Free signup for more
- Track your favorite companies
- Receive email alerts for new filings
- Personalized dashboard of news and more
- Access all data and search results
Filing tables
Filing exhibits
JBSS similar filings
- 30 Aug 16 Regulation FD Disclosure
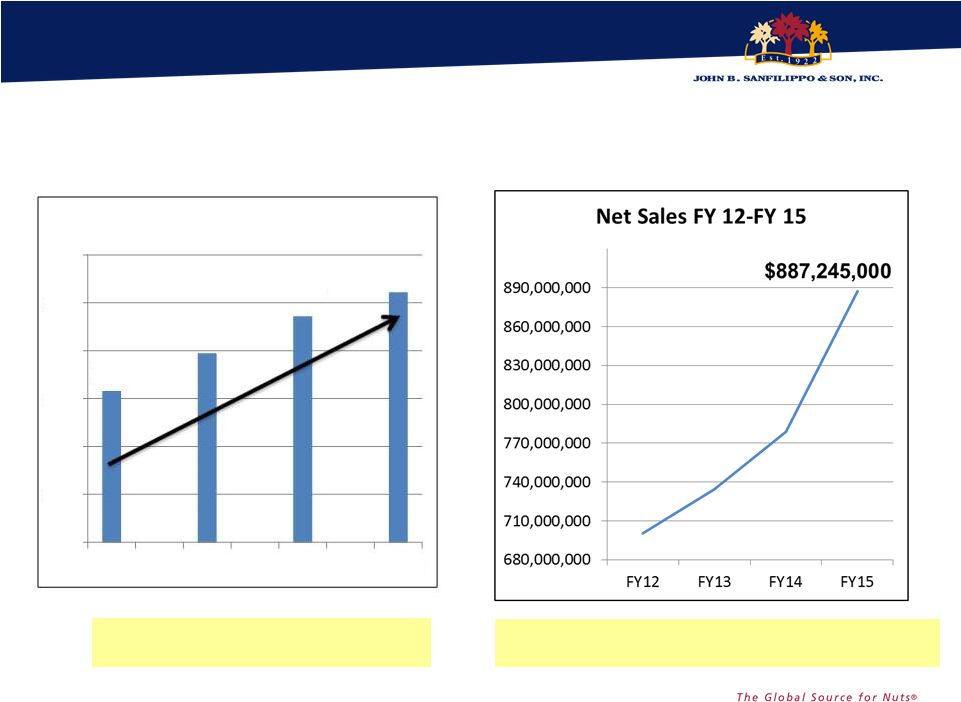
- 24 Aug 16 Net Sales Grew by 4.6% to a Fourth Quarter Record $231.5 Million on Strong Brand Performance
- 7 Jul 16 Board Declares Special Cash Dividend of $2.50 per share of Common Stock and $2.50 per share of Class A Common Stock
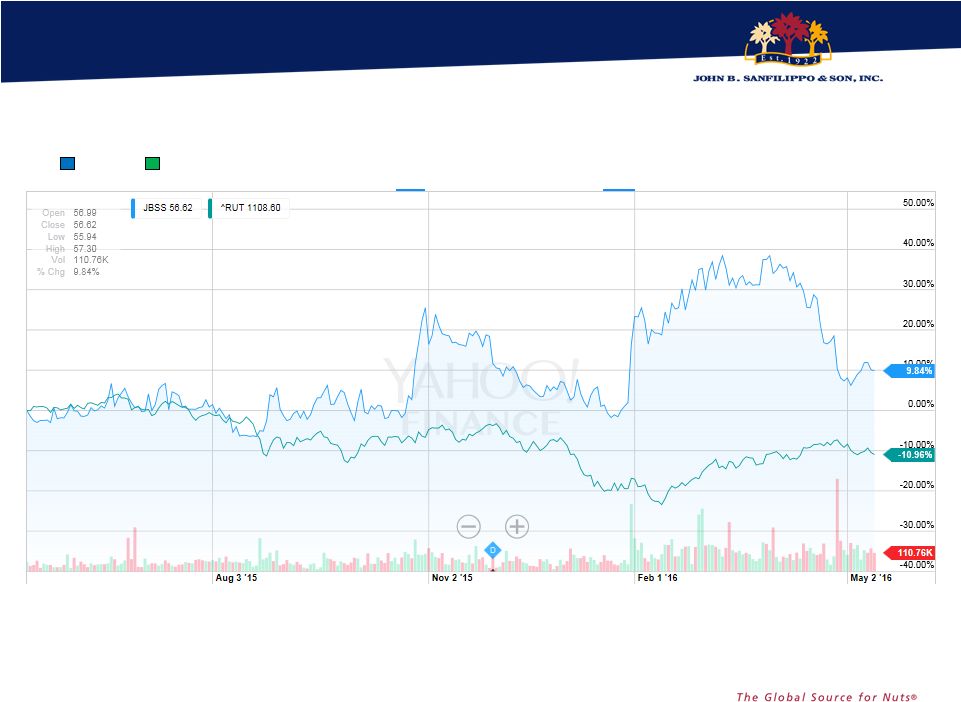
- 18 May 16 Some of the statements in this presentation and any statements by management
- 26 Apr 16 Third Quarter Net Sales Increased by 3.0% to a Third Quarter Record of $215.7 Million
- 10 Feb 16 Regulation FD Disclosure
- 28 Jan 16 Second Quarter EPS Increased by 42.7% to a Second Quarter Record $1.07 per Share Diluted
Filing view
External links