
Exhibit 99.1 NASDAQ: JBSS AUGUST 2020Exhibit 99.1 NASDAQ: JBSS AUGUST 2020
Forward-Looking Statements Some of the statements in this presentation and any statements by management constitute “forward-looking statements” about John B. Sanfilippo & Son, Inc. Such statements include, in particular, statements about our plans, strategies, business prospects, changes and trends in our business and the markets in which we operate. In some cases, you can identify forward- looking statements by the use of words such as “may,” “will,” “could,” “would,” “should,” “expect,” “plan,” “anticipate,” “intend,” “believe,” “estimate,” “forecast,” “predict,” “propose,” “potential” or “continue” or the negative of those terms or other comparable terminology. These statements represent our present expectations or beliefs concerning future events and are not guarantees. Such statements speak only as of the date they are made, and we do not undertake any obligation to update any forward-looking statement. We caution that forward-looking statements are qualified by important factors, risks and uncertainties that could cause actual results to differ materially from those in the forward- looking statements. Our periodic reports filed with the Securities and Exchange Commission, including our Forms 10-K and 10-Q and any amendments thereto, describe some of these factors, risks and uncertainties. 2Forward-Looking Statements Some of the statements in this presentation and any statements by management constitute “forward-looking statements” about John B. Sanfilippo & Son, Inc. Such statements include, in particular, statements about our plans, strategies, business prospects, changes and trends in our business and the markets in which we operate. In some cases, you can identify forward- looking statements by the use of words such as “may,” “will,” “could,” “would,” “should,” “expect,” “plan,” “anticipate,” “intend,” “believe,” “estimate,” “forecast,” “predict,” “propose,” “potential” or “continue” or the negative of those terms or other comparable terminology. These statements represent our present expectations or beliefs concerning future events and are not guarantees. Such statements speak only as of the date they are made, and we do not undertake any obligation to update any forward-looking statement. We caution that forward-looking statements are qualified by important factors, risks and uncertainties that could cause actual results to differ materially from those in the forward- looking statements. Our periodic reports filed with the Securities and Exchange Commission, including our Forms 10-K and 10-Q and any amendments thereto, describe some of these factors, risks and uncertainties. 2
JBSS Corporate Overview • One of the largest nut processors in the world with fiscal year 2020 net sales of approximately $880 million • State-of-the-art nut processing capabilities, including what we believe is the single largest nut processing facility in the world • A North American market leader in every major selling channel – from consumer and commercial ingredient customers to contract manufacturing customers • Dual consumer strategy of offering branded nut and dried fruit programs (Fisher, Orchard Valley Harvest, Squirrel Brand and Southern Style Nuts) and private brands • Commodity procurement expertise with buyers averaging over 20+ years experience • A category leader in packaging and product innovation • Vertically integrated nut processing operation for pecans, peanuts and walnuts 3JBSS Corporate Overview • One of the largest nut processors in the world with fiscal year 2020 net sales of approximately $880 million • State-of-the-art nut processing capabilities, including what we believe is the single largest nut processing facility in the world • A North American market leader in every major selling channel – from consumer and commercial ingredient customers to contract manufacturing customers • Dual consumer strategy of offering branded nut and dried fruit programs (Fisher, Orchard Valley Harvest, Squirrel Brand and Southern Style Nuts) and private brands • Commodity procurement expertise with buyers averaging over 20+ years experience • A category leader in packaging and product innovation • Vertically integrated nut processing operation for pecans, peanuts and walnuts 3
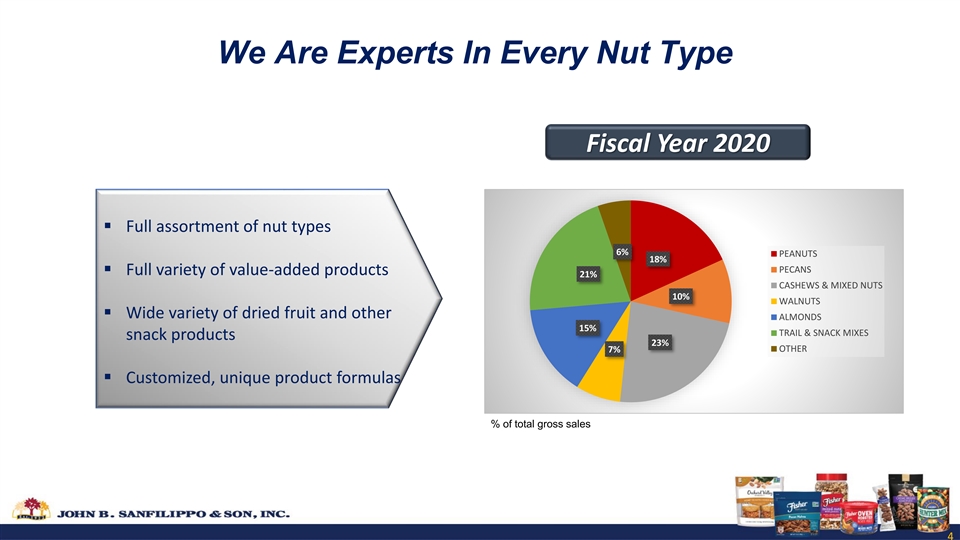
We Are Experts In Every Nut Type Fiscal Year 2020 ▪ Full assortment of nut types 6% PEANUTS 18% PECANS ▪ Full variety of value-added products 21% CASHEWS & MIXED NUTS 10% WALNUTS ▪ Wide variety of dried fruit and other ALMONDS 15% TRAIL & SNACK MIXES snack products 23% OTHER 7% ▪ Customized, unique product formulas % of total gross sales 4We Are Experts In Every Nut Type Fiscal Year 2020 ▪ Full assortment of nut types 6% PEANUTS 18% PECANS ▪ Full variety of value-added products 21% CASHEWS & MIXED NUTS 10% WALNUTS ▪ Wide variety of dried fruit and other ALMONDS 15% TRAIL & SNACK MIXES snack products 23% OTHER 7% ▪ Customized, unique product formulas % of total gross sales 4
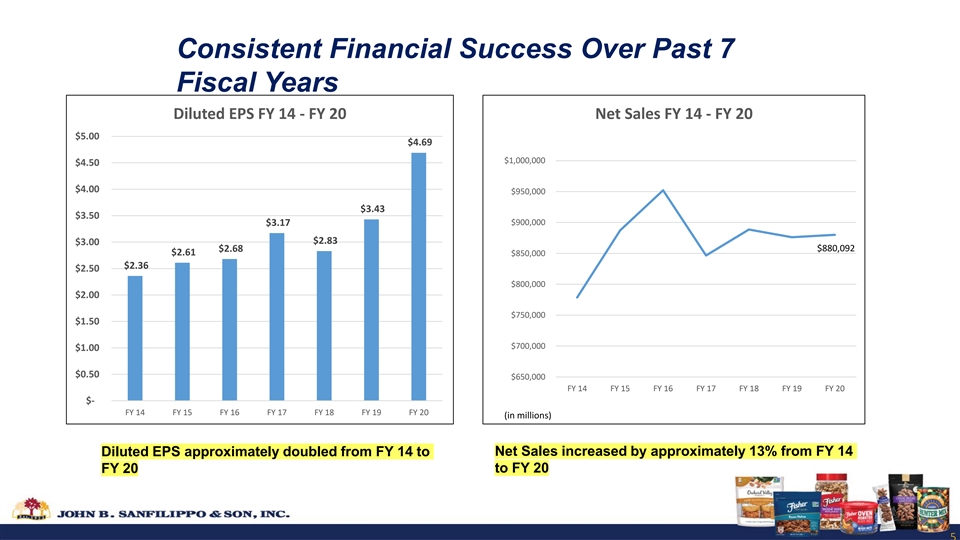
Consistent Financial Success Over Past 7 Fiscal Years Diluted EPS FY 14 - FY 20 Net Sales FY 14 - FY 20 $5.00 $4.69 $1,000,000 $4.50 $4.00 $950,000 $3.43 $3.50 $900,000 $3.17 $2.83 $3.00 $880,092 $2.68 $2.61 $850,000 $2.36 $2.50 $800,000 $2.00 $750,000 $1.50 $700,000 $1.00 $0.50 $650,000 FY 14 FY 15 FY 16 FY 17 FY 18 FY 19 FY 20 $- FY 14 FY 15 FY 16 FY 17 FY 18 FY 19 FY 20 (in millions) Diluted EPS approximately doubled from FY 14 to Net Sales increased by approximately 13% from FY 14 FY 20 to FY 20 5Consistent Financial Success Over Past 7 Fiscal Years Diluted EPS FY 14 - FY 20 Net Sales FY 14 - FY 20 $5.00 $4.69 $1,000,000 $4.50 $4.00 $950,000 $3.43 $3.50 $900,000 $3.17 $2.83 $3.00 $880,092 $2.68 $2.61 $850,000 $2.36 $2.50 $800,000 $2.00 $750,000 $1.50 $700,000 $1.00 $0.50 $650,000 FY 14 FY 15 FY 16 FY 17 FY 18 FY 19 FY 20 $- FY 14 FY 15 FY 16 FY 17 FY 18 FY 19 FY 20 (in millions) Diluted EPS approximately doubled from FY 14 to Net Sales increased by approximately 13% from FY 14 FY 20 to FY 20 5
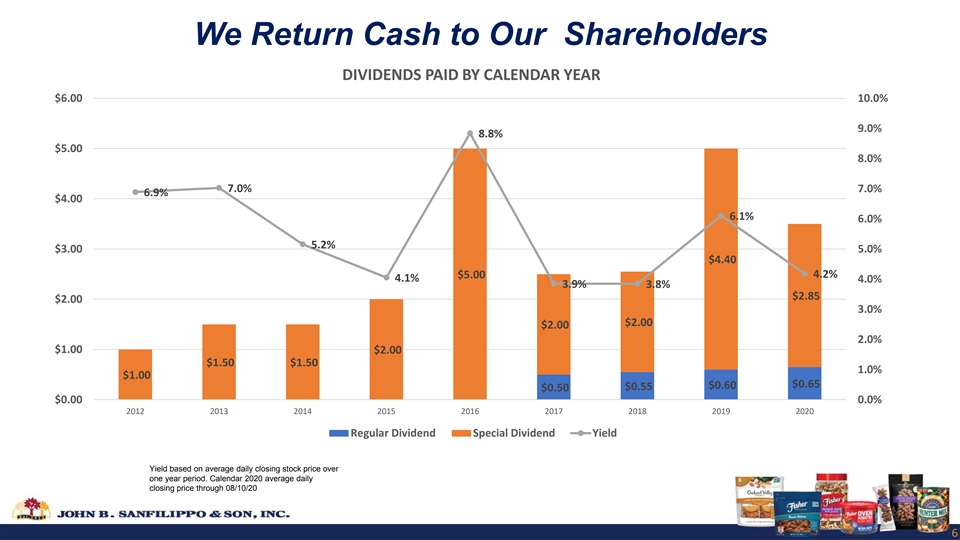
We Return Cash to Our Shareholders DIVIDENDS PAID BY CALENDAR YEAR $6.00 10.0% 9.0% 8.8% $5.00 8.0% 7.0% 7.0% 6.9% $4.00 6.1% 6.0% 5.2% $3.00 5.0% $4.40 $5.00 4.2% 4.1% 4.0% 3.9% 3.8% $2.85 $2.00 3.0% $2.00 $2.00 2.0% $1.00 $2.00 $1.50 $1.50 1.0% $1.00 $0.65 $0.60 $0.55 $0.50 $0.00 0.0% 2012 2013 2014 2015 2016 2017 2018 2019 2020 Regular Dividend Special Dividend Yield Yield based on average daily closing stock price over one year period. Calendar 2020 average daily closing price through 08/10/20 6We Return Cash to Our Shareholders DIVIDENDS PAID BY CALENDAR YEAR $6.00 10.0% 9.0% 8.8% $5.00 8.0% 7.0% 7.0% 6.9% $4.00 6.1% 6.0% 5.2% $3.00 5.0% $4.40 $5.00 4.2% 4.1% 4.0% 3.9% 3.8% $2.85 $2.00 3.0% $2.00 $2.00 2.0% $1.00 $2.00 $1.50 $1.50 1.0% $1.00 $0.65 $0.60 $0.55 $0.50 $0.00 0.0% 2012 2013 2014 2015 2016 2017 2018 2019 2020 Regular Dividend Special Dividend Yield Yield based on average daily closing stock price over one year period. Calendar 2020 average daily closing price through 08/10/20 6
FY 2020 Results 7FY 2020 Results 7
88

FY 2020 Accomplishments • Grew pound and dollar share in Grocery on every JBSS brand driven by strong performance in Fisher Recipe and our Southern Style Nuts brand • While Fisher Recipe saw challenges driven by private label performance at a key customer, E-commerce growth was a bright spot, especially in Q4 (March- June) • Continued to grow our equity on key brands including Orchard Valley Harvest and Fisher through strong, digital campaigns Source: IRI Time Periods: Total FY 20 Year Ending 6/21/20 8 9FY 2020 Accomplishments • Grew pound and dollar share in Grocery on every JBSS brand driven by strong performance in Fisher Recipe and our Southern Style Nuts brand • While Fisher Recipe saw challenges driven by private label performance at a key customer, E-commerce growth was a bright spot, especially in Q4 (March- June) • Continued to grow our equity on key brands including Orchard Valley Harvest and Fisher through strong, digital campaigns Source: IRI Time Periods: Total FY 20 Year Ending 6/21/20 8 9

FY 2020 Accomplishments • Expanded core nut and trail mix assortments with our largest, strategic customers & gained new business with top retail customers • Flawlessly managed a significant private brand transition with a major retailer • Great progress penetrating the Non-Commercial sector as we initiated supply agreements with two key players • Expanded our market share position at two of our largest Food Service broadline partners 9 10FY 2020 Accomplishments • Expanded core nut and trail mix assortments with our largest, strategic customers & gained new business with top retail customers • Flawlessly managed a significant private brand transition with a major retailer • Great progress penetrating the Non-Commercial sector as we initiated supply agreements with two key players • Expanded our market share position at two of our largest Food Service broadline partners 9 10
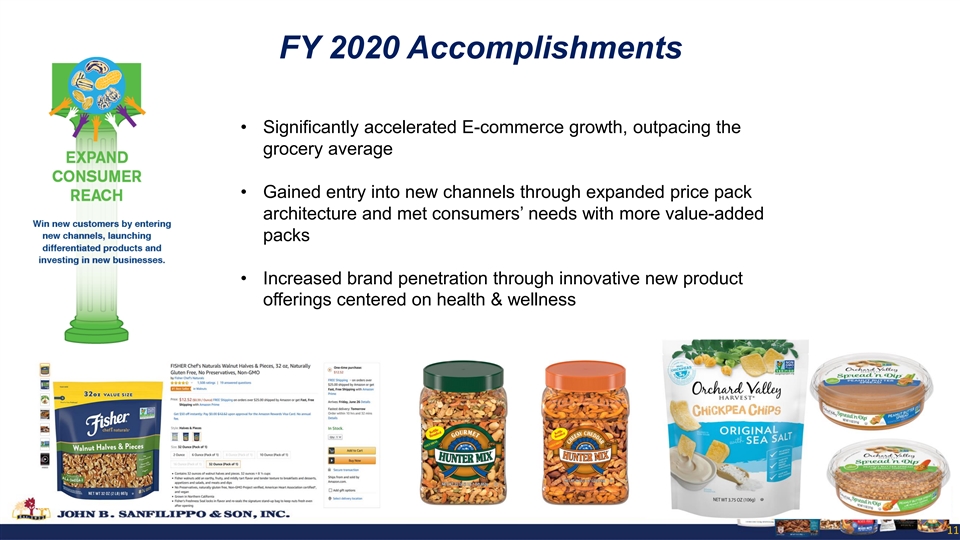
FY 2020 Accomplishments • Significantly accelerated E-commerce growth, outpacing the grocery average • Gained entry into new channels through expanded price pack architecture and met consumers’ needs with more value-added packs • Increased brand penetration through innovative new product offerings centered on health & wellness 11FY 2020 Accomplishments • Significantly accelerated E-commerce growth, outpacing the grocery average • Gained entry into new channels through expanded price pack architecture and met consumers’ needs with more value-added packs • Increased brand penetration through innovative new product offerings centered on health & wellness 11
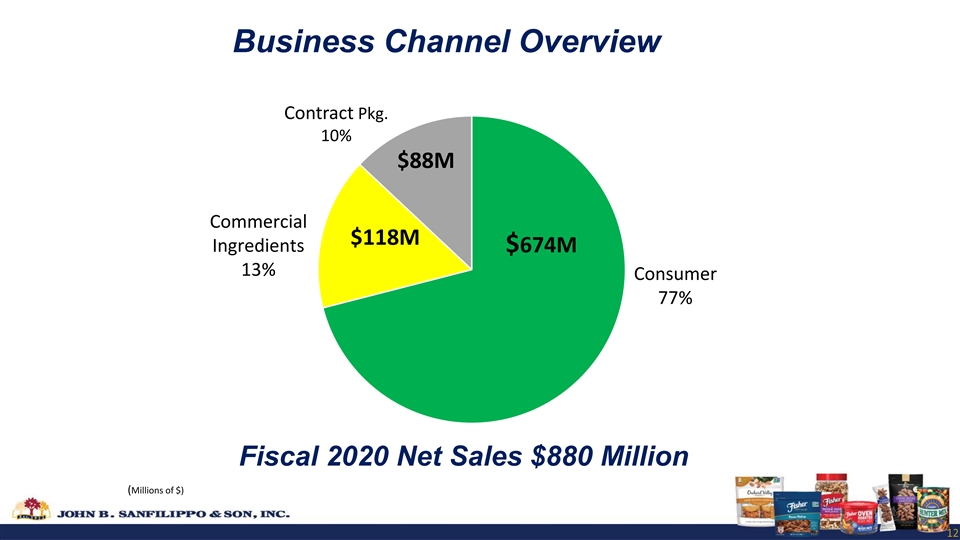
Business Channel Overview Contract Pkg. 10% $88M Commercial $118M Ingredients $674M 13% Consumer 77% Fiscal 2020 Net Sales $880 Million (Millions of $) 12Business Channel Overview Contract Pkg. 10% $88M Commercial $118M Ingredients $674M 13% Consumer 77% Fiscal 2020 Net Sales $880 Million (Millions of $) 12
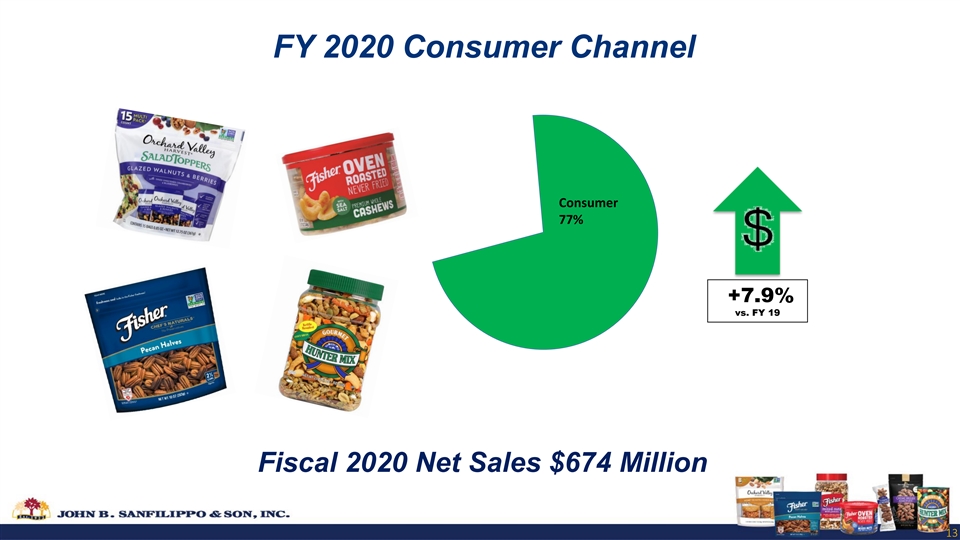
FY 2020 Consumer Channel Consumer 77% +7.9% vs. FY 19 Fiscal 2020 Net Sales $674 Million 13FY 2020 Consumer Channel Consumer 77% +7.9% vs. FY 19 Fiscal 2020 Net Sales $674 Million 13
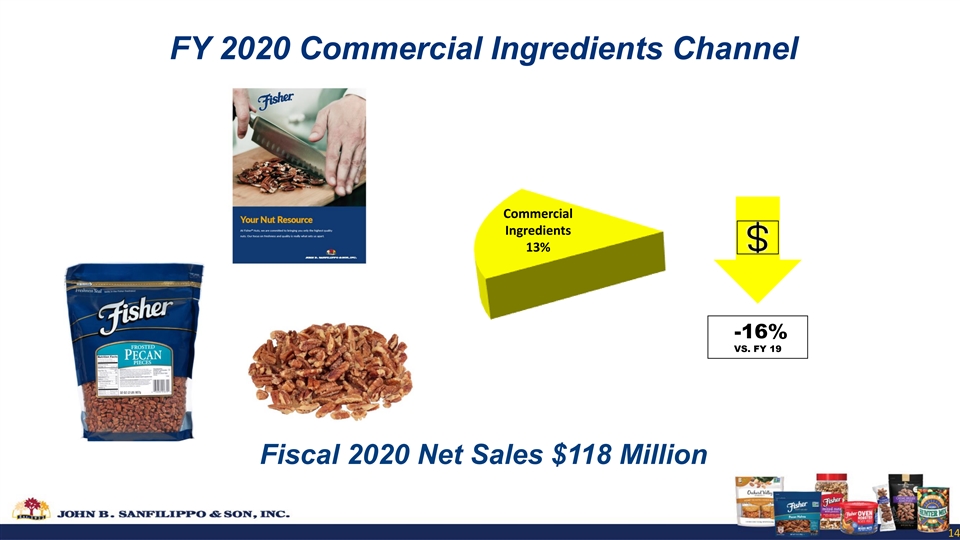
FY 2020 Commercial Ingredients Channel Commercial Ingredients 13% -16% VS. FY 19 Fiscal 2020 Net Sales $118 Million 14FY 2020 Commercial Ingredients Channel Commercial Ingredients 13% -16% VS. FY 19 Fiscal 2020 Net Sales $118 Million 14

FY 2020 Contract Packaging Channel Contract Packaging 10% -20.7% VS FY 19 Fiscal 2020 Net Sales $88 Million 15FY 2020 Contract Packaging Channel Contract Packaging 10% -20.7% VS FY 19 Fiscal 2020 Net Sales $88 Million 15

FY 2020 Nut Category Review 16FY 2020 Nut Category Review 16
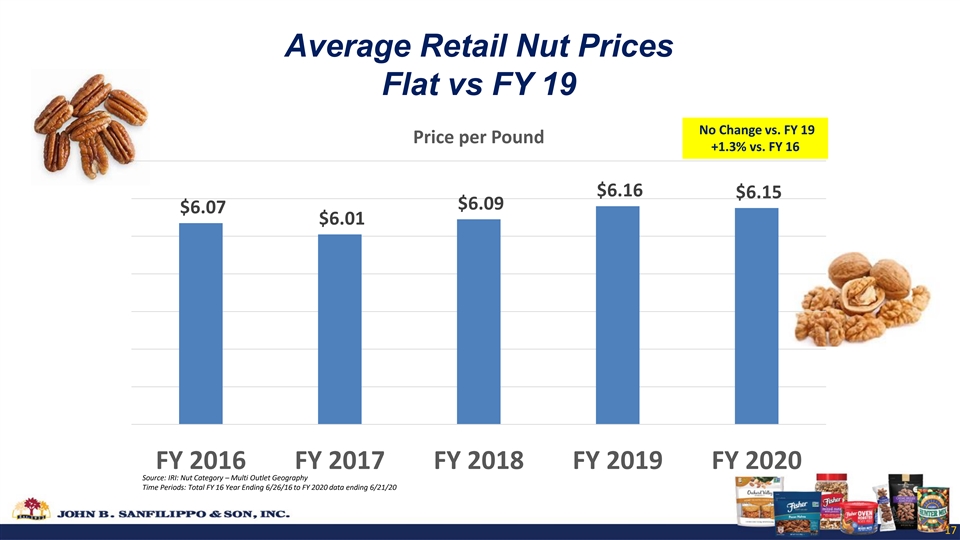
Average Retail Nut Prices Flat vs FY 19 No Change vs. FY 19 Price per Pound +1.3% vs. FY 16 $6.16 $6.15 $6.09 $6.07 $6.01 FY 2016 FY 2017 FY 2018 FY 2019 FY 2020 Source: IRI: Nut Category – Multi Outlet Geography Time Periods: Total FY 16 Year Ending 6/26/16 to FY 2020 data ending 6/21/20 17Average Retail Nut Prices Flat vs FY 19 No Change vs. FY 19 Price per Pound +1.3% vs. FY 16 $6.16 $6.15 $6.09 $6.07 $6.01 FY 2016 FY 2017 FY 2018 FY 2019 FY 2020 Source: IRI: Nut Category – Multi Outlet Geography Time Periods: Total FY 16 Year Ending 6/26/16 to FY 2020 data ending 6/21/20 17
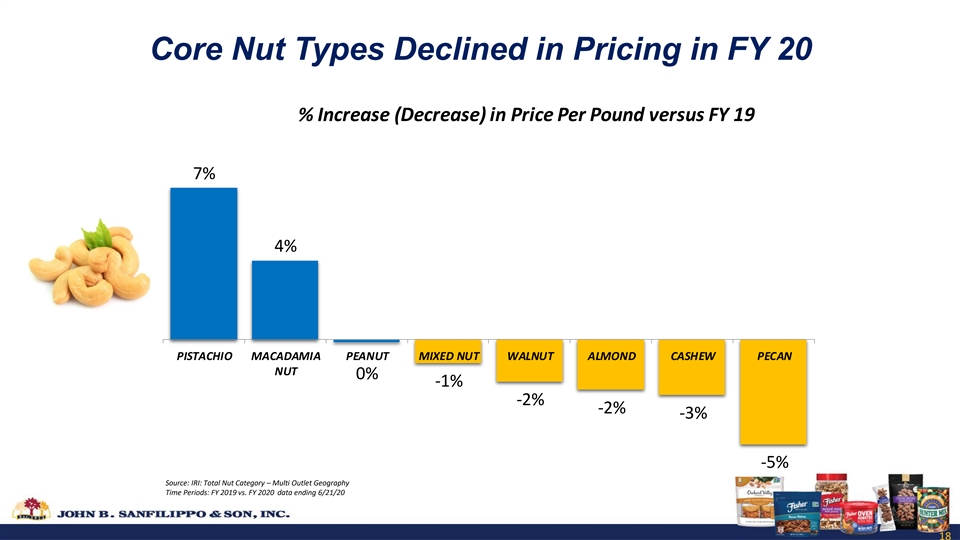
Core Nut Types Declined in Pricing in FY 20 % Increase (Decrease) in Price Per Pound versus FY 19 7% 4% PISTACHIO MACADAMIA PEANUT MIXED NUT WALNUT ALMOND CASHEW PECAN NUT 0% -1% -2% -2% -3% -5% Source: IRI: Total Nut Category – Multi Outlet Geography Time Periods: FY 2019 vs. FY 2020 data ending 6/21/20 18Core Nut Types Declined in Pricing in FY 20 % Increase (Decrease) in Price Per Pound versus FY 19 7% 4% PISTACHIO MACADAMIA PEANUT MIXED NUT WALNUT ALMOND CASHEW PECAN NUT 0% -1% -2% -2% -3% -5% Source: IRI: Total Nut Category – Multi Outlet Geography Time Periods: FY 2019 vs. FY 2020 data ending 6/21/20 18
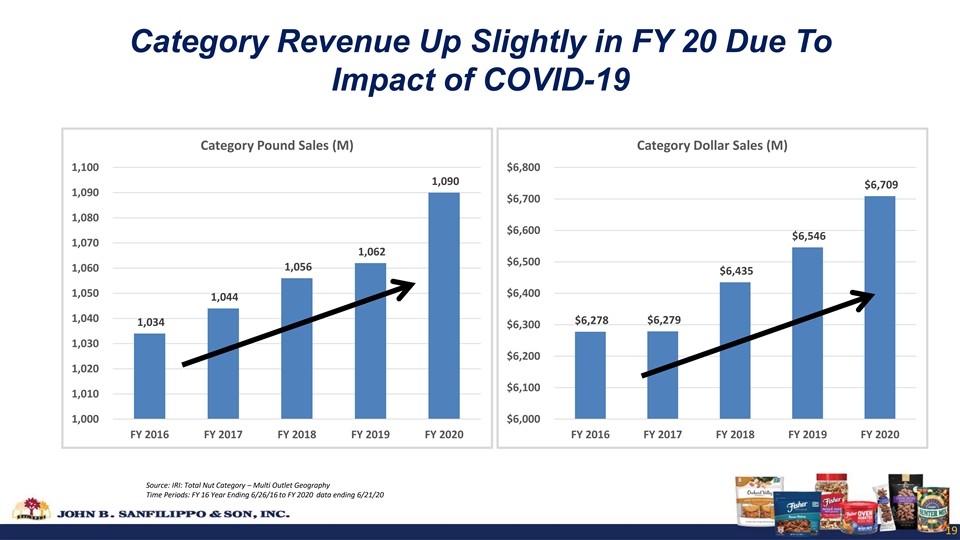
Category Revenue Up Slightly in FY 20 Due To Impact of COVID-19 Category Pound Sales (M) Category Dollar Sales (M) 1,100 $6,800 1,090 $6,709 1,090 $6,700 1,080 $6,600 $6,546 1,070 1,062 $6,500 1,056 1,060 $6,435 1,050 $6,400 1,044 1,040 $6,278 $6,279 1,034 $6,300 1,030 $6,200 1,020 $6,100 1,010 1,000 $6,000 FY 2016 FY 2017 FY 2018 FY 2019 FY 2020 FY 2016 FY 2017 FY 2018 FY 2019 FY 2020 Source: IRI: Total Nut Category – Multi Outlet Geography Time Periods: FY 16 Year Ending 6/26/16 to FY 2020 data ending 6/21/20 19Category Revenue Up Slightly in FY 20 Due To Impact of COVID-19 Category Pound Sales (M) Category Dollar Sales (M) 1,100 $6,800 1,090 $6,709 1,090 $6,700 1,080 $6,600 $6,546 1,070 1,062 $6,500 1,056 1,060 $6,435 1,050 $6,400 1,044 1,040 $6,278 $6,279 1,034 $6,300 1,030 $6,200 1,020 $6,100 1,010 1,000 $6,000 FY 2016 FY 2017 FY 2018 FY 2019 FY 2020 FY 2016 FY 2017 FY 2018 FY 2019 FY 2020 Source: IRI: Total Nut Category – Multi Outlet Geography Time Periods: FY 16 Year Ending 6/26/16 to FY 2020 data ending 6/21/20 19

FY 2020 Financial Milestones 20FY 2020 Financial Milestones 20

JBSS Net Sales FYs 1991-2020 $1,200 Decreased prices and increased volume 6.1% CAGR over 28.5 Years Increased Pound Volume $1,000 and Prices $880 De-emphasized $800 Industrial Sales, Lower million Prices $600 In millions of $ Low Carb Diet Run Up $400 $200 $0 21 1991 1992 1993 1994 1995 1996 1997 (6 MO) 1998 1999 2000 2001 2002 2003 2004 2005 2006 2007 2008 2009 2010 2011 2012 2013 2014 2015 2016 2017 2018 2019 2020JBSS Net Sales FYs 1991-2020 $1,200 Decreased prices and increased volume 6.1% CAGR over 28.5 Years Increased Pound Volume $1,000 and Prices $880 De-emphasized $800 Industrial Sales, Lower million Prices $600 In millions of $ Low Carb Diet Run Up $400 $200 $0 21 1991 1992 1993 1994 1995 1996 1997 (6 MO) 1998 1999 2000 2001 2002 2003 2004 2005 2006 2007 2008 2009 2010 2011 2012 2013 2014 2015 2016 2017 2018 2019 2020
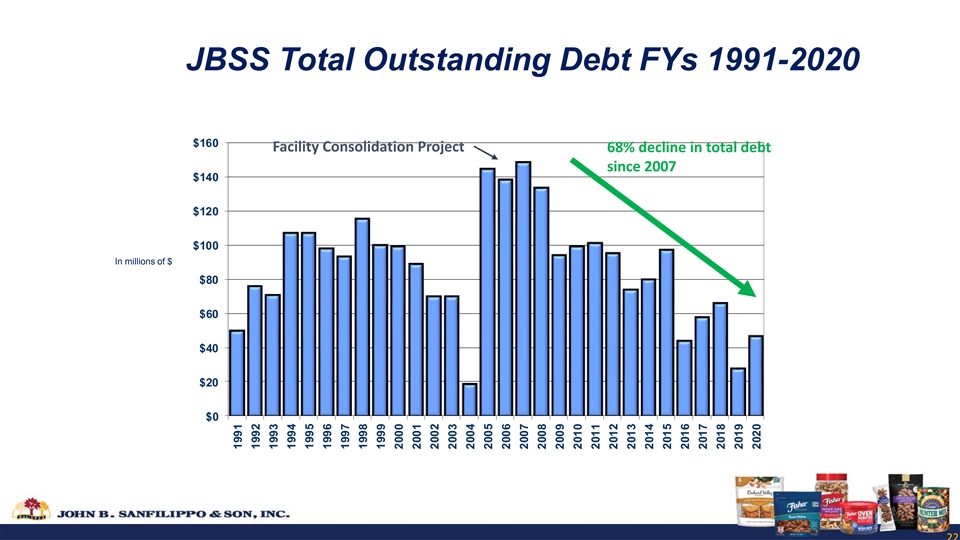
JBSS Total Outstanding Debt FYs 1991-2020 $160 Facility Consolidation Project 68% decline in total debt since 2007 $140 $120 $100 In millions of $ $80 $60 $40 $20 $0 22 1991 1992 1993 1994 1995 1996 1997 1998 1999 2000 2001 2002 2003 2004 2005 2006 2007 2008 2009 2010 2011 2012 2013 2014 2015 2016 2017 2018 2019 2020JBSS Total Outstanding Debt FYs 1991-2020 $160 Facility Consolidation Project 68% decline in total debt since 2007 $140 $120 $100 In millions of $ $80 $60 $40 $20 $0 22 1991 1992 1993 1994 1995 1996 1997 1998 1999 2000 2001 2002 2003 2004 2005 2006 2007 2008 2009 2010 2011 2012 2013 2014 2015 2016 2017 2018 2019 2020
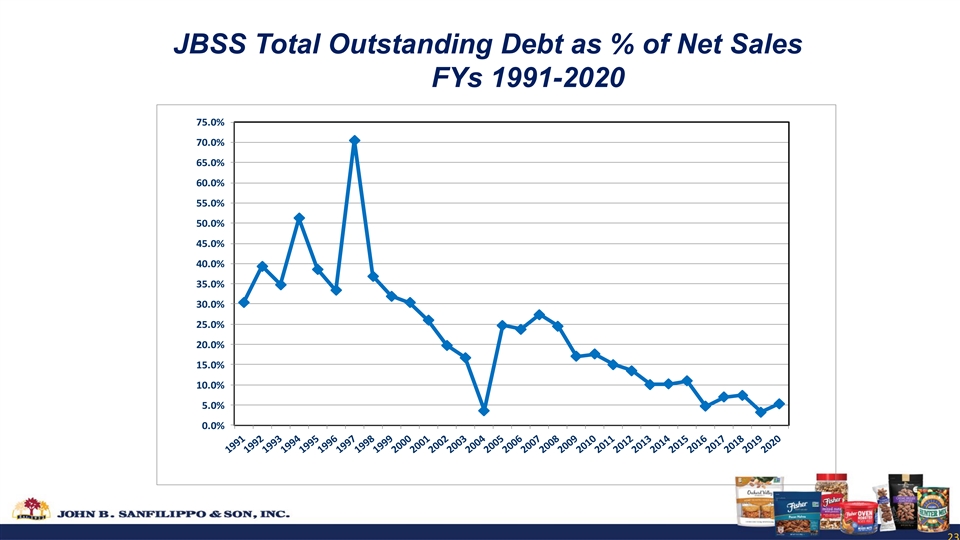
JBSS Total Outstanding Debt as % of Net Sales FYs 1991-2020 75.0% 70.0% 65.0% 60.0% 55.0% 50.0% 45.0% 40.0% 35.0% 30.0% 25.0% 20.0% 15.0% 10.0% 5.0% 0.0% 23JBSS Total Outstanding Debt as % of Net Sales FYs 1991-2020 75.0% 70.0% 65.0% 60.0% 55.0% 50.0% 45.0% 40.0% 35.0% 30.0% 25.0% 20.0% 15.0% 10.0% 5.0% 0.0% 23
EBITDA EBITDA consists of earnings before interest, taxes, depreciation, amortization and noncontrolling interest. EBITDA is not a measurement of financial performance under accounting principles generally accepted in the United States of America ( GAAP ), and does not represent cash flow from operations. EBITDA is presented solely as a supplemental disclosure because management believes that it is important in evaluating JBSS's financial performance and market valuation. In conformity with Regulation G, a reconciliation of EBITDA to the most directly comparable financial measures calculated and presented in accordance with GAAP is presented in the following slide. 24EBITDA EBITDA consists of earnings before interest, taxes, depreciation, amortization and noncontrolling interest. EBITDA is not a measurement of financial performance under accounting principles generally accepted in the United States of America ( GAAP ), and does not represent cash flow from operations. EBITDA is presented solely as a supplemental disclosure because management believes that it is important in evaluating JBSS's financial performance and market valuation. In conformity with Regulation G, a reconciliation of EBITDA to the most directly comparable financial measures calculated and presented in accordance with GAAP is presented in the following slide. 24
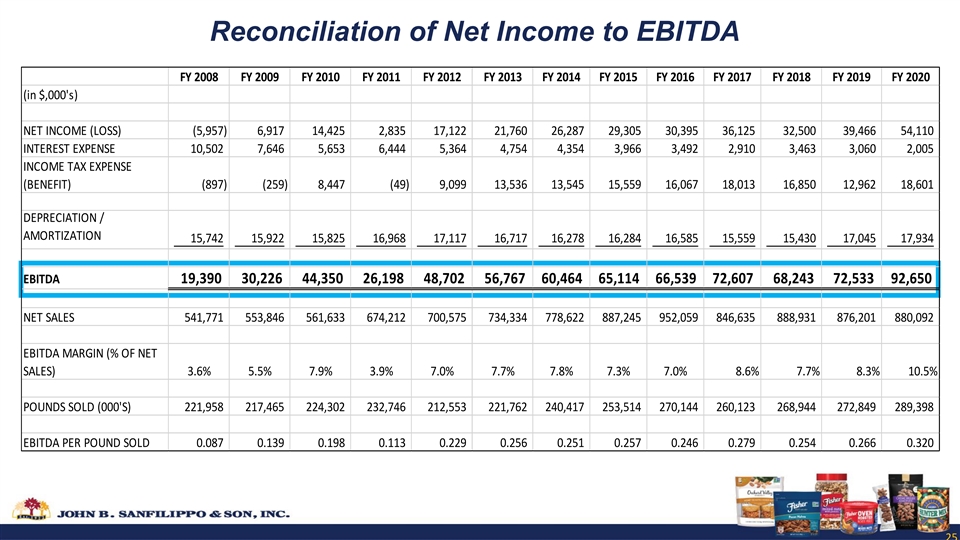
Reconciliation of Net Income to EBITDA FY 2008 FY 2009 FY 2010 FY 2011 FY 2012 FY 2013 FY 2014 FY 2015 FY 2016 FY 2017 FY 2018 FY 2019 FY 2020 (in $,000's) NET INCOME (LOSS) (5,957) 6,917 14,425 2,835 17,122 21,760 26,287 29,305 30,395 3 6,125 32,500 3 9,466 54,110 INTEREST EXPENSE 10,502 7,646 5,653 6,444 5,364 4,754 4,354 3,966 3,492 2 ,910 3,463 3,060 2,005 INCOME TAX EXPENSE (BENEFIT) (897) (259) 8,447 ( 49) 9,099 13,536 13,545 1 5,559 16,067 18,013 16,850 12,962 18,601 DEPRECIATION / AMORTIZATION 15,742 15,922 15,825 16,968 17,117 16,717 16,278 16,284 16,585 15,559 15,430 17,045 17,934 EBITDA 19,390 30,226 44,350 26,198 48,702 56,767 60,464 65,114 66,539 72,607 68,243 72,533 92,650 NET SALES 541,771 553,846 561,633 674,212 700,575 734,334 7 78,622 8 87,245 9 52,059 8 46,635 888,931 876,201 880,092 EBITDA MARGIN (% OF NET SALES) 3.6% 5.5% 7.9% 3.9% 7.0% 7.7% 7.8% 7.3% 7.0% 8.6% 7.7% 8.3% 10.5% POUNDS SOLD (000'S) 221,958 217,465 224,302 232,746 212,553 221,762 2 40,417 2 53,514 270,144 260,123 268,944 272,849 289,398 EBITDA PER POUND SOLD 0.087 0.139 0.198 0.113 0.229 0.256 0 .251 0.257 0.246 0.279 0.254 0 .266 0.320 25Reconciliation of Net Income to EBITDA FY 2008 FY 2009 FY 2010 FY 2011 FY 2012 FY 2013 FY 2014 FY 2015 FY 2016 FY 2017 FY 2018 FY 2019 FY 2020 (in $,000's) NET INCOME (LOSS) (5,957) 6,917 14,425 2,835 17,122 21,760 26,287 29,305 30,395 3 6,125 32,500 3 9,466 54,110 INTEREST EXPENSE 10,502 7,646 5,653 6,444 5,364 4,754 4,354 3,966 3,492 2 ,910 3,463 3,060 2,005 INCOME TAX EXPENSE (BENEFIT) (897) (259) 8,447 ( 49) 9,099 13,536 13,545 1 5,559 16,067 18,013 16,850 12,962 18,601 DEPRECIATION / AMORTIZATION 15,742 15,922 15,825 16,968 17,117 16,717 16,278 16,284 16,585 15,559 15,430 17,045 17,934 EBITDA 19,390 30,226 44,350 26,198 48,702 56,767 60,464 65,114 66,539 72,607 68,243 72,533 92,650 NET SALES 541,771 553,846 561,633 674,212 700,575 734,334 7 78,622 8 87,245 9 52,059 8 46,635 888,931 876,201 880,092 EBITDA MARGIN (% OF NET SALES) 3.6% 5.5% 7.9% 3.9% 7.0% 7.7% 7.8% 7.3% 7.0% 8.6% 7.7% 8.3% 10.5% POUNDS SOLD (000'S) 221,958 217,465 224,302 232,746 212,553 221,762 2 40,417 2 53,514 270,144 260,123 268,944 272,849 289,398 EBITDA PER POUND SOLD 0.087 0.139 0.198 0.113 0.229 0.256 0 .251 0.257 0.246 0.279 0.254 0 .266 0.320 25
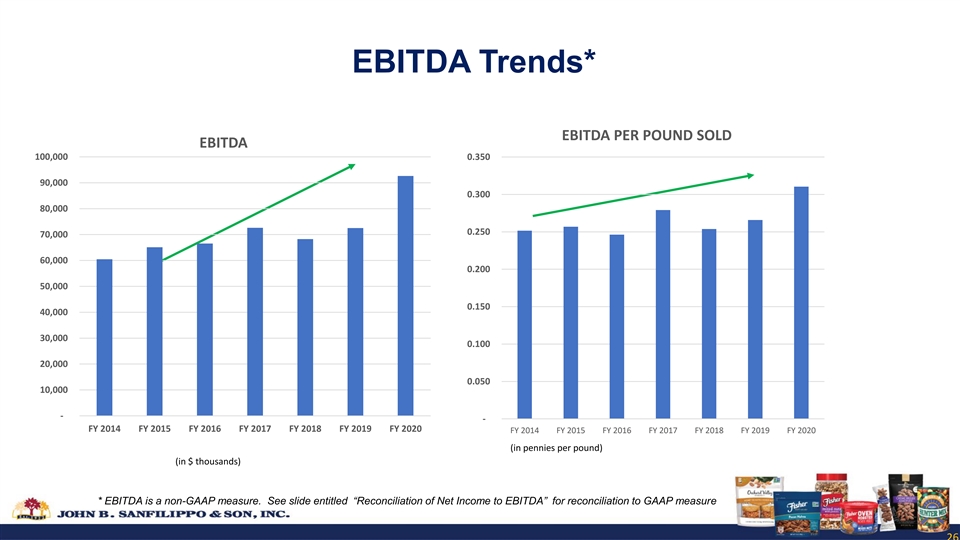
EBITDA Trends* EBITDA PER POUND SOLD EBITDA 100,000 0.350 90,000 0.300 80,000 0.250 70,000 60,000 0.200 50,000 0.150 40,000 30,000 0.100 20,000 0.050 10,000 - - FY 2014 FY 2015 FY 2016 FY 2017 FY 2018 FY 2019 FY 2020 FY 2014 FY 2015 FY 2016 FY 2017 FY 2018 FY 2019 FY 2020 (in pennies per pound) (in $ thousands) * EBITDA is a non-GAAP measure. See slide entitled “Reconciliation of Net Income to EBITDA” for reconciliation to GAAP measure 26EBITDA Trends* EBITDA PER POUND SOLD EBITDA 100,000 0.350 90,000 0.300 80,000 0.250 70,000 60,000 0.200 50,000 0.150 40,000 30,000 0.100 20,000 0.050 10,000 - - FY 2014 FY 2015 FY 2016 FY 2017 FY 2018 FY 2019 FY 2020 FY 2014 FY 2015 FY 2016 FY 2017 FY 2018 FY 2019 FY 2020 (in pennies per pound) (in $ thousands) * EBITDA is a non-GAAP measure. See slide entitled “Reconciliation of Net Income to EBITDA” for reconciliation to GAAP measure 26
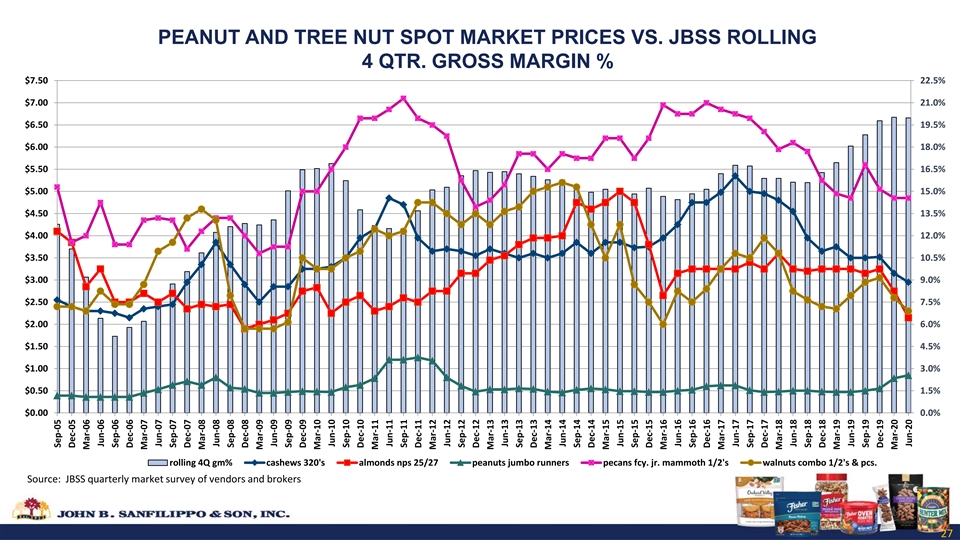
PEANUT AND TREE NUT SPOT MARKET PRICES VS. JBSS ROLLING 4 QTR. GROSS MARGIN % $7.50 22.5% $7.00 21.0% $6.50 19.5% $6.00 18.0% $5.50 16.5% $5.00 15.0% $4.50 13.5% $4.00 12.0% $3.50 10.5% $3.00 9.0% $2.50 7.5% $2.00 6.0% $1.50 4.5% $1.00 3.0% $0.50 1.5% $0.00 0.0% rolling 4Q gm% cashews 320's almonds nps 25/27 peanuts jumbo runners pecans fcy. jr. mammoth 1/2's walnuts combo 1/2's & pcs. Source: JBSS quarterly market survey of vendors and brokers 27 27 Sep-05 Dec-05 Mar-06 Jun-06 Sep-06 Dec-06 Mar-07 Jun-07 Sep-07 Dec-07 Mar-08 Jun-08 Sep-08 Dec-08 Mar-09 Jun-09 Sep-09 Dec-09 Mar-10 Jun-10 Sep-10 Dec-10 Mar-11 Jun-11 Sep-11 Dec-11 Mar-12 Jun-12 Sep-12 Dec-12 Mar-13 Jun-13 Sep-13 Dec-13 Mar-14 Jun-14 Sep-14 Dec-14 Mar-15 Jun-15 Sep-15 Dec-15 Mar-16 Jun-16 Sep-16 Dec-16 Mar-17 Jun-17 Sep-17 Dec-17 Mar-18 Jun-18 Sep-18 Dec-18 Mar-19 Jun-19 Sep-19 Dec-19 Mar-20 Jun-20PEANUT AND TREE NUT SPOT MARKET PRICES VS. JBSS ROLLING 4 QTR. GROSS MARGIN % $7.50 22.5% $7.00 21.0% $6.50 19.5% $6.00 18.0% $5.50 16.5% $5.00 15.0% $4.50 13.5% $4.00 12.0% $3.50 10.5% $3.00 9.0% $2.50 7.5% $2.00 6.0% $1.50 4.5% $1.00 3.0% $0.50 1.5% $0.00 0.0% rolling 4Q gm% cashews 320's almonds nps 25/27 peanuts jumbo runners pecans fcy. jr. mammoth 1/2's walnuts combo 1/2's & pcs. Source: JBSS quarterly market survey of vendors and brokers 27 27 Sep-05 Dec-05 Mar-06 Jun-06 Sep-06 Dec-06 Mar-07 Jun-07 Sep-07 Dec-07 Mar-08 Jun-08 Sep-08 Dec-08 Mar-09 Jun-09 Sep-09 Dec-09 Mar-10 Jun-10 Sep-10 Dec-10 Mar-11 Jun-11 Sep-11 Dec-11 Mar-12 Jun-12 Sep-12 Dec-12 Mar-13 Jun-13 Sep-13 Dec-13 Mar-14 Jun-14 Sep-14 Dec-14 Mar-15 Jun-15 Sep-15 Dec-15 Mar-16 Jun-16 Sep-16 Dec-16 Mar-17 Jun-17 Sep-17 Dec-17 Mar-18 Jun-18 Sep-18 Dec-18 Mar-19 Jun-19 Sep-19 Dec-19 Mar-20 Jun-20

FY 2020 Brand Marketing Review 28FY 2020 Brand Marketing Review 28

Grow JBSS Brands Snack Nuts Recipe Nuts 29Grow JBSS Brands Snack Nuts Recipe Nuts 29
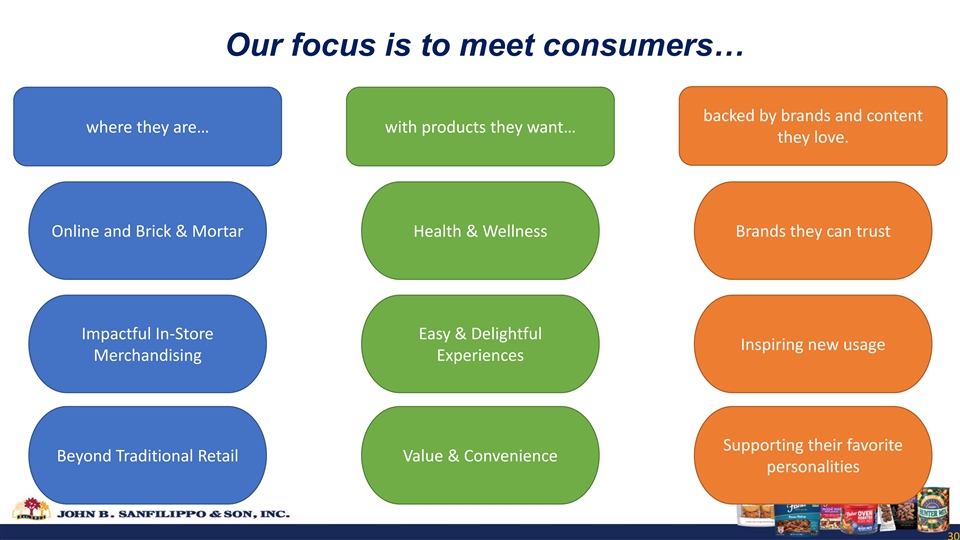
Our focus is to meet consumers… backed by brands and content where they are… with products they want… they love. Online and Brick & Mortar Health & Wellness Brands they can trust Impactful In-Store Easy & Delightful Inspiring new usage Merchandising Experiences Supporting their favorite Beyond Traditional Retail Value & Convenience personalities 30Our focus is to meet consumers… backed by brands and content where they are… with products they want… they love. Online and Brick & Mortar Health & Wellness Brands they can trust Impactful In-Store Easy & Delightful Inspiring new usage Merchandising Experiences Supporting their favorite Beyond Traditional Retail Value & Convenience personalities 30

Our focus is to meet consumers… backed by brands and content where they are… with products they want… they love. 31Our focus is to meet consumers… backed by brands and content where they are… with products they want… they love. 31
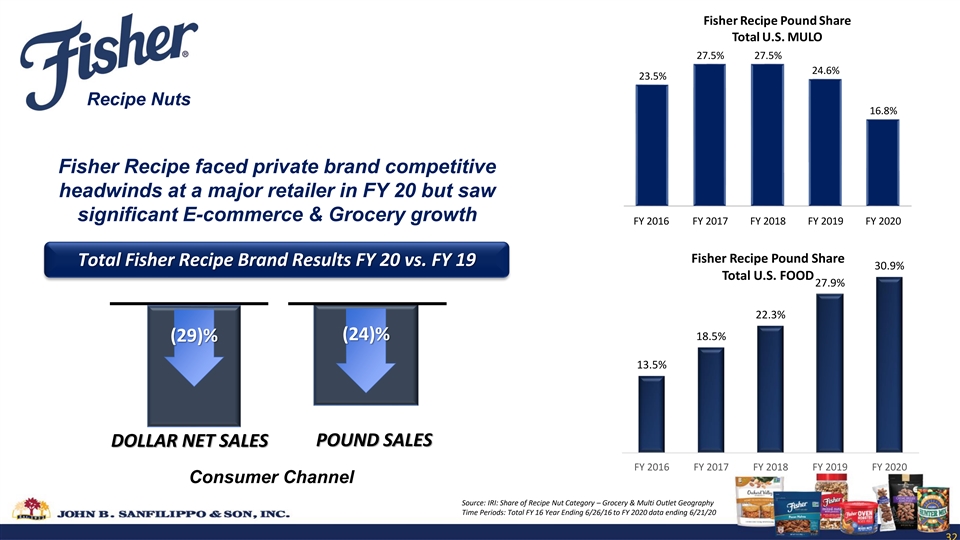
Fisher Recipe Pound Share Total U.S. MULO 27.5% 27.5% 24.6% 23.5% Recipe Nuts 16.8% Fisher Recipe faced private brand competitive headwinds at a major retailer in FY 20 but saw significant E-commerce & Grocery growth FY 2016 FY 2017 FY 2018 FY 2019 FY 2020 Fisher Recipe Pound Share Total Fisher Recipe Brand Results FY 20 vs. FY 19 30.9% Total U.S. FOOD 27.9% 22.3% (24)% 18.5% (29)% 13.5% POUND SALES DOLLAR NET SALES FY 2016 FY 2017 FY 2018 FY 2019 FY 2020 Consumer Channel Source: IRI: Share of Recipe Nut Category – Grocery & Multi Outlet Geography Time Periods: Total FY 16 Year Ending 6/26/16 to FY 2020 data ending 6/21/20 32Fisher Recipe Pound Share Total U.S. MULO 27.5% 27.5% 24.6% 23.5% Recipe Nuts 16.8% Fisher Recipe faced private brand competitive headwinds at a major retailer in FY 20 but saw significant E-commerce & Grocery growth FY 2016 FY 2017 FY 2018 FY 2019 FY 2020 Fisher Recipe Pound Share Total Fisher Recipe Brand Results FY 20 vs. FY 19 30.9% Total U.S. FOOD 27.9% 22.3% (24)% 18.5% (29)% 13.5% POUND SALES DOLLAR NET SALES FY 2016 FY 2017 FY 2018 FY 2019 FY 2020 Consumer Channel Source: IRI: Share of Recipe Nut Category – Grocery & Multi Outlet Geography Time Periods: Total FY 16 Year Ending 6/26/16 to FY 2020 data ending 6/21/20 32

Inspiring all kitchen creators to do more with Fisher nuts! Recipe Nuts Inspiring Content E-commerce Acceleration Value-added Products & Packs & Expert Partnerships & Impactful In-store Events 33Inspiring all kitchen creators to do more with Fisher nuts! Recipe Nuts Inspiring Content E-commerce Acceleration Value-added Products & Packs & Expert Partnerships & Impactful In-store Events 33
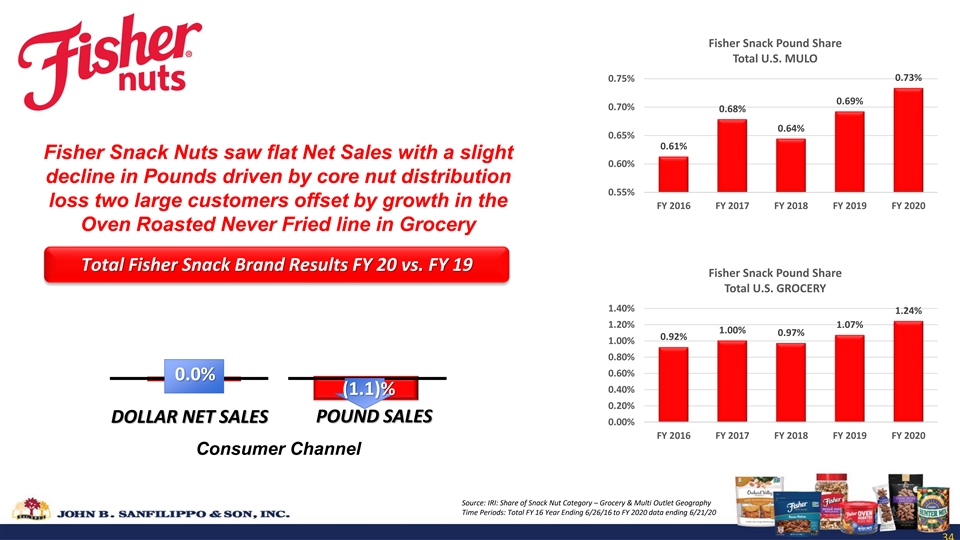
Fisher Snack Pound Share Total U.S. MULO 0.73% 0.75% 0.69% 0.70% 0.68% 0.64% 0.65% 0.61% Fisher Snack Nuts saw flat Net Sales with a slight 0.60% decline in Pounds driven by core nut distribution 0.55% loss two large customers offset by growth in the FY 2016 FY 2017 FY 2018 FY 2019 FY 2020 Oven Roasted Never Fried line in Grocery Total Fisher Snack Brand Results FY 20 vs. FY 19 Fisher Snack Pound Share Total U.S. GROCERY 1.40% 1.24% 1.20% 1.07% 1.00% 0.97% 0.92% 1.00% 0.80% 0.60% 0.0% 0.40% (1.1)% 0.20% POUND SALES DOLLAR NET SALES 0.00% FY 2016 FY 2017 FY 2018 FY 2019 FY 2020 Consumer Channel Source: IRI: Share of Snack Nut Category – Grocery & Multi Outlet Geography Time Periods: Total FY 16 Year Ending 6/26/16 to FY 2020 data ending 6/21/20 34Fisher Snack Pound Share Total U.S. MULO 0.73% 0.75% 0.69% 0.70% 0.68% 0.64% 0.65% 0.61% Fisher Snack Nuts saw flat Net Sales with a slight 0.60% decline in Pounds driven by core nut distribution 0.55% loss two large customers offset by growth in the FY 2016 FY 2017 FY 2018 FY 2019 FY 2020 Oven Roasted Never Fried line in Grocery Total Fisher Snack Brand Results FY 20 vs. FY 19 Fisher Snack Pound Share Total U.S. GROCERY 1.40% 1.24% 1.20% 1.07% 1.00% 0.97% 0.92% 1.00% 0.80% 0.60% 0.0% 0.40% (1.1)% 0.20% POUND SALES DOLLAR NET SALES 0.00% FY 2016 FY 2017 FY 2018 FY 2019 FY 2020 Consumer Channel Source: IRI: Share of Snack Nut Category – Grocery & Multi Outlet Geography Time Periods: Total FY 16 Year Ending 6/26/16 to FY 2020 data ending 6/21/20 34
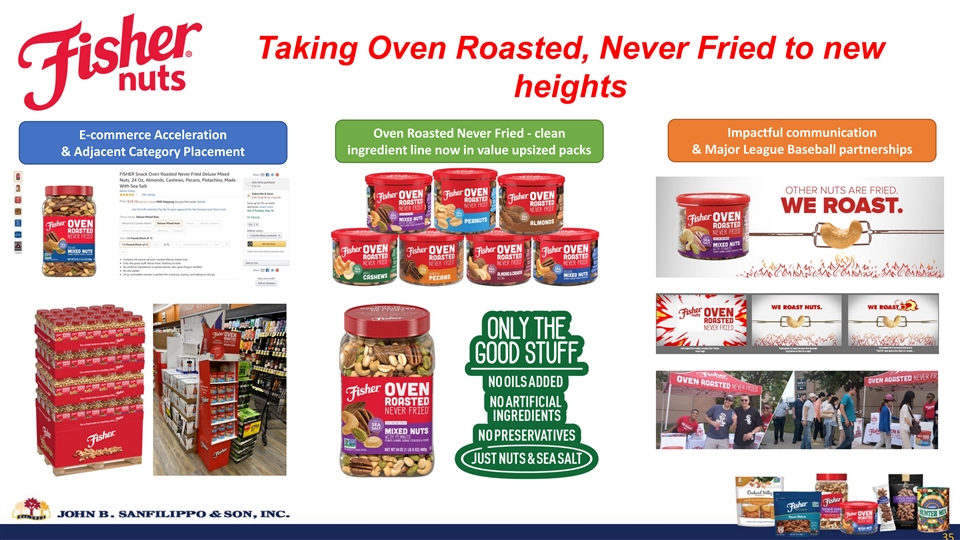
Taking Oven Roasted, Never Fried to new heights Impactful communication Oven Roasted Never Fried - clean E-commerce Acceleration ingredient line now in value upsized packs & Major League Baseball partnerships & Adjacent Category Placement 35Taking Oven Roasted, Never Fried to new heights Impactful communication Oven Roasted Never Fried - clean E-commerce Acceleration ingredient line now in value upsized packs & Major League Baseball partnerships & Adjacent Category Placement 35
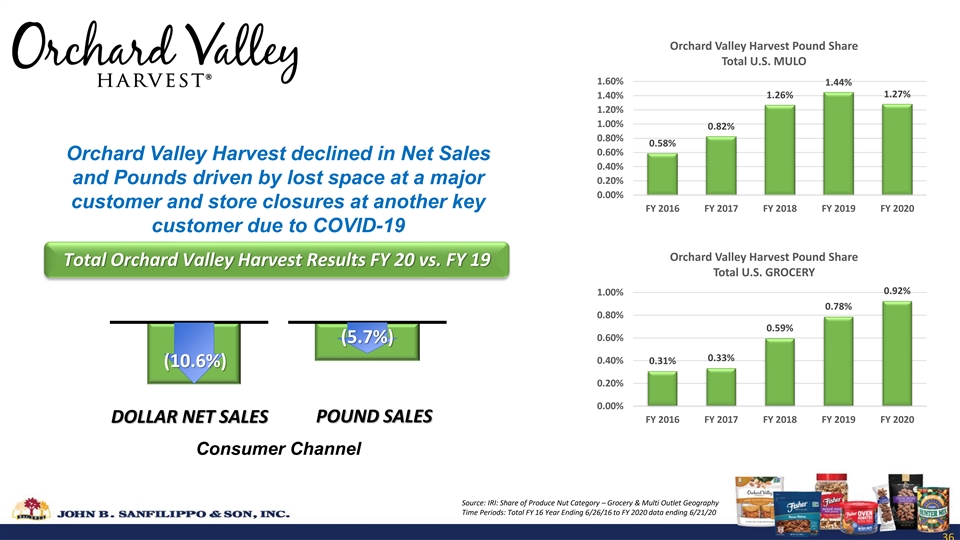
Orchard Valley Harvest Pound Share Total U.S. MULO 1.60% 1.44% 1.27% 1.26% 1.40% 1.20% 1.00% 0.82% 0.80% 0.58% 0.60% Orchard Valley Harvest declined in Net Sales 0.40% and Pounds driven by lost space at a major 0.20% 0.00% customer and store closures at another key FY 2016 FY 2017 FY 2018 FY 2019 FY 2020 customer due to COVID-19 Orchard Valley Harvest Pound Share Total Orchard Valley Harvest Results FY 20 vs. FY 19 Total U.S. GROCERY 0.92% 1.00% 0.78% 0.80% 0.59% 0.60% (5.7%) 0.33% 0.40% 0.31% (10.6%) 0.20% 0.00% POUND SALES DOLLAR NET SALES FY 2016 FY 2017 FY 2018 FY 2019 FY 2020 Consumer Channel Source: IRI: Share of Produce Nut Category – Grocery & Multi Outlet Geography Time Periods: Total FY 16 Year Ending 6/26/16 to FY 2020 data ending 6/21/20 36Orchard Valley Harvest Pound Share Total U.S. MULO 1.60% 1.44% 1.27% 1.26% 1.40% 1.20% 1.00% 0.82% 0.80% 0.58% 0.60% Orchard Valley Harvest declined in Net Sales 0.40% and Pounds driven by lost space at a major 0.20% 0.00% customer and store closures at another key FY 2016 FY 2017 FY 2018 FY 2019 FY 2020 customer due to COVID-19 Orchard Valley Harvest Pound Share Total Orchard Valley Harvest Results FY 20 vs. FY 19 Total U.S. GROCERY 0.92% 1.00% 0.78% 0.80% 0.59% 0.60% (5.7%) 0.33% 0.40% 0.31% (10.6%) 0.20% 0.00% POUND SALES DOLLAR NET SALES FY 2016 FY 2017 FY 2018 FY 2019 FY 2020 Consumer Channel Source: IRI: Share of Produce Nut Category – Grocery & Multi Outlet Geography Time Periods: Total FY 16 Year Ending 6/26/16 to FY 2020 data ending 6/21/20 36
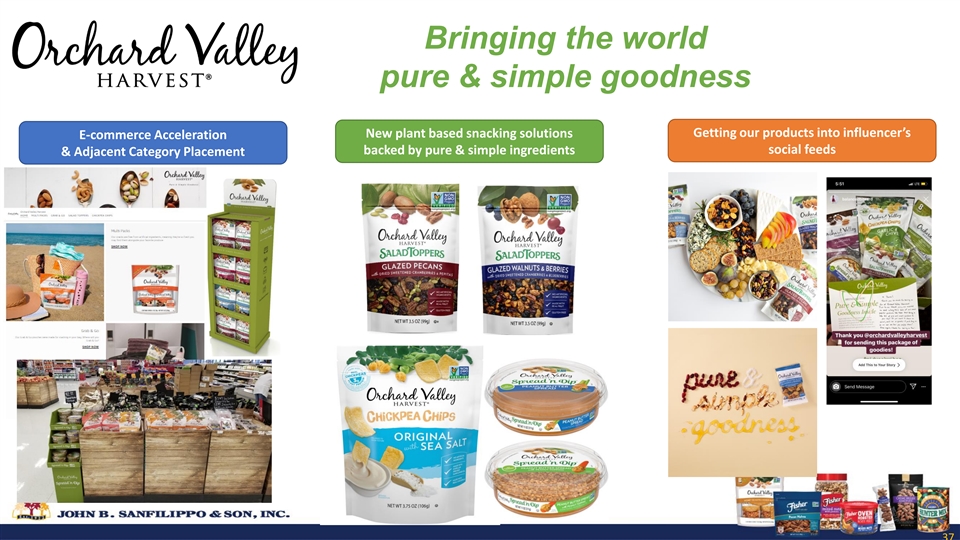
Bringing the world pure & simple goodness Getting our products into influencer’s New plant based snacking solutions E-commerce Acceleration backed by pure & simple ingredients social feeds & Adjacent Category Placement 37Bringing the world pure & simple goodness Getting our products into influencer’s New plant based snacking solutions E-commerce Acceleration backed by pure & simple ingredients social feeds & Adjacent Category Placement 37
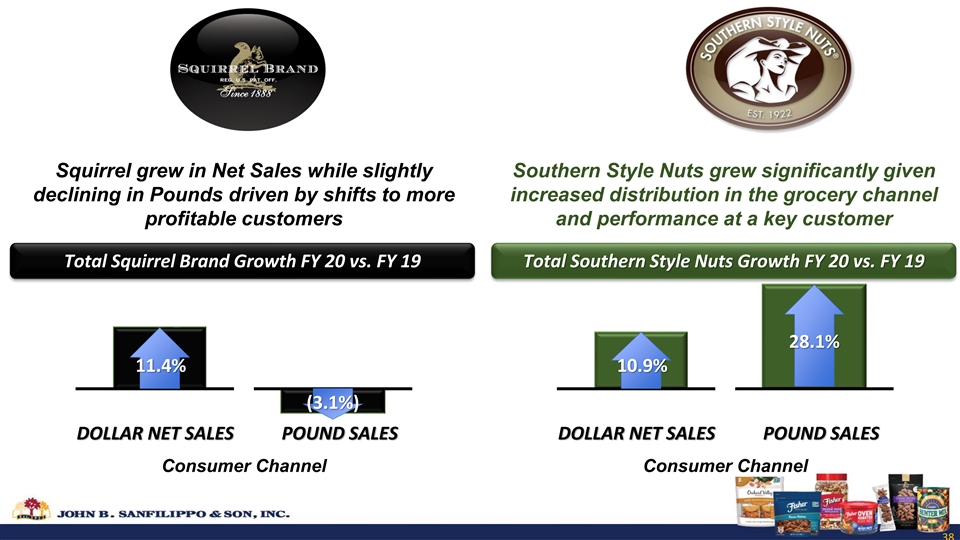
Squirrel grew in Net Sales while slightly Southern Style Nuts grew significantly given declining in Pounds driven by shifts to more increased distribution in the grocery channel profitable customers and performance at a key customer Total Squirrel Brand Growth FY 20 vs. FY 19 Total Southern Style Nuts Growth FY 20 vs. FY 19 28.1% 11.4% 10.9% (3.1%) DOLLAR NET SALES POUND SALES DOLLAR NET SALES POUND SALES Consumer Channel Consumer Channel 38Squirrel grew in Net Sales while slightly Southern Style Nuts grew significantly given declining in Pounds driven by shifts to more increased distribution in the grocery channel profitable customers and performance at a key customer Total Squirrel Brand Growth FY 20 vs. FY 19 Total Southern Style Nuts Growth FY 20 vs. FY 19 28.1% 11.4% 10.9% (3.1%) DOLLAR NET SALES POUND SALES DOLLAR NET SALES POUND SALES Consumer Channel Consumer Channel 38
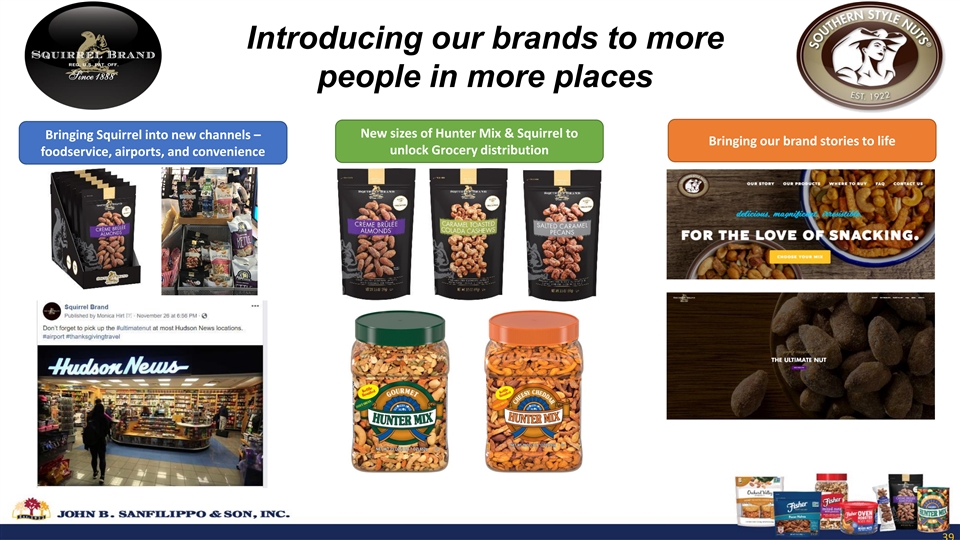
Introducing our brands to more people in more places New sizes of Hunter Mix & Squirrel to Bringing Squirrel into new channels – Bringing our brand stories to life unlock Grocery distribution foodservice, airports, and convenience 39Introducing our brands to more people in more places New sizes of Hunter Mix & Squirrel to Bringing Squirrel into new channels – Bringing our brand stories to life unlock Grocery distribution foodservice, airports, and convenience 39

THANK YOU 40THANK YOU 40