UNITED STATES
SECURITIES AND EXCHANGE COMMISSION
Washington, D.C. 20549
FORM N-CSR
CERTIFIED SHAREHOLDER REPORT OF REGISTERED
MANAGEMENT INVESTMENT COMPANIES
Investment Company Act file number 811-6440
Fidelity Aberdeen Street Trust
(Exact name of registrant as specified in charter)
245 Summer St., Boston, Massachusetts 02210
(Address of principal executive offices) (Zip code)
Scott C. Goebel, Secretary
245 Summer St.
Boston, Massachusetts 02210
(Name and address of agent for service)
Registrant's telephone number, including area code: 617-563-7000
Date of fiscal year end: | March 31 |
| |
Date of reporting period: | September 30, 2013 |
Item 1. Reports to Stockholders
Fidelity Freedom K® Funds -
Income, 2000, 2005, 2010, 2015, 2020, 2025, 2030, 2035, 2040, 2045, 2050, 2055
Semiannual Report
September 30, 2013
(Fidelity Cover Art)
Contents
Semiannual Report
To view a fund's proxy voting guidelines and proxy voting record for the 12-month period ended June 30, visit http://www.fidelity.com/proxyvotingresults or visit the Securities and Exchange Commission's (SEC) web site at http://www.sec.gov. You may also call 1-800-835-5092 to request a free copy of the proxy voting guidelines.
Standard & Poor's, S&P and S&P 500 are registered service marks of The McGraw-Hill Companies, Inc. and have been licensed for use by Fidelity Distributors Corporation.
Other third-party marks appearing herein are the property of their respective owners.
All other marks appearing herein are registered or unregistered trademarks or service marks of FMR LLC or an affiliated company. © 2013 FMR LLC. All rights reserved.
This report and the financial statements contained herein are submitted for the general information of the shareholders of the funds. This report is not authorized for distribution to prospective investors in the funds unless preceded or accompanied by an effective prospectus.
A fund files its complete schedule of portfolio holdings with the SEC for the first and third quarters of each fiscal year on Form N-Q. Forms N-Q are available on the SEC's web site at http://www.sec.gov. A fund's Forms N-Q may be reviewed and copied at the SEC's Public Reference Room in Washington, DC. Information regarding the operation of the SEC's Public Reference Room may be obtained by calling 1-800-SEC-0330. For a complete list of a fund's portfolio holdings, view the most recent holdings listing, semiannual report, or annual report on Fidelity's web site at http://www.fidelity.com, http://www.advisor.fidelity.com, or http://www.401k.com, as applicable.
NOT FDIC INSURED • MAY LOSE VALUE • NO BANK GUARANTEE
Neither the funds nor Fidelity Distributors Corporation is a bank.
Semiannual Report
As a shareholder of a Fund, you incur two types of costs: (1) transaction costs, and (2) ongoing costs, including other Fund expenses. This Example is intended to help you understand your ongoing costs (in dollars) of investing in the Funds and to compare these costs with the ongoing costs of investing in other mutual funds.
The Example is based on an investment of $1,000 invested at the beginning of the period and held for the entire period (April 1, 2013 to September 30, 2013).
Actual Expenses
The first line of the accompanying table for each fund provides information about actual account values and actual expenses. You may use the information in this line, together with the amount you invested, to estimate the expenses that you paid over the period. Simply divide your account value by $1,000.00 (for example, an $8,600 account value divided by $1,000.00 = 8.6), then multiply the result by the number in the first line for a fund under the heading entitled "Expenses Paid During Period" to estimate the expenses you paid on your account during this period. In addition, each Fund, as a shareholder in underlying Fidelity Funds, will indirectly bear its pro-rata share of the fees and expenses incurred by the underlying Fidelity Funds. These fees and expenses are not included in each Fund's annualized expense ratio used to calculate the expense estimates in the table below.
Hypothetical Example for Comparison Purposes
The second line of the accompanying table for each fund provides information about hypothetical account values and hypothetical expenses based on a fund's actual expense ratio and an assumed rate of return of 5% per year before expenses, which is not the Fund's actual return. The hypothetical account values and expenses may not be used to estimate the actual ending account balance or expenses you paid for the period. You may use this information to compare the ongoing costs of investing in the Fund and other funds. To do so, compare this 5% hypothetical example with the 5% hypothetical examples that appear in the shareholder reports of the other funds. In addition, each Fund, as a shareholder in underlying Fidelity Funds, will indirectly bear its pro-rata share of the fees and expenses incurred by the underlying Fidelity Funds. These fees and expenses are not included in each Fund's annualized expense ratio used to calculate the expense estimates in the table below.
Please note that the expenses shown in the table are meant to highlight your ongoing costs only and do not reflect any transaction costs. Therefore, the second line of the table is useful in comparing ongoing costs only, and will not help you determine the relative total costs of owning different funds.
| Annualized
Expense RatioB | Beginning
Account Value
April 1, 2013 | Ending
Account Value
September 30, 2013 | Expenses Paid
During Period*
April 1, 2013
to September 30, 2013 |
Fidelity Freedom K® Income Fund | .05% | | | |
Actual | | $ 1,000.00 | $ 1,008.50 | $ .25 |
HypotheticalA | | $ 1,000.00 | $ 1,024.82 | $ .25 |
Fidelity Freedom K® 2000 Fund | .05% | | | |
Actual | | $ 1,000.00 | $ 1,008.00 | $ .25 |
HypotheticalA | | $ 1,000.00 | $ 1,024.82 | $ .25 |
Fidelity Freedom K® 2005 Fund | .05% | | | |
Actual | | $ 1,000.00 | $ 1,021.00 | $ .25 |
HypotheticalA | | $ 1,000.00 | $ 1,024.82 | $ .25 |
Fidelity Freedom K® 2010 Fund | .05% | | | |
Actual | | $ 1,000.00 | $ 1,030.80 | $ .25 |
HypotheticalA | | $ 1,000.00 | $ 1,024.82 | $ .25 |
Fidelity Freedom K® 2015 Fund | .05% | | | |
Actual | | $ 1,000.00 | $ 1,032.60 | $ .25 |
HypotheticalA | | $ 1,000.00 | $ 1,024.82 | $ .25 |
Fidelity Freedom K® 2020 Fund | .05% | | | |
Actual | | $ 1,000.00 | $ 1,037.50 | $ .26 |
HypotheticalA | | $ 1,000.00 | $ 1,024.82 | $ .25 |
Fidelity Freedom K® 2025 Fund | .05% | | | |
Actual | | $ 1,000.00 | $ 1,049.90 | $ .26 |
HypotheticalA | | $ 1,000.00 | $ 1,024.82 | $ .25 |
Fidelity Freedom K® 2030 Fund | .05% | | | |
Actual | | $ 1,000.00 | $ 1,053.60 | $ .26 |
HypotheticalA | | $ 1,000.00 | $ 1,024.82 | $ .25 |
Fidelity Freedom K® 2035 Fund | .05% | | | |
Actual | | $ 1,000.00 | $ 1,065.70 | $ .26 |
HypotheticalA | | $ 1,000.00 | $ 1,024.82 | $ .25 |
| Annualized
Expense RatioB | Beginning
Account Value
April 1, 2013 | Ending
Account Value
September 30, 2013 | Expenses Paid
During Period*
April 1, 2013
to September 30, 2013 |
Fidelity Freedom K® 2040 Fund | .05% | | | |
Actual | | $ 1,000.00 | $ 1,067.60 | $ .26 |
HypotheticalA | | $ 1,000.00 | $ 1,024.82 | $ .25 |
Fidelity Freedom K® 2045 Fund | .05% | | | |
Actual | | $ 1,000.00 | $ 1,070.20 | $ .26 |
HypotheticalA | | $ 1,000.00 | $ 1,024.82 | $ .25 |
Fidelity Freedom K® 2050 Fund | .05% | | | |
Actual | | $ 1,000.00 | $ 1,070.60 | $ .26 |
HypotheticalA | | $ 1,000.00 | $ 1,024.82 | $ .25 |
Fidelity Freedom K® 2055 Fund | .05% | | | |
Actual | | $ 1,000.00 | $ 1,074.00 | $ .26 |
HypotheticalA | | $ 1,000.00 | $ 1,024.82 | $ .25 |
A 5% return per year before expenses
B Annualized expense ratio reflects expenses net of applicable fee waivers.
* Expenses are equal to each Fund's annualized expense ratio, multiplied by the average account value over the period, multiplied by 183/365 (to reflect the one-half year period). The fees and expenses of the underlying Fidelity Funds in which the Funds invest are not included in the Fund's annualized expense ratio.
Semiannual Report
Fidelity Freedom K® Income Fund
Investment Changes (Unaudited)
The information in the following tables is based on the direct investments of the Fund. |
Fund Holdings as of September 30, 2013 |
| % of fund's
net assets | % of fund's net assets
6 months ago |
Commodity Funds | | |
Fidelity Series Commodity Strategy Fund Class F | 1.9 | 1.9 |
Domestic Equity Funds | | |
Fidelity Blue Chip Growth Fund Class F | 1.5 | 1.4 |
Fidelity Disciplined Equity Fund Class F | 0.0 | 0.3 |
Fidelity Growth Company Fund Class F | 1.9 | 1.8 |
Fidelity Series 100 Index Fund | 0.4 | 0.5 |
Fidelity Series All-Sector Equity Fund Class F | 2.0 | 2.0 |
Fidelity Series Equity-Income Fund Class F | 1.3 | 1.2 |
Fidelity Series Growth & Income Fund Class F (formerly Fidelity Series Mega Cap Fund Class F) | 0.5 | 0.5 |
Fidelity Series Intrinsic Opportunities Fund Class F | 1.0 | 0.8 |
Fidelity Series Large Cap Value Fund Class F | 1.1 | 1.2 |
Fidelity Series Opportunistic Insights Fund Class F | 1.0 | 0.9 |
Fidelity Series Real Estate Equity Fund Class F | 0.2 | 0.2 |
Fidelity Series Small Cap Opportunities Fund Class F | 0.6 | 0.5 |
Fidelity Series Stock Selector Large Cap Value Fund Class F | 1.2 | 1.2 |
Fidelity Small Cap Growth Fund Class F | 0.3 | 0.3 |
Fidelity Small Cap Value Fund Class F | 0.3 | 0.3 |
| 13.3 | 13.1 |
Developed International Equity Funds | | |
Fidelity Series International Growth Fund Class F | 2.1 | 2.0 |
Fidelity Series International Small Cap Fund Class F | 0.4 | 0.4 |
Fidelity Series International Value Fund Class F | 2.0 | 2.0 |
| 4.5 | 4.4 |
Emerging Markets Equity Funds | | |
Fidelity Series Emerging Markets Fund Class F | 1.2 | 1.2 |
High Yield Bond Funds | | |
Fidelity Series Emerging Markets Debt Fund Class F | 0.5 | 0.5 |
Fidelity Series Floating Rate High Income Fund Class F | 1.2 | 1.1 |
Fidelity Series High Income Fund Class F | 4.9 | 5.0 |
Fidelity Series Real Estate Income Fund Class F | 0.3 | 0.4 |
| 6.9 | 7.0 |
Inflation-Protected Bond Funds | | |
Fidelity Series Inflation-Protected Bond Index Fund Class F | 11.0 | 11.4 |
Investment Grade Bond Funds | | |
Fidelity Series Investment Grade Bond Fund Class F | 21.6 | 21.5 |
Short-Term Funds | | |
Fidelity Institutional Money Market Portfolio Class F | 21.8 | 21.7 |
Fidelity Short-Term Bond Fund Class F | 17.8 | 17.8 |
| 39.6 | 39.5 |
Net Other Assets (Liabilities)* | 0.0 | 0.0 |
| 100.0 | 100.0 |
* Amount represents less than 0.1% |
Asset Allocation (% of fund's net assets) |
Period end |
 | Commodity Funds | 1.9% | |
 | Domestic Equity Funds | 13.3% | |
 | Developed International Equity Funds | 4.5% | |
 | Emerging Markets Equity Funds | 1.2% | |
 | High Yield Bond Funds | 6.9% | |
 | Inflation-Protected Bond Funds | 11.0% | |
 | Investment Grade Bond Funds | 21.6% | |
 | Short-Term Funds | 39.6% | |

Six months ago |
| Commodity Funds | 1.9% | |
| Domestic Equity Funds | 13.1% | |
| Developed International Equity Funds | 4.4% | |
| Emerging Markets Equity Funds | 1.2% | |
| High Yield Bond Funds | 7.0% | |
| Inflation-Protected Bond Funds | 11.4% | |
| Investment Grade Bond Funds | 21.5% | |
| Short-Term Funds | 39.5% | |

Semiannual Report
Fidelity Freedom K® Income Fund
Investments September 30, 2013 (Unaudited)
Showing Percentage of Net Assets
Domestic Equity Funds - 15.2% |
| Shares | | Value |
Commodity Funds - 1.9% |
Fidelity Series Commodity Strategy Fund Class F (a)(c) | 3,670,524 | | $ 29,547,719 |
Domestic Equity Funds - 13.3% |
Fidelity Blue Chip Growth Fund Class F (c) | 412,578 | | 24,148,182 |
Fidelity Growth Company Fund Class F (c) | 250,634 | | 29,767,839 |
Fidelity Series 100 Index Fund (c) | 639,875 | | 7,089,820 |
Fidelity Series All-Sector Equity Fund Class F (c) | 2,215,145 | | 31,388,602 |
Fidelity Series Equity-Income Fund Class F (c) | 1,781,258 | | 21,001,033 |
Fidelity Series Growth & Income Fund Class F (c) | 658,993 | | 7,954,049 |
Fidelity Series Intrinsic Opportunities Fund Class F (c) | 1,238,022 | | 16,081,902 |
Fidelity Series Large Cap Value Fund Class F (c) | 1,322,093 | | 16,698,031 |
Fidelity Series Opportunistic Insights Fund Class F (c) | 1,279,631 | | 16,494,443 |
Fidelity Series Real Estate Equity Fund Class F (c) | 269,524 | | 3,223,506 |
Fidelity Series Small Cap Opportunities Fund Class F (c) | 679,509 | | 8,765,669 |
Fidelity Series Stock Selector Large Cap Value Fund Class F (c) | 1,544,507 | | 18,827,546 |
Fidelity Small Cap Growth Fund Class F (c) | 244,182 | | 4,607,721 |
Fidelity Small Cap Value Fund Class F (c) | 237,070 | | 4,511,451 |
TOTAL DOMESTIC EQUITY FUNDS | | 210,559,794 |
TOTAL DOMESTIC EQUITY FUNDS (Cost $199,826,505) |
240,107,513
|
International Equity Funds - 5.7% |
| | | |
Developed International Equity Funds - 4.5% |
Fidelity Series International Growth Fund Class F (c) | 2,334,311 | | 31,769,970 |
Fidelity Series International Small Cap Fund Class F (c) | 423,067 | | 6,485,611 |
Fidelity Series International Value Fund Class F (c) | 2,939,331 | | 31,685,988 |
TOTAL DEVELOPED INTERNATIONAL EQUITY FUNDS | | 69,941,569 |
|
| Shares | | Value |
Emerging Markets Equity Funds - 1.2% |
Fidelity Series Emerging Markets Fund Class F (c) | 1,145,911 | | $ 19,239,841 |
TOTAL INTERNATIONAL EQUITY FUNDS (Cost $73,741,762) |
89,181,410
|
Bond Funds - 39.5% |
| | | |
High Yield Bond Funds - 6.9% |
Fidelity Series Emerging Markets Debt Fund Class F (c) | 770,376 | | 7,796,203 |
Fidelity Series Floating Rate High Income Fund Class F (c) | 1,729,377 | | 18,296,807 |
Fidelity Series High Income Fund Class F (c) | 7,536,056 | | 77,470,657 |
Fidelity Series Real Estate Income Fund Class F (c) | 514,097 | | 5,644,789 |
TOTAL HIGH YIELD BOND FUNDS | | 109,208,456 |
Inflation-Protected Bond Funds - 11.0% |
Fidelity Series Inflation-Protected Bond Index Fund Class F (c) | 15,969,547 | | 173,429,279 |
Investment Grade Bond Funds - 21.6% |
Fidelity Series Investment Grade Bond Fund Class F (c) | 30,396,629 | | 340,442,244 |
TOTAL BOND FUNDS (Cost $633,943,370) |
623,079,979
|
Short-Term Funds - 39.6% |
| | | |
Fidelity Institutional Money Market Portfolio Class F 0.07% (b)(c) | 343,170,947 | | 343,170,947 |
Fidelity Short-Term Bond Fund Class F (c) | 32,826,960 | | 281,327,045 |
TOTAL SHORT-TERM FUNDS (Cost $621,689,178) |
624,497,992
|
TOTAL INVESTMENT PORTFOLIO - 100.0% (Cost $1,529,200,815) | | 1,576,866,894 |
NET OTHER ASSETS (LIABILITIES) - 0.0% | | (65,308) |
NET ASSETS - 100% | $ 1,576,801,586 |
Legend |
(a) Non-income producing |
(b) The rate quoted is the annualized seven-day yield of the fund at period end. |
(c) Affiliated company |
Affiliated Underlying Funds |
Information regarding the Fund's fiscal year to date purchases and sales of the affiliated Underlying Funds and income earned by the Fund from investments in affiliated Underlying Funds is as follows: |
Affiliate | Value,
beginning of
period | Purchases | Sales
Proceeds | Dividend
Income | Value,
end of
period |
Fidelity Blue Chip Growth Fund Class F | $ 21,399,323 | $ 2,360,005 | $ 1,628,873 | $ 81,813 | $ 24,148,182 |
Fidelity Disciplined Equity Fund Class F | 4,651,346 | 42,516 | 4,916,585 | - | - |
Fidelity Growth Company Fund Class F | 28,422,283 | 1,251,683 | 4,609,768 | - | 29,767,839 |
Fidelity Institutional Money Market Portfolio Class F | 339,166,529 | 22,789,198 | 18,784,780 | 196,747 | 343,170,947 |
Fidelity Series 100 Index Fund | 7,242,026 | 325,251 | 1,003,242 | - | 7,089,820 |
Fidelity Series All-Sector Equity Fund Class F | 31,398,973 | 1,303,994 | 4,463,152 | - | 31,388,602 |
Fidelity Series Commodity Strategy Fund Class F | 29,920,383 | 3,505,317 | 1,512,741 | - | 29,547,719 |
Fidelity Series Emerging Markets Debt Fund Class F | 7,995,783 | 603,553 | 229,098 | 212,790 | 7,796,203 |
Fidelity Series Emerging Markets Fund Class F | 18,984,480 | 1,022,083 | 792,248 | - | 19,239,841 |
Fidelity Series Equity-Income Fund Class F | 19,446,821 | 1,593,407 | 1,245,563 | 220,463 | 21,001,033 |
Fidelity Series Floating Rate High Income Fund Class F | 17,924,383 | 1,232,445 | 774,455 | 405,769 | 18,296,807 |
Fidelity Series Growth & Income Fund Class F (formerly Fidelity Series Mega Cap Fund Class F) | 7,114,397 | 516,401 | 356,873 | - | 7,954,049 |
Fidelity Series High Income Fund Class F | 77,747,119 | 6,797,850 | 5,360,016 | 2,077,858 | 77,470,657 |
Fidelity Series Inflation-Protected Bond Index Fund Class F | 178,639,922 | 12,422,195 | 9,181,250 | - | 173,429,279 |
Fidelity Series International Growth Fund Class F | 31,280,623 | 1,360,626 | 3,056,149 | - | 31,769,970 |
Fidelity Series International Small Cap Fund Class F | 6,410,334 | 319,244 | 916,865 | - | 6,485,611 |
Fidelity Series International Value Fund Class F | 31,172,842 | 1,386,218 | 3,682,297 | - | 31,685,988 |
Fidelity Series Intrinsic Opportunities Fund Class F | 13,156,895 | 1,926,012 | 1,030,233 | 106,950 | 16,081,902 |
Fidelity Series Investment Grade Bond Fund Class F | 336,789,194 | 31,565,480 | 17,645,060 | 3,698,109 | 340,442,244 |
Fidelity Series Large Cap Value Fund Class F | 18,154,852 | 676,960 | 3,680,014 | - | 16,698,031 |
Fidelity Series Opportunistic Insights Fund Class F | 14,233,295 | 713,782 | 883,965 | - | 16,494,443 |
Fidelity Series Real Estate Equity Fund Class F | 2,859,599 | 801,386 | 151,934 | 24,599 | 3,223,506 |
Fidelity Series Real Estate Income Fund Class F | 5,738,540 | 530,550 | 284,633 | 172,586 | 5,644,789 |
Fidelity Series Small Cap Opportunities Fund Class F | 8,187,311 | 1,018,590 | 810,066 | - | 8,765,669 |
Fidelity Series Stock Selector Large Cap Value Fund Class F | 19,520,184 | 855,992 | 3,265,821 | - | 18,827,546 |
Fidelity Short-Term Bond Fund Class F | 279,344,535 | 18,144,494 | 15,150,030 | 1,218,322 | 281,327,045 |
Fidelity Small Cap Growth Fund Class F | 4,297,566 | 675,131 | 539,988 | - | 4,607,721 |
Fidelity Small Cap Value Fund Class F | 4,588,276 | 488,333 | 616,777 | 12,379 | 4,511,451 |
Total | $ 1,565,787,814 | $ 116,228,696 | $ 106,572,476 | $ 8,428,385 | $ 1,576,866,894 |
Other Information |
All investments are categorized as Level 1 under the Fair Value Hierarchy. The inputs or methodology used for valuing securities may not be an indication of the risk associated with investing in those securities. For more information on valuation inputs, please refer to the Investment Valuation section in the accompanying Notes to Financial Statements. |
See accompanying notes which are an integral part of the financial statements.
Semiannual Report
Fidelity Freedom K® Income Fund
Statement of Assets and Liabilities
| September 30, 2013 (Unaudited) |
| | |
Assets | | |
Investment in securities, at value (cost $1,529,200,815) - See accompanying schedule | | $ 1,576,866,894 |
Receivable for investments sold | | 4,116,320 |
Receivable for fund shares sold | | 2,844,402 |
Total assets | | 1,583,827,616 |
| | |
Liabilities | | |
Payable for fund shares redeemed | $ 6,960,719 | |
Transfer agent fees payable | 65,311 | |
Total liabilities | | 7,026,030 |
| | |
Net Assets | | $ 1,576,801,586 |
Net Assets consist of: | | |
Paid in capital | | $ 1,522,594,885 |
Undistributed net investment income | | 1,884,501 |
Accumulated undistributed net realized gain (loss) on investments | | 4,656,121 |
Net unrealized appreciation (depreciation) on investments | | 47,666,079 |
Net Assets, for 133,383,121 shares outstanding | | $ 1,576,801,586 |
Net Asset Value, offering price and redemption price per share ($1,576,801,586 ÷ 133,383,121 shares) | | $ 11.82 |
Statement of Operations
Six months ended September 30, 2013 (Unaudited) |
| | |
Investment Income | | |
Income distributions from underlying funds | | $ 8,428,385 |
| | |
Expenses | | |
Transfer agent fees | $ 388,351 | |
Independent trustees' compensation | 2,938 | |
Total expenses | | 391,289 |
Net investment income (loss) | | 8,037,096 |
Realized and Unrealized Gain (Loss) Realized gain (loss) on sale of underlying fund shares | 3,523,337 | |
Capital gain distributions from underlying funds | 3,034,192 | |
Total net realized gain (loss) | | 6,557,529 |
Change in net unrealized appreciation (depreciation) on underlying funds | | (2,100,475) |
Net gain (loss) | | 4,457,054 |
Net increase (decrease) in net assets resulting from operations | | $ 12,494,150 |
See accompanying notes which are an integral part of the financial statements.
Semiannual Report
Fidelity Freedom K® Income Fund
Financial Statements - continued
Statement of Changes in Net Assets
| Six months ended September 30, 2013
(Unaudited) | Year ended
March 31,
2013 |
Increase (Decrease) in Net Assets | | |
Operations | | |
Net investment income (loss) | $ 8,037,096 | $ 19,506,145 |
Net realized gain (loss) | 6,557,529 | 29,007,460 |
Change in net unrealized appreciation (depreciation) | (2,100,475) | 19,854,338 |
Net increase (decrease) in net assets resulting from operations | 12,494,150 | 68,367,943 |
Distributions to shareholders from net investment income | (7,750,518) | (19,271,276) |
Distributions to shareholders from net realized gain | (13,588,645) | (20,877,308) |
Total distributions | (21,339,163) | (40,148,584) |
Share transactions
Proceeds from sales of shares | 328,507,825 | 753,193,034 |
Reinvestment of distributions | 21,339,163 | 40,148,584 |
Cost of shares redeemed | (329,923,332) | (537,169,540) |
Net increase (decrease) in net assets resulting from share transactions | 19,923,656 | 256,172,078 |
Total increase (decrease) in net assets | 11,078,643 | 284,391,437 |
| | |
Net Assets | | |
Beginning of period | 1,565,722,943 | 1,281,331,506 |
End of period (including undistributed net investment income of $1,884,501 and undistributed net investment income of $1,597,923, respectively) | $ 1,576,801,586 | $ 1,565,722,943 |
Other Information Shares | | |
Sold | 27,912,699 | 64,260,405 |
Issued in reinvestment of distributions | 1,805,334 | 3,441,371 |
Redeemed | (28,079,937) | (45,842,631) |
Net increase (decrease) | 1,638,096 | 21,859,145 |
Financial Highlights
| Six months ended September 30, 2013 | Years ended March 31, |
| (Unaudited) | 2013 | 2012 | 2011 | 2010 E |
Selected Per-Share Data | | | | | |
Net asset value, beginning of period | $ 11.88 | $ 11.66 | $ 11.64 | $ 11.10 | $ 10.00 |
Income from Investment Operations | | | | | |
Net investment income (loss) C | .06 | .16 | .19 | .20 | .17 |
Net realized and unrealized gain (loss) | .04 | .39 | .21 | .61 | 1.09 |
Total from investment operations | .10 | .55 | .40 | .81 | 1.26 |
Distributions from net investment income | (.06) | (.16) | (.18) | (.18) | (.13) |
Distributions from net realized gain | (.10) | (.17) | (.19) | (.09) | (.03) |
Total distributions | (.16) | (.33) | (.38) G | (.27) | (.16) |
Net asset value, end of period | $ 11.82 | $ 11.88 | $ 11.66 | $ 11.64 | $ 11.10 |
Total Return B | .85% | 4.77% | 3.50% | 7.37% | 12.66% |
Ratios to Average Net Assets D, F | | | | | |
Expenses before reductions | .05% A | .05% | .05% | .05% | .05% A |
Expenses net of fee waivers, if any | .05% A | .05% | .05% | .05% | .05% A |
Expenses net of all reductions | .05% A | .05% | .05% | .05% | .05% A |
Net investment income (loss) | 1.02% A | 1.37% | 1.67% | 1.77% | 2.18% A |
Supplemental Data | | | | | |
Net assets, end of period (000 omitted) | $ 1,576,802 | $ 1,565,723 | $ 1,281,332 | $ 636,056 | $ 123,777 |
Portfolio turnover rate D | 14% A | 17% | 20% | 32% | 32% A |
A Annualized
B Total returns for periods of less than one year are not annualized.
C Calculated based on average shares outstanding during the period.
D Amounts do not include the activity of the Underlying Funds.
E For the period July 2, 2009 (commencement of operations) to March 31, 2010.
F Expense ratios reflect operating expenses of the Fund. Expenses before reductions do not reflect amounts reimbursed by the investment adviser or reductions from expense offset arrangements and do not represent the amount paid by the Fund during periods when reimbursements or reductions occur. Expenses net of fee waivers reflect expenses after reimbursement by the investment adviser but prior to reductions from expense offset arrangements. Expenses net of all reductions represent the net expenses paid by the Fund but do not include expenses of the investment companies in which the Fund invests.
G Total distributions of $.38 per share is comprised of distributions from net investment income of $.182 and distributions from net realized gain of $.194 per share.
See accompanying notes which are an integral part of the financial statements.
Semiannual Report
Fidelity Freedom K® 2000 Fund
Investment Changes (Unaudited)
The information in the following tables is based on the direct investments of the Fund. |
Fund Holdings as of September 30, 2013 |
| % of fund's net assets | % of fund's net assets 6 months ago |
Commodity Funds | | |
Fidelity Series Commodity Strategy Fund Class F | 1.9 | 1.9 |
Domestic Equity Funds | | |
Fidelity Blue Chip Growth Fund Class F | 1.5 | 1.3 |
Fidelity Disciplined Equity Fund Class F | 0.0 | 0.3 |
Fidelity Growth Company Fund Class F | 1.9 | 1.8 |
Fidelity Series 100 Index Fund | 0.5 | 0.4 |
Fidelity Series All-Sector Equity Fund Class F | 2.0 | 2.0 |
Fidelity Series Equity-Income Fund Class F | 1.3 | 1.3 |
Fidelity Series Growth & Income Fund Class F (formerly Fidelity Series Mega Cap Fund Class F) | 0.5 | 0.5 |
Fidelity Series Intrinsic Opportunities Fund Class F | 1.0 | 0.8 |
Fidelity Series Large Cap Value Fund Class F | 1.0 | 1.2 |
Fidelity Series Opportunistic Insights Fund Class F | 1.0 | 0.9 |
Fidelity Series Real Estate Equity Fund Class F | 0.2 | 0.2 |
Fidelity Series Small Cap Opportunities Fund Class F | 0.6 | 0.5 |
Fidelity Series Stock Selector Large Cap Value Fund Class F | 1.2 | 1.3 |
Fidelity Small Cap Growth Fund Class F | 0.3 | 0.3 |
Fidelity Small Cap Value Fund Class F | 0.3 | 0.3 |
| 13.3 | 13.1 |
Developed International Equity Funds | | |
Fidelity Series International Growth Fund Class F | 2.0 | 2.0 |
Fidelity Series International Small Cap Fund Class F | 0.4 | 0.4 |
Fidelity Series International Value Fund Class F | 2.0 | 2.0 |
| 4.4 | 4.4 |
Emerging Markets Equity Funds | | |
Fidelity Series Emerging Markets Fund Class F | 1.2 | 1.2 |
High Yield Bond Funds | | |
Fidelity Series Emerging Markets Debt Fund Class F | 0.5 | 0.5 |
Fidelity Series Floating Rate High Income Fund Class F | 1.1 | 1.2 |
Fidelity Series High Income Fund Class F | 4.9 | 5.0 |
Fidelity Series Real Estate Income Fund Class F | 0.4 | 0.4 |
| 6.9 | 7.1 |
Inflation-Protected Bond Funds | | |
Fidelity Series Inflation-Protected Bond Index Fund Class F | 11.0 | 11.4 |
Investment Grade Bond Funds | | |
Fidelity Series Investment Grade Bond Fund Class F | 21.6 | 21.4 |
Short-Term Funds | | |
Fidelity Institutional Money Market Portfolio Class F | 21.8 | 21.7 |
Fidelity Short-Term Bond Fund Class F | 17.9 | 17.8 |
| 39.7 | 39.5 |
Net Other Assets (Liabilities)* | 0.0 | 0.0 |
| 100.0 | 100.0 |
* Amount represents less than 0.1% |
Asset Allocation (% of fund's net assets) |
Period end |
| Commodity Funds | 1.9% | |
| Domestic Equity Funds | 13.3% | |
| Developed International Equity Funds | 4.4% | |
| Emerging Markets Equity Funds | 1.2% | |
| High Yield Bond Funds | 6.9% | |
| Inflation-Protected Bond Funds | 11.0% | |
| Investment Grade Bond Funds | 21.6% | |
| Short-Term Funds | 39.7% | |

Six months ago |
| Commodity Funds | 1.9% | |
| Domestic Equity Funds | 13.1% | |
| Developed International Equity Funds | 4.4% | |
| Emerging Markets Equity Funds | 1.2% | |
| High Yield Bond Funds | 7.1% | |
| Inflation-Protected Bond Funds | 11.4% | |
| Investment Grade Bond Funds | 21.4% | |
| Short-Term Funds | 39.5% | |

Semiannual Report
Fidelity Freedom K® 2000 Fund
Investments September 30, 2013 (Unaudited)
Showing Percentage of Net Assets
Domestic Equity Funds - 15.2% |
| Shares | | Value |
Commodity Funds - 1.9% |
Fidelity Series Commodity Strategy Fund Class F (a)(c) | 1,697,035 | | $ 13,661,129 |
Domestic Equity Funds - 13.3% |
Fidelity Blue Chip Growth Fund Class F (c) | 190,153 | | 11,129,678 |
Fidelity Growth Company Fund Class F (c) | 115,839 | | 13,758,141 |
Fidelity Series 100 Index Fund (c) | 297,298 | | 3,294,066 |
Fidelity Series All-Sector Equity Fund Class F (c) | 1,022,503 | | 14,488,863 |
Fidelity Series Equity-Income Fund Class F (c) | 830,983 | | 9,797,294 |
Fidelity Series Growth & Income Fund Class F (c) | 318,243 | | 3,841,189 |
Fidelity Series Intrinsic Opportunities Fund Class F (c) | 580,345 | | 7,538,686 |
Fidelity Series Large Cap Value Fund Class F (c) | 606,141 | | 7,655,566 |
Fidelity Series Opportunistic Insights Fund Class F (c) | 596,326 | | 7,686,646 |
Fidelity Series Real Estate Equity Fund Class F (c) | 124,740 | | 1,491,885 |
Fidelity Series Small Cap Opportunities Fund Class F (c) | 313,494 | | 4,044,076 |
Fidelity Series Stock Selector Large Cap Value Fund Class F (c) | 714,004 | | 8,703,703 |
Fidelity Small Cap Growth Fund Class F (c) | 114,228 | | 2,155,486 |
Fidelity Small Cap Value Fund Class F (c) | 111,450 | | 2,120,897 |
TOTAL DOMESTIC EQUITY FUNDS | | 97,706,176 |
TOTAL DOMESTIC EQUITY FUNDS (Cost $91,689,666) |
111,367,305
|
International Equity Funds - 5.6% |
| | | |
Developed International Equity Funds - 4.4% |
Fidelity Series International Growth Fund Class F (c) | 1,086,896 | | 14,792,657 |
Fidelity Series International Small Cap Fund Class F (c) | 197,013 | | 3,020,209 |
Fidelity Series International Value Fund Class F (c) | 1,367,864 | | 14,745,574 |
TOTAL DEVELOPED INTERNATIONAL EQUITY FUNDS | | 32,558,440 |
|
| Shares | | Value |
Emerging Markets Equity Funds - 1.2% |
Fidelity Series Emerging Markets Fund Class F (c) | 525,134 | | $ 8,817,005 |
TOTAL INTERNATIONAL EQUITY FUNDS (Cost $33,911,939) |
41,375,445
|
Bond Funds - 39.5% |
| | | |
High Yield Bond Funds - 6.9% |
Fidelity Series Emerging Markets Debt Fund Class F (c) | 370,991 | | 3,754,428 |
Fidelity Series Floating Rate High Income Fund Class F (c) | 790,519 | | 8,363,696 |
Fidelity Series High Income Fund Class F (c) | 3,495,709 | | 35,935,885 |
Fidelity Series Real Estate Income Fund Class F (c) | 237,246 | | 2,604,956 |
TOTAL HIGH YIELD BOND FUNDS | | 50,658,965 |
Inflation-Protected Bond Funds - 11.0% |
Fidelity Series Inflation-Protected Bond Index Fund Class F (c) | 7,429,834 | | 80,687,998 |
Investment Grade Bond Funds - 21.6% |
Fidelity Series Investment Grade Bond Fund Class F (c) | 14,129,805 | | 158,253,816 |
TOTAL BOND FUNDS (Cost $293,112,535) |
289,600,779
|
Short-Term Funds - 39.7% |
| | | |
Fidelity Institutional Money Market Portfolio Class F 0.07% (b)(c) | 159,724,633 | | 159,724,633 |
Fidelity Short-Term Bond Fund Class F (c) | 15,280,859 | | 130,956,964 |
TOTAL SHORT-TERM FUNDS (Cost $288,938,938) |
290,681,597
|
TOTAL INVESTMENT PORTFOLIO - 100.0% (Cost $707,653,078) | | 733,025,126 |
NET OTHER ASSETS (LIABILITIES) - 0.0% | | (30,581) |
NET ASSETS - 100% | $ 732,994,545 |
Legend |
(a) Non-income producing |
(b) The rate quoted is the annualized seven-day yield of the fund at period end. |
(c) Affiliated company |
Affiliated Underlying Funds |
Information regarding the Fund's fiscal year to date purchases and sales of the affiliated Underlying Funds and income earned by the Fund from investments in affiliated Underlying Funds is as follows: |
Affiliate | Value,
beginning of
period | Purchases | Sales
Proceeds | Dividend
Income | Value,
end of
period |
Fidelity Blue Chip Growth Fund Class F | $ 10,367,354 | $ 943,038 | $ 1,142,631 | $ 38,060 | $ 11,129,678 |
Fidelity Disciplined Equity Fund Class F | 2,272,153 | 8,875 | 2,389,469 | - | - |
Fidelity Growth Company Fund Class F | 13,841,156 | 413,353 | 2,738,344 | - | 13,758,141 |
Fidelity Institutional Money Market Portfolio Class F | 165,948,123 | 7,226,067 | 13,449,557 | 93,562 | 159,724,633 |
Fidelity Series 100 Index Fund | 3,503,980 | 103,120 | 564,443 | - | 3,294,066 |
Fidelity Series All-Sector Equity Fund Class F | 15,197,543 | 426,085 | 2,626,355 | - | 14,488,863 |
Fidelity Series Commodity Strategy Fund Class F | 14,657,088 | 1,311,744 | 1,179,184 | - | 13,661,129 |
Fidelity Series Emerging Markets Debt Fund Class F | 4,128,883 | 215,282 | 308,756 | 105,519 | 3,754,428 |
Fidelity Series Emerging Markets Fund Class F | 9,247,573 | 307,241 | 745,892 | - | 8,817,005 |
Fidelity Series Equity-Income Fund Class F | 9,701,289 | 469,799 | 964,115 | 106,912 | 9,797,294 |
Fidelity Series Floating Rate High Income Fund Class F | 8,951,472 | 419,144 | 967,426 | 193,013 | 8,363,696 |
Fidelity Series Growth & Income Fund Class F (formerly Fidelity Series Mega Cap Fund Class F) | 3,546,946 | 294,400 | 331,949 | - | 3,841,189 |
Fidelity Series High Income Fund Class F | 38,372,819 | 2,307,892 | 3,943,689 | 988,897 | 35,935,885 |
Fidelity Series Inflation-Protected Bond Index Fund Class F | 87,252,419 | 4,526,143 | 7,068,391 | - | 80,687,998 |
Fidelity Series International Growth Fund Class F | 15,297,286 | 423,304 | 1,971,795 | - | 14,792,657 |
Fidelity Series International Small Cap Fund Class F | 3,125,927 | 89,075 | 517,569 | - | 3,020,209 |
Fidelity Series International Value Fund Class F | 15,195,142 | 421,163 | 2,220,468 | - | 14,745,574 |
Fidelity Series Intrinsic Opportunities Fund Class F | 6,402,479 | 721,957 | 559,569 | 50,649 | 7,538,686 |
Fidelity Series Investment Grade Bond Fund Class F | 164,573,090 | 11,357,885 | 12,831,160 | 1,754,721 | 158,253,816 |
Fidelity Series Large Cap Value Fund Class F | 8,877,379 | 233,570 | 2,198,548 | - | 7,655,566 |
Fidelity Series Opportunistic Insights Fund Class F | 7,095,962 | 221,916 | 796,330 | - | 7,686,646 |
Fidelity Series Real Estate Equity Fund Class F | 1,315,668 | 447,385 | 137,357 | 11,467 | 1,491,885 |
Fidelity Series Real Estate Income Fund Class F | 2,865,016 | 204,049 | 305,066 | 81,190 | 2,604,956 |
Fidelity Series Small Cap Opportunities Fund Class F | 3,972,675 | 419,131 | 525,656 | - | 4,044,076 |
Fidelity Series Stock Selector Large Cap Value Fund Class F | 9,741,259 | 281,100 | 2,162,640 | - | 8,703,703 |
Fidelity Short-Term Bond Fund Class F | 136,491,569 | 5,837,335 | 10,898,749 | 578,121 | 130,956,964 |
Fidelity Small Cap Growth Fund Class F | 2,095,648 | 291,121 | 315,936 | - | 2,155,486 |
Fidelity Small Cap Value Fund Class F | 2,242,805 | 200,903 | 348,655 | 5,876 | 2,120,897 |
Total | $ 766,280,703 | $ 40,122,077 | $ 74,209,699 | $ 4,007,987 | $ 733,025,126 |
Other Information |
All investments are categorized as Level 1 under the Fair Value Hierarchy. The inputs or methodology used for valuing securities may not be an indication of the risk associated with investing in those securities. For more information on valuation inputs, please refer to the Investment Valuation section in the accompanying Notes to Financial Statements. |
See accompanying notes which are an integral part of the financial statements.
Semiannual Report
Fidelity Freedom K® 2000 Fund
Statement of Assets and Liabilities
| September 30, 2013 (Unaudited) |
| | |
Assets | | |
Investment in securities, at value (cost $707,653,078) - See accompanying schedule | | $ 733,025,126 |
Receivable for investments sold | | 2,307,472 |
Receivable for fund shares sold | | 1,260,648 |
Total assets | | 736,593,246 |
| | |
Liabilities | | |
Payable for fund shares redeemed | $ 3,568,117 | |
Transfer agent fees payable | 30,584 | |
Total liabilities | | 3,598,701 |
| | |
Net Assets | | $ 732,994,545 |
Net Assets consist of: | | |
Paid in capital | | $ 700,810,327 |
Undistributed net investment income | | 3,799,795 |
Accumulated undistributed net realized gain (loss) on investments | | 3,012,375 |
Net unrealized appreciation (depreciation) on investments | | 25,372,048 |
Net Assets, for 61,087,214 shares outstanding | | $ 732,994,545 |
Net Asset Value, offering price and redemption price per share ($732,994,545 ÷ 61,087,214 shares) | | $ 12.00 |
Statement of Operations
Six months ended September 30, 2013 (Unaudited) |
| | |
Investment Income | | |
Income distributions from underlying funds | | $ 4,007,987 |
| | |
Expenses | | |
Transfer agent fees | $ 184,541 | |
Independent trustees' compensation | 1,407 | |
Total expenses | | 185,948 |
Net investment income (loss) | | 3,822,039 |
Realized and Unrealized Gain (Loss) Realized gain (loss) on sale of underlying fund shares | 2,547,247 | |
Capital gain distributions from underlying funds | 1,420,394 | |
Total net realized gain (loss) | | 3,967,641 |
Change in net unrealized appreciation (depreciation) on underlying funds | | (1,715,202) |
Net gain (loss) | | 2,252,439 |
Net increase (decrease) in net assets resulting from operations | | $ 6,074,478 |
See accompanying notes which are an integral part of the financial statements.
Semiannual Report
Financial Statements - continued
Statement of Changes in Net Assets
| Six months ended September 30, 2013
(Unaudited) | Year ended
March 31,
2013 |
Increase (Decrease) in Net Assets | | |
Operations | | |
Net investment income (loss) | $ 3,822,039 | $ 9,986,493 |
Net realized gain (loss) | 3,967,641 | 14,801,169 |
Change in net unrealized appreciation (depreciation) | (1,715,202) | 10,236,408 |
Net increase (decrease) in net assets resulting from operations | 6,074,478 | 35,024,070 |
Distributions to shareholders from net investment income | (1,768,093) | (10,127,602) |
Distributions to shareholders from net realized gain | (6,819,787) | (10,962,080) |
Total distributions | (8,587,880) | (21,089,682) |
Share transactions
Proceeds from sales of shares | 105,641,503 | 317,129,847 |
Reinvestment of distributions | 8,587,880 | 21,089,682 |
Cost of shares redeemed | (144,970,335) | (248,577,057) |
Net increase (decrease) in net assets resulting from share transactions | (30,740,952) | 89,642,472 |
Total increase (decrease) in net assets | (33,254,354) | 103,576,860 |
| | |
Net Assets | | |
Beginning of period | 766,248,899 | 662,672,039 |
End of period (including undistributed net investment income of $3,799,795 and undistributed net investment income of $1,745,849, respectively) | $ 732,994,545 | $ 766,248,899 |
Other Information Shares | | |
Sold | 8,866,885 | 26,708,564 |
Issued in reinvestment of distributions | 715,657 | 1,790,935 |
Redeemed | (12,158,584) | (20,902,745) |
Net increase (decrease) | (2,576,042) | 7,596,754 |
Financial Highlights
| Six months ended September 30, 2013 | Years ended March 31, |
| (Unaudited) | 2013 | 2012 | 2011 | 2010 E |
Selected Per-Share Data | | | | | |
Net asset value, beginning of period | $ 12.04 | $ 11.82 | $ 11.83 | $ 11.20 | $ 10.00 |
Income from Investment Operations | | | | | |
Net investment income (loss) C | .06 | .16 | .19 | .20 | .19 |
Net realized and unrealized gain (loss) | .04 | .40 | .20 | .65 | 1.12 |
Total from investment operations | .10 | .56 | .39 | .85 | 1.31 |
Distributions from net investment income | (.03) | (.16) | (.17) | (.14) | (.06) |
Distributions from net realized gain | (.11) | (.18) | (.24) | (.08) | (.05) |
Total distributions | (.14) | (.34) | (.40) G | (.22) | (.11) |
Net asset value, end of period | $ 12.00 | $ 12.04 | $ 11.82 | $ 11.83 | $ 11.20 |
Total Return B | .80% | 4.84% | 3.41% | 7.68% | 13.12% |
Ratios to Average Net Assets D, F | | | | | |
Expenses before reductions | .05% A | .05% | .05% | .05% | .05% A |
Expenses net of fee waivers, if any | .05% A | .05% | .05% | .05% | .05% A |
Expenses net of all reductions | .05% A | .05% | .05% | .05% | .05% A |
Net investment income (loss) | 1.02% A | 1.37% | 1.65% | 1.74% | 2.40% A |
Supplemental Data | | | | | |
Net assets, end of period (000 omitted) | $ 732,995 | $ 766,249 | $ 662,672 | $ 415,186 | $ 87,474 |
Portfolio turnover rate D | 11% A | 20% | 22% | 36% | 35% A |
A Annualized
B Total returns for periods of less than one year are not annualized.
C Calculated based on average shares outstanding during the period.
D Amounts do not include the activity of the Underlying Funds.
E For the period July 2, 2009 (commencement of operations) to March 31, 2010.
F Expense ratios reflect operating expenses of the Fund. Expenses before reductions do not reflect amounts reimbursed by the investment adviser or reductions from expense offset arrangements and do not represent the amount paid by the Fund during periods when reimbursements or reductions occur. Expenses net of fee waivers reflect expenses after reimbursement by the investment adviser but prior to reductions from expense offset arrangements. Expenses net of all reductions represent the net expenses paid by the Fund but do not include expenses of the investment companies in which the Fund invests.
G Total distributions of $.40 per share is comprised of distributions from net investment income of $.166 and distributions from net realized gain of $.235 per share.
See accompanying notes which are an integral part of the financial statements.
Semiannual Report
Fidelity Freedom K® 2005 Fund
Investment Changes (Unaudited)
The information in the following tables is based on the direct investments of the Fund. |
Fund Holdings as of September 30, 2013 |
| % of fund's
net assets | % of fund's net assets
6 months ago |
Commodity Funds | | |
Fidelity Series Commodity Strategy Fund Class F | 3.5 | 3.8 |
Domestic Equity Funds | | |
Fidelity Blue Chip Growth Fund Class F | 2.5 | 2.4 |
Fidelity Disciplined Equity Fund Class F | 0.0 | 0.5 |
Fidelity Growth Company Fund Class F | 3.0 | 3.1 |
Fidelity Series 100 Index Fund | 0.7 | 0.8 |
Fidelity Series All-Sector Equity Fund Class F | 3.2 | 3.4 |
Fidelity Series Equity-Income Fund Class F | 2.2 | 2.2 |
Fidelity Series Growth & Income Fund Class F (formerly Fidelity Series Mega Cap Fund Class F) | 0.9 | 0.8 |
Fidelity Series Intrinsic Opportunities Fund Class F | 1.6 | 1.2 |
Fidelity Series Large Cap Value Fund Class F | 1.6 | 2.0 |
Fidelity Series Opportunistic Insights Fund Class F | 1.7 | 1.6 |
Fidelity Series Real Estate Equity Fund Class F | 0.3 | 0.3 |
Fidelity Series Small Cap Opportunities Fund Class F | 0.9 | 0.9 |
Fidelity Series Stock Selector Large Cap Value Fund Class F | 1.9 | 2.2 |
Fidelity Small Cap Growth Fund Class F | 0.5 | 0.5 |
Fidelity Small Cap Value Fund Class F | 0.5 | 0.5 |
| 21.5 | 22.4 |
Developed International Equity Funds | | |
Fidelity Series International Growth Fund Class F | 3.3 | 3.4 |
Fidelity Series International Small Cap Fund Class F | 0.7 | 0.7 |
Fidelity Series International Value Fund Class F | 3.3 | 3.3 |
| 7.3 | 7.4 |
Emerging Markets Equity Funds | | |
Fidelity Series Emerging Markets Fund Class F | 2.1 | 2.0 |
High Yield Bond Funds | | |
Fidelity Series Emerging Markets Debt Fund Class F | 0.6 | 0.6 |
Fidelity Series Floating Rate High Income Fund Class F | 1.2 | 1.1 |
Fidelity Series High Income Fund Class F | 4.8 | 4.8 |
Fidelity Series Real Estate Income Fund Class F | 0.4 | 0.5 |
| 7.0 | 7.0 |
Inflation-Protected Bond Funds | | |
Fidelity Series Inflation-Protected Bond Index Fund Class F | 8.8 | 9.1 |
Investment Grade Bond Funds | | |
Fidelity Series Investment Grade Bond Fund Class F | 17.9 | 18.1 |
Short-Term Funds | | |
Fidelity Institutional Money Market Portfolio Class F | 17.5 | 16.6 |
Fidelity Short-Term Bond Fund Class F | 14.4 | 13.6 |
| 31.9 | 30.2 |
Net Other Assets (Liabilities)* | 0.0 | 0.0 |
| 100.0 | 100.0 |
* Amount represents less than 0.1% |
Asset Allocation (% of fund's net assets) |
Period end |
| Commodity Funds | 3.5% | |
| Domestic Equity Funds | 21.5% | |
| Developed International Equity Funds | 7.3% | |
| Emerging Markets Equity Funds | 2.1% | |
| High Yield Bond Funds | 7.0% | |
| Inflation-Protected Bond Funds | 8.8% | |
| Investment Grade Bond Funds | 17.9% | |
| Short-Term Funds | 31.9% | |

Six months ago |
| Commodity Funds | 3.8% | |
| Domestic Equity Funds | 22.4% | |
| Developed International Equity Funds | 7.4% | |
| Emerging Markets Equity Funds | 2.0% | |
| High Yield Bond Funds | 7.0% | |
| Inflation-Protected Bond Funds | 9.1% | |
| Investment Grade Bond Funds | 18.1% | |
| Short-Term Funds | 30.2% | |

Semiannual Report
Fidelity Freedom K® 2005 Fund
Investments September 30, 2013 (Unaudited)
Showing Percentage of Net Assets
Domestic Equity Funds - 25.0% |
| Shares | | Value |
Commodity Funds - 3.5% |
Fidelity Series Commodity Strategy Fund Class F (a)(c) | 2,189,902 | | $ 17,628,712 |
Domestic Equity Funds - 21.5% |
Fidelity Blue Chip Growth Fund Class F (c) | 209,899 | | 12,285,403 |
Fidelity Growth Company Fund Class F (c) | 126,200 | | 14,988,784 |
Fidelity Series 100 Index Fund (c) | 317,806 | | 3,521,290 |
Fidelity Series All-Sector Equity Fund Class F (c) | 1,118,180 | | 15,844,609 |
Fidelity Series Equity-Income Fund Class F (c) | 918,521 | | 10,829,358 |
Fidelity Series Growth & Income Fund Class F (c) | 358,009 | | 4,321,170 |
Fidelity Series Intrinsic Opportunities Fund Class F (c) | 625,850 | | 8,129,792 |
Fidelity Series Large Cap Value Fund Class F (c) | 638,300 | | 8,061,734 |
Fidelity Series Opportunistic Insights Fund Class F (c) | 667,807 | | 8,608,031 |
Fidelity Series Real Estate Equity Fund Class F (c) | 137,944 | | 1,649,804 |
Fidelity Series Small Cap Opportunities Fund Class F (c) | 342,393 | | 4,416,865 |
Fidelity Series Stock Selector Large Cap Value Fund Class F (c) | 768,447 | | 9,367,365 |
Fidelity Small Cap Growth Fund Class F (c) | 126,446 | | 2,386,042 |
Fidelity Small Cap Value Fund Class F (c) | 121,386 | | 2,309,974 |
TOTAL DOMESTIC EQUITY FUNDS | | 106,720,221 |
TOTAL DOMESTIC EQUITY FUNDS (Cost $103,527,749) |
124,348,933
|
International Equity Funds - 9.4% |
| | | |
Developed International Equity Funds - 7.3% |
Fidelity Series International Growth Fund Class F (c) | 1,209,221 | | 16,457,503 |
Fidelity Series International Small Cap Fund Class F (c) | 217,669 | | 3,336,867 |
Fidelity Series International Value Fund Class F (c) | 1,517,689 | | 16,360,685 |
TOTAL DEVELOPED INTERNATIONAL EQUITY FUNDS | | 36,155,055 |
|
| Shares | | Value |
Emerging Markets Equity Funds - 2.1% |
Fidelity Series Emerging Markets Fund Class F (c) | 617,413 | | $ 10,366,356 |
TOTAL INTERNATIONAL EQUITY FUNDS (Cost $37,940,717) |
46,521,411
|
Bond Funds - 33.7% |
| | | |
High Yield Bond Funds - 7.0% |
Fidelity Series Emerging Markets Debt Fund Class F (c) | 297,352 | | 3,009,204 |
Fidelity Series Floating Rate High Income Fund Class F (c) | 547,937 | | 5,797,174 |
Fidelity Series High Income Fund Class F (c) | 2,320,257 | | 23,852,237 |
Fidelity Series Real Estate Income Fund Class F (c) | 204,597 | | 2,246,472 |
TOTAL HIGH YIELD BOND FUNDS | | 34,905,087 |
Inflation-Protected Bond Funds - 8.8% |
Fidelity Series Inflation-Protected Bond Index Fund Class F (c) | 4,013,582 | | 43,587,505 |
Investment Grade Bond Funds - 17.9% |
Fidelity Series Investment Grade Bond Fund Class F (c) | 7,910,233 | | 88,594,615 |
TOTAL BOND FUNDS (Cost $169,035,753) |
167,087,207
|
Short-Term Funds - 31.9% |
| | | |
Fidelity Institutional Money Market Portfolio Class F 0.07% (b)(c) | 87,017,729 | | 87,017,729 |
Fidelity Short-Term Bond Fund Class F (c) | 8,314,891 | | 71,258,614 |
TOTAL SHORT-TERM FUNDS (Cost $157,712,319) |
158,276,343
|
TOTAL INVESTMENT PORTFOLIO - 100.0% (Cost $468,216,538) | | 496,233,894 |
NET OTHER ASSETS (LIABILITIES) - 0.0% | | (20,511) |
NET ASSETS - 100% | $ 496,213,383 |
Legend |
(a) Non-income producing |
(b) The rate quoted is the annualized seven-day yield of the fund at period end. |
(c) Affiliated company |
Affiliated Underlying Funds |
Information regarding the Fund's fiscal year to date purchases and sales of the affiliated Underlying Funds and income earned by the Fund from investments in affiliated Underlying Funds is as follows: |
Affiliate | Value,
beginning of
period | Purchases | Sales
Proceeds | Dividend
Income | Value,
end of
period |
Fidelity Blue Chip Growth Fund Class F | $ 11,815,761 | $ 1,706,949 | $ 2,350,967 | $ 41,226 | $ 12,285,403 |
Fidelity Disciplined Equity Fund Class F | 2,578,747 | 28,754 | 2,729,159 | - | - |
Fidelity Growth Company Fund Class F | 15,272,824 | 1,274,170 | 4,022,064 | - | 14,988,784 |
Fidelity Institutional Money Market Portfolio Class F | 82,320,523 | 14,148,625 | 9,451,419 | 49,238 | 87,017,729 |
Fidelity Series 100 Index Fund | 3,957,039 | 321,626 | 1,028,250 | - | 3,521,290 |
Fidelity Series All-Sector Equity Fund Class F | 17,062,392 | 1,400,083 | 4,256,052 | - | 15,844,609 |
Fidelity Series Commodity Strategy Fund Class F | 18,712,743 | 2,494,905 | 2,081,595 | - | 17,628,712 |
Fidelity Series Emerging Markets Debt Fund Class F | 3,081,086 | 321,315 | 173,130 | 81,793 | 3,009,204 |
Fidelity Series Emerging Markets Fund Class F | 10,249,384 | 960,967 | 850,219 | - | 10,366,356 |
Fidelity Series Equity-Income Fund Class F | 10,757,552 | 1,056,379 | 1,647,078 | 119,966 | 10,829,358 |
Fidelity Series Floating Rate High Income Fund Class F | 5,430,822 | 758,185 | 364,175 | 126,565 | 5,797,174 |
Fidelity Series Growth & Income Fund Class F (formerly Fidelity Series Mega Cap Fund Class F) | 3,927,382 | 437,660 | 415,692 | - | 4,321,170 |
Fidelity Series High Income Fund Class F | 23,964,069 | 3,086,989 | 2,649,653 | 642,183 | 23,852,237 |
Fidelity Series Inflation-Protected Bond Index Fund Class F | 45,159,502 | 5,669,769 | 5,066,904 | - | 43,587,505 |
Fidelity Series International Growth Fund Class F | 16,729,213 | 1,530,371 | 2,923,805 | - | 16,457,503 |
Fidelity Series International Small Cap Fund Class F | 3,426,173 | 304,676 | 738,304 | - | 3,336,867 |
Fidelity Series International Value Fund Class F | 16,533,675 | 1,279,467 | 2,905,320 | - | 16,360,685 |
Fidelity Series Intrinsic Opportunities Fund Class F | 6,130,497 | 1,784,990 | 756,542 | 54,338 | 8,129,792 |
Fidelity Series Investment Grade Bond Fund Class F | 89,545,578 | 11,636,843 | 9,826,315 | 974,342 | 88,594,615 |
Fidelity Series Large Cap Value Fund Class F | 9,996,897 | 743,695 | 3,430,485 | - | 8,061,734 |
Fidelity Series Opportunistic Insights Fund Class F | 7,852,073 | 682,067 | 1,227,127 | - | 8,608,031 |
Fidelity Series Real Estate Equity Fund Class F | 1,520,576 | 419,890 | 144,879 | 12,841 | 1,649,804 |
Fidelity Series Real Estate Income Fund Class F | 2,333,416 | 252,870 | 204,116 | 69,217 | 2,246,472 |
Fidelity Series Small Cap Opportunities Fund Class F | 4,532,355 | 697,988 | 1,029,288 | - | 4,416,865 |
Fidelity Series Stock Selector Large Cap Value Fund Class F | 10,807,598 | 860,941 | 3,197,712 | - | 9,367,365 |
Fidelity Short-Term Bond Fund Class F | 67,453,619 | 11,775,447 | 7,712,721 | 304,186 | 71,258,614 |
Fidelity Small Cap Growth Fund Class F | 2,384,563 | 449,186 | 549,190 | - | 2,386,042 |
Fidelity Small Cap Value Fund Class F | 2,548,398 | 346,488 | 619,991 | 6,371 | 2,309,974 |
Total | $ 496,084,457 | $ 66,431,295 | $ 72,352,152 | $ 2,482,266 | $ 496,233,894 |
Other Information |
All investments are categorized as Level 1 under the Fair Value Hierarchy. The inputs or methodology used for valuing securities may not be an indication of the risk associated with investing in those securities. For more information on valuation inputs, please refer to the Investment Valuation section in the accompanying Notes to Financial Statements. |
See accompanying notes which are an integral part of the financial statements.
Semiannual Report
Fidelity Freedom K® 2005 Fund
Statement of Assets and Liabilities
| September 30, 2013 (Unaudited) |
| | |
Assets | | |
Investment in securities, at value (cost $468,216,538) - See accompanying schedule | | $ 496,233,894 |
Receivable for investments sold | | 1,373,420 |
Receivable for fund shares sold | | 750,520 |
Total assets | | 498,357,834 |
| | |
Liabilities | | |
Payable for fund shares redeemed | $ 2,123,940 | |
Transfer agent fees payable | 20,511 | |
Total liabilities | | 2,144,451 |
| | |
Net Assets | | $ 496,213,383 |
Net Assets consist of: | | |
Paid in capital | | $ 462,651,454 |
Undistributed net investment income | | 2,353,189 |
Accumulated undistributed net realized gain (loss) on investments | | 3,191,384 |
Net unrealized appreciation (depreciation) on investments | | 28,017,356 |
Net Assets, for 38,006,239 shares outstanding | | $ 496,213,383 |
Net Asset Value, offering price and redemption price per share ($496,213,383 ÷ 38,006,239 shares) | | $ 13.06 |
Statement of Operations
Six months ended September 30, 2013 (Unaudited) |
| | |
Investment Income | | |
Income distributions from underlying funds | | $ 2,482,266 |
| | |
Expenses | | |
Transfer agent fees | $ 123,027 | |
Independent trustees' compensation | 932 | |
Total expenses | | 123,959 |
Net investment income (loss) | | 2,358,307 |
Realized and Unrealized Gain (Loss) Realized gain (loss) on sale of underlying fund shares | 2,843,656 | |
Capital gain distributions from underlying funds | 1,535,562 | |
Total net realized gain (loss) | | 4,379,218 |
Change in net unrealized appreciation (depreciation) on underlying funds | | 3,226,637 |
Net gain (loss) | | 7,605,855 |
Net increase (decrease) in net assets resulting from operations | | $ 9,964,162 |
See accompanying notes which are an integral part of the financial statements.
Semiannual Report
Fidelity Freedom K® 2005 Fund
Financial Statements - continued
Statement of Changes in Net Assets
| Six months ended
September 30, 2013
(Unaudited) | Year ended
March 31,
2013 |
Increase (Decrease) in Net Assets | | |
Operations | | |
Net investment income (loss) | $ 2,358,307 | $ 6,602,294 |
Net realized gain (loss) | 4,379,218 | 11,911,149 |
Change in net unrealized appreciation (depreciation) | 3,226,637 | 9,551,556 |
Net increase (decrease) in net assets resulting from operations | 9,964,162 | 28,064,999 |
Distributions to shareholders from net investment income | (1,003,197) | (6,563,931) |
Distributions to shareholders from net realized gain | (7,138,132) | (7,399,766) |
Total distributions | (8,141,329) | (13,963,697) |
Share transactions
Proceeds from sales of shares | 102,627,883 | 255,064,764 |
Reinvestment of distributions | 8,141,329 | 13,963,697 |
Cost of shares redeemed | (112,442,558) | (175,074,534) |
Net increase (decrease) in net assets resulting from share transactions | (1,673,346) | 93,953,927 |
Total increase (decrease) in net assets | 149,487 | 108,055,229 |
| | |
Net Assets | | |
Beginning of period | 496,063,896 | 388,008,667 |
End of period (including undistributed net investment income of $2,353,189 and undistributed net investment income of $998,079, respectively) | $ 496,213,383 | $ 496,063,896 |
Other Information Shares | | |
Sold | 7,947,333 | 20,164,317 |
Issued in reinvestment of distributions | 629,160 | 1,114,064 |
Redeemed | (8,733,698) | (13,795,032) |
Net increase (decrease) | (157,205) | 7,483,349 |
Financial Highlights
| Six months ended September 30, 2013 | Years ended March 31, |
| (Unaudited) | 2013 | 2012 | 2011 | 2010 E |
Selected Per-Share Data | | | | | |
Net asset value, beginning of period | $ 13.00 | $ 12.65 | $ 12.82 | $ 11.85 | $ 10.00 |
Income from Investment Operations | | | | | |
Net investment income (loss) C | .06 | .19 | .21 | .21 | .18 |
Net realized and unrealized gain (loss) | .21 | .56 | .13 | 1.05 | 1.76 |
Total from investment operations | .27 | .75 | .34 | 1.26 | 1.94 |
Distributions from net investment income | (.03) | (.18) | (.18) | (.17) | (.05) |
Distributions from net realized gain | (.19) | (.21) | (.33) | (.12) | (.04) |
Total distributions | (.21) H | (.40) G | (.51) | (.29) | (.09) |
Net asset value, end of period | $ 13.06 | $ 13.00 | $ 12.65 | $ 12.82 | $ 11.85 |
Total Return B | 2.10% | 6.03% | 2.83% | 10.75% | 19.42% |
Ratios to Average Net Assets D, F | | | | | |
Expenses before reductions | .05% A | .05% | .05% | .05% | .06% A |
Expenses net of fee waivers, if any | .05% A | .05% | .05% | .05% | .06% A |
Expenses net of all reductions | .05% A | .05% | .05% | .05% | .06% A |
Net investment income (loss) | .95% A | 1.46% | 1.66% | 1.73% | 2.11% A |
Supplemental Data | | | | | |
Net assets, end of period (000 omitted) | $ 496,213 | $ 496,064 | $ 388,009 | $ 257,817 | $ 65,083 |
Portfolio turnover rate D | 27% A | 29% | 37% | 47% | 40% A |
A Annualized
B Total returns for periods of less than one year are not annualized.
C Calculated based on average shares outstanding during the period.
D Amounts do not include the activity of the Underlying Funds.
E For the period July 2, 2009 (commencement of operations) to March 31, 2010.
F Expense ratios reflect operating expenses of the Fund. Expenses before reductions do not reflect amounts reimbursed by the investment adviser or reductions from expense offset arrangements and do not represent the amount paid by the Fund during periods when reimbursements or reductions occur. Expenses net of fee waivers reflect expenses after reimbursement by the investment adviser but prior to reductions from expense offset arrangements. Expenses net of all reductions represent the net expenses paid by the Fund but do not include expenses of the investment companies in which the Fund invests.
G Total distributions of $.40 per share is comprised of distributions from net investment income of $.182 and distributions from net realized gain of $.213 per share.
H Total distributions of $.21 per share is comprised of distributions from net investment income of $.026 and distributions from net realized gain of $.185 per share.
See accompanying notes which are an integral part of the financial statements.
Semiannual Report
Fidelity Freedom K® 2010 Fund
Investment Changes (Unaudited)
The information in the following tables is based on the direct investments of the Fund. |
Fund Holdings as of September 30, 2013 |
| % of fund's
net assets | % of fund's net assets
6 months ago |
Commodity Funds | | |
Fidelity Series Commodity Strategy Fund Class F | 5.0 | 5.0 |
Domestic Equity Funds | | |
Fidelity Blue Chip Growth Fund Class F | 3.5 | 3.2 |
Fidelity Disciplined Equity Fund Class F | 0.0 | 0.7 |
Fidelity Growth Company Fund Class F | 4.3 | 4.3 |
Fidelity Series 100 Index Fund | 1.0 | 1.1 |
Fidelity Series All-Sector Equity Fund Class F | 4.5 | 4.7 |
Fidelity Series Equity-Income Fund Class F | 3.0 | 3.0 |
Fidelity Series Growth & Income Fund Class F (formerly Fidelity Series Mega Cap Fund Class F) | 1.2 | 1.1 |
Fidelity Series Intrinsic Opportunities Fund Class F | 2.3 | 1.7 |
Fidelity Series Large Cap Value Fund Class F | 2.4 | 2.8 |
Fidelity Series Opportunistic Insights Fund Class F | 2.4 | 2.2 |
Fidelity Series Real Estate Equity Fund Class F | 0.5 | 0.4 |
Fidelity Series Small Cap Opportunities Fund Class F | 1.2 | 1.2 |
Fidelity Series Stock Selector Large Cap Value Fund Class F | 2.7 | 3.0 |
Fidelity Small Cap Growth Fund Class F | 0.7 | 0.6 |
Fidelity Small Cap Value Fund Class F | 0.6 | 0.7 |
| 30.3 | 30.7 |
Developed International Equity Funds | | |
Fidelity Series International Growth Fund Class F | 4.7 | 4.6 |
Fidelity Series International Small Cap Fund Class F | 1.0 | 1.0 |
Fidelity Series International Value Fund Class F | 4.7 | 4.6 |
| 10.4 | 10.2 |
Emerging Markets Equity Funds | | |
Fidelity Series Emerging Markets Fund Class F | 2.8 | 2.8 |
High Yield Bond Funds | | |
Fidelity Series Emerging Markets Debt Fund Class F | 0.7 | 0.7 |
Fidelity Series Floating Rate High Income Fund Class F | 1.1 | 1.1 |
Fidelity Series High Income Fund Class F | 4.7 | 4.8 |
Fidelity Series Real Estate Income Fund Class F | 0.5 | 0.5 |
| 7.0 | 7.1 |
Inflation-Protected Bond Funds | | |
Fidelity Series Inflation-Protected Bond Index Fund Class F | 9.6 | 10.1 |
Investment Grade Bond Funds | | |
Fidelity Series Investment Grade Bond Fund Class F | 21.4 | 21.5 |
Short-Term Funds | | |
Fidelity Institutional Money Market Portfolio Class F | 7.4 | 6.9 |
Fidelity Short-Term Bond Fund Class F | 6.1 | 5.7 |
| 13.5 | 12.6 |
Net Other Assets (Liabilities)* | 0.0 | 0.0 |
| 100.0 | 100.0 |
* Amount represents less than 0.1% |
Asset Allocation (% of fund's net assets) |
Period end |
| Commodity Funds | 5.0% | |
| Domestic Equity Funds | 30.3% | |
| Developed International Equity Funds | 10.4% | |
| Emerging Markets Equity Funds | 2.8% | |
| High Yield Bond Funds | 7.0% | |
| Inflation-Protected Bond Funds | 9.6% | |
| Investment Grade Bond Funds | 21.4% | |
| Short-Term Funds | 13.5% | |

Six months ago |
| Commodity Funds | 5.0% | |
| Domestic Equity Funds | 30.7% | |
| Developed International Equity Funds | 10.2% | |
| Emerging Markets Equity Funds | 2.8% | |
| High Yield Bond Funds | 7.1% | |
| Inflation-Protected Bond Funds | 10.1% | |
| Investment Grade Bond Funds | 21.5% | |
| Short-Term Funds | 12.6% | |

Semiannual Report
Fidelity Freedom K® 2010 Fund
Investments September 30, 2013 (Unaudited)
Showing Percentage of Net Assets
Domestic Equity Funds - 35.3% |
| Shares | | Value |
Commodity Funds - 5.0% |
Fidelity Series Commodity Strategy Fund Class F (a)(c) | 28,567,411 | | $ 229,967,656 |
Domestic Equity Funds - 30.3% |
Fidelity Blue Chip Growth Fund Class F (c) | 2,740,087 | | 160,377,320 |
Fidelity Growth Company Fund Class F (c) | 1,657,469 | | 196,857,627 |
Fidelity Series 100 Index Fund (c) | 4,137,280 | | 45,841,061 |
Fidelity Series All-Sector Equity Fund Class F (c) | 14,736,715 | | 208,819,246 |
Fidelity Series Equity-Income Fund Class F (c) | 11,921,988 | | 140,560,238 |
Fidelity Series Growth & Income Fund Class F (c) | 4,539,234 | | 54,788,559 |
Fidelity Series Intrinsic Opportunities Fund Class F (c) | 8,163,721 | | 106,046,732 |
Fidelity Series Large Cap Value Fund Class F (c) | 8,592,334 | | 108,521,178 |
Fidelity Series Opportunistic Insights Fund Class F (c) | 8,672,861 | | 111,793,178 |
Fidelity Series Real Estate Equity Fund Class F (c) | 1,781,161 | | 21,302,684 |
Fidelity Series Small Cap Opportunities Fund Class F (c) | 4,382,605 | | 56,535,601 |
Fidelity Series Stock Selector Large Cap Value Fund Class F (c) | 10,123,199 | | 123,401,793 |
Fidelity Small Cap Growth Fund Class F (c) | 1,618,431 | | 30,539,789 |
Fidelity Small Cap Value Fund Class F (c) | 1,564,082 | | 29,764,479 |
TOTAL DOMESTIC EQUITY FUNDS | | 1,395,149,485 |
TOTAL DOMESTIC EQUITY FUNDS (Cost $1,359,708,595) |
1,625,117,141
|
International Equity Funds - 13.2% |
| | | |
Developed International Equity Funds - 10.4% |
Fidelity Series International Growth Fund Class F (c) | 15,941,890 | | 216,969,123 |
Fidelity Series International Small Cap Fund Class F (c) | 2,927,205 | | 44,874,056 |
Fidelity Series International Value Fund Class F (c) | 20,268,564 | | 218,495,116 |
TOTAL DEVELOPED INTERNATIONAL EQUITY FUNDS | | 480,338,295 |
|
| Shares | | Value |
Emerging Markets Equity Funds - 2.8% |
Fidelity Series Emerging Markets Fund Class F (c) | 7,597,353 | | $ 127,559,552 |
TOTAL INTERNATIONAL EQUITY FUNDS (Cost $501,685,700) |
607,897,847
|
Bond Funds - 38.0% |
| | | |
High Yield Bond Funds - 7.0% |
Fidelity Series Emerging Markets Debt Fund Class F (c) | 2,869,253 | | 29,036,845 |
Fidelity Series Floating Rate High Income Fund Class F (c) | 4,898,671 | | 51,827,938 |
Fidelity Series High Income Fund Class F (c) | 21,123,454 | | 217,149,106 |
Fidelity Series Real Estate Income Fund Class F (c) | 2,033,628 | | 22,329,231 |
TOTAL HIGH YIELD BOND FUNDS | | 320,343,120 |
Inflation-Protected Bond Funds - 9.6% |
Fidelity Series Inflation-Protected Bond Index Fund Class F (c) | 40,878,870 | | 443,944,532 |
Investment Grade Bond Funds - 21.4% |
Fidelity Series Investment Grade Bond Fund Class F (c) | 87,840,116 | | 983,809,303 |
TOTAL BOND FUNDS (Cost $1,767,828,039) |
1,748,096,955
|
Short-Term Funds - 13.5% |
| | | |
Fidelity Institutional Money Market Portfolio Class F 0.07% (b)(c) | 342,113,824 | | 342,113,824 |
Fidelity Short-Term Bond Fund Class F (c) | 32,670,183 | | 279,983,467 |
TOTAL SHORT-TERM FUNDS (Cost $619,367,780) |
622,097,291
|
TOTAL INVESTMENT PORTFOLIO - 100.0% (Cost $4,248,590,114) | | 4,603,209,234 |
NET OTHER ASSETS (LIABILITIES) - 0.0% | | (191,199) |
NET ASSETS - 100% | $ 4,603,018,035 |
Legend |
(a) Non-income producing |
(b) The rate quoted is the annualized seven-day yield of the fund at period end. |
(c) Affiliated company |
Affiliated Underlying Funds |
Information regarding the Fund's fiscal year to date purchases and sales of the affiliated Underlying Funds and income earned by the Fund from investments in affiliated Underlying Funds is as follows: |
Affiliate | Value,
beginning of
period | Purchases | Sales
Proceeds | Dividend
Income | Value,
end of
period |
Fidelity Blue Chip Growth Fund Class F | $ 149,802,430 | $ 12,794,315 | $ 15,982,142 | $ 544,698 | $ 160,377,320 |
Fidelity Disciplined Equity Fund Class F | 32,891,866 | 195,514 | 34,690,362 | - | - |
Fidelity Growth Company Fund Class F | 201,628,203 | 4,702,347 | 41,382,360 | - | 196,857,627 |
Fidelity Institutional Money Market Portfolio Class F | 324,006,396 | 42,537,626 | 24,430,199 | 192,558 | 342,113,824 |
Fidelity Series 100 Index Fund | 50,679,176 | 1,167,735 | 9,577,519 | - | 45,841,061 |
Fidelity Series All-Sector Equity Fund Class F | 220,409,431 | 5,069,373 | 37,938,450 | - | 208,819,246 |
Fidelity Series Commodity Strategy Fund Class F | 236,385,079 | 28,093,345 | 15,795,321 | - | 229,967,656 |
Fidelity Series Emerging Markets Debt Fund Class F | 31,266,438 | 1,718,076 | 1,760,377 | 810,255 | 29,036,845 |
Fidelity Series Emerging Markets Fund Class F | 131,441,689 | 4,459,362 | 8,371,810 | - | 127,559,552 |
Fidelity Series Equity-Income Fund Class F | 140,951,352 | 5,670,552 | 14,578,216 | 1,551,083 | 140,560,238 |
Fidelity Series Floating Rate High Income Fund Class F | 54,243,040 | 2,489,422 | 4,651,965 | 1,185,245 | 51,827,938 |
Fidelity Series Growth & Income Fund Class F (formerly Fidelity Series Mega Cap Fund Class F) | 51,492,653 | 2,944,322 | 4,456,491 | - | 54,788,559 |
Fidelity Series High Income Fund Class F | 225,844,840 | 12,297,707 | 16,044,270 | 5,924,019 | 217,149,106 |
Fidelity Series Inflation-Protected Bond Index Fund Class F | 474,228,237 | 23,933,944 | 31,988,903 | - | 443,944,532 |
Fidelity Series International Growth Fund Class F | 217,671,150 | 5,285,839 | 21,130,064 | - | 216,969,123 |
Fidelity Series International Small Cap Fund Class F | 44,352,190 | 1,141,463 | 5,359,320 | - | 44,874,056 |
Fidelity Series International Value Fund Class F | 215,820,670 | 5,606,118 | 22,474,576 | - | 218,495,116 |
Fidelity Series Intrinsic Opportunities Fund Class F | 80,252,568 | 18,133,871 | 5,240,273 | 710,335 | 106,046,732 |
Fidelity Series Investment Grade Bond Fund Class F | 1,011,302,155 | 73,931,101 | 70,918,233 | 10,874,875 | 983,809,303 |
Fidelity Series Large Cap Value Fund Class F | 131,757,219 | 2,789,004 | 36,479,365 | - | 108,521,178 |
Fidelity Series Opportunistic Insights Fund Class F | 102,960,623 | 2,518,498 | 10,500,364 | - | 111,793,178 |
Fidelity Series Real Estate Equity Fund Class F | 18,790,991 | 5,869,822 | 1,585,650 | 159,691 | 21,302,684 |
Fidelity Series Real Estate Income Fund Class F | 24,335,736 | 1,622,526 | 2,253,407 | 702,864 | 22,329,231 |
Fidelity Series Small Cap Opportunities Fund Class F | 57,101,662 | 5,508,548 | 8,611,797 | - | 56,535,601 |
Fidelity Series Stock Selector Large Cap Value Fund Class F | 141,814,376 | 3,218,228 | 33,709,779 | - | 123,401,793 |
Fidelity Short-Term Bond Fund Class F | 266,142,105 | 34,785,327 | 19,952,034 | 1,191,602 | 279,983,467 |
Fidelity Small Cap Growth Fund Class F | 30,161,753 | 4,011,016 | 4,820,081 | - | 30,539,789 |
Fidelity Small Cap Value Fund Class F | 32,244,593 | 2,684,159 | 5,511,305 | 82,251 | 29,764,479 |
Total | $ 4,699,978,621 | $ 315,179,160 | $ 510,194,633 | $ 23,929,476 | $ 4,603,209,234 |
Other Information |
All investments are categorized as Level 1 under the Fair Value Hierarchy. The inputs or methodology used for valuing securities may not be an indication of the risk associated with investing in those securities. For more information on valuation inputs, please refer to the Investment Valuation section in the accompanying Notes to Financial Statements. |
See accompanying notes which are an integral part of the financial statements.
Semiannual Report
Fidelity Freedom K® 2010 Fund
Statement of Assets and Liabilities
| September 30, 2013 (Unaudited) |
| | |
Assets | | |
Investment in securities, at value (cost $4,248,590,114) - See accompanying schedule | | $ 4,603,209,234 |
Cash | | 3 |
Receivable for investments sold | | 8,432,082 |
Receivable for fund shares sold | | 5,185,902 |
Total assets | | 4,616,827,221 |
| | |
Liabilities | | |
Payable for fund shares redeemed | $ 13,617,977 | |
Transfer agent fees payable | 191,209 | |
Total liabilities | | 13,809,186 |
| | |
Net Assets | | $ 4,603,018,035 |
Net Assets consist of: | | |
Paid in capital | | $ 4,177,462,513 |
Undistributed net investment income | | 22,521,418 |
Accumulated undistributed net realized gain (loss) on investments | | 48,414,984 |
Net unrealized appreciation (depreciation) on investments | | 354,619,120 |
Net Assets, for 340,406,794 shares outstanding | | $ 4,603,018,035 |
Net Asset Value, offering price and redemption price per share ($4,603,018,035 ÷ 340,406,794 shares) | | $ 13.52 |
Statement of Operations
Six months ended September 30, 2013 (Unaudited) |
| | |
Investment Income | | |
Income distributions from underlying funds | | $ 23,929,476 |
| | |
Expenses | | |
Transfer agent fees | $ 1,147,007 | |
Independent trustees' compensation | 8,715 | |
Total expenses | | 1,155,722 |
Net investment income (loss) | | 22,773,754 |
Realized and Unrealized Gain (Loss) Realized gain (loss) on sale of underlying fund shares | 37,809,613 | |
Capital gain distributions from underlying funds | 19,879,916 | |
Total net realized gain (loss) | | 57,689,529 |
Change in net unrealized appreciation (depreciation) on underlying funds | | 60,436,474 |
Net gain (loss) | | 118,126,003 |
Net increase (decrease) in net assets resulting from operations | | $ 140,899,757 |
See accompanying notes which are an integral part of the financial statements.
Semiannual Report
Fidelity Freedom K® 2010 Fund
Financial Statements - continued
Statement of Changes in Net Assets
| Six months ended
September 30, 2013
(Unaudited) | Year ended
March 31,
2013 |
Increase (Decrease) in Net Assets | | |
Operations | | |
Net investment income (loss) | $ 22,773,754 | $ 72,614,538 |
Net realized gain (loss) | 57,689,529 | 137,261,232 |
Change in net unrealized appreciation (depreciation) | 60,436,474 | 117,239,921 |
Net increase (decrease) in net assets resulting from operations | 140,899,757 | 327,115,691 |
Distributions to shareholders from net investment income | (9,806,287) | (73,332,890) |
Distributions to shareholders from net realized gain | (87,556,064) | (90,164,143) |
Total distributions | (97,362,351) | (163,497,033) |
Share transactions
Proceeds from sales of shares | 546,667,338 | 1,635,790,352 |
Reinvestment of distributions | 97,362,351 | 163,497,033 |
Cost of shares redeemed | (784,332,764) | (1,393,908,281) |
Net increase (decrease) in net assets resulting from share transactions | (140,303,075) | 405,379,104 |
Total increase (decrease) in net assets | (96,765,669) | 568,997,762 |
| | |
Net Assets | | |
Beginning of period | 4,699,783,704 | 4,130,785,942 |
End of period (including undistributed net investment income of $22,521,418 and undistributed net investment income of $9,553,951, respectively) | $ 4,603,018,035 | $ 4,699,783,704 |
Other Information Shares | | |
Sold | 41,076,723 | 126,668,267 |
Issued in reinvestment of distributions | 7,309,486 | 12,812,082 |
Redeemed | (59,054,614) | (107,862,174) |
Net increase (decrease) | (10,668,405) | 31,618,175 |
Financial Highlights
| Six months ended September 30, 2013 | Years ended March 31, |
| (Unaudited) | 2013 | 2012 | 2011 | 2010 E |
Selected Per-Share Data | | | | | |
Net asset value, beginning of period | $ 13.39 | $ 12.93 | $ 13.12 | $ 11.97 | $ 10.00 |
Income from Investment Operations | | | | | |
Net investment income (loss) C | .07 | .21 | .23 | .23 | .17 |
Net realized and unrealized gain (loss) | .34 | .74 | .14 | 1.21 | 1.89 |
Total from investment operations | .41 | .95 | .37 | 1.44 | 2.06 |
Distributions from net investment income | (.03) | (.22) | (.20) | (.17) | (.05) |
Distributions from net realized gain | (.25) | (.27) | (.36) | (.12) | (.04) |
Total distributions | (.28) | (.49) | (.56) | (.29) | (.09) |
Net asset value, end of period | $ 13.52 | $ 13.39 | $ 12.93 | $ 13.12 | $ 11.97 |
Total Return B | 3.08% | 7.53% | 3.08% | 12.17% | 20.62% |
Ratios to Average Net Assets D, F | | | | | |
Expenses before reductions | .05% A | .05% | .05% | .05% | .05% A |
Expenses net of fee waivers, if any | .05% A | .05% | .05% | .05% | .05% A |
Expenses net of all reductions | .05% A | .05% | .05% | .05% | .05% A |
Net investment income (loss) | .98% A | 1.65% | 1.85% | 1.82% | 2.04% A |
Supplemental Data | | | | | |
Net assets, end of period (000 omitted) | $ 4,603,018 | $ 4,699,784 | $ 4,130,786 | $ 2,665,237 | $ 675,704 |
Portfolio turnover rate D | 14% A | 30% | 28% | 42% | 29% A |
A Annualized
B Total returns for periods of less than one year are not annualized.
C Calculated based on average shares outstanding during the period.
D Amounts do not include the activity of the Underlying Funds.
E For the period July 2, 2009 (commencement of operations) to March 31, 2010.
F Expense ratios reflect operating expenses of the Fund. Expenses before reductions do not reflect amounts reimbursed by the investment adviser or reductions from expense offset arrangements and do not represent the amount paid by the Fund during periods when reimbursements or reductions occur. Expenses net of fee waivers reflect expenses after reimbursement by the investment adviser but prior to reductions from expense offset arrangements. Expenses net of all reductions represent the net expenses paid by the Fund but do not include expenses of the investment companies in which the Fund invests.
See accompanying notes which are an integral part of the financial statements.
Semiannual Report
Fidelity Freedom K® 2015 Fund
Investment Changes (Unaudited)
The information in the following tables is based on the direct investments of the Fund. |
Fund Holdings as of September 30, 2013 |
| % of fund's
net assets | % of fund's net assets
6 months ago |
Commodity Funds | | |
Fidelity Series Commodity Strategy Fund Class F | 5.3 | 5.3 |
Domestic Equity Funds | | |
Fidelity Blue Chip Growth Fund Class F | 3.6 | 3.3 |
Fidelity Disciplined Equity Fund Class F | 0.0 | 0.7 |
Fidelity Growth Company Fund Class F | 4.5 | 4.5 |
Fidelity Series 100 Index Fund | 1.0 | 1.2 |
Fidelity Series All-Sector Equity Fund Class F | 4.8 | 4.9 |
Fidelity Series Equity-Income Fund Class F | 3.2 | 3.1 |
Fidelity Series Growth & Income Fund Class F (formerly Fidelity Series Mega Cap Fund Class F) | 1.3 | 1.1 |
Fidelity Series Intrinsic Opportunities Fund Class F | 2.4 | 1.8 |
Fidelity Series Large Cap Value Fund Class F | 2.5 | 2.9 |
Fidelity Series Opportunistic Insights Fund Class F | 2.5 | 2.3 |
Fidelity Series Real Estate Equity Fund Class F | 0.5 | 0.4 |
Fidelity Series Small Cap Opportunities Fund Class F | 1.3 | 1.3 |
Fidelity Series Stock Selector Large Cap Value Fund Class F | 2.8 | 3.1 |
Fidelity Small Cap Growth Fund Class F | 0.7 | 0.7 |
Fidelity Small Cap Value Fund Class F | 0.7 | 0.7 |
| 31.8 | 32.0 |
Developed International Equity Funds | | |
Fidelity Series International Growth Fund Class F | 5.0 | 4.8 |
Fidelity Series International Small Cap Fund Class F | 1.0 | 1.0 |
Fidelity Series International Value Fund Class F | 5.0 | 4.8 |
| 11.0 | 10.6 |
Emerging Markets Equity Funds | | |
Fidelity Series Emerging Markets Fund Class F | 2.9 | 2.9 |
High Yield Bond Funds | | |
Fidelity Series Emerging Markets Debt Fund Class F | 0.6 | 0.6 |
Fidelity Series Floating Rate High Income Fund Class F | 1.1 | 1.1 |
Fidelity Series High Income Fund Class F | 4.7 | 4.7 |
Fidelity Series Real Estate Income Fund Class F | 0.5 | 0.6 |
| 6.9 | 7.0 |
Inflation-Protected Bond Funds | | |
Fidelity Series Inflation-Protected Bond Index Fund Class F | 9.8 | 9.9 |
Investment Grade Bond Funds | | |
Fidelity Series Investment Grade Bond Fund Class F | 22.5 | 22.6 |
Short-Term Funds | | |
Fidelity Institutional Money Market Portfolio Class F | 5.4 | 5.3 |
Fidelity Short-Term Bond Fund Class F | 4.4 | 4.4 |
| 9.8 | 9.7 |
Net Other Assets (Liabilities)* | 0.0 | 0.0 |
| 100.0 | 100.0 |
* Amount represents less than 0.1% |
Asset Allocation (% of fund's net assets) |
Period end |
| Commodity Funds | 5.3% | |
| Domestic Equity Funds | 31.8% | |
| Developed International Equity Funds | 11.0% | |
| Emerging Markets Equity Funds | 2.9% | |
| High Yield Bond Funds | 6.9% | |
| Inflation-Protected Bond Funds | 9.8% | |
| Investment Grade Bond Funds | 22.5% | |
| Short-Term Funds | 9.8% | |

Six months ago |
| Commodity Funds | 5.3% | |
| Domestic Equity Funds | 32.0% | |
| Developed International Equity Funds | 10.6% | |
| Emerging Markets Equity Funds | 2.9% | |
| High Yield Bond Funds | 7.0% | |
| Inflation-Protected Bond Funds | 9.9% | |
| Investment Grade Bond Funds | 22.6% | |
| Short-Term Funds | 9.7% | |

Semiannual Report
Fidelity Freedom K® 2015 Fund
Investments September 30, 2013 (Unaudited)
Showing Percentage of Net Assets
Domestic Equity Funds - 37.1% |
| Shares | | Value |
Commodity Funds - 5.3% |
Fidelity Series Commodity Strategy Fund Class F (a)(c) | 48,384,895 | | $ 389,498,405 |
Domestic Equity Funds - 31.8% |
Fidelity Blue Chip Growth Fund Class F (c) | 4,594,344 | | 268,906,953 |
Fidelity Growth Company Fund Class F (c) | 2,791,651 | | 331,564,403 |
Fidelity Series 100 Index Fund (c) | 6,934,616 | | 76,835,545 |
Fidelity Series All-Sector Equity Fund Class F (c) | 24,748,408 | | 350,684,941 |
Fidelity Series Equity-Income Fund Class F (c) | 19,979,451 | | 235,557,729 |
Fidelity Series Growth & Income Fund Class F (c) | 7,634,779 | | 92,151,778 |
Fidelity Series Intrinsic Opportunities Fund Class F (c) | 13,751,483 | | 178,631,768 |
Fidelity Series Large Cap Value Fund Class F (c) | 14,356,547 | | 181,323,190 |
Fidelity Series Opportunistic Insights Fund Class F (c) | 14,408,646 | | 185,727,451 |
Fidelity Series Real Estate Equity Fund Class F (c) | 2,993,945 | | 35,807,577 |
Fidelity Series Small Cap Opportunities Fund Class F (c) | 7,317,559 | | 94,396,516 |
Fidelity Series Stock Selector Large Cap Value Fund Class F (c) | 17,092,875 | | 208,362,144 |
Fidelity Small Cap Growth Fund Class F (c) | 2,717,497 | | 51,279,177 |
Fidelity Small Cap Value Fund Class F (c) | 2,622,810 | | 49,912,073 |
TOTAL DOMESTIC EQUITY FUNDS | | 2,341,141,245 |
TOTAL DOMESTIC EQUITY FUNDS (Cost $2,309,325,346) |
2,730,639,650
|
International Equity Funds - 13.9% |
| | | |
Developed International Equity Funds - 11.0% |
Fidelity Series International Growth Fund Class F (c) | 26,915,780 | | 366,323,763 |
Fidelity Series International Small Cap Fund Class F (c) | 4,929,030 | | 75,562,027 |
Fidelity Series International Value Fund Class F (c) | 34,025,967 | | 366,799,926 |
TOTAL DEVELOPED INTERNATIONAL EQUITY FUNDS | | 808,685,716 |
|
| Shares | | Value |
Emerging Markets Equity Funds - 2.9% |
Fidelity Series Emerging Markets Fund Class F (c) | 12,748,095 | | $ 214,040,517 |
TOTAL INTERNATIONAL EQUITY FUNDS (Cost $852,282,992) |
1,022,726,233
|
Bond Funds - 39.2% |
| | | |
High Yield Bond Funds - 6.9% |
Fidelity Series Emerging Markets Debt Fund Class F (c) | 4,261,386 | | 43,125,227 |
Fidelity Series Floating Rate High Income Fund Class F (c) | 7,849,379 | | 83,046,429 |
Fidelity Series High Income Fund Class F (c) | 33,364,326 | | 342,985,267 |
Fidelity Series Real Estate Income Fund Class F (c) | 3,612,479 | | 39,665,018 |
TOTAL HIGH YIELD BOND FUNDS | | 508,821,941 |
Inflation-Protected Bond Funds - 9.8% |
Fidelity Series Inflation-Protected Bond Index Fund Class F (c) | 66,401,403 | | 721,119,234 |
Investment Grade Bond Funds - 22.5% |
Fidelity Series Investment Grade Bond Fund Class F (c) | 148,390,284 | | 1,661,971,186 |
TOTAL BOND FUNDS (Cost $2,941,396,630) |
2,891,912,361
|
Short-Term Funds - 9.8% |
| | | |
Fidelity Institutional Money Market Portfolio Class F 0.07% (b)(c) | 396,420,544 | | 396,420,544 |
Fidelity Short-Term Bond Fund Class F (c) | 37,943,304 | | 325,174,115 |
TOTAL SHORT-TERM FUNDS (Cost $718,542,493) |
721,594,659
|
TOTAL INVESTMENT PORTFOLIO - 100.0% (Cost $6,821,547,461) | | 7,366,872,903 |
NET OTHER ASSETS (LIABILITIES) - 0.0% | | (305,081) |
NET ASSETS - 100% | $ 7,366,567,822 |
Legend |
(a) Non-income producing |
(b) The rate quoted is the annualized seven-day yield of the fund at period end. |
(c) Affiliated company |
Affiliated Underlying Funds |
Information regarding the Fund's fiscal year to date purchases and sales of the affiliated Underlying Funds and income earned by the Fund from investments in affiliated Underlying Funds is as follows: |
Affiliate | Value,
beginning of
period | Purchases | Sales
Proceeds | Dividend
Income | Value,
end of
period |
Fidelity Blue Chip Growth Fund Class F | $ 237,838,735 | $ 24,999,956 | $ 16,115,751 | $ 910,391 | $ 268,906,953 |
Fidelity Disciplined Equity Fund Class F | 52,358,996 | 400,751 | 55,322,111 | - | - |
Fidelity Growth Company Fund Class F | 322,600,509 | 12,807,348 | 55,892,544 | - | 331,564,403 |
Fidelity Institutional Money Market Portfolio Class F | 381,045,557 | 37,407,898 | 22,032,911 | 225,199 | 396,420,544 |
Fidelity Series 100 Index Fund | 81,337,216 | 3,174,267 | 13,472,519 | - | 76,835,545 |
Fidelity Series All-Sector Equity Fund Class F | 351,010,140 | 13,573,852 | 48,572,900 | - | 350,684,941 |
Fidelity Series Commodity Strategy Fund Class F | 380,986,843 | 58,273,358 | 19,269,926 | - | 389,498,405 |
Fidelity Series Emerging Markets Debt Fund Class F | 44,393,155 | 3,290,202 | 1,381,386 | 1,176,693 | 43,125,227 |
Fidelity Series Emerging Markets Fund Class F | 207,804,129 | 12,309,747 | 6,394,850 | - | 214,040,517 |
Fidelity Series Equity-Income Fund Class F | 218,217,212 | 16,746,895 | 12,825,918 | 2,447,658 | 235,557,729 |
Fidelity Series Floating Rate High Income Fund Class F | 80,285,954 | 5,637,551 | 2,483,908 | 1,829,836 | 83,046,429 |
Fidelity Series Growth & Income Fund Class F (formerly Fidelity Series Mega Cap Fund Class F) | 79,795,267 | 8,106,880 | 3,384,979 | - | 92,151,778 |
Fidelity Series High Income Fund Class F | 337,458,576 | 27,922,593 | 14,767,203 | 9,110,358 | 342,985,267 |
Fidelity Series Inflation-Protected Bond Index Fund Class F | 707,349,178 | 80,688,812 | 32,610,840 | - | 721,119,234 |
Fidelity Series International Growth Fund Class F | 343,583,858 | 15,017,682 | 17,411,029 | - | 366,323,763 |
Fidelity Series International Small Cap Fund Class F | 70,175,563 | 3,103,174 | 5,512,233 | - | 75,562,027 |
Fidelity Series International Value Fund Class F | 341,221,853 | 15,319,847 | 21,658,656 | - | 366,799,926 |
Fidelity Series Intrinsic Opportunities Fund Class F | 129,280,499 | 34,235,630 | 6,224,594 | 1,192,656 | 178,631,768 |
Fidelity Series Investment Grade Bond Fund Class F | 1,608,848,595 | 166,379,009 | 63,927,921 | 17,844,392 | 1,661,971,186 |
Fidelity Series Large Cap Value Fund Class F | 209,293,319 | 7,049,727 | 51,939,864 | - | 181,323,190 |
Fidelity Series Opportunistic Insights Fund Class F | 159,564,808 | 7,640,200 | 8,697,486 | - | 185,727,451 |
Fidelity Series Real Estate Equity Fund Class F | 29,832,276 | 10,143,249 | 1,153,143 | 265,267 | 35,807,577 |
Fidelity Series Real Estate Income Fund Class F | 39,787,328 | 3,674,704 | 1,406,679 | 1,214,399 | 39,665,018 |
Fidelity Series Small Cap Opportunities Fund Class F | 90,905,560 | 10,626,652 | 11,200,368 | - | 94,396,516 |
Fidelity Series Stock Selector Large Cap Value Fund Class F | 219,647,351 | 8,659,605 | 38,884,909 | - | 208,362,144 |
Fidelity Short-Term Bond Fund Class F | 313,710,106 | 30,276,722 | 17,636,077 | 1,394,292 | 325,174,115 |
Fidelity Small Cap Growth Fund Class F | 48,597,274 | 7,421,862 | 6,637,373 | - | 51,279,177 |
Fidelity Small Cap Value Fund Class F | 52,008,882 | 5,187,745 | 7,795,739 | 137,471 | 49,912,073 |
Total | $ 7,138,938,739 | $ 630,075,918 | $ 564,613,817 | $ 37,748,612 | $ 7,366,872,903 |
Other Information |
All investments are categorized as Level 1 under the Fair Value Hierarchy. The inputs or methodology used for valuing securities may not be an indication of the risk associated with investing in those securities. For more information on valuation inputs, please refer to the Investment Valuation section in the accompanying Notes to Financial Statements. |
See accompanying notes which are an integral part of the financial statements.
Semiannual Report
Fidelity Freedom K® 2015 Fund
Statement of Assets and Liabilities
| September 30, 2013 (Unaudited) |
| | |
Assets | | |
Investment in securities, at value (cost $6,821,547,461) - See accompanying schedule | | $ 7,366,872,903 |
Receivable for investments sold | | 17,937,694 |
Receivable for fund shares sold | | 10,030,225 |
Total assets | | 7,394,840,822 |
| | |
Liabilities | | |
Payable for fund shares redeemed | $ 27,967,908 | |
Transfer agent fees payable | 305,092 | |
Total liabilities | | 28,273,000 |
| | |
Net Assets | | $ 7,366,567,822 |
Net Assets consist of: | | |
Paid in capital | | $ 6,728,684,010 |
Undistributed net investment income | | 35,643,015 |
Accumulated undistributed net realized gain (loss) on investments | | 56,915,355 |
Net unrealized appreciation (depreciation) on investments | | 545,325,442 |
Net Assets, for 539,202,364 shares outstanding | | $ 7,366,567,822 |
Net Asset Value, offering price and redemption price per share ($7,366,567,822 ÷ 539,202,364 shares) | | $ 13.66 |
Statement of Operations
Six months ended September 30, 2013 (Unaudited) |
| | |
Investment Income | | |
Income distributions from underlying funds | | $ 37,748,612 |
| | |
Expenses | | |
Transfer agent fees | $ 1,790,818 | |
Independent trustees' compensation | 13,475 | |
Total expenses | | 1,804,293 |
Net investment income (loss) | | 35,944,319 |
Realized and Unrealized Gain (Loss) Realized gain (loss) on sale of underlying fund shares | 37,739,017 | |
Capital gain distributions from underlying funds | 33,232,088 | |
Total net realized gain (loss) | | 70,971,105 |
Change in net unrealized appreciation (depreciation) on underlying funds | | 124,733,046 |
Net gain (loss) | | 195,704,151 |
Net increase (decrease) in net assets resulting from operations | | $ 231,648,470 |
See accompanying notes which are an integral part of the financial statements.
Semiannual Report
Fidelity Freedom K® 2015 Fund
Financial Statements - continued
Statement of Changes in Net Assets
| Six months ended
September 30, 2013
(Unaudited) | Year ended
March 31,
2013 |
Increase (Decrease) in Net Assets | | |
Operations | | |
Net investment income (loss) | $ 35,944,319 | $ 104,973,156 |
Net realized gain (loss) | 70,971,105 | 193,870,703 |
Change in net unrealized appreciation (depreciation) | 124,733,046 | 191,632,000 |
Net increase (decrease) in net assets resulting from operations | 231,648,470 | 490,475,859 |
Distributions to shareholders from net investment income | (14,431,748) | (104,060,774) |
Distributions to shareholders from net realized gain | (122,402,541) | (121,907,706) |
Total distributions | (136,834,289) | (225,968,480) |
Share transactions
Proceeds from sales of shares | 1,267,899,788 | 2,897,817,791 |
Reinvestment of distributions | 136,834,289 | 225,968,480 |
Cost of shares redeemed | (1,271,625,204) | (1,715,829,396) |
Net increase (decrease) in net assets resulting from share transactions | 133,108,873 | 1,407,956,875 |
Total increase (decrease) in net assets | 227,923,054 | 1,672,464,254 |
| | |
Net Assets | | |
Beginning of period | 7,138,644,768 | 5,466,180,514 |
End of period (including undistributed net investment income of $35,643,015 and undistributed net investment income of $14,130,444, respectively) | $ 7,366,567,822 | $ 7,138,644,768 |
Other Information Shares | | |
Sold | 94,375,051 | 222,954,292 |
Issued in reinvestment of distributions | 10,135,873 | 17,651,115 |
Redeemed | (94,964,331) | (131,962,603) |
Net increase (decrease) | 9,546,593 | 108,642,804 |
Financial Highlights
| Six months ended September 30, 2013 | Years ended March 31, |
| (Unaudited) | 2013 | 2012 | 2011 | 2010 E |
Selected Per-Share Data | | | | | |
Net asset value, beginning of period | $ 13.48 | $ 12.98 | $ 13.17 | $ 12.01 | $ 10.00 |
Income from Investment Operations | | | | | |
Net investment income (loss) C | .07 | .22 | .24 | .23 | .19 |
Net realized and unrealized gain (loss) | .37 | .75 | .13 | 1.24 | 1.95 |
Total from investment operations | .44 | .97 | .37 | 1.47 | 2.14 |
Distributions from net investment income | (.03) | (.21) | (.20) | (.18) | (.07) |
Distributions from net realized gain | (.23) | (.26) | (.36) | (.14) | (.06) |
Total distributions | (.26) | (.47) | (.56) | (.31) G | (.13) |
Net asset value, end of period | $ 13.66 | $ 13.48 | $ 12.98 | $ 13.17 | $ 12.01 |
Total Return B | 3.26% | 7.70% | 3.00% | 12.42% | 21.38% |
Ratios to Average Net Assets D, F | | | | | |
Expenses before reductions | .05% A | .05% | .05% | .05% | .05% A |
Expenses net of fee waivers, if any | .05% A | .05% | .05% | .05% | .05% A |
Expenses net of all reductions | .05% A | .05% | .05% | .05% | .05% A |
Net investment income (loss) | .99% A | 1.68% | 1.86% | 1.83% | 2.26% A |
Supplemental Data | | | | | |
Net assets, end of period (000 omitted) | $ 7,366,568 | $ 7,138,645 | $ 5,466,181 | $ 3,148,854 | $ 870,342 |
Portfolio turnover rate D | 16% A | 21% | 23% | 35% | 23% A |
A Annualized
B Total returns for periods of less than one year are not annualized.
C Calculated based on average shares outstanding during the period.
D Amounts do not include the activity of the Underlying Funds.
E For the period July 2, 2009 (commencement of operations) to March 31, 2010.
F Expense ratios reflect operating expenses of the Fund. Expenses before reductions do not reflect amounts reimbursed by the investment adviser or reductions from expense offset arrangements and do not represent the amount paid by the Fund during periods when reimbursements or reductions occur. Expenses net of fee waivers reflect expenses after reimbursement by the investment adviser but prior to reductions from expense offset arrangements. Expenses net of all reductions represent the net expenses paid by the Fund but do not include expenses of the investment companies in which the Fund invests.
G Total distributions of $.31 per share is comprised of distributions from net investment income of $.176 and distributions from net realized gain of $.137 per share.
See accompanying notes which are an integral part of the financial statements.
Semiannual Report
Fidelity Freedom K® 2020 Fund
Investment Changes (Unaudited)
The information in the following tables is based on the direct investments of the Fund. |
Fund Holdings as of September 30, 2013 |
| % of fund's
net assets | % of fund's net assets
6 months ago |
Commodity Funds | | |
Fidelity Series Commodity Strategy Fund Class F | 5.7 | 5.9 |
Domestic Equity Funds | | |
Fidelity Blue Chip Growth Fund Class F | 3.9 | 3.7 |
Fidelity Disciplined Equity Fund Class F | 0.0 | 0.8 |
Fidelity Growth Company Fund Class F | 4.9 | 4.9 |
Fidelity Series 100 Index Fund | 1.1 | 1.2 |
Fidelity Series All-Sector Equity Fund Class F | 5.2 | 5.4 |
Fidelity Series Equity-Income Fund Class F | 3.5 | 3.4 |
Fidelity Series Growth & Income Fund Class F (formerly Fidelity Series Mega Cap Fund Class F) | 1.3 | 1.2 |
Fidelity Series Intrinsic Opportunities Fund Class F | 2.6 | 1.9 |
Fidelity Series Large Cap Value Fund Class F | 2.7 | 3.2 |
Fidelity Series Opportunistic Insights Fund Class F | 2.7 | 2.5 |
Fidelity Series Real Estate Equity Fund Class F | 0.5 | 0.5 |
Fidelity Series Small Cap Opportunities Fund Class F | 1.4 | 1.4 |
Fidelity Series Stock Selector Large Cap Value Fund Class F | 3.1 | 3.4 |
Fidelity Small Cap Growth Fund Class F | 0.7 | 0.7 |
Fidelity Small Cap Value Fund Class F | 0.7 | 0.8 |
| 34.3 | 35.0 |
Developed International Equity Funds | | |
Fidelity Series International Growth Fund Class F | 5.4 | 5.2 |
Fidelity Series International Small Cap Fund Class F | 1.1 | 1.1 |
Fidelity Series International Value Fund Class F | 5.3 | 5.2 |
| 11.8 | 11.5 |
Emerging Markets Equity Funds | | |
Fidelity Series Emerging Markets Fund Class F | 3.2 | 3.2 |
High Yield Bond Funds | | |
Fidelity Series Emerging Markets Debt Fund Class F | 0.7 | 0.7 |
Fidelity Series Floating Rate High Income Fund Class F | 1.1 | 1.1 |
Fidelity Series High Income Fund Class F | 5.1 | 5.4 |
Fidelity Series Real Estate Income Fund Class F | 0.5 | 0.6 |
| 7.4 | 7.8 |
Inflation-Protected Bond Funds | | |
Fidelity Series Inflation-Protected Bond Index Fund Class F | 8.3 | 8.2 |
Investment Grade Bond Funds | | |
Fidelity Series Investment Grade Bond Fund Class F | 22.0 | 21.7 |
Short-Term Funds | | |
Fidelity Institutional Money Market Portfolio Class F | 4.0 | 3.7 |
Fidelity Short-Term Bond Fund Class F | 3.3 | 3.0 |
| 7.3 | 6.7 |
Net Other Assets (Liabilities)* | 0.0 | 0.0 |
| 100.0 | 100.0 |
* Amount represents less than 0.1% |
Asset Allocation (% of fund's net assets) |
Period end |
| Commodity Funds | 5.7% | |
| Domestic Equity Funds | 34.3% | |
| Developed International Equity Funds | 11.8% | |
| Emerging Markets Equity Funds | 3.2% | |
| High Yield Bond Funds | 7.4% | |
| Inflation-Protected Bond Funds | 8.3% | |
| Investment Grade Bond Funds | 22.0% | |
| Short-Term Funds | 7.3% | |

Six months ago |
| Commodity Funds | 5.9% | |
| Domestic Equity Funds | 35.0% | |
| Developed International Equity Funds | 11.5% | |
| Emerging Markets Equity Funds | 3.2% | |
| High Yield Bond Funds | 7.8% | |
| Inflation-Protected Bond Funds | 8.2% | |
| Investment Grade Bond Funds | 21.7% | |
| Short-Term Funds | 6.7% | |

Semiannual Report
Fidelity Freedom K® 2020 Fund
Investments September 30, 2013 (Unaudited)
Showing Percentage of Net Assets
Domestic Equity Funds - 40.0% |
| Shares | | Value |
Commodity Funds - 5.7% |
Fidelity Series Commodity Strategy Fund Class F (a)(c) | 121,529,361 | | $ 978,311,353 |
Domestic Equity Funds - 34.3% |
Fidelity Blue Chip Growth Fund Class F (c) | 11,417,744 | | 668,280,564 |
Fidelity Growth Company Fund Class F (c) | 7,039,213 | | 836,047,339 |
Fidelity Series 100 Index Fund (c) | 17,125,720 | | 189,752,975 |
Fidelity Series All-Sector Equity Fund Class F (c) | 62,033,244 | | 879,011,067 |
Fidelity Series Equity-Income Fund Class F (c) | 49,965,404 | | 589,092,118 |
Fidelity Series Growth & Income Fund Class F (c) | 19,060,973 | | 230,065,943 |
Fidelity Series Intrinsic Opportunities Fund Class F (c) | 33,641,387 | | 437,001,622 |
Fidelity Series Large Cap Value Fund Class F (c) | 35,878,363 | | 453,143,730 |
Fidelity Series Opportunistic Insights Fund Class F (c) | 35,990,578 | | 463,918,556 |
Fidelity Series Real Estate Equity Fund Class F (c) | 7,480,465 | | 89,466,359 |
Fidelity Series Small Cap Opportunities Fund Class F (c) | 18,023,165 | | 232,498,827 |
Fidelity Series Stock Selector Large Cap Value Fund Class F (c) | 43,078,648 | | 525,128,724 |
Fidelity Small Cap Growth Fund Class F (c) | 6,759,354 | | 127,549,008 |
Fidelity Small Cap Value Fund Class F (c) | 6,376,090 | | 121,336,994 |
TOTAL DOMESTIC EQUITY FUNDS | | 5,842,293,826 |
TOTAL DOMESTIC EQUITY FUNDS (Cost $5,791,832,942) |
6,820,605,179
|
International Equity Funds - 15.0% |
| | | |
Developed International Equity Funds - 11.8% |
Fidelity Series International Growth Fund Class F (c) | 67,301,165 | | 915,968,858 |
Fidelity Series International Small Cap Fund Class F (c) | 12,247,154 | | 187,748,876 |
Fidelity Series International Value Fund Class F (c) | 84,808,714 | | 914,237,935 |
TOTAL DEVELOPED INTERNATIONAL EQUITY FUNDS | | 2,017,955,669 |
|
| Shares | | Value |
Emerging Markets Equity Funds - 3.2% |
Fidelity Series Emerging Markets Fund Class F (c) | 31,984,961 | | $ 537,027,496 |
TOTAL INTERNATIONAL EQUITY FUNDS (Cost $2,133,953,506) |
2,554,983,165
|
Bond Funds - 37.7% |
| | | |
High Yield Bond Funds - 7.4% |
Fidelity Series Emerging Markets Debt Fund Class F (c) | 11,776,972 | | 119,182,952 |
Fidelity Series Floating Rate High Income Fund Class F (c) | 18,027,520 | | 190,731,162 |
Fidelity Series High Income Fund Class F (c) | 84,498,031 | | 868,639,763 |
Fidelity Series Real Estate Income Fund Class F (c) | 8,845,836 | | 97,127,279 |
TOTAL HIGH YIELD BOND FUNDS | | 1,275,681,156 |
Inflation-Protected Bond Funds - 8.3% |
Fidelity Series Inflation-Protected Bond Index Fund Class F (c) | 130,332,178 | | 1,415,407,455 |
Investment Grade Bond Funds - 22.0% |
Fidelity Series Investment Grade Bond Fund Class F (c) | 334,942,038 | | 3,751,350,830 |
TOTAL BOND FUNDS (Cost $6,554,940,750) |
6,442,439,441
|
Short-Term Funds - 7.3% |
| | | |
Fidelity Institutional Money Market Portfolio Class F 0.07% (b)(c) | 684,620,248 | | 684,620,248 |
Fidelity Short-Term Bond Fund Class F (c) | 65,316,542 | | 559,762,763 |
TOTAL SHORT-TERM FUNDS (Cost $1,241,884,279) |
1,244,383,011
|
TOTAL INVESTMENT PORTFOLIO - 100.0% (Cost $15,722,611,477) | 17,062,410,796 |
NET OTHER ASSETS (LIABILITIES) - 0.0% | | (705,092) |
NET ASSETS - 100% | $ 17,061,705,704 |
Legend |
(a) Non-income producing |
(b) The rate quoted is the annualized seven-day yield of the fund at period end. |
(c) Affiliated company |
Affiliated Underlying Funds |
Information regarding the Fund's fiscal year to date purchases and sales of the affiliated Underlying Funds and income earned by the Fund from investments in affiliated Underlying Funds is as follows: |
Affiliate | Value,
beginning of
period | Purchases | Sales
Proceeds | Dividend
Income | Value,
end of
period |
Fidelity Blue Chip Growth Fund Class F | $ 588,498,575 | $ 61,597,155 | $ 36,883,724 | $ 2,254,983 | $ 668,280,564 |
Fidelity Disciplined Equity Fund Class F | 129,158,280 | 997,721 | 136,451,376 | - | - |
Fidelity Growth Company Fund Class F | 789,365,850 | 32,482,131 | 115,245,178 | - | 836,047,339 |
Fidelity Institutional Money Market Portfolio Class F | 593,164,107 | 106,456,432 | 15,000,291 | 369,835 | 684,620,248 |
Fidelity Series 100 Index Fund | 199,972,738 | 8,003,931 | 32,673,873 | - | 189,752,975 |
Fidelity Series All-Sector Equity Fund Class F | 865,819,849 | 34,079,583 | 107,359,472 | - | 879,011,067 |
Fidelity Series Commodity Strategy Fund Class F | 942,685,044 | 129,182,105 | 17,482,034 | - | 978,311,353 |
Fidelity Series Emerging Markets Debt Fund Class F | 118,940,141 | 10,203,548 | 1,372,802 | 3,193,695 | 119,182,952 |
Fidelity Series Emerging Markets Fund Class F | 511,073,597 | 30,563,425 | 5,898,898 | - | 537,027,496 |
Fidelity Series Equity-Income Fund Class F | 541,381,458 | 37,673,344 | 23,296,759 | 6,084,682 | 589,092,118 |
Fidelity Series Floating Rate High Income Fund Class F | 180,424,834 | 15,646,213 | 4,424,697 | 4,159,949 | 190,731,162 |
Fidelity Series Growth & Income Fund Class F (formerly Fidelity Series Mega Cap Fund Class F) | 197,708,377 | 18,580,444 | 5,149,283 | - | 230,065,943 |
Fidelity Series High Income Fund Class F | 862,323,043 | 65,405,417 | 39,476,060 | 23,126,512 | 868,639,763 |
Fidelity Series Inflation-Protected Bond Index Fund Class F | 1,313,135,289 | 197,668,716 | 30,775,634 | - | 1,415,407,455 |
Fidelity Series International Growth Fund Class F | 843,420,577 | 36,959,240 | 27,036,738 | - | 915,968,858 |
Fidelity Series International Small Cap Fund Class F | 171,602,530 | 7,475,759 | 10,602,780 | - | 187,748,876 |
Fidelity Series International Value Fund Class F | 835,290,115 | 37,000,936 | 37,159,314 | - | 914,237,935 |
Fidelity Series Intrinsic Opportunities Fund Class F | 302,249,698 | 91,819,239 | 7,749,008 | 2,909,633 | 437,001,622 |
Fidelity Series Investment Grade Bond Fund Class F | 3,483,007,844 | 427,919,628 | 51,684,779 | 39,510,535 | 3,751,350,830 |
Fidelity Series Large Cap Value Fund Class F | 514,984,893 | 17,090,430 | 120,525,187 | - | 453,143,730 |
Fidelity Series Opportunistic Insights Fund Class F | 395,214,863 | 18,863,235 | 17,885,100 | - | 463,918,556 |
Fidelity Series Real Estate Equity Fund Class F | 75,712,362 | 22,250,271 | 1,038,721 | 661,640 | 89,466,359 |
Fidelity Series Real Estate Income Fund Class F | 95,886,354 | 9,427,175 | 2,351,301 | 2,960,547 | 97,127,279 |
Fidelity Series Small Cap Opportunities Fund Class F | 224,645,527 | 26,451,802 | 28,892,088 | - | 232,498,827 |
Fidelity Series Stock Selector Large Cap Value Fund Class F | 544,827,638 | 22,100,438 | 89,281,771 | - | 525,128,724 |
Fidelity Short-Term Bond Fund Class F | 486,687,301 | 87,159,606 | 12,244,080 | 2,296,191 | 559,762,763 |
Fidelity Small Cap Growth Fund Class F | 118,596,302 | 18,174,831 | 13,849,464 | - | 127,549,008 |
Fidelity Small Cap Value Fund Class F | 126,823,443 | 12,631,281 | 19,581,564 | 333,449 | 121,336,994 |
Total | $ 16,052,600,629 | $ 1,583,864,036 | $ 1,011,371,976 | $ 87,861,651 | $ 17,062,410,796 |
Other Information |
All investments are categorized as Level 1 under the Fair Value Hierarchy. The inputs or methodology used for valuing securities may not be an indication of the risk associated with investing in those securities. For more information on valuation inputs, please refer to the Investment Valuation section in the accompanying Notes to Financial Statements. |
See accompanying notes which are an integral part of the financial statements.
Semiannual Report
Fidelity Freedom K® 2020 Fund
Statement of Assets and Liabilities
| September 30, 2013 (Unaudited) |
| | |
Assets | | |
Investment in securities, at value (cost $15,722,611,477) - See accompanying schedule | | $ 17,062,410,796 |
Receivable for investments sold | | 27,378,657 |
Receivable for fund shares sold | | 22,196,681 |
Total assets | | 17,111,986,134 |
| | |
Liabilities | | |
Payable for fund shares redeemed | $ 49,575,315 | |
Transfer agent fees payable | 705,115 | |
Total liabilities | | 50,280,430 |
| | |
Net Assets | | $ 17,061,705,704 |
Net Assets consist of: | | |
Paid in capital | | $ 15,491,073,734 |
Undistributed net investment income | | 82,923,568 |
Accumulated undistributed net realized gain (loss) on investments | | 147,909,083 |
Net unrealized appreciation (depreciation) on investments | | 1,339,799,319 |
Net Assets, for 1,199,856,995 shares outstanding | | $ 17,061,705,704 |
Net Asset Value, offering price and redemption price per share ($17,061,705,704 ÷ 1,199,856,995 shares) | | $ 14.22 |
Statement of Operations
Six months ended September 30, 2013 (Unaudited) |
| | |
Investment Income | | |
Income distributions from underlying funds | | $ 87,861,651 |
| | |
Expenses | | |
Transfer agent fees | $ 4,083,829 | |
Independent trustees' compensation | 30,573 | |
Total expenses | | 4,114,402 |
Net investment income (loss) | | 83,747,249 |
Realized and Unrealized Gain (Loss) Realized gain (loss) on sale of underlying fund shares | 91,066,860 | |
Capital gain distributions from underlying funds | 81,962,269 | |
Total net realized gain (loss) | | 173,029,129 |
Change in net unrealized appreciation (depreciation) on underlying funds | | 346,251,249 |
Net gain (loss) | | 519,280,378 |
Net increase (decrease) in net assets resulting from operations | | $ 603,027,627 |
See accompanying notes which are an integral part of the financial statements.
Semiannual Report
Fidelity Freedom K® 2020 Fund
Financial Statements - continued
Statement of Changes in Net Assets
| Six months ended
September 30, 2013
(Unaudited) | Year ended
March 31,
2013 |
Increase (Decrease) in Net Assets | | |
Operations | | |
Net investment income (loss) | $ 83,747,249 | $ 245,370,726 |
Net realized gain (loss) | 173,029,129 | 448,704,104 |
Change in net unrealized appreciation (depreciation) | 346,251,249 | 471,599,307 |
Net increase (decrease) in net assets resulting from operations | 603,027,627 | 1,165,674,137 |
Distributions to shareholders from net investment income | (32,613,953) | (242,055,622) |
Distributions to shareholders from net realized gain | (293,525,248) | (272,202,329) |
Total distributions | (326,139,201) | (514,257,951) |
Share transactions
Proceeds from sales of shares | 2,424,403,933 | 5,706,482,439 |
Reinvestment of distributions | 326,139,201 | 514,257,951 |
Cost of shares redeemed | (2,017,666,759) | (2,874,667,076) |
Net increase (decrease) in net assets resulting from share transactions | 732,876,375 | 3,346,073,314 |
Total increase (decrease) in net assets | 1,009,764,801 | 3,997,489,500 |
| | |
Net Assets | | |
Beginning of period | 16,051,940,903 | 12,054,451,403 |
End of period (including undistributed net investment income of $82,923,568 and undistributed net investment income of $31,790,272, respectively) | $ 17,061,705,704 | $ 16,051,940,903 |
Other Information Shares | | |
Sold | 173,737,570 | 425,101,001 |
Issued in reinvestment of distributions | 23,262,425 | 38,982,612 |
Redeemed | (145,044,633) | (214,551,170) |
Net increase (decrease) | 51,955,362 | 249,532,443 |
Financial Highlights
| Six months ended
September 30, 2013 | Years ended March 31, |
| (Unaudited) | 2013 | 2012 | 2011 | 2010 E |
Selected Per-Share Data | | | | | |
Net asset value, beginning of period | $ 13.98 | $ 13.42 | $ 13.72 | $ 12.37 | $ 10.00 |
Income from Investment Operations | | | | | |
Net investment income (loss) C | .07 | .24 | .25 | .24 | .18 |
Net realized and unrealized gain (loss) | .45 | .82 | .06 | 1.42 | 2.30 |
Total from investment operations | .52 | 1.06 | .31 | 1.66 | 2.48 |
Distributions from net investment income | (.03) | (.23) | (.21) | (.18) | (.06) |
Distributions from net realized gain | (.25) | (.27) | (.40) | (.13) | (.05) |
Total distributions | (.28) | (.50) | (.61) | (.31) | (.11) |
Net asset value, end of period | $ 14.22 | $ 13.98 | $ 13.42 | $ 13.72 | $ 12.37 |
Total Return B | 3.75% | 8.17% | 2.50% | 13.62% | 24.78% |
Ratios to Average Net Assets D, F | | | | | |
Expenses before reductions | .05% A | .05% | .05% | .05% | .05% A |
Expenses net of fee waivers, if any | .05% A | .05% | .05% | .05% | .05% A |
Expenses net of all reductions | .05% A | .05% | .05% | .05% | .05% A |
Net investment income (loss) | 1.01% A | 1.78% | 1.94% | 1.89% | 2.01% A |
Supplemental Data | | | | | |
Net assets, end of period (000 omitted) | $ 17,061,706 | $ 16,051,941 | $ 12,054,451 | $ 6,632,569 | $ 1,585,350 |
Portfolio turnover rate D | 12% A | 23% | 21% | 37% | 20% A |
A Annualized
B Total returns for periods of less than one year are not annualized.
C Calculated based on average shares outstanding during the period.
D Amounts do not include the activity of the Underlying Funds.
E For the period July 2, 2009 (commencement of operations) to March 31, 2010.
F Expense ratios reflect operating expenses of the Fund. Expenses before reductions do not reflect amounts reimbursed by the investment adviser or reductions from expense offset arrangements and do not represent the amount paid by the Fund during periods when reimbursements or reductions occur. Expenses net of fee waivers reflect expenses after reimbursement by the investment adviser but prior to reductions from expense offset arrangements. Expenses net of all reductions represent the net expenses paid by the Fund but do not include expenses of the investment companies in which the Fund invests.
See accompanying notes which are an integral part of the financial statements.
Semiannual Report
Fidelity Freedom K® 2025 Fund
Investment Changes (Unaudited)
The information in the following tables is based on the direct investments of the Fund. |
Fund Holdings as of September 30, 2013 |
| % of fund's
net assets | % of fund's net assets
6 months ago |
Commodity Funds | | |
Fidelity Series Commodity Strategy Fund Class F | 7.1 | 7.2 |
Domestic Equity Funds | | |
Fidelity Blue Chip Growth Fund Class F | 4.8 | 4.5 |
Fidelity Disciplined Equity Fund Class F | 0.0 | 1.0 |
Fidelity Growth Company Fund Class F | 6.0 | 6.1 |
Fidelity Series 100 Index Fund | 1.4 | 1.5 |
Fidelity Series All-Sector Equity Fund Class F | 6.2 | 6.6 |
Fidelity Series Equity-Income Fund Class F | 4.2 | 4.0 |
Fidelity Series Growth & Income Fund Class F (formerly Fidelity Series Mega Cap Fund Class F) | 1.7 | 1.5 |
Fidelity Series Intrinsic Opportunities Fund Class F | 3.2 | 2.4 |
Fidelity Series Large Cap Value Fund Class F | 3.2 | 3.9 |
Fidelity Series Opportunistic Insights Fund Class F | 3.3 | 2.9 |
Fidelity Series Real Estate Equity Fund Class F | 0.6 | 0.6 |
Fidelity Series Small Cap Opportunities Fund Class F | 1.7 | 1.7 |
Fidelity Series Stock Selector Large Cap Value Fund Class F | 3.7 | 4.0 |
Fidelity Small Cap Growth Fund Class F | 0.9 | 0.9 |
Fidelity Small Cap Value Fund Class F | 0.9 | 1.0 |
| 41.8 | 42.6 |
Developed International Equity Funds | | |
Fidelity Series International Growth Fund Class F | 6.5 | 6.4 |
Fidelity Series International Small Cap Fund Class F | 1.4 | 1.3 |
Fidelity Series International Value Fund Class F | 6.5 | 6.3 |
| 14.4 | 14.0 |
Emerging Markets Equity Funds | | |
Fidelity Series Emerging Markets Fund Class F | 3.8 | 3.9 |
High Yield Bond Funds | | |
Fidelity Series Emerging Markets Debt Fund Class F | 0.7 | 0.7 |
Fidelity Series Floating Rate High Income Fund Class F | 0.9 | 0.9 |
Fidelity Series High Income Fund Class F | 6.8 | 6.9 |
Fidelity Series Real Estate Income Fund Class F | 0.5 | 0.6 |
| 8.9 | 9.1 |
Inflation-Protected Bond Funds | | |
Fidelity Series Inflation-Protected Bond Index Fund Class F | 5.6 | 5.3 |
Investment Grade Bond Funds | | |
Fidelity Series Investment Grade Bond Fund Class F | 17.4 | 17.2 |
Short-Term Funds | | |
Fidelity Institutional Money Market Portfolio Class F | 0.5 | 0.4 |
Fidelity Short-Term Bond Fund Class F | 0.5 | 0.3 |
| 1.0 | 0.7 |
Net Other Assets (Liabilities)* | 0.0 | 0.0 |
| 100.0 | 100.0 |
* Amount represents less than 0.1% |
Asset Allocation (% of fund's net assets) |
Period end |
| Commodity Funds | 7.1% | |
| Domestic Equity Funds | 41.8% | |
| Developed International Equity Funds | 14.4% | |
| Emerging Markets Equity Funds | 3.8% | |
| High Yield Bond Funds | 8.9% | |
| Inflation-Protected Bond Funds | 5.6% | |
| Investment Grade Bond Funds | 17.4% | |
| Short-Term Funds | 1.0% | |

Six months ago |
| Commodity Funds | 7.2% | |
| Domestic Equity Funds | 42.6% | |
| Developed International Equity Funds | 14.0% | |
| Emerging Markets Equity Funds | 3.9% | |
| High Yield Bond Funds | 9.1% | |
| Inflation-Protected Bond Funds | 5.3% | |
| Investment Grade Bond Funds | 17.2% | |
| Short-Term Funds | 0.7% | |

Semiannual Report
Fidelity Freedom K® 2025 Fund
Investments September 30, 2013 (Unaudited)
Showing Percentage of Net Assets
Domestic Equity Funds - 48.9% |
| Shares | | Value |
Commodity Funds - 7.1% |
Fidelity Series Commodity Strategy Fund Class F (a)(c) | 97,950,222 | | $ 788,499,284 |
Domestic Equity Funds - 41.8% |
Fidelity Blue Chip Growth Fund Class F (c) | 9,107,340 | | 533,052,618 |
Fidelity Growth Company Fund Class F (c) | 5,564,921 | | 660,945,612 |
Fidelity Series 100 Index Fund (c) | 13,823,425 | | 153,163,552 |
Fidelity Series All-Sector Equity Fund Class F (c) | 48,940,294 | | 693,483,969 |
Fidelity Series Equity-Income Fund Class F (c) | 39,269,228 | | 462,984,197 |
Fidelity Series Growth & Income Fund Class F (c) | 15,215,127 | | 183,646,586 |
Fidelity Series Intrinsic Opportunities Fund Class F (c) | 27,061,303 | | 351,526,328 |
Fidelity Series Large Cap Value Fund Class F (c) | 28,455,141 | | 359,388,429 |
Fidelity Series Opportunistic Insights Fund Class F (c) | 28,078,672 | | 361,934,080 |
Fidelity Series Real Estate Equity Fund Class F (c) | 5,942,825 | | 71,076,181 |
Fidelity Series Small Cap Opportunities Fund Class F (c) | 14,566,018 | | 187,901,627 |
Fidelity Series Stock Selector Large Cap Value Fund Class F (c) | 34,085,670 | | 415,504,319 |
Fidelity Small Cap Growth Fund Class F (c) | 5,423,369 | | 102,338,968 |
Fidelity Small Cap Value Fund Class F (c) | 5,206,218 | | 99,074,327 |
TOTAL DOMESTIC EQUITY FUNDS | | 4,636,020,793 |
TOTAL DOMESTIC EQUITY FUNDS (Cost $4,656,582,330) |
5,424,520,077
|
International Equity Funds - 18.2% |
| | | |
Developed International Equity Funds - 14.4% |
Fidelity Series International Growth Fund Class F (c) | 52,907,277 | | 720,068,042 |
Fidelity Series International Small Cap Fund Class F (c) | 9,909,674 | | 151,915,295 |
Fidelity Series International Value Fund Class F (c) | 67,500,413 | | 727,654,450 |
TOTAL DEVELOPED INTERNATIONAL EQUITY FUNDS | | 1,599,637,787 |
|
| Shares | | Value |
Emerging Markets Equity Funds - 3.8% |
Fidelity Series Emerging Markets Fund Class F (c) | 25,111,532 | | $ 421,622,628 |
TOTAL INTERNATIONAL EQUITY FUNDS (Cost $1,709,536,993) |
2,021,260,415
|
Bond Funds - 31.9% |
| | | |
High Yield Bond Funds - 8.9% |
Fidelity Series Emerging Markets Debt Fund Class F (c) | 7,558,102 | | 76,487,994 |
Fidelity Series Floating Rate High Income Fund Class F (c) | 9,606,483 | | 101,636,595 |
Fidelity Series High Income Fund Class F (c) | 73,690,309 | | 757,536,375 |
Fidelity Series Real Estate Income Fund Class F (c) | 5,165,851 | | 56,721,047 |
TOTAL HIGH YIELD BOND FUNDS | | 992,382,011 |
Inflation-Protected Bond Funds - 5.6% |
Fidelity Series Inflation-Protected Bond Index Fund Class F (c) | 56,726,640 | | 616,051,314 |
Investment Grade Bond Funds - 17.4% |
Fidelity Series Investment Grade Bond Fund Class F (c) | 172,564,715 | | 1,932,724,816 |
TOTAL BOND FUNDS (Cost $3,597,641,870) |
3,541,158,141
|
Short-Term Funds - 1.0% |
| | | |
Fidelity Institutional Money Market Portfolio Class F 0.07% (b)(c) | 59,893,878 | | 59,893,878 |
Fidelity Short-Term Bond Fund Class F (c) | 5,721,891 | | 49,036,609 |
TOTAL SHORT-TERM FUNDS (Cost $108,929,728) |
108,930,487
|
TOTAL INVESTMENT PORTFOLIO - 100.0% (Cost $10,072,690,921) | 11,095,869,120 |
NET OTHER ASSETS (LIABILITIES) - 0.0% | | (457,599) |
NET ASSETS - 100% | $ 11,095,411,521 |
Legend |
(a) Non-income producing |
(b) The rate quoted is the annualized seven-day yield of the fund at period end. |
(c) Affiliated company |
Affiliated Underlying Funds |
Information regarding the Fund's fiscal year to date purchases and sales of the affiliated Underlying Funds and income earned by the Fund from investments in affiliated Underlying Funds is as follows: |
Affiliate | Value,
beginning of
period | Purchases | Sales
Proceeds | Dividend
Income | Value,
end of
period |
Fidelity Blue Chip Growth Fund Class F | $ 441,725,132 | $ 65,867,895 | $ 16,604,084 | $ 1,791,347 | $ 533,052,618 |
Fidelity Disciplined Equity Fund Class F | 97,000,644 | 1,131,756 | 102,876,859 | - | - |
Fidelity Growth Company Fund Class F | 601,589,634 | 44,027,976 | 85,191,811 | - | 660,945,612 |
Fidelity Institutional Money Market Portfolio Class F | 39,758,924 | 20,928,477 | 793,523 | 28,652 | 59,893,878 |
Fidelity Series 100 Index Fund | 151,059,084 | 10,822,052 | 19,870,411 | - | 153,163,552 |
Fidelity Series All-Sector Equity Fund Class F | 651,250,933 | 45,947,341 | 70,790,400 | - | 693,483,969 |
Fidelity Series Commodity Strategy Fund Class F | 714,281,419 | 145,453,576 | 12,641,090 | - | 788,499,284 |
Fidelity Series Emerging Markets Debt Fund Class F | 71,957,407 | 10,386,768 | 572,247 | 1,977,573 | 76,487,994 |
Fidelity Series Emerging Markets Fund Class F | 381,386,399 | 41,838,630 | 3,030,121 | - | 421,622,628 |
Fidelity Series Equity-Income Fund Class F | 396,747,170 | 51,739,755 | 10,416,397 | 4,552,888 | 462,984,197 |
Fidelity Series Floating Rate High Income Fund Class F | 90,181,158 | 12,614,695 | 704,205 | 2,134,109 | 101,636,595 |
Fidelity Series Growth & Income Fund Class F (formerly Fidelity Series Mega Cap Fund Class F) | 145,116,806 | 26,534,799 | 2,224,585 | - | 183,646,586 |
Fidelity Series High Income Fund Class F | 684,251,795 | 99,616,136 | 10,347,455 | 19,299,752 | 757,536,375 |
Fidelity Series Inflation-Protected Bond Index Fund Class F | 529,707,916 | 126,920,008 | 13,548,637 | - | 616,051,314 |
Fidelity Series International Growth Fund Class F | 629,703,229 | 52,805,795 | 11,181,414 | - | 720,068,042 |
Fidelity Series International Small Cap Fund Class F | 128,141,475 | 10,716,204 | 2,250,826 | - | 151,915,295 |
Fidelity Series International Value Fund Class F | 624,323,358 | 52,919,743 | 11,220,592 | - | 727,654,450 |
Fidelity Series Intrinsic Opportunities Fund Class F | 236,976,345 | 79,398,118 | 5,343,004 | 2,335,715 | 351,526,328 |
Fidelity Series Investment Grade Bond Fund Class F | 1,697,697,363 | 331,240,776 | 42,200,681 | 19,867,139 | 1,932,724,816 |
Fidelity Series Large Cap Value Fund Class F | 386,286,269 | 23,652,617 | 82,985,738 | - | 359,388,429 |
Fidelity Series Opportunistic Insights Fund Class F | 289,984,373 | 26,695,830 | 6,330,514 | - | 361,934,080 |
Fidelity Series Real Estate Equity Fund Class F | 55,497,972 | 22,049,362 | 532,999 | 515,090 | 71,076,181 |
Fidelity Series Real Estate Income Fund Class F | 53,104,120 | 7,361,121 | 415,047 | 1,681,724 | 56,721,047 |
Fidelity Series Small Cap Opportunities Fund Class F | 169,246,938 | 26,686,576 | 15,721,901 | - | 187,901,627 |
Fidelity Series Stock Selector Large Cap Value Fund Class F | 399,975,994 | 29,791,900 | 50,016,931 | - | 415,504,319 |
Fidelity Short-Term Bond Fund Class F | 32,611,876 | 17,234,110 | 669,469 | 180,244 | 49,036,609 |
Fidelity Small Cap Growth Fund Class F | 91,028,733 | 17,309,299 | 9,587,105 | - | 102,338,968 |
Fidelity Small Cap Value Fund Class F | 97,515,534 | 12,942,787 | 12,469,285 | 271,785 | 99,074,327 |
Total | $ 9,888,108,000 | $ 1,414,634,102 | $ 600,537,331 | $ 54,636,018 | $ 11,095,869,120 |
Other Information |
All investments are categorized as Level 1 under the Fair Value Hierarchy. The inputs or methodology used for valuing securities may not be an indication of the risk associated with investing in those securities. For more information on valuation inputs, please refer to the Investment Valuation section in the accompanying Notes to Financial Statements. |
See accompanying notes which are an integral part of the financial statements.
Semiannual Report
Fidelity Freedom K® 2025 Fund
Statement of Assets and Liabilities
| September 30, 2013 (Unaudited) |
| | |
Assets | | |
Investment in securities, at value (cost $10,072,690,921) - See accompanying schedule | | $ 11,095,869,120 |
Receivable for investments sold | | 26,526,273 |
Receivable for fund shares sold | | 18,574,137 |
Total assets | | 11,140,969,530 |
| | |
Liabilities | | |
Payable for fund shares redeemed | $ 45,100,395 | |
Transfer agent fees payable | 457,614 | |
Total liabilities | | 45,558,009 |
| | |
Net Assets | | $ 11,095,411,521 |
Net Assets consist of: | | |
Paid in capital | | $ 9,924,804,397 |
Undistributed net investment income | | 51,739,732 |
Accumulated undistributed net realized gain (loss) on investments | | 95,689,193 |
Net unrealized appreciation (depreciation) on investments | | 1,023,178,199 |
Net Assets, for 754,922,422 shares outstanding | | $ 11,095,411,521 |
Net Asset Value, offering price and redemption price per share ($11,095,411,521 ÷ 754,922,422 shares) | | $ 14.70 |
Statement of Operations
Six months ended September 30, 2013 (Unaudited) |
| | |
Investment Income | | |
Income distributions from underlying funds | | $ 54,636,018 |
| | |
Expenses | | |
Transfer agent fees | $ 2,589,292 | |
Independent trustees' compensation | 19,200 | |
Total expenses | | 2,608,492 |
Net investment income (loss) | | 52,027,526 |
Realized and Unrealized Gain (Loss) Realized gain (loss) on sale of underlying fund shares | 48,424,937 | |
Capital gain distributions from underlying funds | 65,220,639 | |
Total net realized gain (loss) | | 113,645,576 |
Change in net unrealized appreciation (depreciation) on underlying funds | | 345,239,413 |
Net gain (loss) | | 458,884,989 |
Net increase (decrease) in net assets resulting from operations | | $ 510,912,515 |
See accompanying notes which are an integral part of the financial statements.
Semiannual Report
Fidelity Freedom K® 2025 Fund
Financial Statements - continued
Statement of Changes in Net Assets
| Six months ended
September 30, 2013
(Unaudited) | Year ended
March 31,
2013 |
Increase (Decrease) in Net Assets | | |
Operations | | |
Net investment income (loss) | $ 52,027,526 | $ 152,593,328 |
Net realized gain (loss) | 113,645,576 | 271,388,589 |
Change in net unrealized appreciation (depreciation) | 345,239,413 | 368,201,225 |
Net increase (decrease) in net assets resulting from operations | 510,912,515 | 792,183,142 |
Distributions to shareholders from net investment income | (19,149,282) | (147,879,817) |
Distributions to shareholders from net realized gain | (198,584,530) | (145,666,744) |
Total distributions | (217,733,812) | (293,546,561) |
Share transactions
Proceeds from sales of shares | 1,848,318,141 | 3,914,024,849 |
Reinvestment of distributions | 217,733,812 | 293,546,561 |
Cost of shares redeemed | (1,151,522,273) | (1,497,471,333) |
Net increase (decrease) in net assets resulting from share transactions | 914,529,680 | 2,710,100,077 |
Total increase (decrease) in net assets | 1,207,708,383 | 3,208,736,658 |
| | |
Net Assets | | |
Beginning of period | 9,887,703,138 | 6,678,966,480 |
End of period (including undistributed net investment income of $51,739,732 and undistributed net investment income of $18,861,488, respectively) | $ 11,095,411,521 | $ 9,887,703,138 |
Other Information Shares | | |
Sold | 128,816,483 | 288,192,126 |
Issued in reinvestment of distributions | 15,141,434 | 22,013,209 |
Redeemed | (80,548,938) | (110,265,804) |
Net increase (decrease) | 63,408,979 | 199,939,531 |
Financial Highlights
| Six months ended
September 30, 2013 | Years ended March 31, |
| (Unaudited) | 2013 | 2012 | 2011 | 2010 E |
Selected Per-Share Data | | | | | |
Net asset value, beginning of period | $ 14.30 | $ 13.59 | $ 13.99 | $ 12.50 | $ 10.00 |
Income from Investment Operations | | | | | |
Net investment income (loss) C | .07 | .26 | .26 | .25 | .18 |
Net realized and unrealized gain (loss) | .64 | .95 | (.02) | 1.57 | 2.44 |
Total from investment operations | .71 | 1.21 | .24 | 1.82 | 2.62 |
Distributions from net investment income | (.03) | (.24) | (.21) | (.19) | (.07) |
Distributions from net realized gain | (.28) | (.26) | (.43) | (.14) | (.05) |
Total distributions | (.31) | (.50) | (.64) | (.33) | (.12) |
Net asset value, end of period | $ 14.70 | $ 14.30 | $ 13.59 | $ 13.99 | $ 12.50 |
Total Return B | 4.99% | 9.17% | 2.02% | 14.72% | 26.24% |
Ratios to Average Net Assets D, F | | | | | |
Expenses before reductions | .05% A | .05% | .05% | .05% | .05% A |
Expenses net of fee waivers, if any | .05% A | .05% | .05% | .05% | .05% A |
Expenses net of all reductions | .05% A | .05% | .05% | .05% | .05% A |
Net investment income (loss) | .99% A | 1.89% | 1.95% | 1.90% | 2.02% A |
Supplemental Data | | | | | |
Net assets, end of period (000 omitted) | $ 11,095,412 | $ 9,887,703 | $ 6,678,966 | $ 3,454,146 | $ 930,417 |
Portfolio turnover rate D | 11% A | 23% | 20% | 38% | 19% A |
A Annualized
B Total returns for periods of less than one year are not annualized.
C Calculated based on average shares outstanding during the period.
D Amounts do not include the activity of the Underlying Funds.
E For the period July 2, 2009 (commencement of operations) to March 31, 2010.
F Expense ratios reflect operating expenses of the Fund. Expenses before reductions do not reflect amounts reimbursed by the investment adviser or reductions from expense offset arrangements and do not represent the amount paid by the Fund during periods when reimbursements or reductions occur. Expenses net of fee waivers reflect expenses after reimbursement by the investment adviser but prior to reductions from expense offset arrangements. Expenses net of all reductions represent the net expenses paid by the Fund but do not include expenses of the investment companies in which the Fund invests.
See accompanying notes which are an integral part of the financial statements.
Semiannual Report
Fidelity Freedom K® 2030 Fund
Investment Changes (Unaudited)
The information in the following tables is based on the direct investments of the Fund. |
Fund Holdings as of September 30, 2013 |
| % of fund's
net assets | % of fund's net assets
6 months ago |
Commodity Funds | | |
Fidelity Series Commodity Strategy Fund Class F | 7.5 | 7.6 |
Domestic Equity Funds | | |
Fidelity Blue Chip Growth Fund Class F | 5.0 | 4.7 |
Fidelity Disciplined Equity Fund Class F | 0.0 | 1.0 |
Fidelity Growth Company Fund Class F | 6.3 | 6.4 |
Fidelity Series 100 Index Fund | 1.5 | 1.6 |
Fidelity Series All-Sector Equity Fund Class F | 6.6 | 6.9 |
Fidelity Series Equity-Income Fund Class F | 4.4 | 4.2 |
Fidelity Series Growth & Income Fund Class F (formerly Fidelity Series Mega Cap Fund Class F) | 1.7 | 1.5 |
Fidelity Series Intrinsic Opportunities Fund Class F | 3.4 | 2.5 |
Fidelity Series Large Cap Value Fund Class F | 3.4 | 4.1 |
Fidelity Series Opportunistic Insights Fund Class F | 3.5 | 3.1 |
Fidelity Series Real Estate Equity Fund Class F | 0.7 | 0.6 |
Fidelity Series Small Cap Opportunities Fund Class F | 1.8 | 1.8 |
Fidelity Series Stock Selector Large Cap Value Fund Class F | 4.0 | 4.3 |
Fidelity Small Cap Growth Fund Class F | 1.0 | 1.0 |
Fidelity Small Cap Value Fund Class F | 0.9 | 1.0 |
| 44.2 | 44.7 |
Developed International Equity Funds | | |
Fidelity Series International Growth Fund Class F | 6.9 | 6.7 |
Fidelity Series International Small Cap Fund Class F | 1.4 | 1.4 |
Fidelity Series International Value Fund Class F | 6.9 | 6.6 |
| 15.2 | 14.7 |
Emerging Markets Equity Funds | | |
Fidelity Series Emerging Markets Fund Class F | 4.1 | 4.0 |
High Yield Bond Funds | | |
Fidelity Series Emerging Markets Debt Fund Class F | 0.7 | 0.7 |
Fidelity Series Floating Rate High Income Fund Class F | 0.9 | 0.9 |
Fidelity Series High Income Fund Class F | 6.9 | 7.0 |
Fidelity Series Real Estate Income Fund Class F | 0.5 | 0.5 |
| 9.0 | 9.1 |
Inflation-Protected Bond Funds | | |
Fidelity Series Inflation-Protected Bond Index Fund Class F | 2.8 | 2.5 |
Investment Grade Bond Funds | | |
Fidelity Series Investment Grade Bond Fund Class F | 17.2 | 17.4 |
Net Other Assets (Liabilities)* | 0.0 | 0.0 |
| 100.0 | 100.0 |
* Amount represents less than 0.1% |
Asset Allocation (% of fund's net assets) |
Period end |
| Commodity Funds | 7.5% | |
| Domestic Equity Funds | 44.2% | |
| Developed International Equity Funds | 15.2% | |
| Emerging Markets Equity Funds | 4.1% | |
| High Yield Bond Funds | 9.0% | |
 | Inflation-Protected Bond Funds | 2.8% | |
| Investment Grade Bond Funds | 17.2% | |

Six months ago |
| Commodity Funds | 7.6% | |
| Domestic Equity Funds | 44.7% | |
| Developed International Equity Funds | 14.7% | |
| Emerging Markets Equity Funds | 4.0% | |
| High Yield Bond Funds | 9.1% | |
| Inflation-Protected Bond Funds | 2.5% | |
| Investment Grade Bond Funds | 17.4% | |

Semiannual Report
Fidelity Freedom K® 2030 Fund
Investments September 30, 2013 (Unaudited)
Showing Percentage of Net Assets
Domestic Equity Funds - 51.7% |
| Shares | | Value |
Commodity Funds - 7.5% |
Fidelity Series Commodity Strategy Fund Class F (a)(b) | 132,268,579 | | $ 1,064,762,062 |
Domestic Equity Funds - 44.2% |
Fidelity Blue Chip Growth Fund Class F (b) | 12,203,532 | | 714,272,720 |
Fidelity Growth Company Fund Class F (b) | 7,546,426 | | 896,289,046 |
Fidelity Series 100 Index Fund (b) | 18,747,398 | | 207,721,170 |
Fidelity Series All-Sector Equity Fund Class F (b) | 66,433,829 | | 941,367,359 |
Fidelity Series Equity-Income Fund Class F (b) | 52,867,997 | | 623,313,689 |
Fidelity Series Growth & Income Fund Class F (b) | 20,386,007 | | 246,059,104 |
Fidelity Series Intrinsic Opportunities Fund Class F (b) | 36,578,484 | | 475,154,510 |
Fidelity Series Large Cap Value Fund Class F (b) | 38,587,683 | | 487,362,442 |
Fidelity Series Opportunistic Insights Fund Class F (b) | 37,998,276 | | 489,797,775 |
Fidelity Series Real Estate Equity Fund Class F (b) | 8,032,641 | | 96,070,390 |
Fidelity Series Small Cap Opportunities Fund Class F (b) | 19,749,399 | | 254,767,246 |
Fidelity Series Stock Selector Large Cap Value Fund Class F (b) | 46,285,434 | | 564,219,446 |
Fidelity Small Cap Growth Fund Class F (b) | 7,412,960 | | 139,882,563 |
Fidelity Small Cap Value Fund Class F (b) | 7,074,844 | | 134,634,277 |
TOTAL DOMESTIC EQUITY FUNDS | | 6,270,911,737 |
TOTAL DOMESTIC EQUITY FUNDS (Cost $6,279,851,533) |
7,335,673,799
|
International Equity Funds - 19.3% |
| | | |
Developed International Equity Funds - 15.2% |
Fidelity Series International Growth Fund Class F (b) | 71,294,525 | | 970,318,485 |
Fidelity Series International Small Cap Fund Class F (b) | 13,248,616 | | 203,101,287 |
Fidelity Series International Value Fund Class F (b) | 90,453,482 | | 975,088,533 |
TOTAL DEVELOPED INTERNATIONAL EQUITY FUNDS | | 2,148,508,305 |
|
| Shares | | Value |
Emerging Markets Equity Funds - 4.1% |
Fidelity Series Emerging Markets Fund Class F (b) | 34,696,781 | | $ 582,558,950 |
TOTAL INTERNATIONAL EQUITY FUNDS (Cost $2,306,573,910) |
2,731,067,255
|
Bond Funds - 29.0% |
| | | |
High Yield Bond Funds - 9.0% |
Fidelity Series Emerging Markets Debt Fund Class F (b) | 9,581,237 | | 96,962,114 |
Fidelity Series Floating Rate High Income Fund Class F (b) | 11,571,104 | | 122,422,284 |
Fidelity Series High Income Fund Class F (b) | 95,768,533 | | 984,500,517 |
Fidelity Series Real Estate Income Fund Class F (b) | 6,282,383 | | 68,980,568 |
TOTAL HIGH YIELD BOND FUNDS | | 1,272,865,483 |
Inflation-Protected Bond Funds - 2.8% |
Fidelity Series Inflation-Protected Bond Index Fund Class F (b) | 36,603,852 | | 397,517,837 |
Investment Grade Bond Funds - 17.2% |
Fidelity Series Investment Grade Bond Fund Class F (b) | 218,141,272 | | 2,443,182,253 |
TOTAL BOND FUNDS (Cost $4,178,866,668) |
4,113,565,573
|
TOTAL INVESTMENT PORTFOLIO - 100.0% (Cost $12,765,292,111) | | 14,180,306,627 |
NET OTHER ASSETS (LIABILITIES) - 0.0% | | (585,705) |
NET ASSETS - 100% | $ 14,179,720,922 |
Legend |
(a) Non-income producing |
(b) Affiliated company |
Affiliated Underlying Funds |
Information regarding the Fund's fiscal year to date purchases and sales of the affiliated Underlying Funds and income earned by the Fund from investments in affiliated Underlying Funds is as follows: |
Affiliate | Value,
beginning of
period | Purchases | Sales
Proceeds | Dividend
Income | Value,
end of
period |
Fidelity Blue Chip Growth Fund Class F | $ 602,111,489 | $ 73,580,966 | $ 18,268,606 | $ 2,405,338 | $ 714,272,720 |
Fidelity Disciplined Equity Fund Class F | 132,360,247 | 913,005 | 139,788,766 | - | - |
Fidelity Growth Company Fund Class F | 828,709,110 | 41,716,339 | 111,028,971 | - | 896,289,046 |
Fidelity Series 100 Index Fund | 205,820,148 | 10,192,230 | 23,314,658 | - | 207,721,170 |
Fidelity Series All-Sector Equity Fund Class F | 888,597,916 | 42,655,078 | 80,487,716 | - | 941,367,359 |
Fidelity Series Commodity Strategy Fund Class F | 980,829,744 | 180,569,063 | 17,422,171 | - | 1,064,762,062 |
Fidelity Series Emerging Markets Debt Fund Class F | 94,633,090 | 10,124,070 | 917,830 | 2,562,063 | 96,962,114 |
Fidelity Series Emerging Markets Fund Class F | 522,651,248 | 63,360,858 | 5,578,687 | - | 582,558,950 |
Fidelity Series Equity-Income Fund Class F | 549,196,646 | 55,038,770 | 15,070,545 | 6,240,802 | 623,313,689 |
Fidelity Series Floating Rate High Income Fund Class F | 111,519,649 | 12,558,465 | 1,107,758 | 2,612,366 | 122,422,284 |
Fidelity Series Growth & Income Fund Class F (formerly Fidelity Series Mega Cap Fund Class F) | 200,841,703 | 29,073,120 | 3,353,217 | - | 246,059,104 |
Fidelity Series High Income Fund Class F | 903,277,695 | 118,276,631 | 15,982,221 | 25,274,548 | 984,500,517 |
Fidelity Series Inflation-Protected Bond Index Fund Class F | 328,765,237 | 93,104,135 | 7,098,196 | - | 397,517,837 |
Fidelity Series International Growth Fund Class F | 862,997,755 | 55,660,843 | 14,478,680 | - | 970,318,485 |
Fidelity Series International Small Cap Fund Class F | 175,227,326 | 10,177,408 | 2,928,858 | - | 203,101,287 |
Fidelity Series International Value Fund Class F | 855,871,899 | 50,283,455 | 14,499,166 | - | 975,088,533 |
Fidelity Series Intrinsic Opportunities Fund Class F | 326,611,115 | 100,312,032 | 7,112,146 | 3,158,491 | 475,154,510 |
Fidelity Series Investment Grade Bond Fund Class F | 2,249,073,002 | 341,635,463 | 77,073,035 | 25,688,607 | 2,443,182,253 |
Fidelity Series Large Cap Value Fund Class F | 532,173,112 | 21,454,379 | 110,560,645 | - | 487,362,442 |
Fidelity Series Opportunistic Insights Fund Class F | 401,399,062 | 26,500,410 | 8,411,955 | - | 489,797,775 |
Fidelity Series Real Estate Equity Fund Class F | 74,960,322 | 30,055,764 | 992,040 | 692,778 | 96,070,390 |
Fidelity Series Real Estate Income Fund Class F | 63,065,894 | 10,567,551 | 612,410 | 2,046,311 | 68,980,568 |
Fidelity Series Small Cap Opportunities Fund Class F | 231,089,918 | 30,911,160 | 17,493,560 | - | 254,767,246 |
Fidelity Series Stock Selector Large Cap Value Fund Class F | 553,830,035 | 28,138,340 | 66,685,491 | - | 564,219,446 |
Fidelity Small Cap Growth Fund Class F | 126,536,017 | 20,973,018 | 12,552,320 | - | 139,882,563 |
Fidelity Small Cap Value Fund Class F | 136,042,302 | 14,944,843 | 17,891,117 | 369,456 | 134,634,277 |
Total | $ 12,938,191,681 | $ 1,472,777,396 | $ 790,710,765 | $ 71,050,760 | $ 14,180,306,627 |
Other Information |
All investments are categorized as Level 1 under the Fair Value Hierarchy. The inputs or methodology used for valuing securities may not be an indication of the risk associated with investing in those securities. For more information on valuation inputs, please refer to the Investment Valuation section in the accompanying Notes to Financial Statements. |
See accompanying notes which are an integral part of the financial statements.
Semiannual Report
Fidelity Freedom K® 2030 Fund
Statement of Assets and Liabilities
| September 30, 2013 (Unaudited) |
| | |
Assets | | |
Investment in securities, at value (cost $12,765,292,111) - See accompanying schedule | | $ 14,180,306,627 |
Receivable for investments sold | | 26,213,704 |
Receivable for fund shares sold | | 20,836,752 |
Total assets | | 14,227,357,083 |
| | |
Liabilities | | |
Payable for fund shares redeemed | $ 47,050,438 | |
Transfer agent fees payable | 585,723 | |
Total liabilities | | 47,636,161 |
| | |
Net Assets | | $ 14,179,720,922 |
Net Assets consist of: | | |
Paid in capital | | $ 12,564,273,359 |
Undistributed net investment income | | 67,465,468 |
Accumulated undistributed net realized gain (loss) on investments | | 132,967,579 |
Net unrealized appreciation (depreciation) on investments | | 1,415,014,516 |
Net Assets, for 949,435,814 shares outstanding | | $ 14,179,720,922 |
Net Asset Value, offering price and redemption price per share ($14,179,720,922 ÷ 949,435,814 shares) | | $ 14.93 |
Statement of Operations
Six months ended September 30, 2013 (Unaudited) |
| | |
Investment Income | | |
Income distributions from underlying funds | | $ 71,050,760 |
| | |
Expenses | | |
Transfer agent fees | $ 3,341,991 | |
Independent trustees' compensation | 24,874 | |
Total expenses | | 3,366,865 |
Net investment income (loss) | | 67,683,895 |
Realized and Unrealized Gain (Loss) Realized gain (loss) on sale of underlying fund shares | 69,498,204 | |
Capital gain distributions from underlying funds | 88,104,933 | |
Total net realized gain (loss) | | 157,603,137 |
Change in net unrealized appreciation (depreciation) on underlying funds | | 490,550,109 |
Net gain (loss) | | 648,153,246 |
Net increase (decrease) in net assets resulting from operations | | $ 715,837,141 |
See accompanying notes which are an integral part of the financial statements.
Semiannual Report
Statement of Changes in Net Assets
| Six months ended
September 30, 2013
(Unaudited) | Year ended
March 31,
2013 |
Increase (Decrease) in Net Assets | | |
Operations | | |
Net investment income (loss) | $ 67,683,895 | $ 207,635,923 |
Net realized gain (loss) | 157,603,137 | 365,148,570 |
Change in net unrealized appreciation (depreciation) | 490,550,109 | 493,923,180 |
Net increase (decrease) in net assets resulting from operations | 715,837,141 | 1,066,707,673 |
Distributions to shareholders from net investment income | (24,505,847) | (202,803,148) |
Distributions to shareholders from net realized gain | (274,101,274) | (198,489,086) |
Total distributions | (298,607,121) | (401,292,234) |
Share transactions
Proceeds from sales of shares | 2,013,221,584 | 4,684,029,188 |
Reinvestment of distributions | 298,607,121 | 401,292,234 |
Cost of shares redeemed | (1,486,999,706) | (2,019,839,253) |
Net increase (decrease) in net assets resulting from share transactions | 824,828,999 | 3,065,482,169 |
Total increase (decrease) in net assets | 1,242,059,019 | 3,730,897,608 |
| | |
Net Assets | | |
Beginning of period | 12,937,661,903 | 9,206,764,295 |
End of period (including undistributed net investment income of $67,465,468 and undistributed net investment income of $24,287,420, respectively) | $ 14,179,720,922 | $ 12,937,661,903 |
Other Information Shares | | |
Sold | 138,348,588 | 341,169,501 |
Issued in reinvestment of distributions | 20,494,655 | 29,813,341 |
Redeemed | (102,564,575) | (147,480,227) |
Net increase (decrease) | 56,278,668 | 223,502,615 |
Financial Highlights
| Six months ended September 30, 2013 | Years ended March 31, |
| (Unaudited) | 2013 | 2012 | 2011 | 2010 E |
Selected Per-Share Data | | | | | |
Net asset value, beginning of period | $ 14.49 | $ 13.75 | $ 14.22 | $ 12.67 | $ 10.00 |
Income from Investment Operations | | | | | |
Net investment income (loss) C | .07 | .27 | .26 | .25 | .17 |
Net realized and unrealized gain (loss) | .70 | .99 | (.07) | 1.62 | 2.62 |
Total from investment operations | .77 | 1.26 | .19 | 1.87 | 2.79 |
Distributions from net investment income | (.03) | (.25) | (.22) | (.18) | (.07) |
Distributions from net realized gain | (.30) | (.26) | (.44) | (.14) | (.05) |
Total distributions | (.33) | (.52) G | (.66) | (.32) | (.12) |
Net asset value, end of period | $ 14.93 | $ 14.49 | $ 13.75 | $ 14.22 | $ 12.67 |
Total Return B | 5.36% | 9.46% | 1.62% | 14.95% | 27.94% |
Ratios to Average Net Assets D, F | | | | | |
Expenses before reductions | .05% A | .05% | .05% | .05% | .05% A |
Expenses net of fee waivers, if any | .05% A | .05% | .05% | .05% | .05% A |
Expenses net of all reductions | .05% A | .05% | .05% | .05% | .05% A |
Net investment income (loss) | 1.00% A | 1.94% | 1.99% | 1.88% | 1.93% A |
Supplemental Data | | | | | |
Net assets, end of period (000 omitted) | $ 14,179,721 | $ 12,937,662 | $ 9,206,764 | $ 4,890,405 | $ 1,280,910 |
Portfolio turnover rate D | 12% A | 25% | 19% | 37% | 23% A |
A Annualized
B Total returns for periods of less than one year are not annualized.
C Calculated based on average shares outstanding during the period.
D Amounts do not include the activity of the Underlying Funds.
E For the period July 2, 2009 (commencement of operations) to March 31, 2010.
F Expense ratios reflect operating expenses of the Fund. Expenses before reductions do not reflect amounts reimbursed by the investment adviser or reductions from expense offset arrangements and do not represent the amount paid by the Fund during periods when reimbursements or reductions occur. Expenses net of fee waivers reflect expenses after reimbursement by the investment adviser but prior to reductions from expense offset arrangements. Expenses net of all reductions represent the net expenses paid by the Fund but do not include expenses of the investment companies in which the Fund invests.
G Total distributions of $.52 per share is comprised of distributions from net investment income of $.252 and distributions from net realized gain of $.264 per share.
See accompanying notes which are an integral part of the financial statements.
Semiannual Report
Fidelity Freedom K® 2035 Fund
Investment Changes (Unaudited)
The information in the following tables is based on the direct investments of the Fund. |
Fund Holdings as of September 30, 2013 |
| % of fund's
net assets | % of fund's net assets
6 months ago |
Commodity Funds | | |
Fidelity Series Commodity Strategy Fund Class F | 8.6 | 8.8 |
Domestic Equity Funds | | |
Fidelity Blue Chip Growth Fund Class F | 5.8 | 5.4 |
Fidelity Disciplined Equity Fund Class F | 0.0 | 1.2 |
Fidelity Growth Company Fund Class F | 7.2 | 7.4 |
Fidelity Series 100 Index Fund | 1.7 | 1.8 |
Fidelity Series All-Sector Equity Fund Class F | 7.6 | 7.9 |
Fidelity Series Equity-Income Fund Class F | 5.0 | 4.8 |
Fidelity Series Growth & Income Fund Class F (formerly Fidelity Series Mega Cap Fund Class F) | 2.0 | 1.8 |
Fidelity Series Intrinsic Opportunities Fund Class F | 3.8 | 2.8 |
Fidelity Series Large Cap Value Fund Class F | 3.9 | 4.8 |
Fidelity Series Opportunistic Insights Fund Class F | 3.9 | 3.5 |
Fidelity Series Real Estate Equity Fund Class F | 0.8 | 0.7 |
Fidelity Series Small Cap Opportunities Fund Class F | 2.1 | 2.1 |
Fidelity Series Stock Selector Large Cap Value Fund Class F | 4.5 | 4.8 |
Fidelity Small Cap Growth Fund Class F | 1.1 | 1.1 |
Fidelity Small Cap Value Fund Class F | 1.1 | 1.2 |
| 50.5 | 51.3 |
Developed International Equity Funds | | |
Fidelity Series International Growth Fund Class F | 7.8 | 7.7 |
Fidelity Series International Small Cap Fund Class F | 1.7 | 1.5 |
Fidelity Series International Value Fund Class F | 7.8 | 7.6 |
| 17.3 | 16.8 |
Emerging Markets Equity Funds | | |
Fidelity Series Emerging Markets Fund Class F | 4.8 | 4.7 |
High Yield Bond Funds | | |
Fidelity Series Emerging Markets Debt Fund Class F | 0.7 | 0.7 |
Fidelity Series Floating Rate High Income Fund Class F | 0.8 | 0.8 |
Fidelity Series High Income Fund Class F | 6.8 | 6.9 |
Fidelity Series Real Estate Income Fund Class F | 0.4 | 0.4 |
| 8.7 | 8.8 |
Inflation-Protected Bond Funds | | |
Fidelity Series Inflation-Protected Bond Index Fund Class F | 0.0* | 0.0 |
Investment Grade Bond Funds | | |
Fidelity Series Investment Grade Bond Fund Class F | 10.1 | 9.6 |
Net Other Assets (Liabilities)* | 0.0 | 0.0 |
| 100.0 | 100.0 |
* Amount represents less than 0.1% |
Asset Allocation (% of fund's net assets) |
Period end |
| Commodity Funds | 8.6% | |
| Domestic Equity Funds | 50.5% | |
| Developed International Equity Funds | 17.3% | |
| Emerging Markets Equity Funds | 4.8% | |
| High Yield Bond Funds | 8.7% | |
| Inflation-Protected Bond Funds | 0.0%* | |
| Investment Grade Bond Funds | 10.1% | |

Six months ago |
| Commodity Funds | 8.8% | |
| Domestic Equity Funds | 51.3% | |
| Developed International Equity Funds | 16.8% | |
| Emerging Markets Equity Funds | 4.7% | |
| High Yield Bond Funds | 8.8% | |
 | Inflation-Protected Bond Funds | 0.0% | |
| Investment Grade Bond Funds | 9.6% | |

Semiannual Report
Fidelity Freedom K® 2035 Fund
Investments September 30, 2013 (Unaudited)
Showing Percentage of Net Assets
Domestic Equity Funds - 59.1% |
| Shares | | Value |
Commodity Funds - 8.6% |
Fidelity Series Commodity Strategy Fund Class F (a)(b) | 89,488,560 | | $ 720,382,909 |
Domestic Equity Funds - 50.5% |
Fidelity Blue Chip Growth Fund Class F (b) | 8,282,161 | | 484,754,911 |
Fidelity Growth Company Fund Class F (b) | 5,085,317 | | 603,983,142 |
Fidelity Series 100 Index Fund (b) | 12,689,780 | | 140,602,765 |
Fidelity Series All-Sector Equity Fund Class F (b) | 44,690,823 | | 633,268,967 |
Fidelity Series Equity-Income Fund Class F (b) | 35,688,855 | | 420,771,604 |
Fidelity Series Growth & Income Fund Class F (b) | 14,184,025 | | 171,201,183 |
Fidelity Series Intrinsic Opportunities Fund Class F (b) | 24,641,838 | | 320,097,471 |
Fidelity Series Large Cap Value Fund Class F (b) | 26,040,427 | | 328,890,597 |
Fidelity Series Opportunistic Insights Fund Class F (b) | 25,541,367 | | 329,228,224 |
Fidelity Series Real Estate Equity Fund Class F (b) | 5,428,692 | | 64,927,153 |
Fidelity Series Small Cap Opportunities Fund Class F (b) | 13,432,468 | | 173,278,836 |
Fidelity Series Stock Selector Large Cap Value Fund Class F (b) | 31,084,163 | | 378,915,944 |
Fidelity Small Cap Growth Fund Class F (b) | 4,942,183 | | 93,259,000 |
Fidelity Small Cap Value Fund Class F (b) | 4,788,419 | | 91,123,620 |
TOTAL DOMESTIC EQUITY FUNDS | | 4,234,303,417 |
TOTAL DOMESTIC EQUITY FUNDS (Cost $4,279,018,150) |
4,954,686,326
|
International Equity Funds - 22.1% |
| | | |
Developed International Equity Funds - 17.3% |
Fidelity Series International Growth Fund Class F (b) | 48,084,229 | | 654,426,363 |
Fidelity Series International Small Cap Fund Class F (b) | 8,891,241 | | 136,302,720 |
Fidelity Series International Value Fund Class F (b) | 60,746,679 | | 654,849,197 |
TOTAL DEVELOPED INTERNATIONAL EQUITY FUNDS | | 1,445,578,280 |
|
| Shares | | Value |
Emerging Markets Equity Funds - 4.8% |
Fidelity Series Emerging Markets Fund Class F (b) | 23,943,303 | | $ 402,008,049 |
TOTAL INTERNATIONAL EQUITY FUNDS (Cost $1,572,343,788) |
1,847,586,329
|
Bond Funds - 18.8% |
| | | |
High Yield Bond Funds - 8.7% |
Fidelity Series Emerging Markets Debt Fund Class F (b) | 5,809,895 | | 58,796,134 |
Fidelity Series Floating Rate High Income Fund Class F (b) | 6,129,823 | | 64,853,526 |
Fidelity Series High Income Fund Class F (b) | 55,632,511 | | 571,902,217 |
Fidelity Series Real Estate Income Fund Class F (b) | 3,243,324 | | 35,611,693 |
TOTAL HIGH YIELD BOND FUNDS | | 731,163,570 |
Inflation-Protected Bond Funds - 0.0% |
Fidelity Series Inflation-Protected Bond Index Fund Class F (b) | 140,854 | | 1,529,670 |
Investment Grade Bond Funds - 10.1% |
Fidelity Series Investment Grade Bond Fund Class F (b) | 75,276,912 | | 843,101,415 |
TOTAL BOND FUNDS (Cost $1,589,206,620) |
1,575,794,655
|
TOTAL INVESTMENT PORTFOLIO - 100.0% (Cost $7,440,568,558) | | 8,378,067,310 |
NET OTHER ASSETS (LIABILITIES) - 0.0% | | (346,023) |
NET ASSETS - 100% | $ 8,377,721,287 |
Legend |
(a) Non-income producing |
(b) Affiliated company |
Affiliated Underlying Funds |
Information regarding the Fund's fiscal year to date purchases and sales of the affiliated Underlying Funds and income earned by the Fund from investments in affiliated Underlying Funds is as follows: |
Affiliate | Value,
beginning of
period | Purchases | Sales
Proceeds | Dividend
Income | Value,
end of
period |
Fidelity Blue Chip Growth Fund Class F | $ 395,059,637 | $ 61,705,575 | $ 9,876,922 | $ 1,631,765 | $ 484,754,911 |
Fidelity Disciplined Equity Fund Class F | 86,464,431 | 988,632 | 91,706,632 | - | - |
Fidelity Growth Company Fund Class F | 542,350,097 | 41,562,891 | 71,262,281 | - | 603,983,142 |
Fidelity Series 100 Index Fund | 134,827,963 | 10,635,596 | 14,787,416 | - | 140,602,765 |
Fidelity Series All-Sector Equity Fund Class F | 582,232,287 | 43,597,691 | 53,031,619 | - | 633,268,967 |
Fidelity Series Commodity Strategy Fund Class F | 643,392,529 | 139,961,321 | 9,953,634 | - | 720,382,909 |
Fidelity Series Emerging Markets Debt Fund Class F | 52,821,472 | 10,623,923 | 513,031 | 1,509,253 | 58,796,134 |
Fidelity Series Emerging Markets Fund Class F | 341,026,305 | 62,214,197 | 3,265,728 | - | 402,008,049 |
Fidelity Series Equity-Income Fund Class F | 351,785,243 | 54,544,378 | 7,857,664 | 4,084,869 | 420,771,604 |
Fidelity Series Floating Rate High Income Fund Class F | 55,436,095 | 10,314,403 | 576,897 | 1,355,956 | 64,853,526 |
Fidelity Series Growth & Income Fund Class F (formerly Fidelity Series Mega Cap Fund Class F) | 128,675,865 | 31,508,664 | 1,799,454 | - | 171,201,183 |
Fidelity Series High Income Fund Class F | 504,997,060 | 85,949,483 | 6,952,478 | 14,422,947 | 571,902,217 |
Fidelity Series Inflation-Protected Bond Index Fund Class F | - | 1,531,388 | 6,407 | - | 1,529,670 |
Fidelity Series International Growth Fund Class F | 561,777,471 | 56,917,116 | 8,658,820 | - | 654,426,363 |
Fidelity Series International Small Cap Fund Class F | 114,078,949 | 10,245,342 | 1,751,347 | - | 136,302,720 |
Fidelity Series International Value Fund Class F | 556,916,636 | 51,165,662 | 8,668,343 | - | 654,849,197 |
Fidelity Series Intrinsic Opportunities Fund Class F | 206,594,366 | 81,298,526 | 3,755,742 | 2,127,211 | 320,097,471 |
Fidelity Series Investment Grade Bond Fund Class F | 701,187,533 | 188,147,696 | 23,263,141 | 8,495,401 | 843,101,415 |
Fidelity Series Large Cap Value Fund Class F | 353,277,341 | 22,834,728 | 76,951,115 | - | 328,890,597 |
Fidelity Series Opportunistic Insights Fund Class F | 257,134,571 | 29,735,913 | 4,263,790 | - | 329,228,224 |
Fidelity Series Real Estate Equity Fund Class F | 49,405,638 | 21,590,328 | 573,360 | 473,658 | 64,927,153 |
Fidelity Series Real Estate Income Fund Class F | 32,314,117 | 5,726,873 | 311,984 | 1,058,992 | 35,611,693 |
Fidelity Series Small Cap Opportunities Fund Class F | 151,752,500 | 25,271,378 | 10,445,947 | - | 173,278,836 |
Fidelity Series Stock Selector Large Cap Value Fund Class F | 355,149,012 | 28,158,016 | 36,204,348 | - | 378,915,944 |
Fidelity Small Cap Growth Fund Class F | 82,451,331 | 16,061,226 | 8,426,685 | - | 93,259,000 |
Fidelity Small Cap Value Fund Class F | 88,434,960 | 12,361,976 | 10,528,233 | 250,097 | 91,123,620 |
Total | $ 7,329,543,409 | $ 1,104,652,922 | $ 465,393,018 | $ 35,410,149 | $ 8,378,067,310 |
Other Information |
All investments are categorized as Level 1 under the Fair Value Hierarchy. The inputs or methodology used for valuing securities may not be an indication of the risk associated with investing in those securities. For more information on valuation inputs, please refer to the Investment Valuation section in the accompanying Notes to Financial Statements. |
See accompanying notes which are an integral part of the financial statements.
Semiannual Report
Fidelity Freedom K® 2035 Fund
Statement of Assets and Liabilities
| September 30, 2013 (Unaudited) |
| | |
Assets | | |
Investment in securities, at value (cost $7,440,568,558) - See accompanying schedule | | $ 8,378,067,310 |
Receivable for investments sold | | 18,013,196 |
Receivable for fund shares sold | | 16,596,732 |
Total assets | | 8,412,677,238 |
| | |
Liabilities | | |
Payable for fund shares redeemed | $ 34,609,919 | |
Transfer agent fees payable | 346,032 | |
Total liabilities | | 34,955,951 |
| | |
Net Assets | | $ 8,377,721,287 |
Net Assets consist of: | | |
Paid in capital | | $ 7,322,967,475 |
Undistributed net investment income | | 33,291,573 |
Accumulated undistributed net realized gain (loss) on investments | | 83,963,487 |
Net unrealized appreciation (depreciation) on investments | | 937,498,752 |
Net Assets, for 545,471,336 shares outstanding | | $ 8,377,721,287 |
Net Asset Value, offering price and redemption price per share ($8,377,721,287 ÷ 545,471,336 shares) | | $ 15.36 |
Statement of Operations
Six months ended September 30, 2013 (Unaudited) |
| | |
Investment Income | | |
Income distributions from underlying funds | | $ 35,410,149 |
| | |
Expenses | | |
Transfer agent fees | $ 1,939,193 | |
Independent trustees' compensation | 14,324 | |
Total expenses | | 1,953,517 |
Net investment income (loss) | | 33,456,632 |
Realized and Unrealized Gain (Loss) Realized gain (loss) on sale of underlying fund shares | 37,634,149 | |
Capital gain distributions from underlying funds | 59,421,797 | |
Total net realized gain (loss) | | 97,055,946 |
Change in net unrealized appreciation (depreciation) on underlying funds | | 371,629,846 |
Net gain (loss) | | 468,685,792 |
Net increase (decrease) in net assets resulting from operations | | $ 502,142,424 |
See accompanying notes which are an integral part of the financial statements.
Semiannual Report
Fidelity Freedom K® 2035 Fund
Financial Statements - continued
Statement of Changes in Net Assets
| Six months ended September 30, 2013
(Unaudited) | Year ended
March 31,
2013 |
Increase (Decrease) in Net Assets | | |
Operations | | |
Net investment income (loss) | $ 33,456,632 | $ 110,661,777 |
Net realized gain (loss) | 97,055,946 | 195,486,050 |
Change in net unrealized appreciation (depreciation) | 371,629,846 | 332,298,561 |
Net increase (decrease) in net assets resulting from operations | 502,142,424 | 638,446,388 |
Distributions to shareholders from net investment income | (11,191,455) | (107,158,832) |
Distributions to shareholders from net realized gain | (164,310,585) | (89,768,174) |
Total distributions | (175,502,040) | (196,927,006) |
Share transactions
Proceeds from sales of shares | 1,411,715,675 | 2,960,649,419 |
Reinvestment of distributions | 175,502,040 | 196,927,006 |
Cost of shares redeemed | (865,380,836) | (1,052,885,544) |
Net increase (decrease) in net assets resulting from share transactions | 721,836,879 | 2,104,690,881 |
Total increase (decrease) in net assets | 1,048,477,263 | 2,546,210,263 |
| | |
Net Assets | | |
Beginning of period | 7,329,244,024 | 4,783,033,761 |
End of period (including undistributed net investment income of $33,291,573 and undistributed net investment income of $11,026,396, respectively) | $ 8,377,721,287 | $ 7,329,244,024 |
Other Information Shares | | |
Sold | 94,885,628 | 213,995,655 |
Issued in reinvestment of distributions | 11,890,382 | 14,476,142 |
Redeemed | (58,296,950) | (76,102,506) |
Net increase (decrease) | 48,479,060 | 152,369,291 |
Financial Highlights
| Six months ended September 30, 2013 | Years ended March 31, |
| (Unaudited) | 2013 | 2012 | 2011 | 2010 E |
Selected Per-Share Data | | | | | |
Net asset value, beginning of period | $ 14.75 | $ 13.88 | $ 14.46 | $ 12.78 | $ 10.00 |
Income from Investment Operations | | | | | |
Net investment income (loss) C | .06 | .26 | .24 | .23 | .15 |
Net realized and unrealized gain (loss) | .90 | 1.09 | (.17) | 1.76 | 2.74 |
Total from investment operations | .96 | 1.35 | .07 | 1.99 | 2.89 |
Distributions from net investment income | (.02) | (.24) | (.20) | (.18) | (.06) |
Distributions from net realized gain | (.32) | (.23) | (.45) | (.13) | (.05) |
Total distributions | (.35) H | (.48) G | (.65) | (.31) | (.11) |
Net asset value, end of period | $ 15.36 | $ 14.75 | $ 13.88 | $ 14.46 | $ 12.78 |
Total Return B | 6.57% | 10.01% | .78% | 15.76% | 28.94% |
Ratios to Average Net Assets D, F | | | | | |
Expenses before reductions | .05% A | .05% | .05% | .05% | .05% A |
Expenses net of fee waivers, if any | .05% A | .05% | .05% | .05% | .05% A |
Expenses net of all reductions | .05% A | .05% | .05% | .05% | .05% A |
Net investment income (loss) | .85% A | 1.90% | 1.81% | 1.75% | 1.72% A |
Supplemental Data | | | | | |
Net assets, end of period (000 omitted) | $ 8,377,721 | $ 7,329,244 | $ 4,783,034 | $ 2,321,903 | $ 632,052 |
Portfolio turnover rate D | 12% A | 26% | 17% | 37% | 19% A |
A Annualized
B Total returns for periods of less than one year are not annualized.
C Calculated based on average shares outstanding during the period.
D Amounts do not include the activity of the Underlying Funds.
E For the period July 2, 2009 (commencement of operations) to March 31, 2010
F Expense ratios reflect operating expenses of the Fund. Expenses before reductions do not reflect amounts reimbursed by the investment adviser or reductions from expense offset arrangements and do not represent the amount paid by the Fund during periods when reimbursements or reductions occur. Expense ratios before reductions for start-up periods may not be representative of longer term operating periods. Expenses net of fee waivers reflect expenses after reimbursement by the investment adviser but prior to reductions from expense offset arrangements. Expenses net of all reductions represent the net expenses paid by the Fund but do not include expenses of the investment companies in which the Fund invests.
G Total distributions of $.48 per share is comprised of distributions from net investment income of $.243 and distributions from net realized gain of $.232 per share.
H Total distributions of $.35 per share is comprised of distributions from net investment income of $.022 and distributions from net realized gain of $.323 per share.
See accompanying notes which are an integral part of the financial statements.
Semiannual Report
Fidelity Freedom K® 2040 Fund
Investment Changes (Unaudited)
The information in the following tables is based on the direct investments of the Fund. |
Fund Holdings as of September 30, 2013 |
| % of fund's
net assets | % of fund's net assets
6 months ago |
Commodity Funds | | |
Fidelity Series Commodity Strategy Fund Class F | 8.7 | 8.9 |
Domestic Equity Funds | | |
Fidelity Blue Chip Growth Fund Class F | 5.9 | 5.5 |
Fidelity Disciplined Equity Fund Class F | 0.0 | 1.2 |
Fidelity Growth Company Fund Class F | 7.4 | 7.5 |
Fidelity Series 100 Index Fund | 1.7 | 1.9 |
Fidelity Series All-Sector Equity Fund Class F | 7.8 | 8.0 |
Fidelity Series Equity-Income Fund Class F | 5.1 | 4.9 |
Fidelity Series Growth & Income Fund Class F (formerly Fidelity Series Mega Cap Fund Class F) | 2.1 | 1.8 |
Fidelity Series Intrinsic Opportunities Fund Class F | 3.9 | 2.9 |
Fidelity Series Large Cap Value Fund Class F | 4.1 | 4.9 |
Fidelity Series Opportunistic Insights Fund Class F | 4.0 | 3.6 |
Fidelity Series Real Estate Equity Fund Class F | 0.8 | 0.7 |
Fidelity Series Small Cap Opportunities Fund Class F | 2.1 | 2.1 |
Fidelity Series Stock Selector Large Cap Value Fund Class F | 4.6 | 4.9 |
Fidelity Small Cap Growth Fund Class F | 1.2 | 1.1 |
Fidelity Small Cap Value Fund Class F | 1.1 | 1.2 |
| 51.8 | 52.2 |
Developed International Equity Funds | | |
Fidelity Series International Growth Fund Class F | 8.0 | 7.8 |
Fidelity Series International Small Cap Fund Class F | 1.6 | 1.6 |
Fidelity Series International Value Fund Class F | 8.0 | 7.7 |
| 17.6 | 17.1 |
Emerging Markets Equity Funds | | |
Fidelity Series Emerging Markets Fund Class F | 5.0 | 4.7 |
High Yield Bond Funds | | |
Fidelity Series Emerging Markets Debt Fund Class F | 0.7 | 0.7 |
Fidelity Series Floating Rate High Income Fund Class F | 0.7 | 0.7 |
Fidelity Series High Income Fund Class F | 6.9 | 7.0 |
Fidelity Series Real Estate Income Fund Class F | 0.4 | 0.4 |
| 8.7 | 8.8 |
Investment Grade Bond Funds | | |
Fidelity Series Investment Grade Bond Fund Class F | 8.2 | 8.3 |
Net Other Assets (Liabilities)* | 0.0 | 0.0 |
| 100.0 | 100.0 |
* Amount represents less than 0.1% |
Asset Allocation (% of fund's net assets) |
Period end |
| Commodity Funds | 8.7% | |
| Domestic Equity Funds | 51.8% | |
| Developed International Equity Funds | 17.6% | |
| Emerging Markets Equity Funds | 5.0% | |
| High Yield Bond Funds | 8.7% | |
| Investment Grade Bond Funds | 8.2% | |

Six months ago |
| Commodity Funds | 8.9% | |
| Domestic Equity Funds | 52.2% | |
| Developed International Equity Funds | 17.1% | |
| Emerging Markets Equity Funds | 4.7% | |
| High Yield Bond Funds | 8.8% | |
| Investment Grade Bond Funds | 8.3% | |

Semiannual Report
Fidelity Freedom K® 2040 Fund
Investments September 30, 2013 (Unaudited)
Showing Percentage of Net Assets
Domestic Equity Funds - 60.5% |
| Shares | | Value |
Commodity Funds - 8.7% |
Fidelity Series Commodity Strategy Fund Class F (a)(b) | 100,144,052 | | $ 806,159,620 |
Domestic Equity Funds - 51.8% |
Fidelity Blue Chip Growth Fund Class F (b) | 9,256,801 | | 541,800,545 |
Fidelity Growth Company Fund Class F (b) | 5,717,060 | | 679,015,184 |
Fidelity Series 100 Index Fund (b) | 14,129,381 | | 156,553,539 |
Fidelity Series All-Sector Equity Fund Class F (b) | 50,253,229 | | 712,088,251 |
Fidelity Series Equity-Income Fund Class F (b) | 39,934,163 | | 470,823,777 |
Fidelity Series Growth & Income Fund Class F (b) | 15,969,664 | | 192,753,845 |
Fidelity Series Intrinsic Opportunities Fund Class F (b) | 27,705,689 | | 359,896,894 |
Fidelity Series Large Cap Value Fund Class F (b) | 29,504,814 | | 372,645,802 |
Fidelity Series Opportunistic Insights Fund Class F (b) | 28,739,441 | | 370,451,398 |
Fidelity Series Real Estate Equity Fund Class F (b) | 6,097,511 | | 72,926,229 |
Fidelity Series Small Cap Opportunities Fund Class F (b) | 15,044,781 | | 194,077,681 |
Fidelity Series Stock Selector Large Cap Value Fund Class F (b) | 34,953,421 | | 426,082,207 |
Fidelity Small Cap Growth Fund Class F (b) | 5,585,577 | | 105,399,836 |
Fidelity Small Cap Value Fund Class F (b) | 5,409,396 | | 102,940,815 |
TOTAL DOMESTIC EQUITY FUNDS | | 4,757,456,003 |
TOTAL DOMESTIC EQUITY FUNDS (Cost $4,795,212,014) |
5,563,615,623
|
International Equity Funds - 22.6% |
| | | |
Developed International Equity Funds - 17.6% |
Fidelity Series International Growth Fund Class F (b) | 53,739,762 | | 731,398,161 |
Fidelity Series International Small Cap Fund Class F (b) | 9,895,558 | | 151,698,902 |
Fidelity Series International Value Fund Class F (b) | 68,038,352 | | 733,453,430 |
TOTAL DEVELOPED INTERNATIONAL EQUITY FUNDS | | 1,616,550,493 |
|
| Shares | | Value |
Emerging Markets Equity Funds - 5.0% |
Fidelity Series Emerging Markets Fund Class F (b) | 27,185,762 | | $ 456,448,942 |
TOTAL INTERNATIONAL EQUITY FUNDS (Cost $1,763,955,228) |
2,072,999,435
|
Bond Funds - 16.9% |
| | | |
High Yield Bond Funds - 8.7% |
Fidelity Series Emerging Markets Debt Fund Class F (b) | 6,430,773 | | 65,079,421 |
Fidelity Series Floating Rate High Income Fund Class F (b) | 6,189,296 | | 65,482,751 |
Fidelity Series High Income Fund Class F (b) | 60,986,377 | | 626,939,953 |
Fidelity Series Real Estate Income Fund Class F (b) | 3,364,209 | | 36,939,020 |
TOTAL HIGH YIELD BOND FUNDS | | 794,441,145 |
Investment Grade Bond Funds - 8.2% |
Fidelity Series Investment Grade Bond Fund Class F (b) | 67,443,034 | | 755,361,980 |
TOTAL BOND FUNDS (Cost $1,557,729,294) |
1,549,803,125
|
TOTAL INVESTMENT PORTFOLIO - 100.0% (Cost $8,116,896,536) | | 9,186,418,183 |
NET OTHER ASSETS (LIABILITIES) - 0.0% | | (379,627) |
NET ASSETS - 100% | $ 9,186,038,556 |
Legend |
(a) Non-income producing |
(b) Affiliated company |
Affiliated Underlying Funds |
Information regarding the Fund's fiscal year to date purchases and sales of the affiliated Underlying Funds and income earned by the Fund from investments in affiliated Underlying Funds is as follows: |
Affiliate | Value,
beginning of
period | Purchases | Sales
Proceeds | Dividend
Income | Value,
end of
period |
Fidelity Blue Chip Growth Fund Class F | $ 448,403,754 | $ 62,922,465 | $ 12,221,406 | $ 1,829,727 | $ 541,800,545 |
Fidelity Disciplined Equity Fund Class F | 97,971,049 | 830,283 | 103,637,232 | - | - |
Fidelity Growth Company Fund Class F | 618,160,833 | 39,538,340 | 81,735,657 | - | 679,015,184 |
Fidelity Series 100 Index Fund | 152,710,597 | 9,900,293 | 17,171,382 | - | 156,553,539 |
Fidelity Series All-Sector Equity Fund Class F | 658,822,164 | 41,805,339 | 56,367,493 | - | 712,088,251 |
Fidelity Series Commodity Strategy Fund Class F | 735,852,317 | 145,539,834 | 15,387,438 | - | 806,159,620 |
Fidelity Series Emerging Markets Debt Fund Class F | 59,502,957 | 11,106,822 | 829,833 | 1,696,084 | 65,079,421 |
Fidelity Series Emerging Markets Fund Class F | 387,556,934 | 72,325,102 | 5,670,923 | - | 456,448,942 |
Fidelity Series Equity-Income Fund Class F | 401,068,775 | 55,360,514 | 10,904,508 | 4,636,340 | 470,823,777 |
Fidelity Series Floating Rate High Income Fund Class F | 56,448,298 | 10,206,030 | 838,354 | 1,383,839 | 65,482,751 |
Fidelity Series Growth & Income Fund Class F (formerly Fidelity Series Mega Cap Fund Class F) | 146,710,372 | 33,975,044 | 2,484,444 | - | 192,753,845 |
Fidelity Series High Income Fund Class F | 574,593,348 | 78,295,313 | 12,408,625 | 16,089,067 | 626,939,953 |
Fidelity Series International Growth Fund Class F | 638,637,618 | 56,391,735 | 13,387,670 | - | 731,398,161 |
Fidelity Series International Small Cap Fund Class F | 129,324,708 | 9,734,600 | 2,715,776 | - | 151,698,902 |
Fidelity Series International Value Fund Class F | 633,729,325 | 50,731,985 | 13,409,171 | - | 733,453,430 |
Fidelity Series Intrinsic Opportunities Fund Class F | 235,273,091 | 89,832,483 | 5,905,286 | 2,389,831 | 359,896,894 |
Fidelity Series Investment Grade Bond Fund Class F | 678,043,519 | 121,763,302 | 22,836,076 | 7,871,140 | 755,361,980 |
Fidelity Series Large Cap Value Fund Class F | 401,880,827 | 21,605,141 | 84,309,017 | - | 372,645,802 |
Fidelity Series Opportunistic Insights Fund Class F | 293,159,852 | 30,218,457 | 5,657,289 | - | 370,451,398 |
Fidelity Series Real Estate Equity Fund Class F | 55,218,701 | 24,908,694 | 973,945 | 533,425 | 72,926,229 |
Fidelity Series Real Estate Income Fund Class F | 33,209,173 | 6,397,048 | 470,987 | 1,097,292 | 36,939,020 |
Fidelity Series Small Cap Opportunities Fund Class F | 171,771,572 | 26,180,478 | 11,383,185 | - | 194,077,681 |
Fidelity Series Stock Selector Large Cap Value Fund Class F | 404,871,081 | 27,600,975 | 42,243,472 | - | 426,082,207 |
Fidelity Small Cap Growth Fund Class F | 95,162,312 | 16,999,430 | 10,402,283 | - | 105,399,836 |
Fidelity Small Cap Value Fund Class F | 102,447,957 | 12,741,039 | 13,214,274 | 282,248 | 102,940,815 |
Total | $ 8,210,531,134 | $ 1,056,910,746 | $ 546,565,726 | $ 37,808,993 | $ 9,186,418,183 |
Other Information |
All investments are categorized as Level 1 under the Fair Value Hierarchy. The inputs or methodology used for valuing securities may not be an indication of the risk associated with investing in those securities. For more information on valuation inputs, please refer to the Investment Valuation section in the accompanying Notes to Financial Statements. |
See accompanying notes which are an integral part of the financial statements.
Semiannual Report
Fidelity Freedom K® 2040 Fund
Statement of Assets and Liabilities
| September 30, 2013 (Unaudited) |
| | |
Assets | | |
Investment in securities, at value (cost $8,116,896,536) - See accompanying schedule | | $ 9,186,418,183 |
Cash | | 1 |
Receivable for investments sold | | 12,058,259 |
Receivable for fund shares sold | | 18,184,703 |
Total assets | | 9,216,661,146 |
| | |
Liabilities | | |
Payable for fund shares redeemed | $ 30,242,951 | |
Transfer agent fees payable | 379,639 | |
Total liabilities | | 30,622,590 |
| | |
Net Assets | | $ 9,186,038,556 |
Net Assets consist of: | | |
Paid in capital | | $ 7,989,910,988 |
Undistributed net investment income | | 35,456,984 |
Accumulated undistributed net realized gain (loss) on investments | | 91,148,937 |
Net unrealized appreciation (depreciation) on investments | | 1,069,521,647 |
Net Assets, for 595,307,688 shares outstanding | | $ 9,186,038,556 |
Net Asset Value, offering price and redemption price per share ($9,186,038,556 ÷ 595,307,688 shares) | | $ 15.43 |
Statement of Operations
Six months ended September 30, 2013 (Unaudited) |
| | |
Investment Income | | |
Income distributions from underlying funds | | $ 37,808,993 |
| | |
Expenses | | |
Transfer agent fees | $ 2,147,527 | |
Independent trustees' compensation | 15,921 | |
Total expenses | | 2,163,448 |
Net investment income (loss) | | 35,645,545 |
Realized and Unrealized Gain (Loss) Realized gain (loss) on sale of underlying fund shares | 42,784,084 | |
Capital gain distributions from underlying funds | 66,720,610 | |
Total net realized gain (loss) | | 109,504,694 |
Change in net unrealized appreciation (depreciation) on underlying funds | | 422,757,946 |
Net gain (loss) | | 532,262,640 |
Net increase (decrease) in net assets resulting from operations | | $ 567,908,185 |
See accompanying notes which are an integral part of the financial statements.
Semiannual Report
Statement of Changes in Net Assets
| Six months ended September 30, 2013
(Unaudited) | Year ended
March 31,
2013 |
Increase (Decrease) in Net Assets | | |
Operations | | |
Net investment income (loss) | $ 35,645,545 | $ 125,505,409 |
Net realized gain (loss) | 109,504,694 | 222,961,042 |
Change in net unrealized appreciation (depreciation) | 422,757,946 | 370,796,035 |
Net increase (decrease) in net assets resulting from operations | 567,908,185 | 719,262,486 |
Distributions to shareholders from net investment income | (12,426,918) | (121,755,541) |
Distributions to shareholders from net realized gain | (188,663,267) | (104,692,158) |
Total distributions | (201,090,185) | (226,447,699) |
Share transactions
Proceeds from sales of shares | 1,443,768,548 | 3,194,396,979 |
Reinvestment of distributions | 201,090,185 | 226,447,699 |
Cost of shares redeemed | (1,035,833,681) | (1,313,097,134) |
Net increase (decrease) in net assets resulting from share transactions | 609,025,052 | 2,107,747,544 |
Total increase (decrease) in net assets | 975,843,052 | 2,600,562,331 |
| | |
Net Assets | | |
Beginning of period | 8,210,195,504 | 5,609,633,173 |
End of period (including undistributed net investment income of $35,456,984 and undistributed net investment income of $12,238,357, respectively) | $ 9,186,038,556 | $ 8,210,195,504 |
Other Information Shares | | |
Sold | 96,656,512 | 230,116,813 |
Issued in reinvestment of distributions | 13,578,000 | 16,605,081 |
Redeemed | (69,564,288) | (94,807,866) |
Net increase (decrease) | 40,670,224 | 151,914,028 |
Financial Highlights
| Six months ended September 30, 2013 | Years ended March 31, |
| (Unaudited) | 2013 | 2012 | 2011 | 2010 E |
Selected Per-Share Data | | | | | |
Net asset value, beginning of period | $ 14.80 | $ 13.93 | $ 14.55 | $ 12.85 | $ 10.00 |
Income from Investment Operations | | | | | |
Net investment income (loss) C | .06 | .26 | .24 | .24 | .15 |
Net realized and unrealized gain (loss) | .93 | 1.09 | (.19) | 1.77 | 2.81 |
Total from investment operations | .99 | 1.35 | .05 | 2.01 | 2.96 |
Distributions from net investment income | (.02) | (.25) | (.20) | (.18) | (.07) |
Distributions from net realized gain | (.33) | (.24) | (.47) | (.13) | (.05) |
Total distributions | (.36) I | (.48) H | (.67) | (.31) | (.11) G |
Net asset value, end of period | $ 15.43 | $ 14.80 | $ 13.93 | $ 14.55 | $ 12.85 |
Total Return B | 6.76% | 10.04% | .67% | 15.81% | 29.64% |
Ratios to Average Net Assets D, F | | | | | |
Expenses before reductions | .05% A | .05% | .05% | .05% | .05% A |
Expenses net of fee waivers, if any | .05% A | .05% | .05% | .05% | .05% A |
Expenses net of all reductions | .05% A | .05% | .05% | .05% | .05% A |
Net investment income (loss) | .82% A | 1.90% | 1.82% | 1.79% | 1.70% A |
Supplemental Data | | | | | |
Net assets, end of period (000 omitted) | $ 9,186,039 | $ 8,210,196 | $ 5,609,633 | $ 2,881,829 | $ 749,360 |
Portfolio turnover rate D | 13% A | 27% | 18% | 38% | 19% A |
A Annualized
B Total returns for periods of less than one year are not annualized.
C Calculated based on average shares outstanding during the period.
D Amounts do not include the activity of the Underlying Funds.
E For the period July 2, 2009 (commencement of operations) to March 31, 2010.
F Expense ratios reflect operating expenses of the Fund. Expenses before reductions do not reflect amounts reimbursed by the investment adviser or reductions from expense offset arrangements and do not represent the amount paid by the Fund during periods when reimbursements or reductions occur. Expenses net of fee waivers reflect expenses after reimbursement by the investment adviser but prior to reductions from expense offset arrangements. Expenses net of all reductions represent the net expenses paid by the Fund but do not include expenses of the investment companies in which the Fund invests.
G Total distributions of $.11 per share is comprised of distributions from net investment income of $.065 and distributions from net realized gain of $.045 per share.
H Total distributions of $.48 per share is comprised of distributions from net investment income of $.245 and distributions from net realized gain of $.237 per share.
I Total distributions of $.36 per share is comprised of distributions from net investment income of $.022 and distributions from net realized gain of $.334 per share.
See accompanying notes which are an integral part of the financial statements.
Semiannual Report
Fidelity Freedom K® 2045 Fund
Investment Changes (Unaudited)
The information in the following tables is based on the direct investments of the Fund. |
Fund Holdings as of September 30, 2013 |
| % of fund's
net assets | % of fund's net assets
6 months ago |
Commodity Funds | | |
Fidelity Series Commodity Strategy Fund Class F | 9.0 | 9.2 |
Domestic Equity Funds | | |
Fidelity Blue Chip Growth Fund Class F | 6.1 | 5.6 |
Fidelity Disciplined Equity Fund Class F | 0.0 | 1.2 |
Fidelity Growth Company Fund Class F | 7.6 | 7.8 |
Fidelity Series 100 Index Fund | 1.7 | 1.9 |
Fidelity Series All-Sector Equity Fund Class F | 7.9 | 8.3 |
Fidelity Series Equity-Income Fund Class F | 5.2 | 4.9 |
Fidelity Series Growth & Income Fund Class F (formerly Fidelity Series Mega Cap Fund Class F) | 2.2 | 1.8 |
Fidelity Series Intrinsic Opportunities Fund Class F | 4.0 | 2.9 |
Fidelity Series Large Cap Value Fund Class F | 4.2 | 5.0 |
Fidelity Series Opportunistic Insights Fund Class F | 4.1 | 3.6 |
Fidelity Series Real Estate Equity Fund Class F | 0.8 | 0.7 |
Fidelity Series Small Cap Opportunities Fund Class F | 2.2 | 2.2 |
Fidelity Series Stock Selector Large Cap Value Fund Class F | 4.7 | 5.0 |
Fidelity Small Cap Growth Fund Class F | 1.2 | 1.2 |
Fidelity Small Cap Value Fund Class F | 1.1 | 1.3 |
| 53.0 | 53.4 |
Developed International Equity Funds | | |
Fidelity Series International Growth Fund Class F | 8.1 | 8.0 |
Fidelity Series International Small Cap Fund Class F | 1.7 | 1.6 |
Fidelity Series International Value Fund Class F | 8.2 | 8.0 |
| 18.0 | 17.6 |
Emerging Markets Equity Funds | | |
Fidelity Series Emerging Markets Fund Class F | 5.1 | 4.9 |
High Yield Bond Funds | | |
Fidelity Series Emerging Markets Debt Fund Class F | 0.7 | 0.7 |
Fidelity Series Floating Rate High Income Fund Class F | 0.4 | 0.3 |
Fidelity Series High Income Fund Class F | 8.8 | 9.1 |
Fidelity Series Real Estate Income Fund Class F | 0.4 | 0.3 |
| 10.3 | 10.4 |
Investment Grade Bond Funds | | |
Fidelity Series Investment Grade Bond Fund Class F | 4.6 | 4.5 |
Net Other Assets (Liabilities)* | 0.0 | 0.0 |
| 100.0 | 100.0 |
* Amount represents less than 0.1% |
Asset Allocation (% of fund's net assets) |
Period end |
| Commodity Funds | 9.0% | |
| Domestic Equity Funds | 53.0% | |
| Developed International Equity Funds | 18.0% | |
| Emerging Markets Equity Funds | 5.1% | |
| High Yield Bond Funds | 10.3% | |
| Investment Grade Bond Funds | 4.6% | |

Six months ago |
| Commodity Funds | 9.2% | |
| Domestic Equity Funds | 53.4% | |
| Developed International Equity Funds | 17.6% | |
| Emerging Markets Equity Funds | 4.9% | |
| High Yield Bond Funds | 10.4% | |
| Investment Grade Bond Funds | 4.5% | |

Semiannual Report
Fidelity Freedom K® 2045 Fund
Investments September 30, 2013 (Unaudited)
Showing Percentage of Net Assets
Domestic Equity Funds - 62.0% |
| Shares | | Value |
Commodity Funds - 9.0% |
Fidelity Series Commodity Strategy Fund Class F (a)(b) | 50,298,103 | | $ 404,899,730 |
Domestic Equity Funds - 53.0% |
Fidelity Blue Chip Growth Fund Class F (b) | 4,657,318 | | 272,592,837 |
Fidelity Growth Company Fund Class F (b) | 2,870,771 | | 340,961,447 |
Fidelity Series 100 Index Fund (b) | 7,104,567 | | 78,718,603 |
Fidelity Series All-Sector Equity Fund Class F (b) | 25,087,848 | | 355,494,801 |
Fidelity Series Equity-Income Fund Class F (b) | 20,016,071 | | 235,989,474 |
Fidelity Series Growth & Income Fund Class F (b) | 8,089,219 | | 97,636,877 |
Fidelity Series Intrinsic Opportunities Fund Class F (b) | 13,827,179 | | 179,615,052 |
Fidelity Series Large Cap Value Fund Class F (b) | 14,793,810 | | 186,845,823 |
Fidelity Series Opportunistic Insights Fund Class F (b) | 14,263,194 | | 183,852,565 |
Fidelity Series Real Estate Equity Fund Class F (b) | 3,055,848 | | 36,547,944 |
Fidelity Series Small Cap Opportunities Fund Class F (b) | 7,554,212 | | 97,449,333 |
Fidelity Series Stock Selector Large Cap Value Fund Class F (b) | 17,327,819 | | 211,226,114 |
Fidelity Small Cap Growth Fund Class F (b) | 2,777,879 | | 52,418,577 |
Fidelity Small Cap Value Fund Class F (b) | 2,696,091 | | 51,306,619 |
TOTAL DOMESTIC EQUITY FUNDS | | 2,380,656,066 |
TOTAL DOMESTIC EQUITY FUNDS (Cost $2,430,135,108) |
2,785,555,796
|
International Equity Funds - 23.1% |
| | | |
Developed International Equity Funds - 18.0% |
Fidelity Series International Growth Fund Class F (b) | 26,908,325 | | 366,222,297 |
Fidelity Series International Small Cap Fund Class F (b) | 4,979,164 | | 76,330,580 |
Fidelity Series International Value Fund Class F (b) | 34,048,066 | | 367,038,148 |
TOTAL DEVELOPED INTERNATIONAL EQUITY FUNDS | | 809,591,025 |
|
| Shares | | Value |
Emerging Markets Equity Funds - 5.1% |
Fidelity Series Emerging Markets Fund Class F (b) | 13,624,404 | | $ 228,753,744 |
TOTAL INTERNATIONAL EQUITY FUNDS (Cost $892,455,318) |
1,038,344,769
|
Bond Funds - 14.9% |
| | | |
High Yield Bond Funds - 10.3% |
Fidelity Series Emerging Markets Debt Fund Class F (b) | 3,049,606 | | 30,862,008 |
Fidelity Series Floating Rate High Income Fund Class F (b) | 1,544,910 | | 16,345,150 |
Fidelity Series High Income Fund Class F (b) | 38,605,575 | | 396,865,309 |
Fidelity Series Real Estate Income Fund Class F (b) | 1,438,388 | | 15,793,503 |
TOTAL HIGH YIELD BOND FUNDS | | 459,865,970 |
Investment Grade Bond Funds - 4.6% |
Fidelity Series Investment Grade Bond Fund Class F (b) | 18,449,419 | | 206,633,493 |
TOTAL BOND FUNDS (Cost $663,966,046) |
666,499,463
|
TOTAL INVESTMENT PORTFOLIO - 100.0% (Cost $3,986,556,472) | | 4,490,400,028 |
NET OTHER ASSETS (LIABILITIES) - 0.0% | | (185,073) |
NET ASSETS - 100% | $ 4,490,214,955 |
Legend |
(a) Non-income producing |
(b) Affiliated company |
Affiliated Underlying Funds |
Information regarding the Fund's fiscal year to date purchases and sales of the affiliated Underlying Funds and income earned by the Fund from investments in affiliated Underlying Funds is as follows: |
Affiliate | Value,
beginning of
period | Purchases | Sales
Proceeds | Dividend
Income | Value,
end of
period |
Fidelity Blue Chip Growth Fund Class F | $ 215,336,932 | $ 40,313,506 | $ 3,973,903 | $ 916,616 | $ 272,592,837 |
Fidelity Disciplined Equity Fund Class F | 46,996,225 | 626,364 | 49,917,557 | - | - |
Fidelity Growth Company Fund Class F | 296,312,250 | 30,526,104 | 36,737,497 | - | 340,961,447 |
Fidelity Series 100 Index Fund | 73,092,900 | 7,603,482 | 7,413,800 | - | 78,718,603 |
Fidelity Series All-Sector Equity Fund Class F | 315,682,810 | 31,915,510 | 25,512,781 | - | 355,494,801 |
Fidelity Series Commodity Strategy Fund Class F | 351,013,285 | 88,266,684 | 5,314,624 | - | 404,899,730 |
Fidelity Series Emerging Markets Debt Fund Class F | 27,249,057 | 5,985,749 | 216,520 | 786,475 | 30,862,008 |
Fidelity Series Emerging Markets Fund Class F | 186,479,953 | 42,424,675 | 1,534,964 | - | 228,753,744 |
Fidelity Series Equity-Income Fund Class F | 187,765,506 | 39,799,237 | 3,684,176 | 2,222,481 | 235,989,474 |
Fidelity Series Floating Rate High Income Fund Class F | 12,529,991 | 4,008,249 | 111,695 | 329,089 | 16,345,150 |
Fidelity Series Growth & Income Fund Class F (formerly Fidelity Series Mega Cap Fund Class F) | 68,657,819 | 22,650,850 | 663,977 | - | 97,636,877 |
Fidelity Series High Income Fund Class F | 345,564,155 | 65,995,729 | 6,275,346 | 9,973,034 | 396,865,309 |
Fidelity Series International Growth Fund Class F | 305,709,775 | 40,278,728 | 4,463,181 | - | 366,222,297 |
Fidelity Series International Small Cap Fund Class F | 62,296,415 | 7,319,049 | 908,479 | - | 76,330,580 |
Fidelity Series International Value Fund Class F | 304,345,181 | 36,415,359 | 4,471,699 | - | 367,038,148 |
Fidelity Series Intrinsic Opportunities Fund Class F | 110,278,545 | 51,446,138 | 1,731,582 | 1,189,670 | 179,615,052 |
Fidelity Series Investment Grade Bond Fund Class F | 170,479,657 | 47,973,682 | 6,234,159 | 2,063,672 | 206,633,493 |
Fidelity Series Large Cap Value Fund Class F | 191,402,042 | 16,395,941 | 37,280,421 | - | 186,845,823 |
Fidelity Series Opportunistic Insights Fund Class F | 137,293,423 | 22,334,971 | 1,480,012 | - | 183,852,565 |
Fidelity Series Real Estate Equity Fund Class F | 26,732,998 | 13,196,814 | 258,447 | 265,636 | 36,547,944 |
Fidelity Series Real Estate Income Fund Class F | 13,258,198 | 3,554,941 | 106,267 | 454,906 | 15,793,503 |
Fidelity Series Small Cap Opportunities Fund Class F | 82,322,283 | 16,489,151 | 5,010,581 | - | 97,449,333 |
Fidelity Series Stock Selector Large Cap Value Fund Class F | 189,619,093 | 21,139,434 | 16,761,455 | - | 211,226,114 |
Fidelity Small Cap Growth Fund Class F | 45,311,128 | 9,869,858 | 4,509,091 | - | 52,418,577 |
Fidelity Small Cap Value Fund Class F | 48,660,513 | 7,884,755 | 5,693,588 | 140,541 | 51,306,619 |
Total | $ 3,814,390,134 | $ 674,414,960 | $ 230,265,802 | $ 18,342,120 | $ 4,490,400,028 |
Other Information |
All investments are categorized as Level 1 under the Fair Value Hierarchy. The inputs or methodology used for valuing securities may not be an indication of the risk associated with investing in those securities. For more information on valuation inputs, please refer to the Investment Valuation section in the accompanying Notes to Financial Statements. |
See accompanying notes which are an integral part of the financial statements.
Semiannual Report
Fidelity Freedom K® 2045 Fund
Statement of Assets and Liabilities
| September 30, 2013 (Unaudited) |
| | |
Assets | | |
Investment in securities, at value (cost $3,986,556,472) - See accompanying schedule | | $ 4,490,400,028 |
Receivable for investments sold | | 982,520 |
Receivable for fund shares sold | | 13,423,500 |
Total assets | | 4,504,806,048 |
| | |
Liabilities | | |
Payable for fund shares redeemed | $ 14,406,014 | |
Transfer agent fees payable | 185,079 | |
Total liabilities | | 14,591,093 |
| | |
Net Assets | | $ 4,490,214,955 |
Net Assets consist of: | | |
Paid in capital | | $ 3,925,738,534 |
Undistributed net investment income | | 17,227,634 |
Accumulated undistributed net realized gain (loss) on investments | | 43,405,231 |
Net unrealized appreciation (depreciation) on investments | | 503,843,556 |
Net Assets, for 285,448,277 shares outstanding | | $ 4,490,214,955 |
Net Asset Value, offering price and redemption price per share ($4,490,214,955 ÷ 285,448,277 shares) | | $ 15.73 |
Statement of Operations
Six months ended September 30, 2013 (Unaudited) |
| | |
Investment Income | | |
Income distributions from underlying funds | | $ 18,342,120 |
| | |
Expenses | | |
Transfer agent fees | $ 1,026,514 | |
Independent trustees' compensation | 7,537 | |
Total expenses | | 1,034,051 |
Net investment income (loss) | | 17,308,069 |
Realized and Unrealized Gain (Loss) Realized gain (loss) on sale of underlying fund shares | 15,931,874 | |
Capital gain distributions from underlying funds | 33,276,451 | |
Total net realized gain (loss) | | 49,208,325 |
Change in net unrealized appreciation (depreciation) on underlying funds | | 215,928,862 |
Net gain (loss) | | 265,137,187 |
Net increase (decrease) in net assets resulting from operations | | $ 282,445,256 |
See accompanying notes which are an integral part of the financial statements.
Semiannual Report
Fidelity Freedom K® 2045 Fund
Financial Statements - continued
Statement of Changes in Net Assets
| Six months ended September 30, 2013 (Unaudited) | Year ended
March 31,
2013 |
Increase (Decrease) in Net Assets | | |
Operations | | |
Net investment income (loss) | $ 17,308,069 | $ 56,464,776 |
Net realized gain (loss) | 49,208,325 | 90,117,648 |
Change in net unrealized appreciation (depreciation) | 215,928,862 | 188,323,806 |
Net increase (decrease) in net assets resulting from operations | 282,445,256 | 334,906,230 |
Distributions to shareholders from net investment income | (5,761,733) | (54,226,677) |
Distributions to shareholders from net realized gain | (80,603,752) | (36,755,954) |
Total distributions | (86,365,485) | (90,982,631) |
Share transactions
Proceeds from sales of shares | 883,490,945 | 1,784,217,328 |
Reinvestment of distributions | 86,365,485 | 90,982,631 |
Cost of shares redeemed | (489,956,820) | (559,701,128) |
Net increase (decrease) in net assets resulting from share transactions | 479,899,610 | 1,315,498,831 |
Total increase (decrease) in net assets | 675,979,381 | 1,559,422,430 |
| | |
Net Assets | | |
Beginning of period | 3,814,235,574 | 2,254,813,144 |
End of period (including undistributed net investment income of $17,227,634 and undistributed net investment income of $5,681,298, respectively) | $ 4,490,214,955 | $ 3,814,235,574 |
Other Information Shares | | |
Sold | 58,110,551 | 126,875,232 |
Issued in reinvestment of distributions | 5,730,983 | 6,590,465 |
Redeemed | (32,286,518) | (39,824,450) |
Net increase (decrease) | 31,555,016 | 93,641,247 |
Financial Highlights
| Six months ended September 30, 2013 | Years ended March 31, |
| (Unaudited) | 2013 | 2012 | 2011 | 2010 E |
Selected Per-Share Data | | | | | |
Net asset value, beginning of period | $ 15.02 | $ 14.07 | $ 14.68 | $ 12.91 | $ 10.00 |
Income from Investment Operations | | | | | |
Net investment income (loss) C | .06 | .28 | .25 | .25 | .14 |
Net realized and unrealized gain (loss) | .98 | 1.12 | (.22) | 1.81 | 2.86 |
Total from investment operations | 1.04 | 1.40 | .03 | 2.06 | 3.00 |
Distributions from net investment income | (.02) | (.25) | (.20) | (.18) | (.06) |
Distributions from net realized gain | (.31) | (.20) | (.44) | (.11) | (.04) |
Total distributions | (.33) | (.45) | (.64) | (.29) | (.09) G |
Net asset value, end of period | $ 15.73 | $ 15.02 | $ 14.07 | $ 14.68 | $ 12.91 |
Total Return B | 7.02% | 10.27% | .45% | 16.12% | 30.03% |
Ratios to Average Net Assets D, F | | | | | |
Expenses before reductions | .05% A | .05% | .05% | .05% | .05% A |
Expenses net of fee waivers, if any | .05% A | .05% | .05% | .05% | .05% A |
Expenses net of all reductions | .05% A | .05% | .05% | .05% | .05% A |
Net investment income (loss) | .83% A | 1.96% | 1.85% | 1.83% | 1.55% A |
Supplemental Data | | | | | |
Net assets, end of period (000 omitted) | $ 4,490,215 | $ 3,814,236 | $ 2,254,813 | $ 927,418 | $ 175,992 |
Portfolio turnover rate D | 11% A | 27% | 14% | 39% | 20% A |
A Annualized
B Total returns for periods of less than one year are not annualized.
C Calculated based on average shares outstanding during the period.
D Amounts do not include the activity of the Underlying Funds.
E For the period July 2, 2009 (commencement of operations) to March 31, 2010.
F Expense ratios reflect operating expenses of the Fund. Expenses before reductions do not reflect amounts reimbursed by the investment adviser or reductions from expense offset arrangements and do not represent the amount paid by the Fund during periods when reimbursements or reductions occur. Expenses net of fee waivers reflect expenses after reimbursement by the investment adviser but prior to reductions from expense offset arrangements. Expenses net of all reductions represent the net expenses paid by the Fund but do not include expenses of the investment companies in which the Fund invests.
G Total distributions of $.09 per share is comprised of distributions from net investment income of $.055 and distributions from net realized gain of $.035 per share.
See accompanying notes which are an integral part of the financial statements.
Semiannual Report
Fidelity Freedom K® 2050 Fund
Investment Changes (Unaudited)
The information in the following tables is based on the direct investments of the Fund. |
Fund Holdings as of September 30, 2013 |
| % of fund's
net assets | % of fund's net assets
6 months ago |
Commodity Funds | | |
Fidelity Series Commodity Strategy Fund Class F | 9.1 | 9.4 |
Domestic Equity Funds | | |
Fidelity Blue Chip Growth Fund Class F | 6.1 | 5.7 |
Fidelity Disciplined Equity Fund Class F | 0.0 | 1.2 |
Fidelity Growth Company Fund Class F | 7.6 | 7.8 |
Fidelity Series 100 Index Fund | 1.8 | 1.9 |
Fidelity Series All-Sector Equity Fund Class F | 8.0 | 8.4 |
Fidelity Series Equity-Income Fund Class F | 5.3 | 5.0 |
Fidelity Series Growth & Income Fund Class F (formerly Fidelity Series Mega Cap Fund Class F) | 2.2 | 1.8 |
Fidelity Series Intrinsic Opportunities Fund Class F | 4.0 | 2.9 |
Fidelity Series Large Cap Value Fund Class F | 4.2 | 5.1 |
Fidelity Series Opportunistic Insights Fund Class F | 4.1 | 3.7 |
Fidelity Series Real Estate Equity Fund Class F | 0.8 | 0.7 |
Fidelity Series Small Cap Opportunities Fund Class F | 2.2 | 2.2 |
Fidelity Series Stock Selector Large Cap Value Fund Class F | 4.8 | 5.1 |
Fidelity Small Cap Growth Fund Class F | 1.2 | 1.2 |
Fidelity Small Cap Value Fund Class F | 1.1 | 1.3 |
| 53.4 | 54.0 |
Developed International Equity Funds | | |
Fidelity Series International Growth Fund Class F | 8.2 | 8.1 |
Fidelity Series International Small Cap Fund Class F | 1.7 | 1.6 |
Fidelity Series International Value Fund Class F | 8.2 | 8.0 |
| 18.1 | 17.7 |
Emerging Markets Equity Funds | | |
Fidelity Series Emerging Markets Fund Class F | 5.2 | 5.0 |
High Yield Bond Funds | | |
Fidelity Series Emerging Markets Debt Fund Class F | 0.7 | 0.7 |
Fidelity Series Floating Rate High Income Fund Class F | 0.1 | 0.1 |
Fidelity Series High Income Fund Class F | 9.1 | 9.3 |
Fidelity Series Real Estate Income Fund Class F | 0.3 | 0.3 |
| 10.2 | 10.4 |
Investment Grade Bond Funds | | |
Fidelity Series Investment Grade Bond Fund Class F | 4.0 | 3.5 |
Net Other Assets (Liabilities)* | 0.0 | 0.0 |
| 100.0 | 100.0 |
* Amount represents less than 0.1% |
Asset Allocation (% of fund's net assets) |
Period end |
| Commodity Funds | 9.1% | |
| Domestic Equity Funds | 53.4% | |
| Developed International Equity Funds | 18.1% | |
| Emerging Markets Equity Funds | 5.2% | |
| High Yield Bond Funds | 10.2% | |
| Investment Grade Bond Funds | 4.0% | |

Six months ago |
| Commodity Funds | 9.4% | |
| Domestic Equity Funds | 54.0% | |
| Developed International Equity Funds | 17.7% | |
| Emerging Markets Equity Funds | 5.0% | |
| High Yield Bond Funds | 10.4% | |
| Investment Grade Bond Funds | 3.5% | |

Semiannual Report
Fidelity Freedom K® 2050 Fund
Investments September 30, 2013 (Unaudited)
Showing Percentage of Net Assets
Domestic Equity Funds - 62.5% |
| Shares | | Value |
Commodity Funds - 9.1% |
Fidelity Series Commodity Strategy Fund Class F (a)(b) | 39,386,023 | | $ 317,057,488 |
Domestic Equity Funds - 53.4% |
Fidelity Blue Chip Growth Fund Class F (b) | 3,643,830 | | 213,273,350 |
Fidelity Growth Company Fund Class F (b) | 2,240,947 | | 266,157,263 |
Fidelity Series 100 Index Fund (b) | 5,546,399 | | 61,454,096 |
Fidelity Series All-Sector Equity Fund Class F (b) | 19,780,249 | | 280,286,130 |
Fidelity Series Equity-Income Fund Class F (b) | 15,593,853 | | 183,851,532 |
Fidelity Series Growth & Income Fund Class F (b) | 6,209,508 | | 74,948,757 |
Fidelity Series Intrinsic Opportunities Fund Class F (b) | 10,815,384 | | 140,491,845 |
Fidelity Series Large Cap Value Fund Class F (b) | 11,646,479 | | 147,095,034 |
Fidelity Series Opportunistic Insights Fund Class F (b) | 11,193,609 | | 144,285,614 |
Fidelity Series Real Estate Equity Fund Class F (b) | 2,392,329 | | 28,612,259 |
Fidelity Series Small Cap Opportunities Fund Class F (b) | 5,919,149 | | 76,357,027 |
Fidelity Series Stock Selector Large Cap Value Fund Class F (b) | 13,558,842 | | 165,282,289 |
Fidelity Small Cap Growth Fund Class F (b) | 2,150,814 | | 40,585,866 |
Fidelity Small Cap Value Fund Class F (b) | 2,085,346 | | 39,684,138 |
TOTAL DOMESTIC EQUITY FUNDS | | 1,862,365,200 |
TOTAL DOMESTIC EQUITY FUNDS (Cost $1,907,296,463) |
2,179,422,688
|
International Equity Funds - 23.3% |
| | | |
Developed International Equity Funds - 18.1% |
Fidelity Series International Growth Fund Class F (b) | 21,013,377 | | 285,992,058 |
Fidelity Series International Small Cap Fund Class F (b) | 3,880,637 | | 59,490,163 |
Fidelity Series International Value Fund Class F (b) | 26,666,993 | | 287,470,188 |
TOTAL DEVELOPED INTERNATIONAL EQUITY FUNDS | | 632,952,409 |
|
| Shares | | Value |
Emerging Markets Equity Funds - 5.2% |
Fidelity Series Emerging Markets Fund Class F (b) | 10,748,720 | | $ 180,471,006 |
TOTAL INTERNATIONAL EQUITY FUNDS (Cost $700,505,606) |
813,423,415
|
Bond Funds - 14.2% |
| | | |
High Yield Bond Funds - 10.2% |
Fidelity Series Emerging Markets Debt Fund Class F (b) | 2,313,065 | | 23,408,218 |
Fidelity Series Floating Rate High Income Fund Class F (b) | 328,150 | | 3,471,825 |
Fidelity Series High Income Fund Class F (b) | 30,989,756 | | 318,574,695 |
Fidelity Series Real Estate Income Fund Class F (b) | 926,823 | | 10,176,521 |
TOTAL HIGH YIELD BOND FUNDS | | 355,631,259 |
Investment Grade Bond Funds - 4.0% |
Fidelity Series Investment Grade Bond Fund Class F (b) | 12,252,000 | | 137,222,402 |
TOTAL BOND FUNDS (Cost $490,850,194) |
492,853,661
|
TOTAL INVESTMENT PORTFOLIO - 100.0% (Cost $3,098,652,263) | | 3,485,699,764 |
NET OTHER ASSETS (LIABILITIES) - 0.0% | | (143,368) |
NET ASSETS - 100% | $ 3,485,556,396 |
Legend |
(a) Non-income producing |
(b) Affiliated company |
Affiliated Underlying Funds |
Information regarding the Fund's fiscal year to date purchases and sales of the affiliated Underlying Funds and income earned by the Fund from investments in affiliated Underlying Funds is as follows: |
Affiliate | Value,
beginning of
period | Purchases | Sales
Proceeds | Dividend
Income | Value,
end of
period |
Fidelity Blue Chip Growth Fund Class F | $ 167,169,895 | $ 33,066,652 | $ 3,104,991 | $ 715,321 | $ 213,273,350 |
Fidelity Disciplined Equity Fund Class F | 36,467,074 | 355,705 | 38,598,137 | - | - |
Fidelity Growth Company Fund Class F | 227,775,172 | 26,405,683 | 27,223,291 | - | 266,157,263 |
Fidelity Series 100 Index Fund | 56,784,261 | 6,579,945 | 6,105,457 | - | 61,454,096 |
Fidelity Series All-Sector Equity Fund Class F | 245,095,711 | 26,846,275 | 17,533,419 | - | 280,286,130 |
Fidelity Series Commodity Strategy Fund Class F | 273,632,432 | 70,433,211 | 4,331,011 | - | 317,057,488 |
Fidelity Series Emerging Markets Debt Fund Class F | 20,696,886 | 4,517,256 | 193,627 | 592,433 | 23,408,218 |
Fidelity Series Emerging Markets Fund Class F | 144,545,954 | 36,156,669 | 1,416,788 | - | 180,471,006 |
Fidelity Series Equity-Income Fund Class F | 146,194,818 | 31,334,387 | 3,114,018 | 1,730,234 | 183,851,532 |
Fidelity Series Floating Rate High Income Fund Class F | 2,265,171 | 1,255,269 | 29,331 | 65,915 | 3,471,825 |
Fidelity Series Growth & Income Fund Class F (formerly Fidelity Series Mega Cap Fund Class F) | 53,466,838 | 16,646,426 | 607,520 | - | 74,948,757 |
Fidelity Series High Income Fund Class F | 270,272,548 | 59,503,530 | 4,594,742 | 7,869,577 | 318,574,695 |
Fidelity Series International Growth Fund Class F | 234,908,722 | 35,667,503 | 3,774,246 | - | 285,992,058 |
Fidelity Series International Small Cap Fund Class F | 47,842,353 | 6,517,293 | 767,347 | - | 59,490,163 |
Fidelity Series International Value Fund Class F | 234,456,564 | 32,912,904 | 3,786,562 | - | 287,470,188 |
Fidelity Series Intrinsic Opportunities Fund Class F | 84,984,122 | 41,741,063 | 1,407,979 | 927,501 | 140,491,845 |
Fidelity Series Investment Grade Bond Fund Class F | 103,703,451 | 39,383,721 | 2,288,755 | 1,335,167 | 137,222,402 |
Fidelity Series Large Cap Value Fund Class F | 147,830,161 | 13,896,520 | 27,146,481 | - | 147,095,034 |
Fidelity Series Opportunistic Insights Fund Class F | 106,902,174 | 18,628,378 | 1,277,566 | - | 144,285,614 |
Fidelity Series Real Estate Equity Fund Class F | 20,757,443 | 10,524,976 | 239,597 | 206,440 | 28,612,259 |
Fidelity Series Real Estate Income Fund Class F | 8,942,416 | 1,914,950 | 83,648 | 297,934 | 10,176,521 |
Fidelity Series Small Cap Opportunities Fund Class F | 64,000,427 | 13,637,802 | 4,079,874 | - | 76,357,027 |
Fidelity Series Stock Selector Large Cap Value Fund Class F | 147,598,938 | 18,261,354 | 13,929,481 | - | 165,282,289 |
Fidelity Small Cap Growth Fund Class F | 34,686,982 | 7,988,113 | 3,395,095 | - | 40,585,866 |
Fidelity Small Cap Value Fund Class F | 37,181,666 | 6,516,151 | 4,329,374 | 108,339 | 39,684,138 |
Total | $ 2,918,162,179 | $ 560,692,736 | $ 173,358,337 | $ 13,848,861 | $ 3,485,699,764 |
Other Information |
All investments are categorized as Level 1 under the Fair Value Hierarchy. The inputs or methodology used for valuing securities may not be an indication of the risk associated with investing in those securities. For more information on valuation inputs, please refer to the Investment Valuation section in the accompanying Notes to Financial Statements. |
See accompanying notes which are an integral part of the financial statements.
Semiannual Report
Fidelity Freedom K® 2050 Fund
Statement of Assets and Liabilities
| September 30, 2013 (Unaudited) |
| | |
Assets | | |
Investment in securities, at value (cost $3,098,652,263) - See accompanying schedule | | $ 3,485,699,764 |
Cash | | 1 |
Receivable for investments sold | | 722,369 |
Receivable for fund shares sold | | 11,721,338 |
Total assets | | 3,498,143,472 |
| | |
Liabilities | | |
Payable for fund shares redeemed | $ 12,443,704 | |
Transfer agent fees payable | 143,372 | |
Total liabilities | | 12,587,076 |
| | |
Net Assets | | $ 3,485,556,396 |
Net Assets consist of: | | |
Paid in capital | | $ 3,053,391,527 |
Undistributed net investment income | | 12,894,834 |
Accumulated undistributed net realized gain (loss) on investments | | 32,222,534 |
Net unrealized appreciation (depreciation) on investments | | 387,047,501 |
Net Assets, for 220,709,189 shares outstanding | | $ 3,485,556,396 |
Net Asset Value, offering price and redemption price per share ($3,485,556,396 ÷ 220,709,189 shares) | | $ 15.79 |
Statement of Operations
Six months ended September 30, 2013 (Unaudited) |
| | |
Investment Income | | |
Income distributions from underlying funds | | $ 13,848,861 |
| | |
Expenses | | |
Transfer agent fees | $ 788,889 | |
Independent trustees' compensation | 5,775 | |
Total expenses | | 794,664 |
Net investment income (loss) | | 13,054,197 |
Realized and Unrealized Gain (Loss) Realized gain (loss) on sale of underlying fund shares | 11,614,768 | |
Capital gain distributions from underlying funds | 25,864,749 | |
Total net realized gain (loss) | | 37,479,517 |
Change in net unrealized appreciation (depreciation) on underlying funds | | 168,588,418 |
Net gain (loss) | | 206,067,935 |
Net increase (decrease) in net assets resulting from operations | | $ 219,122,132 |
See accompanying notes which are an integral part of the financial statements.
Semiannual Report
Statement of Changes in Net Assets
| Six months ended September 30, 2013 (Unaudited) | Year ended
March 31,
2013 |
Increase (Decrease) in Net Assets | | |
Operations | | |
Net investment income (loss) | $ 13,054,197 | $ 42,149,319 |
Net realized gain (loss) | 37,479,517 | 66,414,220 |
Change in net unrealized appreciation (depreciation) | 168,588,418 | 144,527,475 |
Net increase (decrease) in net assets resulting from operations | 219,122,132 | 253,091,014 |
Distributions to shareholders from net investment income | (4,183,723) | (40,396,292) |
Distributions to shareholders from net realized gain | (61,362,949) | (26,769,214) |
Total distributions | (65,546,672) | (67,165,506) |
Share transactions
Proceeds from sales of shares | 761,517,683 | 1,471,476,473 |
Reinvestment of distributions | 65,546,672 | 67,165,506 |
Cost of shares redeemed | (413,127,947) | (512,018,200) |
Net increase (decrease) in net assets resulting from share transactions | 413,936,408 | 1,026,623,779 |
Total increase (decrease) in net assets | 567,511,868 | 1,212,549,287 |
| | |
Net Assets | | |
Beginning of period | 2,918,044,528 | 1,705,495,241 |
End of period (including undistributed net investment income of $12,894,834 and undistributed net investment income of $4,024,360, respectively) | $ 3,485,556,396 | $ 2,918,044,528 |
Other Information Shares | | |
Sold | 49,891,373 | 104,262,767 |
Issued in reinvestment of distributions | 4,335,097 | 4,858,118 |
Redeemed | (27,142,087) | (36,404,612) |
Net increase (decrease) | 27,084,383 | 72,716,273 |
Financial Highlights
| Six months ended September 30, 2013 | Years ended March 31, |
| (Unaudited) | 2013 | 2012 | 2011 | 2010 E |
Selected Per-Share Data | | | | | |
Net asset value, beginning of period | $ 15.07 | $ 14.11 | $ 14.77 | $ 12.94 | $ 10.00 |
Income from Investment Operations | | | | | |
Net investment income (loss) C | .06 | .27 | .24 | .24 | .15 |
Net realized and unrealized gain (loss) | .99 | 1.13 | (.27) | 1.86 | 2.91 |
Total from investment operations | 1.05 | 1.40 | (.03) | 2.10 | 3.06 |
Distributions from net investment income | (.02) | (.25) | (.19) | (.17) | (.07) |
Distributions from net realized gain | (.31) | (.20) | (.44) | (.11) | (.05) |
Total distributions | (.33) | (.44) H | (.63) | (.27) G | (.12) |
Net asset value, end of period | $ 15.79 | $ 15.07 | $ 14.11 | $ 14.77 | $ 12.94 |
Total Return B | 7.06% | 10.26% | .06% | 16.43% | 30.59% |
Ratios to Average Net Assets D, F | | | | | |
Expenses before reductions | .05% A | .05% | .05% | .05% | .05% A |
Expenses net of fee waivers, if any | .05% A | .05% | .05% | .05% | .05% A |
Expenses net of all reductions | .05% A | .05% | .05% | .05% | .05% A |
Net investment income (loss) | .82% A | 1.94% | 1.78% | 1.77% | 1.62% A |
Supplemental Data | | | | | |
Net assets, end of period (000 omitted) | $ 3,485,556 | $ 2,918,045 | $ 1,705,495 | $ 677,007 | $ 117,894 |
Portfolio turnover rate D | 11% A | 29% | 14% | 42% | 24% A |
A Annualized
B Total returns for periods of less than one year are not annualized.
C Calculated based on average shares outstanding during the period.
D Amounts do not include the activity of the Underlying Funds.
E For the period July 2, 2009 (commencement of operations) to March 31, 2010.
F Expense ratios reflect operating expenses of the Fund. Expenses before reductions do not reflect amounts reimbursed by the investment adviser or reductions from expense offset arrangements and do not represent the amount paid by the Fund during periods when reimbursements or reductions occur. Expenses net of fee waivers reflect expenses after reimbursement by the investment adviser but prior to reductions from expense offset arrangements. Expenses net of all reductions represent the net expenses paid by the Fund but do not include expenses of the investment companies in which the Fund invests.
G Total distributions of $.27 per share is comprised of distributions from net investment income of $.167 and distributions from net realized gain of $.106 per share.
H Total distributions of $.44 per share is comprised of distributions from net investment income of $.245 and distributions from net realized gain of $.198 per share.
See accompanying notes which are an integral part of the financial statements.
Semiannual Report
Fidelity Freedom K® 2055 Fund
Investment Changes (Unaudited)
The information in the following tables is based on the direct investments of the Fund. |
Fund Holdings as of September 30, 2013 |
| % of fund's
net assets | % of fund's net assets
6 months ago |
Commodity Funds | | |
Fidelity Series Commodity Strategy Fund Class F | 9.4 | 9.8 |
Domestic Equity Funds | | |
Fidelity Blue Chip Growth Fund Class F | 6.3 | 6.4 |
Fidelity Disciplined Equity Fund Class F | 0.0 | 1.4 |
Fidelity Growth Company Fund Class F | 8.0 | 8.4 |
Fidelity Series 100 Index Fund | 1.9 | 2.2 |
Fidelity Series All-Sector Equity Fund Class F | 8.3 | 9.4 |
Fidelity Series Equity-Income Fund Class F | 5.6 | 4.4 |
Fidelity Series Growth & Income Fund Class F (formerly Fidelity Series Mega Cap Fund Class F) | 2.4 | 1.6 |
Fidelity Series Intrinsic Opportunities Fund Class F | 4.3 | 2.8 |
Fidelity Series Large Cap Value Fund Class F | 4.4 | 5.4 |
Fidelity Series Opportunistic Insights Fund Class F | 4.3 | 3.3 |
Fidelity Series Real Estate Equity Fund Class F | 0.9 | 1.1 |
Fidelity Series Small Cap Opportunities Fund Class F | 2.3 | 2.5 |
Fidelity Series Stock Selector Large Cap Value Fund Class F | 4.9 | 4.5 |
Fidelity Small Cap Growth Fund Class F | 1.2 | 1.3 |
Fidelity Small Cap Value Fund Class F | 1.2 | 1.4 |
| 56.0 | 56.1 |
Developed International Equity Funds | | |
Fidelity Series International Growth Fund Class F | 8.6 | 8.5 |
Fidelity Series International Small Cap Fund Class F | 1.8 | 1.7 |
Fidelity Series International Value Fund Class F | 8.6 | 8.4 |
| 19.0 | 18.6 |
Emerging Markets Equity Funds | | |
Fidelity Series Emerging Markets Fund Class F | 5.5 | 5.3 |
High Yield Bond Funds | | |
Fidelity Series Emerging Markets Debt Fund Class F | 0.7 | 0.6 |
Fidelity Series Floating Rate High Income Fund Class F* | 0.0 | 0.0 |
Fidelity Series High Income Fund Class F | 9.0 | 9.3 |
Fidelity Series Real Estate Income Fund Class F | 0.3 | 0.2 |
| 10.0 | 10.1 |
Investment Grade Bond Funds | | |
Fidelity Series Investment Grade Bond Fund Class F | 0.1 | 0.1 |
Net Other Assets (Liabilities)* | 0.0 | 0.0 |
| 100.0 | 100.0 |
* Amount represents less than 0.1% |
Asset Allocation (% of fund's net assets) |
Period end |
| Commodity Funds | 9.4% | |
| Domestic Equity Funds | 56.0% | |
| Developed International Equity Funds | 19.0% | |
| Emerging Markets Equity Funds | 5.5% | |
| High Yield Bond Funds | 10.0% | |
| Investment Grade Bond Funds | 0.1% | |

Six months ago |
| Commodity Funds | 9.8% | |
| Domestic Equity Funds | 56.1% | |
| Developed International Equity Funds | 18.6% | |
| Emerging Markets Equity Funds | 5.3% | |
| High Yield Bond Funds | 10.1% | |
| Investment Grade Bond Funds | 0.1% | |

Semiannual Report
Fidelity Freedom K® 2055 Fund
Investments September 30, 2013 (Unaudited)
Showing Percentage of Net Assets
Domestic Equity Funds - 65.4% |
| Shares | | Value |
Commodity Funds - 9.4% |
Fidelity Series Commodity Strategy Fund Class F (a)(b) | 4,234,703 | | $ 34,089,358 |
Domestic Equity Funds - 56.0% |
Fidelity Blue Chip Growth Fund Class F (b) | 392,334 | | 22,963,307 |
Fidelity Growth Company Fund Class F (b) | 245,737 | | 29,186,143 |
Fidelity Series 100 Index Fund (b) | 627,646 | | 6,954,314 |
Fidelity Series All-Sector Equity Fund Class F (b) | 2,132,135 | | 30,212,352 |
Fidelity Series Equity-Income Fund Class F (b) | 1,724,049 | | 20,326,535 |
Fidelity Series Growth & Income Fund Class F (b) | 728,737 | | 8,795,850 |
Fidelity Series Intrinsic Opportunities Fund Class F (b) | 1,185,403 | | 15,398,386 |
Fidelity Series Large Cap Value Fund Class F (b) | 1,263,577 | | 15,958,982 |
Fidelity Series Opportunistic Insights Fund Class F (b) | 1,216,703 | | 15,683,301 |
Fidelity Series Real Estate Equity Fund Class F (b) | 276,090 | | 3,302,036 |
Fidelity Series Small Cap Opportunities Fund Class F (b) | 649,646 | | 8,380,434 |
Fidelity Series Stock Selector Large Cap Value Fund Class F (b) | 1,446,305 | | 17,630,462 |
Fidelity Small Cap Growth Fund Class F (b) | 233,429 | | 4,404,813 |
Fidelity Small Cap Value Fund Class F (b) | 224,936 | | 4,280,523 |
TOTAL DOMESTIC EQUITY FUNDS | | 203,477,438 |
TOTAL DOMESTIC EQUITY FUNDS (Cost $218,092,754) |
237,566,796
|
International Equity Funds - 24.5% |
| | | |
Developed International Equity Funds - 19.0% |
Fidelity Series International Growth Fund Class F (b) | 2,299,199 | | 31,292,097 |
Fidelity Series International Small Cap Fund Class F (b) | 414,408 | | 6,352,872 |
Fidelity Series International Value Fund Class F (b) | 2,898,438 | | 31,245,163 |
TOTAL DEVELOPED INTERNATIONAL EQUITY FUNDS | | 68,890,132 |
|
| Shares | | Value |
Emerging Markets Equity Funds - 5.5% |
Fidelity Series Emerging Markets Fund Class F (b) | 1,203,153 | | $ 20,200,942 |
TOTAL INTERNATIONAL EQUITY FUNDS (Cost $80,895,311) |
89,091,074
|
Bond Funds - 10.1% |
| | | |
High Yield Bond Funds - 10.0% |
Fidelity Series Emerging Markets Debt Fund Class F (b) | 252,130 | | 2,551,551 |
Fidelity Series Floating Rate High Income Fund Class F (b) | 3,614 | | 38,232 |
Fidelity Series High Income Fund Class F (b) | 3,183,627 | | 32,727,684 |
Fidelity Series Real Estate Income Fund Class F (b) | 89,938 | | 987,525 |
TOTAL HIGH YIELD BOND FUNDS | | 36,304,992 |
Investment Grade Bond Funds - 0.1% |
Fidelity Series Investment Grade Bond Fund Class F (b) | 30,725 | | 344,120 |
TOTAL BOND FUNDS (Cost $36,838,828) |
36,649,112
|
TOTAL INVESTMENT PORTFOLIO - 100.0% (Cost $335,826,893) | | 363,306,982 |
NET OTHER ASSETS (LIABILITIES) - 0.0% | | (14,577) |
NET ASSETS - 100% | $ 363,292,405 |
Legend |
(a) Non-income producing |
(b) Affiliated company |
Affiliated Underlying Funds |
Information regarding the Fund's fiscal year to date purchases and sales of the affiliated Underlying Funds and income earned by the Fund from investments in affiliated Underlying Funds is as follows: |
Affiliate | Value,
beginning of
period | Purchases | Sales
Proceeds | Dividend
Income | Value,
end of
period |
Fidelity Blue Chip Growth Fund Class F | $ 13,312,170 | $ 8,735,517 | $ 467,165 | $ 74,109 | $ 22,963,307 |
Fidelity Disciplined Equity Fund Class F | 2,881,689 | 100,939 | 3,132,167 | - | - |
Fidelity Growth Company Fund Class F | 17,586,800 | 9,518,157 | 1,573,797 | - | 29,186,143 |
Fidelity Series 100 Index Fund | 4,685,874 | 2,314,983 | 426,992 | - | 6,954,314 |
Fidelity Series All-Sector Equity Fund Class F | 19,606,964 | 10,393,581 | 2,198,592 | - | 30,212,352 |
Fidelity Series Commodity Strategy Fund Class F | 20,452,316 | 16,060,028 | 514,284 | - | 34,089,358 |
Fidelity Series Emerging Markets Debt Fund Class F | 1,267,774 | 1,440,095 | 7,358 | 52,865 | 2,551,551 |
Fidelity Series Emerging Markets Fund Class F | 10,968,071 | 9,020,640 | 55,160 | - | 20,200,942 |
Fidelity Series Equity-Income Fund Class F | 9,261,291 | 10,511,468 | 193,868 | 138,279 | 20,326,535 |
Fidelity Series Floating Rate High Income Fund Class F | 6,513 | 32,690 | 753 | 529 | 38,232 |
Fidelity Series Growth & Income Fund Class F (formerly Fidelity Series Mega Cap Fund Class F) | 3,386,524 | 4,971,438 | 23,421 | - | 8,795,850 |
Fidelity Series High Income Fund Class F | 19,306,774 | 14,324,278 | 334,060 | 690,435 | 32,727,684 |
Fidelity Series International Growth Fund Class F | 17,734,981 | 11,915,410 | 279,309 | - | 31,292,097 |
Fidelity Series International Small Cap Fund Class F | 3,582,563 | 2,265,805 | 56,010 | - | 6,352,872 |
Fidelity Series International Value Fund Class F | 17,569,569 | 11,708,598 | 279,313 | - | 31,245,163 |
Fidelity Series Intrinsic Opportunities Fund Class F | 5,879,837 | 8,286,453 | 139,228 | 98,780 | 15,398,386 |
Fidelity Series Investment Grade Bond Fund Class F | 307,537 | 183,372 | 141,197 | 3,065 | 344,120 |
Fidelity Series Large Cap Value Fund Class F | 11,297,163 | 5,523,744 | 1,956,480 | - | 15,958,982 |
Fidelity Series Opportunistic Insights Fund Class F | 6,789,237 | 7,087,060 | 50,511 | - | 15,683,301 |
Fidelity Series Real Estate Equity Fund Class F | 2,215,807 | 1,428,256 | 81,664 | 21,635 | 3,302,036 |
Fidelity Series Real Estate Income Fund Class F | 477,858 | 564,611 | 2,124 | 25,397 | 987,525 |
Fidelity Series Small Cap Opportunities Fund Class F | 5,145,422 | 3,296,466 | 276,220 | - | 8,380,434 |
Fidelity Series Stock Selector Large Cap Value Fund Class F | 9,314,599 | 8,036,076 | 805,646 | - | 17,630,462 |
Fidelity Small Cap Growth Fund Class F | 2,691,226 | 1,831,594 | 198,657 | - | 4,404,813 |
Fidelity Small Cap Value Fund Class F | 2,852,288 | 1,668,305 | 244,297 | 11,344 | 4,280,523 |
Total | $ 208,580,847 | $ 151,219,564 | $ 13,438,273 | $ 1,116,438 | $ 363,306,982 |
Other Information |
All investments are categorized as Level 1 under the Fair Value Hierarchy. The inputs or methodology used for valuing securities may not be an indication of the risk associated with investing in those securities. For more information on valuation inputs, please refer to the Investment Valuation section in the accompanying Notes to Financial Statements. |
See accompanying notes which are an integral part of the financial statements.
Semiannual Report
Fidelity Freedom K® 2055 Fund
Statement of Assets and Liabilities
| September 30, 2013 (Unaudited) |
| | |
Assets | | |
Investment in securities, at value (cost $335,826,893) - See accompanying schedule | | $ 363,306,982 |
Receivable for fund shares sold | | 3,485,525 |
Total assets | | 366,792,507 |
| | |
Liabilities | | |
Payable to custodian bank | $ 3 | |
Payable for investments purchased | 2,315,243 | |
Payable for fund shares redeemed | 1,170,282 | |
Transfer agent fees payable | 14,574 | |
Total liabilities | | 3,500,102 |
| | |
Net Assets | | $ 363,292,405 |
Net Assets consist of: | | |
Paid in capital | | $ 331,825,754 |
Undistributed net investment income | | 1,036,466 |
Accumulated undistributed net realized gain (loss) on investments | | 2,950,096 |
Net unrealized appreciation (depreciation) on investments | | 27,480,089 |
Net Assets, for 32,174,334 shares outstanding | | $ 363,292,405 |
Net Asset Value, offering price and redemption price per share ($363,292,405 ÷ 32,174,334 shares) | | $ 11.29 |
Statement of Operations
Six months ended September 30, 2013 (Unaudited) |
| | |
Investment Income | | |
Income distributions from underlying funds | | $ 1,116,438 |
| | |
Expenses | | |
Transfer agent fees | $ 69,791 | |
Independent trustees' compensation | 478 | |
Total expenses | | 70,269 |
Net investment income (loss) | | 1,046,169 |
Realized and Unrealized Gain (Loss) Realized gain (loss) on sale of underlying fund shares | 437,780 | |
Capital gain distributions from underlying funds | 2,715,310 | |
Total net realized gain (loss) | | 3,153,090 |
Change in net unrealized appreciation (depreciation) on underlying funds | | 16,507,067 |
Net gain (loss) | | 19,660,157 |
Net increase (decrease) in net assets resulting from operations | | $ 20,706,326 |
See accompanying notes which are an integral part of the financial statements.
Semiannual Report
Statement of Changes in Net Assets
| Six months ended
September 30, 2013
(Unaudited) | Year ended
March 31,
2013 |
Increase (Decrease) in Net Assets | | |
Operations | | |
Net investment income (loss) | $ 1,046,169 | $ 1,948,221 |
Net realized gain (loss) | 3,153,090 | 2,656,117 |
Change in net unrealized appreciation (depreciation) | 16,507,067 | 10,191,458 |
Net increase (decrease) in net assets resulting from operations | 20,706,326 | 14,795,796 |
Distributions to shareholders from net investment income | (238,637) | (1,740,051) |
Distributions to shareholders from net realized gain | (2,600,273) | (381,047) |
Total distributions | (2,838,910) | (2,121,098) |
Share transactions
Proceeds from sales of shares | 188,467,346 | 206,753,109 |
Reinvestment of distributions | 2,838,910 | 2,121,098 |
Cost of shares redeemed | (54,454,059) | (37,846,021) |
Net increase (decrease) in net assets resulting from share transactions | 136,852,197 | 171,028,186 |
Total increase (decrease) in net assets | 154,719,613 | 183,702,884 |
| | |
Net Assets | | |
Beginning of period | 208,572,792 | 24,869,908 |
End of period (including undistributed net investment income of $1,036,466 and undistributed net investment income of $228,934, respectively) | $ 363,292,405 | $ 208,572,792 |
Other Information Shares | | |
Sold | 17,309,200 | 20,650,775 |
Issued in reinvestment of distributions | 263,353 | 216,279 |
Redeemed | (5,006,197) | (3,787,133) |
Net increase (decrease) | 12,566,356 | 17,079,921 |
Financial Highlights
| Six months ended
September 30, 2013 | Years ended March 31, |
| (Unaudited) | 2013 | 2012 E |
Selected Per-Share Data | | | |
Net asset value, beginning of period | $ 10.64 | $ 9.84 | $ 10.00 |
Income from Investment Operations | | | |
Net investment income (loss) C | .04 | .22 | .14 |
Net realized and unrealized gain (loss) | .74 | .79 | (.11) |
Total from investment operations | .78 | 1.01 | .03 |
Distributions from net investment income | (.01) | (.15) | (.10) |
Distributions from net realized gain | (.12) | (.06) | (.08) |
Total distributions | (.13) | (.21) | (.19) G |
Net asset value, end of period | $ 11.29 | $ 10.64 | $ 9.84 |
Total Return B | 7.40% | 10.48% | .47% |
Ratios to Average Net Assets D, F | | | |
Expenses before reductions | .05% A | .05% | .05% A |
Expenses net of fee waivers, if any | .05% A | .05% | .05% A |
Expenses net of all reductions | .05% A | .05% | .05% A |
Net investment income (loss) | .74% A | 2.17% | 1.78% A |
Supplemental Data | | | |
Net assets, end of period (000 omitted) | $ 363,292 | $ 208,573 | $ 24,870 |
Portfolio turnover rate D | 10% A | 27% | 7% A |
A Annualized
B Total returns for periods of less than one year are not annualized.
C Calculated based on average shares outstanding during the period.
D Amounts do not include the activity of the Underlying Funds.
E For the period June 1, 2011 (commencement of operations) to March 31, 2012.
F Expense ratios reflect operating expenses of the Fund. Expenses before reductions do not reflect amounts reimbursed by the investment adviser or reductions from expense offset arrangements and do not represent the amount paid by the Fund during periods when reimbursements or reductions occur. Expenses net of fee waivers reflect expenses after reimbursement by the investment adviser but prior to reductions from expense offset arrangements. Expenses net of all reductions represent the net expenses paid by the Fund but do not include expenses of the investment companies in which the Fund invests.
G Total distributions of $.19 per share is comprised of distributions from net investment income of $.104 and distributions from net realized gain of $.081 per share.
See accompanying notes which are an integral part of the financial statements.
Semiannual Report
Notes to Financial Statements
For the period ended September 30, 2013 (Unaudited)
1. Organization.
Fidelity Freedom K® Income Fund, Fidelity Freedom K® 2000 Fund, Fidelity Freedom K® 2005 Fund, Fidelity Freedom K® 2010 Fund, Fidelity Freedom K® 2015 Fund, Fidelity Freedom K® 2020 Fund, Fidelity Freedom K® 2025 Fund, Fidelity Freedom K® 2030 Fund, Fidelity Freedom K® 2035 Fund, Fidelity Freedom K® 2040 Fund, Fidelity Freedom K® 2045 Fund, Fidelity Freedom K® 2050 Fund, and Fidelity Freedom K® 2055 Fund (the Funds) are funds of Fidelity Aberdeen Street Trust (the Trust). The Trust is registered under the Investment Company Act of 1940, as amended (the 1940 Act), as an open-end management investment company organized as a Delaware statutory trust. Each Fund is authorized to issue an unlimited number of shares. The Funds invest primarily in a combination of other Fidelity equity, bond, and short-term funds (the Underlying Funds) managed by Fidelity Management & Research Company (FMR).
2. Significant Accounting Policies.
The financial statements have been prepared in conformity with accounting principles generally accepted in the United States of America (GAAP), which require management to make certain estimates and assumptions at the date of the financial statements. Actual results could differ from those estimates. Subsequent events, if any, through the date that the financial statements were issued have been evaluated in the preparation of the financial statements. The following summarizes the significant accounting policies of the Funds:
Investment Valuation. Investments are valued as of 4:00 p.m. Eastern time on the last calendar day of the period. Each Fund categorizes the inputs to valuation techniques used to value its investments into a disclosure hierarchy consisting of three levels as shown below:
Level 1 - quoted prices in active markets for identical investments
Level 2 - other significant observable inputs (including quoted prices for similar investments, interest rates, prepayment speeds, etc.)
Level 3 - unobservable inputs (including the Fund's own assumptions based on the best information available)
Valuation techniques used to value each Fund's investments by major category are as follows. Investments in the Underlying Funds are valued at their closing net asset value (NAV) each business day and are categorized as Level 1 in the hierarchy.
Investment Transactions and Income. For financial reporting purposes, the Funds' investment holdings and NAV include trades executed through the end of the last business day of the period. The NAV per share for processing shareholder transactions is calculated as of the close of business of the New York Stock Exchange (NYSE), normally 4:00 p.m. Eastern time and includes trades executed through the end of the prior business day. Gains and losses on securities sold are determined on the basis of identified cost. Income and capital gain distributions from the Underlying Funds, if any, are recorded on the ex-dividend date.
Expenses. Expenses directly attributable to a fund are charged to that fund. Expenses attributable to more than one fund are allocated among the respective funds on the basis of relative net assets or other appropriate methods. Expenses included in the accompanying financial statements reflect the expenses of each Fund and do not include any expenses associated with the Underlying Funds. Although not included in each Fund's expenses, each Fund indirectly bears its proportionate share of the Underlying Funds' expenses through the impact of these expenses on each Underlying Fund's NAV. Expense estimates are accrued in the period to which they relate and adjustments are made when actual amounts are known.
Income Tax Information and Distributions to Shareholders. Each year, each Fund intends to qualify as a regulated investment company under Subchapter M of the Internal Revenue Code, including distributing substantially all of its taxable income and realized gains. As a result, no provision for U.S. Federal income taxes is required. Each Fund files a U.S. federal tax return, in addition to state and local tax returns as required. The Fund's federal income tax returns are subject to examination by the Internal Revenue Service (IRS) for a period of three fiscal years after they are filed. State and local tax returns may be subject to examination for an additional fiscal year depending on the jurisdiction.
Distributions are declared and recorded on the ex-dividend date. Income and capital gain distributions are determined in accordance with income tax regulations, which may differ from GAAP.
Capital accounts within the financial statements are adjusted for permanent book-tax differences. These adjustments have no impact on net assets or the results of operations. Temporary book-tax differences will reverse in a subsequent period.
Book-tax differences are primarily due to the short-term gain distributions from the Underlying Funds and losses deferred due to wash sales.
Semiannual Report
Notes to Financial Statements (Unaudited) - continued
2. Significant Accounting Policies - continued
Income Tax Information and Distributions to Shareholders - continued
The federal tax cost of investment securities and unrealized appreciation (depreciation) as of period end were as follows for each Fund:
| Tax cost | Gross unrealized
appreciation | Gross unrealized
depreciation | Net unrealized
appreciation
(depreciation) on
securities and other
investments |
Fidelity Freedom K® Income Fund | $ 1,531,317,311 | $ 69,883,384 | $ (24,333,801) | $ 45,549,583 |
Fidelity Freedom K® 2000 Fund | 708,394,469 | 34,663,092 | (10,032,435) | 24,630,657 |
Fidelity Freedom K® 2005 Fund | 469,404,749 | 34,987,769 | (8,158,624) | 26,829,145 |
Fidelity Freedom K® 2010 Fund | 4,256,487,526 | 444,523,634 | (97,801,926) | 346,721,708 |
Fidelity Freedom K® 2015 Fund | 6,836,918,593 | 695,397,274 | (165,442,964) | 529,954,310 |
Fidelity Freedom K® 2020 Fund | 15,746,857,489 | 1,714,019,731 | (398,466,424) | 1,315,553,307 |
Fidelity Freedom K® 2025 Fund | 10,090,803,189 | 1,258,882,975 | (253,817,044) | 1,005,065,931 |
Fidelity Freedom K® 2030 Fund | 12,790,561,713 | 1,729,421,745 | (339,676,831) | 1,389,744,914 |
Fidelity Freedom K® 2035 Fund | 7,453,927,256 | 1,104,791,769 | (180,651,715) | 924,140,054 |
Fidelity Freedom K® 2040 Fund | 8,136,609,380 | 1,254,662,612 | (204,853,809) | 1,049,808,803 |
Fidelity Freedom K® 2045 Fund | 3,992,855,249 | 584,822,121 | (87,277,342) | 497,544,779 |
Fidelity Freedom K® 2050 Fund | 3,104,031,603 | 450,378,291 | (68,710,130) | 381,668,161 |
Fidelity Freedom K® 2055 Fund | 336,106,273 | 30,883,845 | (3,683,136) | 27,200,709 |
3. Purchases and Sales of Investments.
Purchases and redemptions of the Underlying Fund shares are noted in the table below.
| Purchases ($) | Redemptions ($) |
Fidelity Freedom K® Income Fund | 116,228,696 | 106,572,476 |
Fidelity Freedom K® 2000 Fund | 40,122,077 | 74,209,699 |
Fidelity Freedom K® 2005 Fund | 66,431,295 | 72,352,152 |
Fidelity Freedom K® 2010 Fund | 315,179,160 | 510,194,633 |
Fidelity Freedom K® 2015 Fund | 630,075,918 | 564,613,817 |
Fidelity Freedom K® 2020 Fund | 1,583,864,036 | 1,011,371,976 |
Fidelity Freedom K® 2025 Fund | 1,414,634,102 | 600,537,331 |
Fidelity Freedom K® 2030 Fund | 1,472,777,396 | 790,710,765 |
Fidelity Freedom K® 2035 Fund | 1,104,652,922 | 465,393,018 |
Fidelity Freedom K® 2040 Fund | 1,056,910,746 | 546,565,726 |
Fidelity Freedom K® 2045 Fund | 674,414,960 | 230,265,802 |
Fidelity Freedom K® 2050 Fund | 560,692,736 | 173,358,337 |
Fidelity Freedom K® 2055 Fund | 151,219,564 | 13,438,273 |
4. Fees and Other Transactions with Affiliates.
Management Fee. Strategic Advisers, Inc. (Strategic Advisers), an affiliate of FMR, provides the Funds with investment management related services. The Funds do not pay any fees for these services.
Other Transactions. Strategic Advisers has entered into an administration agreement with FMR under which FMR provides management and administrative services (other than investment advisory services) necessary for the operation of each Fund. Pursuant to this agreement, FMR pays all expenses of each Fund, excluding the transfer agent fees, the compensation of the independent Trustees and certain other expenses such as interest expense. FMR also contracts with other Fidelity companies to perform the services necessary for the operation of each Fund. The Funds do not pay any fees for these services.
Transfer Agent Fees. Fidelity Investments Institutional Operations Company, Inc. (FIIOC), an affiliate of FMR, is the Funds' transfer, dividend disbursing and shareholder servicing agent. FIIOC receives an asset-based fee of .05% based on each Fund's average net assets. FIIOC pays for typesetting, printing and mailing of shareholder reports, except proxy statements.
Semiannual Report
5. Other.
The Funds' organizational documents provide former and current trustees and officers with a limited indemnification against liabilities arising in connection with the performance of their duties to the Funds. In the normal course of business, the Funds may also enter into contracts that provide general indemnifications. The Funds' maximum exposure under these arrangements is unknown as this would be dependent on future claims that may be made against the Funds. The risk of material loss from such claims is considered remote.
The Funds do not invest in the Underlying Funds for the purpose of exercising management or control; however, investments by the Funds within their principal investment strategies may represent a significant portion of the Underlying Fund's net assets. At the end of the period, the following Freedom K® Funds were the owners of record of 10% or more of the total outstanding shares of the Underlying Funds.
Fund | Fidelity Freedom K® 2020 Fund | Fidelity Freedom K® 2030 Fund |
| | |
Fidelity Series Emerging Markets Debt Fund | 10% | - |
Fidelity Series Equity-Income Fund | - | 10% |
Fidelity Series Floating Rate High Income Fund | 13% | - |
Fidelity Series Growth & Income Fund | - | 10% |
Fidelity Series Inflation-Protected Bond Index Fund | 16% | - |
Fidelity Series Intrinsic Opportunities Fund | - | 10% |
Fidelity Series Investment Grade Bond Fund | 14% | - |
Fidelity Series Opportunistic Insights Fund | - | 10% |
Fidelity Series Real Estate Income Fund | 12% | - |
Fidelity Series Stock Selector Large Cap Value Fund | - | 10% |
The Funds, in aggregate, were the owners of record of more than 20% of the total outstanding shares of the following Underlying Funds.
Fund | % of shares held |
| |
Fidelity Series 100 Index Fund | 51% |
Fidelity Series All-Sector Equity Fund | 49% |
Fidelity Series Commodity Strategy Fund | 46% |
Fidelity Series Emerging Markets Debt Fund | 49% |
Fidelity Series Emerging Markets Fund | 49% |
Fidelity Series Equity-Income Fund | 56% |
Fidelity Series Floating Rate High Income Fund | 48% |
Fidelity Series Growth & Income Fund | 56% |
Fidelity Series High Income Fund | 49% |
Fidelity Series Inflation-Protected Bond Index Fund | 45% |
Fidelity Series International Growth Fund | 50% |
Fidelity Series International Small Cap Fund | 50% |
Fidelity Series International Value Fund | 50% |
Fidelity Series Intrinsic Opportunities Fund | 56% |
Fidelity Series Investment Grade Bond Fund | 48% |
Fidelity Series Large Cap Value Fund | 48% |
Fidelity Series Opportunistic Insights Fund | 56% |
Fidelity Series Real Estate Equity Fund | 50% |
Fidelity Series Real Estate Income Fund | 49% |
Fidelity Series Small Cap Opportunities Fund | 46% |
Fidelity Series Stock Selector Large Cap Value Fund | 56% |
Fidelity Small Cap Growth Fund | 32% |
Subsequent to period end, the Funds redeemed all of their shares of the Fidelity Series Large Cap Value Fund.
Semiannual Report
Board Approval of Investment Advisory Contracts and Management Fees
Fidelity Freedom K® Funds
Each year, the Board of Trustees, including the Independent Trustees (together, the Board), votes on the renewal of the management contract (the Advisory Contract) with Strategic Advisers, Inc. (Strategic Advisers) and the administration agreement for each fund. The Board, assisted by the advice of fund counsel and Independent Trustees' counsel, requests and considers a broad range of information relevant to the renewal of the Advisory Contracts throughout the year.
The Board meets regularly and, at each of its meetings, covers an extensive agenda of topics and materials and considers factors that are relevant to its annual consideration of the renewal of each fund's Advisory Contract, including the services and support provided to each fund and its shareholders. The Board has established four standing committees, Operations, Audit, Fair Valuation, and Governance and Nominating, each composed of and chaired by Independent Trustees with varying backgrounds, to which the Board has assigned specific subject matter responsibilities in order to enhance effective decision-making by the Board. The Operations Committee, of which all of the Independent Trustees are members, meets regularly throughout the year and, among other matters, considers matters specifically related to the annual consideration of the renewal of each fund's Advisory Contract. The Board, acting directly and through its Committees, requests and receives information concerning the annual consideration of the renewal of each fund's Advisory Contract. The Board also meets as needed to consider matters specifically related to the Board's annual consideration of the renewal of Advisory Contracts. Members of the Board may also meet with trustees of other Fidelity funds through ad hoc joint committees to discuss certain matters relevant to the Fidelity funds.
At its September 2013 meeting, the Board, including the Independent Trustees, unanimously determined to renew each fund's Advisory Contract. In reaching its determination, the Board considered all factors it believed relevant and reached a determination, with the assistance of fund counsel and Independent Trustees' counsel and through the exercise of its business judgment, that the renewal of the Advisory Contract was in the best interests of each fund and its shareholders and the fact that no fees are payable under the Advisory Contracts was fair and reasonable. The Board's decision to renew the Advisory Contracts was not based on any single factor, but rather was based on a comprehensive consideration of all the information provided to the Board at its meetings throughout the year. In reaching its determination, the Board was aware that shareholders in each fund have a broad range of investment choices available to them, including a wide choice among mutual funds offered by Fidelity's competitors, and that each fund's shareholders, who have the opportunity to review and weigh the disclosure provided by the fund in its prospectus and other public disclosures, have chosen to invest in that fund, which is part of the Fidelity family of funds.
Nature, Extent, and Quality of Services Provided. The Board considered Fidelity's staffing as it relates to the funds, including the backgrounds of investment personnel of Strategic Advisers, and also considered the funds' investment objectives, strategies, and related investment philosophies. The Independent Trustees also had discussions with senior management of Fidelity's investment operations and investment groups with responsibility for the underlying Fidelity funds in which each fund invests. The Board considered the structure of the portfolio manager compensation program and whether this structure provides appropriate incentives to act in the best interests of each fund.
Resources Dedicated to Investment Management and Support Services. The Board reviewed the general qualifications and capabilities of Fidelity's investment staff, including its size, education, experience, and resources, as well as Fidelity's approach to recruiting, managing, and compensating investment personnel. The Board noted that Fidelity has continued to increase the resources devoted to non-U.S. offices, including expansion of Fidelity's global investment organization. The Board also noted that Fidelity's analysts have extensive resources, tools and capabilities that allow them to conduct sophisticated quantitative and fundamental analysis, as well as credit analysis of issuers, counterparties and guarantors. Further, the Board believes that Fidelity's investment professionals have sufficient access to global information and data so as to provide competitive investment results over time, and that those professionals also have access to sophisticated tools that permit them to assess portfolio construction and risk and performance attribution characteristics continuously, as well as to transmit new information and research conclusions rapidly around the world. Additionally, in its deliberations, the Board considered Fidelity's risk management capabilities and resources, which are an integral part of the investment management process.
Shareholder and Administrative Services. The Board considered (i) the nature, extent, quality, and cost of advisory, administrative, and shareholder services performed by Fidelity affiliates under the Advisory Contract and the administration agreement and under separate agreements covering transfer agency and pricing and bookkeeping services for each fund; (ii) the nature and extent of the supervision of third party service providers, principally custodians and subcustodians; and (iii) the resources devoted to, and the record of compliance with, each fund's compliance policies and procedures.
The Board noted that the growth of fund assets over time across the complex allows Fidelity to reinvest in the development of services designed to enhance the value or convenience of the Fidelity funds as investment vehicles. These services include 24-hour access to account information and market information through telephone representatives and over the Internet, investor education materials and asset allocation tools, and the expanded availability of Fidelity Investor Centers.
Investment in a Large Fund Family. The Board considered the benefits to shareholders of investing in a Fidelity fund, including the benefits of investing in a fund that is part of a large family of funds offering a variety of investment disciplines and providing a large variety of mutual fund investor services. The Board noted that Fidelity had taken, or had made recommendations that resulted in the Fidelity funds taking, a number of actions over the previous year that benefited particular funds, including (i) continuing to dedicate additional resources to investment research and to the support of the senior management team that oversees asset management; (ii) persisting in efforts to enhance Fidelity's global research capabilities; (iii) launching new funds and making other enhancements to meet client needs for global and income-oriented solutions; (iv) continuing to launch dedicated lower cost underlying funds to meet portfolio construction needs related to expanding underlying fund options for Fidelity funds of funds, specifically for the Freedom Fund product lines; (v) rationalizing product lines and gaining increased efficiencies through the combination of several funds with other funds; (vi) strengthening Fidelity's index fund offerings by reducing investment minimums and adopting or lowering existing expense caps for certain funds and classes; (vii) enhancing Global Asset Allocation product offerings by launching new funds and strategies, including "open architecture" target date funds that utilize affiliated and unaffiliated sub-advisers; (viii) modifying the eligibility criteria for Institutional Class shares of Advisor funds to increase their marketability to a portion of the defined contribution plan market; (ix) creating a new low-cost retirement share class for certain Advisor funds to appeal to large retirement plans; (x) transitioning the management of certain Fidelity commodity funds to Geode Capital Management LLC, a registered commodity pool operator, while retaining administrative responsibilities for the funds; and (xi) taking steps toward establishing a new Fidelity adviser to manage sector-based funds and products.
Semiannual Report
Investment Performance. The Board considered whether each fund has operated in accordance with its investment objective, as well as its record of compliance with its investment restrictions and its performance history.
The Board took into account discussions with the investment adviser about fund investment performance that occur at Board meetings throughout the year. In this regard the Board noted that as part of regularly scheduled fund reviews and other reports to the Board on fund performance, the Board periodically considers annualized return information for each fund for different time periods, measured against one or more securities market indices, including a customized blended index representative of the fund's asset classes (each a "benchmark index") and a peer group of mutual funds with similar objectives ("peer group"). In its evaluation of fund investment performance at meetings throughout the year, the Board gave particular attention to information indicating underperformance of certain Fidelity funds for specific time periods and the investment adviser's explanations for such underperformance.
In addition to reviewing absolute and relative fund performance, the Independent Trustees periodically consider the appropriateness of fund performance metrics in evaluating the results achieved. In general, the Independent Trustees believe that fund performance should be evaluated based on gross performance (before fees and expenses, including acquired fund fees and expenses, but after transaction costs, if any) compared to appropriate benchmark indices, over appropriate time periods that may include full market cycles, and on net performance (after fees and expenses) compared to peer groups, as applicable, over the same periods, taking into account relevant factors including the following: general market conditions; the extent to which particular underlying funds affected performance; and fund cash flows and other factors. Depending on the circumstances, the Independent Trustees may be satisfied with a fund's performance notwithstanding that it lags its benchmark index or peer group for certain periods.
The Independent Trustees recognize that shareholders evaluate performance on a net basis over their own holding periods, for which one-, three-, and five-year periods are often used as a proxy. For this reason, the performance information reviewed by the Board also included net cumulative calendar year total return information for each fund and an appropriate benchmark index for the most recent one- and three-year periods (for the most recent one-year period for Fidelity Freedom K 2055 Fund).
Based on its review, the Board concluded that the nature, extent, and quality of services provided to each fund under the Advisory Contract should benefit each fund's shareholders.
Competitiveness of Management Fee and Total Expense Ratio. The Board noted that the funds do not pay Strategic Advisers a management fee for investment advisory services. The Board considered each fund's management fee and total expense ratio compared to "mapped groups" of competitive funds and classes, and also considered that each fund bears indirectly the expenses of the underlying Fidelity funds in which it invests. Fidelity creates "mapped groups" by combining similar Lipper investment objective categories that have comparable investment mandates. Combining Lipper investment objective categories aids the Board's management fee and total expense ratio comparisons by broadening the competitive group used for comparison and by reducing the number of universes to which various Fidelity funds are compared.
Management Fee. The Board considered two proprietary management fee comparisons for the 12-month (or shorter) periods shown in the charts below. The group of Lipper funds used by the Board for management fee comparisons is referred to below as the "Total Mapped Group." The Total Mapped Group comparison focuses on a fund's standing in terms of gross management fees before expense reimbursements or caps relative to the total universe of funds with comparable investment mandates, regardless of whether their management fee structures also are comparable. "TMG %" represents the percentage of funds in the Total Mapped Group that had management fees that were lower than a fund's. For example, a hypothetical TMG % of 50% would mean that half of the funds in the Total Mapped Group had higher, and half had lower, management fees than a fund. The funds' actual TMG %s are in the charts below. The "Asset-Size Peer Group" (ASPG) comparison focuses on a fund's standing relative to a subset of non-Fidelity funds within the Total Mapped Group that are similar in size and management fee structure. For example, if a fund is in the first quartile of the ASPG, the fund's management fee ranks in the least expensive or lowest 25% of funds in the ASPG. The ASPG represents at least 15% of the funds in the Total Mapped Group with comparable asset size and management fee structures, subject to a minimum of 50 funds (or all funds in the Total Mapped Group if fewer than 50). Additional information, such as the ASPG quartile in which a fund's management fee rate ranked, is also included in the charts and considered by the Board.
Semiannual Report
Board Approval of Investment Advisory Contracts and Management Fees - continued
Freedom K® 2000 Fund
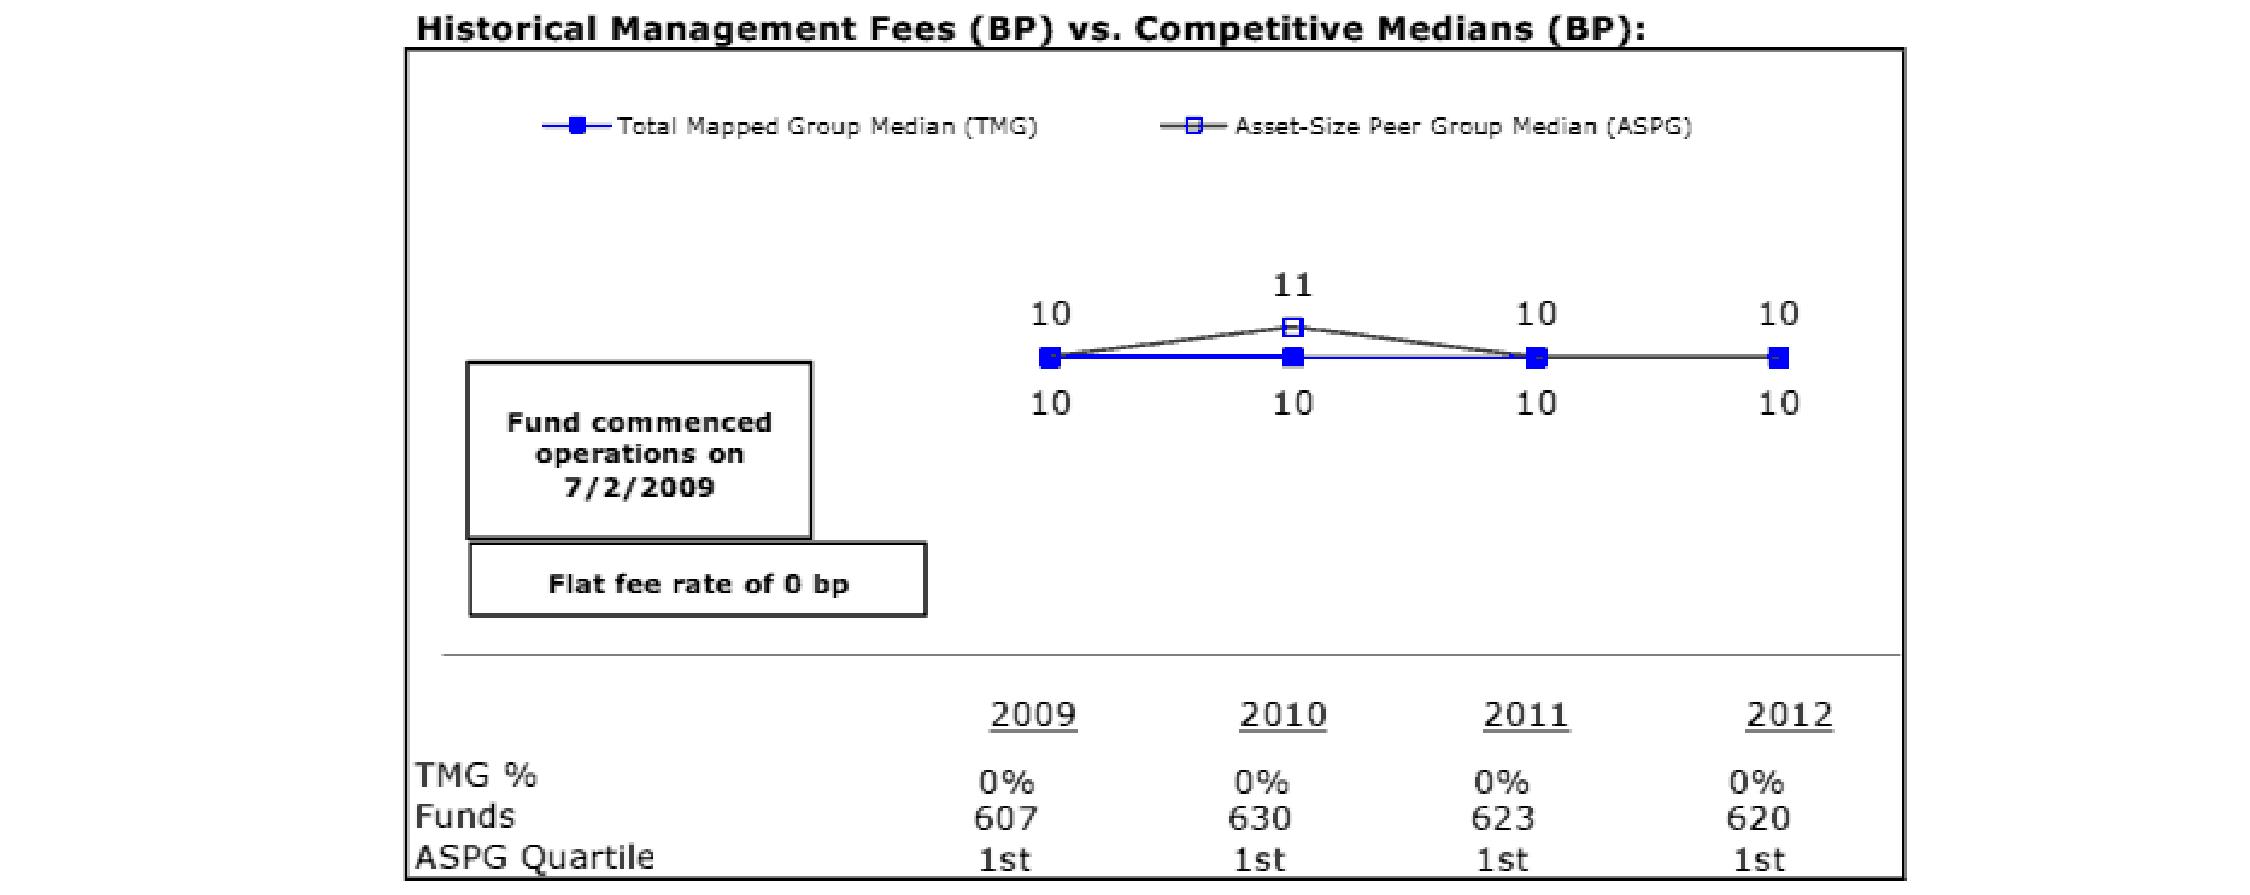
Freedom K® 2005 Fund
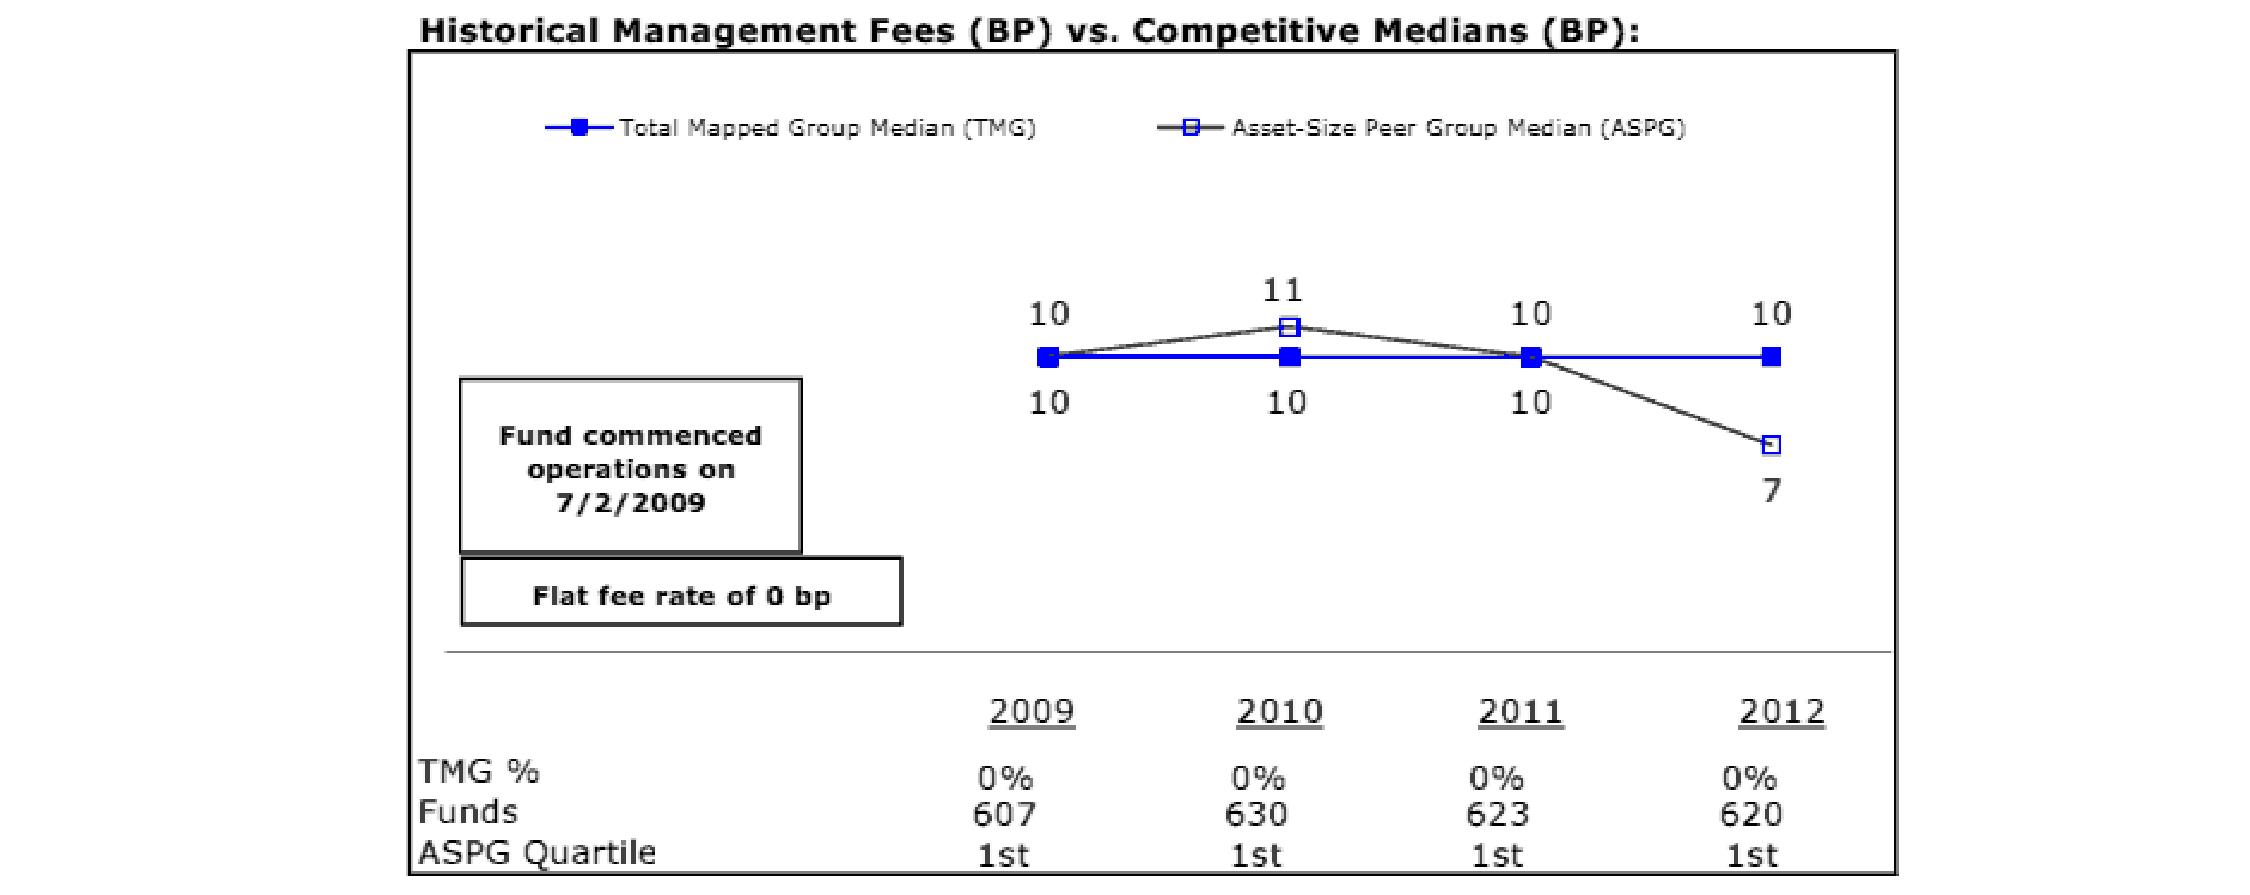
Semiannual Report
Freedom K® 2010 Fund
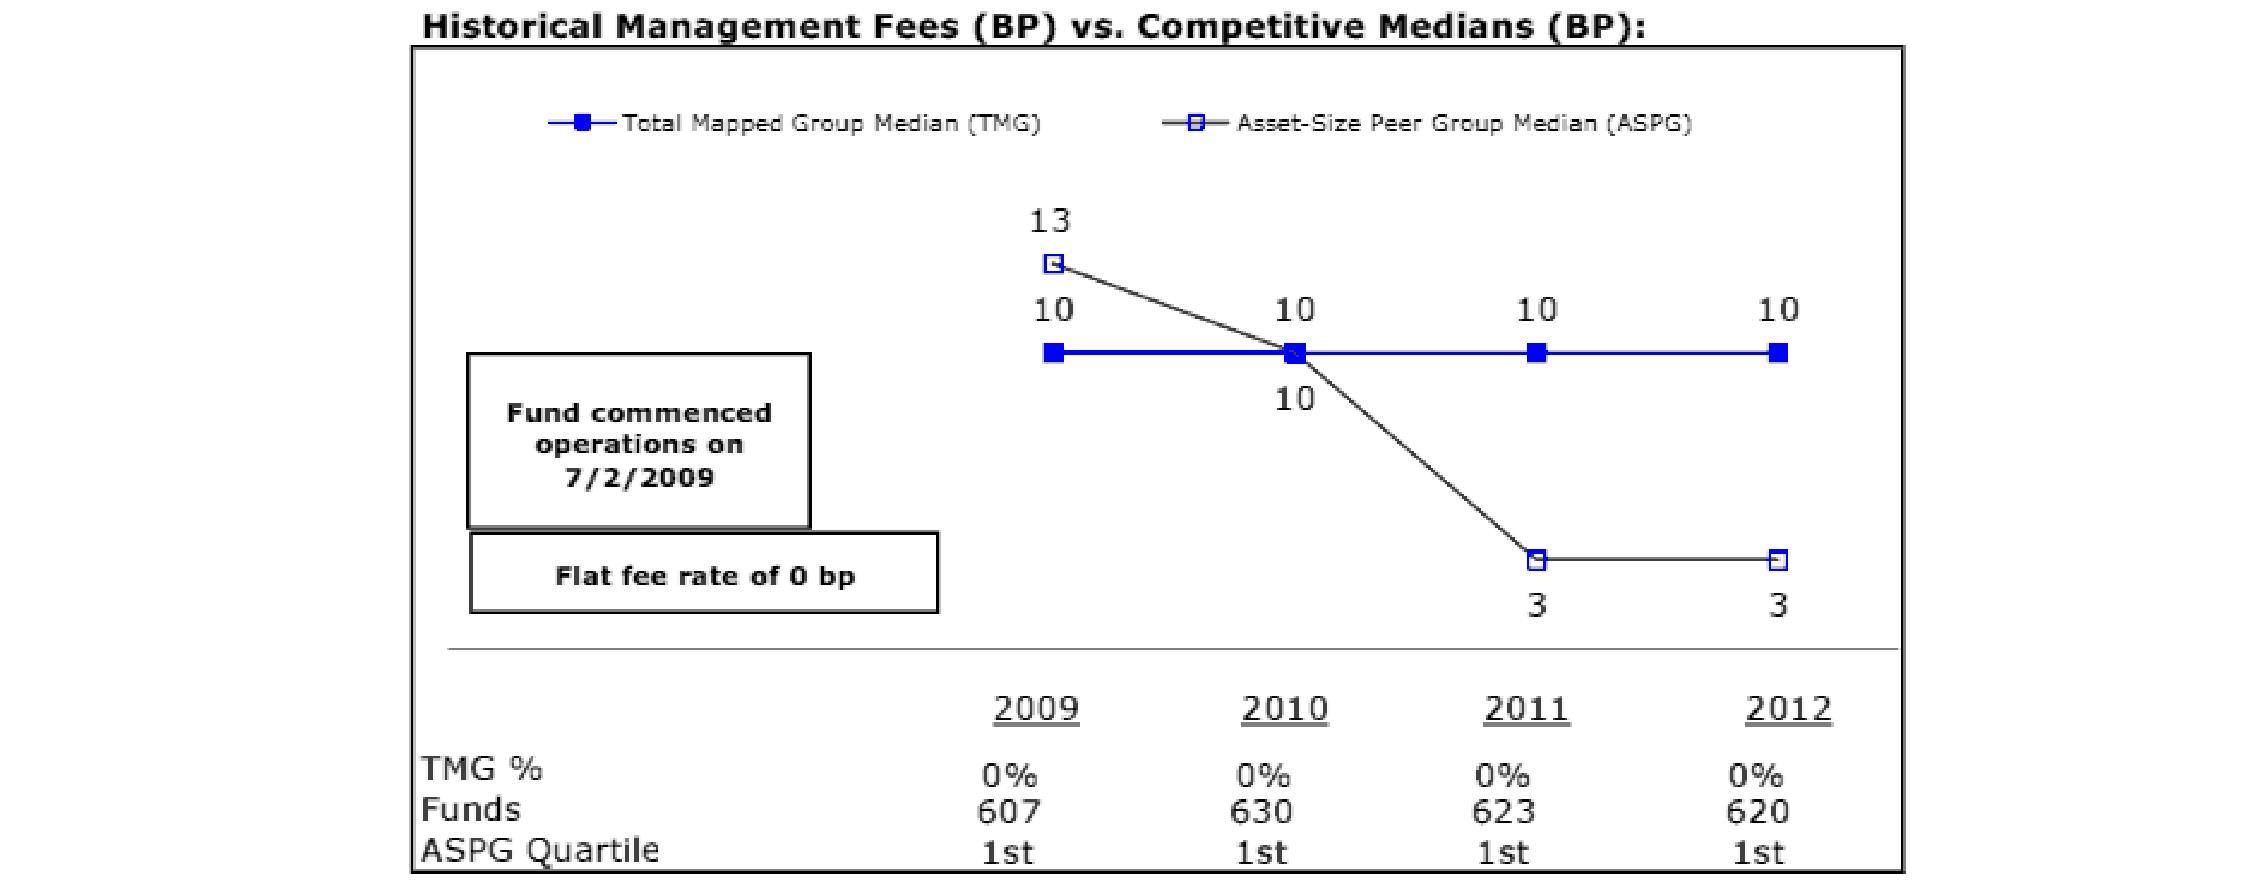
Freedom K® 2015 Fund
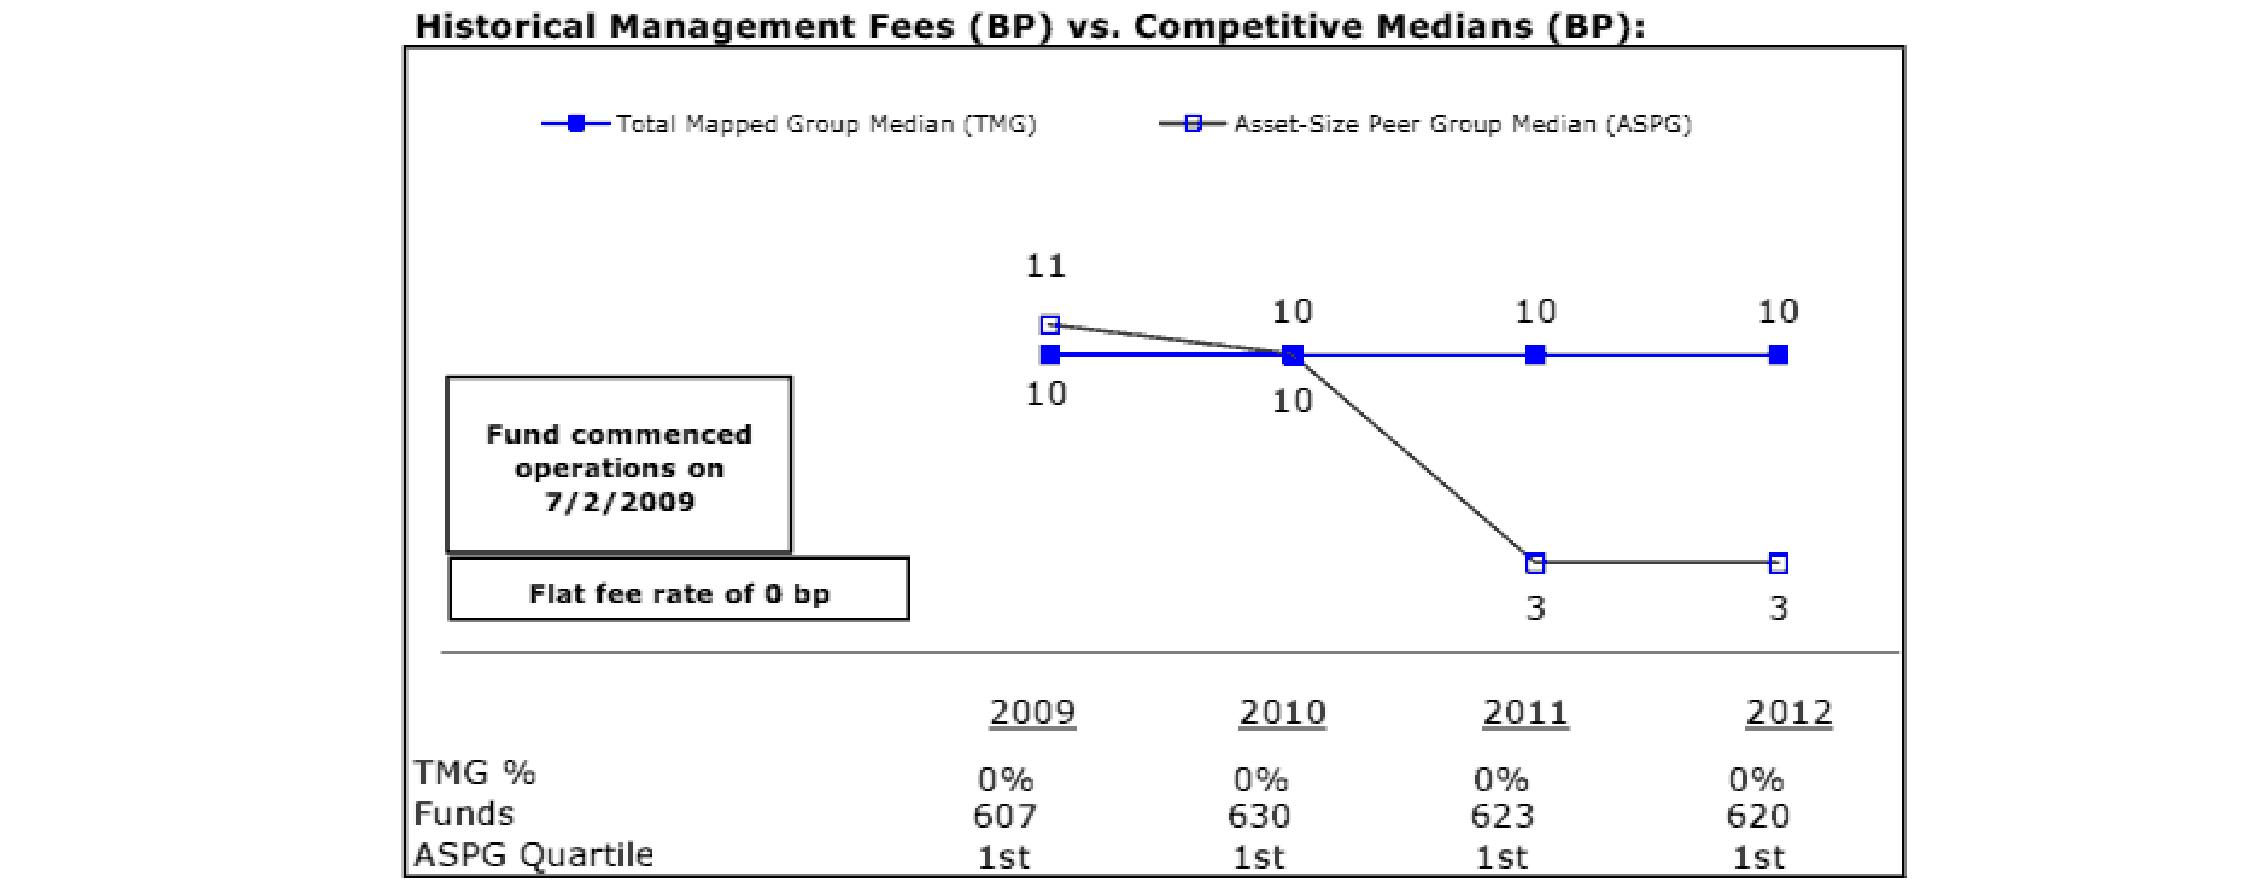
Semiannual Report
Board Approval of Investment Advisory Contracts and Management Fees - continued
Freedom K® 2020 Fund
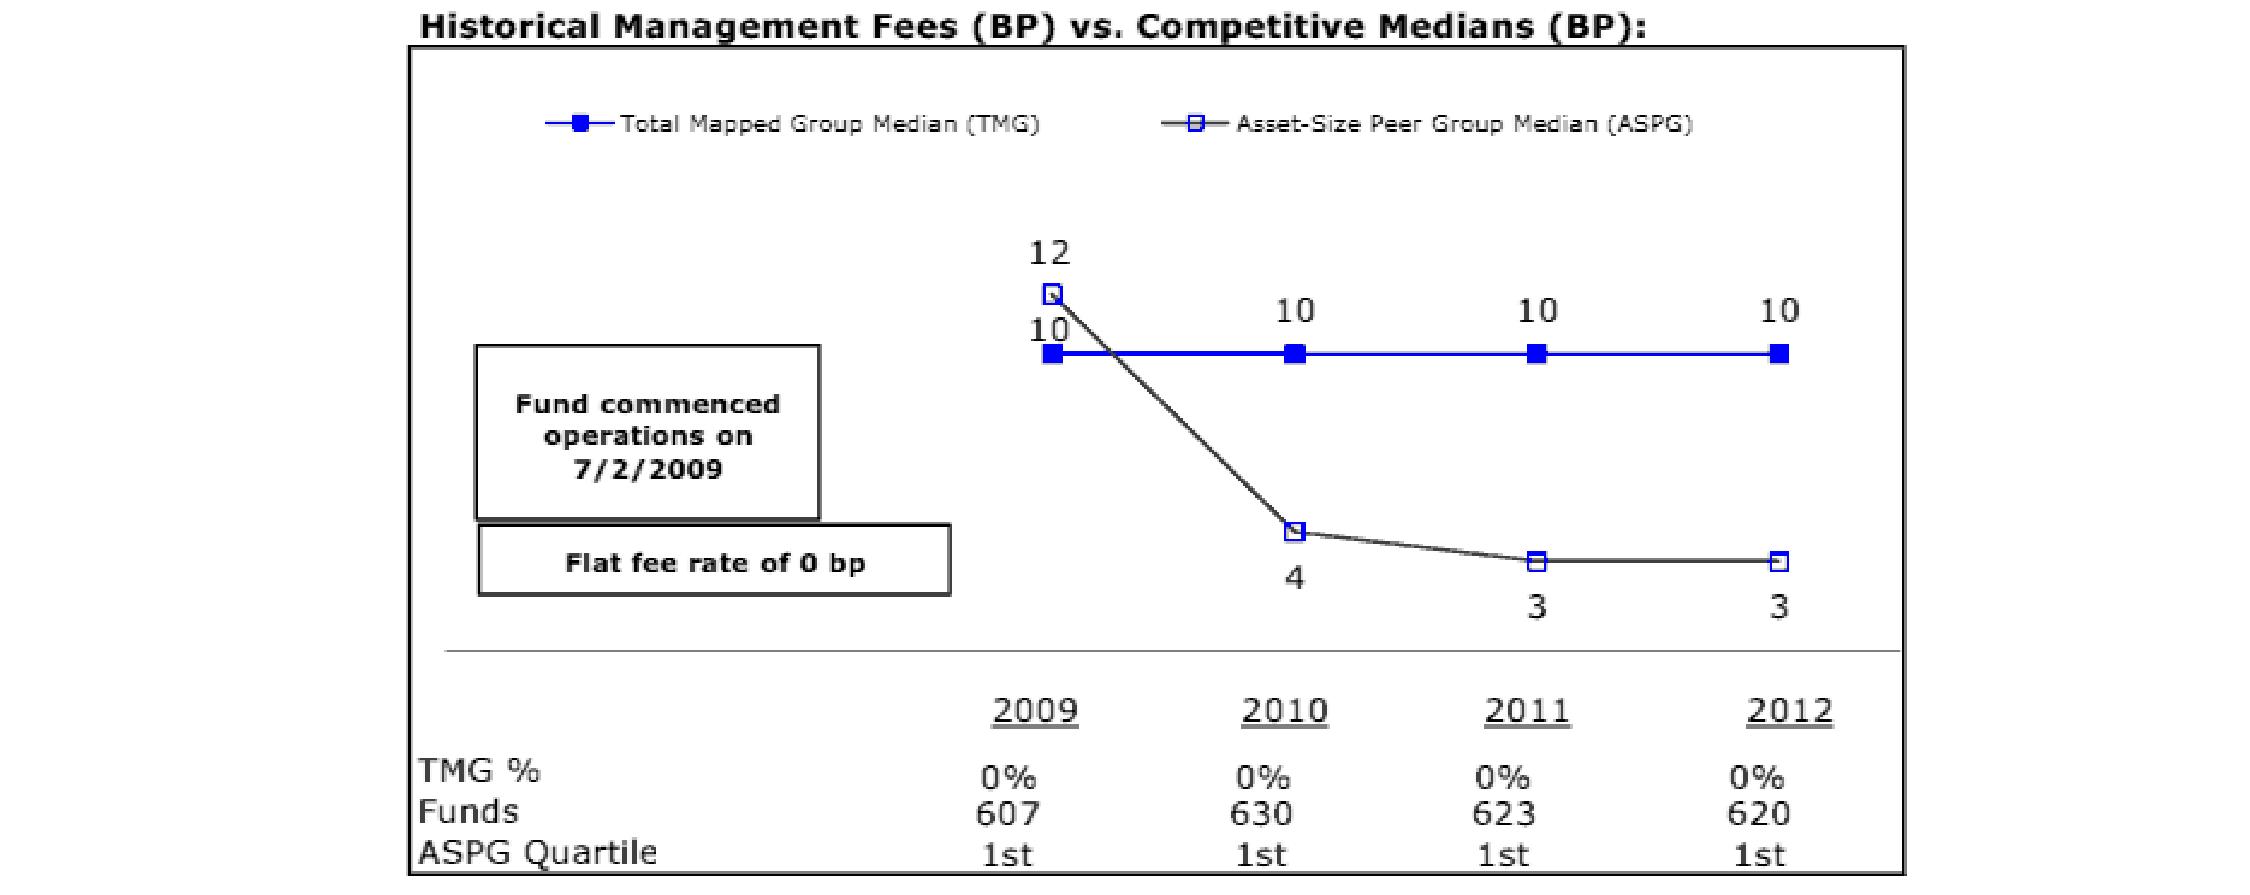
Freedom K® 2025 Fund
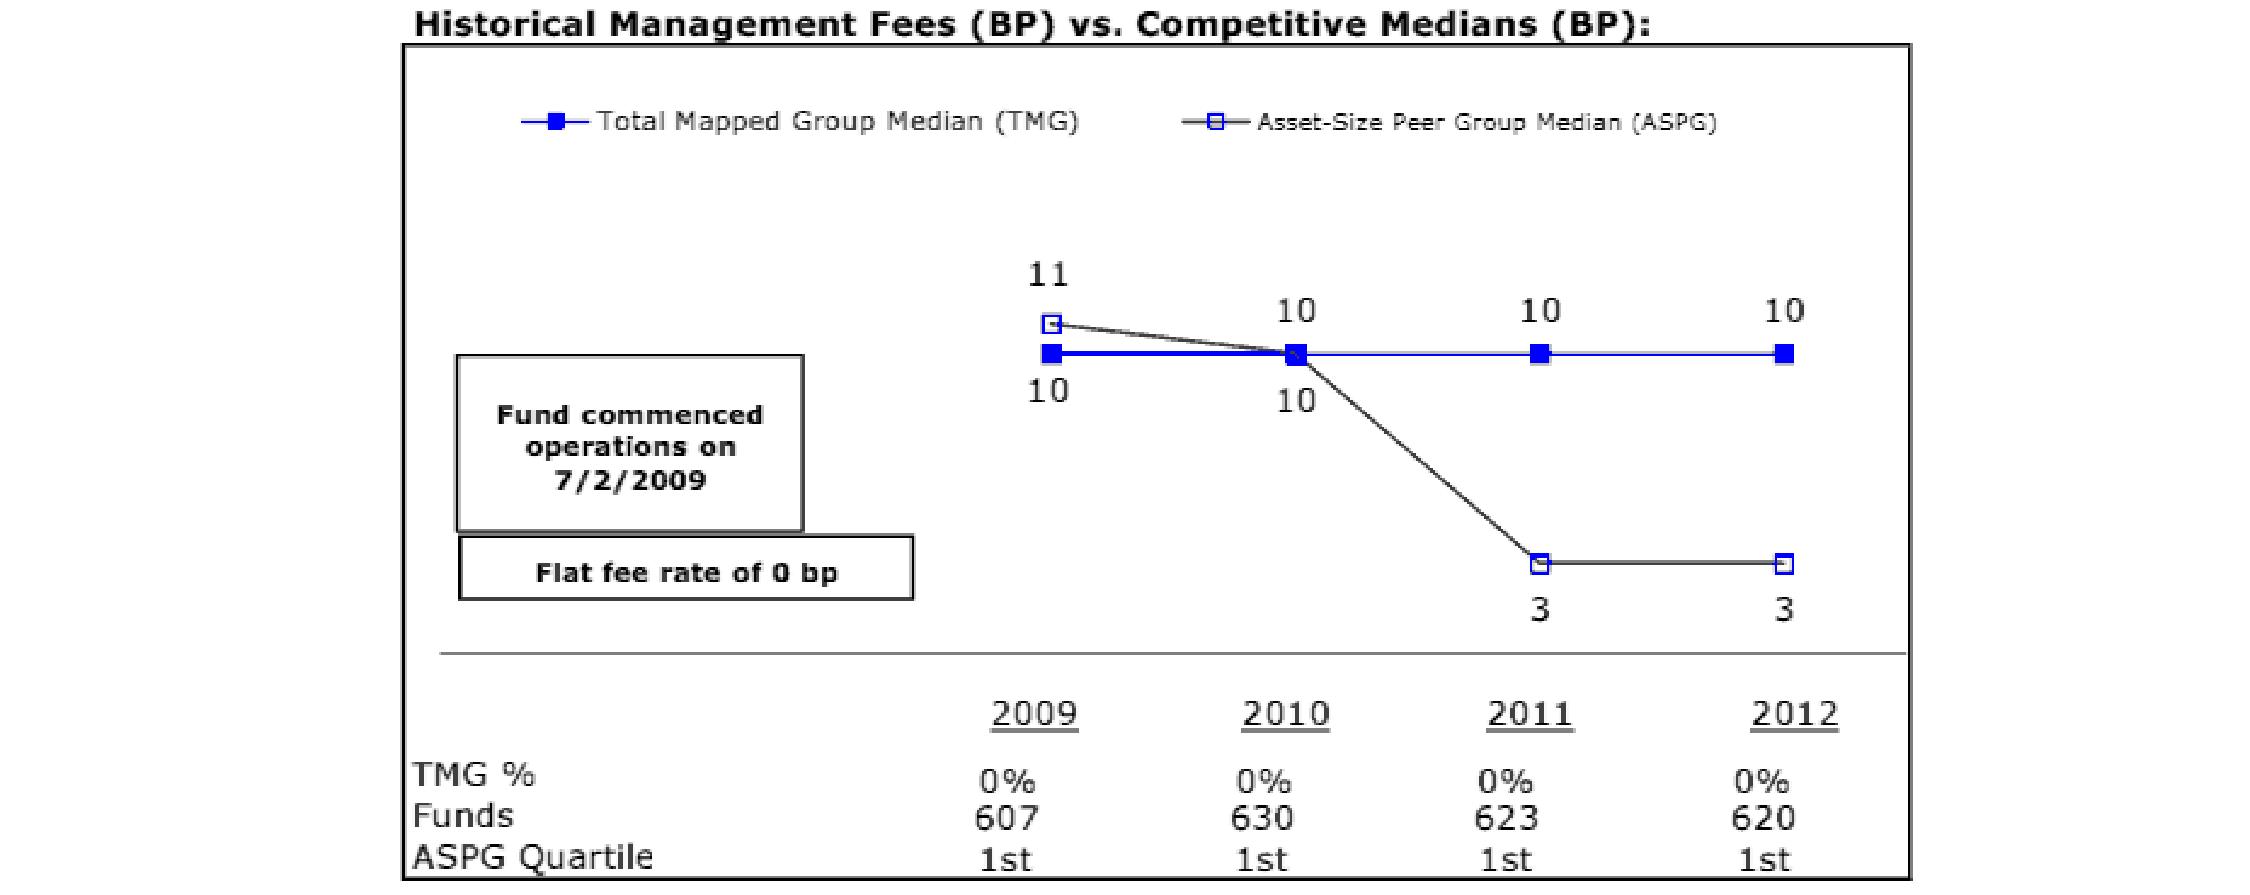
Semiannual Report
Freedom K® 2030 Fund
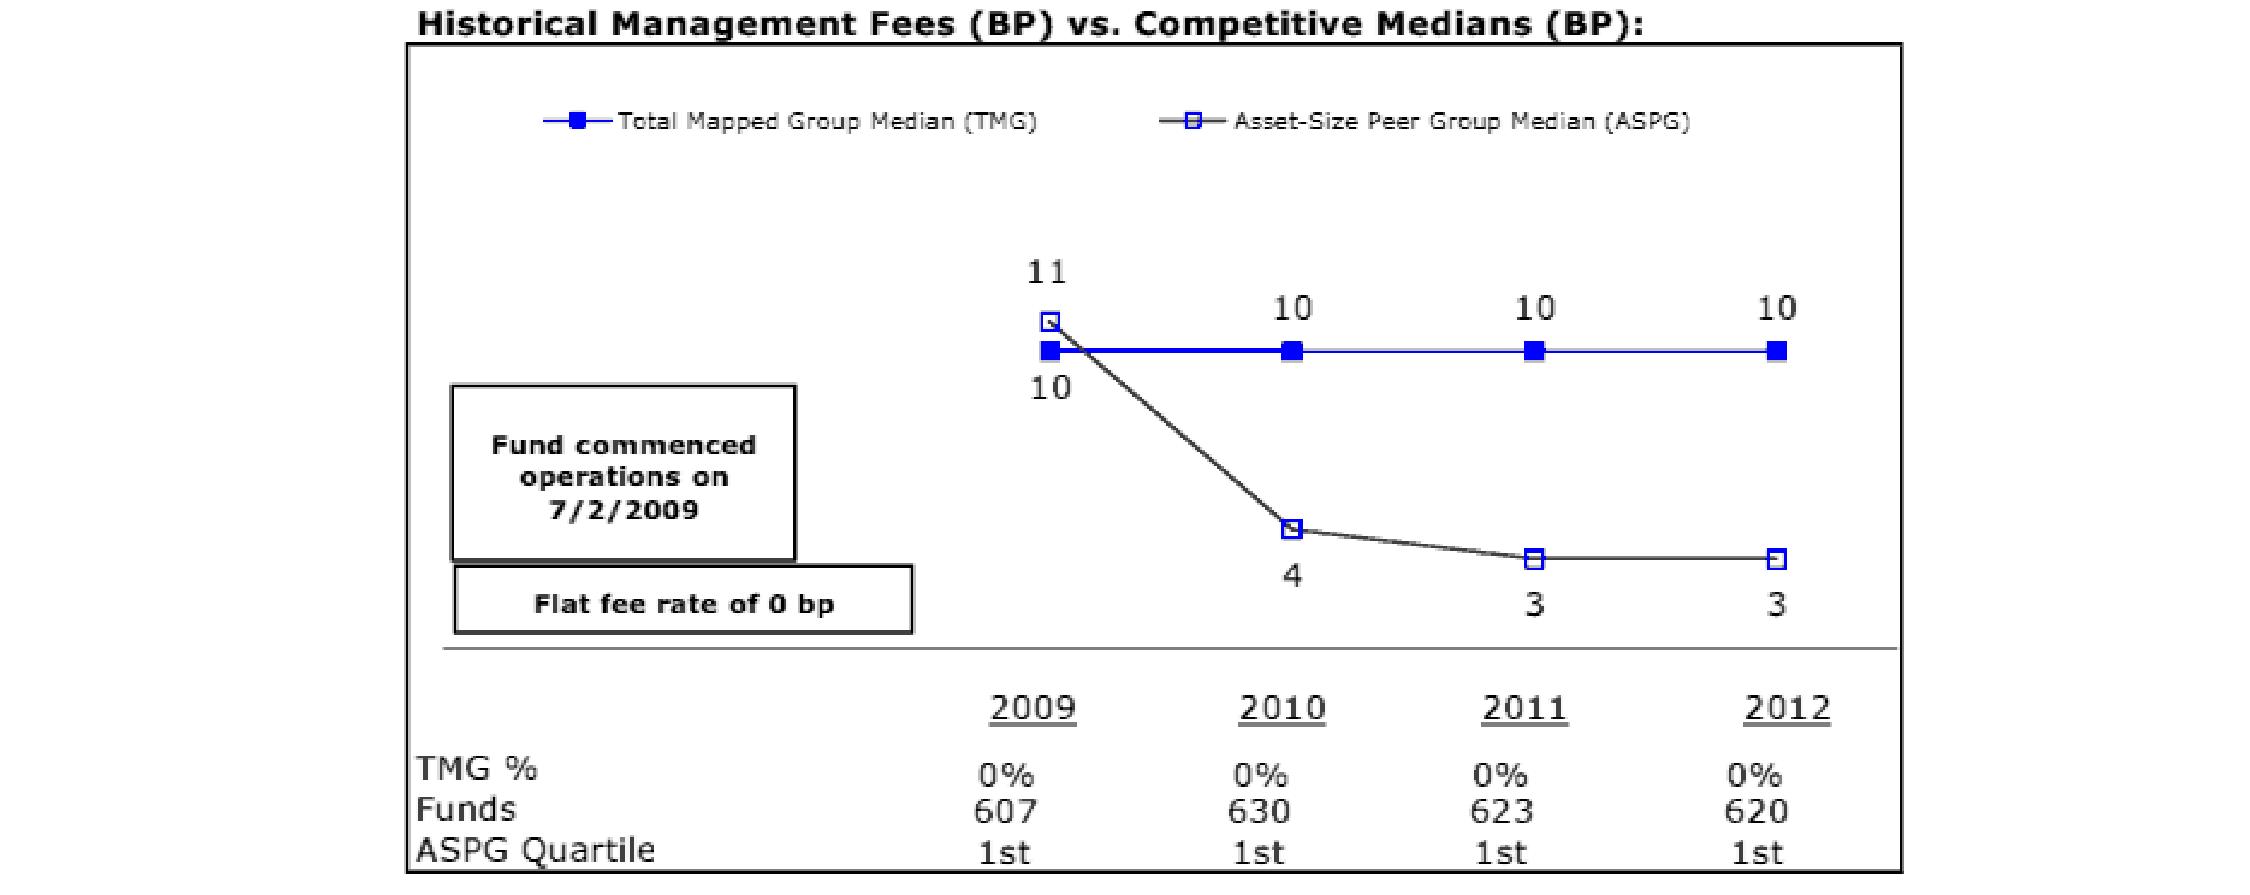
Freedom K® 2035 Fund
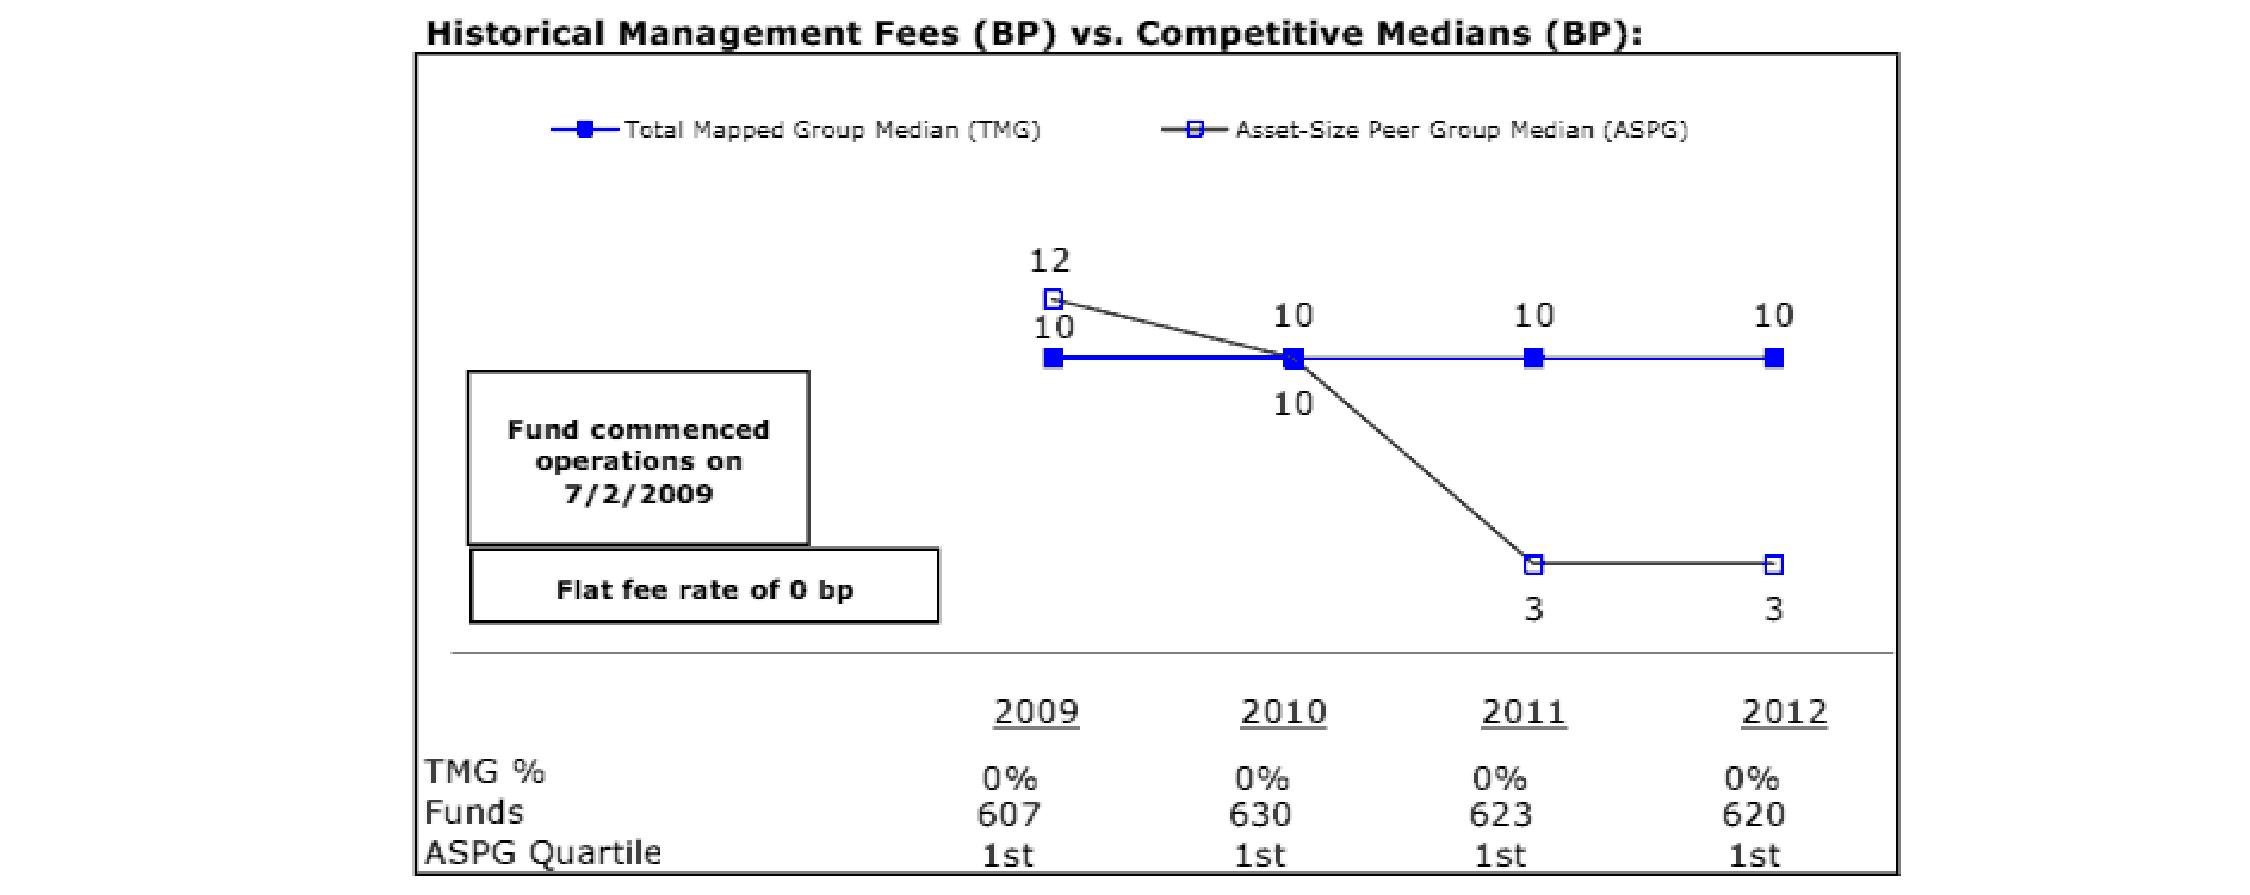
Semiannual Report
Board Approval of Investment Advisory Contracts and Management Fees - continued
Freedom K® 2040 Fund
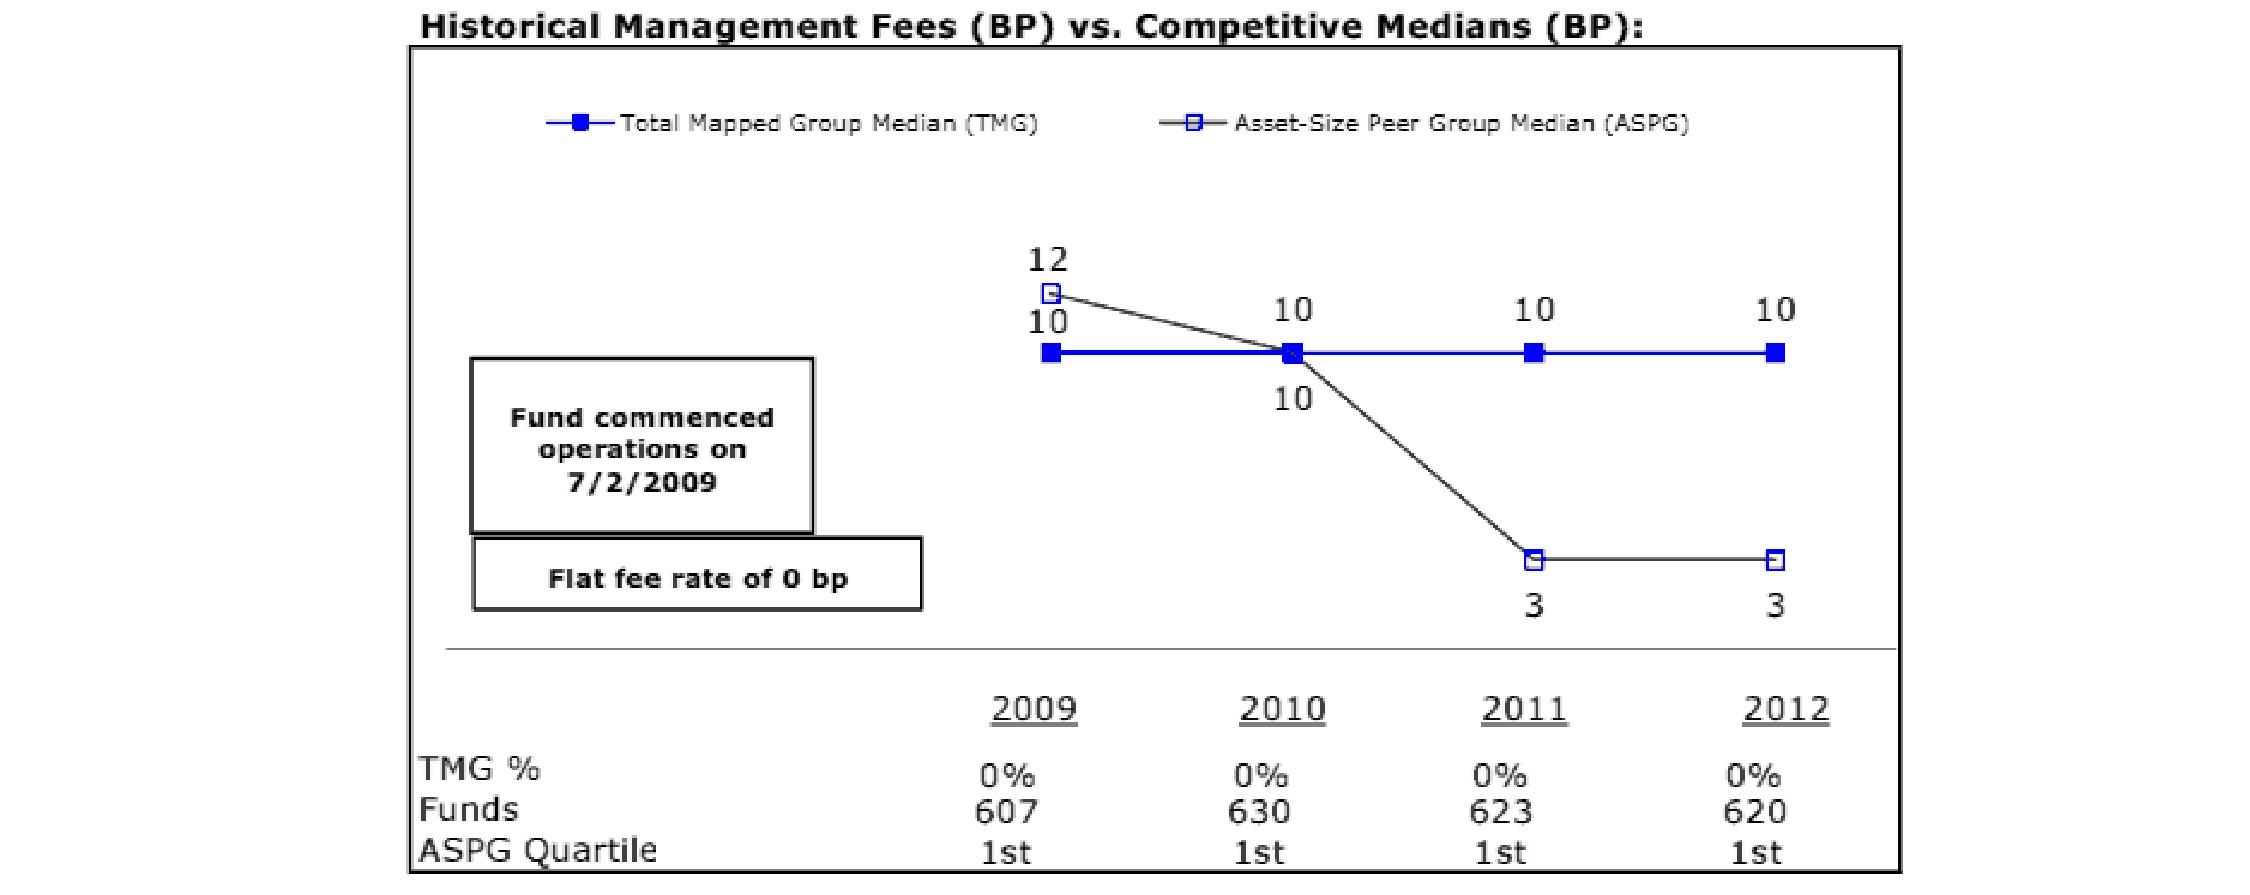
Freedom K® 2045 Fund
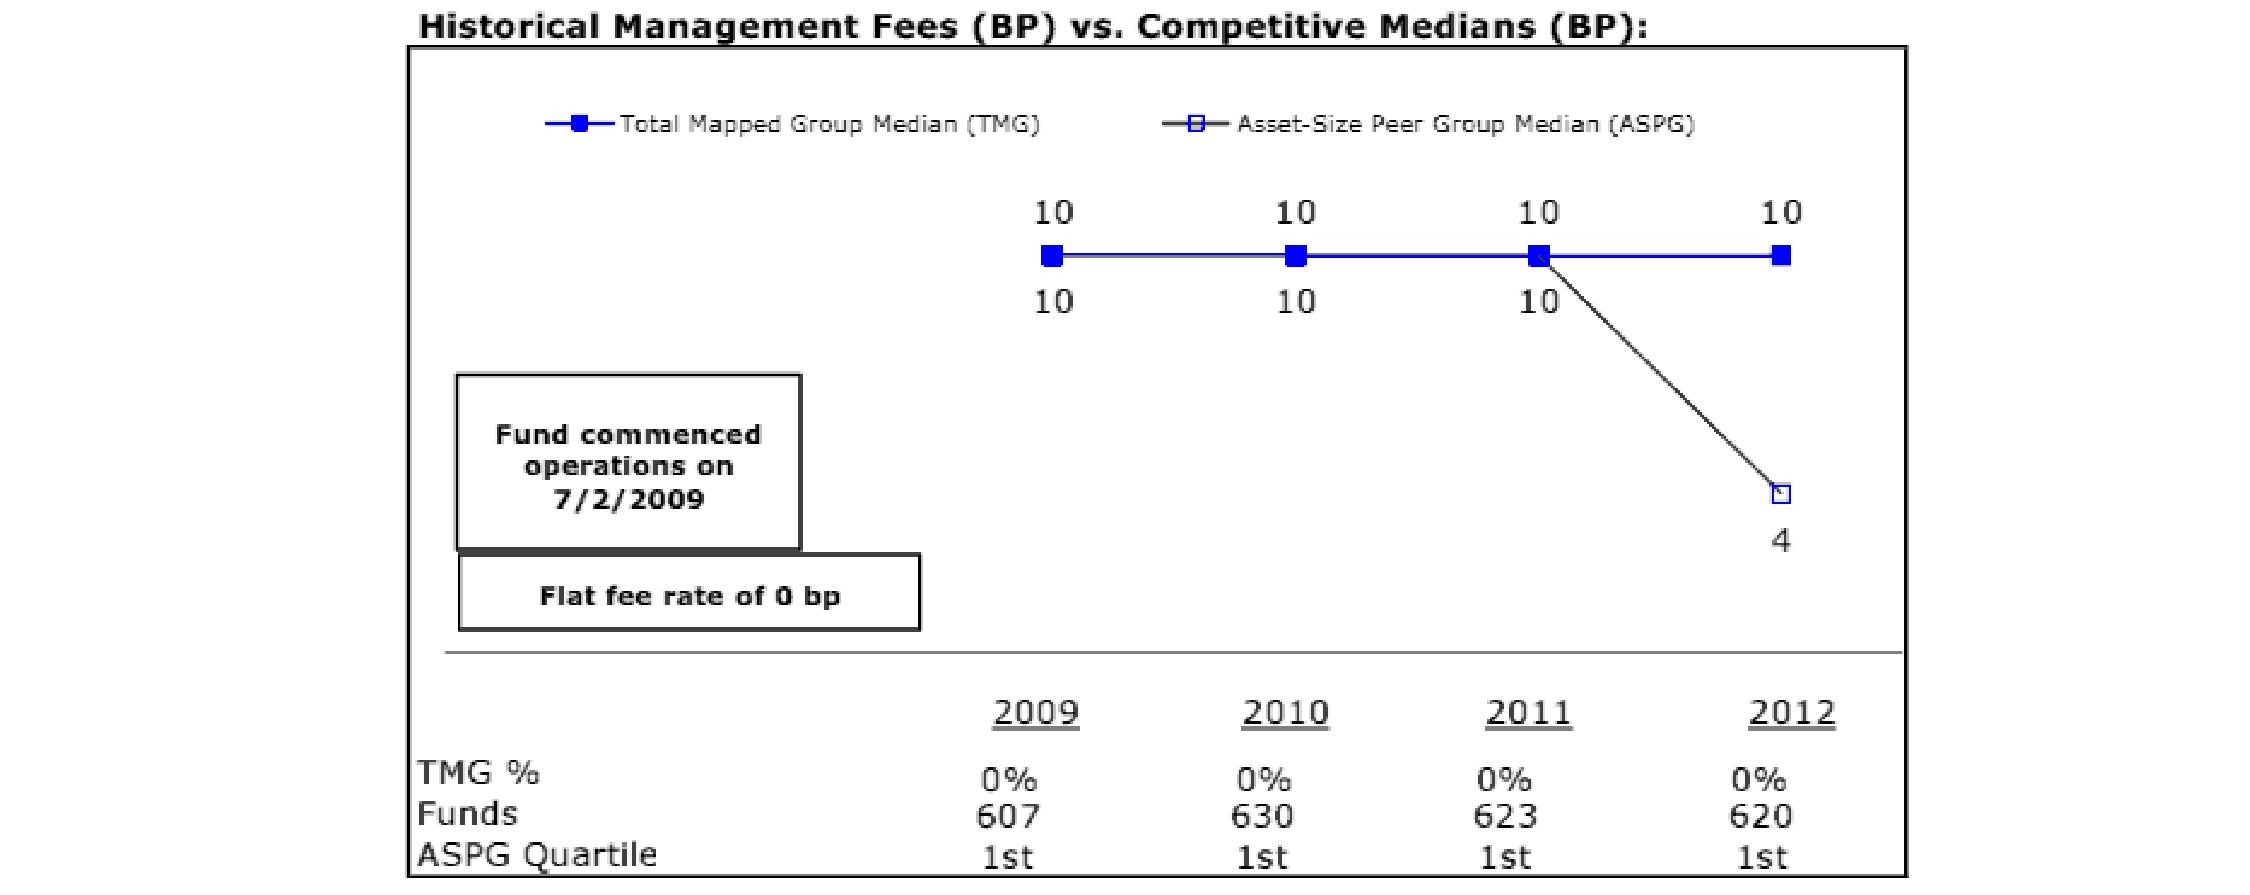
Semiannual Report
Freedom K® 2050 Fund
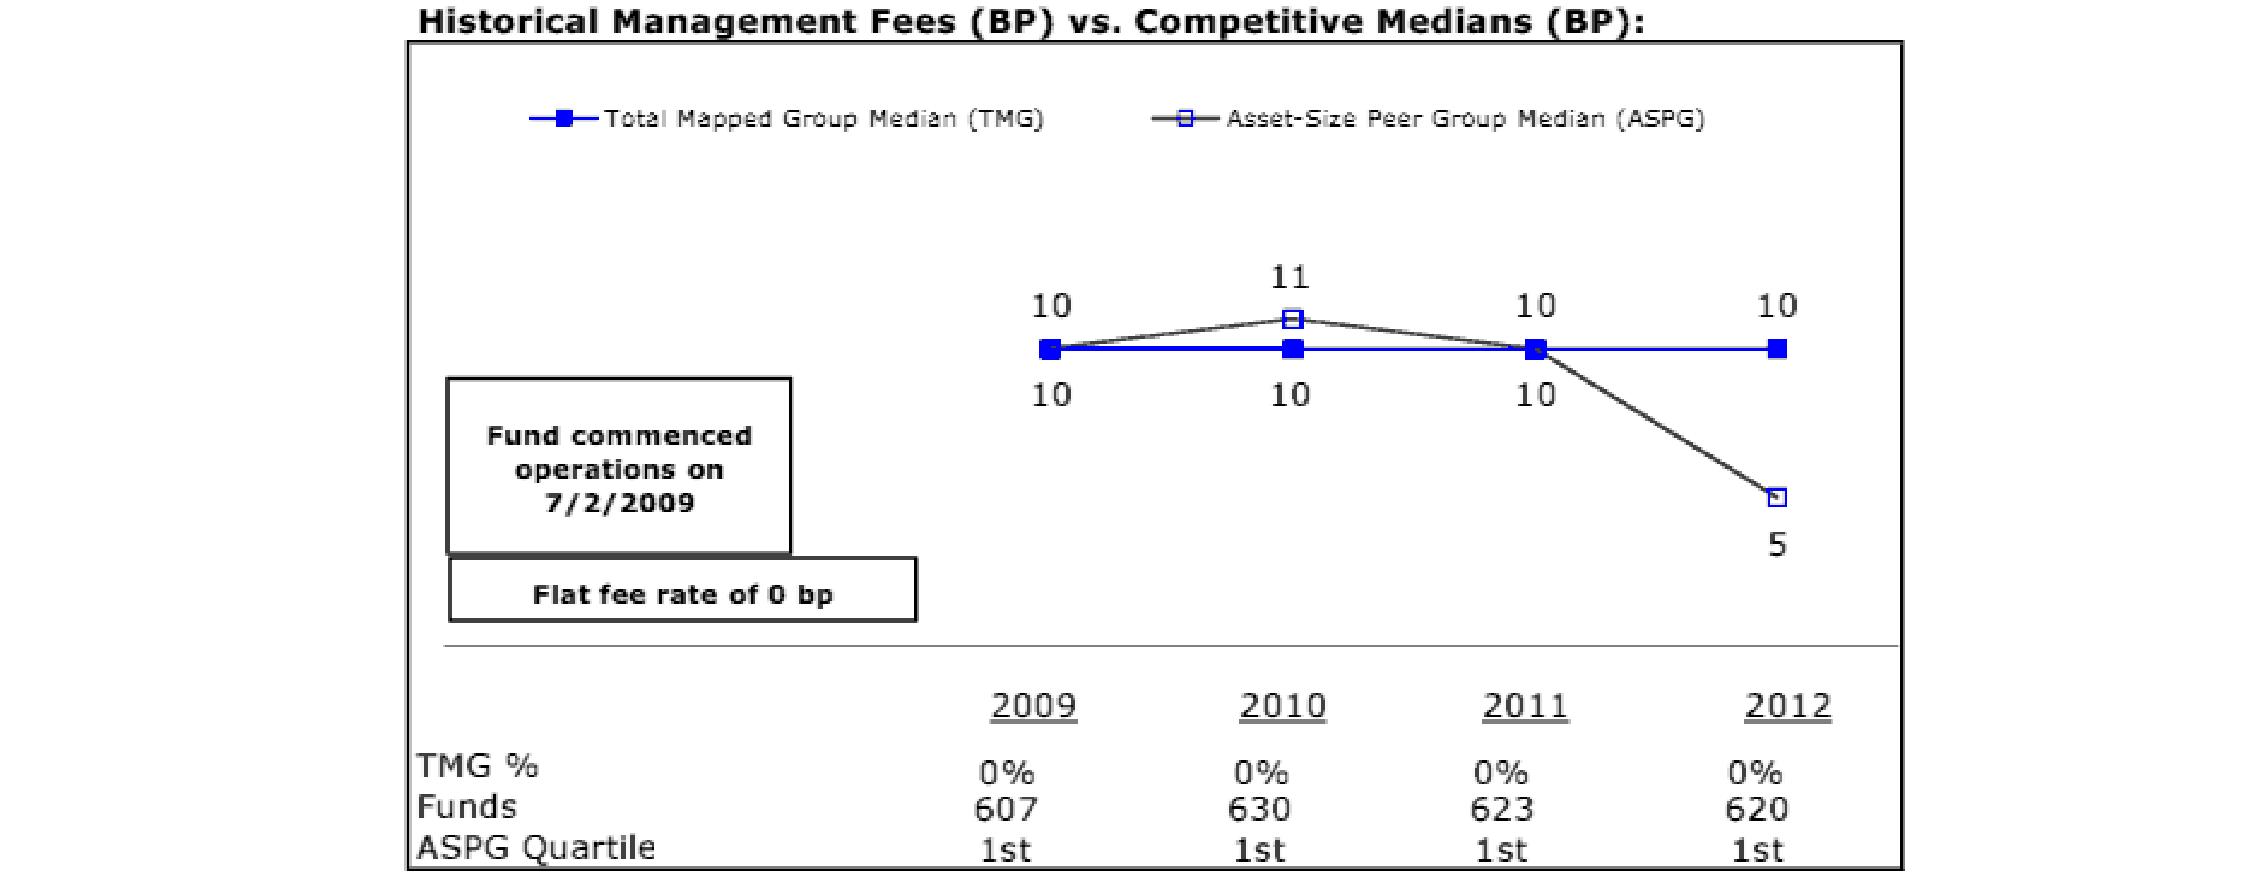
Freedom K® 2055 Fund
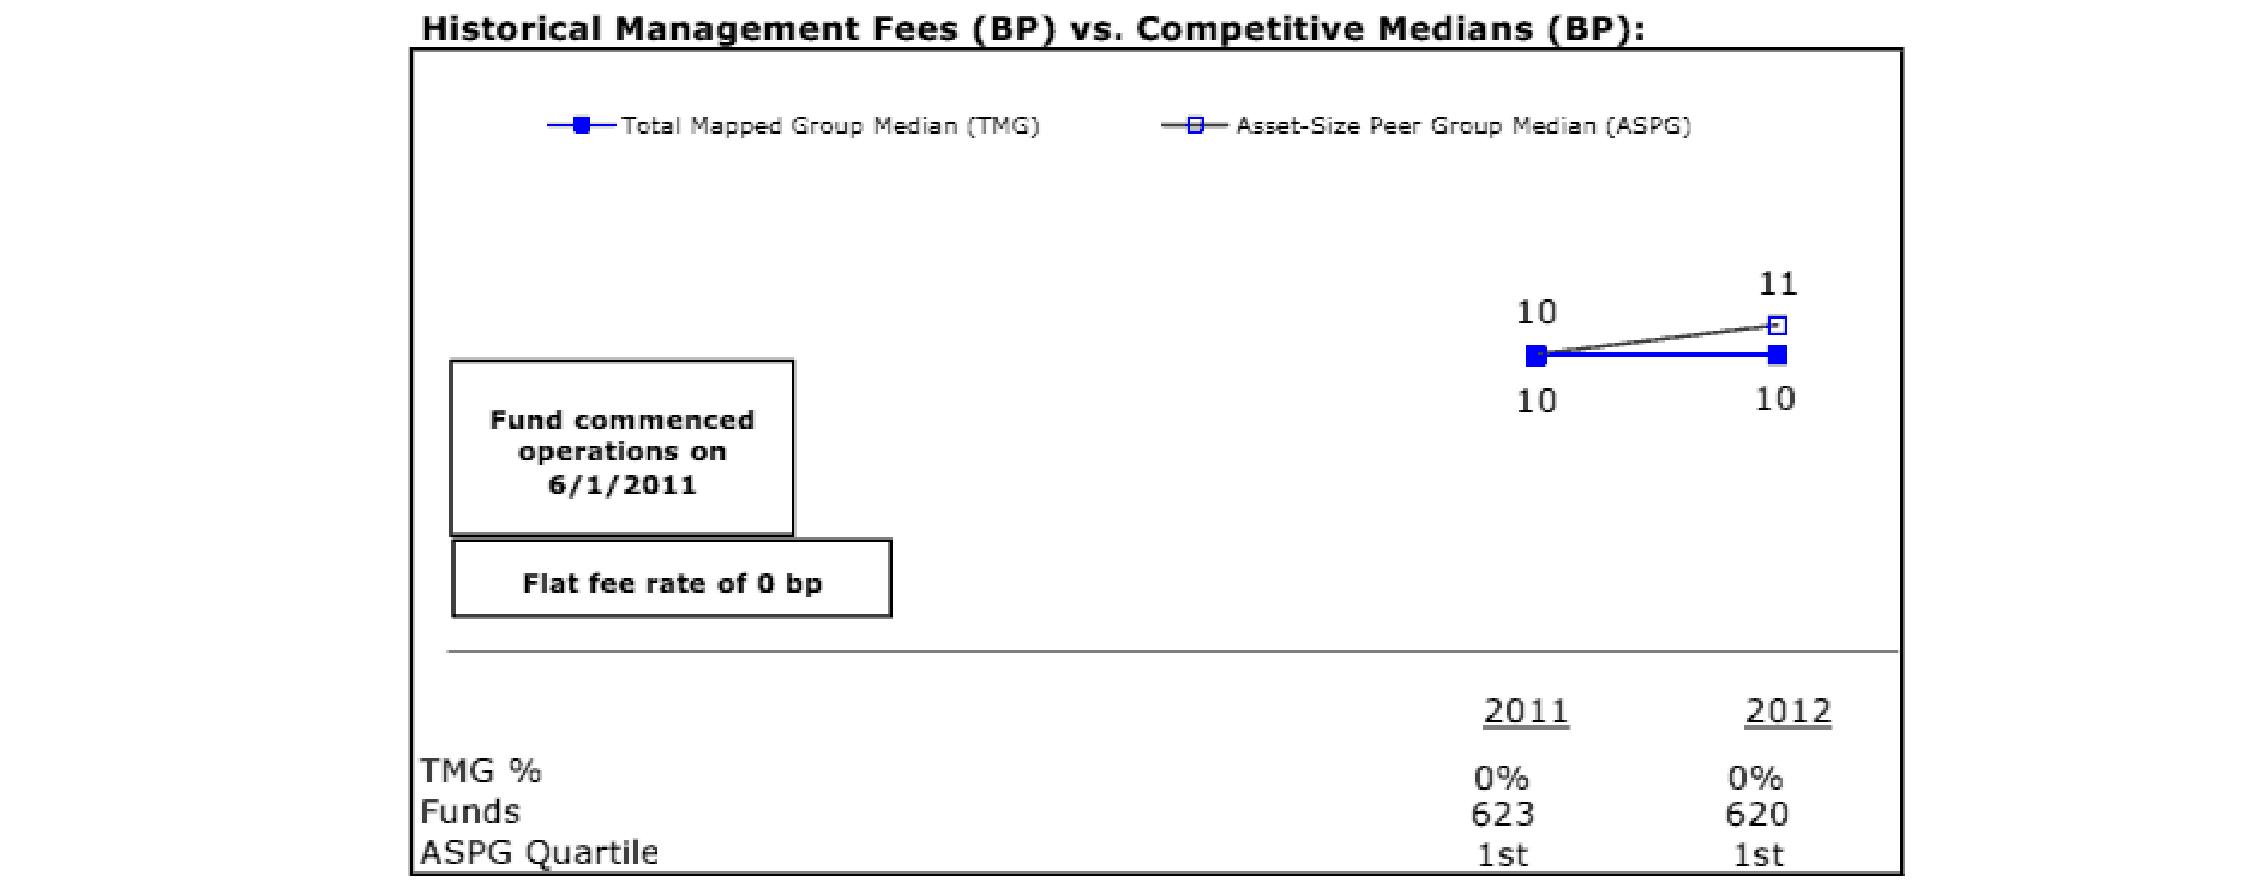
Semiannual Report
Board Approval of Investment Advisory Contracts and Management Fees - continued
Freedom K® Income Fund
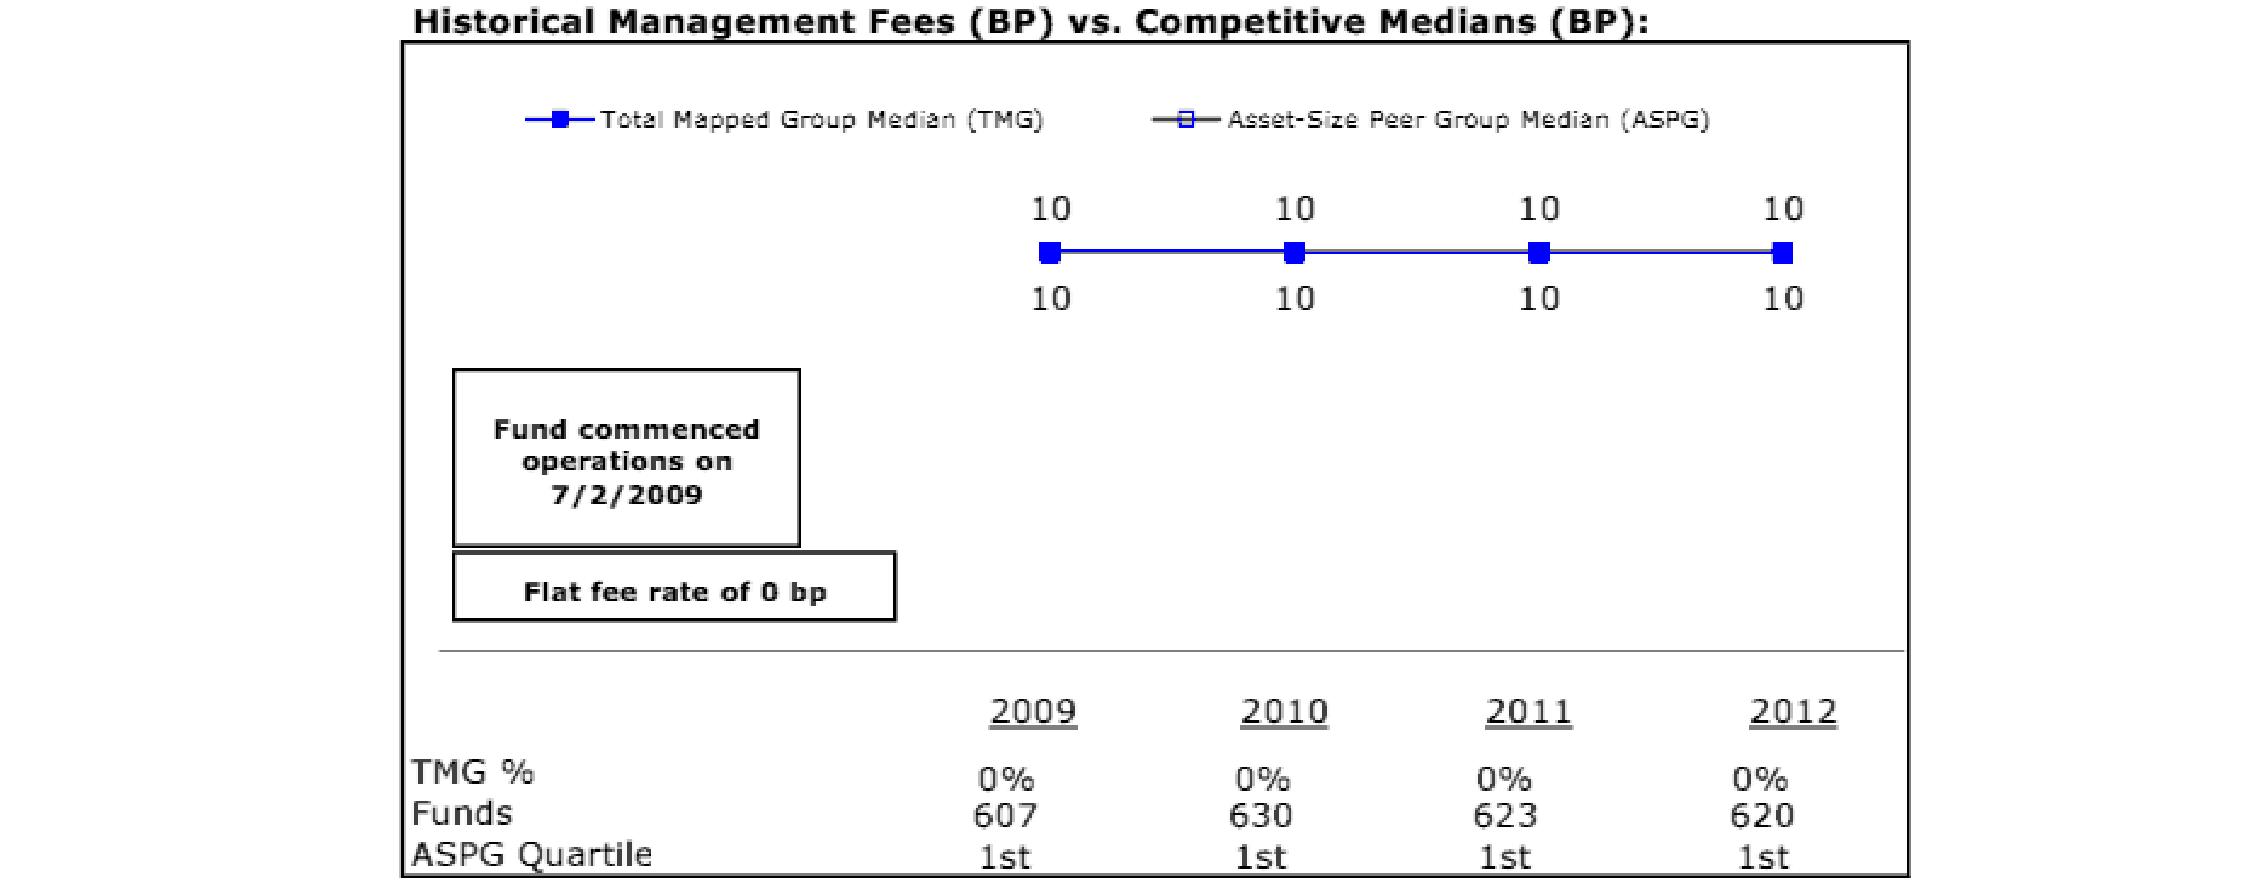
The Board noted that each fund's management fee rate of 0.00% ranked below the median of its Total Mapped Group and below the median of its ASPG for 2012. The Board further noted that many peer funds pay fund-level expenses, including management fees, to which the funds are not subject.
Based on its review, the Board concluded that each fund's management fee is fair and reasonable in light of the services that the fund receives and the other factors considered.
Total Expense Ratio. In its review of each fund's total expense ratio, the Board considered that the funds pay transfer agent fees. The Board further noted that Fidelity Management & Research Company (FMR) pays all other expenses of each fund, with limited exceptions.
The Board noted that each fund's total expense ratio ranked below its competitive median for 2012.
Fees Charged to Other Fidelity Clients. The Board also considered Fidelity fee structures and other information with respect to clients of Fidelity, such as other mutual funds advised or subadvised by Fidelity, pension plan clients, and other institutional clients. The Board noted the findings of the 2013 ad hoc joint committee (created with the board of other Fidelity funds), which reviewed and compared Fidelity's institutional investment advisory business with its business of providing services to the Fidelity funds, including the differences in services provided, fees charged, and costs incurred, as well as competition in their respective marketplaces.
Based on its review of total expense ratios and fees charged to other Fidelity clients, the Board concluded that each fund's total expense ratio was reasonable in light of the services that the fund and its shareholders receive and the other factors considered.
Costs of the Services and Profitability. The Board considered the level of Fidelity's profits in respect of all the Fidelity funds, including the Fidelity funds in which the funds invest.
PricewaterhouseCoopers LLP (PwC), independent registered public accounting firm and auditor to Fidelity and certain Fidelity funds, has been engaged annually by the Board as part of the Board's assessment of Fidelity's profitability analysis. PwC's engagement includes the review and assessment of the methodologies used by Fidelity in determining the revenues and expenses attributable to Fidelity's mutual fund business, and completion of agreed-upon procedures surrounding the mathematical accuracy of fund profitability and its conformity to allocation methodologies. After considering PwC's reports issued under the engagement and information provided by Fidelity, the Board concluded that while other allocation methods may also be reasonable, Fidelity's profitability methodologies are reasonable in all material respects.
The Board also reviewed Fidelity's non-fund businesses and fall-out benefits related to the mutual fund business as well as cases where Fidelity's affiliates may benefit from or be related to the funds' business.
The Board concluded that the costs of the services provided by and the profits realized by Fidelity in connection with the operation of each fund were not relevant to the renewal of each fund's Advisory Contract because the funds do not pay management fees and FMR pays all other expenses of each fund, with limited exceptions.
Economies of Scale. The Board concluded that because the funds do not pay management fees and FMR pays all other expenses of each fund, with limited exceptions, economies of scale cannot be realized by the funds, but may be realized by the other Fidelity funds in which each fund invests, many of which may benefit from breakpoints in the group fee arrangement.
Semiannual Report
Additional Information Requested by the Board. In order to develop fully the factual basis for consideration of the Fidelity funds' Advisory Contracts, the Board requested and received additional information on certain topics, including: (i) Fidelity's fund profitability methodology, profitability trends for certain funds, and the impact of certain factors on fund profitability results; (ii) portfolio manager changes that have occurred during the past year and the amount of the investment that each portfolio manager has made in the Fidelity fund(s) that he or she manages; (iii) Fidelity's compensation structure for portfolio managers, research analysts, and other key personnel, including its effects on fund profitability, the rationale for the compensation structure, and the extent to which current market conditions have affected retention and recruitment; (iv) the arrangements with and compensation paid to certain fund sub-advisers on behalf of the Fidelity funds; (v) Fidelity's fee structures, including the group fee structure and definition of group assets, and the rationale for recommending different fees among different categories of funds and classes; (vi) Fidelity's voluntary waiver of its fees to maintain minimum yields for certain money market funds and classes as well as contractual waivers in place for certain funds; (vii) the methodology with respect to competitive fund data and peer group classifications; (viii) Fidelity's transfer agent fee, expense, and service structures for different funds and classes, and the impact of the increased use of omnibus accounts; and (ix) explanations regarding the relative total expense ratios of certain funds and classes, total expense competitive trends and methodologies for total expense competitive comparisons, and actions that might be taken by Fidelity to reduce total expense ratios for certain funds and classes or to achieve further economies of scale.
Based on its evaluation of all of the conclusions noted above, and after considering all factors it believed relevant, the Board ultimately concluded that the advisory fee structures are fair and reasonable, and that each fund's Advisory Contract should be renewed.
Semiannual Report
Semiannual Report
Investment Adviser
Strategic Advisers, Inc.
Boston, MA
Administrator
Fidelity Management & Research Company
Boston, MA
General Distributor
Fidelity Distributors Corporation
Smithfield, RI
Transfer and Service Agents
Fidelity Investments Institutional
Operations Company, Inc.
Boston, MA
Fidelity Service Company, Inc.
Boston, MA
Custodians
JPMorgan Chase Bank
New York, NY
Income, 2000, 2005, 2010, 2015, 2020, 2025, 2030, 2035, 2040, 2045, 2050
The Bank of New York Mellon
New York, NY
2055
FF-K-USAN-1113
1.892600.104
Fidelity Freedom® Funds -
Income, 2000, 2005, 2010, 2015, 2020, 2025, 2030, 2035, 2040, 2045, 2050, 2055
Semiannual Report
September 30, 2013
(Fidelity Cover Art)
Contents
Semiannual Report
To view a fund's proxy voting guidelines and proxy voting record for the 12-month period ended June 30, visit http://www.fidelity.com/proxyvotingresults or visit the Securities and Exchange Commission's (SEC) web site at http://www.sec.gov. You may also call 1-800-544-8544 to request a free copy of the proxy voting guidelines.
Standard & Poor's, S&P and S&P 500 are registered service marks of The McGraw-Hill Companies, Inc. and have been licensed for use by Fidelity Distributors Corporation.
Other third-party marks appearing herein are the property of their respective owners.
All other marks appearing herein are registered or unregistered trademarks or service marks of FMR LLC or an affiliated company. © 2013 FMR LLC. All rights reserved.
This report and the financial statements contained herein are submitted for the general information of the shareholders of the funds. This report is not authorized for distribution to prospective investors in the funds unless preceded or accompanied by an effective prospectus.
A fund files its complete schedule of portfolio holdings with the SEC for the first and third quarters of each fiscal year on Form N-Q. Forms N-Q are available on the SEC's web site at http://www.sec.gov. A fund's Forms N-Q may be reviewed and copied at the SEC's Public Reference Room in Washington, DC. Information regarding the operation of the SEC's Public Reference Room may be obtained by calling 1-800-SEC-0330. For a complete list of a fund's portfolio holdings, view the most recent holdings listing, semiannual report, or annual report on Fidelity's web site at http://www.fidelity.com, http://www.advisor.fidelity.com, or http://www.401k.com, as applicable.
NOT FDIC INSURED • MAY LOSE VALUE • NO BANK GUARANTEE
Neither the funds nor Fidelity Distributors Corporation is a bank.
Semiannual Report
As a shareholder of a Fund, you incur two types of costs: (1) transaction costs, and (2) ongoing costs, including other Fund expenses. This Example is intended to help you understand your ongoing costs (in dollars) of investing in the Funds and to compare these costs with the ongoing costs of investing in other mutual funds.
The Example is based on an investment of $1,000 invested at the beginning of the period and held for the entire period (April 1, 2013 to September 30, 2013).
Actual Expenses
The first line of the accompanying table for each fund provides information about actual account values and actual expenses. You may use the information in this line, together with the amount you invested, to estimate the expenses that you paid over the period. Simply divide your account value by $1,000.00 (for example, an $8,600 account value divided by $1,000.00 = 8.6), then multiply the result by the number in the first line for a fund under the heading entitled "Expenses Paid During Period" to estimate the expenses you paid on your account during this period. A small balance maintenance fee of $12.00 that is charged once a year may apply for certain accounts with a value of less than $2,000. This fee is not included in the table below. If it was, the estimate of expenses you paid during the period would be higher, and your ending account value lower, by this amount. In addition, each Fund, as a shareholder in underlying Fidelity Funds, will indirectly bear its pro-rata share of the fees and expenses incurred by the underlying Fidelity Funds. These fees and expenses are not included in each Fund's annualized expense ratio used to calculate the expense estimates in the table below.
Hypothetical Example for Comparison Purposes
The second line of the accompanying table for each fund provides information about hypothetical account values and hypothetical expenses based on a fund's actual expense ratio and an assumed rate of return of 5% per year before expenses, which is not the Fund's actual return. The hypothetical account values and expenses may not be used to estimate the actual ending account balance or expenses you paid for the period. You may use this information to compare the ongoing costs of investing in the Fund and other funds. To do so, compare this 5% hypothetical example with the 5% hypothetical examples that appear in the shareholder reports of the other funds. A small balance maintenance fee of $12.00 that is charged once a year may apply for certain accounts with a value of less than $2,000. This fee is not included in the table below. If it was, the estimate of expenses you paid during the period would be higher, and your ending account value lower, by this amount. In addition, each Fund, as a shareholder in underlying Fidelity Funds, will indirectly bear its pro-rata share of the fees and expenses incurred by the underlying Fidelity Funds. These fees and expenses are not included in each Fund's annualized expense ratio used to calculate the expense estimates in the table below.
Please note that the expenses shown in the table are meant to highlight your ongoing costs only and do not reflect any transaction costs. Therefore, the second line of the table is useful in comparing ongoing costs only, and will not help you determine the relative total costs of owning different funds.
| Annualized
Expense Ratio B | Beginning
Account Value
April 1, 2013 | Ending
Account Value
September 30, 2013 | Expenses Paid
During Period*
April 1, 2013
to September 30, 2013 |
Freedom Income | 0.0% | | | |
Actual | | $ 1,000.00 | $ 1,007.70 | $ - |
HypotheticalA | | $ 1,000.00 | $ 1,025.07 | $ - |
Freedom 2000 | 0.0% | | | |
Actual | | $ 1,000.00 | $ 1,008.30 | $ - |
HypotheticalA | | $ 1,000.00 | $ 1,025.07 | $ - |
Freedom 2005 | 0.0% | | | |
Actual | | $ 1,000.00 | $ 1,020.60 | $ - |
HypotheticalA | | $ 1,000.00 | $ 1,025.07 | $ - |
Freedom 2010 | 0.0% | | | |
Actual | | $ 1,000.00 | $ 1,030.40 | $ - |
HypotheticalA | | $ 1,000.00 | $ 1,025.07 | $ - |
Freedom 2015 | 0.0% | | | |
Actual | | $ 1,000.00 | $ 1,032.50 | $ - |
HypotheticalA | | $ 1,000.00 | $ 1,025.07 | $ - |
Freedom 2020 | 0.0% | | | |
Actual | | $ 1,000.00 | $ 1,036.80 | $ - |
HypotheticalA | | $ 1,000.00 | $ 1,025.07 | $ - |
Freedom 2025 | 0.0% | | | |
Actual | | $ 1,000.00 | $ 1,049.20 | $ - |
HypotheticalA | | $ 1,000.00 | $ 1,025.07 | $ - |
Freedom 2030 | 0.0% | | | |
Actual | | $ 1,000.00 | $ 1,053.70 | $ - |
HypotheticalA | | $ 1,000.00 | $ 1,025.07 | $ - |
| Annualized
Expense Ratio B | Beginning
Account Value
April 1, 2013 | Ending
Account Value
September 30, 2013 | Expenses Paid
During Period*
April 1, 2013
to September 30, 2013 |
Freedom 2035 | 0.0% | | | |
Actual | | $ 1,000.00 | $ 1,065.10 | $ - |
HypotheticalA | | $ 1,000.00 | $ 1,025.07 | $ - |
Freedom 2040 | 0.0% | | | |
Actual | | $ 1,000.00 | $ 1,067.30 | $ - |
HypotheticalA | | $ 1,000.00 | $ 1,025.07 | $ - |
Freedom 2045 | 0.0% | | | |
Actual | | $ 1,000.00 | $ 1,069.00 | $ - |
HypotheticalA | | $ 1,000.00 | $ 1,025.07 | $ - |
Freedom 2050 | 0.0% | | | |
Actual | | $ 1,000.00 | $ 1,070.40 | $ - |
HypotheticalA | | $ 1,000.00 | $ 1,025.07 | $ - |
Freedom 2055 | 0.0% | | | |
Actual | | $ 1,000.00 | $ 1,073.60 | $ - |
HypotheticalA | | $ 1,000.00 | $ 1,025.07 | $ - |
A 5% return per year before expenses
B Annualized expense ratio reflects expenses net of applicable fee waivers.
* Expenses are equal to each Fund's annualized expense ratio, multiplied by the average account value over the period, multiplied by 183/365 (to reflect the one-half year period). The fees and expenses of the underlying Fidelity Funds in which the Funds invest are not included in the Fund's annualized expense ratio.
Semiannual Report
Fidelity Freedom Income Fund
Investment Changes (Unaudited)
The information in the following tables is based on the direct investments of the Fund. |
Fund Holdings as of September 30, 2013 |
| % of fund's
net assets | % of fund's net assets
6 months ago |
Commodity Funds | | |
Fidelity Series Commodity Strategy Fund | 1.9 | 1.9 |
Domestic Equity Funds | | |
Fidelity Blue Chip Growth Fund | 1.5 | 1.3 |
Fidelity Disciplined Equity Fund | 0.0 | 0.3 |
Fidelity Growth Company Fund | 1.9 | 1.8 |
Fidelity Series 100 Index Fund | 0.5 | 0.5 |
Fidelity Series All-Sector Equity Fund | 2.0 | 2.0 |
Fidelity Series Equity-Income Fund | 1.3 | 1.3 |
Fidelity Series Growth & Income Fund (formerly Fidelity Series Mega Cap Fund) | 0.5 | 0.5 |
Fidelity Series Intrinsic Opportunities Fund | 1.0 | 0.8 |
Fidelity Series Large Cap Value Fund | 1.0 | 1.1 |
Fidelity Series Opportunistic Insights Fund | 1.0 | 0.9 |
Fidelity Series Real Estate Equity Fund | 0.2 | 0.2 |
Fidelity Series Small Cap Opportunities Fund | 0.6 | 0.5 |
Fidelity Series Stock Selector Large Cap Value Fund | 1.2 | 1.3 |
Fidelity Small Cap Growth Fund | 0.3 | 0.3 |
Fidelity Small Cap Value Fund | 0.3 | 0.3 |
| 13.3 | 13.1 |
Developed International Equity Funds | |
Fidelity Series International Growth Fund | 2.1 | 2.0 |
Fidelity Series International Small Cap Fund | 0.4 | 0.4 |
Fidelity Series International Value Fund | 2.0 | 2.0 |
| 4.5 | 4.4 |
Emerging Markets Equity Funds | | |
Fidelity Series Emerging Markets Fund | 1.2 | 1.2 |
High Yield Bond Funds | | |
Fidelity Series Emerging Markets Debt Fund | 0.5 | 0.5 |
Fidelity Series Floating Rate High Income Fund | 1.1 | 1.2 |
Fidelity Series High Income Fund | 4.9 | 4.9 |
Fidelity Series Real Estate Income Fund | 0.4 | 0.4 |
| 6.9 | 7.0 |
Inflation-Protected Bond Funds | | |
Fidelity Series Inflation-Protected Bond Index Fund | 11.0 | 11.4 |
Investment Grade Bond Funds | | |
Fidelity Series Investment Grade Bond Fund | 21.6 | 21.5 |
Short-Term Funds | | |
Fidelity Institutional Money Market Portfolio Institutional Class | 21.8 | 21.7 |
Fidelity Short-Term Bond Fund | 17.8 | 17.8 |
| 39.6 | 39.5 |
Net Other Assets (Liabilities)* | 0.0 | 0.0 |
| 100.0 | 100.0 |
* Amount represents less than 0.1% |
Asset Allocation (% of fund's net assets) |
Period end |
 | Commodity Funds | 1.9% | |
 | Domestic Equity Funds | 13.3% | |
 | Developed International Equity Funds | 4.5% | |
 | Emerging Markets Equity Funds | 1.2% | |
 | High Yield Bond Funds | 6.9% | |
 | Inflation-Protected Bond Funds | 11.0% | |
 | Investment Grade Bond Funds | 21.6% | |
 | Short-Term Funds | 39.6% | |

Six months ago |
| Commodity Funds | 1.9% | |
| Domestic Equity Funds | 13.1% | |
| Developed International Equity Funds | 4.4% | |
| Emerging Markets Equity Funds | 1.2% | |
| High Yield Bond Funds | 7.0% | |
| Inflation-Protected Bond Funds | 11.4% | |
| Investment Grade Bond Funds | 21.5% | |
| Short-Term Funds | 39.5% | |

Semiannual Report
Fidelity Freedom Income Fund
Investments September 30, 2013 (Unaudited)
Showing Percentage of Net Assets
Domestic Equity Funds - 15.2% |
| Shares | | Value |
Commodity Funds - 1.9% |
Fidelity Series Commodity Strategy Fund (a)(c) | 4,787,708 | | $ 38,349,538 |
Domestic Equity Funds - 13.3% |
Fidelity Blue Chip Growth Fund (c) | 527,186 | | 30,792,948 |
Fidelity Growth Company Fund (c) | 325,504 | | 38,660,070 |
Fidelity Series 100 Index Fund (c) | 842,140 | | 9,330,916 |
Fidelity Series All-Sector Equity Fund (c) | 2,855,372 | | 40,432,065 |
Fidelity Series Equity-Income Fund (c) | 2,305,549 | | 27,159,364 |
Fidelity Series Growth & Income Fund (c) | 849,334 | | 10,242,965 |
Fidelity Series Intrinsic Opportunities Fund (c) | 1,610,591 | | 20,905,475 |
Fidelity Series Large Cap Value Fund (c) | 1,681,361 | | 21,235,591 |
Fidelity Series Opportunistic Insights Fund (c) | 1,649,777 | | 21,232,624 |
Fidelity Series Real Estate Equity Fund (c) | 348,150 | | 4,163,869 |
Fidelity Series Small Cap Opportunities Fund (c) | 878,090 | | 11,265,900 |
Fidelity Series Stock Selector Large Cap Value Fund (c) | 2,002,066 | | 24,385,165 |
Fidelity Small Cap Growth Fund (c) | 325,540 | | 6,087,604 |
Fidelity Small Cap Value Fund (c) | 317,107 | | 6,018,682 |
TOTAL DOMESTIC EQUITY FUNDS | | 271,913,238 |
TOTAL DOMESTIC EQUITY FUNDS (Cost $234,779,270) |
310,262,776
|
International Equity Funds - 5.7% |
| | | |
Developed International Equity Funds - 4.5% |
Fidelity Series International Growth Fund (c) | 3,033,213 | | 41,160,700 |
Fidelity Series International Small Cap Fund (c) | 549,474 | | 8,401,464 |
Fidelity Series International Value Fund (c) | 3,818,699 | | 41,051,017 |
TOTAL DEVELOPED INTERNATIONAL EQUITY FUNDS | | 90,613,181 |
Emerging Markets Equity Funds - 1.2% |
Fidelity Series Emerging Markets Fund (c) | 1,502,499 | | 25,151,825 |
TOTAL INTERNATIONAL EQUITY FUNDS (Cost $94,662,888) |
115,765,006
|
Bond Funds - 39.5% |
| Shares | | Value |
High Yield Bond Funds - 6.9% |
Fidelity Series Emerging Markets Debt Fund (c) | 1,035,814 | | $ 10,482,440 |
Fidelity Series Floating Rate High Income Fund (c) | 2,198,593 | | 23,261,112 |
Fidelity Series High Income Fund (c) | 9,767,023 | | 100,404,998 |
Fidelity Series Real Estate Income Fund (c) | 660,082 | | 7,247,706 |
TOTAL HIGH YIELD BOND FUNDS | | 141,396,256 |
Inflation-Protected Bond Funds - 11.0% |
Fidelity Series Inflation-Protected Bond Index Fund (c) | 20,794,536 | | 225,620,719 |
Investment Grade Bond Funds - 21.6% |
Fidelity Series Investment Grade Bond Fund (c) | 39,443,537 | | 441,373,172 |
TOTAL BOND FUNDS (Cost $768,874,239) |
808,390,147
|
Short-Term Funds - 39.6% |
| | | |
Fidelity Institutional Money Market Portfolio Institutional Class 0.04% (b)(c) | 444,943,486 | | 444,943,486 |
Fidelity Short-Term Bond Fund (c) | 42,551,787 | | 365,094,332 |
TOTAL SHORT-TERM FUNDS (Cost $813,938,383) |
810,037,818
|
TOTAL INVESTMENT PORTFOLIO - 100.0% (Cost $1,912,254,780) | 2,044,455,747 |
NET OTHER ASSETS (LIABILITIES) - 0.0% | | (9,091) |
NET ASSETS - 100% | $ 2,044,446,656 |
Legend |
(a) Non-income producing |
(b) The rate quoted is the annualized seven-day yield of the fund at period end. |
(c) Affiliated company |
Affiliated Underlying Funds |
Information regarding the Fund's fiscal year to date purchases and sales of the affiliated Underlying Funds and income earned by the Fund from investments in affiliated Underlying Funds is as follows: |
Affiliate | Value,
beginning of
period | Purchases | Sales
Proceeds | Dividend
Income | Value,
end of
period |
Fidelity Blue Chip Growth Fund | $ 29,550,512 | $ 1,814,380 | $ 3,280,370 | $ 74,236 | $ 30,792,948 |
Fidelity Disciplined Equity Fund | 6,471,462 | 7,891 | 6,781,787 | - | - |
Fidelity Growth Company Fund | 39,532,972 | 175,007 | 7,313,912 | - | 38,660,070 |
Fidelity Institutional Money Market Portfolio Institutional Class | 475,076,345 | 8,246,661 | 38,379,518 | 264,488 | 444,943,486 |
Fidelity Series 100 Index Fund | 10,058,863 | 44,340 | 1,485,331 | - | 9,330,916 |
Fidelity Series All-Sector Equity Fund | 43,443,824 | 178,240 | 7,356,700 | - | 40,432,065 |
Fidelity Series Commodity Strategy Fund | 41,898,415 | 3,048,076 | 3,360,605 | - | 38,349,538 |
Fidelity Series Emerging Markets Debt Fund | 11,658,104 | 361,187 | 731,899 | 290,721 | 10,482,440 |
Fidelity Series Emerging Markets Fund | 26,453,092 | 851,364 | 2,159,631 | - | 25,151,825 |
Fidelity Series Equity-Income Fund | 27,580,149 | 435,368 | 2,487,859 | 278,525 | 27,159,364 |
Fidelity Series Floating Rate High Income Fund | 25,249,630 | 675,920 | 2,550,845 | 527,136 | 23,261,112 |
Fidelity Series Growth & Income Fund (formerly Fidelity Series Mega Cap Fund) | 10,075,586 | 166,850 | 931,331 | - | 10,242,965 |
Fidelity Series High Income Fund | 108,369,867 | 4,415,189 | 10,091,723 | 2,716,887 | 100,404,998 |
Fidelity Series Inflation-Protected Bond Index Fund | 249,889,843 | 6,246,802 | 18,840,909 | - | 225,620,719 |
Fidelity Series International Growth Fund | 43,822,625 | 222,237 | 5,717,650 | - | 41,160,700 |
Fidelity Series International Small Cap Fund | 8,972,020 | 43,834 | 1,509,694 | - | 8,401,464 |
Fidelity Series International Value Fund | 43,630,979 | 226,312 | 6,533,702 | - | 41,051,017 |
Fidelity Series Intrinsic Opportunities Fund | 18,436,302 | 1,593,394 | 1,849,058 | 124,307 | 20,905,475 |
Fidelity Series Investment Grade Bond Fund | 471,536,497 | 19,086,342 | 35,423,491 | 4,722,614 | 441,373,172 |
Fidelity Series Large Cap Value Fund | 25,177,407 | 71,177 | 6,070,115 | - | 21,235,591 |
Fidelity Series Opportunistic Insights Fund | 20,136,167 | 98,545 | 2,227,315 | - | 21,232,624 |
Fidelity Series Real Estate Equity Fund | 4,218,184 | 711,118 | 393,181 | 28,875 | 4,163,869 |
Fidelity Series Real Estate Income Fund | 8,061,268 | 398,072 | 764,904 | 220,870 | 7,247,706 |
Fidelity Series Small Cap Opportunities Fund | 11,333,546 | 876,859 | 1,432,841 | - | 11,265,900 |
Fidelity Series Stock Selector Large Cap Value Fund | 27,676,866 | 125,018 | 5,752,125 | - | 24,385,165 |
Fidelity Short-Term Bond Fund | 390,811,762 | 6,653,886 | 31,431,859 | 1,442,401 | 365,094,332 |
Fidelity Small Cap Growth Fund | 6,072,452 | 674,215 | 899,279 | - | 6,087,604 |
Fidelity Small Cap Value Fund | 6,512,618 | 407,602 | 974,437 | 9,540 | 6,018,682 |
Total | $ 2,191,707,357 | $ 57,855,886 | $ 206,732,071 | $ 10,700,600 | $ 2,044,455,747 |
Other Information |
All investments are categorized as Level 1 under the Fair Value Hierarchy. The inputs or methodology used for valuing securities may not be an indication of the risk associated with investing in those securities. For more information on valuation inputs, please refer to the Investment Valuation section in the accompanying Notes to Financial Statements. |
See accompanying notes which are an integral part of the financial statements.
Semiannual Report
Fidelity Freedom Income Fund
Statement of Assets and Liabilities
| September 30, 2013 (Unaudited) |
| | |
Assets | | |
Investment in securities, at value (cost $1,912,254,780) - See accompanying schedule | | $ 2,044,455,747 |
Cash | | 13 |
Receivable for investments sold | | 919,837 |
Receivable for fund shares sold | | 2,249,686 |
Total assets | | 2,047,625,283 |
| | |
Liabilities | | |
Payable for fund shares redeemed | | 3,178,627 |
| | |
Net Assets | | $ 2,044,446,656 |
Net Assets consist of: | | |
Paid in capital | | $ 1,896,083,663 |
Undistributed net investment income | | 2,332,845 |
Accumulated undistributed net realized gain (loss) on investments | | 13,829,181 |
Net unrealized appreciation (depreciation) on investments | | 132,200,967 |
Net Assets, for 173,666,954 shares outstanding | | $ 2,044,446,656 |
Net Asset Value, offering price and redemption price per share ($2,044,446,656 ÷ 173,666,954 shares) | | $ 11.77 |
Statement of Operations
Six months ended September 30, 2013 (Unaudited) |
| | |
Investment Income | | |
Income distributions from underlying funds | | $ 10,700,600 |
| | |
Expenses | | |
Independent trustees' compensation | $ 3,992 | |
Total expenses before reductions | 3,992 | |
Expense reductions | (3,992) | - |
Net investment income (loss) | | 10,700,600 |
Realized and Unrealized Gain (Loss) Realized gain (loss) on sale of underlying fund shares | 11,631,395 | |
Capital gain distributions from underlying funds | 3,947,908 | |
Total net realized gain (loss) | | 15,579,303 |
Change in net unrealized appreciation (depreciation) on underlying funds | | (10,006,818) |
Net gain (loss) | | 5,572,485 |
Net increase (decrease) in net assets resulting from operations | | $ 16,273,085 |
See accompanying notes which are an integral part of the financial statements.
Semiannual Report
Fidelity Freedom Income Fund
Financial Statements - continued
Statement of Changes in Net Assets
| Six months ended
September 30, 2013
(Unaudited) | Year ended
March 31,
2013 |
Increase (Decrease) in Net Assets | | |
Operations | | |
Net investment income (loss) | $ 10,700,600 | $ 30,039,521 |
Net realized gain (loss) | 15,579,303 | 80,163,065 |
Change in net unrealized appreciation (depreciation) | (10,006,818) | (5,809,253) |
Net increase (decrease) in net assets resulting from operations | 16,273,085 | 104,393,333 |
Distributions to shareholders from net investment income | (10,426,406) | (30,676,109) |
Distributions to shareholders from net realized gain | (31,503,011) | (15,315,416) |
Total distributions | (41,929,417) | (45,991,525) |
Share transactions
Proceeds from sales of shares | 224,562,531 | 576,179,291 |
Reinvestment of distributions | 41,310,007 | 45,296,041 |
Cost of shares redeemed | (387,435,320) | (871,916,280) |
Net increase (decrease) in net assets resulting from share transactions | (121,562,782) | (250,440,948) |
Total increase (decrease) in net assets | (147,219,114) | (192,039,140) |
| | |
Net Assets | | |
Beginning of period | 2,191,665,770 | 2,383,704,910 |
End of period (including undistributed net investment income of $2,332,845 and undistributed net investment income of $2,058,651, respectively) | $ 2,044,446,656 | $ 2,191,665,770 |
Other Information Shares | | |
Sold | 19,111,175 | 49,200,613 |
Issued in reinvestment of distributions | 3,502,312 | 3,877,974 |
Redeemed | (33,016,298) | (74,491,637) |
Net increase (decrease) | (10,402,811) | (21,413,050) |
Financial Highlights
| Six months ended
September 30, 2013 | Years ended March 31, |
| (Unaudited) | 2013 | 2012 | 2011 | 2010 | 2009 |
Selected Per-Share Data | | | | | | |
Net asset value, beginning of period | $ 11.91 | $ 11.60 | $ 11.48 | $ 10.96 | $ 9.37 | $ 11.19 |
Income from Investment Operations | | | | | | |
Net investment income (loss) D | .06 | .15 | .18 | .19 | .26 | .36 |
Net realized and unrealized gain (loss) | .03 | .40 | .21 | .60 | 1.65 | (1.66) |
Total from investment operations | .09 | .55 | .39 | .79 | 1.91 | (1.30) |
Distributions from net investment income | (.06) | (.16) | (.19) | (.20) | (.26) | (.37) |
Distributions from net realized gain | (.17) | (.08) | (.08) | (.07) | (.06) | (.15) |
Total distributions | (.23) | (.24) | (.27) | (.27) | (.32) H | (.52) |
Net asset value, end of period | $ 11.77 | $ 11.91 | $ 11.60 | $ 11.48 | $ 10.96 | $ 9.37 |
Total Return B, C | .77% | 4.79% | 3.47% | 7.33% | 20.60% | (11.97)% |
Ratios to Average Net Assets E, G | | | | | | |
Expenses before reductions F | .00% A | .00% | .00% | .00% | .00% | .00% |
Expenses net of fee waivers, if any | .00% A | .00% | .00% | .00% | .00% | .00% |
Expenses net of all reductions | .00% A | .00% | .00% | .00% | .00% | .00% |
Net investment income (loss) | 1.01% A | 1.32% | 1.58% | 1.71% | 2.54% | 3.46% |
Supplemental Data | | | | | | |
Net assets, end of period (000 omitted) | $ 2,044,447 | $ 2,191,666 | $ 2,383,705 | $ 2,859,662 | $ 2,734,398 | $ 2,179,906 |
Portfolio turnover rate E | 5% A | 14% | 20% | 38% | 29% | 35% |
A Annualized
B Total returns for periods of less than one year are not annualized.
C Total returns would have been lower if certain expenses had not been reduced during the applicable periods shown.
D Calculated based on average shares outstanding during the period.
E Amounts do not include the activity of the Underlying Funds.
F Amount represents less than .01%.
G Expense ratios reflect operating expenses of the Fund. Expenses before reductions do not reflect amounts reimbursed by the investment adviser or reductions from expense offset arrangements and do not represent the amount paid by the Fund during periods when reimbursements or reductions occur. Expenses net of fee waivers reflect expenses after reimbursement by the investment adviser but prior to reductions from expense offset arrangements. Expenses net of all reductions represent the net expenses paid by the Fund but do not include expenses of the investment companies in which the Fund invests.
H Total distributions of $.32 per share is comprised of distributions from net investment income of $.260 and distributions from net realized gain of $.060 per share.
See accompanying notes which are an integral part of the financial statements.
Semiannual Report
Fidelity Freedom 2000 Fund
Investment Changes (Unaudited)
The information in the following tables is based on the direct investments of the Fund. |
Fund Holdings as of September 30, 2013 |
| % of fund's
net assets | % of fund's net assets
6 months ago |
Commodity Funds | | |
Fidelity Series Commodity Strategy Fund | 1.8 | 1.9 |
Domestic Equity Funds | | |
Fidelity Blue Chip Growth Fund | 1.5 | 1.3 |
Fidelity Disciplined Equity Fund | 0.0 | 0.3 |
Fidelity Growth Company Fund | 1.9 | 1.8 |
Fidelity Series 100 Index Fund | 0.5 | 0.4 |
Fidelity Series All-Sector Equity Fund | 2.0 | 2.0 |
Fidelity Series Equity-Income Fund | 1.3 | 1.3 |
Fidelity Series Growth & Income Fund (formerly Fidelity Series Mega Cap Fund) | 0.5 | 0.5 |
Fidelity Series Intrinsic Opportunities Fund | 1.0 | 0.9 |
Fidelity Series Large Cap Value Fund | 1.0 | 1.1 |
Fidelity Series Opportunistic Insights Fund | 1.0 | 0.9 |
Fidelity Series Real Estate Equity Fund | 0.2 | 0.2 |
Fidelity Series Small Cap Opportunities Fund | 0.6 | 0.5 |
Fidelity Series Stock Selector Large Cap Value Fund | 1.2 | 1.3 |
Fidelity Small Cap Growth Fund | 0.3 | 0.3 |
Fidelity Small Cap Value Fund | 0.3 | 0.3 |
| 13.3 | 13.1 |
Developed International Equity Funds | |
Fidelity Series International Growth Fund | 2.0 | 2.0 |
Fidelity Series International Small Cap Fund | 0.4 | 0.4 |
Fidelity Series International Value Fund | 2.0 | 2.0 |
| 4.4 | 4.4 |
Emerging Markets Equity Funds | | |
Fidelity Series Emerging Markets Fund | 1.2 | 1.2 |
High Yield Bond Funds | | |
Fidelity Series Emerging Markets Debt Fund | 0.5 | 0.5 |
Fidelity Series Floating Rate High Income Fund | 1.1 | 1.1 |
Fidelity Series High Income Fund | 4.9 | 5.0 |
Fidelity Series Real Estate Income Fund | 0.4 | 0.4 |
| 6.9 | 7.0 |
Inflation-Protected Bond Funds | | |
Fidelity Series Inflation-Protected Bond Index Fund | 11.1 | 11.4 |
Investment Grade Bond Funds | | |
Fidelity Series Investment Grade Bond Fund | 21.6 | 21.5 |
Short-Term Funds | | |
Fidelity Institutional Money Market Portfolio Institutional Class | 21.8 | 21.7 |
Fidelity Short-Term Bond Fund | 17.9 | 17.8 |
| 39.7 | 39.5 |
Net Other Assets (Liabilities)* | 0.0 | 0.0 |
| 100.0 | 100.0 |
* Amount represents less than 0.1% |
Asset Allocation (% of fund's net assets) |
Period end |
| Commodity Funds | 1.8% | |
| Domestic Equity Funds | 13.3% | |
| Developed International Equity Funds | 4.4% | |
| Emerging Markets Equity Funds | 1.2% | |
| High Yield Bond Funds | 6.9% | |
| Inflation-Protected Bond Funds | 11.1% | |
| Investment Grade Bond Funds | 21.6% | |
| Short-Term Funds | 39.7% | |

Six months ago |
| Commodity Funds | 1.9% | |
| Domestic Equity Funds | 13.1% | |
| Developed International Equity Funds | 4.4% | |
| Emerging Markets Equity Funds | 1.2% | |
| High Yield Bond Funds | 7.0% | |
| Inflation-Protected Bond Funds | 11.4% | |
| Investment Grade Bond Funds | 21.5% | |
| Short-Term Funds | 39.5% | |

Semiannual Report
Fidelity Freedom 2000 Fund
Investments September 30, 2013 (Unaudited)
Showing Percentage of Net Assets
Domestic Equity Funds - 15.1% |
| Shares | | Value |
Commodity Funds - 1.8% |
Fidelity Series Commodity Strategy Fund (a)(c) | 2,119,339 | | $ 16,975,904 |
Domestic Equity Funds - 13.3% |
Fidelity Blue Chip Growth Fund (c) | 233,627 | | 13,646,138 |
Fidelity Growth Company Fund (c) | 144,090 | | 17,113,595 |
Fidelity Series 100 Index Fund (c) | 371,215 | | 4,113,059 |
Fidelity Series All-Sector Equity Fund (c) | 1,262,641 | | 17,878,996 |
Fidelity Series Equity-Income Fund (c) | 1,032,515 | | 12,163,022 |
Fidelity Series Growth & Income Fund (c) | 395,024 | | 4,763,986 |
Fidelity Series Intrinsic Opportunities Fund (c) | 724,503 | | 9,404,051 |
Fidelity Series Large Cap Value Fund (c) | 740,379 | | 9,350,986 |
Fidelity Series Opportunistic Insights Fund (c) | 735,366 | | 9,464,155 |
Fidelity Series Real Estate Equity Fund (c) | 155,020 | | 1,854,038 |
Fidelity Series Small Cap Opportunities Fund (c) | 391,417 | | 5,021,883 |
Fidelity Series Stock Selector Large Cap Value Fund (c) | 883,995 | | 10,767,060 |
Fidelity Small Cap Growth Fund (c) | 146,136 | | 2,732,743 |
Fidelity Small Cap Value Fund (c) | 142,985 | | 2,713,858 |
TOTAL DOMESTIC EQUITY FUNDS | | 120,987,570 |
TOTAL DOMESTIC EQUITY FUNDS (Cost $103,931,302) |
137,963,474
|
International Equity Funds - 5.6% |
| | | |
Developed International Equity Funds - 4.4% |
Fidelity Series International Growth Fund (c) | 1,350,728 | | 18,329,379 |
Fidelity Series International Small Cap Fund (c) | 242,250 | | 3,703,998 |
Fidelity Series International Value Fund (c) | 1,697,926 | | 18,252,705 |
TOTAL DEVELOPED INTERNATIONAL EQUITY FUNDS | | 40,286,082 |
Emerging Markets Equity Funds - 1.2% |
Fidelity Series Emerging Markets Fund (c) | 659,121 | | 11,033,685 |
TOTAL INTERNATIONAL EQUITY FUNDS (Cost $41,578,681) |
51,319,767
|
Bond Funds - 39.6% |
| Shares | | Value |
High Yield Bond Funds - 6.9% |
Fidelity Series Emerging Markets Debt Fund (c) | 472,932 | | $ 4,786,076 |
Fidelity Series Floating Rate High Income Fund (c) | 986,002 | | 10,431,904 |
Fidelity Series High Income Fund (c) | 4,342,130 | | 44,637,095 |
Fidelity Series Real Estate Income Fund (c) | 295,472 | | 3,244,285 |
TOTAL HIGH YIELD BOND FUNDS | | 63,099,360 |
Inflation-Protected Bond Funds - 11.1% |
Fidelity Series Inflation-Protected Bond Index Fund (c) | 9,297,113 | | 100,873,676 |
Investment Grade Bond Funds - 21.6% |
Fidelity Series Investment Grade Bond Fund (c) | 17,590,740 | | 196,840,376 |
TOTAL BOND FUNDS (Cost $342,043,857) |
360,813,412
|
Short-Term Funds - 39.7% |
| | | |
Fidelity Institutional Money Market Portfolio Institutional Class 0.04% (b)(c) | 198,492,953 | | 198,492,953 |
Fidelity Short-Term Bond Fund (c) | 18,982,299 | | 162,868,122 |
TOTAL SHORT-TERM FUNDS (Cost $364,378,238) |
361,361,075
|
TOTAL INVESTMENT PORTFOLIO - 100.0% (Cost $851,932,078) | | 911,457,728 |
NET OTHER ASSETS (LIABILITIES) - 0.0% | | (2,844) |
NET ASSETS - 100% | $ 911,454,884 |
Legend |
(a) Non-income producing |
(b) The rate quoted is the annualized seven-day yield of the fund at period end. |
(c) Affiliated company |
Affiliated Underlying Funds |
Information regarding the Fund's fiscal year to date purchases and sales of the affiliated Underlying Funds and income earned by the Fund from investments in affiliated Underlying Funds is as follows: |
Affiliate | Value,
beginning of
period | Purchases | Sales
Proceeds | Dividend
Income | Value,
end of
period |
Fidelity Blue Chip Growth Fund | $ 13,459,390 | $ 814,174 | $ 1,852,070 | $ 33,031 | $ 13,646,138 |
Fidelity Disciplined Equity Fund | 2,941,841 | - | 3,075,816 | - | - |
Fidelity Growth Company Fund | 18,102,567 | 55,890 | 3,877,253 | - | 17,113,595 |
Fidelity Institutional Money Market Portfolio Institutional Class | 217,485,045 | 3,438,299 | 22,430,391 | 119,532 | 198,492,953 |
Fidelity Series 100 Index Fund | 4,546,028 | 13,274 | 766,470 | - | 4,113,059 |
Fidelity Series All-Sector Equity Fund | 19,752,787 | 44,060 | 3,786,278 | - | 17,878,996 |
Fidelity Series Commodity Strategy Fund | 18,865,003 | 1,522,644 | 1,963,238 | - | 16,975,904 |
Fidelity Series Emerging Markets Debt Fund | 5,390,785 | 168,335 | 403,173 | 133,644 | 4,786,076 |
Fidelity Series Emerging Markets Fund | 12,168,692 | 147,872 | 1,257,383 | - | 11,033,685 |
Fidelity Series Equity-Income Fund | 12,675,789 | 183,967 | 1,440,769 | 127,052 | 12,163,022 |
Fidelity Series Floating Rate High Income Fund | 11,682,093 | 309,562 | 1,508,537 | 239,852 | 10,431,904 |
Fidelity Series Growth & Income Fund (formerly Fidelity Series Mega Cap Fund) | 4,631,043 | 255,530 | 553,975 | - | 4,763,986 |
Fidelity Series High Income Fund | 49,900,379 | 1,757,035 | 5,981,665 | 1,228,403 | 44,637,095 |
Fidelity Series Inflation-Protected Bond Index Fund | 114,741,430 | 2,436,202 | 10,972,734 | - | 100,873,676 |
Fidelity Series International Growth Fund | 20,131,920 | 84,270 | 3,158,099 | - | 18,329,379 |
Fidelity Series International Small Cap Fund | 4,126,007 | 16,621 | 838,698 | - | 3,703,998 |
Fidelity Series International Value Fund | 20,044,595 | 82,197 | 3,558,585 | - | 18,252,705 |
Fidelity Series Intrinsic Opportunities Fund | 8,640,223 | 541,140 | 1,030,620 | 55,988 | 9,404,051 |
Fidelity Series Investment Grade Bond Fund | 215,410,032 | 8,866,635 | 21,158,238 | 2,129,593 | 196,840,376 |
Fidelity Series Large Cap Value Fund | 11,478,106 | 10,589 | 3,069,642 | - | 9,350,986 |
Fidelity Series Opportunistic Insights Fund | 9,257,628 | 30,479 | 1,280,447 | - | 9,464,155 |
Fidelity Series Real Estate Equity Fund | 1,980,634 | 253,323 | 219,952 | 12,914 | 1,854,038 |
Fidelity Series Real Estate Income Fund | 3,727,756 | 176,218 | 455,957 | 100,873 | 3,244,285 |
Fidelity Series Small Cap Opportunities Fund | 5,170,986 | 383,947 | 755,864 | - | 5,021,883 |
Fidelity Series Stock Selector Large Cap Value Fund | 12,726,026 | 37,217 | 3,063,280 | - | 10,767,060 |
Fidelity Short-Term Bond Fund | 178,738,729 | 2,771,114 | 18,211,212 | 650,839 | 162,868,122 |
Fidelity Small Cap Growth Fund | 2,788,099 | 298,688 | 465,643 | - | 2,732,743 |
Fidelity Small Cap Value Fund | 2,994,231 | 180,931 | 496,785 | 4,305 | 2,713,858 |
Total | $ 1,003,557,844 | $ 24,880,213 | $ 117,632,774 | $ 4,836,026 | $ 911,457,728 |
Other Information |
All investments are categorized as Level 1 under the Fair Value Hierarchy. The inputs or methodology used for valuing securities may not be an indication of the risk associated with investing in those securities. For more information on valuation inputs, please refer to the Investment Valuation section in the accompanying Notes to Financial Statements. |
See accompanying notes which are an integral part of the financial statements.
Semiannual Report
Fidelity Freedom 2000 Fund
Statement of Assets and Liabilities
| September 30, 2013 (Unaudited) |
| | |
Assets | | |
Investment in securities, at value (cost $851,932,078) - See accompanying schedule | | $ 911,457,728 |
Receivable for investments sold | | 513,079 |
Receivable for fund shares sold | | 625,048 |
Total assets | | 912,595,855 |
| | |
Liabilities | | |
Payable for fund shares redeemed | | 1,140,971 |
| | |
Net Assets | | $ 911,454,884 |
Net Assets consist of: | | |
Paid in capital | | $ 839,632,509 |
Undistributed net investment income | | 4,766,909 |
Accumulated undistributed net realized gain (loss) on investments | | 7,529,816 |
Net unrealized appreciation (depreciation) on investments | | 59,525,650 |
Net Assets, for 72,625,366 shares outstanding | | $ 911,454,884 |
Net Asset Value, offering price and redemption price per share ($911,454,884 ÷ 72,625,366 shares) | | $ 12.55 |
Statement of Operations
Six months ended September 30, 2013 (Unaudited) |
| | |
Investment Income | | |
Income distributions from underlying funds | | $ 4,836,026 |
| | |
Expenses | | |
Independent trustees' compensation | $ 1,812 | |
Total expenses before reductions | 1,812 | |
Expense reductions | (1,812) | - |
Net investment income (loss) | | 4,836,026 |
Realized and Unrealized Gain (Loss) Realized gain (loss) on sale of underlying fund shares | 6,516,311 | |
Capital gain distributions from underlying funds | 1,766,987 | |
Total net realized gain (loss) | | 8,283,298 |
Change in net unrealized appreciation (depreciation) on underlying funds | | (5,863,864) |
Net gain (loss) | | 2,419,434 |
Net increase (decrease) in net assets resulting from operations | | $ 7,255,460 |
See accompanying notes which are an integral part of the financial statements.
Semiannual Report
Fidelity Freedom 2000 Fund
Financial Statements - continued
Statement of Changes in Net Assets
| Six months ended
September 30, 2013
(Unaudited) | Year ended
March 31,
2013 |
Increase (Decrease) in Net Assets | | |
Operations | | |
Net investment income (loss) | $ 4,836,026 | $ 14,543,943 |
Net realized gain (loss) | 8,283,298 | 47,890,516 |
Change in net unrealized appreciation (depreciation) | (5,863,864) | (12,705,167) |
Net increase (decrease) in net assets resulting from operations | 7,255,460 | 49,729,292 |
Distributions to shareholders from net investment income | (2,430,725) | (15,922,623) |
Distributions to shareholders from net realized gain | (8,860,376) | (7,401,419) |
Total distributions | (11,291,101) | (23,324,042) |
Share transactions
Proceeds from sales of shares | 71,194,402 | 211,998,303 |
Reinvestment of distributions | 11,189,477 | 23,138,995 |
Cost of shares redeemed | (170,443,252) | (473,996,472) |
Net increase (decrease) in net assets resulting from share transactions | (88,059,373) | (238,859,174) |
Total increase (decrease) in net assets | (92,095,014) | (212,453,924) |
| | |
Net Assets | | |
Beginning of period | 1,003,549,898 | 1,216,003,822 |
End of period (including undistributed net investment income of $4,766,909 and undistributed net investment income of $2,361,608, respectively) | $ 911,454,884 | $ 1,003,549,898 |
Other Information Shares | | |
Sold | 5,700,990 | 17,091,972 |
Issued in reinvestment of distributions | 890,882 | 1,877,679 |
Redeemed | (13,666,505) | (38,251,373) |
Net increase (decrease) | (7,074,633) | (19,281,722) |
Financial Highlights
| Six months ended
September 30, 2013 | Years ended March 31, |
| (Unaudited) | 2013 | 2012 | 2011 | 2010 | 2009 |
Selected Per-Share Data | | | | | | |
Net asset value, beginning of period | $ 12.59 | $ 12.29 | $ 12.18 | $ 11.61 | $ 9.86 | $ 12.08 |
Income from Investment Operations | | | | | | |
Net investment income (loss) D | .06 | .16 | .19 | .20 | .27 | .37 |
Net realized and unrealized gain (loss) | .04 | .41 | .22 | .67 | 1.83 | (1.97) |
Total from investment operations | .10 | .57 | .41 | .87 | 2.10 | (1.60) |
Distributions from net investment income | (.03) | (.18) | (.20) | (.22) | (.29) | (.41) |
Distributions from net realized gain | (.11) | (.09) | (.10) | (.08) | (.06) | (.21) |
Total distributions | (.14) | (.27) | (.30) | (.30) | (.35) H | (.62) |
Net asset value, end of period | $ 12.55 | $ 12.59 | $ 12.29 | $ 12.18 | $ 11.61 | $ 9.86 |
Total Return B, C | .83% | 4.70% | 3.45% | 7.56% | 21.46% | (13.60)% |
Ratios to Average Net Assets E, G | | | | | | |
Expenses before reductions F | .00% A | .00% | .00% | .00% | .00% | .00% |
Expenses net of fee waivers, if any | .00% A | .00% | .00% | .00% | .00% | .00% |
Expenses net of all reductions | .00% A | .00% | .00% | .00% | .00% | .00% |
Net investment income (loss) | 1.01% A | 1.32% | 1.58% | 1.67% | 2.47% | 3.33% |
Supplemental Data | | | | | | |
Net assets, end of period (000 omitted) | $ 911,455 | $ 1,003,550 | $ 1,216,004 | $ 1,481,969 | $ 1,708,818 | $ 1,443,544 |
Portfolio turnover rate E | 5% A | 12% | 19% | 32% | 31% | 33% |
A Annualized
B Total returns for periods of less than one year are not annualized.
C Total returns would have been lower if certain expenses had not been reduced during the applicable periods shown.
D Calculated based on average shares outstanding during the period.
E Amounts do not include the activity of the Underlying Funds.
F Amount represents less than .01%.
G Expense ratios reflect operating expenses of the Fund. Expenses before reductions do not reflect amounts reimbursed by the investment adviser or reductions from expense offset arrangements and do not represent the amount paid by the Fund during periods when reimbursements or reductions occur. Expenses net of fee waivers reflect expenses after reimbursement by the investment adviser but prior to reductions from expense offset arrangements. Expenses net of all reductions represent the net expenses paid by the Fund but do not include expenses of the investment companies in which the Fund invests.
H Total distributions of $.35 per share is comprised of distributions from net investment income of $.290 and distributions from net realized gain of $.060 per share.
See accompanying notes which are an integral part of the financial statements.
Semiannual Report
Fidelity Freedom 2005 Fund
Investment Changes (Unaudited)
The information in the following tables is based on the direct investments of the Fund. |
Fund Holdings as of September 30, 2013 |
| % of fund's
net assets | % of fund's net assets
6 months ago |
Commodity Funds | | |
Fidelity Series Commodity Strategy Fund | 3.6 | 3.8 |
Domestic Equity Funds | | |
Fidelity Blue Chip Growth Fund | 2.5 | 2.3 |
Fidelity Disciplined Equity Fund | 0.0 | 0.5 |
Fidelity Growth Company Fund | 3.0 | 3.1 |
Fidelity Series 100 Index Fund | 0.7 | 0.8 |
Fidelity Series All-Sector Equity Fund | 3.1 | 3.4 |
Fidelity Series Equity-Income Fund | 2.2 | 2.2 |
Fidelity Series Growth & Income Fund (formerly Fidelity Series Mega Cap Fund) | 0.9 | 0.8 |
Fidelity Series Intrinsic Opportunities Fund | 1.6 | 1.2 |
Fidelity Series Large Cap Value Fund | 1.6 | 2.0 |
Fidelity Series Opportunistic Insights Fund | 1.7 | 1.6 |
Fidelity Series Real Estate Equity Fund | 0.3 | 0.3 |
Fidelity Series Small Cap Opportunities Fund | 0.9 | 0.9 |
Fidelity Series Stock Selector Large Cap Value Fund | 1.9 | 2.2 |
Fidelity Small Cap Growth Fund | 0.5 | 0.5 |
Fidelity Small Cap Value Fund | 0.5 | 0.5 |
| 21.4 | 22.3 |
Developed International Equity Funds | | |
Fidelity Series International Growth Fund | 3.3 | 3.4 |
Fidelity Series International Small Cap Fund | 0.7 | 0.7 |
Fidelity Series International Value Fund | 3.3 | 3.3 |
| 7.3 | 7.4 |
Emerging Markets Equity Funds | | |
Fidelity Series Emerging Markets Fund | 2.0 | 2.1 |
High Yield Bond Funds | | |
Fidelity Series Emerging Markets Debt Fund | 0.6 | 0.7 |
Fidelity Series Floating Rate High Income Fund | 1.1 | 1.1 |
Fidelity Series High Income Fund | 4.8 | 4.8 |
Fidelity Series Real Estate Income Fund | 0.5 | 0.5 |
| 7.0 | 7.1 |
Inflation-Protected Bond Funds | | |
Fidelity Series Inflation-Protected Bond Index Fund | 8.8 | 9.1 |
Investment Grade Bond Funds | | |
Fidelity Series Investment Grade Bond Fund | 17.9 | 18.0 |
Short-Term Funds | | |
Fidelity Institutional Money Market Portfolio Institutional Class | 17.6 | 16.6 |
Fidelity Short-Term Bond Fund | 14.4 | 13.6 |
| 32.0 | 30.2 |
Net Other Assets (Liabilities) * | 0.0 | 0.0 |
| 100.0 | 100.0 |
* Amount represents less than 0.1% |
Asset Allocation (% of fund's net assets) |
Period end |
| Commodity Funds | 3.6% | |
| Domestic Equity Funds | 21.4% | |
| Developed International Equity Funds | 7.3% | |
| Emerging MarketsEquity Funds | 2.0% | |
| High Yield Bond Funds | 7.0% | |
| Inflation-Protected Bond Funds | 8.8% | |
| Investment Grade Bond Funds | 17.9% | |
| Short-Term Funds | 32.0% | |

Six months ago |
| Commodity Funds | 3.8% | |
| Domestic Equity Funds | 22.3% | |
| Developed International Equity Funds | 7.4% | |
| Emerging Markets Equity Funds | 2.1% | |
| High Yield Bond Funds | 7.1% | |
| Inflation-Protected Bond Funds | 9.1% | |
| Investment Grade Bond Funds | 18.0% | |
| Short-Term Funds | 30.2% | |

Semiannual Report
Fidelity Freedom 2005 Fund
Investments September 30, 2013 (Unaudited)
Showing Percentage of Net Assets
Domestic Equity Funds - 25.0% |
| Shares | | Value |
Commodity Funds - 3.6% |
Fidelity Series Commodity Strategy Fund (a)(c) | 3,006,372 | | $ 24,081,037 |
Domestic Equity Funds - 21.4% |
Fidelity Blue Chip Growth Fund (c) | 284,788 | | 16,634,467 |
Fidelity Growth Company Fund (c) | 171,479 | | 20,366,551 |
Fidelity Series 100 Index Fund (c) | 444,913 | | 4,929,638 |
Fidelity Series All-Sector Equity Fund (c) | 1,506,816 | | 21,336,508 |
Fidelity Series Equity-Income Fund (c) | 1,252,304 | | 14,752,142 |
Fidelity Series Growth & Income Fund (c) | 478,067 | | 5,765,484 |
Fidelity Series Intrinsic Opportunities Fund (c) | 845,285 | | 10,971,794 |
Fidelity Series Large Cap Value Fund (c) | 869,620 | | 10,983,303 |
Fidelity Series Opportunistic Insights Fund (c) | 905,973 | | 11,659,869 |
Fidelity Series Real Estate Equity Fund (c) | 198,656 | | 2,375,931 |
Fidelity Series Small Cap Opportunities Fund (c) | 468,123 | | 6,006,013 |
Fidelity Series Stock Selector Large Cap Value Fund (c) | 1,039,142 | | 12,656,748 |
Fidelity Small Cap Growth Fund (c) | 177,989 | | 3,328,392 |
Fidelity Small Cap Value Fund (c) | 170,258 | | 3,231,491 |
TOTAL DOMESTIC EQUITY FUNDS | | 144,998,331 |
TOTAL DOMESTIC EQUITY FUNDS (Cost $151,610,934) |
169,079,368
|
International Equity Funds - 9.3% |
| | | |
Developed International Equity Funds - 7.3% |
Fidelity Series International Growth Fund (c) | 1,657,778 | | 22,496,050 |
Fidelity Series International Small Cap Fund (c) | 297,929 | | 4,555,339 |
Fidelity Series International Value Fund (c) | 2,075,290 | | 22,309,363 |
TOTAL DEVELOPED INTERNATIONAL EQUITY FUNDS | | 49,360,752 |
Emerging Markets Equity Funds - 2.0% |
Fidelity Series Emerging Markets Fund (c) | 825,424 | | 13,817,600 |
TOTAL INTERNATIONAL EQUITY FUNDS (Cost $56,919,686) |
63,178,352
|
Bond Funds - 33.7% |
| Shares | | Value |
High Yield Bond Funds - 7.0% |
Fidelity Series Emerging Markets Debt Fund (c) | 420,554 | | $ 4,256,003 |
Fidelity Series Floating Rate High Income Fund (c) | 720,930 | | 7,627,442 |
Fidelity Series High Income Fund (c) | 3,168,394 | | 32,571,089 |
Fidelity Series Real Estate Income Fund (c) | 275,826 | | 3,028,572 |
TOTAL HIGH YIELD BOND FUNDS | | 47,483,106 |
Inflation-Protected Bond Funds - 8.8% |
Fidelity Series Inflation-Protected Bond Index Fund (c) | 5,524,220 | | 59,937,784 |
Investment Grade Bond Funds - 17.9% |
Fidelity Series Investment Grade Bond Fund (c) | 10,830,300 | | 121,191,055 |
TOTAL BOND FUNDS (Cost $232,410,290) |
228,611,945
|
Short-Term Funds - 32.0% |
| | | |
Fidelity Institutional Money Market Portfolio Institutional Class 0.04% (b)(c) | 118,985,115 | | 118,985,115 |
Fidelity Short-Term Bond Fund (c) | 11,365,752 | | 97,518,149 |
TOTAL SHORT-TERM FUNDS (Cost $217,861,738) |
216,503,264
|
TOTAL INVESTMENT PORTFOLIO - 100.0% (Cost $658,802,648) | | 677,372,929 |
NET OTHER ASSETS (LIABILITIES) - 0.0% | | (32) |
NET ASSETS - 100% | $ 677,372,897 |
Legend |
(a) Non-income producing |
(b) The rate quoted is the annualized seven-day yield of the fund at period end. |
(c) Affiliated company |
Affiliated Underlying Funds |
Information regarding the Fund's fiscal year to date purchases and sales of the affiliated Underlying Funds and income earned by the Fund from investments in affiliated Underlying Funds is as follows: |
Affiliate | Value,
beginning of
period | Purchases | Sales
Proceeds | Dividend
Income | Value,
end of
period |
Fidelity Blue Chip Growth Fund | $ 16,570,159 | $ 1,364,034 | $ 2,815,816 | $ 40,834 | $ 16,634,467 |
Fidelity Disciplined Equity Fund | 3,612,518 | 3,354 | 3,785,056 | - | - |
Fidelity Growth Company Fund | 21,623,451 | 554,472 | 5,211,734 | - | 20,366,551 |
Fidelity Institutional Money Market Portfolio Institutional Class | 116,878,761 | 12,284,863 | 10,178,508 | 68,379 | 118,985,115 |
Fidelity Series 100 Index Fund | 5,538,000 | 132,941 | 1,116,402 | - | 4,929,638 |
Fidelity Series All-Sector Equity Fund | 23,962,206 | 563,098 | 5,434,714 | - | 21,336,508 |
Fidelity Series Commodity Strategy Fund | 26,470,248 | 1,983,573 | 2,311,436 | - | 24,081,037 |
Fidelity Series Emerging Markets Debt Fund | 4,702,012 | 233,269 | 354,763 | 117,686 | 4,256,003 |
Fidelity Series Emerging Markets Fund | 14,594,326 | 525,320 | 1,300,844 | - | 13,817,600 |
Fidelity Series Equity-Income Fund | 15,360,498 | 615,288 | 2,134,179 | 154,324 | 14,752,142 |
Fidelity Series Floating Rate High Income Fund | 8,167,175 | 323,655 | 825,680 | 172,717 | 7,627,442 |
Fidelity Series Growth & Income Fund (formerly Fidelity Series Mega Cap Fund) | 5,601,103 | 263,491 | 618,384 | - | 5,765,484 |
Fidelity Series High Income Fund | 34,054,224 | 2,248,539 | 2,993,202 | 873,457 | 32,571,089 |
Fidelity Series Inflation-Protected Bond Index Fund | 64,209,676 | 4,069,382 | 5,293,085 | - | 59,937,784 |
Fidelity Series International Growth Fund | 23,779,915 | 574,341 | 3,418,284 | - | 22,496,050 |
Fidelity Series International Small Cap Fund | 4,874,479 | 171,074 | 972,722 | - | 4,555,339 |
Fidelity Series International Value Fund | 23,490,490 | 625,280 | 3,846,402 | - | 22,309,363 |
Fidelity Series Intrinsic Opportunities Fund | 8,637,881 | 1,861,189 | 874,674 | 65,215 | 10,971,794 |
Fidelity Series Investment Grade Bond Fund | 126,485,301 | 9,275,969 | 10,791,484 | 1,290,324 | 121,191,055 |
Fidelity Series Large Cap Value Fund | 14,031,678 | 282,346 | 4,375,737 | - | 10,983,303 |
Fidelity Series Opportunistic Insights Fund | 11,193,340 | 302,949 | 1,624,925 | - | 11,659,869 |
Fidelity Series Real Estate Equity Fund | 2,461,176 | 348,949 | 225,340 | 16,636 | 2,375,931 |
Fidelity Series Real Estate Income Fund | 3,360,451 | 202,087 | 343,429 | 93,909 | 3,028,572 |
Fidelity Series Small Cap Opportunities Fund | 6,363,627 | 605,344 | 1,249,239 | - | 6,006,013 |
Fidelity Series Stock Selector Large Cap Value Fund | 15,431,236 | 370,728 | 4,383,734 | - | 12,656,748 |
Fidelity Short-Term Bond Fund | 95,700,835 | 10,446,848 | 8,396,301 | 373,236 | 97,518,149 |
Fidelity Small Cap Growth Fund | 3,393,222 | 430,171 | 630,850 | - | 3,328,392 |
Fidelity Small Cap Value Fund | 3,635,319 | 283,450 | 732,310 | 5,123 | 3,231,491 |
Total | $ 704,183,307 | $ 50,946,004 | $ 86,239,234 | $ 3,271,840 | $ 677,372,929 |
Other Information |
All investments are categorized as Level 1 under the Fair Value Hierarchy. The inputs or methodology used for valuing securities may not be an indication of the risk associated with investing in those securities. For more information on valuation inputs, please refer to the Investment Valuation section in the accompanying Notes to Financial Statements. |
See accompanying notes which are an integral part of the financial statements.
Semiannual Report
Fidelity Freedom 2005 Fund
Statement of Assets and Liabilities
| September 30, 2013 (Unaudited) |
| | |
Assets | | |
Investment in securities, at value (cost $658,802,648) - See accompanying schedule | | $ 677,372,929 |
Receivable for investments sold | | 840,218 |
Receivable for fund shares sold | | 402,533 |
Total assets | | 678,615,680 |
| | |
Liabilities | | |
Payable for fund shares redeemed | | 1,242,783 |
| | |
Net Assets | | $ 677,372,897 |
Net Assets consist of: | | |
Paid in capital | | $ 671,739,634 |
Undistributed net investment income | | 3,204,388 |
Accumulated undistributed net realized gain (loss) on investments | | (16,141,406) |
Net unrealized appreciation (depreciation) on investments | | 18,570,281 |
Net Assets, for 57,710,047 shares outstanding | | $ 677,372,897 |
Net Asset Value, offering price and redemption price per share ($677,372,897 ÷ 57,710,047 shares) | | $ 11.74 |
Statement of Operations
Six months ended September 30, 2013 (Unaudited) |
| | |
Investment Income | | |
Income distributions from underlying funds | | $ 3,271,840 |
| | |
Expenses | | |
Independent trustees' compensation | $ 1,302 | |
Total expenses before reductions | 1,302 | |
Expense reductions | (1,302) | - |
Net investment income (loss) | | 3,271,840 |
Realized and Unrealized Gain (Loss) Realized gain (loss) on sale of underlying fund shares | 7,003,171 | |
Capital gain distributions from underlying funds | 2,131,179 | |
Total net realized gain (loss) | | 9,134,350 |
Change in net unrealized appreciation (depreciation) on underlying funds | | 1,479,596 |
Net gain (loss) | | 10,613,946 |
Net increase (decrease) in net assets resulting from operations | | $ 13,885,786 |
See accompanying notes which are an integral part of the financial statements.
Semiannual Report
Fidelity Freedom 2005 Fund
Financial Statements - continued
Statement of Changes in Net Assets
| Six months ended September 30, 2013 (Unaudited) | Year ended
March 31,
2013 |
Increase (Decrease) in Net Assets | | |
Operations | | |
Net investment income (loss) | $ 3,271,840 | $ 10,136,653 |
Net realized gain (loss) | 9,134,350 | 22,552,453 |
Change in net unrealized appreciation (depreciation) | 1,479,596 | 8,411,298 |
Net increase (decrease) in net assets resulting from operations | 13,885,786 | 41,100,404 |
Distributions to shareholders from net investment income | (1,514,229) | (10,742,526) |
Distributions to shareholders from net realized gain | (121,138) | (4,341,485) |
Total distributions | (1,635,367) | (15,084,011) |
Share transactions
Proceeds from sales of shares | 82,626,120 | 171,676,253 |
Reinvestment of distributions | 1,623,299 | 14,972,075 |
Cost of shares redeemed | (123,310,224) | (306,330,103) |
Net increase (decrease) in net assets resulting from share transactions | (39,060,805) | (119,681,775) |
Total increase (decrease) in net assets | (26,810,386) | (93,665,382) |
| | |
Net Assets | | |
Beginning of period | 704,183,283 | 797,848,665 |
End of period (including undistributed net investment income of $3,204,388 and undistributed net investment income of $1,446,777, respectively) | $ 677,372,897 | $ 704,183,283 |
Other Information Shares | | |
Sold | 7,133,652 | 15,303,988 |
Issued in reinvestment of distributions | 139,459 | 1,345,365 |
Redeemed | (10,641,046) | (27,376,874) |
Net increase (decrease) | (3,367,935) | (10,727,521) |
Financial Highlights
| Six months ended September 30, 2013 | Years ended March 31, |
| (Unaudited) | 2013 | 2012 | 2011 | 2010 | 2009 |
Selected Per-Share Data | | | | | | |
Net asset value, beginning of period | $ 11.53 | $ 11.11 | $ 11.13 | $ 10.32 | $ 8.02 | $ 11.19 |
Income from Investment Operations | | | | | | |
Net investment income (loss) D | .05 | .15 | .17 | .17 | .23 | .29 |
Net realized and unrealized gain (loss) | .19 | .51 | .12 | .91 | 2.39 | (2.88) |
Total from investment operations | .24 | .66 | .29 | 1.08 | 2.62 | (2.59) |
Distributions from net investment income | (.03) | (.17) | (.18) | (.19) | (.24) | (.32) |
Distributions from net realized gain | - H | (.07) | (.13) | (.09) | (.08) | (.26) |
Total distributions | (.03) | (.24) | (.31) | (.27) J | (.32) I | (.58) |
Net asset value, end of period | $ 11.74 | $ 11.53 | $ 11.11 | $ 11.13 | $ 10.32 | $ 8.02 |
Total Return B, C | 2.06% | 5.99% | 2.76% | 10.64% | 32.83% | (23.91)% |
Ratios to Average Net Assets E, G | | | | | | |
Expenses before reductions F | .00% A | .00% | .00% | .00% | .00% | .00% |
Expenses net of fee waivers, if any | .00% A | .00% | .00% | .00% | .00% | .00% |
Expenses net of all reductions | .00% A | .00% | .00% | .00% | .00% | .00% |
Net investment income (loss) | .94% A | 1.38% | 1.58% | 1.60% | 2.37% | 3.03% |
Supplemental Data | | | | | | |
Net assets, end of period (000 omitted) | $ 677,373 | $ 704,183 | $ 797,849 | $ 932,400 | $ 1,013,924 | $ 770,642 |
Portfolio turnover rate E | 15% A | 22% | 29% | 38% | 34% | 43% |
A Annualized
B Total returns for periods of less than one year are not annualized.
C Total returns would have been lower if certain expenses had not been reduced during the applicable periods shown.
D Calculated based on average shares outstanding during the period.
E Amounts do not include the activity of the Underlying Funds.
F Amount represents less than .01%.
G Expense ratios reflect operating expenses of the Fund. Expenses before reductions do not reflect amounts reimbursed by the investment adviser or reductions from expense offset arrangements and do not represent the amount paid by the Fund during periods when reimbursements or reductions occur. Expenses net of fee waivers reflect expenses after reimbursement by the investment adviser but prior to reductions from expense offset arrangements. Expenses net of all reductions represent the net expenses paid by the Fund but do not include expenses of the investment companies in which the Fund invests.
H Amount represents less than $.01 per share.
I Total distributions of $.32 per share is comprised of distributions from net investment income of $.235 and distributions from net realized gain of $.080 per share.
J Total distributions of $.27 per share is comprised of distributions from net investment income of $.188 and distributions from net realized gain of $.085 per share.
See accompanying notes which are an integral part of the financial statements.
Semiannual Report
Fidelity Freedom 2010 Fund
Investment Changes (Unaudited)
The information in the following tables is based on the direct investments of the Fund. |
Fund Holdings as of September 30, 2013 |
| % of fund's
net assets | % of fund's net assets
6 months ago |
Commodity Funds | | |
Fidelity Series Commodity Strategy Fund | 5.0 | 5.0 |
Domestic Equity Funds | | |
Fidelity Blue Chip Growth Fund | 3.5 | 3.2 |
Fidelity Disciplined Equity Fund | 0.0 | 0.7 |
Fidelity Growth Company Fund | 4.3 | 4.3 |
Fidelity Series 100 Index Fund | 1.0 | 1.1 |
Fidelity Series All-Sector Equity Fund | 4.5 | 4.7 |
Fidelity Series Equity-Income Fund | 3.0 | 3.0 |
Fidelity Series Growth & Income Fund (formerly Fidelity Series Mega Cap Fund) | 1.2 | 1.1 |
Fidelity Series Intrinsic Opportunities Fund | 2.3 | 1.7 |
Fidelity Series Large Cap Value Fund | 2.3 | 2.8 |
Fidelity Series Opportunistic Insights Fund | 2.4 | 2.2 |
Fidelity Series Real Estate Equity Fund | 0.5 | 0.4 |
Fidelity Series Small Cap Opportunities Fund | 1.2 | 1.2 |
Fidelity Series Stock Selector Large Cap Value Fund | 2.7 | 3.0 |
Fidelity Small Cap Growth Fund | 0.7 | 0.6 |
Fidelity Small Cap Value Fund | 0.7 | 0.7 |
| 30.3 | 30.7 |
Developed International Equity Funds | | |
Fidelity Series International Growth Fund | 4.7 | 4.7 |
Fidelity Series International Small Cap Fund | 1.0 | 0.9 |
Fidelity Series International Value Fund | 4.7 | 4.6 |
| 10.4 | 10.2 |
Emerging Markets Equity Funds | | |
Fidelity Series Emerging Markets Fund | 2.8 | 2.8 |
High Yield Bond Funds | | |
Fidelity Series Emerging Markets Debt Fund | 0.6 | 0.7 |
Fidelity Series Floating Rate High Income Fund | 1.1 | 1.1 |
Fidelity Series High Income Fund | 4.7 | 4.8 |
Fidelity Series Real Estate Income Fund | 0.5 | 0.5 |
| 6.9 | 7.1 |
Inflation-Protected Bond Funds | | |
Fidelity Series Inflation-Protected Bond Index Fund | 9.7 | 10.2 |
Investment Grade Bond Funds | | |
Fidelity Series Investment Grade Bond Fund | 21.4 | 21.5 |
Short-Term Funds | | |
Fidelity Institutional Money Market Portfolio Institutional Class | 7.4 | 6.9 |
Fidelity Short-Term Bond Fund | 6.1 | 5.6 |
| 13.5 | 12.5 |
Net Other Assets (Liabilities)* | 0.0 | 0.0 |
| 100.0 | 100.0 |
* Amount represents less than 0.1% |
Asset Allocation (% of fund's net assets) |
Period end |
| Commodity Funds | 5.0% | |
| Domestic Equity Funds | 30.3% | |
| Developed International Equity Funds | 10.4% | |
| Emerging Markets Equity Funds | 2.8% | |
| High Yield Bond Funds | 6.9% | |
| Inflation-Protected Bond Funds | 9.7% | |
| Investment Grade Bond Funds | 21.4% | |
| Short-Term Funds | 13.5% | |

Six months ago |
| Commodity Funds | 5.0% | |
| Domestic Equity Funds | 30.7% | |
 | Developed International Equity Funds | 10.2% | |
| Emerging Markets Equity Funds | 2.8% | |
| High Yield Bond Funds | 7.1% | |
| Inflation-Protected Bond Funds | 10.2% | |
| Investment Grade Bond Funds | 21.5% | |
| Short-Term Funds | 12.5% | |

Semiannual Report
Fidelity Freedom 2010 Fund
Investments September 30, 2013 (Unaudited)
Showing Percentage of Net Assets
Domestic Equity Funds - 35.3% |
| Shares | | Value |
Commodity Funds - 5.0% |
Fidelity Series Commodity Strategy Fund (a)(c) | 34,923,428 | | $ 279,736,657 |
Domestic Equity Funds - 30.3% |
Fidelity Blue Chip Growth Fund (c) | 3,336,223 | | 194,868,783 |
Fidelity Growth Company Fund (c) | 2,033,368 | | 241,503,071 |
Fidelity Series 100 Index Fund (c) | 5,087,298 | | 56,367,266 |
Fidelity Series All-Sector Equity Fund (c) | 17,914,739 | | 253,672,703 |
Fidelity Series Equity-Income Fund (c) | 14,539,685 | | 171,277,494 |
Fidelity Series Growth & Income Fund (c) | 5,531,307 | | 66,707,561 |
Fidelity Series Intrinsic Opportunities Fund (c) | 9,971,377 | | 129,428,472 |
Fidelity Series Large Cap Value Fund (c) | 10,338,065 | | 130,569,761 |
Fidelity Series Opportunistic Insights Fund (c) | 10,447,313 | | 134,456,912 |
Fidelity Series Real Estate Equity Fund (c) | 2,173,224 | | 25,991,765 |
Fidelity Series Small Cap Opportunities Fund (c) | 5,379,204 | | 69,015,189 |
Fidelity Series Stock Selector Large Cap Value Fund (c) | 12,338,801 | | 150,286,591 |
Fidelity Small Cap Growth Fund (c) | 2,034,269 | | 38,040,831 |
Fidelity Small Cap Value Fund (c) | 1,926,288 | | 36,560,948 |
TOTAL DOMESTIC EQUITY FUNDS | | 1,698,747,347 |
TOTAL DOMESTIC EQUITY FUNDS (Cost $1,742,321,428) |
1,978,484,004
|
International Equity Funds - 13.2% |
| | | |
Developed International Equity Funds - 10.4% |
Fidelity Series International Growth Fund (c) | 19,430,181 | | 263,667,555 |
Fidelity Series International Small Cap Fund (c) | 3,548,669 | | 54,259,145 |
Fidelity Series International Value Fund (c) | 24,608,821 | | 264,544,825 |
TOTAL DEVELOPED INTERNATIONAL EQUITY FUNDS | | 582,471,525 |
Emerging Markets Equity Funds - 2.8% |
Fidelity Series Emerging Markets Fund (c) | 9,544,306 | | 159,771,685 |
TOTAL INTERNATIONAL EQUITY FUNDS (Cost $663,461,431) |
742,243,210
|
Bond Funds - 38.0% |
| Shares | | Value |
High Yield Bond Funds - 6.9% |
Fidelity Series Emerging Markets Debt Fund (c) | 3,443,415 | | $ 34,847,357 |
Fidelity Series Floating Rate High Income Fund (c) | 5,924,196 | | 62,677,989 |
Fidelity Series High Income Fund (c) | 25,760,917 | | 264,822,223 |
Fidelity Series Real Estate Income Fund (c) | 2,462,335 | | 27,036,440 |
TOTAL HIGH YIELD BOND FUNDS | | 389,384,009 |
Inflation-Protected Bond Funds - 9.7% |
Fidelity Series Inflation-Protected Bond Index Fund (c) | 50,212,700 | | 544,807,795 |
Investment Grade Bond Funds - 21.4% |
Fidelity Series Investment Grade Bond Fund (c) | 107,311,263 | | 1,200,813,027 |
TOTAL BOND FUNDS (Cost $2,159,969,415) |
2,135,004,831
|
Short-Term Funds - 13.5% |
| | | |
Fidelity Institutional Money Market Portfolio Institutional Class 0.04% (b)(c) | 417,224,429 | | 417,224,429 |
Fidelity Short-Term Bond Fund (c) | 39,827,620 | | 341,720,981 |
TOTAL SHORT-TERM FUNDS (Cost $768,131,391) |
758,945,410
|
TOTAL INVESTMENT PORTFOLIO - 100.0% (Cost $5,333,883,665) | | 5,614,677,455 |
NET OTHER ASSETS (LIABILITIES) - 0.0% | | (39,655) |
NET ASSETS - 100% | $ 5,614,637,800 |
Legend |
(a) Non-income producing |
(b) The rate quoted is the annualized seven-day yield of the fund at period end. |
(c) Affiliated company |
Affiliated Underlying Funds |
Information regarding the Fund's fiscal year to date purchases and sales of the affiliated Underlying Funds and income earned by the Fund from investments in affiliated Underlying Funds is as follows: |
Affiliate | Value,
beginning of
period | Purchases | Sales
Proceeds | Dividend
Income | Value,
end of
period |
Fidelity Blue Chip Growth Fund | $ 186,114,976 | $ 11,956,792 | $ 20,134,051 | $ 471,831 | $ 194,868,783 |
Fidelity Disciplined Equity Fund | 40,864,204 | - | 42,787,698 | - | - |
Fidelity Growth Company Fund | 252,031,793 | 384,977 | 50,098,206 | - | 241,503,071 |
Fidelity Institutional Money Market Portfolio Institutional Class | 404,251,789 | 42,628,913 | 29,656,273 | 238,001 | 417,224,429 |
Fidelity Series 100 Index Fund | 63,169,918 | 96,394 | 11,325,278 | - | 56,367,266 |
Fidelity Series All-Sector Equity Fund | 274,884,699 | 252,614 | 47,522,247 | - | 253,672,703 |
Fidelity Series Commodity Strategy Fund | 291,037,550 | 34,225,532 | 22,628,436 | - | 279,736,657 |
Fidelity Series Emerging Markets Debt Fund | 38,879,246 | 1,415,586 | 2,769,021 | 967,558 | 34,847,357 |
Fidelity Series Emerging Markets Fund | 165,102,623 | 6,877,668 | 12,503,632 | - | 159,771,685 |
Fidelity Series Equity-Income Fund | 176,228,827 | 2,282,980 | 17,573,073 | 1,769,452 | 171,277,494 |
Fidelity Series Floating Rate High Income Fund | 67,425,812 | 1,718,259 | 6,154,584 | 1,419,084 | 62,677,989 |
Fidelity Series Growth & Income Fund (formerly Fidelity Series Mega Cap Fund) | 64,280,620 | 2,727,541 | 6,245,892 | - | 66,707,561 |
Fidelity Series High Income Fund | 281,818,109 | 9,565,474 | 20,520,684 | 7,138,303 | 264,822,223 |
Fidelity Series Inflation-Protected Bond Index Fund | 596,159,790 | 17,338,433 | 40,654,776 | - | 544,807,795 |
Fidelity Series International Growth Fund | 273,833,776 | 678,905 | 29,085,176 | - | 263,667,555 |
Fidelity Series International Small Cap Fund | 55,789,764 | 111,630 | 7,416,244 | - | 54,259,145 |
Fidelity Series International Value Fund | 271,671,324 | 616,601 | 31,540,375 | - | 264,544,825 |
Fidelity Series Intrinsic Opportunities Fund | 102,272,330 | 19,159,352 | 8,024,952 | 770,479 | 129,428,472 |
Fidelity Series Investment Grade Bond Fund | 1,265,479,190 | 60,660,961 | 87,717,235 | 12,811,517 | 1,200,813,027 |
Fidelity Series Large Cap Value Fund | 162,294,534 | 47,309 | 44,477,582 | - | 130,569,761 |
Fidelity Series Opportunistic Insights Fund | 128,375,786 | 239,223 | 14,573,177 | - | 134,456,912 |
Fidelity Series Real Estate Equity Fund | 26,877,220 | 3,531,636 | 2,144,986 | 180,536 | 25,991,765 |
Fidelity Series Real Estate Income Fund | 30,215,379 | 1,394,555 | 2,873,409 | 841,194 | 27,036,440 |
Fidelity Series Small Cap Opportunities Fund | 71,078,566 | 5,148,494 | 10,256,803 | - | 69,015,189 |
Fidelity Series Stock Selector Large Cap Value Fund | 177,344,742 | 270,982 | 42,071,408 | - | 150,286,591 |
Fidelity Short-Term Bond Fund | 332,020,499 | 34,956,978 | 24,440,025 | 1,301,182 | 341,720,981 |
Fidelity Small Cap Growth Fund | 38,482,496 | 4,112,924 | 6,033,435 | - | 38,040,831 |
Fidelity Small Cap Value Fund | 41,330,695 | 2,387,738 | 7,649,854 | 58,007 | 36,560,948 |
Total | $ 5,879,316,257 | $ 264,788,451 | $ 648,878,512 | $ 27,967,144 | $ 5,614,677,455 |
Other Information |
All investments are categorized as Level 1 under the Fair Value Hierarchy. The inputs or methodology used for valuing securities may not be an indication of the risk associated with investing in those securities. For more information on valuation inputs, please refer to the Investment Valuation section in the accompanying Notes to Financial Statements. |
See accompanying notes which are an integral part of the financial statements.
Semiannual Report
Fidelity Freedom 2010 Fund
Statement of Assets and Liabilities
| September 30, 2013 (Unaudited) |
| | |
Assets | | |
Investment in securities, at value (cost $5,333,883,665) - See accompanying schedule | | $ 5,614,677,455 |
Receivable for investments sold | | 3,512,632 |
Receivable for fund shares sold | | 3,052,179 |
Other receivables | | 58,636 |
Total assets | | 5,621,300,902 |
| | |
Liabilities | | |
Payable for fund shares redeemed | $ 6,604,467 | |
Other payables and accrued expenses | 58,635 | |
Total liabilities | | 6,663,102 |
| | |
Net Assets | | $ 5,614,637,800 |
Net Assets consist of: | | |
Paid in capital | | $ 5,395,912,703 |
Undistributed net investment income | | 27,722,283 |
Accumulated undistributed net realized gain (loss) on investments | | (89,790,976) |
Net unrealized appreciation (depreciation) on investments | | 280,793,790 |
Net Assets, for 372,275,876 shares outstanding | | $ 5,614,637,800 |
Net Asset Value, offering price and redemption price per share ($5,614,637,800 ÷ 372,275,876 shares) | | $ 15.08 |
Statement of Operations
Six months ended September 30, 2013 (Unaudited) |
| | |
Investment Income | | |
Income distributions from underlying funds | | $ 27,967,144 |
| | |
Expenses | | |
Independent trustees' compensation | $ 10,814 | |
Total expenses before reductions | 10,814 | |
Expense reductions | (10,814) | - |
Net investment income (loss) | | 27,967,144 |
Realized and Unrealized Gain (Loss) Realized gain (loss) on sale of underlying fund shares | 66,830,535 | |
Capital gain distributions from underlying funds | 24,424,540 | |
Total net realized gain (loss) | | 91,255,075 |
Change in net unrealized appreciation (depreciation) on underlying funds | | 52,620,723 |
Net gain (loss) | | 143,875,798 |
Net increase (decrease) in net assets resulting from operations | | $ 171,842,942 |
See accompanying notes which are an integral part of the financial statements.
Semiannual Report
Fidelity Freedom 2010 Fund
Financial Statements - continued
Statement of Changes in Net Assets
| Six months ended September 30, 2013 (Unaudited) | Year ended
March 31,
2013 |
Increase (Decrease) in Net Assets | | |
Operations | | |
Net investment income (loss) | $ 27,967,144 | $ 97,566,494 |
Net realized gain (loss) | 91,255,075 | 271,207,451 |
Change in net unrealized appreciation (depreciation) | 52,620,723 | 59,475,421 |
Net increase (decrease) in net assets resulting from operations | 171,842,942 | 428,249,366 |
Distributions to shareholders from net investment income | (12,272,333) | (104,287,093) |
Distributions to shareholders from net realized gain | (1,583,533) | (42,473,324) |
Total distributions | (13,855,866) | (146,760,417) |
Share transactions
Proceeds from sales of shares | 448,643,672 | 1,055,233,571 |
Reinvestment of distributions | 13,748,825 | 145,632,188 |
Cost of shares redeemed | (885,033,342) | (2,663,149,142) |
Net increase (decrease) in net assets resulting from share transactions | (422,640,845) | (1,462,283,383) |
Total increase (decrease) in net assets | (264,653,769) | (1,180,794,434) |
| | |
Net Assets | | |
Beginning of period | 5,879,291,569 | 7,060,086,003 |
End of period (including undistributed net investment income of $27,722,283 and undistributed net investment income of $12,027,472, respectively) | $ 5,614,637,800 | $ 5,879,291,569 |
Other Information Shares | | |
Sold | 30,315,502 | 74,675,351 |
Issued in reinvestment of distributions | 924,601 | 10,401,803 |
Redeemed | (59,821,674) | (188,864,045) |
Net increase (decrease) | (28,581,571) | (103,786,891) |
Financial Highlights
| Six months ended September 30, 2013 | Years ended March 31, |
| (Unaudited) | 2013 | 2012 | 2011 | 2010 | 2009 |
Selected Per-Share Data | | | | | | |
Net asset value, beginning of period | $ 14.67 | $ 13.99 | $ 14.05 | $ 12.89 | $ 9.87 | $ 14.07 |
Income from Investment Operations | | | | | | |
Net investment income (loss) D | .07 | .22 | .23 | .22 | .29 | .37 |
Net realized and unrealized gain (loss) | .38 | .80 | .17 | 1.31 | 3.14 | (3.77) |
Total from investment operations | .45 | 1.02 | .40 | 1.53 | 3.43 | (3.40) |
Distributions from net investment income | (.03) | (.24) | (.26) | (.25) | (.31) | (.40) |
Distributions from net realized gain | - H | (.10) | (.20) | (.12) | (.11) | (.40) |
Total distributions | (.04) J | (.34) | (.46) | (.37) | (.41) I | (.80) |
Net asset value, end of period | $ 15.08 | $ 14.67 | $ 13.99 | $ 14.05 | $ 12.89 | $ 9.87 |
Total Return B, C | 3.04% | 7.43% | 3.01% | 12.02% | 34.99% | (25.06)% |
Ratios to Average Net Assets E, G | | | | | | |
Expenses before reductions F | .00% A | .00% | .00% | .00% | .00% | .00% |
Expenses net of fee waivers, if any | .00% A | .00% | .00% | .00% | .00% | .00% |
Expenses net of all reductions | .00% A | .00% | .00% | .00% | .00% | .00% |
Net investment income (loss) | .97% A | 1.54% | 1.67% | 1.64% | 2.40% | 3.03% |
Supplemental Data | | | | | | |
Net assets, end of period (000 omitted) | $ 5,614,638 | $ 5,879,292 | $ 7,060,086 | $ 9,701,251 | $ 11,088,228 | $ 9,130,697 |
Portfolio turnover rate E | 9% A | 19% | 18% | 34% | 25% | 39% |
A Annualized
B Total returns for periods of less than one year are not annualized.
C Total returns would have been lower if certain expenses had not been reduced during the applicable periods shown.
D Calculated based on average shares outstanding during the period.
E Amounts do not include the activity of the Underlying Funds.
F Amount represents less than .01%.
G Expense ratios reflect operating expenses of the Fund. Expenses before reductions do not reflect amounts reimbursed by the investment adviser or reductions from expense offset arrangements and do not represent the amount paid by the Fund during periods when reimbursements or reductions occur. Expenses net of fee waivers reflect expenses after reimbursement by the investment adviser but prior to reductions from expense offset arrangements. Expenses net of all reductions represent the net expenses paid by the Fund but do not include expenses of the investment companies in which the Fund invests.
H Amount represents less than $.01 per share.
I Total distributions of $.41 per share is comprised of distributions from net investment income of $.305 and distributions from net realized gain of $.105 per share.
J Total distributions of $.04 per share is comprised of distributions from net investment income of $.031 and distributions from net realized gain of $.004 per share.
See accompanying notes which are an integral part of the financial statements.
Semiannual Report
Fidelity Freedom 2015 Fund
Investment Changes (Unaudited)
The information in the following tables is based on the direct investments of the Fund. |
Fund Holdings as of September 30, 2013 |
| % of fund's
net assets | % of fund's net assets
6 months ago |
Commodity Funds | | |
Fidelity Series Commodity Strategy Fund | 5.2 | 5.3 |
Domestic Equity Funds | | |
Fidelity Blue Chip Growth Fund | 3.6 | 3.3 |
Fidelity Disciplined Equity Fund | 0.0 | 0.7 |
Fidelity Growth Company Fund | 4.5 | 4.5 |
Fidelity Series 100 Index Fund | 1.1 | 1.1 |
Fidelity Series All-Sector Equity Fund | 4.7 | 4.9 |
Fidelity Series Equity-Income Fund | 3.2 | 3.1 |
Fidelity Series Growth & Income Fund (formerly Fidelity Series Mega Cap Fund) | 1.3 | 1.1 |
Fidelity Series Intrinsic Opportunities Fund | 2.4 | 1.8 |
Fidelity Series Large Cap Value Fund | 2.5 | 2.9 |
Fidelity Series Opportunistic Insights Fund | 2.5 | 2.3 |
Fidelity Series Real Estate Equity Fund | 0.5 | 0.5 |
Fidelity Series Small Cap Opportunities Fund | 1.3 | 1.3 |
Fidelity Series Stock Selector Large Cap Value Fund | 2.8 | 3.1 |
Fidelity Small Cap Growth Fund | 0.7 | 0.7 |
Fidelity Small Cap Value Fund | 0.7 | 0.7 |
| 31.8 | 32.0 |
Developed International Equity Funds | | |
Fidelity Series International Growth Fund | 4.9 | 4.8 |
Fidelity Series International Small Cap Fund | 1.0 | 1.0 |
Fidelity Series International Value Fund | 5.0 | 4.8 |
| 10.9 | 10.6 |
Emerging Markets Equity Funds | | |
Fidelity Series Emerging Markets Fund | 3.0 | 2.9 |
High Yield Bond Funds | | |
Fidelity Series Emerging Markets Debt Fund | 0.6 | 0.6 |
Fidelity Series Floating Rate High Income Fund | 1.1 | 1.1 |
Fidelity Series High Income Fund | 4.7 | 4.7 |
Fidelity Series Real Estate Income Fund | 0.5 | 0.6 |
| 6.9 | 7.0 |
Inflation-Protected Bond Funds | | |
Fidelity Series Inflation-Protected Bond Index Fund | 9.9 | 9.9 |
Investment Grade Bond Funds | | |
Fidelity Series Investment Grade Bond Fund | 22.5 | 22.6 |
Short-Term Funds | | |
Fidelity Institutional Money Market Portfolio Institutional Class | 5.4 | 5.3 |
Fidelity Short-Term Bond Fund | 4.4 | 4.4 |
| 9.8 | 9.7 |
Net Other Assets (Liabilities)* | 0.0 | 0.0 |
| 100.0 | 100.0 |
* Amount represents less than 0.1% |
Asset Allocation (% of fund's net assets) |
Period end |
| Commodity Funds | 5.2% | |
| Domestic Equity Funds | 31.8% | |
| Developed International Equity Funds | 10.9% | |
| Emerging Markets Equity Funds | 3.0% | |
| High Yield Bond Funds | 6.9% | |
| Inflation-Protected Bond Funds | 9.9% | |
| Investment Grade Bond Funds | 22.5% | |
| Short-Term Funds | 9.8% | |

Six months ago |
| Commodity Funds | 5.3% | |
| Domestic Equity Funds | 32.0% | |
| Developed International Equity Funds | 10.6% | |
| Emerging Markets Equity Funds | 2.9% | |
| High Yield Bond Funds | 7.0% | |
| Inflation-Protected Bond Funds | 9.9% | |
| Investment Grade Bond Funds | 22.6% | |
| Short-Term Funds | 9.7% | |

Semiannual Report
Fidelity Freedom 2015 Fund
Investments September 30, 2013 (Unaudited)
Showing Percentage of Net Assets
Domestic Equity Funds - 37.0% |
| Shares | | Value |
Commodity Funds - 5.2% |
Fidelity Series Commodity Strategy Fund (a)(c) | 42,063,112 | | $ 336,925,524 |
Domestic Equity Funds - 31.8% |
Fidelity Blue Chip Growth Fund (c) | 3,960,675 | | 231,343,033 |
Fidelity Growth Company Fund (c) | 2,450,443 | | 291,039,143 |
Fidelity Series 100 Index Fund (c) | 6,169,264 | | 68,355,441 |
Fidelity Series All-Sector Equity Fund (c) | 21,489,340 | | 304,289,054 |
Fidelity Series Equity-Income Fund (c) | 17,432,990 | | 205,360,618 |
Fidelity Series Growth & Income Fund (c) | 6,674,399 | | 80,493,257 |
Fidelity Series Intrinsic Opportunities Fund (c) | 11,886,700 | | 154,289,361 |
Fidelity Series Large Cap Value Fund (c) | 12,416,753 | | 156,823,596 |
Fidelity Series Opportunistic Insights Fund (c) | 12,460,041 | | 160,360,726 |
Fidelity Series Real Estate Equity Fund (c) | 2,615,219 | | 31,278,013 |
Fidelity Series Small Cap Opportunities Fund (c) | 6,535,324 | | 83,848,212 |
Fidelity Series Stock Selector Large Cap Value Fund (c) | 14,919,870 | | 181,724,011 |
Fidelity Small Cap Growth Fund (c) | 2,438,860 | | 45,606,688 |
Fidelity Small Cap Value Fund (c) | 2,351,151 | | 44,624,852 |
TOTAL DOMESTIC EQUITY FUNDS | | 2,039,436,005 |
TOTAL DOMESTIC EQUITY FUNDS (Cost $2,020,224,950) |
2,376,361,529
|
International Equity Funds - 13.9% |
| | | |
Developed International Equity Funds - 10.9% |
Fidelity Series International Growth Fund (c) | 23,313,679 | | 316,366,619 |
Fidelity Series International Small Cap Fund (c) | 4,277,380 | | 65,401,142 |
Fidelity Series International Value Fund (c) | 29,519,397 | | 317,333,523 |
TOTAL DEVELOPED INTERNATIONAL EQUITY FUNDS | | 699,101,284 |
Emerging Markets Equity Funds - 3.0% |
Fidelity Series Emerging Markets Fund (c) | 11,505,667 | | 192,604,869 |
TOTAL INTERNATIONAL EQUITY FUNDS (Cost $772,659,876) |
891,706,153
|
Bond Funds - 39.3% |
| Shares | | Value |
High Yield Bond Funds - 6.9% |
Fidelity Series Emerging Markets Debt Fund (c) | 3,868,659 | | $ 39,150,831 |
Fidelity Series Floating Rate High Income Fund (c) | 6,815,042 | | 72,103,142 |
Fidelity Series High Income Fund (c) | 29,088,515 | | 299,029,934 |
Fidelity Series Real Estate Income Fund (c) | 3,103,356 | | 34,074,845 |
TOTAL HIGH YIELD BOND FUNDS | | 444,358,752 |
Inflation-Protected Bond Funds - 9.9% |
Fidelity Series Inflation-Protected Bond Index Fund (c) | 58,377,515 | | 633,396,036 |
Investment Grade Bond Funds - 22.5% |
Fidelity Series Investment Grade Bond Fund (c) | 129,347,073 | | 1,447,393,744 |
TOTAL BOND FUNDS (Cost $2,518,457,942) |
2,525,148,532
|
Short-Term Funds - 9.8% |
| | | |
Fidelity Institutional Money Market Portfolio Institutional Class 0.04% (b)(c) | 345,937,531 | | 345,937,531 |
Fidelity Short-Term Bond Fund (c) | 33,013,013 | | 283,251,649 |
TOTAL SHORT-TERM FUNDS (Cost $632,078,845) |
629,189,180
|
TOTAL INVESTMENT PORTFOLIO - 100.0% (Cost $5,943,421,613) | | 6,422,405,394 |
NET OTHER ASSETS (LIABILITIES) - 0.0% | | (12,622) |
NET ASSETS - 100% | $ 6,422,392,772 |
Legend |
(a) Non-income producing |
(b) The rate quoted is the annualized seven-day yield of the fund at period end. |
(c) Affiliated company |
Affiliated Underlying Funds |
Information regarding the Fund's fiscal year to date purchases and sales of the affiliated Underlying Funds and income earned by the Fund from investments in affiliated Underlying Funds is as follows: |
Affiliate | Value,
beginning of
period | Purchases | Sales
Proceeds | Dividend
Income | Value,
end of
period |
Fidelity Blue Chip Growth Fund | $ 213,759,696 | $ 16,208,805 | $ 18,219,660 | $ 558,171 | $ 231,343,033 |
Fidelity Disciplined Equity Fund | 47,041,667 | 55,304 | 49,331,893 | - | - |
Fidelity Growth Company Fund | 293,214,576 | 4,295,450 | 52,546,249 | - | 291,039,143 |
Fidelity Institutional Money Market Portfolio Institutional Class | 347,754,811 | 20,290,489 | 22,107,769 | 200,389 | 345,937,531 |
Fidelity Series 100 Index Fund | 73,222,342 | 1,053,760 | 11,058,975 | - | 68,355,441 |
Fidelity Series All-Sector Equity Fund | 316,372,211 | 3,084,830 | 45,667,085 | - | 304,289,054 |
Fidelity Series Commodity Strategy Fund | 346,399,555 | 40,180,432 | 22,477,808 | - | 336,925,524 |
Fidelity Series Emerging Markets Debt Fund | 42,694,851 | 1,860,016 | 2,434,595 | 1,073,116 | 39,150,831 |
Fidelity Series Emerging Markets Fund | 189,047,511 | 14,755,523 | 11,937,253 | - | 192,604,869 |
Fidelity Series Equity-Income Fund | 200,337,181 | 7,552,938 | 14,427,539 | 2,040,520 | 205,360,618 |
Fidelity Series Floating Rate High Income Fund | 73,928,556 | 2,959,414 | 4,439,797 | 1,591,501 | 72,103,142 |
Fidelity Series Growth & Income Fund (formerly Fidelity Series Mega Cap Fund) | 73,162,778 | 5,915,679 | 5,444,828 | - | 80,493,257 |
Fidelity Series High Income Fund | 305,127,509 | 20,165,780 | 19,632,068 | 7,888,137 | 299,029,934 |
Fidelity Series Inflation-Protected Bond Index Fund | 643,423,611 | 56,872,726 | 35,900,578 | - | 633,396,036 |
Fidelity Series International Growth Fund | 313,168,036 | 5,408,861 | 23,853,966 | - | 316,366,619 |
Fidelity Series International Small Cap Fund | 63,922,233 | 1,062,615 | 6,436,553 | - | 65,401,142 |
Fidelity Series International Value Fund | 310,953,542 | 5,318,018 | 26,989,452 | - | 317,333,523 |
Fidelity Series Intrinsic Opportunities Fund | 118,472,548 | 26,021,631 | 9,122,950 | 913,506 | 154,289,361 |
Fidelity Series Investment Grade Bond Fund | 1,468,099,626 | 102,935,784 | 79,814,957 | 15,117,847 | 1,447,393,744 |
Fidelity Series Large Cap Value Fund | 190,651,645 | 1,218,309 | 50,131,490 | - | 156,823,596 |
Fidelity Series Opportunistic Insights Fund | 146,144,507 | 2,778,899 | 12,471,273 | - | 160,360,726 |
Fidelity Series Real Estate Equity Fund | 30,362,650 | 5,539,784 | 1,923,854 | 211,921 | 31,278,013 |
Fidelity Series Real Estate Income Fund | 36,597,869 | 2,213,817 | 2,648,560 | 1,030,864 | 34,074,845 |
Fidelity Series Small Cap Opportunities Fund | 81,880,283 | 7,415,960 | 8,882,914 | - | 83,848,212 |
Fidelity Series Stock Selector Large Cap Value Fund | 201,706,380 | 2,947,595 | 39,825,335 | - | 181,724,011 |
Fidelity Short-Term Bond Fund | 286,320,176 | 16,672,089 | 19,033,024 | 1,093,638 | 283,251,649 |
Fidelity Small Cap Growth Fund | 45,014,044 | 5,278,287 | 6,389,681 | - | 45,606,688 |
Fidelity Small Cap Value Fund | 48,403,699 | 3,435,254 | 7,704,747 | 70,478 | 44,624,852 |
Total | $ 6,507,184,093 | $ 383,498,049 | $ 610,854,853 | $ 31,790,088 | $ 6,422,405,394 |
Other Information |
All investments are categorized as Level 1 under the Fair Value Hierarchy. The inputs or methodology used for valuing securities may not be an indication of the risk associated with investing in those securities. For more information on valuation inputs, please refer to the Investment Valuation section in the accompanying Notes to Financial Statements. |
See accompanying notes which are an integral part of the financial statements.
Semiannual Report
Fidelity Freedom 2015 Fund
Statement of Assets and Liabilities
| September 30, 2013 (Unaudited) |
| | |
Assets | | |
Investment in securities, at value (cost $5,943,421,613) - See accompanying schedule | | $ 6,422,405,394 |
Receivable for investments sold | | 4,644,134 |
Receivable for fund shares sold | | 6,527,142 |
Total assets | | 6,433,576,670 |
| | |
Liabilities | | |
Payable for fund shares redeemed | | 11,183,898 |
| | |
Net Assets | | $ 6,422,392,772 |
Net Assets consist of: | | |
Paid in capital | | $ 5,858,863,154 |
Undistributed net investment income | | 31,277,457 |
Accumulated undistributed net realized gain (loss) on investments | | 53,268,380 |
Net unrealized appreciation (depreciation) on investments | | 478,983,781 |
Net Assets, for 510,559,290 shares outstanding | | $ 6,422,392,772 |
Net Asset Value, offering price and redemption price per share ($6,422,392,772 ÷ 510,559,290 shares) | | $ 12.58 |
Statement of Operations
Six months ended September 30, 2013 (Unaudited) |
| | |
Investment Income | | |
Income distributions from underlying funds | | $ 31,790,088 |
| | |
Expenses | | |
Independent trustees' compensation | $ 12,081 | |
Total expenses before reductions | 12,081 | |
Expense reductions | (12,081) | - |
Net investment income (loss) | | 31,790,088 |
Realized and Unrealized Gain (Loss) Realized gain (loss) on sale of underlying fund shares | 36,766,836 | |
Capital gain distributions from underlying funds | 29,188,341 | |
Total net realized gain (loss) | | 65,955,177 |
Change in net unrealized appreciation (depreciation) on underlying funds | | 105,810,909 |
Net gain (loss) | | 171,766,086 |
Net increase (decrease) in net assets resulting from operations | | $ 203,556,174 |
See accompanying notes which are an integral part of the financial statements.
Semiannual Report
Fidelity Freedom 2015 Fund
Financial Statements - continued
Statement of Changes in Net Assets
| Six months ended
September 30, 2013
(Unaudited) | Year ended
March 31,
2013 |
Increase (Decrease) in Net Assets | | |
Operations | | |
Net investment income (loss) | $ 31,790,088 | $ 104,883,570 |
Net realized gain (loss) | 65,955,177 | 382,847,840 |
Change in net unrealized appreciation (depreciation) | 105,810,909 | (18,263,602) |
Net increase (decrease) in net assets resulting from operations | 203,556,174 | 469,467,808 |
Distributions to shareholders from net investment income | (13,672,252) | (110,329,490) |
Distributions to shareholders from net realized gain | (37,861,474) | (45,506,416) |
Total distributions | (51,533,726) | (155,835,906) |
Share transactions
Proceeds from sales of shares | 908,915,025 | 1,800,318,470 |
Reinvestment of distributions | 51,296,963 | 155,091,386 |
Cost of shares redeemed | (1,197,010,833) | (3,017,087,231) |
Net increase (decrease) in net assets resulting from share transactions | (236,798,845) | (1,061,677,375) |
Total increase (decrease) in net assets | (84,776,397) | (748,045,473) |
| | |
Net Assets | | |
Beginning of period | 6,507,169,169 | 7,255,214,642 |
End of period (including undistributed net investment income of $31,277,457 and undistributed net investment income of $13,159,621, respectively) | $ 6,422,392,772 | $ 6,507,169,169 |
Other Information Shares | | |
Sold | 73,568,127 | 152,357,073 |
Issued in reinvestment of distributions | 4,126,868 | 13,251,938 |
Redeemed | (97,000,356) | (256,121,423) |
Net increase (decrease) | (19,305,361) | (90,512,412) |
Financial Highlights
| Six months ended
September 30, 2013 | Years ended March 31, |
| (Unaudited) | 2013 | 2012 | 2011 | 2010 | 2009 |
Selected Per-Share Data | | | | | | |
Net asset value, beginning of period | $ 12.28 | $ 11.69 | $ 11.74 | $ 10.74 | $ 8.13 | $ 11.73 |
Income from Investment Operations | | | | | | |
Net investment income (loss) D | .06 | .18 | .20 | .18 | .24 | .29 |
Net realized and unrealized gain (loss) | .34 | .69 | .12 | 1.12 | 2.70 | (3.29) |
Total from investment operations | .40 | .87 | .32 | 1.30 | 2.94 | (3.00) |
Distributions from net investment income | (.03) | (.20) | (.21) | (.20) | (.24) | (.30) |
Distributions from net realized gain | (.07) | (.08) | (.16) | (.10) | (.09) | (.30) |
Total distributions | (.10) | (.28) | (.37) | (.30) | (.33) H | (.60) |
Net asset value, end of period | $ 12.58 | $ 12.28 | $ 11.69 | $ 11.74 | $ 10.74 | $ 8.13 |
Total Return B, C | 3.25% | 7.60% | 2.95% | 12.24% | 36.33% | (26.45)% |
Ratios to Average Net Assets E, G | | | | | | |
Expenses before reductions F | .00% A | .00% | .00% | .00% | .00% | .00% |
Expenses net of fee waivers, if any | .00% A | .00% | .00% | .00% | .00% | .00% |
Expenses net of all reductions | .00% A | .00% | .00% | .00% | .00% | .00% |
Net investment income (loss) | .99% A | 1.57% | 1.71% | 1.66% | 2.38% | 2.97% |
Supplemental Data | | | | | | |
Net assets, end of period (000 omitted) | $ 6,422,393 | $ 6,507,169 | $ 7,255,215 | $ 8,851,315 | $ 8,848,519 | $ 6,089,406 |
Portfolio turnover rate E | 12% A | 23% | 24% | 43% | 30% | 36% |
A Annualized
B Total returns for periods of less than one year are not annualized.
C Total returns would have been lower if certain expenses had not been reduced during the applicable periods shown.
D Calculated based on average shares outstanding during the period.
E Amounts do not include the activity of the Underlying Funds.
F Amount represents less than .01%.
G Expense ratios reflect operating expenses of the Fund. Expenses before reductions do not reflect amounts reimbursed by the investment adviser or reductions from expense offset arrangements and do not represent the amount paid by the Fund during periods when reimbursements or reductions occur. Expenses net of fee waivers reflect expenses after reimbursement by the investment adviser but prior to reductions from expense offset arrangements. Expenses net of all reductions represent the net expenses paid by the Fund but do not include expenses of the investment companies in which the Fund invests.
H Total distributions of $.33 per share is comprised of distributions from net investment income of $.235 and distributions from net realized gain of $.091 per share.
See accompanying notes which are an integral part of the financial statements.
Semiannual Report
Fidelity Freedom 2020 Fund
Investment Changes (Unaudited)
The information in the following tables is based on the direct investments of the Fund. |
Fund Holdings as of September 30, 2013 |
| % of fund's
net assets | % of fund's net assets
6 months ago |
Commodity Funds | | |
Fidelity Series Commodity Strategy Fund | 5.7 | 5.8 |
Domestic Equity Funds | | |
Fidelity Blue Chip Growth Fund | 3.9 | 3.6 |
Fidelity Disciplined Equity Fund | 0.0 | 0.8 |
Fidelity Growth Company Fund | 4.9 | 4.9 |
Fidelity Series 100 Index Fund | 1.1 | 1.2 |
Fidelity Series All-Sector Equity Fund | 5.1 | 5.4 |
Fidelity Series Equity-Income Fund | 3.5 | 3.4 |
Fidelity Series Growth & Income Fund (formerly Fidelity Series Mega Cap Fund) | 1.3 | 1.2 |
Fidelity Series Intrinsic Opportunities Fund | 2.6 | 1.9 |
Fidelity Series Large Cap Value Fund | 2.6 | 3.2 |
Fidelity Series Opportunistic Insights Fund | 2.7 | 2.5 |
Fidelity Series Real Estate Equity Fund | 0.5 | 0.5 |
Fidelity Series Small Cap Opportunities Fund | 1.4 | 1.4 |
Fidelity Series Stock Selector Large Cap Value Fund | 3.1 | 3.4 |
Fidelity Small Cap Growth Fund | 0.8 | 0.8 |
Fidelity Small Cap Value Fund | 0.7 | 0.8 |
| 34.2 | 35.0 |
Developed International Equity Funds | |
Fidelity Series International Growth Fund | 5.4 | 5.2 |
Fidelity Series International Small Cap Fund | 1.1 | 1.1 |
Fidelity Series International Value Fund | 5.3 | 5.2 |
| 11.8 | 11.5 |
Emerging Markets Equity Funds | | |
Fidelity Series Emerging Markets Fund | 3.2 | 3.2 |
High Yield Bond Funds | | |
Fidelity Series Emerging Markets Debt Fund | 0.7 | 0.8 |
Fidelity Series Floating Rate High Income Fund | 1.1 | 1.1 |
Fidelity Series High Income Fund | 5.1 | 5.4 |
Fidelity Series Real Estate Income Fund | 0.6 | 0.6 |
| 7.5 | 7.9 |
Inflation-Protected Bond Funds | | |
Fidelity Series Inflation-Protected Bond Index Fund | 8.3 | 8.2 |
Investment Grade Bond Funds | | |
Fidelity Series Investment Grade Bond Fund | 22.0 | 21.7 |
Short-Term Funds | | |
Fidelity Institutional Money Market Portfolio Institutional Class | 4.0 | 3.7 |
Fidelity Short-Term Bond Fund | 3.3 | 3.0 |
| 7.3 | 6.7 |
Net Other Assets (Liabilities)* | 0.0 | 0.0 |
| 100.0 | 100.0 |
* Amount represents less than 0.1% |
Asset Allocation (% of fund's net assets) |
Period end |
| Commodity Funds | 5.7% | |
| Domestic Equity Funds | 34.2% | |
| Developed International Equity Funds | 11.8% | |
| Emerging Markets Equity Funds | 3.2% | |
| High Yield Bond Funds | 7.5% | |
| Inflation-Protected Bond Funds | 8.3% | |
| Investment Grade Bond Funds | 22.0% | |
| Short-Term Funds | 7.3% | |

Six months ago |
| Commodity Funds | 5.8% | |
| Domestic Equity Funds | 35.0% | |
| Developed International Equity Funds | 11.5% | |
| Emerging Markets Equity Funds | 3.2% | |
| High Yield Bond Funds | 7.9% | |
| Inflation-Protected Bond Funds | 8.2% | |
| Investment Grade Bond Funds | 21.7% | |
| Short-Term Funds | 6.7% | |

Semiannual Report
Fidelity Freedom 2020 Fund
Investments September 30, 2013 (Unaudited)
Showing Percentage of Net Assets
Domestic Equity Funds - 39.9% |
| Shares | | Value |
Commodity Funds - 5.7% |
Fidelity Series Commodity Strategy Fund (a)(c) | 96,030,689 | | $ 769,205,821 |
Domestic Equity Funds - 34.2% |
Fidelity Blue Chip Growth Fund (c) | 9,076,880 | | 530,180,576 |
Fidelity Growth Company Fund (c) | 5,595,849 | | 664,619,035 |
Fidelity Series 100 Index Fund (c) | 13,711,850 | | 151,927,298 |
Fidelity Series All-Sector Equity Fund (c) | 48,941,906 | | 693,017,391 |
Fidelity Series Equity-Income Fund (c) | 39,587,205 | | 466,337,269 |
Fidelity Series Growth & Income Fund (c) | 15,101,993 | | 182,130,035 |
Fidelity Series Intrinsic Opportunities Fund (c) | 26,607,496 | | 345,365,304 |
Fidelity Series Large Cap Value Fund (c) | 28,173,755 | | 355,834,528 |
Fidelity Series Opportunistic Insights Fund (c) | 28,460,028 | | 366,280,563 |
Fidelity Series Real Estate Equity Fund (c) | 5,929,351 | | 70,915,039 |
Fidelity Series Small Cap Opportunities Fund (c) | 14,464,266 | | 185,576,535 |
Fidelity Series Stock Selector Large Cap Value Fund (c) | 33,977,403 | | 413,844,764 |
Fidelity Small Cap Growth Fund (c) | 5,450,026 | | 101,915,484 |
Fidelity Small Cap Value Fund (c) | 5,112,468 | | 97,034,634 |
TOTAL DOMESTIC EQUITY FUNDS | | 4,624,978,455 |
TOTAL DOMESTIC EQUITY FUNDS (Cost $4,534,340,275) |
5,394,184,276
|
International Equity Funds - 15.0% |
| | | |
Developed International Equity Funds - 11.8% |
Fidelity Series International Growth Fund (c) | 53,169,220 | | 721,506,311 |
Fidelity Series International Small Cap Fund (c) | 9,660,176 | | 147,704,083 |
Fidelity Series International Value Fund (c) | 66,953,637 | | 719,751,602 |
TOTAL DEVELOPED INTERNATIONAL EQUITY FUNDS | | 1,588,961,996 |
Emerging Markets Equity Funds - 3.2% |
Fidelity Series Emerging Markets Fund (c) | 26,139,707 | | 437,578,692 |
TOTAL INTERNATIONAL EQUITY FUNDS (Cost $1,761,586,627) |
2,026,540,688
|
Bond Funds - 37.8% |
| Shares | | Value |
High Yield Bond Funds - 7.5% |
Fidelity Series Emerging Markets Debt Fund (c) | 9,748,727 | | $ 98,657,112 |
Fidelity Series Floating Rate High Income Fund (c) | 14,181,417 | | 150,039,391 |
Fidelity Series High Income Fund (c) | 66,862,743 | | 687,349,002 |
Fidelity Series Real Estate Income Fund (c) | 6,957,232 | | 76,390,410 |
TOTAL HIGH YIELD BOND FUNDS | | 1,012,435,915 |
Inflation-Protected Bond Funds - 8.3% |
Fidelity Series Inflation-Protected Bond Index Fund (c) | 103,723,000 | | 1,125,394,546 |
Investment Grade Bond Funds - 22.0% |
Fidelity Series Investment Grade Bond Fund (c) | 265,081,976 | | 2,966,267,306 |
TOTAL BOND FUNDS (Cost $5,122,323,511) |
5,104,097,767
|
Short-Term Funds - 7.3% |
| | | |
Fidelity Institutional Money Market Portfolio Institutional Class 0.04% (b)(c) | 541,545,881 | | 541,545,881 |
Fidelity Short-Term Bond Fund (c) | 51,631,399 | | 442,997,403 |
TOTAL SHORT-TERM FUNDS (Cost $983,687,095) |
984,543,284
|
TOTAL INVESTMENT PORTFOLIO - 100.0% (Cost $12,401,937,508) | 13,509,366,015 |
NET OTHER ASSETS (LIABILITIES) - 0.0% | | (14,987) |
NET ASSETS - 100% | $ 13,509,351,028 |
Legend |
(a) Non-income producing |
(b) The rate quoted is the annualized seven-day yield of the fund at period end. |
(c) Affiliated company |
Affiliated Underlying Funds |
Information regarding the Fund's fiscal year to date purchases and sales of the affiliated Underlying Funds and income earned by the Fund from investments in affiliated Underlying Funds is as follows: |
Affiliate | Value,
beginning of
period | Purchases | Sales
Proceeds | Dividend
Income | Value,
end of
period |
Fidelity Blue Chip Growth Fund | $ 492,062,782 | $ 38,383,843 | $ 45,391,322 | $ 1,275,642 | $ 530,180,576 |
Fidelity Disciplined Equity Fund | 108,272,106 | 122,145 | 113,485,481 | - | - |
Fidelity Growth Company Fund | 663,180,853 | 8,544,634 | 112,077,373 | - | 664,619,035 |
Fidelity Institutional Money Market Portfolio Institutional Class | 500,577,942 | 66,511,032 | 25,543,093 | 301,722 | 541,545,881 |
Fidelity Series 100 Index Fund | 167,578,924 | 2,138,625 | 29,616,223 | - | 151,927,298 |
Fidelity Series All-Sector Equity Fund | 725,747,232 | 6,365,808 | 108,778,580 | - | 693,017,391 |
Fidelity Series Commodity Strategy Fund | 793,221,467 | 85,796,185 | 47,238,683 | - | 769,205,821 |
Fidelity Series Emerging Markets Debt Fund | 106,653,094 | 5,022,112 | 5,601,621 | 2,688,447 | 98,657,112 |
Fidelity Series Emerging Markets Fund | 432,568,504 | 28,716,914 | 25,118,537 | - | 437,578,692 |
Fidelity Series Equity-Income Fund | 460,774,634 | 14,968,980 | 36,619,245 | 4,658,738 | 466,337,269 |
Fidelity Series Floating Rate High Income Fund | 154,240,602 | 6,285,083 | 9,764,153 | 3,312,685 | 150,039,391 |
Fidelity Series Growth & Income Fund (formerly Fidelity Series Mega Cap Fund) | 168,043,313 | 10,735,833 | 12,326,610 | - | 182,130,035 |
Fidelity Series High Income Fund | 731,007,157 | 34,126,596 | 62,036,107 | 18,439,422 | 687,349,002 |
Fidelity Series Inflation-Protected Bond Index Fund | 1,109,832,266 | 124,701,579 | 55,005,075 | - | 1,125,394,546 |
Fidelity Series International Growth Fund | 714,965,886 | 11,065,942 | 53,828,870 | - | 721,506,311 |
Fidelity Series International Small Cap Fund | 145,365,421 | 2,215,762 | 15,361,040 | - | 147,704,083 |
Fidelity Series International Value Fund | 707,702,951 | 11,114,983 | 62,713,914 | - | 719,751,602 |
Fidelity Series Intrinsic Opportunities Fund | 261,908,477 | 58,823,622 | 16,999,289 | 2,044,356 | 345,365,304 |
Fidelity Series Investment Grade Bond Fund | 2,944,508,889 | 252,049,274 | 141,492,210 | 30,711,761 | 2,966,267,306 |
Fidelity Series Large Cap Value Fund | 429,894,987 | 2,318,731 | 110,124,926 | - | 355,834,528 |
Fidelity Series Opportunistic Insights Fund | 335,611,023 | 4,971,764 | 28,904,726 | - | 366,280,563 |
Fidelity Series Real Estate Equity Fund | 72,192,684 | 8,988,791 | 4,070,232 | 487,603 | 70,915,039 |
Fidelity Series Real Estate Income Fund | 81,896,972 | 5,049,924 | 5,849,871 | 2,322,200 | 76,390,410 |
Fidelity Series Small Cap Opportunities Fund | 188,084,857 | 16,072,189 | 26,729,220 | - | 185,576,535 |
Fidelity Series Stock Selector Large Cap Value Fund | 463,784,970 | 5,974,114 | 94,718,417 | - | 413,844,764 |
Fidelity Short-Term Bond Fund | 410,672,936 | 54,791,808 | 21,460,381 | 1,650,921 | 442,997,403 |
Fidelity Small Cap Growth Fund | 101,126,412 | 11,712,172 | 14,795,146 | - | 101,915,484 |
Fidelity Small Cap Value Fund | 108,495,992 | 7,412,998 | 20,199,512 | 153,143 | 97,034,634 |
Total | $ 13,579,973,333 | $ 884,981,443 | $ 1,305,849,857 | $ 68,046,640 | $ 13,509,366,015 |
Other Information |
All investments are categorized as Level 1 under the Fair Value Hierarchy. The inputs or methodology used for valuing securities may not be an indication of the risk associated with investing in those securities. For more information on valuation inputs, please refer to the Investment Valuation section in the accompanying Notes to Financial Statements. |
See accompanying notes which are an integral part of the financial statements.
Semiannual Report
Fidelity Freedom 2020 Fund
Statement of Assets and Liabilities
| September 30, 2013 (Unaudited) |
| | |
Assets | | |
Investment in securities, at value (cost $12,401,937,508) - See accompanying schedule | | $ 13,509,366,015 |
Cash | | 6 |
Receivable for investments sold | | 5,473,868 |
Receivable for fund shares sold | | 12,491,665 |
Other receivables | | 100,574 |
Total assets | | 13,527,432,128 |
| | |
Liabilities | | |
Payable for fund shares redeemed | $ 17,980,526 | |
Other payables and accrued expenses | 100,574 | |
Total liabilities | | 18,081,100 |
| | |
Net Assets | | $ 13,509,351,028 |
Net Assets consist of: | | |
Paid in capital | | $ 12,194,097,475 |
Undistributed net investment income | | 67,495,534 |
Accumulated undistributed net realized gain (loss) on investments | | 140,329,512 |
Net unrealized appreciation (depreciation) on investments | | 1,107,428,507 |
Net Assets, for 878,073,637 shares outstanding | | $ 13,509,351,028 |
Net Asset Value, offering price and redemption price per share ($13,509,351,028 ÷ 878,073,637 shares) | | $ 15.39 |
Statement of Operations
Six months ended September 30, 2013 (Unaudited) |
| | |
Investment Income | | |
Income distributions from underlying funds | | $ 68,046,640 |
| | |
Expenses | | |
Independent trustees' compensation | $ 25,268 | |
Total expenses before reductions | 25,268 | |
Expense reductions | (25,268) | - |
Net investment income (loss) | | 68,046,640 |
Realized and Unrealized Gain (Loss) Realized gain (loss) on sale of underlying fund shares | 102,934,599 | |
Capital gain distributions from underlying funds | 65,577,135 | |
Total net realized gain (loss) | | 168,511,734 |
Change in net unrealized appreciation (depreciation) on underlying funds | | 247,326,495 |
Net gain (loss) | | 415,838,229 |
Net increase (decrease) in net assets resulting from operations | | $ 483,884,869 |
See accompanying notes which are an integral part of the financial statements.
Semiannual Report
Fidelity Freedom 2020 Fund
Financial Statements - continued
Statement of Changes in Net Assets
| Six months ended
September 30, 2013
(Unaudited) | Year ended
March 31,
2013 |
Increase (Decrease) in Net Assets | | |
Operations | | |
Net investment income (loss) | $ 68,046,640 | $ 232,843,698 |
Net realized gain (loss) | 168,511,734 | 966,217,209 |
Change in net unrealized appreciation (depreciation) | 247,326,495 | (145,899,197) |
Net increase (decrease) in net assets resulting from operations | 483,884,869 | 1,053,161,710 |
Distributions to shareholders from net investment income | (29,846,241) | (243,387,454) |
Distributions to shareholders from net realized gain | (59,692,392) | (89,218,598) |
Total distributions | (89,538,633) | (332,606,052) |
Share transactions
Proceeds from sales of shares | 1,481,475,607 | 3,011,958,439 |
Reinvestment of distributions | 89,201,443 | 331,286,060 |
Cost of shares redeemed | (2,035,622,715) | (5,907,826,193) |
Net increase (decrease) in net assets resulting from share transactions | (464,945,665) | (2,564,581,694) |
Total increase (decrease) in net assets | (70,599,429) | (1,844,026,036) |
| | |
Net Assets | | |
Beginning of period | 13,579,950,457 | 15,423,976,493 |
End of period (including undistributed net investment income of $67,495,534 and undistributed net investment income of $29,295,135, respectively) | $ 13,509,351,028 | $ 13,579,950,457 |
Other Information Shares | | |
Sold | 98,280,650 | 210,663,326 |
Issued in reinvestment of distributions | 5,880,124 | 23,411,907 |
Redeemed | (135,168,513) | (414,285,789) |
Net increase (decrease) | (31,007,739) | (180,210,556) |
Financial Highlights
| Six months ended
September 30, 2013 | Years ended March 31, |
| (Unaudited) | 2013 | 2012 | 2011 | 2010 | 2009 |
Selected Per-Share Data | | | | | | |
Net asset value, beginning of period | $ 14.94 | $ 14.16 | $ 14.33 | $ 12.98 | $ 9.42 | $ 14.66 |
Income from Investment Operations | | | | | | |
Net investment income (loss) D | .08 | .24 | .24 | .22 | .27 | .33 |
Net realized and unrealized gain (loss) | .47 | .89 | .08 | 1.50 | 3.68 | (4.74) |
Total from investment operations | .55 | 1.13 | .32 | 1.72 | 3.95 | (4.41) |
Distributions from net investment income | (.03) | (.25) | (.26) | (.24) | (.29) | (.31) |
Distributions from net realized gain | (.07) | (.10) | (.22) | (.14) | (.11) | (.52) |
Total distributions | (.10) | (.35) | (.49) J | (.37) I | (.39) H | (.83) |
Net asset value, end of period | $ 15.39 | $ 14.94 | $ 14.16 | $ 14.33 | $ 12.98 | $ 9.42 |
Total Return B, C | 3.68% | 8.12% | 2.45% | 13.47% | 42.19% | (31.39)% |
Ratios to Average Net Assets E, G | | | | | | |
Expenses before reductions F | .00% A | .00% | .00% | .00% | .00% | .00% |
Expenses net of fee waivers, if any | .00% A | .00% | .00% | .00% | .00% | .00% |
Expenses net of all reductions | .00% A | .00% | .00% | .00% | .00% | .00% |
Net investment income (loss) | 1.01% A | 1.65% | 1.74% | 1.69% | 2.30% | 2.73% |
Supplemental Data | | | | | | |
Net assets, end of period (000 omitted) | $ 13,509,351 | $ 13,579,950 | $ 15,423,976 | $ 19,923,391 | $ 20,563,040 | $ 14,316,696 |
Portfolio turnover rate E | 13% A | 25% | 24% | 42% | 29% | 35% |
A Annualized
B Total returns for periods of less than one year are not annualized.
C Total returns would have been lower if certain expenses had not been reduced during the applicable periods shown.
D Calculated based on average shares outstanding during the period.
E Amounts do not include the activity of the Underlying Funds.
F Amount represents less than .01%.
G Expense ratios reflect operating expenses of the Fund. Expenses before reductions do not reflect amounts reimbursed by the investment adviser or reductions from expense offset arrangements and do not represent the amount paid by the Fund during periods when reimbursements or reductions occur. Expenses net of fee waivers reflect expenses after reimbursement by the investment adviser but prior to reductions from expense offset arrangements. Expenses net of all reductions represent the net expenses paid by the Fund but do not include expenses of the investment companies in which the Fund invests.
H Total distributions of $.39 per share is comprised of distributions from net investment income of $.285 and distributions from net realized gain of $.105 per share.
I Total distributions of $.37 per share is comprised of distributions from net investment income of $.236 and distributions from net realized gain of $.135 per share.
J Total distributions of $.49 per share is comprised of distributions from net investment income of $.264 and distributions from net realized gain of $.222 per share.
See accompanying notes which are an integral part of the financial statements.
Semiannual Report
Fidelity Freedom 2025 Fund
Investment Changes (Unaudited)
The information in the following tables is based on the direct investments of the Fund. |
Fund Holdings as of September 30, 2013 |
| % of fund's
net assets | % of fund's net assets
6 months ago |
Commodity Funds | | |
Fidelity Series Commodity Strategy Fund | 7.0 | 7.2 |
Domestic Equity Funds | | |
Fidelity Blue Chip Growth Fund | 4.7 | 4.4 |
Fidelity Disciplined Equity Fund | 0.0 | 1.0 |
Fidelity Growth Company Fund | 6.0 | 6.0 |
Fidelity Series 100 Index Fund | 1.4 | 1.5 |
Fidelity Series All-Sector Equity Fund | 6.2 | 6.5 |
Fidelity Series Equity-Income Fund | 4.2 | 4.0 |
Fidelity Series Growth & Income Fund (formerly Fidelity Series Mega Cap Fund) | 1.7 | 1.5 |
Fidelity Series Intrinsic Opportunities Fund | 3.2 | 2.5 |
Fidelity Series Large Cap Value Fund | 3.2 | 3.9 |
Fidelity Series Opportunistic Insights Fund | 3.2 | 2.9 |
Fidelity Series Real Estate Equity Fund | 0.7 | 0.6 |
Fidelity Series Small Cap Opportunities Fund | 1.7 | 1.7 |
Fidelity Series Stock Selector Large Cap Value Fund | 3.8 | 4.1 |
Fidelity Small Cap Growth Fund | 0.9 | 0.9 |
Fidelity Small Cap Value Fund | 0.9 | 1.0 |
| 41.8 | 42.5 |
Developed International Equity Funds | |
Fidelity Series International Growth Fund | 6.4 | 6.3 |
Fidelity Series International Small Cap Fund | 1.4 | 1.3 |
Fidelity Series International Value Fund | 6.5 | 6.3 |
| 14.3 | 13.9 |
Emerging Markets Equity Funds | | |
Fidelity Series Emerging Markets Fund | 3.9 | 3.9 |
High Yield Bond Funds | | |
Fidelity Series Emerging Markets Debt Fund | 0.7 | 0.8 |
Fidelity Series Floating Rate High Income Fund | 1.0 | 1.0 |
Fidelity Series High Income Fund | 6.8 | 6.9 |
Fidelity Series Real Estate Income Fund | 0.5 | 0.5 |
| 9.0 | 9.2 |
Inflation-Protected Bond Funds | | |
Fidelity Series Inflation-Protected Bond Index Fund | 5.6 | 5.4 |
Investment Grade Bond Funds | | |
Fidelity Series Investment Grade Bond Fund | 17.4 | 17.2 |
Short-Term Funds | | |
Fidelity Institutional Money Market Portfolio Institutional Class | 0.5 | 0.4 |
Fidelity Short-Term Bond Fund | 0.5 | 0.3 |
| 1.0 | 0.7 |
Net Other Assets (Liabilities)* | 0.0 | 0.0 |
| 100.0 | 100.0 |
* Amount represents less than 0.1% |
Asset Allocation (% of fund's net assets) |
Period end |
| Commodity Funds | 7.0% | |
| Domestic Equity Funds | 41.8% | |
| Developed International Equity Funds | 14.3% | |
| Emerging Markets Equity Funds | 3.9% | |
| High Yield Bond Funds | 9.0% | |
| Inflation-Protected Bond Funds | 5.6% | |
| Investment Grade Bond Funds | 17.4% | |
| Short-Term Funds | 1.0% | |

Six months ago |
| Commodity Funds | 7.2% | |
| Domestic Equity Funds | 42.5% | |
| Developed International Equity Funds | 13.9% | |
| Emerging Markets Equity Funds | 3.9% | |
| High Yield Bond Funds | 9.2% | |
| Inflation-Protected Bond Funds | 5.4% | |
| Investment Grade Bond Funds | 17.2% | |
| Short-Term Funds | 0.7% | |

Semiannual Report
Fidelity Freedom 2025 Fund
Investments September 30, 2013 (Unaudited)
Showing Percentage of Net Assets
Domestic Equity Funds - 48.8% |
| Shares | | Value |
Commodity Funds - 7.0% |
Fidelity Series Commodity Strategy Fund (a)(c) | 75,635,781 | | $ 605,842,604 |
Domestic Equity Funds - 41.8% |
Fidelity Blue Chip Growth Fund (c) | 6,967,087 | | 406,947,550 |
Fidelity Growth Company Fund (c) | 4,339,895 | | 515,449,326 |
Fidelity Series 100 Index Fund (c) | 10,905,946 | | 120,837,876 |
Fidelity Series All-Sector Equity Fund (c) | 37,871,919 | | 536,266,378 |
Fidelity Series Equity-Income Fund (c) | 30,505,647 | | 359,356,519 |
Fidelity Series Growth & Income Fund (c) | 11,823,772 | | 142,594,695 |
Fidelity Series Intrinsic Opportunities Fund (c) | 21,057,020 | | 273,320,121 |
Fidelity Series Large Cap Value Fund (c) | 21,985,166 | | 277,672,651 |
Fidelity Series Opportunistic Insights Fund (c) | 21,673,629 | | 278,939,604 |
Fidelity Series Real Estate Equity Fund (c) | 4,616,581 | | 55,214,314 |
Fidelity Series Small Cap Opportunities Fund (c) | 11,527,597 | | 147,899,073 |
Fidelity Series Stock Selector Large Cap Value Fund (c) | 26,485,534 | | 322,593,806 |
Fidelity Small Cap Growth Fund (c) | 4,295,751 | | 80,330,538 |
Fidelity Small Cap Value Fund (c) | 4,147,676 | | 78,722,884 |
TOTAL DOMESTIC EQUITY FUNDS | | 3,596,145,335 |
TOTAL DOMESTIC EQUITY FUNDS (Cost $3,591,007,243) |
4,201,987,939
|
International Equity Funds - 18.2% |
| | | |
Developed International Equity Funds - 14.3% |
Fidelity Series International Growth Fund (c) | 40,994,218 | | 556,291,544 |
Fidelity Series International Small Cap Fund (c) | 7,669,288 | | 117,263,420 |
Fidelity Series International Value Fund (c) | 52,255,847 | | 561,750,359 |
TOTAL DEVELOPED INTERNATIONAL EQUITY FUNDS | | 1,235,305,323 |
Emerging Markets Equity Funds - 3.9% |
Fidelity Series Emerging Markets Fund (c) | 19,921,830 | | 333,491,430 |
TOTAL INTERNATIONAL EQUITY FUNDS (Cost $1,343,433,531) |
1,568,796,753
|
Bond Funds - 32.0% |
| Shares | | Value |
High Yield Bond Funds - 9.0% |
Fidelity Series Emerging Markets Debt Fund (c) | 6,122,465 | | $ 61,959,342 |
Fidelity Series Floating Rate High Income Fund (c) | 7,729,485 | | 81,777,952 |
Fidelity Series High Income Fund (c) | 57,178,215 | | 587,792,046 |
Fidelity Series Real Estate Income Fund (c) | 4,124,584 | | 45,287,935 |
TOTAL HIGH YIELD BOND FUNDS | | 776,817,275 |
Inflation-Protected Bond Funds - 5.6% |
Fidelity Series Inflation-Protected Bond Index Fund (c) | 44,451,675 | | 482,300,669 |
Investment Grade Bond Funds - 17.4% |
Fidelity Series Investment Grade Bond Fund (c) | 134,035,719 | | 1,499,859,696 |
TOTAL BOND FUNDS (Cost $2,747,983,933) |
2,758,977,640
|
Short-Term Funds - 1.0% |
| | | |
Fidelity Institutional Money Market Portfolio Institutional Class 0.04% (b)(c) | 46,630,217 | | 46,630,217 |
Fidelity Short-Term Bond Fund (c) | 4,459,628 | | 38,263,612 |
TOTAL SHORT-TERM FUNDS (Cost $84,826,245) |
84,893,829
|
TOTAL INVESTMENT PORTFOLIO - 100.0% (Cost $7,767,250,952) | | 8,614,656,161 |
NET OTHER ASSETS (LIABILITIES) - 0.0% | | (856) |
NET ASSETS - 100% | $ 8,614,655,305 |
Legend |
(a) Non-income producing |
(b) The rate quoted is the annualized seven-day yield of the fund at period end. |
(c) Affiliated company |
Affiliated Underlying Funds |
Information regarding the Fund's fiscal year to date purchases and sales of the affiliated Underlying Funds and income earned by the Fund from investments in affiliated Underlying Funds is as follows: |
Affiliate | Value,
beginning of
period | Purchases | Sales
Proceeds | Dividend
Income | Value,
end of
period |
Fidelity Blue Chip Growth Fund | $ 361,156,496 | $ 36,339,630 | $ 23,999,735 | $ 972,833 | $ 406,947,550 |
Fidelity Disciplined Equity Fund | 79,885,277 | 324,471 | 84,012,318 | - | - |
Fidelity Growth Company Fund | 498,402,031 | 16,494,944 | 79,149,060 | - | 515,449,326 |
Fidelity Institutional Money Market Portfolio Institutional Class | 32,776,776 | 15,656,173 | 1,802,732 | 22,785 | 46,630,217 |
Fidelity Series 100 Index Fund | 124,241,484 | 4,146,947 | 16,468,789 | - | 120,837,876 |
Fidelity Series All-Sector Equity Fund | 534,286,119 | 11,909,052 | 62,661,986 | - | 536,266,378 |
Fidelity Series Commodity Strategy Fund | 591,093,320 | 91,332,467 | 29,598,489 | - | 605,842,604 |
Fidelity Series Emerging Markets Debt Fund | 63,844,839 | 5,476,031 | 2,857,585 | 1,639,191 | 61,959,342 |
Fidelity Series Emerging Markets Fund | 316,171,663 | 31,974,168 | 15,615,238 | - | 333,491,430 |
Fidelity Series Equity-Income Fund | 332,472,297 | 25,372,911 | 18,455,847 | 3,426,813 | 359,356,519 |
Fidelity Series Floating Rate High Income Fund | 80,151,717 | 5,710,212 | 3,698,847 | 1,756,028 | 81,777,952 |
Fidelity Series Growth & Income Fund (formerly Fidelity Series Mega Cap Fund) | 121,469,306 | 16,626,629 | 7,042,623 | - | 142,594,695 |
Fidelity Series High Income Fund | 569,830,215 | 57,506,418 | 26,953,194 | 15,062,126 | 587,792,046 |
Fidelity Series Inflation-Protected Bond Index Fund | 441,919,712 | 82,125,195 | 19,631,694 | - | 482,300,669 |
Fidelity Series International Growth Fund | 522,512,545 | 23,270,457 | 27,157,391 | - | 556,291,544 |
Fidelity Series International Small Cap Fund | 106,278,239 | 4,533,902 | 5,598,941 | - | 117,263,420 |
Fidelity Series International Value Fund | 517,854,612 | 22,659,865 | 27,398,227 | - | 561,750,359 |
Fidelity Series Intrinsic Opportunities Fund | 202,438,452 | 50,759,549 | 12,820,253 | 1,607,086 | 273,320,121 |
Fidelity Series Investment Grade Bond Fund | 1,412,229,289 | 195,977,737 | 64,928,407 | 15,119,795 | 1,499,859,696 |
Fidelity Series Large Cap Value Fund | 321,132,608 | 5,195,364 | 74,691,205 | - | 277,672,651 |
Fidelity Series Opportunistic Insights Fund | 242,695,836 | 11,175,405 | 15,667,422 | - | 278,939,604 |
Fidelity Series Real Estate Equity Fund | 50,770,463 | 11,582,987 | 2,423,551 | 366,078 | 55,214,314 |
Fidelity Series Real Estate Income Fund | 45,908,504 | 4,210,304 | 2,108,727 | 1,337,946 | 45,287,935 |
Fidelity Series Small Cap Opportunities Fund | 138,822,327 | 15,948,357 | 12,797,680 | - | 147,899,073 |
Fidelity Series Stock Selector Large Cap Value Fund | 335,196,146 | 11,588,740 | 52,943,046 | - | 322,593,806 |
Fidelity Short-Term Bond Fund | 26,919,395 | 12,916,572 | 1,503,405 | 126,581 | 38,263,612 |
Fidelity Small Cap Growth Fund | 76,800,863 | 10,089,724 | 9,527,033 | - | 80,330,538 |
Fidelity Small Cap Value Fund | 82,624,629 | 7,371,616 | 12,215,544 | 123,548 | 78,722,884 |
Total | $ 8,229,885,160 | $ 788,275,827 | $ 713,728,969 | $ 41,560,810 | $ 8,614,656,161 |
Other Information |
All investments are categorized as Level 1 under the Fair Value Hierarchy. The inputs or methodology used for valuing securities may not be an indication of the risk associated with investing in those securities. For more information on valuation inputs, please refer to the Investment Valuation section in the accompanying Notes to Financial Statements. |
See accompanying notes which are an integral part of the financial statements.
Semiannual Report
Fidelity Freedom 2025 Fund
Statement of Assets and Liabilities
| September 30, 2013 (Unaudited) |
| | |
Assets | | |
Investment in securities, at value (cost $7,767,250,952) - See accompanying schedule | | $ 8,614,656,161 |
Receivable for investments sold | | 1,887,154 |
Receivable for fund shares sold | | 11,004,248 |
Total assets | | 8,627,547,563 |
| | |
Liabilities | | |
Payable for fund shares redeemed | | 12,892,258 |
| | |
Net Assets | | $ 8,614,655,305 |
Net Assets consist of: | | |
Paid in capital | | $ 7,643,903,268 |
Undistributed net investment income | | 40,963,511 |
Accumulated undistributed net realized gain (loss) on investments | | 82,383,317 |
Net unrealized appreciation (depreciation) on investments | | 847,405,209 |
Net Assets, for 661,228,012 shares outstanding | | $ 8,614,655,305 |
Net Asset Value, offering price and redemption price per share ($8,614,655,305 ÷ 661,228,012 shares) | | $ 13.03 |
Statement of Operations
Six months ended September 30, 2013 (Unaudited) |
| | |
Investment Income | | |
Income distributions from underlying funds | | $ 41,560,810 |
| | |
Expenses | | |
Independent trustees' compensation | $ 15,550 | |
Total expenses before reductions | 15,550 | |
Expense reductions | (15,550) | - |
Net investment income (loss) | | 41,560,810 |
Realized and Unrealized Gain (Loss) Realized gain (loss) on sale of underlying fund shares | 45,639,468 | |
Capital gain distributions from underlying funds | 50,791,429 | |
Total net realized gain (loss) | | 96,430,897 |
Change in net unrealized appreciation (depreciation) on underlying funds | | 264,584,676 |
Net gain (loss) | | 361,015,573 |
Net increase (decrease) in net assets resulting from operations | | $ 402,576,383 |
See accompanying notes which are an integral part of the financial statements.
Semiannual Report
Fidelity Freedom 2025 Fund
Financial Statements - continued
Statement of Changes in Net Assets
| Six months ended
September 30, 2013
(Unaudited) | Year ended
March 31,
2013 |
Increase (Decrease) in Net Assets | | |
Operations | | |
Net investment income (loss) | $ 41,560,810 | $ 140,023,295 |
Net realized gain (loss) | 96,430,897 | 300,476,835 |
Change in net unrealized appreciation (depreciation) | 264,584,676 | 245,402,402 |
Net increase (decrease) in net assets resulting from operations | 402,576,383 | 685,902,532 |
Distributions to shareholders from net investment income | (17,002,455) | (143,208,455) |
Distributions to shareholders from net realized gain | (90,894,705) | (41,403,773) |
Total distributions | (107,897,160) | (184,612,228) |
Share transactions
Proceeds from sales of shares | 1,155,660,491 | 2,165,051,657 |
Reinvestment of distributions | 107,656,989 | 184,222,369 |
Cost of shares redeemed | (1,173,226,124) | (3,219,615,558) |
Net increase (decrease) in net assets resulting from share transactions | 90,091,356 | (870,341,532) |
Total increase (decrease) in net assets | 384,770,579 | (369,051,228) |
| | |
Net Assets | | |
Beginning of period | 8,229,884,726 | 8,598,935,954 |
End of period (including undistributed net investment income of $40,963,511 and undistributed net investment income of $16,405,156, respectively) | $ 8,614,655,305 | $ 8,229,884,726 |
Other Information Shares | | |
Sold | 90,946,007 | 181,648,013 |
Issued in reinvestment of distributions | 8,490,303 | 15,600,566 |
Redeemed | (92,463,020) | (271,318,538) |
Net increase (decrease) | 6,973,290 | (74,069,959) |
Financial Highlights
| Six months ended
September 30, 2013 | Years ended March 31, |
| (Unaudited) | 2013 | 2012 | 2011 | 2010 | 2009 |
Selected Per-Share Data | | | | | | |
Net asset value, beginning of period | $ 12.58 | $ 11.81 | $ 12.02 | $ 10.77 | $ 7.68 | $ 12.15 |
Income from Investment Operations | | | | | | |
Net investment income (loss) D | .06 | .21 | .20 | .18 | .22 | .26 |
Net realized and unrealized gain (loss) | .56 | .84 | - | 1.37 | 3.18 | (4.10) |
Total from investment operations | .62 | 1.05 | .20 | 1.55 | 3.40 | (3.84) |
Distributions from net investment income | (.03) | (.22) | (.22) | (.19) | (.21) | (.26) |
Distributions from net realized gain | (.14) | (.06) | (.19) | (.11) | (.10) | (.37) |
Total distributions | (.17) | (.28) | (.41) | (.30) | (.31) H | (.63) |
Net asset value, end of period | $ 13.03 | $ 12.58 | $ 11.81 | $ 12.02 | $ 10.77 | $ 7.68 |
Total Return B, C | 4.92% | 9.03% | 1.93% | 14.57% | 44.43% | (32.84)% |
Ratios to Average Net Assets E, G | | | | | | |
Expenses before reductions F | .00% A | .00% | .00% | .00% | .00% | .00% |
Expenses net of fee waivers, if any | .00% A | .00% | .00% | .00% | .00% | .00% |
Expenses net of all reductions | .00% A | .00% | .00% | .00% | .00% | .00% |
Net investment income (loss) | .99% A | 1.73% | 1.75% | 1.67% | 2.21% | 2.64% |
Supplemental Data | | | | | | |
Net assets, end of period (000 omitted) | $ 8,614,655 | $ 8,229,885 | $ 8,598,936 | $ 10,159,991 | $ 9,301,452 | $ 5,798,688 |
Portfolio turnover rate E | 17% A | 31% | 28% | 49% | 26% | 29% |
A Annualized
B Total returns for periods of less than one year are not annualized.
C Total returns would have been lower if certain expenses had not been reduced during the applicable periods shown.
D Calculated based on average shares outstanding during the period.
E Amounts do not include the activity of the Underlying Funds.
F Amount represents less than .01%.
G Expense ratios reflect operating expenses of the Fund. Expenses before reductions do not reflect amounts reimbursed by the investment adviser or reductions from expense offset arrangements and do not represent the amount paid by the Fund during periods when reimbursements or reductions occur. Expenses net of fee waivers reflect expenses after reimbursement by the investment adviser but prior to reductions from expense offset arrangements. Expenses net of all reductions represent the net expenses paid by the Fund but do not include expenses of the investment companies in which the Fund invests.
H Total distributions of $.31 per share is comprised of distributions from net investment income of $.210 and distributions from net realized gain of $.095 per share.
See accompanying notes which are an integral part of the financial statements.
Semiannual Report
Fidelity Freedom 2030 Fund
Investment Changes (Unaudited)
The information in the following tables is based on the direct investments of the Fund. |
Fund Holdings as of September 30, 2013 |
| % of fund's
net assets | % of fund's net assets
6 months ago |
Commodity Funds | | |
Fidelity Series Commodity Strategy Fund | 7.4 | 7.5 |
Domestic Equity Funds | | |
Fidelity Blue Chip Growth Fund | 5.0 | 4.6 |
Fidelity Disciplined Equity Fund | 0.0 | 1.0 |
Fidelity Growth Company Fund | 6.3 | 6.3 |
Fidelity Series 100 Index Fund | 1.5 | 1.6 |
Fidelity Series All-Sector Equity Fund | 6.6 | 6.8 |
Fidelity Series Equity-Income Fund | 4.4 | 4.3 |
Fidelity Series Growth & Income Fund (formerly Fidelity Series Mega Cap Fund) | 1.7 | 1.6 |
Fidelity Series Intrinsic Opportunities Fund | 3.3 | 2.6 |
Fidelity Series Large Cap Value Fund | 3.4 | 4.1 |
Fidelity Series Opportunistic Insights Fund | 3.5 | 3.1 |
Fidelity Series Real Estate Equity Fund | 0.7 | 0.6 |
Fidelity Series Small Cap Opportunities Fund | 1.8 | 1.8 |
Fidelity Series Stock Selector Large Cap Value Fund | 4.0 | 4.3 |
Fidelity Small Cap Growth Fund | 1.0 | 1.0 |
Fidelity Small Cap Value Fund | 1.0 | 1.0 |
| 44.2 | 44.7 |
Developed International Equity Funds | | |
Fidelity Series International Growth Fund | 6.8 | 6.7 |
Fidelity Series International Small Cap Fund | 1.4 | 1.4 |
Fidelity Series International Value Fund | 6.9 | 6.6 |
| 15.1 | 14.7 |
Emerging Markets Equity Funds | | |
Fidelity Series Emerging Markets Fund | 4.2 | 4.0 |
High Yield Bond Funds | | |
Fidelity Series Emerging Markets Debt Fund | 0.7 | 0.8 |
Fidelity Series Floating Rate High Income Fund | 0.9 | 0.9 |
Fidelity Series High Income Fund | 6.9 | 7.0 |
Fidelity Series Real Estate Income Fund | 0.5 | 0.5 |
| 9.0 | 9.2 |
Inflation-Protected Bond Funds | | |
Fidelity Series Inflation-Protected Bond Index Fund | 2.8 | 2.5 |
Investment Grade Bond Funds | | |
Fidelity Series Investment Grade Bond Fund | 17.3 | 17.4 |
Net Other Assets (Liabilities)* | 0.0 | 0.0 |
| 100.0 | 100.0 |
* Amount represents less than 0.1% |
Asset Allocation (% of fund's net assets) |
Period end |
| Commodity Funds | 7.4% | |
| Domestic Equity Funds | 44.2% | |
| Developed International Equity Funds | 15.1% | |
| Emerging Markets Equity Funds | 4.2% | |
| High Yield Bond Funds | 9.0% | |
 | Inflation-Protected Bond Funds | 2.8% | |
| Investment Grade Bond Funds | 17.3% | |

Six months ago |
| Commodity Funds | 7.5% | |
| Domestic Equity Funds | 44.7% | |
| Developed International Equity Funds | 14.7% | |
| Emerging Markets Equity Funds | 4.0% | |
| High Yield Bond Funds | 9.2% | |
| Inflation-Protected Bond Funds | 2.5% | |
| Investment Grade Bond Funds | 17.4% | |

Semiannual Report
Fidelity Freedom 2030 Fund
Investments September 30, 2013 (Unaudited)
Showing Percentage of Net Assets
Domestic Equity Funds - 51.6% |
| Shares | | Value |
Commodity Funds - 7.4% |
Fidelity Series Commodity Strategy Fund (a)(b) | 102,046,984 | | $ 817,396,343 |
Domestic Equity Funds - 44.2% |
Fidelity Blue Chip Growth Fund (b) | 9,329,882 | | 544,958,405 |
Fidelity Growth Company Fund (b) | 5,872,029 | | 697,420,849 |
Fidelity Series 100 Index Fund (b) | 14,701,928 | | 162,897,361 |
Fidelity Series All-Sector Equity Fund (b) | 51,508,757 | | 729,363,993 |
Fidelity Series Equity-Income Fund (b) | 41,218,644 | | 485,555,624 |
Fidelity Series Growth & Income Fund (b) | 15,915,622 | | 191,942,400 |
Fidelity Series Intrinsic Opportunities Fund (b) | 28,340,808 | | 367,863,685 |
Fidelity Series Large Cap Value Fund (b) | 29,920,596 | | 377,897,124 |
Fidelity Series Opportunistic Insights Fund (b) | 29,459,014 | | 379,137,516 |
Fidelity Series Real Estate Equity Fund (b) | 6,236,716 | | 74,591,126 |
Fidelity Series Small Cap Opportunities Fund (b) | 15,438,989 | | 198,082,224 |
Fidelity Series Stock Selector Large Cap Value Fund (b) | 35,907,577 | | 437,354,283 |
Fidelity Small Cap Growth Fund (b) | 5,797,667 | | 108,416,372 |
Fidelity Small Cap Value Fund (b) | 5,596,008 | | 106,212,226 |
TOTAL DOMESTIC EQUITY FUNDS | | 4,861,693,188 |
TOTAL DOMESTIC EQUITY FUNDS (Cost $4,881,537,474) |
5,679,089,531
|
International Equity Funds - 19.3% |
| | | |
Developed International Equity Funds - 15.1% |
Fidelity Series International Growth Fund (b) | 55,235,148 | | 749,540,961 |
Fidelity Series International Small Cap Fund (b) | 10,258,124 | | 156,846,722 |
Fidelity Series International Value Fund (b) | 70,077,252 | | 753,330,454 |
TOTAL DEVELOPED INTERNATIONAL EQUITY FUNDS | | 1,659,718,137 |
|
| Shares | | Value |
Emerging Markets Equity Funds - 4.2% |
Fidelity Series Emerging Markets Fund (b) | 27,555,533 | | $ 461,279,625 |
TOTAL INTERNATIONAL EQUITY FUNDS (Cost $1,859,847,997) |
2,120,997,762
|
Bond Funds - 29.1% |
| | | |
High Yield Bond Funds - 9.0% |
Fidelity Series Emerging Markets Debt Fund (b) | 7,838,550 | | 79,326,127 |
Fidelity Series Floating Rate High Income Fund (b) | 9,149,453 | | 96,801,211 |
Fidelity Series High Income Fund (b) | 74,199,595 | | 762,771,841 |
Fidelity Series Real Estate Income Fund (b) | 4,795,191 | | 52,651,194 |
TOTAL HIGH YIELD BOND FUNDS | | 991,550,373 |
Inflation-Protected Bond Funds - 2.8% |
Fidelity Series Inflation-Protected Bond Index Fund (b) | 28,431,765 | | 308,484,652 |
Investment Grade Bond Funds - 17.3% |
Fidelity Series Investment Grade Bond Fund (b) | 169,763,907 | | 1,899,658,121 |
TOTAL BOND FUNDS (Cost $3,252,120,454) |
3,199,693,146
|
TOTAL INVESTMENT
PORTFOLIO - 100.0% (Cost $9,993,505,925) | 10,999,780,439 |
NET OTHER ASSETS (LIABILITIES) - 0.0% | | (360) |
NET ASSETS - 100% | $ 10,999,780,079 |
Legend |
(a) Non-income producing |
(b) Affiliated company |
Affiliated Underlying Funds |
Information regarding the Fund's fiscal year to date purchases and sales of the affiliated Underlying Funds and income earned by the Fund from investments in affiliated Underlying Funds is as follows: |
Affiliate | Value,
beginning of
period | Purchases | Sales
Proceeds | Dividend
Income | Value,
end of
period |
Fidelity Blue Chip Growth Fund | $ 487,624,225 | $ 42,132,420 | $ 29,931,174 | $ 1,304,737 | $ 544,958,405 |
Fidelity Disciplined Equity Fund | 107,095,744 | 153,201 | 112,431,415 | - | - |
Fidelity Growth Company Fund | 674,931,574 | 14,266,856 | 99,902,391 | - | 697,420,849 |
Fidelity Series 100 Index Fund | 166,481,556 | 3,543,663 | 19,061,266 | - | 162,897,361 |
Fidelity Series All-Sector Equity Fund | 720,496,458 | 9,563,808 | 71,820,238 | - | 729,363,993 |
Fidelity Series Commodity Strategy Fund | 802,421,860 | 120,544,412 | 42,314,412 | - | 817,396,343 |
Fidelity Series Emerging Markets Debt Fund | 83,008,083 | 5,766,431 | 3,612,572 | 2,121,576 | 79,326,127 |
Fidelity Series Emerging Markets Fund | 428,616,306 | 52,374,865 | 21,645,365 | - | 461,279,625 |
Fidelity Series Equity-Income Fund | 456,590,441 | 25,416,268 | 23,850,264 | 4,697,390 | 485,555,624 |
Fidelity Series Floating Rate High Income Fund | 96,138,999 | 5,500,157 | 4,381,596 | 2,097,895 | 96,801,211 |
Fidelity Series Growth & Income Fund (formerly Fidelity Series Mega Cap Fund) | 166,777,913 | 18,563,441 | 9,223,724 | - | 191,942,400 |
Fidelity Series High Income Fund | 743,549,405 | 71,519,111 | 35,862,176 | 19,620,608 | 762,771,841 |
Fidelity Series Inflation-Protected Bond Index Fund | 269,213,630 | 66,528,475 | 13,263,145 | - | 308,484,652 |
Fidelity Series International Growth Fund | 709,484,571 | 25,602,252 | 36,550,580 | - | 749,540,961 |
Fidelity Series International Small Cap Fund | 143,975,076 | 4,227,178 | 7,563,356 | - | 156,846,722 |
Fidelity Series International Value Fund | 703,646,006 | 21,145,105 | 37,140,477 | - | 753,330,454 |
Fidelity Series Intrinsic Opportunities Fund | 274,048,747 | 65,960,589 | 16,477,362 | 2,171,540 | 367,863,685 |
Fidelity Series Investment Grade Bond Fund | 1,847,181,730 | 206,681,791 | 97,916,545 | 19,459,474 | 1,899,658,121 |
Fidelity Series Large Cap Value Fund | 435,825,680 | 3,675,858 | 96,836,174 | - | 377,897,124 |
Fidelity Series Opportunistic Insights Fund | 333,229,823 | 10,344,332 | 20,091,963 | - | 379,137,516 |
Fidelity Series Real Estate Equity Fund | 68,265,551 | 15,939,020 | 3,320,784 | 490,640 | 74,591,126 |
Fidelity Series Real Estate Income Fund | 54,011,577 | 4,288,123 | 2,466,466 | 1,565,819 | 52,651,194 |
Fidelity Series Small Cap Opportunities Fund | 187,307,306 | 18,833,310 | 16,048,159 | - | 198,082,224 |
Fidelity Series Stock Selector Large Cap Value Fund | 460,345,409 | 9,860,944 | 72,191,210 | - | 437,354,283 |
Fidelity Small Cap Growth Fund | 104,061,555 | 12,818,340 | 12,457,954 | - | 108,416,372 |
Fidelity Small Cap Value Fund | 112,068,277 | 8,791,348 | 15,903,406 | 167,175 | 106,212,226 |
Total | $ 10,636,397,502 | $ 844,041,298 | $ 922,264,174 | $ 53,696,854 | $ 10,999,780,439 |
Other Information |
All investments are categorized as Level 1 under the Fair Value Hierarchy. The inputs or methodology used for valuing securities may not be an indication of the risk associated with investing in those securities. For more information on valuation inputs, please refer to the Investment Valuation section in the accompanying Notes to Financial Statements. |
See accompanying notes which are an integral part of the financial statements.
Semiannual Report
Fidelity Freedom 2030 Fund
Statement of Assets and Liabilities
| September 30, 2013 (Unaudited) |
| | |
Assets | | |
Investment in securities, at value (cost $9,993,505,925) - See accompanying schedule | | $ 10,999,780,439 |
Receivable for investments sold | | 229,538 |
Receivable for fund shares sold | | 12,987,808 |
Other receivables | | 70,572 |
Total assets | | 11,013,068,357 |
| | |
Liabilities | | |
Payable for investments purchased | $ 942,806 | |
Payable for fund shares redeemed | 12,274,899 | |
Other payables and accrued expenses | 70,573 | |
Total liabilities | | 13,288,278 |
| | |
Net Assets | | $ 10,999,780,079 |
Net Assets consist of: | | |
Paid in capital | | $ 9,879,953,792 |
Undistributed net investment income | | 52,888,919 |
Accumulated undistributed net realized gain (loss) on investments | | 60,662,854 |
Net unrealized appreciation (depreciation) on investments | | 1,006,274,514 |
Net Assets, for 696,741,905 shares outstanding | | $ 10,999,780,079 |
Net Asset Value, offering price and redemption price per share ($10,999,780,079 ÷ 696,741,905 shares) | | $ 15.79 |
Statement of Operations
Six months ended September 30, 2013 (Unaudited) |
| | |
Investment Income | | |
Income distributions from underlying funds | | $ 53,696,854 |
| | |
Expenses | | |
Independent trustees' compensation | $ 20,031 | |
Total expenses before reductions | 20,031 | |
Expense reductions | (20,031) | - |
Net investment income (loss) | | 53,696,854 |
Realized and Unrealized Gain (Loss) Realized gain (loss) on sale of underlying fund shares | 131,277,489 | |
Capital gain distributions from underlying funds | 68,247,935 | |
Total net realized gain (loss) | | 199,525,424 |
Change in net unrealized appreciation (depreciation) on underlying funds | | 310,328,324 |
Net gain (loss) | | 509,853,748 |
Net increase (decrease) in net assets resulting from operations | | $ 563,550,602 |
See accompanying notes which are an integral part of the financial statements.
Semiannual Report
Fidelity Freedom 2030 Fund
Financial Statements - continued
Statement of Changes in Net Assets
| Six months ended
September 30, 2013
(Unaudited) | Year ended
March 31,
2013 |
Increase (Decrease) in Net Assets | | |
Operations | | |
Net investment income (loss) | $ 53,696,854 | $ 191,240,952 |
Net realized gain (loss) | 199,525,424 | 692,932,845 |
Change in net unrealized appreciation (depreciation) | 310,328,324 | 41,418,078 |
Net increase (decrease) in net assets resulting from operations | 563,550,602 | 925,591,875 |
Distributions to shareholders from net investment income | (21,882,952) | (197,568,570) |
Distributions to shareholders from net realized gain | (3,529,593) | (49,492,170) |
Total distributions | (25,412,545) | (247,060,740) |
Share transactions
Proceeds from sales of shares | 1,237,450,499 | 2,435,501,325 |
Reinvestment of distributions | 25,351,938 | 246,356,389 |
Cost of shares redeemed | (1,437,557,723) | (4,378,903,589) |
Net increase (decrease) in net assets resulting from share transactions | (174,755,286) | (1,697,045,875) |
Total increase (decrease) in net assets | 363,382,771 | (1,018,514,740) |
| | |
Net Assets | | |
Beginning of period | 10,636,397,308 | 11,654,912,048 |
End of period (including undistributed net investment income of $52,888,919 and undistributed net investment income of $21,075,017, respectively) | $ 10,999,780,079 | $ 10,636,397,308 |
Other Information Shares | | |
Sold | 80,702,270 | 171,683,612 |
Issued in reinvestment of distributions | 1,655,909 | 17,520,585 |
Redeemed | (93,849,900) | (309,491,711) |
Net increase (decrease) | (11,491,721) | (120,287,514) |
Financial Highlights
| Six months ended
September 30, 2013 | Years ended March 31, |
| (Unaudited) | 2013 | 2012 | 2011 | 2010 | 2009 |
Selected Per-Share Data | | | | | | |
Net asset value, beginning of period | $ 15.02 | $ 14.07 | $ 14.40 | $ 12.87 | $ 8.97 | $ 15.02 |
Income from Investment Operations | | | | | | |
Net investment income (loss) D | .08 | .25 | .24 | .21 | .23 | .27 |
Net realized and unrealized gain (loss) | .73 | 1.04 | (.07) | 1.67 | 4.02 | (5.46) |
Total from investment operations | .81 | 1.29 | .17 | 1.88 | 4.25 | (5.19) |
Distributions from net investment income | (.03) | (.27) | (.26) | (.22) | (.24) | (.27) |
Distributions from net realized gain | (.01) | (.07) | (.24) | (.13) | (.11) | (.59) |
Total distributions | (.04) | (.34) | (.50) | (.35) | (.35) H | (.86) |
Net asset value, end of period | $ 15.79 | $ 15.02 | $ 14.07 | $ 14.40 | $ 12.87 | $ 8.97 |
Total Return B, C | 5.37% | 9.30% | 1.48% | 14.81% | 47.57% | (36.25)% |
Ratios to Average Net Assets E, G | | | | | | |
Expenses before reductions F | .00% A | .00% | .00% | .00% | .00% | .00% |
Expenses net of fee waivers, if any | .00% A | .00% | .00% | .00% | .00% | .00% |
Expenses net of all reductions | .00% A | .00% | .00% | .00% | .00% | .00% |
Net investment income (loss) | 1.00% A | 1.77% | 1.75% | 1.62% | 2.01% | 2.29% |
Supplemental Data | | | | | | |
Net assets, end of period (000 omitted) | $ 10,999,780 | $ 10,636,397 | $ 11,654,912 | $ 14,745,053 | $ 14,595,428 | $ 9,685,340 |
Portfolio turnover rate E | 16% A | 29% | 26% | 44% | 29% | 23% |
A Annualized
B Total returns for periods of less than one year are not annualized.
C Total returns would have been lower if certain expenses had not been reduced during the applicable periods shown.
D Calculated based on average shares outstanding during the period.
E Amounts do not include the activity of the Underlying Funds.
F Amount represents less than .01%.
G Expense ratios reflect operating expenses of the Fund. Expenses before reductions do not reflect amounts reimbursed by the investment adviser or reductions from expense offset arrangements and do not represent the amount paid by the Fund during periods when reimbursements or reductions occur. Expenses net of fee waivers reflect expenses after reimbursement by the investment adviser but prior to reductions from expense offset arrangements. Expenses net of all reductions represent the net expenses paid by the Fund but do not include expenses of the investment companies in which the Fund invests.
H Total distributions of $.35 per share is comprised of distributions from net investment income of $.240 and distributions from net realized gain of $.105 per share.
See accompanying notes which are an integral part of the financial statements.
Semiannual Report
Fidelity Freedom 2035 Fund
Investment Changes (Unaudited)
The information in the following tables is based on the direct investments of the Fund. |
Fund Holdings as of September 30, 2013 |
| % of fund's
net assets | % of fund's net assets
6 months ago |
Commodity Funds | | |
Fidelity Series Commodity Strategy Fund | 8.5 | 8.7 |
Domestic Equity Funds | | |
Fidelity Blue Chip Growth Fund | 5.7 | 5.3 |
Fidelity Disciplined Equity Fund | 0.0 | 1.2 |
Fidelity Growth Company Fund | 7.2 | 7.3 |
Fidelity Series 100 Index Fund | 1.7 | 1.8 |
Fidelity Series All-Sector Equity Fund | 7.6 | 7.8 |
Fidelity Series Equity-Income Fund | 5.0 | 4.9 |
Fidelity Series Growth & Income Fund (formerly Fidelity Series Mega Cap Fund) | 2.1 | 1.8 |
Fidelity Series Intrinsic Opportunities Fund | 3.8 | 2.9 |
Fidelity Series Large Cap Value Fund | 3.9 | 4.8 |
Fidelity Series Opportunistic Insights Fund | 3.9 | 3.6 |
Fidelity Series Real Estate Equity Fund | 0.8 | 0.7 |
Fidelity Series Small Cap Opportunities Fund | 2.1 | 2.0 |
Fidelity Series Stock Selector Large Cap Value Fund | 4.5 | 4.9 |
Fidelity Small Cap Growth Fund | 1.1 | 1.1 |
Fidelity Small Cap Value Fund | 1.1 | 1.2 |
| 50.5 | 51.3 |
Developed International Equity Funds | | |
Fidelity Series International Growth Fund | 7.8 | 7.7 |
Fidelity Series International Small Cap Fund | 1.6 | 1.5 |
Fidelity Series International Value Fund | 7.8 | 7.6 |
| 17.2 | 16.8 |
Emerging Markets Equity Funds | | |
Fidelity Series Emerging Markets Fund | 4.9 | 4.7 |
High Yield Bond Funds | | |
Fidelity Series Emerging Markets Debt Fund | 0.7 | 0.8 |
Fidelity Series Floating Rate High Income Fund | 0.8 | 0.8 |
Fidelity Series High Income Fund | 6.8 | 6.9 |
Fidelity Series Real Estate Income Fund | 0.5 | 0.4 |
| 8.8 | 8.9 |
Inflation-Protected Bond Funds | | |
Fidelity Series Inflation-Protected Bond Index Fund | 0.0* | 0.0 |
Investment Grade Bond Funds | | |
Fidelity Series Investment Grade Bond Fund | 10.1 | 9.6 |
Net Other Assets (Liabilities)* | 0.0 | 0.0 |
| 100.0 | 100.0 |
* Amount represents less than 0.1% |
Asset Allocation (% of fund's net assets) |
Period end |
| Commodity Funds | 8.5% | |
| Domestic Equity Funds | 50.5% | |
| Developed International Equity Funds | 17.2% | |
| Emerging Markets Equity Funds | 4.9% | |
| High Yield Bond Funds | 8.8% | |
| Inflation-Protected Bond Funds | 0.0%* | |
| Investment Grade Bond Funds | 10.1% | |

Six months ago |
| Commodity Funds | 8.7% | |
| Domestic Equity Funds | 51.3% | |
| Developed International Equity Funds | 16.8% | |
| Emerging Markets Equity Funds | 4.7% | |
| High Yield Bond Funds | 8.9% | |
 | Inflation-Protected Bond Funds | 0.0% | |
| Investment Grade Bond Funds | 9.6% | |

Semiannual Report
Fidelity Freedom 2035 Fund
Investments September 30, 2013 (Unaudited)
Showing Percentage of Net Assets
Domestic Equity Funds - 59.0% |
| Shares | | Value |
Commodity Funds - 8.5% |
Fidelity Series Commodity Strategy Fund (a)(b) | 63,754,463 | | $ 510,673,245 |
Domestic Equity Funds - 50.5% |
Fidelity Blue Chip Growth Fund (b) | 5,812,307 | | 339,496,852 |
Fidelity Growth Company Fund (b) | 3,652,271 | | 433,780,226 |
Fidelity Series 100 Index Fund (b) | 9,120,548 | | 101,055,675 |
Fidelity Series All-Sector Equity Fund (b) | 31,959,586 | | 452,547,733 |
Fidelity Series Equity-Income Fund (b) | 25,667,438 | | 302,362,415 |
Fidelity Series Growth & Income Fund (b) | 10,239,743 | | 123,491,297 |
Fidelity Series Intrinsic Opportunities Fund (b) | 17,667,387 | | 229,322,685 |
Fidelity Series Large Cap Value Fund (b) | 18,623,716 | | 235,217,531 |
Fidelity Series Opportunistic Insights Fund (b) | 18,242,797 | | 234,784,801 |
Fidelity Series Real Estate Equity Fund (b) | 3,885,176 | | 46,466,700 |
Fidelity Series Small Cap Opportunities Fund (b) | 9,614,296 | | 123,351,416 |
Fidelity Series Stock Selector Large Cap Value Fund (b) | 22,288,121 | | 271,469,308 |
Fidelity Small Cap Growth Fund (b) | 3,578,076 | | 66,910,026 |
Fidelity Small Cap Value Fund (b) | 3,498,333 | | 66,398,359 |
TOTAL DOMESTIC EQUITY FUNDS | | 3,026,655,024 |
TOTAL DOMESTIC EQUITY FUNDS (Cost $3,033,492,830) |
3,537,328,269
|
International Equity Funds - 22.1% |
| | | |
Developed International Equity Funds - 17.2% |
Fidelity Series International Growth Fund (b) | 34,450,454 | | 467,492,659 |
Fidelity Series International Small Cap Fund (b) | 6,352,738 | | 97,133,370 |
Fidelity Series International Value Fund (b) | 43,495,989 | | 467,581,885 |
TOTAL DEVELOPED INTERNATIONAL EQUITY FUNDS | | 1,032,207,914 |
|
| Shares | | Value |
Emerging Markets Equity Funds - 4.9% |
Fidelity Series Emerging Markets Fund (b) | 17,362,363 | | $ 290,645,952 |
TOTAL INTERNATIONAL EQUITY FUNDS (Cost $1,140,191,912) |
1,322,853,866
|
Bond Funds - 18.9% |
| | | |
High Yield Bond Funds - 8.8% |
Fidelity Series Emerging Markets Debt Fund (b) | 4,252,377 | | 43,034,057 |
Fidelity Series Floating Rate High Income Fund (b) | 4,535,432 | | 47,984,868 |
Fidelity Series High Income Fund (b) | 39,818,956 | | 409,338,865 |
Fidelity Series Real Estate Income Fund (b) | 2,365,109 | | 25,968,898 |
TOTAL HIGH YIELD BOND FUNDS | | 526,326,688 |
Inflation-Protected Bond Funds - 0.0% |
Fidelity Series Inflation-Protected Bond Index Fund (b) | 106,330 | | 1,153,683 |
Investment Grade Bond Funds - 10.1% |
Fidelity Series Investment Grade Bond Fund (b) | 54,292,504 | | 607,533,115 |
TOTAL BOND FUNDS (Cost $1,136,450,532) |
1,135,013,486
|
TOTAL INVESTMENT PORTFOLIO - 100.0% (Cost $5,310,135,274) | | 5,995,195,621 |
NET OTHER ASSETS (LIABILITIES) - 0.0% | | (59) |
NET ASSETS - 100% | $ 5,995,195,562 |
Legend |
(a) Non-income producing |
(b) Affiliated company |
Affiliated Underlying Funds |
Information regarding the Fund's fiscal year to date purchases and sales of the affiliated Underlying Funds and income earned by the Fund from investments in affiliated Underlying Funds is as follows: |
Affiliate | Value,
beginning of
period | Purchases | Sales
Proceeds | Dividend
Income | Value,
end of
period |
Fidelity Blue Chip Growth Fund | $ 298,998,948 | $ 32,158,185 | $ 19,486,213 | $ 810,549 | $ 339,496,852 |
Fidelity Disciplined Equity Fund | 66,212,676 | 291,345 | 69,664,334 | - | - |
Fidelity Growth Company Fund | 414,650,988 | 16,259,180 | 63,725,238 | - | 433,780,226 |
Fidelity Series 100 Index Fund | 102,799,140 | 3,960,634 | 13,068,201 | - | 101,055,675 |
Fidelity Series All-Sector Equity Fund | 442,293,979 | 12,038,439 | 45,716,598 | - | 452,547,733 |
Fidelity Series Commodity Strategy Fund | 492,118,400 | 84,902,605 | 27,053,417 | - | 510,673,245 |
Fidelity Series Emerging Markets Debt Fund | 43,409,832 | 5,007,442 | 2,228,518 | 1,133,505 | 43,034,057 |
Fidelity Series Emerging Markets Fund | 262,195,289 | 42,192,109 | 14,900,295 | - | 290,645,952 |
Fidelity Series Equity-Income Fund | 274,206,122 | 27,178,095 | 15,618,569 | 2,861,624 | 302,362,415 |
Fidelity Series Floating Rate High Income Fund | 46,146,895 | 4,477,424 | 2,406,633 | 1,025,355 | 47,984,868 |
Fidelity Series Growth & Income Fund (formerly Fidelity Series Mega Cap Fund) | 100,171,919 | 19,736,983 | 6,075,667 | - | 123,491,297 |
Fidelity Series High Income Fund | 389,678,722 | 49,735,929 | 21,207,548 | 10,401,680 | 409,338,865 |
Fidelity Series Inflation-Protected Bond Index Fund | - | 1,167,712 | 18,881 | - | 1,153,683 |
Fidelity Series International Growth Fund | 432,552,372 | 28,331,620 | 24,999,192 | - | 467,492,659 |
Fidelity Series International Small Cap Fund | 87,758,173 | 4,562,049 | 5,152,707 | - | 97,133,370 |
Fidelity Series International Value Fund | 428,597,716 | 23,632,650 | 25,040,262 | - | 467,581,885 |
Fidelity Series Intrinsic Opportunities Fund | 164,216,602 | 49,344,361 | 11,351,018 | 1,346,948 | 229,322,685 |
Fidelity Series Investment Grade Bond Fund | 541,689,061 | 116,665,736 | 33,714,144 | 5,976,696 | 607,533,115 |
Fidelity Series Large Cap Value Fund | 268,013,652 | 5,582,770 | 60,085,714 | - | 235,217,531 |
Fidelity Series Opportunistic Insights Fund | 200,195,104 | 13,312,748 | 12,821,473 | - | 234,784,801 |
Fidelity Series Real Estate Equity Fund | 41,801,081 | 10,957,890 | 2,269,298 | 309,409 | 46,466,700 |
Fidelity Series Real Estate Income Fund | 26,049,104 | 2,832,081 | 1,344,253 | 766,731 | 25,968,898 |
Fidelity Series Small Cap Opportunities Fund | 115,116,706 | 13,859,561 | 10,554,505 | - | 123,351,416 |
Fidelity Series Stock Selector Large Cap Value Fund | 276,611,948 | 11,054,507 | 39,928,406 | - | 271,469,308 |
Fidelity Small Cap Growth Fund | 64,072,307 | 8,662,750 | 8,269,539 | - | 66,910,026 |
Fidelity Small Cap Value Fund | 68,974,089 | 6,457,492 | 9,733,252 | 104,142 | 66,398,359 |
Total | $ 5,648,530,825 | $ 594,362,297 | $ 546,433,875 | $ 24,736,639 | $ 5,995,195,621 |
Other Information |
All investments are categorized as Level 1 under the Fair Value Hierarchy. The inputs or methodology used for valuing securities may not be an indication of the risk associated with investing in those securities. For more information on valuation inputs, please refer to the Investment Valuation section in the accompanying Notes to Financial Statements. |
See accompanying notes which are an integral part of the financial statements.
Semiannual Report
Fidelity Freedom 2035 Fund
Statement of Assets and Liabilities
| September 30, 2013 (Unaudited) |
| | |
Assets | | |
Investment in securities, at value (cost $5,310,135,274) - See accompanying schedule | | $ 5,995,195,621 |
Receivable for investments sold | | 343,883 |
Receivable for fund shares sold | | 7,992,971 |
Total assets | | 6,003,532,475 |
| | |
Liabilities | | |
Payable for fund shares redeemed | | 8,336,913 |
| | |
Net Assets | | $ 5,995,195,562 |
Net Assets consist of: | | |
Paid in capital | | $ 5,224,037,477 |
Undistributed net investment income | | 24,694,626 |
Accumulated undistributed net realized gain (loss) on investments | | 61,403,112 |
Net unrealized appreciation (depreciation) on investments | | 685,060,347 |
Net Assets, for 458,632,983 shares outstanding | | $ 5,995,195,562 |
Net Asset Value, offering price and redemption price per share ($5,995,195,562 ÷ 458,632,983 shares) | | $ 13.07 |
Statement of Operations
Six months ended September 30, 2013 (Unaudited) |
| | |
Investment Income | | |
Income distributions from underlying funds | | $ 24,736,639 |
| | |
Expenses | | |
Independent trustees' compensation | $ 10,728 | |
Total expenses before reductions | 10,728 | |
Expense reductions | (10,728) | - |
Net investment income (loss) | | 24,736,639 |
Realized and Unrealized Gain (Loss) Realized gain (loss) on sale of underlying fund shares | 32,235,723 | |
Capital gain distributions from underlying funds | 42,242,597 | |
Total net realized gain (loss) | | 74,478,320 |
Change in net unrealized appreciation (depreciation) on underlying funds | | 266,500,656 |
Net gain (loss) | | 340,978,976 |
Net increase (decrease) in net assets resulting from operations | | $ 365,715,615 |
See accompanying notes which are an integral part of the financial statements.
Semiannual Report
Fidelity Freedom 2035 Fund
Financial Statements - continued
Statement of Changes in Net Assets
| Six months ended
September 30, 2013
(Unaudited) | Year ended
March 31,
2013 |
Increase (Decrease) in Net Assets | | |
Operations | | |
Net investment income (loss) | $ 24,736,639 | $ 94,134,924 |
Net realized gain (loss) | 74,478,320 | 223,921,042 |
Change in net unrealized appreciation (depreciation) | 266,500,656 | 189,781,598 |
Net increase (decrease) in net assets resulting from operations | 365,715,615 | 507,837,564 |
Distributions to shareholders from net investment income | (8,980,599) | (94,950,080) |
Distributions to shareholders from net realized gain | (129,320,953) | (15,457,683) |
Total distributions | (138,301,552) | (110,407,763) |
Share transactions
Proceeds from sales of shares | 854,258,981 | 1,600,255,935 |
Reinvestment of distributions | 138,120,560 | 110,279,193 |
Cost of shares redeemed | (873,128,794) | (2,316,826,416) |
Net increase (decrease) in net assets resulting from share transactions | 119,250,747 | (606,291,288) |
Total increase (decrease) in net assets | 346,664,810 | (208,861,487) |
| | |
Net Assets | | |
Beginning of period | 5,648,530,752 | 5,857,392,239 |
End of period (including undistributed net investment income of $24,694,626 and undistributed net investment income of $8,938,586, respectively) | $ 5,995,195,562 | $ 5,648,530,752 |
Other Information Shares | | |
Sold | 67,249,078 | 136,178,047 |
Issued in reinvestment of distributions | 10,901,386 | 9,462,687 |
Redeemed | (68,872,046) | (197,756,468) |
Net increase (decrease) | 9,278,418 | (52,115,734) |
Financial Highlights
| Six months ended
September 30, 2013 | Years ended March 31, |
| (Unaudited) | 2013 | 2012 | 2011 | 2010 | 2009 |
Selected Per-Share Data | | | | | | |
Net asset value, beginning of period | $ 12.57 | $ 11.68 | $ 12.04 | $ 10.66 | $ 7.36 | $ 12.41 |
Income from Investment Operations | | | | | | |
Net investment income (loss) D | .05 | .20 | .18 | .16 | .18 | .22 |
Net realized and unrealized gain (loss) | .76 | .93 | (.14) | 1.48 | 3.40 | (4.63) |
Total from investment operations | .81 | 1.13 | .04 | 1.64 | 3.58 | (4.41) |
Distributions from net investment income | (.02) | (.21) | (.19) | (.17) | (.18) | (.20) |
Distributions from net realized gain | (.29) | (.03) | (.21) | (.10) | (.10) | (.44) |
Total distributions | (.31) | (.24) | (.40) | (.26) I | (.28) H | (.64) |
Net asset value, end of period | $ 13.07 | $ 12.57 | $ 11.68 | $ 12.04 | $ 10.66 | $ 7.36 |
Total Return B, C | 6.51% | 9.85% | .63% | 15.63% | 48.79% | (37.11)% |
Ratios to Average Net Assets E, G | | | | | | |
Expenses before reductions F | .00% A | .00% | .00% | .00% | .00% | .00% |
Expenses net of fee waivers, if any | .00% A | .00% | .00% | .00% | .00% | .00% |
Expenses net of all reductions | .00% A | .00% | .00% | .00% | .00% | .00% |
Net investment income (loss) | .85% A | 1.70% | 1.57% | 1.49% | 1.91% | 2.24% |
Supplemental Data | | | | | | |
Net assets, end of period (000 omitted) | $ 5,995,196 | $ 5,648,531 | $ 5,857,392 | $ 6,909,265 | $ 6,082,003 | $ 3,576,031 |
Portfolio turnover rate E | 19% A | 36% | 30% | 47% | 25% | 20% |
A Annualized
B Total returns for periods of less than one year are not annualized.
C Total returns would have been lower if certain expenses had not been reduced during the applicable periods shown.
D Calculated based on average shares outstanding during the period.
E Amounts do not include the activity of the Underlying Funds.
F Amount represents less than .01%.
G Expense ratios reflect operating expenses of the Fund. Expenses before reductions do not reflect amounts reimbursed by the investment adviser or reductions from expense offset arrangements and do not represent the amount paid by the Fund during periods when reimbursements or reductions occur. Expenses net of fee waivers reflect expenses after reimbursement by the investment adviser but prior to reductions from expense offset arrangements. Expenses net of all reductions represent the net expenses paid by the Fund but do not include expenses of the investment companies in which the Fund invests.
H Total distributions of $.28 per share is comprised of distributions from net investment income of $.180 and distributions from net realized gain of $.095 per share.
I Total distributions of $.26 per share is comprised of distributions from net investment income of $.168 and distributions from net realized gain of $.095 per share.
See accompanying notes which are an integral part of the financial statements.
Semiannual Report
Fidelity Freedom 2040 Fund
Investment Changes (Unaudited)
The information in the following tables is based on the direct investments of the Fund. |
Fund Holdings as of September 30, 2013 |
| % of fund's
net assets | % of fund's net assets
6 months ago |
Commodity Funds | | |
Fidelity Series Commodity Strategy Fund | 8.7 | 8.9 |
Domestic Equity Funds | | |
Fidelity Blue Chip Growth Fund | 5.8 | 5.3 |
Fidelity Disciplined Equity Fund | 0.0 | 1.2 |
Fidelity Growth Company Fund | 7.4 | 7.4 |
Fidelity Series 100 Index Fund | 1.7 | 1.8 |
Fidelity Series All-Sector Equity Fund | 7.7 | 7.9 |
Fidelity Series Equity-Income Fund | 5.2 | 5.0 |
Fidelity Series Growth & Income Fund (formerly Fidelity Series Mega Cap Fund) | 2.1 | 1.8 |
Fidelity Series Intrinsic Opportunities Fund | 3.9 | 3.0 |
Fidelity Series Large Cap Value Fund | 4.1 | 4.8 |
Fidelity Series Opportunistic Insights Fund | 4.1 | 3.7 |
Fidelity Series Real Estate Equity Fund | 0.8 | 0.7 |
Fidelity Series Small Cap Opportunities Fund | 2.1 | 2.1 |
Fidelity Series Stock Selector Large Cap Value Fund | 4.7 | 5.0 |
Fidelity Small Cap Growth Fund | 1.1 | 1.2 |
Fidelity Small Cap Value Fund | 1.1 | 1.2 |
| 51.8 | 52.1 |
Developed International Equity Funds | | |
Fidelity Series International Growth Fund | 8.0 | 7.8 |
Fidelity Series International Small Cap Fund | 1.6 | 1.6 |
Fidelity Series International Value Fund | 8.0 | 7.7 |
| 17.6 | 17.1 |
Emerging Markets Equity Funds | | |
Fidelity Series Emerging Markets Fund | 5.0 | 4.7 |
High Yield Bond Funds | | |
Fidelity Series Emerging Markets Debt Fund | 0.7 | 0.8 |
Fidelity Series Floating Rate High Income Fund | 0.8 | 0.8 |
Fidelity Series High Income Fund | 6.8 | 7.0 |
Fidelity Series Real Estate Income Fund | 0.4 | 0.4 |
| 8.7 | 9.0 |
Investment Grade Bond Funds | | |
Fidelity Series Investment Grade Bond Fund | 8.2 | 8.2 |
Net Other Assets (Liabilities)* | 0.0 | 0.0 |
| 100.0 | 100.0 |
* Amount represents less than 0.1% |
Asset Allocation (% of fund's net assets) |
Period end |
| Commodity Funds | 8.7% | |
| Domestic Equity Funds | 51.8% | |
| Developed International Equity Funds | 17.6% | |
| Emerging Markets Equity Funds | 5.0% | |
| High Yield Bond Funds | 8.7% | |
| Investment Grade Bond Funds | 8.2% | |

Six months ago |
| Commodity Funds | 8.9% | |
| Domestic Equity Funds | 52.1% | |
| Developed International Equity Funds | 17.1% | |
| Emerging Markets Equity Funds | 4.7% | |
| High Yield Bond Funds | 9.0% | |
| Investment Grade Bond Funds | 8.2% | |

Semiannual Report
Fidelity Freedom 2040 Fund
Investments September 30, 2013 (Unaudited)
Showing Percentage of Net Assets
Domestic Equity Funds - 60.5% |
| Shares | | Value |
Commodity Funds - 8.7% |
Fidelity Series Commodity Strategy Fund (a)(b) | 77,397,207 | | $ 619,951,630 |
Domestic Equity Funds - 51.8% |
Fidelity Blue Chip Growth Fund (b) | 7,012,430 | | 409,596,055 |
Fidelity Growth Company Fund (b) | 4,438,414 | | 527,150,396 |
Fidelity Series 100 Index Fund (b) | 10,898,829 | | 120,759,030 |
Fidelity Series All-Sector Equity Fund (b) | 38,846,907 | | 550,072,204 |
Fidelity Series Equity-Income Fund (b) | 31,185,944 | | 367,370,426 |
Fidelity Series Growth & Income Fund (b) | 12,577,109 | | 151,679,938 |
Fidelity Series Intrinsic Opportunities Fund (b) | 21,446,025 | | 278,369,407 |
Fidelity Series Large Cap Value Fund (b) | 22,808,114 | | 288,066,483 |
Fidelity Series Opportunistic Insights Fund (b) | 22,322,475 | | 287,290,259 |
Fidelity Series Real Estate Equity Fund (b) | 4,713,126 | | 56,368,988 |
Fidelity Series Small Cap Opportunities Fund (b) | 11,542,674 | | 148,092,505 |
Fidelity Series Stock Selector Large Cap Value Fund (b) | 27,104,206 | | 330,129,225 |
Fidelity Small Cap Growth Fund (b) | 4,339,479 | | 81,148,262 |
Fidelity Small Cap Value Fund (b) | 4,217,110 | | 80,040,753 |
TOTAL DOMESTIC EQUITY FUNDS | | 3,676,133,931 |
TOTAL DOMESTIC EQUITY FUNDS (Cost $3,715,921,882) |
4,296,085,561
|
International Equity Funds - 22.6% |
| | | |
Developed International Equity Funds - 17.6% |
Fidelity Series International Growth Fund (b) | 41,620,651 | | 564,792,233 |
Fidelity Series International Small Cap Fund (b) | 7,634,262 | | 116,727,860 |
Fidelity Series International Value Fund (b) | 52,617,951 | | 565,642,973 |
TOTAL DEVELOPED INTERNATIONAL EQUITY FUNDS | | 1,247,163,066 |
|
| Shares | | Value |
Emerging Markets Equity Funds - 5.0% |
Fidelity Series Emerging Markets Fund (b) | 21,342,695 | | $ 357,276,709 |
TOTAL INTERNATIONAL EQUITY FUNDS (Cost $1,412,225,251) |
1,604,439,775
|
Bond Funds - 16.9% |
| | | |
High Yield Bond Funds - 8.7% |
Fidelity Series Emerging Markets Debt Fund (b) | 5,052,402 | | 51,130,308 |
Fidelity Series Floating Rate High Income Fund (b) | 4,924,335 | | 52,099,459 |
Fidelity Series High Income Fund (b) | 47,210,410 | | 485,323,012 |
Fidelity Series Real Estate Income Fund (b) | 2,603,103 | | 28,582,066 |
TOTAL HIGH YIELD BOND FUNDS | | 617,134,845 |
Investment Grade Bond Funds - 8.2% |
Fidelity Series Investment Grade Bond Fund (b) | 52,527,890 | | 587,787,084 |
TOTAL BOND FUNDS (Cost $1,214,184,611) |
1,204,921,929
|
TOTAL INVESTMENT PORTFOLIO - 100.0% (Cost $6,342,331,744) | | 7,105,447,265 |
NET OTHER ASSETS (LIABILITIES) - 0.0% | | (113) |
NET ASSETS - 100% | $ 7,105,447,152 |
Legend |
(a) Non-income producing |
(b) Affiliated company |
Affiliated Underlying Funds |
Information regarding the Fund's fiscal year to date purchases and sales of the affiliated Underlying Funds and income earned by the Fund from investments in affiliated Underlying Funds is as follows: |
Affiliate | Value,
beginning of
period | Purchases | Sales
Proceeds | Dividend
Income | Value,
end of
period |
Fidelity Blue Chip Growth Fund | $ 361,613,965 | $ 33,592,304 | $ 19,248,260 | $ 982,143 | $ 409,596,055 |
Fidelity Disciplined Equity Fund | 79,383,963 | - | 83,206,973 | - | - |
Fidelity Growth Company Fund | 501,108,462 | 10,971,721 | 65,772,988 | - | 527,150,396 |
Fidelity Series 100 Index Fund | 123,280,464 | 2,671,641 | 13,984,453 | - | 120,759,030 |
Fidelity Series All-Sector Equity Fund | 532,276,904 | 8,444,938 | 43,532,409 | - | 550,072,204 |
Fidelity Series Commodity Strategy Fund | 601,677,707 | 96,393,883 | 30,368,279 | - | 619,951,630 |
Fidelity Series Emerging Markets Debt Fund | 52,626,055 | 4,561,765 | 2,272,019 | 1,363,570 | 51,130,308 |
Fidelity Series Emerging Markets Fund | 318,012,165 | 53,346,422 | 15,830,930 | - | 357,276,709 |
Fidelity Series Equity-Income Fund | 338,041,915 | 25,339,298 | 16,456,704 | 3,518,882 | 367,370,426 |
Fidelity Series Floating Rate High Income Fund | 50,886,280 | 3,686,244 | 2,222,418 | 1,124,096 | 52,099,459 |
Fidelity Series Growth & Income Fund (formerly Fidelity Series Mega Cap Fund) | 123,509,214 | 22,572,721 | 6,357,029 | - | 151,679,938 |
Fidelity Series High Income Fund | 472,842,334 | 44,800,855 | 21,759,320 | 12,464,396 | 485,323,012 |
Fidelity Series International Growth Fund | 525,753,805 | 26,908,705 | 26,315,635 | - | 564,792,233 |
Fidelity Series International Small Cap Fund | 106,326,246 | 3,776,331 | 5,416,103 | - | 116,727,860 |
Fidelity Series International Value Fund | 521,944,842 | 21,006,707 | 26,461,074 | - | 565,642,973 |
Fidelity Series Intrinsic Opportunities Fund | 201,323,772 | 56,881,046 | 12,682,783 | 1,645,103 | 278,369,407 |
Fidelity Series Investment Grade Bond Fund | 557,059,848 | 80,249,695 | 32,296,079 | 5,956,522 | 587,787,084 |
Fidelity Series Large Cap Value Fund | 323,669,869 | 3,260,207 | 64,951,241 | - | 288,066,483 |
Fidelity Series Opportunistic Insights Fund | 246,769,163 | 12,167,589 | 13,573,121 | - | 287,290,259 |
Fidelity Series Real Estate Equity Fund | 49,363,878 | 14,386,806 | 2,423,734 | 376,866 | 56,368,988 |
Fidelity Series Real Estate Income Fund | 28,880,044 | 2,664,480 | 1,237,221 | 846,736 | 28,582,066 |
Fidelity Series Small Cap Opportunities Fund | 138,645,643 | 14,207,083 | 10,622,411 | - | 148,092,505 |
Fidelity Series Stock Selector Large Cap Value Fund | 341,079,737 | 7,434,161 | 47,335,550 | - | 330,129,225 |
Fidelity Small Cap Growth Fund | 78,158,932 | 9,715,191 | 9,641,922 | - | 81,148,262 |
Fidelity Small Cap Value Fund | 84,334,462 | 6,633,776 | 11,729,073 | 126,169 | 80,040,753 |
Total | $ 6,758,569,669 | $ 565,673,569 | $ 585,697,729 | $ 28,404,483 | $ 7,105,447,265 |
Other Information |
All investments are categorized as Level 1 under the Fair Value Hierarchy. The inputs or methodology used for valuing securities may not be an indication of the risk associated with investing in those securities. For more information on valuation inputs, please refer to the Investment Valuation section in the accompanying Notes to Financial Statements. |
See accompanying notes which are an integral part of the financial statements.
Semiannual Report
Fidelity Freedom 2040 Fund
Statement of Assets and Liabilities
| September 30, 2013 (Unaudited) |
| | |
Assets | | |
Investment in securities, at value (cost $6,342,331,744) - See accompanying schedule | | $ 7,105,447,265 |
Receivable for investments sold | | 2,995,296 |
Receivable for fund shares sold | | 9,065,024 |
Total assets | | 7,117,507,585 |
| | |
Liabilities | | |
Payable for fund shares redeemed | | 12,060,433 |
| | |
Net Assets | | $ 7,105,447,152 |
Net Assets consist of: | | |
Paid in capital | | $ 6,252,002,297 |
Undistributed net investment income | | 28,267,581 |
Accumulated undistributed net realized gain (loss) on investments | | 62,061,753 |
Net unrealized appreciation (depreciation) on investments | | 763,115,521 |
Net Assets, for 772,679,226 shares outstanding | | $ 7,105,447,152 |
Net Asset Value, offering price and redemption price per share ($7,105,447,152 ÷ 772,679,226 shares) | | $ 9.20 |
Statement of Operations
Six months ended September 30, 2013 (Unaudited) |
| | |
Investment Income | | |
Income distributions from underlying funds | | $ 28,404,483 |
| | |
Expenses | | |
Independent trustees' compensation | $ 12,797 | |
Total expenses before reductions | 12,797 | |
Expense reductions | (12,797) | - |
Net investment income (loss) | | 28,404,483 |
Realized and Unrealized Gain (Loss) Realized gain (loss) on sale of underlying fund shares | 33,275,313 | |
Capital gain distributions from underlying funds | 51,195,522 | |
Total net realized gain (loss) | | 84,470,835 |
Change in net unrealized appreciation (depreciation) on underlying funds | | 333,626,445 |
Net gain (loss) | | 418,097,280 |
Net increase (decrease) in net assets resulting from operations | | $ 446,501,763 |
See accompanying notes which are an integral part of the financial statements.
Semiannual Report
Fidelity Freedom 2040 Fund
Financial Statements - continued
Statement of Changes in Net Assets
| Six months ended
September 30, 2013
(Unaudited) | Year ended
March 31,
2013 |
Increase (Decrease) in Net Assets | | |
Operations | | |
Net investment income (loss) | $ 28,404,483 | $ 115,806,882 |
Net realized gain (loss) | 84,470,835 | 434,988,724 |
Change in net unrealized appreciation (depreciation) | 333,626,445 | 72,440,995 |
Net increase (decrease) in net assets resulting from operations | 446,501,763 | 623,236,601 |
Distributions to shareholders from net investment income | (10,727,043) | (116,763,462) |
Distributions to shareholders from net realized gain | (114,933,834) | (17,513,053) |
Total distributions | (125,660,877) | (134,276,515) |
Share transactions
Proceeds from sales of shares | 864,039,792 | 1,752,526,704 |
Reinvestment of distributions | 125,332,207 | 133,868,825 |
Cost of shares redeemed | (963,335,321) | (2,909,851,337) |
Net increase (decrease) in net assets resulting from share transactions | 26,036,678 | (1,023,455,808) |
Total increase (decrease) in net assets | 346,877,564 | (534,495,722) |
| | |
Net Assets | | |
Beginning of period | 6,758,569,588 | 7,293,065,310 |
End of period (including undistributed net investment income of $28,267,581 and undistributed net investment income of $10,590,141, respectively) | $ 7,105,447,152 | $ 6,758,569,588 |
Other Information Shares | | |
Sold | 97,042,797 | 213,801,336 |
Issued in reinvestment of distributions | 14,193,904 | 16,447,611 |
Redeemed | (108,284,990) | (355,303,340) |
Net increase (decrease) | 2,951,711 | (125,054,393) |
Financial Highlights
| Six months ended
September 30, 2013 | Years ended March 31, |
| (Unaudited) | 2013 | 2012 | 2011 | 2010 | 2009 |
Selected Per-Share Data | | | | | | |
Net asset value, beginning of period | $ 8.78 | $ 8.15 | $ 8.41 | $ 7.45 | $ 5.10 | $ 8.79 |
Income from Investment Operations | | | | | | |
Net investment income (loss) D | .04 | .14 | .12 | .12 | .13 | .15 |
Net realized and unrealized gain (loss) | .54 | .66 | (.10) | 1.03 | 2.42 | (3.35) |
Total from investment operations | .58 | .80 | .02 | 1.15 | 2.55 | (3.20) |
Distributions from net investment income | (.01) | (.15) | (.13) | (.12) | (.13) | (.15) |
Distributions from net realized gain | (.15) | (.02) | (.15) | (.07) | (.07) | (.34) |
Total distributions | (.16) | (.17) | (.28) | (.19) | (.20) H | (.49) |
Net asset value, end of period | $ 9.20 | $ 8.78 | $ 8.15 | $ 8.41 | $ 7.45 | $ 5.10 |
Total Return B, C | 6.73% | 9.94% | .58% | 15.66% | 50.14% | (38.20)% |
Ratios to Average Net Assets E, G | | | | | | |
Expenses before reductions F | .00% A | .00% | .00% | .00% | .00% | .00% |
Expenses net of fee waivers, if any | .00% A | .00% | .00% | .00% | .00% | .00% |
Expenses net of all reductions | .00% A | .00% | .00% | .00% | .00% | .00% |
Net investment income (loss) | .82% A | 1.70% | 1.55% | 1.52% | 1.94% | 2.22% |
Supplemental Data | | | | | | |
Net assets, end of period (000 omitted) | $ 7,105,447 | $ 6,758,570 | $ 7,293,065 | $ 9,073,364 | $ 8,622,511 | $ 5,336,303 |
Portfolio turnover rate E | 16% A | 33% | 27% | 46% | 27% | 17% |
A Annualized
B Total returns for periods of less than one year are not annualized.
C Total returns would have been lower if certain expenses had not been reduced during the applicable periods shown.
D Calculated based on average shares outstanding during the period.
E Amounts do not include the activity of the Underlying Funds.
F Amount represents less than .01%.
G Expense ratios reflect operating expenses of the Fund. Expenses before reductions do not reflect amounts reimbursed by the investment adviser or reductions from expense offset arrangements and do not represent the amount paid by the Fund during periods when reimbursements or reductions occur. Expenses net of fee waivers reflect expenses after reimbursement by the investment adviser but prior to reductions from expense offset arrangements. Expenses net of all reductions represent the net expenses paid by the Fund but do not include expenses of the investment companies in which the Fund invests.
H Total distributions of $.20 per share is comprised of distributions from net investment income of $.125 and distributions from net realized gain of $.070 per share.
See accompanying notes which are an integral part of the financial statements.
Semiannual Report
Fidelity Freedom 2045 Fund
Investment Changes (Unaudited)
The information in the following tables is based on the direct investments of the Fund. |
Fund Holdings as of September 30, 2013 |
| % of fund's
net assets | % of fund's net assets
6 months ago |
Commodity Funds | | |
Fidelity Series Commodity Strategy Fund | 9.0 | 9.2 |
Domestic Equity Funds | | |
Fidelity Blue Chip Growth Fund | 5.9 | 5.5 |
Fidelity Disciplined Equity Fund | 0.0 | 1.2 |
Fidelity Growth Company Fund | 7.6 | 7.7 |
Fidelity Series 100 Index Fund | 1.7 | 1.9 |
Fidelity Series All-Sector Equity Fund | 7.9 | 8.1 |
Fidelity Series Equity-Income Fund | 5.3 | 5.0 |
Fidelity Series Growth & Income Fund (formerly Fidelity Series Mega Cap Fund) | 2.2 | 1.8 |
Fidelity Series Intrinsic Opportunities Fund | 4.0 | 3.0 |
Fidelity Series Large Cap Value Fund | 4.2 | 4.9 |
Fidelity Series Opportunistic Insights Fund | 4.1 | 3.7 |
Fidelity Series Real Estate Equity Fund | 0.8 | 0.8 |
Fidelity Series Small Cap Opportunities Fund | 2.1 | 2.1 |
Fidelity Series Stock Selector Large Cap Value Fund | 4.8 | 5.0 |
Fidelity Small Cap Growth Fund | 1.2 | 1.2 |
Fidelity Small Cap Value Fund | 1.1 | 1.3 |
| 52.9 | 53.2 |
Developed International Equity Funds | | |
Fidelity Series International Growth Fund | 8.1 | 8.0 |
Fidelity Series International Small Cap Fund | 1.7 | 1.6 |
Fidelity Series International Value Fund | 8.2 | 8.0 |
| 18.0 | 17.6 |
Emerging Markets Equity Funds | | |
Fidelity Series Emerging Markets Fund | 5.2 | 4.9 |
High Yield Bond Funds | | |
Fidelity Series Emerging Markets Debt Fund | 0.7 | 0.7 |
Fidelity Series Floating Rate High Income Fund | 0.4 | 0.4 |
Fidelity Series High Income Fund | 8.9 | 9.1 |
Fidelity Series Real Estate Income Fund | 0.3 | 0.4 |
| 10.3 | 10.6 |
Investment Grade Bond Funds | | |
Fidelity Series Investment Grade Bond Fund | 4.6 | 4.5 |
Net Other Assets (Liabilities)* | 0.0 | 0.0 |
| 100.0 | 100.0 |
* Amount represents less than 0.1% |
Asset Allocation (% of fund's net assets) |
Period end |
| Commodity Funds | 9.0% | |
| Domestic Equity Funds | 52.9% | |
| Developed International Equity Funds | 18.0% | |
| Emerging Markets Equity Funds | 5.2% | |
| High Yield Bond Funds | 10.3% | |
| Investment Grade Bond Funds | 4.6% | |

Six months ago |
| Commodity Funds | 9.2% | |
| Domestic Equity Funds | 53.2% | |
| Developed International Equity Funds | 17.6% | |
| Emerging Markets Equity Funds | 4.9% | |
| High Yield Bond Funds | 10.6% | |
| Investment Grade Bond Funds | 4.5% | |

Semiannual Report
Fidelity Freedom 2045 Fund
Investments September 30, 2013 (Unaudited)
Showing Percentage of Net Assets
Domestic Equity Funds - 61.9% |
| Shares | | Value |
Commodity Funds - 9.0% |
Fidelity Series Commodity Strategy Fund (a)(b) | 30,878,290 | | $ 247,335,105 |
Domestic Equity Funds - 52.9% |
Fidelity Blue Chip Growth Fund (b) | 2,781,096 | | 162,443,818 |
Fidelity Growth Company Fund (b) | 1,766,175 | | 209,768,565 |
Fidelity Series 100 Index Fund (b) | 4,367,966 | | 48,397,058 |
Fidelity Series All-Sector Equity Fund (b) | 15,406,605 | | 218,157,531 |
Fidelity Series Equity-Income Fund (b) | 12,331,675 | | 145,267,131 |
Fidelity Series Growth & Income Fund (b) | 4,993,674 | | 60,223,711 |
Fidelity Series Intrinsic Opportunities Fund (b) | 8,512,715 | | 110,495,037 |
Fidelity Series Large Cap Value Fund (b) | 9,085,446 | | 114,749,178 |
Fidelity Series Opportunistic Insights Fund (b) | 8,783,584 | | 113,044,729 |
Fidelity Series Real Estate Equity Fund (b) | 1,876,084 | | 22,437,961 |
Fidelity Series Small Cap Opportunities Fund (b) | 4,596,072 | | 58,967,607 |
Fidelity Series Stock Selector Large Cap Value Fund (b) | 10,803,456 | | 131,586,088 |
Fidelity Small Cap Growth Fund (b) | 1,730,157 | | 32,353,931 |
Fidelity Small Cap Value Fund (b) | 1,686,154 | | 32,003,197 |
TOTAL DOMESTIC EQUITY FUNDS | | 1,459,895,542 |
TOTAL DOMESTIC EQUITY FUNDS (Cost $1,350,306,846) |
1,707,230,647
|
International Equity Funds - 23.2% |
| | | |
Developed International Equity Funds - 18.0% |
Fidelity Series International Growth Fund (b) | 16,532,555 | | 224,346,767 |
Fidelity Series International Small Cap Fund (b) | 3,058,357 | | 46,762,286 |
Fidelity Series International Value Fund (b) | 20,922,569 | | 224,917,622 |
TOTAL DEVELOPED INTERNATIONAL EQUITY FUNDS | | 496,026,675 |
|
| Shares | | Value |
Emerging Markets Equity Funds - 5.2% |
Fidelity Series Emerging Markets Fund (b) | 8,500,545 | | $ 142,299,125 |
TOTAL INTERNATIONAL EQUITY FUNDS (Cost $533,833,393) |
638,325,800
|
Bond Funds - 14.9% |
| | | |
High Yield Bond Funds - 10.3% |
Fidelity Series Emerging Markets Debt Fund (b) | 1,912,107 | | 19,350,525 |
Fidelity Series Floating Rate High Income Fund (b) | 985,396 | | 10,425,492 |
Fidelity Series High Income Fund (b) | 23,703,975 | | 243,676,865 |
Fidelity Series Real Estate Income Fund (b) | 853,347 | | 9,369,753 |
TOTAL HIGH YIELD BOND FUNDS | | 282,822,635 |
Investment Grade Bond Funds - 4.6% |
Fidelity Series Investment Grade Bond Fund (b) | 11,418,936 | | 127,777,890 |
TOTAL BOND FUNDS (Cost $405,395,605) |
410,600,525
|
TOTAL INVESTMENT PORTFOLIO - 100.0% (Cost $2,289,535,844) | | 2,756,156,972 |
NET OTHER ASSETS (LIABILITIES) - 0.0% | | (31) |
NET ASSETS - 100% | $ 2,756,156,941 |
Legend |
(a) Non-income producing |
(b) Affiliated company |
Affiliated Underlying Funds |
Information regarding the Fund's fiscal year to date purchases and sales of the affiliated Underlying Funds and income earned by the Fund from investments in affiliated Underlying Funds is as follows: |
Affiliate | Value,
beginning of
period | Purchases | Sales
Proceeds | Dividend
Income | Value,
end of
period |
Fidelity Blue Chip Growth Fund | $ 136,122,664 | $ 21,407,193 | $ 8,002,274 | $ 386,494 | $ 162,443,818 |
Fidelity Disciplined Equity Fund | 30,351,780 | 390,593 | 32,182,048 | - | - |
Fidelity Growth Company Fund | 190,554,402 | 14,256,120 | 26,564,058 | - | 209,768,565 |
Fidelity Series 100 Index Fund | 46,874,857 | 3,542,318 | 5,440,712 | - | 48,397,058 |
Fidelity Series All-Sector Equity Fund | 200,532,299 | 13,709,106 | 16,624,588 | - | 218,157,531 |
Fidelity Series Commodity Strategy Fund | 229,013,206 | 48,898,453 | 12,044,310 | - | 247,335,105 |
Fidelity Series Emerging Markets Debt Fund | 18,954,756 | 2,696,066 | 908,169 | 501,366 | 19,350,525 |
Fidelity Series Emerging Markets Fund | 119,751,578 | 28,106,507 | 6,397,879 | - | 142,299,125 |
Fidelity Series Equity-Income Fund | 123,866,150 | 20,120,369 | 6,396,672 | 1,328,937 | 145,267,131 |
Fidelity Series Floating Rate High Income Fund | 9,460,149 | 1,473,472 | 456,342 | 217,303 | 10,425,492 |
Fidelity Series Growth & Income Fund (formerly Fidelity Series Mega Cap Fund) | 45,248,499 | 12,970,194 | 2,495,896 | - | 60,223,711 |
Fidelity Series High Income Fund | 225,447,407 | 34,902,897 | 11,481,274 | 6,118,315 | 243,676,865 |
Fidelity Series International Growth Fund | 198,766,174 | 21,269,122 | 10,757,949 | - | 224,346,767 |
Fidelity Series International Small Cap Fund | 40,506,495 | 3,724,089 | 2,206,544 | - | 46,762,286 |
Fidelity Series International Value Fund | 197,947,938 | 18,657,118 | 10,849,908 | - | 224,917,622 |
Fidelity Series Intrinsic Opportunities Fund | 74,797,958 | 27,956,009 | 4,843,884 | 648,912 | 110,495,037 |
Fidelity Series Investment Grade Bond Fund | 112,141,719 | 25,555,468 | 6,412,627 | 1,241,326 | 127,777,890 |
Fidelity Series Large Cap Value Fund | 122,272,345 | 7,075,948 | 24,727,673 | - | 114,749,178 |
Fidelity Series Opportunistic Insights Fund | 90,463,001 | 11,678,846 | 5,194,873 | - | 113,044,729 |
Fidelity Series Real Estate Equity Fund | 18,829,328 | 6,554,840 | 978,223 | 147,954 | 22,437,961 |
Fidelity Series Real Estate Income Fund | 9,116,218 | 1,264,473 | 449,763 | 273,004 | 9,369,753 |
Fidelity Series Small Cap Opportunities Fund | 52,242,976 | 8,579,053 | 4,097,450 | - | 58,967,607 |
Fidelity Series Stock Selector Large Cap Value Fund | 125,094,985 | 9,870,592 | 14,346,204 | - | 131,586,088 |
Fidelity Small Cap Growth Fund | 29,863,139 | 5,178,145 | 3,806,920 | - | 32,353,931 |
Fidelity Small Cap Value Fund | 32,245,448 | 4,051,717 | 4,604,088 | 50,204 | 32,003,197 |
Total | $ 2,480,465,471 | $ 353,888,708 | $ 222,270,328 | $ 10,913,815 | $ 2,756,156,972 |
Other Information |
All investments are categorized as Level 1 under the Fair Value Hierarchy. The inputs or methodology used for valuing securities may not be an indication of the risk associated with investing in those securities. For more information on valuation inputs, please refer to the Investment Valuation section in the accompanying Notes to Financial Statements. |
See accompanying notes which are an integral part of the financial statements.
Semiannual Report
Fidelity Freedom 2045 Fund
Statement of Assets and Liabilities
| September 30, 2013 (Unaudited) |
| | |
Assets | | |
Investment in securities, at value (cost $2,289,535,844) - See accompanying schedule | | $ 2,756,156,972 |
Cash | | 2 |
Receivable for investments sold | | 70,263 |
Receivable for fund shares sold | | 5,770,255 |
Total assets | | 2,761,997,492 |
| | |
Liabilities | | |
Payable for investments purchased | $ 1,089,873 | |
Payable for fund shares redeemed | 4,750,678 | |
Total liabilities | | 5,840,551 |
| | |
Net Assets | | $ 2,756,156,941 |
Net Assets consist of: | | |
Paid in capital | | $ 2,243,444,521 |
Undistributed net investment income | | 10,875,197 |
Accumulated undistributed net realized gain (loss) on investments | | 35,216,095 |
Net unrealized appreciation (depreciation) on investments | | 466,621,128 |
Net Assets, for 258,479,157 shares outstanding | | $ 2,756,156,941 |
Net Asset Value, offering price and redemption price per share ($2,756,156,941 ÷ 258,479,157 shares) | | $ 10.66 |
Statement of Operations
Six months ended September 30, 2013 (Unaudited) |
| | |
Investment Income | | |
Income distributions from underlying funds | | $ 10,913,815 |
| | |
Expenses | | |
Independent trustees' compensation | $ 4,795 | |
Total expenses before reductions | 4,795 | |
Expense reductions | (4,795) | - |
Net investment income (loss) | | 10,913,815 |
Realized and Unrealized Gain (Loss) Realized gain (loss) on sale of underlying fund shares | 24,322,541 | |
Capital gain distributions from underlying funds | 20,189,868 | |
Total net realized gain (loss) | | 44,512,409 |
Change in net unrealized appreciation (depreciation) on underlying funds | | 119,750,610 |
Net gain (loss) | | 164,263,019 |
Net increase (decrease) in net assets resulting from operations | | $ 175,176,834 |
See accompanying notes which are an integral part of the financial statements.
Semiannual Report
Fidelity Freedom 2045 Fund
Financial Statements - continued
Statement of Changes in Net Assets
| Six months ended
September 30, 2013
(Unaudited) | Year ended
March 31,
2013 |
Increase (Decrease) in Net Assets | | |
Operations | | |
Net investment income (loss) | $ 10,913,815 | $ 41,368,476 |
Net realized gain (loss) | 44,512,409 | 133,356,837 |
Change in net unrealized appreciation (depreciation) | 119,750,610 | 54,006,409 |
Net increase (decrease) in net assets resulting from operations | 175,176,834 | 228,731,722 |
Distributions to shareholders from net investment income | (3,851,720) | (41,465,860) |
Distributions to shareholders from net realized gain | (107,606,398) | (4,528,192) |
Total distributions | (111,458,118) | (45,994,052) |
Share transactions
Proceeds from sales of shares | 516,029,119 | 987,985,006 |
Reinvestment of distributions | 111,360,375 | 45,960,325 |
Cost of shares redeemed | (415,416,722) | (1,169,045,115) |
Net increase (decrease) in net assets resulting from share transactions | 211,972,772 | (135,099,784) |
Total increase (decrease) in net assets | 275,691,488 | 47,637,886 |
| | |
Net Assets | | |
Beginning of period | 2,480,465,453 | 2,432,827,567 |
End of period (including undistributed net investment income of $10,875,197 and undistributed net investment income of $3,813,101, respectively) | $ 2,756,156,941 | $ 2,480,465,453 |
Other Information Shares | | |
Sold | 49,691,261 | 101,844,132 |
Issued in reinvestment of distributions | 10,801,201 | 4,772,492 |
Redeemed | (40,036,294) | (120,670,005) |
Net increase (decrease) | 20,456,168 | (14,053,381) |
Financial Highlights
| Six months ended
September 30, 2013 | Years ended March 31, |
| (Unaudited) | 2013 | 2012 | 2011 | 2010 | 2009 |
Selected Per-Share Data | | | | | | |
Net asset value, beginning of period | $ 10.42 | $ 9.65 | $ 9.98 | $ 8.81 | $ 5.99 | $ 10.24 |
Income from Investment Operations | | | | | | |
Net investment income (loss) D | .04 | .17 | .15 | .14 | .16 | .18 |
Net realized and unrealized gain (loss) | .66 | .79 | (.15) | 1.25 | 2.88 | (4.00) |
Total from investment operations | .70 | .96 | - | 1.39 | 3.04 | (3.82) |
Distributions from net investment income | (.02) | (.17) | (.15) | (.14) | (.15) | (.15) |
Distributions from net realized gain | (.45) | (.02) | (.17) | (.08) | (.07) | (.28) |
Total distributions | (.46) J | (.19) | (.33) I | (.22) | (.22) H | (.43) |
Net asset value, end of period | $ 10.66 | $ 10.42 | $ 9.65 | $ 9.98 | $ 8.81 | $ 5.99 |
Total Return B, C | 6.90% | 10.14% | .29% | 15.99% | 50.86% | (38.60)% |
Ratios to Average Net Assets E, G | | | | | | |
Expenses before reductions F | .00% A | .00% | .00% | .00% | .00% | .00% |
Expenses net of fee waivers, if any | .00% A | .00% | .00% | .00% | .00% | .00% |
Expenses net of all reductions | .00% A | .00% | .00% | .00% | .00% | .00% |
Net investment income (loss) | .84% A | 1.75% | 1.57% | 1.55% | 1.97% | 2.29% |
Supplemental Data | | | | | | |
Net assets, end of period (000 omitted) | $ 2,756,157 | $ 2,480,465 | $ 2,432,828 | $ 2,660,423 | $ 2,071,143 | $ 946,939 |
Portfolio turnover rate E | 17% A | 45% | 40% | 50% | 24% | 17% |
A Annualized
B Total returns for periods of less than one year are not annualized.
C Total returns would have been lower if certain expenses had not been reduced during the applicable periods shown.
D Calculated based on average shares outstanding during the period.
E Amounts do not include the activity of the Underlying Funds.
F Amount represents less than .01%.
G Expense ratios reflect operating expenses of the Fund. Expenses before reductions do not reflect amounts reimbursed by the investment adviser or reductions from expense offset arrangements and do not represent the amount paid by the Fund during periods when reimbursements or reductions occur. Expenses net of fee waivers reflect expenses after reimbursement by the investment adviser but prior to reductions from expense offset arrangements. Expenses net of all reductions represent the net expenses paid by the Fund but do not include expenses of the investment companies in which the Fund invests.
H Total distributions of $.22 per share is comprised of distributions from net investment income of $.145 and distributions from net realized gain of $.070 per share.
I Total distributions of $.33 per share is comprised of distributions from net investment income of $.153 and distributions from net realized gain of $.174 per share.
J Total distributions of $.46 per share is comprised of distributions from net investment income of $.016 and distributions from net realized gain of $.447 per share.
See accompanying notes which are an integral part of the financial statements.
Semiannual Report
Fidelity Freedom 2050 Fund
Investment Changes (Unaudited)
The information in the following tables is based on the direct investments of the Fund. |
Fund Holdings as of September 30, 2013 |
| % of fund's
net assets | % of fund's net assets
6 months ago |
Commodity Funds | | |
Fidelity Series Commodity Strategy Fund | 9.0 | 9.4 |
Domestic Equity Funds | | |
Fidelity Blue Chip Growth Fund | 6.0 | 5.6 |
Fidelity Disciplined Equity Fund | 0.0 | 1.2 |
Fidelity Growth Company Fund | 7.7 | 7.8 |
Fidelity Series 100 Index Fund | 1.8 | 1.9 |
Fidelity Series All-Sector Equity Fund | 8.0 | 8.2 |
Fidelity Series Equity-Income Fund | 5.3 | 5.1 |
Fidelity Series Growth & Income Fund (formerly Fidelity Series Mega Cap Fund) | 2.2 | 1.9 |
Fidelity Series Intrinsic Opportunities Fund | 4.0 | 3.0 |
Fidelity Series Large Cap Value Fund | 4.2 | 5.0 |
Fidelity Series Opportunistic Insights Fund | 4.1 | 3.7 |
Fidelity Series Real Estate Equity Fund | 0.8 | 0.8 |
Fidelity Series Small Cap Opportunities Fund | 2.2 | 2.1 |
Fidelity Series Stock Selector Large Cap Value Fund | 4.8 | 5.2 |
Fidelity Small Cap Growth Fund | 1.2 | 1.2 |
Fidelity Small Cap Value Fund | 1.2 | 1.3 |
| 53.5 | 54.0 |
Developed International Equity Funds | | |
Fidelity Series International Growth Fund | 8.2 | 8.0 |
Fidelity Series International Small Cap Fund | 1.7 | 1.6 |
Fidelity Series International Value Fund | 8.2 | 8.1 |
| 18.1 | 17.7 |
Emerging Markets Equity Funds | | |
Fidelity Series Emerging Markets Fund | 5.2 | 4.9 |
High Yield Bond Funds | | |
Fidelity Series Emerging Markets Debt Fund | 0.7 | 0.8 |
Fidelity Series Floating Rate High Income Fund | 0.2 | 0.1 |
Fidelity Series High Income Fund | 9.1 | 9.3 |
Fidelity Series Real Estate Income Fund | 0.3 | 0.3 |
| 10.3 | 10.5 |
Investment Grade Bond Funds | | |
Fidelity Series Investment Grade Bond Fund | 3.9 | 3.5 |
Net Other Assets (Liabilities)* | 0.0 | 0.0 |
| 100.0 | 100.0 |
* Amount represents less than 0.1% |
Asset Allocation (% of fund's net assets) |
Period end |
| Commodity Funds | 9.0% | |
| Domestic Equity Funds | 53.5% | |
| Developed International Equity Funds | 18.1% | |
| Emerging Markets Equity Funds | 5.2% | |
| High Yield Bond Funds | 10.3% | |
| Investment Grade Bond Funds | 3.9% | |

Six months ago |
| Commodity Funds | 9.4% | |
| Domestic Equity Funds | 54.0% | |
| Developed International Equity Funds | 17.7% | |
| Emerging Markets Equity Funds | 4.9% | |
| High Yield Bond Funds | 10.5% | |
| Investment Grade Bond Funds | 3.5% | |

Semiannual Report
Fidelity Freedom 2050 Fund
Investments September 30, 2013 (Unaudited)
Showing Percentage of Net Assets
Domestic Equity Funds - 62.5% |
| Shares | | Value |
Commodity Funds - 9.0% |
Fidelity Series Commodity Strategy Fund (a)(b) | 25,789,465 | | $ 206,573,612 |
Domestic Equity Funds - 53.5% |
Fidelity Blue Chip Growth Fund (b) | 2,347,171 | | 137,098,249 |
Fidelity Growth Company Fund (b) | 1,474,366 | | 175,110,490 |
Fidelity Series 100 Index Fund (b) | 3,636,165 | | 40,288,712 |
Fidelity Series All-Sector Equity Fund (b) | 12,974,189 | | 183,714,515 |
Fidelity Series Equity-Income Fund (b) | 10,265,951 | | 120,932,906 |
Fidelity Series Growth & Income Fund (b) | 4,075,110 | | 49,145,826 |
Fidelity Series Intrinsic Opportunities Fund (b) | 7,101,540 | | 92,177,994 |
Fidelity Series Large Cap Value Fund (b) | 7,638,866 | | 96,478,879 |
Fidelity Series Opportunistic Insights Fund (b) | 7,360,473 | | 94,729,286 |
Fidelity Series Real Estate Equity Fund (b) | 1,568,877 | | 18,763,764 |
Fidelity Series Small Cap Opportunities Fund (b) | 3,854,536 | | 49,453,694 |
Fidelity Series Stock Selector Large Cap Value Fund (b) | 9,031,979 | | 110,009,501 |
Fidelity Small Cap Growth Fund (b) | 1,449,233 | | 27,100,662 |
Fidelity Small Cap Value Fund (b) | 1,405,424 | | 26,674,951 |
TOTAL DOMESTIC EQUITY FUNDS | | 1,221,679,429 |
TOTAL DOMESTIC EQUITY FUNDS (Cost $1,140,015,557) |
1,428,253,041
|
International Equity Funds - 23.3% |
| | | |
Developed International Equity Funds - 18.1% |
Fidelity Series International Growth Fund (b) | 13,813,709 | | 187,452,029 |
Fidelity Series International Small Cap Fund (b) | 2,548,725 | | 38,969,998 |
Fidelity Series International Value Fund (b) | 17,497,494 | | 188,098,063 |
TOTAL DEVELOPED INTERNATIONAL EQUITY FUNDS | | 414,520,090 |
|
| Shares | | Value |
Emerging Markets Equity Funds - 5.2% |
Fidelity Series Emerging Markets Fund (b) | 7,092,975 | | $ 118,736,397 |
TOTAL INTERNATIONAL EQUITY FUNDS (Cost $446,668,404) |
533,256,487
|
Bond Funds - 14.2% |
| | | |
High Yield Bond Funds - 10.3% |
Fidelity Series Emerging Markets Debt Fund (b) | 1,598,404 | | 16,175,845 |
Fidelity Series Floating Rate High Income Fund (b) | 273,476 | | 2,893,379 |
Fidelity Series High Income Fund (b) | 20,238,778 | | 208,054,639 |
Fidelity Series Real Estate Income Fund (b) | 634,825 | | 6,970,374 |
TOTAL HIGH YIELD BOND FUNDS | | 234,094,237 |
Investment Grade Bond Funds - 3.9% |
Fidelity Series Investment Grade Bond Fund (b) | 7,970,529 | | 89,190,225 |
TOTAL BOND FUNDS (Cost $322,288,058) |
323,284,462
|
TOTAL INVESTMENT PORTFOLIO - 100.0% (Cost $1,908,972,019) | | 2,284,793,990 |
NET OTHER ASSETS (LIABILITIES) - 0.0% | | (15) |
NET ASSETS - 100% | $ 2,284,793,975 |
Legend |
(a) Non-income producing |
(b) Affiliated company |
Affiliated Underlying Funds |
Information regarding the Fund's fiscal year to date purchases and sales of the affiliated Underlying Funds and income earned by the Fund from investments in affiliated Underlying Funds is as follows: |
Affiliate | Value,
beginning of
period | Purchases | Sales
Proceeds | Dividend
Income | Value,
end of
period |
Fidelity Blue Chip Growth Fund | $ 115,551,329 | $ 16,569,024 | $ 5,922,171 | $ 325,982 | $ 137,098,249 |
Fidelity Disciplined Equity Fund | 25,531,228 | 192,269 | 26,940,621 | - | - |
Fidelity Growth Company Fund | 161,156,910 | 10,596,155 | 23,035,247 | - | 175,110,490 |
Fidelity Series 100 Index Fund | 39,559,755 | 2,612,098 | 4,736,576 | - | 40,288,712 |
Fidelity Series All-Sector Equity Fund | 169,849,558 | 10,574,141 | 13,949,200 | - | 183,714,515 |
Fidelity Series Commodity Strategy Fund | 194,100,158 | 37,165,807 | 9,179,114 | - | 206,573,612 |
Fidelity Series Emerging Markets Debt Fund | 15,753,724 | 2,191,733 | 599,668 | 418,684 | 16,175,845 |
Fidelity Series Emerging Markets Fund | 100,492,737 | 22,297,556 | 4,773,878 | - | 118,736,397 |
Fidelity Series Equity-Income Fund | 105,478,389 | 13,793,364 | 4,813,329 | 1,117,205 | 120,932,906 |
Fidelity Series Floating Rate High Income Fund | 2,484,791 | 506,830 | 83,255 | 59,256 | 2,893,379 |
Fidelity Series Growth & Income Fund (formerly Fidelity Series Mega Cap Fund) | 38,540,289 | 8,716,137 | 1,891,670 | - | 49,145,826 |
Fidelity Series High Income Fund | 191,415,370 | 29,633,396 | 8,602,355 | 5,192,824 | 208,054,639 |
Fidelity Series International Growth Fund | 166,678,653 | 16,031,498 | 7,844,972 | - | 187,452,029 |
Fidelity Series International Small Cap Fund | 33,971,182 | 2,679,796 | 1,629,161 | - | 38,969,998 |
Fidelity Series International Value Fund | 166,734,667 | 13,398,143 | 8,053,359 | - | 188,098,063 |
Fidelity Series Intrinsic Opportunities Fund | 62,847,546 | 22,260,929 | 3,451,032 | 542,095 | 92,177,994 |
Fidelity Series Investment Grade Bond Fund | 72,999,572 | 22,873,730 | 4,234,956 | 855,417 | 89,190,225 |
Fidelity Series Large Cap Value Fund | 103,890,585 | 5,509,754 | 21,391,792 | - | 96,478,879 |
Fidelity Series Opportunistic Insights Fund | 77,039,422 | 7,992,668 | 3,821,829 | - | 94,729,286 |
Fidelity Series Real Estate Equity Fund | 15,606,153 | 5,501,010 | 733,012 | 121,809 | 18,763,764 |
Fidelity Series Real Estate Income Fund | 6,758,487 | 889,090 | 259,352 | 203,372 | 6,970,374 |
Fidelity Series Small Cap Opportunities Fund | 44,373,673 | 6,746,607 | 3,540,611 | - | 49,453,694 |
Fidelity Series Stock Selector Large Cap Value Fund | 106,512,148 | 7,291,037 | 13,017,235 | - | 110,009,501 |
Fidelity Small Cap Growth Fund | 25,199,447 | 4,243,061 | 3,261,511 | - | 27,100,662 |
Fidelity Small Cap Value Fund | 27,218,917 | 3,203,133 | 3,991,302 | 41,899 | 26,674,951 |
Total | $ 2,069,744,690 | $ 273,468,966 | $ 179,757,208 | $ 8,878,543 | $ 2,284,793,990 |
Other Information |
All investments are categorized as Level 1 under the Fair Value Hierarchy. The inputs or methodology used for valuing securities may not be an indication of the risk associated with investing in those securities. For more information on valuation inputs, please refer to the Investment Valuation section in the accompanying Notes to Financial Statements. |
See accompanying notes which are an integral part of the financial statements.
Semiannual Report
Fidelity Freedom 2050 Fund
Statement of Assets and Liabilities
| September 30, 2013 (Unaudited) |
| | |
Assets | | |
Investment in securities, at value (cost $1,908,972,019) - See accompanying schedule | | $ 2,284,793,990 |
Cash | | 2 |
Receivable for investments sold | | 38,615 |
Receivable for fund shares sold | | 5,250,751 |
Total assets | | 2,290,083,358 |
| | |
Liabilities | | |
Payable for investments purchased | $ 947,722 | |
Payable for fund shares redeemed | 4,341,661 | |
Total liabilities | | 5,289,383 |
| | |
Net Assets | | $ 2,284,793,975 |
Net Assets consist of: | | |
Paid in capital | | $ 1,870,209,167 |
Undistributed net investment income | | 8,786,993 |
Accumulated undistributed net realized gain (loss) on investments | | 29,975,844 |
Net unrealized appreciation (depreciation) on investments | | 375,821,971 |
Net Assets, for 213,182,993 shares outstanding | | $ 2,284,793,975 |
Net Asset Value, offering price and redemption price per share ($2,284,793,975 ÷ 213,182,993 shares) | | $ 10.72 |
Statement of Operations
Six months ended September 30, 2013 (Unaudited) |
| | |
Investment Income | | |
Income distributions from underlying funds | | $ 8,878,543 |
| | |
Expenses | | |
Independent trustees' compensation | $ 3,981 | |
Total expenses before reductions | 3,981 | |
Expense reductions | (3,981) | - |
Net investment income (loss) | | 8,878,543 |
Realized and Unrealized Gain (Loss) Realized gain (loss) on sale of underlying fund shares | 20,705,438 | |
Capital gain distributions from underlying funds | 16,937,966 | |
Total net realized gain (loss) | | 37,643,404 |
Change in net unrealized appreciation (depreciation) on underlying funds | | 100,632,128 |
Net gain (loss) | | 138,275,532 |
Net increase (decrease) in net assets resulting from operations | | $ 147,154,075 |
See accompanying notes which are an integral part of the financial statements.
Semiannual Report
Fidelity Freedom 2050 Fund
Financial Statements - continued
Statement of Changes in Net Assets
| Six months ended
September 30, 2013
(Unaudited) | Year ended
March 31,
2013 |
Increase (Decrease) in Net Assets | | |
Operations | | |
Net investment income (loss) | $ 8,878,543 | $ 34,449,705 |
Net realized gain (loss) | 37,643,404 | 113,197,897 |
Change in net unrealized appreciation (depreciation) | 100,632,128 | 46,471,895 |
Net increase (decrease) in net assets resulting from operations | 147,154,075 | 194,119,497 |
Distributions to shareholders from net investment income | (3,240,763) | (34,165,519) |
Distributions to shareholders from net realized gain | (52,255,410) | (3,253,611) |
Total distributions | (55,496,173) | (37,419,130) |
Share transactions
Proceeds from sales of shares | 426,527,834 | 854,887,344 |
Reinvestment of distributions | 55,409,386 | 37,337,537 |
Cost of shares redeemed | (358,545,830) | (1,045,485,840) |
Net increase (decrease) in net assets resulting from share transactions | 123,391,390 | (153,260,959) |
Total increase (decrease) in net assets | 215,049,292 | 3,439,408 |
| | |
Net Assets | | |
Beginning of period | 2,069,744,683 | 2,066,305,275 |
End of period (including undistributed net investment income of $8,786,993 and undistributed net investment income of $3,149,213, respectively) | $ 2,284,793,975 | $ 2,069,744,683 |
Other Information Shares | | |
Sold | 41,072,303 | 89,442,709 |
Issued in reinvestment of distributions | 5,348,397 | 3,933,171 |
Redeemed | (34,568,021) | (109,263,719) |
Net increase (decrease) | 11,852,679 | (15,887,839) |
Financial Highlights
| Six months ended
September 30, 2013 | Years ended March 31, |
| (Unaudited) | 2013 | 2012 | 2011 | 2010 | 2009 |
Selected Per-Share Data | | | | | | |
Net asset value, beginning of period | $ 10.28 | $ 9.51 | $ 9.88 | $ 8.69 | $ 5.84 | $ 10.26 |
Income from Investment Operations | | | | | | |
Net investment income (loss) D | .04 | .16 | .14 | .13 | .14 | .17 |
Net realized and unrealized gain (loss) | .67 | .79 | (.19) | 1.27 | 2.92 | (4.15) |
Total from investment operations | .71 | .95 | (.05) | 1.40 | 3.06 | (3.98) |
Distributions from net investment income | (.02) | (.17) | (.14) | (.13) | (.13) | (.15) |
Distributions from net realized gain | (.26) | (.02) | (.18) | (.08) | (.08) | (.29) |
Total distributions | (.27) H | (.18) J | (.32) | (.21) | (.21) I | (.44) |
Net asset value, end of period | $ 10.72 | $ 10.28 | $ 9.51 | $ 9.88 | $ 8.69 | $ 5.84 |
Total Return B, C | 7.04% | 10.18% | (.17)% | 16.29% | 52.51% | (40.19)% |
Ratios to Average Net Assets E, G | | | | | | |
Expenses before reductions F | .00% A | .00% | .00% | .00% | .00% | .00% |
Expenses net of fee waivers, if any | .00% A | .00% | .00% | .00% | .00% | .00% |
Expenses net of all reductions | .00% A | .00% | .00% | .00% | .00% | .00% |
Net investment income (loss) | .82% A | 1.71% | 1.49% | 1.47% | 1.85% | 2.13% |
Supplemental Data | | | | | | |
Net assets, end of period (000 omitted) | $ 2,284,794 | $ 2,069,745 | $ 2,066,305 | $ 2,166,229 | $ 1,665,296 | $ 767,949 |
Portfolio turnover rate E | 17% A | 44% | 41% | 51% | 23% | 20% |
A Annualized
B Total returns for periods of less than one year are not annualized.
C Total returns would have been lower if certain expenses had not been reduced during the applicable periods shown.
D Calculated based on average shares outstanding during the period.
E Amounts do not include the activity of the Underlying Funds.
F Amount represents less than .01%.
G Expense ratios reflect operating expenses of the Fund. Expenses before reductions do not reflect amounts reimbursed by the investment adviser or reductions from expense offset arrangements and do not represent the amount paid by the Fund during periods when reimbursements or reductions occur. Expenses net of fee waivers reflect expenses after reimbursement by the investment adviser but prior to reductions from expense offset arrangements. Expenses net of all reductions represent the net expenses paid by the Fund but do not include expenses of the investment companies in which the Fund invests.
H Total distributions of $.27 per share is comprised of distributions from net investment income of $.016 and distributions from net realized gain of $.258 per share.
I Total distributions of $.21 per share is comprised of distributions from net investment income of $.130 and distributions from net realized gain of $.075 per share.
J Total distributions of $.18 per share is comprised of distributions from net investment income of $.167 and distributions from net realized gain of $.016 per share.
See accompanying notes which are an integral part of the financial statements.
Semiannual Report
Fidelity Freedom 2055 Fund
Investment Changes (Unaudited)
The information in the following tables is based on the direct investments of the Fund. |
Fund Holdings as of September 30, 2013 |
| % of fund's
net assets | % of fund's net assets
6 months ago |
Commodity Funds | | |
Fidelity Series Commodity Strategy Fund | 9.3 | 9.8 |
Domestic Equity Funds | | |
Fidelity Blue Chip Growth Fund | 6.4 | 6.4 |
Fidelity Disciplined Equity Fund | 0.0 | 1.4 |
Fidelity Growth Company Fund | 7.9 | 8.4 |
Fidelity Series 100 Index Fund | 1.9 | 2.2 |
Fidelity Series All-Sector Equity Fund | 8.3 | 9.4 |
Fidelity Series Equity-Income Fund | 5.7 | 4.5 |
Fidelity Series Growth & Income Fund (formerly Fidelity Series Mega Cap Fund) | 2.5 | 1.6 |
Fidelity Series Intrinsic Opportunities Fund | 4.2 | 2.9 |
Fidelity Series Large Cap Value Fund | 4.4 | 5.4 |
Fidelity Series Opportunistic Insights Fund | 4.4 | 3.3 |
Fidelity Series Real Estate Equity Fund | 0.9 | 1.1 |
Fidelity Series Small Cap Opportunities Fund | 2.2 | 2.5 |
Fidelity Series Stock Selector Large Cap Value Fund | 4.9 | 4.5 |
Fidelity Small Cap Growth Fund | 1.2 | 1.3 |
Fidelity Small Cap Value Fund | 1.1 | 1.4 |
| 56.0 | 56.3 |
Developed International Equity Funds | | |
Fidelity Series International Growth Fund | 8.6 | 8.5 |
Fidelity Series International Small Cap Fund | 1.8 | 1.7 |
Fidelity Series International Value Fund | 8.6 | 8.3 |
| 19.0 | 18.5 |
Emerging Markets Equity Funds | | |
Fidelity Series Emerging Markets Fund | 5.6 | 5.3 |
High Yield Bond Funds | | |
Fidelity Series Emerging Markets Debt Fund | 0.7 | 0.6 |
Fidelity Series Floating Rate High Income Fund | 0.0* | 0.0* |
Fidelity Series High Income Fund | 9.0 | 9.2 |
Fidelity Series Real Estate Income Fund | 0.3 | 0.2 |
| 10.0 | 10.0 |
Investment Grade Bond Funds | | |
Fidelity Series Investment Grade Bond Fund | 0.1 | 0.1 |
Net Other Assets (Liabilities) | 0.0 | 0.0 |
| 100.0 | 100.0 |
* Amount represents less than 0.1% |
Asset Allocation (% of fund's net assets) |
Period end |
| Commodity Funds | 9.3% | |
| Domestic Equity Funds | 56.0% | |
| Developed International Equity Funds | 19.0% | |
| Emerging Markets Equity Funds | 5.6% | |
| High Yield Bond Funds | 10.0% | |
| Investment Grade Bond Funds | 0.1% | |

Six months ago |
| Commodity Funds | 9.8% | |
| Domestic Equity Funds | 56.3% | |
| Developed International Equity Funds | 18.5% | |
| Emerging Markets Equity Funds | 5.3% | |
| High Yield Bond Funds | 10.0% | |
| Investment Grade Bond Funds | 0.1% | |

Semiannual Report
Fidelity Freedom 2055 Fund
Investments September 30, 2013 (Unaudited)
Showing Percentage of Net Assets
Domestic Equity Funds - 65.3% |
| Shares | | Value |
Commodity Funds - 9.3% |
Fidelity Series Commodity Strategy Fund (a)(b) | 2,938,345 | | $ 23,536,143 |
Domestic Equity Funds - 56.0% |
Fidelity Blue Chip Growth Fund (b) | 276,742 | | 16,164,472 |
Fidelity Growth Company Fund (b) | 167,575 | | 19,902,855 |
Fidelity Series 100 Index Fund (b) | 424,977 | | 4,708,750 |
Fidelity Series All-Sector Equity Fund (b) | 1,476,553 | | 20,907,997 |
Fidelity Series Equity-Income Fund (b) | 1,226,685 | | 14,450,347 |
Fidelity Series Growth & Income Fund (b) | 527,897 | | 6,366,432 |
Fidelity Series Intrinsic Opportunities Fund (b) | 825,603 | | 10,716,326 |
Fidelity Series Large Cap Value Fund (b) | 875,113 | | 11,052,676 |
Fidelity Series Opportunistic Insights Fund (b) | 862,134 | | 11,095,659 |
Fidelity Series Real Estate Equity Fund (b) | 187,181 | | 2,238,689 |
Fidelity Series Small Cap Opportunities Fund (b) | 441,899 | | 5,669,569 |
Fidelity Series Stock Selector Large Cap Value Fund (b) | 1,015,775 | | 12,372,136 |
Fidelity Small Cap Growth Fund (b) | 158,339 | | 2,960,939 |
Fidelity Small Cap Value Fund (b) | 153,848 | | 2,920,031 |
TOTAL DOMESTIC EQUITY FUNDS | | 141,526,878 |
TOTAL DOMESTIC EQUITY FUNDS (Cost $150,338,813) |
165,063,021
|
International Equity Funds - 24.6% |
| | | |
Developed International Equity Funds - 19.0% |
Fidelity Series International Growth Fund (b) | 1,606,377 | | 21,798,537 |
Fidelity Series International Small Cap Fund (b) | 289,187 | | 4,421,676 |
Fidelity Series International Value Fund (b) | 2,024,832 | | 21,766,943 |
TOTAL DEVELOPED INTERNATIONAL EQUITY FUNDS | | 47,987,156 |
|
| Shares | | Value |
Emerging Markets Equity Funds - 5.6% |
Fidelity Series Emerging Markets Fund (b) | 846,542 | | $ 14,171,119 |
TOTAL INTERNATIONAL EQUITY FUNDS (Cost $55,821,862) |
62,158,275
|
Bond Funds - 10.1% |
| | | |
High Yield Bond Funds - 10.0% |
Fidelity Series Emerging Markets Debt Fund (b) | 172,110 | | 1,741,757 |
Fidelity Series Floating Rate High Income Fund (b) | 2,407 | | 25,471 |
Fidelity Series High Income Fund (b) | 2,213,187 | | 22,751,558 |
Fidelity Series Real Estate Income Fund (b) | 60,692 | | 666,393 |
TOTAL HIGH YIELD BOND FUNDS | | 25,185,179 |
Investment Grade Bond Funds - 0.1% |
Fidelity Series Investment Grade Bond Fund (b) | 20,885 | | 233,708 |
TOTAL BOND FUNDS (Cost $25,449,590) |
25,418,887
|
TOTAL INVESTMENT PORTFOLIO - 100.0% (Cost $231,610,265) | | 252,640,183 |
NET OTHER ASSETS (LIABILITIES) - 0.0% | | 0 |
NET ASSETS - 100% | $ 252,640,183 |
Legend |
(a) Non-income producing |
(b) Affiliated company |
Affiliated Underlying Funds |
Information regarding the Fund's fiscal year to date purchases and sales of the affiliated Underlying Funds and income earned by the Fund from investments in affiliated Underlying Funds is as follows: |
Affiliate | Value,
beginning of
period | Purchases | Sales
Proceeds | Dividend
Income | Value,
end of
period |
Fidelity Blue Chip Growth Fund | $ 9,879,288 | $ 5,868,766 | $ 604,233 | $ 36,485 | $ 16,164,472 |
Fidelity Disciplined Equity Fund | 2,125,234 | 114,102 | 2,348,947 | - | - |
Fidelity Growth Company Fund | 13,077,158 | 5,738,649 | 1,477,309 | - | 19,902,855 |
Fidelity Series 100 Index Fund | 3,476,555 | 1,344,316 | 384,484 | - | 4,708,750 |
Fidelity Series All-Sector Equity Fund | 14,517,243 | 5,840,683 | 1,140,058 | - | 20,907,997 |
Fidelity Series Commodity Strategy Fund | 15,240,996 | 10,632,974 | 924,310 | - | 23,536,143 |
Fidelity Series Emerging Markets Debt Fund | 956,671 | 948,793 | 60,836 | 36,236 | 1,741,757 |
Fidelity Series Emerging Markets Fund | 8,190,722 | 6,370,995 | 534,771 | - | 14,171,119 |
Fidelity Series Equity-Income Fund | 7,029,662 | 7,362,765 | 505,141 | 97,335 | 14,450,347 |
Fidelity Series Floating Rate High Income Fund | 5,037 | 21,279 | 694 | 357 | 25,471 |
Fidelity Series Growth & Income Fund (formerly Fidelity Series Mega Cap Fund) | 2,567,293 | 3,642,958 | 203,478 | - | 6,366,432 |
Fidelity Series High Income Fund | 14,299,373 | 9,825,289 | 963,359 | 485,296 | 22,751,558 |
Fidelity Series International Growth Fund | 13,093,510 | 8,172,853 | 806,193 | - | 21,798,537 |
Fidelity Series International Small Cap Fund | 2,643,631 | 1,544,951 | 164,217 | - | 4,421,676 |
Fidelity Series International Value Fund | 12,932,413 | 8,039,267 | 809,082 | - | 21,766,943 |
Fidelity Series Intrinsic Opportunities Fund | 4,477,624 | 5,692,252 | 464,004 | 60,945 | 10,716,326 |
Fidelity Series Investment Grade Bond Fund | 128,171 | 120,162 | 10,007 | 1,887 | 233,708 |
Fidelity Series Large Cap Value Fund | 8,323,887 | 3,110,695 | 1,149,704 | - | 11,052,676 |
Fidelity Series Opportunistic Insights Fund | 5,158,995 | 4,948,342 | 373,784 | - | 11,095,659 |
Fidelity Series Real Estate Equity Fund | 1,659,671 | 906,452 | 156,493 | 13,005 | 2,238,689 |
Fidelity Series Real Estate Income Fund | 359,892 | 366,641 | 23,774 | 16,982 | 666,393 |
Fidelity Series Small Cap Opportunities Fund | 3,818,377 | 1,981,541 | 285,363 | - | 5,669,569 |
Fidelity Series Stock Selector Large Cap Value Fund | 7,059,938 | 5,188,116 | 672,311 | - | 12,372,136 |
Fidelity Small Cap Growth Fund | 2,004,111 | 1,054,254 | 156,745 | - | 2,960,939 |
Fidelity Small Cap Value Fund | 2,116,481 | 981,800 | 183,114 | 4,430 | 2,920,031 |
Total | $ 155,141,933 | $ 99,818,895 | $ 14,402,411 | $ 752,958 | $ 252,640,183 |
Other Information |
All investments are categorized as Level 1 under the Fair Value Hierarchy. The inputs or methodology used for valuing securities may not be an indication of the risk associated with investing in those securities. For more information on valuation inputs, please refer to the Investment Valuation section in the accompanying Notes to Financial Statements. |
See accompanying notes which are an integral part of the financial statements.
Semiannual Report
Fidelity Freedom 2055 Fund
Statement of Assets and Liabilities
| September 30, 2013 (Unaudited) |
| | |
Assets | | |
Investment in securities, at value (cost $231,610,265) - See accompanying schedule | | $ 252,640,183 |
Receivable for fund shares sold | | 1,607,595 |
Total assets | | 254,247,778 |
| | |
Liabilities | | |
Payable for investments purchased | $ 619,449 | |
Payable for fund shares redeemed | 988,146 | |
Total liabilities | | 1,607,595 |
| | |
Net Assets | | $ 252,640,183 |
Net Assets consist of: | | |
Paid in capital | | $ 229,018,764 |
Undistributed net investment income | | 741,727 |
Accumulated undistributed net realized gain (loss) on investments | | 1,849,774 |
Net unrealized appreciation (depreciation) on investments | | 21,029,918 |
Net Assets, for 22,580,639 shares outstanding | | $ 252,640,183 |
Net Asset Value, offering price and redemption price per share ($252,640,183 ÷ 22,580,639 shares) | | $ 11.19 |
Statement of Operations
Six months ended September 30, 2013 (Unaudited) |
| | |
Investment Income | | |
Income distributions from underlying funds | | $ 752,958 |
| | |
Expenses | | |
Independent trustees' compensation | $ 350 | |
Total expenses before reductions | 350 | |
Expense reductions | (350) | - |
Net investment income (loss) | | 752,958 |
Realized and Unrealized Gain (Loss) Realized gain (loss) on sale of underlying fund shares | 264,019 | |
Capital gain distributions from underlying funds | 1,867,474 | |
Total net realized gain (loss) | | 2,131,493 |
Change in net unrealized appreciation (depreciation) on underlying funds | | 11,817,747 |
Net gain (loss) | | 13,949,240 |
Net increase (decrease) in net assets resulting from operations | | $ 14,702,198 |
See accompanying notes which are an integral part of the financial statements.
Semiannual Report
Fidelity Freedom 2055 Fund
Financial Statements - continued
Statement of Changes in Net Assets
| Six months ended
September 30, 2013
(Unaudited) | Year ended
March 31,
2013 |
Increase (Decrease) in Net Assets | | |
Operations | | |
Net investment income (loss) | $ 752,958 | $ 1,545,566 |
Net realized gain (loss) | 2,131,493 | 2,121,562 |
Change in net unrealized appreciation (depreciation) | 11,817,747 | 8,820,646 |
Net increase (decrease) in net assets resulting from operations | 14,702,198 | 12,487,774 |
Distributions to shareholders from net investment income | (200,366) | (1,376,832) |
Distributions to shareholders from net realized gain | (2,170,611) | (357,234) |
Total distributions | (2,370,977) | (1,734,066) |
Share transactions
Proceeds from sales of shares | 128,802,653 | 175,712,102 |
Reinvestment of distributions | 2,368,698 | 1,733,331 |
Cost of shares redeemed | (46,004,322) | (54,035,538) |
Net increase (decrease) in net assets resulting from share transactions | 85,167,029 | 123,409,895 |
Total increase (decrease) in net assets | 97,498,250 | 134,163,603 |
| | |
Net Assets | | |
Beginning of period | 155,141,933 | 20,978,330 |
End of period (including undistributed net investment income of $741,727 and undistributed net investment income of $189,135, respectively) | $ 252,640,183 | $ 155,141,933 |
Other Information Shares | | |
Sold | 11,932,555 | 17,794,776 |
Issued in reinvestment of distributions | 219,527 | 178,383 |
Redeemed | (4,265,554) | (5,425,829) |
Net increase (decrease) | 7,886,528 | 12,547,330 |
Financial Highlights
| Six months ended
September 30, 2013 | Years ended March 31, |
| (Unaudited) | 2013 | 2012 G |
Selected Per-Share Data | | | |
Net asset value, beginning of period | $ 10.56 | $ 9.77 | $ 10.00 |
Income from Investment Operations | | | |
Net investment income (loss) D | .04 | .20 | .13 |
Net realized and unrealized gain (loss) | .73 | .80 | (.12) |
Total from investment operations | .77 | 1.00 | .01 |
Distributions from net investment income | (.01) | (.14) | (.11) |
Distributions from net realized gain | (.13) | (.06) | (.13) |
Total distributions | (.14) | (.21) I | (.24) |
Net asset value, end of period | $ 11.19 | $ 10.56 | $ 9.77 |
Total Return B, C | 7.36% | 10.39% | .32% |
Ratios to Average Net Assets E, H | | | |
Expenses before reductions F | .00% A | .00% | .00% A |
Expenses net of fee waivers, if any | .00% A | .00% | .00% A |
Expenses net of all reductions | .00% A | .00% | .00% A |
Net investment income (loss) | .74% A | 1.99% | 1.69% A |
Supplemental Data | | | |
Net assets, end of period (000 omitted) | $ 252,640 | $ 155,142 | $ 20,978 |
Portfolio turnover rate E | 14% A | 45% | 8% A |
A Annualized
B Total returns for periods of less than one year are not annualized.
C Total returns would have been lower if certain expenses had not been reduced during the applicable periods shown.
D Calculated based on average shares outstanding during the period.
E Amounts do not include the activity of the Underlying Funds.
F Amount represents less than .01%.
G For the period June 1, 2011 (commencement of operations) to March 31, 2012.
H Expense ratios reflect operating expenses of the Fund. Expenses before reductions do not reflect amounts reimbursed by the investment adviser or reductions from expense offset arrangements and do not represent the amount paid by the Fund during periods when reimbursements or reductions occur. Expenses net of fee waivers reflect expenses after reimbursement by the investment adviser but prior to reductions from expense offset arrangements. Expenses net of all reductions represent the net expenses paid by the Fund but do not include expenses of the investment companies in which the Fund invests.
I Total distributions of $.21 per share is comprised of distributions from net investment income of $.141 and distributions from net realized gain of $.064 per share.
See accompanying notes which are an integral part of the financial statements.
Semiannual Report
Notes to Financial Statements
For the period ended September 30, 2013 (Unaudited)
1. Organization.
Freedom Income Fund, Freedom 2000 Fund, Freedom 2005 Fund, Freedom 2010 Fund, Freedom 2015 Fund, Freedom 2020 Fund, Freedom 2025 Fund, Freedom 2030 Fund, Freedom 2035 Fund, Freedom 2040 Fund, Freedom 2045 Fund, Freedom 2050 Fund, and Freedom 2055 Fund (the Funds) are funds of Fidelity Aberdeen Street Trust (the Trust). The Trust is registered under the Investment Company Act of 1940, as amended (the 1940 Act), as an open-end management investment company organized as a Delaware statutory trust. Each Fund is authorized to issue an unlimited number of shares. The Funds invest primarily in a combination of other Fidelity equity, bond, and short-term funds (the Underlying Funds) managed by Fidelity Management & Research Company (FMR).
2. Significant Accounting Policies.
The financial statements have been prepared in conformity with accounting principles generally accepted in the United States of America (GAAP), which require management to make certain estimates and assumptions at the date of the financial statements. Actual results could differ from those estimates. Subsequent events, if any, through the date that the financial statements were issued have been evaluated in the preparation of the financial statements. The following summarizes the significant accounting policies of the Funds:
Investment Valuation. Investments are valued as of 4:00 p.m. Eastern time on the last calendar day of the period. Each Fund categorizes the inputs to valuation techniques used to value its investments into a disclosure hierarchy consisting of three levels as shown below:
Level 1 - quoted prices in active markets for identical investments
Level 2 - other significant observable inputs (including quoted prices for similar investments, interest rates, prepayment speeds, etc.)
Level 3 - unobservable inputs (including the Fund's own assumptions based on the best information available)
Valuation techniques used to value each Fund's investments by major category are as follows. Investments in the Underlying Funds are valued at their closing net asset value (NAV) each business day and are categorized as Level 1 in the hierarchy.
Investment Transactions and Income. For financial reporting purposes, the Funds' investment holdings and NAV include trades executed through the end of the last business day of the period. The NAV per share for processing shareholder transactions is calculated as of the close of business of the New York Stock Exchange (NYSE), normally 4:00 p.m. Eastern time and includes trades executed through the end of the prior business day. Gains and losses on securities sold are determined on the basis of identified cost. Income and capital gain distributions from the Underlying Funds, if any, are recorded on the ex-dividend date.
Expenses. Expenses directly attributable to a fund are charged to that fund. Expenses attributable to more than one fund are allocated among the respective funds on the basis of relative net assets or other appropriate methods. Expenses included in the accompanying financial statements reflect the expenses of each Fund and do not include any expenses associated with the Underlying Funds. Although not included in each Fund's expenses, each Fund indirectly bears its proportionate share of the Underlying Funds' expenses through the impact of these expenses on each Underlying Fund's NAV. Expense estimates are accrued in the period to which they relate and adjustments are made when actual amounts are known.
Deferred Trustee Compensation. Under a Deferred Compensation Plan (the Plan) for Freedom 2010 Fund, Freedom 2020 Fund and Freedom 2030 Fund, independent Trustees may elect to defer receipt of a portion of their annual compensation. Deferred amounts are invested in a cross-section of Fidelity funds, are marked-to-market and remain in the Fund until distributed in accordance with the Plan. The investment of deferred amounts and the offsetting payable to the Trustees are included in the accompanying Statement of Assets and Liabilities.
Income Tax Information and Distributions to Shareholders. Each year, each Fund intends to qualify as a regulated investment company under Subchapter M of the Internal Revenue Code, including distributing substantially all of its taxable income and realized gains. As a result, no provision for U.S. Federal income taxes is required. Each Fund files a U.S. federal tax return, in addition to state and local tax returns as required. The Fund's federal income tax returns are subject to examination by the Internal Revenue Service (IRS) for a period of three fiscal years after they are filed. State and local tax returns may be subject to examination for an additional fiscal year depending on the jurisdiction.
Distributions are declared and recorded on the ex-dividend date. Income and capital gain distributions are determined in accordance with income tax regulations, which may differ from GAAP.
Capital accounts within the financial statements are adjusted for permanent book-tax differences. These adjustments have no impact on net assets or the results of operations. Temporary book-tax differences will reverse in a subsequent period.
Book-tax differences are primarily due to the short-term gain distributions from the Underlying Funds, deferred trustees compensation, capital loss carryforwards and losses deferred due to wash sales and excise tax regulations.
Semiannual Report
2. Significant Accounting Policies - continued
Income Tax Information and Distributions to Shareholders - continued
The federal tax cost of investment securities and unrealized appreciation (depreciation) as of period end were as follows for each Fund:
| Tax cost | Gross unrealized
appreciation | Gross unrealized
depreciation | Net unrealized
appreciation
(depreciation) on
securities and
other investments |
Freedom Income | $ 1,913,520,926 | $ 147,030,569 | $ (16,095,748) | $ 130,934,821 |
Freedom 2000 | 852,572,106 | 66,162,181 | (7,276,559) | 58,885,622 |
Freedom 2005 | 660,525,038 | 33,185,890 | (16,337,999) | 16,847,891 |
Freedom 2010 | 5,350,872,983 | 418,431,837 | (154,627,365) | 263,804,472 |
Freedom 2015 | 5,954,539,234 | 614,084,507 | (146,218,347) | 467,866,160 |
Freedom 2020 | 12,425,669,521 | 1,429,183,890 | (345,487,396) | 1,083,696,494 |
Freedom 2025 | 7,781,313,916 | 1,039,338,729 | (205,996,484) | 833,342,245 |
Freedom 2030 | 10,017,784,500 | 1,320,161,728 | (338,165,789) | 981,995,939 |
Freedom 2035 | 5,323,047,478 | 838,734,043 | (166,585,900) | 672,148,143 |
Freedom 2040 | 6,360,105,445 | 972,378,123 | (227,036,303) | 745,341,820 |
Freedom 2045 | 2,298,851,818 | 526,186,726 | (68,881,572) | 457,305,154 |
Freedom 2050 | 1,916,860,740 | 430,098,089 | (62,164,839) | 367,933,250 |
Freedom 2055 | 232,062,997 | 23,325,030 | (2,747,844) | 20,577,186 |
Capital loss carryforwards are only available to offset future capital gains of the Funds to the extent provided by regulations and may be limited. Under the Regulated Investment Company Modernization Act of 2010 (the Act), the Funds are permitted to carry forward capital losses incurred in taxable years beginning after December 22, 2010 for an unlimited period and such capital losses are required to be used prior to any losses that expire. The capital loss carryforward information presented below, including any applicable limitation, is estimated as of fiscal period end and is subject to adjustment.
| Fiscal year of expiration | |
| 2018 | 2019 | Total capital loss
carryforward |
Freedom 2005 | $ (23,400,318) | $ - | $ (23,400,318) |
Freedom 2010 | (162,610,190) | - | (162,610,190) |
Freedom 2030 | - | (109,107,545) | (109,107,545) |
3. Purchases and Sales of Investments.
Purchases and redemptions of the Underlying Fund shares are noted in the table below.
| Purchases ($) | Redemptions ($) |
Freedom Income | 57,855,886 | 206,732,071 |
Freedom 2000 | 24,880,213 | 117,632,774 |
Freedom 2005 | 50,946,004 | 86,239,234 |
Freedom 2010 | 264,788,451 | 648,878,512 |
Freedom 2015 | 383,498,049 | 610,854,853 |
Freedom 2020 | 884,981,443 | 1,305,849,857 |
Freedom 2025 | 788,275,827 | 713,728,969 |
Freedom 2030 | 844,041,298 | 922,264,174 |
Freedom 2035 | 594,362,297 | 546,433,875 |
Freedom 2040 | 565,673,569 | 585,697,729 |
Freedom 2045 | 353,888,708 | 222,270,328 |
Freedom 2050 | 273,468,966 | 179,757,208 |
Freedom 2055 | 99,818,895 | 14,402,411 |
4. Fees and Other Transactions with Affiliates.
Management Fee. Strategic Advisers, Inc. (Strategic Advisers), an affiliate of FMR, provides the Funds with investment management related services. The Funds do not pay any fees for these services.
Semiannual Report
Notes to Financial Statements (Unaudited) - continued
4. Fees and Other Transactions with Affiliates - continued
Other Transactions. Strategic Advisers has entered into an administration agreement with FMR under which FMR provides management and administrative services (other than investment advisory services) necessary for the operation of each Fund. Pursuant to this agreement, FMR pays all expenses of each Fund, excluding the compensation of the independent Trustees and certain other expenses such as interest expense. FMR also contracts with other Fidelity companies to perform the services necessary for the operation of each Fund. The Funds do not pay any fees for these services.
5. Expense Reductions.
FMR voluntarily agreed to reimburse each Fund's operating expenses. Some expenses, for example interest expense, are excluded from this reimbursement.
The following Funds were in reimbursement during the period:
| Reimbursement
from adviser |
Freedom Income | $ 3,992 |
Freedom 2000 | 1,812 |
Freedom 2005 | 1,302 |
Freedom 2010 | 10,814 |
Freedom 2015 | 12,081 |
Freedom 2020 | 25,268 |
Freedom 2025 | 15,550 |
Freedom 2030 | 20,031 |
Freedom 2035 | 10,728 |
Freedom 2040 | 12,797 |
Freedom 2045 | 4,795 |
Freedom 2050 | 3,981 |
Freedom 2055 | 350 |
6. Other.
The Funds' organizational documents provide former and current trustees and officers with a limited indemnification against liabilities arising in connection with the performance of their duties to the Funds. In the normal course of business, the Funds may also enter into contracts that provide general indemnifications. The Funds' maximum exposure under these arrangements is unknown as this would be dependent on future claims that may be made against the Funds. The risk of material loss from such claims is considered remote.
The Funds do not invest in the Underlying Funds for the purpose of exercising management or control; however, investments by the Funds within their principal investment strategies may represent a significant portion of the Underlying Fund's net assets. At the end of the period, the following Freedom Funds were the owners of record of 10% or more of the total outstanding shares of the Underlying Funds.
Fund | Freedom 2020 |
Fidelity Series Inflation-Protected Bond Index Fund | 13% |
Fidelity Series Investment Grade Bond Fund | 11% |
The Funds, in aggregate, were the owners of record of more than 20% of the total outstanding shares of the following Underlying Funds.
Fund | % of shares held |
Fidelity Series 100 Index Fund | 40% |
Fidelity Series All-Sector Equity Fund | 38% |
Fidelity Series Commodity Strategy Fund | 36% |
Fidelity Series Emerging Markets Debt Fund | 40% |
Fidelity Series Emerging Markets Fund | 39% |
Fidelity Series Equity-Income Fund | 44% |
Fidelity Series Floating Rate High Income Fund | 41% |
Fidelity Series Growth and Income Fund | 44% |
Fidelity Series High Income Fund | 39% |
Fidelity Series Inflation-Protected Bond Index Fund | 40% |
Semiannual Report
6. Other - continued
Fund | % of shares held |
Fidelity Series International Growth Fund | 39% |
Fidelity Series International Small Cap Fund | 39% |
Fidelity Series International Value Fund | 39% |
Fidelity Series Intrinsic Opportunities Fund | 44% |
Fidelity Series Investment Grade Bond Fund | 41% |
Fidelity Series Large Cap Value Fund | 38% |
Fidelity Series Opportunistic Insights Fund | 44% |
Fidelity Series Real Estate Equity Fund | 39% |
Fidelity Series Real Estate Income Fund | 40% |
Fidelity Series Small Cap Opportunities Fund | 36% |
Fidelity Series Stock Selector Large Cap Value Fund | 44% |
Fidelity Small Cap Growth Fund | 26% |
Subsequent to period end, the Funds redeemed all of their shares of the Fidelity Series Large Cap Value Fund.
Semiannual Report
Board Approval of Investment Advisory Contracts and Management Fees
Fidelity Freedom Funds
Each year, the Board of Trustees, including the Independent Trustees (together, the Board), votes on the renewal of the management contract (the Advisory Contract) with Strategic Advisers, Inc. (Strategic Advisers) and the administration agreement for each fund. The Board, assisted by the advice of fund counsel and Independent Trustees' counsel, requests and considers a broad range of information relevant to the renewal of the Advisory Contracts throughout the year.
The Board meets regularly and, at each of its meetings, covers an extensive agenda of topics and materials and considers factors that are relevant to its annual consideration of the renewal of each fund's Advisory Contract, including the services and support provided to each fund and its shareholders. The Board has established four standing committees, Operations, Audit, Fair Valuation, and Governance and Nominating, each composed of and chaired by Independent Trustees with varying backgrounds, to which the Board has assigned specific subject matter responsibilities in order to enhance effective decision-making by the Board. The Operations Committee, of which all of the Independent Trustees are members, meets regularly throughout the year and, among other matters, considers matters specifically related to the annual consideration of the renewal of each fund's Advisory Contract. The Board, acting directly and through its Committees, requests and receives information concerning the annual consideration of the renewal of each fund's Advisory Contract. The Board also meets as needed to consider matters specifically related to the Board's annual consideration of the renewal of Advisory Contracts. Members of the Board may also meet with trustees of other Fidelity funds through ad hoc joint committees to discuss certain matters relevant to the Fidelity funds.
At its September 2013 meeting, the Board, including the Independent Trustees, unanimously determined to renew each fund's Advisory Contract. In reaching its determination, the Board considered all factors it believed relevant and reached a determination, with the assistance of fund counsel and Independent Trustees' counsel and through the exercise of its business judgment, that the renewal of the Advisory Contract was in the best interests of each fund and its shareholders and the fact that no fees are payable under the Advisory Contracts was fair and reasonable. The Board's decision to renew the Advisory Contracts was not based on any single factor, but rather was based on a comprehensive consideration of all the information provided to the Board at its meetings throughout the year. In reaching its determination, the Board was aware that shareholders in each fund have a broad range of investment choices available to them, including a wide choice among mutual funds offered by Fidelity's competitors, and that each fund's shareholders, who have the opportunity to review and weigh the disclosure provided by the fund in its prospectus and other public disclosures, have chosen to invest in that fund, which is part of the Fidelity family of funds.
Nature, Extent, and Quality of Services Provided. The Board considered Fidelity's staffing, as it relates to the funds, including the backgrounds of investment personnel of Strategic Advisers, and also considered the funds' investment objectives, strategies, and related investment philosophies. The Independent Trustees also had discussions with senior management of Fidelity's investment operations and investment groups with responsibility for the underlying Fidelity funds in which each fund invests. The Board considered the structure of the portfolio manager compensation program and whether this structure provides appropriate incentives to act in the best interests of each fund.
Resources Dedicated to Investment Management and Support Services. The Board reviewed the general qualifications and capabilities of Fidelity's investment staff, including its size, education, experience, and resources, as well as Fidelity's approach to recruiting, managing, and compensating investment personnel. The Board noted that Fidelity has continued to increase the resources devoted to non-U.S. offices, including expansion of Fidelity's global investment organization. The Board also noted that Fidelity's analysts have extensive resources, tools and capabilities that allow them to conduct sophisticated quantitative and fundamental analysis, as well as credit analysis of issuers, counterparties and guarantors. Further, the Board believes that Fidelity's investment professionals have sufficient access to global information and data so as to provide competitive investment results over time, and that those professionals also have access to sophisticated tools that permit them to assess portfolio construction and risk and performance attribution characteristics continuously, as well as to transmit new information and research conclusions rapidly around the world. Additionally, in its deliberations, the Board considered Fidelity's risk management capabilities and resources, which are an integral part of the investment management process.
Shareholder and Administrative Services. The Board considered (i) the nature, extent, quality, and cost of advisory, administrative, and shareholder services performed by Fidelity affiliates under the Advisory Contract and the administration agreement and under separate agreements covering transfer agency and pricing and bookkeeping services for each fund; (ii) the nature and extent of the supervision of third party service providers, principally custodians and subcustodians; and (iii) the resources devoted to, and the record of compliance with, each fund's compliance policies and procedures.
The Board noted that the growth of fund assets over time across the complex allows Fidelity to reinvest in the development of services designed to enhance the value or convenience of the Fidelity funds as investment vehicles. These services include 24-hour access to account information and market information through telephone representatives and over the Internet, investor education materials and asset allocation tools, and the expanded availability of Fidelity Investor Centers.
Investment in a Large Fund Family. The Board considered the benefits to shareholders of investing in a Fidelity fund, including the benefits of investing in a fund that is part of a large family of funds offering a variety of investment disciplines and providing a large variety of mutual fund investor services. The Board noted that Fidelity had taken, or had made recommendations that resulted in the Fidelity funds taking, a number of actions over the previous year that benefited particular funds, including (i) continuing to dedicate additional resources to investment research and to the support of the senior management team that oversees asset management; (ii) persisting in efforts to enhance Fidelity's global research capabilities; (iii) launching new funds and making other enhancements to meet client needs for global and income-oriented solutions; (iv) continuing to launch dedicated lower cost underlying funds to meet portfolio construction needs related to expanding underlying fund options for Fidelity funds of funds, specifically for the Freedom Fund product lines; (v) rationalizing product lines and gaining increased efficiencies through the combination of several funds with other funds; (vi) strengthening Fidelity's index fund offerings by reducing investment minimums and adopting or lowering existing expense caps for certain funds and classes; (vii) enhancing Global Asset Allocation product offerings by launching new funds and strategies, including "open architecture" target date funds that utilize affiliated and unaffiliated sub-advisers; (viii) modifying the eligibility criteria for Institutional Class shares of Advisor funds to increase their marketability to a portion of the defined contribution plan market; (ix) creating a new low-cost retirement share class for certain Advisor funds to appeal to large retirement plans; (x) transitioning the management of certain Fidelity commodity funds to Geode Capital Management LLC, a registered commodity pool operator, while retaining administrative responsibilities for the funds; and (xi) taking steps toward establishing a new Fidelity adviser to manage sector-based funds and products.
Semiannual Report
Investment Performance. The Board considered whether each fund has operated in accordance with its investment objective, as well as its record of compliance with its investment restrictions and its performance history.
The Board took into account discussions with the investment adviser about fund investment performance that occur at Board meetings throughout the year. In this regard the Board noted that as part of regularly scheduled fund reviews and other reports to the Board on fund performance, the Board periodically considers annualized return information for each fund for different time periods, measured against one or more securities market indices, including a customized blended index representative of the fund's asset classes (each a "benchmark index") and a peer group of mutual funds with similar objectives ("peer group"). In its evaluation of fund investment performance at meetings throughout the year, the Board gave particular attention to information indicating underperformance of certain Fidelity funds for specific time periods and the investment adviser's explanations for such underperformance.
In addition to reviewing absolute and relative fund performance, the Independent Trustees periodically consider the appropriateness of fund performance metrics in evaluating the results achieved. In general, the Independent Trustees believe that fund performance should be evaluated based on gross performance (before fees and expenses, including acquired fund fees and expenses, but after transaction costs, if any) compared to appropriate benchmark indices, over appropriate time periods that may include full market cycles, and on net performance (after fees and expenses) compared to peer groups, as applicable, over the same periods, taking into account relevant factors including the following: general market conditions; the extent to which particular underlying funds affected performance; and fund cash flows and other factors. Depending on the circumstances, the Independent Trustees may be satisfied with a fund's performance notwithstanding that it lags its benchmark index or peer group for certain periods.
The Independent Trustees recognize that shareholders evaluate performance on a net basis over their own holding periods, for which one-, three-, and five-year periods are often used as a proxy. For this reason, the performance information reviewed by the Board also included net cumulative calendar year total return information for each fund and an appropriate benchmark index for the most recent one-, three-, and five-year periods (for the most recent one-year period for Fidelity Freedom 2055 Fund).
Based on its review, the Board concluded that the nature, extent, and quality of services provided to each fund under the Advisory Contract should benefit each fund's shareholders.
Competitiveness of Management Fee and Total Expense Ratio. The Board noted that the funds do not pay Strategic Advisers a management fee for investment advisory services. The Board considered each fund's management fee and total expense ratio compared to "mapped groups" of competitive funds and classes, and also considered that each fund bears indirectly the expenses of the underlying Fidelity funds in which it invests. Fidelity creates "mapped groups" by combining similar Lipper investment objective categories that have comparable investment mandates. Combining Lipper investment objective categories aids the Board's management fee and total expense ratio comparisons by broadening the competitive group used for comparison and by reducing the number of universes to which various Fidelity funds are compared.
Management Fee. The Board considered two proprietary management fee comparisons for the 12-month (or shorter) periods shown in the charts below. The group of Lipper funds used by the Board for management fee comparisons is referred to below as the "Total Mapped Group." The Total Mapped Group comparison focuses on a fund's standing in terms of gross management fees before expense reimbursements or caps relative to the total universe of funds with comparable investment mandates, regardless of whether their management fee structures also are comparable. "TMG %" represents the percentage of funds in the Total Mapped Group that had management fees that were lower than a fund's. For example, a hypothetical TMG % of 50% would mean that half of the funds in the Total Mapped Group had higher, and half had lower, management fees than a fund. The funds' actual TMG %s are in the charts below. The "Asset-Size Peer Group" (ASPG) comparison focuses on a fund's standing relative to a subset of non-Fidelity funds within the Total Mapped Group that are similar in size and management fee structure. For example, if a fund is in the first quartile of the ASPG, the fund's management fee ranks in the least expensive or lowest 25% of funds in the ASPG. The ASPG represents at least 15% of the funds in the Total Mapped Group with comparable asset size and management fee structures, subject to a minimum of 50 funds (or all funds in the Total Mapped Group if fewer than 50). Additional information, such as the ASPG quartile in which a fund's management fee rate ranked, is also included in the charts and considered by the Board.
Semiannual Report
Board Approval of Investment Advisory Contracts and Management Fees - continued
Freedom 2000 Fund

Freedom 2005 Fund
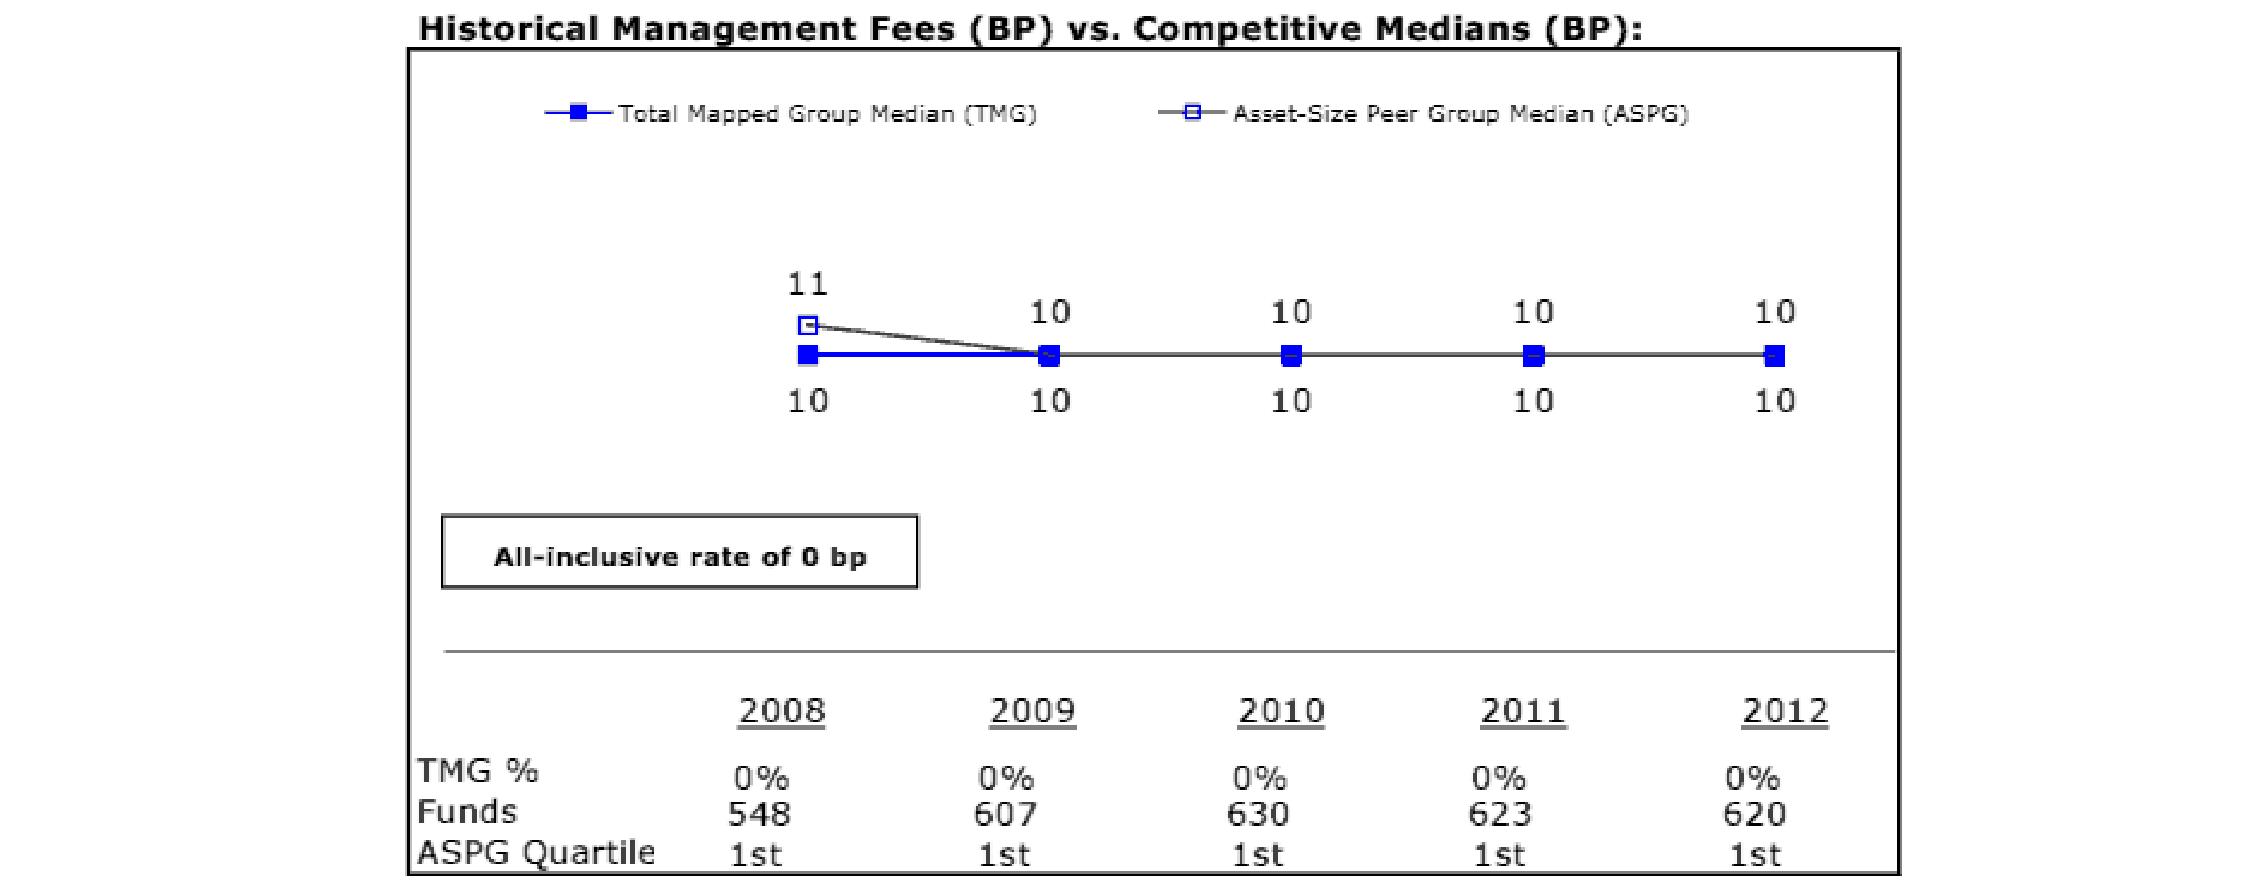
Semiannual Report
Freedom 2010 Fund
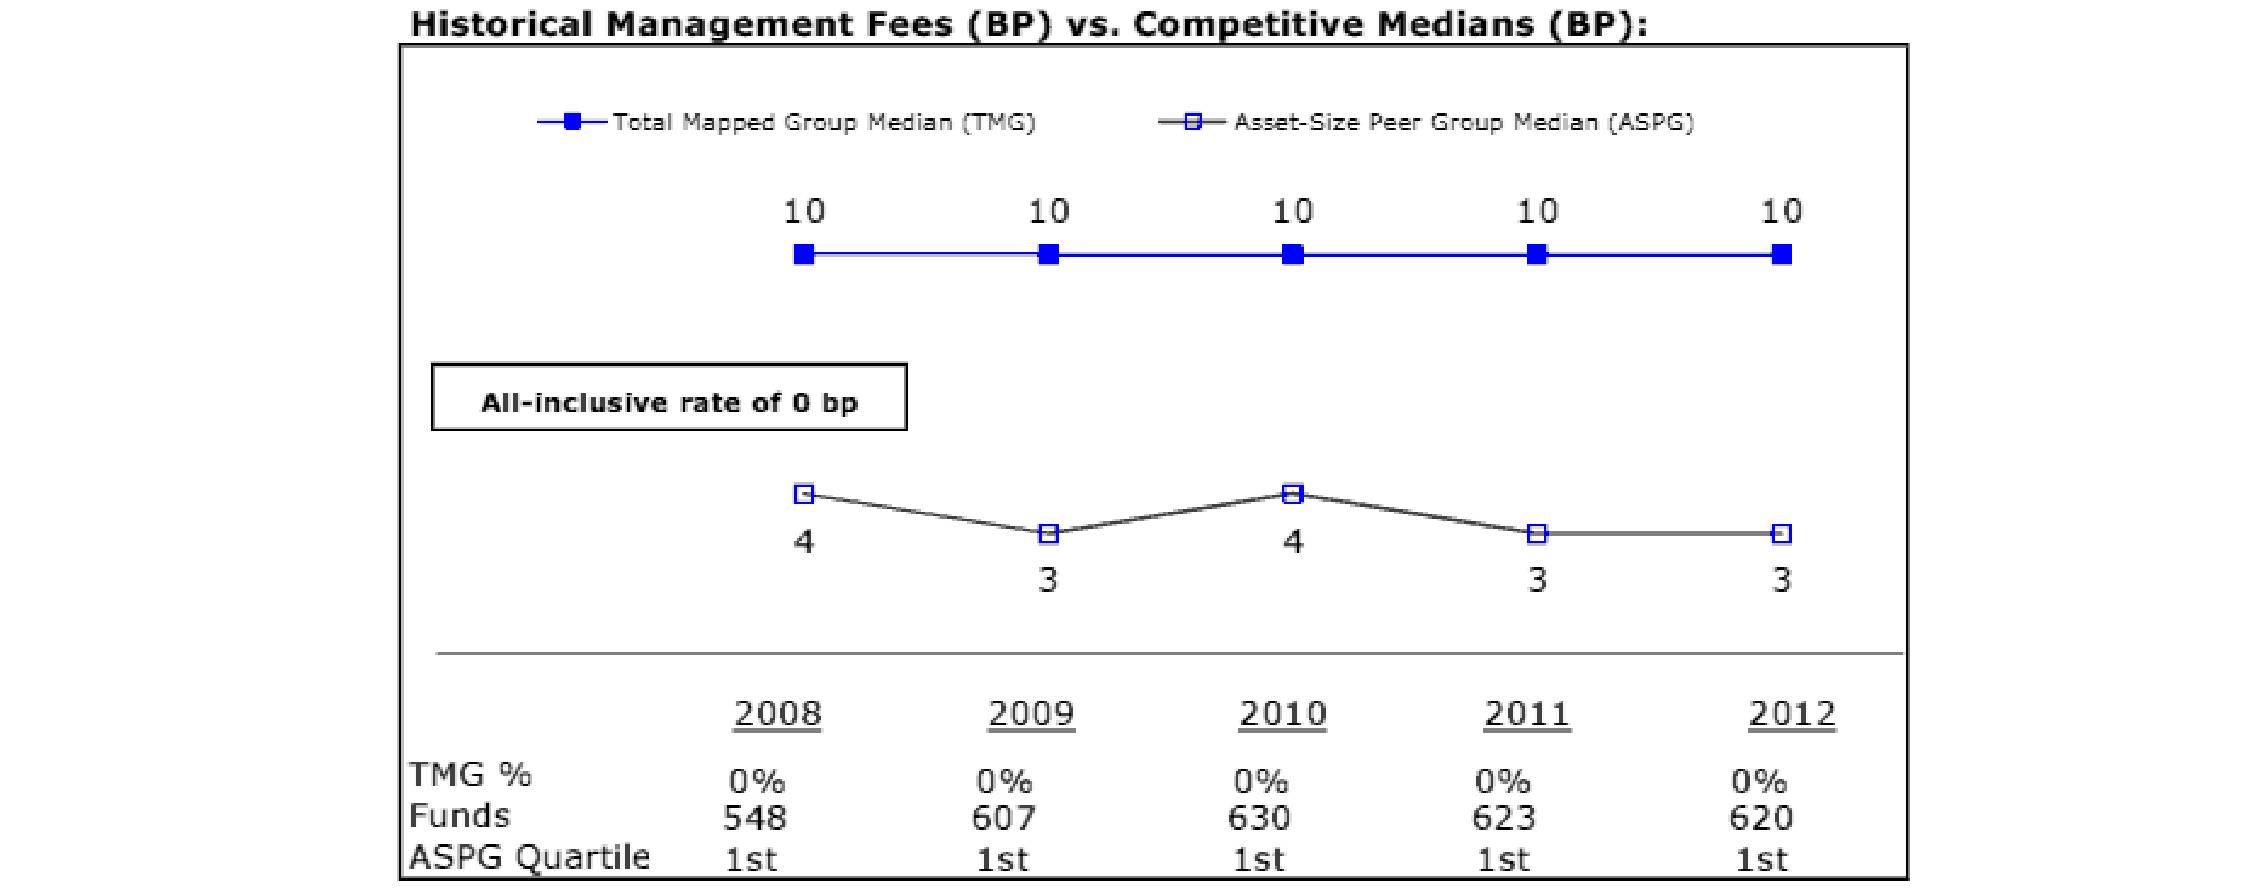
Freedom 2015 Fund
Semiannual Report
Board Approval of Investment Advisory Contracts and Management Fees - continued
Freedom 2020 Fund

Freedom 2025 Fund
Semiannual Report
Freedom 2030 Fund

Freedom 2035 Fund
Semiannual Report
Board Approval of Investment Advisory Contracts and Management Fees - continued
Freedom 2040 Fund
Freedom 2045 Fund
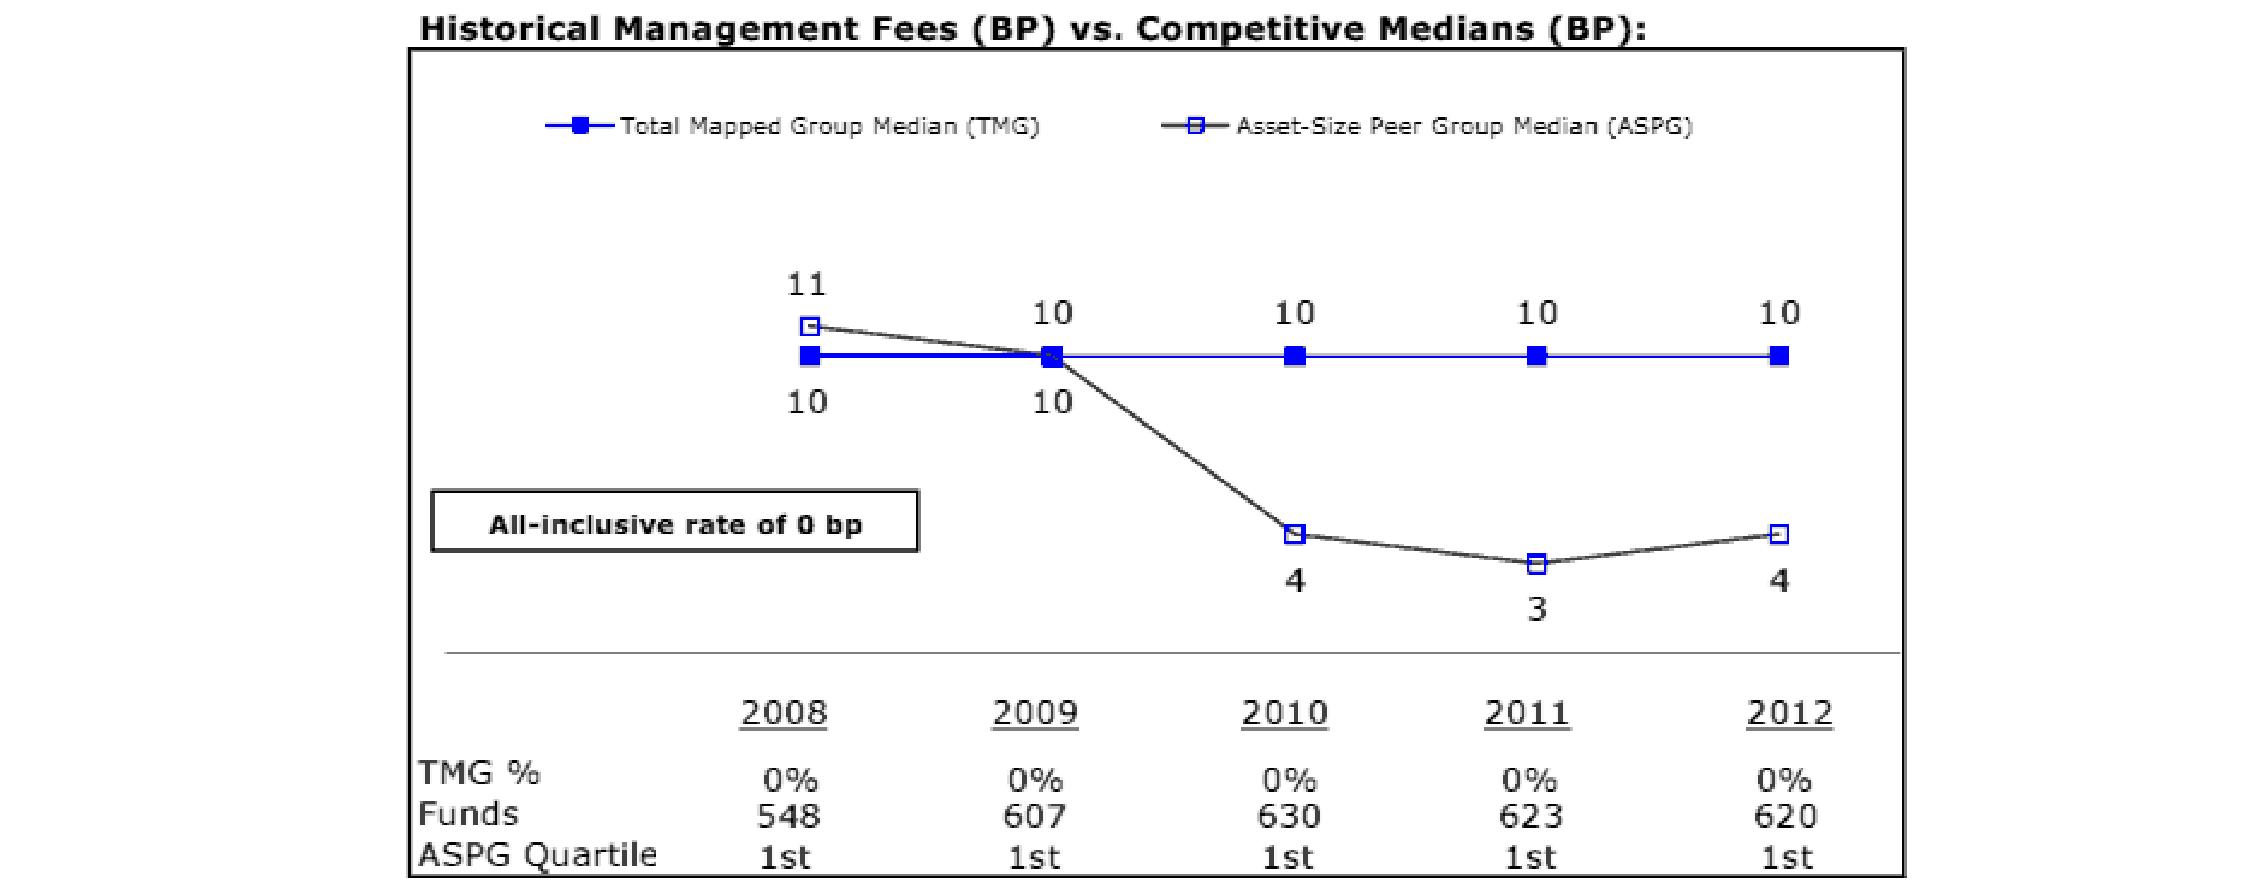
Semiannual Report
Freedom 2050 Fund
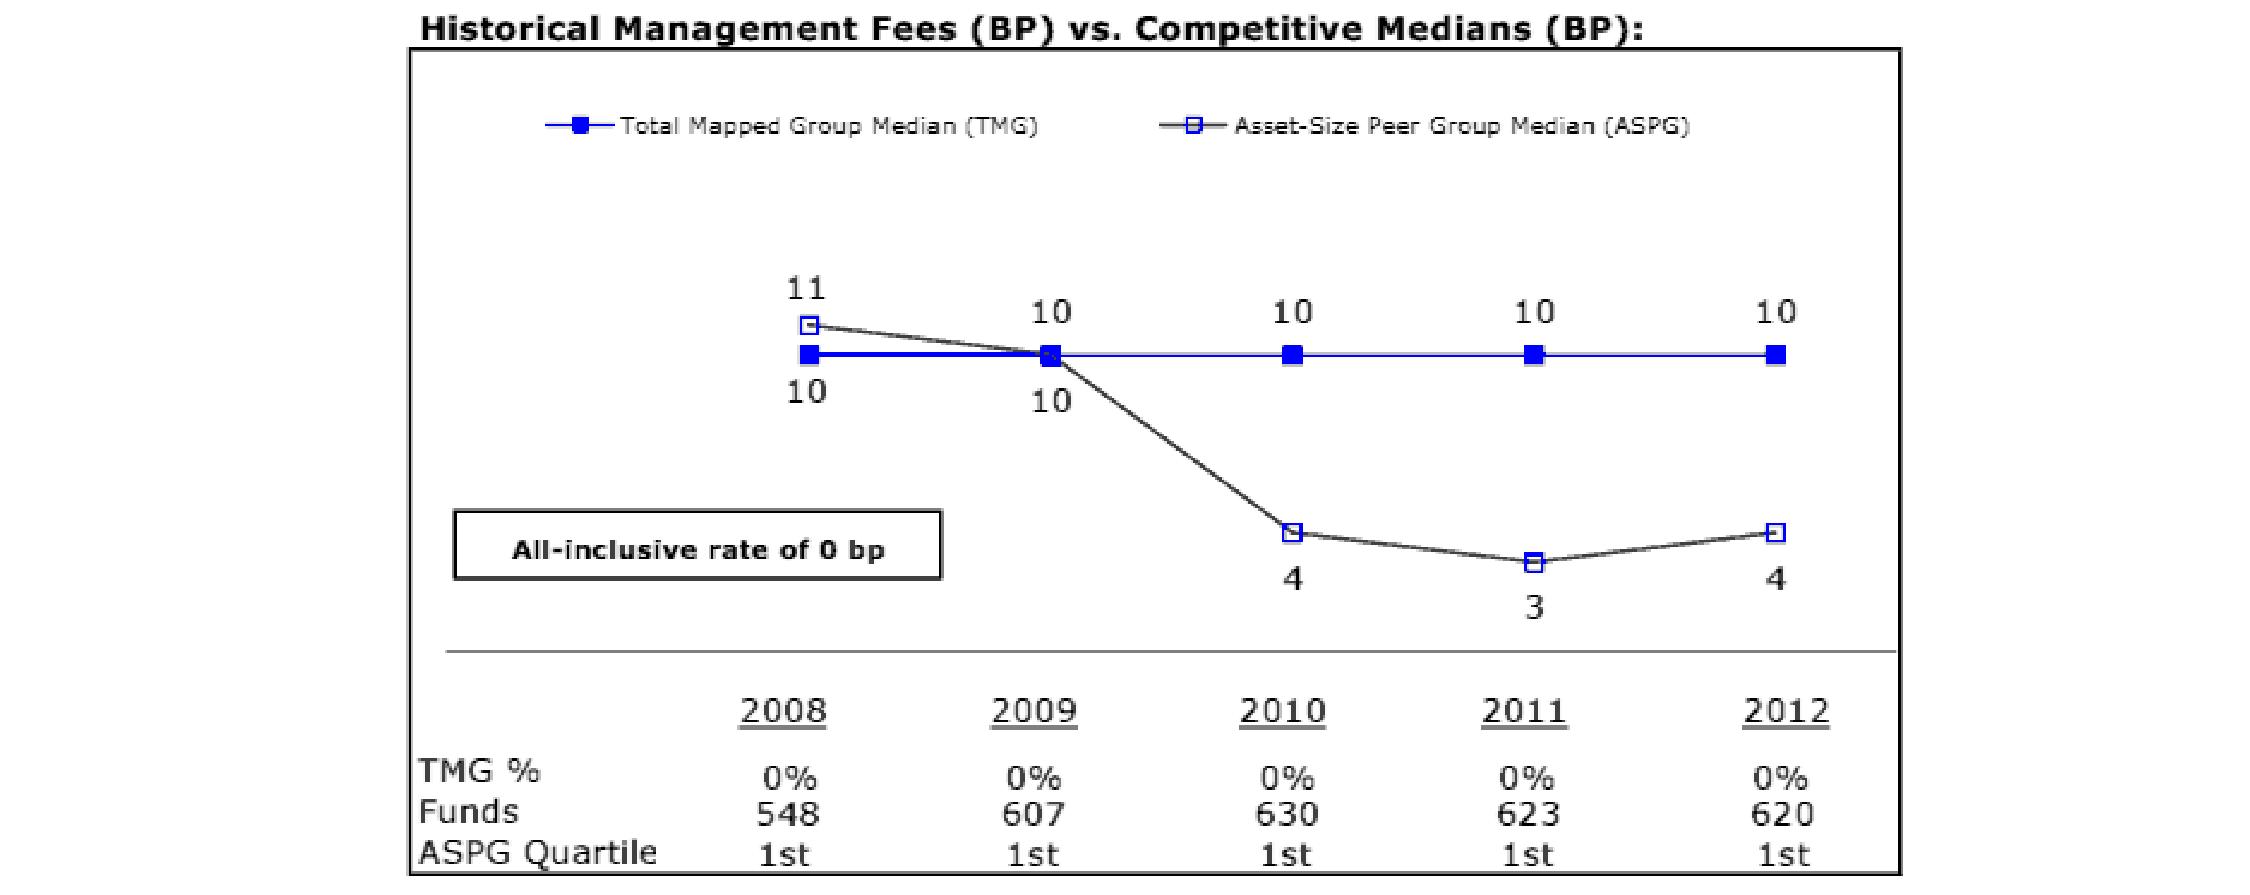
Freedom 2055 Fund
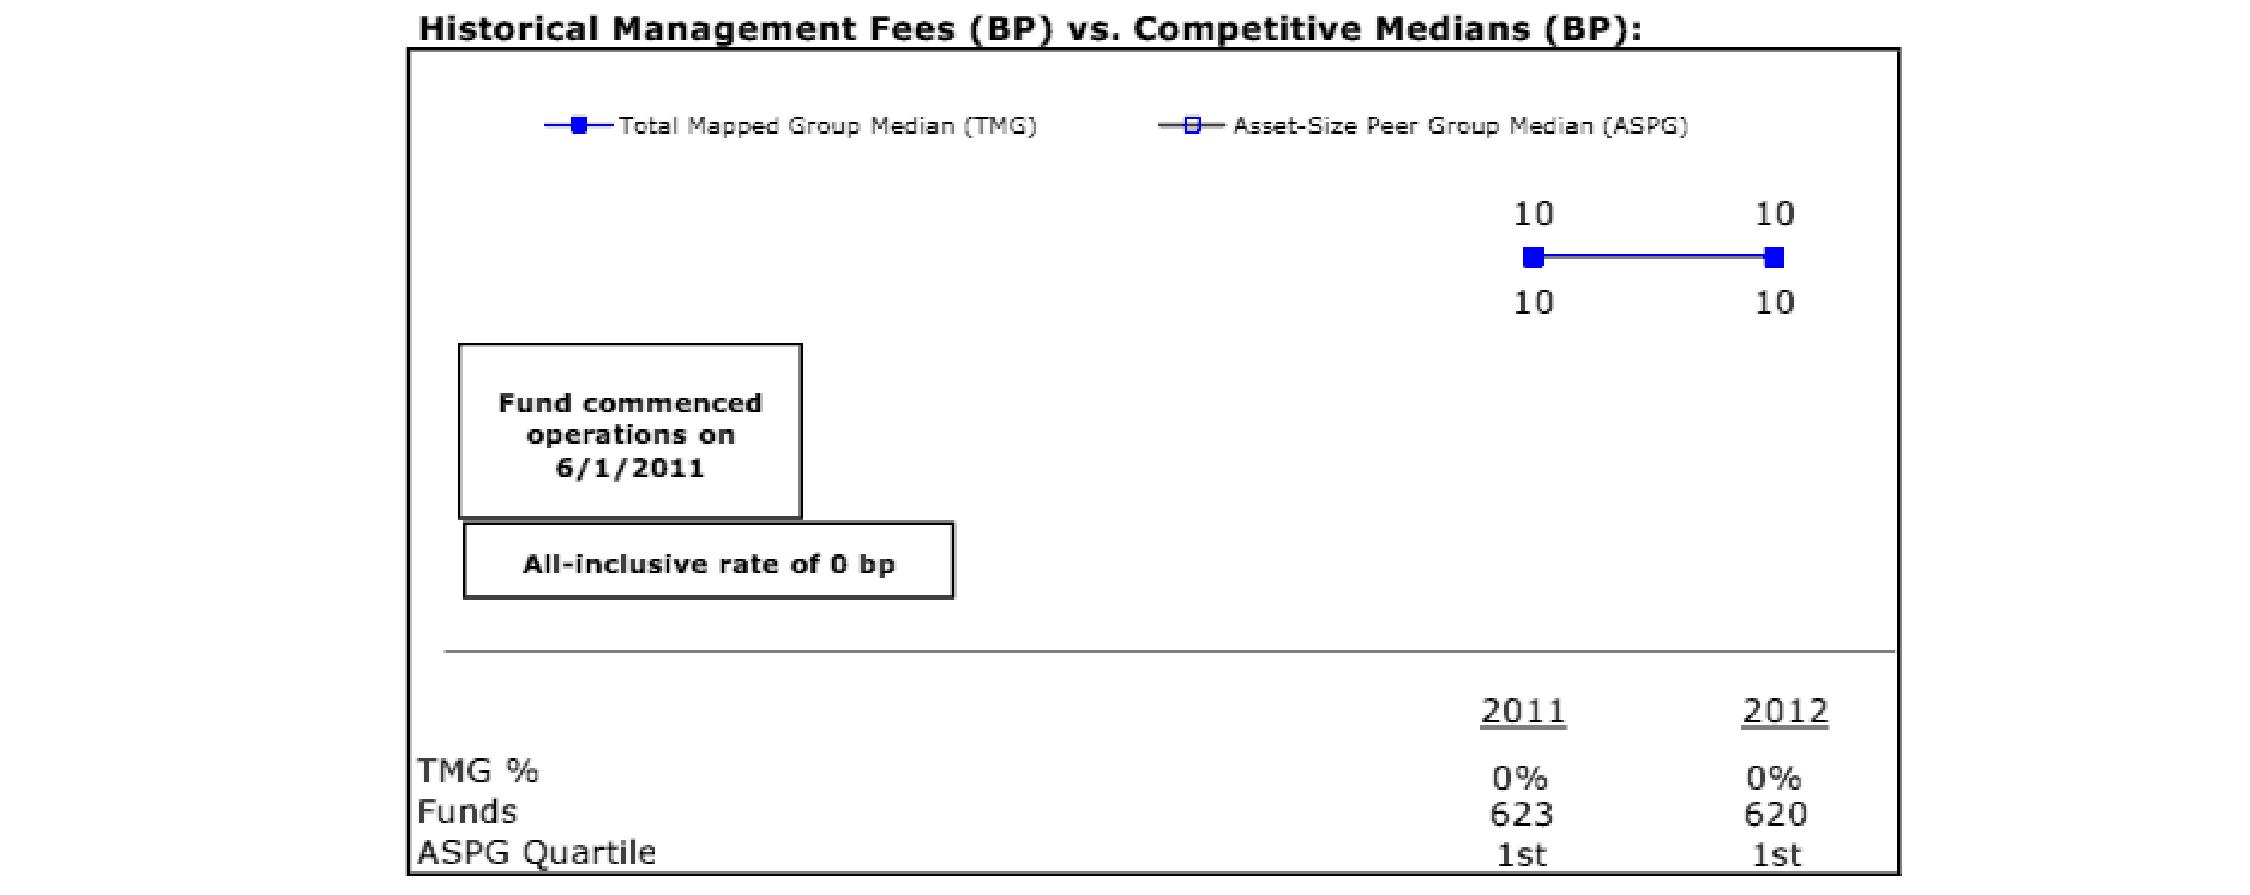
Semiannual Report
Board Approval of Investment Advisory Contracts and Management Fees - continued
Freedom Income Fund
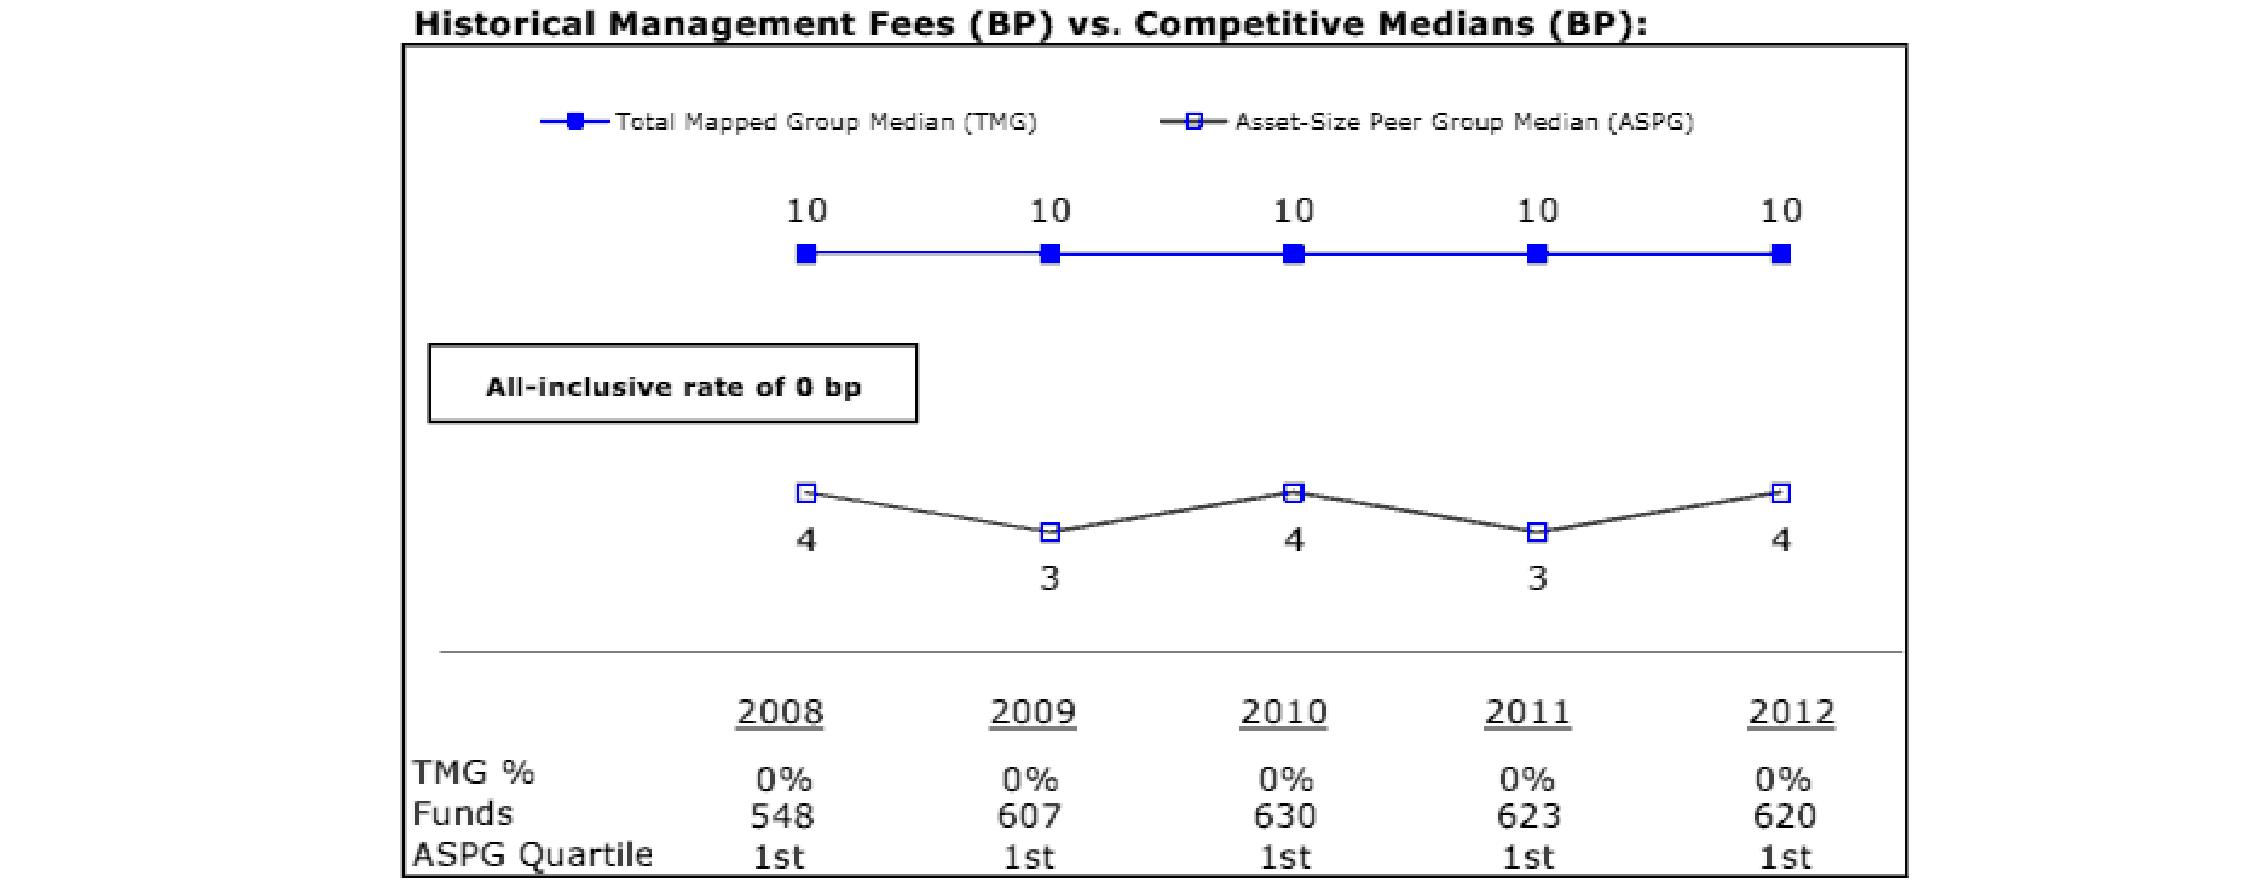
The Board noted that each fund's management fee rate of 0.00% ranked below the median of its Total Mapped Group and below the median of its ASPG for 2012. The Board further noted that many peer funds pay fund-level expenses, including management fees, to which the funds are not subject.
Based on its review, the Board concluded that each fund's management fee is fair and reasonable in light of the services that the fund receives and the other factors considered.
Total Expense Ratio. In its review of each fund's total expense ratio, the Board considered that the funds do not pay transfer agent fees. Instead, each underlying Fidelity fund (or the retail class of the underlying fund, if that underlying fund offers multiple classes of shares) bears its pro rata portion of each fund's transfer agent fee according to the percentage of each fund's assets invested in that underlying fund. The Board further noted that Fidelity Management & Research Company (FMR) pays all other expenses of each fund, with limited exceptions.
The Board noted that each fund's total expense ratio ranked below its competitive median for 2012.
Fees Charged to Other Fidelity Clients. The Board also considered Fidelity fee structures and other information with respect to clients of Fidelity and its affiliates, such as other mutual funds advised or subadvised by Fidelity or its affiliates, pension plan clients, and other institutional clients. The Board noted the findings of the 2013 ad hoc joint committee (created with the board of other Fidelity funds), which reviewed and compared Fidelity's institutional investment advisory business with its business of providing services to the Fidelity funds, including the differences in services provided, fees charged, and costs incurred, as well as competition in their respective marketplaces.
Based on its review of total expense ratios and fees charged to other Fidelity clients, the Board concluded that each fund's total expense ratio was reasonable in light of the services that the fund and its shareholders receive and the other factors considered.
Costs of the Services and Profitability. The Board considered the level of Fidelity's profits in respect of all the Fidelity funds, including the Fidelity funds in which the funds invest.
PricewaterhouseCoopers LLP (PwC), independent registered public accounting firm and auditor to Fidelity and certain Fidelity funds, has been engaged annually by the Board as part of the Board's assessment of Fidelity's profitability analysis. PwC's engagement includes the review and assessment of the methodologies used by Fidelity in determining the revenues and expenses attributable to Fidelity's mutual fund business, and completion of agreed-upon procedures surrounding the mathematical accuracy of fund profitability and its conformity to allocation methodologies. After considering PwC's reports issued under the engagement and information provided by Fidelity, the Board concluded that while other allocation methods may also be reasonable, Fidelity's profitability methodologies are reasonable in all material respects.
The Board also reviewed Fidelity's non-fund businesses and fall-out benefits related to the mutual fund business as well as cases where Fidelity's affiliates may benefit from or be related to the funds' business.
The Board concluded that the costs of the services provided by and the profits realized by Fidelity in connection with the operation of each fund were not relevant to the renewal of each fund's Advisory Contract because the funds do not pay management fees and FMR pays all other expenses of each fund, with limited exceptions.
Semiannual Report
Economies of Scale. The Board concluded that because the funds do not pay management fees and FMR pays all other expenses of each fund, with limited exceptions, economies of scale cannot be realized by the funds, but may be realized by the other Fidelity funds in which each fund invests, many of which may benefit from breakpoints in the group fee arrangement.
Additional Information Requested by the Board. In order to develop fully the factual basis for consideration of the Fidelity funds' Advisory Contracts, the Board requested and received additional information on certain topics, including: (i) Fidelity's fund profitability methodology, profitability trends for certain funds, and the impact of certain factors on fund profitability results; (ii) portfolio manager changes that have occurred during the past year and the amount of the investment that each portfolio manager has made in the Fidelity fund(s) that he or she manages; (iii) Fidelity's compensation structure for portfolio managers, research analysts, and other key personnel, including its effects on fund profitability, the rationale for the compensation structure, and the extent to which current market conditions have affected retention and recruitment; (iv) the arrangements with and compensation paid to certain fund sub-advisers on behalf of the Fidelity funds; (v) Fidelity's fee structures, including the group fee structure and definition of group assets, and the rationale for recommending different fees among different categories of funds and classes; (vi) Fidelity's voluntary waiver of its fees to maintain minimum yields for certain money market funds and classes as well as contractual waivers in place for certain funds; (vii) the methodology with respect to competitive fund data and peer group classifications; (viii) Fidelity's transfer agent fee, expense, and service structures for different funds and classes, and the impact of the increased use of omnibus accounts; and (ix) explanations regarding the relative total expense ratios of certain funds and classes, total expense competitive trends and methodologies for total expense competitive comparisons, and actions that might be taken by Fidelity to reduce total expense ratios for certain funds and classes or to achieve further economies of scale.
Based on its evaluation of all of the conclusions noted above, and after considering all factors it believed relevant, the Board ultimately concluded that the advisory fee structures are fair and reasonable, and that each fund's Advisory Contract should be renewed.
Semiannual Report
Investment Adviser
Strategic Advisers, Inc.
Boston, MA
Administrator
Fidelity Management & Research
Company
Boston, MA
General Distributor
Fidelity Distributors Corporation
Smithfield, RI
Transfer and Service Agents
Fidelity Investments Institutional
Operations Company, Inc.
Boston, MA
Fidelity Service Company, Inc.
Boston, MA
Custodian
The Bank of New York Mellon
New York, NY

FF-USAN-1113
1.792160.110
Fidelity Advisor Freedom Funds®-
Income, 2005, 2010, 2015, 2020, 2025, 2030, 2035, 2040, 2045, 2050 - Class A, Class T, Class B and Class C
Fidelity Advisor Freedom® 2055 Fund -
Class A, Class T, and Class C
Semiannual Report
September 30, 2013
(Fidelity Cover Art)
Contents
Semiannual Report
To view a fund's proxy voting guidelines and proxy voting record for the 12-month period ended June 30, visit http://www.fidelity.com/proxyvotingresults or visit the Securities and Exchange Commission's (SEC) web site at http://www.sec.gov. You may also call 1-877-208-0098 to request a free copy of the proxy voting guidelines.
Standard & Poor's, S&P and S&P 500 are registered service marks of The McGraw-Hill Companies, Inc. and have been licensed for use by Fidelity Distributors Corporation.
Other third-party marks appearing herein are the property of their respective owners.
All other marks appearing herein are registered or unregistered trademarks or service marks of FMR LLC or an affiliated company. © 2013 FMR LLC. All rights reserved.
This report and the financial statements contained herein are submitted for the general information of the shareholders of the funds. This report is not authorized for distribution to prospective investors in the funds unless preceded or accompanied by an effective prospectus.
A fund files its complete schedule of portfolio holdings with the SEC for the first and third quarters of each fiscal year on Form N-Q. Forms N-Q are available on the SEC's web site at http://www.sec.gov. A fund's Forms N-Q may be reviewed and copied at the SEC's Public Reference Room in Washington, DC. Information regarding the operation of the SEC's Public Reference Room may be obtained by calling 1-800-SEC-0330. For a complete list of a fund's portfolio holdings, view the most recent holdings listing, semiannual report, or annual report on Fidelity's web site at http://www.fidelity.com, http://www.advisor.fidelity.com, or http://www.401k.com, as applicable.
NOT FDIC INSURED • MAY LOSE VALUE • NO BANK GUARANTEE
Neither the funds nor Fidelity Distributors Corporation is a bank.
Semiannual Report
As a shareholder of a Fund, you incur two types of costs: (1) transaction costs, including sales charges (loads) on purchase payments or redemption proceeds, and (2) ongoing costs, including distribution and/or service (12b-1) fees and other Fund expenses. This Example is intended to help you understand your ongoing costs (in dollars) of investing in the Funds and to compare these costs with the ongoing costs of investing in other mutual funds.
The Example is based on an investment of $1,000 invested at the beginning of the period and held for the entire period (April 1, 2013 to September 30, 2013).
Actual Expenses
The first line of the accompanying table for each class of each fund provides information about actual account values and actual expenses. You may use the information in this line, together with the amount you invested, to estimate the expenses that you paid over the period. Simply divide your account value by $1,000.00 (for example, an $8,600 account value divided by $1,000.00 = 8.6), then multiply the result by the number in the first line for a class of the fund under the heading entitled "Expenses Paid During Period" to estimate the expenses you paid on your account during this period. In addition, each Fund, as a shareholder in underlying Fidelity Funds, will indirectly bear its pro-rata share of the fees and expenses incurred by the underlying Fidelity Funds. These fees and expenses are not included in each Fund's annualized expense ratio used to calculate the expense estimates in the table below.
Hypothetical Example for Comparison Purposes
The second line of the accompanying table for each class of each fund provides information about hypothetical account values and hypothetical expenses based on a Class' actual expense ratio and an assumed rate of return of 5% per year before expenses, which is not the Class' actual return. The hypothetical account values and expenses may not be used to estimate the actual ending account balance or expenses you paid for the period. You may use this information to compare the ongoing costs of investing in the Fund and other funds. To do so, compare this 5% hypothetical example with the 5% hypothetical examples that appear in the shareholder reports of the other funds. In addition, each Fund, as a shareholder in underlying Fidelity Funds, will indirectly bear its pro-rata share of the fees and expenses incurred by the underlying Fidelity Funds. These fees and expenses are not included in each Fund's annualized expense ratio used to calculate the expense estimates in the table below.
Please note that the expenses shown in the table are meant to highlight your ongoing costs only and do not reflect any transaction costs. Therefore, the second line of the table is useful in comparing ongoing costs only, and will not help you determine the relative total costs of owning different funds. In addition, if these transactional costs were included, your costs would have been higher.
| Annualized
Expense RatioB | Beginning
Account Value
April 1, 2013 | Ending
Account Value
September 30, 2013 | Expenses Paid
During Period*
April 1, 2013
to September 30, 2013 |
Advisor Freedom Income | | | | |
Class A | .25% | | | |
Actual | | $ 1,000.00 | $ 1,005.10 | $ 1.26 |
HypotheticalA | | $ 1,000.00 | $ 1,023.82 | $ 1.27 |
Class T | .50% | | | |
Actual | | $ 1,000.00 | $ 1,003.70 | $ 2.51 |
HypotheticalA | | $ 1,000.00 | $ 1,022.56 | $ 2.54 |
Class B | 1.00% | | | |
Actual | | $ 1,000.00 | $ 1,001.30 | $ 5.02 |
HypotheticalA | | $ 1,000.00 | $ 1,020.05 | $ 5.06 |
Class C | 1.00% | | | |
Actual | | $ 1,000.00 | $ 1,002.30 | $ 5.02 |
HypotheticalA | | $ 1,000.00 | $ 1,020.05 | $ 5.06 |
Institutional Class | .00% | | | |
Actual | | $ 1,000.00 | $ 1,007.10 | $ .00 |
HypotheticalA | | $ 1,000.00 | $ 1,025.07 | $ .00 |
| Annualized
Expense RatioB | Beginning
Account Value
April 1, 2013 | Ending
Account Value
September 30, 2013 | Expenses Paid
During Period*
April 1, 2013
to September 30, 2013 |
Advisor Freedom 2005 | | | | |
Class A | .25% | | | |
Actual | | $ 1,000.00 | $ 1,017.70 | $ 1.26 |
HypotheticalA | | $ 1,000.00 | $ 1,023.82 | $ 1.27 |
Class T | .50% | | | |
Actual | | $ 1,000.00 | $ 1,016.30 | $ 2.53 |
HypotheticalA | | $ 1,000.00 | $ 1,022.56 | $ 2.54 |
Class B | 1.00% | | | |
Actual | | $ 1,000.00 | $ 1,013.50 | $ 5.05 |
HypotheticalA | | $ 1,000.00 | $ 1,020.05 | $ 5.06 |
Class C | 1.00% | | | |
Actual | | $ 1,000.00 | $ 1,014.40 | $ 5.05 |
HypotheticalA | | $ 1,000.00 | $ 1,020.05 | $ 5.06 |
Institutional Class | .00% | | | |
Actual | | $ 1,000.00 | $ 1,019.00 | $ .00 |
HypotheticalA | | $ 1,000.00 | $ 1,025.07 | $ .00 |
Advisor Freedom 2010 | | | | |
Class A | .25% | | | |
Actual | | $ 1,000.00 | $ 1,026.70 | $ 1.27 |
HypotheticalA | | $ 1,000.00 | $ 1,023.82 | $ 1.27 |
Class T | .50% | | | |
Actual | | $ 1,000.00 | $ 1,026.20 | $ 2.54 |
HypotheticalA | | $ 1,000.00 | $ 1,022.56 | $ 2.54 |
Class B | 1.00% | | | |
Actual | | $ 1,000.00 | $ 1,023.30 | $ 5.07 |
HypotheticalA | | $ 1,000.00 | $ 1,020.05 | $ 5.06 |
Class C | 1.00% | | | |
Actual | | $ 1,000.00 | $ 1,023.50 | $ 5.07 |
HypotheticalA | | $ 1,000.00 | $ 1,020.05 | $ 5.06 |
Institutional Class | .00% | | | |
Actual | | $ 1,000.00 | $ 1,028.00 | $ .00 |
HypotheticalA | | $ 1,000.00 | $ 1,025.07 | $ .00 |
Advisor Freedom 2015 | | | | |
Class A | .25% | | | |
Actual | | $ 1,000.00 | $ 1,029.20 | $ 1.27 |
HypotheticalA | | $ 1,000.00 | $ 1,023.82 | $ 1.27 |
Class T | .50% | | | |
Actual | | $ 1,000.00 | $ 1,027.00 | $ 2.54 |
HypotheticalA | | $ 1,000.00 | $ 1,022.56 | $ 2.54 |
Class B | 1.00% | | | |
Actual | | $ 1,000.00 | $ 1,025.00 | $ 5.08 |
HypotheticalA | | $ 1,000.00 | $ 1,020.05 | $ 5.06 |
Class C | 1.00% | | | |
Actual | | $ 1,000.00 | $ 1,024.30 | $ 5.07 |
HypotheticalA | | $ 1,000.00 | $ 1,020.05 | $ 5.06 |
Institutional Class | .00% | | | |
Actual | | $ 1,000.00 | $ 1,029.60 | $ .00 |
HypotheticalA | | $ 1,000.00 | $ 1,025.07 | $ .00 |
| Annualized
Expense RatioB | Beginning
Account Value
April 1, 2013 | Ending
Account Value
September 30, 2013 | Expenses Paid
During Period*
April 1, 2013
to September 30, 2013 |
Advisor Freedom 2020 | | | | |
Class A | .25% | | | |
Actual | | $ 1,000.00 | $ 1,033.20 | $ 1.27 |
HypotheticalA | | $ 1,000.00 | $ 1,023.82 | $ 1.27 |
Class T | .50% | | | |
Actual | | $ 1,000.00 | $ 1,031.80 | $ 2.55 |
HypotheticalA | | $ 1,000.00 | $ 1,022.56 | $ 2.54 |
Class B | 1.00% | | | |
Actual | | $ 1,000.00 | $ 1,029.00 | $ 5.09 |
HypotheticalA | | $ 1,000.00 | $ 1,020.05 | $ 5.06 |
Class C | 1.00% | | | |
Actual | | $ 1,000.00 | $ 1,029.20 | $ 5.09 |
HypotheticalA | | $ 1,000.00 | $ 1,020.05 | $ 5.06 |
Institutional Class | .00% | | | |
Actual | | $ 1,000.00 | $ 1,033.60 | $ .00 |
HypotheticalA | | $ 1,000.00 | $ 1,025.07 | $ .00 |
Advisor Freedom 2025 | | | | |
Class A | .25% | | | |
Actual | | $ 1,000.00 | $ 1,044.90 | $ 1.28 |
HypotheticalA | | $ 1,000.00 | $ 1,023.82 | $ 1.27 |
Class T | .50% | | | |
Actual | | $ 1,000.00 | $ 1,043.40 | $ 2.56 |
HypotheticalA | | $ 1,000.00 | $ 1,022.56 | $ 2.54 |
Class B | 1.00% | | | |
Actual | | $ 1,000.00 | $ 1,040.80 | $ 5.12 |
HypotheticalA | | $ 1,000.00 | $ 1,020.05 | $ 5.06 |
Class C | 1.00% | | | |
Actual | | $ 1,000.00 | $ 1,040.20 | $ 5.11 |
HypotheticalA | | $ 1,000.00 | $ 1,020.05 | $ 5.06 |
Institutional Class | .00% | | | |
Actual | | $ 1,000.00 | $ 1,046.00 | $ .00 |
HypotheticalA | | $ 1,000.00 | $ 1,025.07 | $ .00 |
Advisor Freedom 2030 | | | | |
Class A | .25% | | | |
Actual | | $ 1,000.00 | $ 1,049.10 | $ 1.28 |
HypotheticalA | | $ 1,000.00 | $ 1,023.82 | $ 1.27 |
Class T | .50% | | | |
Actual | | $ 1,000.00 | $ 1,047.90 | $ 2.57 |
HypotheticalA | | $ 1,000.00 | $ 1,022.56 | $ 2.54 |
Class B | 1.00% | | | |
Actual | | $ 1,000.00 | $ 1,045.10 | $ 5.13 |
HypotheticalA | | $ 1,000.00 | $ 1,020.05 | $ 5.06 |
Class C | 1.00% | | | |
Actual | | $ 1,000.00 | $ 1,045.30 | $ 5.13 |
HypotheticalA | | $ 1,000.00 | $ 1,020.05 | $ 5.06 |
Institutional Class | .00% | | | |
Actual | | $ 1,000.00 | $ 1,050.30 | $ .00 |
HypotheticalA | | $ 1,000.00 | $ 1,025.07 | $ .00 |
| Annualized
Expense RatioB | Beginning
Account Value
April 1, 2013 | Ending
Account Value
September 30, 2013 | Expenses Paid
During Period*
April 1, 2013
to September 30, 2013 |
Advisor Freedom 2035 | | | | |
Class A | .25% | | | |
Actual | | $ 1,000.00 | $ 1,059.30 | $ 1.29 |
HypotheticalA | | $ 1,000.00 | $ 1,023.82 | $ 1.27 |
Class T | .50% | | | |
Actual | | $ 1,000.00 | $ 1,058.20 | $ 2.58 |
HypotheticalA | | $ 1,000.00 | $ 1,022.56 | $ 2.54 |
Class B | 1.00% | | | |
Actual | | $ 1,000.00 | $ 1,056.00 | $ 5.15 |
HypotheticalA | | $ 1,000.00 | $ 1,020.05 | $ 5.06 |
Class C | 1.00% | | | |
Actual | | $ 1,000.00 | $ 1,056.10 | $ 5.15 |
HypotheticalA | | $ 1,000.00 | $ 1,020.05 | $ 5.06 |
Institutional Class | .00% | | | |
Actual | | $ 1,000.00 | $ 1,061.30 | $ .00 |
HypotheticalA | | $ 1,000.00 | $ 1,025.07 | $ .00 |
Advisor Freedom 2040 | | | | |
Class A | .25% | | | |
Actual | | $ 1,000.00 | $ 1,061.30 | $ 1.29 |
HypotheticalA | | $ 1,000.00 | $ 1,023.82 | $ 1.27 |
Class T | .50% | | | |
Actual | | $ 1,000.00 | $ 1,060.00 | $ 2.58 |
HypotheticalA | | $ 1,000.00 | $ 1,022.56 | $ 2.54 |
Class B | 1.00% | | | |
Actual | | $ 1,000.00 | $ 1,057.30 | $ 5.16 |
HypotheticalA | | $ 1,000.00 | $ 1,020.05 | $ 5.06 |
Class C | 1.00% | | | |
Actual | | $ 1,000.00 | $ 1,057.50 | $ 5.16 |
HypotheticalA | | $ 1,000.00 | $ 1,020.05 | $ 5.06 |
Institutional Class | .00% | | | |
Actual | | $ 1,000.00 | $ 1,063.10 | $ .00 |
HypotheticalA | | $ 1,000.00 | $ 1,025.07 | $ .00 |
Advisor Freedom 2045 | | | | |
Class A | .25% | | | |
Actual | | $ 1,000.00 | $ 1,064.10 | $ 1.29 |
HypotheticalA | | $ 1,000.00 | $ 1,023.82 | $ 1.27 |
Class T | .50% | | | |
Actual | | $ 1,000.00 | $ 1,061.80 | $ 2.58 |
HypotheticalA | | $ 1,000.00 | $ 1,022.56 | $ 2.54 |
Class B | 1.00% | | | |
Actual | | $ 1,000.00 | $ 1,060.00 | $ 5.16 |
HypotheticalA | | $ 1,000.00 | $ 1,020.05 | $ 5.06 |
Class C | 1.00% | | | |
Actual | | $ 1,000.00 | $ 1,060.10 | $ 5.16 |
HypotheticalA | | $ 1,000.00 | $ 1,020.05 | $ 5.06 |
Institutional Class | .00% | | | |
Actual | | $ 1,000.00 | $ 1,065.40 | $ .00 |
HypotheticalA | | $ 1,000.00 | $ 1,025.07 | $ .00 |
| Annualized
Expense RatioB | Beginning
Account Value
April 1, 2013 | Ending
Account Value
September 30, 2013 | Expenses Paid
During Period*
April 1, 2013
to September 30, 2013 |
Advisor Freedom 2050 | | | | |
Class A | .25% | | | |
Actual | | $ 1,000.00 | $ 1,064.50 | $ 1.29 |
HypotheticalA | | $ 1,000.00 | $ 1,023.82 | $ 1.27 |
Class T | .50% | | | |
Actual | | $ 1,000.00 | $ 1,063.20 | $ 2.59 |
HypotheticalA | | $ 1,000.00 | $ 1,022.56 | $ 2.54 |
Class B | 1.00% | | | |
Actual | | $ 1,000.00 | $ 1,061.10 | $ 5.17 |
HypotheticalA | | $ 1,000.00 | $ 1,020.05 | $ 5.06 |
Class C | 1.00% | | | |
Actual | | $ 1,000.00 | $ 1,060.10 | $ 5.16 |
HypotheticalA | | $ 1,000.00 | $ 1,020.05 | $ 5.06 |
Institutional Class | .00% | | | |
Actual | | $ 1,000.00 | $ 1,065.80 | $ .00 |
HypotheticalA | | $ 1,000.00 | $ 1,025.07 | $ .00 |
Advisor Freedom 2055 | | | | |
Class A | .25% | | | |
Actual | | $ 1,000.00 | $ 1,068.20 | $ 1.30 |
HypotheticalA | | $ 1,000.00 | $ 1,023.82 | $ 1.27 |
Class T | .50% | | | |
Actual | | $ 1,000.00 | $ 1,066.80 | $ 2.59 |
HypotheticalA | | $ 1,000.00 | $ 1,022.56 | $ 2.54 |
Class C | 1.00% | | | |
Actual | | $ 1,000.00 | $ 1,063.70 | $ 5.17 |
HypotheticalA | | $ 1,000.00 | $ 1,020.05 | $ 5.06 |
Institutional Class | .00% | | | |
Actual | | $ 1,000.00 | $ 1,069.50 | $ .00 |
HypotheticalA | | $ 1,000.00 | $ 1,025.07 | $ .00 |
A 5% return per year before expenses
B Annualized expense ratio reflects expenses net of applicable fee waivers.
* Expenses are equal to each Class' annualized expense ratio, multiplied by the average account value over the period, multiplied by 183/ 365 (to reflect the one-half year period). The fees and expenses of the underlying Fidelity Funds in which the Funds invest are not included in each Class' annualized expense ratio.
Semiannual Report
Fidelity Advisor Freedom Income Fund
Investment Changes (Unaudited)
The information in the following tables is based on the direct investments of the Fund. |
Fund Holdings as of September 30, 2013 |
| % of fund's
net assets | % of fund's net assets
6 months ago |
Commodity Funds | | |
Fidelity Series Commodity Strategy Fund | 1.9 | 1.9 |
Domestic Equity Funds | | |
Fidelity Advisor Equity Growth Fund Institutional Class | 1.9 | 1.8 |
Fidelity Advisor Growth & Income Fund Institutional Class | 0.0 | 0.9 |
Fidelity Advisor Large Cap Fund Institutional Class | 0.9 | 1.0 |
Fidelity Advisor Series Equity-Income Fund | 1.3 | 1.3 |
Fidelity Advisor Series Growth & Income Fund (formerly Fidelity Advisor Series Mega Cap Fund) | 1.3 | 0.3 |
Fidelity Advisor Series Opportunistic Insights Fund | 1.0 | 0.9 |
Fidelity Advisor Series Stock Selector Large Cap Value Fund | 1.3 | 1.3 |
Fidelity Advisor Small Cap Fund Institutional Class | 0.7 | 0.7 |
Fidelity Series 100 Index Fund | 0.3 | 0.3 |
Fidelity Series All-Sector Equity Fund | 2.3 | 2.3 |
Fidelity Series Large Cap Value Fund | 1.2 | 1.3 |
Fidelity Series Real Estate Equity Fund | 0.2 | 0.2 |
Fidelity Series Small Cap Opportunities Fund | 0.8 | 0.8 |
| 13.2 | 13.1 |
Developed International Equity Funds | | |
Fidelity Series International Growth Fund | 2.0 | 2.0 |
Fidelity Series International Small Cap Fund | 0.4 | 0.4 |
Fidelity Series International Value Fund | 2.1 | 2.0 |
| 4.5 | 4.4 |
Emerging Markets Equity Funds | | |
Fidelity Series Emerging Markets Fund | 1.2 | 1.2 |
High Yield Bond Funds | | |
Fidelity Series Emerging Markets Debt Fund | 0.5 | 0.5 |
Fidelity Series Floating Rate High Income Fund | 1.1 | 1.1 |
Fidelity Series High Income Fund | 4.9 | 4.9 |
Fidelity Series Real Estate Income Fund | 0.4 | 0.4 |
| 6.9 | 6.9 |
Inflation-Protected Bond Funds | | |
Fidelity Series Inflation-Protected Bond Index Fund | 11.1 | 11.4 |
Investment Grade Bond Funds | | |
Fidelity Series Investment Grade Bond Fund | 21.6 | 21.5 |
Short-Term Funds | | |
Fidelity Advisor Short Fixed-Income Fund Institutional Class | 17.8 | 17.9 |
Fidelity Institutional Money Market Portfolio Institutional Class | 21.8 | 21.7 |
| 39.6 | 39.6 |
Net Other Assets (Liabilities)* | 0.0 | 0.0 |
| 100.0 | 100.0 |
* Amount represents less than 0.1% |
Asset Allocation (% of fund's net assets) |
Period end |
 | Commodity Funds | 1.9% | |
 | Domestic Equity Funds | 13.2% | |
 | Developed International Equity Funds | 4.5% | |
 | Emerging Markets Equity Funds | 1.2% | |
 | High Yield Bond Funds | 6.9% | |
 | Inflation-Protected Bond Funds | 11.1% | |
 | Investment Grade Bond Funds | 21.6% | |
 | Short-Term Funds | 39.6% | |

Six months ago |
| Commodity Funds | 1.9% | |
| Domestic Equity Funds | 13.1% | |
| Developed International Equity Funds | 4.4% | |
| Emerging Markets Equity Funds | 1.2% | |
| High Yield Bond Funds | 6.9% | |
| Inflation-Protected Bond Funds | 11.4% | |
| Investment Grade Bond Funds | 21.5% | |
| Short-Term Funds | 39.6% | |

Semiannual Report
Fidelity Advisor Freedom Income Fund
Investments September 30, 2013 (Unaudited)
Showing Percentage of Net Assets
Domestic Equity Funds - 15.1% |
| Shares | | Value |
Commodity Funds - 1.9% |
Fidelity Series Commodity Strategy Fund (a)(c) | 741,639 | | $ 5,940,526 |
Domestic Equity Funds - 13.2% |
Fidelity Advisor Equity Growth Fund Institutional Class (c) | 70,803 | | 5,825,653 |
Fidelity Advisor Large Cap Fund Institutional Class (c) | 110,055 | | 2,960,481 |
Fidelity Advisor Series Equity-Income Fund (c) | 336,270 | | 3,964,623 |
Fidelity Advisor Series Growth & Income Fund (c) | 325,336 | | 3,920,301 |
Fidelity Advisor Series Opportunistic Insights Fund (c) | 236,712 | | 3,048,849 |
Fidelity Advisor Series Stock Selector Large Cap Value Fund (c) | 324,571 | | 3,950,034 |
Fidelity Advisor Small Cap Fund Institutional Class (c) | 75,552 | | 2,302,840 |
Fidelity Series 100 Index Fund (c) | 80,993 | | 897,405 |
Fidelity Series All-Sector Equity Fund (c) | 506,022 | | 7,165,278 |
Fidelity Series Large Cap Value Fund (c) | 301,744 | | 3,811,027 |
Fidelity Series Real Estate Equity Fund (c) | 48,336 | | 578,104 |
Fidelity Series Small Cap Opportunities Fund (c) | 207,220 | | 2,658,627 |
TOTAL DOMESTIC EQUITY FUNDS | | 41,083,222 |
TOTAL DOMESTIC EQUITY FUNDS (Cost $36,823,436) |
47,023,748
|
International Equity Funds - 5.7% |
| | | |
Developed International Equity Funds - 4.5% |
Fidelity Series International Growth Fund (c) | 454,762 | | 6,171,116 |
Fidelity Series International Small Cap Fund (c) | 85,290 | | 1,304,078 |
Fidelity Series International Value Fund (c) | 584,849 | | 6,287,130 |
TOTAL DEVELOPED INTERNATIONAL EQUITY FUNDS | | 13,762,324 |
Emerging Markets Equity Funds - 1.2% |
Fidelity Series Emerging Markets Fund (c) | 226,634 | | 3,793,857 |
TOTAL INTERNATIONAL EQUITY FUNDS (Cost $14,122,954) |
17,556,181
|
Bond Funds - 39.6% |
| Shares | | Value |
High Yield Bond Funds - 6.9% |
Fidelity Series Emerging Markets Debt Fund (c) | 145,404 | | $ 1,471,488 |
Fidelity Series Floating Rate High Income Fund (c) | 335,064 | | 3,544,975 |
Fidelity Series High Income Fund (c) | 1,485,598 | | 15,271,952 |
Fidelity Series Real Estate Income Fund (c) | 100,983 | | 1,108,788 |
TOTAL HIGH YIELD BOND FUNDS | | 21,397,203 |
Inflation-Protected Bond Funds - 11.1% |
Fidelity Series Inflation-Protected Bond Index Fund (c) | 3,168,479 | | 34,377,994 |
Investment Grade Bond Funds - 21.6% |
Fidelity Series Investment Grade Bond Fund (c) | 6,013,328 | | 67,289,141 |
TOTAL BOND FUNDS (Cost $120,138,040) |
123,064,338
|
Short-Term Funds - 39.6% |
| | | |
Fidelity Advisor Short Fixed-Income Fund Institutional Class (c) | 5,945,688 | | 55,473,267 |
Fidelity Institutional Money Market Portfolio Institutional Class 0.04% (b)(c) | 67,718,018 | | 67,718,018 |
TOTAL SHORT-TERM FUNDS (Cost $122,553,620) |
123,191,285
|
TOTAL INVESTMENT PORTFOLIO - 100.0% (Cost $293,638,050) | | 310,835,552 |
NET OTHER ASSETS (LIABILITIES) - 0.0% | | (73,546) |
NET ASSETS - 100% | $ 310,762,006 |
Legend |
(a) Non-income producing |
(b) The rate quoted is the annualized seven-day yield of the fund at period end. |
(c) Affiliated company |
Affiliated Underlying Funds |
Information regarding the Fund's fiscal year to date purchases and sales of the affiliated Underlying Funds and income earned by the Fund from investments in affiliated Underlying Funds is as follows: |
Affiliate | Value,
beginning of
period | Purchases | Sales
Proceeds | Dividend
Income | Value,
end of
period |
Fidelity Advisor Equity Growth Fund Institutional Class | $ 5,710,077 | $ 118,360 | $ 858,887 | $ - | $ 5,825,653 |
Fidelity Advisor Growth & Income Fund Institutional Class | 3,030,254 | 42,439 | 3,331,738 | - | - |
Fidelity Advisor Large Cap Fund Institutional Class | 3,065,549 | 48,805 | 537,567 | - | 2,960,481 |
Fidelity Advisor Series Equity-Income Fund | 4,217,999 | 170,724 | 670,150 | 41,571 | 3,964,623 |
Fidelity Advisor Series Growth & Income Fund (formerly Fidelity Advisor Series Mega Cap Fund) | 944,641 | 3,083,231 | 232,302 | - | 3,920,301 |
Fidelity Advisor Series Opportunistic Insights Fund | 2,977,939 | 60,814 | 460,483 | - | 3,048,849 |
Fidelity Advisor Series Stock Selector Large Cap Value Fund | 4,236,726 | 85,094 | 728,403 | - | 3,950,034 |
Fidelity Advisor Short Fixed-Income Fund Institutional Class | 58,469,712 | 2,254,377 | 5,055,895 | 223,001 | 55,473,267 |
Fidelity Advisor Small Cap Fund Institutional Class | 2,340,665 | 46,842 | 369,935 | - | 2,302,840 |
Fidelity Institutional Money Market Portfolio Institutional Class | 71,120,992 | 2,860,589 | 6,263,565 | 40,374 | 67,718,018 |
Fidelity Series 100 Index Fund | 930,494 | 19,605 | 118,927 | - | 897,405 |
Fidelity Series All-Sector Equity Fund | 7,623,707 | 122,971 | 1,311,208 | - | 7,165,278 |
Fidelity Series Commodity Strategy Fund | 6,348,249 | 615,845 | 523,241 | - | 5,940,526 |
Fidelity Series Emerging Markets Debt Fund | 1,617,547 | 80,041 | 112,313 | 40,897 | 1,471,488 |
Fidelity Series Emerging Markets Fund | 3,933,471 | 197,145 | 336,476 | - | 3,793,857 |
Fidelity Series Floating Rate High Income Fund | 3,606,153 | 190,394 | 234,742 | 78,660 | 3,544,975 |
Fidelity Series High Income Fund | 16,077,152 | 906,450 | 1,363,182 | 412,612 | 15,271,952 |
Fidelity Series Inflation-Protected Bond Index Fund | 37,364,057 | 1,739,988 | 2,950,101 | - | 34,377,994 |
Fidelity Series International Growth Fund | 6,557,246 | 155,636 | 967,693 | - | 6,171,116 |
Fidelity Series International Small Cap Fund | 1,343,743 | 27,961 | 205,647 | - | 1,304,078 |
Fidelity Series International Value Fund | 6,535,805 | 138,721 | 952,290 | - | 6,287,130 |
Fidelity Series Investment Grade Bond Fund | 70,566,759 | 4,101,698 | 5,266,273 | 720,328 | 67,289,141 |
Fidelity Series Large Cap Value Fund | 4,366,121 | 67,283 | 978,982 | - | 3,811,027 |
Fidelity Series Real Estate Equity Fund | 651,607 | 34,981 | 59,033 | 4,034 | 578,104 |
Fidelity Series Real Estate Income Fund | 1,201,698 | 80,608 | 105,144 | 33,617 | 1,108,788 |
Fidelity Series Small Cap Opportunities Fund | 2,720,966 | 248,427 | 430,029 | - | 2,658,627 |
Total | $ 327,559,329 | $ 17,499,029 | $ 34,424,206 | $ 1,595,094 | $ 310,835,552 |
Other Information |
All investments are categorized as Level 1 under the Fair Value Hierarchy. The inputs or methodology used for valuing securities may not be an indication of the risk associated with investing in those securities. For more information on valuation inputs, please refer to the Investment Valuation section in the accompanying Notes to Financial Statements. |
See accompanying notes which are an integral part of the financial statements.
Semiannual Report
Fidelity Advisor Freedom Income Fund
Statement of Assets and Liabilities
| September 30, 2013 (Unaudited) |
| | |
Assets | | |
Investment in securities, at value (cost $293,638,050) - See accompanying schedule | | $ 310,835,552 |
Receivable for investments sold | | 145,198 |
Receivable for fund shares sold | | 692,494 |
Total assets | | 311,673,244 |
| | |
Liabilities | | |
Payable for investments purchased | $ 14,598 | |
Payable for fund shares redeemed | 826,140 | |
Distribution and service plan fees payable | 70,500 | |
Total liabilities | | 911,238 |
| | |
Net Assets | | $ 310,762,006 |
Net Assets consist of: | | |
Paid in capital | | $ 291,457,188 |
Undistributed net investment income | | 247,867 |
Accumulated undistributed net realized gain (loss) on investments | | 1,859,449 |
Net unrealized appreciation (depreciation) on investments | | 17,197,502 |
Net Assets | | $ 310,762,006 |
| | |
Calculation of Maximum Offering Price Class A:
Net Asset Value and redemption price per share ($165,071,584 ÷ 14,867,864 shares) | | $ 11.10 |
| | |
Maximum offering price per share (100/94.25 of $11.10) | | $ 11.78 |
Class T:
Net Asset Value and redemption price per share ($50,693,440 ÷ 4,569,668 shares) | | $ 11.09 |
| | |
Maximum offering price per share (100/96.50 of $11.09) | | $ 11.49 |
Class B:
Net Asset Value and offering price per share ($1,979,421 ÷ 178,568 shares)A | | $ 11.08 |
| | |
Class C:
Net Asset Value and offering price per share ($15,537,051 ÷ 1,402,622 shares)A | | $ 11.08 |
| | |
Institutional Class:
Net Asset Value, offering price and redemption price per share ($77,480,510 ÷ 6,960,731 shares) | | $ 11.13 |
A Redemption price per share is equal to net asset value less any applicable contingent deferred sales charge.
Statement of Operations
Six months ended September 30, 2013 (Unaudited) |
| | |
Investment Income | | |
Income distributions from underlying funds | | $ 1,595,094 |
| | |
Expenses | | |
Distribution and service plan fees | $ 439,921 | |
Independent trustees' compensation | 605 | |
Total expenses before reductions | 440,526 | |
Expense reductions | (605) | 439,921 |
Net investment income (loss) | | 1,155,173 |
Realized and Unrealized Gain (Loss) Realized gain (loss) on sale of underlying fund shares | 2,345,155 | |
Capital gain distributions from underlying funds | 239,454 | |
Total net realized gain (loss) | | 2,584,609 |
Change in net unrealized appreciation (depreciation) on underlying funds | | (2,143,775) |
Net gain (loss) | | 440,834 |
Net increase (decrease) in net assets resulting from operations | | $ 1,596,007 |
See accompanying notes which are an integral part of the financial statements.
Semiannual Report
Statement of Changes in Net Assets
| Six months ended
September 30, 2013
(Unaudited) | Year ended
March 31,
2013 |
Increase (Decrease) in Net Assets | | |
Operations | | |
Net investment income (loss) | $ 1,155,173 | $ 3,306,001 |
Net realized gain (loss) | 2,584,609 | 6,963,470 |
Change in net unrealized appreciation (depreciation) | (2,143,775) | 3,721,536 |
Net increase (decrease) in net assets resulting from operations | 1,596,007 | 13,991,007 |
Distributions to shareholders from net investment income | (1,158,318) | (3,274,495) |
Distributions to shareholders from net realized gain | (3,649,889) | (4,055,113) |
Total distributions | (4,808,207) | (7,329,608) |
Share transactions - net increase (decrease) | (13,511,315) | 17,611,622 |
Total increase (decrease) in net assets | (16,723,515) | 24,273,021 |
| | |
Net Assets | | |
Beginning of period | 327,485,521 | 303,212,500 |
End of period (including undistributed net investment income of $247,867 and undistributed net investment income of $251,012, respectively) | $ 310,762,006 | $ 327,485,521 |
Financial Highlights - Class A
| Six months ended
September 30, 2013 | Years ended March 31, |
| (Unaudited) | 2013 | 2012 | 2011 | 2010 | 2009 |
Selected Per-Share Data | | | | | | |
Net asset value, beginning of period | $ 11.21 | $ 10.98 | $ 10.85 | $ 10.35 | $ 8.74 | $ 10.46 |
Income from Investment Operations | | | | | | |
Net investment income (loss) E | .04 | .12 | .15 | .16 | .22 | .29 |
Net realized and unrealized gain (loss) | .02 | .37 | .21 | .57 | 1.66 | (1.60) |
Total from investment operations | .06 | .49 | .36 | .73 | 1.88 | (1.31) |
Distributions from net investment income | (.04) | (.12) | (.15) | (.16) | (.22) | (.30) |
Distributions from net realized gain | (.13) | (.14) | (.08) | (.07) | (.06) | (.11) |
Total distributions | (.17) | (.26) | (.23) | (.23) | (.27) H | (.41) |
Net asset value, end of period | $ 11.10 | $ 11.21 | $ 10.98 | $ 10.85 | $ 10.35 | $ 8.74 |
Total Return B, C, D | .51% | 4.53% | 3.34% | 7.11% | 21.74% | (12.78)% |
Ratios to Average Net Assets F, G | | | | | | |
Expenses before reductions | .25% A | .25% | .25% | .25% | .25% | .25% |
Expenses net of fee waivers, if any | .25% A | .25% | .25% | .25% | .25% | .25% |
Expenses net of all reductions | .25% A | .25% | .25% | .25% | .25% | .25% |
Net investment income (loss) | .74% A | 1.08% | 1.37% | 1.48% | 2.19% | 3.03% |
Supplemental Data | | | | | | |
Net assets, end of period (000 omitted) | $ 165,072 | $ 176,876 | $ 166,658 | $ 157,695 | $ 142,691 | $ 93,865 |
Portfolio turnover rate F | 11% A | 17% | 24% | 35% | 31% | 44% |
A Annualized
B Total returns for periods of less than one year are not annualized.
C Total returns would have been lower if certain expenses had not been reduced during the applicable periods shown.
D Total returns do not include the effect of the sales charges.
E Calculated based on average shares outstanding during the period.
F Amounts do not include the activity of the Underlying Funds.
G Expense ratios reflect operating expenses of the class. Expenses before reductions do not reflect amounts reimbursed by the investment adviser or reductions from expense offset arrangements and do not represent the amount paid by the class during periods when reimbursements or reductions occur. Expenses net of fee waivers reflect expenses after reimbursement by the investment adviser but prior to reductions from expense offset arrangements. Expenses net of all reductions represent the net expenses paid by the class but do not include expenses of the investment companies in which the Fund invests.
H Total distributions of $.27 per share is comprised of distributions from net investment income of $.217 and distributions from net realized gain of $.056 per share.
See accompanying notes which are an integral part of the financial statements.
Semiannual Report
Financial Highlights - Class T
| Six months ended
September 30, 2013 | Years ended March 31, |
| (Unaudited) | 2013 | 2012 | 2011 | 2010 | 2009 |
Selected Per-Share Data | | | | | | |
Net asset value, beginning of period | $ 11.20 | $ 10.96 | $ 10.84 | $ 10.34 | $ 8.73 | $ 10.45 |
Income from Investment Operations | | | | | | |
Net investment income (loss) E | .03 | .09 | .12 | .13 | .19 | .27 |
Net realized and unrealized gain (loss) | .01 | .38 | .20 | .57 | 1.67 | (1.61) |
Total from investment operations | .04 | .47 | .32 | .70 | 1.86 | (1.34) |
Distributions from net investment income | (.03) | (.09) | (.12) | (.13) | (.19) | (.27) |
Distributions from net realized gain | (.13) | (.14) | (.08) | (.07) | (.06) | (.11) |
Total distributions | (.15) I | (.23) | (.20) | (.20) | (.25) H | (.38) |
Net asset value, end of period | $ 11.09 | $ 11.20 | $ 10.96 | $ 10.84 | $ 10.34 | $ 8.73 |
Total Return B, C, D | .37% | 4.35% | 3.01% | 6.85% | 21.47% | (13.03)% |
Ratios to Average Net Assets F, G | | | | | | |
Expenses before reductions | .50% A | .50% | .50% | .50% | .50% | .50% |
Expenses net of fee waivers, if any | .50% A | .50% | .50% | .50% | .50% | .50% |
Expenses net of all reductions | .50% A | .50% | .50% | .50% | .50% | .50% |
Net investment income (loss) | .49% A | .83% | 1.12% | 1.23% | 1.94% | 2.78% |
Supplemental Data | | | | | | |
Net assets, end of period (000 omitted) | $ 50,693 | $ 53,734 | $ 56,246 | $ 57,404 | $ 52,047 | $ 42,675 |
Portfolio turnover rate F | 11% A | 17% | 24% | 35% | 31% | 44% |
A Annualized
B Total returns for periods of less than one year are not annualized.
C Total returns would have been lower if certain expenses had not been reduced during the applicable periods shown.
D Total returns do not include the effect of the sales charges.
E Calculated based on average shares outstanding during the period.
F Amounts do not include the activity of the Underlying Funds.
G Expense ratios reflect operating expenses of the class. Expenses before reductions do not reflect amounts reimbursed by the investment adviser or reductions from expense offset arrangements and do not represent the amount paid by the class during periods when reimbursements or reductions occur. Expenses net of fee waivers reflect expenses after reimbursement by the investment adviser but prior to reductions from expense offset arrangements. Expenses net of all reductions represent the net expenses paid by the class but do not include expenses of the investment companies in which the Fund invests.
H Total distributions of $.25 per share is comprised of distributions from net investment income of $.193 and distributions from net realized gain of $.056 per share.
I Total distributions of $.15 per share is comprised of distributions from net investment income of $.027 and distributions from net realized gain of $.125 per share.
Financial Highlights - Class B
| Six months ended
September 30, 2013 | Years ended March 31, |
| (Unaudited) | 2013 | 2012 | 2011 | 2010 | 2009 |
Selected Per-Share Data | | | | | | |
Net asset value, beginning of period | $ 11.19 | $ 10.96 | $ 10.84 | $ 10.33 | $ 8.72 | $ 10.44 |
Income from Investment Operations | | | | | | |
Net investment income (loss) E | - H | .04 | .07 | .08 | .14 | .22 |
Net realized and unrealized gain (loss) | .02 | .37 | .19 | .58 | 1.67 | (1.60) |
Total from investment operations | .02 | .41 | .26 | .66 | 1.81 | (1.38) |
Distributions from net investment income | - | (.04) | (.07) | (.08) | (.14) | (.23) |
Distributions from net realized gain | (.13) | (.14) | (.08) | (.07) | (.06) | (.11) |
Total distributions | (.13) | (.18) | (.14) J | (.15) | (.20) I | (.34) |
Net asset value, end of period | $ 11.08 | $ 11.19 | $ 10.96 | $ 10.84 | $ 10.33 | $ 8.72 |
Total Return B, C, D | .13% | 3.80% | 2.47% | 6.39% | 20.86% | (13.48)% |
Ratios to Average Net Assets F, G | | | | | | |
Expenses before reductions | 1.00% A | 1.00% | 1.00% | 1.00% | 1.00% | 1.00% |
Expenses net of fee waivers, if any | 1.00% A | 1.00% | 1.00% | 1.00% | 1.00% | 1.00% |
Expenses net of all reductions | 1.00% A | 1.00% | 1.00% | 1.00% | 1.00% | 1.00% |
Net investment income (loss) | (.01)% A | .33% | .62% | .73% | 1.44% | 2.28% |
Supplemental Data | | | | | | |
Net assets, end of period (000 omitted) | $ 1,979 | $ 2,294 | $ 2,889 | $ 3,938 | $ 5,319 | $ 4,282 |
Portfolio turnover rate F | 11% A | 17% | 24% | 35% | 31% | 44% |
A Annualized
B Total returns for periods of less than one year are not annualized.
C Total returns would have been lower if certain expenses had not been reduced during the applicable periods shown.
D Total returns do not include the effect of the contingent deferred sales charge.
E Calculated based on average shares outstanding during the period.
F Amounts do not include the activity of the Underlying Funds.
G Expense ratios reflect operating expenses of the class. Expenses before reductions do not reflect amounts reimbursed by the investment adviser or reductions from expense offset arrangements and do not represent the amount paid by the class during periods when reimbursements or reductions occur. Expenses net of fee waivers reflect expenses after reimbursement by the investment adviser but prior to reductions from expense offset arrangements. Expenses net of all reductions represent the net expenses paid by the class but do not include expenses of the investment companies in which the Fund invests.
H Amount represents less than $.01 per share.
I Total distributions of $.20 per share is comprised of distributions from net investment income of $.142 and distributions from net realized gain of $.056 per share.
J Total distributions of $.14 per share is comprised of distributions from net investment income of $.065 and distributions from net realized gain of $.079 per share.
See accompanying notes which are an integral part of the financial statements.
Semiannual Report
Financial Highlights - Class C
| Six months ended
September 30, 2013 | Years ended March 31, |
| (Unaudited) | 2013 | 2012 | 2011 | 2010 | 2009 |
Selected Per-Share Data | | | | | | |
Net asset value, beginning of period | $ 11.18 | $ 10.96 | $ 10.84 | $ 10.33 | $ 8.72 | $ 10.43 |
Income from Investment Operations | | | | | | |
Net investment income (loss) E | - H | .04 | .07 | .08 | .14 | .22 |
Net realized and unrealized gain (loss) | .03 | .36 | .20 | .58 | 1.67 | (1.60) |
Total from investment operations | .03 | .40 | .27 | .66 | 1.81 | (1.38) |
Distributions from net investment income | - | (.04) | (.07) | (.08) | (.14) | (.22) |
Distributions from net realized gain | (.13) | (.14) | (.08) | (.07) | (.06) | (.11) |
Total distributions | (.13) | (.18) | (.15) | (.15) | (.20) I | (.33) |
Net asset value, end of period | $ 11.08 | $ 11.18 | $ 10.96 | $ 10.84 | $ 10.33 | $ 8.72 |
Total Return B, C, D | .23% | 3.70% | 2.50% | 6.42% | 20.83% | (13.41)% |
Ratios to Average Net Assets F, G | | | | | | |
Expenses before reductions | 1.00% A | 1.00% | 1.00% | 1.00% | 1.00% | 1.00% |
Expenses net of fee waivers, if any | 1.00% A | 1.00% | 1.00% | 1.00% | 1.00% | 1.00% |
Expenses net of all reductions | 1.00% A | 1.00% | 1.00% | 1.00% | 1.00% | 1.00% |
Net investment income (loss) | (.01)% A | .33% | .62% | .73% | 1.44% | 2.28% |
Supplemental Data | | | | | | |
Net assets, end of period (000 omitted) | $ 15,537 | $ 16,606 | $ 17,170 | $ 16,581 | $ 14,697 | $ 11,362 |
Portfolio turnover rate F | 11% A | 17% | 24% | 35% | 31% | 44% |
A Annualized
B Total returns for periods of less than one year are not annualized.
C Total returns would have been lower if certain expenses had not been reduced during the applicable periods shown.
D Total returns do not include the effect of the contingent deferred sales charge.
E Calculated based on average shares outstanding during the period.
F Amounts do not include the activity of the Underlying Funds.
G Expense ratios reflect operating expenses of the class. Expenses before reductions do not reflect amounts reimbursed by the investment adviser or reductions from expense offset arrangements and do not represent the amount paid by the class during periods when reimbursements or reductions occur. Expenses net of fee waivers reflect expenses after reimbursement by the investment adviser but prior to reductions from expense offset arrangements. Expenses net of all reductions represent the net expenses paid by the class but do not include expenses of the investment companies in which the Fund invests.
H Amount represents less than $.01 per share.
I Total distributions of $.20 per share is comprised of distributions from net investment income of $.140 and distributions from net realized gain of $.056 per share.
Financial Highlights - Institutional Class
| Six months ended
September 30, 2013 | Years ended March 31, |
| (Unaudited) | 2013 | 2012 | 2011 | 2010 | 2009 |
Selected Per-Share Data | | | | | | |
Net asset value, beginning of period | $ 11.23 | $ 11.00 | $ 10.87 | $ 10.37 | $ 8.75 | $ 10.48 |
Income from Investment Operations | | | | | | |
Net investment income (loss) D | .06 | .15 | .18 | .18 | .24 | .31 |
Net realized and unrealized gain (loss) | .02 | .37 | .20 | .57 | 1.68 | (1.61) |
Total from investment operations | .08 | .52 | .38 | .75 | 1.92 | (1.30) |
Distributions from net investment income | (.05) | (.14) | (.17) | (.19) | (.24) | (.32) |
Distributions from net realized gain | (.13) | (.14) | (.08) | (.07) | (.06) | (.11) |
Total distributions | (.18) | (.29) J | (.25) | (.25) I | (.30) H | (.43) |
Net asset value, end of period | $ 11.13 | $ 11.23 | $ 11.00 | $ 10.87 | $ 10.37 | $ 8.75 |
Total Return B, C | .71% | 4.75% | 3.58% | 7.36% | 22.16% | (12.63)% |
Ratios to Average Net Assets E, G | | | | | | |
Expenses before reductions F | .00% A | .00% | .00% | .00% | .00% | .00% |
Expenses net of fee waivers, if any | .00% A | .00% | .00% | .00% | .00% | .00% |
Expenses net of all reductions | .00% A | .00% | .00% | .00% | .00% | .00% |
Net investment income (loss) | .99% A | 1.33% | 1.62% | 1.73% | 2.44% | 3.28% |
Supplemental Data | | | | | | |
Net assets, end of period (000 omitted) | $ 77,481 | $ 77,976 | $ 60,248 | $ 32,640 | $ 18,137 | $ 8,461 |
Portfolio turnover rate E | 11% A | 17% | 24% | 35% | 31% | 44% |
A Annualized
B Total returns for periods of less than one year are not annualized.
C Total returns would have been lower if certain expenses had not been reduced during the applicable periods shown.
D Calculated based on average shares outstanding during the period.
E Amounts do not include the activity of the Underlying Funds.
F Amount represents less than .01%.
G Expense ratios reflect operating expenses of the class. Expenses before reductions do not reflect amounts reimbursed by the investment adviser or reductions from expense offset arrangements and do not represent the amount paid by the class during periods when reimbursements or reductions occur. Expenses net of fee waivers reflect expenses after reimbursement by the investment adviser but prior to reductions from expense offset arrangements. Expenses net of all reductions represent the net expenses paid by the class but do not include expenses of the investment companies in which the Fund invests.
H Total distributions of $.30 per share is comprised of distributions from net investment income of $.243 and distributions from net realized gain of $.056 per share.
I Total distributions of $.25 per share is comprised of distributions from net investment income of $.186 and distributions from net realized gain of $.067 per share.
J Total distributions of $.29 per share is comprised of distributions from net investment income of $.144 and distributions from net realized gain of $.141 per share.
See accompanying notes which are an integral part of the financial statements.
Semiannual Report
Fidelity Advisor Freedom 2005 Fund
Investment Changes (Unaudited)
The information in the following tables is based on the direct investments of the Fund. |
Fund Holdings as of September 30, 2013 |
| % of fund's
net assets | % of fund's net assets
6 months ago |
Commodity Funds | | |
Fidelity Series Commodity Strategy Fund | 3.5 | 3.7 |
Domestic Equity Funds | | |
Fidelity Advisor Equity Growth Fund Institutional Class | 3.0 | 3.0 |
Fidelity Advisor Growth & Income Fund Institutional Class | 0.0 | 1.6 |
Fidelity Advisor Large Cap Fund Institutional Class | 1.5 | 1.6 |
Fidelity Advisor Series Equity-Income Fund | 2.0 | 2.1 |
Fidelity Advisor Series Growth & Income Fund (formerly Fidelity Advisor Series Mega Cap Fund) | 2.0 | 0.5 |
Fidelity Advisor Series Opportunistic Insights Fund | 1.6 | 1.5 |
Fidelity Advisor Series Stock Selector Large Cap Value Fund | 2.0 | 2.2 |
Fidelity Advisor Small Cap Fund Institutional Class | 1.2 | 1.2 |
Fidelity Series 100 Index Fund | 0.5 | 0.5 |
Fidelity Series All-Sector Equity Fund | 3.8 | 4.0 |
Fidelity Series Large Cap Value Fund | 2.0 | 2.3 |
Fidelity Series Real Estate Equity Fund | 0.3 | 0.4 |
Fidelity Series Small Cap Opportunities Fund | 1.4 | 1.4 |
| 21.3 | 22.3 |
Developed International Equity Funds | | |
Fidelity Series International Growth Fund | 3.3 | 3.4 |
Fidelity Series International Small Cap Fund | 0.7 | 0.7 |
Fidelity Series International Value Fund | 3.3 | 3.3 |
| 7.3 | 7.4 |
Emerging Markets Equity Funds | | |
Fidelity Series Emerging Markets Fund | 2.0 | 2.0 |
High Yield Bond Funds | | |
Fidelity Series Emerging Markets Debt Fund | 0.6 | 0.6 |
Fidelity Series Floating Rate High Income Fund | 1.1 | 1.1 |
Fidelity Series High Income Fund | 4.8 | 4.8 |
Fidelity Series Real Estate Income Fund | 0.5 | 0.5 |
| 7.0 | 7.0 |
Inflation-Protected Bond Funds | | |
Fidelity Series Inflation-Protected Bond Index Fund | 8.9 | 9.1 |
Investment Grade Bond Funds | | |
Fidelity Series Investment Grade Bond Fund | 17.9 | 18.1 |
Short-Term Funds | | |
Fidelity Advisor Short Fixed-Income Fund Institutional Class | 14.5 | 13.7 |
Fidelity Institutional Money Market Portfolio Institutional Class | 17.6 | 16.7 |
| 32.1 | 30.4 |
Net Other Assets (Liabilities)* | 0.0 | 0.0 |
| 100.0 | 100.0 |
* Amount represents less than 0.1% |
Asset Allocation (% of fund's net assets) |
Period end |
| Commodity Funds | 3.5% | |
| Domestic Equity Funds | 21.3% | |
| Developed International Equity Funds | 7.3% | |
| Emerging Markets Equity Funds | 2.0% | |
| High Yield Bond Funds | 7.0% | |
| Inflation-Protected Bond Funds | 8.9% | |
| Investment Grade Bond Funds | 17.9% | |
| Short-Term Funds | 32.1% | |

Six months ago |
| Commodity Funds | 3.7% | |
| Domestic Equity Funds | 22.3% | |
| Developed International Equity Funds | 7.4% | |
| Emerging Markets Equity Funds | 2.0% | |
| High Yield Bond Funds | 7.0% | |
| Inflation-Protected Bond Funds | 9.1% | |
| Investment Grade Bond Funds | 18.1% | |
| Short-Term Funds | 30.4% | |

Semiannual Report
Fidelity Advisor Freedom 2005 Fund
Investments September 30, 2013 (Unaudited)
Showing Percentage of Net Assets
Domestic Equity Funds - 24.8% |
| Shares | | Value |
Commodity Funds - 3.5% |
Fidelity Series Commodity Strategy Fund (a)(c) | 1,344,988 | | $ 10,773,354 |
Domestic Equity Funds - 21.3% |
Fidelity Advisor Equity Growth Fund Institutional Class (c) | 111,593 | | 9,181,841 |
Fidelity Advisor Large Cap Fund Institutional Class (c) | 171,061 | | 4,601,541 |
Fidelity Advisor Series Equity-Income Fund (c) | 522,290 | | 6,157,801 |
Fidelity Advisor Series Growth & Income Fund (c) | 510,814 | | 6,155,310 |
Fidelity Advisor Series Opportunistic Insights Fund (c) | 374,976 | | 4,829,697 |
Fidelity Advisor Series Stock Selector Large Cap Value Fund (c) | 508,020 | | 6,182,598 |
Fidelity Advisor Small Cap Fund Institutional Class (c) | 119,159 | | 3,631,975 |
Fidelity Series 100 Index Fund (c) | 131,556 | | 1,457,645 |
Fidelity Series All-Sector Equity Fund (c) | 803,057 | | 11,371,291 |
Fidelity Series Large Cap Value Fund (c) | 472,281 | | 5,964,912 |
Fidelity Series Real Estate Equity Fund (c) | 82,916 | | 991,674 |
Fidelity Series Small Cap Opportunities Fund (c) | 324,698 | | 4,165,874 |
TOTAL DOMESTIC EQUITY FUNDS | | 64,692,159 |
TOTAL DOMESTIC EQUITY FUNDS (Cost $62,727,786) |
75,465,513
|
International Equity Funds - 9.3% |
| | | |
Developed International Equity Funds - 7.3% |
Fidelity Series International Growth Fund (c) | 730,880 | | 9,918,037 |
Fidelity Series International Small Cap Fund (c) | 137,612 | | 2,104,091 |
Fidelity Series International Value Fund (c) | 931,320 | | 10,011,694 |
TOTAL DEVELOPED INTERNATIONAL EQUITY FUNDS | | 22,033,822 |
Emerging Markets Equity Funds - 2.0% |
Fidelity Series Emerging Markets Fund (c) | 370,175 | | 6,196,731 |
TOTAL INTERNATIONAL EQUITY FUNDS (Cost $22,865,686) |
28,230,553
|
Bond Funds - 33.8% |
| Shares | | Value |
High Yield Bond Funds - 7.0% |
Fidelity Series Emerging Markets Debt Fund (c) | 179,182 | | $ 1,813,326 |
Fidelity Series Floating Rate High Income Fund (c) | 324,736 | | 3,435,705 |
Fidelity Series High Income Fund (c) | 1,430,222 | | 14,702,678 |
Fidelity Series Real Estate Income Fund (c) | 124,161 | | 1,363,291 |
TOTAL HIGH YIELD BOND FUNDS | | 21,315,000 |
Inflation-Protected Bond Funds - 8.9% |
Fidelity Series Inflation-Protected Bond Index Fund (c) | 2,492,121 | | 27,039,508 |
Investment Grade Bond Funds - 17.9% |
Fidelity Series Investment Grade Bond Fund (c) | 4,881,794 | | 54,627,275 |
TOTAL BOND FUNDS (Cost $101,292,286) |
102,981,783
|
Short-Term Funds - 32.1% |
| | | |
Fidelity Advisor Short Fixed-Income Fund Institutional Class (c) | 4,707,741 | | 43,923,221 |
Fidelity Institutional Money Market Portfolio Institutional Class 0.04% (b)(c) | 53,651,862 | | 53,651,862 |
TOTAL SHORT-TERM FUNDS (Cost $97,138,152) |
97,575,083
|
TOTAL INVESTMENT PORTFOLIO - 100.0% (Cost $284,023,910) | | 304,252,932 |
NET OTHER ASSETS (LIABILITIES) - 0.0% | | (61,670) |
NET ASSETS - 100% | $ 304,191,262 |
Legend |
(a) Non-income producing |
(b) The rate quoted is the annualized seven-day yield of the fund at period end. |
(c) Affiliated company |
Affiliated Underlying Funds |
Information regarding the Fund's fiscal year to date purchases and sales of the affiliated Underlying Funds and income earned by the Fund from investments in affiliated Underlying Funds is as follows: |
Affiliate | Value,
beginning of
period | Purchases | Sales
Proceeds | Dividend
Income | Value,
end of
period |
Fidelity Advisor Equity Growth Fund Institutional Class | $ 9,259,781 | $ 520,230 | $ 1,974,975 | $ - | $ 9,181,841 |
Fidelity Advisor Growth & Income Fund Institutional Class | 4,932,891 | 199,148 | 5,560,081 | - | - |
Fidelity Advisor Large Cap Fund Institutional Class | 4,939,271 | 262,159 | 1,215,649 | - | 4,601,541 |
Fidelity Advisor Series Equity-Income Fund | 6,678,206 | 466,077 | 1,384,750 | 65,338 | 6,157,801 |
Fidelity Advisor Series Growth & Income Fund (formerly Fidelity Advisor Series Mega Cap Fund) | 1,486,283 | 4,833,068 | 361,434 | - | 6,155,310 |
Fidelity Advisor Series Opportunistic Insights Fund | 4,718,776 | 269,673 | 906,801 | - | 4,829,697 |
Fidelity Advisor Series Stock Selector Large Cap Value Fund | 6,717,864 | 372,783 | 1,479,039 | - | 6,182,598 |
Fidelity Advisor Short Fixed-Income Fund Institutional Class | 42,520,470 | 5,838,600 | 4,298,304 | 167,651 | 43,923,221 |
Fidelity Advisor Small Cap Fund Institutional Class | 3,791,219 | 205,813 | 823,653 | - | 3,631,975 |
Fidelity Institutional Money Market Portfolio Institutional Class | 51,920,042 | 6,847,166 | 5,115,346 | 30,348 | 53,651,862 |
Fidelity Series 100 Index Fund | 1,544,268 | 85,620 | 284,064 | - | 1,457,645 |
Fidelity Series All-Sector Equity Fund | 12,345,820 | 660,442 | 2,822,961 | - | 11,371,291 |
Fidelity Series Commodity Strategy Fund | 11,606,286 | 1,341,967 | 1,267,033 | - | 10,773,354 |
Fidelity Series Emerging Markets Debt Fund | 1,922,638 | 139,672 | 114,208 | 48,886 | 1,813,326 |
Fidelity Series Emerging Markets Fund | 6,352,622 | 493,091 | 654,984 | - | 6,196,731 |
Fidelity Series Floating Rate High Income Fund | 3,388,054 | 324,393 | 260,177 | 74,701 | 3,435,705 |
Fidelity Series High Income Fund | 14,966,543 | 1,566,111 | 1,506,943 | 386,994 | 14,702,678 |
Fidelity Series Inflation-Protected Bond Index Fund | 28,253,550 | 2,855,807 | 2,728,030 | - | 27,039,508 |
Fidelity Series International Growth Fund | 10,396,703 | 650,903 | 1,821,495 | - | 9,918,037 |
Fidelity Series International Small Cap Fund | 2,144,791 | 123,484 | 388,693 | - | 2,104,091 |
Fidelity Series International Value Fund | 10,285,665 | 620,217 | 1,802,498 | - | 10,011,694 |
Fidelity Series Investment Grade Bond Fund | 55,981,719 | 5,609,985 | 5,298,990 | 573,611 | 54,627,275 |
Fidelity Series Large Cap Value Fund | 7,189,173 | 361,568 | 2,171,660 | - | 5,964,912 |
Fidelity Series Real Estate Equity Fund | 1,108,307 | 103,912 | 139,979 | 6,749 | 991,674 |
Fidelity Series Real Estate Income Fund | 1,458,849 | 105,288 | 118,445 | 40,788 | 1,363,291 |
Fidelity Series Small Cap Opportunities Fund | 4,413,628 | 541,184 | 992,865 | 1 | 4,165,874 |
Total | $ 310,323,419 | $ 35,398,361 | $ 45,493,057 | $ 1,395,067 | $ 304,252,932 |
Other Information |
All investments are categorized as Level 1 under the Fair Value Hierarchy. The inputs or methodology used for valuing securities may not be an indication of the risk associated with investing in those securities. For more information on valuation inputs, please refer to the Investment Valuation section in the accompanying Notes to Financial Statements. |
See accompanying notes which are an integral part of the financial statements.
Semiannual Report
Fidelity Advisor Freedom 2005 Fund
Statement of Assets and Liabilities
| September 30, 2013 (Unaudited) |
| | |
Assets | | |
Investment in securities, at value (cost $284,023,910) - See accompanying schedule | | $ 304,252,932 |
Cash | | 9 |
Receivable for investments sold | | 272,038 |
Receivable for fund shares sold | | 162,830 |
Receivable from investment adviser for expense reductions | | 24 |
Total assets | | 304,687,833 |
| | |
Liabilities | | |
Payable for investments purchased | $ 3 | |
Payable for fund shares redeemed | 435,890 | |
Distribution and service plan fees payable | 60,678 | |
Total liabilities | | 496,571 |
| | |
Net Assets | | $ 304,191,262 |
Net Assets consist of: | | |
Paid in capital | | $ 280,417,458 |
Undistributed net investment income | | 1,029,486 |
Accumulated undistributed net realized gain (loss) on investments | | 2,515,296 |
Net unrealized appreciation (depreciation) on investments | | 20,229,022 |
Net Assets | | $ 304,191,262 |
| |
Calculation of Maximum Offering Price Class A:
Net Asset Value and redemption price per share ($196,039,349 ÷ 16,312,385 shares) | | $ 12.02 |
| | |
Maximum offering price per share (100/94.25 of $12.02) | | $ 12.75 |
Class T:
Net Asset Value and redemption price per share ($27,842,962 ÷ 2,318,854 shares) | | $ 12.01 |
| | |
Maximum offering price per share (100/96.50 of $12.01) | | $ 12.45 |
Class B:
Net Asset Value and offering price per share ($1,125,149 ÷ 93,602 shares)A | | $ 12.02 |
| | |
Class C:
Net Asset Value and offering price per share ($8,990,623 ÷ 751,342 shares)A | | $ 11.97 |
| | |
Institutional Class:
Net Asset Value, offering price and redemption price per share ($70,193,179 ÷ 5,802,313 shares) | | $ 12.10 |
A Redemption price per share is equal to net asset value less any applicable contingent deferred sales charge.
Statement of Operations
Six months ended September 30, 2013 (Unaudited) |
| | |
Investment Income | | |
Income distributions from underlying funds | | $ 1,395,067 |
| | |
Expenses | | |
Distribution and service plan fees | $ 365,792 | |
Independent trustees' compensation | 575 | |
Total expenses before reductions | 366,367 | |
Expense reductions | (575) | 365,792 |
Net investment income (loss) | | 1,029,275 |
Realized and Unrealized Gain (Loss) Realized gain (loss) on sale of underlying fund shares | 3,290,289 | |
Capital gain distributions from underlying funds | 369,083 | |
Total net realized gain (loss) | | 3,659,372 |
Change in net unrealized appreciation (depreciation) on underlying funds | | 733,921 |
Net gain (loss) | | 4,393,293 |
Net increase (decrease) in net assets resulting from operations | | $ 5,422,568 |
See accompanying notes which are an integral part of the financial statements.
Semiannual Report
Fidelity Advisor Freedom 2005 Fund
Financial Statements - continued
Statement of Changes in Net Assets
| Six months ended September 30, 2013 (Unaudited) | Year ended
March 31,
2013 |
Increase (Decrease) in Net Assets | | |
Operations | | |
Net investment income (loss) | $ 1,029,275 | $ 3,323,059 |
Net realized gain (loss) | 3,659,372 | 12,719,737 |
Change in net unrealized appreciation (depreciation) | 733,921 | 462,584 |
Net increase (decrease) in net assets resulting from operations | 5,422,568 | 16,505,380 |
Distributions to shareholders from net investment income | (456,504) | (3,357,002) |
Distributions to shareholders from net realized gain | (1,900,701) | (1,779,655) |
Total distributions | (2,357,205) | (5,136,657) |
Share transactions - net increase (decrease) | (9,137,237) | 26,042,535 |
Total increase (decrease) in net assets | (6,071,874) | 37,411,258 |
| | |
Net Assets | | |
Beginning of period | 310,263,136 | 272,851,878 |
End of period (including undistributed net investment income of $1,029,486 and undistributed net investment income of $456,715, respectively) | $ 304,191,262 | $ 310,263,136 |
Financial Highlights - Class A
| Six months ended
September 30, 2013 | Years ended March 31, |
| (Unaudited) | 2013 | 2012 | 2011 | 2010 | 2009 |
Selected Per-Share Data | | | | | | |
Net asset value, beginning of period | $ 11.90 | $ 11.45 | $ 11.45 | $ 10.57 | $ 8.10 | $ 11.40 |
Income from Investment Operations | | | | | | |
Net investment income (loss) E | .04 | .13 | .15 | .15 | .20 | .27 |
Net realized and unrealized gain (loss) | .17 | .53 | .13 | .97 | 2.53 | (3.06) |
Total from investment operations | .21 | .66 | .28 | 1.12 | 2.73 | (2.79) |
Distributions from net investment income | (.02) | (.13) | (.15) | (.15) | (.19) | (.28) |
Distributions from net realized gain | (.07) | (.07) | (.13) | (.09) | (.07) | (.23) |
Total distributions | (.09) | (.21) H | (.28) | (.24) | (.26) | (.51) |
Net asset value, end of period | $ 12.02 | $ 11.90 | $ 11.45 | $ 11.45 | $ 10.57 | $ 8.10 |
Total Return B, C, D | 1.77% | 5.79% | 2.53% | 10.72% | 33.91% | (25.09)% |
Ratios to Average Net Assets F, G | | | | | | |
Expenses before reductions | .25% A | .25% | .25% | .25% | .25% | .25% |
Expenses net of fee waivers, if any | .25% A | .25% | .25% | .25% | .25% | .25% |
Expenses net of all reductions | .25% A | .25% | .25% | .25% | .25% | .25% |
Net investment income (loss) | .66% A | 1.16% | 1.37% | 1.37% | 2.01% | 2.75% |
Supplemental Data | | | | | | |
Net assets, end of period (000 omitted) | $ 196,039 | $ 204,418 | $ 193,977 | $ 177,385 | $ 155,482 | $ 88,593 |
Portfolio turnover rate F | 23% A | 23% | 28% | 41% | 35% | 54% |
A Annualized
B Total returns for periods of less than one year are not annualized.
C Total returns would have been lower if certain expenses had not been reduced during the applicable periods shown.
D Total returns do not include the effect of the sales charges.
E Calculated based on average shares outstanding during the period.
F Amounts do not include the activity of the Underlying Funds.
G Expense ratios reflect operating expenses of the class. Expenses before reductions do not reflect amounts reimbursed by the investment adviser or reductions from expense offset arrangements and do not represent the amount paid by the class during periods when reimbursements or reductions occur. Expenses net of fee waivers reflect expenses after reimbursement by the investment adviser but prior to reductions from expense offset arrangements. Expenses net of all reductions represent the net expenses paid by the class but do not include expenses of the investment companies in which the Fund invests.
H Total distributions of $.21 per share is comprised of distributions from net investment income of $.134 and distributions from net realized gain of $.071 per share.
See accompanying notes which are an integral part of the financial statements.
Semiannual Report
Financial Highlights - Class T
| Six months ended
September 30, 2013 | Years ended March 31, |
| (Unaudited) | 2013 | 2012 | 2011 | 2010 | 2009 |
Selected Per-Share Data | | | | | | |
Net asset value, beginning of period | $ 11.90 | $ 11.45 | $ 11.45 | $ 10.57 | $ 8.10 | $ 11.39 |
Income from Investment Operations | | | | | | |
Net investment income (loss) E | .02 | .11 | .13 | .12 | .17 | .25 |
Net realized and unrealized gain (loss) | .17 | .52 | .12 | .97 | 2.54 | (3.06) |
Total from investment operations | .19 | .63 | .25 | 1.09 | 2.71 | (2.81) |
Distributions from net investment income | (.01) | (.11) | (.12) | (.12) | (.17) | (.25) |
Distributions from net realized gain | (.07) | (.07) | (.13) | (.09) | (.07) | (.23) |
Total distributions | (.08) | (.18) | (.25) | (.21) | (.24) | (.48) |
Net asset value, end of period | $ 12.01 | $ 11.90 | $ 11.45 | $ 11.45 | $ 10.57 | $ 8.10 |
Total Return B, C, D | 1.63% | 5.56% | 2.25% | 10.42% | 33.61% | (25.27)% |
Ratios to Average Net Assets F, G | | | | | | |
Expenses before reductions | .50% A | .50% | .50% | .50% | .50% | .50% |
Expenses net of fee waivers, if any | .50% A | .50% | .50% | .50% | .50% | .50% |
Expenses net of all reductions | .50% A | .50% | .50% | .50% | .50% | .50% |
Net investment income (loss) | .41% A | .91% | 1.12% | 1.12% | 1.76% | 2.50% |
Supplemental Data | | | | | | |
Net assets, end of period (000 omitted) | $ 27,843 | $ 26,201 | $ 22,316 | $ 21,658 | $ 23,113 | $ 14,437 |
Portfolio turnover rate F | 23% A | 23% | 28% | 41% | 35% | 54% |
A Annualized
B Total returns for periods of less than one year are not annualized.
C Total returns would have been lower if certain expenses had not been reduced during the applicable periods shown.
D Total returns do not include the effect of the sales charges.
E Calculated based on average shares outstanding during the period.
F Amounts do not include the activity of the Underlying Funds.
G Expense ratios reflect operating expenses of the class. Expenses before reductions do not reflect amounts reimbursed by the investment adviser or reductions from expense offset arrangements and do not represent the amount paid by the class during periods when reimbursements or reductions occur. Expenses net of fee waivers reflect expenses after reimbursement by the investment adviser but prior to reductions from expense offset arrangements. Expenses net of all reductions represent the net expenses paid by the class but do not include expenses of the investment companies in which the Fund invests.
Financial Highlights - Class B
| Six months ended
September 30, 2013 | Years ended March 31, |
| (Unaudited) | 2013 | 2012 | 2011 | 2010 | 2009 |
Selected Per-Share Data | | | | | | |
Net asset value, beginning of period | $ 11.93 | $ 11.47 | $ 11.45 | $ 10.56 | $ 8.09 | $ 11.37 |
Income from Investment Operations | | | | | | |
Net investment income (loss) E | (.01) | .05 | .07 | .07 | .12 | .20 |
Net realized and unrealized gain (loss) | .17 | .52 | .12 | .97 | 2.53 | (3.06) |
Total from investment operations | .16 | .57 | .19 | 1.04 | 2.65 | (2.86) |
Distributions from net investment income | - | (.04) | (.05) | (.07) | (.11) | (.19) |
Distributions from net realized gain | (.07) | (.07) | (.12) | (.09) | (.07) | (.23) |
Total distributions | (.07) | (.11) | (.17) | (.15) H | (.18) | (.42) |
Net asset value, end of period | $ 12.02 | $ 11.93 | $ 11.47 | $ 11.45 | $ 10.56 | $ 8.09 |
Total Return B, C, D | 1.35% | 5.00% | 1.73% | 9.94% | 32.90% | (25.69)% |
Ratios to Average Net Assets F, G | | | | | | |
Expenses before reductions | 1.00% A | 1.00% | 1.00% | 1.00% | 1.00% | 1.00% |
Expenses net of fee waivers, if any | 1.00% A | 1.00% | 1.00% | 1.00% | 1.00% | 1.00% |
Expenses net of all reductions | 1.00% A | 1.00% | 1.00% | 1.00% | 1.00% | 1.00% |
Net investment income (loss) | (.09)% A | .41% | .62% | .62% | 1.26% | 2.00% |
Supplemental Data | | | | | | |
Net assets, end of period (000 omitted) | $ 1,125 | $ 1,162 | $ 1,571 | $ 2,338 | $ 2,986 | $ 2,692 |
Portfolio turnover rate F | 23% A | 23% | 28% | 41% | 35% | 54% |
A Annualized
B Total returns for periods of less than one year are not annualized.
C Total returns would have been lower if certain expenses had not been reduced during the applicable periods shown.
D Total returns do not include the effect of the contingent deferred sales charge.
E Calculated based on average shares outstanding during the period.
F Amounts do not include the activity of the Underlying Funds.
G Expense ratios reflect operating expenses of the class. Expenses before reductions do not reflect amounts reimbursed by the investment adviser or reductions from expense offset arrangements and do not represent the amount paid by the class during periods when reimbursements or reductions occur. Expenses net of fee waivers reflect expenses after reimbursement by the investment adviser but prior to reductions from expense offset arrangements. Expenses net of all reductions represent the net expenses paid by the class but do not include expenses of the investment companies in which the Fund invests.
H Total distributions of $.15 per share is comprised of distributions from net investment income of $.065 and distributions from net realized gain of $.087 per share.
See accompanying notes which are an integral part of the financial statements.
Semiannual Report
Financial Highlights - Class C
| Six months ended
September 30, 2013 | Years ended March 31, |
| (Unaudited) | 2013 | 2012 | 2011 | 2010 | 2009 |
Selected Per-Share Data | | | | | | |
Net asset value, beginning of period | $ 11.87 | $ 11.42 | $ 11.42 | $ 10.54 | $ 8.08 | $ 11.34 |
Income from Investment Operations | | | | | | |
Net investment income (loss) E | (.01) | .05 | .07 | .07 | .12 | .20 |
Net realized and unrealized gain (loss) | .18 | .52 | .11 | .97 | 2.53 | (3.04) |
Total from investment operations | .17 | .57 | .18 | 1.04 | 2.65 | (2.84) |
Distributions from net investment income | - | (.05) | (.07) | (.07) | (.12) | (.19) |
Distributions from net realized gain | (.07) | (.07) | (.12) | (.09) | (.07) | (.23) |
Total distributions | (.07) | (.12) | (.18) H | (.16) | (.19) | (.42) |
Net asset value, end of period | $ 11.97 | $ 11.87 | $ 11.42 | $ 11.42 | $ 10.54 | $ 8.08 |
Total Return B, C, D | 1.44% | 5.01% | 1.66% | 9.91% | 32.90% | (25.61)% |
Ratios to Average Net Assets F, G | | | | | | |
Expenses before reductions | 1.00% A | 1.00% | 1.00% | 1.00% | 1.00% | 1.00% |
Expenses net of fee waivers, if any | 1.00% A | 1.00% | 1.00% | 1.00% | 1.00% | 1.00% |
Expenses net of all reductions | 1.00% A | 1.00% | 1.00% | 1.00% | 1.00% | 1.00% |
Net investment income (loss) | (.09)% A | .41% | .62% | .62% | 1.26% | 2.00% |
Supplemental Data | | | | | | |
Net assets, end of period (000 omitted) | $ 8,991 | $ 8,118 | $ 8,053 | $ 8,679 | $ 9,377 | $ 6,761 |
Portfolio turnover rate F | 23% A | 23% | 28% | 41% | 35% | 54% |
A Annualized
B Total returns for periods of less than one year are not annualized.
C Total returns would have been lower if certain expenses had not been reduced during the applicable periods shown.
D Total returns do not include the effect of the contingent deferred sales charge.
E Calculated based on average shares outstanding during the period.
F Amounts do not include the activity of the Underlying Funds.
G Expense ratios reflect operating expenses of the class. Expenses before reductions do not reflect amounts reimbursed by the investment adviser or reductions from expense offset arrangements and do not represent the amount paid by the class during periods when reimbursements or reductions occur. Expenses net of fee waivers reflect expenses after reimbursement by the investment adviser but prior to reductions from expense offset arrangements. Expenses net of all reductions represent the net expenses paid by the class but do not include expenses of the investment companies in which the Fund invests.
H Total distributions of $.18 per share is comprised of distributions from net investment income of $.065 and distributions from net realized gain of $.115 per share.
Financial Highlights - Institutional Class
| Six months ended
September 30, 2013 | Years ended March 31, |
| (Unaudited) | 2013 | 2012 | 2011 | 2010 | 2009 |
Selected Per-Share Data | | | | | | |
Net asset value, beginning of period | $ 11.97 | $ 11.51 | $ 11.52 | $ 10.63 | $ 8.14 | $ 11.46 |
Income from Investment Operations | | | | | | |
Net investment income (loss) D | .05 | .16 | .18 | .18 | .22 | .29 |
Net realized and unrealized gain (loss) | .18 | .53 | .11 | .98 | 2.55 | (3.07) |
Total from investment operations | .23 | .69 | .29 | 1.16 | 2.77 | (2.78) |
Distributions from net investment income | (.02) | (.16) | (.18) | (.18) | (.21) | (.31) |
Distributions from net realized gain | (.07) | (.07) | (.13) | (.09) | (.07) | (.23) |
Total distributions | (.10) I | (.23) | (.30) H | (.27) | (.28) | (.54) |
Net asset value, end of period | $ 12.10 | $ 11.97 | $ 11.51 | $ 11.52 | $ 10.63 | $ 8.14 |
Total Return B, C | 1.90% | 6.11% | 2.67% | 11.02% | 34.28% | (24.93)% |
Ratios to Average Net Assets E, G | | | | | | |
Expenses before reductions F | .00% A | .00% | .00% | .00% | .00% | .00% |
Expenses net of fee waivers, if any | .00% A | .00% | .00% | .00% | .00% | .00% |
Expenses net of all reductions | .00% A | .00% | .00% | .00% | .00% | .00% |
Net investment income (loss) | .91% A | 1.41% | 1.62% | 1.62% | 2.26% | 3.00% |
Supplemental Data | | | | | | |
Net assets, end of period (000 omitted) | $ 70,193 | $ 70,364 | $ 46,935 | $ 35,069 | $ 18,775 | $ 9,313 |
Portfolio turnover rate E | 23% A | 23% | 28% | 41% | 35% | 54% |
A Annualized
B Total returns for periods of less than one year are not annualized.
C Total returns would have been lower if certain expenses had not been reduced during the applicable periods shown.
D Calculated based on average shares outstanding during the period.
E Amounts do not include the activity of the Underlying Funds.
F Amount represents less than .01%.
G Expense ratios reflect operating expenses of the class. Expenses before reductions do not reflect amounts reimbursed by the investment adviser or reductions from expense offset arrangements and do not represent the amount paid by the class during periods when reimbursements or reductions occur. Expenses net of fee waivers reflect expenses after reimbursement by the investment adviser but prior to reductions from expense offset arrangements. Expenses net of all reductions represent the net expenses paid by the class but do not include expenses of the investment companies in which the Fund invests.
H Total distributions of $.30 per share is comprised of distributions from net investment income of $.175 and distributions from net realized gain of $.128 per share.
I Total distributions of $.10 per share is comprised of distributions from net investment income of $.024 and distributions from net realized gain of $.073 per share.
See accompanying notes which are an integral part of the financial statements.
Semiannual Report
Fidelity Advisor Freedom 2010 Fund
Investment Changes (Unaudited)
The information in the following tables is based on the direct investments of the Fund. |
Fund Holdings as of September 30, 2013 |
| % of fund's
net assets | % of fund's net assets
6 months ago |
Commodity Funds | | |
Fidelity Series Commodity Strategy Fund | 5.0 | 5.1 |
Domestic Equity Funds | | |
Fidelity Advisor Equity Growth Fund Institutional Class | 4.3 | 4.1 |
Fidelity Advisor Growth & Income Fund Institutional Class | 0.0 | 2.2 |
Fidelity Advisor Large Cap Fund Institutional Class | 2.1 | 2.2 |
Fidelity Advisor Series Equity-Income Fund | 2.9 | 3.0 |
Fidelity Advisor Series Growth & Income Fund (formerly Fidelity Advisor Series Mega Cap Fund) | 2.8 | 0.7 |
Fidelity Advisor Series Opportunistic Insights Fund | 2.3 | 2.1 |
Fidelity Advisor Series Stock Selector Large Cap Value Fund | 2.9 | 3.1 |
Fidelity Advisor Small Cap Fund Institutional Class | 1.7 | 1.7 |
Fidelity Series 100 Index Fund | 0.7 | 0.7 |
Fidelity Series All-Sector Equity Fund | 5.3 | 5.4 |
Fidelity Series Large Cap Value Fund | 2.9 | 3.1 |
Fidelity Series Real Estate Equity Fund | 0.4 | 0.5 |
Fidelity Series Small Cap Opportunities Fund | 1.9 | 1.9 |
| 30.2 | 30.7 |
Developed International Equity Funds | | |
Fidelity Series International Growth Fund | 4.7 | 4.6 |
Fidelity Series International Small Cap Fund | 1.0 | 0.9 |
Fidelity Series International Value Fund | 4.7 | 4.6 |
| 10.4 | 10.1 |
Emerging Markets Equity Funds | | |
Fidelity Series Emerging Markets Fund | 2.8 | 2.8 |
High Yield Bond Funds | | |
Fidelity Series Emerging Markets Debt Fund | 0.6 | 0.6 |
Fidelity Series Floating Rate High Income Fund | 1.1 | 1.2 |
Fidelity Series High Income Fund | 4.7 | 4.8 |
Fidelity Series Real Estate Income Fund | 0.5 | 0.5 |
| 6.9 | 7.1 |
Inflation-Protected Bond Funds | | |
Fidelity Series Inflation-Protected Bond Index Fund | 9.7 | 10.0 |
Investment Grade Bond Funds | | |
Fidelity Series Investment Grade Bond Fund | 21.5 | 21.6 |
Short-Term Funds | | |
Fidelity Advisor Short Fixed-Income Fund Institutional Class | 6.1 | 5.7 |
Fidelity Institutional Money Market Portfolio Institutional Class | 7.4 | 6.9 |
| 13.5 | 12.6 |
Net Other Assets (Liabilities)* | 0.0 | 0.0 |
| 100.0 | 100.0 |
* Amount represents less than 0.1% |
Asset Allocation (% of fund's net assets) |
Period end |
| Commodity Funds | 5.0% | |
| Domestic Equity Funds | 30.2% | |
| Developed International Equity Funds | 10.4% | |
| Emerging Markets Equity Funds | 2.8% | |
| High Yield Bond Funds | 6.9% | |
| Inflation-Protected Bond Funds | 9.7% | |
| Investment Grade Bond Funds | 21.5% | |
| Short-Term Funds | 13.5% | |

Six months ago |
| Commodity Funds | 5.1% | |
| Domestic Equity Funds | 30.7% | |
| Developed International Equity Funds | 10.1% | |
| Emerging Markets Equity Funds | 2.8% | |
| High Yield Bond Funds | 7.1% | |
| Inflation-Protected Bond Funds | 10.0% | |
| Investment Grade Bond Funds | 21.6% | |
| Short-Term Funds | 12.6% | |

Semiannual Report
Fidelity Advisor Freedom 2010 Fund
Investments September 30, 2013 (Unaudited)
Showing Percentage of Net Assets
Domestic Equity Funds - 35.2% |
| Shares | | Value |
Commodity Funds - 5.0% |
Fidelity Series Commodity Strategy Fund (a)(c) | 5,573,516 | | $ 44,643,862 |
Domestic Equity Funds - 30.2% |
Fidelity Advisor Equity Growth Fund Institutional Class (c) | 467,652 | | 38,478,426 |
Fidelity Advisor Large Cap Fund Institutional Class (c) | 712,340 | | 19,161,946 |
Fidelity Advisor Series Equity-Income Fund (c) | 2,181,560 | | 25,720,596 |
Fidelity Advisor Series Growth & Income Fund (c) | 2,096,321 | | 25,260,674 |
Fidelity Advisor Series Opportunistic Insights Fund (c) | 1,563,236 | | 20,134,485 |
Fidelity Advisor Series Stock Selector Large Cap Value Fund (c) | 2,123,696 | | 25,845,376 |
Fidelity Advisor Small Cap Fund Institutional Class (c) | 494,360 | | 15,068,102 |
Fidelity Series 100 Index Fund (c) | 540,380 | | 5,987,406 |
Fidelity Series All-Sector Equity Fund (c) | 3,371,778 | | 47,744,376 |
Fidelity Series Large Cap Value Fund (c) | 2,024,458 | | 25,568,909 |
Fidelity Series Real Estate Equity Fund (c) | 314,406 | | 3,760,301 |
Fidelity Series Small Cap Opportunities Fund (c) | 1,350,232 | | 17,323,470 |
TOTAL DOMESTIC EQUITY FUNDS | | 270,054,067 |
TOTAL DOMESTIC EQUITY FUNDS (Cost $267,917,591) |
314,697,929
|
International Equity Funds - 13.2% |
| | | |
Developed International Equity Funds - 10.4% |
Fidelity Series International Growth Fund (c) | 3,086,446 | | 41,883,079 |
Fidelity Series International Small Cap Fund (c) | 576,685 | | 8,817,512 |
Fidelity Series International Value Fund (c) | 3,937,144 | | 42,324,302 |
TOTAL DEVELOPED INTERNATIONAL EQUITY FUNDS | | 93,024,893 |
Emerging Markets Equity Funds - 2.8% |
Fidelity Series Emerging Markets Fund (c) | 1,495,732 | | 25,038,554 |
TOTAL INTERNATIONAL EQUITY FUNDS (Cost $99,067,426) |
118,063,447
|
Bond Funds - 38.1% |
| Shares | | Value |
High Yield Bond Funds - 6.9% |
Fidelity Series Emerging Markets Debt Fund (c) | 521,385 | | $ 5,276,420 |
Fidelity Series Floating Rate High Income Fund (c) | 942,244 | | 9,968,944 |
Fidelity Series High Income Fund (c) | 4,112,906 | | 42,280,673 |
Fidelity Series Real Estate Income Fund (c) | 391,529 | | 4,298,991 |
TOTAL HIGH YIELD BOND FUNDS | | 61,825,028 |
Inflation-Protected Bond Funds - 9.7% |
Fidelity Series Inflation-Protected Bond Index Fund (c) | 8,018,127 | | 86,996,683 |
Investment Grade Bond Funds - 21.5% |
Fidelity Series Investment Grade Bond Fund (c) | 17,174,120 | | 192,178,400 |
TOTAL BOND FUNDS (Cost $338,086,784) |
341,000,111
|
Short-Term Funds - 13.5% |
| | | |
Fidelity Advisor Short Fixed-Income Fund Institutional Class (c) | 5,835,602 | | 54,446,165 |
Fidelity Institutional Money Market Portfolio Institutional Class 0.04% (b)(c) | 66,572,965 | | 66,572,965 |
TOTAL SHORT-TERM FUNDS (Cost $121,044,287) |
121,019,130
|
TOTAL INVESTMENT PORTFOLIO - 100.0% (Cost $826,116,088) | | 894,780,617 |
NET OTHER ASSETS (LIABILITIES) - 0.0% | | (201,209) |
NET ASSETS - 100% | $ 894,579,408 |
Legend |
(a) Non-income producing |
(b) The rate quoted is the annualized seven-day yield of the fund at period end. |
(c) Affiliated company |
Affiliated Underlying Funds |
Information regarding the Fund's fiscal year to date purchases and sales of the affiliated Underlying Funds and income earned by the Fund from investments in affiliated Underlying Funds is as follows: |
Affiliate | Value,
beginning of
period | Purchases | Sales
Proceeds | Dividend
Income | Value,
end of
period |
Fidelity Advisor Equity Growth Fund Institutional Class | $ 37,256,333 | $ 1,069,645 | $ 5,498,333 | $ - | $ 38,478,426 |
Fidelity Advisor Growth & Income Fund Institutional Class | 19,844,540 | 464,881 | 22,020,009 | - | - |
Fidelity Advisor Large Cap Fund Institutional Class | 20,021,126 | 496,004 | 3,862,188 | - | 19,161,946 |
Fidelity Advisor Series Equity-Income Fund | 27,797,031 | 1,158,986 | 4,872,682 | 272,677 | 25,720,596 |
Fidelity Advisor Series Growth & Income Fund (formerly Fidelity Advisor Series Mega Cap Fund) | 6,212,935 | 19,655,337 | 1,428,702 | - | 25,260,674 |
Fidelity Advisor Series Opportunistic Insights Fund | 19,617,134 | 534,880 | 3,126,848 | - | 20,134,485 |
Fidelity Advisor Series Stock Selector Large Cap Value Fund | 27,908,639 | 740,995 | 5,163,865 | - | 25,845,376 |
Fidelity Advisor Short Fixed-Income Fund Institutional Class | 51,871,108 | 6,686,125 | 3,937,886 | 208,614 | 54,446,165 |
Fidelity Advisor Small Cap Fund Institutional Class | 15,266,503 | 409,392 | 2,477,477 | - | 15,068,102 |
Fidelity Institutional Money Market Portfolio Institutional Class | 63,172,497 | 8,160,937 | 4,760,470 | 37,651 | 66,572,965 |
Fidelity Series 100 Index Fund | 6,173,658 | 174,442 | 806,427 | - | 5,987,406 |
Fidelity Series All-Sector Equity Fund | 49,620,547 | 1,272,691 | 7,968,517 | - | 47,744,376 |
Fidelity Series Commodity Strategy Fund | 46,125,134 | 6,013,867 | 3,812,615 | - | 44,643,862 |
Fidelity Series Emerging Markets Debt Fund | 5,750,850 | 301,058 | 372,292 | 145,619 | 5,276,420 |
Fidelity Series Emerging Markets Fund | 25,236,844 | 1,735,499 | 1,988,878 | - | 25,038,554 |
Fidelity Series Floating Rate High Income Fund | 10,542,272 | 417,793 | 942,443 | 224,530 | 9,968,944 |
Fidelity Series High Income Fund | 43,273,952 | 3,224,784 | 3,269,482 | 1,125,923 | 42,280,673 |
Fidelity Series Inflation-Protected Bond Index Fund | 91,127,240 | 6,732,113 | 6,507,221 | - | 86,996,683 |
Fidelity Series International Growth Fund | 42,059,080 | 1,324,381 | 4,398,646 | - | 41,883,079 |
Fidelity Series International Small Cap Fund | 8,602,872 | 256,515 | 975,192 | - | 8,817,512 |
Fidelity Series International Value Fund | 41,792,652 | 1,281,742 | 4,541,962 | - | 42,324,302 |
Fidelity Series Investment Grade Bond Fund | 196,591,693 | 15,243,128 | 13,747,156 | 2,030,291 | 192,178,400 |
Fidelity Series Large Cap Value Fund | 28,205,834 | 684,123 | 5,633,383 | - | 25,568,909 |
Fidelity Series Real Estate Equity Fund | 4,145,322 | 350,051 | 405,881 | 26,290 | 3,760,301 |
Fidelity Series Real Estate Income Fund | 4,736,681 | 283,811 | 455,636 | 131,328 | 4,298,991 |
Fidelity Series Small Cap Opportunities Fund | 17,772,438 | 1,743,295 | 2,984,158 | - | 17,323,470 |
Total | $ 910,724,915 | $ 80,416,475 | $ 115,958,349 | $ 4,202,923 | $ 894,780,617 |
Other Information |
All investments are categorized as Level 1 under the Fair Value Hierarchy. The inputs or methodology used for valuing securities may not be an indication of the risk associated with investing in those securities. For more information on valuation inputs, please refer to the Investment Valuation section in the accompanying Notes to Financial Statements. |
See accompanying notes which are an integral part of the financial statements.
Semiannual Report
Fidelity Advisor Freedom 2010 Fund
Statement of Assets and Liabilities
| September 30, 2013 (Unaudited) |
| | |
Assets | | |
Investment in securities, at value (cost $826,116,088) - See accompanying schedule | | $ 894,780,617 |
Receivable for investments sold | | 2,190,777 |
Receivable for fund shares sold | | 632,372 |
Total assets | | 897,603,766 |
| | |
Liabilities | | |
Payable for investments purchased | $ 5,701 | |
Payable for fund shares redeemed | 2,821,639 | |
Distribution and service plan fees payable | 197,018 | |
Total liabilities | | 3,024,358 |
| | |
Net Assets | | $ 894,579,408 |
Net Assets consist of: | | |
Paid in capital | | $ 813,147,659 |
Undistributed net investment income | | 2,992,871 |
Accumulated undistributed net realized gain (loss) on investments | | 9,774,349 |
Net unrealized appreciation (depreciation) on investments | | 68,664,529 |
Net Assets | | $ 894,579,408 |
| | |
Calculation of Maximum Offering Price Class A:
Net Asset Value and redemption price per share ($517,975,989 ÷ 40,809,065 shares) | | $ 12.69 |
| | |
Maximum offering price per share (100/94.25 of $12.69) | | $ 13.46 |
Class T:
Net Asset Value and redemption price per share ($128,567,651 ÷ 10,165,355 shares) | | $ 12.65 |
| | |
Maximum offering price per share (100/96.50 of $12.65) | | $ 13.11 |
Class B:
Net Asset Value and offering price per share ($4,938,035 ÷ 390,119 shares)A | | $ 12.66 |
| | |
Class C:
Net Asset Value and offering price per share ($37,261,684 ÷ 2,966,690 shares)A | | $ 12.56 |
| | |
Institutional Class:
Net Asset Value, offering price and redemption price per share ($205,836,049 ÷ 16,139,593 shares) | | $ 12.75 |
A Redemption price per share is equal to net asset value less any applicable contingent deferred sales charge.
Statement of Operations
Six months ended September 30, 2013 (Unaudited) |
| | |
Investment Income | | |
Income distributions from underlying funds | | $ 4,202,923 |
| | |
Expenses | | |
Distribution and service plan fees | $ 1,206,775 | |
Independent trustees' compensation | 1,698 | |
Total expenses before reductions | 1,208,473 | |
Expense reductions | (1,698) | 1,206,775 |
Net investment income (loss) | | 2,996,148 |
Realized and Unrealized Gain (Loss) Realized gain (loss) on sale of underlying fund shares | 10,242,811 | |
Capital gain distributions from underlying funds | 1,516,761 | |
Total net realized gain (loss) | | 11,759,572 |
Change in net unrealized appreciation (depreciation) on underlying funds | | 9,354,765 |
Net gain (loss) | | 21,114,337 |
Net increase (decrease) in net assets resulting from operations | | $ 24,110,485 |
See accompanying notes which are an integral part of the financial statements.
Semiannual Report
Statement of Changes in Net Assets
| Six months ended
September 30, 2013 (Unaudited) | Year ended
March 31,
2013 |
Increase (Decrease) in Net Assets | | |
Operations | | |
Net investment income (loss) | $ 2,996,148 | $ 11,478,269 |
Net realized gain (loss) | 11,759,572 | 54,501,265 |
Change in net unrealized appreciation (depreciation) | 9,354,765 | (4,153,489) |
Net increase (decrease) in net assets resulting from operations | 24,110,485 | 61,826,045 |
Distributions to shareholders from net investment income | (1,301,958) | (11,763,830) |
Distributions to shareholders from net realized gain | (9,014,737) | (6,303,241) |
Total distributions | (10,316,695) | (18,067,071) |
Share transactions - net increase (decrease) | (29,734,922) | (22,088,856) |
Total increase (decrease) in net assets | (15,941,132) | 21,670,118 |
| | |
Net Assets | | |
Beginning of period | 910,520,540 | 888,850,422 |
End of period (including undistributed net investment income of $2,992,871 and undistributed net investment income of $1,298,681, respectively) | $ 894,579,408 | $ 910,520,540 |
Financial Highlights - Class A
| Six months ended
September 30, 2013 | Years ended March 31, |
| (Unaudited) | 2013 | 2012 | 2011 | 2010 | 2009 |
Selected Per-Share Data | | | | | | |
Net asset value, beginning of period | $ 12.50 | $ 11.89 | $ 11.92 | $ 10.87 | $ 8.19 | $ 11.78 |
Income from Investment Operations | | | | | | |
Net investment income (loss) E | .04 | .16 | .17 | .15 | .21 | .27 |
Net realized and unrealized gain (loss) | .29 | .70 | .12 | 1.17 | 2.76 | (3.28) |
Total from investment operations | .33 | .86 | .29 | 1.32 | 2.97 | (3.01) |
Distributions from net investment income | (.02) | (.16) | (.17) | (.17) | (.21) | (.28) |
Distributions from net realized gain | (.12) | (.09) | (.16) | (.10) | (.08) | (.30) |
Total distributions | (.14) | (.25) | (.32) I | (.27) | (.29) H | (.58) |
Net asset value, end of period | $ 12.69 | $ 12.50 | $ 11.89 | $ 11.92 | $ 10.87 | $ 8.19 |
Total Return B, C, D | 2.67% | 7.33% | 2.63% | 12.27% | 36.51% | (26.36)% |
Ratios to Average Net Assets F, G | | | | | | |
Expenses before reductions | .25% A | .25% | .25% | .25% | .25% | .25% |
Expenses net of fee waivers, if any | .25% A | .25% | .25% | .25% | .25% | .25% |
Expenses net of all reductions | .25% A | .25% | .25% | .25% | .25% | .25% |
Net investment income (loss) | .68% A | 1.33% | 1.48% | 1.38% | 2.04% | 2.77% |
Supplemental Data | | | | | | |
Net assets, end of period (000 omitted) | $ 517,976 | $ 540,980 | $ 552,770 | $ 536,999 | $ 478,025 | $ 339,203 |
Portfolio turnover rate F | 18% A | 26% | 25% | 41% | 42% | 44% |
A Annualized
B Total returns for periods of less than one year are not annualized.
C Total returns would have been lower if certain expenses had not been reduced during the applicable periods shown.
D Total returns do not include the effect of the sales charges.
E Calculated based on average shares outstanding during the period.
F Amounts do not include the activity of the Underlying Funds.
G Expense ratios reflect operating expenses of the class. Expenses before reductions do not reflect amounts reimbursed by the investment adviser or reductions from expense offset arrangements and do not represent the amount paid by the class during periods when reimbursements or reductions occur. Expenses net of fee waivers reflect expenses after reimbursement by the investment adviser but prior to reductions from expense offset arrangements. Expenses net of all reductions represent the net expenses paid by the class but do not include expenses of the investment companies in which the Fund invests.
H Total distributions of $.29 per share is comprised of distributions from net investment income of $.211 and distributions from net realized gain of $.083 per share.
I Total distributions of $.32 per share is comprised of distributions from net investment income of $.169 and distributions from net realized gain of $.155 per share.
See accompanying notes which are an integral part of the financial statements.
Semiannual Report
Financial Highlights - Class T
| Six months ended
September 30, 2013 | Years ended March 31, |
| (Unaudited) | 2013 | 2012 | 2011 | 2010 | 2009 |
Selected Per-Share Data | | | | | | |
Net asset value, beginning of period | $ 12.46 | $ 11.86 | $ 11.88 | $ 10.83 | $ 8.16 | $ 11.74 |
Income from Investment Operations | | | | | | |
Net investment income (loss) E | .03 | .13 | .14 | .13 | .18 | .25 |
Net realized and unrealized gain (loss) | .30 | .69 | .13 | 1.15 | 2.76 | (3.28) |
Total from investment operations | .33 | .82 | .27 | 1.28 | 2.94 | (3.03) |
Distributions from net investment income | (.01) | (.13) | (.14) | (.13) | (.19) | (.25) |
Distributions from net realized gain | (.12) | (.09) | (.16) | (.10) | (.08) | (.30) |
Total distributions | (.14) J | (.22) | (.29) I | (.23) | (.27) H | (.55) |
Net asset value, end of period | $ 12.65 | $ 12.46 | $ 11.86 | $ 11.88 | $ 10.83 | $ 8.16 |
Total Return B, C, D | 2.62% | 6.98% | 2.43% | 11.95% | 36.19% | (26.57)% |
Ratios to Average Net Assets F, G | | | | | | |
Expenses before reductions | .50% A | .50% | .50% | .50% | .50% | .50% |
Expenses net of fee waivers, if any | .50% A | .50% | .50% | .50% | .50% | .50% |
Expenses net of all reductions | .50% A | .50% | .50% | .50% | .50% | .50% |
Net investment income (loss) | .43% A | 1.08% | 1.23% | 1.13% | 1.79% | 2.52% |
Supplemental Data | | | | | | |
Net assets, end of period (000 omitted) | $ 128,568 | $ 127,353 | $ 132,044 | $ 152,126 | $ 204,059 | $ 163,842 |
Portfolio turnover rate F | 18% A | 26% | 25% | 41% | 42% | 44% |
A Annualized
B Total returns for periods of less than one year are not annualized.
C Total returns would have been lower if certain expenses had not been reduced during the applicable periods shown.
D Total returns do not include the effect of the sales charges.
E Calculated based on average shares outstanding during the period.
F Amounts do not include the activity of the Underlying Funds.
G Expense ratios reflect operating expenses of the class. Expenses before reductions do not reflect amounts reimbursed by the investment adviser or reductions from expense offset arrangements and do not represent the amount paid by the class during periods when reimbursements or reductions occur. Expenses net of fee waivers reflect expenses after reimbursement by the investment adviser but prior to reductions from expense offset arrangements. Expenses net of all reductions represent the net expenses paid by the class but do not include expenses of the investment companies in which the Fund invests.
H Total distributions of $.27 per share is comprised of distributions from net investment income of $.186 and distributions from net realized gain of $.083 per share.
I Total distributions of $.29 per share is comprised of distributions from net investment income of $.137 and distributions from net realized gain of $.155 per share.
J Total distributions of $.14 per share is comprised of distributions from net investment income of $.011 and distributions from net realized gain of $.124 per share.
Financial Highlights - Class B
| Six months ended
September 30, 2013 | Years ended March 31, |
| (Unaudited) | 2013 | 2012 | 2011 | 2010 | 2009 |
Selected Per-Share Data | | | | | | |
Net asset value, beginning of period | $ 12.49 | $ 11.87 | $ 11.87 | $ 10.82 | $ 8.15 | $ 11.70 |
Income from Investment Operations | | | | | | |
Net investment income (loss) E | - H | .07 | .08 | .07 | .13 | .20 |
Net realized and unrealized gain (loss) | .29 | .70 | .13 | 1.15 | 2.76 | (3.26) |
Total from investment operations | .29 | .77 | .21 | 1.22 | 2.89 | (3.06) |
Distributions from net investment income | - | (.06) | (.07) | (.07) | (.13) | (.19) |
Distributions from net realized gain | (.12) | (.09) | (.15) | (.10) | (.08) | (.30) |
Total distributions | (.12) | (.15) | (.21) J | (.17) | (.22) I | (.49) |
Net asset value, end of period | $ 12.66 | $ 12.49 | $ 11.87 | $ 11.87 | $ 10.82 | $ 8.15 |
Total Return B, C, D | 2.33% | 6.51% | 1.90% | 11.37% | 35.54% | (26.92)% |
Ratios to Average Net Assets F, G | | | | | | |
Expenses before reductions | 1.00% A | 1.00% | 1.00% | 1.00% | 1.00% | 1.00% |
Expenses net of fee waivers, if any | 1.00% A | 1.00% | 1.00% | 1.00% | 1.00% | 1.00% |
Expenses net of all reductions | 1.00% A | 1.00% | 1.00% | 1.00% | 1.00% | 1.00% |
Net investment income (loss) | (.07)% A | .58% | .73% | .63% | 1.29% | 2.03% |
Supplemental Data | | | | | | |
Net assets, end of period (000 omitted) | $ 4,938 | $ 6,474 | $ 9,154 | $ 15,842 | $ 22,468 | $ 19,950 |
Portfolio turnover rate F | 18% A | 26% | 25% | 41% | 42% | 44% |
A Annualized
B Total returns for periods of less than one year are not annualized.
C Total returns would have been lower if certain expenses had not been reduced during the applicable periods shown.
D Total returns do not include the effect of the contingent deferred sales charge.
E Calculated based on average shares outstanding during the period.
F Amounts do not include the activity of the Underlying Funds.
G Expense ratios reflect operating expenses of the class. Expenses before reductions do not reflect amounts reimbursed by the investment adviser or reductions from expense offset arrangements and do not represent the amount paid by the class during periods when reimbursements or reductions occur. Expenses net of fee waivers reflect expenses after reimbursement by the investment adviser but prior to reductions from expense offset arrangements. Expenses net of all reductions represent the net expenses paid by the class but do not include expenses of the investment companies in which the Fund invests.
H Amount represents less than $.01 per share.
I Total distributions of $.22 per share is comprised of distributions from net investment income of $.134 and distributions from net realized gain of $.083 per share.
J Total distributions of $.21 per share is comprised of distributions from net investment income of $.065 and distributions from net realized gain of $.148 per share.
See accompanying notes which are an integral part of the financial statements.
Semiannual Report
Financial Highlights - Class C
| Six months ended
September 30, 2013 | Years ended March 31, |
| (Unaudited) | 2013 | 2012 | 2011 | 2010 | 2009 |
Selected Per-Share Data | | | | | | |
Net asset value, beginning of period | $ 12.39 | $ 11.79 | $ 11.81 | $ 10.78 | $ 8.13 | $ 11.67 |
Income from Investment Operations | | | | | | |
Net investment income (loss) | - H | .07 | .08 | .07 | .13 | .20 |
Net realized and unrealized gain (loss) | .29 | .69 | .13 | 1.14 | 2.74 | (3.25) |
Total from investment operations | .29 | .76 | .21 | 1.21 | 2.87 | (3.05) |
Distributions from net investment income | - | (.07) | (.08) | (.08) | (.14) | (.19) |
Distributions from net realized gain | (.12) | (.09) | (.15) | (.10) | (.08) | (.30) |
Total distributions | (.12) | (.16) | (.23) | (.18) | (.22) I | (.49) |
Net asset value, end of period | $ 12.56 | $ 12.39 | $ 11.79 | $ 11.81 | $ 10.78 | $ 8.13 |
Total Return B, C, D | 2.35% | 6.49% | 1.90% | 11.33% | 35.45% | (26.88)% |
Ratios to Average Net Assets F, G | | | | | | |
Expenses before reductions | 1.00% A | 1.00% | 1.00% | 1.00% | 1.00% | 1.00% |
Expenses net of fee waivers, if any | 1.00% A | 1.00% | 1.00% | 1.00% | 1.00% | 1.00% |
Expenses net of all reductions | 1.00% A | 1.00% | 1.00% | 1.00% | 1.00% | 1.00% |
Net investment income (loss) | (.07)% A | .58% | .73% | .63% | 1.29% | 2.02% |
Supplemental Data | | | | | | |
Net assets, end of period (000 omitted) | $ 37,262 | $ 38,562 | $ 38,423 | $ 44,764 | $ 47,178 | $ 37,524 |
Portfolio turnover rate F | 18% A | 26% | 25% | 41% | 42% | 44% |
A Annualized
B Total returns for periods of less than one year are not annualized.
C Total returns would have been lower if certain expenses had not been reduced during the applicable periods shown.
D Total returns do not include the effect of the contingent deferred sales charge.
E Calculated based on average shares outstanding during the period.
F Amounts do not include the activity of the Underlying Funds.
G Expense ratios reflect operating expenses of the class. Expenses before reductions do not reflect amounts reimbursed by the investment adviser or reductions from expense offset arrangements and do not represent the amount paid by the class during periods when reimbursements or reductions occur. Expenses net of fee waivers reflect expenses after reimbursement by the investment adviser but prior to reductions from expense offset arrangements. Expenses net of all reductions represent the net expenses paid by the class but do not include expenses of the investment companies in which the Fund invests.
H Amount represents less than $.01 per share.
I Total distributions of $.022 per share is comprised of distributions from net investment income of $.139 and distributions from net realized gain of $.083 per share.
Financial Highlights - Institutional Class
| Six months ended
September 30, 2013 | Years ended March 31, |
| (Unaudited) | 2013 | 2012 | 2011 | 2010 | 2009 |
Selected Per-Share Data | | | | | | |
Net asset value, beginning of period | $ 12.55 | $ 11.94 | $ 11.96 | $ 10.91 | $ 8.22 | $ 11.82 |
Income from Investment Operations | | | | | | |
Net investment income (loss) D | .06 | .19 | .20 | .18 | .23 | .30 |
Net realized and unrealized gain (loss) | .29 | .70 | .13 | 1.17 | 2.78 | (3.30) |
Total from investment operations | .35 | .89 | .33 | 1.35 | 3.01 | (3.00) |
Distributions from net investment income | (.03) | (.19) | (.20) | (.20) | (.23) | (.30) |
Distributions from net realized gain | (.12) | (.09) | (.16) | (.10) | (.08) | (.30) |
Total distributions | (.15) | (.28) | (.35) H | (.30) | (.32) G | (.60) |
Net asset value, end of period | $ 12.75 | $ 12.55 | $ 11.94 | $ 11.96 | $ 10.91 | $ 8.22 |
Total Return B, C | 2.80% | 7.56% | 2.97% | 12.50% | 36.80% | (26.16)% |
Ratios to Average Net Assets E, F | | | | | | |
Expenses before reductions I | .00% A | .00% | .00% | .00% | .00% | .00% |
Expenses net of fee waivers, if any | .00% A | .00% | .00% | .00% | .00% | .00% |
Expenses net of all reductions | .00% A | .00% | .00% | .00% | .00% | .00% |
Net investment income (loss) | .93% A | 1.58% | 1.73% | 1.63% | 2.29% | 3.02% |
Supplemental Data | | | | | | |
Net assets, end of period (000 omitted) | $ 205,836 | $ 197,152 | $ 156,459 | $ 115,490 | $ 75,569 | $ 41,737 |
Portfolio turnover rate E | 18% A | 26% | 25% | 41% | 42% | 44% |
A Annualized
B Total returns for periods of less than one year are not annualized.
C Total returns would have been lower if certain expenses had not been reduced during the applicable periods shown.
D Calculated based on average shares outstanding during the period.
E Amounts do not include the activity of the Underlying Funds.
F Expense ratios reflect operating expenses of the class. Expenses before reductions do not reflect amounts reimbursed by the investment adviser or reductions from expense offset arrangements and do not represent the amount paid by the class during periods when reimbursements or reductions occur. Expenses net of fee waivers reflect expenses after reimbursement by the investment adviser but prior to reductions from expense offset arrangements. Expenses net of all reductions represent the net expenses paid by the class but do not include expenses of the investment companies in which the Fund invests.
G Total distributions of $.32 per share is comprised of distributions from net investment income of $.234 and distributions from net realized gain of $.083 per share.
H Total distributions of $.35 per share is comprised of distributions from net investment income of $.199 and distributions from net realized gain of $.1555 per share.
I Amount represents less than .01%.
See accompanying notes which are an integral part of the financial statements.
Semiannual Report
Fidelity Advisor Freedom 2015 Fund
Investment Changes (Unaudited)
The information in the following tables is based on the direct investments of the Fund. |
Fund Holdings as of September 30, 2013 |
| % of fund's
net assets | % of fund's net assets
6 months ago |
Commodity Funds | | |
Fidelity Series Commodity Strategy Fund | 5.3 | 5.4 |
Domestic Equity Funds | | |
Fidelity Advisor Equity Growth Fund Institutional Class | 4.5 | 4.3 |
Fidelity Advisor Growth & Income Fund Institutional Class | 0.0 | 2.3 |
Fidelity Advisor Large Cap Fund Institutional Class | 2.3 | 2.3 |
Fidelity Advisor Series Equity-Income Fund | 3.0 | 3.1 |
Fidelity Advisor Series Growth & Income Fund (formerly Fidelity Advisor Series Mega Cap Fund) | 3.0 | 0.7 |
Fidelity Advisor Series Opportunistic Insights Fund | 2.3 | 2.2 |
Fidelity Advisor Series Stock Selector Large Cap Value Fund | 3.0 | 3.1 |
Fidelity Advisor Small Cap Fund Institutional Class | 1.8 | 1.8 |
Fidelity Series 100 Index Fund | 0.7 | 0.7 |
Fidelity Series All-Sector Equity Fund | 5.6 | 5.7 |
Fidelity Series Large Cap Value Fund | 3.0 | 3.2 |
Fidelity Series Real Estate Equity Fund | 0.4 | 0.5 |
Fidelity Series Small Cap Opportunities Fund | 2.0 | 2.1 |
| 31.6 | 32.0 |
Developed International Equity Funds | | |
Fidelity Series International Growth Fund | 5.0 | 4.8 |
Fidelity Series International Small Cap Fund | 1.0 | 1.0 |
Fidelity Series International Value Fund | 5.0 | 4.7 |
| 11.0 | 10.5 |
Emerging Markets Equity Funds | | |
Fidelity Series Emerging Markets Fund | 2.9 | 2.9 |
High Yield Bond Funds | | |
Fidelity Series Emerging Markets Debt Fund | 0.6 | 0.6 |
Fidelity Series Floating Rate High Income Fund | 1.1 | 1.1 |
Fidelity Series High Income Fund | 4.7 | 4.7 |
Fidelity Series Real Estate Income Fund | 0.5 | 0.6 |
| 6.9 | 7.0 |
Inflation-Protected Bond Funds | | |
Fidelity Series Inflation-Protected Bond Index Fund | 9.9 | 9.9 |
Investment Grade Bond Funds | | |
Fidelity Series Investment Grade Bond Fund | 22.6 | 22.6 |
Short-Term Funds | | |
Fidelity Advisor Short Fixed-Income Fund Institutional Class | 4.4 | 4.4 |
Fidelity Institutional Money Market Portfolio Institutional Class | 5.4 | 5.3 |
| 9.8 | 9.7 |
Net Other Assets (Liabilities)* | 0.0 | 0.0 |
| 100.0 | 100.0 |
* Amount represents less than 0.1% |
Asset Allocation (% of fund's net assets) |
Period end |
| Commodity Funds | 5.3% | |
| Domestic Equity Funds | 31.6% | |
| Developed International Equity Funds | 11.0% | |
| Emerging Markets Equity Funds | 2.9% | |
| High Yield Bond Funds | 6.9% | |
| Inflation-Protected Bond Funds | 9.9% | |
| Investment Grade Bond Funds | 22.6% | |
| Short-Term Funds | 9.8% | |

Six months ago |
| Commodity Funds | 5.4% | |
| Domestic Equity Funds | 32.0% | |
| Developed International Equity Funds | 10.5% | |
| Emerging Markets Equity Funds | 2.9% | |
| High Yield Bond Funds | 7.0% | |
| Inflation-Protected Bond Funds | 9.9% | |
| Investment Grade Bond Funds | 22.6% | |
| Short-Term Funds | 9.7% | |

Semiannual Report
Fidelity Advisor Freedom 2015 Fund
Investments September 30, 2013 (Unaudited)
Showing Percentage of Net Assets
Domestic Equity Funds - 36.9% |
| Shares | | Value |
Commodity Funds - 5.3% |
Fidelity Series Commodity Strategy Fund (a)(c) | 12,747,014 | | $ 102,103,585 |
Domestic Equity Funds - 31.6% |
Fidelity Advisor Equity Growth Fund Institutional Class (c) | 1,061,122 | | 87,309,146 |
Fidelity Advisor Large Cap Fund Institutional Class (c) | 1,614,946 | | 43,442,036 |
Fidelity Advisor Series Equity-Income Fund (c) | 4,983,781 | | 58,758,781 |
Fidelity Advisor Series Growth & Income Fund (c) | 4,772,861 | | 57,512,980 |
Fidelity Advisor Series Opportunistic Insights Fund (c) | 3,508,436 | | 45,188,652 |
Fidelity Advisor Series Stock Selector Large Cap Value Fund (c) | 4,827,653 | | 58,752,532 |
Fidelity Advisor Small Cap Fund Institutional Class (c) | 1,120,418 | | 34,150,343 |
Fidelity Series 100 Index Fund (c) | 1,225,583 | | 13,579,454 |
Fidelity Series All-Sector Equity Fund (c) | 7,663,308 | | 108,512,444 |
Fidelity Series Large Cap Value Fund (c) | 4,560,105 | | 57,594,122 |
Fidelity Series Real Estate Equity Fund (c) | 712,071 | | 8,516,371 |
Fidelity Series Small Cap Opportunities Fund (c) | 3,056,460 | | 39,214,387 |
TOTAL DOMESTIC EQUITY FUNDS | | 612,531,248 |
TOTAL DOMESTIC EQUITY FUNDS (Cost $599,965,447) |
714,634,833
|
International Equity Funds - 13.9% |
| | | |
Developed International Equity Funds - 11.0% |
Fidelity Series International Growth Fund (c) | 7,073,501 | | 95,987,410 |
Fidelity Series International Small Cap Fund (c) | 1,309,479 | | 20,021,937 |
Fidelity Series International Value Fund (c) | 8,992,363 | | 96,667,903 |
TOTAL DEVELOPED INTERNATIONAL EQUITY FUNDS | | 212,677,250 |
Emerging Markets Equity Funds - 2.9% |
Fidelity Series Emerging Markets Fund (c) | 3,373,557 | | 56,473,352 |
TOTAL INTERNATIONAL EQUITY FUNDS (Cost $219,714,963) |
269,150,602
|
Bond Funds - 39.4% |
| Shares | | Value |
High Yield Bond Funds - 6.9% |
Fidelity Series Emerging Markets Debt Fund (c) | 1,106,425 | | $ 11,197,020 |
Fidelity Series Floating Rate High Income Fund (c) | 2,058,602 | | 21,780,012 |
Fidelity Series High Income Fund (c) | 8,809,706 | | 90,563,780 |
Fidelity Series Real Estate Income Fund (c) | 941,163 | | 10,333,968 |
TOTAL HIGH YIELD BOND FUNDS | | 133,874,780 |
Inflation-Protected Bond Funds - 9.9% |
Fidelity Series Inflation-Protected Bond Index Fund (c) | 17,689,479 | | 191,930,851 |
Investment Grade Bond Funds - 22.6% |
Fidelity Series Investment Grade Bond Fund (c) | 39,221,116 | | 438,884,288 |
TOTAL BOND FUNDS (Cost $757,122,859) |
764,689,919
|
Short-Term Funds - 9.8% |
| | | |
Fidelity Advisor Short Fixed-Income Fund Institutional Class (c) | 9,191,423 | | 85,755,978 |
Fidelity Institutional Money Market Portfolio Institutional Class 0.04% (b)(c) | 103,870,506 | | 103,870,506 |
TOTAL SHORT-TERM FUNDS (Cost $188,385,967) |
189,626,484
|
TOTAL INVESTMENT PORTFOLIO - 100.0% (Cost $1,765,189,236) | | 1,938,101,838 |
NET OTHER ASSETS (LIABILITIES) - 0.0% | | (408,069) |
NET ASSETS - 100% | $ 1,937,693,769 |
Legend |
(a) Non-income producing |
(b) The rate quoted is the annualized seven-day yield of the fund at period end. |
(c) Affiliated company |
Affiliated Underlying Funds |
Information regarding the Fund's fiscal year to date purchases and sales of the affiliated Underlying Funds and income earned by the Fund from investments in affiliated Underlying Funds is as follows: |
Affiliate | Value,
beginning of
period | Purchases | Sales
Proceeds | Dividend
Income | Value,
end of
period |
Fidelity Advisor Equity Growth Fund Institutional Class | $ 84,657,466 | $ 1,358,728 | $ 11,467,812 | $ - | $ 87,309,146 |
Fidelity Advisor Growth & Income Fund Institutional Class | 44,873,207 | 488,411 | 49,209,139 | - | - |
Fidelity Advisor Large Cap Fund Institutional Class | 45,274,051 | 531,557 | 8,005,719 | - | 43,442,036 |
Fidelity Advisor Series Equity-Income Fund | 61,416,234 | 2,072,658 | 8,326,614 | 603,475 | 58,758,781 |
Fidelity Advisor Series Growth & Income Fund (formerly Fidelity Advisor Series Mega Cap Fund) | 13,693,032 | 44,568,855 | 2,570,092 | - | 57,512,980 |
Fidelity Advisor Series Opportunistic Insights Fund | 43,357,108 | 703,407 | 5,770,034 | - | 45,188,652 |
Fidelity Advisor Series Stock Selector Large Cap Value Fund | 61,668,338 | 952,769 | 9,077,681 | - | 58,752,532 |
Fidelity Advisor Short Fixed-Income Fund Institutional Class | 86,474,459 | 5,346,908 | 5,776,023 | 336,903 | 85,755,978 |
Fidelity Advisor Small Cap Fund Institutional Class | 34,707,632 | 524,783 | 5,307,267 | - | 34,150,343 |
Fidelity Institutional Money Market Portfolio Institutional Class | 105,198,514 | 7,094,446 | 8,422,454 | 60,675 | 103,870,506 |
Fidelity Series 100 Index Fund | 13,918,390 | 224,637 | 1,562,534 | - | 13,579,454 |
Fidelity Series All-Sector Equity Fund | 112,351,689 | 1,399,615 | 16,082,643 | - | 108,512,444 |
Fidelity Series Commodity Strategy Fund | 105,007,756 | 12,639,730 | 7,162,118 | - | 102,103,585 |
Fidelity Series Emerging Markets Debt Fund | 12,205,213 | 557,421 | 715,506 | 307,766 | 11,197,020 |
Fidelity Series Emerging Markets Fund | 56,762,125 | 3,090,030 | 3,497,829 | - | 56,473,352 |
Fidelity Series Floating Rate High Income Fund | 21,465,667 | 1,610,293 | 1,199,523 | 472,714 | 21,780,012 |
Fidelity Series High Income Fund | 92,367,830 | 5,228,922 | 5,019,532 | 2,393,086 | 90,563,780 |
Fidelity Series Inflation-Protected Bond Index Fund | 195,025,325 | 17,204,737 | 10,910,246 | - | 191,930,851 |
Fidelity Series International Growth Fund | 94,342,991 | 1,620,283 | 6,577,231 | - | 95,987,410 |
Fidelity Series International Small Cap Fund | 19,264,544 | 324,275 | 1,669,018 | - | 20,021,937 |
Fidelity Series International Value Fund | 93,717,826 | 1,620,283 | 7,236,778 | - | 96,667,903 |
Fidelity Series Investment Grade Bond Fund | 443,590,585 | 32,560,023 | 23,994,662 | 4,587,211 | 438,884,288 |
Fidelity Series Large Cap Value Fund | 63,335,231 | 738,330 | 11,645,710 | - | 57,594,122 |
Fidelity Series Real Estate Equity Fund | 9,445,628 | 532,999 | 739,215 | 59,189 | 8,516,371 |
Fidelity Series Real Estate Income Fund | 11,099,419 | 683,638 | 817,587 | 312,319 | 10,333,968 |
Fidelity Series Small Cap Opportunities Fund | 40,393,393 | 3,469,029 | 6,433,921 | - | 39,214,387 |
Total | $ 1,965,613,653 | $ 147,146,767 | $ 219,196,888 | $ 9,133,338 | $ 1,938,101,838 |
Other Information |
All investments are categorized as Level 1 under the Fair Value Hierarchy. The inputs or methodology used for valuing securities may not be an indication of the risk associated with investing in those securities. For more information on valuation inputs, please refer to the Investment Valuation section in the accompanying Notes to Financial Statements. |
See accompanying notes which are an integral part of the financial statements.
Semiannual Report
Fidelity Advisor Freedom 2015 Fund
Statement of Assets and Liabilities
| September 30, 2013 (Unaudited) |
| | |
Assets | | |
Investment in securities, at value (cost $1,765,189,236) - See accompanying schedule | | $ 1,938,101,838 |
Receivable for investments sold | | 3,525,089 |
Receivable for fund shares sold | | 1,306,815 |
Total assets | | 1,942,933,742 |
| | |
Liabilities | | |
Payable for investments purchased | $ 103 | |
Payable for fund shares redeemed | 4,833,484 | |
Distribution and service plan fees payable | 406,386 | |
Total liabilities | | 5,239,973 |
| | |
Net Assets | | $ 1,937,693,769 |
Net Assets consist of: | | |
Paid in capital | | $ 1,736,594,421 |
Undistributed net investment income | | 6,646,143 |
Accumulated undistributed net realized gain (loss) on investments | | 21,540,603 |
Net unrealized appreciation (depreciation) on investments | | 172,912,602 |
Net Assets | | $ 1,937,693,769 |
| | |
Calculation of Maximum Offering Price Class A:
Net Asset Value and redemption price per share ($1,139,749,591 ÷ 90,412,292 shares) | | $ 12.61 |
| | |
Maximum offering price per share (100/94.25 of $12.61) | | $ 13.38 |
Class T:
Net Asset Value and redemption price per share ($231,748,626 ÷ 18,421,407 shares) | | $ 12.58 |
| | |
Maximum offering price per share (100/96.50 of $12.58) | | $ 13.04 |
Class B:
Net Asset Value and offering price per share ($14,371,986 ÷ 1,145,146 shares)A | | $ 12.55 |
| | |
Class C:
Net Asset Value and offering price per share ($72,753,080 ÷ 5,824,097 shares)A | | $ 12.49 |
| | |
Institutional Class:
Net Asset Value, offering price and redemption price per share ($479,070,486 ÷ 37,716,747 shares) | | $ 12.70 |
A Redemption price per share is equal to net asset value less any applicable contingent deferred sales charge.
Statement of Operations
Six months ended September 30, 2013 (Unaudited) |
| | |
Investment Income | | |
Income distributions from underlying funds | | $ 9,133,338 |
| | |
Expenses | | |
Distribution and service plan fees | $ 2,469,160 | |
Independent trustees' compensation | 3,656 | |
Total expenses before reductions | 2,472,816 | |
Expense reductions | (3,656) | 2,469,160 |
Net investment income (loss) | | 6,664,178 |
Realized and Unrealized Gain (Loss) Realized gain (loss) on sale of underlying fund shares | 21,504,519 | |
Capital gain distributions from underlying funds | 3,426,678 | |
Total net realized gain (loss) | | 24,931,197 |
Change in net unrealized appreciation (depreciation) on underlying funds | | 23,033,768 |
Net gain (loss) | | 47,964,965 |
Net increase (decrease) in net assets resulting from operations | | $ 54,629,143 |
See accompanying notes which are an integral part of the financial statements.
Semiannual Report
Statement of Changes in Net Assets
| Six months ended
September 30, 2013
(Unaudited) | Year ended
March 31,
2013 |
Increase (Decrease) in Net Assets | | |
Operations | | |
Net investment income (loss) | $ 6,664,178 | $ 24,573,510 |
Net realized gain (loss) | 24,931,197 | 92,864,023 |
Change in net unrealized appreciation (depreciation) | 23,033,768 | 17,904,608 |
Net increase (decrease) in net assets resulting from operations | 54,629,143 | 135,342,141 |
Distributions to shareholders from net investment income | (2,852,074) | (24,816,448) |
Distributions to shareholders from net realized gain | (31,992,134) | (13,437,037) |
Total distributions | (34,844,208) | (38,253,485) |
Share transactions - net increase (decrease) | (47,263,491) | 111,574,961 |
Total increase (decrease) in net assets | (27,478,556) | 208,663,617 |
| | |
Net Assets | | |
Beginning of period | 1,965,172,325 | 1,756,508,708 |
End of period (including undistributed net investment income of $6,646,143 and undistributed net investment income of $2,834,039, respectively) | $ 1,937,693,769 | $ 1,965,172,325 |
Financial Highlights - Class A
| Six months ended
September 30, 2013 | Years ended March 31, |
| (Unaudited) | 2013 | 2012 | 2011 | 2010 | 2009 |
Selected Per-Share Data | | | | | | |
Net asset value, beginning of period | $ 12.47 | $ 11.85 | $ 11.87 | $ 10.81 | $ 8.05 | $ 11.85 |
Income from Investment Operations | | | | | | |
Net investment income (loss) E | .04 | .16 | .17 | .16 | .20 | .26 |
Net realized and unrealized gain (loss) | .32 | .71 | .13 | 1.16 | 2.84 | (3.47) |
Total from investment operations | .36 | .87 | .30 | 1.32 | 3.04 | (3.21) |
Distributions from net investment income | (.02) | (.16) | (.17) | (.16) | (.20) | (.26) |
Distributions from net realized gain | (.20) | (.09) | (.15) | (.10) | (.08) | (.33) |
Total distributions | (.22) | (.25) | (.32) | (.26) | (.28) I | (.59) H |
Net asset value, end of period | $ 12.61 | $ 12.47 | $ 11.85 | $ 11.87 | $ 10.81 | $ 8.05 |
Total Return B, C, D | 2.92% | 7.45% | 2.71% | 12.36% | 37.95% | (28.01)% |
Ratios to Average Net Assets F, G | | | | | | |
Expenses before reductions | .25% A | .25% | .25% | .25% | .25% | .25% |
Expenses net of fee waivers, if any | .25% A | .25% | .25% | .25% | .25% | .25% |
Expenses net of all reductions | .25% A | .25% | .25% | .25% | .25% | .25% |
Net investment income (loss) | .69% A | 1.36% | 1.50% | 1.42% | 2.02% | 2.69% |
Supplemental Data | | | | | | |
Net assets, end of period (000 omitted) | $ 1,139,750 | $ 1,181,020 | $ 1,101,302 | $ 1,004,955 | $ 830,024 | $ 477,641 |
Portfolio turnover rate F | 15% A | 20% | 19% | 33% | 29% | 36% |
A Annualized
B Total returns for periods of less than one year are not annualized.
C Total returns would have been lower if certain expenses had not been reduced during the applicable periods shown.
D Total returns do not include the effect of the sales charges.
E Calculated based on average shares outstanding during the period.
F Amounts do not include the activity of the Underlying Funds.
G Expense ratios reflect operating expenses of the class. Expenses before reductions do not reflect amounts reimbursed by the investment adviser or reductions from expense offset arrangements and do not represent the amount paid by the class during periods when reimbursements or reductions occur. Expenses net of fee waivers reflect expenses after reimbursement by the investment adviser but prior to reductions from expense offset arrangements. Expenses net of all reductions represent the net expenses paid by the class but do not include expenses of the investment companies in which the Fund invests.
H Total distributions of $.59 per share is comprised of distributions from net investment income of $.262 and distributions from net realized gain of $.325 per share.
I Total distributions of $.28 per share is comprised of distributions from net investment income of $.197 and distributions from net realized gain of $.082 per share.
See accompanying notes which are an integral part of the financial statements.
Semiannual Report
Financial Highlights - Class T
| Six months ended
September 30, 2013 | Years ended March 31, |
| (Unaudited) | 2013 | 2012 | 2011 | 2010 | 2009 |
Selected Per-Share Data | | | | | | |
Net asset value, beginning of period | $ 12.46 | $ 11.83 | $ 11.85 | $ 10.79 | $ 8.04 | $ 11.82 |
Income from Investment Operations | | | | | | |
Net investment income (loss) E | .03 | .13 | .14 | .13 | .18 | .24 |
Net realized and unrealized gain (loss) | .30 | .72 | .13 | 1.16 | 2.82 | (3.46) |
Total from investment operations | .33 | .85 | .27 | 1.29 | 3.00 | (3.22) |
Distributions from net investment income | (.01) | (.13) | (.14) | (.13) | (.17) | (.23) |
Distributions from net realized gain | (.20) | (.09) | (.15) | (.10) | (.08) | (.33) |
Total distributions | (.21) | (.22) | (.29) | (.23) | (.25) I | (.56) H |
Net asset value, end of period | $ 12.58 | $ 12.46 | $ 11.83 | $ 11.85 | $ 10.79 | $ 8.04 |
Total Return B, C, D | 2.70% | 7.28% | 2.44% | 12.09% | 37.53% | (28.13)% |
Ratios to Average Net Assets F, G | | | | | | |
Expenses before reductions | .50% A | .50% | .50% | .50% | .50% | .50% |
Expenses net of fee waivers, if any | .50% A | .50% | .50% | .50% | .50% | .50% |
Expenses net of all reductions | .50% A | .50% | .50% | .50% | .50% | .50% |
Net investment income (loss) | .44% A | 1.11% | 1.25% | 1.17% | 1.77% | 2.44% |
Supplemental Data | | | | | | |
Net assets, end of period (000 omitted) | $ 231,749 | $ 227,022 | $ 213,366 | $ 236,106 | $ 225,384 | $ 162,439 |
Portfolio turnover rate F | 15% A | 20% | 19% | 33% | 29% | 36% |
A Annualized
B Total returns for periods of less than one year are not annualized.
C Total returns would have been lower if certain expenses had not been reduced during the applicable periods shown.
D Total returns do not include the effect of the sales charges.
E Calculated based on average shares outstanding during the period.
F Amounts do not include the activity of the Underlying Funds.
G Expense ratios reflect operating expenses of the class. Expenses before reductions do not reflect amounts reimbursed by the investment adviser or reductions from expense offset arrangements and do not represent the amount paid by the class during periods when reimbursements or reductions occur. Expenses net of fee waivers reflect expenses after reimbursement by the investment adviser but prior to reductions from expense offset arrangements. Expenses net of all reductions represent the net expenses paid by the class but do not include expenses of the investment companies in which the Fund invests.
H Total distributions of $.56 per share is comprised of distributions from net investment income of $.234 and distributions from net realized gain of $.325 per share.
I Total distributions of $.25 per share is comprised of distributions from net investment income of $.172 and distributions from net realized gain of $.082 per share.
Financial Highlights - Class B
| Six months ended
September 30, 2013 | Years ended March 31, |
| (Unaudited) | 2013 | 2012 | 2011 | 2010 | 2009 |
Selected Per-Share Data | | | | | | |
Net asset value, beginning of period | $ 12.44 | $ 11.81 | $ 11.82 | $ 10.76 | $ 8.02 | $ 11.77 |
Income from Investment Operations | | | | | | |
Net investment income (loss) E | - H | .07 | .09 | .07 | .13 | .19 |
Net realized and unrealized gain (loss) | .31 | .71 | .13 | 1.16 | 2.82 | (3.44) |
Total from investment operations | .31 | .78 | .22 | 1.23 | 2.95 | (3.25) |
Distributions from net investment income | - | (.06) | (.07) | (.07) | (.12) | (.17) |
Distributions from net realized gain | (.20) | (.09) | (.15) | (.10) | (.08) | (.33) |
Total distributions | (.20) | (.15) | (.23) K | (.17) | (.21) J | (.50) I |
Net asset value, end of period | $ 12.55 | $ 12.44 | $ 11.81 | $ 11.82 | $ 10.76 | $ 8.02 |
Total Return B, C, D | 2.50% | 6.65% | 1.95% | 11.51% | 36.85% | (28.47)% |
Ratios to Average Net Assets F, G | | | | | | |
Expenses before reductions | 1.00% A | 1.00% | 1.00% | 1.00% | 1.00% | 1.00% |
Expenses net of fee waivers, if any | 1.00% A | 1.00% | 1.00% | 1.00% | 1.00% | 1.00% |
Expenses net of all reductions | 1.00% A | 1.00% | 1.00% | 1.00% | 1.00% | 1.00% |
Net investment income (loss) | (.06)% A | .61% | .75% | .67% | 1.27% | 1.94% |
Supplemental Data | | | | | | |
Net assets, end of period (000 omitted) | $ 14,372 | $ 17,411 | $ 23,552 | $ 32,762 | $ 35,932 | $ 27,727 |
Portfolio turnover rate F | 15% A | 20% | 19% | 33% | 29% | 36% |
A Annualized
B Total returns for periods of less than one year are not annualized.
C Total returns would have been lower if certain expenses had not been reduced during the applicable periods shown.
D Total returns do not include the effect of the contingent deferred sales charge.
E Calculated based on average shares outstanding during the period.
F Amounts do not include the activity of the Underlying Funds.
G Expense ratios reflect operating expenses of the class. Expenses before reductions do not reflect amounts reimbursed by the investment adviser or reductions from expense offset arrangements and do not represent the amount paid by the class during periods when reimbursements or reductions occur. Expenses net of fee waivers reflect expenses after reimbursement by the investment adviser but prior to reductions from expense offset arrangements. Expenses net of all reductions represent the net expenses paid by the class but do not include expenses of the investment companies in which the Fund invests.
H Amount represents less than $.01 per share.
I Total distributions of $.50 per share is comprised of distributions from net investment income of $.173 and distributions from net realized gain of $.325 per share.
J Total distributions of $.21 per share is comprised of distributions from net investment income of $.124 and distributions from net realized gain of $.082 per share.
K Total distributions of $.23 per share is comprised of distributions from net investment income of $.073 and distributions from net realized gain of $.154 per share.
See accompanying notes which are an integral part of the financial statements.
Semiannual Report
Financial Highlights - Class C
| Six months ended
September 30, 2013 | Years ended March 31, |
| (Unaudited) | 2013 | 2012 | 2011 | 2010 | 2009 |
Selected Per-Share Data | | | | | | |
Net asset value, beginning of period | $ 12.39 | $ 11.77 | $ 11.79 | $ 10.74 | $ 8.00 | $ 11.76 |
Income from Investment Operations | | | | | | |
Net investment income (loss) E | - H | .07 | .09 | .07 | .13 | .19 |
Net realized and unrealized gain (loss) | .30 | .71 | .13 | 1.15 | 2.82 | (3.45) |
Total from investment operations | .30 | .78 | .22 | 1.22 | 2.95 | (3.26) |
Distributions from net investment income | - | (.07) | (.09) | (.07) | (.13) | (.18) |
Distributions from net realized gain | (.20) | (.09) | (.15) | (.10) | (.08) | (.33) |
Total distributions | (.20) | (.16) | (.24) | (.17) | (.21) J | (.50) I |
Net asset value, end of period | $ 12.49 | $ 12.39 | $ 11.77 | $ 11.79 | $ 10.74 | $ 8.00 |
Total Return B, C, D | 2.43% | 6.70% | 1.98% | 11.49% | 36.97% | (28.53)% |
Ratios to Average Net Assets F, G | | | | | | |
Expenses before reductions | 1.00% A | 1.00% | 1.00% | 1.00% | 1.00% | 1.00% |
Expenses net of fee waivers, if any | 1.00% A | 1.00% | 1.00% | 1.00% | 1.00% | 1.00% |
Expenses net of all reductions | 1.00% A | 1.00% | 1.00% | 1.00% | 1.00% | 1.00% |
Net investment income (loss) | (.06)% A | .61% | .75% | .67% | 1.27% | 1.94% |
Supplemental Data | | | | | | |
Net assets, end of period (000 omitted) | $ 72,753 | $ 72,115 | $ 70,220 | $ 70,396 | $ 64,801 | $ 46,942 |
Portfolio turnover rate F | 15% A | 20% | 19% | 33% | 29% | 36% |
A Annualized
B Total returns for periods of less than one year are not annualized.
C Total returns would have been lower if certain expenses had not been reduced during the applicable periods shown.
D Total returns do not include the effect of the contingent deferred sales charge.
E Calculated based on average shares outstanding during the period.
F Amounts do not include the activity of the Underlying Funds.
G Expense ratios reflect operating expenses of the class. Expenses before reductions do not reflect amounts reimbursed by the investment adviser or reductions from expense offset arrangements and do not represent the amount paid by the class during periods when reimbursements or reductions occur. Expenses net of fee waivers reflect expenses after reimbursement by the investment adviser but prior to reductions from expense offset arrangements. Expenses net of all reductions represent the net expenses paid by the class but do not include expenses of the investment companies in which the Fund invests.
H Amount represents less than $.01 per share.
I Total distributions of $.50 per share is comprised of distributions from net investment income of $.179 and distributions from net realized gain of $.325 per share.
J Total distributions of $.21 per share is comprised of distributions from net investment income of $.126 and distributions from net realized gain of $.082 per share.
Financial Highlights - Institutional Class
| Six months ended
September 30, 2013 | Years ended March 31, |
| (Unaudited) | 2013 | 2012 | 2011 | 2010 | 2009 |
Selected Per-Share Data | | | | | | |
Net asset value, beginning of period | $ 12.56 | $ 11.93 | $ 11.94 | $ 10.87 | $ 8.09 | $ 11.91 |
Income from Investment Operations | | | | | | |
Net investment income (loss) D | .06 | .19 | .20 | .19 | .23 | .29 |
Net realized and unrealized gain (loss) | .31 | .72 | .14 | 1.17 | 2.85 | (3.50) |
Total from investment operations | .37 | .91 | .34 | 1.36 | 3.08 | (3.21) |
Distributions from net investment income | (.03) | (.19) | (.19) | (.19) | (.22) | (.29) |
Distributions from net realized gain | (.20) | (.09) | (.15) | (.10) | (.08) | (.33) |
Total distributions | (.23) | (.28) | (.35) J | (.29) | (.30) I | (.61) H |
Net asset value, end of period | $ 12.70 | $ 12.56 | $ 11.93 | $ 11.94 | $ 10.87 | $ 8.09 |
Total Return B, C | 2.96% | 7.74% | 3.01% | 12.67% | 38.30% | (27.85)% |
Ratios to Average Net Assets E, G | | | | | | |
Expenses before reductions F | .00% A | .00% | .00% | .00% | .00% | .00% |
Expenses net of fee waivers, if any | .00% A | .00% | .00% | .00% | .00% | .00% |
Expenses net of all reductions | .00% A | .00% | .00% | .00% | .00% | .00% |
Net investment income (loss) | .94% A | 1.61% | 1.75% | 1.67% | 2.27% | 2.94% |
Supplemental Data | | | | | | |
Net assets, end of period (000 omitted) | $ 479,070 | $ 467,604 | $ 348,068 | $ 238,655 | $ 137,487 | $ 77,998 |
Portfolio turnover rate E | 15% A | 20% | 19% | 33% | 29% | 36% |
A Annualized
B Total returns for periods of less than one year are not annualized.
C Total returns would have been lower if certain expenses had not been reduced during the applicable periods shown.
D Calculated based on average shares outstanding during the period.
E Amounts do not include the activity of the Underlying Funds.
F Amount represents less than .01%.
G Expense ratios reflect operating expenses of the class. Expenses before reductions do not reflect amounts reimbursed by the investment adviser or reductions from expense offset arrangements and do not represent the amount paid by the class during periods when reimbursements or reductions occur. Expenses net of fee waivers reflect expenses after reimbursement by the investment adviser but prior to reductions from expense offset arrangements. Expenses net of all reductions represent the net expenses paid by the class but do not include expenses of the investment companies in which the Fund invests.
H Total distributions of $.61 per share is comprised of distributions from net investment income of $.286 and distributions from net realized gain of $.325 per share.
I Total distributions of $.30 per share is comprised of distributions from net investment income of $.219 and distributions from net realized gain of $.082 per share.
J Total distributions of $.35 per share is comprised of distributions from net investment income of $.194 and distributions from net realized gain of $.154 per share.
See accompanying notes which are an integral part of the financial statements.
Semiannual Report
Fidelity Advisor Freedom 2020 Fund
Investment Changes (Unaudited)
The information in the following tables is based on the direct investments of the Fund. |
Fund Holdings as of September 30, 2013 |
| % of fund's
net assets | % of fund's net assets
6 months ago |
Commodity Funds | | |
Fidelity Series Commodity Strategy Fund | 5.7 | 5.9 |
Domestic Equity Funds | | |
Fidelity Advisor Equity Growth Fund Institutional Class | 4.8 | 4.7 |
Fidelity Advisor Growth & Income Fund Institutional Class | 0.0 | 2.5 |
Fidelity Advisor Large Cap Fund Institutional Class | 2.4 | 2.5 |
Fidelity Advisor Series Equity-Income Fund | 3.3 | 3.4 |
Fidelity Advisor Series Growth & Income Fund (formerly Fidelity Advisor Series Mega Cap Fund) | 3.2 | 0.8 |
Fidelity Advisor Series Opportunistic Insights Fund | 2.5 | 2.4 |
Fidelity Advisor Series Stock Selector Large Cap Value Fund | 3.3 | 3.4 |
Fidelity Advisor Small Cap Fund Institutional Class | 1.9 | 1.9 |
Fidelity Series 100 Index Fund | 0.8 | 0.8 |
Fidelity Series All-Sector Equity Fund | 6.0 | 6.3 |
Fidelity Series Large Cap Value Fund | 3.2 | 3.6 |
Fidelity Series Real Estate Equity Fund | 0.5 | 0.5 |
Fidelity Series Small Cap Opportunities Fund | 2.2 | 2.2 |
| 34.1 | 35.0 |
Developed International Equity Funds | | |
Fidelity Series International Growth Fund | 5.3 | 5.2 |
Fidelity Series International Small Cap Fund | 1.1 | 1.1 |
Fidelity Series International Value Fund | 5.4 | 5.2 |
| 11.8 | 11.5 |
Emerging Markets Equity Funds | | |
Fidelity Series Emerging Markets Fund | 3.2 | 3.2 |
High Yield Bond Funds | | |
Fidelity Series Emerging Markets Debt Fund | 0.7 | 0.7 |
Fidelity Series Floating Rate High Income Fund | 1.1 | 1.1 |
Fidelity Series High Income Fund | 5.1 | 5.4 |
Fidelity Series Real Estate Income Fund | 0.5 | 0.6 |
| 7.4 | 7.8 |
Inflation-Protected Bond Funds | | |
Fidelity Series Inflation-Protected Bond Index Fund | 8.3 | 8.2 |
Investment Grade Bond Funds | | |
Fidelity Series Investment Grade Bond Fund | 22.2 | 21.7 |
Short-Term Funds | | |
Fidelity Advisor Short Fixed-Income Fund Institutional Class | 3.3 | 3.0 |
Fidelity Institutional Money Market Portfolio Institutional Class | 4.0 | 3.7 |
| 7.3 | 6.7 |
Net Other Assets (Liabilities)* | 0.0 | 0.0 |
| 100.0 | 100.0 |
* Amount represents less than 0.1% |
Asset Allocation (% of fund's net assets) |
Period end |
| Commodity Funds | 5.7% | |
| Domestic Equity Funds | 34.1% | |
| Developed International Equity Funds | 11.8% | |
| Emerging Markets Equity Funds | 3.2% | |
| High Yield Bond Funds | 7.4% | |
| Inflation-Protected Bond Funds | 8.3% | |
| Investment Grade Bond Funds | 22.2% | |
| Short-Term Funds | 7.3% | |

Six months ago |
| Commodity Funds | 5.9% | |
| Domestic Equity Funds | 35.0% | |
| Developed International Equity Funds | 11.5% | |
| Emerging Markets Equity Funds | 3.2% | |
| High Yield Bond Funds | 7.8% | |
| Inflation-Protected Bond Funds | 8.2% | |
| Investment Grade Bond Funds | 21.7% | |
| Short-Term Funds | 6.7% | |

Semiannual Report
Fidelity Advisor Freedom 2020 Fund
Investments September 30, 2013 (Unaudited)
Showing Percentage of Net Assets
Domestic Equity Funds - 39.8% |
| Shares | | Value |
Commodity Funds - 5.7% |
Fidelity Series Commodity Strategy Fund (a)(c) | 23,851,326 | | $ 191,049,124 |
Domestic Equity Funds - 34.1% |
Fidelity Advisor Equity Growth Fund Institutional Class (c) | 1,972,440 | | 162,292,346 |
Fidelity Advisor Large Cap Fund Institutional Class (c) | 2,992,307 | | 80,493,071 |
Fidelity Advisor Series Equity-Income Fund (c) | 9,274,631 | | 109,347,901 |
Fidelity Advisor Series Growth & Income Fund (c) | 8,847,621 | | 106,613,831 |
Fidelity Advisor Series Opportunistic Insights Fund (c) | 6,546,184 | | 84,314,856 |
Fidelity Advisor Series Stock Selector Large Cap Value Fund (c) | 8,955,894 | | 108,993,225 |
Fidelity Advisor Small Cap Fund Institutional Class (c) | 2,079,392 | | 63,379,858 |
Fidelity Series 100 Index Fund (c) | 2,284,101 | | 25,307,842 |
Fidelity Series All-Sector Equity Fund (c) | 14,220,903 | | 201,367,987 |
Fidelity Series Large Cap Value Fund (c) | 8,484,380 | | 107,157,715 |
Fidelity Series Real Estate Equity Fund (c) | 1,347,946 | | 16,121,429 |
Fidelity Series Small Cap Opportunities Fund (c) | 5,683,318 | | 72,916,976 |
TOTAL DOMESTIC EQUITY FUNDS | | 1,138,307,037 |
TOTAL DOMESTIC EQUITY FUNDS (Cost $1,125,427,943) |
1,329,356,161
|
International Equity Funds - 15.0% |
| | | |
Developed International Equity Funds - 11.8% |
Fidelity Series International Growth Fund (c) | 13,057,302 | | 177,187,590 |
Fidelity Series International Small Cap Fund (c) | 2,426,983 | | 37,108,567 |
Fidelity Series International Value Fund (c) | 16,688,406 | | 179,400,368 |
TOTAL DEVELOPED INTERNATIONAL EQUITY FUNDS | | 393,696,525 |
Emerging Markets Equity Funds - 3.2% |
Fidelity Series Emerging Markets Fund (c) | 6,374,744 | | 106,713,220 |
TOTAL INTERNATIONAL EQUITY FUNDS (Cost $413,019,840) |
500,409,745
|
Bond Funds - 37.9% |
| Shares | | Value |
High Yield Bond Funds - 7.4% |
Fidelity Series Emerging Markets Debt Fund (c) | 2,276,688 | | $ 23,040,085 |
Fidelity Series Floating Rate High Income Fund (c) | 3,380,027 | | 35,760,682 |
Fidelity Series High Income Fund (c) | 16,526,869 | | 169,896,215 |
Fidelity Series Real Estate Income Fund (c) | 1,729,962 | | 18,994,984 |
TOTAL HIGH YIELD BOND FUNDS | | 247,691,966 |
Inflation-Protected Bond Funds - 8.3% |
Fidelity Series Inflation-Protected Bond Index Fund (c) | 25,784,510 | | 279,761,928 |
Investment Grade Bond Funds - 22.2% |
Fidelity Series Investment Grade Bond Fund (c) | 66,238,611 | | 741,210,058 |
TOTAL BOND FUNDS (Cost $1,272,399,606) |
1,268,663,952
|
Short-Term Funds - 7.3% |
| | | |
Fidelity Advisor Short Fixed-Income Fund Institutional Class (c) | 11,775,997 | | 109,870,056 |
Fidelity Institutional Money Market Portfolio Institutional Class 0.04% (b)(c) | 134,555,896 | | 134,555,896 |
TOTAL SHORT-TERM FUNDS (Cost $243,596,756) |
244,425,952
|
TOTAL INVESTMENT PORTFOLIO - 100.0% (Cost $3,054,444,145) | | 3,342,855,810 |
NET OTHER ASSETS (LIABILITIES) - 0.0% | | (709,252) |
NET ASSETS - 100% | $ 3,342,146,558 |
Legend |
(a) Non-income producing |
(b) The rate quoted is the annualized seven-day yield of the fund at period end. |
(c) Affiliated company |
Affiliated Underlying Funds |
Information regarding the Fund's fiscal year to date purchases and sales of the affiliated Underlying Funds and income earned by the Fund from investments in affiliated Underlying Funds is as follows: |
Affiliate | Value,
beginning of
period | Purchases | Sales
Proceeds | Dividend
Income | Value,
end of
period |
Fidelity Advisor Equity Growth Fund Institutional Class | $ 154,490,981 | $ 3,223,721 | $ 19,034,255 | $ - | $ 162,292,346 |
Fidelity Advisor Growth & Income Fund Institutional Class | 82,252,688 | 1,179,659 | 90,548,966 | - | - |
Fidelity Advisor Large Cap Fund Institutional Class | 82,897,919 | 1,304,901 | 14,128,528 | - | 80,493,071 |
Fidelity Advisor Series Equity-Income Fund | 112,102,324 | 4,718,112 | 14,099,143 | 1,110,633 | 109,347,901 |
Fidelity Advisor Series Growth & Income Fund (formerly Fidelity Advisor Series Mega Cap Fund) | 25,056,657 | 82,413,162 | 4,216,579 | - | 106,613,831 |
Fidelity Advisor Series Opportunistic Insights Fund | 79,114,060 | 1,661,361 | 9,246,508 | - | 84,314,856 |
Fidelity Advisor Series Stock Selector Large Cap Value Fund | 112,492,720 | 2,323,676 | 15,419,985 | - | 108,993,225 |
Fidelity Advisor Short Fixed-Income Fund Institutional Class | 99,769,271 | 14,948,244 | 4,504,165 | 412,320 | 109,870,056 |
Fidelity Advisor Small Cap Fund Institutional Class | 63,218,442 | 1,279,201 | 8,910,773 | - | 63,379,858 |
Fidelity Institutional Money Market Portfolio Institutional Class | 121,613,151 | 18,457,545 | 5,514,799 | 74,444 | 134,555,896 |
Fidelity Series 100 Index Fund | 25,520,060 | 531,830 | 2,593,440 | - | 25,307,842 |
Fidelity Series All-Sector Equity Fund | 206,104,762 | 3,290,913 | 28,132,915 | - | 201,367,987 |
Fidelity Series Commodity Strategy Fund | 192,966,991 | 24,689,564 | 11,123,947 | - | 191,049,124 |
Fidelity Series Emerging Markets Debt Fund | 24,323,444 | 1,606,599 | 1,169,844 | 622,926 | 23,040,085 |
Fidelity Series Emerging Markets Fund | 104,167,314 | 6,953,355 | 4,751,158 | - | 106,713,220 |
Fidelity Series Floating Rate High Income Fund | 35,417,859 | 2,188,267 | 1,676,780 | 778,555 | 35,760,682 |
Fidelity Series High Income Fund | 176,298,804 | 10,132,141 | 12,708,092 | 4,522,668 | 169,896,215 |
Fidelity Series Inflation-Protected Bond Index Fund | 270,384,921 | 34,743,218 | 12,083,649 | - | 279,761,928 |
Fidelity Series International Growth Fund | 172,481,169 | 4,056,681 | 11,498,166 | - | 177,187,590 |
Fidelity Series International Small Cap Fund | 35,093,991 | 801,761 | 2,661,871 | - | 37,108,567 |
Fidelity Series International Value Fund | 170,880,200 | 4,006,841 | 11,286,606 | - | 179,400,368 |
Fidelity Series Investment Grade Bond Fund | 714,114,976 | 78,528,063 | 29,614,816 | 7,593,673 | 741,210,058 |
Fidelity Series Large Cap Value Fund | 117,278,679 | 1,801,591 | 21,545,172 | - | 107,157,715 |
Fidelity Series Real Estate Equity Fund | 17,572,853 | 1,000,461 | 1,077,827 | 111,039 | 16,121,429 |
Fidelity Series Real Estate Income Fund | 19,257,908 | 1,927,467 | 1,030,593 | 569,202 | 18,994,984 |
Fidelity Series Small Cap Opportunities Fund | 73,572,021 | 6,785,849 | 10,708,814 | - | 72,916,976 |
Total | $ 3,288,444,165 | $ 314,554,183 | $ 349,287,391 | $ 15,795,460 | $ 3,342,855,810 |
Other Information |
All investments are categorized as Level 1 under the Fair Value Hierarchy. The inputs or methodology used for valuing securities may not be an indication of the risk associated with investing in those securities. For more information on valuation inputs, please refer to the Investment Valuation section in the accompanying Notes to Financial Statements. |
See accompanying notes which are an integral part of the financial statements.
Semiannual Report
Fidelity Advisor Freedom 2020 Fund
Statement of Assets and Liabilities
| September 30, 2013 (Unaudited) |
| | |
Assets | | |
Investment in securities, at value (cost $3,054,444,145) - See accompanying schedule | | $ 3,342,855,810 |
Receivable for investments sold | | 7,668,632 |
Receivable for fund shares sold | | 1,867,608 |
Receivable from investment adviser for expense reductions | | 488 |
Total assets | | 3,352,392,538 |
| | |
Liabilities | | |
Payable for investments purchased | $ 39,099 | |
Payable for fund shares redeemed | 9,504,564 | |
Distribution and service plan fees payable | 702,317 | |
Total liabilities | | 10,245,980 |
| | |
Net Assets | | $ 3,342,146,558 |
Net Assets consist of: | | |
Paid in capital | | $ 3,005,099,870 |
Undistributed net investment income | | 11,588,465 |
Accumulated undistributed net realized gain (loss) on investments | | 37,046,558 |
Net unrealized appreciation (depreciation) on investments | | 288,411,665 |
Net Assets | | $ 3,342,146,558 |
| | |
Calculation of Maximum Offering Price Class A:
Net Asset Value and redemption price per share ($1,924,379,187 ÷ 145,694,237 shares) | | $ 13.21 |
| | |
Maximum offering price per share (100/94.25 of $13.21) | | $ 14.02 |
Class T:
Net Asset Value and redemption price per share ($458,026,350 ÷ 34,703,538 shares) | | $ 13.20 |
| | |
Maximum offering price per share (100/96.50 of $13.20) | | $ 13.68 |
Class B:
Net Asset Value and offering price per share ($27,861,864 ÷ 2,116,075 shares)A | | $ 13.17 |
| | |
Class C:
Net Asset Value and offering price per share ($106,811,497 ÷ 8,152,123 shares)A | | $ 13.10 |
| | |
Institutional Class:
Net Asset Value, offering price and redemption price per share ($825,067,660 ÷ 62,019,131 shares) | | $ 13.30 |
A Redemption price per share is equal to net asset value less any applicable contingent deferred sales charge.
Statement of Operations
Six months ended September 30, 2013 (Unaudited) |
| | |
Investment Income | | |
Income distributions from underlying funds | | $ 15,795,460 |
| | |
Expenses | | |
Distribution and service plan fees | $ 4,216,033 | |
Independent trustees' compensation | 6,185 | |
Total expenses before reductions | 4,222,218 | |
Expense reductions | (6,185) | 4,216,033 |
Net investment income (loss) | | 11,579,427 |
Realized and Unrealized Gain (Loss) Realized gain (loss) on sale of underlying fund shares | 36,129,236 | |
Capital gain distributions from underlying funds | 6,367,840 | |
Total net realized gain (loss) | | 42,497,076 |
Change in net unrealized appreciation (depreciation) on underlying funds | | 53,015,622 |
Net gain (loss) | | 95,512,698 |
Net increase (decrease) in net assets resulting from operations | | $ 107,092,125 |
See accompanying notes which are an integral part of the financial statements.
Semiannual Report
Fidelity Advisor Freedom 2020 Fund
Financial Statements - continued
Statement of Changes in Net Assets
| Six months ended
September 30, 2013
(Unaudited) | Year ended
March 31,
2013 |
Increase (Decrease) in Net Assets | | |
Operations | | |
Net investment income (loss) | $ 11,579,427 | $ 42,540,294 |
Net realized gain (loss) | 42,497,076 | 163,159,519 |
Change in net unrealized appreciation (depreciation) | 53,015,622 | 31,602,843 |
Net increase (decrease) in net assets resulting from operations | 107,092,125 | 237,302,656 |
Distributions to shareholders from net investment income | (4,816,181) | (42,626,632) |
Distributions to shareholders from net realized gain | (63,126,693) | (20,099,722) |
Total distributions | (67,942,874) | (62,726,354) |
Share transactions - net increase (decrease) | 15,215,669 | 290,138,617 |
Total increase (decrease) in net assets | 54,364,920 | 464,714,919 |
| | |
Net Assets | | |
Beginning of period | 3,287,781,638 | 2,823,066,719 |
End of period (including undistributed net investment income of $11,588,465 and undistributed net investment income of $4,825,219, respectively) | $ 3,342,146,558 | $ 3,287,781,638 |
Financial Highlights - Class A
| Six months ended September 30, 2013 | Years ended March 31, |
| (Unaudited) | 2013 | 2012 | 2011 | 2010 | 2009 |
Selected Per-Share Data | | | | | | |
Net asset value, beginning of period | $ 13.05 | $ 12.35 | $ 12.45 | $ 11.21 | $ 7.97 | $ 12.73 |
Income from Investment Operations | | | | | | |
Net investment income (loss) E | .05 | .18 | .19 | .16 | .20 | .25 |
Net realized and unrealized gain (loss) | .38 | .78 | .06 | 1.36 | 3.32 | (4.33) |
Total from investment operations | .43 | .96 | .25 | 1.52 | 3.52 | (4.08) |
Distributions from net investment income | (.02) | (.18) | (.18) | (.17) | (.19) | (.25) |
Distributions from net realized gain | (.25) | (.08) | (.18) | (.11) | (.09) | (.43) |
Total distributions | (.27) | (.26) | (.35) I | (.28) | (.28) H | (.68) |
Net asset value, end of period | $ 13.21 | $ 13.05 | $ 12.35 | $ 12.45 | $ 11.21 | $ 7.97 |
Total Return B, C, D | 3.32% | 7.91% | 2.23% | 13.73% | 44.32% | (33.34)% |
Ratios to Average Net Assets F, G | | | | | | |
Expenses before reductions | .25% A | .25% | .25% | .25% | .25% | .25% |
Expenses net of fee waivers, if any | .25% A | .25% | .25% | .25% | .25% | .25% |
Expenses net of all reductions | .25% A | .25% | .25% | .25% | .25% | .25% |
Net investment income (loss) | .70% A | 1.44% | 1.55% | 1.43% | 1.92% | 2.49% |
Supplemental Data | | | | | | |
Net assets, end of period (000 omitted) | $ 1,924,379 | $ 1,944,691 | $ 1,740,500 | $ 1,557,402 | $ 1,238,015 | $ 677,210 |
Portfolio turnover rate F | 19% A | 21% | 18% | 39% | 26% | 31% |
A Annualized
B Total returns for periods of less than one year are not annualized.
C Total returns would have been lower if certain expenses had not been reduced during the applicable periods shown.
D Total returns do not include the effect of the sales charges.
E Calculated based on average shares outstanding during the period.
F Amounts do not include the activity of the Underlying Funds.
G Expense ratios reflect operating expenses of the class. Expenses before reductions do not reflect amounts reimbursed by the investment adviser or reductions from expense offset arrangements and do not represent the amount paid by the class during periods when reimbursements or reductions occur. Expenses net of fee waivers reflect expenses after reimbursement by the investment adviser but prior to reductions from expense offset arrangements. Expenses net of all reductions represent the net expenses paid by the class but do not include expenses of the investment companies in which the Fund invests.
H Total distributions of $.28 per share is comprised of distributions from net investment income of $.189 and distributions from net realized gain of $.087 per share.
I Total distributions of $.35 per share is comprised of distributions from net investment income of $.178 and distributions from net realized gain of $.175 per share.
See accompanying notes which are an integral part of the financial statements.
Semiannual Report
Financial Highlights - Class T
| Six months ended September 30, 2013 | Years ended March 31, |
| (Unaudited) | 2013 | 2012 | 2011 | 2010 | 2009 |
Selected Per-Share Data | | | | | | |
Net asset value, beginning of period | $ 13.05 | $ 12.34 | $ 12.45 | $ 11.20 | $ 7.96 | $ 12.72 |
Income from Investment Operations | | | | | | |
Net investment income (loss) E | .03 | .15 | .16 | .13 | .17 | .23 |
Net realized and unrealized gain (loss) | .38 | .79 | .05 | 1.37 | 3.32 | (4.34) |
Total from investment operations | .41 | .94 | .21 | 1.50 | 3.49 | (4.11) |
Distributions from net investment income | (.01) | (.15) | (.15) | (.13) | (.16) | (.22) |
Distributions from net realized gain | (.25) | (.08) | (.18) | (.11) | (.09) | (.43) |
Total distributions | (.26) | (.23) | (.32) J | (.25) I | (.25) H | (.65) |
Net asset value, end of period | $ 13.20 | $ 13.05 | $ 12.34 | $ 12.45 | $ 11.20 | $ 7.96 |
Total Return B, C, D | 3.18% | 7.72% | 1.86% | 13.50% | 44.02% | (33.56)% |
Ratios to Average Net Assets F, G | | | | | | |
Expenses before reductions | .50% A | .50% | .50% | .50% | .50% | .50% |
Expenses net of fee waivers, if any | .50% A | .50% | .50% | .50% | .50% | .50% |
Expenses net of all reductions | .50% A | .50% | .50% | .50% | .50% | .50% |
Net investment income (loss) | .45% A | 1.19% | 1.30% | 1.18% | 1.67% | 2.24% |
Supplemental Data | | | | | | |
Net assets, end of period (000 omitted) | $ 458,026 | $ 430,153 | $ 386,416 | $ 424,707 | $ 488,097 | $ 343,919 |
Portfolio turnover rate F | 19% A | 21% | 18% | 39% | 26% | 31% |
A Annualized
B Total returns for periods of less than one year are not annualized.
C Total returns would have been lower if certain expenses had not been reduced during the applicable periods shown.
D Total returns do not include the effect of the sales charges.
E Calculated based on average shares outstanding during the period.
F Amounts do not include the activity of the Underlying Funds.
G Expense ratios reflect operating expenses of the class. Expenses before reductions do not reflect amounts reimbursed by the investment adviser or reductions from expense offset arrangements and do not represent the amount paid by the class during periods when reimbursements or reductions occur. Expenses net of fee waivers reflect expenses after reimbursement by the investment adviser but prior to reductions from expense offset arrangements. Expenses net of all reductions represent the net expenses paid by the class but do not include expenses of the investment companies in which the Fund invests.
H Total distributions of $.25 per share is comprised of distributions from net investment income of $.163 and distributions from net realized gain of $.087 per share.
I Total distributions of $.25 per share is comprised of distributions from net investment income of $.134 and distributions from net realized gain of $.111 per share.
J Total distributions of $.32 per share is comprised of distributions from net investment income of $.145 and distributions from net realized gain of $.175 per share.
Financial Highlights - Class B
| Six months ended September 30, 2013 | Years ended March 31, |
| (Unaudited) | 2013 | 2012 | 2011 | 2010 | 2009 |
Selected Per-Share Data | | | | | | |
Net asset value, beginning of period | $ 13.04 | $ 12.32 | $ 12.41 | $ 11.17 | $ 7.94 | $ 12.66 |
Income from Investment Operations | | | | | | |
Net investment income (loss) E | - H | .09 | .10 | .08 | .12 | .18 |
Net realized and unrealized gain (loss) | .38 | .79 | .06 | 1.35 | 3.31 | (4.31) |
Total from investment operations | .38 | .88 | .16 | 1.43 | 3.43 | (4.13) |
Distributions from net investment income | - | (.08) | (.08) | (.08) | (.12) | (.16) |
Distributions from net realized gain | (.25) | (.08) | (.17) | (.11) | (.09) | (.43) |
Total distributions | (.25) | (.16) | (.25) | (.19) | (.20) I | (.59) |
Net asset value, end of period | $ 13.17 | $ 13.04 | $ 12.32 | $ 12.41 | $ 11.17 | $ 7.94 |
Total Return B, C, D | 2.90% | 7.19% | 1.39% | 12.87% | 43.34% | (33.87)% |
Ratios to Average Net Assets F, G | | | | | | |
Expenses before reductions | 1.00% A | 1.00% | 1.00% | 1.00% | 1.00% | 1.00% |
Expenses net of fee waivers, if any | 1.00% A | 1.00% | 1.00% | 1.00% | 1.00% | 1.00% |
Expenses net of all reductions | 1.00% A | 1.00% | 1.00% | 1.00% | 1.00% | 1.00% |
Net investment income (loss) | (.05)% A | .69% | .80% | .68% | 1.17% | 1.74% |
Supplemental Data | | | | | | |
Net assets, end of period (000 omitted) | $ 27,862 | $ 33,074 | $ 43,138 | $ 61,856 | $ 71,888 | $ 52,871 |
Portfolio turnover rate F | 19% A | 21% | 18% | 39% | 26% | 31% |
A Annualized
B Total returns for periods of less than one year are not annualized.
C Total returns would have been lower if certain expenses had not been reduced during the applicable periods shown.
D Total returns do not include the effect of the contingent deferred sales charge.
E Calculated based on average shares outstanding during the period.
F Amounts do not include the activity of the Underlying Funds.
G Expense ratios reflect operating expenses of the class. Expenses before reductions do not reflect amounts reimbursed by the investment adviser or reductions from expense offset arrangements and do not represent the amount paid by the class during periods when reimbursements or reductions occur. Expenses net of fee waivers reflect expenses after reimbursement by the investment adviser but prior to reductions from expense offset arrangements. Expenses net of all reductions represent the net expenses paid by the class but do not include expenses of the investment companies in which the Fund invests.
H Amount represents less than $.01 per share.
I Total distributions of $.20 per share is comprised of distributions from net investment income of $.115 and distributions from net realized gain of $.087 per share.
See accompanying notes which are an integral part of the financial statements.
Semiannual Report
Financial Highlights - Class C
| Six months ended September 30, 2013 | Years ended March 31, |
| (Unaudited) | 2013 | 2012 | 2011 | 2010 | 2009 |
Selected Per-Share Data | | | | | | |
Net asset value, beginning of period | $ 12.97 | $ 12.27 | $ 12.37 | $ 11.14 | $ 7.92 | $ 12.64 |
Income from Investment Operations | | | | | | |
Net investment income (loss) E | - J | .09 | .10 | .08 | .12 | .18 |
Net realized and unrealized gain (loss) | .38 | .78 | .06 | 1.34 | 3.31 | (4.31) |
Total from investment operations | .38 | .87 | .16 | 1.42 | 3.43 | (4.13) |
Distributions from net investment income | - | (.08) | (.09) | (.08) | (.12) | (.16) |
Distributions from net realized gain | (.25) | (.08) | (.17) | (.11) | (.09) | (.43) |
Total distributions | (.25) | (.17) I | (.26) | (.19) | (.21) H | (.59) |
Net asset value, end of period | $ 13.10 | $ 12.97 | $ 12.27 | $ 12.37 | $ 11.14 | $ 7.92 |
Total Return B, C, D | 2.92% | 7.13% | 1.43% | 12.89% | 43.38% | (33.90)% |
Ratios to Average Net Assets F, G | | | | | | |
Expenses before reductions | 1.00% A | 1.00% | 1.00% | 1.00% | 1.00% | 1.00% |
Expenses net of fee waivers, if any | 1.00% A | 1.00% | 1.00% | 1.00% | 1.00% | 1.00% |
Expenses net of all reductions | 1.00% A | 1.00% | 1.00% | 1.00% | 1.00% | 1.00% |
Net investment income (loss) | (.05)% A | .69% | .80% | .68% | 1.17% | 1.74% |
Supplemental Data | | | | | | |
Net assets, end of period (000 omitted) | $ 106,811 | $ 102,576 | $ 97,550 | $ 101,019 | $ 93,237 | $ 62,702 |
Portfolio turnover rate F | 19% A | 21% | 18% | 39% | 26% | 31% |
A Annualized
B Total returns for periods of less than one year are not annualized.
C Total returns would have been lower if certain expenses had not been reduced during the applicable periods shown.
D Total returns do not include the effect of the contingent deferred sales charge.
E Calculated based on average shares outstanding during the period.
F Amounts do not include the activity of the Underlying Funds.
G Expense ratios reflect operating expenses of the class. Expenses before reductions do not reflect amounts reimbursed by the investment adviser or reductions from expense offset arrangements and do not represent the amount paid by the class during periods when reimbursements or reductions occur. Expenses net of fee waivers reflect expenses after reimbursement by the investment adviser but prior to reductions from expense offset arrangements. Expenses net of all reductions represent the net expenses paid by the class but do not include expenses of the investment companies in which the Fund invests.
H Total distributions of $.21 per share is comprised of distributions from net investment income of $.119 and distributions from net realized gain of $.087 per share.
I Total distributions of $.17 per share is comprised of distributions from net investment income of $.084 and distributions from net realized gain of $.083 per share.
J Amount represents less than .01%.
Financial Highlights - Institutional Class
| Six months ended September 30, 2013 | Years ended March 31, |
| (Unaudited) | 2013 | 2012 | 2011 | 2010 | 2009 |
Selected Per-Share Data | | | | | | |
Net asset value, beginning of period | $ 13.14 | $ 12.42 | $ 12.53 | $ 11.27 | $ 8.01 | $ 12.79 |
Income from Investment Operations | | | | | | |
Net investment income (loss) D | .06 | .21 | .22 | .19 | .22 | .28 |
Net realized and unrealized gain (loss) | .38 | .80 | .05 | 1.38 | 3.34 | (4.35) |
Total from investment operations | .44 | 1.01 | .27 | 1.57 | 3.56 | (4.07) |
Distributions from net investment income | (.03) | (.21) | (.21) | (.20) | (.21) | (.28) |
Distributions from net realized gain | (.25) | (.08) | (.18) | (.11) | (.09) | (.43) |
Total distributions | (.28) | (.29) | (.38) I | (.31) | (.30) H | (.71) |
Net asset value, end of period | $ 13.30 | $ 13.14 | $ 12.42 | $ 12.53 | $ 11.27 | $ 8.01 |
Total Return B, C | 3.36% | 8.28% | 2.39% | 14.09% | 44.65% | (33.16)% |
Ratios to Average Net Assets E, G | | | | | | |
Expenses before reductions F | .00% A | .00% | .00% | .00% | .00% | .00% |
Expenses net of fee waivers, if any | .00% A | .00% | .00% | .00% | .00% | .00% |
Expenses net of all reductions | .00% A | .00% | .00% | .00% | .00% | .00% |
Net investment income (loss) | .95% A | 1.69% | 1.80% | 1.68% | 2.17% | 2.74% |
Supplemental Data | | | | | | |
Net assets, end of period (000 omitted) | $ 825,068 | $ 777,288 | $ 555,462 | $ 365,157 | $ 214,905 | $ 105,660 |
Portfolio turnover rate E | 19% A | 21% | 18% | 39% | 26% | 31% |
A Annualized
B Total returns for periods of less than one year are not annualized.
C Total returns would have been lower if certain expenses had not been reduced during the applicable periods shown.
D Calculated based on average shares outstanding during the period.
E Amounts do not include the activity of the Underlying Funds.
F Amount represents less than .01%.
G Expense ratios reflect operating expenses of the class. Expenses before reductions do not reflect amounts reimbursed by the investment adviser or reductions from expense offset arrangements and do not represent the amount paid by the class during periods when reimbursements or reductions occur. Expenses net of fee waivers reflect expenses after reimbursement by the investment adviser but prior to reductions from expense offset arrangements. Expenses net of all reductions represent the net expenses paid by the class but do not include expenses of the investment companies in which the Fund invests.
H Total distributions of $.30 per share is comprised of distributions from net investment income of $.211 and distributions from net realized gain of $.087 per share.
I Total distributions of $.38 per share is comprised of distributions from net investment income of $.208 and distributions from net realized gain of $.175 per share.
See accompanying notes which are an integral part of the financial statements.
Semiannual Report
Fidelity Advisor Freedom 2025 Fund
Investment Changes (Unaudited)
The information in the following tables is based on the direct investments of the Fund. |
Fund Holdings as of September 30, 2013 |
| % of fund's
net assets | % of fund's net assets
6 months ago |
Commodity Funds | | |
Fidelity Series Commodity Strategy Fund | 7.1 | 7.2 |
Domestic Equity Funds | | |
Fidelity Advisor Equity Growth Fund Institutional Class | 6.0 | 5.8 |
Fidelity Advisor Growth & Income Fund Institutional Class | 0.0 | 3.1 |
Fidelity Advisor Large Cap Fund Institutional Class | 2.9 | 3.1 |
Fidelity Advisor Series Equity-Income Fund | 4.0 | 4.1 |
Fidelity Advisor Series Growth & Income Fund (formerly Fidelity Advisor Series Mega Cap Fund) | 3.9 | 0.9 |
Fidelity Advisor Series Opportunistic Insights Fund | 3.1 | 2.9 |
Fidelity Advisor Series Stock Selector Large Cap Value Fund | 4.0 | 4.1 |
Fidelity Advisor Small Cap Fund Institutional Class | 2.3 | 2.4 |
Fidelity Series 100 Index Fund | 0.9 | 0.9 |
Fidelity Series All-Sector Equity Fund | 7.4 | 7.6 |
Fidelity Series Large Cap Value Fund | 3.9 | 4.3 |
Fidelity Series Real Estate Equity Fund | 0.6 | 0.6 |
Fidelity Series Small Cap Opportunities Fund | 2.7 | 2.8 |
| 41.7 | 42.6 |
Developed International Equity Funds | | |
Fidelity Series International Growth Fund | 6.5 | 6.4 |
Fidelity Series International Small Cap Fund | 1.3 | 1.3 |
Fidelity Series International Value Fund | 6.6 | 6.3 |
| 14.4 | 14.0 |
Emerging Markets Equity Funds | | |
Fidelity Series Emerging Markets Fund | 3.8 | 3.8 |
High Yield Bond Funds | | |
Fidelity Series Emerging Markets Debt Fund | 0.7 | 0.7 |
Fidelity Series Floating Rate High Income Fund | 0.9 | 0.9 |
Fidelity Series High Income Fund | 6.8 | 6.9 |
Fidelity Series Real Estate Income Fund | 0.5 | 0.6 |
| 8.9 | 9.1 |
Inflation-Protected Bond Funds | | |
Fidelity Series Inflation-Protected Bond Index Fund | 5.6 | 5.4 |
Investment Grade Bond Funds | | |
Fidelity Series Investment Grade Bond Fund | 17.5 | 17.2 |
Short-Term Funds | | |
Fidelity Advisor Short Fixed-Income Fund Institutional Class | 0.5 | 0.3 |
Fidelity Institutional Money Market Portfolio Institutional Class | 0.5 | 0.4 |
| 1.0 | 0.7 |
Net Other Assets (Liabilities)* | 0.0 | 0.0 |
| 100.0 | 100.0 |
* Amount represents less than 0.1% |
Asset Allocation (% of fund's net assets) |
Period end |
| Commodity Funds | 7.1% | |
| Domestic Equity Funds | 41.7% | |
| Developed International Equity Funds | 14.4% | |
| Emerging Markets Equity Funds | 3.8% | |
| High Yield Bond Funds | 8.9% | |
| Inflation-Protected Bond Funds | 5.6% | |
| Investment Grade Bond Funds | 17.5% | |
| Short-Term Funds | 1.0% | |

Six months ago |
| Commodity Funds | 7.2% | |
| Domestic Equity Funds | 42.6% | |
| Developed International Equity Funds | 14.0% | |
| Emerging Markets Equity Funds | 3.8% | |
| High Yield Bond Funds | 9.1% | |
| Inflation-Protected Bond Funds | 5.4% | |
| Investment Grade Bond Funds | 17.2% | |
| Short-Term Funds | 0.7% | |

Semiannual Report
Fidelity Advisor Freedom 2025 Fund
Investments September 30, 2013 (Unaudited)
Showing Percentage of Net Assets
Domestic Equity Funds - 48.8% |
| Shares | | Value |
Commodity Funds - 7.1% |
Fidelity Series Commodity Strategy Fund (a)(c) | 27,380,042 | | $ 219,314,140 |
Domestic Equity Funds - 41.7% |
Fidelity Advisor Equity Growth Fund Institutional Class (c) | 2,242,267 | | 184,493,740 |
Fidelity Advisor Large Cap Fund Institutional Class (c) | 3,389,723 | | 91,183,542 |
Fidelity Advisor Series Equity-Income Fund (c) | 10,604,475 | | 125,026,758 |
Fidelity Advisor Series Growth & Income Fund (c) | 10,030,978 | | 120,873,284 |
Fidelity Advisor Series Opportunistic Insights Fund (c) | 7,375,859 | | 95,001,059 |
Fidelity Advisor Series Stock Selector Large Cap Value Fund (c) | 10,180,774 | | 123,900,025 |
Fidelity Advisor Small Cap Fund Institutional Class (c) | 2,358,760 | | 71,894,992 |
Fidelity Series 100 Index Fund (c) | 2,591,040 | | 28,708,722 |
Fidelity Series All-Sector Equity Fund (c) | 16,132,401 | | 228,434,798 |
Fidelity Series Large Cap Value Fund (c) | 9,639,793 | | 121,750,588 |
Fidelity Series Real Estate Equity Fund (c) | 1,505,208 | | 18,002,283 |
Fidelity Series Small Cap Opportunities Fund (c) | 6,438,853 | | 82,610,489 |
TOTAL DOMESTIC EQUITY FUNDS | | 1,291,880,280 |
TOTAL DOMESTIC EQUITY FUNDS (Cost $1,292,190,477) |
1,511,194,420
|
International Equity Funds - 18.2% |
| | | |
Developed International Equity Funds - 14.4% |
Fidelity Series International Growth Fund (c) | 14,825,452 | | 201,181,390 |
Fidelity Series International Small Cap Fund (c) | 2,785,181 | | 42,585,411 |
Fidelity Series International Value Fund (c) | 18,958,092 | | 203,799,494 |
TOTAL DEVELOPED INTERNATIONAL EQUITY FUNDS | | 447,566,295 |
Emerging Markets Equity Funds - 3.8% |
Fidelity Series Emerging Markets Fund (c) | 7,047,640 | | 117,977,495 |
TOTAL INTERNATIONAL EQUITY FUNDS (Cost $471,028,648) |
565,543,790
|
Bond Funds - 32.0% |
| Shares | | Value |
High Yield Bond Funds - 8.9% |
Fidelity Series Emerging Markets Debt Fund (c) | 2,085,995 | | $ 21,110,267 |
Fidelity Series Floating Rate High Income Fund (c) | 2,627,084 | | 27,794,546 |
Fidelity Series High Income Fund (c) | 20,549,149 | | 211,245,254 |
Fidelity Series Real Estate Income Fund (c) | 1,433,256 | | 15,737,147 |
TOTAL HIGH YIELD BOND FUNDS | | 275,887,214 |
Inflation-Protected Bond Funds - 5.6% |
Fidelity Series Inflation-Protected Bond Index Fund (c) | 15,935,172 | | 172,896,619 |
Investment Grade Bond Funds - 17.5% |
Fidelity Series Investment Grade Bond Fund (c) | 48,611,067 | | 543,957,840 |
TOTAL BOND FUNDS (Cost $995,066,129) |
992,741,673
|
Short-Term Funds - 1.0% |
| | | |
Fidelity Advisor Short Fixed-Income Fund Institutional Class (c) | 1,445,816 | | 13,489,466 |
Fidelity Institutional Money Market Portfolio Institutional Class 0.04% (b)(c) | 16,456,376 | | 16,456,376 |
TOTAL SHORT-TERM FUNDS (Cost $29,938,324) |
29,945,842
|
TOTAL INVESTMENT PORTFOLIO - 100.0% (Cost $2,788,223,578) | | 3,099,425,725 |
NET OTHER ASSETS (LIABILITIES) - 0.0% | | (622,715) |
NET ASSETS - 100% | $ 3,098,803,010 |
Legend |
(a) Non-income producing |
(b) The rate quoted is the annualized seven-day yield of the fund at period end. |
(c) Affiliated company |
Affiliated Underlying Funds |
Information regarding the Fund's fiscal year to date purchases and sales of the affiliated Underlying Funds and income earned by the Fund from investments in affiliated Underlying Funds is as follows: |
Affiliate | Value,
beginning of
period | Purchases | Sales
Proceeds | Dividend
Income | Value,
end of
period |
Fidelity Advisor Equity Growth Fund Institutional Class | $ 168,222,574 | $ 7,405,590 | $ 17,490,758 | $ - | $ 184,493,740 |
Fidelity Advisor Growth & Income Fund Institutional Class | 89,324,444 | 2,811,266 | 99,939,107 | - | - |
Fidelity Advisor Large Cap Fund Institutional Class | 90,137,343 | 3,221,928 | 13,692,812 | - | 91,183,542 |
Fidelity Advisor Series Equity-Income Fund | 118,699,060 | 8,736,435 | 9,504,432 | 1,197,964 | 125,026,758 |
Fidelity Advisor Series Growth & Income Fund (formerly Fidelity Advisor Series Mega Cap Fund) | 26,284,215 | 93,761,370 | 2,825,271 | - | 120,873,284 |
Fidelity Advisor Series Opportunistic Insights Fund | 83,888,742 | 3,849,513 | 6,799,198 | - | 95,001,059 |
Fidelity Advisor Series Stock Selector Large Cap Value Fund | 119,562,234 | 5,329,384 | 11,393,798 | - | 123,900,025 |
Fidelity Advisor Short Fixed-Income Fund Institutional Class | 9,663,635 | 4,257,553 | 395,358 | 45,730 | 13,489,466 |
Fidelity Advisor Small Cap Fund Institutional Class | 68,924,591 | 2,943,851 | 8,663,342 | - | 71,894,992 |
Fidelity Institutional Money Market Portfolio Institutional Class | 11,776,143 | 5,122,324 | 442,091 | 8,159 | 16,456,376 |
Fidelity Series 100 Index Fund | 27,794,239 | 1,226,747 | 2,351,000 | - | 28,708,722 |
Fidelity Series All-Sector Equity Fund | 223,124,251 | 8,122,887 | 25,057,646 | - | 228,434,798 |
Fidelity Series Commodity Strategy Fund | 209,981,372 | 35,863,438 | 9,579,953 | - | 219,314,140 |
Fidelity Series Emerging Markets Debt Fund | 21,302,722 | 2,108,436 | 784,023 | 552,908 | 21,110,267 |
Fidelity Series Emerging Markets Fund | 111,535,501 | 9,550,703 | 3,513,908 | - | 117,977,495 |
Fidelity Series Floating Rate High Income Fund | 26,695,868 | 2,194,164 | 965,129 | 591,216 | 27,794,546 |
Fidelity Series High Income Fund | 202,125,088 | 21,000,053 | 7,396,232 | 5,412,578 | 211,245,254 |
Fidelity Series Inflation-Protected Bond Index Fund | 157,454,593 | 28,268,349 | 4,996,441 | - | 172,896,619 |
Fidelity Series International Growth Fund | 184,869,495 | 9,400,905 | 6,790,722 | - | 201,181,390 |
Fidelity Series International Small Cap Fund | 37,686,968 | 1,877,739 | 1,358,125 | - | 42,585,411 |
Fidelity Series International Value Fund | 183,537,602 | 9,388,860 | 6,790,722 | - | 203,799,494 |
Fidelity Series Investment Grade Bond Fund | 501,358,646 | 73,432,014 | 15,499,251 | 5,431,373 | 543,957,840 |
Fidelity Series Large Cap Value Fund | 126,349,210 | 4,447,248 | 19,589,097 | - | 121,750,588 |
Fidelity Series Real Estate Equity Fund | 18,637,135 | 1,723,810 | 857,777 | 121,082 | 18,002,283 |
Fidelity Series Real Estate Income Fund | 15,704,734 | 1,517,239 | 542,577 | 462,772 | 15,737,147 |
Fidelity Series Small Cap Opportunities Fund | 80,339,838 | 9,409,963 | 10,721,184 | - | 82,610,489 |
Total | $ 2,914,980,243 | $ 356,971,769 | $ 287,939,954 | $ 13,823,782 | $ 3,099,425,725 |
Other Information |
All investments are categorized as Level 1 under the Fair Value Hierarchy. The inputs or methodology used for valuing securities may not be an indication of the risk associated with investing in those securities. For more information on valuation inputs, please refer to the Investment Valuation section in the accompanying Notes to Financial Statements. |
See accompanying notes which are an integral part of the financial statements.
Semiannual Report
Fidelity Advisor Freedom 2025 Fund
Statement of Assets and Liabilities
| September 30, 2013 (Unaudited) |
| | |
Assets | | |
Investment in securities, at value (cost $2,788,223,578) - See accompanying schedule | | $ 3,099,425,725 |
Cash | | 8 |
Receivable for investments sold | | 8,805,809 |
Receivable for fund shares sold | | 2,242,527 |
Receivable from investment adviser for expense reductions | | 881 |
Total assets | | 3,110,474,950 |
| | |
Liabilities | | |
Payable for investments purchased | $ 16,484 | |
Payable for fund shares redeemed | 11,034,457 | |
Distribution and service plan fees payable | 620,999 | |
Total liabilities | | 11,671,940 |
| | |
Net Assets | | $ 3,098,803,010 |
Net Assets consist of: | | |
Paid in capital | | $ 2,748,159,358 |
Undistributed net investment income | | 10,187,795 |
Accumulated undistributed net realized gain (loss) on investments | | 29,253,710 |
Net unrealized appreciation (depreciation) on investments | | 311,202,147 |
Net Assets | | $ 3,098,803,010 |
| | |
Calculation of Maximum Offering Price Class A:
Net Asset Value and redemption price per share ($1,863,005,317 ÷ 144,581,286 shares) | | $ 12.89 |
| | |
Maximum offering price per share (100/94.25 of $12.89) | | $ 13.68 |
Class T:
Net Asset Value and redemption price per share ($360,450,566 ÷ 27,937,618 shares) | | $ 12.90 |
| | |
Maximum offering price per share (100/96.50 of $12.90) | | $ 13.37 |
Class B:
Net Asset Value and offering price per share ($19,823,406 ÷ 1,548,956 shares)A | | $ 12.80 |
| | |
Class C:
Net Asset Value and offering price per share ($81,403,084 ÷ 6,392,425 shares)A | | $ 12.73 |
| | |
Institutional Class:
Net Asset Value, offering price and redemption price per share ($774,120,637 ÷ 59,610,731 shares) | | $ 12.99 |
A Redemption price per share is equal to net asset value less any applicable contingent deferred sales charge.
Statement of Operations
Six months ended September 30, 2013 (Unaudited) |
| | |
Investment Income | | |
Income distributions from underlying funds | | $ 13,823,782 |
| | |
Expenses | | |
Distribution and service plan fees | $ 3,654,117 | |
Independent trustees' compensation | 5,552 | |
Total expenses before reductions | 3,659,669 | |
Expense reductions | (5,552) | 3,654,117 |
Net investment income (loss) | | 10,169,665 |
Realized and Unrealized Gain (Loss) Realized gain (loss) on sale of underlying fund shares | 27,476,679 | |
Capital gain distributions from underlying funds | 7,087,107 | |
Total net realized gain (loss) | | 34,563,786 |
Change in net unrealized appreciation (depreciation) on underlying funds | | 87,936,986 |
Net gain (loss) | | 122,500,772 |
Net increase (decrease) in net assets resulting from operations | | $ 132,670,437 |
See accompanying notes which are an integral part of the financial statements.
Semiannual Report
Fidelity Advisor Freedom 2025 Fund
Financial Statements - continued
Statement of Changes in Net Assets
| Six months ended September 30, 2013 (Unaudited) | Year ended
March 31,
2013 |
Increase (Decrease) in Net Assets | | |
Operations | | |
Net investment income (loss) | $ 10,169,665 | $ 39,243,788 |
Net realized gain (loss) | 34,563,786 | 155,185,524 |
Change in net unrealized appreciation (depreciation) | 87,936,986 | 39,571,192 |
Net increase (decrease) in net assets resulting from operations | 132,670,437 | 234,000,504 |
Distributions to shareholders from net investment income | (4,026,824) | (38,848,941) |
Distributions to shareholders from net realized gain | (85,918,081) | (14,347,444) |
Total distributions | (89,944,905) | (53,196,385) |
Share transactions - net increase (decrease) | 141,682,509 | 370,631,756 |
Total increase (decrease) in net assets | 184,408,041 | 551,435,875 |
| | |
Net Assets | | |
Beginning of period | 2,914,394,969 | 2,362,959,094 |
End of period (including undistributed net investment income of $10,187,795 and undistributed net investment income of $4,044,954, respectively) | $ 3,098,803,010 | $ 2,914,394,969 |
Financial Highlights - Class A
| Six months ended September 30, 2013 | Years ended March 31, |
| (Unaudited) | 2013 | 2012 | 2011 | 2010 | 2009 |
Selected Per-Share Data | | | | | | |
Net asset value, beginning of period | $ 12.72 | $ 11.91 | $ 12.09 | $ 10.76 | $ 7.51 | $ 12.26 |
Income from Investment Operations | | | | | | |
Net investment income (loss) E | .04 | .18 | .18 | .16 | .18 | .23 |
Net realized and unrealized gain (loss) | .52 | .88 | (.01) | 1.43 | 3.32 | (4.36) |
Total from investment operations | .56 | 1.06 | .17 | 1.59 | 3.50 | (4.13) |
Distributions from net investment income | (.02) | (.18) | (.17) | (.16) | (.17) | (.22) |
Distributions from net realized gain | (.37) | (.07) | (.18) | (.11) | (.09) | (.40) |
Total distributions | (.39) | (.25) | (.35) | (.26) I | (.25) H | (.62) |
Net asset value, end of period | $ 12.89 | $ 12.72 | $ 11.91 | $ 12.09 | $ 10.76 | $ 7.51 |
Total Return B, C, D | 4.49% | 9.00% | 1.61% | 14.97% | 46.86% | (34.98)% |
Ratios to Average Net Assets F, G | | | | | | |
Expenses before reductions | .25% A | .25% | .25% | .25% | .25% | .25% |
Expenses net of fee waivers, if any | .25% A | .25% | .25% | .25% | .25% | .25% |
Expenses net of all reductions | .25% A | .25% | .25% | .25% | .25% | .25% |
Net investment income (loss) | .67% A | 1.54% | 1.56% | 1.42% | 1.82% | 2.41% |
Supplemental Data | | | | | | |
Net assets, end of period (000 omitted) | $ 1,863,005 | $ 1,806,028 | $ 1,539,333 | $ 1,290,255 | $ 999,687 | $ 512,482 |
Portfolio turnover rate F | 19% A | 22% | 14% | 34% | 19% | 29% |
A Annualized
B Total returns for periods of less than one year are not annualized.
C Total returns would have been lower if certain expenses had not been reduced during the applicable periods shown.
D Total returns do not include the effect of the sales charges.
E Calculated based on average shares outstanding during the period.
F Amounts do not include the activity of the Underlying Funds.
G Expense ratios reflect operating expenses of the class. Expenses before reductions do not reflect amounts reimbursed by the investment adviser or reductions from expense offset arrangements and do not represent the amount paid by the class during periods when reimbursements or reductions occur. Expenses net of fee waivers reflect expenses after reimbursement by the investment adviser but prior to reductions from expense offset arrangements. Expenses net of all reductions represent the net expenses paid by the class but do not include expenses of the investment companies in which the Fund invests.
H Total distributions of $.25 per share is comprised of distributions from net investment income of $.169 and distributions from net realized gain of $.085 per share.
I Total distributions of $.26 per share is comprised of distributions from net investment income of $.155 and distributions from net realized gain of $.106 per share.
See accompanying notes which are an integral part of the financial statements.
Semiannual Report
Financial Highlights - Class T
| Six months ended September 30, 2013 | Years ended March 31, |
| (Unaudited) | 2013 | 2012 | 2011 | 2010 | 2009 |
Selected Per-Share Data | | | | | | |
Net asset value, beginning of period | $ 12.74 | $ 11.93 | $ 12.11 | $ 10.78 | $ 7.52 | $ 12.28 |
Income from Investment Operations | | | | | | |
Net investment income (loss) E | .03 | .15 | .15 | .13 | .15 | .21 |
Net realized and unrealized gain (loss) | .51 | .88 | (.01) | 1.43 | 3.34 | (4.37) |
Total from investment operations | .54 | 1.03 | .14 | 1.56 | 3.49 | (4.16) |
Distributions from net investment income | (.01) | (.15) | (.14) | (.13) | (.15) | (.20) |
Distributions from net realized gain | (.37) | (.07) | (.18) | (.11) | (.09) | (.40) |
Total distributions | (.38) | (.22) | (.32) | (.23) I | (.23) H | (.60) |
Net asset value, end of period | $ 12.90 | $ 12.74 | $ 11.93 | $ 12.11 | $ 10.78 | $ 7.52 |
Total Return B, C, D | 4.34% | 8.74% | 1.33% | 14.67% | 46.60% | (35.20)% |
Ratios to Average Net Assets F, G | | | | | | |
Expenses before reductions | .50% A | .50% | .50% | .50% | .50% | .50% |
Expenses net of fee waivers, if any | .50% A | .50% | .50% | .50% | .50% | .50% |
Expenses net of all reductions | .50% A | .50% | .50% | .50% | .50% | .50% |
Net investment income (loss) | .42% A | 1.29% | 1.31% | 1.17% | 1.57% | 2.16% |
Supplemental Data | | | | | | |
Net assets, end of period (000 omitted) | $ 360,451 | $ 324,352 | $ 257,594 | $ 258,166 | $ 230,003 | $ 139,330 |
Portfolio turnover rate F | 19% A | 22% | 14% | 34% | 19% | 29% |
A Annualized
B Total returns for periods of less than one year are not annualized.
C Total returns would have been lower if certain expenses had not been reduced during the applicable periods shown.
D Total returns do not include the effect of the sales charges.
E Calculated based on average shares outstanding during the period.
F Amounts do not include the activity of the Underlying Funds.
G Expense ratios reflect operating expenses of the class. Expenses before reductions do not reflect amounts reimbursed by the investment adviser or reductions from expense offset arrangements and do not represent the amount paid by the class during periods when reimbursements or reductions occur. Expenses net of fee waivers reflect expenses after reimbursement by the investment adviser but prior to reductions from expense offset arrangements. Expenses net of all reductions represent the net expenses paid by the class but do not include expenses of the investment companies in which the Fund invests.
H Total distributions of $.23 per share is comprised of distributions from net investment income of $.146 and distributions from net realized gain of $.085 per share.
I Total distributions of $.23 per share is comprised of distributions from net investment income of $.128 and distributions from net realized gain of $.106 per share.
Financial Highlights - Class B
| Six months ended September 30, 2013 | Years ended March 31, |
| (Unaudited) | 2013 | 2012 | 2011 | 2010 | 2009 |
Selected Per-Share Data | | | | | | |
Net asset value, beginning of period | $ 12.66 | $ 11.84 | $ 12.01 | $ 10.70 | $ 7.47 | $ 12.17 |
Income from Investment Operations | | | | | | |
Net investment income (loss) E | - | .09 | .09 | .07 | .10 | .16 |
Net realized and unrealized gain (loss) | .51 | .88 | (.01) | 1.42 | 3.32 | (4.32) |
Total from investment operations | .51 | .97 | .08 | 1.49 | 3.42 | (4.16) |
Distributions from net investment income | - | (.08) | (.08) | (.07) | (.10) | (.14) |
Distributions from net realized gain | (.37) | (.07) | (.17) | (.11) | (.09) | (.40) |
Total distributions | (.37) | (.15) | (.25) | (.18) | (.19) H | (.54) |
Net asset value, end of period | $ 12.80 | $ 12.66 | $ 11.84 | $ 12.01 | $ 10.70 | $ 7.47 |
Total Return B, C, D | 4.08% | 8.26% | .82% | 14.02% | 45.83% | (35.45)% |
Ratios to Average Net Assets F, G | | | | | | |
Expenses before reductions | 1.00% A | 1.00% | 1.00% | 1.00% | 1.00% | 1.00% |
Expenses net of fee waivers, if any | 1.00% A | 1.00% | 1.00% | 1.00% | 1.00% | 1.00% |
Expenses net of all reductions | 1.00% A | 1.00% | 1.00% | 1.00% | 1.00% | 1.00% |
Net investment income (loss) | (.08)% A | .79% | .81% | .67% | 1.07% | 1.66% |
Supplemental Data | | | | | | |
Net assets, end of period (000 omitted) | $ 19,823 | $ 23,061 | $ 29,202 | $ 38,946 | $ 38,816 | $ 27,207 |
Portfolio turnover rate F | 19% A | 22% | 14% | 34% | 19% | 29% |
A Annualized
B Total returns for periods of less than one year are not annualized.
C Total returns would have been lower if certain expenses had not been reduced during the applicable periods shown.
D Total returns do not include the effect of the contingent deferred sales charge.
E Calculated based on average shares outstanding during the period.
F Amounts do not include the activity of the Underlying Funds.
G Expense ratios reflect operating expenses of the class. Expenses before reductions do not reflect amounts reimbursed by the investment adviser or reductions from expense offset arrangements and do not represent the amount paid by the class during periods when reimbursements or reductions occur. Expenses net of fee waivers reflect expenses after reimbursement by the investment adviser but prior to reductions from expense offset arrangements. Expenses net of all reductions represent the net expenses paid by the class but do not include expenses of the investment companies in which the Fund invests.
H Total distributions of $.19 per share is comprised of distributions from net investment income of $.100 and distributions from net realized gain of $.085 per share.
See accompanying notes which are an integral part of the financial statements.
Semiannual Report
Financial Highlights - Class C
| Six months ended September 30, 2013 | Years ended March 31, |
| (Unaudited) | 2013 | 2012 | 2011 | 2010 | 2009 |
Selected Per-Share Data | | | | | | |
Net asset value, beginning of period | $ 12.60 | $ 11.80 | $ 11.98 | $ 10.68 | $ 7.46 | $ 12.16 |
Income from Investment Operations | | | | | | |
Net investment income (loss) E | - | .09 | .09 | .07 | .10 | .16 |
Net realized and unrealized gain (loss) | .50 | .87 | (.01) | 1.41 | 3.31 | (4.32) |
Total from investment operations | .50 | .96 | .08 | 1.48 | 3.41 | (4.16) |
Distributions from net investment income | - | (.10) | (.09) | (.08) | (.11) | (.14) |
Distributions from net realized gain | (.37) | (.07) | (.17) | (.11) | (.09) | (.40) |
Total distributions | (.37) | (.16) J | (.26) | (.18) I | (.19) H | (.54) |
Net asset value, end of period | $ 12.73 | $ 12.60 | $ 11.80 | $ 11.98 | $ 10.68 | $ 7.46 |
Total Return B, C, D | 4.02% | 8.23% | .86% | 14.01% | 45.83% | (35.44)% |
Ratios to Average Net Assets F, G | | | | | | |
Expenses before reductions | 1.00% A | 1.00% | 1.00% | 1.00% | 1.00% | 1.00% |
Expenses net of fee waivers, if any | 1.00% A | 1.00% | 1.00% | 1.00% | 1.00% | 1.00% |
Expenses net of all reductions | 1.00% A | 1.00% | 1.00% | 1.00% | 1.00% | 1.00% |
Net investment income (loss) | (.08)% A | .79% | .81% | .67% | 1.07% | 1.66% |
Supplemental Data | | | | | | |
Net assets, end of period (000 omitted) | $ 81,403 | $ 74,415 | $ 66,126 | $ 61,640 | $ 52,756 | $ 31,735 |
Portfolio turnover rate F | 19% A | 22% | 14% | 34% | 19% | 29% |
A Annualized
B Total returns for periods of less than one year are not annualized.
C Total returns would have been lower if certain expenses had not been reduced during the applicable periods shown.
D Total returns do not include the effect of the contingent deferred sales charge.
E Calculated based on average shares outstanding during the period.
F Amounts do not include the activity of the Underlying Funds.
G Expense ratios reflect operating expenses of the class. Expenses before reductions do not reflect amounts reimbursed by the investment adviser or reductions from expense offset arrangements and do not represent the amount paid by the class during periods when reimbursements or reductions occur. Expenses net of fee waivers reflect expenses after reimbursement by the investment adviser but prior to reductions from expense offset arrangements. Expenses net of all reductions represent the net expenses paid by the class but do not include expenses of the investment companies in which the Fund invests.
H Total distributions of $.19 per share is comprised of distributions from net investment income of $.105 and distributions from net realized gain of $.085 per share.
I Total distributions of $.18 per share is comprised of distributions from net investment income of $.077 and distributions from net realized gain of $.106 per share.
J Total distributions of $.16 per share is comprised of distributions from net investment income of $.096 and distributions from net realized gain of $.066 per share.
Financial Highlights - Institutional Class
| Six months ended September 30, 2013 | Years ended March 31, |
| (Unaudited) | 2013 | 2012 | 2011 | 2010 | 2009 |
Selected Per-Share Data | | | | | | |
Net asset value, beginning of period | $ 12.81 | $ 11.99 | $ 12.17 | $ 10.83 | $ 7.55 | $ 12.33 |
Income from Investment Operations | | | | | | |
Net investment income (loss) D | .06 | .22 | .21 | .19 | .20 | .26 |
Net realized and unrealized gain (loss) | .52 | .88 | (.02) | 1.44 | 3.35 | (4.39) |
Total from investment operations | .58 | 1.10 | .19 | 1.63 | 3.55 | (4.13) |
Distributions from net investment income | (.03) | (.21) | (.20) | (.18) | (.19) | (.25) |
Distributions from net realized gain | (.37) | (.07) | (.18) | (.11) | (.09) | (.40) |
Total distributions | (.40) | (.28) | (.37) G | (.29) | (.27) H | (.65) |
Net asset value, end of period | $ 12.99 | $ 12.81 | $ 11.99 | $ 12.17 | $ 10.83 | $ 7.55 |
Total Return B, C | 4.60% | 9.29% | 1.84% | 15.23% | 47.31% | (34.83)% |
Ratios to Average Net Assets E, F | | | | | | |
Expenses before reductions I | .00% A | .00% | .00% | .00% | .00% | .00% |
Expenses net of fee waivers, if any | .00% A | .00% | .00% | .00% | .00% | .00% |
Expenses net of all reductions | .00% A | .00% | .00% | .00% | .00% | .00% |
Net investment income (loss) | .92% A | 1.79% | 1.81% | 1.67% | 2.07% | 2.66% |
Supplemental Data | | | | | | |
Net assets, end of period (000 omitted) | $ 774,121 | $ 686,540 | $ 470,704 | $ 284,309 | $ 140,948 | $ 69,731 |
Portfolio turnover rate E | 19% A | 22% | 14% | 34% | 19% | 29% |
A Annualized
B Total returns for periods of less than one year are not annualized.
C Total returns would have been lower if certain expenses had not been reduced during the applicable periods shown.
D Calculated based on average shares outstanding during the period.
E Amounts do not include the activity of the Underlying Funds.
F Expense ratios reflect operating expenses of the class. Expenses before reductions do not reflect amounts reimbursed by the investment adviser or reductions from expense offset arrangements and do not represent the amount paid by the class during periods when reimbursements or reductions occur. Expenses net of fee waivers reflect expenses after reimbursement by the investment adviser but prior to reductions from expense offset arrangements. Expenses net of all reductions represent the net expenses paid by the class but do not include expenses of the investment companies in which the Fund invests.
G Total distributions of $.37 per share is comprised of distributions from net investment income of $.195 and distributions from net realized gain of $.179 per share.
H Total distributions of $.27 per share is comprised of distributions from net investment income of $.189 and distributions from net realized gain of $.085 per share.
I Amount represents less than .01%.
See accompanying notes which are an integral part of the financial statements.
Semiannual Report
Fidelity Advisor Freedom 2030 Fund
Investment Changes (Unaudited)
The information in the following tables is based on the direct investments of the Fund. |
Fund Holdings as of September 30, 2013 |
| % of fund's
net assets | % of fund's net assets
6 months ago |
Commodity Funds | | |
Fidelity Series Commodity Strategy Fund | 7.5 | 7.6 |
Domestic Equity Funds | | |
Fidelity Advisor Equity Growth Fund Institutional Class | 6.3 | 6.1 |
Fidelity Advisor Growth & Income Fund Institutional Class | 0.0 | 3.2 |
Fidelity Advisor Large Cap Fund Institutional Class | 3.1 | 3.3 |
Fidelity Advisor Series Equity-Income Fund | 4.3 | 4.3 |
Fidelity Advisor Series Growth & Income Fund (formerly Fidelity Advisor Series Mega Cap Fund) | 4.1 | 0.9 |
Fidelity Advisor Series Opportunistic Insights Fund | 3.2 | 3.0 |
Fidelity Advisor Series Stock Selector Large Cap Value Fund | 4.2 | 4.3 |
Fidelity Advisor Small Cap Fund Institutional Class | 2.5 | 2.5 |
Fidelity Series 100 Index Fund | 1.0 | 1.0 |
Fidelity Series All-Sector Equity Fund | 7.8 | 8.1 |
Fidelity Series Large Cap Value Fund | 4.2 | 4.5 |
Fidelity Series Real Estate Equity Fund | 0.6 | 0.7 |
Fidelity Series Small Cap Opportunities Fund | 2.8 | 2.9 |
| 44.1 | 44.8 |
Developed International Equity Funds | | |
Fidelity Series International Growth Fund | 6.8 | 6.7 |
Fidelity Series International Small Cap Fund | 1.5 | 1.4 |
Fidelity Series International Value Fund | 6.9 | 6.6 |
| 15.2 | 14.7 |
Emerging Markets Equity Funds | | |
Fidelity Series Emerging Markets Fund | 4.1 | 4.0 |
High Yield Bond Funds | | |
Fidelity Series Emerging Markets Debt Fund | 0.7 | 0.7 |
Fidelity Series Floating Rate High Income Fund | 0.8 | 0.8 |
Fidelity Series High Income Fund | 6.9 | 7.0 |
Fidelity Series Real Estate Income Fund | 0.5 | 0.5 |
| 8.9 | 9.0 |
Inflation-Protected Bond Funds | | |
Fidelity Series Inflation-Protected Bond Index Fund | 2.8 | 2.5 |
Investment Grade Bond Funds | | |
Fidelity Series Investment Grade Bond Fund | 17.4 | 17.4 |
Net Other Assets (Liabilities)* | 0.0 | 0.0 |
| 100.0 | 100.0 |
* Amount represents less than 0.1% |
Asset Allocation (% of fund's net assets) |
Period end |
| Commodity Funds | 7.5% | |
| Domestic Equity Funds | 44.1% | |
| Developed International Equity Funds | 15.2% | |
| Emerging Markets Equity Funds | 4.1% | |
| High Yield Bond Funds | 8.9% | |
 | Inflation-Protected Bond Funds | 2.8% | |
| Investment Grade Bond Funds | 17.4% | |

Six months ago |
| Commodity Funds | 7.6% | |
| Domestic Equity Funds | 44.8% | |
| Developed International Equity Funds | 14.7% | |
| Emerging Markets Equity Funds | 4.0% | |
| High Yield Bond Funds | 9.0% | |
| Inflation-Protected Bond Funds | 2.5% | |
| Investment Grade Bond Funds | 17.4% | |

Semiannual Report
Fidelity Advisor Freedom 2030 Fund
Investments September 30, 2013 (Unaudited)
Showing Percentage of Net Assets
Domestic Equity Funds - 51.6% |
| Shares | | Value |
Commodity Funds - 7.5% |
Fidelity Series Commodity Strategy Fund (a)(b) | 28,975,224 | | $ 232,091,547 |
Domestic Equity Funds - 44.1% |
Fidelity Advisor Equity Growth Fund Institutional Class (b) | 2,377,009 | | 195,580,280 |
Fidelity Advisor Large Cap Fund Institutional Class (b) | 3,595,198 | | 96,710,834 |
Fidelity Advisor Series Equity-Income Fund (b) | 11,183,659 | | 131,855,340 |
Fidelity Advisor Series Growth & Income Fund (b) | 10,600,377 | | 127,734,539 |
Fidelity Advisor Series Opportunistic Insights Fund (b) | 7,776,341 | | 100,159,270 |
Fidelity Advisor Series Stock Selector Large Cap Value Fund (b) | 10,789,087 | | 131,303,185 |
Fidelity Advisor Small Cap Fund Institutional Class (b) | 2,500,821 | | 76,225,036 |
Fidelity Series 100 Index Fund (b) | 2,731,861 | | 30,269,015 |
Fidelity Series All-Sector Equity Fund (b) | 17,104,519 | | 242,199,989 |
Fidelity Series Large Cap Value Fund (b) | 10,235,257 | | 129,271,292 |
Fidelity Series Real Estate Equity Fund (b) | 1,589,936 | | 19,015,639 |
Fidelity Series Small Cap Opportunities Fund (b) | 6,808,852 | | 87,357,575 |
TOTAL DOMESTIC EQUITY FUNDS | | 1,367,681,994 |
TOTAL DOMESTIC EQUITY FUNDS (Cost $1,371,195,378) |
1,599,773,541
|
International Equity Funds - 19.3% |
| | | |
Developed International Equity Funds - 15.2% |
Fidelity Series International Growth Fund (b) | 15,584,587 | | 211,482,850 |
Fidelity Series International Small Cap Fund (b) | 2,923,398 | | 44,698,758 |
Fidelity Series International Value Fund (b) | 19,891,244 | | 213,830,870 |
TOTAL DEVELOPED INTERNATIONAL EQUITY FUNDS | | 470,012,478 |
|
| Shares | | Value |
Emerging Markets Equity Funds - 4.1% |
Fidelity Series Emerging Markets Fund (b) | 7,661,864 | | $ 128,259,602 |
TOTAL INTERNATIONAL EQUITY FUNDS (Cost $499,161,649) |
598,272,080
|
Bond Funds - 29.1% |
| | | |
High Yield Bond Funds - 8.9% |
Fidelity Series Emerging Markets Debt Fund (b) | 2,072,515 | | 20,973,849 |
Fidelity Series Floating Rate High Income Fund (b) | 2,437,457 | | 25,788,290 |
Fidelity Series High Income Fund (b) | 20,958,298 | | 215,451,298 |
Fidelity Series Real Estate Income Fund (b) | 1,295,521 | | 14,224,825 |
TOTAL HIGH YIELD BOND FUNDS | | 276,438,262 |
Inflation-Protected Bond Funds - 2.8% |
Fidelity Series Inflation-Protected Bond Index Fund (b) | 7,979,880 | | 86,581,695 |
Investment Grade Bond Funds - 17.4% |
Fidelity Series Investment Grade Bond Fund (b) | 48,113,276 | | 538,387,562 |
TOTAL BOND FUNDS (Cost $910,867,118) |
901,407,519
|
TOTAL INVESTMENT PORTFOLIO - 100.0% (Cost $2,781,224,145) | | 3,099,453,140 |
NET OTHER ASSETS (LIABILITIES) - 0.0% | | (630,402) |
NET ASSETS - 100% | $ 3,098,822,738 |
Legend |
(a) Non-income producing |
(b) Affiliated company |
Affiliated Underlying Funds |
Information regarding the Fund's fiscal year to date purchases and sales of the affiliated Underlying Funds and income earned by the Fund from investments in affiliated Underlying Funds is as follows: |
Affiliate | Value,
beginning of
period | Purchases | Sales
Proceeds | Dividend
Income | Value,
end of
period |
Fidelity Advisor Equity Growth Fund Institutional Class | $ 179,689,389 | $ 5,009,988 | $ 17,007,461 | $ - | $ 195,580,280 |
Fidelity Advisor Growth & Income Fund Institutional Class | 95,214,795 | 1,721,067 | 105,161,542 | - | - |
Fidelity Advisor Large Cap Fund Institutional Class | 96,135,812 | 1,932,033 | 13,534,730 | - | 96,710,834 |
Fidelity Advisor Series Equity-Income Fund | 126,635,001 | 7,144,827 | 9,381,815 | 1,267,414 | 131,855,340 |
Fidelity Advisor Series Growth & Income Fund (formerly Fidelity Advisor Series Mega Cap Fund) | 28,043,155 | 99,122,498 | 3,282,781 | - | 127,734,539 |
Fidelity Advisor Series Opportunistic Insights Fund | 89,481,574 | 2,851,791 | 6,995,824 | - | 100,159,270 |
Fidelity Advisor Series Stock Selector Large Cap Value Fund | 127,546,729 | 3,620,602 | 10,814,047 | - | 131,303,185 |
Fidelity Advisor Small Cap Fund Institutional Class | 73,801,869 | 1,952,069 | 8,731,112 | - | 76,225,036 |
Fidelity Series 100 Index Fund | 29,526,733 | 818,069 | 2,213,369 | - | 30,269,015 |
Fidelity Series All-Sector Equity Fund | 237,970,708 | 4,917,889 | 24,148,249 | - | 242,199,989 |
Fidelity Series Commodity Strategy Fund | 223,024,825 | 37,591,168 | 10,541,772 | - | 232,091,547 |
Fidelity Series Emerging Markets Debt Fund | 21,567,139 | 1,902,033 | 962,395 | 556,496 | 20,973,849 |
Fidelity Series Emerging Markets Fund | 119,091,201 | 12,669,407 | 4,034,040 | - | 128,259,602 |
Fidelity Series Floating Rate High Income Fund | 24,857,076 | 2,142,112 | 1,092,251 | 551,251 | 25,788,290 |
Fidelity Series High Income Fund | 206,384,861 | 20,566,917 | 6,903,497 | 5,521,358 | 215,451,298 |
Fidelity Series Inflation-Protected Bond Index Fund | 75,072,305 | 18,319,668 | 2,935,847 | - | 86,581,695 |
Fidelity Series International Growth Fund | 197,193,583 | 7,963,982 | 8,074,461 | - | 211,482,850 |
Fidelity Series International Small Cap Fund | 40,156,611 | 1,547,602 | 1,614,199 | | 44,698,758 |
Fidelity Series International Value Fund | 195,575,080 | 7,748,390 | 8,074,461 | - | 213,830,870 |
Fidelity Series Investment Grade Bond Fund | 513,272,085 | 62,232,003 | 21,427,599 | 5,476,245 | 538,387,562 |
Fidelity Series Large Cap Value Fund | 134,229,504 | 2,666,426 | 18,714,617 | - | 129,271,292 |
Fidelity Series Real Estate Equity Fund | 19,848,733 | 1,738,061 | 987,812 | 127,968 | 19,015,639 |
Fidelity Series Real Estate Income Fund | 14,357,770 | 1,331,535 | 608,514 | 419,976 | 14,224,825 |
Fidelity Series Small Cap Opportunities Fund | 85,867,813 | 8,603,697 | 10,887,961 | - | 87,357,575 |
Total | $ 2,954,544,351 | $ 316,113,834 | $ 298,130,356 | $ 13,920,708 | $ 3,099,453,140 |
Other Information |
All investments are categorized as level 1 under the Fair Value Hierarchy. The inputs or methodology used for valuing securities may not be an indication of the risk associated with investing in those securities. For more information on valuation inputs, please refer to the Investment Valuation section in the accompanying Notes to Financial Statements. |
See accompanying notes which are an integral part of the financial statements.
Semiannual Report
Fidelity Advisor Freedom 2030 Fund
Statement of Assets and Liabilities
| September 30, 2013 (Unaudited) |
| | |
Assets | | |
Investment in securities, at value (cost $2,781,224,145) - See accompanying schedule | | $ 3,099,453,140 |
Cash | | 5 |
Receivable for investments sold | | 6,752,214 |
Receivable for fund shares sold | | 2,458,053 |
Receivable from investment adviser for expense reductions | | 579 |
Total assets | | 3,108,663,991 |
| | |
Liabilities | | |
Payable for investments purchased | $ 84,252 | |
Payable for fund shares redeemed | 9,126,076 | |
Distribution and service plan fees payable | 630,925 | |
Total liabilities | | 9,841,253 |
| | |
Net Assets | | $ 3,098,822,738 |
Net Assets consist of: | | |
Paid in capital | | $ 2,738,206,303 |
Undistributed net investment income | | 10,239,960 |
Accumulated undistributed net realized gain (loss) on investments | | 32,147,480 |
Net unrealized appreciation (depreciation) on investments | | 318,228,995 |
Net Assets | | $ 3,098,822,738 |
| | |
Calculation of Maximum Offering Price Class A:
Net Asset Value and redemption price per share ($1,777,075,691 ÷ 130,214,140 shares) | | $ 13.65 |
| | |
Maximum offering price per share (100/94.25 of $13.65) | | $ 14.48 |
Class T:
Net Asset Value and redemption price per share ($419,864,430 ÷ 30,877,104 shares) | | $ 13.60 |
| | |
Maximum offering price per share (100/96.50 of $13.60) | | $ 14.09 |
Class B:
Net Asset Value and offering price per share ($23,946,769 ÷ 1,767,301 shares)A | | $ 13.55 |
| | |
Class C:
Net Asset Value and offering price per share ($80,607,700 ÷ 5,976,351 shares)A | | $ 13.49 |
| | |
Institutional Class:
Net Asset Value, offering price and redemption price per share ($797,328,148 ÷ 58,101,566 shares) | | $ 13.72 |
A Redemption price per share is equal to net asset value less any applicable contingent deferred sales charge.
Statement of Operations
Six months ended September 30, 2013 (Unaudited) |
| | |
Investment Income | | |
Income distributions from underlying funds | | $ 13,920,708 |
| | |
Expenses | | |
Distribution and service plan fees | $ 3,739,074 | |
Independent trustees' compensation | 5,602 | |
Total expenses before reductions | 3,744,676 | |
Expense reductions | (5,602) | 3,739,074 |
Net investment income (loss) | | 10,181,634 |
Realized and Unrealized Gain (Loss) Realized gain (loss) on sale of underlying fund shares | 30,003,696 | |
Capital gain distributions from underlying funds | 7,456,678 | |
Total net realized gain (loss) | | 37,460,374 |
Change in net unrealized appreciation (depreciation) on underlying funds | | 96,921,607 |
Net gain (loss) | | 134,381,981 |
Net increase (decrease) in net assets resulting from operations | | $ 144,563,615 |
See accompanying notes which are an integral part of the financial statements.
Semiannual Report
Fidelity Advisor Freedom 2030 Fund
Financial Statements - continued
Statement of Changes in Net Assets
| Six months ended
September 30, 2013
(Unaudited) | Year ended
March 31,
2013 |
Increase (Decrease) in Net Assets | | |
Operations | | |
Net investment income (loss) | $ 10,181,634 | $ 41,214,791 |
Net realized gain (loss) | 37,460,374 | 166,007,236 |
Change in net unrealized appreciation (depreciation) | 96,921,607 | 37,190,757 |
Net increase (decrease) in net assets resulting from operations | 144,563,615 | 244,412,784 |
Distributions to shareholders from net investment income | (4,039,445) | (40,765,226) |
Distributions to shareholders from net realized gain | (74,728,489) | (13,074,704) |
Total distributions | (78,767,934) | (53,839,930) |
Share transactions - net increase (decrease) | 79,086,543 | 314,631,239 |
Total increase (decrease) in net assets | 144,882,224 | 505,204,093 |
| | |
Net Assets | | |
Beginning of period | 2,953,940,514 | 2,448,736,421 |
End of period (including undistributed net investment income of $10,239,960 and undistributed net investment income of $4,097,771, respectively) | $ 3,098,822,738 | $ 2,953,940,514 |
Financial Highlights - Class A
| Six months ended September 30, 2013 | Years ended March 31, |
| (Unaudited) | 2013 | 2012 | 2011 | 2010 | 2009 |
Selected Per-Share Data | | | | | | |
Net asset value, beginning of period | $ 13.36 | $ 12.48 | $ 12.72 | $ 11.29 | $ 7.69 | $ 13.29 |
Income from Investment Operations | | | | | | |
Net investment income (loss) E | .04 | .20 | .19 | .16 | .16 | .21 |
Net realized and unrealized gain (loss) | .61 | .94 | (.06) | 1.54 | 3.68 | (5.10) |
Total from investment operations | .65 | 1.14 | .13 | 1.70 | 3.84 | (4.89) |
Distributions from net investment income | (.02) | (.20) | (.18) | (.16) | (.15) | (.21) |
Distributions from net realized gain | (.34) | (.06) | (.19) | (.11) | (.09) | (.50) |
Total distributions | (.36) | (.26) | (.37) | (.27) | (.24) H | (.71) |
Net asset value, end of period | $ 13.65 | $ 13.36 | $ 12.48 | $ 12.72 | $ 11.29 | $ 7.69 |
Total Return B, C, D | 4.91% | 9.25% | 1.25% | 15.27% | 50.17% | (38.49)% |
Ratios to Average Net Assets F, G | | | | | | |
Expenses before reductions | .25% A | .25% | .25% | .25% | .25% | .25% |
Expenses net of fee waivers, if any | .25% A | .25% | .25% | .25% | .25% | .25% |
Expenses net of all reductions | .25% A | .25% | .25% | .25% | .25% | .25% |
Net investment income (loss) | .67% A | 1.58% | 1.57% | 1.38% | 1.61% | 2.08% |
Supplemental Data | | | | | | |
Net assets, end of period (000 omitted) | $ 1,777,076 | $ 1,747,549 | $ 1,506,827 | $ 1,340,583 | $ 1,030,972 | $ 527,042 |
Portfolio turnover rate F | 20% A | 23% | 16% | 38% | 20% | 22% |
A Annualized
B Total returns for periods of less than one year are not annualized.
C Total returns would have been lower if certain expenses had not been reduced during the applicable periods shown.
D Total returns do not include the effect of the sales charges.
E Calculated based on average shares outstanding during the period.
F Amounts do not include the activity of the Underlying Funds.
G Expense ratios reflect operating expenses of the class. Expenses before reductions do not reflect amounts reimbursed by the investment adviser or reductions from expense offset arrangements and do not represent the amount paid by the class during periods when reimbursements or reductions occur. Expenses net of fee waivers reflect expenses after reimbursement by the investment adviser but prior to reductions from expense offset arrangements. Expenses net of all reductions represent the net expenses paid by the class but do not include expenses of the investment companies in which the Fund invests.
H Total distributions of $.24 per share is comprised of distributions from net investment income of $.151 and distributions from net realized gain of $.093 per share.
See accompanying notes which are an integral part of the financial statements.
Semiannual Report
Financial Highlights - Class T
| Six months ended September 30, 2013 | Years ended March 31, |
| (Unaudited) | 2013 | 2012 | 2011 | 2010 | 2009 |
Selected Per-Share Data | | | | | | |
Net asset value, beginning of period | $ 13.32 | $ 12.44 | $ 12.68 | $ 11.25 | $ 7.67 | $ 13.25 |
Income from Investment Operations | | | | | | |
Net investment income (loss) E | .03 | .17 | .16 | .13 | .14 | .19 |
Net realized and unrealized gain (loss) | .60 | .94 | (.06) | 1.54 | 3.66 | (5.09) |
Total from investment operations | .63 | 1.11 | .10 | 1.67 | 3.80 | (4.90) |
Distributions from net investment income | (.01) | (.17) | (.15) | (.13) | (.13) | (.18) |
Distributions from net realized gain | (.34) | (.06) | (.19) | (.11) | (.09) | (.50) |
Total distributions | (.35) | (.23) | (.34) | (.24) | (.22) H | (.68) |
Net asset value, end of period | $ 13.60 | $ 13.32 | $ 12.44 | $ 12.68 | $ 11.25 | $ 7.67 |
Total Return B, C, D | 4.79% | 9.02% | .98% | 14.98% | 49.72% | (38.62)% |
Ratios to Average Net Assets F, G | | | | | | |
Expenses before reductions | .50% A | .50% | .50% | .50% | .50% | .50% |
Expenses net of fee waivers, if any | .50% A | .50% | .50% | .50% | .50% | .50% |
Expenses net of all reductions | .50% A | .50% | .50% | .50% | .50% | .50% |
Net investment income (loss) | .42% A | 1.33% | 1.32% | 1.12% | 1.36% | 1.83% |
Supplemental Data | | | | | | |
Net assets, end of period (000 omitted) | $ 419,864 | $ 387,102 | $ 335,407 | $ 348,443 | $ 382,092 | $ 236,333 |
Portfolio turnover rate F | 20% A | 23% | 16% | 38% | 20% | 22% |
A Annualized
B Total returns for periods of less than one year are not annualized.
C Total returns would have been lower if certain expenses had not been reduced during the applicable periods shown.
D Total returns do not include the effect of the sales charges.
E Calculated based on average shares outstanding during the period.
F Amounts do not include the activity of the Underlying Funds.
G Expense ratios reflect operating expenses of the class. Expenses before reductions do not reflect amounts reimbursed by the investment adviser or reductions from expense offset arrangements and do not represent the amount paid by the class during periods when reimbursements or reductions occur. Expenses net of fee waivers reflect expenses after reimbursement by the investment adviser but prior to reductions from expense offset arrangements. Expenses net of all reductions represent the net expenses paid by the class but do not include expenses of the investment companies in which the Fund invests.
H Total distributions of $.22 per share is comprised of distributions from net investment income of $.128 and distributions from net realized gain of $.093 per share.
Financial Highlights - Class B
| Six months ended September 30, 2013 | Years ended March 31, |
| (Unaudited) | 2013 | 2012 | 2011 | 2010 | 2009 |
Selected Per-Share Data | | | | | | |
Net asset value, beginning of period | $ 13.29 | $ 12.41 | $ 12.63 | $ 11.21 | $ 7.64 | $ 13.17 |
Income from Investment Operations | | | | | | |
Net investment income (loss) E | (.01) | .10 | .10 | .07 | .09 | .14 |
Net realized and unrealized gain (loss) | .60 | .94 | (.06) | 1.53 | 3.65 | (5.06) |
Total from investment operations | .59 | 1.04 | .04 | 1.60 | 3.74 | (4.92) |
Distributions from net investment income | - | (.10) | (.08) | (.07) | (.08) | (.11) |
Distributions from net realized gain | (.33) | (.06) | (.18) | (.11) | (.09) | (.50) |
Total distributions | (.33) | (.16) | (.26) | (.18) | (.17) H | (.61) |
Net asset value, end of period | $ 13.55 | $ 13.29 | $ 12.41 | $ 12.63 | $ 11.21 | $ 7.64 |
Total Return B, C, D | 4.51% | 8.44% | .52% | 14.38% | 49.07% | (38.94)% |
Ratios to Average Net Assets F, G | | | | | | |
Expenses before reductions | 1.00% A | 1.00% | 1.00% | 1.00% | 1.00% | 1.00% |
Expenses net of fee waivers, if any | 1.00% A | 1.00% | 1.00% | 1.00% | 1.00% | 1.00% |
Expenses net of all reductions | 1.00% A | 1.00% | 1.00% | 1.00% | 1.00% | 1.00% |
Net investment income (loss) | (.08)% A | .83% | .82% | .62% | .86% | 1.33% |
Supplemental Data | | | | | | |
Net assets, end of period (000 omitted) | $ 23,947 | $ 27,191 | $ 34,324 | $ 47,275 | $ 51,360 | $ 35,701 |
Portfolio turnover rate F | 20% A | 23% | 16% | 38% | 20% | 22% |
A Annualized
B Total returns for periods of less than one year are not annualized.
C Total returns would have been lower if certain expenses had not been reduced during the applicable periods shown.
D Total returns do not include the effect of the contingent deferred sales charge.
E Calculated based on average shares outstanding during the period.
F Amounts do not include the activity of the Underlying Funds.
G Expense ratios reflect operating expenses of the class. Expenses before reductions do not reflect amounts reimbursed by the investment adviser or reductions from expense offset arrangements and do not represent the amount paid by the class during periods when reimbursements or reductions occur. Expenses net of fee waivers reflect expenses after reimbursement by the investment adviser but prior to reductions from expense offset arrangements. Expenses net of all reductions represent the net expenses paid by the class but do not include expenses of the investment companies in which the Fund invests.
H Total distributions of $.17 per share is comprised of distributions from net investment income of $.080 and distributions from net realized gain of $.092 per share.
See accompanying notes which are an integral part of the financial statements.
Semiannual Report
Financial Highlights - Class C
| Six months ended September 30, 2013 | Years ended March 31, |
| (Unaudited) | 2013 | 2012 | 2011 | 2010 | 2009 |
Selected Per-Share Data | | | | | | |
Net asset value, beginning of period | $ 13.23 | $ 12.37 | $ 12.60 | $ 11.19 | $ 7.63 | $ 13.17 |
Income from Investment Operations | | | | | | |
Net investment income (loss) E | (.01) | .10 | .10 | .07 | .09 | .14 |
Net realized and unrealized gain (loss) | .60 | .93 | (.05) | 1.53 | 3.65 | (5.06) |
Total from investment operations | .59 | 1.03 | .05 | 1.60 | 3.74 | (4.92) |
Distributions from net investment income | - | (.11) | (.09) | (.08) | (.08) | (.12) |
Distributions from net realized gain | (.33) | (.06) | (.18) | (.11) | (.09) | (.50) |
Total distributions | (.33) | (.17) | (.28) I | (.19) | (.18) H | (.62) |
Net asset value, end of period | $ 13.49 | $ 13.23 | $ 12.37 | $ 12.60 | $ 11.19 | $ 7.63 |
Total Return B, C, D | 4.53% | 8.39% | .55% | 14.38% | 49.06% | (38.96)% |
Ratios to Average Net Assets F, G | | | | | | |
Expenses before reductions | 1.00% A | 1.00% | 1.00% | 1.00% | 1.00% | 1.00% |
Expenses net of fee waivers, if any | 1.00% A | 1.00% | 1.00% | 1.00% | 1.00% | 1.00% |
Expenses net of all reductions | 1.00% A | 1.00% | 1.00% | 1.00% | 1.00% | 1.00% |
Net investment income (loss) | (.08)% A | .83% | .82% | .63% | .86% | 1.33% |
Supplemental Data | | | | | | |
Net assets, end of period (000 omitted) | $ 80,608 | $ 75,384 | $ 66,418 | $ 68,349 | $ 63,700 | $ 40,294 |
Portfolio turnover rate F | 20% A | 23% | 16% | 38% | 20% | 22% |
A Annualized
B Total returns for periods of less than one year are not annualized.
C Total returns would have been lower if certain expenses had not been reduced during the applicable periods shown.
D Total returns do not include the effect of the contingent deferred sales charge.
E Calculated based on average shares outstanding during the period.
F Amounts do not include the activity of the Underlying Funds.
G Expense ratios reflect operating expenses of the class. Expenses before reductions do not reflect amounts reimbursed by the investment adviser or reductions from expense offset arrangements and do not represent the amount paid by the class during periods when reimbursements or reductions occur. Expenses net of fee waivers reflect expenses after reimbursement by the investment adviser but prior to reductions from expense offset arrangements. Expenses net of all reductions represent the net expenses paid by the class but do not include expenses of the investment companies in which the Fund invests.
H Total distributions of $.18 per share is comprised of distributions from net investment income of $.083 and distributions from net realized gain of $.093 per share.
I Total distributions of $.28 per share is comprised of distributions from net investment income of $.094 and distributions from net realized gain of $.182 per share.
Financial Highlights - Institutional Class
| Six months ended September 30, 2013 | Years ended March 31, |
| (Unaudited) | 2013 | 2012 | 2011 | 2010 | 2009 |
Selected Per-Share Data | | | | | | |
Net asset value, beginning of period | $ 13.42 | $ 12.54 | $ 12.77 | $ 11.33 | $ 7.72 | $ 13.34 |
Income from Investment Operations | | | | | | |
Net investment income (loss) D | .06 | .23 | .22 | .19 | .19 | .23 |
Net realized and unrealized gain (loss) | .60 | .94 | (.05) | 1.55 | 3.69 | (5.11) |
Total from investment operations | .66 | 1.17 | .17 | 1.74 | 3.88 | (4.88) |
Distributions from net investment income | (.03) | (.23) | (.21) | (.19) | (.17) | (.24) |
Distributions from net realized gain | (.34) | (.06) | (.19) | (.11) | (.09) | (.50) |
Total distributions | (.36) H | (.29) | (.40) | (.30) | (.27) G | (.74) |
Net asset value, end of period | $ 13.72 | $ 13.42 | $ 12.54 | $ 12.77 | $ 11.33 | $ 7.72 |
Total Return B, C | 5.03% | 9.47% | 1.57% | 15.56% | 50.42% | (38.31)% |
Ratios to Average Net Assets E, F | | | | | | |
Expenses before reductions I | .00% A | .00% | .00% | .00% | .00% | .00% |
Expenses net of fee waivers, if any | .00% A | .00% | .00% | .00% | .00% | .00% |
Expenses net of all reductions | .00% A | .00% | .00% | .00% | .00% | .00% |
Net investment income (loss) | .92% A | 1.83% | 1.82% | 1.62% | 1.86% | 2.33% |
Supplemental Data | | | | | | |
Net assets, end of period (000 omitted) | $ 797,328 | $ 716,715 | $ 505,761 | $ 321,529 | $ 178,232 | $ 82,534 |
Portfolio turnover rate E | 20% A | 23% | 16% | 38% | 20% | 22% |
A Annualized
B Total returns for periods of less than one year are not annualized.
C Total returns would have been lower if certain expenses had not been reduced during the applicable periods shown.
D Calculated based on average shares outstanding during the period.
E Amounts do not include the activity of the Underlying Funds.
F Expense ratios reflect operating expenses of the class. Expenses before reductions do not reflect amounts reimbursed by the investment adviser or reductions from expense offset arrangements and do not represent the amount paid by the class during periods when reimbursements or reductions occur. Expenses net of fee waivers reflect expenses after reimbursement by the investment adviser but prior to reductions from expense offset arrangements. Expenses net of all reductions represent the net expenses paid by the class but do not include expenses of the investment companies in which the Fund invests.
G Total distributions of $.27 per share is comprised of distributions from net investment income of $.173 and distributions from net realized gain of $.093 per share.
H Total distributions of $.36 per share is comprised of distributions from net investment income of $.026 and distributions from net realized gain of $.338 per share.
I Amount represents less than 0.1%
See accompanying notes which are an integral part of the financial statements.
Semiannual Report
Fidelity Advisor Freedom 2035 Fund
Investment Changes (Unaudited)
The information in the following tables is based on the direct investments of the Fund. |
Fund Holdings as of September 30, 2013 |
| % of fund's
net assets | % of fund's net assets
6 months ago |
Commodity Funds | | |
Fidelity Series Commodity Strategy Fund | 8.7 | 8.7 |
Domestic Equity Funds | | |
Fidelity Advisor Equity Growth Fund Institutional Class | 7.2 | 7.0 |
Fidelity Advisor Growth & Income Fund Institutional Class | 0.0 | 3.7 |
Fidelity Advisor Large Cap Fund Institutional Class | 3.6 | 3.8 |
Fidelity Advisor Series Equity-Income Fund | 4.8 | 4.9 |
Fidelity Advisor Series Growth & Income Fund (formerly Fidelity Advisor Series Mega Cap Fund) | 4.7 | 1.1 |
Fidelity Advisor Series Opportunistic Insights Fund | 3.7 | 3.4 |
Fidelity Advisor Series Stock Selector Large Cap Value Fund | 4.8 | 4.9 |
Fidelity Advisor Small Cap Fund Institutional Class | 2.8 | 2.9 |
Fidelity Series 100 Index Fund | 1.1 | 1.1 |
Fidelity Series All-Sector Equity Fund | 9.0 | 9.3 |
Fidelity Series Large Cap Value Fund | 4.8 | 5.3 |
Fidelity Series Real Estate Equity Fund | 0.7 | 0.8 |
Fidelity Series Small Cap Opportunities Fund | 3.2 | 3.3 |
| 50.4 | 51.5 |
Developed International Equity Funds | | |
Fidelity Series International Growth Fund | 7.8 | 7.6 |
Fidelity Series International Small Cap Fund | 1.6 | 1.6 |
Fidelity Series International Value Fund | 7.9 | 7.6 |
| 17.3 | 16.8 |
Emerging Markets Equity Funds | | |
Fidelity Series Emerging Markets Fund | 4.8 | 4.6 |
High Yield Bond Funds | | |
Fidelity Series Emerging Markets Debt Fund | 0.7 | 0.7 |
Fidelity Series Floating Rate High Income Fund | 0.7 | 0.8 |
Fidelity Series High Income Fund | 6.9 | 6.9 |
Fidelity Series Real Estate Income Fund | 0.4 | 0.4 |
| 8.7 | 8.8 |
Inflation-Protected Bond Funds | | |
Fidelity Series Inflation-Protected Bond Index Fund | 0.0* | 0.0 |
Investment Grade Bond Funds | | |
Fidelity Series Investment Grade Bond Fund | 10.1 | 9.6 |
Net Other Assets (Liabilities)* | 0.0 | 0.0 |
| 100.0 | 100.0 |
* Amount represents less than 0.1% |
Asset Allocation (% of fund's net assets) |
Period end |
| Commodity Funds | 8.7% | |
| Domestic Equity Funds | 50.4% | |
| Developed International Equity Funds | 17.3% | |
| Emerging Markets Equity Funds | 4.8% | |
| High Yield Bond Funds | 8.7% | |
| Inflation-Protected Bond Funds | 0.0%* | |
| Investment Grade Bond Funds | 10.1% | |

Six months ago |
| Commodity Funds | 8.7% | |
| Domestic Equity Funds | 51.5% | |
| Developed International Equity Funds | 16.8% | |
| Emerging Markets Equity Funds | 4.6% | |
| High Yield Bond Funds | 8.8% | |
 | Inflation-Protected Bond Funds | 0.0% | |
| Investment Grade Bond Funds | 9.6% | |

Semiannual Report
Fidelity Advisor Freedom 2035 Fund
Investments September 30, 2013 (Unaudited)
Showing Percentage of Net Assets
Domestic Equity Funds - 59.1% |
| Shares | | Value |
Commodity Funds - 8.7% |
Fidelity Series Commodity Strategy Fund (a)(b) | 24,364,620 | | $ 195,160,603 |
Domestic Equity Funds - 50.4% |
Fidelity Advisor Equity Growth Fund Institutional Class (b) | 1,977,815 | | 162,734,612 |
Fidelity Advisor Large Cap Fund Institutional Class (b) | 2,993,625 | | 80,528,512 |
Fidelity Advisor Series Equity-Income Fund (b) | 9,247,828 | | 109,031,895 |
Fidelity Advisor Series Growth & Income Fund (b) | 8,805,844 | | 106,110,419 |
Fidelity Advisor Series Opportunistic Insights Fund (b) | 6,411,004 | | 82,573,737 |
Fidelity Advisor Series Stock Selector Large Cap Value Fund (b) | 8,926,900 | | 108,640,371 |
Fidelity Advisor Small Cap Fund Institutional Class (b) | 2,084,756 | | 63,543,348 |
Fidelity Series 100 Index Fund (b) | 2,272,564 | | 25,180,005 |
Fidelity Series All-Sector Equity Fund (b) | 14,217,915 | | 201,325,671 |
Fidelity Series Large Cap Value Fund (b) | 8,502,930 | | 107,392,012 |
Fidelity Series Real Estate Equity Fund (b) | 1,323,594 | | 15,830,190 |
Fidelity Series Small Cap Opportunities Fund (b) | 5,672,998 | | 72,784,571 |
TOTAL DOMESTIC EQUITY FUNDS | | 1,135,675,343 |
TOTAL DOMESTIC EQUITY FUNDS (Cost $1,148,073,707) |
1,330,835,946
|
International Equity Funds - 22.1% |
| | | |
Developed International Equity Funds - 17.3% |
Fidelity Series International Growth Fund (b) | 12,957,796 | | 175,837,294 |
Fidelity Series International Small Cap Fund (b) | 2,402,862 | | 36,739,758 |
Fidelity Series International Value Fund (b) | 16,413,200 | | 176,441,903 |
TOTAL DEVELOPED INTERNATIONAL EQUITY FUNDS | | 389,018,955 |
|
| Shares | | Value |
Emerging Markets Equity Funds - 4.8% |
Fidelity Series Emerging Markets Fund (b) | 6,487,138 | | $ 108,594,695 |
TOTAL INTERNATIONAL EQUITY FUNDS (Cost $417,889,557) |
497,613,650
|
Bond Funds - 18.8% |
| | | |
High Yield Bond Funds - 8.7% |
Fidelity Series Emerging Markets Debt Fund (b) | 1,478,301 | | 14,960,403 |
Fidelity Series Floating Rate High Income Fund (b) | 1,567,705 | | 16,586,320 |
Fidelity Series High Income Fund (b) | 14,978,604 | | 153,980,051 |
Fidelity Series Real Estate Income Fund (b) | 847,077 | | 9,300,903 |
TOTAL HIGH YIELD BOND FUNDS | | 194,827,677 |
Inflation-Protected Bond Funds - 0.0% |
Fidelity Series Inflation-Protected Bond Index Fund (b) | 29,597 | | 321,126 |
Investment Grade Bond Funds - 10.1% |
Fidelity Series Investment Grade Bond Fund (b) | 20,343,009 | | 227,638,270 |
TOTAL BOND FUNDS (Cost $423,739,238) |
422,787,073
|
TOTAL INVESTMENT PORTFOLIO - 100.0% (Cost $1,989,702,502) | 2,251,236,669 |
NET OTHER ASSETS (LIABILITIES) - 0.0% | | (431,084) |
NET ASSETS - 100% | $ 2,250,805,585 |
Legend |
(a) Non-income producing |
(b) Affiliated company |
Affiliated Underlying Funds |
Information regarding the Fund's fiscal year to date purchases and sales of the affiliated Underlying Funds and income earned by the Fund from investments in affiliated Underlying Funds is as follows: |
Affiliate | Value,
beginning of
period | Purchases | Sales
Proceeds | Dividend
Income | Value,
end of
period |
Fidelity Advisor Equity Growth Fund Institutional Class | $ 146,037,675 | $ 6,529,645 | $ 12,876,212 | $ - | $ 162,734,612 |
Fidelity Advisor Growth & Income Fund Institutional Class | 77,536,597 | 2,512,472 | 86,810,609 | - | - |
Fidelity Advisor Large Cap Fund Institutional Class | 78,302,498 | 2,837,567 | 10,635,927 | - | 80,528,512 |
Fidelity Advisor Series Equity-Income Fund | 101,253,648 | 7,725,782 | 6,000,213 | 1,026,098 | 109,031,895 |
Fidelity Advisor Series Growth & Income Fund (formerly Fidelity Advisor Series Mega Cap Fund) | 22,423,472 | 82,752,170 | 2,218,716 | - | 106,110,419 |
Fidelity Advisor Series Opportunistic Insights Fund | 71,567,575 | 3,441,052 | 4,528,383 | - | 82,573,737 |
Fidelity Advisor Series Stock Selector Large Cap Value Fund | 101,988,948 | 4,716,970 | 6,966,625 | - | 108,640,371 |
Fidelity Advisor Small Cap Fund Institutional Class | 60,006,024 | 2,593,626 | 6,656,117 | - | 63,543,348 |
Fidelity Series 100 Index Fund | 24,100,686 | 1,077,217 | 1,762,436 | - | 25,180,005 |
Fidelity Series All-Sector Equity Fund | 193,432,696 | 7,153,832 | 18,595,195 | - | 201,325,671 |
Fidelity Series Commodity Strategy Fund | 182,349,768 | 36,304,852 | 8,593,523 | - | 195,160,603 |
Fidelity Series Emerging Markets Debt Fund | 15,061,340 | 1,523,036 | 549,547 | 391,381 | 14,960,403 |
Fidelity Series Emerging Markets Fund | 96,441,362 | 14,529,819 | 2,823,512 | - | 108,594,695 |
Fidelity Series Floating Rate High Income Fund | 15,821,013 | 1,416,572 | 573,601 | 351,435 | 16,586,320 |
Fidelity Series High Income Fund | 143,718,637 | 18,072,209 | 4,571,769 | 3,895,338 | 153,980,051 |
Fidelity Series Inflation-Protected Bond Index Fund | - | 330,668 | 8,294 | - | 321,126 |
Fidelity Series International Growth Fund | 159,255,463 | 10,146,233 | 5,501,051 | - | 175,837,294 |
Fidelity Series International Small Cap Fund | 32,344,142 | 1,773,538 | 1,144,070 | - | 36,739,758 |
Fidelity Series International Value Fund | 157,641,894 | 8,958,193 | 5,368,853 | - | 176,441,903 |
Fidelity Series Investment Grade Bond Fund | 200,160,305 | 41,102,348 | 7,253,686 | 2,242,007 | 227,638,270 |
Fidelity Series Large Cap Value Fund | 109,701,861 | 3,916,432 | 15,367,260 | - | 107,392,012 |
Fidelity Series Real Estate Equity Fund | 16,098,520 | 1,717,804 | 674,829 | 105,839 | 15,830,190 |
Fidelity Series Real Estate Income Fund | 9,212,263 | 964,316 | 319,979 | 272,417 | 9,300,903 |
Fidelity Series Small Cap Opportunities Fund | 69,819,611 | 8,278,843 | 8,386,224 | - | 72,784,571 |
Total | $ 2,084,275,998 | $ 270,375,196 | $ 218,186,631 | $ 8,284,515 | $ 2,251,236,669 |
Other Information |
All investments are categorized as Level 1 under the Fair Value Hierarchy. The inputs or methodology used for valuing securities may not be an indication of the risk associated with investing in those securities. For more information on valuation inputs, please refer to the Investment Valuation section in the accompanying Notes to Financial Statements. |
See accompanying notes which are an integral part of the financial statements.
Semiannual Report
Fidelity Advisor Freedom 2035 Fund
Statement of Assets and Liabilities
| September 30, 2013 (Unaudited) |
| | |
Assets | | |
Investment in securities, at value (cost $1,989,702,502) - See accompanying schedule | | $ 2,251,236,669 |
Cash | | 9 |
Receivable for investments sold | | 3,192,966 |
Receivable for fund shares sold | | 2,087,357 |
Receivable from investment adviser for expense reductions | | 1,021 |
Total assets | | 2,256,518,022 |
| | |
Liabilities | | |
Payable for investments purchased | $ 30,389 | |
Payable for fund shares redeemed | 5,249,936 | |
Distribution and service plan fees payable | 432,112 | |
Total liabilities | | 5,712,437 |
| | |
Net Assets | | $ 2,250,805,585 |
Net Assets consist of: | | |
Paid in capital | | $ 1,962,360,005 |
Undistributed net investment income | | 5,804,286 |
Accumulated undistributed net realized gain (loss) on investments | | 21,107,127 |
Net unrealized appreciation (depreciation) on investments | | 261,534,167 |
Net Assets | | $ 2,250,805,585 |
| | |
Calculation of Maximum Offering Price Class A:
Net Asset Value and redemption price per share ($1,325,524,311 ÷ 101,928,010 shares) | | $ 13.00 |
| | |
Maximum offering price per share (100/94.25 of $13.00) | | $ 13.79 |
Class T:
Net Asset Value and redemption price per share ($248,258,597 ÷ 19,200,085 shares) | | $ 12.93 |
| | |
Maximum offering price per share (100/96.50 of $12.93) | | $ 13.40 |
Class B:
Net Asset Value and offering price per share ($16,231,867 ÷ 1,266,153 shares)A | | $ 12.82 |
| | |
Class C:
Net Asset Value and offering price per share ($49,061,412 ÷ 3,836,405 shares)A | | $ 12.79 |
| | |
Institutional Class:
Net Asset Value, offering price and redemption price per share ($611,729,398 ÷ 46,765,020 shares) | | $ 13.08 |
A Redemption price per share is equal to net asset value less any applicable contingent deferred sales charge.
Statement of Operations
Six months ended September 30, 2013 (Unaudited) |
| | |
Investment Income | | |
Income distributions from underlying funds | | $ 8,284,515 |
| | |
Expenses | | |
Distribution and service plan fees | $ 2,519,111 | |
Independent trustees' compensation | 3,996 | |
Total expenses before reductions | 2,523,107 | |
Expense reductions | (3,996) | 2,519,111 |
Net investment income (loss) | | 5,765,404 |
Realized and Unrealized Gain (Loss) Realized gain (loss) on sale of underlying fund shares | 19,689,765 | |
Capital gain distributions from underlying funds | 6,160,694 | |
Total net realized gain (loss) | | 25,850,459 |
Change in net unrealized appreciation (depreciation) on underlying funds | | 95,082,341 |
Net gain (loss) | | 120,932,800 |
Net increase (decrease) in net assets resulting from operations | | $ 126,698,204 |
See accompanying notes which are an integral part of the financial statements.
Semiannual Report
Fidelity Advisor Freedom 2035 Fund
Financial Statements - continued
Statement of Changes in Net Assets
| Six months ended
September 30, 2013
(Unaudited) | Year ended
March 31,
2013 |
Increase (Decrease) in Net Assets | | |
Operations | | |
Net investment income (loss) | $ 5,765,404 | $ 27,744,686 |
Net realized gain (loss) | 25,850,459 | 116,307,027 |
Change in net unrealized appreciation (depreciation) | 95,082,341 | 38,369,090 |
Net increase (decrease) in net assets resulting from operations | 126,698,204 | 182,420,803 |
Distributions to shareholders from net investment income | (2,139,263) | (27,167,238) |
Distributions to shareholders from net realized gain | (76,670,553) | (5,583,432) |
Total distributions | (78,809,816) | (32,750,670) |
Share transactions - net increase (decrease) | 119,039,176 | 289,056,044 |
Total increase (decrease) in net assets | 166,927,564 | 438,726,177 |
| | |
Net Assets | | |
Beginning of period | 2,083,878,021 | 1,645,151,844 |
End of period (including undistributed net investment income of $5,804,286 and undistributed net investment income of $2,178,145, respectively) | $ 2,250,805,585 | $ 2,083,878,021 |
Financial Highlights - Class A
| Six months ended September 30, 2013 | Years ended March 31, |
| (Unaudited) | 2013 | 2012 | 2011 | 2010 | 2009 |
Selected Per-Share Data | | | | | | |
Net asset value, beginning of period | $ 12.74 | $ 11.80 | $ 12.11 | $ 10.65 | $ 7.18 | $ 12.53 |
Income from Investment Operations | | | | | | |
Net investment income (loss) E | .03 | .18 | .16 | .14 | .14 | .20 |
Net realized and unrealized gain (loss) | .71 | .97 | (.13) | 1.56 | 3.55 | (4.92) |
Total from investment operations | .74 | 1.15 | .03 | 1.70 | 3.69 | (4.72) |
Distributions from net investment income | (.01) | (.18) | (.15) | (.13) | (.14) | (.18) |
Distributions from net realized gain | (.47) | (.04) | (.19) | (.11) | (.08) | (.45) |
Total distributions | (.48) | (.21) I | (.34) | (.24) | (.22) | (.63) H |
Net asset value, end of period | $ 13.00 | $ 12.74 | $ 11.80 | $ 12.11 | $ 10.65 | $ 7.18 |
Total Return B, C, D | 5.93% | 9.89% | .47% | 16.13% | 51.59% | (39.29)% |
Ratios to Average Net Assets F, G | | | | | | |
Expenses before reductions | .25% A | .25% | .25% | .25% | .25% | .25% |
Expenses net of fee waivers, if any | .25% A | .25% | .25% | .25% | .25% | .25% |
Expenses net of all reductions | .25% A | .25% | .25% | .25% | .25% | .25% |
Net investment income (loss) | .51% A | 1.54% | 1.39% | 1.26% | 1.51% | 2.04% |
Supplemental Data | | | | | | |
Net assets, end of period (000 omitted) | $ 1,325,524 | $ 1,258,797 | $ 1,057,102 | $ 906,896 | $ 669,450 | $ 314,996 |
Portfolio turnover rate F | 20% A | 25% | 13% | 30% | 16% | 21% |
A Annualized
B Total returns for periods of less than one year are not annualized.
C Total returns would have been lower if certain expenses had not been reduced during the applicable periods shown.
D Total returns do not include the effect of the sales charges.
E Calculated based on average shares outstanding during the period.
F Amounts do not include the activity of the Underlying Funds.
G Expense ratios reflect operating expenses of the class. Expenses before reductions do not reflect amounts reimbursed by the investment adviser or reductions from expense offset arrangements and do not represent the amount paid by the class during periods when reimbursements or reductions occur. Expenses net of fee waivers reflect expenses after reimbursement by the investment adviser but prior to reductions from expense offset arrangements. Expenses net of all reductions represent the net expenses paid by the class but do not include expenses of the investment companies in which the Fund invests.
H Total distributions of $.63 per share is comprised of distributions from net investment income of $.182 and distributions from net realized gain of $.445 per share.
I Total distributions of $.21 per share is comprised of distributions from net investment income of $.175 and distributions from net realized gain of $.036 per share.
See accompanying notes which are an integral part of the financial statements.
Semiannual Report
Financial Highlights - Class T
| Six months ended September 30, 2013 | Years ended March 31, |
| (Unaudited) | 2013 | 2012 | 2011 | 2010 | 2009 |
Selected Per-Share Data | | | | | | |
Net asset value, beginning of period | $ 12.68 | $ 11.74 | $ 12.05 | $ 10.60 | $ 7.15 | $ 12.47 |
Income from Investment Operations | | | | | | |
Net investment income (loss) E | .02 | .15 | .13 | .11 | .12 | .17 |
Net realized and unrealized gain (loss) | .70 | .97 | (.13) | 1.55 | 3.53 | (4.89) |
Total from investment operations | .72 | 1.12 | - | 1.66 | 3.65 | (4.72) |
Distributions from net investment income | (.01) | (.15) | (.12) | (.11) | (.12) | (.16) |
Distributions from net realized gain | (.47) | (.04) | (.19) | (.11) | (.08) | (.45) |
Total distributions | (.47) K | (.18) J | (.31) | (.21) I | (.20) | (.60) H |
Net asset value, end of period | $ 12.93 | $ 12.68 | $ 11.74 | $ 12.05 | $ 10.60 | $ 7.15 |
Total Return B, C, D | 5.82% | 9.69% | .19% | 15.84% | 51.17% | (39.42)% |
Ratios to Average Net Assets F, G | | | | | | |
Expenses before reductions | .50% A | .50% | .50% | .50% | .50% | .50% |
Expenses net of fee waivers, if any | .50% A | .50% | .50% | .50% | .50% | .50% |
Expenses net of all reductions | .50% A | .50% | .50% | .50% | .50% | .50% |
Net investment income (loss) | .26% A | 1.29% | 1.14% | 1.01% | 1.26% | 1.79% |
Supplemental Data | | | | | | |
Net assets, end of period (000 omitted) | $ 248,259 | $ 216,701 | $ 166,843 | $ 169,442 | $ 143,106 | $ 81,463 |
Portfolio turnover rate F | 20% A | 25% | 13% | 30% | 16% | 21% |
A Annualized
B Total returns for periods of less than one year are not annualized.
C Total returns would have been lower if certain expenses had not been reduced during the applicable periods shown.
D Total returns do not include the effect of the sales charges.
E Calculated based on average shares outstanding during the period.
F Amounts do not include the activity of the Underlying Funds.
G Expense ratios reflect operating expenses of the class. Expenses before reductions do not reflect amounts reimbursed by the investment adviser or reductions from expense offset arrangements and do not represent the amount paid by the class during periods when reimbursements or reductions occur. Expenses net of fee waivers reflect expenses after reimbursement by the investment adviser but prior to reductions from expense offset arrangements. Expenses net of all reductions represent the net expenses paid by the class but do not include expenses of the investment companies in which the Fund invests.
H Total distributions of $.60 per share is comprised of distributions from net investment income of $.156 and distributions from net realized gain of $.445 per share.
I Total distributions of $.21 per share is comprised of distributions from net investment income of $.106 and distributions from net realized gain of $.105 per share.
J Total distributions of $.18 per share is comprised of distributions from net investment income of $.148 and distributions from net realized gain of $.036 per share.
K Total distributions of $.47 per share is comprised of distributions from net investment income of $.005 and distributions from net realized gain of $.466 per share.
Financial Highlights - Class B
| Six months ended September 30, 2013 | Years ended March 31, |
| (Unaudited) | 2013 | 2012 | 2011 | 2010 | 2009 |
Selected Per-Share Data | | | | | | |
Net asset value, beginning of period | $ 12.59 | $ 11.67 | $ 11.96 | $ 10.52 | $ 7.10 | $ 12.38 |
Income from Investment Operations | | | | | | |
Net investment income (loss) E | (.01) | .09 | .07 | .05 | .07 | .13 |
Net realized and unrealized gain (loss) | .70 | .95 | (.12) | 1.55 | 3.50 | (4.86) |
Total from investment operations | .69 | 1.04 | (.05) | 1.60 | 3.57 | (4.73) |
Distributions from net investment income | - | (.09) | (.07) | (.06) | (.07) | (.10) |
Distributions from net realized gain | (.46) | (.04) | (.17) | (.10) | (.08) | (.45) |
Total distributions | (.46) | (.12) I | (.24) | (.16) | (.15) | (.55) H |
Net asset value, end of period | $ 12.82 | $ 12.59 | $ 11.67 | $ 11.96 | $ 10.52 | $ 7.10 |
Total Return B, C, D | 5.60% | 9.02% | (.23)% | 15.28% | 50.43% | (39.76)% |
Ratios to Average Net Assets F, G | | | | | | |
Expenses before reductions | 1.00% A | 1.00% | 1.00% | 1.00% | 1.00% | 1.00% |
Expenses net of fee waivers, if any | 1.00% A | 1.00% | 1.00% | 1.00% | 1.00% | 1.00% |
Expenses net of all reductions | 1.00% A | 1.00% | 1.00% | 1.00% | 1.00% | 1.00% |
Net investment income (loss) | (.24)% A | .79% | .64% | .51% | .76% | 1.30% |
Supplemental Data | | | | | | |
Net assets, end of period (000 omitted) | $ 16,232 | $ 17,884 | $ 22,013 | $ 28,360 | $ 27,408 | $ 17,892 |
Portfolio turnover rate F | 20% A | 25% | 13% | 30% | 16% | 21% |
A Annualized
B Total returns for periods of less than one year are not annualized.
C Total returns would have been lower if certain expenses had not been reduced during the applicable periods shown.
D Total returns do not include the effect of the contingent deferred sales charge.
E Calculated based on average shares outstanding during the period.
F Amounts do not include the activity of the Underlying Funds.
G Expense ratios reflect operating expenses of the class. Expenses before reductions do not reflect amounts reimbursed by the investment adviser or reductions from expense offset arrangements and do not represent the amount paid by the class during periods when reimbursements or reductions occur. Expenses net of fee waivers reflect expenses after reimbursement by the investment adviser but prior to reductions from expense offset arrangements. Expenses net of all reductions represent the net expenses paid by the class but do not include expenses of the investment companies in which the Fund invests.
H Total distributions of $.55 per share is comprised of distributions from net investment income of $.103 and distributions from net realized gain of $.445 per share.
I Total distributions of $.12 per share is comprised of distributions from net investment income of $.088 and distributions from net realized gain of $.036 per share.
See accompanying notes which are an integral part of the financial statements.
Semiannual Report
Financial Highlights - Class C
| Six months ended September 30, 2013 | Years ended March 31, |
| (Unaudited) | 2013 | 2012 | 2011 | 2010 | 2009 |
Selected Per-Share Data | | | | | | |
Net asset value, beginning of period | $ 12.56 | $ 11.65 | $ 11.96 | $ 10.52 | $ 7.11 | $ 12.39 |
Income from Investment Operations | | | | | | |
Net investment income (loss) E | (.01) | .09 | .07 | .06 | .07 | .12 |
Net realized and unrealized gain (loss) | .70 | .95 | (.13) | 1.54 | 3.50 | (4.85) |
Total from investment operations | .69 | 1.04 | (.06) | 1.60 | 3.57 | (4.73) |
Distributions from net investment income | - | (.10) | (.08) | (.06) | (.08) | (.11) |
Distributions from net realized gain | (.46) | (.04) | (.18) | (.10) | (.08) | (.45) |
Total distributions | (.46) | (.13) J | (.25) I | (.16) | (.16) | (.55) H |
Net asset value, end of period | $ 12.79 | $ 12.56 | $ 11.65 | $ 11.96 | $ 10.52 | $ 7.11 |
Total Return B, C, D | 5.61% | 9.04% | (.29)% | 15.33% | 50.28% | (39.70)% |
Ratios to Average Net Assets F, G | | | | | | |
Expenses before reductions | 1.00% A | 1.00% | 1.00% | 1.00% | 1.00% | 1.00% |
Expenses net of fee waivers, if any | 1.00% A | 1.00% | 1.00% | 1.00% | 1.00% | 1.00% |
Expenses net of all reductions | 1.00% A | 1.00% | 1.00% | 1.00% | 1.00% | 1.00% |
Net investment income (loss) | (.24)% A | .79% | .64% | .51% | .76% | 1.29% |
Supplemental Data | | | | | | |
Net assets, end of period (000 omitted) | $ 49,061 | $ 43,447 | $ 38,614 | $ 36,389 | $ 30,994 | $ 17,821 |
Portfolio turnover rate F | 20% A | 25% | 13% | 30% | 16% | 21% |
A Annualized
B Total returns for periods of less than one year are not annualized.
C Total returns would have been lower if certain expenses had not been reduced during the applicable periods shown.
D Total returns do not include the effect of the contingent deferred sales charge.
E Calculated based on average shares outstanding during the period.
F Amounts do not include the activity of the Underlying Funds.
G Expense ratios reflect operating expenses of the class. Expenses before reductions do not reflect amounts reimbursed by the investment adviser or reductions from expense offset arrangements and do not represent the amount paid by the class during periods when reimbursements or reductions occur. Expenses net of fee waivers reflect expenses after reimbursement by the investment adviser but prior to reductions from expense offset arrangements. Expenses net of all reductions represent the net expenses paid by the class but do not include expenses of the investment companies in which the Fund invests.
H Total distributions of $.55 per share is comprised of distributions from net investment income of $.107 and distributions from net realized gain of $.445 per share.
I Total distributions of $.25 per share is comprised of distributions from net investment income of $.076 and distributions from net realized gain of $.176 per share.
J Total distributions of $.13 per share is comprised of distributions from net investment income of $.098 and distributions from net realized gain of $.036 per share.
Financial Highlights - Institutional Class
| Six months ended September 30, 2013 | Years ended March 31, |
| (Unaudited) | 2013 | 2012 | 2011 | 2010 | 2009 |
Selected Per-Share Data | | | | | | |
Net asset value, beginning of period | $ 12.80 | $ 11.86 | $ 12.17 | $ 10.69 | $ 7.21 | $ 12.57 |
Income from Investment Operations | | | | | | |
Net investment income (loss) D | .05 | .21 | .19 | .17 | .17 | .22 |
Net realized and unrealized gain (loss) | .72 | .97 | (.14) | 1.57 | 3.55 | (4.93) |
Total from investment operations | .77 | 1.18 | .05 | 1.74 | 3.72 | (4.71) |
Distributions from net investment income | (.02) | (.20) | (.17) | (.16) | (.16) | (.21) |
Distributions from net realized gain | (.47) | (.04) | (.19) | (.11) | (.08) | (.45) |
Total distributions | (.49) | (.24) | (.36) | (.26) I | (.24) | (.65) H |
Net asset value, end of period | $ 13.08 | $ 12.80 | $ 11.86 | $ 12.17 | $ 10.69 | $ 7.21 |
Total Return B, C | 6.13% | 10.10% | .71% | 16.51% | 51.81% | (39.08)% |
Ratios to Average Net Assets E, G | | | | | | |
Expenses before reductions F | .00% A | .00% | .00% | .00% | .00% | .00% |
Expenses net of fee waivers, if any | .00% A | .00% | .00% | .00% | .00% | .00% |
Expenses net of all reductions | .00% A | .00% | .00% | .00% | .00% | .00% |
Net investment income (loss) | .76% A | 1.79% | 1.64% | 1.51% | 1.76% | 2.29% |
Supplemental Data | | | | | | |
Net assets, end of period (000 omitted) | $ 611,729 | $ 547,049 | $ 360,580 | $ 218,092 | $ 97,629 | $ 43,667 |
Portfolio turnover rate E | 20% A | 25% | 13% | 30% | 16% | 21% |
A Annualized
B Total returns for periods of less than one year are not annualized.
C Total returns would have been lower if certain expenses had not been reduced during the applicable periods shown.
D Calculated based on average shares outstanding during the period.
E Amounts do not include the activity of the Underlying Funds.
F Amount represents less than .01%.
G Expense ratios reflect operating expenses of the class. Expenses before reductions do not reflect amounts reimbursed by the investment adviser or reductions from expense offset arrangements and do not represent the amount paid by the class during periods when reimbursements or reductions occur. Expenses net of fee waivers reflect expenses after reimbursement by the investment adviser but prior to reductions from expense offset arrangements. Expenses net of all reductions represent the net expenses paid by the class but do not include expenses of the investment companies in which the Fund invests.
H Total distributions of $.65 per share is comprised of distributions from net investment income of $.206 and distributions from net realized gain of $.445 per share.
I Total distributions of $.26 per share is comprised of distributions from net investment income of $.157 and distributions from net realized gain of $.105 per share.
See accompanying notes which are an integral part of the financial statements.
Semiannual Report
Fidelity Advisor Freedom 2040 Fund
Investment Changes (Unaudited)
The information in the following tables is based on the direct investments of the Fund. |
Fund Holdings as of September 30, 2013 |
| % of fund's
net assets | % of fund's net assets
6 months ago |
Commodity Funds | | |
Fidelity Series Commodity Strategy Fund | 8.8 | 8.9 |
Domestic Equity Funds | | |
Fidelity Advisor Equity Growth Fund Institutional Class | 7.4 | 7.1 |
Fidelity Advisor Growth & Income Fund Institutional Class | 0.0 | 3.8 |
Fidelity Advisor Large Cap Fund Institutional Class | 3.7 | 3.8 |
Fidelity Advisor Series Equity-Income Fund | 5.0 | 5.0 |
Fidelity Advisor Series Growth & Income Fund (formerly Fidelity Advisor Series Mega Cap Fund) | 4.8 | 1.1 |
Fidelity Advisor Series Opportunistic Insights Fund | 3.8 | 3.5 |
Fidelity Advisor Series Stock Selector Large Cap Value Fund | 4.9 | 5.0 |
Fidelity Advisor Small Cap Fund Institutional Class | 2.9 | 2.9 |
Fidelity Series 100 Index Fund | 1.1 | 1.2 |
Fidelity Series All-Sector Equity Fund | 9.2 | 9.4 |
Fidelity Series Large Cap Value Fund | 4.9 | 5.3 |
Fidelity Series Real Estate Equity Fund | 0.7 | 0.8 |
Fidelity Series Small Cap Opportunities Fund | 3.3 | 3.4 |
| 51.7 | 52.3 |
Developed International Equity Funds | | |
Fidelity Series International Growth Fund | 8.0 | 7.7 |
Fidelity Series International Small Cap Fund | 1.7 | 1.6 |
Fidelity Series International Value Fund | 8.0 | 7.7 |
| 17.7 | 17.0 |
Emerging Markets Equity Funds | | |
Fidelity Series Emerging Markets Fund | 5.0 | 4.7 |
High Yield Bond Funds | | |
Fidelity Series Emerging Markets Debt Fund | 0.6 | 0.7 |
Fidelity Series Floating Rate High Income Fund | 0.7 | 0.7 |
Fidelity Series High Income Fund | 6.8 | 7.0 |
Fidelity Series Real Estate Income Fund | 0.4 | 0.4 |
| 8.5 | 8.8 |
Investment Grade Bond Funds | | |
Fidelity Series Investment Grade Bond Fund | 8.3 | 8.3 |
Net Other Assets (Liabilities)* | 0.0 | 0.0 |
| 100.0 | 100.0 |
* Amount represents less than 0.1% |
Asset Allocation (% of fund's net assets) |
Period end |
| Commodity Funds | 8.8% | |
| Domestic Equity Funds | 51.7% | |
| Developed International Equity Funds | 17.7% | |
| Emerging Markets Equity Funds | 5.0% | |
| High Yield Bond Funds | 8.5% | |
| Investment Grade Bond Funds | 8.3% | |

Six months ago |
| Commodity Funds | 8.9% | |
| Domestic Equity Funds | 52.3% | |
| Developed International Equity Funds | 17.0% | |
| Emerging Markets Equity Funds | 4.7% | |
| High Yield Bond Funds | 8.8% | |
| Investment Grade Bond Funds | 8.3% | |

Semiannual Report
Fidelity Advisor Freedom 2040 Fund
Investments September 30, 2013 (Unaudited)
Showing Percentage of Net Assets
Domestic Equity Funds - 60.5% |
| Shares | | Value |
Commodity Funds - 8.8% |
Fidelity Series Commodity Strategy Fund (a)(b) | 23,768,104 | | $ 190,382,510 |
Domestic Equity Funds - 51.7% |
Fidelity Advisor Equity Growth Fund Institutional Class (b) | 1,951,706 | | 160,586,345 |
Fidelity Advisor Large Cap Fund Institutional Class (b) | 2,970,171 | | 79,897,603 |
Fidelity Advisor Series Equity-Income Fund (b) | 9,134,579 | | 107,696,687 |
Fidelity Advisor Series Growth & Income Fund (b) | 8,680,872 | | 104,604,509 |
Fidelity Advisor Series Opportunistic Insights Fund (b) | 6,364,109 | | 81,969,721 |
Fidelity Advisor Series Stock Selector Large Cap Value Fund (b) | 8,836,027 | | 107,534,452 |
Fidelity Advisor Small Cap Fund Institutional Class (b) | 2,057,738 | | 62,719,840 |
Fidelity Series 100 Index Fund (b) | 2,236,208 | | 24,777,189 |
Fidelity Series All-Sector Equity Fund (b) | 14,097,381 | | 199,618,920 |
Fidelity Series Large Cap Value Fund (b) | 8,452,473 | | 106,754,732 |
Fidelity Series Real Estate Equity Fund (b) | 1,306,493 | | 15,625,657 |
Fidelity Series Small Cap Opportunities Fund (b) | 5,598,844 | | 71,833,168 |
TOTAL DOMESTIC EQUITY FUNDS | | 1,123,618,823 |
TOTAL DOMESTIC EQUITY FUNDS (Cost $1,147,391,961) |
1,314,001,333
|
International Equity Funds - 22.7% |
| | | |
Developed International Equity Funds - 17.7% |
Fidelity Series International Growth Fund (b) | 12,814,800 | | 173,896,836 |
Fidelity Series International Small Cap Fund (b) | 2,365,112 | | 36,162,558 |
Fidelity Series International Value Fund (b) | 16,235,787 | | 174,534,709 |
TOTAL DEVELOPED INTERNATIONAL EQUITY FUNDS | | 384,594,103 |
|
| Shares | | Value |
Emerging Markets Equity Funds - 5.0% |
Fidelity Series Emerging Markets Fund (b) | 6,544,773 | | $ 109,559,494 |
TOTAL INTERNATIONAL EQUITY FUNDS (Cost $414,084,198) |
494,153,597
|
Bond Funds - 16.8% |
| | | |
High Yield Bond Funds - 8.5% |
Fidelity Series Emerging Markets Debt Fund (b) | 1,408,721 | | 14,256,257 |
Fidelity Series Floating Rate High Income Fund (b) | 1,411,162 | | 14,930,089 |
Fidelity Series High Income Fund (b) | 14,452,915 | | 148,575,964 |
Fidelity Series Real Estate Income Fund (b) | 742,737 | | 8,155,256 |
TOTAL HIGH YIELD BOND FUNDS | | 185,917,566 |
Investment Grade Bond Funds - 8.3% |
Fidelity Series Investment Grade Bond Fund (b) | 16,098,622 | | 180,143,576 |
TOTAL BOND FUNDS (Cost $367,841,672) |
366,061,142
|
TOTAL INVESTMENT PORTFOLIO - 100.0% (Cost $1,929,317,831) | | 2,174,216,072 |
NET OTHER ASSETS (LIABILITIES) - 0.0% | | (450,068) |
NET ASSETS - 100% | $ 2,173,766,004 |
Legend |
(a) Non-income producing |
(b) Affiliated company |
Affiliated Underlying Funds |
Information regarding the Fund's fiscal year to date purchases and sales of the affiliated Underlying Funds and income earned by the Fund from investments in affiliated Underlying Funds is as follows: |
Affiliate | Value,
beginning of
period | Purchases | Sales
Proceeds | Dividend
Income | Value,
end of
period |
Fidelity Advisor Equity Growth Fund Institutional Class | $ 143,673,712 | $ 5,178,165 | $ 11,077,016 | $ - | $ 160,586,345 |
Fidelity Advisor Growth & Income Fund Institutional Class | 75,975,139 | 2,089,336 | 84,711,075 | - | - |
Fidelity Advisor Large Cap Fund Institutional Class | 76,812,641 | 2,254,815 | 9,066,700 | - | 79,897,603 |
Fidelity Advisor Series Equity-Income Fund | 100,676,220 | 6,302,287 | 5,326,211 | 1,023,649 | 107,696,687 |
Fidelity Advisor Series Growth & Income Fund (formerly Fidelity Advisor Series Mega Cap Fund) | 22,294,860 | 81,426,796 | 2,258,221 | - | 104,604,509 |
Fidelity Advisor Series Opportunistic Insights Fund | 71,158,645 | 2,780,024 | 4,049,738 | - | 81,969,721 |
Fidelity Advisor Series Stock Selector Large Cap Value Fund | 101,402,797 | 3,753,365 | 6,502,612 | - | 107,534,452 |
Fidelity Advisor Small Cap Fund Institutional Class | 59,092,069 | 2,056,089 | 5,948,571 | - | 62,719,840 |
Fidelity Series 100 Index Fund | 23,560,024 | 848,399 | 1,366,347 | - | 24,777,189 |
Fidelity Series All-Sector Equity Fund | 189,472,856 | 5,684,201 | 14,647,073 | - | 199,618,920 |
Fidelity Series Commodity Strategy Fund | 180,115,990 | 33,341,615 | 8,479,778 | - | 190,382,510 |
Fidelity Series Emerging Markets Debt Fund | 14,730,822 | 1,135,298 | 559,217 | 380,586 | 14,256,257 |
Fidelity Series Emerging Markets Fund | 94,763,737 | 17,029,636 | 2,838,391 | - | 109,559,494 |
Fidelity Series Floating Rate High Income Fund | 13,987,354 | 1,539,895 | 531,651 | 315,804 | 14,930,089 |
Fidelity Series High Income Fund | 141,548,587 | 14,923,781 | 4,713,357 | 3,805,605 | 148,575,964 |
Fidelity Series International Growth Fund | 156,546,342 | 10,833,012 | 5,304,206 | - | 173,896,836 |
Fidelity Series International Small Cap Fund | 31,795,611 | 1,808,294 | 1,151,185 | - | 36,162,558 |
Fidelity Series International Value Fund | 154,936,713 | 9,735,164 | 5,161,890 | - | 174,534,709 |
Fidelity Series Investment Grade Bond Fund | 167,049,065 | 26,247,629 | 7,916,373 | 1,820,405 | 180,143,576 |
Fidelity Series Large Cap Value Fund | 106,490,192 | 3,112,693 | 11,796,317 | - | 106,754,732 |
Fidelity Series Real Estate Equity Fund | 15,629,519 | 1,856,873 | 579,058 | 103,884 | 15,625,657 |
Fidelity Series Real Estate Income Fund | 8,218,795 | 727,578 | 298,427 | 241,614 | 8,155,256 |
Fidelity Series Small Cap Opportunities Fund | 68,837,714 | 7,599,360 | 7,646,256 | - | 71,833,168 |
Total | $ 2,018,769,404 | $ 242,264,305 | $ 201,929,670 | $ 7,691,547 | $ 2,174,216,072 |
Other Information |
All investments are categorized as Level 1 under the Fair Value Hierarchy. The inputs or methodology used for valuing securities may not be an indication of the risk associated with investing in those securities. For more information on valuation inputs, please refer to the Investment Valuation section in the accompanying Notes to Financial Statements. |
See accompanying notes which are an integral part of the financial statements.
Semiannual Report
Fidelity Advisor Freedom 2040 Fund
Statement of Assets and Liabilities
| September 30, 2013 (Unaudited) |
| | |
Assets | | |
Investment in securities, at value (cost $1,929,317,831) - See accompanying schedule | | $ 2,174,216,072 |
Cash | | 7 |
Receivable for investments sold | | 4,177,107 |
Receivable for fund shares sold | | 2,196,373 |
Receivable from investment adviser for expense reductions | | 612 |
Total assets | | 2,180,590,171 |
| | |
Liabilities | | |
Payable for investments purchased | $ 33,546 | |
Payable for fund shares redeemed | 6,339,978 | |
Distribution and service plan fees payable | 450,643 | |
Total liabilities | | 6,824,167 |
| | |
Net Assets | | $ 2,173,766,004 |
Net Assets consist of: | | |
Paid in capital | | $ 1,905,055,333 |
Undistributed net investment income | | 5,005,024 |
Accumulated undistributed net realized gain (loss) on investments | | 18,807,406 |
Net unrealized appreciation (depreciation) on investments | | 244,898,241 |
Net Assets | | $ 2,173,766,004 |
| | |
Calculation of Maximum Offering Price Class A:
Net Asset Value and redemption price per share ($1,188,562,710 ÷ 85,374,078 shares) | | $ 13.92 |
| | |
Maximum offering price per share (100/94.25 of $13.92) | | $ 14.77 |
Class T:
Net Asset Value and redemption price per share ($311,365,479 ÷ 22,433,285 shares) | | $ 13.88 |
| | |
Maximum offering price per share (100/96.50 of $13.88) | | $ 14.38 |
Class B:
Net Asset Value and offering price per share ($20,825,438 ÷ 1,514,703 shares)A | | $ 13.75 |
| | |
Class C:
Net Asset Value and offering price per share ($67,277,997 ÷ 4,909,647 shares)A | | $ 13.70 |
| | |
Institutional Class:
Net Asset Value, offering price and redemption price per share ($585,734,380 ÷ 41,841,094 shares) | | $ 14.00 |
A Redemption price per share is equal to net asset value less any applicable contingent deferred sales charge.
Statement of Operations
Six months ended September 30, 2013 (Unaudited) |
| | |
Investment Income | | |
Income distributions from underlying funds | | $ 7,691,547 |
| | |
Expenses | | |
Distribution and service plan fees | $ 2,657,943 | |
Independent trustees' compensation | 3,880 | |
Total expenses before reductions | 2,661,823 | |
Expense reductions | (3,880) | 2,657,943 |
Net investment income (loss) | | 5,033,604 |
Realized and Unrealized Gain (Loss) Realized gain (loss) on sale of underlying fund shares | 17,157,443 | |
Capital gain distributions from underlying funds | 6,087,902 | |
Total net realized gain (loss) | | 23,245,345 |
Change in net unrealized appreciation (depreciation) on underlying funds | | 97,954,587 |
Net gain (loss) | | 121,199,932 |
Net increase (decrease) in net assets resulting from operations | | $ 126,233,536 |
See accompanying notes which are an integral part of the financial statements.
Semiannual Report
Fidelity Advisor Freedom 2040 Fund
Financial Statements - continued
Statement of Changes in Net Assets
| Six months ended
September 30, 2013
(Unaudited) | Year ended
March 31,
2013 |
Increase (Decrease) in Net Assets | | |
Operations | | |
Net investment income (loss) | $ 5,033,604 | $ 26,992,967 |
Net realized gain (loss) | 23,245,345 | 90,179,730 |
Change in net unrealized appreciation (depreciation) | 97,954,587 | 62,667,913 |
Net increase (decrease) in net assets resulting from operations | 126,233,536 | 179,840,610 |
Distributions to shareholders from net investment income | (1,974,119) | (26,501,610) |
Distributions to shareholders from net realized gain | (73,740,059) | (5,287,230) |
Total distributions | (75,714,178) | (31,788,840) |
Share transactions - net increase (decrease) | 104,901,832 | 198,765,979 |
Total increase (decrease) in net assets | 155,421,190 | 346,817,749 |
| | |
Net Assets | | |
Beginning of period | 2,018,344,814 | 1,671,527,065 |
End of period (including undistributed net investment income of $5,005,024 and undistributed net investment income of $1,945,539, respectively) | $ 2,173,766,004 | $ 2,018,344,814 |
Financial Highlights - Class A
| Six months ended
September 30, 2013 | Years ended March 31, |
| (Unaudited) | 2013 | 2012 | 2011 | 2010 | 2009 |
Selected Per-Share Data | | | | | | |
Net asset value, beginning of period | $ 13.61 | $ 12.60 | $ 12.95 | $ 11.37 | $ 7.59 | $ 13.57 |
Income from Investment Operations | | | | | | |
Net investment income (loss) E | .03 | .19 | .17 | .15 | .15 | .21 |
Net realized and unrealized gain (loss) | .79 | 1.05 | (.15) | 1.69 | 3.87 | (5.44) |
Total from investment operations | .82 | 1.24 | .02 | 1.84 | 4.02 | (5.23) |
Distributions from net investment income | (.01) | (.19) | (.16) | (.15) | (.15) | (.20) |
Distributions from net realized gain | (.49) | (.04) | (.21) | (.11) | (.09) | (.56) |
Total distributions | (.51) I | (.23) | (.37) | (.26) | (.24) | (.75) H |
Net asset value, end of period | $ 13.92 | $ 13.61 | $ 12.60 | $ 12.95 | $ 11.37 | $ 7.59 |
Total Return B, C, D | 6.13% | 9.94% | .38% | 16.38% | 53.15% | (40.42)% |
Ratios to Average Net Assets F, G | | | | | | |
Expenses before reductions | .25% A | .25% | .25% | .25% | .25% | .25% |
Expenses net of fee waivers, if any | .25% A | .25% | .25% | .25% | .25% | .25% |
Expenses net of all reductions | .25% A | .25% | .25% | .25% | .25% | .25% |
Net investment income (loss) | .48% A | 1.53% | 1.38% | 1.25% | 1.52% | 2.02% |
Supplemental Data | | | | | | |
Net assets, end of period (000 omitted) | $ 1,188,563 | $ 1,133,722 | $ 967,348 | $ 865,008 | $ 670,673 | $ 342,357 |
Portfolio turnover rate F | 19% A | 26% | 14% | 38% | 18% | 18% |
A Annualized
B Total returns for periods of less than one year are not annualized.
C Total returns would have been lower if certain expenses had not been reduced during the applicable periods shown.
D Total returns do not include the effect of the sales charges.
E Calculated based on average shares outstanding during the period.
F Amounts do not include the activity of the Underlying Funds.
G Expense ratios reflect operating expenses of the class. Expenses before reductions do not reflect amounts reimbursed by the investment adviser or reductions from expense offset arrangements and do not represent the amount paid by the class during periods when reimbursements or reductions occur. Expenses net of fee waivers reflect expenses after reimbursement by the investment adviser but prior to reductions from expense offset arrangements. Expenses net of all reductions represent the net expenses paid by the class but do not include expenses of the investment companies in which the Fund invests.
H Total distributions of $.75 per share is comprised of distributions from net investment income of $.197 and distributions from net realized gain of $.555 per share.
I Total distributions of $.51 per share is comprised of distributions from net investment income of $.013 and distributions from net realized gain of $.492 per share.
See accompanying notes which are an integral part of the financial statements.
Semiannual Report
Financial Highlights - Class T
| Six months ended
September 30, 2013 | Years ended March 31, |
| (Unaudited) | 2013 | 2012 | 2011 | 2010 | 2009 |
Selected Per-Share Data | | | | | | |
Net asset value, beginning of period | $ 13.58 | $ 12.57 | $ 12.92 | $ 11.34 | $ 7.57 | $ 13.54 |
Income from Investment Operations | | | | | | |
Net investment income (loss) E | .02 | .16 | .14 | .12 | .13 | .18 |
Net realized and unrealized gain (loss) | .78 | 1.04 | (.16) | 1.68 | 3.86 | (5.43) |
Total from investment operations | .80 | 1.20 | (.02) | 1.80 | 3.99 | (5.25) |
Distributions from net investment income | - L | (.16) | (.13) | (.11) | (.13) | (.17) |
Distributions from net realized gain | (.49) | (.04) | (.21) | (.11) | (.09) | (.56) |
Total distributions | (.50) K | (.19) J | (.33) I | (.22) | (.22) | (.72) H |
Net asset value, end of period | $ 13.88 | $ 13.58 | $ 12.57 | $ 12.92 | $ 11.34 | $ 7.57 |
Total Return B, C, D | 6.00% | 9.69% | .12% | 16.06% | 52.83% | (40.61)% |
Ratios to Average Net Assets F, G | | | | | | |
Expenses before reductions | .50% A | .50% | .50% | .50% | .50% | .50% |
Expenses net of fee waivers, if any | .50% A | .50% | .50% | .50% | .50% | .50% |
Expenses net of all reductions | .50% A | .50% | .50% | .50% | .50% | .50% |
Net investment income (loss) | .23% A | 1.28% | 1.13% | 1.00% | 1.27% | 1.77% |
Supplemental Data | | | | | | |
Net assets, end of period (000 omitted) | $ 311,365 | $ 288,886 | $ 262,944 | $ 276,335 | $ 300,594 | $ 181,917 |
Portfolio turnover rate F | 19% A | 26% | 14% | 38% | 18% | 18% |
A Annualized
B Total returns for periods of less than one year are not annualized.
C Total returns would have been lower if certain expenses had not been reduced during the applicable periods shown.
D Total returns do not include the effect of the sales charges.
E Calculated based on average shares outstanding during the period.
F Amounts do not include the activity of the Underlying Funds.
G Expense ratios reflect operating expenses of the class. Expenses before reductions do not reflect amounts reimbursed by the investment adviser or reductions from expense offset arrangements and do not represent the amount paid by the class during periods when reimbursements or reductions occur. Expenses net of fee waivers reflect expenses after reimbursement by the investment adviser but prior to reductions from expense offset arrangements. Expenses net of all reductions represent the net expenses paid by the class but do not include expenses of the investment companies in which the Fund invests.
H Total distributions of $.72 per share is comprised of distributions from net investment income of $.168 and distributions from net realized gain of $.555 per share.
I Total distributions of $.33 per share is comprised of distributions from net investment income of $.127 and distributions from net realized gain of $.207 per share.
J Total distributions of $.19 per share is comprised of distributions from net investment income of $.156 and distributions from net realized gain of $.037 per share.
K Total distributions of $.50 per share is comprised of distributions from net investment income of $.004 and distributions from net realized gain of $.492 per share.
L Amount represents less than $.01 per share.
Financial Highlights - Class B
| Six months ended
September 30, 2013 | Years ended March 31, |
| (Unaudited) | 2013 | 2012 | 2011 | 2010 | 2009 |
Selected Per-Share Data | | | | | | |
Net asset value, beginning of period | $ 13.48 | $ 12.48 | $ 12.82 | $ 11.26 | $ 7.52 | $ 13.42 |
Income from Investment Operations | | | | | | |
Net investment income (loss) E | (.02) | .10 | .08 | .06 | .08 | .13 |
Net realized and unrealized gain (loss) | .78 | 1.03 | (.15) | 1.66 | 3.83 | (5.37) |
Total from investment operations | .76 | 1.13 | (.07) | 1.72 | 3.91 | (5.24) |
Distributions from net investment income | - | (.09) | (.07) | (.06) | (.08) | (.11) |
Distributions from net realized gain | (.49) | (.04) | (.20) | (.10) | (.09) | (.55) |
Total distributions | (.49) | (.13) | (.27) | (.16) | (.17) | (.66) H |
Net asset value, end of period | $ 13.75 | $ 13.48 | $ 12.48 | $ 12.82 | $ 11.26 | $ 7.52 |
Total Return B, C, D | 5.73% | 9.14% | (.36)% | 15.43% | 52.08% | (40.85)% |
Ratios to Average Net Assets F, G | | | | | | |
Expenses before reductions | 1.00% A | 1.00% | 1.00% | 1.00% | 1.00% | 1.00% |
Expenses net of fee waivers, if any | 1.00% A | 1.00% | 1.00% | 1.00% | 1.00% | 1.00% |
Expenses net of all reductions | 1.00% A | 1.00% | 1.00% | 1.00% | 1.00% | 1.00% |
Net investment income (loss) | (.27)% A | .78% | .63% | .50% | .77% | 1.28% |
Supplemental Data | | | | | | |
Net assets, end of period (000 omitted) | $ 20,825 | $ 24,481 | $ 31,574 | $ 41,935 | $ 43,773 | $ 29,479 |
Portfolio turnover rate F | 19% A | 26% | 14% | 38% | 18% | 18% |
A Annualized
B Total returns for periods of less than one year are not annualized.
C Total returns would have been lower if certain expenses had not been reduced during the applicable periods shown.
D Total returns do not include the effect of the contingent deferred sales charge.
E Calculated based on average shares outstanding during the period.
F Amounts do not include the activity of the Underlying Funds.
G Expense ratios reflect operating expenses of the class. Expenses before reductions do not reflect amounts reimbursed by the investment adviser or reductions from expense offset arrangements and do not represent the amount paid by the class during periods when reimbursements or reductions occur. Expenses net of fee waivers reflect expenses after reimbursement by the investment adviser but prior to reductions from expense offset arrangements. Expenses net of all reductions represent the net expenses paid by the class but do not include expenses of the investment companies in which the Fund invests.
H Total distributions of $.66 per share is comprised of distributions from net investment income of $.112 and distributions from net realized gain of $.550 per share.
See accompanying notes which are an integral part of the financial statements.
Semiannual Report
Financial Highlights - Class C
| Six months ended
September 30, 2013 | Years ended March 31, |
| (Unaudited) | 2013 | 2012 | 2011 | 2010 | 2009 |
Selected Per-Share Data | | | | | | |
Net asset value, beginning of period | $ 13.43 | $ 12.45 | $ 12.80 | $ 11.25 | $ 7.51 | $ 13.42 |
Income from Investment Operations | | | | | | |
Net investment income (loss) E | (.02) | .10 | .08 | .06 | .08 | .13 |
Net realized and unrealized gain (loss) | .78 | 1.02 | (.15) | 1.66 | 3.83 | (5.37) |
Total from investment operations | .76 | 1.12 | (.07) | 1.72 | 3.91 | (5.24) |
Distributions from net investment income | - | (.11) | (.08) | (.07) | (.08) | (.12) |
Distributions from net realized gain | (.49) | (.04) | (.20) | (.10) | (.09) | (.55) |
Total distributions | (.49) | (.14) I | (.28) | (.17) | (.17) | (.67) H |
Net asset value, end of period | $ 13.70 | $ 13.43 | $ 12.45 | $ 12.80 | $ 11.25 | $ 7.51 |
Total Return B, C, D | 5.75% | 9.09% | (.35)% | 15.39% | 52.18% | (40.91)% |
Ratios to Average Net Assets F, G | | | | | | |
Expenses before reductions | 1.00% A | 1.00% | 1.00% | 1.00% | 1.00% | 1.00% |
Expenses net of fee waivers, if any | 1.00% A | 1.00% | 1.00% | 1.00% | 1.00% | 1.00% |
Expenses net of all reductions | 1.00% A | 1.00% | 1.00% | 1.00% | 1.00% | 1.00% |
Net investment income (loss) | (.27)% A | .78% | .63% | .50% | .77% | 1.28% |
Supplemental Data | | | | | | |
Net assets, end of period (000 omitted) | $ 67,278 | $ 62,893 | $ 56,910 | $ 58,416 | $ 53,334 | $ 34,036 |
Portfolio turnover rate F | 19% A | 26% | 14% | 38% | 18% | 18% |
A Annualized
B Total returns for periods of less than one year are not annualized.
C Total returns would have been lower if certain expenses had not been reduced during the applicable periods shown.
D Total returns do not include the effect of the contingent deferred sales charge.
E Calculated based on average shares outstanding during the period.
F Amounts do not include the activity of the Underlying Funds.
G Expense ratios reflect operating expenses of the class. Expenses before reductions do not reflect amounts reimbursed by the investment adviser or reductions from expense offset arrangements and do not represent the amount paid by the class during periods when reimbursements or reductions occur. Expenses net of fee waivers reflect expenses after reimbursement by the investment adviser but prior to reductions from expense offset arrangements. Expenses net of all reductions represent the net expenses paid by the class but do not include expenses of the investment companies in which the Fund invests.
H Total distributions of $.67 per share is comprised of distributions from net investment income of $.115 and distributions from net realized gain of $.550 per share.
I Total distributions of $.14 per share is comprised of distributions from net investment income of $.105 and distributions from net realized gain of $.037 per share.
Financial Highlights - Institutional Class
| Six months ended
September 30, 2013 | Years ended March 31, |
| (Unaudited) | 2013 | 2012 | 2011 | 2010 | 2009 |
Selected Per-Share Data | | | | | | |
Net asset value, beginning of period | $ 13.67 | $ 12.65 | $ 13.00 | $ 11.42 | $ 7.62 | $ 13.62 |
Income from Investment Operations | | | | | | |
Net investment income (loss) D | .05 | .23 | .20 | .18 | .18 | .23 |
Net realized and unrealized gain (loss) | .79 | 1.05 | (.16) | 1.69 | 3.88 | (5.45) |
Total from investment operations | .84 | 1.28 | .04 | 1.87 | 4.06 | (5.22) |
Distributions from net investment income | (.02) | (.22) | (.19) | (.18) | (.17) | (.22) |
Distributions from net realized gain | (.49) | (.04) | (.21) | (.11) | (.09) | (.56) |
Total distributions | (.51) | (.26) | (.39) I | (.29) | (.26) | (.78) H |
Net asset value, end of period | $ 14.00 | $ 13.67 | $ 12.65 | $ 13.00 | $ 11.42 | $ 7.62 |
Total Return B, C | 6.31% | 10.24% | .61% | 16.57% | 53.53% | (40.24)% |
Ratios to Average Net Assets E, G | | | | | | |
Expenses before reductions F | .00% A | .00% | .00% | .00% | .00% | .00% |
Expenses net of fee waivers, if any | .00% A | .00% | .00% | .00% | .00% | .00% |
Expenses net of all reductions | .00% A | .00% | .00% | .00% | .00% | .00% |
Net investment income (loss) | .73% A | 1.78% | 1.63% | 1.50% | 1.77% | 2.27% |
Supplemental Data | | | | | | |
Net assets, end of period (000 omitted) | $ 585,734 | $ 508,363 | $ 352,751 | $ 229,228 | $ 126,440 | $ 56,940 |
Portfolio turnover rate E | 19% A | 26% | 14% | 38% | 18% | 18% |
A Annualized
B Total returns for periods of less than one year are not annualized.
C Total returns would have been lower if certain expenses had not been reduced during the applicable periods shown.
D Calculated based on average shares outstanding during the period.
E Amounts do not include the activity of the Underlying Funds.
F Amount represents less than .01%.
G Expense ratios reflect operating expenses of the class. Expenses before reductions do not reflect amounts reimbursed by the investment adviser or reductions from expense offset arrangements and do not represent the amount paid by the class during periods when reimbursements or reductions occur. Expenses net of fee waivers reflect expenses after reimbursement by the investment adviser but prior to reductions from expense offset arrangements. Expenses net of all reductions represent the net expenses paid by the class but do not include expenses of the investment companies in which the Fund invests.
H Total distributions of $.78 per share is comprised of distributions from net investment income of $.224 and distributions from net realized gain of $.555 per share.
I Total distributions of $.39 per share is comprised of distributions from net investment income of $.186 and distributions from net realized gain of $.207 per share.
See accompanying notes which are an integral part of the financial statements.
Semiannual Report
Fidelity Advisor Freedom 2045 Fund
Investment Changes (Unaudited)
The information in the following tables is based on the direct investments of the Fund. |
Fund Holdings as of September 30, 2013 |
| % of fund's
net assets | % of fund's net assets
6 months ago |
Commodity Funds | | |
Fidelity Series Commodity Strategy Fund | 9.1 | 9.2 |
Domestic Equity Funds | | |
Fidelity Advisor Equity Growth Fund Institutional Class | 7.6 | 7.4 |
Fidelity Advisor Growth & Income Fund Institutional Class | 0.0 | 3.9 |
Fidelity Advisor Large Cap Fund Institutional Class | 3.8 | 4.0 |
Fidelity Advisor Series Equity-Income Fund | 4.9 | 4.9 |
Fidelity Advisor Series Growth & Income Fund (formerly Fidelity Advisor Series Mega Cap Fund) | 4.9 | 1.1 |
Fidelity Advisor Series Opportunistic Insights Fund | 3.8 | 3.5 |
Fidelity Advisor Series Stock Selector Large Cap Value Fund | 5.0 | 5.0 |
Fidelity Advisor Small Cap Fund Institutional Class | 3.0 | 3.0 |
Fidelity Series 100 Index Fund | 1.2 | 1.2 |
Fidelity Series All-Sector Equity Fund | 9.5 | 9.7 |
Fidelity Series Large Cap Value Fund | 5.1 | 5.5 |
Fidelity Series Real Estate Equity Fund | 0.7 | 0.8 |
Fidelity Series Small Cap Opportunities Fund | 3.4 | 3.5 |
| 52.9 | 53.5 |
Developed International Equity Funds | | |
Fidelity Series International Growth Fund | 8.2 | 8.0 |
Fidelity Series International Small Cap Fund | 1.7 | 1.6 |
Fidelity Series International Value Fund | 8.2 | 7.9 |
| 18.1 | 17.5 |
Emerging Markets Equity Funds | | |
Fidelity Series Emerging Markets Fund | 5.2 | 4.9 |
High Yield Bond Funds | | |
Fidelity Series Emerging Markets Debt Fund | 0.6 | 0.7 |
Fidelity Series Floating Rate High Income Fund | 0.4 | 0.3 |
Fidelity Series High Income Fund | 8.8 | 9.1 |
Fidelity Series Real Estate Income Fund | 0.3 | 0.3 |
| 10.1 | 10.4 |
Investment Grade Bond Funds | | |
Fidelity Series Investment Grade Bond Fund | 4.6 | 4.5 |
Net Other Assets (Liabilities)* | 0.0 | 0.0 |
| 100.0 | 100.0 |
* Amount represents less than 0.1% |
Asset Allocation (% of fund's net assets) |
Period end |
| Commodity Funds | 9.1% | |
| Domestic Equity Funds | 52.9% | |
| Developed International Equity Funds | 18.1% | |
| Emerging Markets Equity Funds | 5.2% | |
| High Yield Bond Funds | 10.1% | |
| Investment Grade Bond Funds | 4.6% | |

Six months ago |
| Commodity Funds | 9.2% | |
| Domestic Equity Funds | 53.5% | |
| Developed International Equity Funds | 17.5% | |
| Emerging Markets Equity Funds | 4.9% | |
| High Yield Bond Funds | 10.4% | |
| Investment Grade Bond Funds | 4.5% | |

Semiannual Report
Fidelity Advisor Freedom 2045 Fund
Investments September 30, 2013 (Unaudited)
Showing Percentage of Net Assets
Domestic Equity Funds - 62.0% |
| Shares | | Value |
Commodity Funds - 9.1% |
Fidelity Series Commodity Strategy Fund (a)(b) | 11,648,756 | | $ 93,306,537 |
Domestic Equity Funds - 52.9% |
Fidelity Advisor Equity Growth Fund Institutional Class (b) | 953,344 | | 78,441,169 |
Fidelity Advisor Large Cap Fund Institutional Class (b) | 1,472,151 | | 39,600,866 |
Fidelity Advisor Series Equity-Income Fund (b) | 4,328,143 | | 51,028,805 |
Fidelity Advisor Series Growth & Income Fund (b) | 4,229,465 | | 50,965,055 |
Fidelity Advisor Series Opportunistic Insights Fund (b) | 3,002,195 | | 38,668,274 |
Fidelity Advisor Series Stock Selector Large Cap Value Fund (b) | 4,203,437 | | 51,155,833 |
Fidelity Advisor Small Cap Fund Institutional Class (b) | 1,010,918 | | 30,812,785 |
Fidelity Series 100 Index Fund (b) | 1,097,481 | | 12,160,085 |
Fidelity Series All-Sector Equity Fund (b) | 6,905,553 | | 97,782,627 |
Fidelity Series Large Cap Value Fund (b) | 4,174,043 | | 52,718,165 |
Fidelity Series Real Estate Equity Fund (b) | 637,042 | | 7,619,023 |
Fidelity Series Small Cap Opportunities Fund (b) | 2,771,451 | | 35,557,710 |
TOTAL DOMESTIC EQUITY FUNDS | | 546,510,397 |
TOTAL DOMESTIC EQUITY FUNDS (Cost $539,965,154) |
639,816,934
|
International Equity Funds - 23.3% |
| | | |
Developed International Equity Funds - 18.1% |
Fidelity Series International Growth Fund (b) | 6,259,337 | | 84,939,203 |
Fidelity Series International Small Cap Fund (b) | 1,147,232 | | 17,541,171 |
Fidelity Series International Value Fund (b) | 7,900,504 | | 84,930,421 |
TOTAL DEVELOPED INTERNATIONAL EQUITY FUNDS | | 187,410,795 |
|
| Shares | | Value |
Emerging Markets Equity Funds - 5.2% |
Fidelity Series Emerging Markets Fund (b) | 3,185,908 | | $ 53,332,105 |
TOTAL INTERNATIONAL EQUITY FUNDS (Cost $204,322,939) |
240,742,900
|
Bond Funds - 14.7% |
| | | |
High Yield Bond Funds - 10.1% |
Fidelity Series Emerging Markets Debt Fund (b) | 655,571 | | 6,634,379 |
Fidelity Series Floating Rate High Income Fund (b) | 341,886 | | 3,617,154 |
Fidelity Series High Income Fund (b) | 8,865,584 | | 91,138,204 |
Fidelity Series Real Estate Income Fund (b) | 299,009 | | 3,283,121 |
TOTAL HIGH YIELD BOND FUNDS | | 104,672,858 |
Investment Grade Bond Funds - 4.6% |
Fidelity Series Investment Grade Bond Fund (b) | 4,251,131 | | 47,570,159 |
TOTAL BOND FUNDS (Cost $151,284,450) |
152,243,017
|
TOTAL INVESTMENT PORTFOLIO - 100.0% (Cost $895,572,543) | | 1,032,802,851 |
NET OTHER ASSETS (LIABILITIES) - 0.0% | | (180,822) |
NET ASSETS - 100% | $ 1,032,622,029 |
Legend |
(a) Non-income producing |
(b) Affiliated company |
Affiliated Underlying Funds |
Information regarding the Fund's fiscal year to date purchases and sales of the affiliated Underlying Funds and income earned by the Fund from investments in affiliated Underlying Funds is as follows: |
Affiliate | Value,
beginning of
period | Purchases | Sales
Proceeds | Dividend
Income | Value,
end of
period |
Fidelity Advisor Equity Growth Fund Institutional Class | $ 66,669,108 | $ 5,613,290 | $ 4,750,798 | $ - | $ 78,441,169 |
Fidelity Advisor Growth & Income Fund Institutional Class | 35,481,306 | 2,174,951 | 40,817,196 | - | - |
Fidelity Advisor Large Cap Fund Institutional Class | 35,845,261 | 2,663,359 | 3,654,014 | - | 39,600,866 |
Fidelity Advisor Series Equity-Income Fund | 44,779,464 | 5,554,343 | 2,035,160 | 461,226 | 51,028,805 |
Fidelity Advisor Series Growth & Income Fund (formerly Fidelity Advisor Series Mega Cap Fund) | 9,921,685 | 40,414,073 | 829,882 | - | 50,965,055 |
Fidelity Advisor Series Opportunistic Insights Fund | 31,656,678 | 2,959,877 | 1,489,478 | - | 38,668,274 |
Fidelity Advisor Series Stock Selector Large Cap Value Fund | 45,101,687 | 4,146,351 | 2,137,972 | - | 51,155,833 |
Fidelity Advisor Small Cap Fund Institutional Class | 27,435,072 | 2,231,793 | 2,474,680 | - | 30,812,785 |
Fidelity Series 100 Index Fund | 11,099,125 | 928,995 | 697,976 | - | 12,160,085 |
Fidelity Series All-Sector Equity Fund | 88,201,459 | 6,706,219 | 6,247,915 | - | 97,782,627 |
Fidelity Series Commodity Strategy Fund | 83,502,801 | 20,451,247 | 3,795,449 | - | 93,306,537 |
Fidelity Series Emerging Markets Debt Fund | 6,420,091 | 914,163 | 231,734 | 170,150 | 6,634,379 |
Fidelity Series Emerging Markets Fund | 44,075,777 | 10,027,341 | 1,060,122 | - | 53,332,105 |
Fidelity Series Floating Rate High Income Fund | 2,952,479 | 800,310 | 121,227 | 71,356 | 3,617,154 |
Fidelity Series High Income Fund | 82,180,603 | 14,046,811 | 3,131,467 | 2,283,424 | 91,138,204 |
Fidelity Series International Growth Fund | 72,337,325 | 9,465,313 | 2,516,561 | - | 84,939,203 |
Fidelity Series International Small Cap Fund | 14,681,753 | 1,603,364 | 503,168 | - | 17,541,171 |
Fidelity Series International Value Fund | 71,628,283 | 8,261,755 | 2,069,004 | - | 84,930,421 |
Fidelity Series Investment Grade Bond Fund | 40,856,148 | 10,992,748 | 2,960,084 | 463,560 | 47,570,159 |
Fidelity Series Large Cap Value Fund | 50,091,676 | 3,677,020 | 5,357,642 | - | 52,718,165 |
Fidelity Series Real Estate Equity Fund | 7,335,896 | 1,152,193 | 237,053 | 50,068 | 7,619,023 |
Fidelity Series Real Estate Income Fund | 3,123,821 | 461,577 | 108,653 | 94,513 | 3,283,121 |
Fidelity Series Small Cap Opportunities Fund | 32,003,872 | 5,163,418 | 3,028,465 | - | 35,557,710 |
Total | $ 907,381,370 | $ 160,410,511 | $ 90,255,700 | $ 3,594,297 | $ 1,032,802,851 |
Other Information |
All investments are categorized as Level 1 under the Fair Value Hierarchy. The inputs or methodology used for valuing securities may not be an indication of the risk associated with investing in those securities. For more information on valuation inputs, please refer to the Investment Valuation section in the accompanying Notes to Financial Statements. |
See accompanying notes which are an integral part of the financial statements.
Semiannual Report
Fidelity Advisor Freedom 2045 Fund
Statement of Assets and Liabilities
| September 30, 2013 (Unaudited) |
| | |
Assets | | |
Investment in securities, at value (cost $895,572,543) - See accompanying schedule | | $ 1,032,802,851 |
Cash | | 4 |
Receivable for investments sold | | 1,450,836 |
Receivable for fund shares sold | | 1,454,998 |
Receivable from investment adviser for expense reductions | | 604 |
Total assets | | 1,035,709,293 |
| | |
Liabilities | | |
Payable for investments purchased | $ 28,968 | |
Payable for fund shares redeemed | 2,876,854 | |
Distribution and service plan fees payable | 181,442 | |
Total liabilities | | 3,087,264 |
| | |
Net Assets | | $ 1,032,622,029 |
Net Assets consist of: | | |
Paid in capital | | $ 877,618,186 |
Undistributed net investment income | | 2,535,806 |
Accumulated undistributed net realized gain (loss) on investments | | 15,237,729 |
Net unrealized appreciation (depreciation) on investments | | 137,230,308 |
Net Assets | | $ 1,032,622,029 |
| | |
Calculation of Maximum Offering Price Class A:
Net Asset Value and redemption price per share ($574,247,447 ÷ 52,703,087 shares) | | $ 10.90 |
| | |
Maximum offering price per share (100/94.25 of $10.90) | | $ 11.56 |
Class T:
Net Asset Value and redemption price per share ($112,222,455 ÷ 10,349,062 shares) | | $ 10.84 |
| | |
Maximum offering price per share (100/96.50 of $10.84) | | $ 11.23 |
Class B:
Net Asset Value and offering price per share ($3,561,500 ÷ 329,673 shares)A | | $ 10.80 |
| | |
Class C:
Net Asset Value and offering price per share ($15,907,361 ÷ 1,477,519 shares)A | | $ 10.77 |
| | |
Institutional Class:
Net Asset Value, offering price and redemption price per share ($326,683,266 ÷ 29,831,382 shares) | | $ 10.95 |
A Redemption price per share is equal to net asset value less any applicable contingent deferred sales charge.
Statement of Operations
Six months ended September 30, 2013 (Unaudited) |
| | |
Investment Income | | |
Income distributions from underlying funds | | $ 3,594,297 |
| | |
Expenses | | |
Distribution and service plan fees | $ 1,045,865 | |
Independent trustees' compensation | 1,776 | |
Total expenses before reductions | 1,047,641 | |
Expense reductions | (1,776) | 1,045,865 |
Net investment income (loss) | | 2,548,432 |
Realized and Unrealized Gain (Loss) Realized gain (loss) on sale of underlying fund shares | 14,690,446 | |
Capital gain distributions from underlying funds | 2,965,966 | |
Total net realized gain (loss) | | 17,656,412 |
Change in net unrealized appreciation (depreciation) on underlying funds | | 40,576,206 |
Net gain (loss) | | 58,232,618 |
Net increase (decrease) in net assets resulting from operations | | $ 60,781,050 |
See accompanying notes which are an integral part of the financial statements.
Semiannual Report
Fidelity Advisor Freedom 2045 Fund
Financial Statements - continued
Statement of Changes in Net Assets
| Six months ended
September 30, 2013
(Unaudited) | Year ended
March 31,
2013 |
Increase (Decrease) in Net Assets | | |
Operations | | |
Net investment income (loss) | $ 2,548,432 | $ 12,046,883 |
Net realized gain (loss) | 17,656,412 | 21,385,492 |
Change in net unrealized appreciation (depreciation) | 40,576,206 | 48,075,115 |
Net increase (decrease) in net assets resulting from operations | 60,781,050 | 81,507,490 |
Distributions to shareholders from net investment income | (979,049) | (11,684,331) |
Distributions to shareholders from net realized gain | (19,046,918) | (10,873,978) |
Total distributions | (20,025,967) | (22,558,309) |
Share transactions - net increase (decrease) | 84,644,823 | 205,501,582 |
Total increase (decrease) in net assets | 125,399,906 | 264,450,763 |
| | |
Net Assets | | |
Beginning of period | 907,222,123 | 642,771,360 |
End of period (including undistributed net investment income of $2,535,806 and undistributed net investment income of $966,423, respectively) | $ 1,032,622,029 | $ 907,222,123 |
Financial Highlights - Class A
| Six months ended
September 30, 2013 | Years ended March 31, |
| (Unaudited) | 2013 | 2012 | 2011 | 2010 | 2009 |
Selected Per-Share Data | | | | | | |
Net asset value, beginning of period | $ 10.46 | $ 9.79 | $ 10.08 | $ 8.82 | $ 5.86 | $ 10.39 |
Income from Investment Operations | | | | | | |
Net investment income (loss) E | .03 | .16 | .13 | .12 | .12 | .16 |
Net realized and unrealized gain (loss) | .63 | .81 | (.14) | 1.33 | 3.02 | (4.29) |
Total from investment operations | .66 | .97 | (.01) | 1.45 | 3.14 | (4.13) |
Distributions from net investment income | (.01) | (.15) | (.12) | (.11) | (.11) | (.14) |
Distributions from net realized gain | (.21) | (.15) | (.16) | (.08) | (.07) | (.26) |
Total distributions | (.22) | (.30) | (.28) | (.19) | (.18) | (.40) |
Net asset value, end of period | $ 10.90 | $ 10.46 | $ 9.79 | $ 10.08 | $ 8.82 | $ 5.86 |
Total Return B, C, D | 6.41% | 10.21% | .12% | 16.67% | 53.81% | (40.93)% |
Ratios to Average Net Assets F, G | | | | | | |
Expenses before reductions | .25% A | .25% | .25% | .25% | .25% | .25% |
Expenses net of fee waivers, if any | .25% A | .25% | .25% | .25% | .25% | .25% |
Expenses net of all reductions | .25% A | .25% | .25% | .25% | .25% | .25% |
Net investment income (loss) | .49% A | 1.59% | 1.41% | 1.35% | 1.53% | 2.12% |
Supplemental Data | | | | | | |
Net assets, end of period (000 omitted) | $ 574,247 | $ 527,525 | $ 403,850 | $ 320,731 | $ 205,405 | $ 81,985 |
Portfolio turnover rate F | 19% A | 25% | 11% | 32% | 14% | 18% |
A Annualized
B Total returns for periods of less than one year are not annualized.
C Total returns would have been lower if certain expenses had not been reduced during the applicable periods shown.
D Total returns do not include the effect of the sales charges.
E Calculated based on average shares outstanding during the period.
F Amounts do not include the activity of the Underlying Funds.
G Expense ratios reflect operating expenses of the class. Expenses before reductions do not reflect amounts reimbursed by the investment adviser or reductions from expense offset arrangements and do not represent the amount paid by the class during periods when reimbursements or reductions occur. Expenses net of fee waivers reflect expenses after reimbursement by the investment adviser but prior to reductions from expense offset arrangements. Expenses net of all reductions represent the net expenses paid by the class but do not include expenses of the investment companies in which the Fund invests.
See accompanying notes which are an integral part of the financial statements.
Semiannual Report
Financial Highlights - Class T
| Six months ended
September 30, 2013 | Years ended March 31, |
| (Unaudited) | 2013 | 2012 | 2011 | 2010 | 2009 |
Selected Per-Share Data | | | | | | |
Net asset value, beginning of period | $ 10.42 | $ 9.75 | $ 10.04 | $ 8.79 | $ 5.84 | $ 10.36 |
Income from Investment Operations | | | | | | |
Net investment income (loss) E | .01 | .13 | .11 | .10 | .10 | .14 |
Net realized and unrealized gain (loss) | .63 | .82 | (.15) | 1.32 | 3.02 | (4.28) |
Total from investment operations | .64 | .95 | (.04) | 1.42 | 3.12 | (4.14) |
Distributions from net investment income | - K | (.12) | (.10) | (.09) | (.10) | (.12) |
Distributions from net realized gain | (.21) | (.15) | (.16) | (.08) | (.07) | (.26) |
Total distributions | (.22) J | (.28) I | (.25) H | (.17) | (.17) | (.38) |
Net asset value, end of period | $ 10.84 | $ 10.42 | $ 9.75 | $ 10.04 | $ 8.79 | $ 5.84 |
Total Return B, C, D | 6.18% | 10.02% | (.15)% | 16.36% | 53.52% | (41.08)% |
Ratios to Average Net Assets F, G | | | | | | |
Expenses before reductions | .50% A | .50% | .50% | .50% | .50% | .50% |
Expenses net of fee waivers, if any | .50% A | .50% | .50% | .50% | .50% | .50% |
Expenses net of all reductions | .50% A | .50% | .50% | .50% | .50% | .50% |
Net investment income (loss) | .24% A | 1.34% | 1.16% | 1.10% | 1.28% | 1.87% |
Supplemental Data | | | | | | |
Net assets, end of period (000 omitted) | $ 112,222 | $ 92,998 | $ 62,438 | $ 60,268 | $ 43,326 | $ 18,065 |
Portfolio turnover rate F | 19% A | 25% | 11% | 32% | 14% | 18% |
A Annualized
B Total returns for periods of less than one year are not annualized.
C Total returns would have been lower if certain expenses had not been reduced during the applicable periods shown.
D Total returns do not include the effect of the sales charges.
E Calculated based on average shares outstanding during the period.
F Amounts do not include the activity of the Underlying Funds.
G Expense ratios reflect operating expenses of the class. Expenses before reductions do not reflect amounts reimbursed by the investment adviser or reductions from expense offset arrangements and do not represent the amount paid by the class during periods when reimbursements or reductions occur. Expenses net of fee waivers reflect expenses after reimbursement by the investment adviser but prior to reductions from expense offset arrangements. Expenses net of all reductions represent the net expenses paid by the class but do not include expenses of the investment companies in which the Fund invests.
H Total distributions of $.25 per share is comprised of distributions from net investment income of $.096 and distributions from net realized gain of $.155 per share.
I Total distributions of $.28 per share is comprised of distributions from net investment income of $.124 and distributions from net realized gain of $.153 per share.
J Total distributions of $.22 per share is comprised of distributions from net investment income of $.004 and distributions from net realized gain of $.213 per share.
K Amount represents less than $.01 per share.
Financial Highlights - Class B
| Six months ended
September 30, 2013 | Years ended March 31, |
| (Unaudited) | 2013 | 2012 | 2011 | 2010 | 2009 |
Selected Per-Share Data | | | | | | |
Net asset value, beginning of period | $ 10.39 | $ 9.73 | $ 10.01 | $ 8.77 | $ 5.83 | $ 10.33 |
Income from Investment Operations | | | | | | |
Net investment income (loss) E | (.01) | .08 | .06 | .05 | .06 | .11 |
Net realized and unrealized gain (loss) | .63 | .81 | (.14) | 1.32 | 3.01 | (4.27) |
Total from investment operations | .62 | .89 | (.08) | 1.37 | 3.07 | (4.16) |
Distributions from net investment income | - | (.08) | (.05) | (.05) | (.06) | (.08) |
Distributions from net realized gain | (.21) | (.15) | (.15) | (.08) | (.07) | (.26) |
Total distributions | (.21) | (.23) | (.20) | (.13) | (.13) | (.34) |
Net asset value, end of period | $ 10.80 | $ 10.39 | $ 9.73 | $ 10.01 | $ 8.77 | $ 5.83 |
Total Return B, C, D | 6.00% | 9.40% | (.62)% | 15.71% | 52.74% | (41.39)% |
Ratios to Average Net Assets F, G | | | | | | |
Expenses before reductions | 1.00% A | 1.00% | 1.00% | 1.00% | 1.00% | 1.00% |
Expenses net of fee waivers, if any | 1.00% A | 1.00% | 1.00% | 1.00% | 1.00% | 1.00% |
Expenses net of all reductions | 1.00% A | 1.00% | 1.00% | 1.00% | 1.00% | 1.00% |
Net investment income (loss) | (.26)% A | .84% | .66% | .60% | .78% | 1.37% |
Supplemental Data | | | | | | |
Net assets, end of period (000 omitted) | $ 3,562 | $ 3,651 | $ 3,786 | $ 4,612 | $ 4,089 | $ 2,231 |
Portfolio turnover rate F | 19% A | 25% | 11% | 32% | 14% | 18% |
A Annualized
B Total returns for periods of less than one year are not annualized.
C Total returns would have been lower if certain expenses had not been reduced during the applicable periods shown.
D Total returns do not include the effect of the contingent deferred sales charge.
E Calculated based on average shares outstanding during the period.
F Amounts do not include the activity of the Underlying Funds.
G Expense ratios reflect operating expenses of the class. Expenses before reductions do not reflect amounts reimbursed by the investment adviser or reductions from expense offset arrangements and do not represent the amount paid by the class during periods when reimbursements or reductions occur. Expenses net of fee waivers reflect expenses after reimbursement by the investment adviser but prior to reductions from expense offset arrangements. Expenses net of all reductions represent the net expenses paid by the class but do not include expenses of the investment companies in which the Fund invests.
See accompanying notes which are an integral part of the financial statements.
Semiannual Report
Financial Highlights - Class C
| Six months ended
September 30, 2013 | Years ended March 31, |
| (Unaudited) | 2013 | 2012 | 2011 | 2010 | 2009 |
Selected Per-Share Data | | | | | | |
Net asset value, beginning of period | $ 10.36 | $ 9.71 | $ 10.00 | $ 8.76 | $ 5.82 | $ 10.32 |
Income from Investment Operations | | | | | | |
Net investment income (loss) E | (.01) | .08 | .06 | .05 | .06 | .11 |
Net realized and unrealized gain (loss) | .63 | .81 | (.14) | 1.32 | 3.01 | (4.27) |
Total from investment operations | .62 | .89 | (.08) | 1.37 | 3.07 | (4.16) |
Distributions from net investment income | - | (.09) | (.06) | (.06) | (.06) | (.08) |
Distributions from net realized gain | (.21) | (.15) | (.15) | (.08) | (.07) | (.26) |
Total distributions | (.21) | (.24) | (.21) | (.13) H | (.13) | (.34) |
Net asset value, end of period | $ 10.77 | $ 10.36 | $ 9.71 | $ 10.00 | $ 8.76 | $ 5.82 |
Total Return B, C, D | 6.01% | 9.42% | (.62)% | 15.80% | 52.90% | (41.39)% |
Ratios to Average Net Assets F, G | | | | | | |
Expenses before reductions | 1.00% A | 1.00% | 1.00% | 1.00% | 1.00% | 1.00% |
Expenses net of fee waivers, if any | 1.00% A | 1.00% | 1.00% | 1.00% | 1.00% | 1.00% |
Expenses net of all reductions | 1.00% A | 1.00% | 1.00% | 1.00% | 1.00% | 1.00% |
Net investment income (loss) | (.26)% A | .84% | .66% | .60% | .78% | 1.37% |
Supplemental Data | | | | | | |
Net assets, end of period (000 omitted) | $ 15,907 | $ 13,415 | $ 9,926 | $ 8,753 | $ 6,199 | $ 3,027 |
Portfolio turnover rate F | 19% A | 25% | 11% | 32% | 14% | 18% |
A Annualized
B Total returns for periods of less than one year are not annualized.
C Total returns would have been lower if certain expenses had not been reduced during the applicable periods shown.
D Total returns do not include the effect of the contingent deferred sales charge.
E Calculated based on average shares outstanding during the period.
F Amounts do not include the activity of the Underlying Funds.
G Expense ratios reflect operating expenses of the class. Expenses before reductions do not reflect amounts reimbursed by the investment adviser or reductions from expense offset arrangements and do not represent the amount paid by the class during periods when reimbursements or reductions occur. Expenses net of fee waivers reflect expenses after reimbursement by the investment adviser but prior to reductions from expense offset arrangements. Expenses net of all reductions represent the net expenses paid by the class but do not include expenses of the investment companies in which the Fund invests.
H Total distributions of $.13 per share is comprised of distributions from net investment income of $.057 and distributions from net realized gain of $.076 per share.
Financial Highlights - Institutional Class
| Six months ended
September 30, 2013 | Years ended March 31, |
| (Unaudited) | 2013 | 2012 | 2011 | 2010 | 2009 |
Selected Per-Share Data | | | | | | |
Net asset value, beginning of period | $ 10.50 | $ 9.83 | $ 10.11 | $ 8.85 | $ 5.87 | $ 10.41 |
Income from Investment Operations | | | | | | |
Net investment income (loss) D | .04 | .18 | .16 | .15 | .14 | .18 |
Net realized and unrealized gain (loss) | .64 | .81 | (.14) | 1.32 | 3.04 | (4.30) |
Total from investment operations | .68 | .99 | .02 | 1.47 | 3.18 | (4.12) |
Distributions from net investment income | (.02) | (.17) | (.14) | (.13) | (.13) | (.16) |
Distributions from net realized gain | (.21) | (.15) | (.16) | (.08) | (.07) | (.26) |
Total distributions | (.23) | (.32) | (.30) | (.21) | (.20) | (.42) |
Net asset value, end of period | $ 10.95 | $ 10.50 | $ 9.83 | $ 10.11 | $ 8.85 | $ 5.87 |
Total Return B, C | 6.54% | 10.43% | .45% | 16.86% | 54.35% | (40.81)% |
Ratios to Average Net Assets E, G | | | | | | |
Expenses before reductions F | .00% A | .00% | .00% | .00% | .00% | .00% |
Expenses net of fee waivers, if any | .00% A | .00% | .00% | .00% | .00% | .00% |
Expenses net of all reductions | .00% A | .00% | .00% | .00% | .00% | .00% |
Net investment income (loss) | .74% A | 1.84% | 1.66% | 1.60% | 1.78% | 2.37% |
Supplemental Data | | | | | | |
Net assets, end of period (000 omitted) | $ 326,683 | $ 269,633 | $ 162,772 | $ 83,240 | $ 32,842 | $ 12,078 |
Portfolio turnover rate E | 19% A | 25% | 11% | 32% | 14% | 18% |
A Annualized
B Total returns for periods of less than one year are not annualized.
C Total returns would have been lower if certain expenses had not been reduced during the applicable periods shown.
D Calculated based on average shares outstanding during the period.
E Amounts do not include the activity of the Underlying Funds.
F Amount represents less than .01%.
G Expense ratios reflect operating expenses of the class. Expenses before reductions do not reflect amounts reimbursed by the investment adviser or reductions from expense offset arrangements and do not represent the amount paid by the class during periods when reimbursements or reductions occur. Expenses net of fee waivers reflect expenses after reimbursement by the investment adviser but prior to reductions from expense offset arrangements. Expenses net of all reductions represent the net expenses paid by the class but do not include expenses of the investment companies in which the Fund invests.
See accompanying notes which are an integral part of the financial statements.
Semiannual Report
Fidelity Advisor Freedom 2050 Fund
Investment Changes (Unaudited)
The information in the following tables is based on the direct investments of the Fund. |
Fund Holdings as of September 30, 2013 |
| % of fund's net assets | % of fund's net assets
6 months ago |
Commodity Funds | | |
Fidelity Series Commodity Strategy Fund | 9.0 | 9.3 |
Domestic Equity Funds | | |
Fidelity Advisor Equity Growth Fund Institutional Class | 7.6 | 7.4 |
Fidelity Advisor Growth & Income Fund Institutional Class | 0.0 | 4.0 |
Fidelity Advisor Large Cap Fund Institutional Class | 3.8 | 4.0 |
Fidelity Advisor Series Equity-Income Fund | 5.1 | 5.1 |
Fidelity Advisor Series Growth & Income Fund (formerly Fidelity Advisor Series Mega Cap Fund) | 5.0 | 1.1 |
Fidelity Advisor Series Opportunistic Insights Fund | 3.9 | 3.6 |
Fidelity Advisor Series Stock Selector Large Cap Value Fund | 5.1 | 5.1 |
Fidelity Advisor Small Cap Fund Institutional Class | 3.0 | 3.0 |
Fidelity Series 100 Index Fund | 1.2 | 1.2 |
Fidelity Series All-Sector Equity Fund | 9.5 | 9.8 |
Fidelity Series Large Cap Value Fund | 5.1 | 5.6 |
Fidelity Series Real Estate Equity Fund | 0.7 | 0.8 |
Fidelity Series Small Cap Opportunities Fund | 3.4 | 3.5 |
| 53.4 | 54.2 |
Developed International Equity Funds | | |
Fidelity Series International Growth Fund | 8.3 | 8.1 |
Fidelity Series International Small Cap Fund | 1.7 | 1.7 |
Fidelity Series International Value Fund | 8.2 | 8.0 |
| 18.2 | 17.8 |
Emerging Markets Equity Funds | | |
Fidelity Series Emerging Markets Fund | 5.3 | 4.9 |
High Yield Bond Funds | | |
Fidelity Series Emerging Markets Debt Fund | 0.7 | 0.7 |
Fidelity Series Floating Rate High Income Fund | 0.1 | 0.1 |
Fidelity Series High Income Fund | 9.1 | 9.2 |
Fidelity Series Real Estate Income Fund | 0.3 | 0.3 |
| 10.2 | 10.3 |
Investment Grade Bond Funds | | |
Fidelity Series Investment Grade Bond Fund | 3.9 | 3.5 |
Net Other Assets (Liabilities)* | 0.0 | 0.0 |
| 100.0 | 100.0 |
* Amount represents less than 0.1% |
Asset Allocation (% of fund's net assets) |
Period end |
| Commodity Funds | 9.0% | |
| Domestic Equity Funds | 53.4% | |
| Developed International Equity Funds | 18.2% | |
| Emerging Markets Equity Funds | 5.3% | |
| High Yield Bond Funds | 10.2% | |
| Investment Grade Bond Funds | 3.9% | |

Six months ago |
| Commodity Funds | 9.3% | |
| Domestic Equity Funds | 54.2% | |
| Developed International Equity Funds | 17.8% | |
| Emerging Markets Equity Funds | 4.9% | |
| High Yield Bond Funds | 10.3% | |
| Investment Grade Bond Funds | 3.5% | |

Semiannual Report
Fidelity Advisor Freedom 2050 Fund
Investments September 30, 2013 (Unaudited)
Showing Percentage of Net Assets
Domestic Equity Funds - 62.4% |
| Shares | | Value |
Commodity Funds - 9.0% |
Fidelity Series Commodity Strategy Fund (a)(b) | 8,565,639 | | $ 68,610,767 |
Domestic Equity Funds - 53.4% |
Fidelity Advisor Equity Growth Fund Institutional Class (b) | 704,095 | | 57,932,930 |
Fidelity Advisor Large Cap Fund Institutional Class (b) | 1,075,459 | | 28,929,854 |
Fidelity Advisor Series Equity-Income Fund (b) | 3,305,116 | | 38,967,319 |
Fidelity Advisor Series Growth & Income Fund (b) | 3,146,681 | | 37,917,506 |
Fidelity Advisor Series Opportunistic Insights Fund (b) | 2,275,673 | | 29,310,670 |
Fidelity Advisor Series Stock Selector Large Cap Value Fund (b) | 3,175,200 | | 38,642,185 |
Fidelity Advisor Small Cap Fund Institutional Class (b) | 742,422 | | 22,629,030 |
Fidelity Series 100 Index Fund (b) | 810,405 | | 8,979,291 |
Fidelity Series All-Sector Equity Fund (b) | 5,087,436 | | 72,038,096 |
Fidelity Series Large Cap Value Fund (b) | 3,056,166 | | 38,599,373 |
Fidelity Series Real Estate Equity Fund (b) | 472,384 | | 5,649,710 |
Fidelity Series Small Cap Opportunities Fund (b) | 2,038,913 | | 26,159,257 |
TOTAL DOMESTIC EQUITY FUNDS | | 405,755,221 |
TOTAL DOMESTIC EQUITY FUNDS (Cost $398,242,218) |
474,365,988
|
International Equity Funds - 23.5% |
| | | |
Developed International Equity Funds - 18.2% |
Fidelity Series International Growth Fund (b) | 4,631,545 | | 62,850,066 |
Fidelity Series International Small Cap Fund (b) | 850,255 | | 13,000,404 |
Fidelity Series International Value Fund (b) | 5,838,814 | | 62,767,252 |
TOTAL DEVELOPED INTERNATIONAL EQUITY FUNDS | | 138,617,722 |
|
| Shares | | Value |
Emerging Markets Equity Funds - 5.3% |
Fidelity Series Emerging Markets Fund (b) | 2,380,519 | | $ 39,849,882 |
TOTAL INTERNATIONAL EQUITY FUNDS (Cost $150,662,106) |
178,467,604
|
Bond Funds - 14.1% |
| | | |
High Yield Bond Funds - 10.2% |
Fidelity Series Emerging Markets Debt Fund (b) | 500,664 | | 5,066,720 |
Fidelity Series Floating Rate High Income Fund (b) | 69,265 | | 732,820 |
Fidelity Series High Income Fund (b) | 6,769,229 | | 69,587,672 |
Fidelity Series Real Estate Income Fund (b) | 200,972 | | 2,206,673 |
TOTAL HIGH YIELD BOND FUNDS | | 77,593,885 |
Investment Grade Bond Funds - 3.9% |
Fidelity Series Investment Grade Bond Fund (b) | 2,640,893 | | 29,551,592 |
TOTAL BOND FUNDS (Cost $106,791,251) |
107,145,477
|
TOTAL INVESTMENT PORTFOLIO - 100.0% (Cost $655,695,575) | | 759,979,069 |
NET OTHER ASSETS (LIABILITIES) - 0.0% | | (142,913) |
NET ASSETS - 100% | $ 759,836,156 |
Legend |
(a) Non-income producing |
(b) Affiliated company |
Affiliated Underlying Funds |
Information regarding the Fund's fiscal year to date purchases and sales of the affiliated Underlying Funds and income earned by the Fund from investments in affiliated Underlying Funds is as follows: |
Affiliate | Value,
beginning of
period | Purchases | Sales
Proceeds | Dividend
Income | Value,
end of
period |
Fidelity Advisor Equity Growth Fund Institutional Class | $ 49,195,874 | $ 4,155,739 | $ 3,484,610 | $ - | $ 57,932,930 |
Fidelity Advisor Growth & Income Fund Institutional Class | 26,225,977 | 1,639,698 | 30,192,915 | - | - |
Fidelity Advisor Large Cap Fund Institutional Class | 26,484,651 | 1,906,510 | 2,947,481 | - | 28,929,854 |
Fidelity Advisor Series Equity-Income Fund | 33,840,493 | 4,339,203 | 1,282,723 | 349,660 | 38,967,319 |
Fidelity Advisor Series Growth & Income Fund (formerly Fidelity Advisor Series Mega Cap Fund) | 7,498,583 | 29,891,403 | 571,381 | - | 37,917,506 |
Fidelity Advisor Series Opportunistic Insights Fund | 23,924,742 | 2,215,362 | 1,041,215 | - | 29,310,670 |
Fidelity Advisor Series Stock Selector Large Cap Value Fund | 34,081,404 | 3,033,126 | 1,533,909 | - | 38,642,185 |
Fidelity Advisor Small Cap Fund Institutional Class | 20,231,800 | 1,649,079 | 1,912,481 | - | 22,629,030 |
Fidelity Series 100 Index Fund | 8,202,815 | 687,319 | 523,734 | - | 8,979,291 |
Fidelity Series All-Sector Equity Fund | 65,230,846 | 4,805,345 | 4,740,540 | - | 72,038,096 |
Fidelity Series Commodity Strategy Fund | 62,055,569 | 14,188,498 | 2,566,818 | - | 68,610,767 |
Fidelity Series Emerging Markets Debt Fund | 4,719,827 | 864,261 | 155,262 | 128,999 | 5,066,720 |
Fidelity Series Emerging Markets Fund | 32,667,017 | 7,618,893 | 700,047 | - | 39,849,882 |
Fidelity Series Floating Rate High Income Fund | 496,860 | 268,215 | 27,934 | 13,982 | 732,820 |
Fidelity Series High Income Fund | 61,428,717 | 11,373,878 | 1,751,118 | 1,720,206 | 69,587,672 |
Fidelity Series International Growth Fund | 53,789,744 | 6,662,779 | 1,808,390 | - | 62,850,066 |
Fidelity Series International Small Cap Fund | 10,942,294 | 1,111,229 | 361,842 | - | 13,000,404 |
Fidelity Series International Value Fund | 53,369,497 | 5,663,459 | 1,547,868 | - | 62,767,252 |
Fidelity Series Investment Grade Bond Fund | 23,478,771 | 8,777,263 | 1,891,434 | 283,735 | 29,551,592 |
Fidelity Series Large Cap Value Fund | 37,173,024 | 2,631,191 | 4,379,226 | - | 38,599,373 |
Fidelity Series Real Estate Equity Fund | 5,424,779 | 825,337 | 128,725 | 37,168 | 5,649,710 |
Fidelity Series Real Estate Income Fund | 2,040,650 | 363,389 | 65,125 | 63,865 | 2,206,673 |
Fidelity Series Small Cap Opportunities Fund | 23,559,633 | 3,801,015 | 2,237,250 | - | 26,159,257 |
Total | $ 666,063,567 | $ 118,472,191 | $ 65,852,028 | $ 2,597,615 | $ 759,979,069 |
Other Information |
All investments are categorized as Level 1 under the Fair Value Hierarchy. The inputs or methodology used for valuing securities may not be an indication of the risk associated with investing in those securities. For more information on valuation inputs, please refer to the Investment Valuation section in the accompanying Notes to Financial Statements. |
See accompanying notes which are an integral part of the financial statements.
Semiannual Report
Fidelity Advisor Freedom 2050 Fund
Statement of Assets and Liabilities
| September 30, 2013 (Unaudited) |
| | |
Assets | | |
Investment in securities, at value (cost $655,695,575) - See accompanying schedule | | $ 759,979,069 |
Receivable for investments sold | | 2,587,538 |
Receivable for fund shares sold | | 1,315,242 |
Receivable from investment adviser for expense reductions | | 503 |
Total assets | | 763,882,352 |
| | |
Liabilities | | |
Payable to custodian bank | $ 2 | |
Payable for investments purchased | 17,989 | |
Payable for fund shares redeemed | 3,884,772 | |
Distribution and service plan fees payable | 143,433 | |
Total liabilities | | 4,046,196 |
| | |
Net Assets | | $ 759,836,156 |
Net Assets consist of: | | |
Paid in capital | | $ 642,526,232 |
Undistributed net investment income | | 1,783,950 |
Accumulated undistributed net realized gain (loss) on investments | | 11,242,480 |
Net unrealized appreciation (depreciation) on investments | | 104,283,494 |
Net Assets | | $ 759,836,156 |
| | |
Calculation of Maximum Offering Price Class A:
Net Asset Value and redemption price per share ($387,127,807 ÷ 35,733,530 shares) | | $ 10.83 |
| | |
Maximum offering price per share (100/94.25 of $10.83) | | $ 11.49 |
Class T:
Net Asset Value and redemption price per share ($103,263,695 ÷ 9,568,027 shares) | | $ 10.79 |
| | |
Maximum offering price per share (100/96.50 of $10.79) | | $ 11.18 |
Class B:
Net Asset Value and offering price per share ($5,385,668 ÷ 502,150 shares)A | | $ 10.73 |
| | |
Class C:
Net Asset Value and offering price per share ($18,756,231 ÷ 1,749,164 shares)A | | $ 10.72 |
| | |
Institutional Class:
Net Asset Value, offering price and redemption price per share ($245,302,755 ÷ 22,519,174 shares) | | $ 10.89 |
A Redemption price per share is equal to net asset value less any applicable contingent deferred sales charge.
Statement of Operations
Six months ended September 30, 2013 (Unaudited) |
| | |
Investment Income | | |
Income distributions from underlying funds | | $ 2,597,615 |
| | |
Expenses | | |
Distribution and service plan fees | $ 824,986 | |
Independent trustees' compensation | 1,304 | |
Total expenses before reductions | 826,290 | |
Expense reductions | (1,304) | 824,986 |
Net investment income (loss) | | 1,772,629 |
Realized and Unrealized Gain (Loss) Realized gain (loss) on sale of underlying fund shares | 11,235,706 | |
Capital gain distributions from underlying funds | 2,191,560 | |
Total net realized gain (loss) | | 13,427,266 |
Change in net unrealized appreciation (depreciation) on underlying funds | | 30,059,655 |
Net gain (loss) | | 43,486,921 |
Net increase (decrease) in net assets resulting from operations | | $ 45,259,550 |
See accompanying notes which are an integral part of the financial statements.
Semiannual Report
Fidelity Advisor Freedom 2050 Fund
Financial Statements - continued
Statement of Changes in Net Assets
| Six months ended
September 30, 2013
(Unaudited) | Year ended
March 31,
2013 |
Increase (Decrease) in Net Assets | | |
Operations | | |
Net investment income (loss) | $ 1,772,629 | $ 8,705,827 |
Net realized gain (loss) | 13,427,266 | 15,586,075 |
Change in net unrealized appreciation (depreciation) | 30,059,655 | 35,894,143 |
Net increase (decrease) in net assets resulting from operations | 45,259,550 | 60,186,045 |
Distributions to shareholders from net investment income | (646,292) | (8,370,984) |
Distributions to shareholders from net realized gain | (14,050,089) | (2,615,729) |
Total distributions | (14,696,381) | (10,986,713) |
Share transactions - net increase (decrease) | 63,335,238 | 126,263,908 |
Total increase (decrease) in net assets | 93,898,407 | 175,463,240 |
| | |
Net Assets | | |
Beginning of period | 665,937,749 | 490,474,509 |
End of period (including undistributed net investment income of $1,783,950 and undistributed net investment income of $657,613, respectively) | $ 759,836,156 | $ 665,937,749 |
Financial Highlights - Class A
| Six months ended September 30, 2013 | Years ended March 31, |
| (Unaudited) | 2013 | 2012 | 2011 | 2010 | 2009 |
Selected Per-Share Data | | | | | | |
Net asset value, beginning of period | $ 10.39 | $ 9.61 | $ 9.93 | $ 8.66 | $ 5.67 | $ 10.32 |
Income from Investment Operations | | | | | | |
Net investment income (loss) E | .03 | .15 | .12 | .11 | .11 | .16 |
Net realized and unrealized gain (loss) | .63 | .82 | (.17) | 1.34 | 3.05 | (4.39) |
Total from investment operations | .66 | .97 | (.05) | 1.45 | 3.16 | (4.23) |
Distributions from net investment income | (.01) | (.14) | (.11) | (.11) | (.10) | (.13) |
Distributions from net realized gain | (.21) | (.05) | (.16) | (.08) | (.07) | (.30) |
Total distributions | (.22) | (.19) | (.27) | (.18) I | (.17) | (.42) H |
Net asset value, end of period | $ 10.83 | $ 10.39 | $ 9.61 | $ 9.93 | $ 8.66 | $ 5.67 |
Total Return B, C, D | 6.45% | 10.23% | (.22)% | 16.99% | 55.94% | (42.30)% |
Ratios to Average Net Assets F, G | | | | | | |
Expenses before reductions | .25% A | .25% | .25% | .25% | .25% | .25% |
Expenses net of fee waivers, if any | .25% A | .25% | .25% | .25% | .25% | .25% |
Expenses net of all reductions | .25% A | .25% | .25% | .25% | .25% | .25% |
Net investment income (loss) | .48% A | 1.56% | 1.32% | 1.23% | 1.43% | 2.04% |
Supplemental Data | | | | | | |
Net assets, end of period (000 omitted) | $ 387,128 | $ 352,814 | $ 280,478 | $ 220,549 | $ 137,716 | $ 57,591 |
Portfolio turnover rate F | 18% A | 28% | 12% | 36% | 15% | 16% |
A Annualized
B Total returns for periods of less than one year are not annualized.
C Total returns would have been lower if certain expenses had not been reduced during the applicable periods shown.
D Total returns do not include the effect of the sales charges.
E Calculated based on average shares outstanding during the period.
F Amounts do not include the activity of the Underlying Funds.
G Expense ratios reflect operating expenses of the class. Expenses before reductions do not reflect amounts reimbursed by the investment adviser or reductions from expense offset arrangements and do not represent the amount paid by the class during periods when reimbursements or reductions occur. Expenses net of fee waivers reflect expenses after reimbursement by the investment adviser but prior to reductions from expense offset arrangements. Expenses net of all reductions represent the net expenses paid by the class but do not include expenses of the investment companies in which the Fund invests.
H Total distributions of $.42 per share is comprised of distributions from net investment income of $.127 and distributions from net realized gain of $.295 per share.
I Total distributions of $.18 per share is comprised of distributions from net investment income of $.105 and distributions from net realized gain of $.079 per share.
See accompanying notes which are an integral part of the financial statements.
Semiannual Report
Financial Highlights - Class T
| Six months ended September 30, 2013 | Years ended March 31, |
| (Unaudited) | 2013 | 2012 | 2011 | 2010 | 2009 |
Selected Per-Share Data | | | | | | |
Net asset value, beginning of period | $ 10.36 | $ 9.58 | $ 9.90 | $ 8.64 | $ 5.66 | $ 10.30 |
Income from Investment Operations | | | | | | |
Net investment income (loss) E | .01 | .13 | .10 | .09 | .09 | .14 |
Net realized and unrealized gain (loss) | .64 | .81 | (.17) | 1.33 | 3.05 | (4.37) |
Total from investment operations | .65 | .94 | (.07) | 1.42 | 3.14 | (4.23) |
Distributions from net investment income | - L | (.12) | (.09) | (.09) | (.09) | (.11) |
Distributions from net realized gain | (.21) | (.05) | (.16) | (.08) | (.07) | (.30) |
Total distributions | (.22) K | (.16) J | (.25) | (.16) I | (.16) | (.41) H |
Net asset value, end of period | $ 10.79 | $ 10.36 | $ 9.58 | $ 9.90 | $ 8.64 | $ 5.66 |
Total Return B, C, D | 6.32% | 9.99% | (.48)% | 16.66% | 55.57% | (42.41)% |
Ratios to Average Net Assets F, G | | | | | | |
Expenses before reductions | .50% A | .50% | .50% | .50% | .50% | .50% |
Expenses net of fee waivers, if any | .50% A | .50% | .50% | .50% | .50% | .50% |
Expenses net of all reductions | .50% A | .50% | .50% | .50% | .50% | .50% |
Net investment income (loss) | .23% A | 1.31% | 1.07% | .98% | 1.18% | 1.79% |
Supplemental Data | | | | | | |
Net assets, end of period (000 omitted) | $ 103,264 | $ 89,196 | $ 64,512 | $ 61,195 | $ 46,449 | $ 21,186 |
Portfolio turnover rate F | 18% A | 28% | 12% | 36% | 15% | 16% |
A Annualized
B Total returns for periods of less than one year are not annualized.
C Total returns would have been lower if certain expenses had not been reduced during the applicable periods shown.
D Total returns do not include the effect of the sales charges.
E Calculated based on average shares outstanding during the period.
F Amounts do not include the activity of the Underlying Funds.
G Expense ratios reflect operating expenses of the class. Expenses before reductions do not reflect amounts reimbursed by the investment adviser or reductions from expense offset arrangements and do not represent the amount paid by the class during periods when reimbursements or reductions occur. Expenses net of fee waivers reflect expenses after reimbursement by the investment adviser but prior to reductions from expense offset arrangements. Expenses net of all reductions represent the net expenses paid by the class but do not include expenses of the investment companies in which the Fund invests.
H Total distributions of $.41 per share is comprised of distributions from net investment income of $.112 and distributions from net realized gain of $.295 per share.
I Total distributions of $.16 per share is comprised of distributions from net investment income of $.085 and distributions from net realized gain of $.079 per share.
J Total distributions of $.16 per share is comprised of distributions from net investment income of $.117 and distributions from net realized gain of $.046 per share.
K Total distributions of $.22 per share is comprised of distributions from net investment income of $.004 and distributions from net realized gain of $.214 per share.
L Amount represents less than $.01 per share.
Financial Highlights - Class B
| Six months ended September 30, 2013 | Years ended March 31, |
| (Unaudited) | 2013 | 2012 | 2011 | 2010 | 2009 |
Selected Per-Share Data | | | | | | |
Net asset value, beginning of period | $ 10.31 | $ 9.54 | $ 9.86 | $ 8.60 | $ 5.64 | $ 10.26 |
Income from Investment Operations | | | | | | |
Net investment income (loss) E | (.01) | .08 | .05 | .04 | .05 | .10 |
Net realized and unrealized gain (loss) | .63 | .81 | (.17) | 1.34 | 3.03 | (4.35) |
Total from investment operations | .62 | .89 | (.12) | 1.38 | 3.08 | (4.25) |
Distributions from net investment income | - | (.08) | (.05) | (.05) | (.05) | (.08) |
Distributions from net realized gain | (.20) | (.05) | (.15) | (.07) | (.07) | (.29) |
Total distributions | (.20) | (.12) I | (.20) | (.12) | (.12) | (.37) H |
Net asset value, end of period | $ 10.73 | $ 10.31 | $ 9.54 | $ 9.86 | $ 8.60 | $ 5.64 |
Total Return B, C, D | 6.11% | 9.47% | (1.06)% | 16.16% | 54.72% | (42.71)% |
Ratios to Average Net Assets F, G | | | | | | |
Expenses before reductions | 1.00% A | 1.00% | 1.00% | 1.00% | 1.00% | 1.00% |
Expenses net of fee waivers, if any | 1.00% A | 1.00% | 1.00% | 1.00% | 1.00% | 1.00% |
Expenses net of all reductions | 1.00% A | 1.00% | 1.00% | 1.00% | 1.00% | 1.00% |
Net investment income (loss) | (.27)% A | .81% | .57% | .48% | .68% | 1.29% |
Supplemental Data | | | | | | |
Net assets, end of period (000 omitted) | $ 5,386 | $ 5,532 | $ 5,643 | $ 6,704 | $ 5,847 | $ 3,078 |
Portfolio turnover rate F | 18% A | 28% | 12% | 36% | 15% | 16% |
A Annualized
B Total returns for periods of less than one year are not annualized.
C Total returns would have been lower if certain expenses had not been reduced during the applicable periods shown.
D Total returns do not include the effect of the contingent deferred sales charge.
E Calculated based on average shares outstanding during the period.
F Amounts do not include the activity of the Underlying Funds.
G Expense ratios reflect operating expenses of the class. Expenses before reductions do not reflect amounts reimbursed by the investment adviser or reductions from expense offset arrangements and do not represent the amount paid by the class during periods when reimbursements or reductions occur. Expenses net of fee waivers reflect expenses after reimbursement by the investment adviser but prior to reductions from expense offset arrangements. Expenses net of all reductions represent the net expenses paid by the class but do not include expenses of the investment companies in which the Fund invests.
H Total distributions of $.37 per share is comprised of distributions from net investment income of $.078 and distributions from net realized gain of $.290 per share.
I Total distributions of $.12 per share is comprised of distributions from net investment income of $.077 and distributions from net realized gain of $.046 per share.
See accompanying notes which are an integral part of the financial statements.
Semiannual Report
Financial Highlights - Class C
| Six months ended September 30, 2013 | Years ended March 31, |
| (Unaudited) | 2013 | 2012 | 2011 | 2010 | 2009 |
Selected Per-Share Data | | | | | | |
Net asset value, beginning of period | $ 10.31 | $ 9.54 | $ 9.87 | $ 8.61 | $ 5.63 | $ 10.25 |
Income from Investment Operations | | | | | | |
Net investment income (loss) E | (.01) | .08 | .05 | .04 | .05 | .10 |
Net realized and unrealized gain (loss) | .62 | .82 | (.18) | 1.34 | 3.05 | (4.35) |
Total from investment operations | .61 | .90 | (.13) | 1.38 | 3.10 | (4.25) |
Distributions from net investment income | - | (.08) | (.05) | (.05) | (.05) | (.08) |
Distributions from net realized gain | (.20) | (.05) | (.15) | (.07) | (.07) | (.29) |
Total distributions | (.20) | (.13) | (.20) | (.12) | (.12) | (.37) H |
Net asset value, end of period | $ 10.72 | $ 10.31 | $ 9.54 | $ 9.87 | $ 8.61 | $ 5.63 |
Total Return B, C, D | 6.01% | 9.53% | (1.08)% | 16.16% | 55.15% | (42.74)% |
Ratios to Average Net Assets F, G | | | | | | |
Expenses before reductions | 1.00% A | 1.00% | 1.00% | 1.00% | 1.00% | 1.00% |
Expenses net of fee waivers, if any | 1.00% A | 1.00% | 1.00% | 1.00% | 1.00% | 1.00% |
Expenses net of all reductions | 1.00% A | 1.00% | 1.00% | 1.00% | 1.00% | 1.00% |
Net investment income (loss) | (.27)% A | .81% | .57% | .48% | .68% | 1.29% |
Supplemental Data | | | | | | |
Net assets, end of period (000 omitted) | $ 18,756 | $ 16,188 | $ 13,344 | $ 12,014 | $ 9,646 | $ 5,436 |
Portfolio turnover rate F | 18% A | 28% | 12% | 36% | 15% | 16% |
A Annualized
B Total returns for periods of less than one year are not annualized.
C Total returns would have been lower if certain expenses had not been reduced during the applicable periods shown.
D Total returns do not include the effect of the contingent deferred sales charge.
E Calculated based on average shares outstanding during the period.
F Amounts do not include the activity of the Underlying Funds.
G Expense ratios reflect operating expenses of the class. Expenses before reductions do not reflect amounts reimbursed by the investment adviser or reductions from expense offset arrangements and do not represent the amount paid by the class during periods when reimbursements or reductions occur. Expenses net of fee waivers reflect expenses after reimbursement by the investment adviser but prior to reductions from expense offset arrangements. Expenses net of all reductions represent the net expenses paid by the class but do not include expenses of the investment companies in which the Fund invests.
H Total distributions of $.37 per share is comprised of distributions from net investment income of $.080 and distributions from net realized gain of $.290 per share.
Financial Highlights - Institutional Class
| Six months ended September 30, 2013 | Years ended March 31, |
| (Unaudited) | 2013 | 2012 | 2011 | 2010 | 2009 |
Selected Per-Share Data | | | | | | |
Net asset value, beginning of period | $ 10.44 | $ 9.65 | $ 9.97 | $ 8.70 | $ 5.68 | $ 10.35 |
Income from Investment Operations | | | | | | |
Net investment income (loss) D | .04 | .18 | .15 | .13 | .13 | .17 |
Net realized and unrealized gain (loss) | .64 | .82 | (.18) | 1.34 | 3.08 | (4.40) |
Total from investment operations | .68 | 1.00 | (.03) | 1.47 | 3.21 | (4.23) |
Distributions from net investment income | (.02) | (.16) | (.13) | (.13) | (.12) | (.15) |
Distributions from net realized gain | (.21) | (.05) | (.16) | (.08) | (.07) | (.30) |
Total distributions | (.23) | (.21) | (.29) | (.20) I | (.19) | (.44) H |
Net asset value, end of period | $ 10.89 | $ 10.44 | $ 9.65 | $ 9.97 | $ 8.70 | $ 5.68 |
Total Return B, C | 6.58% | 10.55% | .02% | 17.17% | 56.66% | (42.22)% |
Ratios to Average Net Assets E, G | | | | | | |
Expenses before reductions F | .00% A | .00% | .00% | .00% | .00% | .00% |
Expenses net of fee waivers, if any | .00% A | .00% | .00% | .00% | .00% | .00% |
Expenses net of all reductions | .00% A | .00% | .00% | .00% | .00% | .00% |
Net investment income (loss) | .73% A | 1.81% | 1.57% | 1.48% | 1.68% | 2.29% |
Supplemental Data | | | | | | |
Net assets, end of period (000 omitted) | $ 245,303 | $ 202,208 | $ 126,497 | $ 62,785 | $ 40,214 | $ 15,010 |
Portfolio turnover rate E | 18% A | 28% | 12% | 36% | 15% | 16% |
A Annualized
B Total returns for periods of less than one year are not annualized.
C Total returns would have been lower if certain expenses had not been reduced during the applicable periods shown.
D Calculated based on average shares outstanding during the period.
E Amounts do not include the activity of the Underlying Funds.
F Amount represents less than .01%.
G Expense ratios reflect operating expenses of the class. Expenses before reductions do not reflect amounts reimbursed by the investment adviser or reductions from expense offset arrangements and do not represent the amount paid by the class during periods when reimbursements or reductions occur. Expenses net of fee waivers reflect expenses after reimbursement by the investment adviser but prior to reductions from expense offset arrangements. Expenses net of all reductions represent the net expenses paid by the class but do not include expenses of the investment companies in which the Fund invests.
H Total distributions of $.44 per share is comprised of distributions from net investment income of $.146 and distributions from net realized gain of $.295 per share.
I Total distributions of $.20 per share is comprised of distributions from net investment income of $.125 and distributions from net realized gain of $.078 per share.
See accompanying notes which are an integral part of the financial statements.
Semiannual Report
Fidelity Advisor Freedom 2055 Fund
Investment Changes (Unaudited)
The information in the following tables is based on the direct investments of the Fund. |
Fund Holdings as of September 30, 2013 |
| % of fund's
net assets | % of fund's net assets
6 months ago |
Commodity Funds | | |
Fidelity Series Commodity Strategy Fund | 9.5 | 9.7 |
Domestic Equity Funds | | |
Fidelity Advisor Equity Growth Fund Institutional Class | 7.9 | 8.0 |
Fidelity Advisor Growth & Income Fund Institutional Class | 0.0 | 4.4 |
Fidelity Advisor Large Cap Fund Institutional Class | 4.0 | 4.4 |
Fidelity Advisor Series Equity-Income Fund | 5.3 | 4.5 |
Fidelity Advisor Series Growth & Income Fund (formerly Fidelity Advisor Series Mega Cap Fund) | 5.2 | 1.0 |
Fidelity Advisor Series Opportunistic Insights Fund | 4.1 | 3.2 |
Fidelity Advisor Series Stock Selector Large Cap Value Fund | 5.3 | 4.5 |
Fidelity Advisor Small Cap Fund Institutional Class | 3.1 | 3.3 |
Fidelity Series 100 Index Fund | 1.3 | 1.5 |
Fidelity Series All-Sector Equity Fund | 9.9 | 10.6 |
Fidelity Series Large Cap Value Fund | 5.5 | 6.2 |
Fidelity Series Real Estate Equity Fund | 0.8 | 0.9 |
Fidelity Series Small Cap Opportunities Fund | 3.6 | 3.8 |
| 56.0 | 56.3 |
Developed International Equity Funds | | |
Fidelity Series International Growth Fund | 8.7 | 8.4 |
Fidelity Series International Small Cap Fund | 1.8 | 1.7 |
Fidelity Series International Value Fund | 8.6 | 8.4 |
| 19.1 | 18.5 |
Emerging Markets Equity Funds | | |
Fidelity Series Emerging Markets Fund | 5.4 | 5.3 |
High Yield Bond Funds | | |
Fidelity Series Emerging Markets Debt Fund | 0.6 | 0.6 |
Fidelity Series Floating Rate High Income Fund | 0.0* | 0.0* |
Fidelity Series High Income Fund | 9.1 | 9.3 |
Fidelity Series Real Estate Income Fund | 0.2 | 0.2 |
| 9.9 | 10.1 |
Investment Grade Bond Funds | | |
Fidelity Series Investment Grade Bond Fund | 0.1 | 0.1 |
Net Other Assets (Liabilities)* | 0.0 | 0.0 |
| 100.0 | 100.0 |
* Amount represents less than 0.1% |
Asset Allocation (% of fund's net assets) |
Period end |
| Commodity Funds | 9.5% | |
| Domestic Equity Funds | 56.0% | |
| Developed International Equity Funds | 19.1% | |
| Emerging Markets Equity Funds | 5.4% | |
| High Yield Bond Funds | 9.9% | |
| Investment Grade Bond Funds | 0.1% | |

Six months ago |
| Commodity Funds | 9.7% | |
| Domestic Equity Funds | 56.3% | |
| Developed International Equity Funds | 18.5% | |
| Emerging Markets Equity Funds | 5.3% | |
| High Yield Bond Funds | 10.1% | |
| Investment Grade Bond Funds | 0.1% | |

Semiannual Report
Fidelity Advisor Freedom 2055 Fund
Investments September 30, 2013 (Unaudited)
Showing Percentage of Net Assets
Domestic Equity Funds - 65.5% |
| Shares | | Value |
Commodity Funds - 9.5% |
Fidelity Series Commodity Strategy Fund (a)(b) | 1,265,283 | | $ 10,134,916 |
Domestic Equity Funds - 56.0% |
Fidelity Advisor Equity Growth Fund Institutional Class (b) | 102,264 | | 8,414,279 |
Fidelity Advisor Large Cap Fund Institutional Class (b) | 158,921 | | 4,274,983 |
Fidelity Advisor Series Equity-Income Fund (b) | 477,120 | | 5,625,240 |
Fidelity Advisor Series Growth & Income Fund (b) | 461,576 | | 5,561,986 |
Fidelity Advisor Series Opportunistic Insights Fund (b) | 334,406 | | 4,307,151 |
Fidelity Advisor Series Stock Selector Large Cap Value Fund (b) | 467,747 | | 5,692,478 |
Fidelity Advisor Small Cap Fund Institutional Class (b) | 108,807 | | 3,316,447 |
Fidelity Series 100 Index Fund (b) | 122,779 | | 1,360,389 |
Fidelity Series All-Sector Equity Fund (b) | 745,815 | | 10,560,737 |
Fidelity Series Large Cap Value Fund (b) | 463,525 | | 5,854,325 |
Fidelity Series Real Estate Equity Fund (b) | 72,949 | | 872,475 |
Fidelity Series Small Cap Opportunities Fund (b) | 299,753 | | 3,845,835 |
TOTAL DOMESTIC EQUITY FUNDS | | 59,686,325 |
TOTAL DOMESTIC EQUITY FUNDS (Cost $64,350,471) |
69,821,241
|
International Equity Funds - 24.5% |
| | | |
Developed International Equity Funds - 19.1% |
Fidelity Series International Growth Fund (b) | 682,409 | | 9,260,295 |
Fidelity Series International Small Cap Fund (b) | 122,370 | | 1,871,041 |
Fidelity Series International Value Fund (b) | 858,298 | | 9,226,706 |
TOTAL DEVELOPED INTERNATIONAL EQUITY FUNDS | | 20,358,042 |
|
| Shares | | Value |
Emerging Markets Equity Funds - 5.4% |
Fidelity Series Emerging Markets Fund (b) | 346,173 | | $ 5,794,932 |
TOTAL INTERNATIONAL EQUITY FUNDS (Cost $23,803,949) |
26,152,974
|
Bond Funds - 10.0% |
| | | |
High Yield Bond Funds - 9.9% |
Fidelity Series Emerging Markets Debt Fund (b) | 64,724 | | 655,008 |
Fidelity Series Floating Rate High Income Fund (b) | 896 | | 9,477 |
Fidelity Series High Income Fund (b) | 942,156 | | 9,685,363 |
Fidelity Series Real Estate Income Fund (b) | 23,279 | | 255,600 |
TOTAL HIGH YIELD BOND FUNDS | | 10,605,448 |
Investment Grade Bond Funds - 0.1% |
Fidelity Series Investment Grade Bond Fund (b) | 9,204 | | 102,995 |
TOTAL BOND FUNDS (Cost $10,752,670) |
10,708,443
|
TOTAL INVESTMENT PORTFOLIO - 100.0% (Cost $98,907,090) | | 106,682,658 |
NET OTHER ASSETS (LIABILITIES) - 0.0% | | (17,838) |
NET ASSETS - 100% | $ 106,664,820 |
Legend |
(a) Non-income producing |
(b) Affiliated company |
Affiliated Underlying Funds |
Information regarding the Fund's fiscal year to date purchases and sales of the affiliated Underlying Funds and income earned by the Fund from investments in affiliated Underlying Funds is as follows: |
Affiliate | Value,
beginning of
period | Purchases | Sales
Proceeds | Dividend
Income | Value,
end of
period |
Fidelity Advisor Equity Growth Fund Institutional Class | $ 4,717,573 | $ 2,785,247 | $ 79,853 | $ - | $ 8,414,279 |
Fidelity Advisor Growth & Income Fund Institutional Class | 2,595,183 | 971,502 | 3,818,648 | - | - |
Fidelity Advisor Large Cap Fund Institutional Class | 2,597,322 | 1,365,168 | 90,605 | - | 4,274,983 |
Fidelity Advisor Series Equity-Income Fund | 2,664,286 | 2,793,115 | 48,624 | 36,301 | 5,625,240 |
Fidelity Advisor Series Growth & Income Fund (formerly Fidelity Advisor Series Mega Cap Fund) | 597,982 | 4,860,499 | 26,358 | - | 5,561,986 |
Fidelity Advisor Series Opportunistic Insights Fund | 1,895,518 | 1,926,607 | 37,413 | - | 4,307,151 |
Fidelity Advisor Series Stock Selector Large Cap Value Fund | 2,677,427 | 2,731,910 | 56,239 | - | 5,692,478 |
Fidelity Advisor Small Cap Fund Institutional Class | 1,939,859 | 1,091,586 | 39,727 | - | 3,316,447 |
Fidelity Series 100 Index Fund | 873,917 | 451,682 | 36,614 | - | 1,360,389 |
Fidelity Series All-Sector Equity Fund | 6,287,353 | 3,664,400 | 176,837 | - | 10,560,737 |
Fidelity Series Commodity Strategy Fund | 5,784,182 | 5,050,043 | 146,993 | - | 10,134,916 |
Fidelity Series Emerging Markets Debt Fund | 356,627 | 340,207 | 5,591 | 13,152 | 655,008 |
Fidelity Series Emerging Markets Fund | 3,113,335 | 2,626,151 | 20,610 | - | 5,794,932 |
Fidelity Series Floating Rate High Income Fund | 1,943 | 7,675 | 95 | 118 | 9,477 |
Fidelity Series High Income Fund | 5,468,666 | 4,792,478 | 406,576 | 197,720 | 9,685,363 |
Fidelity Series International Growth Fund | 5,007,955 | 3,724,066 | 29,586 | - | 9,260,295 |
Fidelity Series International Small Cap Fund | 1,011,976 | 707,499 | 11,103 | - | 1,871,041 |
Fidelity Series International Value Fund | 4,963,040 | 3,668,786 | 57,135 | - | 9,226,706 |
Fidelity Series Investment Grade Bond Fund | 68,328 | 75,474 | 38,906 | 840 | 102,995 |
Fidelity Series Large Cap Value Fund | 3,698,707 | 1,963,518 | 167,919 | - | 5,854,325 |
Fidelity Series Real Estate Equity Fund | 544,808 | 402,511 | 4,972 | 4,904 | 872,475 |
Fidelity Series Real Estate Income Fund | 134,922 | 134,828 | 1,073 | 6,237 | 255,600 |
Fidelity Series Small Cap Opportunities Fund | 2,255,121 | 1,543,381 | 41,993 | - | 3,845,835 |
Total | $ 59,256,030 | $ 47,678,333 | $ 5,343,470 | $ 259,272 | $ 106,682,658 |
Other Information |
All investments are categorized as Level 1 under the Fair Value Hierarchy. The inputs or methodology used for valuing securities may not be an indication of the risk associated with investing in those securities. For more information on valuation inputs, please refer to the Investment Valuation section in the accompanying Notes to Financial Statements. |
See accompanying notes which are an integral part of the financial statements.
Semiannual Report
Fidelity Advisor Freedom 2055 Fund
Statement of Assets and Liabilities
| September 30, 2013 (Unaudited) |
| | |
Assets | | |
Investment in securities, at value (cost $98,907,090) - See accompanying schedule | | $ 106,682,658 |
Receivable for investments sold | | 2,080 |
Receivable for fund shares sold | | 413,420 |
Receivable from investment adviser for expense reductions | | 287 |
Total assets | | 107,098,445 |
| | |
Liabilities | | |
Payable for investments purchased | $ 73,718 | |
Payable for fund shares redeemed | 341,781 | |
Distribution and service plan fees payable | 18,126 | |
Total liabilities | | 433,625 |
| | |
Net Assets | | $ 106,664,820 |
Net Assets consist of: | | |
Paid in capital | | $ 98,002,258 |
Undistributed net investment income | | 172,268 |
Accumulated undistributed net realized gain (loss) on investments | | 714,726 |
Net unrealized appreciation (depreciation) on investments | | 7,775,568 |
Net Assets | | $ 106,664,820 |
| | |
Calculation of Maximum Offering Price Class A:
Net Asset Value and redemption price per share ($57,099,503 ÷ 5,119,588 shares) | | $ 11.15 |
| | |
Maximum offering price per share (100/94.25 of $11.15) | | $ 11.83 |
Class T:
Net Asset Value and redemption price per share ($13,051,971 ÷ 1,172,796 shares) | | $ 11.13 |
| | |
Maximum offering price per share (100/96.50 of $11.13) | | $ 11.53 |
Class C:
Net Asset Value and offering price per share ($1,618,008 ÷ 145,367 shares)A | | $ 11.13 |
| | |
Institutional Class:
Net Asset Value, offering price and redemption price per share ($34,895,338 ÷ 3,119,518 shares) | | $ 11.19 |
A Redemption price per share is equal to net asset value less any applicable contingent deferred sales charge.
Statement of Operations
Six months ended September 30, 2013 (Unaudited) |
| | |
Investment Income | | |
Income distributions from underlying funds | | $ 259,272 |
| | |
Expenses | | |
Distribution and service plan fees | $ 87,727 | |
Independent trustees' compensation | 139 | |
Total expenses before reductions | 87,866 | |
Expense reductions | (139) | 87,727 |
Net investment income (loss) | | 171,545 |
Realized and Unrealized Gain (Loss) Realized gain (loss) on sale of underlying fund shares | 509,658 | |
Capital gain distributions from underlying funds | 308,975 | |
Total net realized gain (loss) | | 818,633 |
Change in net unrealized appreciation (depreciation) on underlying funds | | 4,582,208 |
Net gain (loss) | | 5,400,841 |
Net increase (decrease) in net assets resulting from operations | | $ 5,572,386 |
See accompanying notes which are an integral part of the financial statements.
Semiannual Report
Fidelity Advisor Freedom 2055 Fund
Financial Statements - continued
Statement of Changes in Net Assets
| Six months ended
September 30, 2013
(Unaudited) | Year ended
March 31,
2013 |
Increase (Decrease) in Net Assets | | |
Operations | | |
Net investment income (loss) | $ 171,545 | $ 516,037 |
Net realized gain (loss) | 818,633 | 755,707 |
Change in net unrealized appreciation (depreciation) | 4,582,208 | 3,283,912 |
Net increase (decrease) in net assets resulting from operations | 5,572,386 | 4,555,656 |
Distributions to shareholders from net investment income | (44,363) | (473,172) |
Distributions to shareholders from net realized gain | (775,793) | (129,809) |
Total distributions | (820,156) | (602,981) |
Share transactions - net increase (decrease) | 42,666,461 | 47,565,310 |
Total increase (decrease) in net assets | 47,418,691 | 51,517,985 |
| | |
Net Assets | | |
Beginning of period | 59,246,129 | 7,728,144 |
End of period (including undistributed net investment income of $172,268 and undistributed net investment income of $45,086, respectively) | $ 106,664,820 | $ 59,246,129 |
Financial Highlights - Class A
| Six months ended
September 30, 2013 | Years ended March 31, |
| (Unaudited) | 2013 | 2012 G |
Selected Per-Share Data | | | |
Net asset value, beginning of period | $ 10.56 | $ 9.75 | $ 10.00 |
Income from Investment Operations | | | |
Net investment income (loss) E | .02 | .18 | .11 |
Net realized and unrealized gain (loss) | .70 | .83 | (.11) |
Total from investment operations | .72 | 1.01 | - |
Distributions from net investment income | (.01) | (.13) | (.11) |
Distributions from net realized gain | (.12) | (.07) | (.15) |
Total distributions | (.13) | (.20) | (.25) I |
Net asset value, end of period | $ 11.15 | $ 10.56 | $ 9.75 |
Total Return B, C, D | 6.82% | 10.51% | .29% |
Ratios to Average Net Assets F, H | | | |
Expenses before reductions | .25% A | .25% | .25% A |
Expenses net of fee waivers, if any | .25% A | .25% | .25% A |
Expenses net of all reductions | .25% A | .25% | .25% A |
Net investment income (loss) | .38% A | 1.82% | 1.44% A |
Supplemental Data | | | |
Net assets, end of period (000 omitted) | $ 57,100 | $ 32,476 | $ 2,655 |
Portfolio turnover rate F | 13% A | 29% | 18% A |
A Annualized
B Total returns for periods of less than one year are not annualized.
C Total returns would have been lower if certain expenses had not been reduced during the applicable periods shown.
D Total returns do not include the effect of the sales charges.
E Calculated based on average shares outstanding during the period.
F Amounts do not include the activity of the Underlying Funds.
G For the period June 1, 2011 (commencement of operations) to March 31, 2012.
H Expense ratios reflect operating expenses of the class. Expenses before reductions do not reflect amounts reimbursed by the investment adviser or reductions from expense offset arrangements and do not represent the amount paid by the class during periods when reimbursements or reductions occur. Expenses net of fee waivers reflect expenses after reimbursement by the investment adviser but prior to reductions from expense offset arrangements. Expenses net of all reductions represent the net expenses paid by the class but do not include expenses of the investment companies in which the Fund invests.
I Total distributions of $.25 per share is comprised of distributions from net investment income of $.105 and distributions from net realized gain of $.146 per share.
See accompanying notes which are an integral part of the financial statements.
Semiannual Report
Financial Highlights - Class T
| Six months ended
September 30, 2013 | Years ended March 31, |
| (Unaudited) | 2013 | 2012 G |
Selected Per-Share Data | | | |
Net asset value, beginning of period | $ 10.55 | $ 9.75 | $ 10.00 |
Income from Investment Operations | | | |
Net investment income (loss) E | .01 | .16 | .09 |
Net realized and unrealized gain (loss) | .69 | .82 | (.10) |
Total from investment operations | .70 | .98 | (.01) |
Distributions from net investment income | - | (.11) | (.09) |
Distributions from net realized gain | (.12) | (.07) | (.15) |
Total distributions | (.12) | (.18) | (.24) |
Net asset value, end of period | $ 11.13 | $ 10.55 | $ 9.75 |
Total Return B, C, D | 6.68% | 10.24% | .12% |
Ratios to Average Net Assets F, H | | | |
Expenses before reductions | .50% A | .50% | .50% A |
Expenses net of fee waivers, if any | .50% A | .50% | .50% A |
Expenses net of all reductions | .50% A | .50% | .50% A |
Net investment income (loss) | .13% A | 1.57% | 1.19% A |
Supplemental Data | | | |
Net assets, end of period (000 omitted) | $ 13,052 | $ 7,239 | $ 1,444 |
Portfolio turnover rate F | 13% A | 29% | 18% A |
A Annualized
B Total returns for periods of less than one year are not annualized.
C Total returns would have been lower if certain expenses had not been reduced during the applicable periods shown.
D Total returns do not include the effect of the sales charges.
E Calculated based on average shares outstanding during the period.
F Amounts do not include the activity of the Underlying Funds.
G For the period June 1, 2011 (commencement of operations) to March 31, 2012.
H Expense ratios reflect operating expenses of the class. Expenses before reductions do not reflect amounts reimbursed by the investment adviser or reductions from expense offset arrangements and do not represent the amount paid by the class during periods when reimbursements or reductions occur. Expenses net of fee waivers reflect expenses after reimbursement by the investment adviser but prior to reductions from expense offset arrangements. Expenses net of all reductions represent the net expenses paid by the class but do not include expenses of the investment companies in which the Fund invests.
Financial Highlights - Class C
| Six months ended
September 30, 2013 | Years ended March 31, |
| (Unaudited) | 2013 | 2012 G |
Selected Per-Share Data | | | |
Net asset value, beginning of period | $ 10.57 | $ 9.74 | $ 10.00 |
Income from Investment Operations | | | |
Net investment income (loss) E | (.02) | .10 | .05 |
Net realized and unrealized gain (loss) | .69 | .83 | (.10) |
Total from investment operations | .67 | .93 | (.05) |
Distributions from net investment income | - | (.03) | (.06) |
Distributions from net realized gain | (.11) | (.07) | (.15) |
Total distributions | (.11) | (.10) | (.21) |
Net asset value, end of period | $ 11.13 | $ 10.57 | $ 9.74 |
Total Return B, C, D | 6.37% | 9.69% | (.27)% |
Ratios to Average Net Assets F, H | | | |
Expenses before reductions | 1.00% A | 1.00% | 1.00% A |
Expenses net of fee waivers, if any | 1.00% A | 1.00% | 1.00% A |
Expenses net of all reductions | 1.00% A | 1.00% | 1.00% A |
Net investment income (loss) | (.37)% A | 1.07% | .69% A |
Supplemental Data | | | |
Net assets, end of period (000 omitted) | $ 1,618 | $ 1,094 | $ 1,127 |
Portfolio turnover rate F | 13% A | 29% | 18% A |
A Annualized
B Total returns for periods of less than one year are not annualized.
C Total returns would have been lower if certain expenses had not been reduced during the applicable periods shown.
D Total returns do not include the effect of the contingent deferred sales charge.
E Calculated based on average shares outstanding during the period.
F Amounts do not include the activity of the Underlying Funds.
G For the period June 1, 2011 (commencement of operations) to March 31, 2012.
H Expense ratios reflect operating expenses of the class. Expenses before reductions do not reflect amounts reimbursed by the investment adviser or reductions from expense offset arrangements and do not represent the amount paid by the class during periods when reimbursements or reductions occur. Expenses net of fee waivers reflect expenses after reimbursement by the investment adviser but prior to reductions from expense offset arrangements. Expenses net of all reductions represent the net expenses paid by the class but do not include expenses of the investment companies in which the Fund invests.
See accompanying notes which are an integral part of the financial statements.
Semiannual Report
Financial Highlights - Institutional Class
| Six months ended
September 30, 2013 | Years ended March 31, |
| (Unaudited) | 2013 | 2012 G |
Selected Per-Share Data | | | |
Net asset value, beginning of period | $ 10.59 | $ 9.76 | $ 10.00 |
Income from Investment Operations | | | |
Net investment income (loss) D | .03 | .21 | .13 |
Net realized and unrealized gain (loss) | .70 | .83 | (.11) |
Total from investment operations | .73 | 1.04 | .02 |
Distributions from net investment income | (.01) | (.14) | (.12) |
Distributions from net realized gain | (.12) | (.07) | (.15) |
Total distributions | (.13) | (.21) | (.26) I |
Net asset value, end of period | $ 11.19 | $ 10.59 | $ 9.76 |
Total Return B, C | 6.95% | 10.84% | .51% |
Ratios to Average Net Assets E, H | | | |
Expenses before reductions F | .00% A | .00% | .00% A |
Expenses net of fee waivers, if any | .00% A | .00% | .00% A |
Expenses net of all reductions | .00% A | .00% | .00% A |
Net investment income (loss) | .63% A | 2.07% | 1.69% A |
Supplemental Data | | | |
Net assets, end of period (000 omitted) | $ 34,895 | $ 18,438 | $ 2,503 |
Portfolio turnover rate E | 13% A | 29% | 18% A |
A Annualized
B Total returns for periods of less than one year are not annualized.
C Total returns would have been lower if certain expenses had not been reduced during the applicable periods shown.
D Calculated based on average shares outstanding during the period.
E Amounts do not include the activity of the Underlying Funds.
F Amount represents less than .01%.
G For the period June 1, 2011 (commencement of operations) to March 31, 2012.
H Expense ratios reflect operating expenses of the class. Expenses before reductions do not reflect amounts reimbursed by the investment adviser or reductions from expense offset arrangements and do not represent the amount paid by the class during periods when reimbursements or reductions occur. Expenses net of fee waivers reflect expenses after reimbursement by the investment adviser but prior to reductions from expense offset arrangements. Expenses net of all reductions represent the net expenses paid by the class but do not include expenses of the investment companies in which the Fund invests.
I Total distributions of $.26 per share is comprised of distributions from net investment income of $.116 and distributions from net realized gain of $.146 per share.
See accompanying notes which are an integral part of the financial statements.
Semiannual Report
Notes to Financial Statements
For the period ended September 30, 2013 (Unaudited)
1. Organization.
Fidelity Advisor Freedom Income Fund, Fidelity Advisor Freedom 2005 Fund, Fidelity Advisor Freedom 2010 Fund, Fidelity Advisor Freedom 2015 Fund, Fidelity Advisor Freedom 2020 Fund, Fidelity Advisor Freedom 2025 Fund, Fidelity Advisor Freedom 2030 Fund, Fidelity Advisor Freedom 2035 Fund, Fidelity Advisor Freedom 2040 Fund, Fidelity Advisor Freedom 2045 Fund, Fidelity Advisor Freedom 2050 Fund and Fidelity Advisor Freedom 2055 Fund (the Funds) are funds of Fidelity Aberdeen Street Trust (the Trust). The Trust is registered under the Investment Company Act of 1940, as amended (the 1940 Act), as an open-end management investment company organized as a Delaware statutory trust. Each Fund is authorized to issue an unlimited number of shares. The Funds invest primarily in a combination of other Fidelity equity, bond and short-term funds (the Underlying Funds) managed by Fidelity Management & Research Company (FMR).
Each Fund offers Class A, Class T, Class C, and Institutional Class shares, each of which, along with Class B shares, has equal rights as to assets and voting privileges. Effective after the close of business on September 1, 2010, Class B shares were closed to new accounts and additional purchases, except for exchanges and reinvestments. Each class has exclusive voting rights with respect to matters that affect that class. Class B shares will automatically convert to Class A shares after a holding period of seven years from the initial date of purchase.
2. Significant Accounting Policies.
The financial statements have been prepared in conformity with accounting principles generally accepted in the United States of America (GAAP), which require management to make certain estimates and assumptions at the date of the financial statements. Actual results could differ from those estimates. Subsequent events, if any, through the date that the financial statements were issued have been evaluated in the preparation of the financial statements. The following summarizes the significant accounting policies of the Funds:
Investment Valuation. Investments are valued as of 4:00 p.m. Eastern time on the last calendar day of the period. In accordance with valuation policies and procedures approved by the Board of Trustees (the Board), each Fund attempts to obtain prices from one or more third party pricing vendors or brokers to value its investments. When current market prices, quotations or currency exchange rates are not readily available or reliable, investments will be fair valued in good faith by the FMR Fair Value Committee (the Committee), in accordance with procedures adopted by the Board. Factors used in determining fair value vary by investment type and may include market or investment specific events. Each Fund categorizes the inputs to valuation techniques used to value its investments into a disclosure hierarchy consisting of three levels as shown below:
Level 1 - quoted prices in active markets for identical investments
Level 2 - other significant observable inputs (including quoted prices for similar investments, interest rates, prepayment speeds, etc.)
Level 3 - unobservable inputs (including the Fund's own assumptions based on the best information available)
Valuation techniques used to value each Fund's investments by major category are as follows. Investments in the Underlying Funds are valued at their closing net asset value (NAV) each business day and are categorized as Level 1 in the hierarchy.
Investment Transactions and Income. For financial reporting purposes, the Funds' investment holdings and NAV include trades executed through the end of the last business day of the period. The NAV per share for processing shareholder transactions is calculated as of the close of business of the New York Stock Exchange (NYSE), normally 4:00 p.m. Eastern time and includes trades executed through the end of the prior business day. Gains and losses on securities sold are determined on the basis of identified cost. Income and capital gain distributions from the Underlying Funds, if any, are recorded on the ex-dividend date.
Class Allocations and Expenses. Investment income, realized and unrealized capital gains and losses, common expenses of each Fund, and certain fund-level expense reductions, if any, are allocated daily on a pro-rata basis to each class based on the relative net assets of each class to the total net assets of each Fund. Each class differs with respect to distribution and service plan fees incurred. Certain expense reductions may also differ by class. For the reporting period, the allocated portion of income and expenses to each class as a percent of its average net assets may vary due to the timing of recording these transactions in relation to fluctuating net assets of the classes. Expenses directly attributable to a fund are charged to that fund. Expenses attributable to more than one fund are allocated among the respective funds on the basis of relative net assets or other appropriate methods. Expenses included in the accompanying financial statements reflect the expenses of each Fund and do not include any expenses associated with the Underlying Funds. Although not included in each Fund's expenses, each Fund indirectly bears its proportionate share of the Underlying Funds' expenses through the impact of these expenses on each Underlying Fund's NAV. Expense estimates are accrued in the period to which they relate and adjustments are made when actual amounts are known.
Income Tax Information and Distributions to Shareholders. Each year, each Fund intends to qualify as a regulated investment company under Subchapter M of the Internal Revenue Code, including distributing substantially all of its taxable income and realized gains. As a result, no provision for U.S. Federal income taxes is required. Each Fund files a U.S. federal tax return, in addition to state and local tax returns as required. The Fund's federal income tax returns are subject to examination by the Internal Revenue Service (IRS) for a period of three fiscal years after they are filed. State and local tax returns may be subject to examination for an additional fiscal year depending on the jurisdiction.
Semiannual Report
Notes to Financial Statements (Unaudited) - continued
2. Significant Accounting Policies - continued
Income Tax Information and Distributions to Shareholders - continued
Distributions are declared and recorded on the ex-dividend date. Income dividends and capital gain distributions are declared separately for each class. Income and capital gain distributions are determined in accordance with income tax regulations, which may differ from GAAP.
Capital accounts within the financial statements are adjusted for permanent book-tax differences. These adjustments have no impact on net assets or the results of operations. Temporary book-tax differences will reverse in a subsequent period.
Book-tax differences are primarily due to the short-term gain distributions from the Underlying Funds, capital loss carryforwards and losses deferred due to wash sales and excise tax regulations.
The federal tax cost of investment securities and unrealized appreciation (depreciation) as of period end were as follows for each Fund:
| Tax cost | Gross unrealized
appreciation | Gross unrealized
depreciation | Net unrealized
appreciation
(depreciation) on
securities and
other investments |
Advisor Freedom Income | $ 294,108,393 | $ 19,405,694 | $ (2,678,535) | $ 16,727,159 |
Advisor Freedom 2005 | 284,879,491 | 23,327,082 | (3,953,641) | 19,373,441 |
Advisor Freedom 2010 | 827,515,446 | 83,461,728 | (16,196,557) | 67,265,171 |
Advisor Freedom 2015 | 1,768,253,280 | 204,666,668 | (34,818,110) | 169,848,558 |
Advisor Freedom 2020 | 3,059,911,210 | 353,825,063 | (70,880,463) | 282,944,600 |
Advisor Freedom 2025 | 2,794,264,137 | 374,719,797 | (69,558,209) | 305,161,588 |
Advisor Freedom 2030 | 2,786,800,422 | 386,473,252 | (73,820,534) | 312,652,718 |
Advisor Freedom 2035 | 1,995,139,418 | 308,610,580 | (52,513,329) | 256,097,251 |
Advisor Freedom 2040 | 1,934,372,975 | 291,671,576 | (51,828,479) | 239,843,097 |
Advisor Freedom 2045 | 898,386,871 | 156,515,047 | (22,099,067) | 134,415,980 |
Advisor Freedom 2050 | 658,024,319 | 118,673,991 | (16,719,241) | 101,954,750 |
Advisor Freedom 2055 | 99,058,124 | 8,795,762 | (1,171,228) | 7,624,534 |
3. Purchases and Sales of Investments.
Purchases and redemptions of the Underlying Fund shares are noted in the table below.
| Purchases ($) | Redemptions ($) |
Advisor Freedom Income | 17,499,029 | 34,424,206 |
Advisor Freedom 2005 | 35,398,361 | 45,493,057 |
Advisor Freedom 2010 | 80,416,475 | 115,958,349 |
Advisor Freedom 2015 | 147,146,767 | 219,196,888 |
Advisor Freedom 2020 | 314,554,183 | 349,287,391 |
Advisor Freedom 2025 | 356,971,769 | 287,939,954 |
Advisor Freedom 2030 | 316,113,834 | 298,130,356 |
Advisor Freedom 2035 | 270,375,196 | 218,186,631 |
Advisor Freedom 2040 | 242,264,305 | 201,929,670 |
Advisor Freedom 2045 | 160,410,511 | 90,255,700 |
Advisor Freedom 2050 | 118,472,191 | 65,852,028 |
Advisor Freedom 2055 | 47,678,333 | 5,343,470 |
4. Fees and Other Transactions with Affiliates.
Management Fee. Strategic Advisers, Inc. (Strategic Advisers), an affiliate of FMR, provides the Funds with investment management related services. The Funds do not pay any fees for these services.
Other Transactions. Strategic Advisers has entered into an administration agreement with FMR under which FMR provides management and administrative services (other than investment advisory services) necessary for the operation of each Fund. Pursuant to this agreement, FMR pays all expenses of each Fund, excluding the distribution and service fees, the compensation of the independent Trustees and certain other expenses such as interest expense. FMR also contracts with other Fidelity companies to perform the services necessary for the operation of each Fund. The Funds do not pay any fees for these services.
Semiannual Report
4. Fees and Other Transactions with Affiliates - continued
Distribution and Service Plan Fees. In accordance with Rule 12b-1 of the 1940 Act, the Fund has adopted separate Distribution and Service Plans for each class of shares, except for the Institutional Class. Certain classes pay Fidelity Distributors Corporation (FDC), an affiliate of FMR, separate Distribution and Service Fees, each of which is based on an annual percentage of each class' average net assets. In addition, FDC may pay financial intermediaries for selling shares of the Fund and providing shareholder support services. For the period, the Distribution and Service Fee rates, total fees and amounts retained by FDC were as follows:
Advisor Freedom Income | Distribution
Fee | Service
Fee | Total Fees | Retained
by FDC |
Class A | 0% | .25% | $ 216,524 | $ 12,524 |
Class T | .25% | .25% | 131,806 | 1,087 |
Class B | .75% | .25% | 10,467 | 8,283 |
Class C | .75% | .25% | 81,124 | 14,492 |
| | | $ 439,921 | $ 36,386 |
Advisor Freedom 2005 | | | | |
Class A | 0% | .25% | $ 247,260 | $ 27,674 |
Class T | .25% | .25% | 68,814 | 428 |
Class B | .75% | .25% | 5,771 | 4,403 |
Class C | .75% | .25% | 43,947 | 5,077 |
| | | $ 365,792 | $ 37,582 |
Advisor Freedom 2010 | | | | |
Class A | 0% | .25% | $ 665,071 | $ 64,465 |
Class T | .25% | .25% | 323,152 | 3,787 |
Class B | .75% | .25% | 27,945 | 21,686 |
Class C | .75% | .25% | 190,607 | 19,572 |
| | | $ 1,206,775 | $ 109,510 |
Advisor Freedom 2015 | | | | |
Class A | 0% | .25% | $ 1,454,472 | $ 138,328 |
Class T | .25% | .25% | 573,788 | 6,029 |
Class B | .75% | .25% | 77,935 | 59,803 |
Class C | .75% | .25% | 362,965 | 47,663 |
| | | $ 2,469,160 | $ 251,823 |
Advisor Freedom 2020 | | | | |
Class A | 0% | .25% | $ 2,429,978 | $ 226,235 |
Class T | .25% | .25% | 1,113,320 | 6,968 |
Class B | .75% | .25% | 149,792 | 115,977 |
Class C | .75% | .25% | 522,943 | 72,197 |
| | | $ 4,216,033 | $ 421,377 |
Advisor Freedom 2025 | | | | |
Class A | 0% | .25% | $ 2,297,657 | $ 249,262 |
Class T | .25% | .25% | 860,149 | 4,774 |
Class B | .75% | .25% | 106,170 | 81,577 |
Class C | .75% | .25% | 390,141 | 55,067 |
| | | $ 3,654,117 | $ 390,680 |
Advisor Freedom 2030 | | | | |
Class A | 0% | .25% | $ 2,207,808 | $ 198,518 |
Class T | .25% | .25% | 1,018,155 | 5,524 |
Class B | .75% | .25% | 125,988 | 97,264 |
Class C | .75% | .25% | 387,123 | 56,474 |
| | | $ 3,739,074 | $ 357,780 |
Advisor Freedom 2035 | | | | |
Class A | 0% | .25% | $ 1,619,675 | $ 167,799 |
Class T | .25% | .25% | 584,460 | 1,964 |
Class B | .75% | .25% | 84,141 | 64,741 |
Class C | .75% | .25% | 230,835 | 33,408 |
| | | $ 2,519,111 | $ 267,912 |
Semiannual Report
Notes to Financial Statements (Unaudited) - continued
4. Fees and Other Transactions with Affiliates - continued
Distribution and Service Plan Fees - continued
Advisor Freedom 2040 | Distribution
Fee | Service
Fee | Total Fees | Retained
by FDC |
Class A | 0% | .25% | $ 1,463,895 | $ 117,703 |
Class T | .25% | .25% | 758,569 | 5,558 |
Class B | .75% | .25% | 111,207 | 85,727 |
Class C | .75% | .25% | 324,272 | 41,968 |
| | | $ 2,657,943 | $ 250,956 |
Advisor Freedom 2045 | | | | |
Class A | 0% | .25% | $ 693,746 | $ 67,529 |
Class T | .25% | .25% | 260,500 | - |
Class B | .75% | .25% | 18,116 | 13,922 |
Class C | .75% | .25% | 73,503 | 15,796 |
| | | $ 1,045,865 | $ 97,247 |
Advisor Freedom 2050 | | | | |
Class A | 0% | .25% | $ 464,723 | $ 29,701 |
Class T | .25% | .25% | 245,277 | - |
Class B | .75% | .25% | 27,647 | 20,965 |
Class C | .75% | .25% | 87,339 | 15,106 |
| | | $ 824,986 | $ 65,772 |
Advisor Freedom 2055 | | | | |
Class A | 0% | .25% | $ 55,966 | $ 6,273 |
Class T | .25% | .25% | 24,951 | - |
Class C | .25% | .25% | 6,810 | 4,709 |
| | | $ 87,727 | $ 10,982 |
Sales Load. FDC may receive a front-end sales charge of up to 5.75% for selling Class A shares and 3.50% for selling Class T shares, some of which is paid to financial intermediaries for selling shares of the Fund. Depending on the holding period, FDC may receive contingent deferred sales charges levied on Class A, Class T, Class B, and Class C redemptions. The deferred sales charges range from 5.00% to 1.00% for Class B shares, 1.00% for Class C shares, 1.00% for certain purchases of Class A shares and .25% for certain purchases of Class T shares.
For the period, sales charge amounts retained by FDC were as follows:
Advisor Freedom Income | Retained
by FDC |
Class A | $ 4,581 |
Class T | 1,075 |
Class B* | 2,765 |
Class C* | 822 |
| $ 9,243 |
Advisor Freedom 2005 | |
Class A | $ 3,225 |
Class T | 519 |
Class B* | 117 |
Class C* | 186 |
| $ 4,047 |
Advisor Freedom 2010 | |
Class A | $ 6,840 |
Class T | 5,042 |
Class B* | 4,566 |
Class C* | 744 |
| $ 17,192 |
Semiannual Report
4. Fees and Other Transactions with Affiliates - continued
Sales Load - continued
Advisor Freedom 2015 | Retained
by FDC |
Class A | $ 18,390 |
Class T | 9,025 |
Class B* | 3,975 |
Class C* | 2,111 |
| $ 33,501 |
Advisor Freedom 2020 | |
Class A | $ 41,003 |
Class T | 18,987 |
Class B* | 11,308 |
Class C* | 5,333 |
| $ 76,631 |
Advisor Freedom 2025 | |
Class A | $ 117,130 |
Class T | 18,750 |
Class B* | 13,311 |
Class C* | 3,649 |
| $ 152,840 |
Advisor Freedom 2030 | |
Class A | $ 43,321 |
Class T | 18,269 |
Class B* | 7,629 |
Class C* | 5,689 |
| $ 74,908 |
Advisor Freedom 2035 | |
Class A | $ 33,922 |
Class T | 16,582 |
Class B* | 5,663 |
Class C* | 4,361 |
| $ 60,528 |
Advisor Freedom 2040 | |
Class A | $ 47,865 |
Class T | 18,233 |
Class B* | 10,573 |
Class C* | 4,285 |
| $ 80,956 |
Advisor Freedom 2045 | |
Class A | $ 16,649 |
Class T | 8,273 |
Class B* | 2,051 |
Class C* | 2,642 |
| $ 29,615 |
Advisor Freedom 2050 | |
Class A | $ 15,585 |
Class T | 6,412 |
Class B* | 3,653 |
Class C* | 2,542 |
| $ 28,192 |
Advisor Freedom 2055 | |
Class A | $ 4,086 |
Class T | 2,767 |
Class C* | 165 |
| $ 7,018 |
* When Class B and Class C shares are initially sold, FDC pays commissions from its own resources to financial intermediaries through which the sales are made.
Semiannual Report
Notes to Financial Statements (Unaudited) - continued
4. Fees and Other Transactions with Affiliates - continued
Reallocation of Underlying Fund Investments. During the period, Strategic Advisers reallocated investments of the Funds. This involved taxable redemptions of the Funds' interest in Fidelity Advisor Growth & Income Fund Institutional Class for securities, including accrued interest, and non-taxable exchanges of those securities for shares of Fidelity Advisor Series Growth & Income Fund, an affiliated investment company managed by FMR. Realized gains and losses on the redemptions of Fidelity Advisor Growth & Income Fund Institutional Class in connection with the reallocation are included in the accompanying Statements of Operations as "Realized gain (loss) on sale of underlying fund shares."
Details of these transactions with the related gain (loss) for the Funds are presented in the accompanying table:
| Value of
Securities, including
accrued interest,
reallocated | Realized Gain (Loss) on
redemption of Fidelity
Advisor Growth & Income
Fund Institutional Class |
Advisor Freedom Income | $ 3,012,344 | $ 1,291,049 |
Advisor Freedom 2005 | 4,644,447 | 1,360,371 |
Advisor Freedom 2010 | 19,264,933 | 5,099,845 |
Advisor Freedom 2015 | 43,737,590 | 10,706,802 |
Advisor Freedom 2020 | 80,471,120 | 19,881,084 |
Advisor Freedom 2025 | 90,140,248 | 18,877,601 |
Advisor Freedom 2030 | 95,994,672 | 20,854,941 |
Advisor Freedom 2035 | 79,465,839 | 15,521,613 |
Advisor Freedom 2040 | 78,900,348 | 13,518,567 |
Advisor Freedom 2045 | 38,130,440 | 14,343,043 |
Advisor Freedom 2050 | 28,101,181 | 10,910,824 |
Advisor Freedom 2055 | 3,739,435 | 567,690 |
5. Expense Reductions.
FMR voluntarily agreed to reimburse funds to the extent annual operating expenses exceeded certain levels of average net assets as noted in the table below. Some expenses, for example interest expense, are excluded from this reimbursement.
The following classes of each applicable Fund were in reimbursement during the period:
| Expense
Limitations | Reimbursement |
Advisor Freedom Income | | |
Class A | .25% | $ 321 |
Class T | .50% | 99 |
Class B | 1.00% | 4 |
Class C | 1.00% | 30 |
Institutional Class | .00% | 151 |
Advisor Freedom 2005 | | |
Class A | .25% | 370 |
Class T | .50% | 53 |
Class B | 1.00% | 2 |
Class C | 1.00% | 17 |
Institutional Class | .00% | 133 |
Advisor Freedom 2010 | | |
Class A | .25% | 983 |
Class T | .50% | 244 |
Class B | 1.00% | 9 |
Class C | 1.00% | 71 |
Institutional Class | .00% | 391 |
Semiannual Report
5. Expense Reductions - continued
| Expense
Limitations | Reimbursement |
Advisor Freedom 2015 | | |
Class A | .25% | $ 2,150 |
Class T | .50% | 437 |
Class B | 1.00% | 27 |
Class C | 1.00% | 139 |
Institutional Class | .00% | 903 |
Advisor Freedom 2020 | | |
Class A | .25% | 3,562 |
Class T | .50% | 847 |
Class B | 1.00% | 52 |
Class C | 1.00% | 197 |
Institutional Class | .00% | 1,527 |
Advisor Freedom 2025 | | |
Class A | .25% | 3,338 |
Class T | .50% | 646 |
Class B | 1.00% | 35 |
Class C | 1.00% | 146 |
Institutional Class | .00% | 1,387 |
Advisor Freedom 2030 | | |
Class A | .25% | 3,213 |
Class T | .50% | 759 |
Class B | 1.00% | 43 |
Class C | 1.00% | 146 |
Institutional Class | .00% | 1,441 |
Advisor Freedom 2035 | | |
Class A | .25% | 2,353 |
Class T | .50% | 439 |
Class B | 1.00% | 29 |
Class C | 1.00% | 88 |
Institutional Class | .00% | 1,087 |
Advisor Freedom 2040 | | |
Class A | .25% | 2,122 |
Class T | .50% | 554 |
Class B | 1.00% | 38 |
Class C | 1.00% | 120 |
Institutional Class | .00% | 1,046 |
Advisor Freedom 2045 | | |
Class A | .25% | 988 |
Class T | .50% | 193 |
Class B | 1.00% | 6 |
Class C | 1.00% | 27 |
Institutional Class | .00% | 562 |
Advisor Freedom 2050 | | |
Class A | .25% | 664 |
Class T | .50% | 177 |
Class B | 1.00% | 9 |
Class C | 1.00% | 33 |
Institutional Class | .00% | 421 |
Semiannual Report
Notes to Financial Statements (Unaudited) - continued
5. Expense Reductions - continued
| Expense
Limitations | Reimbursement |
Advisor Freedom 2055 | | |
Class A | .25% | $ 75 |
Class T | .50% | 17 |
Class C | 1.00% | 2 |
Institutional Class | .00% | 45 |
6. Distributions to Shareholders.
Distributions to shareholders of each class were as follows:
| Six months ended
September 30, 2013 | Year ended
March 31, 2013 |
Advisor Freedom Income | | |
From net investment income | | |
Class A | $ 656,311 | $ 1,869,112 |
Class T | 128,512 | 433,735 |
Class B | - | 9,453 |
Class C | 1,476 | 61,486 |
Institutional Class | 372,019 | 900,709 |
Total | $ 1,158,318 | $ 3,274,495 |
From net realized gain | | |
Class A | $ 1,977,628 | $ 2,240,481 |
Class T | 612,330 | 669,554 |
Class B | 24,775 | 32,437 |
Class C | 184,052 | 210,904 |
Institutional Class | 851,104 | 901,737 |
Total | $ 3,649,889 | $ 4,055,113 |
Advisor Freedom 2005 | | |
From net investment income | | |
Class A | $ 288,226 | $ 2,280,196 |
Class T | 25,627 | 219,973 |
Class B | - | 4,601 |
Class C | - | 31,434 |
Institutional Class | 142,651 | 820,798 |
Total | $ 456,504 | $ 3,357,002 |
From net realized gain | | |
Class A | $ 1,237,673 | $ 1,208,263 |
Class T | 170,073 | 146,502 |
Class B | 7,054 | 8,377 |
Class C | 52,005 | 47,485 |
Institutional Class | 433,896 | 369,028 |
Total | $ 1,900,701 | $ 1,779,655 |
Semiannual Report
6. Distributions to Shareholders - continued
| Six months ended
September 30, 2013 | Year ended
March 31, 2013 |
Advisor Freedom 2010 | | |
From net investment income | | |
Class A | $ 774,729 | $ 7,248,480 |
Class T | 113,125 | 1,357,322 |
Class B | - | 35,114 |
Class C | - | 221,866 |
Institutional Class | 414,104 | 2,901,048 |
Total | $ 1,301,958 | $ 11,763,830 |
From net realized gain | | |
Class A | $ 5,337,041 | $ 3,797,581 |
Class T | 1,275,224 | 877,542 |
Class B | 57,586 | 49,505 |
Class C | 369,929 | 264,617 |
Institutional Class | 1,974,957 | 1,313,996 |
Total | $ 9,014,737 | $ 6,303,241 |
Advisor Freedom 2015 | | |
From net investment income | | |
Class A | $ 1,692,286 | $ 15,443,272 |
Class T | 181,793 | 2,370,199 |
Class B | - | 95,446 |
Class C | - | 437,291 |
Institutional Class | 977,995 | 6,470,240 |
Total | $ 2,852,074 | $ 24,816,448 |
From net realized gain | | |
Class A | $ 19,179,240 | $ 8,264,610 |
Class T | 3,708,566 | 1,548,591 |
Class B | 261,176 | 133,932 |
Class C | 1,169,651 | 514,113 |
Institutional Class | 7,673,501 | 2,975,791 |
Total | $ 31,992,134 | $ 13,437,037 |
Advisor Freedom 2020 | | |
From net investment income | | |
Class A | $ 2,838,484 | $ 26,237,034 |
Class T | 366,712 | 4,698,779 |
Class B | - | 207,668 |
Class C | - | 650,444 |
Institutional Class | 1,610,985 | 10,832,707 |
Total | $ 4,816,181 | $ 42,626,632 |
From net realized gain | | |
Class A | $ 37,348,421 | $ 12,221,481 |
Class T | 8,334,361 | 2,642,164 |
Class B | 591,092 | 229,820 |
Class C | 1,936,305 | 642,700 |
Institutional Class | 14,916,514 | 4,363,557 |
Total | $ 63,126,693 | $ 20,099,722 |
Semiannual Report
Notes to Financial Statements (Unaudited) - continued
6. Distributions to Shareholders - continued
| Six months ended
September 30, 2013 | Year ended
March 31, 2013 |
Advisor Freedom 2025 | | |
From net investment income | | |
Class A | $ 2,418,460 | $ 24,790,567 |
Class T | 259,209 | 3,595,303 |
Class B | - | 163,792 |
Class C | - | 561,745 |
Institutional Class | 1,349,155 | 9,737,534 |
Total | $ 4,026,824 | $ 38,848,941 |
From net realized gain | | |
Class A | $ 53,211,723 | $ 9,143,726 |
Class T | 9,694,413 | 1,563,144 |
Class B | 637,953 | 130,245 |
Class C | 2,189,425 | 386,200 |
Institutional Class | 20,184,567 | 3,124,129 |
Total | $ 85,918,081 | $ 14,347,444 |
Advisor Freedom 2030 | | |
From net investment income | | |
Class A | $ 2,350,262 | $ 24,782,410 |
Class T | 292,762 | 4,552,485 |
Class B | - | 210,414 |
Class C | - | 585,019 |
Institutional Class | 1,396,421 | 10,634,898 |
Total | $ 4,039,445 | $ 40,765,226 |
From net realized gain | | |
Class A | $ 44,132,595 | $ 7,915,192 |
Class T | 9,895,307 | 1,715,030 |
Class B | 642,741 | 137,323 |
Class C | 1,904,406 | 342,181 |
Institutional Class | 18,153,440 | 2,964,978 |
Total | $ 74,728,489 | $ 13,074,704 |
Advisor Freedom 2035 | | |
From net investment income | | |
Class A | $ 1,192,449 | $ 16,875,467 |
Class T | 86,655 | 2,349,822 |
Class B | - | 135,304 |
Class C | - | 332,280 |
Institutional Class | 860,159 | 7,474,365 |
Total | $ 2,139,263 | $ 27,167,238 |
From net realized gain | | |
Class A | $ 46,306,621 | $ 3,487,770 |
Class T | 8,076,146 | 574,019 |
Class B | 624,641 | 55,352 |
Class C | 1,621,494 | 122,062 |
Institutional Class | 20,041,651 | 1,344,229 |
Total | $ 76,670,553 | $ 5,583,432 |
Semiannual Report
6. Distributions to Shareholders - continued
| Six months ended
September 30, 2013 | Year ended
March 31, 2013 |
Advisor Freedom 2040 | | |
From net investment income | | |
Class A | $ 1,097,416 | $ 15,416,805 |
Class T | 85,902 | 3,246,224 |
Class B | - | 187,384 |
Class C | - | 477,964 |
Institutional Class | 790,801 | 7,173,233 |
Total | $ 1,974,119 | $ 26,501,610 |
From net realized gain | | |
Class A | $ 41,532,752 | $ 3,045,286 |
Class T | 10,566,271 | 769,855 |
Class B | 827,214 | 73,757 |
Class C | 2,286,483 | 168,492 |
Institutional Class | 18,527,339 | 1,229,840 |
Total | $ 73,740,059 | $ 5,287,230 |
Advisor Freedom 2045 | | |
From net investment income | | |
Class A | $ 520,632 | $ 6,957,403 |
Class T | 37,622 | 988,121 |
Class B | - | 27,566 |
Class C | - | 101,775 |
Institutional Class | 420,795 | 3,609,466 |
Total | $ 979,049 | $ 11,684,331 |
From net realized gain | | |
Class A | $ 11,089,758 | $ 6,744,595 |
Class T | 2,003,353 | 1,044,959 |
Class B | 71,783 | 57,582 |
Class C | 280,418 | 162,607 |
Institutional Class | 5,601,606 | 2,864,235 |
Total | $ 19,046,918 | $ 10,873,978 |
Advisor Freedom 2050 | | |
From net investment income | | |
Class A | $ 313,112 | $ 4,634,192 |
Class T | 36,098 | 923,527 |
Class B | - | 42,092 |
Class C | - | 123,643 |
Institutional Class | 297,082 | 2,647,530 |
Total | $ 646,292 | $ 8,370,984 |
From net realized gain | | |
Class A | $ 7,445,118 | $ 1,465,892 |
Class T | 1,931,226 | 345,032 |
Class B | 108,074 | 25,867 |
Class C | 328,577 | 67,326 |
Institutional Class | 4,237,094 | 711,612 |
Total | $ 14,050,089 | $ 2,615,729 |
Semiannual Report
Notes to Financial Statements (Unaudited) - continued
6. Distributions to Shareholders - continued
| Six months ended
September 30, 2013 | Year ended
March 31, 2013 |
Advisor Freedom 2055 | | |
From net investment income | | |
Class A | $ 21,336 | $ 273,976 |
Class T | 777 | 55,233 |
Class C | - | 2,070 |
Institutional Class | 22,250 | 141,893 |
Total | $ 44,363 | $ 473,172 |
From net realized gain | | |
Class A | $ 426,693 | $ 68,154 |
Class T | 93,872 | 17,814 |
Class C | 12,499 | 6,257 |
Institutional Class | 242,729 | 37,584 |
Total | $ 775,793 | $ 129,809 |
7. Share Transactions.
Transactions for each class of shares were as follows:
| Shares | Dollars |
| Six months ended
September 30,
2013 | Year ended
March 31,
2013 | Six months ended
September 30,
2013 | Year ended
March 31,
2013 |
Advisor Freedom Income | | | | |
Class A | | | | |
Shares sold | 2,127,608 | 5,667,328 | $ 23,600,685 | $ 62,675,823 |
Reinvestment of distributions | 233,337 | 368,047 | 2,598,148 | 4,049,319 |
Shares redeemed | (3,275,171) | (5,438,505) | (36,202,478) | (60,152,423) |
Net increase (decrease) | (914,226) | 596,870 | $ (10,003,645) | $ 6,572,719 |
Class T | | | | |
Shares sold | 949,875 | 1,752,672 | $ 10,523,058 | $ 19,341,827 |
Reinvestment of distributions | 65,060 | 97,192 | 724,314 | 1,067,874 |
Shares redeemed | (1,244,182) | (2,181,141) | (13,735,429) | (24,078,105) |
Net increase (decrease) | (229,247) | (331,277) | $ (2,488,057) | $ (3,668,404) |
Class B | | | | |
Shares sold | 2,322 | 13,728 | $ 26,023 | $ 151,709 |
Reinvestment of distributions | 1,998 | 3,419 | 22,258 | 37,528 |
Shares redeemed | (30,737) | (75,727) | (340,211) | (836,079) |
Net increase (decrease) | (26,417) | (58,580) | $ (291,930) | $ (646,842) |
Class C | | | | |
Shares sold | 125,978 | 326,072 | $ 1,395,075 | $ 3,593,856 |
Reinvestment of distributions | 13,707 | 19,976 | 152,687 | 219,246 |
Shares redeemed | (222,037) | (428,327) | (2,451,845) | (4,730,145) |
Net increase (decrease) | (82,352) | (82,279) | $ (904,083) | $ (917,043) |
Institutional Class | | | | |
Shares sold | 1,503,550 | 3,768,736 | $ 16,650,115 | $ 41,751,702 |
Reinvestment of distributions | 109,483 | 161,577 | 1,220,655 | 1,781,582 |
Shares redeemed | (1,593,395) | (2,467,458) | (17,694,370) | (27,262,092) |
Net increase (decrease) | 19,638 | 1,462,855 | $ 176,400 | $ 16,271,192 |
Advisor Freedom 2005 | | | | |
Class A | | | | |
Shares sold | 2,439,583 | 5,950,479 | $ 28,962,357 | $ 69,001,688 |
Reinvestment of distributions | 125,138 | 296,966 | 1,494,144 | 3,414,979 |
Shares redeemed | (3,432,513) | (6,013,562) | (40,833,056) | (69,615,909) |
Net increase (decrease) | (867,792) | 233,883 | $ (10,376,555) | $ 2,800,758 |
Semiannual Report
7. Share Transactions - continued
| Shares | Dollars |
| Six months ended
September 30,
2013 | Year ended
March 31,
2013 | Six months ended
September 30,
2013 | Year ended
March 31,
2013 |
Advisor Freedom 2005 | | | | |
Class T | | | | |
Shares sold | 763,163 | 1,289,243 | $ 9,063,185 | $ 14,935,857 |
Reinvestment of distributions | 16,130 | 30,601 | 192,591 | 352,432 |
Shares redeemed | (662,766) | (1,066,736) | (7,860,505) | (12,303,077) |
Net increase (decrease) | 116,527 | 253,108 | $ 1,395,271 | $ 2,985,212 |
Class B | | | | |
Shares sold | 7,317 | 652 | $ 86,101 | $ 7,549 |
Reinvestment of distributions | 573 | 1,083 | 6,870 | 12,534 |
Shares redeemed | (11,742) | (41,276) | (138,505) | (481,200) |
Net increase (decrease) | (3,852) | (39,541) | $ (45,534) | $ (461,117) |
Class C | | | | |
Shares sold | 100,114 | 173,944 | $ 1,182,757 | $ 2,021,586 |
Reinvestment of distributions | 3,910 | 6,077 | 46,649 | 70,003 |
Shares redeemed | (36,446) | (201,333) | (432,960) | (2,316,273) |
Net increase (decrease) | 67,578 | (21,312) | $ 796,446 | $ (224,684) |
Institutional Class | | | | |
Shares sold | 1,517,703 | 3,014,914 | $ 18,148,736 | $ 35,073,813 |
Reinvestment of distributions | 47,781 | 102,306 | 573,852 | 1,182,672 |
Shares redeemed | (1,642,132) | (1,314,929) | (19,629,453) | (15,314,119) |
Net increase (decrease) | (76,648) | 1,802,291 | $ (906,865) | $ 20,942,366 |
Advisor Freedom 2010 | | | | |
Class A | | | | |
Shares sold | 5,251,004 | 12,708,869 | $ 65,509,212 | $ 153,017,064 |
Reinvestment of distributions | 482,691 | 915,288 | 6,052,943 | 10,935,441 |
Shares redeemed | (8,212,668) | (16,811,351) | (102,673,254) | (202,005,316) |
Net increase (decrease) | (2,478,973) | (3,187,194) | $ (31,111,099) | $ (38,052,811) |
Class T | | | | |
Shares sold | 1,988,555 | 3,712,396 | $ 24,769,437 | $ 44,524,286 |
Reinvestment of distributions | 109,343 | 183,018 | 1,367,885 | 2,182,056 |
Shares redeemed | (2,151,946) | (4,809,687) | (26,775,213) | (57,632,993) |
Net increase (decrease) | (54,048) | (914,273) | $ (637,891) | $ (10,926,651) |
Class B | | | | |
Shares sold | 2,091 | 9,563 | $ 26,054 | $ 115,968 |
Reinvestment of distributions | 4,319 | 6,587 | 54,166 | 78,910 |
Shares redeemed | (134,739) | (268,639) | (1,681,733) | (3,216,272) |
Net increase (decrease) | (128,329) | (252,489) | $ (1,601,513) | $ (3,021,394) |
Class C | | | | |
Shares sold | 242,554 | 499,095 | $ 3,007,095 | $ 5,991,309 |
Reinvestment of distributions | 27,051 | 36,663 | 336,513 | 435,812 |
Shares redeemed | (414,658) | (681,672) | (5,132,115) | (8,150,135) |
Net increase (decrease) | (145,053) | (145,914) | $ (1,788,507) | $ (1,723,014) |
Institutional Class | | | | |
Shares sold | 3,673,331 | 7,292,808 | $ 46,090,376 | $ 88,270,797 |
Reinvestment of distributions | 189,747 | 351,077 | 2,387,014 | 4,208,551 |
Shares redeemed | (3,434,320) | (5,034,949) | (43,073,302) | (60,844,334) |
Net increase (decrease) | 428,758 | 2,608,936 | $ 5,404,088 | $ 31,635,014 |
Advisor Freedom 2015 | | | | |
Class A | | | | |
Shares sold | 11,822,758 | 28,506,295 | $ 146,918,566 | $ 342,099,746 |
Reinvestment of distributions | 1,656,125 | 1,974,621 | 20,668,444 | 23,498,680 |
Shares redeemed | (17,748,439) | (28,730,020) | (220,413,154) | (344,939,129) |
Net increase (decrease) | (4,269,556) | 1,750,896 | $ (52,826,144) | $ 20,659,297 |
Semiannual Report
Notes to Financial Statements (Unaudited) - continued
7. Share Transactions - continued
| Shares | Dollars |
| Six months ended
September 30,
2013 | Year ended
March 31,
2013 | Six months ended
September 30,
2013 | Year ended
March 31,
2013 |
Advisor Freedom 2015 | | | | |
Class T | | | | |
Shares sold | 3,671,924 | 7,048,273 | $ 45,534,032 | $ 84,377,992 |
Reinvestment of distributions | 304,740 | 321,618 | 3,800,102 | 3,825,959 |
Shares redeemed | (3,781,181) | (7,173,479) | (46,927,498) | (85,670,361) |
Net increase (decrease) | 195,483 | 196,412 | $ 2,406,636 | $ 2,533,590 |
Class B | | | | |
Shares sold | 11,654 | 18,918 | $ 143,580 | $ 230,299 |
Reinvestment of distributions | 19,480 | 17,784 | 242,911 | 211,983 |
Shares redeemed | (285,193) | (631,455) | (3,531,583) | (7,538,504) |
Net increase (decrease) | (254,059) | (594,753) | $ (3,145,092) | $ (7,096,222) |
Class C | | | | |
Shares sold | 622,383 | 1,112,764 | $ 7,659,257 | $ 13,243,553 |
Reinvestment of distributions | 87,547 | 73,853 | 1,086,460 | 876,636 |
Shares redeemed | (707,866) | (1,330,728) | (8,744,282) | (15,851,708) |
Net increase (decrease) | 2,064 | (144,111) | $ 1,435 | $ (1,731,519) |
Institutional Class | | | | |
Shares sold | 7,840,567 | 16,268,843 | $ 98,081,157 | $ 196,562,251 |
Reinvestment of distributions | 684,252 | 782,959 | 8,601,045 | 9,370,557 |
Shares redeemed | (8,040,817) | (8,997,016) | (100,382,528) | (108,722,993) |
Net increase (decrease) | 484,002 | 8,054,786 | $ 6,299,674 | $ 97,209,815 |
Advisor Freedom 2020 | | | | |
Class A | | | | |
Shares sold | 19,365,269 | 44,416,958 | $ 251,542,064 | $ 555,194,594 |
Reinvestment of distributions | 3,062,857 | 3,073,389 | 39,817,141 | 38,099,250 |
Shares redeemed | (25,715,135) | (39,485,922) | (333,808,007) | (494,297,897) |
Net increase (decrease) | (3,287,009) | 8,004,425 | $ (42,448,802) | $ 98,995,947 |
Class T | | | | |
Shares sold | 6,517,644 | 12,011,989 | $ 84,591,367 | $ 150,203,034 |
Reinvestment of distributions | 657,577 | 579,475 | 8,548,496 | 7,192,079 |
Shares redeemed | (5,429,437) | (10,936,020) | (70,538,381) | (136,699,168) |
Net increase (decrease) | 1,745,784 | 1,655,444 | $ 22,601,482 | $ 20,695,945 |
Class B | | | | |
Shares sold | 14,441 | 23,018 | $ 188,912 | $ 283,038 |
Reinvestment of distributions | 42,098 | 32,154 | 547,279 | 399,675 |
Shares redeemed | (477,343) | (1,019,496) | (6,189,594) | (12,664,560) |
Net increase (decrease) | (420,804) | (964,324) | $ (5,453,403) | $ (11,981,847) |
Class C | | | | |
Shares sold | 1,017,435 | 1,650,086 | $ 13,118,586 | $ 20,539,871 |
Reinvestment of distributions | 137,912 | 95,759 | 1,783,201 | 1,184,544 |
Shares redeemed | (909,018) | (1,789,596) | (11,734,033) | (22,192,952) |
Net increase (decrease) | 246,329 | (43,751) | $ 3,167,754 | $ (468,537) |
Institutional Class | | | | |
Shares sold | 11,553,007 | 25,904,119 | $ 151,075,685 | $ 326,561,698 |
Reinvestment of distributions | 1,261,074 | 1,214,162 | 16,494,851 | 15,144,940 |
Shares redeemed | (9,962,598) | (12,665,795) | (130,221,898) | (158,809,529) |
Net increase (decrease) | 2,851,483 | 14,452,486 | $ 37,348,638 | $ 182,897,109 |
Advisor Freedom 2025 | | | | |
Class A | | | | |
Shares sold | 21,484,719 | 46,832,812 | $ 270,536,519 | $ 564,656,133 |
Reinvestment of distributions | 4,392,566 | 2,817,136 | 55,214,568 | 33,682,400 |
Shares redeemed | (23,310,835) | (36,915,729) | (294,143,281) | (445,620,144) |
Net increase (decrease) | 2,566,450 | 12,734,219 | $ 31,607,806 | $ 152,718,389 |
Semiannual Report
7. Share Transactions - continued
| Shares | Dollars |
| Six months ended
September 30,
2013 | Year ended
March 31,
2013 | Six months ended
September 30,
2013 | Year ended
March 31,
2013 |
Advisor Freedom 2025 | | | | |
Class T | | | | |
Shares sold | 5,861,332 | 10,475,315 | $ 74,105,083 | $ 126,787,508 |
Reinvestment of distributions | 776,118 | 421,842 | 9,779,081 | 5,059,334 |
Shares redeemed | (4,155,999) | (7,029,069) | (52,642,773) | (84,713,362) |
Net increase (decrease) | 2,481,451 | 3,868,088 | $ 31,241,391 | $ 47,133,480 |
Class B | | | | |
Shares sold | 9,171 | 33,837 | $ 116,540 | $ 402,830 |
Reinvestment of distributions | 47,736 | 22,745 | 597,652 | 271,803 |
Shares redeemed | (329,923) | (700,042) | (4,141,565) | (8,354,336) |
Net increase (decrease) | (273,016) | (643,460) | $ (3,427,373) | $ (7,679,703) |
Class C | | | | |
Shares sold | 969,953 | 1,362,294 | $ 12,098,122 | $ 16,242,141 |
Reinvestment of distributions | 167,133 | 75,516 | 2,082,477 | 897,881 |
Shares redeemed | (652,554) | (1,133,462) | (8,143,338) | (13,531,664) |
Net increase (decrease) | 484,532 | 304,348 | $ 6,037,261 | $ 3,608,358 |
Institutional Class | | | | |
Shares sold | 12,239,737 | 24,213,764 | $ 155,528,718 | $ 294,374,445 |
Reinvestment of distributions | 1,696,531 | 1,063,922 | 21,478,082 | 12,801,944 |
Shares redeemed | (7,937,045) | (10,933,983) | (100,783,376) | (132,325,157) |
Net increase (decrease) | 5,999,223 | 14,343,703 | $ 76,223,424 | $ 174,851,232 |
Advisor Freedom 2030 | | | | |
Class A | | | | |
Shares sold | 17,393,699 | 41,613,890 | $ 231,903,056 | $ 525,837,935 |
Reinvestment of distributions | 3,467,908 | 2,585,181 | 46,019,142 | 32,378,742 |
Shares redeemed | (21,450,374) | (34,146,152) | (285,945,603) | (432,000,548) |
Net increase (decrease) | (588,767) | 10,052,919 | $ (8,023,405) | $ 126,216,129 |
Class T | | | | |
Shares sold | 5,845,270 | 11,109,856 | $ 77,608,720 | $ 139,954,510 |
Reinvestment of distributions | 756,816 | 492,157 | 10,020,241 | 6,152,559 |
Shares redeemed | (4,783,389) | (9,495,122) | (63,739,773) | (119,272,485) |
Net increase (decrease) | 1,818,697 | 2,106,891 | $ 23,889,188 | $ 26,834,584 |
Class B | | | | |
Shares sold | 11,434 | 20,379 | $ 152,483 | $ 253,313 |
Reinvestment of distributions | 45,593 | 25,911 | 602,738 | 324,148 |
Shares redeemed | (335,466) | (766,318) | (4,450,354) | (9,575,940) |
Net increase (decrease) | (278,439) | (720,028) | $ (3,695,133) | $ (8,998,479) |
Class C | | | | |
Shares sold | 824,346 | 1,523,134 | $ 10,881,111 | $ 19,092,460 |
Reinvestment of distributions | 136,419 | 69,617 | 1,795,277 | 867,428 |
Shares redeemed | (681,520) | (1,266,642) | (8,989,275) | (15,862,398) |
Net increase (decrease) | 279,245 | 326,109 | $ 3,687,113 | $ 4,097,490 |
Institutional Class | | | | |
Shares sold | 11,966,615 | 22,913,292 | $ 160,453,428 | $ 291,232,690 |
Reinvestment of distributions | 1,465,805 | 1,079,513 | 19,539,185 | 13,569,835 |
Shares redeemed | (8,722,395) | (10,947,359) | (116,763,833) | (138,321,010) |
Net increase (decrease) | 4,710,025 | 13,045,446 | $ 63,228,780 | $ 166,481,515 |
Advisor Freedom 2035 | | | | |
Class A | | | | |
Shares sold | 15,328,725 | 34,835,056 | $ 194,288,373 | $ 415,484,819 |
Reinvestment of distributions | 3,756,210 | 1,706,155 | 47,102,871 | 20,199,297 |
Shares redeemed | (15,983,339) | (27,311,897) | (202,574,328) | (326,166,700) |
Net increase (decrease) | 3,101,596 | 9,229,314 | $ 38,816,916 | $ 109,517,416 |
Semiannual Report
Notes to Financial Statements (Unaudited) - continued
7. Share Transactions - continued
| Shares | Dollars |
| Six months ended
September 30,
2013 | Year ended
March 31,
2013 | Six months ended
September 30,
2013 | Year ended
March 31,
2013 |
Advisor Freedom 2035 | | | | |
Class T | | | | |
Shares sold | 4,739,387 | 8,091,085 | $ 59,651,621 | $ 96,019,491 |
Reinvestment of distributions | 644,594 | 243,254 | 8,044,532 | 2,870,268 |
Shares redeemed | (3,279,646) | (5,444,520) | (41,406,993) | (64,446,129) |
Net increase (decrease) | 2,104,335 | 2,889,819 | $ 26,289,160 | $ 34,443,630 |
Class B | | | | |
Shares sold | 8,764 | 11,260 | $ 109,455 | $ 131,688 |
Reinvestment of distributions | 48,167 | 15,412 | 597,268 | 181,095 |
Shares redeemed | (211,235) | (493,168) | (2,643,503) | (5,777,414) |
Net increase (decrease) | (154,304) | (466,496) | $ (1,936,780) | $ (5,464,631) |
Class C | | | | |
Shares sold | 552,164 | 873,123 | $ 6,879,029 | $ 10,285,137 |
Reinvestment of distributions | 125,573 | 36,956 | 1,553,338 | 433,119 |
Shares redeemed | (300,343) | (766,094) | (3,735,784) | (8,970,033) |
Net increase (decrease) | 377,394 | 143,985 | $ 4,696,583 | $ 1,748,223 |
Institutional Class | | | | |
Shares sold | 10,067,478 | 19,774,112 | $ 128,261,755 | $ 237,955,566 |
Reinvestment of distributions | 1,654,714 | 738,822 | 20,849,394 | 8,780,433 |
Shares redeemed | (7,689,187) | (8,196,096) | (97,937,852) | (97,924,593) |
Net increase (decrease) | 4,033,005 | 12,316,838 | $ 51,173,297 | $ 148,811,406 |
Advisor Freedom 2040 | | | | |
Class A | | | | |
Shares sold | 13,741,196 | 28,004,111 | $ 185,910,809 | $ 355,673,696 |
Reinvestment of distributions | 3,150,109 | 1,447,450 | 42,242,959 | 18,293,644 |
Shares redeemed | (14,826,865) | (22,935,436) | (200,786,772) | (292,260,264) |
Net increase (decrease) | 2,064,440 | 6,516,125 | $ 27,366,996 | $ 81,707,076 |
Class T | | | | |
Shares sold | 4,175,854 | 7,602,047 | $ 56,395,548 | $ 96,328,995 |
Reinvestment of distributions | 784,260 | 312,761 | 10,493,403 | 3,950,120 |
Shares redeemed | (3,805,344) | (7,559,551) | (51,611,587) | (95,678,684) |
Net increase (decrease) | 1,154,770 | 355,257 | $ 15,277,364 | $ 4,600,431 |
Class B | | | | |
Shares sold | 4,871 | 6,103 | $ 64,725 | $ 76,395 |
Reinvestment of distributions | 58,893 | 19,509 | 782,097 | 245,030 |
Shares redeemed | (365,831) | (739,626) | (4,898,361) | (9,293,767) |
Net increase (decrease) | (302,067) | (714,014) | $ (4,051,539) | $ (8,972,342) |
Class C | | | | |
Shares sold | 545,553 | 962,998 | $ 7,278,488 | $ 12,120,904 |
Reinvestment of distributions | 164,891 | 49,059 | 2,183,158 | 614,213 |
Shares redeemed | (483,247) | (901,869) | (6,448,192) | (11,261,526) |
Net increase (decrease) | 227,197 | 110,188 | $ 3,013,454 | $ 1,473,591 |
Institutional Class | | | | |
Shares sold | 8,924,237 | 16,906,391 | $ 121,584,786 | $ 216,610,718 |
Reinvestment of distributions | 1,433,492 | 660,482 | 19,309,134 | 8,377,157 |
Shares redeemed | (5,698,086) | (8,263,973) | (77,598,363) | (105,030,652) |
Net increase (decrease) | 4,659,643 | 9,302,900 | $ 63,295,557 | $ 119,957,223 |
Advisor Freedom 2045 | | | | |
Class A | | | | |
Shares sold | 10,763,007 | 22,348,428 | $ 113,785,892 | $ 218,037,471 |
Reinvestment of distributions | 1,092,315 | 1,428,096 | 11,534,852 | 13,620,503 |
Shares redeemed | (9,597,942) | (14,594,828) | (101,338,137) | (143,000,136) |
Net increase (decrease) | 2,257,380 | 9,181,696 | $ 23,982,607 | $ 88,657,838 |
Semiannual Report
7. Share Transactions - continued
| Shares | Dollars |
| Six months ended
September 30,
2013 | Year ended
March 31,
2013 | Six months ended
September 30,
2013 | Year ended
March 31,
2013 |
Advisor Freedom 2045 | | | | |
Class T | | | | |
Shares sold | 3,064,460 | 5,253,099 | $ 32,252,012 | $ 51,047,511 |
Reinvestment of distributions | 193,728 | 213,016 | 2,038,018 | 2,024,121 |
Shares redeemed | (1,838,186) | (2,939,816) | (19,421,996) | (28,557,658) |
Net increase (decrease) | 1,420,002 | 2,526,299 | $ 14,868,034 | $ 24,513,974 |
Class B | | | | |
Shares sold | 1,176 | 3,515 | $ 12,449 | $ 31,735 |
Reinvestment of distributions | 6,637 | 8,787 | 69,693 | 82,887 |
Shares redeemed | (29,473) | (49,903) | (310,467) | (482,094) |
Net increase (decrease) | (21,660) | (37,601) | $ (228,325) | $ (367,472) |
Class C | | | | |
Shares sold | 317,072 | 518,274 | $ 3,304,370 | $ 5,021,009 |
Reinvestment of distributions | 26,496 | 27,552 | 277,147 | 259,896 |
Shares redeemed | (161,198) | (272,934) | (1,686,237) | (2,637,588) |
Net increase (decrease) | 182,370 | 272,892 | $ 1,895,280 | $ 2,643,317 |
Institutional Class | | | | |
Shares sold | 7,940,334 | 13,436,841 | $ 84,229,192 | $ 132,476,916 |
Reinvestment of distributions | 568,004 | 671,239 | 6,020,842 | 6,432,276 |
Shares redeemed | (4,351,433) | (4,998,582) | (46,122,807) | (48,855,267) |
Net increase (decrease) | 4,156,905 | 9,109,498 | $ 44,127,227 | $ 90,053,925 |
Advisor Freedom 2050 | | | | |
Class A | | | | |
Shares sold | 7,663,793 | 15,759,974 | $ 80,531,968 | $ 152,322,278 |
Reinvestment of distributions | 731,350 | 630,390 | 7,671,857 | 6,034,537 |
Shares redeemed | (6,616,416) | (11,627,846) | (69,465,373) | (112,817,332) |
Net increase (decrease) | 1,778,727 | 4,762,518 | $ 18,738,452 | $ 45,539,483 |
Class T | | | | |
Shares sold | 2,482,375 | 4,570,956 | $ 25,952,463 | $ 44,088,375 |
Reinvestment of distributions | 187,633 | 131,758 | 1,962,644 | 1,260,447 |
Shares redeemed | (1,711,782) | (2,827,192) | (18,021,056) | (27,249,174) |
Net increase (decrease) | 958,226 | 1,875,522 | $ 9,894,051 | $ 18,099,648 |
Class B | | | | |
Shares sold | 5,070 | 330 | $ 51,641 | $ 3,096 |
Reinvestment of distributions | 10,041 | 6,911 | 104,630 | 65,663 |
Shares redeemed | (49,566) | (62,118) | (521,199) | (591,359) |
Net increase (decrease) | (34,455) | (54,877) | $ (364,928) | $ (522,600) |
Class C | | | | |
Shares sold | 297,249 | 469,493 | $ 3,084,375 | $ 4,511,086 |
Reinvestment of distributions | 30,767 | 19,364 | 320,597 | 184,167 |
Shares redeemed | (149,570) | (316,364) | (1,557,961) | (3,039,772) |
Net increase (decrease) | 178,446 | 172,493 | $ 1,847,011 | $ 1,655,481 |
Institutional Class | | | | |
Shares sold | 5,989,467 | 10,323,520 | $ 63,235,231 | $ 100,853,706 |
Reinvestment of distributions | 430,167 | 347,891 | 4,533,950 | 3,344,639 |
Shares redeemed | (3,270,141) | (4,410,206) | (34,548,529) | (42,706,449) |
Net increase (decrease) | 3,149,493 | 6,261,205 | $ 33,220,652 | $ 61,491,896 |
Advisor Freedom 2055 | | | | |
Class A | | | | |
Shares sold | 2,996,089 | 3,664,304 | $ 32,343,544 | $ 36,168,205 |
Reinvestment of distributions | 41,392 | 35,066 | 446,206 | 341,179 |
Shares redeemed | (992,247) | (897,204) | (10,716,396) | (8,919,848) |
Net increase (decrease) | 2,045,234 | 2,802,166 | $ 22,073,354 | $ 27,589,536 |
Semiannual Report
Notes to Financial Statements (Unaudited) - continued
7. Share Transactions - continued
| Shares | Dollars |
| Six months ended
September 30,
2013 | Year ended
March 31,
2013 | Six months ended
September 30,
2013 | Year ended
March 31,
2013 |
Advisor Freedom 2055 | | | | |
Class T | | | | |
Shares sold | 641,407 | 865,233 | $ 6,913,222 | $ 8,537,245 |
Reinvestment of distributions | 8,794 | 7,527 | 94,622 | 73,047 |
Shares redeemed | (163,614) | (334,621) | (1,769,492) | (3,311,442) |
Net increase (decrease) | 486,587 | 538,139 | $ 5,238,352 | $ 5,298,850 |
Class C | | | | |
Shares sold | 54,977 | 90,384 | $ 592,325 | $ 903,238 |
Reinvestment of distributions | 1,158 | 877 | 12,499 | 8,307 |
Shares redeemed | (14,273) | (103,499) | (154,667) | (1,002,740) |
Net increase (decrease) | 41,862 | (12,238) | $ 450,157 | $ (91,195) |
Institutional Class | | | | |
Shares sold | 1,761,121 | 1,958,189 | $ 19,049,037 | $ 19,433,573 |
Reinvestment of distributions | 24,535 | 18,452 | 264,980 | 179,477 |
Shares redeemed | (407,823) | (491,376) | (4,409,419) | (4,844,931) |
Net increase (decrease) | 1,377,833 | 1,485,265 | $ 14,904,598 | $ 14,768,119 |
8. Other.
The Funds' organizational documents provide former and current trustees and officers with a limited indemnification against liabilities arising in connection with the performance of their duties to the Funds. In the normal course of business, the Funds may also enter into contracts that provide general indemnifications. The Funds' maximum exposure under these arrangements is unknown as this would be dependent on future claims that may be made against the Funds. The risk of material loss from such claims is considered remote.
The Funds do not invest in the Underlying Funds for the purpose of exercising management or control; however, investments by the Funds within their principal investment strategies may represent a significant portion of the Underlying Fund's net assets. At the end of the period, the following Advisor Freedom Funds were the owners of record of 10% or more of the total outstanding shares of the Underlying Funds.
Fund | Fidelity Advisor Freedom 2020 Fund | Fidelity Advisor Freedom 2025 Fund | Fidelity Advisor Freedom 2030 Fund | Fidelity Advisor Freedom 2035 Fund | Fidelity Advisor Freedom 2040 Fund |
Fidelity Advisor Series Equity-Income Fund | 14% | 16% | 17% | 14% | 14% |
Fidelity Advisor Series Growth & Income Fund | 14% | 16% | 17% | 14% | 14% |
Fidelity Advisor Series Opportunistic Insights Fund | 14% | 16% | 17% | 14% | 14% |
Fidelity Advisor Series Stock Selector Large Cap Value Fund | 14% | 16% | 17% | 14% | 14% |
The Funds, in aggregate, were the owners of record of more than 20% of the total outstanding shares of the following Underlying Funds.
Fund | % of shares held |
Fidelity Advisor Equity Growth Fund | 30% |
Fidelity Advisor Short Fixed-Income Fund | 32% |
Fidelity Advisor Large Cap Fund | 50% |
Fidelity Advisor Series Equity-Income Fund | 100% |
Fidelity Advisor Series Growth & Income Fund | 100% |
Fidelity Advisor Series Opportunistic Insights Fund | 100% |
Fidelity Advisor Series Stock Selector Large Cap Value Fund | 100% |
Semiannual Report
Board Approval of Investment Advisory Contracts and Management Fees
Advisor Freedom Funds
Each year, the Board of Trustees, including the Independent Trustees (together, the Board), votes on the renewal of the management contract (the Advisory Contract) with Strategic Advisers, Inc. (Strategic Advisers) and the administration agreement for each fund. The Board, assisted by the advice of fund counsel and Independent Trustees' counsel, requests and considers a broad range of information relevant to the renewal of the Advisory Contracts throughout the year.
The Board meets regularly and, at each of its meetings, covers an extensive agenda of topics and materials and considers factors that are relevant to its annual consideration of the renewal of each fund's Advisory Contract, including the services and support provided to each fund and its shareholders. The Board has established four standing committees, Operations, Audit, Fair Valuation, and Governance and Nominating, each composed of and chaired by Independent Trustees with varying backgrounds, to which the Board has assigned specific subject matter responsibilities in order to enhance effective decision-making by the Board. The Operations Committee, of which all of the Independent Trustees are members, meets regularly throughout the year and, among other matters, considers matters specifically related to the annual consideration of the renewal of each fund's Advisory Contract. The Board, acting directly and through its Committees, requests and receives information concerning the annual consideration of the renewal of each fund's Advisory Contract. The Board also meets as needed to consider matters specifically related to the Board's annual consideration of the renewal of Advisory Contracts. Members of the Board may also meet with trustees of other Fidelity funds through ad hoc joint committees to discuss certain matters relevant to the Fidelity funds.
At its September 2013 meeting, the Board, including the Independent Trustees, unanimously determined to renew each fund's Advisory Contract. In reaching its determination, the Board considered all factors it believed relevant and reached a determination, with the assistance of fund counsel and Independent Trustees' counsel and through the exercise of its business judgment, that the renewal of the Advisory Contract was in the best interests of each fund and its shareholders and the fact that no fees are payable under the Advisory Contracts was fair and reasonable. The Board's decision to renew the Advisory Contracts was not based on any single factor, but rather was based on a comprehensive consideration of all the information provided to the Board at its meetings throughout the year. In reaching its determination, the Board was aware that shareholders in each fund have a broad range of investment choices available to them, including a wide choice among mutual funds offered by Fidelity's competitors, and that each fund's shareholders, who have the opportunity to review and weigh the disclosure provided by the fund in its prospectus and other public disclosures, have chosen to invest in that fund, which is part of the Fidelity family of funds.
Nature, Extent, and Quality of Services Provided. The Board considered Fidelity's staffing as it relates to the funds, including the backgrounds of investment personnel of Strategic Advisers, and also considered the funds' investment objectives, strategies, and related investment philosophies. The Independent Trustees also had discussions with senior management of Fidelity's investment operations and investment groups with responsibility for the underlying Fidelity funds in which each fund invests. The Board considered the structure of the portfolio manager compensation program and whether this structure provides appropriate incentives to act in the best interests of each fund.
Resources Dedicated to Investment Management and Support Services. The Board reviewed the general qualifications and capabilities of Fidelity's investment staff, including its size, education, experience, and resources, as well as Fidelity's approach to recruiting, managing, and compensating investment personnel. The Board noted that Fidelity has continued to increase the resources devoted to non-U.S. offices, including expansion of Fidelity's global investment organization. The Board also noted that Fidelity's analysts have extensive resources, tools and capabilities that allow them to conduct sophisticated quantitative and fundamental analysis, as well as credit analysis of issuers, counterparties and guarantors. Further, the Board believes that Fidelity's investment professionals have sufficient access to global information and data so as to provide competitive investment results over time, and that those professionals also have access to sophisticated tools that permit them to assess portfolio construction and risk and performance attribution characteristics continuously, as well as to transmit new information and research conclusions rapidly around the world. Additionally, in its deliberations, the Board considered Fidelity's risk management capabilities and resources, which are an integral part of the investment management process.
Shareholder and Administrative Services. The Board considered (i) the nature, extent, quality, and cost of advisory, administrative, and shareholder services performed by Fidelity affiliates under the Advisory Contract and the administration agreement and under separate agreements covering transfer agency and pricing and bookkeeping services for each fund; (ii) the nature and extent of the supervision of third party service providers, principally custodians and subcustodians; and (iii) the resources devoted to, and the record of compliance with, each fund's compliance policies and procedures.
The Board noted that the growth of fund assets over time across the complex allows Fidelity to reinvest in the development of services designed to enhance the value or convenience of the Fidelity funds as investment vehicles. These services include 24-hour access to account information and market information through telephone representatives and over the Internet, investor education materials and asset allocation tools, and the expanded availability of Fidelity Investor Centers.
Investment in a Large Fund Family. The Board considered the benefits to shareholders of investing in a Fidelity fund, including the benefits of investing in a fund that is part of a large family of funds offering a variety of investment disciplines and providing a large variety of mutual fund investor services. The Board noted that Fidelity had taken, or had made recommendations that resulted in the Fidelity funds taking, a number of actions over the previous year that benefited particular funds, including (i) continuing to dedicate additional resources to investment research and to the support of the senior management team that oversees asset management; (ii) persisting in efforts to enhance Fidelity's global research capabilities; (iii) launching new funds and making other enhancements to meet client needs for global and income-oriented solutions; (iv) continuing to launch dedicated lower cost underlying funds to meet portfolio construction needs related to expanding underlying fund options for Fidelity funds of funds, specifically for the Freedom Fund product lines; (v) rationalizing product lines and gaining increased efficiencies through the combination of several funds with other funds; (vi) strengthening Fidelity's index fund offerings by reducing investment minimums and adopting or lowering existing expense caps for certain funds and classes; (vii) enhancing Global Asset Allocation product offerings by launching new funds and strategies, including "open architecture" target date funds that utilize affiliated and unaffiliated sub-advisers; (viii) modifying the eligibility criteria for Institutional Class shares of Advisor funds to increase their marketability to a portion of the defined contribution plan market; (ix) creating a new low-cost retirement share class for certain Advisor funds to appeal to large retirement plans; (x) transitioning the management of certain Fidelity commodity funds to Geode Capital Management LLC, a registered commodity pool operator, while retaining administrative responsibilities for the funds; and (xi) taking steps toward establishing a new Fidelity adviser to manage sector-based funds and products.
Semiannual Report
Board Approval of Investment Advisory Contracts and Management Fees - continued
Investment Performance. The Board considered whether each fund has operated in accordance with its investment objective, as well as its record of compliance with its investment restrictions and its performance history.
The Board took into account discussions with the investment adviser about fund investment performance that occur at Board meetings throughout the year. In this regard the Board noted that as part of regularly scheduled fund reviews and other reports to the Board on fund performance, the Board periodically considers annualized return information for each fund for different time periods, measured against one or more securities market indices, including a customized blended index representative of the fund's asset classes (each a "benchmark index") and a peer group of mutual funds with similar objectives ("peer group"). In its evaluation of fund investment performance at meetings throughout the year, the Board gave particular attention to information indicating underperformance of certain Fidelity funds for specific time periods and the investment adviser's explanations for such underperformance.
In addition to reviewing absolute and relative fund performance, the Independent Trustees periodically consider the appropriateness of fund performance metrics in evaluating the results achieved. In general, the Independent Trustees believe that fund performance should be evaluated based on gross performance (before fees and expenses, including acquired fund fees and expenses, but after transaction costs, if any) compared to appropriate benchmark indices, over appropriate time periods that may include full market cycles, and on net performance (after fees and expenses) compared to peer groups, as applicable, over the same periods, taking into account relevant factors including the following: general market conditions; the extent to which particular underlying funds affected performance; and fund cash flows and other factors. Depending on the circumstances, the Independent Trustees may be satisfied with a fund's performance notwithstanding that it lags its benchmark index or peer group for certain periods.
The Independent Trustees recognize that shareholders evaluate performance on a net basis over their own holding periods, for which one-, three-, and five-year periods are often used as a proxy. For this reason, the performance information reviewed by the Board also included net cumulative calendar year total return information for each fund and an appropriate benchmark index for the most recent one-, three-, and five-year periods (for the most recent one-year period for Fidelity Advisor Freedom 2055 Fund).
Based on its review, the Board concluded that the nature, extent, and quality of services provided to each fund under the Advisory Contract should benefit each fund's shareholders.
Competitiveness of Management Fee and Total Expense Ratio. The Board noted that the funds do not pay Strategic Advisers a management fee for investment advisory services. The Board considered each fund's management fee and total expense ratio compared to "mapped groups" of competitive funds and classes, and also considered that each fund bears indirectly the expenses of the underlying Fidelity funds in which it invests. Fidelity creates "mapped groups" by combining similar Lipper investment objective categories that have comparable investment mandates. Combining Lipper investment objective categories aids the Board's management fee and total expense ratio comparisons by broadening the competitive group used for comparison and by reducing the number of universes to which various Fidelity funds are compared.
Management Fee. The Board considered two proprietary management fee comparisons for the 12-month (or shorter) periods shown in the charts below. The group of Lipper funds used by the Board for management fee comparisons is referred to below as the "Total Mapped Group." The Total Mapped Group comparison focuses on a fund's standing in terms of gross management fees before expense reimbursements or caps relative to the total universe of funds with comparable investment mandates, regardless of whether their management fee structures also are comparable. "TMG %" represents the percentage of funds in the Total Mapped Group that had management fees that were lower than a fund's. For example, a hypothetical TMG % of 50% would mean that half of the funds in the Total Mapped Group had higher, and half had lower, management fees than a fund. The funds' actual TMG %s are in the charts below. The "Asset-Size Peer Group" (ASPG) comparison focuses on a fund's standing relative to a subset of non-Fidelity funds within the Total Mapped Group that are similar in size and management fee structure. For example, if a fund is in the first quartile of the ASPG, the fund's management fee ranks in the least expensive or lowest 25% of funds in the ASPG. The ASPG represents at least 15% of the funds in the Total Mapped Group with comparable asset size and management fee structures, subject to a minimum of 50 funds (or all funds in the Total Mapped Group if fewer than 50). Additional information, such as the ASPG quartile in which a fund's management fee rate ranked, is also included in the charts and considered by the Board.
Semiannual Report
Advisor Freedom 2005 Fund
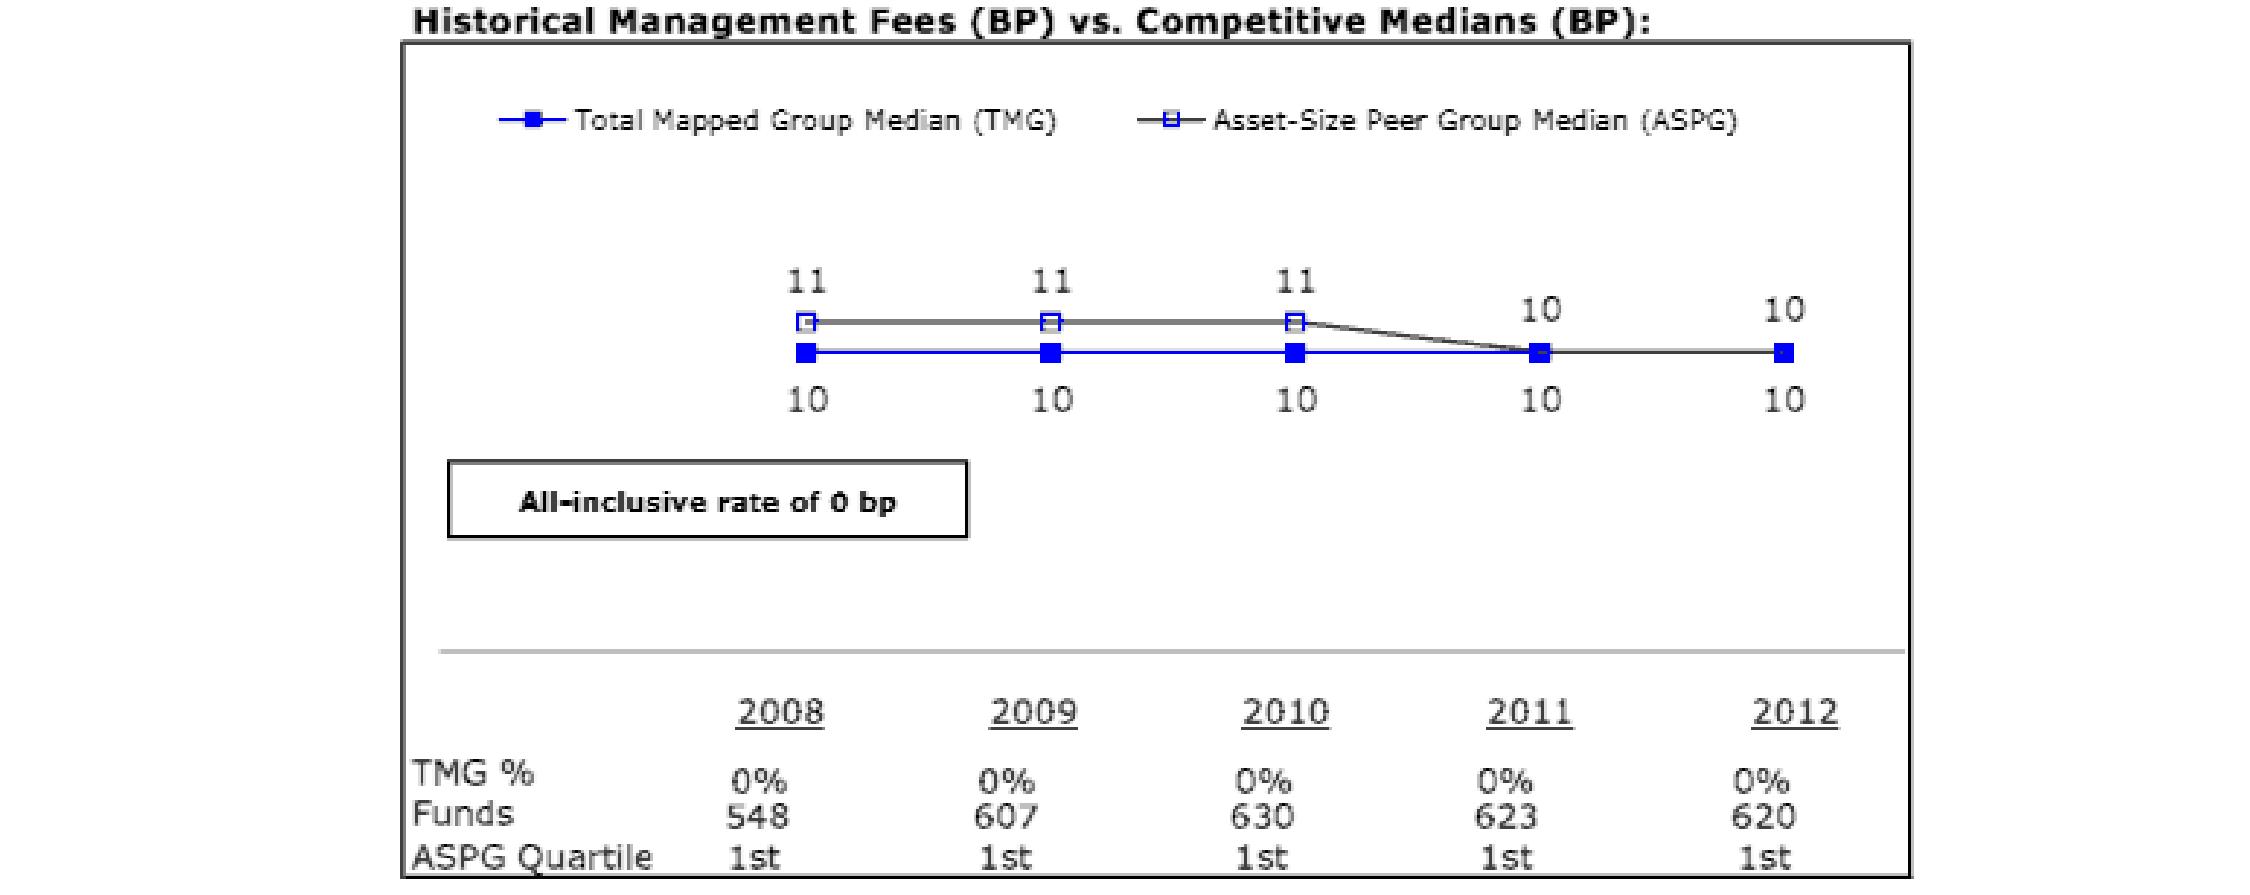
Advisor Freedom 2010 Fund
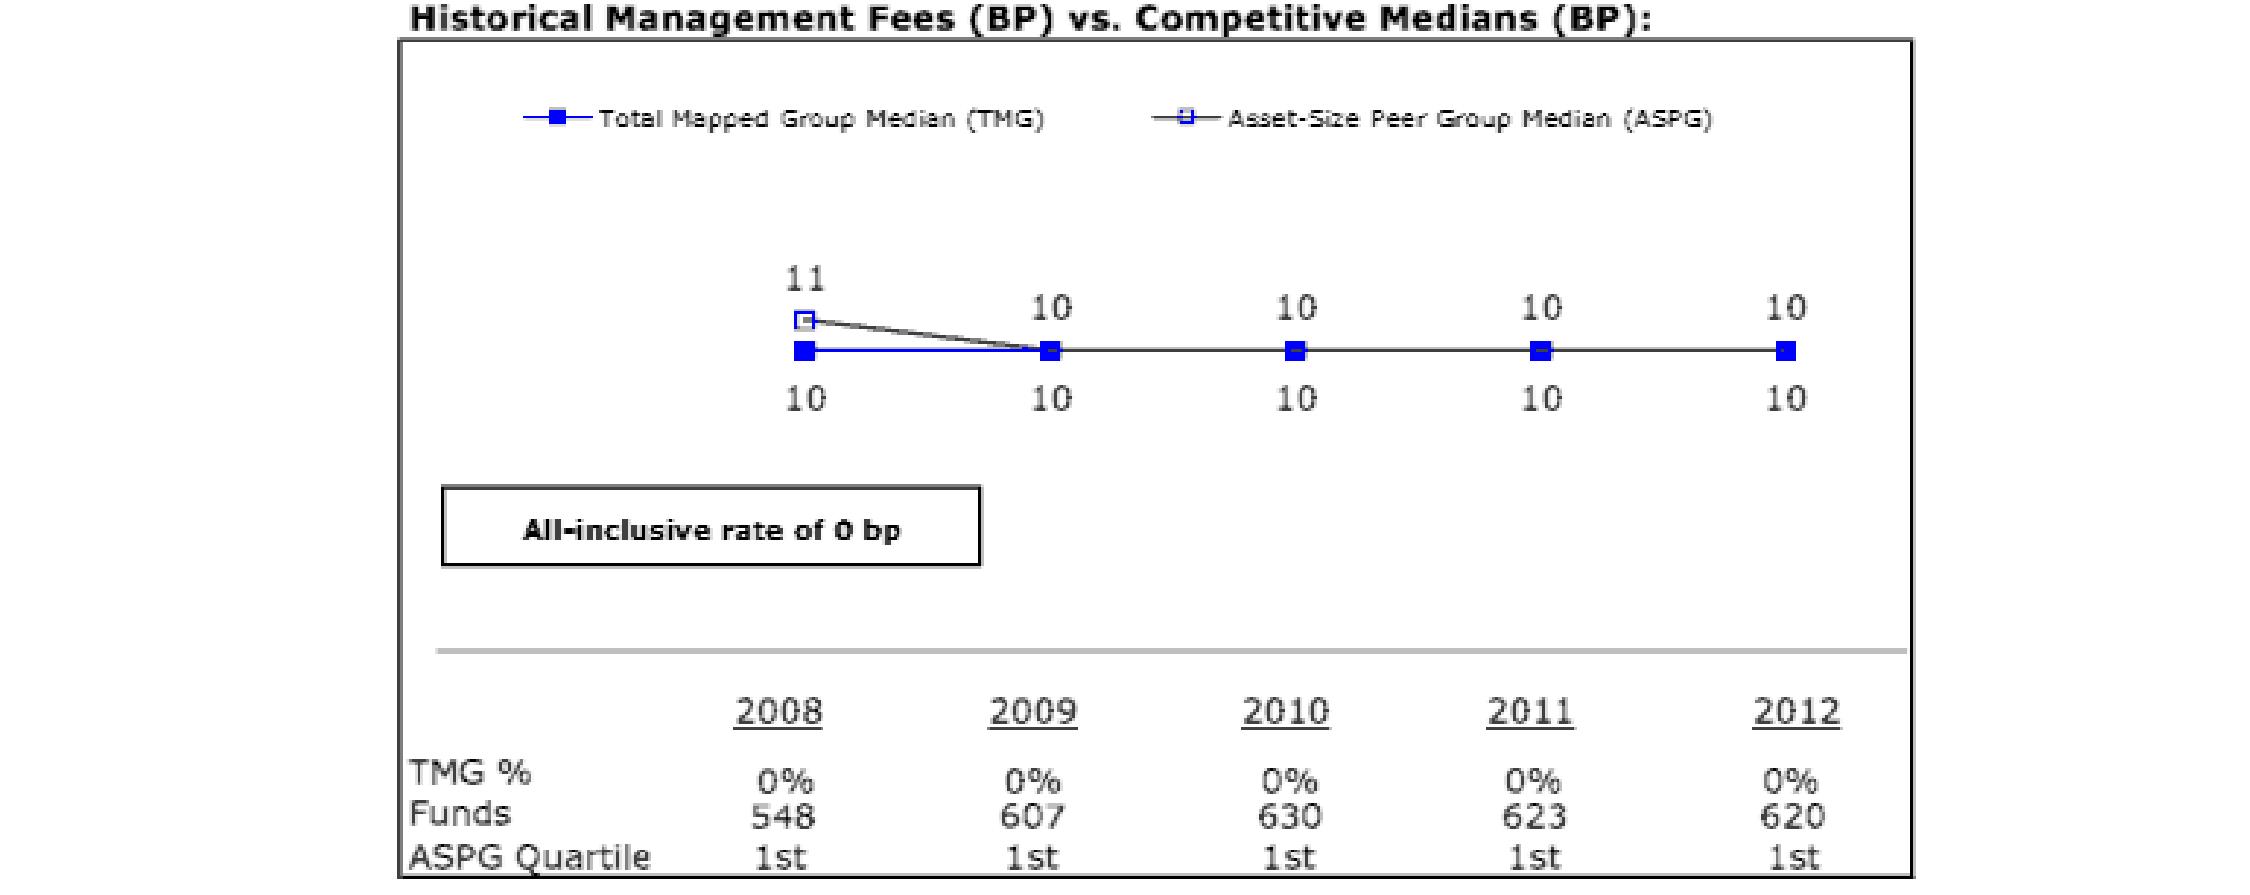
Semiannual Report
Board Approval of Investment Advisory Contracts and Management Fees - continued
Advisor Freedom 2015 Fund
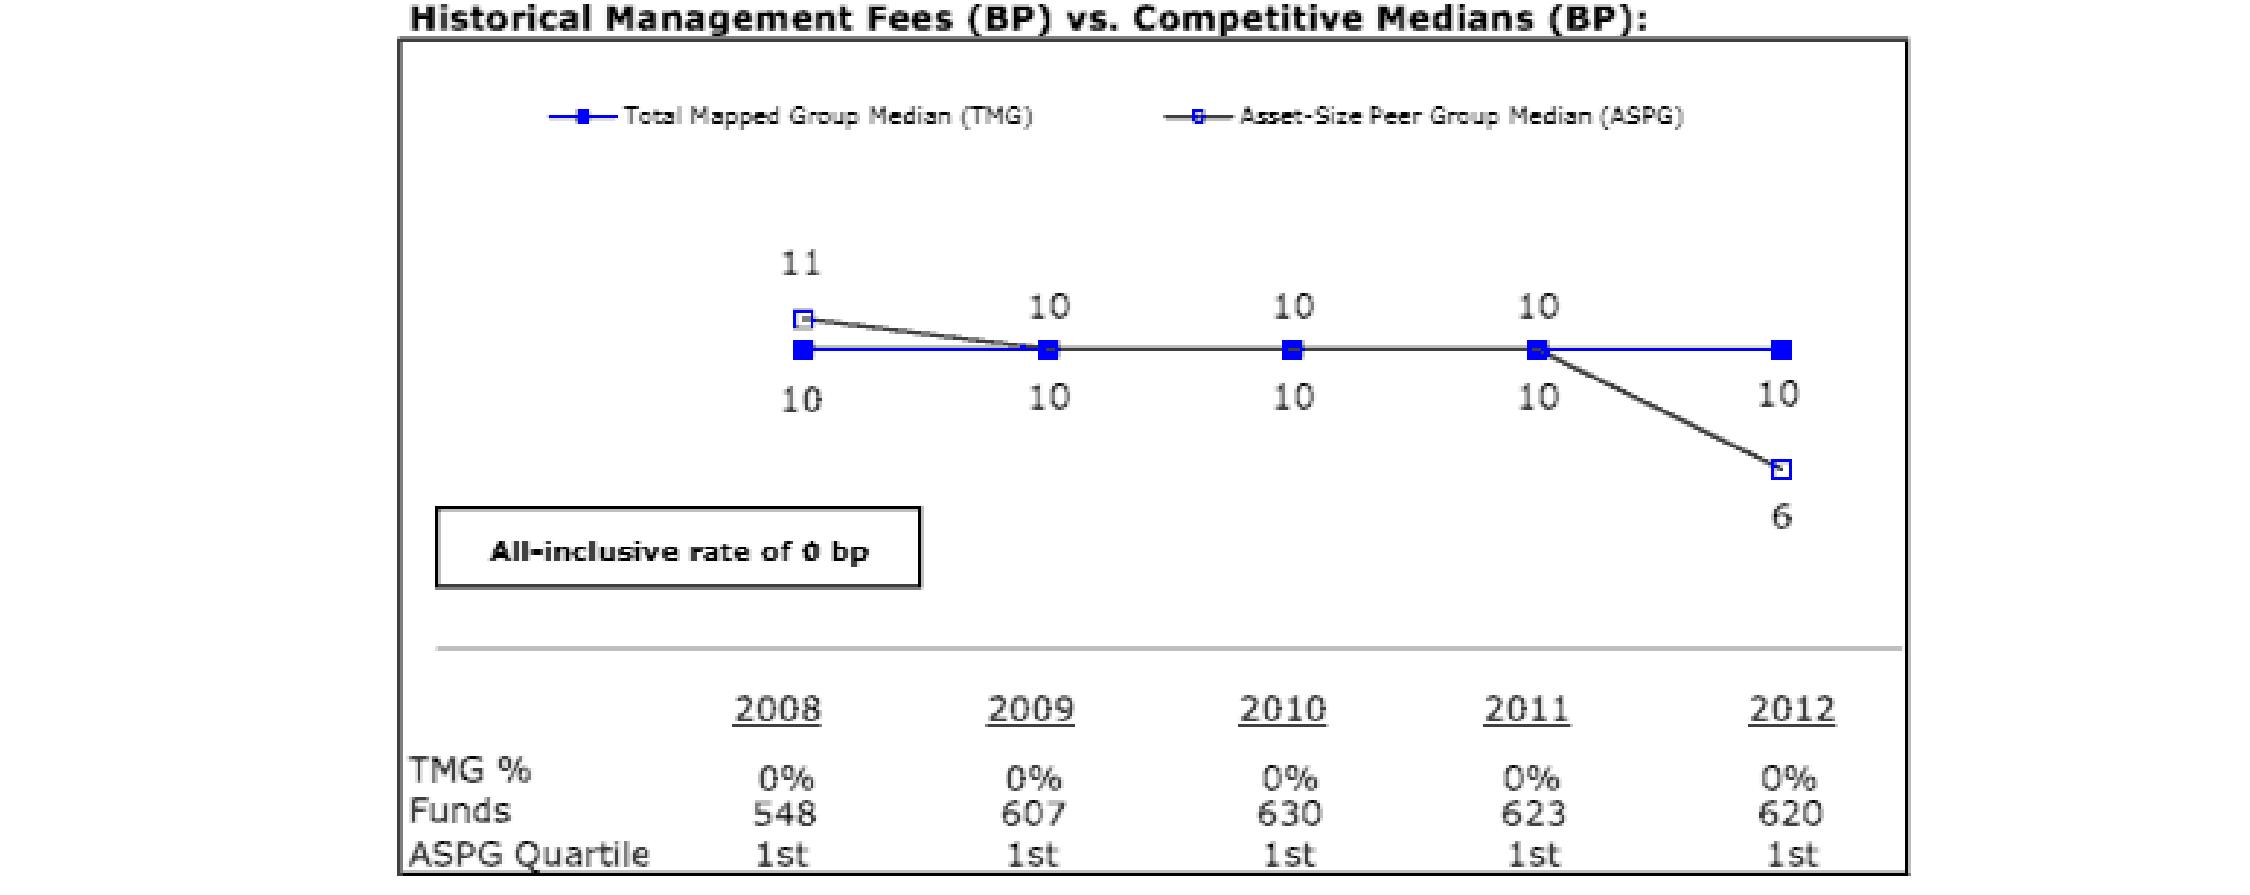
Advisor Freedom 2020 Fund
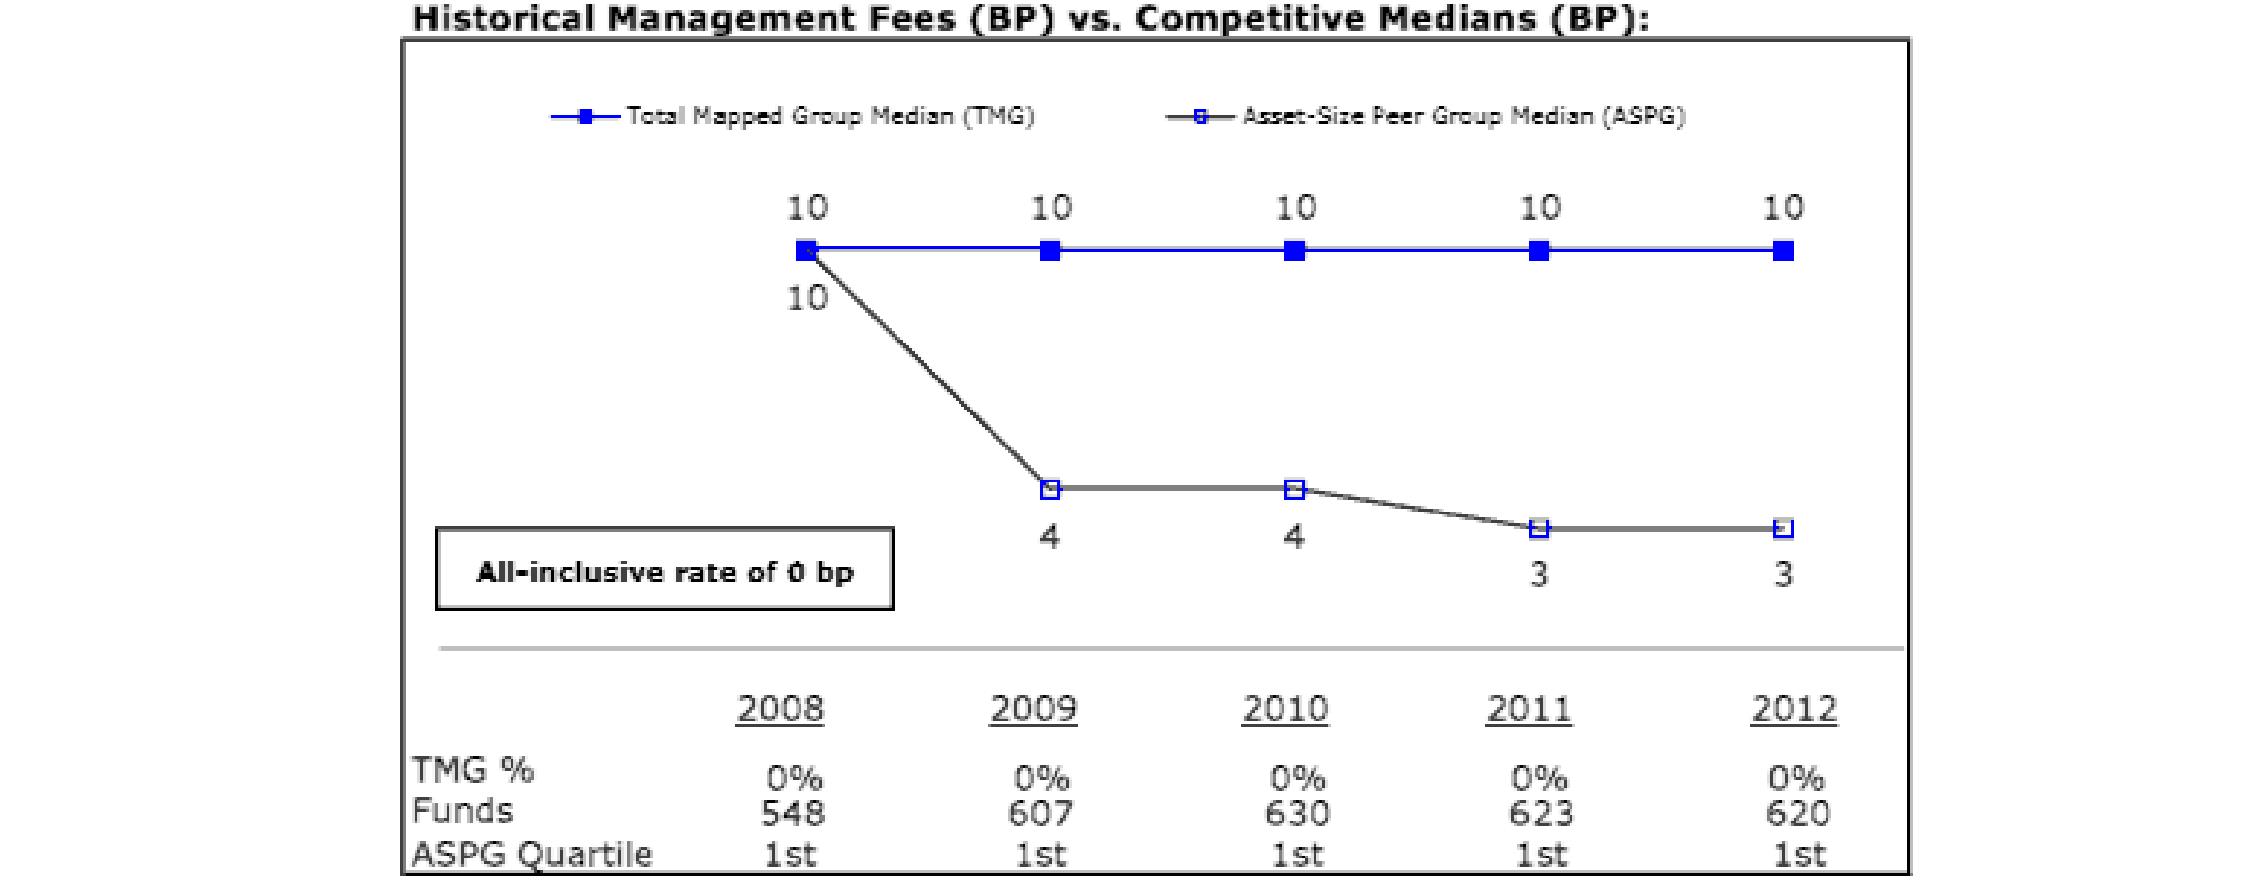
Semiannual Report
Advisor Freedom 2025 Fund
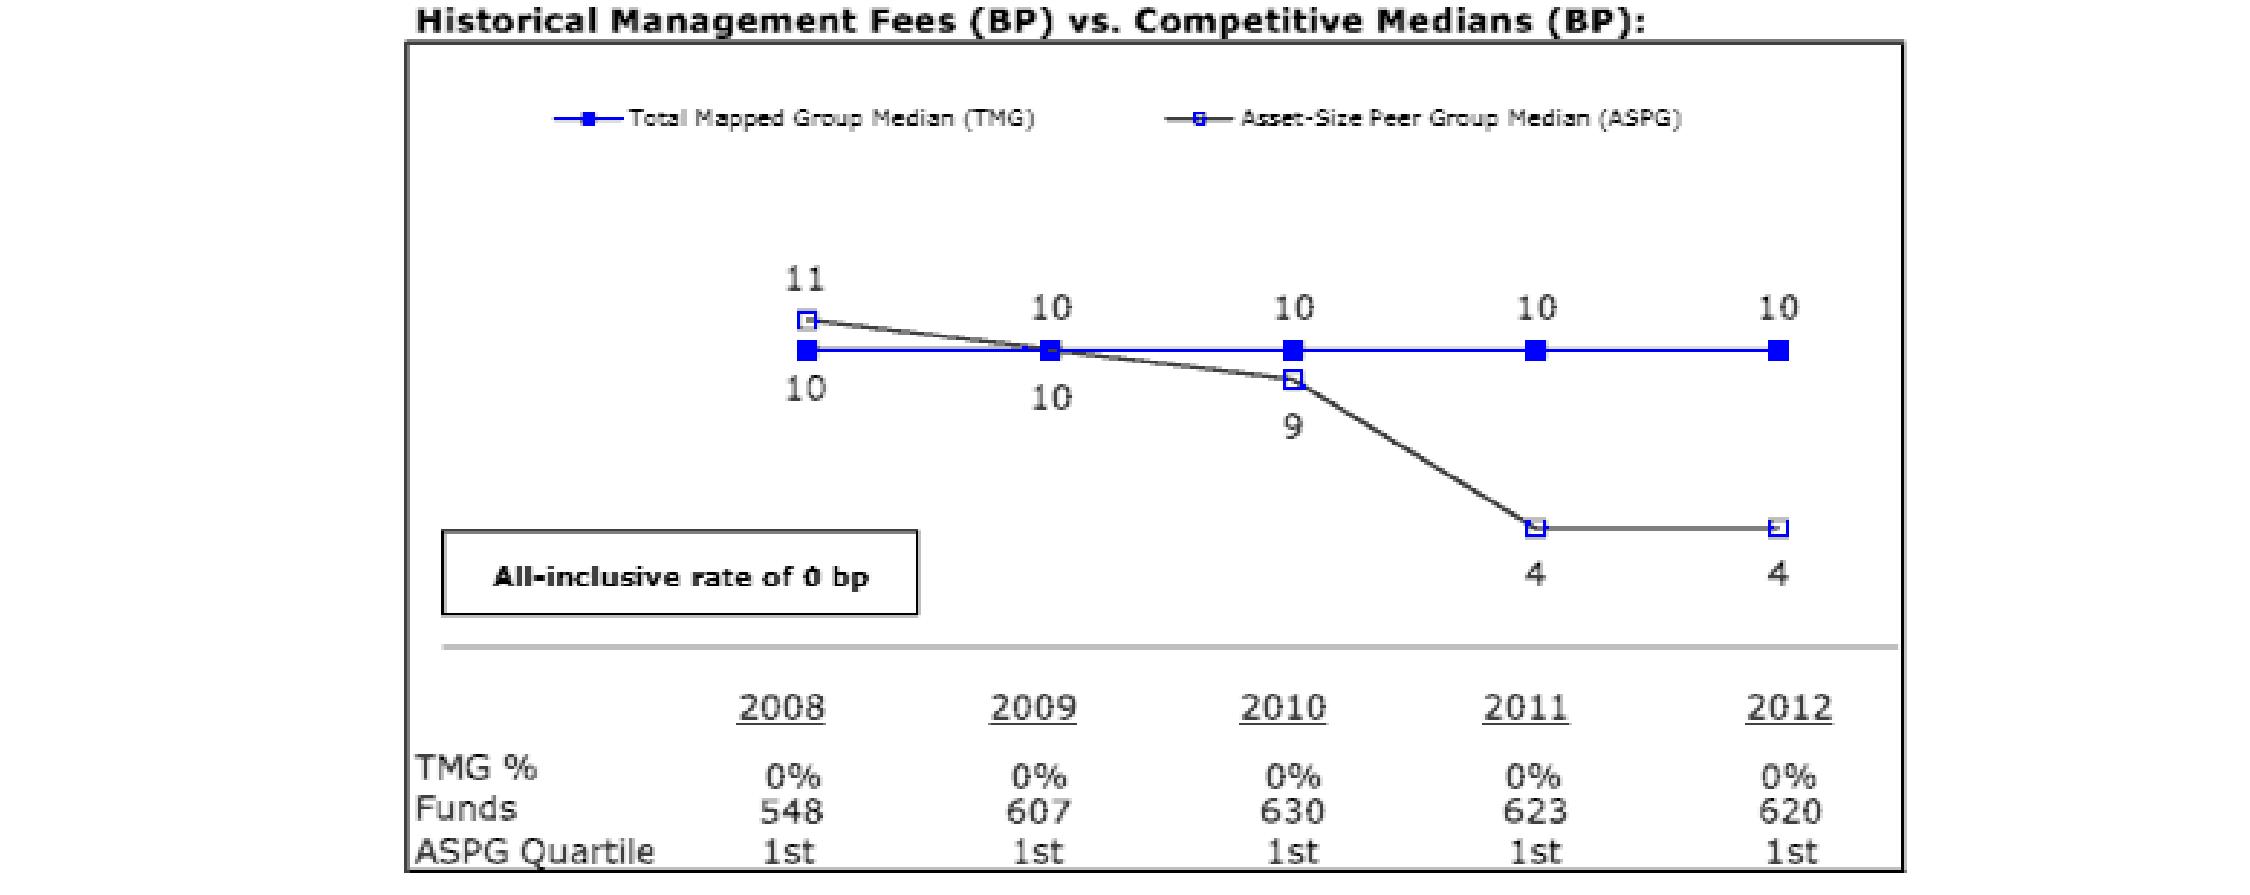
Advisor Freedom 2030 Fund
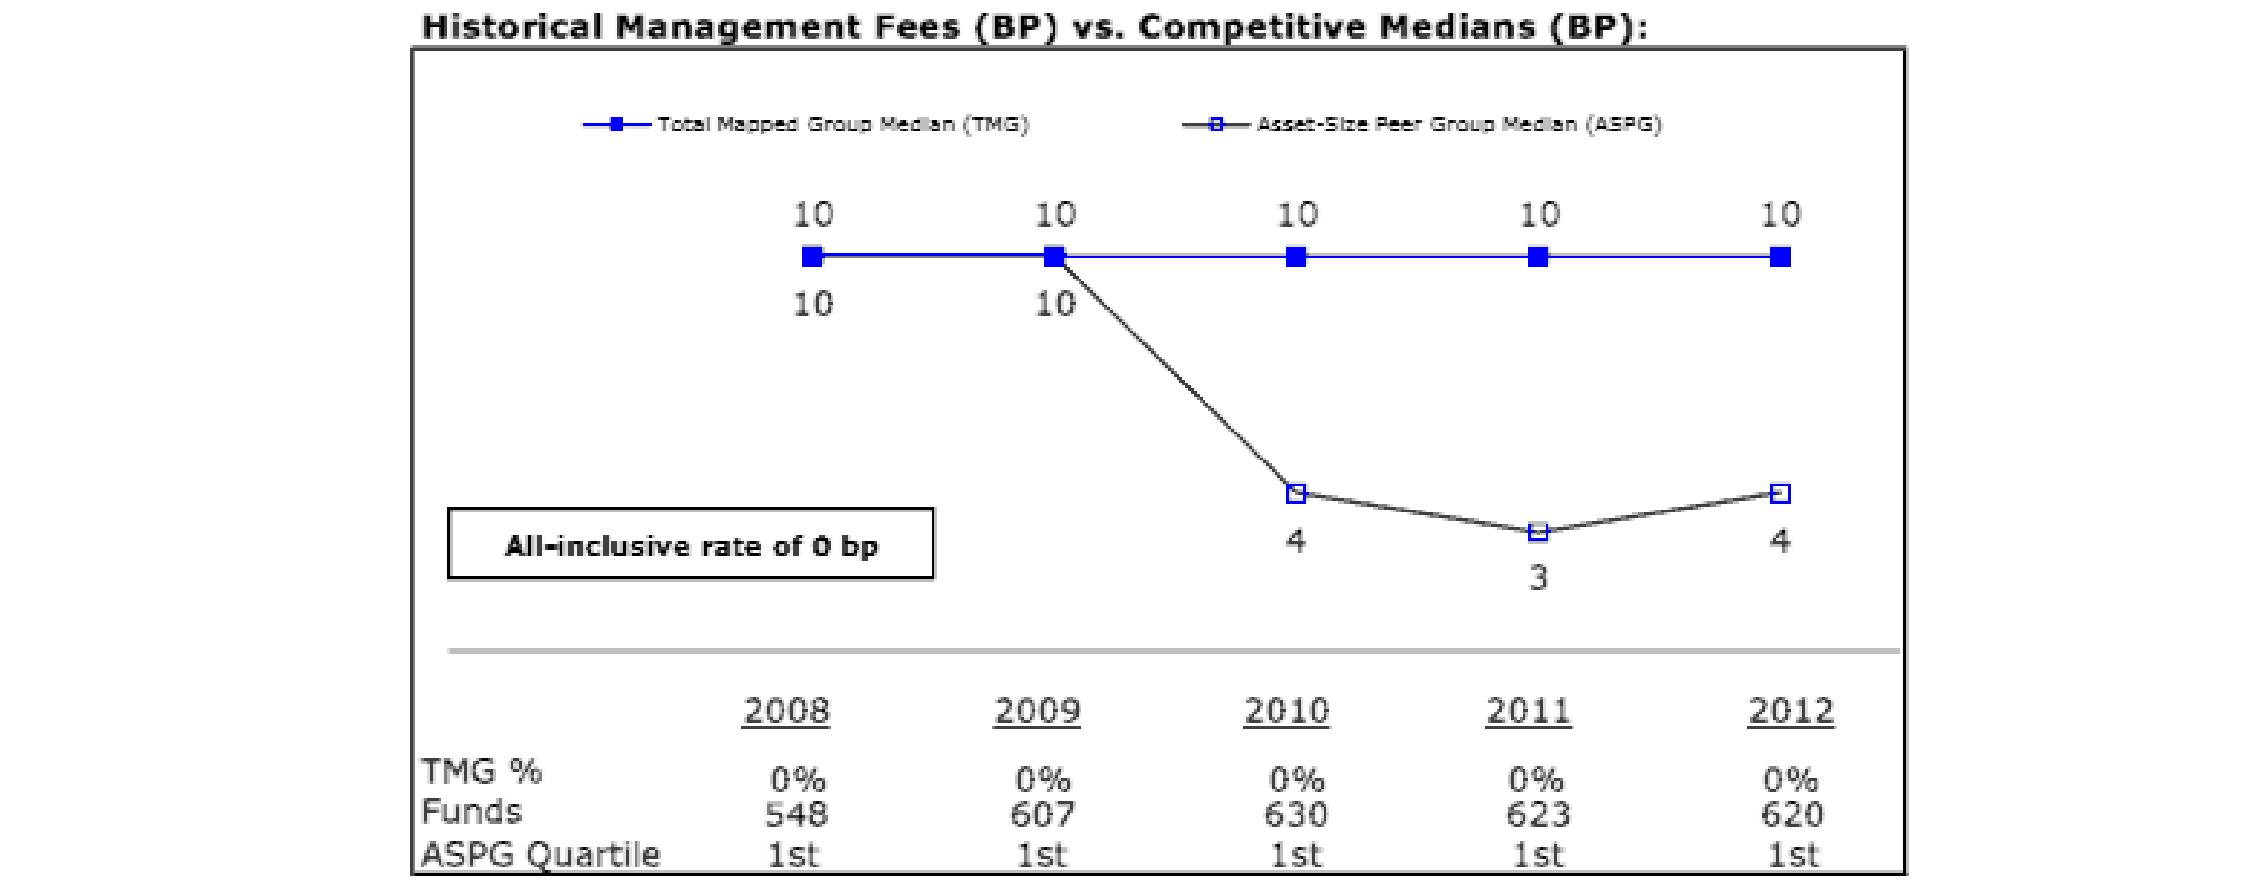
Semiannual Report
Board Approval of Investment Advisory Contracts and Management Fees - continued
Advisor Freedom 2035 Fund
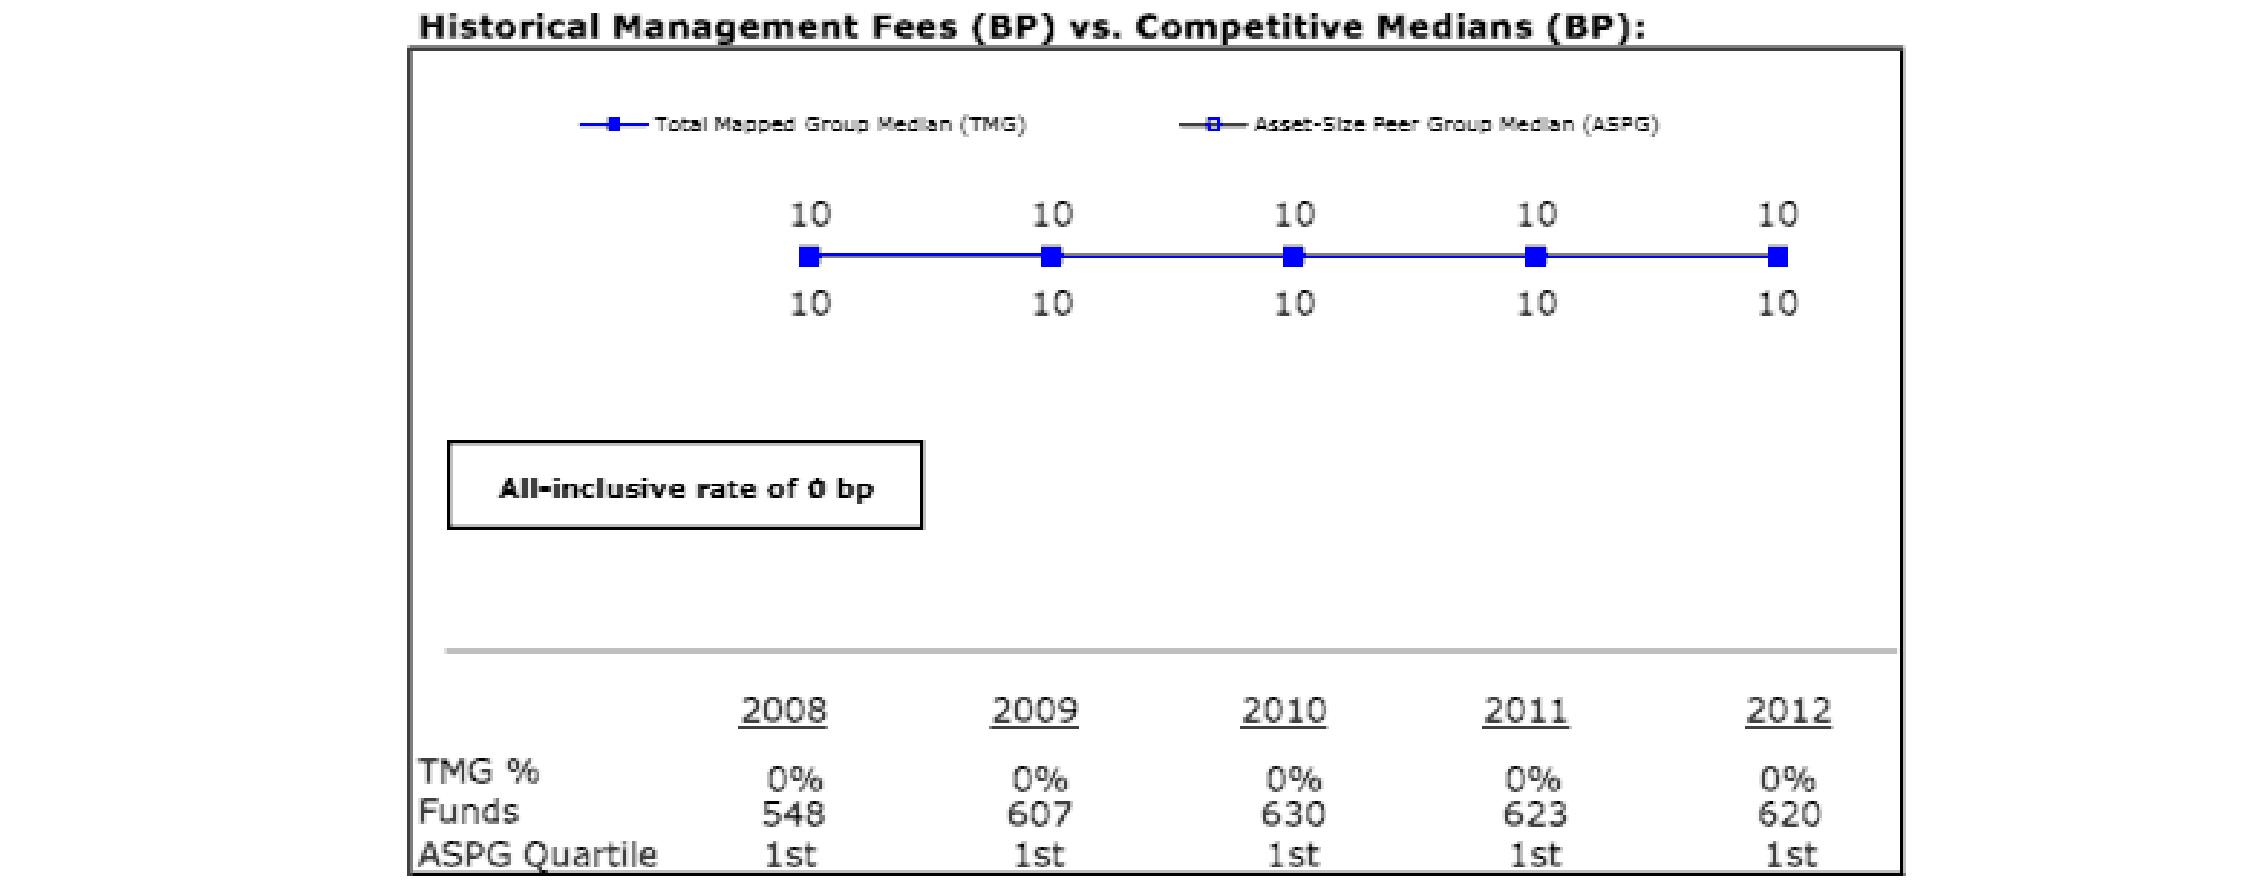
Advisor Freedom 2040 Fund

Semiannual Report
Advisor Freedom 2045 Fund
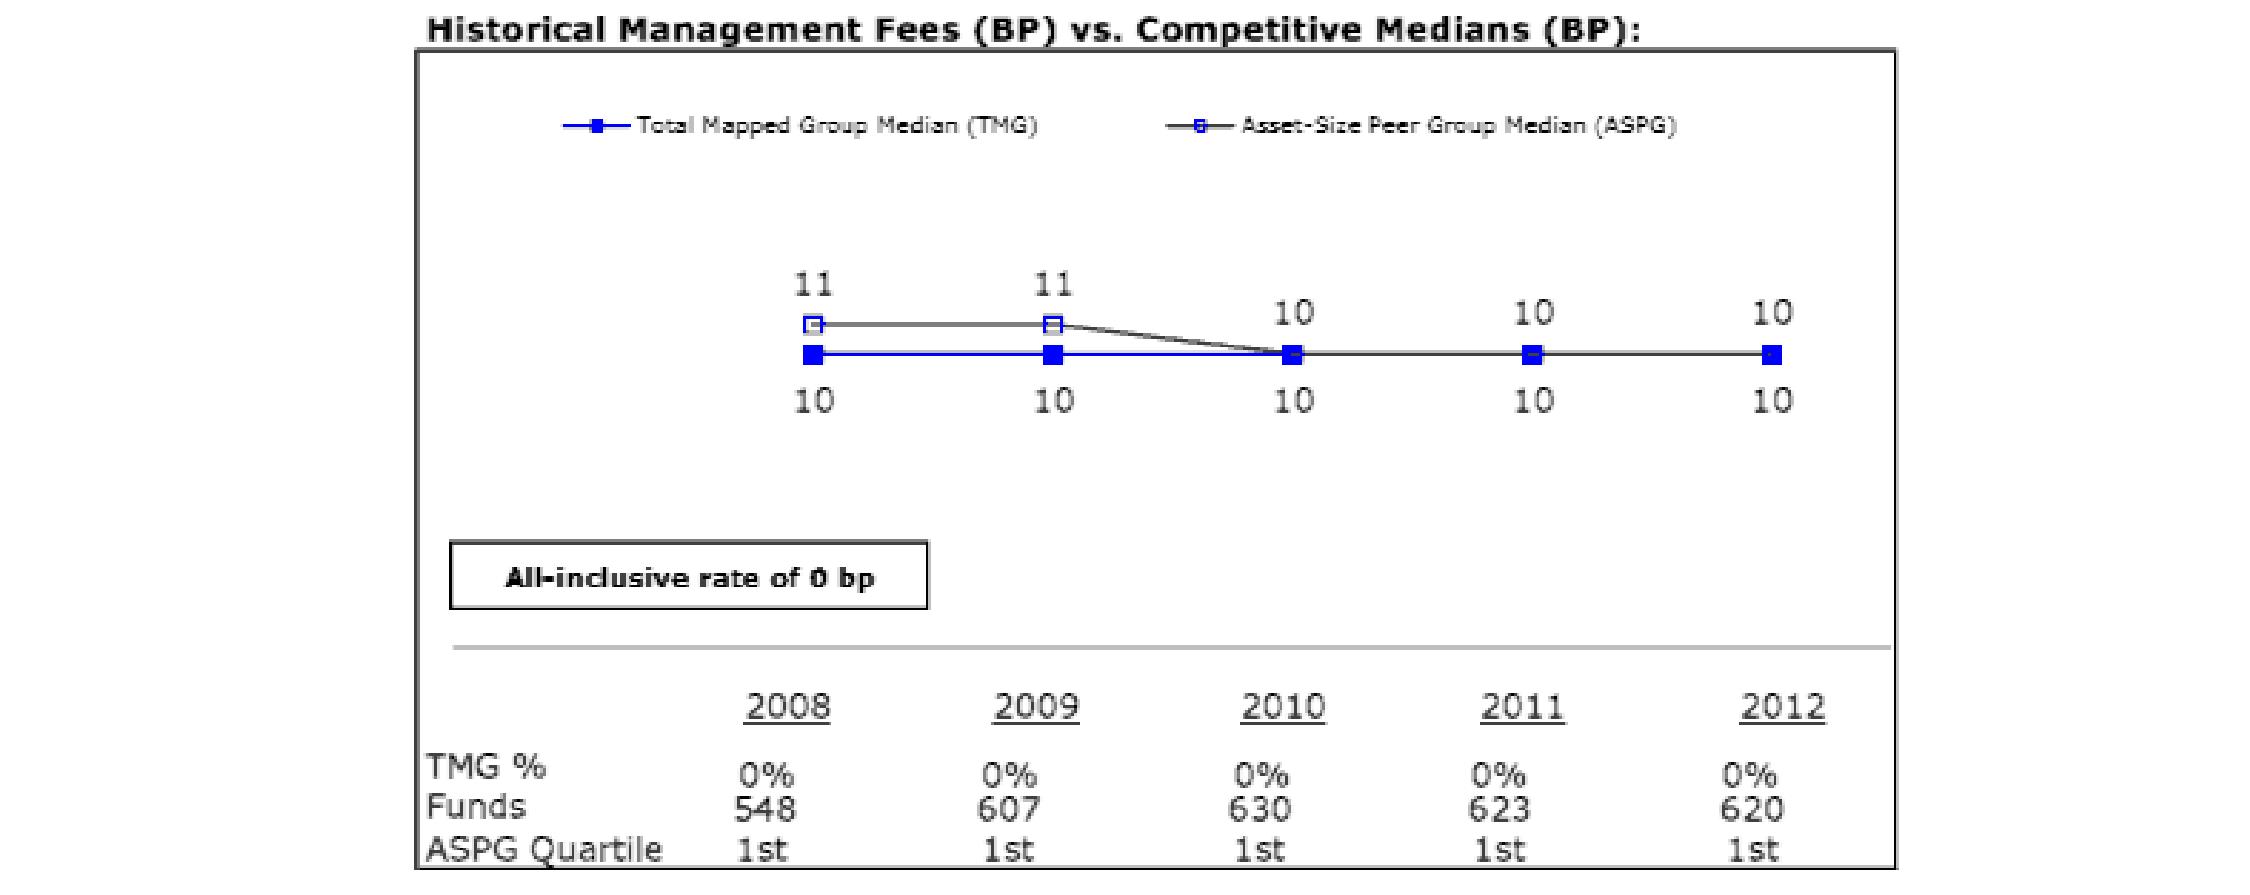
Advisor Freedom 2050 Fund
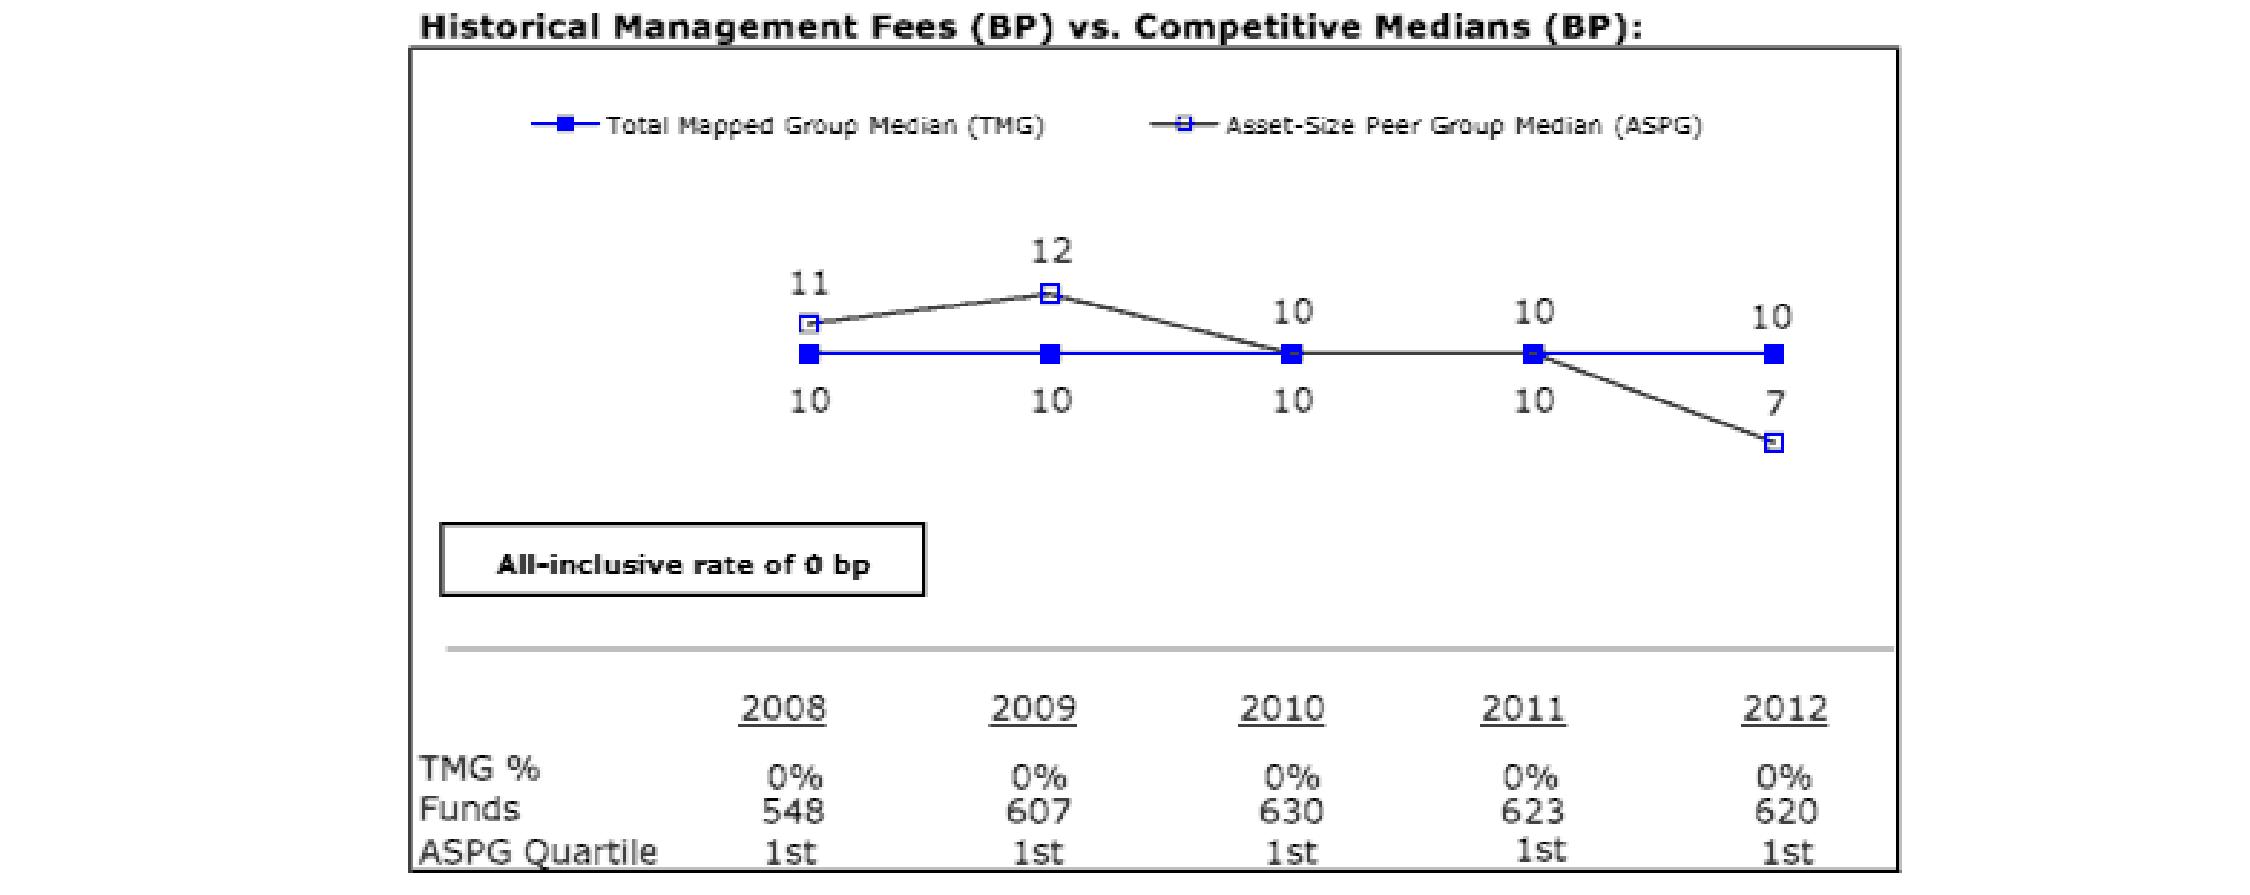
Semiannual Report
Board Approval of Investment Advisory Contracts and Management Fees - continued
Advisor Freedom 2055 Fund
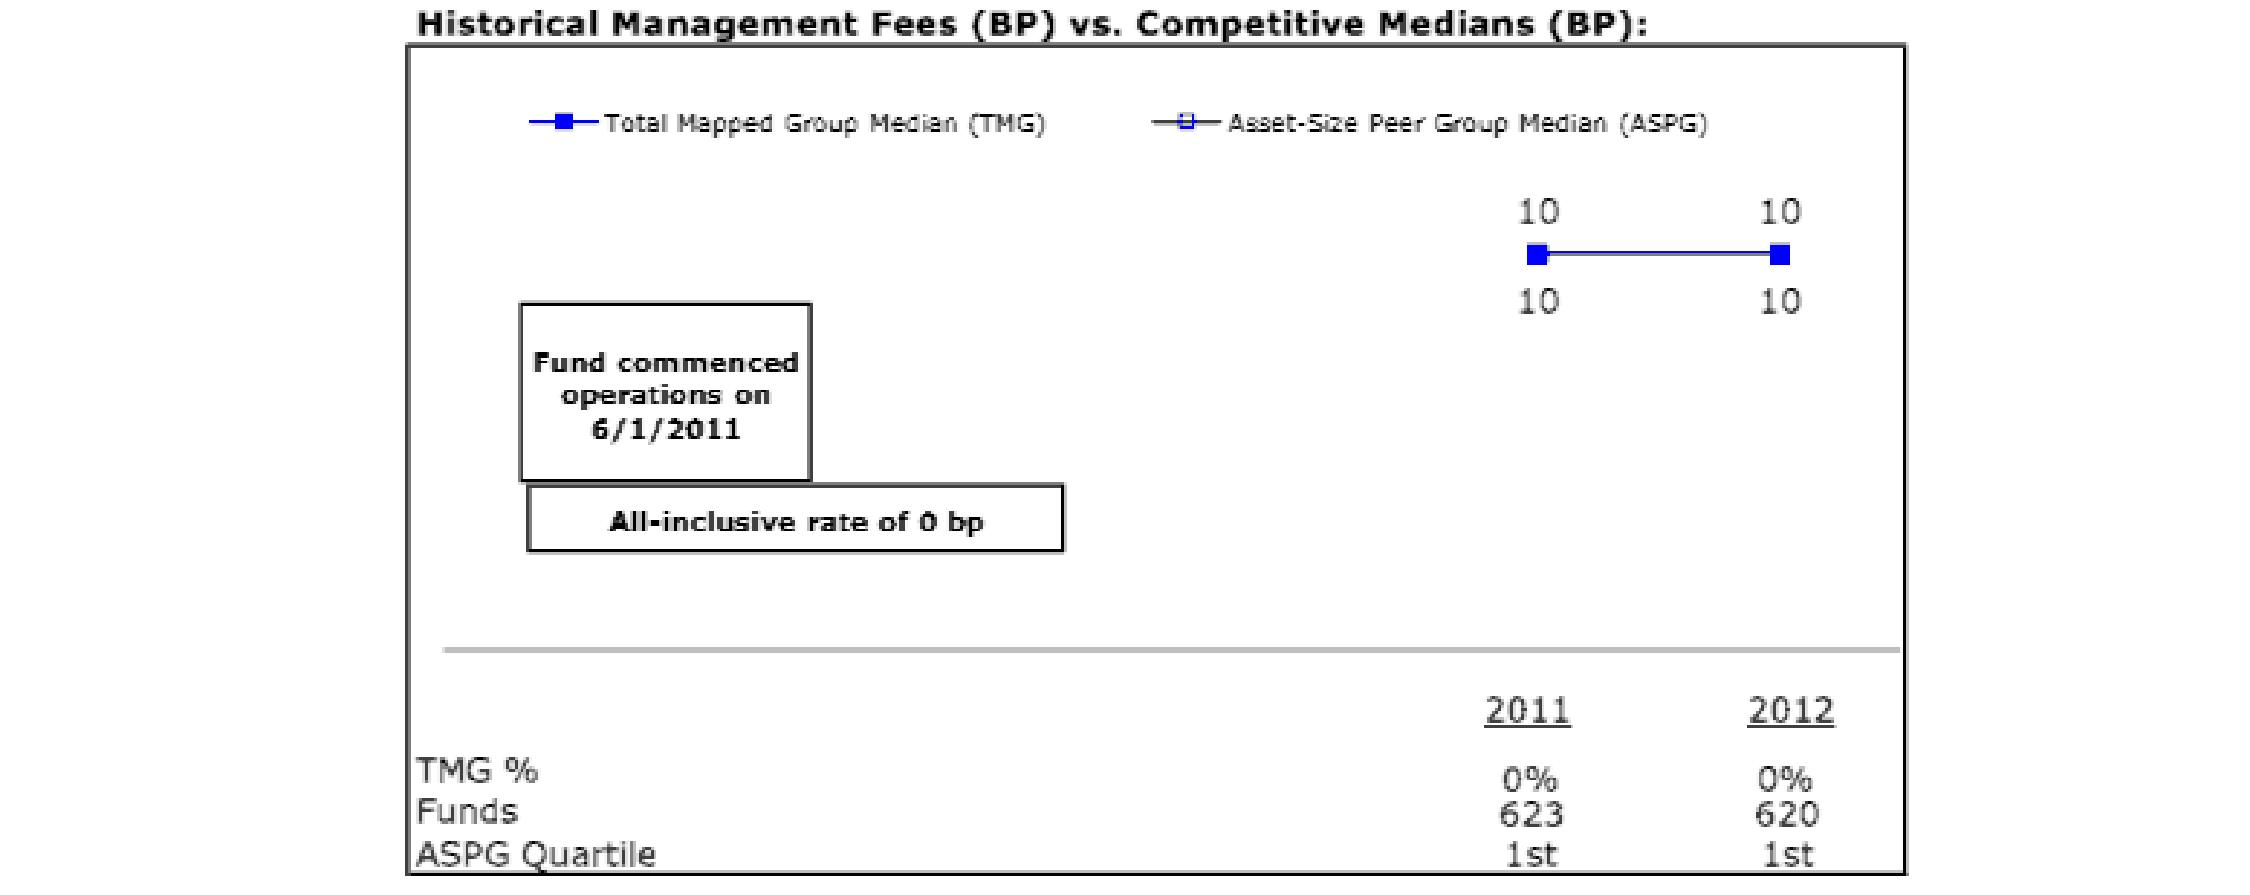
Advisor Freedom Income Fund

The Board noted that each fund's management fee rate of 0.00% ranked below the median of its Total Mapped Group and below the median of its ASPG for 2012. The Board further noted that many peer funds pay fund-level expenses, including management fees, to which the funds are not subject.
Based on its review, the Board concluded that each fund's management fee is fair and reasonable in light of the services that the fund receives and the other factors considered.
Total Expense Ratio. In its review of the total expense ratio of each class of each fund, the Board noted that each fund invests in Institutional Class of the underlying Fidelity fund (if that underlying fund offers multiple classes of shares) to avoid charging fund-paid 12b-1 fees at both fund levels. The Board considered that the funds do not pay transfer agent fees. Instead, Institutional Class of each underlying Fidelity fund (or the underlying fund, if that underlying fund does not offer multiple classes of shares) bears its pro rata portion of each fund's transfer agent fee according to the percentage of each fund's assets invested in that underlying fund. The Board further noted that Fidelity Management & Research Company (FMR) pays all other expenses of each fund, with limited exceptions.
For each fund except Advisor Freedom 2055, the Board noted that the total expense ratio of each of Class A, Class B, Class C, and Institutional Class of each fund ranked below its competitive median for 2012 and the total expense ratio of Class T of each fund ranked equal to its competitive median for 2012.
Semiannual Report
The Board noted that the total expense ratio of each of Class A, Class C and Institutional Class of Advisor Freedom 2055 Fund ranked below its competitive median for 2012 and the total expense ratio of Class T of Advisor Freedom 2055 Fund ranked equal to its competitive median for 2012.
Fees Charged to Other Fidelity Clients. The Board also considered Fidelity fee structures and other information with respect to clients of Fidelity, such as other mutual funds advised or subadvised by Fidelity, pension plan clients, and other institutional clients. The Board noted the findings of the 2013 ad hoc joint committee (created with the board of other Fidelity funds), which reviewed and compared Fidelity's institutional investment advisory business with its business of providing services to the Fidelity funds, including the differences in services provided, fees charged, and costs incurred, as well as competition in their respective marketplaces.
Based on its review of total expense ratios and fees charged to other Fidelity clients, the Board concluded that the total expense ratio of each class of each fund was reasonable in light of the services that the fund and its shareholders receive and the other factors considered.
Costs of the Services and Profitability. The Board considered the level of Fidelity's profits in respect of all the Fidelity funds, including the Fidelity funds in which the funds invest.
PricewaterhouseCoopers LLP (PwC), independent registered public accounting firm and auditor to Fidelity and certain Fidelity funds, has been engaged annually by the Board as part of the Board's assessment of Fidelity's profitability analysis. PwC's engagement includes the review and assessment of the methodologies used by Fidelity in determining the revenues and expenses attributable to Fidelity's mutual fund business, and completion of agreed-upon procedures surrounding the mathematical accuracy of fund profitability and its conformity to allocation methodologies. After considering PwC's reports issued under the engagement and information provided by Fidelity, the Board concluded that while other allocation methods may also be reasonable, Fidelity's profitability methodologies are reasonable in all material respects.
The Board also reviewed Fidelity's non-fund businesses and fall-out benefits related to the mutual fund business as well as cases where Fidelity's affiliates may benefit from or be related to the funds' business.
The Board concluded that the costs of the services provided by and the profits realized by Fidelity in connection with the operation of each fund were not relevant to the renewal of each fund's Advisory Contract because the funds do not pay management fees and FMR pays all other expenses of each fund, with limited exceptions.
Economies of Scale. The Board concluded that because the funds do not pay management fees and FMR pays all other expenses of each fund, with limited exceptions, economies of scale cannot be realized by the funds, but may be realized by the other Fidelity funds in which each fund invests, many of which may benefit from breakpoints in the group fee arrangement.
Additional Information Requested by the Board. In order to develop fully the factual basis for consideration of the Fidelity funds' Advisory Contracts, the Board requested and received additional information on certain topics, including: (i) Fidelity's fund profitability methodology, profitability trends for certain funds, and the impact of certain factors on fund profitability results; (ii) portfolio manager changes that have occurred during the past year and the amount of the investment that each portfolio manager has made in the Fidelity fund(s) that he or she manages; (iii) Fidelity's compensation structure for portfolio managers, research analysts, and other key personnel, including its effects on fund profitability, the rationale for the compensation structure, and the extent to which current market conditions have affected retention and recruitment; (iv) the arrangements with and compensation paid to certain fund sub-advisers on behalf of the Fidelity funds; (v) Fidelity's fee structures, including the group fee structure and definition of group assets, and the rationale for recommending different fees among different categories of funds and classes; (vi) Fidelity's voluntary waiver of its fees to maintain minimum yields for certain money market funds and classes as well as contractual waivers in place for certain funds; (vii) the methodology with respect to competitive fund data and peer group classifications; (viii) Fidelity's transfer agent fee, expense, and service structures for different funds and classes, and the impact of the increased use of omnibus accounts; and (ix) explanations regarding the relative total expense ratios of certain funds and classes, total expense competitive trends and methodologies for total expense competitive comparisons, and actions that might be taken by Fidelity to reduce total expense ratios for certain funds and classes or to achieve further economies of scale.
Based on its evaluation of all of the conclusions noted above, and after considering all factors it believed relevant, the Board ultimately concluded that the advisory fee structures are fair and reasonable, and that each fund's Advisory Contract should be renewed.
Semiannual Report
Investment Adviser
Strategic Advisers, Inc.
Boston, MA
Administrator
Fidelity Management & Research Company
Boston, MA
General Distributor
Fidelity Distributors Corporation
Smithfield, RI
Transfer and Service Agents
Fidelity Investments Institutional Operations Company, Inc.
Boston, MA
Fidelity Service Company, Inc.
Boston, MA
Custodian
The Bank of New York Mellon
New York, NY
(Fidelity Investment logo)(registered trademark)
AFF-USAN-1113
1.792158.110
Fidelity Advisor Freedom Funds®-
Income, 2005, 2010, 2015, 2020, 2025, 2030, 2035, 2040, 2045, 2050, 2055 - Institutional Class
Semiannual Report
September 30, 2013
(Fidelity Cover Art)
Contents
Semiannual Report
To view a fund's proxy voting guidelines and proxy voting record for the 12-month period ended June 30, visit http://www.fidelity.com/proxyvotingresults or visit the Securities and Exchange Commission's (SEC) web site at http://www.sec.gov. You may also call 1-877-208-0098 to request a free copy of the proxy voting guidelines.
Standard & Poor's, S&P and S&P 500 are registered service marks of The McGraw-Hill Companies, Inc. and have been licensed for use by Fidelity Distributors Corporation.
Other third-party marks appearing herein are the property of their respective owners.
All other marks appearing herein are registered or unregistered trademarks or service marks of FMR LLC or an affiliated company. © 2013 FMR LLC. All rights reserved.
This report and the financial statements contained herein are submitted for the general information of the shareholders of the funds. This report is not authorized for distribution to prospective investors in the funds unless preceded or accompanied by an effective prospectus.
A fund files its complete schedule of portfolio holdings with the SEC for the first and third quarters of each fiscal year on Form N-Q. Forms N-Q are available on the SEC's web site at http://www.sec.gov. A fund's Forms N-Q may be reviewed and copied at the SEC's Public Reference Room in Washington, DC. Information regarding the operation of the SEC's Public Reference Room may be obtained by calling 1-800-SEC-0330. For a complete list of a fund's portfolio holdings, view the most recent holdings listing, semiannual report, or annual report on Fidelity's web site at http://www.fidelity.com, http://www.advisor.fidelity.com, or http://www.401k.com, as applicable.
NOT FDIC INSURED • MAY LOSE VALUE • NO BANK GUARANTEE
Neither the funds nor Fidelity Distributors Corporation is a bank.
Semiannual Report
As a shareholder of a Fund, you incur two types of costs: (1) transaction costs, including sales charges (loads) on purchase payments or redemption proceeds, and (2) ongoing costs, including distribution and/or service (12b-1) fees and other Fund expenses. This Example is intended to help you understand your ongoing costs (in dollars) of investing in the Funds and to compare these costs with the ongoing costs of investing in other mutual funds.
The Example is based on an investment of $1,000 invested at the beginning of the period and held for the entire period (April 1, 2013 to September 30, 2013).
Actual Expenses
The first line of the accompanying table for each class of each fund provides information about actual account values and actual expenses. You may use the information in this line, together with the amount you invested, to estimate the expenses that you paid over the period. Simply divide your account value by $1,000.00 (for example, an $8,600 account value divided by $1,000.00 = 8.6), then multiply the result by the number in the first line for a class of the fund under the heading entitled "Expenses Paid During Period" to estimate the expenses you paid on your account during this period. In addition, each Fund, as a shareholder in underlying Fidelity Funds, will indirectly bear its pro-rata share of the fees and expenses incurred by the underlying Fidelity Funds. These fees and expenses are not included in each Fund's annualized expense ratio used to calculate the expense estimates in the table below.
Hypothetical Example for Comparison Purposes
The second line of the accompanying table for each class of each fund provides information about hypothetical account values and hypothetical expenses based on a Class' actual expense ratio and an assumed rate of return of 5% per year before expenses, which is not the Class' actual return. The hypothetical account values and expenses may not be used to estimate the actual ending account balance or expenses you paid for the period. You may use this information to compare the ongoing costs of investing in the Fund and other funds. To do so, compare this 5% hypothetical example with the 5% hypothetical examples that appear in the shareholder reports of the other funds. In addition, each Fund, as a shareholder in underlying Fidelity Funds, will indirectly bear its pro-rata share of the fees and expenses incurred by the underlying Fidelity Funds. These fees and expenses are not included in each Fund's annualized expense ratio used to calculate the expense estimates in the table below.
Please note that the expenses shown in the table are meant to highlight your ongoing costs only and do not reflect any transaction costs. Therefore, the second line of the table is useful in comparing ongoing costs only, and will not help you determine the relative total costs of owning different funds. In addition, if these transactional costs were included, your costs would have been higher.
| Annualized
Expense RatioB | Beginning
Account Value
April 1, 2013 | Ending
Account Value
September 30, 2013 | Expenses Paid
During Period*
April 1, 2013
to September 30, 2013 |
Advisor Freedom Income | | | | |
Class A | .25% | | | |
Actual | | $ 1,000.00 | $ 1,005.10 | $ 1.26 |
HypotheticalA | | $ 1,000.00 | $ 1,023.82 | $ 1.27 |
Class T | .50% | | | |
Actual | | $ 1,000.00 | $ 1,003.70 | $ 2.51 |
HypotheticalA | | $ 1,000.00 | $ 1,022.56 | $ 2.54 |
Class B | 1.00% | | | |
Actual | | $ 1,000.00 | $ 1,001.30 | $ 5.02 |
HypotheticalA | | $ 1,000.00 | $ 1,020.05 | $ 5.06 |
Class C | 1.00% | | | |
Actual | | $ 1,000.00 | $ 1,002.30 | $ 5.02 |
HypotheticalA | | $ 1,000.00 | $ 1,020.05 | $ 5.06 |
Institutional Class | .00% | | | |
Actual | | $ 1,000.00 | $ 1,007.10 | $ .00 |
HypotheticalA | | $ 1,000.00 | $ 1,025.07 | $ .00 |
| Annualized
Expense RatioB | Beginning
Account Value
April 1, 2013 | Ending
Account Value
September 30, 2013 | Expenses Paid
During Period*
April 1, 2013
to September 30, 2013 |
Advisor Freedom 2005 | | | | |
Class A | .25% | | | |
Actual | | $ 1,000.00 | $ 1,017.70 | $ 1.26 |
HypotheticalA | | $ 1,000.00 | $ 1,023.82 | $ 1.27 |
Class T | .50% | | | |
Actual | | $ 1,000.00 | $ 1,016.30 | $ 2.53 |
HypotheticalA | | $ 1,000.00 | $ 1,022.56 | $ 2.54 |
Class B | 1.00% | | | |
Actual | | $ 1,000.00 | $ 1,013.50 | $ 5.05 |
HypotheticalA | | $ 1,000.00 | $ 1,020.05 | $ 5.06 |
Class C | 1.00% | | | |
Actual | | $ 1,000.00 | $ 1,014.40 | $ 5.05 |
HypotheticalA | | $ 1,000.00 | $ 1,020.05 | $ 5.06 |
Institutional Class | .00% | | | |
Actual | | $ 1,000.00 | $ 1,019.00 | $ .00 |
HypotheticalA | | $ 1,000.00 | $ 1,025.07 | $ .00 |
Advisor Freedom 2010 | | | | |
Class A | .25% | | | |
Actual | | $ 1,000.00 | $ 1,026.70 | $ 1.27 |
HypotheticalA | | $ 1,000.00 | $ 1,023.82 | $ 1.27 |
Class T | .50% | | | |
Actual | | $ 1,000.00 | $ 1,026.20 | $ 2.54 |
HypotheticalA | | $ 1,000.00 | $ 1,022.56 | $ 2.54 |
Class B | 1.00% | | | |
Actual | | $ 1,000.00 | $ 1,023.30 | $ 5.07 |
HypotheticalA | | $ 1,000.00 | $ 1,020.05 | $ 5.06 |
Class C | 1.00% | | | |
Actual | | $ 1,000.00 | $ 1,023.50 | $ 5.07 |
HypotheticalA | | $ 1,000.00 | $ 1,020.05 | $ 5.06 |
Institutional Class | .00% | | | |
Actual | | $ 1,000.00 | $ 1,028.00 | $ .00 |
HypotheticalA | | $ 1,000.00 | $ 1,025.07 | $ .00 |
Advisor Freedom 2015 | | | | |
Class A | .25% | | | |
Actual | | $ 1,000.00 | $ 1,029.20 | $ 1.27 |
HypotheticalA | | $ 1,000.00 | $ 1,023.82 | $ 1.27 |
Class T | .50% | | | |
Actual | | $ 1,000.00 | $ 1,027.00 | $ 2.54 |
HypotheticalA | | $ 1,000.00 | $ 1,022.56 | $ 2.54 |
Class B | 1.00% | | | |
Actual | | $ 1,000.00 | $ 1,025.00 | $ 5.08 |
HypotheticalA | | $ 1,000.00 | $ 1,020.05 | $ 5.06 |
Class C | 1.00% | | | |
Actual | | $ 1,000.00 | $ 1,024.30 | $ 5.07 |
HypotheticalA | | $ 1,000.00 | $ 1,020.05 | $ 5.06 |
Institutional Class | .00% | | | |
Actual | | $ 1,000.00 | $ 1,029.60 | $ .00 |
HypotheticalA | | $ 1,000.00 | $ 1,025.07 | $ .00 |
| Annualized
Expense RatioB | Beginning
Account Value
April 1, 2013 | Ending
Account Value
September 30, 2013 | Expenses Paid
During Period*
April 1, 2013
to September 30, 2013 |
Advisor Freedom 2020 | | | | |
Class A | .25% | | | |
Actual | | $ 1,000.00 | $ 1,033.20 | $ 1.27 |
HypotheticalA | | $ 1,000.00 | $ 1,023.82 | $ 1.27 |
Class T | .50% | | | |
Actual | | $ 1,000.00 | $ 1,031.80 | $ 2.55 |
HypotheticalA | | $ 1,000.00 | $ 1,022.56 | $ 2.54 |
Class B | 1.00% | | | |
Actual | | $ 1,000.00 | $ 1,029.00 | $ 5.09 |
HypotheticalA | | $ 1,000.00 | $ 1,020.05 | $ 5.06 |
Class C | 1.00% | | | |
Actual | | $ 1,000.00 | $ 1,029.20 | $ 5.09 |
HypotheticalA | | $ 1,000.00 | $ 1,020.05 | $ 5.06 |
Institutional Class | .00% | | | |
Actual | | $ 1,000.00 | $ 1,033.60 | $ .00 |
HypotheticalA | | $ 1,000.00 | $ 1,025.07 | $ .00 |
Advisor Freedom 2025 | | | | |
Class A | .25% | | | |
Actual | | $ 1,000.00 | $ 1,044.90 | $ 1.28 |
HypotheticalA | | $ 1,000.00 | $ 1,023.82 | $ 1.27 |
Class T | .50% | | | |
Actual | | $ 1,000.00 | $ 1,043.40 | $ 2.56 |
HypotheticalA | | $ 1,000.00 | $ 1,022.56 | $ 2.54 |
Class B | 1.00% | | | |
Actual | | $ 1,000.00 | $ 1,040.80 | $ 5.12 |
HypotheticalA | | $ 1,000.00 | $ 1,020.05 | $ 5.06 |
Class C | 1.00% | | | |
Actual | | $ 1,000.00 | $ 1,040.20 | $ 5.11 |
HypotheticalA | | $ 1,000.00 | $ 1,020.05 | $ 5.06 |
Institutional Class | .00% | | | |
Actual | | $ 1,000.00 | $ 1,046.00 | $ .00 |
HypotheticalA | | $ 1,000.00 | $ 1,025.07 | $ .00 |
Advisor Freedom 2030 | | | | |
Class A | .25% | | | |
Actual | | $ 1,000.00 | $ 1,049.10 | $ 1.28 |
HypotheticalA | | $ 1,000.00 | $ 1,023.82 | $ 1.27 |
Class T | .50% | | | |
Actual | | $ 1,000.00 | $ 1,047.90 | $ 2.57 |
HypotheticalA | | $ 1,000.00 | $ 1,022.56 | $ 2.54 |
Class B | 1.00% | | | |
Actual | | $ 1,000.00 | $ 1,045.10 | $ 5.13 |
HypotheticalA | | $ 1,000.00 | $ 1,020.05 | $ 5.06 |
Class C | 1.00% | | | |
Actual | | $ 1,000.00 | $ 1,045.30 | $ 5.13 |
HypotheticalA | | $ 1,000.00 | $ 1,020.05 | $ 5.06 |
Institutional Class | .00% | | | |
Actual | | $ 1,000.00 | $ 1,050.30 | $ .00 |
HypotheticalA | | $ 1,000.00 | $ 1,025.07 | $ .00 |
| Annualized
Expense RatioB | Beginning
Account Value
April 1, 2013 | Ending
Account Value
September 30, 2013 | Expenses Paid
During Period*
April 1, 2013
to September 30, 2013 |
Advisor Freedom 2035 | | | | |
Class A | .25% | | | |
Actual | | $ 1,000.00 | $ 1,059.30 | $ 1.29 |
HypotheticalA | | $ 1,000.00 | $ 1,023.82 | $ 1.27 |
Class T | .50% | | | |
Actual | | $ 1,000.00 | $ 1,058.20 | $ 2.58 |
HypotheticalA | | $ 1,000.00 | $ 1,022.56 | $ 2.54 |
Class B | 1.00% | | | |
Actual | | $ 1,000.00 | $ 1,056.00 | $ 5.15 |
HypotheticalA | | $ 1,000.00 | $ 1,020.05 | $ 5.06 |
Class C | 1.00% | | | |
Actual | | $ 1,000.00 | $ 1,056.10 | $ 5.15 |
HypotheticalA | | $ 1,000.00 | $ 1,020.05 | $ 5.06 |
Institutional Class | .00% | | | |
Actual | | $ 1,000.00 | $ 1,061.30 | $ .00 |
HypotheticalA | | $ 1,000.00 | $ 1,025.07 | $ .00 |
Advisor Freedom 2040 | | | | |
Class A | .25% | | | |
Actual | | $ 1,000.00 | $ 1,061.30 | $ 1.29 |
HypotheticalA | | $ 1,000.00 | $ 1,023.82 | $ 1.27 |
Class T | .50% | | | |
Actual | | $ 1,000.00 | $ 1,060.00 | $ 2.58 |
HypotheticalA | | $ 1,000.00 | $ 1,022.56 | $ 2.54 |
Class B | 1.00% | | | |
Actual | | $ 1,000.00 | $ 1,057.30 | $ 5.16 |
HypotheticalA | | $ 1,000.00 | $ 1,020.05 | $ 5.06 |
Class C | 1.00% | | | |
Actual | | $ 1,000.00 | $ 1,057.50 | $ 5.16 |
HypotheticalA | | $ 1,000.00 | $ 1,020.05 | $ 5.06 |
Institutional Class | .00% | | | |
Actual | | $ 1,000.00 | $ 1,063.10 | $ .00 |
HypotheticalA | | $ 1,000.00 | $ 1,025.07 | $ .00 |
Advisor Freedom 2045 | | | | |
Class A | .25% | | | |
Actual | | $ 1,000.00 | $ 1,064.10 | $ 1.29 |
HypotheticalA | | $ 1,000.00 | $ 1,023.82 | $ 1.27 |
Class T | .50% | | | |
Actual | | $ 1,000.00 | $ 1,061.80 | $ 2.58 |
HypotheticalA | | $ 1,000.00 | $ 1,022.56 | $ 2.54 |
Class B | 1.00% | | | |
Actual | | $ 1,000.00 | $ 1,060.00 | $ 5.16 |
HypotheticalA | | $ 1,000.00 | $ 1,020.05 | $ 5.06 |
Class C | 1.00% | | | |
Actual | | $ 1,000.00 | $ 1,060.10 | $ 5.16 |
HypotheticalA | | $ 1,000.00 | $ 1,020.05 | $ 5.06 |
Institutional Class | .00% | | | |
Actual | | $ 1,000.00 | $ 1,065.40 | $ .00 |
HypotheticalA | | $ 1,000.00 | $ 1,025.07 | $ .00 |
| Annualized
Expense RatioB | Beginning
Account Value
April 1, 2013 | Ending
Account Value
September 30, 2013 | Expenses Paid
During Period*
April 1, 2013
to September 30, 2013 |
Advisor Freedom 2050 | | | | |
Class A | .25% | | | |
Actual | | $ 1,000.00 | $ 1,064.50 | $ 1.29 |
HypotheticalA | | $ 1,000.00 | $ 1,023.82 | $ 1.27 |
Class T | .50% | | | |
Actual | | $ 1,000.00 | $ 1,063.20 | $ 2.59 |
HypotheticalA | | $ 1,000.00 | $ 1,022.56 | $ 2.54 |
Class B | 1.00% | | | |
Actual | | $ 1,000.00 | $ 1,061.10 | $ 5.17 |
HypotheticalA | | $ 1,000.00 | $ 1,020.05 | $ 5.06 |
Class C | 1.00% | | | |
Actual | | $ 1,000.00 | $ 1,060.10 | $ 5.16 |
HypotheticalA | | $ 1,000.00 | $ 1,020.05 | $ 5.06 |
Institutional Class | .00% | | | |
Actual | | $ 1,000.00 | $ 1,065.80 | $ .00 |
HypotheticalA | | $ 1,000.00 | $ 1,025.07 | $ .00 |
Advisor Freedom 2055 | | | | |
Class A | .25% | | | |
Actual | | $ 1,000.00 | $ 1,068.20 | $ 1.30 |
HypotheticalA | | $ 1,000.00 | $ 1,023.82 | $ 1.27 |
Class T | .50% | | | |
Actual | | $ 1,000.00 | $ 1,066.80 | $ 2.59 |
HypotheticalA | | $ 1,000.00 | $ 1,022.56 | $ 2.54 |
Class C | 1.00% | | | |
Actual | | $ 1,000.00 | $ 1,063.70 | $ 5.17 |
HypotheticalA | | $ 1,000.00 | $ 1,020.05 | $ 5.06 |
Institutional Class | .00% | | | |
Actual | | $ 1,000.00 | $ 1,069.50 | $ .00 |
HypotheticalA | | $ 1,000.00 | $ 1,025.07 | $ .00 |
A 5% return per year before expenses
B Annualized expense ratio reflects expenses net of applicable fee waivers.
* Expenses are equal to each Class' annualized expense ratio, multiplied by the average account value over the period, multiplied by 183/ 365 (to reflect the one-half year period). The fees and expenses of the underlying Fidelity Funds in which the Funds invest are not included in each Class' annualized expense ratio.
Semiannual Report
Fidelity Advisor Freedom Income Fund
Investment Changes (Unaudited)
The information in the following tables is based on the direct investments of the Fund. |
Fund Holdings as of September 30, 2013 |
| % of fund's
net assets | % of fund's net assets
6 months ago |
Commodity Funds | | |
Fidelity Series Commodity Strategy Fund | 1.9 | 1.9 |
Domestic Equity Funds | | |
Fidelity Advisor Equity Growth Fund Institutional Class | 1.9 | 1.8 |
Fidelity Advisor Growth & Income Fund Institutional Class | 0.0 | 0.9 |
Fidelity Advisor Large Cap Fund Institutional Class | 0.9 | 1.0 |
Fidelity Advisor Series Equity-Income Fund | 1.3 | 1.3 |
Fidelity Advisor Series Growth & Income Fund (formerly Fidelity Advisor Series Mega Cap Fund) | 1.3 | 0.3 |
Fidelity Advisor Series Opportunistic Insights Fund | 1.0 | 0.9 |
Fidelity Advisor Series Stock Selector Large Cap Value Fund | 1.3 | 1.3 |
Fidelity Advisor Small Cap Fund Institutional Class | 0.7 | 0.7 |
Fidelity Series 100 Index Fund | 0.3 | 0.3 |
Fidelity Series All-Sector Equity Fund | 2.3 | 2.3 |
Fidelity Series Large Cap Value Fund | 1.2 | 1.3 |
Fidelity Series Real Estate Equity Fund | 0.2 | 0.2 |
Fidelity Series Small Cap Opportunities Fund | 0.8 | 0.8 |
| 13.2 | 13.1 |
Developed International Equity Funds | | |
Fidelity Series International Growth Fund | 2.0 | 2.0 |
Fidelity Series International Small Cap Fund | 0.4 | 0.4 |
Fidelity Series International Value Fund | 2.1 | 2.0 |
| 4.5 | 4.4 |
Emerging Markets Equity Funds | | |
Fidelity Series Emerging Markets Fund | 1.2 | 1.2 |
High Yield Bond Funds | | |
Fidelity Series Emerging Markets Debt Fund | 0.5 | 0.5 |
Fidelity Series Floating Rate High Income Fund | 1.1 | 1.1 |
Fidelity Series High Income Fund | 4.9 | 4.9 |
Fidelity Series Real Estate Income Fund | 0.4 | 0.4 |
| 6.9 | 6.9 |
Inflation-Protected Bond Funds | | |
Fidelity Series Inflation-Protected Bond Index Fund | 11.1 | 11.4 |
Investment Grade Bond Funds | | |
Fidelity Series Investment Grade Bond Fund | 21.6 | 21.5 |
Short-Term Funds | | |
Fidelity Advisor Short Fixed-Income Fund Institutional Class | 17.8 | 17.9 |
Fidelity Institutional Money Market Portfolio Institutional Class | 21.8 | 21.7 |
| 39.6 | 39.6 |
Net Other Assets (Liabilities)* | 0.0 | 0.0 |
| 100.0 | 100.0 |
* Amount represents less than 0.1% |
Asset Allocation (% of fund's net assets) |
Period end |
 | Commodity Funds | 1.9% | |
 | Domestic Equity Funds | 13.2% | |
 | Developed International Equity Funds | 4.5% | |
 | Emerging Markets Equity Funds | 1.2% | |
 | High Yield Bond Funds | 6.9% | |
 | Inflation-Protected Bond Funds | 11.1% | |
 | Investment Grade Bond Funds | 21.6% | |
 | Short-Term Funds | 39.6% | |

Six months ago |
| Commodity Funds | 1.9% | |
| Domestic Equity Funds | 13.1% | |
| Developed International Equity Funds | 4.4% | |
| Emerging Markets Equity Funds | 1.2% | |
| High Yield Bond Funds | 6.9% | |
| Inflation-Protected Bond Funds | 11.4% | |
| Investment Grade Bond Funds | 21.5% | |
| Short-Term Funds | 39.6% | |

Semiannual Report
Fidelity Advisor Freedom Income Fund
Investments September 30, 2013 (Unaudited)
Showing Percentage of Net Assets
Domestic Equity Funds - 15.1% |
| Shares | | Value |
Commodity Funds - 1.9% |
Fidelity Series Commodity Strategy Fund (a)(c) | 741,639 | | $ 5,940,526 |
Domestic Equity Funds - 13.2% |
Fidelity Advisor Equity Growth Fund Institutional Class (c) | 70,803 | | 5,825,653 |
Fidelity Advisor Large Cap Fund Institutional Class (c) | 110,055 | | 2,960,481 |
Fidelity Advisor Series Equity-Income Fund (c) | 336,270 | | 3,964,623 |
Fidelity Advisor Series Growth & Income Fund (c) | 325,336 | | 3,920,301 |
Fidelity Advisor Series Opportunistic Insights Fund (c) | 236,712 | | 3,048,849 |
Fidelity Advisor Series Stock Selector Large Cap Value Fund (c) | 324,571 | | 3,950,034 |
Fidelity Advisor Small Cap Fund Institutional Class (c) | 75,552 | | 2,302,840 |
Fidelity Series 100 Index Fund (c) | 80,993 | | 897,405 |
Fidelity Series All-Sector Equity Fund (c) | 506,022 | | 7,165,278 |
Fidelity Series Large Cap Value Fund (c) | 301,744 | | 3,811,027 |
Fidelity Series Real Estate Equity Fund (c) | 48,336 | | 578,104 |
Fidelity Series Small Cap Opportunities Fund (c) | 207,220 | | 2,658,627 |
TOTAL DOMESTIC EQUITY FUNDS | | 41,083,222 |
TOTAL DOMESTIC EQUITY FUNDS (Cost $36,823,436) |
47,023,748
|
International Equity Funds - 5.7% |
| | | |
Developed International Equity Funds - 4.5% |
Fidelity Series International Growth Fund (c) | 454,762 | | 6,171,116 |
Fidelity Series International Small Cap Fund (c) | 85,290 | | 1,304,078 |
Fidelity Series International Value Fund (c) | 584,849 | | 6,287,130 |
TOTAL DEVELOPED INTERNATIONAL EQUITY FUNDS | | 13,762,324 |
Emerging Markets Equity Funds - 1.2% |
Fidelity Series Emerging Markets Fund (c) | 226,634 | | 3,793,857 |
TOTAL INTERNATIONAL EQUITY FUNDS (Cost $14,122,954) |
17,556,181
|
Bond Funds - 39.6% |
| Shares | | Value |
High Yield Bond Funds - 6.9% |
Fidelity Series Emerging Markets Debt Fund (c) | 145,404 | | $ 1,471,488 |
Fidelity Series Floating Rate High Income Fund (c) | 335,064 | | 3,544,975 |
Fidelity Series High Income Fund (c) | 1,485,598 | | 15,271,952 |
Fidelity Series Real Estate Income Fund (c) | 100,983 | | 1,108,788 |
TOTAL HIGH YIELD BOND FUNDS | | 21,397,203 |
Inflation-Protected Bond Funds - 11.1% |
Fidelity Series Inflation-Protected Bond Index Fund (c) | 3,168,479 | | 34,377,994 |
Investment Grade Bond Funds - 21.6% |
Fidelity Series Investment Grade Bond Fund (c) | 6,013,328 | | 67,289,141 |
TOTAL BOND FUNDS (Cost $120,138,040) |
123,064,338
|
Short-Term Funds - 39.6% |
| | | |
Fidelity Advisor Short Fixed-Income Fund Institutional Class (c) | 5,945,688 | | 55,473,267 |
Fidelity Institutional Money Market Portfolio Institutional Class 0.04% (b)(c) | 67,718,018 | | 67,718,018 |
TOTAL SHORT-TERM FUNDS (Cost $122,553,620) |
123,191,285
|
TOTAL INVESTMENT PORTFOLIO - 100.0% (Cost $293,638,050) | | 310,835,552 |
NET OTHER ASSETS (LIABILITIES) - 0.0% | | (73,546) |
NET ASSETS - 100% | $ 310,762,006 |
Legend |
(a) Non-income producing |
(b) The rate quoted is the annualized seven-day yield of the fund at period end. |
(c) Affiliated company |
Affiliated Underlying Funds |
Information regarding the Fund's fiscal year to date purchases and sales of the affiliated Underlying Funds and income earned by the Fund from investments in affiliated Underlying Funds is as follows: |
Affiliate | Value,
beginning of
period | Purchases | Sales
Proceeds | Dividend
Income | Value,
end of
period |
Fidelity Advisor Equity Growth Fund Institutional Class | $ 5,710,077 | $ 118,360 | $ 858,887 | $ - | $ 5,825,653 |
Fidelity Advisor Growth & Income Fund Institutional Class | 3,030,254 | 42,439 | 3,331,738 | - | - |
Fidelity Advisor Large Cap Fund Institutional Class | 3,065,549 | 48,805 | 537,567 | - | 2,960,481 |
Fidelity Advisor Series Equity-Income Fund | 4,217,999 | 170,724 | 670,150 | 41,571 | 3,964,623 |
Fidelity Advisor Series Growth & Income Fund (formerly Fidelity Advisor Series Mega Cap Fund) | 944,641 | 3,083,231 | 232,302 | - | 3,920,301 |
Fidelity Advisor Series Opportunistic Insights Fund | 2,977,939 | 60,814 | 460,483 | - | 3,048,849 |
Fidelity Advisor Series Stock Selector Large Cap Value Fund | 4,236,726 | 85,094 | 728,403 | - | 3,950,034 |
Fidelity Advisor Short Fixed-Income Fund Institutional Class | 58,469,712 | 2,254,377 | 5,055,895 | 223,001 | 55,473,267 |
Fidelity Advisor Small Cap Fund Institutional Class | 2,340,665 | 46,842 | 369,935 | - | 2,302,840 |
Fidelity Institutional Money Market Portfolio Institutional Class | 71,120,992 | 2,860,589 | 6,263,565 | 40,374 | 67,718,018 |
Fidelity Series 100 Index Fund | 930,494 | 19,605 | 118,927 | - | 897,405 |
Fidelity Series All-Sector Equity Fund | 7,623,707 | 122,971 | 1,311,208 | - | 7,165,278 |
Fidelity Series Commodity Strategy Fund | 6,348,249 | 615,845 | 523,241 | - | 5,940,526 |
Fidelity Series Emerging Markets Debt Fund | 1,617,547 | 80,041 | 112,313 | 40,897 | 1,471,488 |
Fidelity Series Emerging Markets Fund | 3,933,471 | 197,145 | 336,476 | - | 3,793,857 |
Fidelity Series Floating Rate High Income Fund | 3,606,153 | 190,394 | 234,742 | 78,660 | 3,544,975 |
Fidelity Series High Income Fund | 16,077,152 | 906,450 | 1,363,182 | 412,612 | 15,271,952 |
Fidelity Series Inflation-Protected Bond Index Fund | 37,364,057 | 1,739,988 | 2,950,101 | - | 34,377,994 |
Fidelity Series International Growth Fund | 6,557,246 | 155,636 | 967,693 | - | 6,171,116 |
Fidelity Series International Small Cap Fund | 1,343,743 | 27,961 | 205,647 | - | 1,304,078 |
Fidelity Series International Value Fund | 6,535,805 | 138,721 | 952,290 | - | 6,287,130 |
Fidelity Series Investment Grade Bond Fund | 70,566,759 | 4,101,698 | 5,266,273 | 720,328 | 67,289,141 |
Fidelity Series Large Cap Value Fund | 4,366,121 | 67,283 | 978,982 | - | 3,811,027 |
Fidelity Series Real Estate Equity Fund | 651,607 | 34,981 | 59,033 | 4,034 | 578,104 |
Fidelity Series Real Estate Income Fund | 1,201,698 | 80,608 | 105,144 | 33,617 | 1,108,788 |
Fidelity Series Small Cap Opportunities Fund | 2,720,966 | 248,427 | 430,029 | - | 2,658,627 |
Total | $ 327,559,329 | $ 17,499,029 | $ 34,424,206 | $ 1,595,094 | $ 310,835,552 |
Other Information |
All investments are categorized as Level 1 under the Fair Value Hierarchy. The inputs or methodology used for valuing securities may not be an indication of the risk associated with investing in those securities. For more information on valuation inputs, please refer to the Investment Valuation section in the accompanying Notes to Financial Statements. |
See accompanying notes which are an integral part of the financial statements.
Semiannual Report
Fidelity Advisor Freedom Income Fund
Statement of Assets and Liabilities
| September 30, 2013 (Unaudited) |
| | |
Assets | | |
Investment in securities, at value (cost $293,638,050) - See accompanying schedule | | $ 310,835,552 |
Receivable for investments sold | | 145,198 |
Receivable for fund shares sold | | 692,494 |
Total assets | | 311,673,244 |
| | |
Liabilities | | |
Payable for investments purchased | $ 14,598 | |
Payable for fund shares redeemed | 826,140 | |
Distribution and service plan fees payable | 70,500 | |
Total liabilities | | 911,238 |
| | |
Net Assets | | $ 310,762,006 |
Net Assets consist of: | | |
Paid in capital | | $ 291,457,188 |
Undistributed net investment income | | 247,867 |
Accumulated undistributed net realized gain (loss) on investments | | 1,859,449 |
Net unrealized appreciation (depreciation) on investments | | 17,197,502 |
Net Assets | | $ 310,762,006 |
| | |
Calculation of Maximum Offering Price Class A:
Net Asset Value and redemption price per share ($165,071,584 ÷ 14,867,864 shares) | | $ 11.10 |
| | |
Maximum offering price per share (100/94.25 of $11.10) | | $ 11.78 |
Class T:
Net Asset Value and redemption price per share ($50,693,440 ÷ 4,569,668 shares) | | $ 11.09 |
| | |
Maximum offering price per share (100/96.50 of $11.09) | | $ 11.49 |
Class B:
Net Asset Value and offering price per share ($1,979,421 ÷ 178,568 shares)A | | $ 11.08 |
| | |
Class C:
Net Asset Value and offering price per share ($15,537,051 ÷ 1,402,622 shares)A | | $ 11.08 |
| | |
Institutional Class:
Net Asset Value, offering price and redemption price per share ($77,480,510 ÷ 6,960,731 shares) | | $ 11.13 |
A Redemption price per share is equal to net asset value less any applicable contingent deferred sales charge.
Statement of Operations
Six months ended September 30, 2013 (Unaudited) |
| | |
Investment Income | | |
Income distributions from underlying funds | | $ 1,595,094 |
| | |
Expenses | | |
Distribution and service plan fees | $ 439,921 | |
Independent trustees' compensation | 605 | |
Total expenses before reductions | 440,526 | |
Expense reductions | (605) | 439,921 |
Net investment income (loss) | | 1,155,173 |
Realized and Unrealized Gain (Loss) Realized gain (loss) on sale of underlying fund shares | 2,345,155 | |
Capital gain distributions from underlying funds | 239,454 | |
Total net realized gain (loss) | | 2,584,609 |
Change in net unrealized appreciation (depreciation) on underlying funds | | (2,143,775) |
Net gain (loss) | | 440,834 |
Net increase (decrease) in net assets resulting from operations | | $ 1,596,007 |
See accompanying notes which are an integral part of the financial statements.
Semiannual Report
Statement of Changes in Net Assets
| Six months ended
September 30, 2013
(Unaudited) | Year ended
March 31,
2013 |
Increase (Decrease) in Net Assets | | |
Operations | | |
Net investment income (loss) | $ 1,155,173 | $ 3,306,001 |
Net realized gain (loss) | 2,584,609 | 6,963,470 |
Change in net unrealized appreciation (depreciation) | (2,143,775) | 3,721,536 |
Net increase (decrease) in net assets resulting from operations | 1,596,007 | 13,991,007 |
Distributions to shareholders from net investment income | (1,158,318) | (3,274,495) |
Distributions to shareholders from net realized gain | (3,649,889) | (4,055,113) |
Total distributions | (4,808,207) | (7,329,608) |
Share transactions - net increase (decrease) | (13,511,315) | 17,611,622 |
Total increase (decrease) in net assets | (16,723,515) | 24,273,021 |
| | |
Net Assets | | |
Beginning of period | 327,485,521 | 303,212,500 |
End of period (including undistributed net investment income of $247,867 and undistributed net investment income of $251,012, respectively) | $ 310,762,006 | $ 327,485,521 |
Financial Highlights - Class A
| Six months ended
September 30, 2013 | Years ended March 31, |
| (Unaudited) | 2013 | 2012 | 2011 | 2010 | 2009 |
Selected Per-Share Data | | | | | | |
Net asset value, beginning of period | $ 11.21 | $ 10.98 | $ 10.85 | $ 10.35 | $ 8.74 | $ 10.46 |
Income from Investment Operations | | | | | | |
Net investment income (loss) E | .04 | .12 | .15 | .16 | .22 | .29 |
Net realized and unrealized gain (loss) | .02 | .37 | .21 | .57 | 1.66 | (1.60) |
Total from investment operations | .06 | .49 | .36 | .73 | 1.88 | (1.31) |
Distributions from net investment income | (.04) | (.12) | (.15) | (.16) | (.22) | (.30) |
Distributions from net realized gain | (.13) | (.14) | (.08) | (.07) | (.06) | (.11) |
Total distributions | (.17) | (.26) | (.23) | (.23) | (.27) H | (.41) |
Net asset value, end of period | $ 11.10 | $ 11.21 | $ 10.98 | $ 10.85 | $ 10.35 | $ 8.74 |
Total Return B, C, D | .51% | 4.53% | 3.34% | 7.11% | 21.74% | (12.78)% |
Ratios to Average Net Assets F, G | | | | | | |
Expenses before reductions | .25% A | .25% | .25% | .25% | .25% | .25% |
Expenses net of fee waivers, if any | .25% A | .25% | .25% | .25% | .25% | .25% |
Expenses net of all reductions | .25% A | .25% | .25% | .25% | .25% | .25% |
Net investment income (loss) | .74% A | 1.08% | 1.37% | 1.48% | 2.19% | 3.03% |
Supplemental Data | | | | | | |
Net assets, end of period (000 omitted) | $ 165,072 | $ 176,876 | $ 166,658 | $ 157,695 | $ 142,691 | $ 93,865 |
Portfolio turnover rate F | 11% A | 17% | 24% | 35% | 31% | 44% |
A Annualized
B Total returns for periods of less than one year are not annualized.
C Total returns would have been lower if certain expenses had not been reduced during the applicable periods shown.
D Total returns do not include the effect of the sales charges.
E Calculated based on average shares outstanding during the period.
F Amounts do not include the activity of the Underlying Funds.
G Expense ratios reflect operating expenses of the class. Expenses before reductions do not reflect amounts reimbursed by the investment adviser or reductions from expense offset arrangements and do not represent the amount paid by the class during periods when reimbursements or reductions occur. Expenses net of fee waivers reflect expenses after reimbursement by the investment adviser but prior to reductions from expense offset arrangements. Expenses net of all reductions represent the net expenses paid by the class but do not include expenses of the investment companies in which the Fund invests.
H Total distributions of $.27 per share is comprised of distributions from net investment income of $.217 and distributions from net realized gain of $.056 per share.
See accompanying notes which are an integral part of the financial statements.
Semiannual Report
Financial Highlights - Class T
| Six months ended
September 30, 2013 | Years ended March 31, |
| (Unaudited) | 2013 | 2012 | 2011 | 2010 | 2009 |
Selected Per-Share Data | | | | | | |
Net asset value, beginning of period | $ 11.20 | $ 10.96 | $ 10.84 | $ 10.34 | $ 8.73 | $ 10.45 |
Income from Investment Operations | | | | | | |
Net investment income (loss) E | .03 | .09 | .12 | .13 | .19 | .27 |
Net realized and unrealized gain (loss) | .01 | .38 | .20 | .57 | 1.67 | (1.61) |
Total from investment operations | .04 | .47 | .32 | .70 | 1.86 | (1.34) |
Distributions from net investment income | (.03) | (.09) | (.12) | (.13) | (.19) | (.27) |
Distributions from net realized gain | (.13) | (.14) | (.08) | (.07) | (.06) | (.11) |
Total distributions | (.15) I | (.23) | (.20) | (.20) | (.25) H | (.38) |
Net asset value, end of period | $ 11.09 | $ 11.20 | $ 10.96 | $ 10.84 | $ 10.34 | $ 8.73 |
Total Return B, C, D | .37% | 4.35% | 3.01% | 6.85% | 21.47% | (13.03)% |
Ratios to Average Net Assets F, G | | | | | | |
Expenses before reductions | .50% A | .50% | .50% | .50% | .50% | .50% |
Expenses net of fee waivers, if any | .50% A | .50% | .50% | .50% | .50% | .50% |
Expenses net of all reductions | .50% A | .50% | .50% | .50% | .50% | .50% |
Net investment income (loss) | .49% A | .83% | 1.12% | 1.23% | 1.94% | 2.78% |
Supplemental Data | | | | | | |
Net assets, end of period (000 omitted) | $ 50,693 | $ 53,734 | $ 56,246 | $ 57,404 | $ 52,047 | $ 42,675 |
Portfolio turnover rate F | 11% A | 17% | 24% | 35% | 31% | 44% |
A Annualized
B Total returns for periods of less than one year are not annualized.
C Total returns would have been lower if certain expenses had not been reduced during the applicable periods shown.
D Total returns do not include the effect of the sales charges.
E Calculated based on average shares outstanding during the period.
F Amounts do not include the activity of the Underlying Funds.
G Expense ratios reflect operating expenses of the class. Expenses before reductions do not reflect amounts reimbursed by the investment adviser or reductions from expense offset arrangements and do not represent the amount paid by the class during periods when reimbursements or reductions occur. Expenses net of fee waivers reflect expenses after reimbursement by the investment adviser but prior to reductions from expense offset arrangements. Expenses net of all reductions represent the net expenses paid by the class but do not include expenses of the investment companies in which the Fund invests.
H Total distributions of $.25 per share is comprised of distributions from net investment income of $.193 and distributions from net realized gain of $.056 per share.
I Total distributions of $.15 per share is comprised of distributions from net investment income of $.027 and distributions from net realized gain of $.125 per share.
Financial Highlights - Class B
| Six months ended
September 30, 2013 | Years ended March 31, |
| (Unaudited) | 2013 | 2012 | 2011 | 2010 | 2009 |
Selected Per-Share Data | | | | | | |
Net asset value, beginning of period | $ 11.19 | $ 10.96 | $ 10.84 | $ 10.33 | $ 8.72 | $ 10.44 |
Income from Investment Operations | | | | | | |
Net investment income (loss) E | - H | .04 | .07 | .08 | .14 | .22 |
Net realized and unrealized gain (loss) | .02 | .37 | .19 | .58 | 1.67 | (1.60) |
Total from investment operations | .02 | .41 | .26 | .66 | 1.81 | (1.38) |
Distributions from net investment income | - | (.04) | (.07) | (.08) | (.14) | (.23) |
Distributions from net realized gain | (.13) | (.14) | (.08) | (.07) | (.06) | (.11) |
Total distributions | (.13) | (.18) | (.14) J | (.15) | (.20) I | (.34) |
Net asset value, end of period | $ 11.08 | $ 11.19 | $ 10.96 | $ 10.84 | $ 10.33 | $ 8.72 |
Total Return B, C, D | .13% | 3.80% | 2.47% | 6.39% | 20.86% | (13.48)% |
Ratios to Average Net Assets F, G | | | | | | |
Expenses before reductions | 1.00% A | 1.00% | 1.00% | 1.00% | 1.00% | 1.00% |
Expenses net of fee waivers, if any | 1.00% A | 1.00% | 1.00% | 1.00% | 1.00% | 1.00% |
Expenses net of all reductions | 1.00% A | 1.00% | 1.00% | 1.00% | 1.00% | 1.00% |
Net investment income (loss) | (.01)% A | .33% | .62% | .73% | 1.44% | 2.28% |
Supplemental Data | | | | | | |
Net assets, end of period (000 omitted) | $ 1,979 | $ 2,294 | $ 2,889 | $ 3,938 | $ 5,319 | $ 4,282 |
Portfolio turnover rate F | 11% A | 17% | 24% | 35% | 31% | 44% |
A Annualized
B Total returns for periods of less than one year are not annualized.
C Total returns would have been lower if certain expenses had not been reduced during the applicable periods shown.
D Total returns do not include the effect of the contingent deferred sales charge.
E Calculated based on average shares outstanding during the period.
F Amounts do not include the activity of the Underlying Funds.
G Expense ratios reflect operating expenses of the class. Expenses before reductions do not reflect amounts reimbursed by the investment adviser or reductions from expense offset arrangements and do not represent the amount paid by the class during periods when reimbursements or reductions occur. Expenses net of fee waivers reflect expenses after reimbursement by the investment adviser but prior to reductions from expense offset arrangements. Expenses net of all reductions represent the net expenses paid by the class but do not include expenses of the investment companies in which the Fund invests.
H Amount represents less than $.01 per share.
I Total distributions of $.20 per share is comprised of distributions from net investment income of $.142 and distributions from net realized gain of $.056 per share.
J Total distributions of $.14 per share is comprised of distributions from net investment income of $.065 and distributions from net realized gain of $.079 per share.
See accompanying notes which are an integral part of the financial statements.
Semiannual Report
Financial Highlights - Class C
| Six months ended
September 30, 2013 | Years ended March 31, |
| (Unaudited) | 2013 | 2012 | 2011 | 2010 | 2009 |
Selected Per-Share Data | | | | | | |
Net asset value, beginning of period | $ 11.18 | $ 10.96 | $ 10.84 | $ 10.33 | $ 8.72 | $ 10.43 |
Income from Investment Operations | | | | | | |
Net investment income (loss) E | - H | .04 | .07 | .08 | .14 | .22 |
Net realized and unrealized gain (loss) | .03 | .36 | .20 | .58 | 1.67 | (1.60) |
Total from investment operations | .03 | .40 | .27 | .66 | 1.81 | (1.38) |
Distributions from net investment income | - | (.04) | (.07) | (.08) | (.14) | (.22) |
Distributions from net realized gain | (.13) | (.14) | (.08) | (.07) | (.06) | (.11) |
Total distributions | (.13) | (.18) | (.15) | (.15) | (.20) I | (.33) |
Net asset value, end of period | $ 11.08 | $ 11.18 | $ 10.96 | $ 10.84 | $ 10.33 | $ 8.72 |
Total Return B, C, D | .23% | 3.70% | 2.50% | 6.42% | 20.83% | (13.41)% |
Ratios to Average Net Assets F, G | | | | | | |
Expenses before reductions | 1.00% A | 1.00% | 1.00% | 1.00% | 1.00% | 1.00% |
Expenses net of fee waivers, if any | 1.00% A | 1.00% | 1.00% | 1.00% | 1.00% | 1.00% |
Expenses net of all reductions | 1.00% A | 1.00% | 1.00% | 1.00% | 1.00% | 1.00% |
Net investment income (loss) | (.01)% A | .33% | .62% | .73% | 1.44% | 2.28% |
Supplemental Data | | | | | | |
Net assets, end of period (000 omitted) | $ 15,537 | $ 16,606 | $ 17,170 | $ 16,581 | $ 14,697 | $ 11,362 |
Portfolio turnover rate F | 11% A | 17% | 24% | 35% | 31% | 44% |
A Annualized
B Total returns for periods of less than one year are not annualized.
C Total returns would have been lower if certain expenses had not been reduced during the applicable periods shown.
D Total returns do not include the effect of the contingent deferred sales charge.
E Calculated based on average shares outstanding during the period.
F Amounts do not include the activity of the Underlying Funds.
G Expense ratios reflect operating expenses of the class. Expenses before reductions do not reflect amounts reimbursed by the investment adviser or reductions from expense offset arrangements and do not represent the amount paid by the class during periods when reimbursements or reductions occur. Expenses net of fee waivers reflect expenses after reimbursement by the investment adviser but prior to reductions from expense offset arrangements. Expenses net of all reductions represent the net expenses paid by the class but do not include expenses of the investment companies in which the Fund invests.
H Amount represents less than $.01 per share.
I Total distributions of $.20 per share is comprised of distributions from net investment income of $.140 and distributions from net realized gain of $.056 per share.
Financial Highlights - Institutional Class
| Six months ended
September 30, 2013 | Years ended March 31, |
| (Unaudited) | 2013 | 2012 | 2011 | 2010 | 2009 |
Selected Per-Share Data | | | | | | |
Net asset value, beginning of period | $ 11.23 | $ 11.00 | $ 10.87 | $ 10.37 | $ 8.75 | $ 10.48 |
Income from Investment Operations | | | | | | |
Net investment income (loss) D | .06 | .15 | .18 | .18 | .24 | .31 |
Net realized and unrealized gain (loss) | .02 | .37 | .20 | .57 | 1.68 | (1.61) |
Total from investment operations | .08 | .52 | .38 | .75 | 1.92 | (1.30) |
Distributions from net investment income | (.05) | (.14) | (.17) | (.19) | (.24) | (.32) |
Distributions from net realized gain | (.13) | (.14) | (.08) | (.07) | (.06) | (.11) |
Total distributions | (.18) | (.29) J | (.25) | (.25) I | (.30) H | (.43) |
Net asset value, end of period | $ 11.13 | $ 11.23 | $ 11.00 | $ 10.87 | $ 10.37 | $ 8.75 |
Total Return B, C | .71% | 4.75% | 3.58% | 7.36% | 22.16% | (12.63)% |
Ratios to Average Net Assets E, G | | | | | | |
Expenses before reductions F | .00% A | .00% | .00% | .00% | .00% | .00% |
Expenses net of fee waivers, if any | .00% A | .00% | .00% | .00% | .00% | .00% |
Expenses net of all reductions | .00% A | .00% | .00% | .00% | .00% | .00% |
Net investment income (loss) | .99% A | 1.33% | 1.62% | 1.73% | 2.44% | 3.28% |
Supplemental Data | | | | | | |
Net assets, end of period (000 omitted) | $ 77,481 | $ 77,976 | $ 60,248 | $ 32,640 | $ 18,137 | $ 8,461 |
Portfolio turnover rate E | 11% A | 17% | 24% | 35% | 31% | 44% |
A Annualized
B Total returns for periods of less than one year are not annualized.
C Total returns would have been lower if certain expenses had not been reduced during the applicable periods shown.
D Calculated based on average shares outstanding during the period.
E Amounts do not include the activity of the Underlying Funds.
F Amount represents less than .01%.
G Expense ratios reflect operating expenses of the class. Expenses before reductions do not reflect amounts reimbursed by the investment adviser or reductions from expense offset arrangements and do not represent the amount paid by the class during periods when reimbursements or reductions occur. Expenses net of fee waivers reflect expenses after reimbursement by the investment adviser but prior to reductions from expense offset arrangements. Expenses net of all reductions represent the net expenses paid by the class but do not include expenses of the investment companies in which the Fund invests.
H Total distributions of $.30 per share is comprised of distributions from net investment income of $.243 and distributions from net realized gain of $.056 per share.
I Total distributions of $.25 per share is comprised of distributions from net investment income of $.186 and distributions from net realized gain of $.067 per share.
J Total distributions of $.29 per share is comprised of distributions from net investment income of $.144 and distributions from net realized gain of $.141 per share.
See accompanying notes which are an integral part of the financial statements.
Semiannual Report
Fidelity Advisor Freedom 2005 Fund
Investment Changes (Unaudited)
The information in the following tables is based on the direct investments of the Fund. |
Fund Holdings as of September 30, 2013 |
| % of fund's
net assets | % of fund's net assets
6 months ago |
Commodity Funds | | |
Fidelity Series Commodity Strategy Fund | 3.5 | 3.7 |
Domestic Equity Funds | | |
Fidelity Advisor Equity Growth Fund Institutional Class | 3.0 | 3.0 |
Fidelity Advisor Growth & Income Fund Institutional Class | 0.0 | 1.6 |
Fidelity Advisor Large Cap Fund Institutional Class | 1.5 | 1.6 |
Fidelity Advisor Series Equity-Income Fund | 2.0 | 2.1 |
Fidelity Advisor Series Growth & Income Fund (formerly Fidelity Advisor Series Mega Cap Fund) | 2.0 | 0.5 |
Fidelity Advisor Series Opportunistic Insights Fund | 1.6 | 1.5 |
Fidelity Advisor Series Stock Selector Large Cap Value Fund | 2.0 | 2.2 |
Fidelity Advisor Small Cap Fund Institutional Class | 1.2 | 1.2 |
Fidelity Series 100 Index Fund | 0.5 | 0.5 |
Fidelity Series All-Sector Equity Fund | 3.8 | 4.0 |
Fidelity Series Large Cap Value Fund | 2.0 | 2.3 |
Fidelity Series Real Estate Equity Fund | 0.3 | 0.4 |
Fidelity Series Small Cap Opportunities Fund | 1.4 | 1.4 |
| 21.3 | 22.3 |
Developed International Equity Funds | | |
Fidelity Series International Growth Fund | 3.3 | 3.4 |
Fidelity Series International Small Cap Fund | 0.7 | 0.7 |
Fidelity Series International Value Fund | 3.3 | 3.3 |
| 7.3 | 7.4 |
Emerging Markets Equity Funds | | |
Fidelity Series Emerging Markets Fund | 2.0 | 2.0 |
High Yield Bond Funds | | |
Fidelity Series Emerging Markets Debt Fund | 0.6 | 0.6 |
Fidelity Series Floating Rate High Income Fund | 1.1 | 1.1 |
Fidelity Series High Income Fund | 4.8 | 4.8 |
Fidelity Series Real Estate Income Fund | 0.5 | 0.5 |
| 7.0 | 7.0 |
Inflation-Protected Bond Funds | | |
Fidelity Series Inflation-Protected Bond Index Fund | 8.9 | 9.1 |
Investment Grade Bond Funds | | |
Fidelity Series Investment Grade Bond Fund | 17.9 | 18.1 |
Short-Term Funds | | |
Fidelity Advisor Short Fixed-Income Fund Institutional Class | 14.5 | 13.7 |
Fidelity Institutional Money Market Portfolio Institutional Class | 17.6 | 16.7 |
| 32.1 | 30.4 |
Net Other Assets (Liabilities)* | 0.0 | 0.0 |
| 100.0 | 100.0 |
* Amount represents less than 0.1% |
Asset Allocation (% of fund's net assets) |
Period end |
| Commodity Funds | 3.5% | |
| Domestic Equity Funds | 21.3% | |
| Developed International Equity Funds | 7.3% | |
| Emerging Markets Equity Funds | 2.0% | |
| High Yield Bond Funds | 7.0% | |
| Inflation-Protected Bond Funds | 8.9% | |
| Investment Grade Bond Funds | 17.9% | |
| Short-Term Funds | 32.1% | |

Six months ago |
| Commodity Funds | 3.7% | |
| Domestic Equity Funds | 22.3% | |
| Developed International Equity Funds | 7.4% | |
| Emerging Markets Equity Funds | 2.0% | |
| High Yield Bond Funds | 7.0% | |
| Inflation-Protected Bond Funds | 9.1% | |
| Investment Grade Bond Funds | 18.1% | |
| Short-Term Funds | 30.4% | |

Semiannual Report
Fidelity Advisor Freedom 2005 Fund
Investments September 30, 2013 (Unaudited)
Showing Percentage of Net Assets
Domestic Equity Funds - 24.8% |
| Shares | | Value |
Commodity Funds - 3.5% |
Fidelity Series Commodity Strategy Fund (a)(c) | 1,344,988 | | $ 10,773,354 |
Domestic Equity Funds - 21.3% |
Fidelity Advisor Equity Growth Fund Institutional Class (c) | 111,593 | | 9,181,841 |
Fidelity Advisor Large Cap Fund Institutional Class (c) | 171,061 | | 4,601,541 |
Fidelity Advisor Series Equity-Income Fund (c) | 522,290 | | 6,157,801 |
Fidelity Advisor Series Growth & Income Fund (c) | 510,814 | | 6,155,310 |
Fidelity Advisor Series Opportunistic Insights Fund (c) | 374,976 | | 4,829,697 |
Fidelity Advisor Series Stock Selector Large Cap Value Fund (c) | 508,020 | | 6,182,598 |
Fidelity Advisor Small Cap Fund Institutional Class (c) | 119,159 | | 3,631,975 |
Fidelity Series 100 Index Fund (c) | 131,556 | | 1,457,645 |
Fidelity Series All-Sector Equity Fund (c) | 803,057 | | 11,371,291 |
Fidelity Series Large Cap Value Fund (c) | 472,281 | | 5,964,912 |
Fidelity Series Real Estate Equity Fund (c) | 82,916 | | 991,674 |
Fidelity Series Small Cap Opportunities Fund (c) | 324,698 | | 4,165,874 |
TOTAL DOMESTIC EQUITY FUNDS | | 64,692,159 |
TOTAL DOMESTIC EQUITY FUNDS (Cost $62,727,786) |
75,465,513
|
International Equity Funds - 9.3% |
| | | |
Developed International Equity Funds - 7.3% |
Fidelity Series International Growth Fund (c) | 730,880 | | 9,918,037 |
Fidelity Series International Small Cap Fund (c) | 137,612 | | 2,104,091 |
Fidelity Series International Value Fund (c) | 931,320 | | 10,011,694 |
TOTAL DEVELOPED INTERNATIONAL EQUITY FUNDS | | 22,033,822 |
Emerging Markets Equity Funds - 2.0% |
Fidelity Series Emerging Markets Fund (c) | 370,175 | | 6,196,731 |
TOTAL INTERNATIONAL EQUITY FUNDS (Cost $22,865,686) |
28,230,553
|
Bond Funds - 33.8% |
| Shares | | Value |
High Yield Bond Funds - 7.0% |
Fidelity Series Emerging Markets Debt Fund (c) | 179,182 | | $ 1,813,326 |
Fidelity Series Floating Rate High Income Fund (c) | 324,736 | | 3,435,705 |
Fidelity Series High Income Fund (c) | 1,430,222 | | 14,702,678 |
Fidelity Series Real Estate Income Fund (c) | 124,161 | | 1,363,291 |
TOTAL HIGH YIELD BOND FUNDS | | 21,315,000 |
Inflation-Protected Bond Funds - 8.9% |
Fidelity Series Inflation-Protected Bond Index Fund (c) | 2,492,121 | | 27,039,508 |
Investment Grade Bond Funds - 17.9% |
Fidelity Series Investment Grade Bond Fund (c) | 4,881,794 | | 54,627,275 |
TOTAL BOND FUNDS (Cost $101,292,286) |
102,981,783
|
Short-Term Funds - 32.1% |
| | | |
Fidelity Advisor Short Fixed-Income Fund Institutional Class (c) | 4,707,741 | | 43,923,221 |
Fidelity Institutional Money Market Portfolio Institutional Class 0.04% (b)(c) | 53,651,862 | | 53,651,862 |
TOTAL SHORT-TERM FUNDS (Cost $97,138,152) |
97,575,083
|
TOTAL INVESTMENT PORTFOLIO - 100.0% (Cost $284,023,910) | | 304,252,932 |
NET OTHER ASSETS (LIABILITIES) - 0.0% | | (61,670) |
NET ASSETS - 100% | $ 304,191,262 |
Legend |
(a) Non-income producing |
(b) The rate quoted is the annualized seven-day yield of the fund at period end. |
(c) Affiliated company |
Affiliated Underlying Funds |
Information regarding the Fund's fiscal year to date purchases and sales of the affiliated Underlying Funds and income earned by the Fund from investments in affiliated Underlying Funds is as follows: |
Affiliate | Value,
beginning of
period | Purchases | Sales
Proceeds | Dividend
Income | Value,
end of
period |
Fidelity Advisor Equity Growth Fund Institutional Class | $ 9,259,781 | $ 520,230 | $ 1,974,975 | $ - | $ 9,181,841 |
Fidelity Advisor Growth & Income Fund Institutional Class | 4,932,891 | 199,148 | 5,560,081 | - | - |
Fidelity Advisor Large Cap Fund Institutional Class | 4,939,271 | 262,159 | 1,215,649 | - | 4,601,541 |
Fidelity Advisor Series Equity-Income Fund | 6,678,206 | 466,077 | 1,384,750 | 65,338 | 6,157,801 |
Fidelity Advisor Series Growth & Income Fund (formerly Fidelity Advisor Series Mega Cap Fund) | 1,486,283 | 4,833,068 | 361,434 | - | 6,155,310 |
Fidelity Advisor Series Opportunistic Insights Fund | 4,718,776 | 269,673 | 906,801 | - | 4,829,697 |
Fidelity Advisor Series Stock Selector Large Cap Value Fund | 6,717,864 | 372,783 | 1,479,039 | - | 6,182,598 |
Fidelity Advisor Short Fixed-Income Fund Institutional Class | 42,520,470 | 5,838,600 | 4,298,304 | 167,651 | 43,923,221 |
Fidelity Advisor Small Cap Fund Institutional Class | 3,791,219 | 205,813 | 823,653 | - | 3,631,975 |
Fidelity Institutional Money Market Portfolio Institutional Class | 51,920,042 | 6,847,166 | 5,115,346 | 30,348 | 53,651,862 |
Fidelity Series 100 Index Fund | 1,544,268 | 85,620 | 284,064 | - | 1,457,645 |
Fidelity Series All-Sector Equity Fund | 12,345,820 | 660,442 | 2,822,961 | - | 11,371,291 |
Fidelity Series Commodity Strategy Fund | 11,606,286 | 1,341,967 | 1,267,033 | - | 10,773,354 |
Fidelity Series Emerging Markets Debt Fund | 1,922,638 | 139,672 | 114,208 | 48,886 | 1,813,326 |
Fidelity Series Emerging Markets Fund | 6,352,622 | 493,091 | 654,984 | - | 6,196,731 |
Fidelity Series Floating Rate High Income Fund | 3,388,054 | 324,393 | 260,177 | 74,701 | 3,435,705 |
Fidelity Series High Income Fund | 14,966,543 | 1,566,111 | 1,506,943 | 386,994 | 14,702,678 |
Fidelity Series Inflation-Protected Bond Index Fund | 28,253,550 | 2,855,807 | 2,728,030 | - | 27,039,508 |
Fidelity Series International Growth Fund | 10,396,703 | 650,903 | 1,821,495 | - | 9,918,037 |
Fidelity Series International Small Cap Fund | 2,144,791 | 123,484 | 388,693 | - | 2,104,091 |
Fidelity Series International Value Fund | 10,285,665 | 620,217 | 1,802,498 | - | 10,011,694 |
Fidelity Series Investment Grade Bond Fund | 55,981,719 | 5,609,985 | 5,298,990 | 573,611 | 54,627,275 |
Fidelity Series Large Cap Value Fund | 7,189,173 | 361,568 | 2,171,660 | - | 5,964,912 |
Fidelity Series Real Estate Equity Fund | 1,108,307 | 103,912 | 139,979 | 6,749 | 991,674 |
Fidelity Series Real Estate Income Fund | 1,458,849 | 105,288 | 118,445 | 40,788 | 1,363,291 |
Fidelity Series Small Cap Opportunities Fund | 4,413,628 | 541,184 | 992,865 | 1 | 4,165,874 |
Total | $ 310,323,419 | $ 35,398,361 | $ 45,493,057 | $ 1,395,067 | $ 304,252,932 |
Other Information |
All investments are categorized as Level 1 under the Fair Value Hierarchy. The inputs or methodology used for valuing securities may not be an indication of the risk associated with investing in those securities. For more information on valuation inputs, please refer to the Investment Valuation section in the accompanying Notes to Financial Statements. |
See accompanying notes which are an integral part of the financial statements.
Semiannual Report
Fidelity Advisor Freedom 2005 Fund
Statement of Assets and Liabilities
| September 30, 2013 (Unaudited) |
| | |
Assets | | |
Investment in securities, at value (cost $284,023,910) - See accompanying schedule | | $ 304,252,932 |
Cash | | 9 |
Receivable for investments sold | | 272,038 |
Receivable for fund shares sold | | 162,830 |
Receivable from investment adviser for expense reductions | | 24 |
Total assets | | 304,687,833 |
| | |
Liabilities | | |
Payable for investments purchased | $ 3 | |
Payable for fund shares redeemed | 435,890 | |
Distribution and service plan fees payable | 60,678 | |
Total liabilities | | 496,571 |
| | |
Net Assets | | $ 304,191,262 |
Net Assets consist of: | | |
Paid in capital | | $ 280,417,458 |
Undistributed net investment income | | 1,029,486 |
Accumulated undistributed net realized gain (loss) on investments | | 2,515,296 |
Net unrealized appreciation (depreciation) on investments | | 20,229,022 |
Net Assets | | $ 304,191,262 |
| |
Calculation of Maximum Offering Price Class A:
Net Asset Value and redemption price per share ($196,039,349 ÷ 16,312,385 shares) | | $ 12.02 |
| | |
Maximum offering price per share (100/94.25 of $12.02) | | $ 12.75 |
Class T:
Net Asset Value and redemption price per share ($27,842,962 ÷ 2,318,854 shares) | | $ 12.01 |
| | |
Maximum offering price per share (100/96.50 of $12.01) | | $ 12.45 |
Class B:
Net Asset Value and offering price per share ($1,125,149 ÷ 93,602 shares)A | | $ 12.02 |
| | |
Class C:
Net Asset Value and offering price per share ($8,990,623 ÷ 751,342 shares)A | | $ 11.97 |
| | |
Institutional Class:
Net Asset Value, offering price and redemption price per share ($70,193,179 ÷ 5,802,313 shares) | | $ 12.10 |
A Redemption price per share is equal to net asset value less any applicable contingent deferred sales charge.
Statement of Operations
Six months ended September 30, 2013 (Unaudited) |
| | |
Investment Income | | |
Income distributions from underlying funds | | $ 1,395,067 |
| | |
Expenses | | |
Distribution and service plan fees | $ 365,792 | |
Independent trustees' compensation | 575 | |
Total expenses before reductions | 366,367 | |
Expense reductions | (575) | 365,792 |
Net investment income (loss) | | 1,029,275 |
Realized and Unrealized Gain (Loss) Realized gain (loss) on sale of underlying fund shares | 3,290,289 | |
Capital gain distributions from underlying funds | 369,083 | |
Total net realized gain (loss) | | 3,659,372 |
Change in net unrealized appreciation (depreciation) on underlying funds | | 733,921 |
Net gain (loss) | | 4,393,293 |
Net increase (decrease) in net assets resulting from operations | | $ 5,422,568 |
See accompanying notes which are an integral part of the financial statements.
Semiannual Report
Fidelity Advisor Freedom 2005 Fund
Financial Statements - continued
Statement of Changes in Net Assets
| Six months ended September 30, 2013 (Unaudited) | Year ended
March 31,
2013 |
Increase (Decrease) in Net Assets | | |
Operations | | |
Net investment income (loss) | $ 1,029,275 | $ 3,323,059 |
Net realized gain (loss) | 3,659,372 | 12,719,737 |
Change in net unrealized appreciation (depreciation) | 733,921 | 462,584 |
Net increase (decrease) in net assets resulting from operations | 5,422,568 | 16,505,380 |
Distributions to shareholders from net investment income | (456,504) | (3,357,002) |
Distributions to shareholders from net realized gain | (1,900,701) | (1,779,655) |
Total distributions | (2,357,205) | (5,136,657) |
Share transactions - net increase (decrease) | (9,137,237) | 26,042,535 |
Total increase (decrease) in net assets | (6,071,874) | 37,411,258 |
| | |
Net Assets | | |
Beginning of period | 310,263,136 | 272,851,878 |
End of period (including undistributed net investment income of $1,029,486 and undistributed net investment income of $456,715, respectively) | $ 304,191,262 | $ 310,263,136 |
Financial Highlights - Class A
| Six months ended
September 30, 2013 | Years ended March 31, |
| (Unaudited) | 2013 | 2012 | 2011 | 2010 | 2009 |
Selected Per-Share Data | | | | | | |
Net asset value, beginning of period | $ 11.90 | $ 11.45 | $ 11.45 | $ 10.57 | $ 8.10 | $ 11.40 |
Income from Investment Operations | | | | | | |
Net investment income (loss) E | .04 | .13 | .15 | .15 | .20 | .27 |
Net realized and unrealized gain (loss) | .17 | .53 | .13 | .97 | 2.53 | (3.06) |
Total from investment operations | .21 | .66 | .28 | 1.12 | 2.73 | (2.79) |
Distributions from net investment income | (.02) | (.13) | (.15) | (.15) | (.19) | (.28) |
Distributions from net realized gain | (.07) | (.07) | (.13) | (.09) | (.07) | (.23) |
Total distributions | (.09) | (.21) H | (.28) | (.24) | (.26) | (.51) |
Net asset value, end of period | $ 12.02 | $ 11.90 | $ 11.45 | $ 11.45 | $ 10.57 | $ 8.10 |
Total Return B, C, D | 1.77% | 5.79% | 2.53% | 10.72% | 33.91% | (25.09)% |
Ratios to Average Net Assets F, G | | | | | | |
Expenses before reductions | .25% A | .25% | .25% | .25% | .25% | .25% |
Expenses net of fee waivers, if any | .25% A | .25% | .25% | .25% | .25% | .25% |
Expenses net of all reductions | .25% A | .25% | .25% | .25% | .25% | .25% |
Net investment income (loss) | .66% A | 1.16% | 1.37% | 1.37% | 2.01% | 2.75% |
Supplemental Data | | | | | | |
Net assets, end of period (000 omitted) | $ 196,039 | $ 204,418 | $ 193,977 | $ 177,385 | $ 155,482 | $ 88,593 |
Portfolio turnover rate F | 23% A | 23% | 28% | 41% | 35% | 54% |
A Annualized
B Total returns for periods of less than one year are not annualized.
C Total returns would have been lower if certain expenses had not been reduced during the applicable periods shown.
D Total returns do not include the effect of the sales charges.
E Calculated based on average shares outstanding during the period.
F Amounts do not include the activity of the Underlying Funds.
G Expense ratios reflect operating expenses of the class. Expenses before reductions do not reflect amounts reimbursed by the investment adviser or reductions from expense offset arrangements and do not represent the amount paid by the class during periods when reimbursements or reductions occur. Expenses net of fee waivers reflect expenses after reimbursement by the investment adviser but prior to reductions from expense offset arrangements. Expenses net of all reductions represent the net expenses paid by the class but do not include expenses of the investment companies in which the Fund invests.
H Total distributions of $.21 per share is comprised of distributions from net investment income of $.134 and distributions from net realized gain of $.071 per share.
See accompanying notes which are an integral part of the financial statements.
Semiannual Report
Financial Highlights - Class T
| Six months ended
September 30, 2013 | Years ended March 31, |
| (Unaudited) | 2013 | 2012 | 2011 | 2010 | 2009 |
Selected Per-Share Data | | | | | | |
Net asset value, beginning of period | $ 11.90 | $ 11.45 | $ 11.45 | $ 10.57 | $ 8.10 | $ 11.39 |
Income from Investment Operations | | | | | | |
Net investment income (loss) E | .02 | .11 | .13 | .12 | .17 | .25 |
Net realized and unrealized gain (loss) | .17 | .52 | .12 | .97 | 2.54 | (3.06) |
Total from investment operations | .19 | .63 | .25 | 1.09 | 2.71 | (2.81) |
Distributions from net investment income | (.01) | (.11) | (.12) | (.12) | (.17) | (.25) |
Distributions from net realized gain | (.07) | (.07) | (.13) | (.09) | (.07) | (.23) |
Total distributions | (.08) | (.18) | (.25) | (.21) | (.24) | (.48) |
Net asset value, end of period | $ 12.01 | $ 11.90 | $ 11.45 | $ 11.45 | $ 10.57 | $ 8.10 |
Total Return B, C, D | 1.63% | 5.56% | 2.25% | 10.42% | 33.61% | (25.27)% |
Ratios to Average Net Assets F, G | | | | | | |
Expenses before reductions | .50% A | .50% | .50% | .50% | .50% | .50% |
Expenses net of fee waivers, if any | .50% A | .50% | .50% | .50% | .50% | .50% |
Expenses net of all reductions | .50% A | .50% | .50% | .50% | .50% | .50% |
Net investment income (loss) | .41% A | .91% | 1.12% | 1.12% | 1.76% | 2.50% |
Supplemental Data | | | | | | |
Net assets, end of period (000 omitted) | $ 27,843 | $ 26,201 | $ 22,316 | $ 21,658 | $ 23,113 | $ 14,437 |
Portfolio turnover rate F | 23% A | 23% | 28% | 41% | 35% | 54% |
A Annualized
B Total returns for periods of less than one year are not annualized.
C Total returns would have been lower if certain expenses had not been reduced during the applicable periods shown.
D Total returns do not include the effect of the sales charges.
E Calculated based on average shares outstanding during the period.
F Amounts do not include the activity of the Underlying Funds.
G Expense ratios reflect operating expenses of the class. Expenses before reductions do not reflect amounts reimbursed by the investment adviser or reductions from expense offset arrangements and do not represent the amount paid by the class during periods when reimbursements or reductions occur. Expenses net of fee waivers reflect expenses after reimbursement by the investment adviser but prior to reductions from expense offset arrangements. Expenses net of all reductions represent the net expenses paid by the class but do not include expenses of the investment companies in which the Fund invests.
Financial Highlights - Class B
| Six months ended
September 30, 2013 | Years ended March 31, |
| (Unaudited) | 2013 | 2012 | 2011 | 2010 | 2009 |
Selected Per-Share Data | | | | | | |
Net asset value, beginning of period | $ 11.93 | $ 11.47 | $ 11.45 | $ 10.56 | $ 8.09 | $ 11.37 |
Income from Investment Operations | | | | | | |
Net investment income (loss) E | (.01) | .05 | .07 | .07 | .12 | .20 |
Net realized and unrealized gain (loss) | .17 | .52 | .12 | .97 | 2.53 | (3.06) |
Total from investment operations | .16 | .57 | .19 | 1.04 | 2.65 | (2.86) |
Distributions from net investment income | - | (.04) | (.05) | (.07) | (.11) | (.19) |
Distributions from net realized gain | (.07) | (.07) | (.12) | (.09) | (.07) | (.23) |
Total distributions | (.07) | (.11) | (.17) | (.15) H | (.18) | (.42) |
Net asset value, end of period | $ 12.02 | $ 11.93 | $ 11.47 | $ 11.45 | $ 10.56 | $ 8.09 |
Total Return B, C, D | 1.35% | 5.00% | 1.73% | 9.94% | 32.90% | (25.69)% |
Ratios to Average Net Assets F, G | | | | | | |
Expenses before reductions | 1.00% A | 1.00% | 1.00% | 1.00% | 1.00% | 1.00% |
Expenses net of fee waivers, if any | 1.00% A | 1.00% | 1.00% | 1.00% | 1.00% | 1.00% |
Expenses net of all reductions | 1.00% A | 1.00% | 1.00% | 1.00% | 1.00% | 1.00% |
Net investment income (loss) | (.09)% A | .41% | .62% | .62% | 1.26% | 2.00% |
Supplemental Data | | | | | | |
Net assets, end of period (000 omitted) | $ 1,125 | $ 1,162 | $ 1,571 | $ 2,338 | $ 2,986 | $ 2,692 |
Portfolio turnover rate F | 23% A | 23% | 28% | 41% | 35% | 54% |
A Annualized
B Total returns for periods of less than one year are not annualized.
C Total returns would have been lower if certain expenses had not been reduced during the applicable periods shown.
D Total returns do not include the effect of the contingent deferred sales charge.
E Calculated based on average shares outstanding during the period.
F Amounts do not include the activity of the Underlying Funds.
G Expense ratios reflect operating expenses of the class. Expenses before reductions do not reflect amounts reimbursed by the investment adviser or reductions from expense offset arrangements and do not represent the amount paid by the class during periods when reimbursements or reductions occur. Expenses net of fee waivers reflect expenses after reimbursement by the investment adviser but prior to reductions from expense offset arrangements. Expenses net of all reductions represent the net expenses paid by the class but do not include expenses of the investment companies in which the Fund invests.
H Total distributions of $.15 per share is comprised of distributions from net investment income of $.065 and distributions from net realized gain of $.087 per share.
See accompanying notes which are an integral part of the financial statements.
Semiannual Report
Financial Highlights - Class C
| Six months ended
September 30, 2013 | Years ended March 31, |
| (Unaudited) | 2013 | 2012 | 2011 | 2010 | 2009 |
Selected Per-Share Data | | | | | | |
Net asset value, beginning of period | $ 11.87 | $ 11.42 | $ 11.42 | $ 10.54 | $ 8.08 | $ 11.34 |
Income from Investment Operations | | | | | | |
Net investment income (loss) E | (.01) | .05 | .07 | .07 | .12 | .20 |
Net realized and unrealized gain (loss) | .18 | .52 | .11 | .97 | 2.53 | (3.04) |
Total from investment operations | .17 | .57 | .18 | 1.04 | 2.65 | (2.84) |
Distributions from net investment income | - | (.05) | (.07) | (.07) | (.12) | (.19) |
Distributions from net realized gain | (.07) | (.07) | (.12) | (.09) | (.07) | (.23) |
Total distributions | (.07) | (.12) | (.18) H | (.16) | (.19) | (.42) |
Net asset value, end of period | $ 11.97 | $ 11.87 | $ 11.42 | $ 11.42 | $ 10.54 | $ 8.08 |
Total Return B, C, D | 1.44% | 5.01% | 1.66% | 9.91% | 32.90% | (25.61)% |
Ratios to Average Net Assets F, G | | | | | | |
Expenses before reductions | 1.00% A | 1.00% | 1.00% | 1.00% | 1.00% | 1.00% |
Expenses net of fee waivers, if any | 1.00% A | 1.00% | 1.00% | 1.00% | 1.00% | 1.00% |
Expenses net of all reductions | 1.00% A | 1.00% | 1.00% | 1.00% | 1.00% | 1.00% |
Net investment income (loss) | (.09)% A | .41% | .62% | .62% | 1.26% | 2.00% |
Supplemental Data | | | | | | |
Net assets, end of period (000 omitted) | $ 8,991 | $ 8,118 | $ 8,053 | $ 8,679 | $ 9,377 | $ 6,761 |
Portfolio turnover rate F | 23% A | 23% | 28% | 41% | 35% | 54% |
A Annualized
B Total returns for periods of less than one year are not annualized.
C Total returns would have been lower if certain expenses had not been reduced during the applicable periods shown.
D Total returns do not include the effect of the contingent deferred sales charge.
E Calculated based on average shares outstanding during the period.
F Amounts do not include the activity of the Underlying Funds.
G Expense ratios reflect operating expenses of the class. Expenses before reductions do not reflect amounts reimbursed by the investment adviser or reductions from expense offset arrangements and do not represent the amount paid by the class during periods when reimbursements or reductions occur. Expenses net of fee waivers reflect expenses after reimbursement by the investment adviser but prior to reductions from expense offset arrangements. Expenses net of all reductions represent the net expenses paid by the class but do not include expenses of the investment companies in which the Fund invests.
H Total distributions of $.18 per share is comprised of distributions from net investment income of $.065 and distributions from net realized gain of $.115 per share.
Financial Highlights - Institutional Class
| Six months ended
September 30, 2013 | Years ended March 31, |
| (Unaudited) | 2013 | 2012 | 2011 | 2010 | 2009 |
Selected Per-Share Data | | | | | | |
Net asset value, beginning of period | $ 11.97 | $ 11.51 | $ 11.52 | $ 10.63 | $ 8.14 | $ 11.46 |
Income from Investment Operations | | | | | | |
Net investment income (loss) D | .05 | .16 | .18 | .18 | .22 | .29 |
Net realized and unrealized gain (loss) | .18 | .53 | .11 | .98 | 2.55 | (3.07) |
Total from investment operations | .23 | .69 | .29 | 1.16 | 2.77 | (2.78) |
Distributions from net investment income | (.02) | (.16) | (.18) | (.18) | (.21) | (.31) |
Distributions from net realized gain | (.07) | (.07) | (.13) | (.09) | (.07) | (.23) |
Total distributions | (.10) I | (.23) | (.30) H | (.27) | (.28) | (.54) |
Net asset value, end of period | $ 12.10 | $ 11.97 | $ 11.51 | $ 11.52 | $ 10.63 | $ 8.14 |
Total Return B, C | 1.90% | 6.11% | 2.67% | 11.02% | 34.28% | (24.93)% |
Ratios to Average Net Assets E, G | | | | | | |
Expenses before reductions F | .00% A | .00% | .00% | .00% | .00% | .00% |
Expenses net of fee waivers, if any | .00% A | .00% | .00% | .00% | .00% | .00% |
Expenses net of all reductions | .00% A | .00% | .00% | .00% | .00% | .00% |
Net investment income (loss) | .91% A | 1.41% | 1.62% | 1.62% | 2.26% | 3.00% |
Supplemental Data | | | | | | |
Net assets, end of period (000 omitted) | $ 70,193 | $ 70,364 | $ 46,935 | $ 35,069 | $ 18,775 | $ 9,313 |
Portfolio turnover rate E | 23% A | 23% | 28% | 41% | 35% | 54% |
A Annualized
B Total returns for periods of less than one year are not annualized.
C Total returns would have been lower if certain expenses had not been reduced during the applicable periods shown.
D Calculated based on average shares outstanding during the period.
E Amounts do not include the activity of the Underlying Funds.
F Amount represents less than .01%.
G Expense ratios reflect operating expenses of the class. Expenses before reductions do not reflect amounts reimbursed by the investment adviser or reductions from expense offset arrangements and do not represent the amount paid by the class during periods when reimbursements or reductions occur. Expenses net of fee waivers reflect expenses after reimbursement by the investment adviser but prior to reductions from expense offset arrangements. Expenses net of all reductions represent the net expenses paid by the class but do not include expenses of the investment companies in which the Fund invests.
H Total distributions of $.30 per share is comprised of distributions from net investment income of $.175 and distributions from net realized gain of $.128 per share.
I Total distributions of $.10 per share is comprised of distributions from net investment income of $.024 and distributions from net realized gain of $.073 per share.
See accompanying notes which are an integral part of the financial statements.
Semiannual Report
Fidelity Advisor Freedom 2010 Fund
Investment Changes (Unaudited)
The information in the following tables is based on the direct investments of the Fund. |
Fund Holdings as of September 30, 2013 |
| % of fund's
net assets | % of fund's net assets
6 months ago |
Commodity Funds | | |
Fidelity Series Commodity Strategy Fund | 5.0 | 5.1 |
Domestic Equity Funds | | |
Fidelity Advisor Equity Growth Fund Institutional Class | 4.3 | 4.1 |
Fidelity Advisor Growth & Income Fund Institutional Class | 0.0 | 2.2 |
Fidelity Advisor Large Cap Fund Institutional Class | 2.1 | 2.2 |
Fidelity Advisor Series Equity-Income Fund | 2.9 | 3.0 |
Fidelity Advisor Series Growth & Income Fund (formerly Fidelity Advisor Series Mega Cap Fund) | 2.8 | 0.7 |
Fidelity Advisor Series Opportunistic Insights Fund | 2.3 | 2.1 |
Fidelity Advisor Series Stock Selector Large Cap Value Fund | 2.9 | 3.1 |
Fidelity Advisor Small Cap Fund Institutional Class | 1.7 | 1.7 |
Fidelity Series 100 Index Fund | 0.7 | 0.7 |
Fidelity Series All-Sector Equity Fund | 5.3 | 5.4 |
Fidelity Series Large Cap Value Fund | 2.9 | 3.1 |
Fidelity Series Real Estate Equity Fund | 0.4 | 0.5 |
Fidelity Series Small Cap Opportunities Fund | 1.9 | 1.9 |
| 30.2 | 30.7 |
Developed International Equity Funds | | |
Fidelity Series International Growth Fund | 4.7 | 4.6 |
Fidelity Series International Small Cap Fund | 1.0 | 0.9 |
Fidelity Series International Value Fund | 4.7 | 4.6 |
| 10.4 | 10.1 |
Emerging Markets Equity Funds | | |
Fidelity Series Emerging Markets Fund | 2.8 | 2.8 |
High Yield Bond Funds | | |
Fidelity Series Emerging Markets Debt Fund | 0.6 | 0.6 |
Fidelity Series Floating Rate High Income Fund | 1.1 | 1.2 |
Fidelity Series High Income Fund | 4.7 | 4.8 |
Fidelity Series Real Estate Income Fund | 0.5 | 0.5 |
| 6.9 | 7.1 |
Inflation-Protected Bond Funds | | |
Fidelity Series Inflation-Protected Bond Index Fund | 9.7 | 10.0 |
Investment Grade Bond Funds | | |
Fidelity Series Investment Grade Bond Fund | 21.5 | 21.6 |
Short-Term Funds | | |
Fidelity Advisor Short Fixed-Income Fund Institutional Class | 6.1 | 5.7 |
Fidelity Institutional Money Market Portfolio Institutional Class | 7.4 | 6.9 |
| 13.5 | 12.6 |
Net Other Assets (Liabilities)* | 0.0 | 0.0 |
| 100.0 | 100.0 |
* Amount represents less than 0.1% |
Asset Allocation (% of fund's net assets) |
Period end |
| Commodity Funds | 5.0% | |
| Domestic Equity Funds | 30.2% | |
| Developed International Equity Funds | 10.4% | |
| Emerging Markets Equity Funds | 2.8% | |
| High Yield Bond Funds | 6.9% | |
| Inflation-Protected Bond Funds | 9.7% | |
| Investment Grade Bond Funds | 21.5% | |
| Short-Term Funds | 13.5% | |

Six months ago |
| Commodity Funds | 5.1% | |
| Domestic Equity Funds | 30.7% | |
| Developed International Equity Funds | 10.1% | |
| Emerging Markets Equity Funds | 2.8% | |
| High Yield Bond Funds | 7.1% | |
| Inflation-Protected Bond Funds | 10.0% | |
| Investment Grade Bond Funds | 21.6% | |
| Short-Term Funds | 12.6% | |

Semiannual Report
Fidelity Advisor Freedom 2010 Fund
Investments September 30, 2013 (Unaudited)
Showing Percentage of Net Assets
Domestic Equity Funds - 35.2% |
| Shares | | Value |
Commodity Funds - 5.0% |
Fidelity Series Commodity Strategy Fund (a)(c) | 5,573,516 | | $ 44,643,862 |
Domestic Equity Funds - 30.2% |
Fidelity Advisor Equity Growth Fund Institutional Class (c) | 467,652 | | 38,478,426 |
Fidelity Advisor Large Cap Fund Institutional Class (c) | 712,340 | | 19,161,946 |
Fidelity Advisor Series Equity-Income Fund (c) | 2,181,560 | | 25,720,596 |
Fidelity Advisor Series Growth & Income Fund (c) | 2,096,321 | | 25,260,674 |
Fidelity Advisor Series Opportunistic Insights Fund (c) | 1,563,236 | | 20,134,485 |
Fidelity Advisor Series Stock Selector Large Cap Value Fund (c) | 2,123,696 | | 25,845,376 |
Fidelity Advisor Small Cap Fund Institutional Class (c) | 494,360 | | 15,068,102 |
Fidelity Series 100 Index Fund (c) | 540,380 | | 5,987,406 |
Fidelity Series All-Sector Equity Fund (c) | 3,371,778 | | 47,744,376 |
Fidelity Series Large Cap Value Fund (c) | 2,024,458 | | 25,568,909 |
Fidelity Series Real Estate Equity Fund (c) | 314,406 | | 3,760,301 |
Fidelity Series Small Cap Opportunities Fund (c) | 1,350,232 | | 17,323,470 |
TOTAL DOMESTIC EQUITY FUNDS | | 270,054,067 |
TOTAL DOMESTIC EQUITY FUNDS (Cost $267,917,591) |
314,697,929
|
International Equity Funds - 13.2% |
| | | |
Developed International Equity Funds - 10.4% |
Fidelity Series International Growth Fund (c) | 3,086,446 | | 41,883,079 |
Fidelity Series International Small Cap Fund (c) | 576,685 | | 8,817,512 |
Fidelity Series International Value Fund (c) | 3,937,144 | | 42,324,302 |
TOTAL DEVELOPED INTERNATIONAL EQUITY FUNDS | | 93,024,893 |
Emerging Markets Equity Funds - 2.8% |
Fidelity Series Emerging Markets Fund (c) | 1,495,732 | | 25,038,554 |
TOTAL INTERNATIONAL EQUITY FUNDS (Cost $99,067,426) |
118,063,447
|
Bond Funds - 38.1% |
| Shares | | Value |
High Yield Bond Funds - 6.9% |
Fidelity Series Emerging Markets Debt Fund (c) | 521,385 | | $ 5,276,420 |
Fidelity Series Floating Rate High Income Fund (c) | 942,244 | | 9,968,944 |
Fidelity Series High Income Fund (c) | 4,112,906 | | 42,280,673 |
Fidelity Series Real Estate Income Fund (c) | 391,529 | | 4,298,991 |
TOTAL HIGH YIELD BOND FUNDS | | 61,825,028 |
Inflation-Protected Bond Funds - 9.7% |
Fidelity Series Inflation-Protected Bond Index Fund (c) | 8,018,127 | | 86,996,683 |
Investment Grade Bond Funds - 21.5% |
Fidelity Series Investment Grade Bond Fund (c) | 17,174,120 | | 192,178,400 |
TOTAL BOND FUNDS (Cost $338,086,784) |
341,000,111
|
Short-Term Funds - 13.5% |
| | | |
Fidelity Advisor Short Fixed-Income Fund Institutional Class (c) | 5,835,602 | | 54,446,165 |
Fidelity Institutional Money Market Portfolio Institutional Class 0.04% (b)(c) | 66,572,965 | | 66,572,965 |
TOTAL SHORT-TERM FUNDS (Cost $121,044,287) |
121,019,130
|
TOTAL INVESTMENT PORTFOLIO - 100.0% (Cost $826,116,088) | | 894,780,617 |
NET OTHER ASSETS (LIABILITIES) - 0.0% | | (201,209) |
NET ASSETS - 100% | $ 894,579,408 |
Legend |
(a) Non-income producing |
(b) The rate quoted is the annualized seven-day yield of the fund at period end. |
(c) Affiliated company |
Affiliated Underlying Funds |
Information regarding the Fund's fiscal year to date purchases and sales of the affiliated Underlying Funds and income earned by the Fund from investments in affiliated Underlying Funds is as follows: |
Affiliate | Value,
beginning of
period | Purchases | Sales
Proceeds | Dividend
Income | Value,
end of
period |
Fidelity Advisor Equity Growth Fund Institutional Class | $ 37,256,333 | $ 1,069,645 | $ 5,498,333 | $ - | $ 38,478,426 |
Fidelity Advisor Growth & Income Fund Institutional Class | 19,844,540 | 464,881 | 22,020,009 | - | - |
Fidelity Advisor Large Cap Fund Institutional Class | 20,021,126 | 496,004 | 3,862,188 | - | 19,161,946 |
Fidelity Advisor Series Equity-Income Fund | 27,797,031 | 1,158,986 | 4,872,682 | 272,677 | 25,720,596 |
Fidelity Advisor Series Growth & Income Fund (formerly Fidelity Advisor Series Mega Cap Fund) | 6,212,935 | 19,655,337 | 1,428,702 | - | 25,260,674 |
Fidelity Advisor Series Opportunistic Insights Fund | 19,617,134 | 534,880 | 3,126,848 | - | 20,134,485 |
Fidelity Advisor Series Stock Selector Large Cap Value Fund | 27,908,639 | 740,995 | 5,163,865 | - | 25,845,376 |
Fidelity Advisor Short Fixed-Income Fund Institutional Class | 51,871,108 | 6,686,125 | 3,937,886 | 208,614 | 54,446,165 |
Fidelity Advisor Small Cap Fund Institutional Class | 15,266,503 | 409,392 | 2,477,477 | - | 15,068,102 |
Fidelity Institutional Money Market Portfolio Institutional Class | 63,172,497 | 8,160,937 | 4,760,470 | 37,651 | 66,572,965 |
Fidelity Series 100 Index Fund | 6,173,658 | 174,442 | 806,427 | - | 5,987,406 |
Fidelity Series All-Sector Equity Fund | 49,620,547 | 1,272,691 | 7,968,517 | - | 47,744,376 |
Fidelity Series Commodity Strategy Fund | 46,125,134 | 6,013,867 | 3,812,615 | - | 44,643,862 |
Fidelity Series Emerging Markets Debt Fund | 5,750,850 | 301,058 | 372,292 | 145,619 | 5,276,420 |
Fidelity Series Emerging Markets Fund | 25,236,844 | 1,735,499 | 1,988,878 | - | 25,038,554 |
Fidelity Series Floating Rate High Income Fund | 10,542,272 | 417,793 | 942,443 | 224,530 | 9,968,944 |
Fidelity Series High Income Fund | 43,273,952 | 3,224,784 | 3,269,482 | 1,125,923 | 42,280,673 |
Fidelity Series Inflation-Protected Bond Index Fund | 91,127,240 | 6,732,113 | 6,507,221 | - | 86,996,683 |
Fidelity Series International Growth Fund | 42,059,080 | 1,324,381 | 4,398,646 | - | 41,883,079 |
Fidelity Series International Small Cap Fund | 8,602,872 | 256,515 | 975,192 | - | 8,817,512 |
Fidelity Series International Value Fund | 41,792,652 | 1,281,742 | 4,541,962 | - | 42,324,302 |
Fidelity Series Investment Grade Bond Fund | 196,591,693 | 15,243,128 | 13,747,156 | 2,030,291 | 192,178,400 |
Fidelity Series Large Cap Value Fund | 28,205,834 | 684,123 | 5,633,383 | - | 25,568,909 |
Fidelity Series Real Estate Equity Fund | 4,145,322 | 350,051 | 405,881 | 26,290 | 3,760,301 |
Fidelity Series Real Estate Income Fund | 4,736,681 | 283,811 | 455,636 | 131,328 | 4,298,991 |
Fidelity Series Small Cap Opportunities Fund | 17,772,438 | 1,743,295 | 2,984,158 | - | 17,323,470 |
Total | $ 910,724,915 | $ 80,416,475 | $ 115,958,349 | $ 4,202,923 | $ 894,780,617 |
Other Information |
All investments are categorized as Level 1 under the Fair Value Hierarchy. The inputs or methodology used for valuing securities may not be an indication of the risk associated with investing in those securities. For more information on valuation inputs, please refer to the Investment Valuation section in the accompanying Notes to Financial Statements. |
See accompanying notes which are an integral part of the financial statements.
Semiannual Report
Fidelity Advisor Freedom 2010 Fund
Statement of Assets and Liabilities
| September 30, 2013 (Unaudited) |
| | |
Assets | | |
Investment in securities, at value (cost $826,116,088) - See accompanying schedule | | $ 894,780,617 |
Receivable for investments sold | | 2,190,777 |
Receivable for fund shares sold | | 632,372 |
Total assets | | 897,603,766 |
| | |
Liabilities | | |
Payable for investments purchased | $ 5,701 | |
Payable for fund shares redeemed | 2,821,639 | |
Distribution and service plan fees payable | 197,018 | |
Total liabilities | | 3,024,358 |
| | |
Net Assets | | $ 894,579,408 |
Net Assets consist of: | | |
Paid in capital | | $ 813,147,659 |
Undistributed net investment income | | 2,992,871 |
Accumulated undistributed net realized gain (loss) on investments | | 9,774,349 |
Net unrealized appreciation (depreciation) on investments | | 68,664,529 |
Net Assets | | $ 894,579,408 |
| | |
Calculation of Maximum Offering Price Class A:
Net Asset Value and redemption price per share ($517,975,989 ÷ 40,809,065 shares) | | $ 12.69 |
| | |
Maximum offering price per share (100/94.25 of $12.69) | | $ 13.46 |
Class T:
Net Asset Value and redemption price per share ($128,567,651 ÷ 10,165,355 shares) | | $ 12.65 |
| | |
Maximum offering price per share (100/96.50 of $12.65) | | $ 13.11 |
Class B:
Net Asset Value and offering price per share ($4,938,035 ÷ 390,119 shares)A | | $ 12.66 |
| | |
Class C:
Net Asset Value and offering price per share ($37,261,684 ÷ 2,966,690 shares)A | | $ 12.56 |
| | |
Institutional Class:
Net Asset Value, offering price and redemption price per share ($205,836,049 ÷ 16,139,593 shares) | | $ 12.75 |
A Redemption price per share is equal to net asset value less any applicable contingent deferred sales charge.
Statement of Operations
Six months ended September 30, 2013 (Unaudited) |
| | |
Investment Income | | |
Income distributions from underlying funds | | $ 4,202,923 |
| | |
Expenses | | |
Distribution and service plan fees | $ 1,206,775 | |
Independent trustees' compensation | 1,698 | |
Total expenses before reductions | 1,208,473 | |
Expense reductions | (1,698) | 1,206,775 |
Net investment income (loss) | | 2,996,148 |
Realized and Unrealized Gain (Loss) Realized gain (loss) on sale of underlying fund shares | 10,242,811 | |
Capital gain distributions from underlying funds | 1,516,761 | |
Total net realized gain (loss) | | 11,759,572 |
Change in net unrealized appreciation (depreciation) on underlying funds | | 9,354,765 |
Net gain (loss) | | 21,114,337 |
Net increase (decrease) in net assets resulting from operations | | $ 24,110,485 |
See accompanying notes which are an integral part of the financial statements.
Semiannual Report
Statement of Changes in Net Assets
| Six months ended
September 30, 2013 (Unaudited) | Year ended
March 31,
2013 |
Increase (Decrease) in Net Assets | | |
Operations | | |
Net investment income (loss) | $ 2,996,148 | $ 11,478,269 |
Net realized gain (loss) | 11,759,572 | 54,501,265 |
Change in net unrealized appreciation (depreciation) | 9,354,765 | (4,153,489) |
Net increase (decrease) in net assets resulting from operations | 24,110,485 | 61,826,045 |
Distributions to shareholders from net investment income | (1,301,958) | (11,763,830) |
Distributions to shareholders from net realized gain | (9,014,737) | (6,303,241) |
Total distributions | (10,316,695) | (18,067,071) |
Share transactions - net increase (decrease) | (29,734,922) | (22,088,856) |
Total increase (decrease) in net assets | (15,941,132) | 21,670,118 |
| | |
Net Assets | | |
Beginning of period | 910,520,540 | 888,850,422 |
End of period (including undistributed net investment income of $2,992,871 and undistributed net investment income of $1,298,681, respectively) | $ 894,579,408 | $ 910,520,540 |
Financial Highlights - Class A
| Six months ended
September 30, 2013 | Years ended March 31, |
| (Unaudited) | 2013 | 2012 | 2011 | 2010 | 2009 |
Selected Per-Share Data | | | | | | |
Net asset value, beginning of period | $ 12.50 | $ 11.89 | $ 11.92 | $ 10.87 | $ 8.19 | $ 11.78 |
Income from Investment Operations | | | | | | |
Net investment income (loss) E | .04 | .16 | .17 | .15 | .21 | .27 |
Net realized and unrealized gain (loss) | .29 | .70 | .12 | 1.17 | 2.76 | (3.28) |
Total from investment operations | .33 | .86 | .29 | 1.32 | 2.97 | (3.01) |
Distributions from net investment income | (.02) | (.16) | (.17) | (.17) | (.21) | (.28) |
Distributions from net realized gain | (.12) | (.09) | (.16) | (.10) | (.08) | (.30) |
Total distributions | (.14) | (.25) | (.32) I | (.27) | (.29) H | (.58) |
Net asset value, end of period | $ 12.69 | $ 12.50 | $ 11.89 | $ 11.92 | $ 10.87 | $ 8.19 |
Total Return B, C, D | 2.67% | 7.33% | 2.63% | 12.27% | 36.51% | (26.36)% |
Ratios to Average Net Assets F, G | | | | | | |
Expenses before reductions | .25% A | .25% | .25% | .25% | .25% | .25% |
Expenses net of fee waivers, if any | .25% A | .25% | .25% | .25% | .25% | .25% |
Expenses net of all reductions | .25% A | .25% | .25% | .25% | .25% | .25% |
Net investment income (loss) | .68% A | 1.33% | 1.48% | 1.38% | 2.04% | 2.77% |
Supplemental Data | | | | | | |
Net assets, end of period (000 omitted) | $ 517,976 | $ 540,980 | $ 552,770 | $ 536,999 | $ 478,025 | $ 339,203 |
Portfolio turnover rate F | 18% A | 26% | 25% | 41% | 42% | 44% |
A Annualized
B Total returns for periods of less than one year are not annualized.
C Total returns would have been lower if certain expenses had not been reduced during the applicable periods shown.
D Total returns do not include the effect of the sales charges.
E Calculated based on average shares outstanding during the period.
F Amounts do not include the activity of the Underlying Funds.
G Expense ratios reflect operating expenses of the class. Expenses before reductions do not reflect amounts reimbursed by the investment adviser or reductions from expense offset arrangements and do not represent the amount paid by the class during periods when reimbursements or reductions occur. Expenses net of fee waivers reflect expenses after reimbursement by the investment adviser but prior to reductions from expense offset arrangements. Expenses net of all reductions represent the net expenses paid by the class but do not include expenses of the investment companies in which the Fund invests.
H Total distributions of $.29 per share is comprised of distributions from net investment income of $.211 and distributions from net realized gain of $.083 per share.
I Total distributions of $.32 per share is comprised of distributions from net investment income of $.169 and distributions from net realized gain of $.155 per share.
See accompanying notes which are an integral part of the financial statements.
Semiannual Report
Financial Highlights - Class T
| Six months ended
September 30, 2013 | Years ended March 31, |
| (Unaudited) | 2013 | 2012 | 2011 | 2010 | 2009 |
Selected Per-Share Data | | | | | | |
Net asset value, beginning of period | $ 12.46 | $ 11.86 | $ 11.88 | $ 10.83 | $ 8.16 | $ 11.74 |
Income from Investment Operations | | | | | | |
Net investment income (loss) E | .03 | .13 | .14 | .13 | .18 | .25 |
Net realized and unrealized gain (loss) | .30 | .69 | .13 | 1.15 | 2.76 | (3.28) |
Total from investment operations | .33 | .82 | .27 | 1.28 | 2.94 | (3.03) |
Distributions from net investment income | (.01) | (.13) | (.14) | (.13) | (.19) | (.25) |
Distributions from net realized gain | (.12) | (.09) | (.16) | (.10) | (.08) | (.30) |
Total distributions | (.14) J | (.22) | (.29) I | (.23) | (.27) H | (.55) |
Net asset value, end of period | $ 12.65 | $ 12.46 | $ 11.86 | $ 11.88 | $ 10.83 | $ 8.16 |
Total Return B, C, D | 2.62% | 6.98% | 2.43% | 11.95% | 36.19% | (26.57)% |
Ratios to Average Net Assets F, G | | | | | | |
Expenses before reductions | .50% A | .50% | .50% | .50% | .50% | .50% |
Expenses net of fee waivers, if any | .50% A | .50% | .50% | .50% | .50% | .50% |
Expenses net of all reductions | .50% A | .50% | .50% | .50% | .50% | .50% |
Net investment income (loss) | .43% A | 1.08% | 1.23% | 1.13% | 1.79% | 2.52% |
Supplemental Data | | | | | | |
Net assets, end of period (000 omitted) | $ 128,568 | $ 127,353 | $ 132,044 | $ 152,126 | $ 204,059 | $ 163,842 |
Portfolio turnover rate F | 18% A | 26% | 25% | 41% | 42% | 44% |
A Annualized
B Total returns for periods of less than one year are not annualized.
C Total returns would have been lower if certain expenses had not been reduced during the applicable periods shown.
D Total returns do not include the effect of the sales charges.
E Calculated based on average shares outstanding during the period.
F Amounts do not include the activity of the Underlying Funds.
G Expense ratios reflect operating expenses of the class. Expenses before reductions do not reflect amounts reimbursed by the investment adviser or reductions from expense offset arrangements and do not represent the amount paid by the class during periods when reimbursements or reductions occur. Expenses net of fee waivers reflect expenses after reimbursement by the investment adviser but prior to reductions from expense offset arrangements. Expenses net of all reductions represent the net expenses paid by the class but do not include expenses of the investment companies in which the Fund invests.
H Total distributions of $.27 per share is comprised of distributions from net investment income of $.186 and distributions from net realized gain of $.083 per share.
I Total distributions of $.29 per share is comprised of distributions from net investment income of $.137 and distributions from net realized gain of $.155 per share.
J Total distributions of $.14 per share is comprised of distributions from net investment income of $.011 and distributions from net realized gain of $.124 per share.
Financial Highlights - Class B
| Six months ended
September 30, 2013 | Years ended March 31, |
| (Unaudited) | 2013 | 2012 | 2011 | 2010 | 2009 |
Selected Per-Share Data | | | | | | |
Net asset value, beginning of period | $ 12.49 | $ 11.87 | $ 11.87 | $ 10.82 | $ 8.15 | $ 11.70 |
Income from Investment Operations | | | | | | |
Net investment income (loss) E | - H | .07 | .08 | .07 | .13 | .20 |
Net realized and unrealized gain (loss) | .29 | .70 | .13 | 1.15 | 2.76 | (3.26) |
Total from investment operations | .29 | .77 | .21 | 1.22 | 2.89 | (3.06) |
Distributions from net investment income | - | (.06) | (.07) | (.07) | (.13) | (.19) |
Distributions from net realized gain | (.12) | (.09) | (.15) | (.10) | (.08) | (.30) |
Total distributions | (.12) | (.15) | (.21) J | (.17) | (.22) I | (.49) |
Net asset value, end of period | $ 12.66 | $ 12.49 | $ 11.87 | $ 11.87 | $ 10.82 | $ 8.15 |
Total Return B, C, D | 2.33% | 6.51% | 1.90% | 11.37% | 35.54% | (26.92)% |
Ratios to Average Net Assets F, G | | | | | | |
Expenses before reductions | 1.00% A | 1.00% | 1.00% | 1.00% | 1.00% | 1.00% |
Expenses net of fee waivers, if any | 1.00% A | 1.00% | 1.00% | 1.00% | 1.00% | 1.00% |
Expenses net of all reductions | 1.00% A | 1.00% | 1.00% | 1.00% | 1.00% | 1.00% |
Net investment income (loss) | (.07)% A | .58% | .73% | .63% | 1.29% | 2.03% |
Supplemental Data | | | | | | |
Net assets, end of period (000 omitted) | $ 4,938 | $ 6,474 | $ 9,154 | $ 15,842 | $ 22,468 | $ 19,950 |
Portfolio turnover rate F | 18% A | 26% | 25% | 41% | 42% | 44% |
A Annualized
B Total returns for periods of less than one year are not annualized.
C Total returns would have been lower if certain expenses had not been reduced during the applicable periods shown.
D Total returns do not include the effect of the contingent deferred sales charge.
E Calculated based on average shares outstanding during the period.
F Amounts do not include the activity of the Underlying Funds.
G Expense ratios reflect operating expenses of the class. Expenses before reductions do not reflect amounts reimbursed by the investment adviser or reductions from expense offset arrangements and do not represent the amount paid by the class during periods when reimbursements or reductions occur. Expenses net of fee waivers reflect expenses after reimbursement by the investment adviser but prior to reductions from expense offset arrangements. Expenses net of all reductions represent the net expenses paid by the class but do not include expenses of the investment companies in which the Fund invests.
H Amount represents less than $.01 per share.
I Total distributions of $.22 per share is comprised of distributions from net investment income of $.134 and distributions from net realized gain of $.083 per share.
J Total distributions of $.21 per share is comprised of distributions from net investment income of $.065 and distributions from net realized gain of $.148 per share.
See accompanying notes which are an integral part of the financial statements.
Semiannual Report
Financial Highlights - Class C
| Six months ended
September 30, 2013 | Years ended March 31, |
| (Unaudited) | 2013 | 2012 | 2011 | 2010 | 2009 |
Selected Per-Share Data | | | | | | |
Net asset value, beginning of period | $ 12.39 | $ 11.79 | $ 11.81 | $ 10.78 | $ 8.13 | $ 11.67 |
Income from Investment Operations | | | | | | |
Net investment income (loss) | - H | .07 | .08 | .07 | .13 | .20 |
Net realized and unrealized gain (loss) | .29 | .69 | .13 | 1.14 | 2.74 | (3.25) |
Total from investment operations | .29 | .76 | .21 | 1.21 | 2.87 | (3.05) |
Distributions from net investment income | - | (.07) | (.08) | (.08) | (.14) | (.19) |
Distributions from net realized gain | (.12) | (.09) | (.15) | (.10) | (.08) | (.30) |
Total distributions | (.12) | (.16) | (.23) | (.18) | (.22) I | (.49) |
Net asset value, end of period | $ 12.56 | $ 12.39 | $ 11.79 | $ 11.81 | $ 10.78 | $ 8.13 |
Total Return B, C, D | 2.35% | 6.49% | 1.90% | 11.33% | 35.45% | (26.88)% |
Ratios to Average Net Assets F, G | | | | | | |
Expenses before reductions | 1.00% A | 1.00% | 1.00% | 1.00% | 1.00% | 1.00% |
Expenses net of fee waivers, if any | 1.00% A | 1.00% | 1.00% | 1.00% | 1.00% | 1.00% |
Expenses net of all reductions | 1.00% A | 1.00% | 1.00% | 1.00% | 1.00% | 1.00% |
Net investment income (loss) | (.07)% A | .58% | .73% | .63% | 1.29% | 2.02% |
Supplemental Data | | | | | | |
Net assets, end of period (000 omitted) | $ 37,262 | $ 38,562 | $ 38,423 | $ 44,764 | $ 47,178 | $ 37,524 |
Portfolio turnover rate F | 18% A | 26% | 25% | 41% | 42% | 44% |
A Annualized
B Total returns for periods of less than one year are not annualized.
C Total returns would have been lower if certain expenses had not been reduced during the applicable periods shown.
D Total returns do not include the effect of the contingent deferred sales charge.
E Calculated based on average shares outstanding during the period.
F Amounts do not include the activity of the Underlying Funds.
G Expense ratios reflect operating expenses of the class. Expenses before reductions do not reflect amounts reimbursed by the investment adviser or reductions from expense offset arrangements and do not represent the amount paid by the class during periods when reimbursements or reductions occur. Expenses net of fee waivers reflect expenses after reimbursement by the investment adviser but prior to reductions from expense offset arrangements. Expenses net of all reductions represent the net expenses paid by the class but do not include expenses of the investment companies in which the Fund invests.
H Amount represents less than $.01 per share.
I Total distributions of $.022 per share is comprised of distributions from net investment income of $.139 and distributions from net realized gain of $.083 per share.
Financial Highlights - Institutional Class
| Six months ended
September 30, 2013 | Years ended March 31, |
| (Unaudited) | 2013 | 2012 | 2011 | 2010 | 2009 |
Selected Per-Share Data | | | | | | |
Net asset value, beginning of period | $ 12.55 | $ 11.94 | $ 11.96 | $ 10.91 | $ 8.22 | $ 11.82 |
Income from Investment Operations | | | | | | |
Net investment income (loss) D | .06 | .19 | .20 | .18 | .23 | .30 |
Net realized and unrealized gain (loss) | .29 | .70 | .13 | 1.17 | 2.78 | (3.30) |
Total from investment operations | .35 | .89 | .33 | 1.35 | 3.01 | (3.00) |
Distributions from net investment income | (.03) | (.19) | (.20) | (.20) | (.23) | (.30) |
Distributions from net realized gain | (.12) | (.09) | (.16) | (.10) | (.08) | (.30) |
Total distributions | (.15) | (.28) | (.35) H | (.30) | (.32) G | (.60) |
Net asset value, end of period | $ 12.75 | $ 12.55 | $ 11.94 | $ 11.96 | $ 10.91 | $ 8.22 |
Total Return B, C | 2.80% | 7.56% | 2.97% | 12.50% | 36.80% | (26.16)% |
Ratios to Average Net Assets E, F | | | | | | |
Expenses before reductions I | .00% A | .00% | .00% | .00% | .00% | .00% |
Expenses net of fee waivers, if any | .00% A | .00% | .00% | .00% | .00% | .00% |
Expenses net of all reductions | .00% A | .00% | .00% | .00% | .00% | .00% |
Net investment income (loss) | .93% A | 1.58% | 1.73% | 1.63% | 2.29% | 3.02% |
Supplemental Data | | | | | | |
Net assets, end of period (000 omitted) | $ 205,836 | $ 197,152 | $ 156,459 | $ 115,490 | $ 75,569 | $ 41,737 |
Portfolio turnover rate E | 18% A | 26% | 25% | 41% | 42% | 44% |
A Annualized
B Total returns for periods of less than one year are not annualized.
C Total returns would have been lower if certain expenses had not been reduced during the applicable periods shown.
D Calculated based on average shares outstanding during the period.
E Amounts do not include the activity of the Underlying Funds.
F Expense ratios reflect operating expenses of the class. Expenses before reductions do not reflect amounts reimbursed by the investment adviser or reductions from expense offset arrangements and do not represent the amount paid by the class during periods when reimbursements or reductions occur. Expenses net of fee waivers reflect expenses after reimbursement by the investment adviser but prior to reductions from expense offset arrangements. Expenses net of all reductions represent the net expenses paid by the class but do not include expenses of the investment companies in which the Fund invests.
G Total distributions of $.32 per share is comprised of distributions from net investment income of $.234 and distributions from net realized gain of $.083 per share.
H Total distributions of $.35 per share is comprised of distributions from net investment income of $.199 and distributions from net realized gain of $.1555 per share.
I Amount represents less than .01%.
See accompanying notes which are an integral part of the financial statements.
Semiannual Report
Fidelity Advisor Freedom 2015 Fund
Investment Changes (Unaudited)
The information in the following tables is based on the direct investments of the Fund. |
Fund Holdings as of September 30, 2013 |
| % of fund's
net assets | % of fund's net assets
6 months ago |
Commodity Funds | | |
Fidelity Series Commodity Strategy Fund | 5.3 | 5.4 |
Domestic Equity Funds | | |
Fidelity Advisor Equity Growth Fund Institutional Class | 4.5 | 4.3 |
Fidelity Advisor Growth & Income Fund Institutional Class | 0.0 | 2.3 |
Fidelity Advisor Large Cap Fund Institutional Class | 2.3 | 2.3 |
Fidelity Advisor Series Equity-Income Fund | 3.0 | 3.1 |
Fidelity Advisor Series Growth & Income Fund (formerly Fidelity Advisor Series Mega Cap Fund) | 3.0 | 0.7 |
Fidelity Advisor Series Opportunistic Insights Fund | 2.3 | 2.2 |
Fidelity Advisor Series Stock Selector Large Cap Value Fund | 3.0 | 3.1 |
Fidelity Advisor Small Cap Fund Institutional Class | 1.8 | 1.8 |
Fidelity Series 100 Index Fund | 0.7 | 0.7 |
Fidelity Series All-Sector Equity Fund | 5.6 | 5.7 |
Fidelity Series Large Cap Value Fund | 3.0 | 3.2 |
Fidelity Series Real Estate Equity Fund | 0.4 | 0.5 |
Fidelity Series Small Cap Opportunities Fund | 2.0 | 2.1 |
| 31.6 | 32.0 |
Developed International Equity Funds | | |
Fidelity Series International Growth Fund | 5.0 | 4.8 |
Fidelity Series International Small Cap Fund | 1.0 | 1.0 |
Fidelity Series International Value Fund | 5.0 | 4.7 |
| 11.0 | 10.5 |
Emerging Markets Equity Funds | | |
Fidelity Series Emerging Markets Fund | 2.9 | 2.9 |
High Yield Bond Funds | | |
Fidelity Series Emerging Markets Debt Fund | 0.6 | 0.6 |
Fidelity Series Floating Rate High Income Fund | 1.1 | 1.1 |
Fidelity Series High Income Fund | 4.7 | 4.7 |
Fidelity Series Real Estate Income Fund | 0.5 | 0.6 |
| 6.9 | 7.0 |
Inflation-Protected Bond Funds | | |
Fidelity Series Inflation-Protected Bond Index Fund | 9.9 | 9.9 |
Investment Grade Bond Funds | | |
Fidelity Series Investment Grade Bond Fund | 22.6 | 22.6 |
Short-Term Funds | | |
Fidelity Advisor Short Fixed-Income Fund Institutional Class | 4.4 | 4.4 |
Fidelity Institutional Money Market Portfolio Institutional Class | 5.4 | 5.3 |
| 9.8 | 9.7 |
Net Other Assets (Liabilities)* | 0.0 | 0.0 |
| 100.0 | 100.0 |
* Amount represents less than 0.1% |
Asset Allocation (% of fund's net assets) |
Period end |
| Commodity Funds | 5.3% | |
| Domestic Equity Funds | 31.6% | |
| Developed International Equity Funds | 11.0% | |
| Emerging Markets Equity Funds | 2.9% | |
| High Yield Bond Funds | 6.9% | |
| Inflation-Protected Bond Funds | 9.9% | |
| Investment Grade Bond Funds | 22.6% | |
| Short-Term Funds | 9.8% | |

Six months ago |
| Commodity Funds | 5.4% | |
| Domestic Equity Funds | 32.0% | |
| Developed International Equity Funds | 10.5% | |
| Emerging Markets Equity Funds | 2.9% | |
| High Yield Bond Funds | 7.0% | |
| Inflation-Protected Bond Funds | 9.9% | |
| Investment Grade Bond Funds | 22.6% | |
| Short-Term Funds | 9.7% | |

Semiannual Report
Fidelity Advisor Freedom 2015 Fund
Investments September 30, 2013 (Unaudited)
Showing Percentage of Net Assets
Domestic Equity Funds - 36.9% |
| Shares | | Value |
Commodity Funds - 5.3% |
Fidelity Series Commodity Strategy Fund (a)(c) | 12,747,014 | | $ 102,103,585 |
Domestic Equity Funds - 31.6% |
Fidelity Advisor Equity Growth Fund Institutional Class (c) | 1,061,122 | | 87,309,146 |
Fidelity Advisor Large Cap Fund Institutional Class (c) | 1,614,946 | | 43,442,036 |
Fidelity Advisor Series Equity-Income Fund (c) | 4,983,781 | | 58,758,781 |
Fidelity Advisor Series Growth & Income Fund (c) | 4,772,861 | | 57,512,980 |
Fidelity Advisor Series Opportunistic Insights Fund (c) | 3,508,436 | | 45,188,652 |
Fidelity Advisor Series Stock Selector Large Cap Value Fund (c) | 4,827,653 | | 58,752,532 |
Fidelity Advisor Small Cap Fund Institutional Class (c) | 1,120,418 | | 34,150,343 |
Fidelity Series 100 Index Fund (c) | 1,225,583 | | 13,579,454 |
Fidelity Series All-Sector Equity Fund (c) | 7,663,308 | | 108,512,444 |
Fidelity Series Large Cap Value Fund (c) | 4,560,105 | | 57,594,122 |
Fidelity Series Real Estate Equity Fund (c) | 712,071 | | 8,516,371 |
Fidelity Series Small Cap Opportunities Fund (c) | 3,056,460 | | 39,214,387 |
TOTAL DOMESTIC EQUITY FUNDS | | 612,531,248 |
TOTAL DOMESTIC EQUITY FUNDS (Cost $599,965,447) |
714,634,833
|
International Equity Funds - 13.9% |
| | | |
Developed International Equity Funds - 11.0% |
Fidelity Series International Growth Fund (c) | 7,073,501 | | 95,987,410 |
Fidelity Series International Small Cap Fund (c) | 1,309,479 | | 20,021,937 |
Fidelity Series International Value Fund (c) | 8,992,363 | | 96,667,903 |
TOTAL DEVELOPED INTERNATIONAL EQUITY FUNDS | | 212,677,250 |
Emerging Markets Equity Funds - 2.9% |
Fidelity Series Emerging Markets Fund (c) | 3,373,557 | | 56,473,352 |
TOTAL INTERNATIONAL EQUITY FUNDS (Cost $219,714,963) |
269,150,602
|
Bond Funds - 39.4% |
| Shares | | Value |
High Yield Bond Funds - 6.9% |
Fidelity Series Emerging Markets Debt Fund (c) | 1,106,425 | | $ 11,197,020 |
Fidelity Series Floating Rate High Income Fund (c) | 2,058,602 | | 21,780,012 |
Fidelity Series High Income Fund (c) | 8,809,706 | | 90,563,780 |
Fidelity Series Real Estate Income Fund (c) | 941,163 | | 10,333,968 |
TOTAL HIGH YIELD BOND FUNDS | | 133,874,780 |
Inflation-Protected Bond Funds - 9.9% |
Fidelity Series Inflation-Protected Bond Index Fund (c) | 17,689,479 | | 191,930,851 |
Investment Grade Bond Funds - 22.6% |
Fidelity Series Investment Grade Bond Fund (c) | 39,221,116 | | 438,884,288 |
TOTAL BOND FUNDS (Cost $757,122,859) |
764,689,919
|
Short-Term Funds - 9.8% |
| | | |
Fidelity Advisor Short Fixed-Income Fund Institutional Class (c) | 9,191,423 | | 85,755,978 |
Fidelity Institutional Money Market Portfolio Institutional Class 0.04% (b)(c) | 103,870,506 | | 103,870,506 |
TOTAL SHORT-TERM FUNDS (Cost $188,385,967) |
189,626,484
|
TOTAL INVESTMENT PORTFOLIO - 100.0% (Cost $1,765,189,236) | | 1,938,101,838 |
NET OTHER ASSETS (LIABILITIES) - 0.0% | | (408,069) |
NET ASSETS - 100% | $ 1,937,693,769 |
Legend |
(a) Non-income producing |
(b) The rate quoted is the annualized seven-day yield of the fund at period end. |
(c) Affiliated company |
Affiliated Underlying Funds |
Information regarding the Fund's fiscal year to date purchases and sales of the affiliated Underlying Funds and income earned by the Fund from investments in affiliated Underlying Funds is as follows: |
Affiliate | Value,
beginning of
period | Purchases | Sales
Proceeds | Dividend
Income | Value,
end of
period |
Fidelity Advisor Equity Growth Fund Institutional Class | $ 84,657,466 | $ 1,358,728 | $ 11,467,812 | $ - | $ 87,309,146 |
Fidelity Advisor Growth & Income Fund Institutional Class | 44,873,207 | 488,411 | 49,209,139 | - | - |
Fidelity Advisor Large Cap Fund Institutional Class | 45,274,051 | 531,557 | 8,005,719 | - | 43,442,036 |
Fidelity Advisor Series Equity-Income Fund | 61,416,234 | 2,072,658 | 8,326,614 | 603,475 | 58,758,781 |
Fidelity Advisor Series Growth & Income Fund (formerly Fidelity Advisor Series Mega Cap Fund) | 13,693,032 | 44,568,855 | 2,570,092 | - | 57,512,980 |
Fidelity Advisor Series Opportunistic Insights Fund | 43,357,108 | 703,407 | 5,770,034 | - | 45,188,652 |
Fidelity Advisor Series Stock Selector Large Cap Value Fund | 61,668,338 | 952,769 | 9,077,681 | - | 58,752,532 |
Fidelity Advisor Short Fixed-Income Fund Institutional Class | 86,474,459 | 5,346,908 | 5,776,023 | 336,903 | 85,755,978 |
Fidelity Advisor Small Cap Fund Institutional Class | 34,707,632 | 524,783 | 5,307,267 | - | 34,150,343 |
Fidelity Institutional Money Market Portfolio Institutional Class | 105,198,514 | 7,094,446 | 8,422,454 | 60,675 | 103,870,506 |
Fidelity Series 100 Index Fund | 13,918,390 | 224,637 | 1,562,534 | - | 13,579,454 |
Fidelity Series All-Sector Equity Fund | 112,351,689 | 1,399,615 | 16,082,643 | - | 108,512,444 |
Fidelity Series Commodity Strategy Fund | 105,007,756 | 12,639,730 | 7,162,118 | - | 102,103,585 |
Fidelity Series Emerging Markets Debt Fund | 12,205,213 | 557,421 | 715,506 | 307,766 | 11,197,020 |
Fidelity Series Emerging Markets Fund | 56,762,125 | 3,090,030 | 3,497,829 | - | 56,473,352 |
Fidelity Series Floating Rate High Income Fund | 21,465,667 | 1,610,293 | 1,199,523 | 472,714 | 21,780,012 |
Fidelity Series High Income Fund | 92,367,830 | 5,228,922 | 5,019,532 | 2,393,086 | 90,563,780 |
Fidelity Series Inflation-Protected Bond Index Fund | 195,025,325 | 17,204,737 | 10,910,246 | - | 191,930,851 |
Fidelity Series International Growth Fund | 94,342,991 | 1,620,283 | 6,577,231 | - | 95,987,410 |
Fidelity Series International Small Cap Fund | 19,264,544 | 324,275 | 1,669,018 | - | 20,021,937 |
Fidelity Series International Value Fund | 93,717,826 | 1,620,283 | 7,236,778 | - | 96,667,903 |
Fidelity Series Investment Grade Bond Fund | 443,590,585 | 32,560,023 | 23,994,662 | 4,587,211 | 438,884,288 |
Fidelity Series Large Cap Value Fund | 63,335,231 | 738,330 | 11,645,710 | - | 57,594,122 |
Fidelity Series Real Estate Equity Fund | 9,445,628 | 532,999 | 739,215 | 59,189 | 8,516,371 |
Fidelity Series Real Estate Income Fund | 11,099,419 | 683,638 | 817,587 | 312,319 | 10,333,968 |
Fidelity Series Small Cap Opportunities Fund | 40,393,393 | 3,469,029 | 6,433,921 | - | 39,214,387 |
Total | $ 1,965,613,653 | $ 147,146,767 | $ 219,196,888 | $ 9,133,338 | $ 1,938,101,838 |
Other Information |
All investments are categorized as Level 1 under the Fair Value Hierarchy. The inputs or methodology used for valuing securities may not be an indication of the risk associated with investing in those securities. For more information on valuation inputs, please refer to the Investment Valuation section in the accompanying Notes to Financial Statements. |
See accompanying notes which are an integral part of the financial statements.
Semiannual Report
Fidelity Advisor Freedom 2015 Fund
Statement of Assets and Liabilities
| September 30, 2013 (Unaudited) |
| | |
Assets | | |
Investment in securities, at value (cost $1,765,189,236) - See accompanying schedule | | $ 1,938,101,838 |
Receivable for investments sold | | 3,525,089 |
Receivable for fund shares sold | | 1,306,815 |
Total assets | | 1,942,933,742 |
| | |
Liabilities | | |
Payable for investments purchased | $ 103 | |
Payable for fund shares redeemed | 4,833,484 | |
Distribution and service plan fees payable | 406,386 | |
Total liabilities | | 5,239,973 |
| | |
Net Assets | | $ 1,937,693,769 |
Net Assets consist of: | | |
Paid in capital | | $ 1,736,594,421 |
Undistributed net investment income | | 6,646,143 |
Accumulated undistributed net realized gain (loss) on investments | | 21,540,603 |
Net unrealized appreciation (depreciation) on investments | | 172,912,602 |
Net Assets | | $ 1,937,693,769 |
| | |
Calculation of Maximum Offering Price Class A:
Net Asset Value and redemption price per share ($1,139,749,591 ÷ 90,412,292 shares) | | $ 12.61 |
| | |
Maximum offering price per share (100/94.25 of $12.61) | | $ 13.38 |
Class T:
Net Asset Value and redemption price per share ($231,748,626 ÷ 18,421,407 shares) | | $ 12.58 |
| | |
Maximum offering price per share (100/96.50 of $12.58) | | $ 13.04 |
Class B:
Net Asset Value and offering price per share ($14,371,986 ÷ 1,145,146 shares)A | | $ 12.55 |
| | |
Class C:
Net Asset Value and offering price per share ($72,753,080 ÷ 5,824,097 shares)A | | $ 12.49 |
| | |
Institutional Class:
Net Asset Value, offering price and redemption price per share ($479,070,486 ÷ 37,716,747 shares) | | $ 12.70 |
A Redemption price per share is equal to net asset value less any applicable contingent deferred sales charge.
Statement of Operations
Six months ended September 30, 2013 (Unaudited) |
| | |
Investment Income | | |
Income distributions from underlying funds | | $ 9,133,338 |
| | |
Expenses | | |
Distribution and service plan fees | $ 2,469,160 | |
Independent trustees' compensation | 3,656 | |
Total expenses before reductions | 2,472,816 | |
Expense reductions | (3,656) | 2,469,160 |
Net investment income (loss) | | 6,664,178 |
Realized and Unrealized Gain (Loss) Realized gain (loss) on sale of underlying fund shares | 21,504,519 | |
Capital gain distributions from underlying funds | 3,426,678 | |
Total net realized gain (loss) | | 24,931,197 |
Change in net unrealized appreciation (depreciation) on underlying funds | | 23,033,768 |
Net gain (loss) | | 47,964,965 |
Net increase (decrease) in net assets resulting from operations | | $ 54,629,143 |
See accompanying notes which are an integral part of the financial statements.
Semiannual Report
Statement of Changes in Net Assets
| Six months ended
September 30, 2013
(Unaudited) | Year ended
March 31,
2013 |
Increase (Decrease) in Net Assets | | |
Operations | | |
Net investment income (loss) | $ 6,664,178 | $ 24,573,510 |
Net realized gain (loss) | 24,931,197 | 92,864,023 |
Change in net unrealized appreciation (depreciation) | 23,033,768 | 17,904,608 |
Net increase (decrease) in net assets resulting from operations | 54,629,143 | 135,342,141 |
Distributions to shareholders from net investment income | (2,852,074) | (24,816,448) |
Distributions to shareholders from net realized gain | (31,992,134) | (13,437,037) |
Total distributions | (34,844,208) | (38,253,485) |
Share transactions - net increase (decrease) | (47,263,491) | 111,574,961 |
Total increase (decrease) in net assets | (27,478,556) | 208,663,617 |
| | |
Net Assets | | |
Beginning of period | 1,965,172,325 | 1,756,508,708 |
End of period (including undistributed net investment income of $6,646,143 and undistributed net investment income of $2,834,039, respectively) | $ 1,937,693,769 | $ 1,965,172,325 |
Financial Highlights - Class A
| Six months ended
September 30, 2013 | Years ended March 31, |
| (Unaudited) | 2013 | 2012 | 2011 | 2010 | 2009 |
Selected Per-Share Data | | | | | | |
Net asset value, beginning of period | $ 12.47 | $ 11.85 | $ 11.87 | $ 10.81 | $ 8.05 | $ 11.85 |
Income from Investment Operations | | | | | | |
Net investment income (loss) E | .04 | .16 | .17 | .16 | .20 | .26 |
Net realized and unrealized gain (loss) | .32 | .71 | .13 | 1.16 | 2.84 | (3.47) |
Total from investment operations | .36 | .87 | .30 | 1.32 | 3.04 | (3.21) |
Distributions from net investment income | (.02) | (.16) | (.17) | (.16) | (.20) | (.26) |
Distributions from net realized gain | (.20) | (.09) | (.15) | (.10) | (.08) | (.33) |
Total distributions | (.22) | (.25) | (.32) | (.26) | (.28) I | (.59) H |
Net asset value, end of period | $ 12.61 | $ 12.47 | $ 11.85 | $ 11.87 | $ 10.81 | $ 8.05 |
Total Return B, C, D | 2.92% | 7.45% | 2.71% | 12.36% | 37.95% | (28.01)% |
Ratios to Average Net Assets F, G | | | | | | |
Expenses before reductions | .25% A | .25% | .25% | .25% | .25% | .25% |
Expenses net of fee waivers, if any | .25% A | .25% | .25% | .25% | .25% | .25% |
Expenses net of all reductions | .25% A | .25% | .25% | .25% | .25% | .25% |
Net investment income (loss) | .69% A | 1.36% | 1.50% | 1.42% | 2.02% | 2.69% |
Supplemental Data | | | | | | |
Net assets, end of period (000 omitted) | $ 1,139,750 | $ 1,181,020 | $ 1,101,302 | $ 1,004,955 | $ 830,024 | $ 477,641 |
Portfolio turnover rate F | 15% A | 20% | 19% | 33% | 29% | 36% |
A Annualized
B Total returns for periods of less than one year are not annualized.
C Total returns would have been lower if certain expenses had not been reduced during the applicable periods shown.
D Total returns do not include the effect of the sales charges.
E Calculated based on average shares outstanding during the period.
F Amounts do not include the activity of the Underlying Funds.
G Expense ratios reflect operating expenses of the class. Expenses before reductions do not reflect amounts reimbursed by the investment adviser or reductions from expense offset arrangements and do not represent the amount paid by the class during periods when reimbursements or reductions occur. Expenses net of fee waivers reflect expenses after reimbursement by the investment adviser but prior to reductions from expense offset arrangements. Expenses net of all reductions represent the net expenses paid by the class but do not include expenses of the investment companies in which the Fund invests.
H Total distributions of $.59 per share is comprised of distributions from net investment income of $.262 and distributions from net realized gain of $.325 per share.
I Total distributions of $.28 per share is comprised of distributions from net investment income of $.197 and distributions from net realized gain of $.082 per share.
See accompanying notes which are an integral part of the financial statements.
Semiannual Report
Financial Highlights - Class T
| Six months ended
September 30, 2013 | Years ended March 31, |
| (Unaudited) | 2013 | 2012 | 2011 | 2010 | 2009 |
Selected Per-Share Data | | | | | | |
Net asset value, beginning of period | $ 12.46 | $ 11.83 | $ 11.85 | $ 10.79 | $ 8.04 | $ 11.82 |
Income from Investment Operations | | | | | | |
Net investment income (loss) E | .03 | .13 | .14 | .13 | .18 | .24 |
Net realized and unrealized gain (loss) | .30 | .72 | .13 | 1.16 | 2.82 | (3.46) |
Total from investment operations | .33 | .85 | .27 | 1.29 | 3.00 | (3.22) |
Distributions from net investment income | (.01) | (.13) | (.14) | (.13) | (.17) | (.23) |
Distributions from net realized gain | (.20) | (.09) | (.15) | (.10) | (.08) | (.33) |
Total distributions | (.21) | (.22) | (.29) | (.23) | (.25) I | (.56) H |
Net asset value, end of period | $ 12.58 | $ 12.46 | $ 11.83 | $ 11.85 | $ 10.79 | $ 8.04 |
Total Return B, C, D | 2.70% | 7.28% | 2.44% | 12.09% | 37.53% | (28.13)% |
Ratios to Average Net Assets F, G | | | | | | |
Expenses before reductions | .50% A | .50% | .50% | .50% | .50% | .50% |
Expenses net of fee waivers, if any | .50% A | .50% | .50% | .50% | .50% | .50% |
Expenses net of all reductions | .50% A | .50% | .50% | .50% | .50% | .50% |
Net investment income (loss) | .44% A | 1.11% | 1.25% | 1.17% | 1.77% | 2.44% |
Supplemental Data | | | | | | |
Net assets, end of period (000 omitted) | $ 231,749 | $ 227,022 | $ 213,366 | $ 236,106 | $ 225,384 | $ 162,439 |
Portfolio turnover rate F | 15% A | 20% | 19% | 33% | 29% | 36% |
A Annualized
B Total returns for periods of less than one year are not annualized.
C Total returns would have been lower if certain expenses had not been reduced during the applicable periods shown.
D Total returns do not include the effect of the sales charges.
E Calculated based on average shares outstanding during the period.
F Amounts do not include the activity of the Underlying Funds.
G Expense ratios reflect operating expenses of the class. Expenses before reductions do not reflect amounts reimbursed by the investment adviser or reductions from expense offset arrangements and do not represent the amount paid by the class during periods when reimbursements or reductions occur. Expenses net of fee waivers reflect expenses after reimbursement by the investment adviser but prior to reductions from expense offset arrangements. Expenses net of all reductions represent the net expenses paid by the class but do not include expenses of the investment companies in which the Fund invests.
H Total distributions of $.56 per share is comprised of distributions from net investment income of $.234 and distributions from net realized gain of $.325 per share.
I Total distributions of $.25 per share is comprised of distributions from net investment income of $.172 and distributions from net realized gain of $.082 per share.
Financial Highlights - Class B
| Six months ended
September 30, 2013 | Years ended March 31, |
| (Unaudited) | 2013 | 2012 | 2011 | 2010 | 2009 |
Selected Per-Share Data | | | | | | |
Net asset value, beginning of period | $ 12.44 | $ 11.81 | $ 11.82 | $ 10.76 | $ 8.02 | $ 11.77 |
Income from Investment Operations | | | | | | |
Net investment income (loss) E | - H | .07 | .09 | .07 | .13 | .19 |
Net realized and unrealized gain (loss) | .31 | .71 | .13 | 1.16 | 2.82 | (3.44) |
Total from investment operations | .31 | .78 | .22 | 1.23 | 2.95 | (3.25) |
Distributions from net investment income | - | (.06) | (.07) | (.07) | (.12) | (.17) |
Distributions from net realized gain | (.20) | (.09) | (.15) | (.10) | (.08) | (.33) |
Total distributions | (.20) | (.15) | (.23) K | (.17) | (.21) J | (.50) I |
Net asset value, end of period | $ 12.55 | $ 12.44 | $ 11.81 | $ 11.82 | $ 10.76 | $ 8.02 |
Total Return B, C, D | 2.50% | 6.65% | 1.95% | 11.51% | 36.85% | (28.47)% |
Ratios to Average Net Assets F, G | | | | | | |
Expenses before reductions | 1.00% A | 1.00% | 1.00% | 1.00% | 1.00% | 1.00% |
Expenses net of fee waivers, if any | 1.00% A | 1.00% | 1.00% | 1.00% | 1.00% | 1.00% |
Expenses net of all reductions | 1.00% A | 1.00% | 1.00% | 1.00% | 1.00% | 1.00% |
Net investment income (loss) | (.06)% A | .61% | .75% | .67% | 1.27% | 1.94% |
Supplemental Data | | | | | | |
Net assets, end of period (000 omitted) | $ 14,372 | $ 17,411 | $ 23,552 | $ 32,762 | $ 35,932 | $ 27,727 |
Portfolio turnover rate F | 15% A | 20% | 19% | 33% | 29% | 36% |
A Annualized
B Total returns for periods of less than one year are not annualized.
C Total returns would have been lower if certain expenses had not been reduced during the applicable periods shown.
D Total returns do not include the effect of the contingent deferred sales charge.
E Calculated based on average shares outstanding during the period.
F Amounts do not include the activity of the Underlying Funds.
G Expense ratios reflect operating expenses of the class. Expenses before reductions do not reflect amounts reimbursed by the investment adviser or reductions from expense offset arrangements and do not represent the amount paid by the class during periods when reimbursements or reductions occur. Expenses net of fee waivers reflect expenses after reimbursement by the investment adviser but prior to reductions from expense offset arrangements. Expenses net of all reductions represent the net expenses paid by the class but do not include expenses of the investment companies in which the Fund invests.
H Amount represents less than $.01 per share.
I Total distributions of $.50 per share is comprised of distributions from net investment income of $.173 and distributions from net realized gain of $.325 per share.
J Total distributions of $.21 per share is comprised of distributions from net investment income of $.124 and distributions from net realized gain of $.082 per share.
K Total distributions of $.23 per share is comprised of distributions from net investment income of $.073 and distributions from net realized gain of $.154 per share.
See accompanying notes which are an integral part of the financial statements.
Semiannual Report
Financial Highlights - Class C
| Six months ended
September 30, 2013 | Years ended March 31, |
| (Unaudited) | 2013 | 2012 | 2011 | 2010 | 2009 |
Selected Per-Share Data | | | | | | |
Net asset value, beginning of period | $ 12.39 | $ 11.77 | $ 11.79 | $ 10.74 | $ 8.00 | $ 11.76 |
Income from Investment Operations | | | | | | |
Net investment income (loss) E | - H | .07 | .09 | .07 | .13 | .19 |
Net realized and unrealized gain (loss) | .30 | .71 | .13 | 1.15 | 2.82 | (3.45) |
Total from investment operations | .30 | .78 | .22 | 1.22 | 2.95 | (3.26) |
Distributions from net investment income | - | (.07) | (.09) | (.07) | (.13) | (.18) |
Distributions from net realized gain | (.20) | (.09) | (.15) | (.10) | (.08) | (.33) |
Total distributions | (.20) | (.16) | (.24) | (.17) | (.21) J | (.50) I |
Net asset value, end of period | $ 12.49 | $ 12.39 | $ 11.77 | $ 11.79 | $ 10.74 | $ 8.00 |
Total Return B, C, D | 2.43% | 6.70% | 1.98% | 11.49% | 36.97% | (28.53)% |
Ratios to Average Net Assets F, G | | | | | | |
Expenses before reductions | 1.00% A | 1.00% | 1.00% | 1.00% | 1.00% | 1.00% |
Expenses net of fee waivers, if any | 1.00% A | 1.00% | 1.00% | 1.00% | 1.00% | 1.00% |
Expenses net of all reductions | 1.00% A | 1.00% | 1.00% | 1.00% | 1.00% | 1.00% |
Net investment income (loss) | (.06)% A | .61% | .75% | .67% | 1.27% | 1.94% |
Supplemental Data | | | | | | |
Net assets, end of period (000 omitted) | $ 72,753 | $ 72,115 | $ 70,220 | $ 70,396 | $ 64,801 | $ 46,942 |
Portfolio turnover rate F | 15% A | 20% | 19% | 33% | 29% | 36% |
A Annualized
B Total returns for periods of less than one year are not annualized.
C Total returns would have been lower if certain expenses had not been reduced during the applicable periods shown.
D Total returns do not include the effect of the contingent deferred sales charge.
E Calculated based on average shares outstanding during the period.
F Amounts do not include the activity of the Underlying Funds.
G Expense ratios reflect operating expenses of the class. Expenses before reductions do not reflect amounts reimbursed by the investment adviser or reductions from expense offset arrangements and do not represent the amount paid by the class during periods when reimbursements or reductions occur. Expenses net of fee waivers reflect expenses after reimbursement by the investment adviser but prior to reductions from expense offset arrangements. Expenses net of all reductions represent the net expenses paid by the class but do not include expenses of the investment companies in which the Fund invests.
H Amount represents less than $.01 per share.
I Total distributions of $.50 per share is comprised of distributions from net investment income of $.179 and distributions from net realized gain of $.325 per share.
J Total distributions of $.21 per share is comprised of distributions from net investment income of $.126 and distributions from net realized gain of $.082 per share.
Financial Highlights - Institutional Class
| Six months ended
September 30, 2013 | Years ended March 31, |
| (Unaudited) | 2013 | 2012 | 2011 | 2010 | 2009 |
Selected Per-Share Data | | | | | | |
Net asset value, beginning of period | $ 12.56 | $ 11.93 | $ 11.94 | $ 10.87 | $ 8.09 | $ 11.91 |
Income from Investment Operations | | | | | | |
Net investment income (loss) D | .06 | .19 | .20 | .19 | .23 | .29 |
Net realized and unrealized gain (loss) | .31 | .72 | .14 | 1.17 | 2.85 | (3.50) |
Total from investment operations | .37 | .91 | .34 | 1.36 | 3.08 | (3.21) |
Distributions from net investment income | (.03) | (.19) | (.19) | (.19) | (.22) | (.29) |
Distributions from net realized gain | (.20) | (.09) | (.15) | (.10) | (.08) | (.33) |
Total distributions | (.23) | (.28) | (.35) J | (.29) | (.30) I | (.61) H |
Net asset value, end of period | $ 12.70 | $ 12.56 | $ 11.93 | $ 11.94 | $ 10.87 | $ 8.09 |
Total Return B, C | 2.96% | 7.74% | 3.01% | 12.67% | 38.30% | (27.85)% |
Ratios to Average Net Assets E, G | | | | | | |
Expenses before reductions F | .00% A | .00% | .00% | .00% | .00% | .00% |
Expenses net of fee waivers, if any | .00% A | .00% | .00% | .00% | .00% | .00% |
Expenses net of all reductions | .00% A | .00% | .00% | .00% | .00% | .00% |
Net investment income (loss) | .94% A | 1.61% | 1.75% | 1.67% | 2.27% | 2.94% |
Supplemental Data | | | | | | |
Net assets, end of period (000 omitted) | $ 479,070 | $ 467,604 | $ 348,068 | $ 238,655 | $ 137,487 | $ 77,998 |
Portfolio turnover rate E | 15% A | 20% | 19% | 33% | 29% | 36% |
A Annualized
B Total returns for periods of less than one year are not annualized.
C Total returns would have been lower if certain expenses had not been reduced during the applicable periods shown.
D Calculated based on average shares outstanding during the period.
E Amounts do not include the activity of the Underlying Funds.
F Amount represents less than .01%.
G Expense ratios reflect operating expenses of the class. Expenses before reductions do not reflect amounts reimbursed by the investment adviser or reductions from expense offset arrangements and do not represent the amount paid by the class during periods when reimbursements or reductions occur. Expenses net of fee waivers reflect expenses after reimbursement by the investment adviser but prior to reductions from expense offset arrangements. Expenses net of all reductions represent the net expenses paid by the class but do not include expenses of the investment companies in which the Fund invests.
H Total distributions of $.61 per share is comprised of distributions from net investment income of $.286 and distributions from net realized gain of $.325 per share.
I Total distributions of $.30 per share is comprised of distributions from net investment income of $.219 and distributions from net realized gain of $.082 per share.
J Total distributions of $.35 per share is comprised of distributions from net investment income of $.194 and distributions from net realized gain of $.154 per share.
See accompanying notes which are an integral part of the financial statements.
Semiannual Report
Fidelity Advisor Freedom 2020 Fund
Investment Changes (Unaudited)
The information in the following tables is based on the direct investments of the Fund. |
Fund Holdings as of September 30, 2013 |
| % of fund's
net assets | % of fund's net assets
6 months ago |
Commodity Funds | | |
Fidelity Series Commodity Strategy Fund | 5.7 | 5.9 |
Domestic Equity Funds | | |
Fidelity Advisor Equity Growth Fund Institutional Class | 4.8 | 4.7 |
Fidelity Advisor Growth & Income Fund Institutional Class | 0.0 | 2.5 |
Fidelity Advisor Large Cap Fund Institutional Class | 2.4 | 2.5 |
Fidelity Advisor Series Equity-Income Fund | 3.3 | 3.4 |
Fidelity Advisor Series Growth & Income Fund (formerly Fidelity Advisor Series Mega Cap Fund) | 3.2 | 0.8 |
Fidelity Advisor Series Opportunistic Insights Fund | 2.5 | 2.4 |
Fidelity Advisor Series Stock Selector Large Cap Value Fund | 3.3 | 3.4 |
Fidelity Advisor Small Cap Fund Institutional Class | 1.9 | 1.9 |
Fidelity Series 100 Index Fund | 0.8 | 0.8 |
Fidelity Series All-Sector Equity Fund | 6.0 | 6.3 |
Fidelity Series Large Cap Value Fund | 3.2 | 3.6 |
Fidelity Series Real Estate Equity Fund | 0.5 | 0.5 |
Fidelity Series Small Cap Opportunities Fund | 2.2 | 2.2 |
| 34.1 | 35.0 |
Developed International Equity Funds | | |
Fidelity Series International Growth Fund | 5.3 | 5.2 |
Fidelity Series International Small Cap Fund | 1.1 | 1.1 |
Fidelity Series International Value Fund | 5.4 | 5.2 |
| 11.8 | 11.5 |
Emerging Markets Equity Funds | | |
Fidelity Series Emerging Markets Fund | 3.2 | 3.2 |
High Yield Bond Funds | | |
Fidelity Series Emerging Markets Debt Fund | 0.7 | 0.7 |
Fidelity Series Floating Rate High Income Fund | 1.1 | 1.1 |
Fidelity Series High Income Fund | 5.1 | 5.4 |
Fidelity Series Real Estate Income Fund | 0.5 | 0.6 |
| 7.4 | 7.8 |
Inflation-Protected Bond Funds | | |
Fidelity Series Inflation-Protected Bond Index Fund | 8.3 | 8.2 |
Investment Grade Bond Funds | | |
Fidelity Series Investment Grade Bond Fund | 22.2 | 21.7 |
Short-Term Funds | | |
Fidelity Advisor Short Fixed-Income Fund Institutional Class | 3.3 | 3.0 |
Fidelity Institutional Money Market Portfolio Institutional Class | 4.0 | 3.7 |
| 7.3 | 6.7 |
Net Other Assets (Liabilities)* | 0.0 | 0.0 |
| 100.0 | 100.0 |
* Amount represents less than 0.1% |
Asset Allocation (% of fund's net assets) |
Period end |
| Commodity Funds | 5.7% | |
| Domestic Equity Funds | 34.1% | |
| Developed International Equity Funds | 11.8% | |
| Emerging Markets Equity Funds | 3.2% | |
| High Yield Bond Funds | 7.4% | |
| Inflation-Protected Bond Funds | 8.3% | |
| Investment Grade Bond Funds | 22.2% | |
| Short-Term Funds | 7.3% | |

Six months ago |
| Commodity Funds | 5.9% | |
| Domestic Equity Funds | 35.0% | |
| Developed International Equity Funds | 11.5% | |
| Emerging Markets Equity Funds | 3.2% | |
| High Yield Bond Funds | 7.8% | |
| Inflation-Protected Bond Funds | 8.2% | |
| Investment Grade Bond Funds | 21.7% | |
| Short-Term Funds | 6.7% | |

Semiannual Report
Fidelity Advisor Freedom 2020 Fund
Investments September 30, 2013 (Unaudited)
Showing Percentage of Net Assets
Domestic Equity Funds - 39.8% |
| Shares | | Value |
Commodity Funds - 5.7% |
Fidelity Series Commodity Strategy Fund (a)(c) | 23,851,326 | | $ 191,049,124 |
Domestic Equity Funds - 34.1% |
Fidelity Advisor Equity Growth Fund Institutional Class (c) | 1,972,440 | | 162,292,346 |
Fidelity Advisor Large Cap Fund Institutional Class (c) | 2,992,307 | | 80,493,071 |
Fidelity Advisor Series Equity-Income Fund (c) | 9,274,631 | | 109,347,901 |
Fidelity Advisor Series Growth & Income Fund (c) | 8,847,621 | | 106,613,831 |
Fidelity Advisor Series Opportunistic Insights Fund (c) | 6,546,184 | | 84,314,856 |
Fidelity Advisor Series Stock Selector Large Cap Value Fund (c) | 8,955,894 | | 108,993,225 |
Fidelity Advisor Small Cap Fund Institutional Class (c) | 2,079,392 | | 63,379,858 |
Fidelity Series 100 Index Fund (c) | 2,284,101 | | 25,307,842 |
Fidelity Series All-Sector Equity Fund (c) | 14,220,903 | | 201,367,987 |
Fidelity Series Large Cap Value Fund (c) | 8,484,380 | | 107,157,715 |
Fidelity Series Real Estate Equity Fund (c) | 1,347,946 | | 16,121,429 |
Fidelity Series Small Cap Opportunities Fund (c) | 5,683,318 | | 72,916,976 |
TOTAL DOMESTIC EQUITY FUNDS | | 1,138,307,037 |
TOTAL DOMESTIC EQUITY FUNDS (Cost $1,125,427,943) |
1,329,356,161
|
International Equity Funds - 15.0% |
| | | |
Developed International Equity Funds - 11.8% |
Fidelity Series International Growth Fund (c) | 13,057,302 | | 177,187,590 |
Fidelity Series International Small Cap Fund (c) | 2,426,983 | | 37,108,567 |
Fidelity Series International Value Fund (c) | 16,688,406 | | 179,400,368 |
TOTAL DEVELOPED INTERNATIONAL EQUITY FUNDS | | 393,696,525 |
Emerging Markets Equity Funds - 3.2% |
Fidelity Series Emerging Markets Fund (c) | 6,374,744 | | 106,713,220 |
TOTAL INTERNATIONAL EQUITY FUNDS (Cost $413,019,840) |
500,409,745
|
Bond Funds - 37.9% |
| Shares | | Value |
High Yield Bond Funds - 7.4% |
Fidelity Series Emerging Markets Debt Fund (c) | 2,276,688 | | $ 23,040,085 |
Fidelity Series Floating Rate High Income Fund (c) | 3,380,027 | | 35,760,682 |
Fidelity Series High Income Fund (c) | 16,526,869 | | 169,896,215 |
Fidelity Series Real Estate Income Fund (c) | 1,729,962 | | 18,994,984 |
TOTAL HIGH YIELD BOND FUNDS | | 247,691,966 |
Inflation-Protected Bond Funds - 8.3% |
Fidelity Series Inflation-Protected Bond Index Fund (c) | 25,784,510 | | 279,761,928 |
Investment Grade Bond Funds - 22.2% |
Fidelity Series Investment Grade Bond Fund (c) | 66,238,611 | | 741,210,058 |
TOTAL BOND FUNDS (Cost $1,272,399,606) |
1,268,663,952
|
Short-Term Funds - 7.3% |
| | | |
Fidelity Advisor Short Fixed-Income Fund Institutional Class (c) | 11,775,997 | | 109,870,056 |
Fidelity Institutional Money Market Portfolio Institutional Class 0.04% (b)(c) | 134,555,896 | | 134,555,896 |
TOTAL SHORT-TERM FUNDS (Cost $243,596,756) |
244,425,952
|
TOTAL INVESTMENT PORTFOLIO - 100.0% (Cost $3,054,444,145) | | 3,342,855,810 |
NET OTHER ASSETS (LIABILITIES) - 0.0% | | (709,252) |
NET ASSETS - 100% | $ 3,342,146,558 |
Legend |
(a) Non-income producing |
(b) The rate quoted is the annualized seven-day yield of the fund at period end. |
(c) Affiliated company |
Affiliated Underlying Funds |
Information regarding the Fund's fiscal year to date purchases and sales of the affiliated Underlying Funds and income earned by the Fund from investments in affiliated Underlying Funds is as follows: |
Affiliate | Value,
beginning of
period | Purchases | Sales
Proceeds | Dividend
Income | Value,
end of
period |
Fidelity Advisor Equity Growth Fund Institutional Class | $ 154,490,981 | $ 3,223,721 | $ 19,034,255 | $ - | $ 162,292,346 |
Fidelity Advisor Growth & Income Fund Institutional Class | 82,252,688 | 1,179,659 | 90,548,966 | - | - |
Fidelity Advisor Large Cap Fund Institutional Class | 82,897,919 | 1,304,901 | 14,128,528 | - | 80,493,071 |
Fidelity Advisor Series Equity-Income Fund | 112,102,324 | 4,718,112 | 14,099,143 | 1,110,633 | 109,347,901 |
Fidelity Advisor Series Growth & Income Fund (formerly Fidelity Advisor Series Mega Cap Fund) | 25,056,657 | 82,413,162 | 4,216,579 | - | 106,613,831 |
Fidelity Advisor Series Opportunistic Insights Fund | 79,114,060 | 1,661,361 | 9,246,508 | - | 84,314,856 |
Fidelity Advisor Series Stock Selector Large Cap Value Fund | 112,492,720 | 2,323,676 | 15,419,985 | - | 108,993,225 |
Fidelity Advisor Short Fixed-Income Fund Institutional Class | 99,769,271 | 14,948,244 | 4,504,165 | 412,320 | 109,870,056 |
Fidelity Advisor Small Cap Fund Institutional Class | 63,218,442 | 1,279,201 | 8,910,773 | - | 63,379,858 |
Fidelity Institutional Money Market Portfolio Institutional Class | 121,613,151 | 18,457,545 | 5,514,799 | 74,444 | 134,555,896 |
Fidelity Series 100 Index Fund | 25,520,060 | 531,830 | 2,593,440 | - | 25,307,842 |
Fidelity Series All-Sector Equity Fund | 206,104,762 | 3,290,913 | 28,132,915 | - | 201,367,987 |
Fidelity Series Commodity Strategy Fund | 192,966,991 | 24,689,564 | 11,123,947 | - | 191,049,124 |
Fidelity Series Emerging Markets Debt Fund | 24,323,444 | 1,606,599 | 1,169,844 | 622,926 | 23,040,085 |
Fidelity Series Emerging Markets Fund | 104,167,314 | 6,953,355 | 4,751,158 | - | 106,713,220 |
Fidelity Series Floating Rate High Income Fund | 35,417,859 | 2,188,267 | 1,676,780 | 778,555 | 35,760,682 |
Fidelity Series High Income Fund | 176,298,804 | 10,132,141 | 12,708,092 | 4,522,668 | 169,896,215 |
Fidelity Series Inflation-Protected Bond Index Fund | 270,384,921 | 34,743,218 | 12,083,649 | - | 279,761,928 |
Fidelity Series International Growth Fund | 172,481,169 | 4,056,681 | 11,498,166 | - | 177,187,590 |
Fidelity Series International Small Cap Fund | 35,093,991 | 801,761 | 2,661,871 | - | 37,108,567 |
Fidelity Series International Value Fund | 170,880,200 | 4,006,841 | 11,286,606 | - | 179,400,368 |
Fidelity Series Investment Grade Bond Fund | 714,114,976 | 78,528,063 | 29,614,816 | 7,593,673 | 741,210,058 |
Fidelity Series Large Cap Value Fund | 117,278,679 | 1,801,591 | 21,545,172 | - | 107,157,715 |
Fidelity Series Real Estate Equity Fund | 17,572,853 | 1,000,461 | 1,077,827 | 111,039 | 16,121,429 |
Fidelity Series Real Estate Income Fund | 19,257,908 | 1,927,467 | 1,030,593 | 569,202 | 18,994,984 |
Fidelity Series Small Cap Opportunities Fund | 73,572,021 | 6,785,849 | 10,708,814 | - | 72,916,976 |
Total | $ 3,288,444,165 | $ 314,554,183 | $ 349,287,391 | $ 15,795,460 | $ 3,342,855,810 |
Other Information |
All investments are categorized as Level 1 under the Fair Value Hierarchy. The inputs or methodology used for valuing securities may not be an indication of the risk associated with investing in those securities. For more information on valuation inputs, please refer to the Investment Valuation section in the accompanying Notes to Financial Statements. |
See accompanying notes which are an integral part of the financial statements.
Semiannual Report
Fidelity Advisor Freedom 2020 Fund
Statement of Assets and Liabilities
| September 30, 2013 (Unaudited) |
| | |
Assets | | |
Investment in securities, at value (cost $3,054,444,145) - See accompanying schedule | | $ 3,342,855,810 |
Receivable for investments sold | | 7,668,632 |
Receivable for fund shares sold | | 1,867,608 |
Receivable from investment adviser for expense reductions | | 488 |
Total assets | | 3,352,392,538 |
| | |
Liabilities | | |
Payable for investments purchased | $ 39,099 | |
Payable for fund shares redeemed | 9,504,564 | |
Distribution and service plan fees payable | 702,317 | |
Total liabilities | | 10,245,980 |
| | |
Net Assets | | $ 3,342,146,558 |
Net Assets consist of: | | |
Paid in capital | | $ 3,005,099,870 |
Undistributed net investment income | | 11,588,465 |
Accumulated undistributed net realized gain (loss) on investments | | 37,046,558 |
Net unrealized appreciation (depreciation) on investments | | 288,411,665 |
Net Assets | | $ 3,342,146,558 |
| | |
Calculation of Maximum Offering Price Class A:
Net Asset Value and redemption price per share ($1,924,379,187 ÷ 145,694,237 shares) | | $ 13.21 |
| | |
Maximum offering price per share (100/94.25 of $13.21) | | $ 14.02 |
Class T:
Net Asset Value and redemption price per share ($458,026,350 ÷ 34,703,538 shares) | | $ 13.20 |
| | |
Maximum offering price per share (100/96.50 of $13.20) | | $ 13.68 |
Class B:
Net Asset Value and offering price per share ($27,861,864 ÷ 2,116,075 shares)A | | $ 13.17 |
| | |
Class C:
Net Asset Value and offering price per share ($106,811,497 ÷ 8,152,123 shares)A | | $ 13.10 |
| | |
Institutional Class:
Net Asset Value, offering price and redemption price per share ($825,067,660 ÷ 62,019,131 shares) | | $ 13.30 |
A Redemption price per share is equal to net asset value less any applicable contingent deferred sales charge.
Statement of Operations
Six months ended September 30, 2013 (Unaudited) |
| | |
Investment Income | | |
Income distributions from underlying funds | | $ 15,795,460 |
| | |
Expenses | | |
Distribution and service plan fees | $ 4,216,033 | |
Independent trustees' compensation | 6,185 | |
Total expenses before reductions | 4,222,218 | |
Expense reductions | (6,185) | 4,216,033 |
Net investment income (loss) | | 11,579,427 |
Realized and Unrealized Gain (Loss) Realized gain (loss) on sale of underlying fund shares | 36,129,236 | |
Capital gain distributions from underlying funds | 6,367,840 | |
Total net realized gain (loss) | | 42,497,076 |
Change in net unrealized appreciation (depreciation) on underlying funds | | 53,015,622 |
Net gain (loss) | | 95,512,698 |
Net increase (decrease) in net assets resulting from operations | | $ 107,092,125 |
See accompanying notes which are an integral part of the financial statements.
Semiannual Report
Fidelity Advisor Freedom 2020 Fund
Financial Statements - continued
Statement of Changes in Net Assets
| Six months ended
September 30, 2013
(Unaudited) | Year ended
March 31,
2013 |
Increase (Decrease) in Net Assets | | |
Operations | | |
Net investment income (loss) | $ 11,579,427 | $ 42,540,294 |
Net realized gain (loss) | 42,497,076 | 163,159,519 |
Change in net unrealized appreciation (depreciation) | 53,015,622 | 31,602,843 |
Net increase (decrease) in net assets resulting from operations | 107,092,125 | 237,302,656 |
Distributions to shareholders from net investment income | (4,816,181) | (42,626,632) |
Distributions to shareholders from net realized gain | (63,126,693) | (20,099,722) |
Total distributions | (67,942,874) | (62,726,354) |
Share transactions - net increase (decrease) | 15,215,669 | 290,138,617 |
Total increase (decrease) in net assets | 54,364,920 | 464,714,919 |
| | |
Net Assets | | |
Beginning of period | 3,287,781,638 | 2,823,066,719 |
End of period (including undistributed net investment income of $11,588,465 and undistributed net investment income of $4,825,219, respectively) | $ 3,342,146,558 | $ 3,287,781,638 |
Financial Highlights - Class A
| Six months ended September 30, 2013 | Years ended March 31, |
| (Unaudited) | 2013 | 2012 | 2011 | 2010 | 2009 |
Selected Per-Share Data | | | | | | |
Net asset value, beginning of period | $ 13.05 | $ 12.35 | $ 12.45 | $ 11.21 | $ 7.97 | $ 12.73 |
Income from Investment Operations | | | | | | |
Net investment income (loss) E | .05 | .18 | .19 | .16 | .20 | .25 |
Net realized and unrealized gain (loss) | .38 | .78 | .06 | 1.36 | 3.32 | (4.33) |
Total from investment operations | .43 | .96 | .25 | 1.52 | 3.52 | (4.08) |
Distributions from net investment income | (.02) | (.18) | (.18) | (.17) | (.19) | (.25) |
Distributions from net realized gain | (.25) | (.08) | (.18) | (.11) | (.09) | (.43) |
Total distributions | (.27) | (.26) | (.35) I | (.28) | (.28) H | (.68) |
Net asset value, end of period | $ 13.21 | $ 13.05 | $ 12.35 | $ 12.45 | $ 11.21 | $ 7.97 |
Total Return B, C, D | 3.32% | 7.91% | 2.23% | 13.73% | 44.32% | (33.34)% |
Ratios to Average Net Assets F, G | | | | | | |
Expenses before reductions | .25% A | .25% | .25% | .25% | .25% | .25% |
Expenses net of fee waivers, if any | .25% A | .25% | .25% | .25% | .25% | .25% |
Expenses net of all reductions | .25% A | .25% | .25% | .25% | .25% | .25% |
Net investment income (loss) | .70% A | 1.44% | 1.55% | 1.43% | 1.92% | 2.49% |
Supplemental Data | | | | | | |
Net assets, end of period (000 omitted) | $ 1,924,379 | $ 1,944,691 | $ 1,740,500 | $ 1,557,402 | $ 1,238,015 | $ 677,210 |
Portfolio turnover rate F | 19% A | 21% | 18% | 39% | 26% | 31% |
A Annualized
B Total returns for periods of less than one year are not annualized.
C Total returns would have been lower if certain expenses had not been reduced during the applicable periods shown.
D Total returns do not include the effect of the sales charges.
E Calculated based on average shares outstanding during the period.
F Amounts do not include the activity of the Underlying Funds.
G Expense ratios reflect operating expenses of the class. Expenses before reductions do not reflect amounts reimbursed by the investment adviser or reductions from expense offset arrangements and do not represent the amount paid by the class during periods when reimbursements or reductions occur. Expenses net of fee waivers reflect expenses after reimbursement by the investment adviser but prior to reductions from expense offset arrangements. Expenses net of all reductions represent the net expenses paid by the class but do not include expenses of the investment companies in which the Fund invests.
H Total distributions of $.28 per share is comprised of distributions from net investment income of $.189 and distributions from net realized gain of $.087 per share.
I Total distributions of $.35 per share is comprised of distributions from net investment income of $.178 and distributions from net realized gain of $.175 per share.
See accompanying notes which are an integral part of the financial statements.
Semiannual Report
Financial Highlights - Class T
| Six months ended September 30, 2013 | Years ended March 31, |
| (Unaudited) | 2013 | 2012 | 2011 | 2010 | 2009 |
Selected Per-Share Data | | | | | | |
Net asset value, beginning of period | $ 13.05 | $ 12.34 | $ 12.45 | $ 11.20 | $ 7.96 | $ 12.72 |
Income from Investment Operations | | | | | | |
Net investment income (loss) E | .03 | .15 | .16 | .13 | .17 | .23 |
Net realized and unrealized gain (loss) | .38 | .79 | .05 | 1.37 | 3.32 | (4.34) |
Total from investment operations | .41 | .94 | .21 | 1.50 | 3.49 | (4.11) |
Distributions from net investment income | (.01) | (.15) | (.15) | (.13) | (.16) | (.22) |
Distributions from net realized gain | (.25) | (.08) | (.18) | (.11) | (.09) | (.43) |
Total distributions | (.26) | (.23) | (.32) J | (.25) I | (.25) H | (.65) |
Net asset value, end of period | $ 13.20 | $ 13.05 | $ 12.34 | $ 12.45 | $ 11.20 | $ 7.96 |
Total Return B, C, D | 3.18% | 7.72% | 1.86% | 13.50% | 44.02% | (33.56)% |
Ratios to Average Net Assets F, G | | | | | | |
Expenses before reductions | .50% A | .50% | .50% | .50% | .50% | .50% |
Expenses net of fee waivers, if any | .50% A | .50% | .50% | .50% | .50% | .50% |
Expenses net of all reductions | .50% A | .50% | .50% | .50% | .50% | .50% |
Net investment income (loss) | .45% A | 1.19% | 1.30% | 1.18% | 1.67% | 2.24% |
Supplemental Data | | | | | | |
Net assets, end of period (000 omitted) | $ 458,026 | $ 430,153 | $ 386,416 | $ 424,707 | $ 488,097 | $ 343,919 |
Portfolio turnover rate F | 19% A | 21% | 18% | 39% | 26% | 31% |
A Annualized
B Total returns for periods of less than one year are not annualized.
C Total returns would have been lower if certain expenses had not been reduced during the applicable periods shown.
D Total returns do not include the effect of the sales charges.
E Calculated based on average shares outstanding during the period.
F Amounts do not include the activity of the Underlying Funds.
G Expense ratios reflect operating expenses of the class. Expenses before reductions do not reflect amounts reimbursed by the investment adviser or reductions from expense offset arrangements and do not represent the amount paid by the class during periods when reimbursements or reductions occur. Expenses net of fee waivers reflect expenses after reimbursement by the investment adviser but prior to reductions from expense offset arrangements. Expenses net of all reductions represent the net expenses paid by the class but do not include expenses of the investment companies in which the Fund invests.
H Total distributions of $.25 per share is comprised of distributions from net investment income of $.163 and distributions from net realized gain of $.087 per share.
I Total distributions of $.25 per share is comprised of distributions from net investment income of $.134 and distributions from net realized gain of $.111 per share.
J Total distributions of $.32 per share is comprised of distributions from net investment income of $.145 and distributions from net realized gain of $.175 per share.
Financial Highlights - Class B
| Six months ended September 30, 2013 | Years ended March 31, |
| (Unaudited) | 2013 | 2012 | 2011 | 2010 | 2009 |
Selected Per-Share Data | | | | | | |
Net asset value, beginning of period | $ 13.04 | $ 12.32 | $ 12.41 | $ 11.17 | $ 7.94 | $ 12.66 |
Income from Investment Operations | | | | | | |
Net investment income (loss) E | - H | .09 | .10 | .08 | .12 | .18 |
Net realized and unrealized gain (loss) | .38 | .79 | .06 | 1.35 | 3.31 | (4.31) |
Total from investment operations | .38 | .88 | .16 | 1.43 | 3.43 | (4.13) |
Distributions from net investment income | - | (.08) | (.08) | (.08) | (.12) | (.16) |
Distributions from net realized gain | (.25) | (.08) | (.17) | (.11) | (.09) | (.43) |
Total distributions | (.25) | (.16) | (.25) | (.19) | (.20) I | (.59) |
Net asset value, end of period | $ 13.17 | $ 13.04 | $ 12.32 | $ 12.41 | $ 11.17 | $ 7.94 |
Total Return B, C, D | 2.90% | 7.19% | 1.39% | 12.87% | 43.34% | (33.87)% |
Ratios to Average Net Assets F, G | | | | | | |
Expenses before reductions | 1.00% A | 1.00% | 1.00% | 1.00% | 1.00% | 1.00% |
Expenses net of fee waivers, if any | 1.00% A | 1.00% | 1.00% | 1.00% | 1.00% | 1.00% |
Expenses net of all reductions | 1.00% A | 1.00% | 1.00% | 1.00% | 1.00% | 1.00% |
Net investment income (loss) | (.05)% A | .69% | .80% | .68% | 1.17% | 1.74% |
Supplemental Data | | | | | | |
Net assets, end of period (000 omitted) | $ 27,862 | $ 33,074 | $ 43,138 | $ 61,856 | $ 71,888 | $ 52,871 |
Portfolio turnover rate F | 19% A | 21% | 18% | 39% | 26% | 31% |
A Annualized
B Total returns for periods of less than one year are not annualized.
C Total returns would have been lower if certain expenses had not been reduced during the applicable periods shown.
D Total returns do not include the effect of the contingent deferred sales charge.
E Calculated based on average shares outstanding during the period.
F Amounts do not include the activity of the Underlying Funds.
G Expense ratios reflect operating expenses of the class. Expenses before reductions do not reflect amounts reimbursed by the investment adviser or reductions from expense offset arrangements and do not represent the amount paid by the class during periods when reimbursements or reductions occur. Expenses net of fee waivers reflect expenses after reimbursement by the investment adviser but prior to reductions from expense offset arrangements. Expenses net of all reductions represent the net expenses paid by the class but do not include expenses of the investment companies in which the Fund invests.
H Amount represents less than $.01 per share.
I Total distributions of $.20 per share is comprised of distributions from net investment income of $.115 and distributions from net realized gain of $.087 per share.
See accompanying notes which are an integral part of the financial statements.
Semiannual Report
Financial Highlights - Class C
| Six months ended September 30, 2013 | Years ended March 31, |
| (Unaudited) | 2013 | 2012 | 2011 | 2010 | 2009 |
Selected Per-Share Data | | | | | | |
Net asset value, beginning of period | $ 12.97 | $ 12.27 | $ 12.37 | $ 11.14 | $ 7.92 | $ 12.64 |
Income from Investment Operations | | | | | | |
Net investment income (loss) E | - J | .09 | .10 | .08 | .12 | .18 |
Net realized and unrealized gain (loss) | .38 | .78 | .06 | 1.34 | 3.31 | (4.31) |
Total from investment operations | .38 | .87 | .16 | 1.42 | 3.43 | (4.13) |
Distributions from net investment income | - | (.08) | (.09) | (.08) | (.12) | (.16) |
Distributions from net realized gain | (.25) | (.08) | (.17) | (.11) | (.09) | (.43) |
Total distributions | (.25) | (.17) I | (.26) | (.19) | (.21) H | (.59) |
Net asset value, end of period | $ 13.10 | $ 12.97 | $ 12.27 | $ 12.37 | $ 11.14 | $ 7.92 |
Total Return B, C, D | 2.92% | 7.13% | 1.43% | 12.89% | 43.38% | (33.90)% |
Ratios to Average Net Assets F, G | | | | | | |
Expenses before reductions | 1.00% A | 1.00% | 1.00% | 1.00% | 1.00% | 1.00% |
Expenses net of fee waivers, if any | 1.00% A | 1.00% | 1.00% | 1.00% | 1.00% | 1.00% |
Expenses net of all reductions | 1.00% A | 1.00% | 1.00% | 1.00% | 1.00% | 1.00% |
Net investment income (loss) | (.05)% A | .69% | .80% | .68% | 1.17% | 1.74% |
Supplemental Data | | | | | | |
Net assets, end of period (000 omitted) | $ 106,811 | $ 102,576 | $ 97,550 | $ 101,019 | $ 93,237 | $ 62,702 |
Portfolio turnover rate F | 19% A | 21% | 18% | 39% | 26% | 31% |
A Annualized
B Total returns for periods of less than one year are not annualized.
C Total returns would have been lower if certain expenses had not been reduced during the applicable periods shown.
D Total returns do not include the effect of the contingent deferred sales charge.
E Calculated based on average shares outstanding during the period.
F Amounts do not include the activity of the Underlying Funds.
G Expense ratios reflect operating expenses of the class. Expenses before reductions do not reflect amounts reimbursed by the investment adviser or reductions from expense offset arrangements and do not represent the amount paid by the class during periods when reimbursements or reductions occur. Expenses net of fee waivers reflect expenses after reimbursement by the investment adviser but prior to reductions from expense offset arrangements. Expenses net of all reductions represent the net expenses paid by the class but do not include expenses of the investment companies in which the Fund invests.
H Total distributions of $.21 per share is comprised of distributions from net investment income of $.119 and distributions from net realized gain of $.087 per share.
I Total distributions of $.17 per share is comprised of distributions from net investment income of $.084 and distributions from net realized gain of $.083 per share.
J Amount represents less than .01%.
Financial Highlights - Institutional Class
| Six months ended September 30, 2013 | Years ended March 31, |
| (Unaudited) | 2013 | 2012 | 2011 | 2010 | 2009 |
Selected Per-Share Data | | | | | | |
Net asset value, beginning of period | $ 13.14 | $ 12.42 | $ 12.53 | $ 11.27 | $ 8.01 | $ 12.79 |
Income from Investment Operations | | | | | | |
Net investment income (loss) D | .06 | .21 | .22 | .19 | .22 | .28 |
Net realized and unrealized gain (loss) | .38 | .80 | .05 | 1.38 | 3.34 | (4.35) |
Total from investment operations | .44 | 1.01 | .27 | 1.57 | 3.56 | (4.07) |
Distributions from net investment income | (.03) | (.21) | (.21) | (.20) | (.21) | (.28) |
Distributions from net realized gain | (.25) | (.08) | (.18) | (.11) | (.09) | (.43) |
Total distributions | (.28) | (.29) | (.38) I | (.31) | (.30) H | (.71) |
Net asset value, end of period | $ 13.30 | $ 13.14 | $ 12.42 | $ 12.53 | $ 11.27 | $ 8.01 |
Total Return B, C | 3.36% | 8.28% | 2.39% | 14.09% | 44.65% | (33.16)% |
Ratios to Average Net Assets E, G | | | | | | |
Expenses before reductions F | .00% A | .00% | .00% | .00% | .00% | .00% |
Expenses net of fee waivers, if any | .00% A | .00% | .00% | .00% | .00% | .00% |
Expenses net of all reductions | .00% A | .00% | .00% | .00% | .00% | .00% |
Net investment income (loss) | .95% A | 1.69% | 1.80% | 1.68% | 2.17% | 2.74% |
Supplemental Data | | | | | | |
Net assets, end of period (000 omitted) | $ 825,068 | $ 777,288 | $ 555,462 | $ 365,157 | $ 214,905 | $ 105,660 |
Portfolio turnover rate E | 19% A | 21% | 18% | 39% | 26% | 31% |
A Annualized
B Total returns for periods of less than one year are not annualized.
C Total returns would have been lower if certain expenses had not been reduced during the applicable periods shown.
D Calculated based on average shares outstanding during the period.
E Amounts do not include the activity of the Underlying Funds.
F Amount represents less than .01%.
G Expense ratios reflect operating expenses of the class. Expenses before reductions do not reflect amounts reimbursed by the investment adviser or reductions from expense offset arrangements and do not represent the amount paid by the class during periods when reimbursements or reductions occur. Expenses net of fee waivers reflect expenses after reimbursement by the investment adviser but prior to reductions from expense offset arrangements. Expenses net of all reductions represent the net expenses paid by the class but do not include expenses of the investment companies in which the Fund invests.
H Total distributions of $.30 per share is comprised of distributions from net investment income of $.211 and distributions from net realized gain of $.087 per share.
I Total distributions of $.38 per share is comprised of distributions from net investment income of $.208 and distributions from net realized gain of $.175 per share.
See accompanying notes which are an integral part of the financial statements.
Semiannual Report
Fidelity Advisor Freedom 2025 Fund
Investment Changes (Unaudited)
The information in the following tables is based on the direct investments of the Fund. |
Fund Holdings as of September 30, 2013 |
| % of fund's
net assets | % of fund's net assets
6 months ago |
Commodity Funds | | |
Fidelity Series Commodity Strategy Fund | 7.1 | 7.2 |
Domestic Equity Funds | | |
Fidelity Advisor Equity Growth Fund Institutional Class | 6.0 | 5.8 |
Fidelity Advisor Growth & Income Fund Institutional Class | 0.0 | 3.1 |
Fidelity Advisor Large Cap Fund Institutional Class | 2.9 | 3.1 |
Fidelity Advisor Series Equity-Income Fund | 4.0 | 4.1 |
Fidelity Advisor Series Growth & Income Fund (formerly Fidelity Advisor Series Mega Cap Fund) | 3.9 | 0.9 |
Fidelity Advisor Series Opportunistic Insights Fund | 3.1 | 2.9 |
Fidelity Advisor Series Stock Selector Large Cap Value Fund | 4.0 | 4.1 |
Fidelity Advisor Small Cap Fund Institutional Class | 2.3 | 2.4 |
Fidelity Series 100 Index Fund | 0.9 | 0.9 |
Fidelity Series All-Sector Equity Fund | 7.4 | 7.6 |
Fidelity Series Large Cap Value Fund | 3.9 | 4.3 |
Fidelity Series Real Estate Equity Fund | 0.6 | 0.6 |
Fidelity Series Small Cap Opportunities Fund | 2.7 | 2.8 |
| 41.7 | 42.6 |
Developed International Equity Funds | | |
Fidelity Series International Growth Fund | 6.5 | 6.4 |
Fidelity Series International Small Cap Fund | 1.3 | 1.3 |
Fidelity Series International Value Fund | 6.6 | 6.3 |
| 14.4 | 14.0 |
Emerging Markets Equity Funds | | |
Fidelity Series Emerging Markets Fund | 3.8 | 3.8 |
High Yield Bond Funds | | |
Fidelity Series Emerging Markets Debt Fund | 0.7 | 0.7 |
Fidelity Series Floating Rate High Income Fund | 0.9 | 0.9 |
Fidelity Series High Income Fund | 6.8 | 6.9 |
Fidelity Series Real Estate Income Fund | 0.5 | 0.6 |
| 8.9 | 9.1 |
Inflation-Protected Bond Funds | | |
Fidelity Series Inflation-Protected Bond Index Fund | 5.6 | 5.4 |
Investment Grade Bond Funds | | |
Fidelity Series Investment Grade Bond Fund | 17.5 | 17.2 |
Short-Term Funds | | |
Fidelity Advisor Short Fixed-Income Fund Institutional Class | 0.5 | 0.3 |
Fidelity Institutional Money Market Portfolio Institutional Class | 0.5 | 0.4 |
| 1.0 | 0.7 |
Net Other Assets (Liabilities)* | 0.0 | 0.0 |
| 100.0 | 100.0 |
* Amount represents less than 0.1% |
Asset Allocation (% of fund's net assets) |
Period end |
| Commodity Funds | 7.1% | |
| Domestic Equity Funds | 41.7% | |
| Developed International Equity Funds | 14.4% | |
| Emerging Markets Equity Funds | 3.8% | |
| High Yield Bond Funds | 8.9% | |
| Inflation-Protected Bond Funds | 5.6% | |
| Investment Grade Bond Funds | 17.5% | |
| Short-Term Funds | 1.0% | |

Six months ago |
| Commodity Funds | 7.2% | |
| Domestic Equity Funds | 42.6% | |
| Developed International Equity Funds | 14.0% | |
| Emerging Markets Equity Funds | 3.8% | |
| High Yield Bond Funds | 9.1% | |
| Inflation-Protected Bond Funds | 5.4% | |
| Investment Grade Bond Funds | 17.2% | |
| Short-Term Funds | 0.7% | |

Semiannual Report
Fidelity Advisor Freedom 2025 Fund
Investments September 30, 2013 (Unaudited)
Showing Percentage of Net Assets
Domestic Equity Funds - 48.8% |
| Shares | | Value |
Commodity Funds - 7.1% |
Fidelity Series Commodity Strategy Fund (a)(c) | 27,380,042 | | $ 219,314,140 |
Domestic Equity Funds - 41.7% |
Fidelity Advisor Equity Growth Fund Institutional Class (c) | 2,242,267 | | 184,493,740 |
Fidelity Advisor Large Cap Fund Institutional Class (c) | 3,389,723 | | 91,183,542 |
Fidelity Advisor Series Equity-Income Fund (c) | 10,604,475 | | 125,026,758 |
Fidelity Advisor Series Growth & Income Fund (c) | 10,030,978 | | 120,873,284 |
Fidelity Advisor Series Opportunistic Insights Fund (c) | 7,375,859 | | 95,001,059 |
Fidelity Advisor Series Stock Selector Large Cap Value Fund (c) | 10,180,774 | | 123,900,025 |
Fidelity Advisor Small Cap Fund Institutional Class (c) | 2,358,760 | | 71,894,992 |
Fidelity Series 100 Index Fund (c) | 2,591,040 | | 28,708,722 |
Fidelity Series All-Sector Equity Fund (c) | 16,132,401 | | 228,434,798 |
Fidelity Series Large Cap Value Fund (c) | 9,639,793 | | 121,750,588 |
Fidelity Series Real Estate Equity Fund (c) | 1,505,208 | | 18,002,283 |
Fidelity Series Small Cap Opportunities Fund (c) | 6,438,853 | | 82,610,489 |
TOTAL DOMESTIC EQUITY FUNDS | | 1,291,880,280 |
TOTAL DOMESTIC EQUITY FUNDS (Cost $1,292,190,477) |
1,511,194,420
|
International Equity Funds - 18.2% |
| | | |
Developed International Equity Funds - 14.4% |
Fidelity Series International Growth Fund (c) | 14,825,452 | | 201,181,390 |
Fidelity Series International Small Cap Fund (c) | 2,785,181 | | 42,585,411 |
Fidelity Series International Value Fund (c) | 18,958,092 | | 203,799,494 |
TOTAL DEVELOPED INTERNATIONAL EQUITY FUNDS | | 447,566,295 |
Emerging Markets Equity Funds - 3.8% |
Fidelity Series Emerging Markets Fund (c) | 7,047,640 | | 117,977,495 |
TOTAL INTERNATIONAL EQUITY FUNDS (Cost $471,028,648) |
565,543,790
|
Bond Funds - 32.0% |
| Shares | | Value |
High Yield Bond Funds - 8.9% |
Fidelity Series Emerging Markets Debt Fund (c) | 2,085,995 | | $ 21,110,267 |
Fidelity Series Floating Rate High Income Fund (c) | 2,627,084 | | 27,794,546 |
Fidelity Series High Income Fund (c) | 20,549,149 | | 211,245,254 |
Fidelity Series Real Estate Income Fund (c) | 1,433,256 | | 15,737,147 |
TOTAL HIGH YIELD BOND FUNDS | | 275,887,214 |
Inflation-Protected Bond Funds - 5.6% |
Fidelity Series Inflation-Protected Bond Index Fund (c) | 15,935,172 | | 172,896,619 |
Investment Grade Bond Funds - 17.5% |
Fidelity Series Investment Grade Bond Fund (c) | 48,611,067 | | 543,957,840 |
TOTAL BOND FUNDS (Cost $995,066,129) |
992,741,673
|
Short-Term Funds - 1.0% |
| | | |
Fidelity Advisor Short Fixed-Income Fund Institutional Class (c) | 1,445,816 | | 13,489,466 |
Fidelity Institutional Money Market Portfolio Institutional Class 0.04% (b)(c) | 16,456,376 | | 16,456,376 |
TOTAL SHORT-TERM FUNDS (Cost $29,938,324) |
29,945,842
|
TOTAL INVESTMENT PORTFOLIO - 100.0% (Cost $2,788,223,578) | | 3,099,425,725 |
NET OTHER ASSETS (LIABILITIES) - 0.0% | | (622,715) |
NET ASSETS - 100% | $ 3,098,803,010 |
Legend |
(a) Non-income producing |
(b) The rate quoted is the annualized seven-day yield of the fund at period end. |
(c) Affiliated company |
Affiliated Underlying Funds |
Information regarding the Fund's fiscal year to date purchases and sales of the affiliated Underlying Funds and income earned by the Fund from investments in affiliated Underlying Funds is as follows: |
Affiliate | Value,
beginning of
period | Purchases | Sales
Proceeds | Dividend
Income | Value,
end of
period |
Fidelity Advisor Equity Growth Fund Institutional Class | $ 168,222,574 | $ 7,405,590 | $ 17,490,758 | $ - | $ 184,493,740 |
Fidelity Advisor Growth & Income Fund Institutional Class | 89,324,444 | 2,811,266 | 99,939,107 | - | - |
Fidelity Advisor Large Cap Fund Institutional Class | 90,137,343 | 3,221,928 | 13,692,812 | - | 91,183,542 |
Fidelity Advisor Series Equity-Income Fund | 118,699,060 | 8,736,435 | 9,504,432 | 1,197,964 | 125,026,758 |
Fidelity Advisor Series Growth & Income Fund (formerly Fidelity Advisor Series Mega Cap Fund) | 26,284,215 | 93,761,370 | 2,825,271 | - | 120,873,284 |
Fidelity Advisor Series Opportunistic Insights Fund | 83,888,742 | 3,849,513 | 6,799,198 | - | 95,001,059 |
Fidelity Advisor Series Stock Selector Large Cap Value Fund | 119,562,234 | 5,329,384 | 11,393,798 | - | 123,900,025 |
Fidelity Advisor Short Fixed-Income Fund Institutional Class | 9,663,635 | 4,257,553 | 395,358 | 45,730 | 13,489,466 |
Fidelity Advisor Small Cap Fund Institutional Class | 68,924,591 | 2,943,851 | 8,663,342 | - | 71,894,992 |
Fidelity Institutional Money Market Portfolio Institutional Class | 11,776,143 | 5,122,324 | 442,091 | 8,159 | 16,456,376 |
Fidelity Series 100 Index Fund | 27,794,239 | 1,226,747 | 2,351,000 | - | 28,708,722 |
Fidelity Series All-Sector Equity Fund | 223,124,251 | 8,122,887 | 25,057,646 | - | 228,434,798 |
Fidelity Series Commodity Strategy Fund | 209,981,372 | 35,863,438 | 9,579,953 | - | 219,314,140 |
Fidelity Series Emerging Markets Debt Fund | 21,302,722 | 2,108,436 | 784,023 | 552,908 | 21,110,267 |
Fidelity Series Emerging Markets Fund | 111,535,501 | 9,550,703 | 3,513,908 | - | 117,977,495 |
Fidelity Series Floating Rate High Income Fund | 26,695,868 | 2,194,164 | 965,129 | 591,216 | 27,794,546 |
Fidelity Series High Income Fund | 202,125,088 | 21,000,053 | 7,396,232 | 5,412,578 | 211,245,254 |
Fidelity Series Inflation-Protected Bond Index Fund | 157,454,593 | 28,268,349 | 4,996,441 | - | 172,896,619 |
Fidelity Series International Growth Fund | 184,869,495 | 9,400,905 | 6,790,722 | - | 201,181,390 |
Fidelity Series International Small Cap Fund | 37,686,968 | 1,877,739 | 1,358,125 | - | 42,585,411 |
Fidelity Series International Value Fund | 183,537,602 | 9,388,860 | 6,790,722 | - | 203,799,494 |
Fidelity Series Investment Grade Bond Fund | 501,358,646 | 73,432,014 | 15,499,251 | 5,431,373 | 543,957,840 |
Fidelity Series Large Cap Value Fund | 126,349,210 | 4,447,248 | 19,589,097 | - | 121,750,588 |
Fidelity Series Real Estate Equity Fund | 18,637,135 | 1,723,810 | 857,777 | 121,082 | 18,002,283 |
Fidelity Series Real Estate Income Fund | 15,704,734 | 1,517,239 | 542,577 | 462,772 | 15,737,147 |
Fidelity Series Small Cap Opportunities Fund | 80,339,838 | 9,409,963 | 10,721,184 | - | 82,610,489 |
Total | $ 2,914,980,243 | $ 356,971,769 | $ 287,939,954 | $ 13,823,782 | $ 3,099,425,725 |
Other Information |
All investments are categorized as Level 1 under the Fair Value Hierarchy. The inputs or methodology used for valuing securities may not be an indication of the risk associated with investing in those securities. For more information on valuation inputs, please refer to the Investment Valuation section in the accompanying Notes to Financial Statements. |
See accompanying notes which are an integral part of the financial statements.
Semiannual Report
Fidelity Advisor Freedom 2025 Fund
Statement of Assets and Liabilities
| September 30, 2013 (Unaudited) |
| | |
Assets | | |
Investment in securities, at value (cost $2,788,223,578) - See accompanying schedule | | $ 3,099,425,725 |
Cash | | 8 |
Receivable for investments sold | | 8,805,809 |
Receivable for fund shares sold | | 2,242,527 |
Receivable from investment adviser for expense reductions | | 881 |
Total assets | | 3,110,474,950 |
| | |
Liabilities | | |
Payable for investments purchased | $ 16,484 | |
Payable for fund shares redeemed | 11,034,457 | |
Distribution and service plan fees payable | 620,999 | |
Total liabilities | | 11,671,940 |
| | |
Net Assets | | $ 3,098,803,010 |
Net Assets consist of: | | |
Paid in capital | | $ 2,748,159,358 |
Undistributed net investment income | | 10,187,795 |
Accumulated undistributed net realized gain (loss) on investments | | 29,253,710 |
Net unrealized appreciation (depreciation) on investments | | 311,202,147 |
Net Assets | | $ 3,098,803,010 |
| | |
Calculation of Maximum Offering Price Class A:
Net Asset Value and redemption price per share ($1,863,005,317 ÷ 144,581,286 shares) | | $ 12.89 |
| | |
Maximum offering price per share (100/94.25 of $12.89) | | $ 13.68 |
Class T:
Net Asset Value and redemption price per share ($360,450,566 ÷ 27,937,618 shares) | | $ 12.90 |
| | |
Maximum offering price per share (100/96.50 of $12.90) | | $ 13.37 |
Class B:
Net Asset Value and offering price per share ($19,823,406 ÷ 1,548,956 shares)A | | $ 12.80 |
| | |
Class C:
Net Asset Value and offering price per share ($81,403,084 ÷ 6,392,425 shares)A | | $ 12.73 |
| | |
Institutional Class:
Net Asset Value, offering price and redemption price per share ($774,120,637 ÷ 59,610,731 shares) | | $ 12.99 |
A Redemption price per share is equal to net asset value less any applicable contingent deferred sales charge.
Statement of Operations
Six months ended September 30, 2013 (Unaudited) |
| | |
Investment Income | | |
Income distributions from underlying funds | | $ 13,823,782 |
| | |
Expenses | | |
Distribution and service plan fees | $ 3,654,117 | |
Independent trustees' compensation | 5,552 | |
Total expenses before reductions | 3,659,669 | |
Expense reductions | (5,552) | 3,654,117 |
Net investment income (loss) | | 10,169,665 |
Realized and Unrealized Gain (Loss) Realized gain (loss) on sale of underlying fund shares | 27,476,679 | |
Capital gain distributions from underlying funds | 7,087,107 | |
Total net realized gain (loss) | | 34,563,786 |
Change in net unrealized appreciation (depreciation) on underlying funds | | 87,936,986 |
Net gain (loss) | | 122,500,772 |
Net increase (decrease) in net assets resulting from operations | | $ 132,670,437 |
See accompanying notes which are an integral part of the financial statements.
Semiannual Report
Fidelity Advisor Freedom 2025 Fund
Financial Statements - continued
Statement of Changes in Net Assets
| Six months ended September 30, 2013 (Unaudited) | Year ended
March 31,
2013 |
Increase (Decrease) in Net Assets | | |
Operations | | |
Net investment income (loss) | $ 10,169,665 | $ 39,243,788 |
Net realized gain (loss) | 34,563,786 | 155,185,524 |
Change in net unrealized appreciation (depreciation) | 87,936,986 | 39,571,192 |
Net increase (decrease) in net assets resulting from operations | 132,670,437 | 234,000,504 |
Distributions to shareholders from net investment income | (4,026,824) | (38,848,941) |
Distributions to shareholders from net realized gain | (85,918,081) | (14,347,444) |
Total distributions | (89,944,905) | (53,196,385) |
Share transactions - net increase (decrease) | 141,682,509 | 370,631,756 |
Total increase (decrease) in net assets | 184,408,041 | 551,435,875 |
| | |
Net Assets | | |
Beginning of period | 2,914,394,969 | 2,362,959,094 |
End of period (including undistributed net investment income of $10,187,795 and undistributed net investment income of $4,044,954, respectively) | $ 3,098,803,010 | $ 2,914,394,969 |
Financial Highlights - Class A
| Six months ended September 30, 2013 | Years ended March 31, |
| (Unaudited) | 2013 | 2012 | 2011 | 2010 | 2009 |
Selected Per-Share Data | | | | | | |
Net asset value, beginning of period | $ 12.72 | $ 11.91 | $ 12.09 | $ 10.76 | $ 7.51 | $ 12.26 |
Income from Investment Operations | | | | | | |
Net investment income (loss) E | .04 | .18 | .18 | .16 | .18 | .23 |
Net realized and unrealized gain (loss) | .52 | .88 | (.01) | 1.43 | 3.32 | (4.36) |
Total from investment operations | .56 | 1.06 | .17 | 1.59 | 3.50 | (4.13) |
Distributions from net investment income | (.02) | (.18) | (.17) | (.16) | (.17) | (.22) |
Distributions from net realized gain | (.37) | (.07) | (.18) | (.11) | (.09) | (.40) |
Total distributions | (.39) | (.25) | (.35) | (.26) I | (.25) H | (.62) |
Net asset value, end of period | $ 12.89 | $ 12.72 | $ 11.91 | $ 12.09 | $ 10.76 | $ 7.51 |
Total Return B, C, D | 4.49% | 9.00% | 1.61% | 14.97% | 46.86% | (34.98)% |
Ratios to Average Net Assets F, G | | | | | | |
Expenses before reductions | .25% A | .25% | .25% | .25% | .25% | .25% |
Expenses net of fee waivers, if any | .25% A | .25% | .25% | .25% | .25% | .25% |
Expenses net of all reductions | .25% A | .25% | .25% | .25% | .25% | .25% |
Net investment income (loss) | .67% A | 1.54% | 1.56% | 1.42% | 1.82% | 2.41% |
Supplemental Data | | | | | | |
Net assets, end of period (000 omitted) | $ 1,863,005 | $ 1,806,028 | $ 1,539,333 | $ 1,290,255 | $ 999,687 | $ 512,482 |
Portfolio turnover rate F | 19% A | 22% | 14% | 34% | 19% | 29% |
A Annualized
B Total returns for periods of less than one year are not annualized.
C Total returns would have been lower if certain expenses had not been reduced during the applicable periods shown.
D Total returns do not include the effect of the sales charges.
E Calculated based on average shares outstanding during the period.
F Amounts do not include the activity of the Underlying Funds.
G Expense ratios reflect operating expenses of the class. Expenses before reductions do not reflect amounts reimbursed by the investment adviser or reductions from expense offset arrangements and do not represent the amount paid by the class during periods when reimbursements or reductions occur. Expenses net of fee waivers reflect expenses after reimbursement by the investment adviser but prior to reductions from expense offset arrangements. Expenses net of all reductions represent the net expenses paid by the class but do not include expenses of the investment companies in which the Fund invests.
H Total distributions of $.25 per share is comprised of distributions from net investment income of $.169 and distributions from net realized gain of $.085 per share.
I Total distributions of $.26 per share is comprised of distributions from net investment income of $.155 and distributions from net realized gain of $.106 per share.
See accompanying notes which are an integral part of the financial statements.
Semiannual Report
Financial Highlights - Class T
| Six months ended September 30, 2013 | Years ended March 31, |
| (Unaudited) | 2013 | 2012 | 2011 | 2010 | 2009 |
Selected Per-Share Data | | | | | | |
Net asset value, beginning of period | $ 12.74 | $ 11.93 | $ 12.11 | $ 10.78 | $ 7.52 | $ 12.28 |
Income from Investment Operations | | | | | | |
Net investment income (loss) E | .03 | .15 | .15 | .13 | .15 | .21 |
Net realized and unrealized gain (loss) | .51 | .88 | (.01) | 1.43 | 3.34 | (4.37) |
Total from investment operations | .54 | 1.03 | .14 | 1.56 | 3.49 | (4.16) |
Distributions from net investment income | (.01) | (.15) | (.14) | (.13) | (.15) | (.20) |
Distributions from net realized gain | (.37) | (.07) | (.18) | (.11) | (.09) | (.40) |
Total distributions | (.38) | (.22) | (.32) | (.23) I | (.23) H | (.60) |
Net asset value, end of period | $ 12.90 | $ 12.74 | $ 11.93 | $ 12.11 | $ 10.78 | $ 7.52 |
Total Return B, C, D | 4.34% | 8.74% | 1.33% | 14.67% | 46.60% | (35.20)% |
Ratios to Average Net Assets F, G | | | | | | |
Expenses before reductions | .50% A | .50% | .50% | .50% | .50% | .50% |
Expenses net of fee waivers, if any | .50% A | .50% | .50% | .50% | .50% | .50% |
Expenses net of all reductions | .50% A | .50% | .50% | .50% | .50% | .50% |
Net investment income (loss) | .42% A | 1.29% | 1.31% | 1.17% | 1.57% | 2.16% |
Supplemental Data | | | | | | |
Net assets, end of period (000 omitted) | $ 360,451 | $ 324,352 | $ 257,594 | $ 258,166 | $ 230,003 | $ 139,330 |
Portfolio turnover rate F | 19% A | 22% | 14% | 34% | 19% | 29% |
A Annualized
B Total returns for periods of less than one year are not annualized.
C Total returns would have been lower if certain expenses had not been reduced during the applicable periods shown.
D Total returns do not include the effect of the sales charges.
E Calculated based on average shares outstanding during the period.
F Amounts do not include the activity of the Underlying Funds.
G Expense ratios reflect operating expenses of the class. Expenses before reductions do not reflect amounts reimbursed by the investment adviser or reductions from expense offset arrangements and do not represent the amount paid by the class during periods when reimbursements or reductions occur. Expenses net of fee waivers reflect expenses after reimbursement by the investment adviser but prior to reductions from expense offset arrangements. Expenses net of all reductions represent the net expenses paid by the class but do not include expenses of the investment companies in which the Fund invests.
H Total distributions of $.23 per share is comprised of distributions from net investment income of $.146 and distributions from net realized gain of $.085 per share.
I Total distributions of $.23 per share is comprised of distributions from net investment income of $.128 and distributions from net realized gain of $.106 per share.
Financial Highlights - Class B
| Six months ended September 30, 2013 | Years ended March 31, |
| (Unaudited) | 2013 | 2012 | 2011 | 2010 | 2009 |
Selected Per-Share Data | | | | | | |
Net asset value, beginning of period | $ 12.66 | $ 11.84 | $ 12.01 | $ 10.70 | $ 7.47 | $ 12.17 |
Income from Investment Operations | | | | | | |
Net investment income (loss) E | - | .09 | .09 | .07 | .10 | .16 |
Net realized and unrealized gain (loss) | .51 | .88 | (.01) | 1.42 | 3.32 | (4.32) |
Total from investment operations | .51 | .97 | .08 | 1.49 | 3.42 | (4.16) |
Distributions from net investment income | - | (.08) | (.08) | (.07) | (.10) | (.14) |
Distributions from net realized gain | (.37) | (.07) | (.17) | (.11) | (.09) | (.40) |
Total distributions | (.37) | (.15) | (.25) | (.18) | (.19) H | (.54) |
Net asset value, end of period | $ 12.80 | $ 12.66 | $ 11.84 | $ 12.01 | $ 10.70 | $ 7.47 |
Total Return B, C, D | 4.08% | 8.26% | .82% | 14.02% | 45.83% | (35.45)% |
Ratios to Average Net Assets F, G | | | | | | |
Expenses before reductions | 1.00% A | 1.00% | 1.00% | 1.00% | 1.00% | 1.00% |
Expenses net of fee waivers, if any | 1.00% A | 1.00% | 1.00% | 1.00% | 1.00% | 1.00% |
Expenses net of all reductions | 1.00% A | 1.00% | 1.00% | 1.00% | 1.00% | 1.00% |
Net investment income (loss) | (.08)% A | .79% | .81% | .67% | 1.07% | 1.66% |
Supplemental Data | | | | | | |
Net assets, end of period (000 omitted) | $ 19,823 | $ 23,061 | $ 29,202 | $ 38,946 | $ 38,816 | $ 27,207 |
Portfolio turnover rate F | 19% A | 22% | 14% | 34% | 19% | 29% |
A Annualized
B Total returns for periods of less than one year are not annualized.
C Total returns would have been lower if certain expenses had not been reduced during the applicable periods shown.
D Total returns do not include the effect of the contingent deferred sales charge.
E Calculated based on average shares outstanding during the period.
F Amounts do not include the activity of the Underlying Funds.
G Expense ratios reflect operating expenses of the class. Expenses before reductions do not reflect amounts reimbursed by the investment adviser or reductions from expense offset arrangements and do not represent the amount paid by the class during periods when reimbursements or reductions occur. Expenses net of fee waivers reflect expenses after reimbursement by the investment adviser but prior to reductions from expense offset arrangements. Expenses net of all reductions represent the net expenses paid by the class but do not include expenses of the investment companies in which the Fund invests.
H Total distributions of $.19 per share is comprised of distributions from net investment income of $.100 and distributions from net realized gain of $.085 per share.
See accompanying notes which are an integral part of the financial statements.
Semiannual Report
Financial Highlights - Class C
| Six months ended September 30, 2013 | Years ended March 31, |
| (Unaudited) | 2013 | 2012 | 2011 | 2010 | 2009 |
Selected Per-Share Data | | | | | | |
Net asset value, beginning of period | $ 12.60 | $ 11.80 | $ 11.98 | $ 10.68 | $ 7.46 | $ 12.16 |
Income from Investment Operations | | | | | | |
Net investment income (loss) E | - | .09 | .09 | .07 | .10 | .16 |
Net realized and unrealized gain (loss) | .50 | .87 | (.01) | 1.41 | 3.31 | (4.32) |
Total from investment operations | .50 | .96 | .08 | 1.48 | 3.41 | (4.16) |
Distributions from net investment income | - | (.10) | (.09) | (.08) | (.11) | (.14) |
Distributions from net realized gain | (.37) | (.07) | (.17) | (.11) | (.09) | (.40) |
Total distributions | (.37) | (.16) J | (.26) | (.18) I | (.19) H | (.54) |
Net asset value, end of period | $ 12.73 | $ 12.60 | $ 11.80 | $ 11.98 | $ 10.68 | $ 7.46 |
Total Return B, C, D | 4.02% | 8.23% | .86% | 14.01% | 45.83% | (35.44)% |
Ratios to Average Net Assets F, G | | | | | | |
Expenses before reductions | 1.00% A | 1.00% | 1.00% | 1.00% | 1.00% | 1.00% |
Expenses net of fee waivers, if any | 1.00% A | 1.00% | 1.00% | 1.00% | 1.00% | 1.00% |
Expenses net of all reductions | 1.00% A | 1.00% | 1.00% | 1.00% | 1.00% | 1.00% |
Net investment income (loss) | (.08)% A | .79% | .81% | .67% | 1.07% | 1.66% |
Supplemental Data | | | | | | |
Net assets, end of period (000 omitted) | $ 81,403 | $ 74,415 | $ 66,126 | $ 61,640 | $ 52,756 | $ 31,735 |
Portfolio turnover rate F | 19% A | 22% | 14% | 34% | 19% | 29% |
A Annualized
B Total returns for periods of less than one year are not annualized.
C Total returns would have been lower if certain expenses had not been reduced during the applicable periods shown.
D Total returns do not include the effect of the contingent deferred sales charge.
E Calculated based on average shares outstanding during the period.
F Amounts do not include the activity of the Underlying Funds.
G Expense ratios reflect operating expenses of the class. Expenses before reductions do not reflect amounts reimbursed by the investment adviser or reductions from expense offset arrangements and do not represent the amount paid by the class during periods when reimbursements or reductions occur. Expenses net of fee waivers reflect expenses after reimbursement by the investment adviser but prior to reductions from expense offset arrangements. Expenses net of all reductions represent the net expenses paid by the class but do not include expenses of the investment companies in which the Fund invests.
H Total distributions of $.19 per share is comprised of distributions from net investment income of $.105 and distributions from net realized gain of $.085 per share.
I Total distributions of $.18 per share is comprised of distributions from net investment income of $.077 and distributions from net realized gain of $.106 per share.
J Total distributions of $.16 per share is comprised of distributions from net investment income of $.096 and distributions from net realized gain of $.066 per share.
Financial Highlights - Institutional Class
| Six months ended September 30, 2013 | Years ended March 31, |
| (Unaudited) | 2013 | 2012 | 2011 | 2010 | 2009 |
Selected Per-Share Data | | | | | | |
Net asset value, beginning of period | $ 12.81 | $ 11.99 | $ 12.17 | $ 10.83 | $ 7.55 | $ 12.33 |
Income from Investment Operations | | | | | | |
Net investment income (loss) D | .06 | .22 | .21 | .19 | .20 | .26 |
Net realized and unrealized gain (loss) | .52 | .88 | (.02) | 1.44 | 3.35 | (4.39) |
Total from investment operations | .58 | 1.10 | .19 | 1.63 | 3.55 | (4.13) |
Distributions from net investment income | (.03) | (.21) | (.20) | (.18) | (.19) | (.25) |
Distributions from net realized gain | (.37) | (.07) | (.18) | (.11) | (.09) | (.40) |
Total distributions | (.40) | (.28) | (.37) G | (.29) | (.27) H | (.65) |
Net asset value, end of period | $ 12.99 | $ 12.81 | $ 11.99 | $ 12.17 | $ 10.83 | $ 7.55 |
Total Return B, C | 4.60% | 9.29% | 1.84% | 15.23% | 47.31% | (34.83)% |
Ratios to Average Net Assets E, F | | | | | | |
Expenses before reductions I | .00% A | .00% | .00% | .00% | .00% | .00% |
Expenses net of fee waivers, if any | .00% A | .00% | .00% | .00% | .00% | .00% |
Expenses net of all reductions | .00% A | .00% | .00% | .00% | .00% | .00% |
Net investment income (loss) | .92% A | 1.79% | 1.81% | 1.67% | 2.07% | 2.66% |
Supplemental Data | | | | | | |
Net assets, end of period (000 omitted) | $ 774,121 | $ 686,540 | $ 470,704 | $ 284,309 | $ 140,948 | $ 69,731 |
Portfolio turnover rate E | 19% A | 22% | 14% | 34% | 19% | 29% |
A Annualized
B Total returns for periods of less than one year are not annualized.
C Total returns would have been lower if certain expenses had not been reduced during the applicable periods shown.
D Calculated based on average shares outstanding during the period.
E Amounts do not include the activity of the Underlying Funds.
F Expense ratios reflect operating expenses of the class. Expenses before reductions do not reflect amounts reimbursed by the investment adviser or reductions from expense offset arrangements and do not represent the amount paid by the class during periods when reimbursements or reductions occur. Expenses net of fee waivers reflect expenses after reimbursement by the investment adviser but prior to reductions from expense offset arrangements. Expenses net of all reductions represent the net expenses paid by the class but do not include expenses of the investment companies in which the Fund invests.
G Total distributions of $.37 per share is comprised of distributions from net investment income of $.195 and distributions from net realized gain of $.179 per share.
H Total distributions of $.27 per share is comprised of distributions from net investment income of $.189 and distributions from net realized gain of $.085 per share.
I Amount represents less than .01%.
See accompanying notes which are an integral part of the financial statements.
Semiannual Report
Fidelity Advisor Freedom 2030 Fund
Investment Changes (Unaudited)
The information in the following tables is based on the direct investments of the Fund. |
Fund Holdings as of September 30, 2013 |
| % of fund's
net assets | % of fund's net assets
6 months ago |
Commodity Funds | | |
Fidelity Series Commodity Strategy Fund | 7.5 | 7.6 |
Domestic Equity Funds | | |
Fidelity Advisor Equity Growth Fund Institutional Class | 6.3 | 6.1 |
Fidelity Advisor Growth & Income Fund Institutional Class | 0.0 | 3.2 |
Fidelity Advisor Large Cap Fund Institutional Class | 3.1 | 3.3 |
Fidelity Advisor Series Equity-Income Fund | 4.3 | 4.3 |
Fidelity Advisor Series Growth & Income Fund (formerly Fidelity Advisor Series Mega Cap Fund) | 4.1 | 0.9 |
Fidelity Advisor Series Opportunistic Insights Fund | 3.2 | 3.0 |
Fidelity Advisor Series Stock Selector Large Cap Value Fund | 4.2 | 4.3 |
Fidelity Advisor Small Cap Fund Institutional Class | 2.5 | 2.5 |
Fidelity Series 100 Index Fund | 1.0 | 1.0 |
Fidelity Series All-Sector Equity Fund | 7.8 | 8.1 |
Fidelity Series Large Cap Value Fund | 4.2 | 4.5 |
Fidelity Series Real Estate Equity Fund | 0.6 | 0.7 |
Fidelity Series Small Cap Opportunities Fund | 2.8 | 2.9 |
| 44.1 | 44.8 |
Developed International Equity Funds | | |
Fidelity Series International Growth Fund | 6.8 | 6.7 |
Fidelity Series International Small Cap Fund | 1.5 | 1.4 |
Fidelity Series International Value Fund | 6.9 | 6.6 |
| 15.2 | 14.7 |
Emerging Markets Equity Funds | | |
Fidelity Series Emerging Markets Fund | 4.1 | 4.0 |
High Yield Bond Funds | | |
Fidelity Series Emerging Markets Debt Fund | 0.7 | 0.7 |
Fidelity Series Floating Rate High Income Fund | 0.8 | 0.8 |
Fidelity Series High Income Fund | 6.9 | 7.0 |
Fidelity Series Real Estate Income Fund | 0.5 | 0.5 |
| 8.9 | 9.0 |
Inflation-Protected Bond Funds | | |
Fidelity Series Inflation-Protected Bond Index Fund | 2.8 | 2.5 |
Investment Grade Bond Funds | | |
Fidelity Series Investment Grade Bond Fund | 17.4 | 17.4 |
Net Other Assets (Liabilities)* | 0.0 | 0.0 |
| 100.0 | 100.0 |
* Amount represents less than 0.1% |
Asset Allocation (% of fund's net assets) |
Period end |
| Commodity Funds | 7.5% | |
| Domestic Equity Funds | 44.1% | |
| Developed International Equity Funds | 15.2% | |
| Emerging Markets Equity Funds | 4.1% | |
| High Yield Bond Funds | 8.9% | |
 | Inflation-Protected Bond Funds | 2.8% | |
| Investment Grade Bond Funds | 17.4% | |

Six months ago |
| Commodity Funds | 7.6% | |
| Domestic Equity Funds | 44.8% | |
| Developed International Equity Funds | 14.7% | |
| Emerging Markets Equity Funds | 4.0% | |
| High Yield Bond Funds | 9.0% | |
| Inflation-Protected Bond Funds | 2.5% | |
| Investment Grade Bond Funds | 17.4% | |

Semiannual Report
Fidelity Advisor Freedom 2030 Fund
Investments September 30, 2013 (Unaudited)
Showing Percentage of Net Assets
Domestic Equity Funds - 51.6% |
| Shares | | Value |
Commodity Funds - 7.5% |
Fidelity Series Commodity Strategy Fund (a)(b) | 28,975,224 | | $ 232,091,547 |
Domestic Equity Funds - 44.1% |
Fidelity Advisor Equity Growth Fund Institutional Class (b) | 2,377,009 | | 195,580,280 |
Fidelity Advisor Large Cap Fund Institutional Class (b) | 3,595,198 | | 96,710,834 |
Fidelity Advisor Series Equity-Income Fund (b) | 11,183,659 | | 131,855,340 |
Fidelity Advisor Series Growth & Income Fund (b) | 10,600,377 | | 127,734,539 |
Fidelity Advisor Series Opportunistic Insights Fund (b) | 7,776,341 | | 100,159,270 |
Fidelity Advisor Series Stock Selector Large Cap Value Fund (b) | 10,789,087 | | 131,303,185 |
Fidelity Advisor Small Cap Fund Institutional Class (b) | 2,500,821 | | 76,225,036 |
Fidelity Series 100 Index Fund (b) | 2,731,861 | | 30,269,015 |
Fidelity Series All-Sector Equity Fund (b) | 17,104,519 | | 242,199,989 |
Fidelity Series Large Cap Value Fund (b) | 10,235,257 | | 129,271,292 |
Fidelity Series Real Estate Equity Fund (b) | 1,589,936 | | 19,015,639 |
Fidelity Series Small Cap Opportunities Fund (b) | 6,808,852 | | 87,357,575 |
TOTAL DOMESTIC EQUITY FUNDS | | 1,367,681,994 |
TOTAL DOMESTIC EQUITY FUNDS (Cost $1,371,195,378) |
1,599,773,541
|
International Equity Funds - 19.3% |
| | | |
Developed International Equity Funds - 15.2% |
Fidelity Series International Growth Fund (b) | 15,584,587 | | 211,482,850 |
Fidelity Series International Small Cap Fund (b) | 2,923,398 | | 44,698,758 |
Fidelity Series International Value Fund (b) | 19,891,244 | | 213,830,870 |
TOTAL DEVELOPED INTERNATIONAL EQUITY FUNDS | | 470,012,478 |
|
| Shares | | Value |
Emerging Markets Equity Funds - 4.1% |
Fidelity Series Emerging Markets Fund (b) | 7,661,864 | | $ 128,259,602 |
TOTAL INTERNATIONAL EQUITY FUNDS (Cost $499,161,649) |
598,272,080
|
Bond Funds - 29.1% |
| | | |
High Yield Bond Funds - 8.9% |
Fidelity Series Emerging Markets Debt Fund (b) | 2,072,515 | | 20,973,849 |
Fidelity Series Floating Rate High Income Fund (b) | 2,437,457 | | 25,788,290 |
Fidelity Series High Income Fund (b) | 20,958,298 | | 215,451,298 |
Fidelity Series Real Estate Income Fund (b) | 1,295,521 | | 14,224,825 |
TOTAL HIGH YIELD BOND FUNDS | | 276,438,262 |
Inflation-Protected Bond Funds - 2.8% |
Fidelity Series Inflation-Protected Bond Index Fund (b) | 7,979,880 | | 86,581,695 |
Investment Grade Bond Funds - 17.4% |
Fidelity Series Investment Grade Bond Fund (b) | 48,113,276 | | 538,387,562 |
TOTAL BOND FUNDS (Cost $910,867,118) |
901,407,519
|
TOTAL INVESTMENT PORTFOLIO - 100.0% (Cost $2,781,224,145) | | 3,099,453,140 |
NET OTHER ASSETS (LIABILITIES) - 0.0% | | (630,402) |
NET ASSETS - 100% | $ 3,098,822,738 |
Legend |
(a) Non-income producing |
(b) Affiliated company |
Affiliated Underlying Funds |
Information regarding the Fund's fiscal year to date purchases and sales of the affiliated Underlying Funds and income earned by the Fund from investments in affiliated Underlying Funds is as follows: |
Affiliate | Value,
beginning of
period | Purchases | Sales
Proceeds | Dividend
Income | Value,
end of
period |
Fidelity Advisor Equity Growth Fund Institutional Class | $ 179,689,389 | $ 5,009,988 | $ 17,007,461 | $ - | $ 195,580,280 |
Fidelity Advisor Growth & Income Fund Institutional Class | 95,214,795 | 1,721,067 | 105,161,542 | - | - |
Fidelity Advisor Large Cap Fund Institutional Class | 96,135,812 | 1,932,033 | 13,534,730 | - | 96,710,834 |
Fidelity Advisor Series Equity-Income Fund | 126,635,001 | 7,144,827 | 9,381,815 | 1,267,414 | 131,855,340 |
Fidelity Advisor Series Growth & Income Fund (formerly Fidelity Advisor Series Mega Cap Fund) | 28,043,155 | 99,122,498 | 3,282,781 | - | 127,734,539 |
Fidelity Advisor Series Opportunistic Insights Fund | 89,481,574 | 2,851,791 | 6,995,824 | - | 100,159,270 |
Fidelity Advisor Series Stock Selector Large Cap Value Fund | 127,546,729 | 3,620,602 | 10,814,047 | - | 131,303,185 |
Fidelity Advisor Small Cap Fund Institutional Class | 73,801,869 | 1,952,069 | 8,731,112 | - | 76,225,036 |
Fidelity Series 100 Index Fund | 29,526,733 | 818,069 | 2,213,369 | - | 30,269,015 |
Fidelity Series All-Sector Equity Fund | 237,970,708 | 4,917,889 | 24,148,249 | - | 242,199,989 |
Fidelity Series Commodity Strategy Fund | 223,024,825 | 37,591,168 | 10,541,772 | - | 232,091,547 |
Fidelity Series Emerging Markets Debt Fund | 21,567,139 | 1,902,033 | 962,395 | 556,496 | 20,973,849 |
Fidelity Series Emerging Markets Fund | 119,091,201 | 12,669,407 | 4,034,040 | - | 128,259,602 |
Fidelity Series Floating Rate High Income Fund | 24,857,076 | 2,142,112 | 1,092,251 | 551,251 | 25,788,290 |
Fidelity Series High Income Fund | 206,384,861 | 20,566,917 | 6,903,497 | 5,521,358 | 215,451,298 |
Fidelity Series Inflation-Protected Bond Index Fund | 75,072,305 | 18,319,668 | 2,935,847 | - | 86,581,695 |
Fidelity Series International Growth Fund | 197,193,583 | 7,963,982 | 8,074,461 | - | 211,482,850 |
Fidelity Series International Small Cap Fund | 40,156,611 | 1,547,602 | 1,614,199 | | 44,698,758 |
Fidelity Series International Value Fund | 195,575,080 | 7,748,390 | 8,074,461 | - | 213,830,870 |
Fidelity Series Investment Grade Bond Fund | 513,272,085 | 62,232,003 | 21,427,599 | 5,476,245 | 538,387,562 |
Fidelity Series Large Cap Value Fund | 134,229,504 | 2,666,426 | 18,714,617 | - | 129,271,292 |
Fidelity Series Real Estate Equity Fund | 19,848,733 | 1,738,061 | 987,812 | 127,968 | 19,015,639 |
Fidelity Series Real Estate Income Fund | 14,357,770 | 1,331,535 | 608,514 | 419,976 | 14,224,825 |
Fidelity Series Small Cap Opportunities Fund | 85,867,813 | 8,603,697 | 10,887,961 | - | 87,357,575 |
Total | $ 2,954,544,351 | $ 316,113,834 | $ 298,130,356 | $ 13,920,708 | $ 3,099,453,140 |
Other Information |
All investments are categorized as level 1 under the Fair Value Hierarchy. The inputs or methodology used for valuing securities may not be an indication of the risk associated with investing in those securities. For more information on valuation inputs, please refer to the Investment Valuation section in the accompanying Notes to Financial Statements. |
See accompanying notes which are an integral part of the financial statements.
Semiannual Report
Fidelity Advisor Freedom 2030 Fund
Statement of Assets and Liabilities
| September 30, 2013 (Unaudited) |
| | |
Assets | | |
Investment in securities, at value (cost $2,781,224,145) - See accompanying schedule | | $ 3,099,453,140 |
Cash | | 5 |
Receivable for investments sold | | 6,752,214 |
Receivable for fund shares sold | | 2,458,053 |
Receivable from investment adviser for expense reductions | | 579 |
Total assets | | 3,108,663,991 |
| | |
Liabilities | | |
Payable for investments purchased | $ 84,252 | |
Payable for fund shares redeemed | 9,126,076 | |
Distribution and service plan fees payable | 630,925 | |
Total liabilities | | 9,841,253 |
| | |
Net Assets | | $ 3,098,822,738 |
Net Assets consist of: | | |
Paid in capital | | $ 2,738,206,303 |
Undistributed net investment income | | 10,239,960 |
Accumulated undistributed net realized gain (loss) on investments | | 32,147,480 |
Net unrealized appreciation (depreciation) on investments | | 318,228,995 |
Net Assets | | $ 3,098,822,738 |
| | |
Calculation of Maximum Offering Price Class A:
Net Asset Value and redemption price per share ($1,777,075,691 ÷ 130,214,140 shares) | | $ 13.65 |
| | |
Maximum offering price per share (100/94.25 of $13.65) | | $ 14.48 |
Class T:
Net Asset Value and redemption price per share ($419,864,430 ÷ 30,877,104 shares) | | $ 13.60 |
| | |
Maximum offering price per share (100/96.50 of $13.60) | | $ 14.09 |
Class B:
Net Asset Value and offering price per share ($23,946,769 ÷ 1,767,301 shares)A | | $ 13.55 |
| | |
Class C:
Net Asset Value and offering price per share ($80,607,700 ÷ 5,976,351 shares)A | | $ 13.49 |
| | |
Institutional Class:
Net Asset Value, offering price and redemption price per share ($797,328,148 ÷ 58,101,566 shares) | | $ 13.72 |
A Redemption price per share is equal to net asset value less any applicable contingent deferred sales charge.
Statement of Operations
Six months ended September 30, 2013 (Unaudited) |
| | |
Investment Income | | |
Income distributions from underlying funds | | $ 13,920,708 |
| | |
Expenses | | |
Distribution and service plan fees | $ 3,739,074 | |
Independent trustees' compensation | 5,602 | |
Total expenses before reductions | 3,744,676 | |
Expense reductions | (5,602) | 3,739,074 |
Net investment income (loss) | | 10,181,634 |
Realized and Unrealized Gain (Loss) Realized gain (loss) on sale of underlying fund shares | 30,003,696 | |
Capital gain distributions from underlying funds | 7,456,678 | |
Total net realized gain (loss) | | 37,460,374 |
Change in net unrealized appreciation (depreciation) on underlying funds | | 96,921,607 |
Net gain (loss) | | 134,381,981 |
Net increase (decrease) in net assets resulting from operations | | $ 144,563,615 |
See accompanying notes which are an integral part of the financial statements.
Semiannual Report
Fidelity Advisor Freedom 2030 Fund
Financial Statements - continued
Statement of Changes in Net Assets
| Six months ended
September 30, 2013
(Unaudited) | Year ended
March 31,
2013 |
Increase (Decrease) in Net Assets | | |
Operations | | |
Net investment income (loss) | $ 10,181,634 | $ 41,214,791 |
Net realized gain (loss) | 37,460,374 | 166,007,236 |
Change in net unrealized appreciation (depreciation) | 96,921,607 | 37,190,757 |
Net increase (decrease) in net assets resulting from operations | 144,563,615 | 244,412,784 |
Distributions to shareholders from net investment income | (4,039,445) | (40,765,226) |
Distributions to shareholders from net realized gain | (74,728,489) | (13,074,704) |
Total distributions | (78,767,934) | (53,839,930) |
Share transactions - net increase (decrease) | 79,086,543 | 314,631,239 |
Total increase (decrease) in net assets | 144,882,224 | 505,204,093 |
| | |
Net Assets | | |
Beginning of period | 2,953,940,514 | 2,448,736,421 |
End of period (including undistributed net investment income of $10,239,960 and undistributed net investment income of $4,097,771, respectively) | $ 3,098,822,738 | $ 2,953,940,514 |
Financial Highlights - Class A
| Six months ended September 30, 2013 | Years ended March 31, |
| (Unaudited) | 2013 | 2012 | 2011 | 2010 | 2009 |
Selected Per-Share Data | | | | | | |
Net asset value, beginning of period | $ 13.36 | $ 12.48 | $ 12.72 | $ 11.29 | $ 7.69 | $ 13.29 |
Income from Investment Operations | | | | | | |
Net investment income (loss) E | .04 | .20 | .19 | .16 | .16 | .21 |
Net realized and unrealized gain (loss) | .61 | .94 | (.06) | 1.54 | 3.68 | (5.10) |
Total from investment operations | .65 | 1.14 | .13 | 1.70 | 3.84 | (4.89) |
Distributions from net investment income | (.02) | (.20) | (.18) | (.16) | (.15) | (.21) |
Distributions from net realized gain | (.34) | (.06) | (.19) | (.11) | (.09) | (.50) |
Total distributions | (.36) | (.26) | (.37) | (.27) | (.24) H | (.71) |
Net asset value, end of period | $ 13.65 | $ 13.36 | $ 12.48 | $ 12.72 | $ 11.29 | $ 7.69 |
Total Return B, C, D | 4.91% | 9.25% | 1.25% | 15.27% | 50.17% | (38.49)% |
Ratios to Average Net Assets F, G | | | | | | |
Expenses before reductions | .25% A | .25% | .25% | .25% | .25% | .25% |
Expenses net of fee waivers, if any | .25% A | .25% | .25% | .25% | .25% | .25% |
Expenses net of all reductions | .25% A | .25% | .25% | .25% | .25% | .25% |
Net investment income (loss) | .67% A | 1.58% | 1.57% | 1.38% | 1.61% | 2.08% |
Supplemental Data | | | | | | |
Net assets, end of period (000 omitted) | $ 1,777,076 | $ 1,747,549 | $ 1,506,827 | $ 1,340,583 | $ 1,030,972 | $ 527,042 |
Portfolio turnover rate F | 20% A | 23% | 16% | 38% | 20% | 22% |
A Annualized
B Total returns for periods of less than one year are not annualized.
C Total returns would have been lower if certain expenses had not been reduced during the applicable periods shown.
D Total returns do not include the effect of the sales charges.
E Calculated based on average shares outstanding during the period.
F Amounts do not include the activity of the Underlying Funds.
G Expense ratios reflect operating expenses of the class. Expenses before reductions do not reflect amounts reimbursed by the investment adviser or reductions from expense offset arrangements and do not represent the amount paid by the class during periods when reimbursements or reductions occur. Expenses net of fee waivers reflect expenses after reimbursement by the investment adviser but prior to reductions from expense offset arrangements. Expenses net of all reductions represent the net expenses paid by the class but do not include expenses of the investment companies in which the Fund invests.
H Total distributions of $.24 per share is comprised of distributions from net investment income of $.151 and distributions from net realized gain of $.093 per share.
See accompanying notes which are an integral part of the financial statements.
Semiannual Report
Financial Highlights - Class T
| Six months ended September 30, 2013 | Years ended March 31, |
| (Unaudited) | 2013 | 2012 | 2011 | 2010 | 2009 |
Selected Per-Share Data | | | | | | |
Net asset value, beginning of period | $ 13.32 | $ 12.44 | $ 12.68 | $ 11.25 | $ 7.67 | $ 13.25 |
Income from Investment Operations | | | | | | |
Net investment income (loss) E | .03 | .17 | .16 | .13 | .14 | .19 |
Net realized and unrealized gain (loss) | .60 | .94 | (.06) | 1.54 | 3.66 | (5.09) |
Total from investment operations | .63 | 1.11 | .10 | 1.67 | 3.80 | (4.90) |
Distributions from net investment income | (.01) | (.17) | (.15) | (.13) | (.13) | (.18) |
Distributions from net realized gain | (.34) | (.06) | (.19) | (.11) | (.09) | (.50) |
Total distributions | (.35) | (.23) | (.34) | (.24) | (.22) H | (.68) |
Net asset value, end of period | $ 13.60 | $ 13.32 | $ 12.44 | $ 12.68 | $ 11.25 | $ 7.67 |
Total Return B, C, D | 4.79% | 9.02% | .98% | 14.98% | 49.72% | (38.62)% |
Ratios to Average Net Assets F, G | | | | | | |
Expenses before reductions | .50% A | .50% | .50% | .50% | .50% | .50% |
Expenses net of fee waivers, if any | .50% A | .50% | .50% | .50% | .50% | .50% |
Expenses net of all reductions | .50% A | .50% | .50% | .50% | .50% | .50% |
Net investment income (loss) | .42% A | 1.33% | 1.32% | 1.12% | 1.36% | 1.83% |
Supplemental Data | | | | | | |
Net assets, end of period (000 omitted) | $ 419,864 | $ 387,102 | $ 335,407 | $ 348,443 | $ 382,092 | $ 236,333 |
Portfolio turnover rate F | 20% A | 23% | 16% | 38% | 20% | 22% |
A Annualized
B Total returns for periods of less than one year are not annualized.
C Total returns would have been lower if certain expenses had not been reduced during the applicable periods shown.
D Total returns do not include the effect of the sales charges.
E Calculated based on average shares outstanding during the period.
F Amounts do not include the activity of the Underlying Funds.
G Expense ratios reflect operating expenses of the class. Expenses before reductions do not reflect amounts reimbursed by the investment adviser or reductions from expense offset arrangements and do not represent the amount paid by the class during periods when reimbursements or reductions occur. Expenses net of fee waivers reflect expenses after reimbursement by the investment adviser but prior to reductions from expense offset arrangements. Expenses net of all reductions represent the net expenses paid by the class but do not include expenses of the investment companies in which the Fund invests.
H Total distributions of $.22 per share is comprised of distributions from net investment income of $.128 and distributions from net realized gain of $.093 per share.
Financial Highlights - Class B
| Six months ended September 30, 2013 | Years ended March 31, |
| (Unaudited) | 2013 | 2012 | 2011 | 2010 | 2009 |
Selected Per-Share Data | | | | | | |
Net asset value, beginning of period | $ 13.29 | $ 12.41 | $ 12.63 | $ 11.21 | $ 7.64 | $ 13.17 |
Income from Investment Operations | | | | | | |
Net investment income (loss) E | (.01) | .10 | .10 | .07 | .09 | .14 |
Net realized and unrealized gain (loss) | .60 | .94 | (.06) | 1.53 | 3.65 | (5.06) |
Total from investment operations | .59 | 1.04 | .04 | 1.60 | 3.74 | (4.92) |
Distributions from net investment income | - | (.10) | (.08) | (.07) | (.08) | (.11) |
Distributions from net realized gain | (.33) | (.06) | (.18) | (.11) | (.09) | (.50) |
Total distributions | (.33) | (.16) | (.26) | (.18) | (.17) H | (.61) |
Net asset value, end of period | $ 13.55 | $ 13.29 | $ 12.41 | $ 12.63 | $ 11.21 | $ 7.64 |
Total Return B, C, D | 4.51% | 8.44% | .52% | 14.38% | 49.07% | (38.94)% |
Ratios to Average Net Assets F, G | | | | | | |
Expenses before reductions | 1.00% A | 1.00% | 1.00% | 1.00% | 1.00% | 1.00% |
Expenses net of fee waivers, if any | 1.00% A | 1.00% | 1.00% | 1.00% | 1.00% | 1.00% |
Expenses net of all reductions | 1.00% A | 1.00% | 1.00% | 1.00% | 1.00% | 1.00% |
Net investment income (loss) | (.08)% A | .83% | .82% | .62% | .86% | 1.33% |
Supplemental Data | | | | | | |
Net assets, end of period (000 omitted) | $ 23,947 | $ 27,191 | $ 34,324 | $ 47,275 | $ 51,360 | $ 35,701 |
Portfolio turnover rate F | 20% A | 23% | 16% | 38% | 20% | 22% |
A Annualized
B Total returns for periods of less than one year are not annualized.
C Total returns would have been lower if certain expenses had not been reduced during the applicable periods shown.
D Total returns do not include the effect of the contingent deferred sales charge.
E Calculated based on average shares outstanding during the period.
F Amounts do not include the activity of the Underlying Funds.
G Expense ratios reflect operating expenses of the class. Expenses before reductions do not reflect amounts reimbursed by the investment adviser or reductions from expense offset arrangements and do not represent the amount paid by the class during periods when reimbursements or reductions occur. Expenses net of fee waivers reflect expenses after reimbursement by the investment adviser but prior to reductions from expense offset arrangements. Expenses net of all reductions represent the net expenses paid by the class but do not include expenses of the investment companies in which the Fund invests.
H Total distributions of $.17 per share is comprised of distributions from net investment income of $.080 and distributions from net realized gain of $.092 per share.
See accompanying notes which are an integral part of the financial statements.
Semiannual Report
Financial Highlights - Class C
| Six months ended September 30, 2013 | Years ended March 31, |
| (Unaudited) | 2013 | 2012 | 2011 | 2010 | 2009 |
Selected Per-Share Data | | | | | | |
Net asset value, beginning of period | $ 13.23 | $ 12.37 | $ 12.60 | $ 11.19 | $ 7.63 | $ 13.17 |
Income from Investment Operations | | | | | | |
Net investment income (loss) E | (.01) | .10 | .10 | .07 | .09 | .14 |
Net realized and unrealized gain (loss) | .60 | .93 | (.05) | 1.53 | 3.65 | (5.06) |
Total from investment operations | .59 | 1.03 | .05 | 1.60 | 3.74 | (4.92) |
Distributions from net investment income | - | (.11) | (.09) | (.08) | (.08) | (.12) |
Distributions from net realized gain | (.33) | (.06) | (.18) | (.11) | (.09) | (.50) |
Total distributions | (.33) | (.17) | (.28) I | (.19) | (.18) H | (.62) |
Net asset value, end of period | $ 13.49 | $ 13.23 | $ 12.37 | $ 12.60 | $ 11.19 | $ 7.63 |
Total Return B, C, D | 4.53% | 8.39% | .55% | 14.38% | 49.06% | (38.96)% |
Ratios to Average Net Assets F, G | | | | | | |
Expenses before reductions | 1.00% A | 1.00% | 1.00% | 1.00% | 1.00% | 1.00% |
Expenses net of fee waivers, if any | 1.00% A | 1.00% | 1.00% | 1.00% | 1.00% | 1.00% |
Expenses net of all reductions | 1.00% A | 1.00% | 1.00% | 1.00% | 1.00% | 1.00% |
Net investment income (loss) | (.08)% A | .83% | .82% | .63% | .86% | 1.33% |
Supplemental Data | | | | | | |
Net assets, end of period (000 omitted) | $ 80,608 | $ 75,384 | $ 66,418 | $ 68,349 | $ 63,700 | $ 40,294 |
Portfolio turnover rate F | 20% A | 23% | 16% | 38% | 20% | 22% |
A Annualized
B Total returns for periods of less than one year are not annualized.
C Total returns would have been lower if certain expenses had not been reduced during the applicable periods shown.
D Total returns do not include the effect of the contingent deferred sales charge.
E Calculated based on average shares outstanding during the period.
F Amounts do not include the activity of the Underlying Funds.
G Expense ratios reflect operating expenses of the class. Expenses before reductions do not reflect amounts reimbursed by the investment adviser or reductions from expense offset arrangements and do not represent the amount paid by the class during periods when reimbursements or reductions occur. Expenses net of fee waivers reflect expenses after reimbursement by the investment adviser but prior to reductions from expense offset arrangements. Expenses net of all reductions represent the net expenses paid by the class but do not include expenses of the investment companies in which the Fund invests.
H Total distributions of $.18 per share is comprised of distributions from net investment income of $.083 and distributions from net realized gain of $.093 per share.
I Total distributions of $.28 per share is comprised of distributions from net investment income of $.094 and distributions from net realized gain of $.182 per share.
Financial Highlights - Institutional Class
| Six months ended September 30, 2013 | Years ended March 31, |
| (Unaudited) | 2013 | 2012 | 2011 | 2010 | 2009 |
Selected Per-Share Data | | | | | | |
Net asset value, beginning of period | $ 13.42 | $ 12.54 | $ 12.77 | $ 11.33 | $ 7.72 | $ 13.34 |
Income from Investment Operations | | | | | | |
Net investment income (loss) D | .06 | .23 | .22 | .19 | .19 | .23 |
Net realized and unrealized gain (loss) | .60 | .94 | (.05) | 1.55 | 3.69 | (5.11) |
Total from investment operations | .66 | 1.17 | .17 | 1.74 | 3.88 | (4.88) |
Distributions from net investment income | (.03) | (.23) | (.21) | (.19) | (.17) | (.24) |
Distributions from net realized gain | (.34) | (.06) | (.19) | (.11) | (.09) | (.50) |
Total distributions | (.36) H | (.29) | (.40) | (.30) | (.27) G | (.74) |
Net asset value, end of period | $ 13.72 | $ 13.42 | $ 12.54 | $ 12.77 | $ 11.33 | $ 7.72 |
Total Return B, C | 5.03% | 9.47% | 1.57% | 15.56% | 50.42% | (38.31)% |
Ratios to Average Net Assets E, F | | | | | | |
Expenses before reductions I | .00% A | .00% | .00% | .00% | .00% | .00% |
Expenses net of fee waivers, if any | .00% A | .00% | .00% | .00% | .00% | .00% |
Expenses net of all reductions | .00% A | .00% | .00% | .00% | .00% | .00% |
Net investment income (loss) | .92% A | 1.83% | 1.82% | 1.62% | 1.86% | 2.33% |
Supplemental Data | | | | | | |
Net assets, end of period (000 omitted) | $ 797,328 | $ 716,715 | $ 505,761 | $ 321,529 | $ 178,232 | $ 82,534 |
Portfolio turnover rate E | 20% A | 23% | 16% | 38% | 20% | 22% |
A Annualized
B Total returns for periods of less than one year are not annualized.
C Total returns would have been lower if certain expenses had not been reduced during the applicable periods shown.
D Calculated based on average shares outstanding during the period.
E Amounts do not include the activity of the Underlying Funds.
F Expense ratios reflect operating expenses of the class. Expenses before reductions do not reflect amounts reimbursed by the investment adviser or reductions from expense offset arrangements and do not represent the amount paid by the class during periods when reimbursements or reductions occur. Expenses net of fee waivers reflect expenses after reimbursement by the investment adviser but prior to reductions from expense offset arrangements. Expenses net of all reductions represent the net expenses paid by the class but do not include expenses of the investment companies in which the Fund invests.
G Total distributions of $.27 per share is comprised of distributions from net investment income of $.173 and distributions from net realized gain of $.093 per share.
H Total distributions of $.36 per share is comprised of distributions from net investment income of $.026 and distributions from net realized gain of $.338 per share.
I Amount represents less than 0.1%
See accompanying notes which are an integral part of the financial statements.
Semiannual Report
Fidelity Advisor Freedom 2035 Fund
Investment Changes (Unaudited)
The information in the following tables is based on the direct investments of the Fund. |
Fund Holdings as of September 30, 2013 |
| % of fund's
net assets | % of fund's net assets
6 months ago |
Commodity Funds | | |
Fidelity Series Commodity Strategy Fund | 8.7 | 8.7 |
Domestic Equity Funds | | |
Fidelity Advisor Equity Growth Fund Institutional Class | 7.2 | 7.0 |
Fidelity Advisor Growth & Income Fund Institutional Class | 0.0 | 3.7 |
Fidelity Advisor Large Cap Fund Institutional Class | 3.6 | 3.8 |
Fidelity Advisor Series Equity-Income Fund | 4.8 | 4.9 |
Fidelity Advisor Series Growth & Income Fund (formerly Fidelity Advisor Series Mega Cap Fund) | 4.7 | 1.1 |
Fidelity Advisor Series Opportunistic Insights Fund | 3.7 | 3.4 |
Fidelity Advisor Series Stock Selector Large Cap Value Fund | 4.8 | 4.9 |
Fidelity Advisor Small Cap Fund Institutional Class | 2.8 | 2.9 |
Fidelity Series 100 Index Fund | 1.1 | 1.1 |
Fidelity Series All-Sector Equity Fund | 9.0 | 9.3 |
Fidelity Series Large Cap Value Fund | 4.8 | 5.3 |
Fidelity Series Real Estate Equity Fund | 0.7 | 0.8 |
Fidelity Series Small Cap Opportunities Fund | 3.2 | 3.3 |
| 50.4 | 51.5 |
Developed International Equity Funds | | |
Fidelity Series International Growth Fund | 7.8 | 7.6 |
Fidelity Series International Small Cap Fund | 1.6 | 1.6 |
Fidelity Series International Value Fund | 7.9 | 7.6 |
| 17.3 | 16.8 |
Emerging Markets Equity Funds | | |
Fidelity Series Emerging Markets Fund | 4.8 | 4.6 |
High Yield Bond Funds | | |
Fidelity Series Emerging Markets Debt Fund | 0.7 | 0.7 |
Fidelity Series Floating Rate High Income Fund | 0.7 | 0.8 |
Fidelity Series High Income Fund | 6.9 | 6.9 |
Fidelity Series Real Estate Income Fund | 0.4 | 0.4 |
| 8.7 | 8.8 |
Inflation-Protected Bond Funds | | |
Fidelity Series Inflation-Protected Bond Index Fund | 0.0* | 0.0 |
Investment Grade Bond Funds | | |
Fidelity Series Investment Grade Bond Fund | 10.1 | 9.6 |
Net Other Assets (Liabilities)* | 0.0 | 0.0 |
| 100.0 | 100.0 |
* Amount represents less than 0.1% |
Asset Allocation (% of fund's net assets) |
Period end |
| Commodity Funds | 8.7% | |
| Domestic Equity Funds | 50.4% | |
| Developed International Equity Funds | 17.3% | |
| Emerging Markets Equity Funds | 4.8% | |
| High Yield Bond Funds | 8.7% | |
| Inflation-Protected Bond Funds | 0.0%* | |
| Investment Grade Bond Funds | 10.1% | |

Six months ago |
| Commodity Funds | 8.7% | |
| Domestic Equity Funds | 51.5% | |
| Developed International Equity Funds | 16.8% | |
| Emerging Markets Equity Funds | 4.6% | |
| High Yield Bond Funds | 8.8% | |
 | Inflation-Protected Bond Funds | 0.0% | |
| Investment Grade Bond Funds | 9.6% | |

Semiannual Report
Fidelity Advisor Freedom 2035 Fund
Investments September 30, 2013 (Unaudited)
Showing Percentage of Net Assets
Domestic Equity Funds - 59.1% |
| Shares | | Value |
Commodity Funds - 8.7% |
Fidelity Series Commodity Strategy Fund (a)(b) | 24,364,620 | | $ 195,160,603 |
Domestic Equity Funds - 50.4% |
Fidelity Advisor Equity Growth Fund Institutional Class (b) | 1,977,815 | | 162,734,612 |
Fidelity Advisor Large Cap Fund Institutional Class (b) | 2,993,625 | | 80,528,512 |
Fidelity Advisor Series Equity-Income Fund (b) | 9,247,828 | | 109,031,895 |
Fidelity Advisor Series Growth & Income Fund (b) | 8,805,844 | | 106,110,419 |
Fidelity Advisor Series Opportunistic Insights Fund (b) | 6,411,004 | | 82,573,737 |
Fidelity Advisor Series Stock Selector Large Cap Value Fund (b) | 8,926,900 | | 108,640,371 |
Fidelity Advisor Small Cap Fund Institutional Class (b) | 2,084,756 | | 63,543,348 |
Fidelity Series 100 Index Fund (b) | 2,272,564 | | 25,180,005 |
Fidelity Series All-Sector Equity Fund (b) | 14,217,915 | | 201,325,671 |
Fidelity Series Large Cap Value Fund (b) | 8,502,930 | | 107,392,012 |
Fidelity Series Real Estate Equity Fund (b) | 1,323,594 | | 15,830,190 |
Fidelity Series Small Cap Opportunities Fund (b) | 5,672,998 | | 72,784,571 |
TOTAL DOMESTIC EQUITY FUNDS | | 1,135,675,343 |
TOTAL DOMESTIC EQUITY FUNDS (Cost $1,148,073,707) |
1,330,835,946
|
International Equity Funds - 22.1% |
| | | |
Developed International Equity Funds - 17.3% |
Fidelity Series International Growth Fund (b) | 12,957,796 | | 175,837,294 |
Fidelity Series International Small Cap Fund (b) | 2,402,862 | | 36,739,758 |
Fidelity Series International Value Fund (b) | 16,413,200 | | 176,441,903 |
TOTAL DEVELOPED INTERNATIONAL EQUITY FUNDS | | 389,018,955 |
|
| Shares | | Value |
Emerging Markets Equity Funds - 4.8% |
Fidelity Series Emerging Markets Fund (b) | 6,487,138 | | $ 108,594,695 |
TOTAL INTERNATIONAL EQUITY FUNDS (Cost $417,889,557) |
497,613,650
|
Bond Funds - 18.8% |
| | | |
High Yield Bond Funds - 8.7% |
Fidelity Series Emerging Markets Debt Fund (b) | 1,478,301 | | 14,960,403 |
Fidelity Series Floating Rate High Income Fund (b) | 1,567,705 | | 16,586,320 |
Fidelity Series High Income Fund (b) | 14,978,604 | | 153,980,051 |
Fidelity Series Real Estate Income Fund (b) | 847,077 | | 9,300,903 |
TOTAL HIGH YIELD BOND FUNDS | | 194,827,677 |
Inflation-Protected Bond Funds - 0.0% |
Fidelity Series Inflation-Protected Bond Index Fund (b) | 29,597 | | 321,126 |
Investment Grade Bond Funds - 10.1% |
Fidelity Series Investment Grade Bond Fund (b) | 20,343,009 | | 227,638,270 |
TOTAL BOND FUNDS (Cost $423,739,238) |
422,787,073
|
TOTAL INVESTMENT PORTFOLIO - 100.0% (Cost $1,989,702,502) | 2,251,236,669 |
NET OTHER ASSETS (LIABILITIES) - 0.0% | | (431,084) |
NET ASSETS - 100% | $ 2,250,805,585 |
Legend |
(a) Non-income producing |
(b) Affiliated company |
Affiliated Underlying Funds |
Information regarding the Fund's fiscal year to date purchases and sales of the affiliated Underlying Funds and income earned by the Fund from investments in affiliated Underlying Funds is as follows: |
Affiliate | Value,
beginning of
period | Purchases | Sales
Proceeds | Dividend
Income | Value,
end of
period |
Fidelity Advisor Equity Growth Fund Institutional Class | $ 146,037,675 | $ 6,529,645 | $ 12,876,212 | $ - | $ 162,734,612 |
Fidelity Advisor Growth & Income Fund Institutional Class | 77,536,597 | 2,512,472 | 86,810,609 | - | - |
Fidelity Advisor Large Cap Fund Institutional Class | 78,302,498 | 2,837,567 | 10,635,927 | - | 80,528,512 |
Fidelity Advisor Series Equity-Income Fund | 101,253,648 | 7,725,782 | 6,000,213 | 1,026,098 | 109,031,895 |
Fidelity Advisor Series Growth & Income Fund (formerly Fidelity Advisor Series Mega Cap Fund) | 22,423,472 | 82,752,170 | 2,218,716 | - | 106,110,419 |
Fidelity Advisor Series Opportunistic Insights Fund | 71,567,575 | 3,441,052 | 4,528,383 | - | 82,573,737 |
Fidelity Advisor Series Stock Selector Large Cap Value Fund | 101,988,948 | 4,716,970 | 6,966,625 | - | 108,640,371 |
Fidelity Advisor Small Cap Fund Institutional Class | 60,006,024 | 2,593,626 | 6,656,117 | - | 63,543,348 |
Fidelity Series 100 Index Fund | 24,100,686 | 1,077,217 | 1,762,436 | - | 25,180,005 |
Fidelity Series All-Sector Equity Fund | 193,432,696 | 7,153,832 | 18,595,195 | - | 201,325,671 |
Fidelity Series Commodity Strategy Fund | 182,349,768 | 36,304,852 | 8,593,523 | - | 195,160,603 |
Fidelity Series Emerging Markets Debt Fund | 15,061,340 | 1,523,036 | 549,547 | 391,381 | 14,960,403 |
Fidelity Series Emerging Markets Fund | 96,441,362 | 14,529,819 | 2,823,512 | - | 108,594,695 |
Fidelity Series Floating Rate High Income Fund | 15,821,013 | 1,416,572 | 573,601 | 351,435 | 16,586,320 |
Fidelity Series High Income Fund | 143,718,637 | 18,072,209 | 4,571,769 | 3,895,338 | 153,980,051 |
Fidelity Series Inflation-Protected Bond Index Fund | - | 330,668 | 8,294 | - | 321,126 |
Fidelity Series International Growth Fund | 159,255,463 | 10,146,233 | 5,501,051 | - | 175,837,294 |
Fidelity Series International Small Cap Fund | 32,344,142 | 1,773,538 | 1,144,070 | - | 36,739,758 |
Fidelity Series International Value Fund | 157,641,894 | 8,958,193 | 5,368,853 | - | 176,441,903 |
Fidelity Series Investment Grade Bond Fund | 200,160,305 | 41,102,348 | 7,253,686 | 2,242,007 | 227,638,270 |
Fidelity Series Large Cap Value Fund | 109,701,861 | 3,916,432 | 15,367,260 | - | 107,392,012 |
Fidelity Series Real Estate Equity Fund | 16,098,520 | 1,717,804 | 674,829 | 105,839 | 15,830,190 |
Fidelity Series Real Estate Income Fund | 9,212,263 | 964,316 | 319,979 | 272,417 | 9,300,903 |
Fidelity Series Small Cap Opportunities Fund | 69,819,611 | 8,278,843 | 8,386,224 | - | 72,784,571 |
Total | $ 2,084,275,998 | $ 270,375,196 | $ 218,186,631 | $ 8,284,515 | $ 2,251,236,669 |
Other Information |
All investments are categorized as Level 1 under the Fair Value Hierarchy. The inputs or methodology used for valuing securities may not be an indication of the risk associated with investing in those securities. For more information on valuation inputs, please refer to the Investment Valuation section in the accompanying Notes to Financial Statements. |
See accompanying notes which are an integral part of the financial statements.
Semiannual Report
Fidelity Advisor Freedom 2035 Fund
Statement of Assets and Liabilities
| September 30, 2013 (Unaudited) |
| | |
Assets | | |
Investment in securities, at value (cost $1,989,702,502) - See accompanying schedule | | $ 2,251,236,669 |
Cash | | 9 |
Receivable for investments sold | | 3,192,966 |
Receivable for fund shares sold | | 2,087,357 |
Receivable from investment adviser for expense reductions | | 1,021 |
Total assets | | 2,256,518,022 |
| | |
Liabilities | | |
Payable for investments purchased | $ 30,389 | |
Payable for fund shares redeemed | 5,249,936 | |
Distribution and service plan fees payable | 432,112 | |
Total liabilities | | 5,712,437 |
| | |
Net Assets | | $ 2,250,805,585 |
Net Assets consist of: | | |
Paid in capital | | $ 1,962,360,005 |
Undistributed net investment income | | 5,804,286 |
Accumulated undistributed net realized gain (loss) on investments | | 21,107,127 |
Net unrealized appreciation (depreciation) on investments | | 261,534,167 |
Net Assets | | $ 2,250,805,585 |
| | |
Calculation of Maximum Offering Price Class A:
Net Asset Value and redemption price per share ($1,325,524,311 ÷ 101,928,010 shares) | | $ 13.00 |
| | |
Maximum offering price per share (100/94.25 of $13.00) | | $ 13.79 |
Class T:
Net Asset Value and redemption price per share ($248,258,597 ÷ 19,200,085 shares) | | $ 12.93 |
| | |
Maximum offering price per share (100/96.50 of $12.93) | | $ 13.40 |
Class B:
Net Asset Value and offering price per share ($16,231,867 ÷ 1,266,153 shares)A | | $ 12.82 |
| | |
Class C:
Net Asset Value and offering price per share ($49,061,412 ÷ 3,836,405 shares)A | | $ 12.79 |
| | |
Institutional Class:
Net Asset Value, offering price and redemption price per share ($611,729,398 ÷ 46,765,020 shares) | | $ 13.08 |
A Redemption price per share is equal to net asset value less any applicable contingent deferred sales charge.
Statement of Operations
Six months ended September 30, 2013 (Unaudited) |
| | |
Investment Income | | |
Income distributions from underlying funds | | $ 8,284,515 |
| | |
Expenses | | |
Distribution and service plan fees | $ 2,519,111 | |
Independent trustees' compensation | 3,996 | |
Total expenses before reductions | 2,523,107 | |
Expense reductions | (3,996) | 2,519,111 |
Net investment income (loss) | | 5,765,404 |
Realized and Unrealized Gain (Loss) Realized gain (loss) on sale of underlying fund shares | 19,689,765 | |
Capital gain distributions from underlying funds | 6,160,694 | |
Total net realized gain (loss) | | 25,850,459 |
Change in net unrealized appreciation (depreciation) on underlying funds | | 95,082,341 |
Net gain (loss) | | 120,932,800 |
Net increase (decrease) in net assets resulting from operations | | $ 126,698,204 |
See accompanying notes which are an integral part of the financial statements.
Semiannual Report
Fidelity Advisor Freedom 2035 Fund
Financial Statements - continued
Statement of Changes in Net Assets
| Six months ended
September 30, 2013
(Unaudited) | Year ended
March 31,
2013 |
Increase (Decrease) in Net Assets | | |
Operations | | |
Net investment income (loss) | $ 5,765,404 | $ 27,744,686 |
Net realized gain (loss) | 25,850,459 | 116,307,027 |
Change in net unrealized appreciation (depreciation) | 95,082,341 | 38,369,090 |
Net increase (decrease) in net assets resulting from operations | 126,698,204 | 182,420,803 |
Distributions to shareholders from net investment income | (2,139,263) | (27,167,238) |
Distributions to shareholders from net realized gain | (76,670,553) | (5,583,432) |
Total distributions | (78,809,816) | (32,750,670) |
Share transactions - net increase (decrease) | 119,039,176 | 289,056,044 |
Total increase (decrease) in net assets | 166,927,564 | 438,726,177 |
| | |
Net Assets | | |
Beginning of period | 2,083,878,021 | 1,645,151,844 |
End of period (including undistributed net investment income of $5,804,286 and undistributed net investment income of $2,178,145, respectively) | $ 2,250,805,585 | $ 2,083,878,021 |
Financial Highlights - Class A
| Six months ended September 30, 2013 | Years ended March 31, |
| (Unaudited) | 2013 | 2012 | 2011 | 2010 | 2009 |
Selected Per-Share Data | | | | | | |
Net asset value, beginning of period | $ 12.74 | $ 11.80 | $ 12.11 | $ 10.65 | $ 7.18 | $ 12.53 |
Income from Investment Operations | | | | | | |
Net investment income (loss) E | .03 | .18 | .16 | .14 | .14 | .20 |
Net realized and unrealized gain (loss) | .71 | .97 | (.13) | 1.56 | 3.55 | (4.92) |
Total from investment operations | .74 | 1.15 | .03 | 1.70 | 3.69 | (4.72) |
Distributions from net investment income | (.01) | (.18) | (.15) | (.13) | (.14) | (.18) |
Distributions from net realized gain | (.47) | (.04) | (.19) | (.11) | (.08) | (.45) |
Total distributions | (.48) | (.21) I | (.34) | (.24) | (.22) | (.63) H |
Net asset value, end of period | $ 13.00 | $ 12.74 | $ 11.80 | $ 12.11 | $ 10.65 | $ 7.18 |
Total Return B, C, D | 5.93% | 9.89% | .47% | 16.13% | 51.59% | (39.29)% |
Ratios to Average Net Assets F, G | | | | | | |
Expenses before reductions | .25% A | .25% | .25% | .25% | .25% | .25% |
Expenses net of fee waivers, if any | .25% A | .25% | .25% | .25% | .25% | .25% |
Expenses net of all reductions | .25% A | .25% | .25% | .25% | .25% | .25% |
Net investment income (loss) | .51% A | 1.54% | 1.39% | 1.26% | 1.51% | 2.04% |
Supplemental Data | | | | | | |
Net assets, end of period (000 omitted) | $ 1,325,524 | $ 1,258,797 | $ 1,057,102 | $ 906,896 | $ 669,450 | $ 314,996 |
Portfolio turnover rate F | 20% A | 25% | 13% | 30% | 16% | 21% |
A Annualized
B Total returns for periods of less than one year are not annualized.
C Total returns would have been lower if certain expenses had not been reduced during the applicable periods shown.
D Total returns do not include the effect of the sales charges.
E Calculated based on average shares outstanding during the period.
F Amounts do not include the activity of the Underlying Funds.
G Expense ratios reflect operating expenses of the class. Expenses before reductions do not reflect amounts reimbursed by the investment adviser or reductions from expense offset arrangements and do not represent the amount paid by the class during periods when reimbursements or reductions occur. Expenses net of fee waivers reflect expenses after reimbursement by the investment adviser but prior to reductions from expense offset arrangements. Expenses net of all reductions represent the net expenses paid by the class but do not include expenses of the investment companies in which the Fund invests.
H Total distributions of $.63 per share is comprised of distributions from net investment income of $.182 and distributions from net realized gain of $.445 per share.
I Total distributions of $.21 per share is comprised of distributions from net investment income of $.175 and distributions from net realized gain of $.036 per share.
See accompanying notes which are an integral part of the financial statements.
Semiannual Report
Financial Highlights - Class T
| Six months ended September 30, 2013 | Years ended March 31, |
| (Unaudited) | 2013 | 2012 | 2011 | 2010 | 2009 |
Selected Per-Share Data | | | | | | |
Net asset value, beginning of period | $ 12.68 | $ 11.74 | $ 12.05 | $ 10.60 | $ 7.15 | $ 12.47 |
Income from Investment Operations | | | | | | |
Net investment income (loss) E | .02 | .15 | .13 | .11 | .12 | .17 |
Net realized and unrealized gain (loss) | .70 | .97 | (.13) | 1.55 | 3.53 | (4.89) |
Total from investment operations | .72 | 1.12 | - | 1.66 | 3.65 | (4.72) |
Distributions from net investment income | (.01) | (.15) | (.12) | (.11) | (.12) | (.16) |
Distributions from net realized gain | (.47) | (.04) | (.19) | (.11) | (.08) | (.45) |
Total distributions | (.47) K | (.18) J | (.31) | (.21) I | (.20) | (.60) H |
Net asset value, end of period | $ 12.93 | $ 12.68 | $ 11.74 | $ 12.05 | $ 10.60 | $ 7.15 |
Total Return B, C, D | 5.82% | 9.69% | .19% | 15.84% | 51.17% | (39.42)% |
Ratios to Average Net Assets F, G | | | | | | |
Expenses before reductions | .50% A | .50% | .50% | .50% | .50% | .50% |
Expenses net of fee waivers, if any | .50% A | .50% | .50% | .50% | .50% | .50% |
Expenses net of all reductions | .50% A | .50% | .50% | .50% | .50% | .50% |
Net investment income (loss) | .26% A | 1.29% | 1.14% | 1.01% | 1.26% | 1.79% |
Supplemental Data | | | | | | |
Net assets, end of period (000 omitted) | $ 248,259 | $ 216,701 | $ 166,843 | $ 169,442 | $ 143,106 | $ 81,463 |
Portfolio turnover rate F | 20% A | 25% | 13% | 30% | 16% | 21% |
A Annualized
B Total returns for periods of less than one year are not annualized.
C Total returns would have been lower if certain expenses had not been reduced during the applicable periods shown.
D Total returns do not include the effect of the sales charges.
E Calculated based on average shares outstanding during the period.
F Amounts do not include the activity of the Underlying Funds.
G Expense ratios reflect operating expenses of the class. Expenses before reductions do not reflect amounts reimbursed by the investment adviser or reductions from expense offset arrangements and do not represent the amount paid by the class during periods when reimbursements or reductions occur. Expenses net of fee waivers reflect expenses after reimbursement by the investment adviser but prior to reductions from expense offset arrangements. Expenses net of all reductions represent the net expenses paid by the class but do not include expenses of the investment companies in which the Fund invests.
H Total distributions of $.60 per share is comprised of distributions from net investment income of $.156 and distributions from net realized gain of $.445 per share.
I Total distributions of $.21 per share is comprised of distributions from net investment income of $.106 and distributions from net realized gain of $.105 per share.
J Total distributions of $.18 per share is comprised of distributions from net investment income of $.148 and distributions from net realized gain of $.036 per share.
K Total distributions of $.47 per share is comprised of distributions from net investment income of $.005 and distributions from net realized gain of $.466 per share.
Financial Highlights - Class B
| Six months ended September 30, 2013 | Years ended March 31, |
| (Unaudited) | 2013 | 2012 | 2011 | 2010 | 2009 |
Selected Per-Share Data | | | | | | |
Net asset value, beginning of period | $ 12.59 | $ 11.67 | $ 11.96 | $ 10.52 | $ 7.10 | $ 12.38 |
Income from Investment Operations | | | | | | |
Net investment income (loss) E | (.01) | .09 | .07 | .05 | .07 | .13 |
Net realized and unrealized gain (loss) | .70 | .95 | (.12) | 1.55 | 3.50 | (4.86) |
Total from investment operations | .69 | 1.04 | (.05) | 1.60 | 3.57 | (4.73) |
Distributions from net investment income | - | (.09) | (.07) | (.06) | (.07) | (.10) |
Distributions from net realized gain | (.46) | (.04) | (.17) | (.10) | (.08) | (.45) |
Total distributions | (.46) | (.12) I | (.24) | (.16) | (.15) | (.55) H |
Net asset value, end of period | $ 12.82 | $ 12.59 | $ 11.67 | $ 11.96 | $ 10.52 | $ 7.10 |
Total Return B, C, D | 5.60% | 9.02% | (.23)% | 15.28% | 50.43% | (39.76)% |
Ratios to Average Net Assets F, G | | | | | | |
Expenses before reductions | 1.00% A | 1.00% | 1.00% | 1.00% | 1.00% | 1.00% |
Expenses net of fee waivers, if any | 1.00% A | 1.00% | 1.00% | 1.00% | 1.00% | 1.00% |
Expenses net of all reductions | 1.00% A | 1.00% | 1.00% | 1.00% | 1.00% | 1.00% |
Net investment income (loss) | (.24)% A | .79% | .64% | .51% | .76% | 1.30% |
Supplemental Data | | | | | | |
Net assets, end of period (000 omitted) | $ 16,232 | $ 17,884 | $ 22,013 | $ 28,360 | $ 27,408 | $ 17,892 |
Portfolio turnover rate F | 20% A | 25% | 13% | 30% | 16% | 21% |
A Annualized
B Total returns for periods of less than one year are not annualized.
C Total returns would have been lower if certain expenses had not been reduced during the applicable periods shown.
D Total returns do not include the effect of the contingent deferred sales charge.
E Calculated based on average shares outstanding during the period.
F Amounts do not include the activity of the Underlying Funds.
G Expense ratios reflect operating expenses of the class. Expenses before reductions do not reflect amounts reimbursed by the investment adviser or reductions from expense offset arrangements and do not represent the amount paid by the class during periods when reimbursements or reductions occur. Expenses net of fee waivers reflect expenses after reimbursement by the investment adviser but prior to reductions from expense offset arrangements. Expenses net of all reductions represent the net expenses paid by the class but do not include expenses of the investment companies in which the Fund invests.
H Total distributions of $.55 per share is comprised of distributions from net investment income of $.103 and distributions from net realized gain of $.445 per share.
I Total distributions of $.12 per share is comprised of distributions from net investment income of $.088 and distributions from net realized gain of $.036 per share.
See accompanying notes which are an integral part of the financial statements.
Semiannual Report
Financial Highlights - Class C
| Six months ended September 30, 2013 | Years ended March 31, |
| (Unaudited) | 2013 | 2012 | 2011 | 2010 | 2009 |
Selected Per-Share Data | | | | | | |
Net asset value, beginning of period | $ 12.56 | $ 11.65 | $ 11.96 | $ 10.52 | $ 7.11 | $ 12.39 |
Income from Investment Operations | | | | | | |
Net investment income (loss) E | (.01) | .09 | .07 | .06 | .07 | .12 |
Net realized and unrealized gain (loss) | .70 | .95 | (.13) | 1.54 | 3.50 | (4.85) |
Total from investment operations | .69 | 1.04 | (.06) | 1.60 | 3.57 | (4.73) |
Distributions from net investment income | - | (.10) | (.08) | (.06) | (.08) | (.11) |
Distributions from net realized gain | (.46) | (.04) | (.18) | (.10) | (.08) | (.45) |
Total distributions | (.46) | (.13) J | (.25) I | (.16) | (.16) | (.55) H |
Net asset value, end of period | $ 12.79 | $ 12.56 | $ 11.65 | $ 11.96 | $ 10.52 | $ 7.11 |
Total Return B, C, D | 5.61% | 9.04% | (.29)% | 15.33% | 50.28% | (39.70)% |
Ratios to Average Net Assets F, G | | | | | | |
Expenses before reductions | 1.00% A | 1.00% | 1.00% | 1.00% | 1.00% | 1.00% |
Expenses net of fee waivers, if any | 1.00% A | 1.00% | 1.00% | 1.00% | 1.00% | 1.00% |
Expenses net of all reductions | 1.00% A | 1.00% | 1.00% | 1.00% | 1.00% | 1.00% |
Net investment income (loss) | (.24)% A | .79% | .64% | .51% | .76% | 1.29% |
Supplemental Data | | | | | | |
Net assets, end of period (000 omitted) | $ 49,061 | $ 43,447 | $ 38,614 | $ 36,389 | $ 30,994 | $ 17,821 |
Portfolio turnover rate F | 20% A | 25% | 13% | 30% | 16% | 21% |
A Annualized
B Total returns for periods of less than one year are not annualized.
C Total returns would have been lower if certain expenses had not been reduced during the applicable periods shown.
D Total returns do not include the effect of the contingent deferred sales charge.
E Calculated based on average shares outstanding during the period.
F Amounts do not include the activity of the Underlying Funds.
G Expense ratios reflect operating expenses of the class. Expenses before reductions do not reflect amounts reimbursed by the investment adviser or reductions from expense offset arrangements and do not represent the amount paid by the class during periods when reimbursements or reductions occur. Expenses net of fee waivers reflect expenses after reimbursement by the investment adviser but prior to reductions from expense offset arrangements. Expenses net of all reductions represent the net expenses paid by the class but do not include expenses of the investment companies in which the Fund invests.
H Total distributions of $.55 per share is comprised of distributions from net investment income of $.107 and distributions from net realized gain of $.445 per share.
I Total distributions of $.25 per share is comprised of distributions from net investment income of $.076 and distributions from net realized gain of $.176 per share.
J Total distributions of $.13 per share is comprised of distributions from net investment income of $.098 and distributions from net realized gain of $.036 per share.
Financial Highlights - Institutional Class
| Six months ended September 30, 2013 | Years ended March 31, |
| (Unaudited) | 2013 | 2012 | 2011 | 2010 | 2009 |
Selected Per-Share Data | | | | | | |
Net asset value, beginning of period | $ 12.80 | $ 11.86 | $ 12.17 | $ 10.69 | $ 7.21 | $ 12.57 |
Income from Investment Operations | | | | | | |
Net investment income (loss) D | .05 | .21 | .19 | .17 | .17 | .22 |
Net realized and unrealized gain (loss) | .72 | .97 | (.14) | 1.57 | 3.55 | (4.93) |
Total from investment operations | .77 | 1.18 | .05 | 1.74 | 3.72 | (4.71) |
Distributions from net investment income | (.02) | (.20) | (.17) | (.16) | (.16) | (.21) |
Distributions from net realized gain | (.47) | (.04) | (.19) | (.11) | (.08) | (.45) |
Total distributions | (.49) | (.24) | (.36) | (.26) I | (.24) | (.65) H |
Net asset value, end of period | $ 13.08 | $ 12.80 | $ 11.86 | $ 12.17 | $ 10.69 | $ 7.21 |
Total Return B, C | 6.13% | 10.10% | .71% | 16.51% | 51.81% | (39.08)% |
Ratios to Average Net Assets E, G | | | | | | |
Expenses before reductions F | .00% A | .00% | .00% | .00% | .00% | .00% |
Expenses net of fee waivers, if any | .00% A | .00% | .00% | .00% | .00% | .00% |
Expenses net of all reductions | .00% A | .00% | .00% | .00% | .00% | .00% |
Net investment income (loss) | .76% A | 1.79% | 1.64% | 1.51% | 1.76% | 2.29% |
Supplemental Data | | | | | | |
Net assets, end of period (000 omitted) | $ 611,729 | $ 547,049 | $ 360,580 | $ 218,092 | $ 97,629 | $ 43,667 |
Portfolio turnover rate E | 20% A | 25% | 13% | 30% | 16% | 21% |
A Annualized
B Total returns for periods of less than one year are not annualized.
C Total returns would have been lower if certain expenses had not been reduced during the applicable periods shown.
D Calculated based on average shares outstanding during the period.
E Amounts do not include the activity of the Underlying Funds.
F Amount represents less than .01%.
G Expense ratios reflect operating expenses of the class. Expenses before reductions do not reflect amounts reimbursed by the investment adviser or reductions from expense offset arrangements and do not represent the amount paid by the class during periods when reimbursements or reductions occur. Expenses net of fee waivers reflect expenses after reimbursement by the investment adviser but prior to reductions from expense offset arrangements. Expenses net of all reductions represent the net expenses paid by the class but do not include expenses of the investment companies in which the Fund invests.
H Total distributions of $.65 per share is comprised of distributions from net investment income of $.206 and distributions from net realized gain of $.445 per share.
I Total distributions of $.26 per share is comprised of distributions from net investment income of $.157 and distributions from net realized gain of $.105 per share.
See accompanying notes which are an integral part of the financial statements.
Semiannual Report
Fidelity Advisor Freedom 2040 Fund
Investment Changes (Unaudited)
The information in the following tables is based on the direct investments of the Fund. |
Fund Holdings as of September 30, 2013 |
| % of fund's
net assets | % of fund's net assets
6 months ago |
Commodity Funds | | |
Fidelity Series Commodity Strategy Fund | 8.8 | 8.9 |
Domestic Equity Funds | | |
Fidelity Advisor Equity Growth Fund Institutional Class | 7.4 | 7.1 |
Fidelity Advisor Growth & Income Fund Institutional Class | 0.0 | 3.8 |
Fidelity Advisor Large Cap Fund Institutional Class | 3.7 | 3.8 |
Fidelity Advisor Series Equity-Income Fund | 5.0 | 5.0 |
Fidelity Advisor Series Growth & Income Fund (formerly Fidelity Advisor Series Mega Cap Fund) | 4.8 | 1.1 |
Fidelity Advisor Series Opportunistic Insights Fund | 3.8 | 3.5 |
Fidelity Advisor Series Stock Selector Large Cap Value Fund | 4.9 | 5.0 |
Fidelity Advisor Small Cap Fund Institutional Class | 2.9 | 2.9 |
Fidelity Series 100 Index Fund | 1.1 | 1.2 |
Fidelity Series All-Sector Equity Fund | 9.2 | 9.4 |
Fidelity Series Large Cap Value Fund | 4.9 | 5.3 |
Fidelity Series Real Estate Equity Fund | 0.7 | 0.8 |
Fidelity Series Small Cap Opportunities Fund | 3.3 | 3.4 |
| 51.7 | 52.3 |
Developed International Equity Funds | | |
Fidelity Series International Growth Fund | 8.0 | 7.7 |
Fidelity Series International Small Cap Fund | 1.7 | 1.6 |
Fidelity Series International Value Fund | 8.0 | 7.7 |
| 17.7 | 17.0 |
Emerging Markets Equity Funds | | |
Fidelity Series Emerging Markets Fund | 5.0 | 4.7 |
High Yield Bond Funds | | |
Fidelity Series Emerging Markets Debt Fund | 0.6 | 0.7 |
Fidelity Series Floating Rate High Income Fund | 0.7 | 0.7 |
Fidelity Series High Income Fund | 6.8 | 7.0 |
Fidelity Series Real Estate Income Fund | 0.4 | 0.4 |
| 8.5 | 8.8 |
Investment Grade Bond Funds | | |
Fidelity Series Investment Grade Bond Fund | 8.3 | 8.3 |
Net Other Assets (Liabilities)* | 0.0 | 0.0 |
| 100.0 | 100.0 |
* Amount represents less than 0.1% |
Asset Allocation (% of fund's net assets) |
Period end |
| Commodity Funds | 8.8% | |
| Domestic Equity Funds | 51.7% | |
| Developed International Equity Funds | 17.7% | |
| Emerging Markets Equity Funds | 5.0% | |
| High Yield Bond Funds | 8.5% | |
| Investment Grade Bond Funds | 8.3% | |

Six months ago |
| Commodity Funds | 8.9% | |
| Domestic Equity Funds | 52.3% | |
| Developed International Equity Funds | 17.0% | |
| Emerging Markets Equity Funds | 4.7% | |
| High Yield Bond Funds | 8.8% | |
| Investment Grade Bond Funds | 8.3% | |

Semiannual Report
Fidelity Advisor Freedom 2040 Fund
Investments September 30, 2013 (Unaudited)
Showing Percentage of Net Assets
Domestic Equity Funds - 60.5% |
| Shares | | Value |
Commodity Funds - 8.8% |
Fidelity Series Commodity Strategy Fund (a)(b) | 23,768,104 | | $ 190,382,510 |
Domestic Equity Funds - 51.7% |
Fidelity Advisor Equity Growth Fund Institutional Class (b) | 1,951,706 | | 160,586,345 |
Fidelity Advisor Large Cap Fund Institutional Class (b) | 2,970,171 | | 79,897,603 |
Fidelity Advisor Series Equity-Income Fund (b) | 9,134,579 | | 107,696,687 |
Fidelity Advisor Series Growth & Income Fund (b) | 8,680,872 | | 104,604,509 |
Fidelity Advisor Series Opportunistic Insights Fund (b) | 6,364,109 | | 81,969,721 |
Fidelity Advisor Series Stock Selector Large Cap Value Fund (b) | 8,836,027 | | 107,534,452 |
Fidelity Advisor Small Cap Fund Institutional Class (b) | 2,057,738 | | 62,719,840 |
Fidelity Series 100 Index Fund (b) | 2,236,208 | | 24,777,189 |
Fidelity Series All-Sector Equity Fund (b) | 14,097,381 | | 199,618,920 |
Fidelity Series Large Cap Value Fund (b) | 8,452,473 | | 106,754,732 |
Fidelity Series Real Estate Equity Fund (b) | 1,306,493 | | 15,625,657 |
Fidelity Series Small Cap Opportunities Fund (b) | 5,598,844 | | 71,833,168 |
TOTAL DOMESTIC EQUITY FUNDS | | 1,123,618,823 |
TOTAL DOMESTIC EQUITY FUNDS (Cost $1,147,391,961) |
1,314,001,333
|
International Equity Funds - 22.7% |
| | | |
Developed International Equity Funds - 17.7% |
Fidelity Series International Growth Fund (b) | 12,814,800 | | 173,896,836 |
Fidelity Series International Small Cap Fund (b) | 2,365,112 | | 36,162,558 |
Fidelity Series International Value Fund (b) | 16,235,787 | | 174,534,709 |
TOTAL DEVELOPED INTERNATIONAL EQUITY FUNDS | | 384,594,103 |
|
| Shares | | Value |
Emerging Markets Equity Funds - 5.0% |
Fidelity Series Emerging Markets Fund (b) | 6,544,773 | | $ 109,559,494 |
TOTAL INTERNATIONAL EQUITY FUNDS (Cost $414,084,198) |
494,153,597
|
Bond Funds - 16.8% |
| | | |
High Yield Bond Funds - 8.5% |
Fidelity Series Emerging Markets Debt Fund (b) | 1,408,721 | | 14,256,257 |
Fidelity Series Floating Rate High Income Fund (b) | 1,411,162 | | 14,930,089 |
Fidelity Series High Income Fund (b) | 14,452,915 | | 148,575,964 |
Fidelity Series Real Estate Income Fund (b) | 742,737 | | 8,155,256 |
TOTAL HIGH YIELD BOND FUNDS | | 185,917,566 |
Investment Grade Bond Funds - 8.3% |
Fidelity Series Investment Grade Bond Fund (b) | 16,098,622 | | 180,143,576 |
TOTAL BOND FUNDS (Cost $367,841,672) |
366,061,142
|
TOTAL INVESTMENT PORTFOLIO - 100.0% (Cost $1,929,317,831) | | 2,174,216,072 |
NET OTHER ASSETS (LIABILITIES) - 0.0% | | (450,068) |
NET ASSETS - 100% | $ 2,173,766,004 |
Legend |
(a) Non-income producing |
(b) Affiliated company |
Affiliated Underlying Funds |
Information regarding the Fund's fiscal year to date purchases and sales of the affiliated Underlying Funds and income earned by the Fund from investments in affiliated Underlying Funds is as follows: |
Affiliate | Value,
beginning of
period | Purchases | Sales
Proceeds | Dividend
Income | Value,
end of
period |
Fidelity Advisor Equity Growth Fund Institutional Class | $ 143,673,712 | $ 5,178,165 | $ 11,077,016 | $ - | $ 160,586,345 |
Fidelity Advisor Growth & Income Fund Institutional Class | 75,975,139 | 2,089,336 | 84,711,075 | - | - |
Fidelity Advisor Large Cap Fund Institutional Class | 76,812,641 | 2,254,815 | 9,066,700 | - | 79,897,603 |
Fidelity Advisor Series Equity-Income Fund | 100,676,220 | 6,302,287 | 5,326,211 | 1,023,649 | 107,696,687 |
Fidelity Advisor Series Growth & Income Fund (formerly Fidelity Advisor Series Mega Cap Fund) | 22,294,860 | 81,426,796 | 2,258,221 | - | 104,604,509 |
Fidelity Advisor Series Opportunistic Insights Fund | 71,158,645 | 2,780,024 | 4,049,738 | - | 81,969,721 |
Fidelity Advisor Series Stock Selector Large Cap Value Fund | 101,402,797 | 3,753,365 | 6,502,612 | - | 107,534,452 |
Fidelity Advisor Small Cap Fund Institutional Class | 59,092,069 | 2,056,089 | 5,948,571 | - | 62,719,840 |
Fidelity Series 100 Index Fund | 23,560,024 | 848,399 | 1,366,347 | - | 24,777,189 |
Fidelity Series All-Sector Equity Fund | 189,472,856 | 5,684,201 | 14,647,073 | - | 199,618,920 |
Fidelity Series Commodity Strategy Fund | 180,115,990 | 33,341,615 | 8,479,778 | - | 190,382,510 |
Fidelity Series Emerging Markets Debt Fund | 14,730,822 | 1,135,298 | 559,217 | 380,586 | 14,256,257 |
Fidelity Series Emerging Markets Fund | 94,763,737 | 17,029,636 | 2,838,391 | - | 109,559,494 |
Fidelity Series Floating Rate High Income Fund | 13,987,354 | 1,539,895 | 531,651 | 315,804 | 14,930,089 |
Fidelity Series High Income Fund | 141,548,587 | 14,923,781 | 4,713,357 | 3,805,605 | 148,575,964 |
Fidelity Series International Growth Fund | 156,546,342 | 10,833,012 | 5,304,206 | - | 173,896,836 |
Fidelity Series International Small Cap Fund | 31,795,611 | 1,808,294 | 1,151,185 | - | 36,162,558 |
Fidelity Series International Value Fund | 154,936,713 | 9,735,164 | 5,161,890 | - | 174,534,709 |
Fidelity Series Investment Grade Bond Fund | 167,049,065 | 26,247,629 | 7,916,373 | 1,820,405 | 180,143,576 |
Fidelity Series Large Cap Value Fund | 106,490,192 | 3,112,693 | 11,796,317 | - | 106,754,732 |
Fidelity Series Real Estate Equity Fund | 15,629,519 | 1,856,873 | 579,058 | 103,884 | 15,625,657 |
Fidelity Series Real Estate Income Fund | 8,218,795 | 727,578 | 298,427 | 241,614 | 8,155,256 |
Fidelity Series Small Cap Opportunities Fund | 68,837,714 | 7,599,360 | 7,646,256 | - | 71,833,168 |
Total | $ 2,018,769,404 | $ 242,264,305 | $ 201,929,670 | $ 7,691,547 | $ 2,174,216,072 |
Other Information |
All investments are categorized as Level 1 under the Fair Value Hierarchy. The inputs or methodology used for valuing securities may not be an indication of the risk associated with investing in those securities. For more information on valuation inputs, please refer to the Investment Valuation section in the accompanying Notes to Financial Statements. |
See accompanying notes which are an integral part of the financial statements.
Semiannual Report
Fidelity Advisor Freedom 2040 Fund
Statement of Assets and Liabilities
| September 30, 2013 (Unaudited) |
| | |
Assets | | |
Investment in securities, at value (cost $1,929,317,831) - See accompanying schedule | | $ 2,174,216,072 |
Cash | | 7 |
Receivable for investments sold | | 4,177,107 |
Receivable for fund shares sold | | 2,196,373 |
Receivable from investment adviser for expense reductions | | 612 |
Total assets | | 2,180,590,171 |
| | |
Liabilities | | |
Payable for investments purchased | $ 33,546 | |
Payable for fund shares redeemed | 6,339,978 | |
Distribution and service plan fees payable | 450,643 | |
Total liabilities | | 6,824,167 |
| | |
Net Assets | | $ 2,173,766,004 |
Net Assets consist of: | | |
Paid in capital | | $ 1,905,055,333 |
Undistributed net investment income | | 5,005,024 |
Accumulated undistributed net realized gain (loss) on investments | | 18,807,406 |
Net unrealized appreciation (depreciation) on investments | | 244,898,241 |
Net Assets | | $ 2,173,766,004 |
| | |
Calculation of Maximum Offering Price Class A:
Net Asset Value and redemption price per share ($1,188,562,710 ÷ 85,374,078 shares) | | $ 13.92 |
| | |
Maximum offering price per share (100/94.25 of $13.92) | | $ 14.77 |
Class T:
Net Asset Value and redemption price per share ($311,365,479 ÷ 22,433,285 shares) | | $ 13.88 |
| | |
Maximum offering price per share (100/96.50 of $13.88) | | $ 14.38 |
Class B:
Net Asset Value and offering price per share ($20,825,438 ÷ 1,514,703 shares)A | | $ 13.75 |
| | |
Class C:
Net Asset Value and offering price per share ($67,277,997 ÷ 4,909,647 shares)A | | $ 13.70 |
| | |
Institutional Class:
Net Asset Value, offering price and redemption price per share ($585,734,380 ÷ 41,841,094 shares) | | $ 14.00 |
A Redemption price per share is equal to net asset value less any applicable contingent deferred sales charge.
Statement of Operations
Six months ended September 30, 2013 (Unaudited) |
| | |
Investment Income | | |
Income distributions from underlying funds | | $ 7,691,547 |
| | |
Expenses | | |
Distribution and service plan fees | $ 2,657,943 | |
Independent trustees' compensation | 3,880 | |
Total expenses before reductions | 2,661,823 | |
Expense reductions | (3,880) | 2,657,943 |
Net investment income (loss) | | 5,033,604 |
Realized and Unrealized Gain (Loss) Realized gain (loss) on sale of underlying fund shares | 17,157,443 | |
Capital gain distributions from underlying funds | 6,087,902 | |
Total net realized gain (loss) | | 23,245,345 |
Change in net unrealized appreciation (depreciation) on underlying funds | | 97,954,587 |
Net gain (loss) | | 121,199,932 |
Net increase (decrease) in net assets resulting from operations | | $ 126,233,536 |
See accompanying notes which are an integral part of the financial statements.
Semiannual Report
Fidelity Advisor Freedom 2040 Fund
Financial Statements - continued
Statement of Changes in Net Assets
| Six months ended
September 30, 2013
(Unaudited) | Year ended
March 31,
2013 |
Increase (Decrease) in Net Assets | | |
Operations | | |
Net investment income (loss) | $ 5,033,604 | $ 26,992,967 |
Net realized gain (loss) | 23,245,345 | 90,179,730 |
Change in net unrealized appreciation (depreciation) | 97,954,587 | 62,667,913 |
Net increase (decrease) in net assets resulting from operations | 126,233,536 | 179,840,610 |
Distributions to shareholders from net investment income | (1,974,119) | (26,501,610) |
Distributions to shareholders from net realized gain | (73,740,059) | (5,287,230) |
Total distributions | (75,714,178) | (31,788,840) |
Share transactions - net increase (decrease) | 104,901,832 | 198,765,979 |
Total increase (decrease) in net assets | 155,421,190 | 346,817,749 |
| | |
Net Assets | | |
Beginning of period | 2,018,344,814 | 1,671,527,065 |
End of period (including undistributed net investment income of $5,005,024 and undistributed net investment income of $1,945,539, respectively) | $ 2,173,766,004 | $ 2,018,344,814 |
Financial Highlights - Class A
| Six months ended
September 30, 2013 | Years ended March 31, |
| (Unaudited) | 2013 | 2012 | 2011 | 2010 | 2009 |
Selected Per-Share Data | | | | | | |
Net asset value, beginning of period | $ 13.61 | $ 12.60 | $ 12.95 | $ 11.37 | $ 7.59 | $ 13.57 |
Income from Investment Operations | | | | | | |
Net investment income (loss) E | .03 | .19 | .17 | .15 | .15 | .21 |
Net realized and unrealized gain (loss) | .79 | 1.05 | (.15) | 1.69 | 3.87 | (5.44) |
Total from investment operations | .82 | 1.24 | .02 | 1.84 | 4.02 | (5.23) |
Distributions from net investment income | (.01) | (.19) | (.16) | (.15) | (.15) | (.20) |
Distributions from net realized gain | (.49) | (.04) | (.21) | (.11) | (.09) | (.56) |
Total distributions | (.51) I | (.23) | (.37) | (.26) | (.24) | (.75) H |
Net asset value, end of period | $ 13.92 | $ 13.61 | $ 12.60 | $ 12.95 | $ 11.37 | $ 7.59 |
Total Return B, C, D | 6.13% | 9.94% | .38% | 16.38% | 53.15% | (40.42)% |
Ratios to Average Net Assets F, G | | | | | | |
Expenses before reductions | .25% A | .25% | .25% | .25% | .25% | .25% |
Expenses net of fee waivers, if any | .25% A | .25% | .25% | .25% | .25% | .25% |
Expenses net of all reductions | .25% A | .25% | .25% | .25% | .25% | .25% |
Net investment income (loss) | .48% A | 1.53% | 1.38% | 1.25% | 1.52% | 2.02% |
Supplemental Data | | | | | | |
Net assets, end of period (000 omitted) | $ 1,188,563 | $ 1,133,722 | $ 967,348 | $ 865,008 | $ 670,673 | $ 342,357 |
Portfolio turnover rate F | 19% A | 26% | 14% | 38% | 18% | 18% |
A Annualized
B Total returns for periods of less than one year are not annualized.
C Total returns would have been lower if certain expenses had not been reduced during the applicable periods shown.
D Total returns do not include the effect of the sales charges.
E Calculated based on average shares outstanding during the period.
F Amounts do not include the activity of the Underlying Funds.
G Expense ratios reflect operating expenses of the class. Expenses before reductions do not reflect amounts reimbursed by the investment adviser or reductions from expense offset arrangements and do not represent the amount paid by the class during periods when reimbursements or reductions occur. Expenses net of fee waivers reflect expenses after reimbursement by the investment adviser but prior to reductions from expense offset arrangements. Expenses net of all reductions represent the net expenses paid by the class but do not include expenses of the investment companies in which the Fund invests.
H Total distributions of $.75 per share is comprised of distributions from net investment income of $.197 and distributions from net realized gain of $.555 per share.
I Total distributions of $.51 per share is comprised of distributions from net investment income of $.013 and distributions from net realized gain of $.492 per share.
See accompanying notes which are an integral part of the financial statements.
Semiannual Report
Financial Highlights - Class T
| Six months ended
September 30, 2013 | Years ended March 31, |
| (Unaudited) | 2013 | 2012 | 2011 | 2010 | 2009 |
Selected Per-Share Data | | | | | | |
Net asset value, beginning of period | $ 13.58 | $ 12.57 | $ 12.92 | $ 11.34 | $ 7.57 | $ 13.54 |
Income from Investment Operations | | | | | | |
Net investment income (loss) E | .02 | .16 | .14 | .12 | .13 | .18 |
Net realized and unrealized gain (loss) | .78 | 1.04 | (.16) | 1.68 | 3.86 | (5.43) |
Total from investment operations | .80 | 1.20 | (.02) | 1.80 | 3.99 | (5.25) |
Distributions from net investment income | - L | (.16) | (.13) | (.11) | (.13) | (.17) |
Distributions from net realized gain | (.49) | (.04) | (.21) | (.11) | (.09) | (.56) |
Total distributions | (.50) K | (.19) J | (.33) I | (.22) | (.22) | (.72) H |
Net asset value, end of period | $ 13.88 | $ 13.58 | $ 12.57 | $ 12.92 | $ 11.34 | $ 7.57 |
Total Return B, C, D | 6.00% | 9.69% | .12% | 16.06% | 52.83% | (40.61)% |
Ratios to Average Net Assets F, G | | | | | | |
Expenses before reductions | .50% A | .50% | .50% | .50% | .50% | .50% |
Expenses net of fee waivers, if any | .50% A | .50% | .50% | .50% | .50% | .50% |
Expenses net of all reductions | .50% A | .50% | .50% | .50% | .50% | .50% |
Net investment income (loss) | .23% A | 1.28% | 1.13% | 1.00% | 1.27% | 1.77% |
Supplemental Data | | | | | | |
Net assets, end of period (000 omitted) | $ 311,365 | $ 288,886 | $ 262,944 | $ 276,335 | $ 300,594 | $ 181,917 |
Portfolio turnover rate F | 19% A | 26% | 14% | 38% | 18% | 18% |
A Annualized
B Total returns for periods of less than one year are not annualized.
C Total returns would have been lower if certain expenses had not been reduced during the applicable periods shown.
D Total returns do not include the effect of the sales charges.
E Calculated based on average shares outstanding during the period.
F Amounts do not include the activity of the Underlying Funds.
G Expense ratios reflect operating expenses of the class. Expenses before reductions do not reflect amounts reimbursed by the investment adviser or reductions from expense offset arrangements and do not represent the amount paid by the class during periods when reimbursements or reductions occur. Expenses net of fee waivers reflect expenses after reimbursement by the investment adviser but prior to reductions from expense offset arrangements. Expenses net of all reductions represent the net expenses paid by the class but do not include expenses of the investment companies in which the Fund invests.
H Total distributions of $.72 per share is comprised of distributions from net investment income of $.168 and distributions from net realized gain of $.555 per share.
I Total distributions of $.33 per share is comprised of distributions from net investment income of $.127 and distributions from net realized gain of $.207 per share.
J Total distributions of $.19 per share is comprised of distributions from net investment income of $.156 and distributions from net realized gain of $.037 per share.
K Total distributions of $.50 per share is comprised of distributions from net investment income of $.004 and distributions from net realized gain of $.492 per share.
L Amount represents less than $.01 per share.
Financial Highlights - Class B
| Six months ended
September 30, 2013 | Years ended March 31, |
| (Unaudited) | 2013 | 2012 | 2011 | 2010 | 2009 |
Selected Per-Share Data | | | | | | |
Net asset value, beginning of period | $ 13.48 | $ 12.48 | $ 12.82 | $ 11.26 | $ 7.52 | $ 13.42 |
Income from Investment Operations | | | | | | |
Net investment income (loss) E | (.02) | .10 | .08 | .06 | .08 | .13 |
Net realized and unrealized gain (loss) | .78 | 1.03 | (.15) | 1.66 | 3.83 | (5.37) |
Total from investment operations | .76 | 1.13 | (.07) | 1.72 | 3.91 | (5.24) |
Distributions from net investment income | - | (.09) | (.07) | (.06) | (.08) | (.11) |
Distributions from net realized gain | (.49) | (.04) | (.20) | (.10) | (.09) | (.55) |
Total distributions | (.49) | (.13) | (.27) | (.16) | (.17) | (.66) H |
Net asset value, end of period | $ 13.75 | $ 13.48 | $ 12.48 | $ 12.82 | $ 11.26 | $ 7.52 |
Total Return B, C, D | 5.73% | 9.14% | (.36)% | 15.43% | 52.08% | (40.85)% |
Ratios to Average Net Assets F, G | | | | | | |
Expenses before reductions | 1.00% A | 1.00% | 1.00% | 1.00% | 1.00% | 1.00% |
Expenses net of fee waivers, if any | 1.00% A | 1.00% | 1.00% | 1.00% | 1.00% | 1.00% |
Expenses net of all reductions | 1.00% A | 1.00% | 1.00% | 1.00% | 1.00% | 1.00% |
Net investment income (loss) | (.27)% A | .78% | .63% | .50% | .77% | 1.28% |
Supplemental Data | | | | | | |
Net assets, end of period (000 omitted) | $ 20,825 | $ 24,481 | $ 31,574 | $ 41,935 | $ 43,773 | $ 29,479 |
Portfolio turnover rate F | 19% A | 26% | 14% | 38% | 18% | 18% |
A Annualized
B Total returns for periods of less than one year are not annualized.
C Total returns would have been lower if certain expenses had not been reduced during the applicable periods shown.
D Total returns do not include the effect of the contingent deferred sales charge.
E Calculated based on average shares outstanding during the period.
F Amounts do not include the activity of the Underlying Funds.
G Expense ratios reflect operating expenses of the class. Expenses before reductions do not reflect amounts reimbursed by the investment adviser or reductions from expense offset arrangements and do not represent the amount paid by the class during periods when reimbursements or reductions occur. Expenses net of fee waivers reflect expenses after reimbursement by the investment adviser but prior to reductions from expense offset arrangements. Expenses net of all reductions represent the net expenses paid by the class but do not include expenses of the investment companies in which the Fund invests.
H Total distributions of $.66 per share is comprised of distributions from net investment income of $.112 and distributions from net realized gain of $.550 per share.
See accompanying notes which are an integral part of the financial statements.
Semiannual Report
Financial Highlights - Class C
| Six months ended
September 30, 2013 | Years ended March 31, |
| (Unaudited) | 2013 | 2012 | 2011 | 2010 | 2009 |
Selected Per-Share Data | | | | | | |
Net asset value, beginning of period | $ 13.43 | $ 12.45 | $ 12.80 | $ 11.25 | $ 7.51 | $ 13.42 |
Income from Investment Operations | | | | | | |
Net investment income (loss) E | (.02) | .10 | .08 | .06 | .08 | .13 |
Net realized and unrealized gain (loss) | .78 | 1.02 | (.15) | 1.66 | 3.83 | (5.37) |
Total from investment operations | .76 | 1.12 | (.07) | 1.72 | 3.91 | (5.24) |
Distributions from net investment income | - | (.11) | (.08) | (.07) | (.08) | (.12) |
Distributions from net realized gain | (.49) | (.04) | (.20) | (.10) | (.09) | (.55) |
Total distributions | (.49) | (.14) I | (.28) | (.17) | (.17) | (.67) H |
Net asset value, end of period | $ 13.70 | $ 13.43 | $ 12.45 | $ 12.80 | $ 11.25 | $ 7.51 |
Total Return B, C, D | 5.75% | 9.09% | (.35)% | 15.39% | 52.18% | (40.91)% |
Ratios to Average Net Assets F, G | | | | | | |
Expenses before reductions | 1.00% A | 1.00% | 1.00% | 1.00% | 1.00% | 1.00% |
Expenses net of fee waivers, if any | 1.00% A | 1.00% | 1.00% | 1.00% | 1.00% | 1.00% |
Expenses net of all reductions | 1.00% A | 1.00% | 1.00% | 1.00% | 1.00% | 1.00% |
Net investment income (loss) | (.27)% A | .78% | .63% | .50% | .77% | 1.28% |
Supplemental Data | | | | | | |
Net assets, end of period (000 omitted) | $ 67,278 | $ 62,893 | $ 56,910 | $ 58,416 | $ 53,334 | $ 34,036 |
Portfolio turnover rate F | 19% A | 26% | 14% | 38% | 18% | 18% |
A Annualized
B Total returns for periods of less than one year are not annualized.
C Total returns would have been lower if certain expenses had not been reduced during the applicable periods shown.
D Total returns do not include the effect of the contingent deferred sales charge.
E Calculated based on average shares outstanding during the period.
F Amounts do not include the activity of the Underlying Funds.
G Expense ratios reflect operating expenses of the class. Expenses before reductions do not reflect amounts reimbursed by the investment adviser or reductions from expense offset arrangements and do not represent the amount paid by the class during periods when reimbursements or reductions occur. Expenses net of fee waivers reflect expenses after reimbursement by the investment adviser but prior to reductions from expense offset arrangements. Expenses net of all reductions represent the net expenses paid by the class but do not include expenses of the investment companies in which the Fund invests.
H Total distributions of $.67 per share is comprised of distributions from net investment income of $.115 and distributions from net realized gain of $.550 per share.
I Total distributions of $.14 per share is comprised of distributions from net investment income of $.105 and distributions from net realized gain of $.037 per share.
Financial Highlights - Institutional Class
| Six months ended
September 30, 2013 | Years ended March 31, |
| (Unaudited) | 2013 | 2012 | 2011 | 2010 | 2009 |
Selected Per-Share Data | | | | | | |
Net asset value, beginning of period | $ 13.67 | $ 12.65 | $ 13.00 | $ 11.42 | $ 7.62 | $ 13.62 |
Income from Investment Operations | | | | | | |
Net investment income (loss) D | .05 | .23 | .20 | .18 | .18 | .23 |
Net realized and unrealized gain (loss) | .79 | 1.05 | (.16) | 1.69 | 3.88 | (5.45) |
Total from investment operations | .84 | 1.28 | .04 | 1.87 | 4.06 | (5.22) |
Distributions from net investment income | (.02) | (.22) | (.19) | (.18) | (.17) | (.22) |
Distributions from net realized gain | (.49) | (.04) | (.21) | (.11) | (.09) | (.56) |
Total distributions | (.51) | (.26) | (.39) I | (.29) | (.26) | (.78) H |
Net asset value, end of period | $ 14.00 | $ 13.67 | $ 12.65 | $ 13.00 | $ 11.42 | $ 7.62 |
Total Return B, C | 6.31% | 10.24% | .61% | 16.57% | 53.53% | (40.24)% |
Ratios to Average Net Assets E, G | | | | | | |
Expenses before reductions F | .00% A | .00% | .00% | .00% | .00% | .00% |
Expenses net of fee waivers, if any | .00% A | .00% | .00% | .00% | .00% | .00% |
Expenses net of all reductions | .00% A | .00% | .00% | .00% | .00% | .00% |
Net investment income (loss) | .73% A | 1.78% | 1.63% | 1.50% | 1.77% | 2.27% |
Supplemental Data | | | | | | |
Net assets, end of period (000 omitted) | $ 585,734 | $ 508,363 | $ 352,751 | $ 229,228 | $ 126,440 | $ 56,940 |
Portfolio turnover rate E | 19% A | 26% | 14% | 38% | 18% | 18% |
A Annualized
B Total returns for periods of less than one year are not annualized.
C Total returns would have been lower if certain expenses had not been reduced during the applicable periods shown.
D Calculated based on average shares outstanding during the period.
E Amounts do not include the activity of the Underlying Funds.
F Amount represents less than .01%.
G Expense ratios reflect operating expenses of the class. Expenses before reductions do not reflect amounts reimbursed by the investment adviser or reductions from expense offset arrangements and do not represent the amount paid by the class during periods when reimbursements or reductions occur. Expenses net of fee waivers reflect expenses after reimbursement by the investment adviser but prior to reductions from expense offset arrangements. Expenses net of all reductions represent the net expenses paid by the class but do not include expenses of the investment companies in which the Fund invests.
H Total distributions of $.78 per share is comprised of distributions from net investment income of $.224 and distributions from net realized gain of $.555 per share.
I Total distributions of $.39 per share is comprised of distributions from net investment income of $.186 and distributions from net realized gain of $.207 per share.
See accompanying notes which are an integral part of the financial statements.
Semiannual Report
Fidelity Advisor Freedom 2045 Fund
Investment Changes (Unaudited)
The information in the following tables is based on the direct investments of the Fund. |
Fund Holdings as of September 30, 2013 |
| % of fund's
net assets | % of fund's net assets
6 months ago |
Commodity Funds | | |
Fidelity Series Commodity Strategy Fund | 9.1 | 9.2 |
Domestic Equity Funds | | |
Fidelity Advisor Equity Growth Fund Institutional Class | 7.6 | 7.4 |
Fidelity Advisor Growth & Income Fund Institutional Class | 0.0 | 3.9 |
Fidelity Advisor Large Cap Fund Institutional Class | 3.8 | 4.0 |
Fidelity Advisor Series Equity-Income Fund | 4.9 | 4.9 |
Fidelity Advisor Series Growth & Income Fund (formerly Fidelity Advisor Series Mega Cap Fund) | 4.9 | 1.1 |
Fidelity Advisor Series Opportunistic Insights Fund | 3.8 | 3.5 |
Fidelity Advisor Series Stock Selector Large Cap Value Fund | 5.0 | 5.0 |
Fidelity Advisor Small Cap Fund Institutional Class | 3.0 | 3.0 |
Fidelity Series 100 Index Fund | 1.2 | 1.2 |
Fidelity Series All-Sector Equity Fund | 9.5 | 9.7 |
Fidelity Series Large Cap Value Fund | 5.1 | 5.5 |
Fidelity Series Real Estate Equity Fund | 0.7 | 0.8 |
Fidelity Series Small Cap Opportunities Fund | 3.4 | 3.5 |
| 52.9 | 53.5 |
Developed International Equity Funds | | |
Fidelity Series International Growth Fund | 8.2 | 8.0 |
Fidelity Series International Small Cap Fund | 1.7 | 1.6 |
Fidelity Series International Value Fund | 8.2 | 7.9 |
| 18.1 | 17.5 |
Emerging Markets Equity Funds | | |
Fidelity Series Emerging Markets Fund | 5.2 | 4.9 |
High Yield Bond Funds | | |
Fidelity Series Emerging Markets Debt Fund | 0.6 | 0.7 |
Fidelity Series Floating Rate High Income Fund | 0.4 | 0.3 |
Fidelity Series High Income Fund | 8.8 | 9.1 |
Fidelity Series Real Estate Income Fund | 0.3 | 0.3 |
| 10.1 | 10.4 |
Investment Grade Bond Funds | | |
Fidelity Series Investment Grade Bond Fund | 4.6 | 4.5 |
Net Other Assets (Liabilities)* | 0.0 | 0.0 |
| 100.0 | 100.0 |
* Amount represents less than 0.1% |
Asset Allocation (% of fund's net assets) |
Period end |
| Commodity Funds | 9.1% | |
| Domestic Equity Funds | 52.9% | |
| Developed International Equity Funds | 18.1% | |
| Emerging Markets Equity Funds | 5.2% | |
| High Yield Bond Funds | 10.1% | |
| Investment Grade Bond Funds | 4.6% | |

Six months ago |
| Commodity Funds | 9.2% | |
| Domestic Equity Funds | 53.5% | |
| Developed International Equity Funds | 17.5% | |
| Emerging Markets Equity Funds | 4.9% | |
| High Yield Bond Funds | 10.4% | |
| Investment Grade Bond Funds | 4.5% | |

Semiannual Report
Fidelity Advisor Freedom 2045 Fund
Investments September 30, 2013 (Unaudited)
Showing Percentage of Net Assets
Domestic Equity Funds - 62.0% |
| Shares | | Value |
Commodity Funds - 9.1% |
Fidelity Series Commodity Strategy Fund (a)(b) | 11,648,756 | | $ 93,306,537 |
Domestic Equity Funds - 52.9% |
Fidelity Advisor Equity Growth Fund Institutional Class (b) | 953,344 | | 78,441,169 |
Fidelity Advisor Large Cap Fund Institutional Class (b) | 1,472,151 | | 39,600,866 |
Fidelity Advisor Series Equity-Income Fund (b) | 4,328,143 | | 51,028,805 |
Fidelity Advisor Series Growth & Income Fund (b) | 4,229,465 | | 50,965,055 |
Fidelity Advisor Series Opportunistic Insights Fund (b) | 3,002,195 | | 38,668,274 |
Fidelity Advisor Series Stock Selector Large Cap Value Fund (b) | 4,203,437 | | 51,155,833 |
Fidelity Advisor Small Cap Fund Institutional Class (b) | 1,010,918 | | 30,812,785 |
Fidelity Series 100 Index Fund (b) | 1,097,481 | | 12,160,085 |
Fidelity Series All-Sector Equity Fund (b) | 6,905,553 | | 97,782,627 |
Fidelity Series Large Cap Value Fund (b) | 4,174,043 | | 52,718,165 |
Fidelity Series Real Estate Equity Fund (b) | 637,042 | | 7,619,023 |
Fidelity Series Small Cap Opportunities Fund (b) | 2,771,451 | | 35,557,710 |
TOTAL DOMESTIC EQUITY FUNDS | | 546,510,397 |
TOTAL DOMESTIC EQUITY FUNDS (Cost $539,965,154) |
639,816,934
|
International Equity Funds - 23.3% |
| | | |
Developed International Equity Funds - 18.1% |
Fidelity Series International Growth Fund (b) | 6,259,337 | | 84,939,203 |
Fidelity Series International Small Cap Fund (b) | 1,147,232 | | 17,541,171 |
Fidelity Series International Value Fund (b) | 7,900,504 | | 84,930,421 |
TOTAL DEVELOPED INTERNATIONAL EQUITY FUNDS | | 187,410,795 |
|
| Shares | | Value |
Emerging Markets Equity Funds - 5.2% |
Fidelity Series Emerging Markets Fund (b) | 3,185,908 | | $ 53,332,105 |
TOTAL INTERNATIONAL EQUITY FUNDS (Cost $204,322,939) |
240,742,900
|
Bond Funds - 14.7% |
| | | |
High Yield Bond Funds - 10.1% |
Fidelity Series Emerging Markets Debt Fund (b) | 655,571 | | 6,634,379 |
Fidelity Series Floating Rate High Income Fund (b) | 341,886 | | 3,617,154 |
Fidelity Series High Income Fund (b) | 8,865,584 | | 91,138,204 |
Fidelity Series Real Estate Income Fund (b) | 299,009 | | 3,283,121 |
TOTAL HIGH YIELD BOND FUNDS | | 104,672,858 |
Investment Grade Bond Funds - 4.6% |
Fidelity Series Investment Grade Bond Fund (b) | 4,251,131 | | 47,570,159 |
TOTAL BOND FUNDS (Cost $151,284,450) |
152,243,017
|
TOTAL INVESTMENT PORTFOLIO - 100.0% (Cost $895,572,543) | | 1,032,802,851 |
NET OTHER ASSETS (LIABILITIES) - 0.0% | | (180,822) |
NET ASSETS - 100% | $ 1,032,622,029 |
Legend |
(a) Non-income producing |
(b) Affiliated company |
Affiliated Underlying Funds |
Information regarding the Fund's fiscal year to date purchases and sales of the affiliated Underlying Funds and income earned by the Fund from investments in affiliated Underlying Funds is as follows: |
Affiliate | Value,
beginning of
period | Purchases | Sales
Proceeds | Dividend
Income | Value,
end of
period |
Fidelity Advisor Equity Growth Fund Institutional Class | $ 66,669,108 | $ 5,613,290 | $ 4,750,798 | $ - | $ 78,441,169 |
Fidelity Advisor Growth & Income Fund Institutional Class | 35,481,306 | 2,174,951 | 40,817,196 | - | - |
Fidelity Advisor Large Cap Fund Institutional Class | 35,845,261 | 2,663,359 | 3,654,014 | - | 39,600,866 |
Fidelity Advisor Series Equity-Income Fund | 44,779,464 | 5,554,343 | 2,035,160 | 461,226 | 51,028,805 |
Fidelity Advisor Series Growth & Income Fund (formerly Fidelity Advisor Series Mega Cap Fund) | 9,921,685 | 40,414,073 | 829,882 | - | 50,965,055 |
Fidelity Advisor Series Opportunistic Insights Fund | 31,656,678 | 2,959,877 | 1,489,478 | - | 38,668,274 |
Fidelity Advisor Series Stock Selector Large Cap Value Fund | 45,101,687 | 4,146,351 | 2,137,972 | - | 51,155,833 |
Fidelity Advisor Small Cap Fund Institutional Class | 27,435,072 | 2,231,793 | 2,474,680 | - | 30,812,785 |
Fidelity Series 100 Index Fund | 11,099,125 | 928,995 | 697,976 | - | 12,160,085 |
Fidelity Series All-Sector Equity Fund | 88,201,459 | 6,706,219 | 6,247,915 | - | 97,782,627 |
Fidelity Series Commodity Strategy Fund | 83,502,801 | 20,451,247 | 3,795,449 | - | 93,306,537 |
Fidelity Series Emerging Markets Debt Fund | 6,420,091 | 914,163 | 231,734 | 170,150 | 6,634,379 |
Fidelity Series Emerging Markets Fund | 44,075,777 | 10,027,341 | 1,060,122 | - | 53,332,105 |
Fidelity Series Floating Rate High Income Fund | 2,952,479 | 800,310 | 121,227 | 71,356 | 3,617,154 |
Fidelity Series High Income Fund | 82,180,603 | 14,046,811 | 3,131,467 | 2,283,424 | 91,138,204 |
Fidelity Series International Growth Fund | 72,337,325 | 9,465,313 | 2,516,561 | - | 84,939,203 |
Fidelity Series International Small Cap Fund | 14,681,753 | 1,603,364 | 503,168 | - | 17,541,171 |
Fidelity Series International Value Fund | 71,628,283 | 8,261,755 | 2,069,004 | - | 84,930,421 |
Fidelity Series Investment Grade Bond Fund | 40,856,148 | 10,992,748 | 2,960,084 | 463,560 | 47,570,159 |
Fidelity Series Large Cap Value Fund | 50,091,676 | 3,677,020 | 5,357,642 | - | 52,718,165 |
Fidelity Series Real Estate Equity Fund | 7,335,896 | 1,152,193 | 237,053 | 50,068 | 7,619,023 |
Fidelity Series Real Estate Income Fund | 3,123,821 | 461,577 | 108,653 | 94,513 | 3,283,121 |
Fidelity Series Small Cap Opportunities Fund | 32,003,872 | 5,163,418 | 3,028,465 | - | 35,557,710 |
Total | $ 907,381,370 | $ 160,410,511 | $ 90,255,700 | $ 3,594,297 | $ 1,032,802,851 |
Other Information |
All investments are categorized as Level 1 under the Fair Value Hierarchy. The inputs or methodology used for valuing securities may not be an indication of the risk associated with investing in those securities. For more information on valuation inputs, please refer to the Investment Valuation section in the accompanying Notes to Financial Statements. |
See accompanying notes which are an integral part of the financial statements.
Semiannual Report
Fidelity Advisor Freedom 2045 Fund
Statement of Assets and Liabilities
| September 30, 2013 (Unaudited) |
| | |
Assets | | |
Investment in securities, at value (cost $895,572,543) - See accompanying schedule | | $ 1,032,802,851 |
Cash | | 4 |
Receivable for investments sold | | 1,450,836 |
Receivable for fund shares sold | | 1,454,998 |
Receivable from investment adviser for expense reductions | | 604 |
Total assets | | 1,035,709,293 |
| | |
Liabilities | | |
Payable for investments purchased | $ 28,968 | |
Payable for fund shares redeemed | 2,876,854 | |
Distribution and service plan fees payable | 181,442 | |
Total liabilities | | 3,087,264 |
| | |
Net Assets | | $ 1,032,622,029 |
Net Assets consist of: | | |
Paid in capital | | $ 877,618,186 |
Undistributed net investment income | | 2,535,806 |
Accumulated undistributed net realized gain (loss) on investments | | 15,237,729 |
Net unrealized appreciation (depreciation) on investments | | 137,230,308 |
Net Assets | | $ 1,032,622,029 |
| | |
Calculation of Maximum Offering Price Class A:
Net Asset Value and redemption price per share ($574,247,447 ÷ 52,703,087 shares) | | $ 10.90 |
| | |
Maximum offering price per share (100/94.25 of $10.90) | | $ 11.56 |
Class T:
Net Asset Value and redemption price per share ($112,222,455 ÷ 10,349,062 shares) | | $ 10.84 |
| | |
Maximum offering price per share (100/96.50 of $10.84) | | $ 11.23 |
Class B:
Net Asset Value and offering price per share ($3,561,500 ÷ 329,673 shares)A | | $ 10.80 |
| | |
Class C:
Net Asset Value and offering price per share ($15,907,361 ÷ 1,477,519 shares)A | | $ 10.77 |
| | |
Institutional Class:
Net Asset Value, offering price and redemption price per share ($326,683,266 ÷ 29,831,382 shares) | | $ 10.95 |
A Redemption price per share is equal to net asset value less any applicable contingent deferred sales charge.
Statement of Operations
Six months ended September 30, 2013 (Unaudited) |
| | |
Investment Income | | |
Income distributions from underlying funds | | $ 3,594,297 |
| | |
Expenses | | |
Distribution and service plan fees | $ 1,045,865 | |
Independent trustees' compensation | 1,776 | |
Total expenses before reductions | 1,047,641 | |
Expense reductions | (1,776) | 1,045,865 |
Net investment income (loss) | | 2,548,432 |
Realized and Unrealized Gain (Loss) Realized gain (loss) on sale of underlying fund shares | 14,690,446 | |
Capital gain distributions from underlying funds | 2,965,966 | |
Total net realized gain (loss) | | 17,656,412 |
Change in net unrealized appreciation (depreciation) on underlying funds | | 40,576,206 |
Net gain (loss) | | 58,232,618 |
Net increase (decrease) in net assets resulting from operations | | $ 60,781,050 |
See accompanying notes which are an integral part of the financial statements.
Semiannual Report
Fidelity Advisor Freedom 2045 Fund
Financial Statements - continued
Statement of Changes in Net Assets
| Six months ended
September 30, 2013
(Unaudited) | Year ended
March 31,
2013 |
Increase (Decrease) in Net Assets | | |
Operations | | |
Net investment income (loss) | $ 2,548,432 | $ 12,046,883 |
Net realized gain (loss) | 17,656,412 | 21,385,492 |
Change in net unrealized appreciation (depreciation) | 40,576,206 | 48,075,115 |
Net increase (decrease) in net assets resulting from operations | 60,781,050 | 81,507,490 |
Distributions to shareholders from net investment income | (979,049) | (11,684,331) |
Distributions to shareholders from net realized gain | (19,046,918) | (10,873,978) |
Total distributions | (20,025,967) | (22,558,309) |
Share transactions - net increase (decrease) | 84,644,823 | 205,501,582 |
Total increase (decrease) in net assets | 125,399,906 | 264,450,763 |
| | |
Net Assets | | |
Beginning of period | 907,222,123 | 642,771,360 |
End of period (including undistributed net investment income of $2,535,806 and undistributed net investment income of $966,423, respectively) | $ 1,032,622,029 | $ 907,222,123 |
Financial Highlights - Class A
| Six months ended
September 30, 2013 | Years ended March 31, |
| (Unaudited) | 2013 | 2012 | 2011 | 2010 | 2009 |
Selected Per-Share Data | | | | | | |
Net asset value, beginning of period | $ 10.46 | $ 9.79 | $ 10.08 | $ 8.82 | $ 5.86 | $ 10.39 |
Income from Investment Operations | | | | | | |
Net investment income (loss) E | .03 | .16 | .13 | .12 | .12 | .16 |
Net realized and unrealized gain (loss) | .63 | .81 | (.14) | 1.33 | 3.02 | (4.29) |
Total from investment operations | .66 | .97 | (.01) | 1.45 | 3.14 | (4.13) |
Distributions from net investment income | (.01) | (.15) | (.12) | (.11) | (.11) | (.14) |
Distributions from net realized gain | (.21) | (.15) | (.16) | (.08) | (.07) | (.26) |
Total distributions | (.22) | (.30) | (.28) | (.19) | (.18) | (.40) |
Net asset value, end of period | $ 10.90 | $ 10.46 | $ 9.79 | $ 10.08 | $ 8.82 | $ 5.86 |
Total Return B, C, D | 6.41% | 10.21% | .12% | 16.67% | 53.81% | (40.93)% |
Ratios to Average Net Assets F, G | | | | | | |
Expenses before reductions | .25% A | .25% | .25% | .25% | .25% | .25% |
Expenses net of fee waivers, if any | .25% A | .25% | .25% | .25% | .25% | .25% |
Expenses net of all reductions | .25% A | .25% | .25% | .25% | .25% | .25% |
Net investment income (loss) | .49% A | 1.59% | 1.41% | 1.35% | 1.53% | 2.12% |
Supplemental Data | | | | | | |
Net assets, end of period (000 omitted) | $ 574,247 | $ 527,525 | $ 403,850 | $ 320,731 | $ 205,405 | $ 81,985 |
Portfolio turnover rate F | 19% A | 25% | 11% | 32% | 14% | 18% |
A Annualized
B Total returns for periods of less than one year are not annualized.
C Total returns would have been lower if certain expenses had not been reduced during the applicable periods shown.
D Total returns do not include the effect of the sales charges.
E Calculated based on average shares outstanding during the period.
F Amounts do not include the activity of the Underlying Funds.
G Expense ratios reflect operating expenses of the class. Expenses before reductions do not reflect amounts reimbursed by the investment adviser or reductions from expense offset arrangements and do not represent the amount paid by the class during periods when reimbursements or reductions occur. Expenses net of fee waivers reflect expenses after reimbursement by the investment adviser but prior to reductions from expense offset arrangements. Expenses net of all reductions represent the net expenses paid by the class but do not include expenses of the investment companies in which the Fund invests.
See accompanying notes which are an integral part of the financial statements.
Semiannual Report
Financial Highlights - Class T
| Six months ended
September 30, 2013 | Years ended March 31, |
| (Unaudited) | 2013 | 2012 | 2011 | 2010 | 2009 |
Selected Per-Share Data | | | | | | |
Net asset value, beginning of period | $ 10.42 | $ 9.75 | $ 10.04 | $ 8.79 | $ 5.84 | $ 10.36 |
Income from Investment Operations | | | | | | |
Net investment income (loss) E | .01 | .13 | .11 | .10 | .10 | .14 |
Net realized and unrealized gain (loss) | .63 | .82 | (.15) | 1.32 | 3.02 | (4.28) |
Total from investment operations | .64 | .95 | (.04) | 1.42 | 3.12 | (4.14) |
Distributions from net investment income | - K | (.12) | (.10) | (.09) | (.10) | (.12) |
Distributions from net realized gain | (.21) | (.15) | (.16) | (.08) | (.07) | (.26) |
Total distributions | (.22) J | (.28) I | (.25) H | (.17) | (.17) | (.38) |
Net asset value, end of period | $ 10.84 | $ 10.42 | $ 9.75 | $ 10.04 | $ 8.79 | $ 5.84 |
Total Return B, C, D | 6.18% | 10.02% | (.15)% | 16.36% | 53.52% | (41.08)% |
Ratios to Average Net Assets F, G | | | | | | |
Expenses before reductions | .50% A | .50% | .50% | .50% | .50% | .50% |
Expenses net of fee waivers, if any | .50% A | .50% | .50% | .50% | .50% | .50% |
Expenses net of all reductions | .50% A | .50% | .50% | .50% | .50% | .50% |
Net investment income (loss) | .24% A | 1.34% | 1.16% | 1.10% | 1.28% | 1.87% |
Supplemental Data | | | | | | |
Net assets, end of period (000 omitted) | $ 112,222 | $ 92,998 | $ 62,438 | $ 60,268 | $ 43,326 | $ 18,065 |
Portfolio turnover rate F | 19% A | 25% | 11% | 32% | 14% | 18% |
A Annualized
B Total returns for periods of less than one year are not annualized.
C Total returns would have been lower if certain expenses had not been reduced during the applicable periods shown.
D Total returns do not include the effect of the sales charges.
E Calculated based on average shares outstanding during the period.
F Amounts do not include the activity of the Underlying Funds.
G Expense ratios reflect operating expenses of the class. Expenses before reductions do not reflect amounts reimbursed by the investment adviser or reductions from expense offset arrangements and do not represent the amount paid by the class during periods when reimbursements or reductions occur. Expenses net of fee waivers reflect expenses after reimbursement by the investment adviser but prior to reductions from expense offset arrangements. Expenses net of all reductions represent the net expenses paid by the class but do not include expenses of the investment companies in which the Fund invests.
H Total distributions of $.25 per share is comprised of distributions from net investment income of $.096 and distributions from net realized gain of $.155 per share.
I Total distributions of $.28 per share is comprised of distributions from net investment income of $.124 and distributions from net realized gain of $.153 per share.
J Total distributions of $.22 per share is comprised of distributions from net investment income of $.004 and distributions from net realized gain of $.213 per share.
K Amount represents less than $.01 per share.
Financial Highlights - Class B
| Six months ended
September 30, 2013 | Years ended March 31, |
| (Unaudited) | 2013 | 2012 | 2011 | 2010 | 2009 |
Selected Per-Share Data | | | | | | |
Net asset value, beginning of period | $ 10.39 | $ 9.73 | $ 10.01 | $ 8.77 | $ 5.83 | $ 10.33 |
Income from Investment Operations | | | | | | |
Net investment income (loss) E | (.01) | .08 | .06 | .05 | .06 | .11 |
Net realized and unrealized gain (loss) | .63 | .81 | (.14) | 1.32 | 3.01 | (4.27) |
Total from investment operations | .62 | .89 | (.08) | 1.37 | 3.07 | (4.16) |
Distributions from net investment income | - | (.08) | (.05) | (.05) | (.06) | (.08) |
Distributions from net realized gain | (.21) | (.15) | (.15) | (.08) | (.07) | (.26) |
Total distributions | (.21) | (.23) | (.20) | (.13) | (.13) | (.34) |
Net asset value, end of period | $ 10.80 | $ 10.39 | $ 9.73 | $ 10.01 | $ 8.77 | $ 5.83 |
Total Return B, C, D | 6.00% | 9.40% | (.62)% | 15.71% | 52.74% | (41.39)% |
Ratios to Average Net Assets F, G | | | | | | |
Expenses before reductions | 1.00% A | 1.00% | 1.00% | 1.00% | 1.00% | 1.00% |
Expenses net of fee waivers, if any | 1.00% A | 1.00% | 1.00% | 1.00% | 1.00% | 1.00% |
Expenses net of all reductions | 1.00% A | 1.00% | 1.00% | 1.00% | 1.00% | 1.00% |
Net investment income (loss) | (.26)% A | .84% | .66% | .60% | .78% | 1.37% |
Supplemental Data | | | | | | |
Net assets, end of period (000 omitted) | $ 3,562 | $ 3,651 | $ 3,786 | $ 4,612 | $ 4,089 | $ 2,231 |
Portfolio turnover rate F | 19% A | 25% | 11% | 32% | 14% | 18% |
A Annualized
B Total returns for periods of less than one year are not annualized.
C Total returns would have been lower if certain expenses had not been reduced during the applicable periods shown.
D Total returns do not include the effect of the contingent deferred sales charge.
E Calculated based on average shares outstanding during the period.
F Amounts do not include the activity of the Underlying Funds.
G Expense ratios reflect operating expenses of the class. Expenses before reductions do not reflect amounts reimbursed by the investment adviser or reductions from expense offset arrangements and do not represent the amount paid by the class during periods when reimbursements or reductions occur. Expenses net of fee waivers reflect expenses after reimbursement by the investment adviser but prior to reductions from expense offset arrangements. Expenses net of all reductions represent the net expenses paid by the class but do not include expenses of the investment companies in which the Fund invests.
See accompanying notes which are an integral part of the financial statements.
Semiannual Report
Financial Highlights - Class C
| Six months ended
September 30, 2013 | Years ended March 31, |
| (Unaudited) | 2013 | 2012 | 2011 | 2010 | 2009 |
Selected Per-Share Data | | | | | | |
Net asset value, beginning of period | $ 10.36 | $ 9.71 | $ 10.00 | $ 8.76 | $ 5.82 | $ 10.32 |
Income from Investment Operations | | | | | | |
Net investment income (loss) E | (.01) | .08 | .06 | .05 | .06 | .11 |
Net realized and unrealized gain (loss) | .63 | .81 | (.14) | 1.32 | 3.01 | (4.27) |
Total from investment operations | .62 | .89 | (.08) | 1.37 | 3.07 | (4.16) |
Distributions from net investment income | - | (.09) | (.06) | (.06) | (.06) | (.08) |
Distributions from net realized gain | (.21) | (.15) | (.15) | (.08) | (.07) | (.26) |
Total distributions | (.21) | (.24) | (.21) | (.13) H | (.13) | (.34) |
Net asset value, end of period | $ 10.77 | $ 10.36 | $ 9.71 | $ 10.00 | $ 8.76 | $ 5.82 |
Total Return B, C, D | 6.01% | 9.42% | (.62)% | 15.80% | 52.90% | (41.39)% |
Ratios to Average Net Assets F, G | | | | | | |
Expenses before reductions | 1.00% A | 1.00% | 1.00% | 1.00% | 1.00% | 1.00% |
Expenses net of fee waivers, if any | 1.00% A | 1.00% | 1.00% | 1.00% | 1.00% | 1.00% |
Expenses net of all reductions | 1.00% A | 1.00% | 1.00% | 1.00% | 1.00% | 1.00% |
Net investment income (loss) | (.26)% A | .84% | .66% | .60% | .78% | 1.37% |
Supplemental Data | | | | | | |
Net assets, end of period (000 omitted) | $ 15,907 | $ 13,415 | $ 9,926 | $ 8,753 | $ 6,199 | $ 3,027 |
Portfolio turnover rate F | 19% A | 25% | 11% | 32% | 14% | 18% |
A Annualized
B Total returns for periods of less than one year are not annualized.
C Total returns would have been lower if certain expenses had not been reduced during the applicable periods shown.
D Total returns do not include the effect of the contingent deferred sales charge.
E Calculated based on average shares outstanding during the period.
F Amounts do not include the activity of the Underlying Funds.
G Expense ratios reflect operating expenses of the class. Expenses before reductions do not reflect amounts reimbursed by the investment adviser or reductions from expense offset arrangements and do not represent the amount paid by the class during periods when reimbursements or reductions occur. Expenses net of fee waivers reflect expenses after reimbursement by the investment adviser but prior to reductions from expense offset arrangements. Expenses net of all reductions represent the net expenses paid by the class but do not include expenses of the investment companies in which the Fund invests.
H Total distributions of $.13 per share is comprised of distributions from net investment income of $.057 and distributions from net realized gain of $.076 per share.
Financial Highlights - Institutional Class
| Six months ended
September 30, 2013 | Years ended March 31, |
| (Unaudited) | 2013 | 2012 | 2011 | 2010 | 2009 |
Selected Per-Share Data | | | | | | |
Net asset value, beginning of period | $ 10.50 | $ 9.83 | $ 10.11 | $ 8.85 | $ 5.87 | $ 10.41 |
Income from Investment Operations | | | | | | |
Net investment income (loss) D | .04 | .18 | .16 | .15 | .14 | .18 |
Net realized and unrealized gain (loss) | .64 | .81 | (.14) | 1.32 | 3.04 | (4.30) |
Total from investment operations | .68 | .99 | .02 | 1.47 | 3.18 | (4.12) |
Distributions from net investment income | (.02) | (.17) | (.14) | (.13) | (.13) | (.16) |
Distributions from net realized gain | (.21) | (.15) | (.16) | (.08) | (.07) | (.26) |
Total distributions | (.23) | (.32) | (.30) | (.21) | (.20) | (.42) |
Net asset value, end of period | $ 10.95 | $ 10.50 | $ 9.83 | $ 10.11 | $ 8.85 | $ 5.87 |
Total Return B, C | 6.54% | 10.43% | .45% | 16.86% | 54.35% | (40.81)% |
Ratios to Average Net Assets E, G | | | | | | |
Expenses before reductions F | .00% A | .00% | .00% | .00% | .00% | .00% |
Expenses net of fee waivers, if any | .00% A | .00% | .00% | .00% | .00% | .00% |
Expenses net of all reductions | .00% A | .00% | .00% | .00% | .00% | .00% |
Net investment income (loss) | .74% A | 1.84% | 1.66% | 1.60% | 1.78% | 2.37% |
Supplemental Data | | | | | | |
Net assets, end of period (000 omitted) | $ 326,683 | $ 269,633 | $ 162,772 | $ 83,240 | $ 32,842 | $ 12,078 |
Portfolio turnover rate E | 19% A | 25% | 11% | 32% | 14% | 18% |
A Annualized
B Total returns for periods of less than one year are not annualized.
C Total returns would have been lower if certain expenses had not been reduced during the applicable periods shown.
D Calculated based on average shares outstanding during the period.
E Amounts do not include the activity of the Underlying Funds.
F Amount represents less than .01%.
G Expense ratios reflect operating expenses of the class. Expenses before reductions do not reflect amounts reimbursed by the investment adviser or reductions from expense offset arrangements and do not represent the amount paid by the class during periods when reimbursements or reductions occur. Expenses net of fee waivers reflect expenses after reimbursement by the investment adviser but prior to reductions from expense offset arrangements. Expenses net of all reductions represent the net expenses paid by the class but do not include expenses of the investment companies in which the Fund invests.
See accompanying notes which are an integral part of the financial statements.
Semiannual Report
Fidelity Advisor Freedom 2050 Fund
Investment Changes (Unaudited)
The information in the following tables is based on the direct investments of the Fund. |
Fund Holdings as of September 30, 2013 |
| % of fund's net assets | % of fund's net assets
6 months ago |
Commodity Funds | | |
Fidelity Series Commodity Strategy Fund | 9.0 | 9.3 |
Domestic Equity Funds | | |
Fidelity Advisor Equity Growth Fund Institutional Class | 7.6 | 7.4 |
Fidelity Advisor Growth & Income Fund Institutional Class | 0.0 | 4.0 |
Fidelity Advisor Large Cap Fund Institutional Class | 3.8 | 4.0 |
Fidelity Advisor Series Equity-Income Fund | 5.1 | 5.1 |
Fidelity Advisor Series Growth & Income Fund (formerly Fidelity Advisor Series Mega Cap Fund) | 5.0 | 1.1 |
Fidelity Advisor Series Opportunistic Insights Fund | 3.9 | 3.6 |
Fidelity Advisor Series Stock Selector Large Cap Value Fund | 5.1 | 5.1 |
Fidelity Advisor Small Cap Fund Institutional Class | 3.0 | 3.0 |
Fidelity Series 100 Index Fund | 1.2 | 1.2 |
Fidelity Series All-Sector Equity Fund | 9.5 | 9.8 |
Fidelity Series Large Cap Value Fund | 5.1 | 5.6 |
Fidelity Series Real Estate Equity Fund | 0.7 | 0.8 |
Fidelity Series Small Cap Opportunities Fund | 3.4 | 3.5 |
| 53.4 | 54.2 |
Developed International Equity Funds | | |
Fidelity Series International Growth Fund | 8.3 | 8.1 |
Fidelity Series International Small Cap Fund | 1.7 | 1.7 |
Fidelity Series International Value Fund | 8.2 | 8.0 |
| 18.2 | 17.8 |
Emerging Markets Equity Funds | | |
Fidelity Series Emerging Markets Fund | 5.3 | 4.9 |
High Yield Bond Funds | | |
Fidelity Series Emerging Markets Debt Fund | 0.7 | 0.7 |
Fidelity Series Floating Rate High Income Fund | 0.1 | 0.1 |
Fidelity Series High Income Fund | 9.1 | 9.2 |
Fidelity Series Real Estate Income Fund | 0.3 | 0.3 |
| 10.2 | 10.3 |
Investment Grade Bond Funds | | |
Fidelity Series Investment Grade Bond Fund | 3.9 | 3.5 |
Net Other Assets (Liabilities)* | 0.0 | 0.0 |
| 100.0 | 100.0 |
* Amount represents less than 0.1% |
Asset Allocation (% of fund's net assets) |
Period end |
| Commodity Funds | 9.0% | |
| Domestic Equity Funds | 53.4% | |
| Developed International Equity Funds | 18.2% | |
| Emerging Markets Equity Funds | 5.3% | |
| High Yield Bond Funds | 10.2% | |
| Investment Grade Bond Funds | 3.9% | |

Six months ago |
| Commodity Funds | 9.3% | |
| Domestic Equity Funds | 54.2% | |
| Developed International Equity Funds | 17.8% | |
| Emerging Markets Equity Funds | 4.9% | |
| High Yield Bond Funds | 10.3% | |
| Investment Grade Bond Funds | 3.5% | |

Semiannual Report
Fidelity Advisor Freedom 2050 Fund
Investments September 30, 2013 (Unaudited)
Showing Percentage of Net Assets
Domestic Equity Funds - 62.4% |
| Shares | | Value |
Commodity Funds - 9.0% |
Fidelity Series Commodity Strategy Fund (a)(b) | 8,565,639 | | $ 68,610,767 |
Domestic Equity Funds - 53.4% |
Fidelity Advisor Equity Growth Fund Institutional Class (b) | 704,095 | | 57,932,930 |
Fidelity Advisor Large Cap Fund Institutional Class (b) | 1,075,459 | | 28,929,854 |
Fidelity Advisor Series Equity-Income Fund (b) | 3,305,116 | | 38,967,319 |
Fidelity Advisor Series Growth & Income Fund (b) | 3,146,681 | | 37,917,506 |
Fidelity Advisor Series Opportunistic Insights Fund (b) | 2,275,673 | | 29,310,670 |
Fidelity Advisor Series Stock Selector Large Cap Value Fund (b) | 3,175,200 | | 38,642,185 |
Fidelity Advisor Small Cap Fund Institutional Class (b) | 742,422 | | 22,629,030 |
Fidelity Series 100 Index Fund (b) | 810,405 | | 8,979,291 |
Fidelity Series All-Sector Equity Fund (b) | 5,087,436 | | 72,038,096 |
Fidelity Series Large Cap Value Fund (b) | 3,056,166 | | 38,599,373 |
Fidelity Series Real Estate Equity Fund (b) | 472,384 | | 5,649,710 |
Fidelity Series Small Cap Opportunities Fund (b) | 2,038,913 | | 26,159,257 |
TOTAL DOMESTIC EQUITY FUNDS | | 405,755,221 |
TOTAL DOMESTIC EQUITY FUNDS (Cost $398,242,218) |
474,365,988
|
International Equity Funds - 23.5% |
| | | |
Developed International Equity Funds - 18.2% |
Fidelity Series International Growth Fund (b) | 4,631,545 | | 62,850,066 |
Fidelity Series International Small Cap Fund (b) | 850,255 | | 13,000,404 |
Fidelity Series International Value Fund (b) | 5,838,814 | | 62,767,252 |
TOTAL DEVELOPED INTERNATIONAL EQUITY FUNDS | | 138,617,722 |
|
| Shares | | Value |
Emerging Markets Equity Funds - 5.3% |
Fidelity Series Emerging Markets Fund (b) | 2,380,519 | | $ 39,849,882 |
TOTAL INTERNATIONAL EQUITY FUNDS (Cost $150,662,106) |
178,467,604
|
Bond Funds - 14.1% |
| | | |
High Yield Bond Funds - 10.2% |
Fidelity Series Emerging Markets Debt Fund (b) | 500,664 | | 5,066,720 |
Fidelity Series Floating Rate High Income Fund (b) | 69,265 | | 732,820 |
Fidelity Series High Income Fund (b) | 6,769,229 | | 69,587,672 |
Fidelity Series Real Estate Income Fund (b) | 200,972 | | 2,206,673 |
TOTAL HIGH YIELD BOND FUNDS | | 77,593,885 |
Investment Grade Bond Funds - 3.9% |
Fidelity Series Investment Grade Bond Fund (b) | 2,640,893 | | 29,551,592 |
TOTAL BOND FUNDS (Cost $106,791,251) |
107,145,477
|
TOTAL INVESTMENT PORTFOLIO - 100.0% (Cost $655,695,575) | | 759,979,069 |
NET OTHER ASSETS (LIABILITIES) - 0.0% | | (142,913) |
NET ASSETS - 100% | $ 759,836,156 |
Legend |
(a) Non-income producing |
(b) Affiliated company |
Affiliated Underlying Funds |
Information regarding the Fund's fiscal year to date purchases and sales of the affiliated Underlying Funds and income earned by the Fund from investments in affiliated Underlying Funds is as follows: |
Affiliate | Value,
beginning of
period | Purchases | Sales
Proceeds | Dividend
Income | Value,
end of
period |
Fidelity Advisor Equity Growth Fund Institutional Class | $ 49,195,874 | $ 4,155,739 | $ 3,484,610 | $ - | $ 57,932,930 |
Fidelity Advisor Growth & Income Fund Institutional Class | 26,225,977 | 1,639,698 | 30,192,915 | - | - |
Fidelity Advisor Large Cap Fund Institutional Class | 26,484,651 | 1,906,510 | 2,947,481 | - | 28,929,854 |
Fidelity Advisor Series Equity-Income Fund | 33,840,493 | 4,339,203 | 1,282,723 | 349,660 | 38,967,319 |
Fidelity Advisor Series Growth & Income Fund (formerly Fidelity Advisor Series Mega Cap Fund) | 7,498,583 | 29,891,403 | 571,381 | - | 37,917,506 |
Fidelity Advisor Series Opportunistic Insights Fund | 23,924,742 | 2,215,362 | 1,041,215 | - | 29,310,670 |
Fidelity Advisor Series Stock Selector Large Cap Value Fund | 34,081,404 | 3,033,126 | 1,533,909 | - | 38,642,185 |
Fidelity Advisor Small Cap Fund Institutional Class | 20,231,800 | 1,649,079 | 1,912,481 | - | 22,629,030 |
Fidelity Series 100 Index Fund | 8,202,815 | 687,319 | 523,734 | - | 8,979,291 |
Fidelity Series All-Sector Equity Fund | 65,230,846 | 4,805,345 | 4,740,540 | - | 72,038,096 |
Fidelity Series Commodity Strategy Fund | 62,055,569 | 14,188,498 | 2,566,818 | - | 68,610,767 |
Fidelity Series Emerging Markets Debt Fund | 4,719,827 | 864,261 | 155,262 | 128,999 | 5,066,720 |
Fidelity Series Emerging Markets Fund | 32,667,017 | 7,618,893 | 700,047 | - | 39,849,882 |
Fidelity Series Floating Rate High Income Fund | 496,860 | 268,215 | 27,934 | 13,982 | 732,820 |
Fidelity Series High Income Fund | 61,428,717 | 11,373,878 | 1,751,118 | 1,720,206 | 69,587,672 |
Fidelity Series International Growth Fund | 53,789,744 | 6,662,779 | 1,808,390 | - | 62,850,066 |
Fidelity Series International Small Cap Fund | 10,942,294 | 1,111,229 | 361,842 | - | 13,000,404 |
Fidelity Series International Value Fund | 53,369,497 | 5,663,459 | 1,547,868 | - | 62,767,252 |
Fidelity Series Investment Grade Bond Fund | 23,478,771 | 8,777,263 | 1,891,434 | 283,735 | 29,551,592 |
Fidelity Series Large Cap Value Fund | 37,173,024 | 2,631,191 | 4,379,226 | - | 38,599,373 |
Fidelity Series Real Estate Equity Fund | 5,424,779 | 825,337 | 128,725 | 37,168 | 5,649,710 |
Fidelity Series Real Estate Income Fund | 2,040,650 | 363,389 | 65,125 | 63,865 | 2,206,673 |
Fidelity Series Small Cap Opportunities Fund | 23,559,633 | 3,801,015 | 2,237,250 | - | 26,159,257 |
Total | $ 666,063,567 | $ 118,472,191 | $ 65,852,028 | $ 2,597,615 | $ 759,979,069 |
Other Information |
All investments are categorized as Level 1 under the Fair Value Hierarchy. The inputs or methodology used for valuing securities may not be an indication of the risk associated with investing in those securities. For more information on valuation inputs, please refer to the Investment Valuation section in the accompanying Notes to Financial Statements. |
See accompanying notes which are an integral part of the financial statements.
Semiannual Report
Fidelity Advisor Freedom 2050 Fund
Statement of Assets and Liabilities
| September 30, 2013 (Unaudited) |
| | |
Assets | | |
Investment in securities, at value (cost $655,695,575) - See accompanying schedule | | $ 759,979,069 |
Receivable for investments sold | | 2,587,538 |
Receivable for fund shares sold | | 1,315,242 |
Receivable from investment adviser for expense reductions | | 503 |
Total assets | | 763,882,352 |
| | |
Liabilities | | |
Payable to custodian bank | $ 2 | |
Payable for investments purchased | 17,989 | |
Payable for fund shares redeemed | 3,884,772 | |
Distribution and service plan fees payable | 143,433 | |
Total liabilities | | 4,046,196 |
| | |
Net Assets | | $ 759,836,156 |
Net Assets consist of: | | |
Paid in capital | | $ 642,526,232 |
Undistributed net investment income | | 1,783,950 |
Accumulated undistributed net realized gain (loss) on investments | | 11,242,480 |
Net unrealized appreciation (depreciation) on investments | | 104,283,494 |
Net Assets | | $ 759,836,156 |
| | |
Calculation of Maximum Offering Price Class A:
Net Asset Value and redemption price per share ($387,127,807 ÷ 35,733,530 shares) | | $ 10.83 |
| | |
Maximum offering price per share (100/94.25 of $10.83) | | $ 11.49 |
Class T:
Net Asset Value and redemption price per share ($103,263,695 ÷ 9,568,027 shares) | | $ 10.79 |
| | |
Maximum offering price per share (100/96.50 of $10.79) | | $ 11.18 |
Class B:
Net Asset Value and offering price per share ($5,385,668 ÷ 502,150 shares)A | | $ 10.73 |
| | |
Class C:
Net Asset Value and offering price per share ($18,756,231 ÷ 1,749,164 shares)A | | $ 10.72 |
| | |
Institutional Class:
Net Asset Value, offering price and redemption price per share ($245,302,755 ÷ 22,519,174 shares) | | $ 10.89 |
A Redemption price per share is equal to net asset value less any applicable contingent deferred sales charge.
Statement of Operations
Six months ended September 30, 2013 (Unaudited) |
| | |
Investment Income | | |
Income distributions from underlying funds | | $ 2,597,615 |
| | |
Expenses | | |
Distribution and service plan fees | $ 824,986 | |
Independent trustees' compensation | 1,304 | |
Total expenses before reductions | 826,290 | |
Expense reductions | (1,304) | 824,986 |
Net investment income (loss) | | 1,772,629 |
Realized and Unrealized Gain (Loss) Realized gain (loss) on sale of underlying fund shares | 11,235,706 | |
Capital gain distributions from underlying funds | 2,191,560 | |
Total net realized gain (loss) | | 13,427,266 |
Change in net unrealized appreciation (depreciation) on underlying funds | | 30,059,655 |
Net gain (loss) | | 43,486,921 |
Net increase (decrease) in net assets resulting from operations | | $ 45,259,550 |
See accompanying notes which are an integral part of the financial statements.
Semiannual Report
Fidelity Advisor Freedom 2050 Fund
Financial Statements - continued
Statement of Changes in Net Assets
| Six months ended
September 30, 2013
(Unaudited) | Year ended
March 31,
2013 |
Increase (Decrease) in Net Assets | | |
Operations | | |
Net investment income (loss) | $ 1,772,629 | $ 8,705,827 |
Net realized gain (loss) | 13,427,266 | 15,586,075 |
Change in net unrealized appreciation (depreciation) | 30,059,655 | 35,894,143 |
Net increase (decrease) in net assets resulting from operations | 45,259,550 | 60,186,045 |
Distributions to shareholders from net investment income | (646,292) | (8,370,984) |
Distributions to shareholders from net realized gain | (14,050,089) | (2,615,729) |
Total distributions | (14,696,381) | (10,986,713) |
Share transactions - net increase (decrease) | 63,335,238 | 126,263,908 |
Total increase (decrease) in net assets | 93,898,407 | 175,463,240 |
| | |
Net Assets | | |
Beginning of period | 665,937,749 | 490,474,509 |
End of period (including undistributed net investment income of $1,783,950 and undistributed net investment income of $657,613, respectively) | $ 759,836,156 | $ 665,937,749 |
Financial Highlights - Class A
| Six months ended September 30, 2013 | Years ended March 31, |
| (Unaudited) | 2013 | 2012 | 2011 | 2010 | 2009 |
Selected Per-Share Data | | | | | | |
Net asset value, beginning of period | $ 10.39 | $ 9.61 | $ 9.93 | $ 8.66 | $ 5.67 | $ 10.32 |
Income from Investment Operations | | | | | | |
Net investment income (loss) E | .03 | .15 | .12 | .11 | .11 | .16 |
Net realized and unrealized gain (loss) | .63 | .82 | (.17) | 1.34 | 3.05 | (4.39) |
Total from investment operations | .66 | .97 | (.05) | 1.45 | 3.16 | (4.23) |
Distributions from net investment income | (.01) | (.14) | (.11) | (.11) | (.10) | (.13) |
Distributions from net realized gain | (.21) | (.05) | (.16) | (.08) | (.07) | (.30) |
Total distributions | (.22) | (.19) | (.27) | (.18) I | (.17) | (.42) H |
Net asset value, end of period | $ 10.83 | $ 10.39 | $ 9.61 | $ 9.93 | $ 8.66 | $ 5.67 |
Total Return B, C, D | 6.45% | 10.23% | (.22)% | 16.99% | 55.94% | (42.30)% |
Ratios to Average Net Assets F, G | | | | | | |
Expenses before reductions | .25% A | .25% | .25% | .25% | .25% | .25% |
Expenses net of fee waivers, if any | .25% A | .25% | .25% | .25% | .25% | .25% |
Expenses net of all reductions | .25% A | .25% | .25% | .25% | .25% | .25% |
Net investment income (loss) | .48% A | 1.56% | 1.32% | 1.23% | 1.43% | 2.04% |
Supplemental Data | | | | | | |
Net assets, end of period (000 omitted) | $ 387,128 | $ 352,814 | $ 280,478 | $ 220,549 | $ 137,716 | $ 57,591 |
Portfolio turnover rate F | 18% A | 28% | 12% | 36% | 15% | 16% |
A Annualized
B Total returns for periods of less than one year are not annualized.
C Total returns would have been lower if certain expenses had not been reduced during the applicable periods shown.
D Total returns do not include the effect of the sales charges.
E Calculated based on average shares outstanding during the period.
F Amounts do not include the activity of the Underlying Funds.
G Expense ratios reflect operating expenses of the class. Expenses before reductions do not reflect amounts reimbursed by the investment adviser or reductions from expense offset arrangements and do not represent the amount paid by the class during periods when reimbursements or reductions occur. Expenses net of fee waivers reflect expenses after reimbursement by the investment adviser but prior to reductions from expense offset arrangements. Expenses net of all reductions represent the net expenses paid by the class but do not include expenses of the investment companies in which the Fund invests.
H Total distributions of $.42 per share is comprised of distributions from net investment income of $.127 and distributions from net realized gain of $.295 per share.
I Total distributions of $.18 per share is comprised of distributions from net investment income of $.105 and distributions from net realized gain of $.079 per share.
See accompanying notes which are an integral part of the financial statements.
Semiannual Report
Financial Highlights - Class T
| Six months ended September 30, 2013 | Years ended March 31, |
| (Unaudited) | 2013 | 2012 | 2011 | 2010 | 2009 |
Selected Per-Share Data | | | | | | |
Net asset value, beginning of period | $ 10.36 | $ 9.58 | $ 9.90 | $ 8.64 | $ 5.66 | $ 10.30 |
Income from Investment Operations | | | | | | |
Net investment income (loss) E | .01 | .13 | .10 | .09 | .09 | .14 |
Net realized and unrealized gain (loss) | .64 | .81 | (.17) | 1.33 | 3.05 | (4.37) |
Total from investment operations | .65 | .94 | (.07) | 1.42 | 3.14 | (4.23) |
Distributions from net investment income | - L | (.12) | (.09) | (.09) | (.09) | (.11) |
Distributions from net realized gain | (.21) | (.05) | (.16) | (.08) | (.07) | (.30) |
Total distributions | (.22) K | (.16) J | (.25) | (.16) I | (.16) | (.41) H |
Net asset value, end of period | $ 10.79 | $ 10.36 | $ 9.58 | $ 9.90 | $ 8.64 | $ 5.66 |
Total Return B, C, D | 6.32% | 9.99% | (.48)% | 16.66% | 55.57% | (42.41)% |
Ratios to Average Net Assets F, G | | | | | | |
Expenses before reductions | .50% A | .50% | .50% | .50% | .50% | .50% |
Expenses net of fee waivers, if any | .50% A | .50% | .50% | .50% | .50% | .50% |
Expenses net of all reductions | .50% A | .50% | .50% | .50% | .50% | .50% |
Net investment income (loss) | .23% A | 1.31% | 1.07% | .98% | 1.18% | 1.79% |
Supplemental Data | | | | | | |
Net assets, end of period (000 omitted) | $ 103,264 | $ 89,196 | $ 64,512 | $ 61,195 | $ 46,449 | $ 21,186 |
Portfolio turnover rate F | 18% A | 28% | 12% | 36% | 15% | 16% |
A Annualized
B Total returns for periods of less than one year are not annualized.
C Total returns would have been lower if certain expenses had not been reduced during the applicable periods shown.
D Total returns do not include the effect of the sales charges.
E Calculated based on average shares outstanding during the period.
F Amounts do not include the activity of the Underlying Funds.
G Expense ratios reflect operating expenses of the class. Expenses before reductions do not reflect amounts reimbursed by the investment adviser or reductions from expense offset arrangements and do not represent the amount paid by the class during periods when reimbursements or reductions occur. Expenses net of fee waivers reflect expenses after reimbursement by the investment adviser but prior to reductions from expense offset arrangements. Expenses net of all reductions represent the net expenses paid by the class but do not include expenses of the investment companies in which the Fund invests.
H Total distributions of $.41 per share is comprised of distributions from net investment income of $.112 and distributions from net realized gain of $.295 per share.
I Total distributions of $.16 per share is comprised of distributions from net investment income of $.085 and distributions from net realized gain of $.079 per share.
J Total distributions of $.16 per share is comprised of distributions from net investment income of $.117 and distributions from net realized gain of $.046 per share.
K Total distributions of $.22 per share is comprised of distributions from net investment income of $.004 and distributions from net realized gain of $.214 per share.
L Amount represents less than $.01 per share.
Financial Highlights - Class B
| Six months ended September 30, 2013 | Years ended March 31, |
| (Unaudited) | 2013 | 2012 | 2011 | 2010 | 2009 |
Selected Per-Share Data | | | | | | |
Net asset value, beginning of period | $ 10.31 | $ 9.54 | $ 9.86 | $ 8.60 | $ 5.64 | $ 10.26 |
Income from Investment Operations | | | | | | |
Net investment income (loss) E | (.01) | .08 | .05 | .04 | .05 | .10 |
Net realized and unrealized gain (loss) | .63 | .81 | (.17) | 1.34 | 3.03 | (4.35) |
Total from investment operations | .62 | .89 | (.12) | 1.38 | 3.08 | (4.25) |
Distributions from net investment income | - | (.08) | (.05) | (.05) | (.05) | (.08) |
Distributions from net realized gain | (.20) | (.05) | (.15) | (.07) | (.07) | (.29) |
Total distributions | (.20) | (.12) I | (.20) | (.12) | (.12) | (.37) H |
Net asset value, end of period | $ 10.73 | $ 10.31 | $ 9.54 | $ 9.86 | $ 8.60 | $ 5.64 |
Total Return B, C, D | 6.11% | 9.47% | (1.06)% | 16.16% | 54.72% | (42.71)% |
Ratios to Average Net Assets F, G | | | | | | |
Expenses before reductions | 1.00% A | 1.00% | 1.00% | 1.00% | 1.00% | 1.00% |
Expenses net of fee waivers, if any | 1.00% A | 1.00% | 1.00% | 1.00% | 1.00% | 1.00% |
Expenses net of all reductions | 1.00% A | 1.00% | 1.00% | 1.00% | 1.00% | 1.00% |
Net investment income (loss) | (.27)% A | .81% | .57% | .48% | .68% | 1.29% |
Supplemental Data | | | | | | |
Net assets, end of period (000 omitted) | $ 5,386 | $ 5,532 | $ 5,643 | $ 6,704 | $ 5,847 | $ 3,078 |
Portfolio turnover rate F | 18% A | 28% | 12% | 36% | 15% | 16% |
A Annualized
B Total returns for periods of less than one year are not annualized.
C Total returns would have been lower if certain expenses had not been reduced during the applicable periods shown.
D Total returns do not include the effect of the contingent deferred sales charge.
E Calculated based on average shares outstanding during the period.
F Amounts do not include the activity of the Underlying Funds.
G Expense ratios reflect operating expenses of the class. Expenses before reductions do not reflect amounts reimbursed by the investment adviser or reductions from expense offset arrangements and do not represent the amount paid by the class during periods when reimbursements or reductions occur. Expenses net of fee waivers reflect expenses after reimbursement by the investment adviser but prior to reductions from expense offset arrangements. Expenses net of all reductions represent the net expenses paid by the class but do not include expenses of the investment companies in which the Fund invests.
H Total distributions of $.37 per share is comprised of distributions from net investment income of $.078 and distributions from net realized gain of $.290 per share.
I Total distributions of $.12 per share is comprised of distributions from net investment income of $.077 and distributions from net realized gain of $.046 per share.
See accompanying notes which are an integral part of the financial statements.
Semiannual Report
Financial Highlights - Class C
| Six months ended September 30, 2013 | Years ended March 31, |
| (Unaudited) | 2013 | 2012 | 2011 | 2010 | 2009 |
Selected Per-Share Data | | | | | | |
Net asset value, beginning of period | $ 10.31 | $ 9.54 | $ 9.87 | $ 8.61 | $ 5.63 | $ 10.25 |
Income from Investment Operations | | | | | | |
Net investment income (loss) E | (.01) | .08 | .05 | .04 | .05 | .10 |
Net realized and unrealized gain (loss) | .62 | .82 | (.18) | 1.34 | 3.05 | (4.35) |
Total from investment operations | .61 | .90 | (.13) | 1.38 | 3.10 | (4.25) |
Distributions from net investment income | - | (.08) | (.05) | (.05) | (.05) | (.08) |
Distributions from net realized gain | (.20) | (.05) | (.15) | (.07) | (.07) | (.29) |
Total distributions | (.20) | (.13) | (.20) | (.12) | (.12) | (.37) H |
Net asset value, end of period | $ 10.72 | $ 10.31 | $ 9.54 | $ 9.87 | $ 8.61 | $ 5.63 |
Total Return B, C, D | 6.01% | 9.53% | (1.08)% | 16.16% | 55.15% | (42.74)% |
Ratios to Average Net Assets F, G | | | | | | |
Expenses before reductions | 1.00% A | 1.00% | 1.00% | 1.00% | 1.00% | 1.00% |
Expenses net of fee waivers, if any | 1.00% A | 1.00% | 1.00% | 1.00% | 1.00% | 1.00% |
Expenses net of all reductions | 1.00% A | 1.00% | 1.00% | 1.00% | 1.00% | 1.00% |
Net investment income (loss) | (.27)% A | .81% | .57% | .48% | .68% | 1.29% |
Supplemental Data | | | | | | |
Net assets, end of period (000 omitted) | $ 18,756 | $ 16,188 | $ 13,344 | $ 12,014 | $ 9,646 | $ 5,436 |
Portfolio turnover rate F | 18% A | 28% | 12% | 36% | 15% | 16% |
A Annualized
B Total returns for periods of less than one year are not annualized.
C Total returns would have been lower if certain expenses had not been reduced during the applicable periods shown.
D Total returns do not include the effect of the contingent deferred sales charge.
E Calculated based on average shares outstanding during the period.
F Amounts do not include the activity of the Underlying Funds.
G Expense ratios reflect operating expenses of the class. Expenses before reductions do not reflect amounts reimbursed by the investment adviser or reductions from expense offset arrangements and do not represent the amount paid by the class during periods when reimbursements or reductions occur. Expenses net of fee waivers reflect expenses after reimbursement by the investment adviser but prior to reductions from expense offset arrangements. Expenses net of all reductions represent the net expenses paid by the class but do not include expenses of the investment companies in which the Fund invests.
H Total distributions of $.37 per share is comprised of distributions from net investment income of $.080 and distributions from net realized gain of $.290 per share.
Financial Highlights - Institutional Class
| Six months ended September 30, 2013 | Years ended March 31, |
| (Unaudited) | 2013 | 2012 | 2011 | 2010 | 2009 |
Selected Per-Share Data | | | | | | |
Net asset value, beginning of period | $ 10.44 | $ 9.65 | $ 9.97 | $ 8.70 | $ 5.68 | $ 10.35 |
Income from Investment Operations | | | | | | |
Net investment income (loss) D | .04 | .18 | .15 | .13 | .13 | .17 |
Net realized and unrealized gain (loss) | .64 | .82 | (.18) | 1.34 | 3.08 | (4.40) |
Total from investment operations | .68 | 1.00 | (.03) | 1.47 | 3.21 | (4.23) |
Distributions from net investment income | (.02) | (.16) | (.13) | (.13) | (.12) | (.15) |
Distributions from net realized gain | (.21) | (.05) | (.16) | (.08) | (.07) | (.30) |
Total distributions | (.23) | (.21) | (.29) | (.20) I | (.19) | (.44) H |
Net asset value, end of period | $ 10.89 | $ 10.44 | $ 9.65 | $ 9.97 | $ 8.70 | $ 5.68 |
Total Return B, C | 6.58% | 10.55% | .02% | 17.17% | 56.66% | (42.22)% |
Ratios to Average Net Assets E, G | | | | | | |
Expenses before reductions F | .00% A | .00% | .00% | .00% | .00% | .00% |
Expenses net of fee waivers, if any | .00% A | .00% | .00% | .00% | .00% | .00% |
Expenses net of all reductions | .00% A | .00% | .00% | .00% | .00% | .00% |
Net investment income (loss) | .73% A | 1.81% | 1.57% | 1.48% | 1.68% | 2.29% |
Supplemental Data | | | | | | |
Net assets, end of period (000 omitted) | $ 245,303 | $ 202,208 | $ 126,497 | $ 62,785 | $ 40,214 | $ 15,010 |
Portfolio turnover rate E | 18% A | 28% | 12% | 36% | 15% | 16% |
A Annualized
B Total returns for periods of less than one year are not annualized.
C Total returns would have been lower if certain expenses had not been reduced during the applicable periods shown.
D Calculated based on average shares outstanding during the period.
E Amounts do not include the activity of the Underlying Funds.
F Amount represents less than .01%.
G Expense ratios reflect operating expenses of the class. Expenses before reductions do not reflect amounts reimbursed by the investment adviser or reductions from expense offset arrangements and do not represent the amount paid by the class during periods when reimbursements or reductions occur. Expenses net of fee waivers reflect expenses after reimbursement by the investment adviser but prior to reductions from expense offset arrangements. Expenses net of all reductions represent the net expenses paid by the class but do not include expenses of the investment companies in which the Fund invests.
H Total distributions of $.44 per share is comprised of distributions from net investment income of $.146 and distributions from net realized gain of $.295 per share.
I Total distributions of $.20 per share is comprised of distributions from net investment income of $.125 and distributions from net realized gain of $.078 per share.
See accompanying notes which are an integral part of the financial statements.
Semiannual Report
Fidelity Advisor Freedom 2055 Fund
Investment Changes (Unaudited)
The information in the following tables is based on the direct investments of the Fund. |
Fund Holdings as of September 30, 2013 |
| % of fund's
net assets | % of fund's net assets
6 months ago |
Commodity Funds | | |
Fidelity Series Commodity Strategy Fund | 9.5 | 9.7 |
Domestic Equity Funds | | |
Fidelity Advisor Equity Growth Fund Institutional Class | 7.9 | 8.0 |
Fidelity Advisor Growth & Income Fund Institutional Class | 0.0 | 4.4 |
Fidelity Advisor Large Cap Fund Institutional Class | 4.0 | 4.4 |
Fidelity Advisor Series Equity-Income Fund | 5.3 | 4.5 |
Fidelity Advisor Series Growth & Income Fund (formerly Fidelity Advisor Series Mega Cap Fund) | 5.2 | 1.0 |
Fidelity Advisor Series Opportunistic Insights Fund | 4.1 | 3.2 |
Fidelity Advisor Series Stock Selector Large Cap Value Fund | 5.3 | 4.5 |
Fidelity Advisor Small Cap Fund Institutional Class | 3.1 | 3.3 |
Fidelity Series 100 Index Fund | 1.3 | 1.5 |
Fidelity Series All-Sector Equity Fund | 9.9 | 10.6 |
Fidelity Series Large Cap Value Fund | 5.5 | 6.2 |
Fidelity Series Real Estate Equity Fund | 0.8 | 0.9 |
Fidelity Series Small Cap Opportunities Fund | 3.6 | 3.8 |
| 56.0 | 56.3 |
Developed International Equity Funds | | |
Fidelity Series International Growth Fund | 8.7 | 8.4 |
Fidelity Series International Small Cap Fund | 1.8 | 1.7 |
Fidelity Series International Value Fund | 8.6 | 8.4 |
| 19.1 | 18.5 |
Emerging Markets Equity Funds | | |
Fidelity Series Emerging Markets Fund | 5.4 | 5.3 |
High Yield Bond Funds | | |
Fidelity Series Emerging Markets Debt Fund | 0.6 | 0.6 |
Fidelity Series Floating Rate High Income Fund | 0.0* | 0.0* |
Fidelity Series High Income Fund | 9.1 | 9.3 |
Fidelity Series Real Estate Income Fund | 0.2 | 0.2 |
| 9.9 | 10.1 |
Investment Grade Bond Funds | | |
Fidelity Series Investment Grade Bond Fund | 0.1 | 0.1 |
Net Other Assets (Liabilities)* | 0.0 | 0.0 |
| 100.0 | 100.0 |
* Amount represents less than 0.1% |
Asset Allocation (% of fund's net assets) |
Period end |
| Commodity Funds | 9.5% | |
| Domestic Equity Funds | 56.0% | |
| Developed International Equity Funds | 19.1% | |
| Emerging Markets Equity Funds | 5.4% | |
| High Yield Bond Funds | 9.9% | |
| Investment Grade Bond Funds | 0.1% | |

Six months ago |
| Commodity Funds | 9.7% | |
| Domestic Equity Funds | 56.3% | |
 | Developed International Equity Funds | 18.5% | |
| Emerging Markets Equity Funds | 5.3% | |
| High Yield Bond Funds | 10.1% | |
| Investment Grade Bond Funds | 0.1% | |

Semiannual Report
Fidelity Advisor Freedom 2055 Fund
Investments September 30, 2013 (Unaudited)
Showing Percentage of Net Assets
Domestic Equity Funds - 65.5% |
| Shares | | Value |
Commodity Funds - 9.5% |
Fidelity Series Commodity Strategy Fund (a)(b) | 1,265,283 | | $ 10,134,916 |
Domestic Equity Funds - 56.0% |
Fidelity Advisor Equity Growth Fund Institutional Class (b) | 102,264 | | 8,414,279 |
Fidelity Advisor Large Cap Fund Institutional Class (b) | 158,921 | | 4,274,983 |
Fidelity Advisor Series Equity-Income Fund (b) | 477,120 | | 5,625,240 |
Fidelity Advisor Series Growth & Income Fund (b) | 461,576 | | 5,561,986 |
Fidelity Advisor Series Opportunistic Insights Fund (b) | 334,406 | | 4,307,151 |
Fidelity Advisor Series Stock Selector Large Cap Value Fund (b) | 467,747 | | 5,692,478 |
Fidelity Advisor Small Cap Fund Institutional Class (b) | 108,807 | | 3,316,447 |
Fidelity Series 100 Index Fund (b) | 122,779 | | 1,360,389 |
Fidelity Series All-Sector Equity Fund (b) | 745,815 | | 10,560,737 |
Fidelity Series Large Cap Value Fund (b) | 463,525 | | 5,854,325 |
Fidelity Series Real Estate Equity Fund (b) | 72,949 | | 872,475 |
Fidelity Series Small Cap Opportunities Fund (b) | 299,753 | | 3,845,835 |
TOTAL DOMESTIC EQUITY FUNDS | | 59,686,325 |
TOTAL DOMESTIC EQUITY FUNDS (Cost $64,350,471) |
69,821,241
|
International Equity Funds - 24.5% |
| | | |
Developed International Equity Funds - 19.1% |
Fidelity Series International Growth Fund (b) | 682,409 | | 9,260,295 |
Fidelity Series International Small Cap Fund (b) | 122,370 | | 1,871,041 |
Fidelity Series International Value Fund (b) | 858,298 | | 9,226,706 |
TOTAL DEVELOPED INTERNATIONAL EQUITY FUNDS | | 20,358,042 |
|
| Shares | | Value |
Emerging Markets Equity Funds - 5.4% |
Fidelity Series Emerging Markets Fund (b) | 346,173 | | $ 5,794,932 |
TOTAL INTERNATIONAL EQUITY FUNDS (Cost $23,803,949) |
26,152,974
|
Bond Funds - 10.0% |
| | | |
High Yield Bond Funds - 9.9% |
Fidelity Series Emerging Markets Debt Fund (b) | 64,724 | | 655,008 |
Fidelity Series Floating Rate High Income Fund (b) | 896 | | 9,477 |
Fidelity Series High Income Fund (b) | 942,156 | | 9,685,363 |
Fidelity Series Real Estate Income Fund (b) | 23,279 | | 255,600 |
TOTAL HIGH YIELD BOND FUNDS | | 10,605,448 |
Investment Grade Bond Funds - 0.1% |
Fidelity Series Investment Grade Bond Fund (b) | 9,204 | | 102,995 |
TOTAL BOND FUNDS (Cost $10,752,670) |
10,708,443
|
TOTAL INVESTMENT PORTFOLIO - 100.0% (Cost $98,907,090) | | 106,682,658 |
NET OTHER ASSETS (LIABILITIES) - 0.0% | | (17,838) |
NET ASSETS - 100% | $ 106,664,820 |
Legend |
(a) Non-income producing |
(b) Affiliated company |
Affiliated Underlying Funds |
Information regarding the Fund's fiscal year to date purchases and sales of the affiliated Underlying Funds and income earned by the Fund from investments in affiliated Underlying Funds is as follows: |
Affiliate | Value,
beginning of
period | Purchases | Sales
Proceeds | Dividend
Income | Value,
end of
period |
Fidelity Advisor Equity Growth Fund Institutional Class | $ 4,717,573 | $ 2,785,247 | $ 79,853 | $ - | $ 8,414,279 |
Fidelity Advisor Growth & Income Fund Institutional Class | 2,595,183 | 971,502 | 3,818,648 | - | - |
Fidelity Advisor Large Cap Fund Institutional Class | 2,597,322 | 1,365,168 | 90,605 | - | 4,274,983 |
Fidelity Advisor Series Equity-Income Fund | 2,664,286 | 2,793,115 | 48,624 | 36,301 | 5,625,240 |
Fidelity Advisor Series Growth & Income Fund (formerly Fidelity Advisor Series Mega Cap Fund) | 597,982 | 4,860,499 | 26,358 | - | 5,561,986 |
Fidelity Advisor Series Opportunistic Insights Fund | 1,895,518 | 1,926,607 | 37,413 | - | 4,307,151 |
Fidelity Advisor Series Stock Selector Large Cap Value Fund | 2,677,427 | 2,731,910 | 56,239 | - | 5,692,478 |
Fidelity Advisor Small Cap Fund Institutional Class | 1,939,859 | 1,091,586 | 39,727 | - | 3,316,447 |
Fidelity Series 100 Index Fund | 873,917 | 451,682 | 36,614 | - | 1,360,389 |
Fidelity Series All-Sector Equity Fund | 6,287,353 | 3,664,400 | 176,837 | - | 10,560,737 |
Fidelity Series Commodity Strategy Fund | 5,784,182 | 5,050,043 | 146,993 | - | 10,134,916 |
Fidelity Series Emerging Markets Debt Fund | 356,627 | 340,207 | 5,591 | 13,152 | 655,008 |
Fidelity Series Emerging Markets Fund | 3,113,335 | 2,626,151 | 20,610 | - | 5,794,932 |
Fidelity Series Floating Rate High Income Fund | 1,943 | 7,675 | 95 | 118 | 9,477 |
Fidelity Series High Income Fund | 5,468,666 | 4,792,478 | 406,576 | 197,720 | 9,685,363 |
Fidelity Series International Growth Fund | 5,007,955 | 3,724,066 | 29,586 | - | 9,260,295 |
Fidelity Series International Small Cap Fund | 1,011,976 | 707,499 | 11,103 | - | 1,871,041 |
Fidelity Series International Value Fund | 4,963,040 | 3,668,786 | 57,135 | - | 9,226,706 |
Fidelity Series Investment Grade Bond Fund | 68,328 | 75,474 | 38,906 | 840 | 102,995 |
Fidelity Series Large Cap Value Fund | 3,698,707 | 1,963,518 | 167,919 | - | 5,854,325 |
Fidelity Series Real Estate Equity Fund | 544,808 | 402,511 | 4,972 | 4,904 | 872,475 |
Fidelity Series Real Estate Income Fund | 134,922 | 134,828 | 1,073 | 6,237 | 255,600 |
Fidelity Series Small Cap Opportunities Fund | 2,255,121 | 1,543,381 | 41,993 | - | 3,845,835 |
Total | $ 59,256,030 | $ 47,678,333 | $ 5,343,470 | $ 259,272 | $ 106,682,658 |
Other Information |
All investments are categorized as Level 1 under the Fair Value Hierarchy. The inputs or methodology used for valuing securities may not be an indication of the risk associated with investing in those securities. For more information on valuation inputs, please refer to the Investment Valuation section in the accompanying Notes to Financial Statements. |
See accompanying notes which are an integral part of the financial statements.
Semiannual Report
Fidelity Advisor Freedom 2055 Fund
Statement of Assets and Liabilities
| September 30, 2013 (Unaudited) |
| | |
Assets | | |
Investment in securities, at value (cost $98,907,090) - See accompanying schedule | | $ 106,682,658 |
Receivable for investments sold | | 2,080 |
Receivable for fund shares sold | | 413,420 |
Receivable from investment adviser for expense reductions | | 287 |
Total assets | | 107,098,445 |
| | |
Liabilities | | |
Payable for investments purchased | $ 73,718 | |
Payable for fund shares redeemed | 341,781 | |
Distribution and service plan fees payable | 18,126 | |
Total liabilities | | 433,625 |
| | |
Net Assets | | $ 106,664,820 |
Net Assets consist of: | | |
Paid in capital | | $ 98,002,258 |
Undistributed net investment income | | 172,268 |
Accumulated undistributed net realized gain (loss) on investments | | 714,726 |
Net unrealized appreciation (depreciation) on investments | | 7,775,568 |
Net Assets | | $ 106,664,820 |
| | |
Calculation of Maximum Offering Price Class A:
Net Asset Value and redemption price per share ($57,099,503 ÷ 5,119,588 shares) | | $ 11.15 |
| | |
Maximum offering price per share (100/94.25 of $11.15) | | $ 11.83 |
Class T:
Net Asset Value and redemption price per share ($13,051,971 ÷ 1,172,796 shares) | | $ 11.13 |
| | |
Maximum offering price per share (100/96.50 of $11.13) | | $ 11.53 |
Class C:
Net Asset Value and offering price per share ($1,618,008 ÷ 145,367 shares)A | | $ 11.13 |
| | |
Institutional Class:
Net Asset Value, offering price and redemption price per share ($34,895,338 ÷ 3,119,518 shares) | | $ 11.19 |
A Redemption price per share is equal to net asset value less any applicable contingent deferred sales charge.
Statement of Operations
Six months ended September 30, 2013 (Unaudited) |
| | |
Investment Income | | |
Income distributions from underlying funds | | $ 259,272 |
| | |
Expenses | | |
Distribution and service plan fees | $ 87,727 | |
Independent trustees' compensation | 139 | |
Total expenses before reductions | 87,866 | |
Expense reductions | (139) | 87,727 |
Net investment income (loss) | | 171,545 |
Realized and Unrealized Gain (Loss) Realized gain (loss) on sale of underlying fund shares | 509,658 | |
Capital gain distributions from underlying funds | 308,975 | |
Total net realized gain (loss) | | 818,633 |
Change in net unrealized appreciation (depreciation) on underlying funds | | 4,582,208 |
Net gain (loss) | | 5,400,841 |
Net increase (decrease) in net assets resulting from operations | | $ 5,572,386 |
See accompanying notes which are an integral part of the financial statements.
Semiannual Report
Fidelity Advisor Freedom 2055 Fund
Financial Statements - continued
Statement of Changes in Net Assets
| Six months ended
September 30, 2013
(Unaudited) | Year ended
March 31,
2013 |
Increase (Decrease) in Net Assets | | |
Operations | | |
Net investment income (loss) | $ 171,545 | $ 516,037 |
Net realized gain (loss) | 818,633 | 755,707 |
Change in net unrealized appreciation (depreciation) | 4,582,208 | 3,283,912 |
Net increase (decrease) in net assets resulting from operations | 5,572,386 | 4,555,656 |
Distributions to shareholders from net investment income | (44,363) | (473,172) |
Distributions to shareholders from net realized gain | (775,793) | (129,809) |
Total distributions | (820,156) | (602,981) |
Share transactions - net increase (decrease) | 42,666,461 | 47,565,310 |
Total increase (decrease) in net assets | 47,418,691 | 51,517,985 |
| | |
Net Assets | | |
Beginning of period | 59,246,129 | 7,728,144 |
End of period (including undistributed net investment income of $172,268 and undistributed net investment income of $45,086, respectively) | $ 106,664,820 | $ 59,246,129 |
Financial Highlights - Class A
| Six months ended
September 30, 2013 | Years ended March 31, |
| (Unaudited) | 2013 | 2012 G |
Selected Per-Share Data | | | |
Net asset value, beginning of period | $ 10.56 | $ 9.75 | $ 10.00 |
Income from Investment Operations | | | |
Net investment income (loss) E | .02 | .18 | .11 |
Net realized and unrealized gain (loss) | .70 | .83 | (.11) |
Total from investment operations | .72 | 1.01 | - |
Distributions from net investment income | (.01) | (.13) | (.11) |
Distributions from net realized gain | (.12) | (.07) | (.15) |
Total distributions | (.13) | (.20) | (.25) I |
Net asset value, end of period | $ 11.15 | $ 10.56 | $ 9.75 |
Total Return B, C, D | 6.82% | 10.51% | .29% |
Ratios to Average Net Assets F, H | | | |
Expenses before reductions | .25% A | .25% | .25% A |
Expenses net of fee waivers, if any | .25% A | .25% | .25% A |
Expenses net of all reductions | .25% A | .25% | .25% A |
Net investment income (loss) | .38% A | 1.82% | 1.44% A |
Supplemental Data | | | |
Net assets, end of period (000 omitted) | $ 57,100 | $ 32,476 | $ 2,655 |
Portfolio turnover rate F | 13% A | 29% | 18% A |
A Annualized
B Total returns for periods of less than one year are not annualized.
C Total returns would have been lower if certain expenses had not been reduced during the applicable periods shown.
D Total returns do not include the effect of the sales charges.
E Calculated based on average shares outstanding during the period.
F Amounts do not include the activity of the Underlying Funds.
G For the period June 1, 2011 (commencement of operations) to March 31, 2012.
H Expense ratios reflect operating expenses of the class. Expenses before reductions do not reflect amounts reimbursed by the investment adviser or reductions from expense offset arrangements and do not represent the amount paid by the class during periods when reimbursements or reductions occur. Expenses net of fee waivers reflect expenses after reimbursement by the investment adviser but prior to reductions from expense offset arrangements. Expenses net of all reductions represent the net expenses paid by the class but do not include expenses of the investment companies in which the Fund invests.
I Total distributions of $.25 per share is comprised of distributions from net investment income of $.105 and distributions from net realized gain of $.146 per share.
See accompanying notes which are an integral part of the financial statements.
Semiannual Report
Financial Highlights - Class T
| Six months ended
September 30, 2013 | Years ended March 31, |
| (Unaudited) | 2013 | 2012 G |
Selected Per-Share Data | | | |
Net asset value, beginning of period | $ 10.55 | $ 9.75 | $ 10.00 |
Income from Investment Operations | | | |
Net investment income (loss) E | .01 | .16 | .09 |
Net realized and unrealized gain (loss) | .69 | .82 | (.10) |
Total from investment operations | .70 | .98 | (.01) |
Distributions from net investment income | - | (.11) | (.09) |
Distributions from net realized gain | (.12) | (.07) | (.15) |
Total distributions | (.12) | (.18) | (.24) |
Net asset value, end of period | $ 11.13 | $ 10.55 | $ 9.75 |
Total Return B, C, D | 6.68% | 10.24% | .12% |
Ratios to Average Net Assets F, H | | | |
Expenses before reductions | .50% A | .50% | .50% A |
Expenses net of fee waivers, if any | .50% A | .50% | .50% A |
Expenses net of all reductions | .50% A | .50% | .50% A |
Net investment income (loss) | .13% A | 1.57% | 1.19% A |
Supplemental Data | | | |
Net assets, end of period (000 omitted) | $ 13,052 | $ 7,239 | $ 1,444 |
Portfolio turnover rate F | 13% A | 29% | 18% A |
A Annualized
B Total returns for periods of less than one year are not annualized.
C Total returns would have been lower if certain expenses had not been reduced during the applicable periods shown.
D Total returns do not include the effect of the sales charges.
E Calculated based on average shares outstanding during the period.
F Amounts do not include the activity of the Underlying Funds.
G For the period June 1, 2011 (commencement of operations) to March 31, 2012.
H Expense ratios reflect operating expenses of the class. Expenses before reductions do not reflect amounts reimbursed by the investment adviser or reductions from expense offset arrangements and do not represent the amount paid by the class during periods when reimbursements or reductions occur. Expenses net of fee waivers reflect expenses after reimbursement by the investment adviser but prior to reductions from expense offset arrangements. Expenses net of all reductions represent the net expenses paid by the class but do not include expenses of the investment companies in which the Fund invests.
Financial Highlights - Class C
| Six months ended
September 30, 2013 | Years ended March 31, |
| (Unaudited) | 2013 | 2012 G |
Selected Per-Share Data | | | |
Net asset value, beginning of period | $ 10.57 | $ 9.74 | $ 10.00 |
Income from Investment Operations | | | |
Net investment income (loss) E | (.02) | .10 | .05 |
Net realized and unrealized gain (loss) | .69 | .83 | (.10) |
Total from investment operations | .67 | .93 | (.05) |
Distributions from net investment income | - | (.03) | (.06) |
Distributions from net realized gain | (.11) | (.07) | (.15) |
Total distributions | (.11) | (.10) | (.21) |
Net asset value, end of period | $ 11.13 | $ 10.57 | $ 9.74 |
Total Return B, C, D | 6.37% | 9.69% | (.27)% |
Ratios to Average Net Assets F, H | | | |
Expenses before reductions | 1.00% A | 1.00% | 1.00% A |
Expenses net of fee waivers, if any | 1.00% A | 1.00% | 1.00% A |
Expenses net of all reductions | 1.00% A | 1.00% | 1.00% A |
Net investment income (loss) | (.37)% A | 1.07% | .69% A |
Supplemental Data | | | |
Net assets, end of period (000 omitted) | $ 1,618 | $ 1,094 | $ 1,127 |
Portfolio turnover rate F | 13% A | 29% | 18% A |
A Annualized
B Total returns for periods of less than one year are not annualized.
C Total returns would have been lower if certain expenses had not been reduced during the applicable periods shown.
D Total returns do not include the effect of the contingent deferred sales charge.
E Calculated based on average shares outstanding during the period.
F Amounts do not include the activity of the Underlying Funds.
G For the period June 1, 2011 (commencement of operations) to March 31, 2012.
H Expense ratios reflect operating expenses of the class. Expenses before reductions do not reflect amounts reimbursed by the investment adviser or reductions from expense offset arrangements and do not represent the amount paid by the class during periods when reimbursements or reductions occur. Expenses net of fee waivers reflect expenses after reimbursement by the investment adviser but prior to reductions from expense offset arrangements. Expenses net of all reductions represent the net expenses paid by the class but do not include expenses of the investment companies in which the Fund invests.
See accompanying notes which are an integral part of the financial statements.
Semiannual Report
Financial Highlights - Institutional Class
| Six months ended
September 30, 2013 | Years ended March 31, |
| (Unaudited) | 2013 | 2012 G |
Selected Per-Share Data | | | |
Net asset value, beginning of period | $ 10.59 | $ 9.76 | $ 10.00 |
Income from Investment Operations | | | |
Net investment income (loss) D | .03 | .21 | .13 |
Net realized and unrealized gain (loss) | .70 | .83 | (.11) |
Total from investment operations | .73 | 1.04 | .02 |
Distributions from net investment income | (.01) | (.14) | (.12) |
Distributions from net realized gain | (.12) | (.07) | (.15) |
Total distributions | (.13) | (.21) | (.26) I |
Net asset value, end of period | $ 11.19 | $ 10.59 | $ 9.76 |
Total Return B, C | 6.95% | 10.84% | .51% |
Ratios to Average Net Assets E, H | | | |
Expenses before reductions F | .00% A | .00% | .00% A |
Expenses net of fee waivers, if any | .00% A | .00% | .00% A |
Expenses net of all reductions | .00% A | .00% | .00% A |
Net investment income (loss) | .63% A | 2.07% | 1.69% A |
Supplemental Data | | | |
Net assets, end of period (000 omitted) | $ 34,895 | $ 18,438 | $ 2,503 |
Portfolio turnover rate E | 13% A | 29% | 18% A |
A Annualized
B Total returns for periods of less than one year are not annualized.
C Total returns would have been lower if certain expenses had not been reduced during the applicable periods shown.
D Calculated based on average shares outstanding during the period.
E Amounts do not include the activity of the Underlying Funds.
F Amount represents less than .01%.
G For the period June 1, 2011 (commencement of operations) to March 31, 2012.
H Expense ratios reflect operating expenses of the class. Expenses before reductions do not reflect amounts reimbursed by the investment adviser or reductions from expense offset arrangements and do not represent the amount paid by the class during periods when reimbursements or reductions occur. Expenses net of fee waivers reflect expenses after reimbursement by the investment adviser but prior to reductions from expense offset arrangements. Expenses net of all reductions represent the net expenses paid by the class but do not include expenses of the investment companies in which the Fund invests.
I Total distributions of $.26 per share is comprised of distributions from net investment income of $.116 and distributions from net realized gain of $.146 per share.
See accompanying notes which are an integral part of the financial statements.
Semiannual Report
Notes to Financial Statements
For the period ended September 30, 2013 (Unaudited)
1. Organization.
Fidelity Advisor Freedom Income Fund, Fidelity Advisor Freedom 2005 Fund, Fidelity Advisor Freedom 2010 Fund, Fidelity Advisor Freedom 2015 Fund, Fidelity Advisor Freedom 2020 Fund, Fidelity Advisor Freedom 2025 Fund, Fidelity Advisor Freedom 2030 Fund, Fidelity Advisor Freedom 2035 Fund, Fidelity Advisor Freedom 2040 Fund, Fidelity Advisor Freedom 2045 Fund, Fidelity Advisor Freedom 2050 Fund and Fidelity Advisor Freedom 2055 Fund (the Funds) are funds of Fidelity Aberdeen Street Trust (the Trust). The Trust is registered under the Investment Company Act of 1940, as amended (the 1940 Act), as an open-end management investment company organized as a Delaware statutory trust. Each Fund is authorized to issue an unlimited number of shares. The Funds invest primarily in a combination of other Fidelity equity, bond and short-term funds (the Underlying Funds) managed by Fidelity Management & Research Company (FMR).
Each Fund offers Class A, Class T, Class C, and Institutional Class shares, each of which, along with Class B shares, has equal rights as to assets and voting privileges. Effective after the close of business on September 1, 2010, Class B shares were closed to new accounts and additional purchases, except for exchanges and reinvestments. Each class has exclusive voting rights with respect to matters that affect that class. Class B shares will automatically convert to Class A shares after a holding period of seven years from the initial date of purchase.
2. Significant Accounting Policies.
The financial statements have been prepared in conformity with accounting principles generally accepted in the United States of America (GAAP), which require management to make certain estimates and assumptions at the date of the financial statements. Actual results could differ from those estimates. Subsequent events, if any, through the date that the financial statements were issued have been evaluated in the preparation of the financial statements. The following summarizes the significant accounting policies of the Funds:
Investment Valuation. Investments are valued as of 4:00 p.m. Eastern time on the last calendar day of the period. In accordance with valuation policies and procedures approved by the Board of Trustees (the Board), each Fund attempts to obtain prices from one or more third party pricing vendors or brokers to value its investments. When current market prices, quotations or currency exchange rates are not readily available or reliable, investments will be fair valued in good faith by the FMR Fair Value Committee (the Committee), in accordance with procedures adopted by the Board. Factors used in determining fair value vary by investment type and may include market or investment specific events. Each Fund categorizes the inputs to valuation techniques used to value its investments into a disclosure hierarchy consisting of three levels as shown below:
Level 1 - quoted prices in active markets for identical investments
Level 2 - other significant observable inputs (including quoted prices for similar investments, interest rates, prepayment speeds, etc.)
Level 3 - unobservable inputs (including the Fund's own assumptions based on the best information available)
Valuation techniques used to value each Fund's investments by major category are as follows. Investments in the Underlying Funds are valued at their closing net asset value (NAV) each business day and are categorized as Level 1 in the hierarchy.
Investment Transactions and Income. For financial reporting purposes, the Funds' investment holdings and NAV include trades executed through the end of the last business day of the period. The NAV per share for processing shareholder transactions is calculated as of the close of business of the New York Stock Exchange (NYSE), normally 4:00 p.m. Eastern time and includes trades executed through the end of the prior business day. Gains and losses on securities sold are determined on the basis of identified cost. Income and capital gain distributions from the Underlying Funds, if any, are recorded on the ex-dividend date.
Class Allocations and Expenses. Investment income, realized and unrealized capital gains and losses, common expenses of each Fund, and certain fund-level expense reductions, if any, are allocated daily on a pro-rata basis to each class based on the relative net assets of each class to the total net assets of each Fund. Each class differs with respect to distribution and service plan fees incurred. Certain expense reductions may also differ by class. For the reporting period, the allocated portion of income and expenses to each class as a percent of its average net assets may vary due to the timing of recording these transactions in relation to fluctuating net assets of the classes. Expenses directly attributable to a fund are charged to that fund. Expenses attributable to more than one fund are allocated among the respective funds on the basis of relative net assets or other appropriate methods. Expenses included in the accompanying financial statements reflect the expenses of each Fund and do not include any expenses associated with the Underlying Funds. Although not included in each Fund's expenses, each Fund indirectly bears its proportionate share of the Underlying Funds' expenses through the impact of these expenses on each Underlying Fund's NAV. Expense estimates are accrued in the period to which they relate and adjustments are made when actual amounts are known.
Income Tax Information and Distributions to Shareholders. Each year, each Fund intends to qualify as a regulated investment company under Subchapter M of the Internal Revenue Code, including distributing substantially all of its taxable income and realized gains. As a result, no provision for U.S. Federal income taxes is required. Each Fund files a U.S. federal tax return, in addition to state and local tax returns as required. The Fund's federal income tax returns are subject to examination by the Internal Revenue Service (IRS) for a period of three fiscal years after they are filed. State and local tax returns may be subject to examination for an additional fiscal year depending on the jurisdiction.
Semiannual Report
Notes to Financial Statements (Unaudited) - continued
2. Significant Accounting Policies - continued
Income Tax Information and Distributions to Shareholders - continued
Distributions are declared and recorded on the ex-dividend date. Income dividends and capital gain distributions are declared separately for each class. Income and capital gain distributions are determined in accordance with income tax regulations, which may differ from GAAP.
Capital accounts within the financial statements are adjusted for permanent book-tax differences. These adjustments have no impact on net assets or the results of operations. Temporary book-tax differences will reverse in a subsequent period.
Book-tax differences are primarily due to the short-term gain distributions from the Underlying Funds, capital loss carryforwards and losses deferred due to wash sales and excise tax regulations.
The federal tax cost of investment securities and unrealized appreciation (depreciation) as of period end were as follows for each Fund:
| Tax cost | Gross unrealized
appreciation | Gross unrealized
depreciation | Net unrealized
appreciation
(depreciation) on
securities and
other investments |
Advisor Freedom Income | $ 294,108,393 | $ 19,405,694 | $ (2,678,535) | $ 16,727,159 |
Advisor Freedom 2005 | 284,879,491 | 23,327,082 | (3,953,641) | 19,373,441 |
Advisor Freedom 2010 | 827,515,446 | 83,461,728 | (16,196,557) | 67,265,171 |
Advisor Freedom 2015 | 1,768,253,280 | 204,666,668 | (34,818,110) | 169,848,558 |
Advisor Freedom 2020 | 3,059,911,210 | 353,825,063 | (70,880,463) | 282,944,600 |
Advisor Freedom 2025 | 2,794,264,137 | 374,719,797 | (69,558,209) | 305,161,588 |
Advisor Freedom 2030 | 2,786,800,422 | 386,473,252 | (73,820,534) | 312,652,718 |
Advisor Freedom 2035 | 1,995,139,418 | 308,610,580 | (52,513,329) | 256,097,251 |
Advisor Freedom 2040 | 1,934,372,975 | 291,671,576 | (51,828,479) | 239,843,097 |
Advisor Freedom 2045 | 898,386,871 | 156,515,047 | (22,099,067) | 134,415,980 |
Advisor Freedom 2050 | 658,024,319 | 118,673,991 | (16,719,241) | 101,954,750 |
Advisor Freedom 2055 | 99,058,124 | 8,795,762 | (1,171,228) | 7,624,534 |
3. Purchases and Sales of Investments.
Purchases and redemptions of the Underlying Fund shares are noted in the table below.
| Purchases ($) | Redemptions ($) |
Advisor Freedom Income | 17,499,029 | 34,424,206 |
Advisor Freedom 2005 | 35,398,361 | 45,493,057 |
Advisor Freedom 2010 | 80,416,475 | 115,958,349 |
Advisor Freedom 2015 | 147,146,767 | 219,196,888 |
Advisor Freedom 2020 | 314,554,183 | 349,287,391 |
Advisor Freedom 2025 | 356,971,769 | 287,939,954 |
Advisor Freedom 2030 | 316,113,834 | 298,130,356 |
Advisor Freedom 2035 | 270,375,196 | 218,186,631 |
Advisor Freedom 2040 | 242,264,305 | 201,929,670 |
Advisor Freedom 2045 | 160,410,511 | 90,255,700 |
Advisor Freedom 2050 | 118,472,191 | 65,852,028 |
Advisor Freedom 2055 | 47,678,333 | 5,343,470 |
4. Fees and Other Transactions with Affiliates.
Management Fee. Strategic Advisers, Inc. (Strategic Advisers), an affiliate of FMR, provides the Funds with investment management related services. The Funds do not pay any fees for these services.
Other Transactions. Strategic Advisers has entered into an administration agreement with FMR under which FMR provides management and administrative services (other than investment advisory services) necessary for the operation of each Fund. Pursuant to this agreement, FMR pays all expenses of each Fund, excluding the distribution and service fees, the compensation of the independent Trustees and certain other expenses such as interest expense. FMR also contracts with other Fidelity companies to perform the services necessary for the operation of each Fund. The Funds do not pay any fees for these services.
Semiannual Report
4. Fees and Other Transactions with Affiliates - continued
Distribution and Service Plan Fees. In accordance with Rule 12b-1 of the 1940 Act, the Fund has adopted separate Distribution and Service Plans for each class of shares, except for the Institutional Class. Certain classes pay Fidelity Distributors Corporation (FDC), an affiliate of FMR, separate Distribution and Service Fees, each of which is based on an annual percentage of each class' average net assets. In addition, FDC may pay financial intermediaries for selling shares of the Fund and providing shareholder support services. For the period, the Distribution and Service Fee rates, total fees and amounts retained by FDC were as follows:
Advisor Freedom Income | Distribution
Fee | Service
Fee | Total Fees | Retained
by FDC |
Class A | 0% | .25% | $ 216,524 | $ 12,524 |
Class T | .25% | .25% | 131,806 | 1,087 |
Class B | .75% | .25% | 10,467 | 8,283 |
Class C | .75% | .25% | 81,124 | 14,492 |
| | | $ 439,921 | $ 36,386 |
Advisor Freedom 2005 | | | | |
Class A | 0% | .25% | $ 247,260 | $ 27,674 |
Class T | .25% | .25% | 68,814 | 428 |
Class B | .75% | .25% | 5,771 | 4,403 |
Class C | .75% | .25% | 43,947 | 5,077 |
| | | $ 365,792 | $ 37,582 |
Advisor Freedom 2010 | | | | |
Class A | 0% | .25% | $ 665,071 | $ 64,465 |
Class T | .25% | .25% | 323,152 | 3,787 |
Class B | .75% | .25% | 27,945 | 21,686 |
Class C | .75% | .25% | 190,607 | 19,572 |
| | | $ 1,206,775 | $ 109,510 |
Advisor Freedom 2015 | | | | |
Class A | 0% | .25% | $ 1,454,472 | $ 138,328 |
Class T | .25% | .25% | 573,788 | 6,029 |
Class B | .75% | .25% | 77,935 | 59,803 |
Class C | .75% | .25% | 362,965 | 47,663 |
| | | $ 2,469,160 | $ 251,823 |
Advisor Freedom 2020 | | | | |
Class A | 0% | .25% | $ 2,429,978 | $ 226,235 |
Class T | .25% | .25% | 1,113,320 | 6,968 |
Class B | .75% | .25% | 149,792 | 115,977 |
Class C | .75% | .25% | 522,943 | 72,197 |
| | | $ 4,216,033 | $ 421,377 |
Advisor Freedom 2025 | | | | |
Class A | 0% | .25% | $ 2,297,657 | $ 249,262 |
Class T | .25% | .25% | 860,149 | 4,774 |
Class B | .75% | .25% | 106,170 | 81,577 |
Class C | .75% | .25% | 390,141 | 55,067 |
| | | $ 3,654,117 | $ 390,680 |
Advisor Freedom 2030 | | | | |
Class A | 0% | .25% | $ 2,207,808 | $ 198,518 |
Class T | .25% | .25% | 1,018,155 | 5,524 |
Class B | .75% | .25% | 125,988 | 97,264 |
Class C | .75% | .25% | 387,123 | 56,474 |
| | | $ 3,739,074 | $ 357,780 |
Advisor Freedom 2035 | | | | |
Class A | 0% | .25% | $ 1,619,675 | $ 167,799 |
Class T | .25% | .25% | 584,460 | 1,964 |
Class B | .75% | .25% | 84,141 | 64,741 |
Class C | .75% | .25% | 230,835 | 33,408 |
| | | $ 2,519,111 | $ 267,912 |
Semiannual Report
Notes to Financial Statements (Unaudited) - continued
4. Fees and Other Transactions with Affiliates - continued
Distribution and Service Plan Fees - continued
Advisor Freedom 2040 | Distribution
Fee | Service
Fee | Total Fees | Retained
by FDC |
Class A | 0% | .25% | $ 1,463,895 | $ 117,703 |
Class T | .25% | .25% | 758,569 | 5,558 |
Class B | .75% | .25% | 111,207 | 85,727 |
Class C | .75% | .25% | 324,272 | 41,968 |
| | | $ 2,657,943 | $ 250,956 |
Advisor Freedom 2045 | | | | |
Class A | 0% | .25% | $ 693,746 | $ 67,529 |
Class T | .25% | .25% | 260,500 | - |
Class B | .75% | .25% | 18,116 | 13,922 |
Class C | .75% | .25% | 73,503 | 15,796 |
| | | $ 1,045,865 | $ 97,247 |
Advisor Freedom 2050 | | | | |
Class A | 0% | .25% | $ 464,723 | $ 29,701 |
Class T | .25% | .25% | 245,277 | - |
Class B | .75% | .25% | 27,647 | 20,965 |
Class C | .75% | .25% | 87,339 | 15,106 |
| | | $ 824,986 | $ 65,772 |
Advisor Freedom 2055 | | | | |
Class A | 0% | .25% | $ 55,966 | $ 6,273 |
Class T | .25% | .25% | 24,951 | - |
Class C | .25% | .25% | 6,810 | 4,709 |
| | | $ 87,727 | $ 10,982 |
Sales Load. FDC may receive a front-end sales charge of up to 5.75% for selling Class A shares and 3.50% for selling Class T shares, some of which is paid to financial intermediaries for selling shares of the Fund. Depending on the holding period, FDC may receive contingent deferred sales charges levied on Class A, Class T, Class B, and Class C redemptions. The deferred sales charges range from 5.00% to 1.00% for Class B shares, 1.00% for Class C shares, 1.00% for certain purchases of Class A shares and .25% for certain purchases of Class T shares.
For the period, sales charge amounts retained by FDC were as follows:
Advisor Freedom Income | Retained
by FDC |
Class A | $ 4,581 |
Class T | 1,075 |
Class B* | 2,765 |
Class C* | 822 |
| $ 9,243 |
Advisor Freedom 2005 | |
Class A | $ 3,225 |
Class T | 519 |
Class B* | 117 |
Class C* | 186 |
| $ 4,047 |
Advisor Freedom 2010 | |
Class A | $ 6,840 |
Class T | 5,042 |
Class B* | 4,566 |
Class C* | 744 |
| $ 17,192 |
Semiannual Report
4. Fees and Other Transactions with Affiliates - continued
Sales Load - continued
Advisor Freedom 2015 | Retained
by FDC |
Class A | $ 18,390 |
Class T | 9,025 |
Class B* | 3,975 |
Class C* | 2,111 |
| $ 33,501 |
Advisor Freedom 2020 | |
Class A | $ 41,003 |
Class T | 18,987 |
Class B* | 11,308 |
Class C* | 5,333 |
| $ 76,631 |
Advisor Freedom 2025 | |
Class A | $ 117,130 |
Class T | 18,750 |
Class B* | 13,311 |
Class C* | 3,649 |
| $ 152,840 |
Advisor Freedom 2030 | |
Class A | $ 43,321 |
Class T | 18,269 |
Class B* | 7,629 |
Class C* | 5,689 |
| $ 74,908 |
Advisor Freedom 2035 | |
Class A | $ 33,922 |
Class T | 16,582 |
Class B* | 5,663 |
Class C* | 4,361 |
| $ 60,528 |
Advisor Freedom 2040 | |
Class A | $ 47,865 |
Class T | 18,233 |
Class B* | 10,573 |
Class C* | 4,285 |
| $ 80,956 |
Advisor Freedom 2045 | |
Class A | $ 16,649 |
Class T | 8,273 |
Class B* | 2,051 |
Class C* | 2,642 |
| $ 29,615 |
Advisor Freedom 2050 | |
Class A | $ 15,585 |
Class T | 6,412 |
Class B* | 3,653 |
Class C* | 2,542 |
| $ 28,192 |
Advisor Freedom 2055 | |
Class A | $ 4,086 |
Class T | 2,767 |
Class C* | 165 |
| $ 7,018 |
* When Class B and Class C shares are initially sold, FDC pays commissions from its own resources to financial intermediaries through which the sales are made.
Semiannual Report
Notes to Financial Statements (Unaudited) - continued
4. Fees and Other Transactions with Affiliates - continued
Reallocation of Underlying Fund Investments. During the period, Strategic Advisers reallocated investments of the Funds. This involved taxable redemptions of the Funds' interest in Fidelity Advisor Growth & Income Fund Institutional Class for securities, including accrued interest, and non-taxable exchanges of those securities for shares of Fidelity Advisor Series Growth & Income Fund, an affiliated investment company managed by FMR. Realized gains and losses on the redemptions of Fidelity Advisor Growth & Income Fund Institutional Class in connection with the reallocation are included in the accompanying Statements of Operations as "Realized gain (loss) on sale of underlying fund shares."
Details of these transactions with the related gain (loss) for the Funds are presented in the accompanying table:
| Value of
Securities, including
accrued interest,
reallocated | Realized Gain (Loss) on
redemption of Fidelity
Advisor Growth & Income
Fund Institutional Class |
Advisor Freedom Income | $ 3,012,344 | $ 1,291,049 |
Advisor Freedom 2005 | 4,644,447 | 1,360,371 |
Advisor Freedom 2010 | 19,264,933 | 5,099,845 |
Advisor Freedom 2015 | 43,737,590 | 10,706,802 |
Advisor Freedom 2020 | 80,471,120 | 19,881,084 |
Advisor Freedom 2025 | 90,140,248 | 18,877,601 |
Advisor Freedom 2030 | 95,994,672 | 20,854,941 |
Advisor Freedom 2035 | 79,465,839 | 15,521,613 |
Advisor Freedom 2040 | 78,900,348 | 13,518,567 |
Advisor Freedom 2045 | 38,130,440 | 14,343,043 |
Advisor Freedom 2050 | 28,101,181 | 10,910,824 |
Advisor Freedom 2055 | 3,739,435 | 567,690 |
5. Expense Reductions.
FMR voluntarily agreed to reimburse funds to the extent annual operating expenses exceeded certain levels of average net assets as noted in the table below. Some expenses, for example interest expense, are excluded from this reimbursement.
The following classes of each applicable Fund were in reimbursement during the period:
| Expense
Limitations | Reimbursement |
Advisor Freedom Income | | |
Class A | .25% | $ 321 |
Class T | .50% | 99 |
Class B | 1.00% | 4 |
Class C | 1.00% | 30 |
Institutional Class | .00% | 151 |
Advisor Freedom 2005 | | |
Class A | .25% | 370 |
Class T | .50% | 53 |
Class B | 1.00% | 2 |
Class C | 1.00% | 17 |
Institutional Class | .00% | 133 |
Advisor Freedom 2010 | | |
Class A | .25% | 983 |
Class T | .50% | 244 |
Class B | 1.00% | 9 |
Class C | 1.00% | 71 |
Institutional Class | .00% | 391 |
Semiannual Report
5. Expense Reductions - continued
| Expense
Limitations | Reimbursement |
Advisor Freedom 2015 | | |
Class A | .25% | $ 2,150 |
Class T | .50% | 437 |
Class B | 1.00% | 27 |
Class C | 1.00% | 139 |
Institutional Class | .00% | 903 |
Advisor Freedom 2020 | | |
Class A | .25% | 3,562 |
Class T | .50% | 847 |
Class B | 1.00% | 52 |
Class C | 1.00% | 197 |
Institutional Class | .00% | 1,527 |
Advisor Freedom 2025 | | |
Class A | .25% | 3,338 |
Class T | .50% | 646 |
Class B | 1.00% | 35 |
Class C | 1.00% | 146 |
Institutional Class | .00% | 1,387 |
Advisor Freedom 2030 | | |
Class A | .25% | 3,213 |
Class T | .50% | 759 |
Class B | 1.00% | 43 |
Class C | 1.00% | 146 |
Institutional Class | .00% | 1,441 |
Advisor Freedom 2035 | | |
Class A | .25% | 2,353 |
Class T | .50% | 439 |
Class B | 1.00% | 29 |
Class C | 1.00% | 88 |
Institutional Class | .00% | 1,087 |
Advisor Freedom 2040 | | |
Class A | .25% | 2,122 |
Class T | .50% | 554 |
Class B | 1.00% | 38 |
Class C | 1.00% | 120 |
Institutional Class | .00% | 1,046 |
Advisor Freedom 2045 | | |
Class A | .25% | 988 |
Class T | .50% | 193 |
Class B | 1.00% | 6 |
Class C | 1.00% | 27 |
Institutional Class | .00% | 562 |
Advisor Freedom 2050 | | |
Class A | .25% | 664 |
Class T | .50% | 177 |
Class B | 1.00% | 9 |
Class C | 1.00% | 33 |
Institutional Class | .00% | 421 |
Semiannual Report
Notes to Financial Statements (Unaudited) - continued
5. Expense Reductions - continued
| Expense
Limitations | Reimbursement |
Advisor Freedom 2055 | | |
Class A | .25% | $ 75 |
Class T | .50% | 17 |
Class C | 1.00% | 2 |
Institutional Class | .00% | 45 |
6. Distributions to Shareholders.
Distributions to shareholders of each class were as follows:
| Six months ended
September 30, 2013 | Year ended
March 31, 2013 |
Advisor Freedom Income | | |
From net investment income | | |
Class A | $ 656,311 | $ 1,869,112 |
Class T | 128,512 | 433,735 |
Class B | - | 9,453 |
Class C | 1,476 | 61,486 |
Institutional Class | 372,019 | 900,709 |
Total | $ 1,158,318 | $ 3,274,495 |
From net realized gain | | |
Class A | $ 1,977,628 | $ 2,240,481 |
Class T | 612,330 | 669,554 |
Class B | 24,775 | 32,437 |
Class C | 184,052 | 210,904 |
Institutional Class | 851,104 | 901,737 |
Total | $ 3,649,889 | $ 4,055,113 |
Advisor Freedom 2005 | | |
From net investment income | | |
Class A | $ 288,226 | $ 2,280,196 |
Class T | 25,627 | 219,973 |
Class B | - | 4,601 |
Class C | - | 31,434 |
Institutional Class | 142,651 | 820,798 |
Total | $ 456,504 | $ 3,357,002 |
From net realized gain | | |
Class A | $ 1,237,673 | $ 1,208,263 |
Class T | 170,073 | 146,502 |
Class B | 7,054 | 8,377 |
Class C | 52,005 | 47,485 |
Institutional Class | 433,896 | 369,028 |
Total | $ 1,900,701 | $ 1,779,655 |
Semiannual Report
6. Distributions to Shareholders - continued
| Six months ended
September 30, 2013 | Year ended
March 31, 2013 |
Advisor Freedom 2010 | | |
From net investment income | | |
Class A | $ 774,729 | $ 7,248,480 |
Class T | 113,125 | 1,357,322 |
Class B | - | 35,114 |
Class C | - | 221,866 |
Institutional Class | 414,104 | 2,901,048 |
Total | $ 1,301,958 | $ 11,763,830 |
From net realized gain | | |
Class A | $ 5,337,041 | $ 3,797,581 |
Class T | 1,275,224 | 877,542 |
Class B | 57,586 | 49,505 |
Class C | 369,929 | 264,617 |
Institutional Class | 1,974,957 | 1,313,996 |
Total | $ 9,014,737 | $ 6,303,241 |
Advisor Freedom 2015 | | |
From net investment income | | |
Class A | $ 1,692,286 | $ 15,443,272 |
Class T | 181,793 | 2,370,199 |
Class B | - | 95,446 |
Class C | - | 437,291 |
Institutional Class | 977,995 | 6,470,240 |
Total | $ 2,852,074 | $ 24,816,448 |
From net realized gain | | |
Class A | $ 19,179,240 | $ 8,264,610 |
Class T | 3,708,566 | 1,548,591 |
Class B | 261,176 | 133,932 |
Class C | 1,169,651 | 514,113 |
Institutional Class | 7,673,501 | 2,975,791 |
Total | $ 31,992,134 | $ 13,437,037 |
Advisor Freedom 2020 | | |
From net investment income | | |
Class A | $ 2,838,484 | $ 26,237,034 |
Class T | 366,712 | 4,698,779 |
Class B | - | 207,668 |
Class C | - | 650,444 |
Institutional Class | 1,610,985 | 10,832,707 |
Total | $ 4,816,181 | $ 42,626,632 |
From net realized gain | | |
Class A | $ 37,348,421 | $ 12,221,481 |
Class T | 8,334,361 | 2,642,164 |
Class B | 591,092 | 229,820 |
Class C | 1,936,305 | 642,700 |
Institutional Class | 14,916,514 | 4,363,557 |
Total | $ 63,126,693 | $ 20,099,722 |
Semiannual Report
Notes to Financial Statements (Unaudited) - continued
6. Distributions to Shareholders - continued
| Six months ended
September 30, 2013 | Year ended
March 31, 2013 |
Advisor Freedom 2025 | | |
From net investment income | | |
Class A | $ 2,418,460 | $ 24,790,567 |
Class T | 259,209 | 3,595,303 |
Class B | - | 163,792 |
Class C | - | 561,745 |
Institutional Class | 1,349,155 | 9,737,534 |
Total | $ 4,026,824 | $ 38,848,941 |
From net realized gain | | |
Class A | $ 53,211,723 | $ 9,143,726 |
Class T | 9,694,413 | 1,563,144 |
Class B | 637,953 | 130,245 |
Class C | 2,189,425 | 386,200 |
Institutional Class | 20,184,567 | 3,124,129 |
Total | $ 85,918,081 | $ 14,347,444 |
Advisor Freedom 2030 | | |
From net investment income | | |
Class A | $ 2,350,262 | $ 24,782,410 |
Class T | 292,762 | 4,552,485 |
Class B | - | 210,414 |
Class C | - | 585,019 |
Institutional Class | 1,396,421 | 10,634,898 |
Total | $ 4,039,445 | $ 40,765,226 |
From net realized gain | | |
Class A | $ 44,132,595 | $ 7,915,192 |
Class T | 9,895,307 | 1,715,030 |
Class B | 642,741 | 137,323 |
Class C | 1,904,406 | 342,181 |
Institutional Class | 18,153,440 | 2,964,978 |
Total | $ 74,728,489 | $ 13,074,704 |
Advisor Freedom 2035 | | |
From net investment income | | |
Class A | $ 1,192,449 | $ 16,875,467 |
Class T | 86,655 | 2,349,822 |
Class B | - | 135,304 |
Class C | - | 332,280 |
Institutional Class | 860,159 | 7,474,365 |
Total | $ 2,139,263 | $ 27,167,238 |
From net realized gain | | |
Class A | $ 46,306,621 | $ 3,487,770 |
Class T | 8,076,146 | 574,019 |
Class B | 624,641 | 55,352 |
Class C | 1,621,494 | 122,062 |
Institutional Class | 20,041,651 | 1,344,229 |
Total | $ 76,670,553 | $ 5,583,432 |
Semiannual Report
6. Distributions to Shareholders - continued
| Six months ended
September 30, 2013 | Year ended
March 31, 2013 |
Advisor Freedom 2040 | | |
From net investment income | | |
Class A | $ 1,097,416 | $ 15,416,805 |
Class T | 85,902 | 3,246,224 |
Class B | - | 187,384 |
Class C | - | 477,964 |
Institutional Class | 790,801 | 7,173,233 |
Total | $ 1,974,119 | $ 26,501,610 |
From net realized gain | | |
Class A | $ 41,532,752 | $ 3,045,286 |
Class T | 10,566,271 | 769,855 |
Class B | 827,214 | 73,757 |
Class C | 2,286,483 | 168,492 |
Institutional Class | 18,527,339 | 1,229,840 |
Total | $ 73,740,059 | $ 5,287,230 |
Advisor Freedom 2045 | | |
From net investment income | | |
Class A | $ 520,632 | $ 6,957,403 |
Class T | 37,622 | 988,121 |
Class B | - | 27,566 |
Class C | - | 101,775 |
Institutional Class | 420,795 | 3,609,466 |
Total | $ 979,049 | $ 11,684,331 |
From net realized gain | | |
Class A | $ 11,089,758 | $ 6,744,595 |
Class T | 2,003,353 | 1,044,959 |
Class B | 71,783 | 57,582 |
Class C | 280,418 | 162,607 |
Institutional Class | 5,601,606 | 2,864,235 |
Total | $ 19,046,918 | $ 10,873,978 |
Advisor Freedom 2050 | | |
From net investment income | | |
Class A | $ 313,112 | $ 4,634,192 |
Class T | 36,098 | 923,527 |
Class B | - | 42,092 |
Class C | - | 123,643 |
Institutional Class | 297,082 | 2,647,530 |
Total | $ 646,292 | $ 8,370,984 |
From net realized gain | | |
Class A | $ 7,445,118 | $ 1,465,892 |
Class T | 1,931,226 | 345,032 |
Class B | 108,074 | 25,867 |
Class C | 328,577 | 67,326 |
Institutional Class | 4,237,094 | 711,612 |
Total | $ 14,050,089 | $ 2,615,729 |
Semiannual Report
Notes to Financial Statements (Unaudited) - continued
6. Distributions to Shareholders - continued
| Six months ended
September 30, 2013 | Year ended
March 31, 2013 |
Advisor Freedom 2055 | | |
From net investment income | | |
Class A | $ 21,336 | $ 273,976 |
Class T | 777 | 55,233 |
Class C | - | 2,070 |
Institutional Class | 22,250 | 141,893 |
Total | $ 44,363 | $ 473,172 |
From net realized gain | | |
Class A | $ 426,693 | $ 68,154 |
Class T | 93,872 | 17,814 |
Class C | 12,499 | 6,257 |
Institutional Class | 242,729 | 37,584 |
Total | $ 775,793 | $ 129,809 |
7. Share Transactions.
Transactions for each class of shares were as follows:
| Shares | Dollars |
| Six months ended
September 30,
2013 | Year ended
March 31,
2013 | Six months ended
September 30,
2013 | Year ended
March 31,
2013 |
Advisor Freedom Income | | | | |
Class A | | | | |
Shares sold | 2,127,608 | 5,667,328 | $ 23,600,685 | $ 62,675,823 |
Reinvestment of distributions | 233,337 | 368,047 | 2,598,148 | 4,049,319 |
Shares redeemed | (3,275,171) | (5,438,505) | (36,202,478) | (60,152,423) |
Net increase (decrease) | (914,226) | 596,870 | $ (10,003,645) | $ 6,572,719 |
Class T | | | | |
Shares sold | 949,875 | 1,752,672 | $ 10,523,058 | $ 19,341,827 |
Reinvestment of distributions | 65,060 | 97,192 | 724,314 | 1,067,874 |
Shares redeemed | (1,244,182) | (2,181,141) | (13,735,429) | (24,078,105) |
Net increase (decrease) | (229,247) | (331,277) | $ (2,488,057) | $ (3,668,404) |
Class B | | | | |
Shares sold | 2,322 | 13,728 | $ 26,023 | $ 151,709 |
Reinvestment of distributions | 1,998 | 3,419 | 22,258 | 37,528 |
Shares redeemed | (30,737) | (75,727) | (340,211) | (836,079) |
Net increase (decrease) | (26,417) | (58,580) | $ (291,930) | $ (646,842) |
Class C | | | | |
Shares sold | 125,978 | 326,072 | $ 1,395,075 | $ 3,593,856 |
Reinvestment of distributions | 13,707 | 19,976 | 152,687 | 219,246 |
Shares redeemed | (222,037) | (428,327) | (2,451,845) | (4,730,145) |
Net increase (decrease) | (82,352) | (82,279) | $ (904,083) | $ (917,043) |
Institutional Class | | | | |
Shares sold | 1,503,550 | 3,768,736 | $ 16,650,115 | $ 41,751,702 |
Reinvestment of distributions | 109,483 | 161,577 | 1,220,655 | 1,781,582 |
Shares redeemed | (1,593,395) | (2,467,458) | (17,694,370) | (27,262,092) |
Net increase (decrease) | 19,638 | 1,462,855 | $ 176,400 | $ 16,271,192 |
Advisor Freedom 2005 | | | | |
Class A | | | | |
Shares sold | 2,439,583 | 5,950,479 | $ 28,962,357 | $ 69,001,688 |
Reinvestment of distributions | 125,138 | 296,966 | 1,494,144 | 3,414,979 |
Shares redeemed | (3,432,513) | (6,013,562) | (40,833,056) | (69,615,909) |
Net increase (decrease) | (867,792) | 233,883 | $ (10,376,555) | $ 2,800,758 |
Semiannual Report
7. Share Transactions - continued
| Shares | Dollars |
| Six months ended
September 30,
2013 | Year ended
March 31,
2013 | Six months ended
September 30,
2013 | Year ended
March 31,
2013 |
Advisor Freedom 2005 | | | | |
Class T | | | | |
Shares sold | 763,163 | 1,289,243 | $ 9,063,185 | $ 14,935,857 |
Reinvestment of distributions | 16,130 | 30,601 | 192,591 | 352,432 |
Shares redeemed | (662,766) | (1,066,736) | (7,860,505) | (12,303,077) |
Net increase (decrease) | 116,527 | 253,108 | $ 1,395,271 | $ 2,985,212 |
Class B | | | | |
Shares sold | 7,317 | 652 | $ 86,101 | $ 7,549 |
Reinvestment of distributions | 573 | 1,083 | 6,870 | 12,534 |
Shares redeemed | (11,742) | (41,276) | (138,505) | (481,200) |
Net increase (decrease) | (3,852) | (39,541) | $ (45,534) | $ (461,117) |
Class C | | | | |
Shares sold | 100,114 | 173,944 | $ 1,182,757 | $ 2,021,586 |
Reinvestment of distributions | 3,910 | 6,077 | 46,649 | 70,003 |
Shares redeemed | (36,446) | (201,333) | (432,960) | (2,316,273) |
Net increase (decrease) | 67,578 | (21,312) | $ 796,446 | $ (224,684) |
Institutional Class | | | | |
Shares sold | 1,517,703 | 3,014,914 | $ 18,148,736 | $ 35,073,813 |
Reinvestment of distributions | 47,781 | 102,306 | 573,852 | 1,182,672 |
Shares redeemed | (1,642,132) | (1,314,929) | (19,629,453) | (15,314,119) |
Net increase (decrease) | (76,648) | 1,802,291 | $ (906,865) | $ 20,942,366 |
Advisor Freedom 2010 | | | | |
Class A | | | | |
Shares sold | 5,251,004 | 12,708,869 | $ 65,509,212 | $ 153,017,064 |
Reinvestment of distributions | 482,691 | 915,288 | 6,052,943 | 10,935,441 |
Shares redeemed | (8,212,668) | (16,811,351) | (102,673,254) | (202,005,316) |
Net increase (decrease) | (2,478,973) | (3,187,194) | $ (31,111,099) | $ (38,052,811) |
Class T | | | | |
Shares sold | 1,988,555 | 3,712,396 | $ 24,769,437 | $ 44,524,286 |
Reinvestment of distributions | 109,343 | 183,018 | 1,367,885 | 2,182,056 |
Shares redeemed | (2,151,946) | (4,809,687) | (26,775,213) | (57,632,993) |
Net increase (decrease) | (54,048) | (914,273) | $ (637,891) | $ (10,926,651) |
Class B | | | | |
Shares sold | 2,091 | 9,563 | $ 26,054 | $ 115,968 |
Reinvestment of distributions | 4,319 | 6,587 | 54,166 | 78,910 |
Shares redeemed | (134,739) | (268,639) | (1,681,733) | (3,216,272) |
Net increase (decrease) | (128,329) | (252,489) | $ (1,601,513) | $ (3,021,394) |
Class C | | | | |
Shares sold | 242,554 | 499,095 | $ 3,007,095 | $ 5,991,309 |
Reinvestment of distributions | 27,051 | 36,663 | 336,513 | 435,812 |
Shares redeemed | (414,658) | (681,672) | (5,132,115) | (8,150,135) |
Net increase (decrease) | (145,053) | (145,914) | $ (1,788,507) | $ (1,723,014) |
Institutional Class | | | | |
Shares sold | 3,673,331 | 7,292,808 | $ 46,090,376 | $ 88,270,797 |
Reinvestment of distributions | 189,747 | 351,077 | 2,387,014 | 4,208,551 |
Shares redeemed | (3,434,320) | (5,034,949) | (43,073,302) | (60,844,334) |
Net increase (decrease) | 428,758 | 2,608,936 | $ 5,404,088 | $ 31,635,014 |
Advisor Freedom 2015 | | | | |
Class A | | | | |
Shares sold | 11,822,758 | 28,506,295 | $ 146,918,566 | $ 342,099,746 |
Reinvestment of distributions | 1,656,125 | 1,974,621 | 20,668,444 | 23,498,680 |
Shares redeemed | (17,748,439) | (28,730,020) | (220,413,154) | (344,939,129) |
Net increase (decrease) | (4,269,556) | 1,750,896 | $ (52,826,144) | $ 20,659,297 |
Semiannual Report
Notes to Financial Statements (Unaudited) - continued
7. Share Transactions - continued
| Shares | Dollars |
| Six months ended
September 30,
2013 | Year ended
March 31,
2013 | Six months ended
September 30,
2013 | Year ended
March 31,
2013 |
Advisor Freedom 2015 | | | | |
Class T | | | | |
Shares sold | 3,671,924 | 7,048,273 | $ 45,534,032 | $ 84,377,992 |
Reinvestment of distributions | 304,740 | 321,618 | 3,800,102 | 3,825,959 |
Shares redeemed | (3,781,181) | (7,173,479) | (46,927,498) | (85,670,361) |
Net increase (decrease) | 195,483 | 196,412 | $ 2,406,636 | $ 2,533,590 |
Class B | | | | |
Shares sold | 11,654 | 18,918 | $ 143,580 | $ 230,299 |
Reinvestment of distributions | 19,480 | 17,784 | 242,911 | 211,983 |
Shares redeemed | (285,193) | (631,455) | (3,531,583) | (7,538,504) |
Net increase (decrease) | (254,059) | (594,753) | $ (3,145,092) | $ (7,096,222) |
Class C | | | | |
Shares sold | 622,383 | 1,112,764 | $ 7,659,257 | $ 13,243,553 |
Reinvestment of distributions | 87,547 | 73,853 | 1,086,460 | 876,636 |
Shares redeemed | (707,866) | (1,330,728) | (8,744,282) | (15,851,708) |
Net increase (decrease) | 2,064 | (144,111) | $ 1,435 | $ (1,731,519) |
Institutional Class | | | | |
Shares sold | 7,840,567 | 16,268,843 | $ 98,081,157 | $ 196,562,251 |
Reinvestment of distributions | 684,252 | 782,959 | 8,601,045 | 9,370,557 |
Shares redeemed | (8,040,817) | (8,997,016) | (100,382,528) | (108,722,993) |
Net increase (decrease) | 484,002 | 8,054,786 | $ 6,299,674 | $ 97,209,815 |
Advisor Freedom 2020 | | | | |
Class A | | | | |
Shares sold | 19,365,269 | 44,416,958 | $ 251,542,064 | $ 555,194,594 |
Reinvestment of distributions | 3,062,857 | 3,073,389 | 39,817,141 | 38,099,250 |
Shares redeemed | (25,715,135) | (39,485,922) | (333,808,007) | (494,297,897) |
Net increase (decrease) | (3,287,009) | 8,004,425 | $ (42,448,802) | $ 98,995,947 |
Class T | | | | |
Shares sold | 6,517,644 | 12,011,989 | $ 84,591,367 | $ 150,203,034 |
Reinvestment of distributions | 657,577 | 579,475 | 8,548,496 | 7,192,079 |
Shares redeemed | (5,429,437) | (10,936,020) | (70,538,381) | (136,699,168) |
Net increase (decrease) | 1,745,784 | 1,655,444 | $ 22,601,482 | $ 20,695,945 |
Class B | | | | |
Shares sold | 14,441 | 23,018 | $ 188,912 | $ 283,038 |
Reinvestment of distributions | 42,098 | 32,154 | 547,279 | 399,675 |
Shares redeemed | (477,343) | (1,019,496) | (6,189,594) | (12,664,560) |
Net increase (decrease) | (420,804) | (964,324) | $ (5,453,403) | $ (11,981,847) |
Class C | | | | |
Shares sold | 1,017,435 | 1,650,086 | $ 13,118,586 | $ 20,539,871 |
Reinvestment of distributions | 137,912 | 95,759 | 1,783,201 | 1,184,544 |
Shares redeemed | (909,018) | (1,789,596) | (11,734,033) | (22,192,952) |
Net increase (decrease) | 246,329 | (43,751) | $ 3,167,754 | $ (468,537) |
Institutional Class | | | | |
Shares sold | 11,553,007 | 25,904,119 | $ 151,075,685 | $ 326,561,698 |
Reinvestment of distributions | 1,261,074 | 1,214,162 | 16,494,851 | 15,144,940 |
Shares redeemed | (9,962,598) | (12,665,795) | (130,221,898) | (158,809,529) |
Net increase (decrease) | 2,851,483 | 14,452,486 | $ 37,348,638 | $ 182,897,109 |
Advisor Freedom 2025 | | | | |
Class A | | | | |
Shares sold | 21,484,719 | 46,832,812 | $ 270,536,519 | $ 564,656,133 |
Reinvestment of distributions | 4,392,566 | 2,817,136 | 55,214,568 | 33,682,400 |
Shares redeemed | (23,310,835) | (36,915,729) | (294,143,281) | (445,620,144) |
Net increase (decrease) | 2,566,450 | 12,734,219 | $ 31,607,806 | $ 152,718,389 |
Semiannual Report
7. Share Transactions - continued
| Shares | Dollars |
| Six months ended
September 30,
2013 | Year ended
March 31,
2013 | Six months ended
September 30,
2013 | Year ended
March 31,
2013 |
Advisor Freedom 2025 | | | | |
Class T | | | | |
Shares sold | 5,861,332 | 10,475,315 | $ 74,105,083 | $ 126,787,508 |
Reinvestment of distributions | 776,118 | 421,842 | 9,779,081 | 5,059,334 |
Shares redeemed | (4,155,999) | (7,029,069) | (52,642,773) | (84,713,362) |
Net increase (decrease) | 2,481,451 | 3,868,088 | $ 31,241,391 | $ 47,133,480 |
Class B | | | | |
Shares sold | 9,171 | 33,837 | $ 116,540 | $ 402,830 |
Reinvestment of distributions | 47,736 | 22,745 | 597,652 | 271,803 |
Shares redeemed | (329,923) | (700,042) | (4,141,565) | (8,354,336) |
Net increase (decrease) | (273,016) | (643,460) | $ (3,427,373) | $ (7,679,703) |
Class C | | | | |
Shares sold | 969,953 | 1,362,294 | $ 12,098,122 | $ 16,242,141 |
Reinvestment of distributions | 167,133 | 75,516 | 2,082,477 | 897,881 |
Shares redeemed | (652,554) | (1,133,462) | (8,143,338) | (13,531,664) |
Net increase (decrease) | 484,532 | 304,348 | $ 6,037,261 | $ 3,608,358 |
Institutional Class | | | | |
Shares sold | 12,239,737 | 24,213,764 | $ 155,528,718 | $ 294,374,445 |
Reinvestment of distributions | 1,696,531 | 1,063,922 | 21,478,082 | 12,801,944 |
Shares redeemed | (7,937,045) | (10,933,983) | (100,783,376) | (132,325,157) |
Net increase (decrease) | 5,999,223 | 14,343,703 | $ 76,223,424 | $ 174,851,232 |
Advisor Freedom 2030 | | | | |
Class A | | | | |
Shares sold | 17,393,699 | 41,613,890 | $ 231,903,056 | $ 525,837,935 |
Reinvestment of distributions | 3,467,908 | 2,585,181 | 46,019,142 | 32,378,742 |
Shares redeemed | (21,450,374) | (34,146,152) | (285,945,603) | (432,000,548) |
Net increase (decrease) | (588,767) | 10,052,919 | $ (8,023,405) | $ 126,216,129 |
Class T | | | | |
Shares sold | 5,845,270 | 11,109,856 | $ 77,608,720 | $ 139,954,510 |
Reinvestment of distributions | 756,816 | 492,157 | 10,020,241 | 6,152,559 |
Shares redeemed | (4,783,389) | (9,495,122) | (63,739,773) | (119,272,485) |
Net increase (decrease) | 1,818,697 | 2,106,891 | $ 23,889,188 | $ 26,834,584 |
Class B | | | | |
Shares sold | 11,434 | 20,379 | $ 152,483 | $ 253,313 |
Reinvestment of distributions | 45,593 | 25,911 | 602,738 | 324,148 |
Shares redeemed | (335,466) | (766,318) | (4,450,354) | (9,575,940) |
Net increase (decrease) | (278,439) | (720,028) | $ (3,695,133) | $ (8,998,479) |
Class C | | | | |
Shares sold | 824,346 | 1,523,134 | $ 10,881,111 | $ 19,092,460 |
Reinvestment of distributions | 136,419 | 69,617 | 1,795,277 | 867,428 |
Shares redeemed | (681,520) | (1,266,642) | (8,989,275) | (15,862,398) |
Net increase (decrease) | 279,245 | 326,109 | $ 3,687,113 | $ 4,097,490 |
Institutional Class | | | | |
Shares sold | 11,966,615 | 22,913,292 | $ 160,453,428 | $ 291,232,690 |
Reinvestment of distributions | 1,465,805 | 1,079,513 | 19,539,185 | 13,569,835 |
Shares redeemed | (8,722,395) | (10,947,359) | (116,763,833) | (138,321,010) |
Net increase (decrease) | 4,710,025 | 13,045,446 | $ 63,228,780 | $ 166,481,515 |
Advisor Freedom 2035 | | | | |
Class A | | | | |
Shares sold | 15,328,725 | 34,835,056 | $ 194,288,373 | $ 415,484,819 |
Reinvestment of distributions | 3,756,210 | 1,706,155 | 47,102,871 | 20,199,297 |
Shares redeemed | (15,983,339) | (27,311,897) | (202,574,328) | (326,166,700) |
Net increase (decrease) | 3,101,596 | 9,229,314 | $ 38,816,916 | $ 109,517,416 |
Semiannual Report
Notes to Financial Statements (Unaudited) - continued
7. Share Transactions - continued
| Shares | Dollars |
| Six months ended
September 30,
2013 | Year ended
March 31,
2013 | Six months ended
September 30,
2013 | Year ended
March 31,
2013 |
Advisor Freedom 2035 | | | | |
Class T | | | | |
Shares sold | 4,739,387 | 8,091,085 | $ 59,651,621 | $ 96,019,491 |
Reinvestment of distributions | 644,594 | 243,254 | 8,044,532 | 2,870,268 |
Shares redeemed | (3,279,646) | (5,444,520) | (41,406,993) | (64,446,129) |
Net increase (decrease) | 2,104,335 | 2,889,819 | $ 26,289,160 | $ 34,443,630 |
Class B | | | | |
Shares sold | 8,764 | 11,260 | $ 109,455 | $ 131,688 |
Reinvestment of distributions | 48,167 | 15,412 | 597,268 | 181,095 |
Shares redeemed | (211,235) | (493,168) | (2,643,503) | (5,777,414) |
Net increase (decrease) | (154,304) | (466,496) | $ (1,936,780) | $ (5,464,631) |
Class C | | | | |
Shares sold | 552,164 | 873,123 | $ 6,879,029 | $ 10,285,137 |
Reinvestment of distributions | 125,573 | 36,956 | 1,553,338 | 433,119 |
Shares redeemed | (300,343) | (766,094) | (3,735,784) | (8,970,033) |
Net increase (decrease) | 377,394 | 143,985 | $ 4,696,583 | $ 1,748,223 |
Institutional Class | | | | |
Shares sold | 10,067,478 | 19,774,112 | $ 128,261,755 | $ 237,955,566 |
Reinvestment of distributions | 1,654,714 | 738,822 | 20,849,394 | 8,780,433 |
Shares redeemed | (7,689,187) | (8,196,096) | (97,937,852) | (97,924,593) |
Net increase (decrease) | 4,033,005 | 12,316,838 | $ 51,173,297 | $ 148,811,406 |
Advisor Freedom 2040 | | | | |
Class A | | | | |
Shares sold | 13,741,196 | 28,004,111 | $ 185,910,809 | $ 355,673,696 |
Reinvestment of distributions | 3,150,109 | 1,447,450 | 42,242,959 | 18,293,644 |
Shares redeemed | (14,826,865) | (22,935,436) | (200,786,772) | (292,260,264) |
Net increase (decrease) | 2,064,440 | 6,516,125 | $ 27,366,996 | $ 81,707,076 |
Class T | | | | |
Shares sold | 4,175,854 | 7,602,047 | $ 56,395,548 | $ 96,328,995 |
Reinvestment of distributions | 784,260 | 312,761 | 10,493,403 | 3,950,120 |
Shares redeemed | (3,805,344) | (7,559,551) | (51,611,587) | (95,678,684) |
Net increase (decrease) | 1,154,770 | 355,257 | $ 15,277,364 | $ 4,600,431 |
Class B | | | | |
Shares sold | 4,871 | 6,103 | $ 64,725 | $ 76,395 |
Reinvestment of distributions | 58,893 | 19,509 | 782,097 | 245,030 |
Shares redeemed | (365,831) | (739,626) | (4,898,361) | (9,293,767) |
Net increase (decrease) | (302,067) | (714,014) | $ (4,051,539) | $ (8,972,342) |
Class C | | | | |
Shares sold | 545,553 | 962,998 | $ 7,278,488 | $ 12,120,904 |
Reinvestment of distributions | 164,891 | 49,059 | 2,183,158 | 614,213 |
Shares redeemed | (483,247) | (901,869) | (6,448,192) | (11,261,526) |
Net increase (decrease) | 227,197 | 110,188 | $ 3,013,454 | $ 1,473,591 |
Institutional Class | | | | |
Shares sold | 8,924,237 | 16,906,391 | $ 121,584,786 | $ 216,610,718 |
Reinvestment of distributions | 1,433,492 | 660,482 | 19,309,134 | 8,377,157 |
Shares redeemed | (5,698,086) | (8,263,973) | (77,598,363) | (105,030,652) |
Net increase (decrease) | 4,659,643 | 9,302,900 | $ 63,295,557 | $ 119,957,223 |
Advisor Freedom 2045 | | | | |
Class A | | | | |
Shares sold | 10,763,007 | 22,348,428 | $ 113,785,892 | $ 218,037,471 |
Reinvestment of distributions | 1,092,315 | 1,428,096 | 11,534,852 | 13,620,503 |
Shares redeemed | (9,597,942) | (14,594,828) | (101,338,137) | (143,000,136) |
Net increase (decrease) | 2,257,380 | 9,181,696 | $ 23,982,607 | $ 88,657,838 |
Semiannual Report
7. Share Transactions - continued
| Shares | Dollars |
| Six months ended
September 30,
2013 | Year ended
March 31,
2013 | Six months ended
September 30,
2013 | Year ended
March 31,
2013 |
Advisor Freedom 2045 | | | | |
Class T | | | | |
Shares sold | 3,064,460 | 5,253,099 | $ 32,252,012 | $ 51,047,511 |
Reinvestment of distributions | 193,728 | 213,016 | 2,038,018 | 2,024,121 |
Shares redeemed | (1,838,186) | (2,939,816) | (19,421,996) | (28,557,658) |
Net increase (decrease) | 1,420,002 | 2,526,299 | $ 14,868,034 | $ 24,513,974 |
Class B | | | | |
Shares sold | 1,176 | 3,515 | $ 12,449 | $ 31,735 |
Reinvestment of distributions | 6,637 | 8,787 | 69,693 | 82,887 |
Shares redeemed | (29,473) | (49,903) | (310,467) | (482,094) |
Net increase (decrease) | (21,660) | (37,601) | $ (228,325) | $ (367,472) |
Class C | | | | |
Shares sold | 317,072 | 518,274 | $ 3,304,370 | $ 5,021,009 |
Reinvestment of distributions | 26,496 | 27,552 | 277,147 | 259,896 |
Shares redeemed | (161,198) | (272,934) | (1,686,237) | (2,637,588) |
Net increase (decrease) | 182,370 | 272,892 | $ 1,895,280 | $ 2,643,317 |
Institutional Class | | | | |
Shares sold | 7,940,334 | 13,436,841 | $ 84,229,192 | $ 132,476,916 |
Reinvestment of distributions | 568,004 | 671,239 | 6,020,842 | 6,432,276 |
Shares redeemed | (4,351,433) | (4,998,582) | (46,122,807) | (48,855,267) |
Net increase (decrease) | 4,156,905 | 9,109,498 | $ 44,127,227 | $ 90,053,925 |
Advisor Freedom 2050 | | | | |
Class A | | | | |
Shares sold | 7,663,793 | 15,759,974 | $ 80,531,968 | $ 152,322,278 |
Reinvestment of distributions | 731,350 | 630,390 | 7,671,857 | 6,034,537 |
Shares redeemed | (6,616,416) | (11,627,846) | (69,465,373) | (112,817,332) |
Net increase (decrease) | 1,778,727 | 4,762,518 | $ 18,738,452 | $ 45,539,483 |
Class T | | | | |
Shares sold | 2,482,375 | 4,570,956 | $ 25,952,463 | $ 44,088,375 |
Reinvestment of distributions | 187,633 | 131,758 | 1,962,644 | 1,260,447 |
Shares redeemed | (1,711,782) | (2,827,192) | (18,021,056) | (27,249,174) |
Net increase (decrease) | 958,226 | 1,875,522 | $ 9,894,051 | $ 18,099,648 |
Class B | | | | |
Shares sold | 5,070 | 330 | $ 51,641 | $ 3,096 |
Reinvestment of distributions | 10,041 | 6,911 | 104,630 | 65,663 |
Shares redeemed | (49,566) | (62,118) | (521,199) | (591,359) |
Net increase (decrease) | (34,455) | (54,877) | $ (364,928) | $ (522,600) |
Class C | | | | |
Shares sold | 297,249 | 469,493 | $ 3,084,375 | $ 4,511,086 |
Reinvestment of distributions | 30,767 | 19,364 | 320,597 | 184,167 |
Shares redeemed | (149,570) | (316,364) | (1,557,961) | (3,039,772) |
Net increase (decrease) | 178,446 | 172,493 | $ 1,847,011 | $ 1,655,481 |
Institutional Class | | | | |
Shares sold | 5,989,467 | 10,323,520 | $ 63,235,231 | $ 100,853,706 |
Reinvestment of distributions | 430,167 | 347,891 | 4,533,950 | 3,344,639 |
Shares redeemed | (3,270,141) | (4,410,206) | (34,548,529) | (42,706,449) |
Net increase (decrease) | 3,149,493 | 6,261,205 | $ 33,220,652 | $ 61,491,896 |
Advisor Freedom 2055 | | | | |
Class A | | | | |
Shares sold | 2,996,089 | 3,664,304 | $ 32,343,544 | $ 36,168,205 |
Reinvestment of distributions | 41,392 | 35,066 | 446,206 | 341,179 |
Shares redeemed | (992,247) | (897,204) | (10,716,396) | (8,919,848) |
Net increase (decrease) | 2,045,234 | 2,802,166 | $ 22,073,354 | $ 27,589,536 |
Semiannual Report
Notes to Financial Statements (Unaudited) - continued
7. Share Transactions - continued
| Shares | Dollars |
| Six months ended
September 30,
2013 | Year ended
March 31,
2013 | Six months ended
September 30,
2013 | Year ended
March 31,
2013 |
Advisor Freedom 2055 | | | | |
Class T | | | | |
Shares sold | 641,407 | 865,233 | $ 6,913,222 | $ 8,537,245 |
Reinvestment of distributions | 8,794 | 7,527 | 94,622 | 73,047 |
Shares redeemed | (163,614) | (334,621) | (1,769,492) | (3,311,442) |
Net increase (decrease) | 486,587 | 538,139 | $ 5,238,352 | $ 5,298,850 |
Class C | | | | |
Shares sold | 54,977 | 90,384 | $ 592,325 | $ 903,238 |
Reinvestment of distributions | 1,158 | 877 | 12,499 | 8,307 |
Shares redeemed | (14,273) | (103,499) | (154,667) | (1,002,740) |
Net increase (decrease) | 41,862 | (12,238) | $ 450,157 | $ (91,195) |
Institutional Class | | | | |
Shares sold | 1,761,121 | 1,958,189 | $ 19,049,037 | $ 19,433,573 |
Reinvestment of distributions | 24,535 | 18,452 | 264,980 | 179,477 |
Shares redeemed | (407,823) | (491,376) | (4,409,419) | (4,844,931) |
Net increase (decrease) | 1,377,833 | 1,485,265 | $ 14,904,598 | $ 14,768,119 |
8. Other.
The Funds' organizational documents provide former and current trustees and officers with a limited indemnification against liabilities arising in connection with the performance of their duties to the Funds. In the normal course of business, the Funds may also enter into contracts that provide general indemnifications. The Funds' maximum exposure under these arrangements is unknown as this would be dependent on future claims that may be made against the Funds. The risk of material loss from such claims is considered remote.
The Funds do not invest in the Underlying Funds for the purpose of exercising management or control; however, investments by the Funds within their principal investment strategies may represent a significant portion of the Underlying Fund's net assets. At the end of the period, the following Advisor Freedom Funds were the owners of record of 10% or more of the total outstanding shares of the Underlying Funds.
Fund | Fidelity Advisor Freedom 2020 Fund | Fidelity Advisor Freedom 2025 Fund | Fidelity Advisor Freedom 2030 Fund | Fidelity Advisor Freedom 2035 Fund | Fidelity Advisor Freedom 2040 Fund |
Fidelity Advisor Series Equity-Income Fund | 14% | 16% | 17% | 14% | 14% |
Fidelity Advisor Series Growth & Income Fund | 14% | 16% | 17% | 14% | 14% |
Fidelity Advisor Series Opportunistic Insights Fund | 14% | 16% | 17% | 14% | 14% |
Fidelity Advisor Series Stock Selector Large Cap Value Fund | 14% | 16% | 17% | 14% | 14% |
The Funds, in aggregate, were the owners of record of more than 20% of the total outstanding shares of the following Underlying Funds.
Fund | % of shares held |
Fidelity Advisor Equity Growth Fund | 30% |
Fidelity Advisor Short Fixed-Income Fund | 32% |
Fidelity Advisor Large Cap Fund | 50% |
Fidelity Advisor Series Equity-Income Fund | 100% |
Fidelity Advisor Series Growth & Income Fund | 100% |
Fidelity Advisor Series Opportunistic Insights Fund | 100% |
Fidelity Advisor Series Stock Selector Large Cap Value Fund | 100% |
Semiannual Report
Board Approval of Investment Advisory Contracts and Management Fees
Advisor Freedom Funds
Each year, the Board of Trustees, including the Independent Trustees (together, the Board), votes on the renewal of the management contract (the Advisory Contract) with Strategic Advisers, Inc. (Strategic Advisers) and the administration agreement for each fund. The Board, assisted by the advice of fund counsel and Independent Trustees' counsel, requests and considers a broad range of information relevant to the renewal of the Advisory Contracts throughout the year.
The Board meets regularly and, at each of its meetings, covers an extensive agenda of topics and materials and considers factors that are relevant to its annual consideration of the renewal of each fund's Advisory Contract, including the services and support provided to each fund and its shareholders. The Board has established four standing committees, Operations, Audit, Fair Valuation, and Governance and Nominating, each composed of and chaired by Independent Trustees with varying backgrounds, to which the Board has assigned specific subject matter responsibilities in order to enhance effective decision-making by the Board. The Operations Committee, of which all of the Independent Trustees are members, meets regularly throughout the year and, among other matters, considers matters specifically related to the annual consideration of the renewal of each fund's Advisory Contract. The Board, acting directly and through its Committees, requests and receives information concerning the annual consideration of the renewal of each fund's Advisory Contract. The Board also meets as needed to consider matters specifically related to the Board's annual consideration of the renewal of Advisory Contracts. Members of the Board may also meet with trustees of other Fidelity funds through ad hoc joint committees to discuss certain matters relevant to the Fidelity funds.
At its September 2013 meeting, the Board, including the Independent Trustees, unanimously determined to renew each fund's Advisory Contract. In reaching its determination, the Board considered all factors it believed relevant and reached a determination, with the assistance of fund counsel and Independent Trustees' counsel and through the exercise of its business judgment, that the renewal of the Advisory Contract was in the best interests of each fund and its shareholders and the fact that no fees are payable under the Advisory Contracts was fair and reasonable. The Board's decision to renew the Advisory Contracts was not based on any single factor, but rather was based on a comprehensive consideration of all the information provided to the Board at its meetings throughout the year. In reaching its determination, the Board was aware that shareholders in each fund have a broad range of investment choices available to them, including a wide choice among mutual funds offered by Fidelity's competitors, and that each fund's shareholders, who have the opportunity to review and weigh the disclosure provided by the fund in its prospectus and other public disclosures, have chosen to invest in that fund, which is part of the Fidelity family of funds.
Nature, Extent, and Quality of Services Provided. The Board considered Fidelity's staffing as it relates to the funds, including the backgrounds of investment personnel of Strategic Advisers, and also considered the funds' investment objectives, strategies, and related investment philosophies. The Independent Trustees also had discussions with senior management of Fidelity's investment operations and investment groups with responsibility for the underlying Fidelity funds in which each fund invests. The Board considered the structure of the portfolio manager compensation program and whether this structure provides appropriate incentives to act in the best interests of each fund.
Resources Dedicated to Investment Management and Support Services. The Board reviewed the general qualifications and capabilities of Fidelity's investment staff, including its size, education, experience, and resources, as well as Fidelity's approach to recruiting, managing, and compensating investment personnel. The Board noted that Fidelity has continued to increase the resources devoted to non-U.S. offices, including expansion of Fidelity's global investment organization. The Board also noted that Fidelity's analysts have extensive resources, tools and capabilities that allow them to conduct sophisticated quantitative and fundamental analysis, as well as credit analysis of issuers, counterparties and guarantors. Further, the Board believes that Fidelity's investment professionals have sufficient access to global information and data so as to provide competitive investment results over time, and that those professionals also have access to sophisticated tools that permit them to assess portfolio construction and risk and performance attribution characteristics continuously, as well as to transmit new information and research conclusions rapidly around the world. Additionally, in its deliberations, the Board considered Fidelity's risk management capabilities and resources, which are an integral part of the investment management process.
Shareholder and Administrative Services. The Board considered (i) the nature, extent, quality, and cost of advisory, administrative, and shareholder services performed by Fidelity affiliates under the Advisory Contract and the administration agreement and under separate agreements covering transfer agency and pricing and bookkeeping services for each fund; (ii) the nature and extent of the supervision of third party service providers, principally custodians and subcustodians; and (iii) the resources devoted to, and the record of compliance with, each fund's compliance policies and procedures.
The Board noted that the growth of fund assets over time across the complex allows Fidelity to reinvest in the development of services designed to enhance the value or convenience of the Fidelity funds as investment vehicles. These services include 24-hour access to account information and market information through telephone representatives and over the Internet, investor education materials and asset allocation tools, and the expanded availability of Fidelity Investor Centers.
Investment in a Large Fund Family. The Board considered the benefits to shareholders of investing in a Fidelity fund, including the benefits of investing in a fund that is part of a large family of funds offering a variety of investment disciplines and providing a large variety of mutual fund investor services. The Board noted that Fidelity had taken, or had made recommendations that resulted in the Fidelity funds taking, a number of actions over the previous year that benefited particular funds, including (i) continuing to dedicate additional resources to investment research and to the support of the senior management team that oversees asset management; (ii) persisting in efforts to enhance Fidelity's global research capabilities; (iii) launching new funds and making other enhancements to meet client needs for global and income-oriented solutions; (iv) continuing to launch dedicated lower cost underlying funds to meet portfolio construction needs related to expanding underlying fund options for Fidelity funds of funds, specifically for the Freedom Fund product lines; (v) rationalizing product lines and gaining increased efficiencies through the combination of several funds with other funds; (vi) strengthening Fidelity's index fund offerings by reducing investment minimums and adopting or lowering existing expense caps for certain funds and classes; (vii) enhancing Global Asset Allocation product offerings by launching new funds and strategies, including "open architecture" target date funds that utilize affiliated and unaffiliated sub-advisers; (viii) modifying the eligibility criteria for Institutional Class shares of Advisor funds to increase their marketability to a portion of the defined contribution plan market; (ix) creating a new low-cost retirement share class for certain Advisor funds to appeal to large retirement plans; (x) transitioning the management of certain Fidelity commodity funds to Geode Capital Management LLC, a registered commodity pool operator, while retaining administrative responsibilities for the funds; and (xi) taking steps toward establishing a new Fidelity adviser to manage sector-based funds and products.
Semiannual Report
Board Approval of Investment Advisory Contracts and Management Fees - continued
Investment Performance. The Board considered whether each fund has operated in accordance with its investment objective, as well as its record of compliance with its investment restrictions and its performance history.
The Board took into account discussions with the investment adviser about fund investment performance that occur at Board meetings throughout the year. In this regard the Board noted that as part of regularly scheduled fund reviews and other reports to the Board on fund performance, the Board periodically considers annualized return information for each fund for different time periods, measured against one or more securities market indices, including a customized blended index representative of the fund's asset classes (each a "benchmark index") and a peer group of mutual funds with similar objectives ("peer group"). In its evaluation of fund investment performance at meetings throughout the year, the Board gave particular attention to information indicating underperformance of certain Fidelity funds for specific time periods and the investment adviser's explanations for such underperformance.
In addition to reviewing absolute and relative fund performance, the Independent Trustees periodically consider the appropriateness of fund performance metrics in evaluating the results achieved. In general, the Independent Trustees believe that fund performance should be evaluated based on gross performance (before fees and expenses, including acquired fund fees and expenses, but after transaction costs, if any) compared to appropriate benchmark indices, over appropriate time periods that may include full market cycles, and on net performance (after fees and expenses) compared to peer groups, as applicable, over the same periods, taking into account relevant factors including the following: general market conditions; the extent to which particular underlying funds affected performance; and fund cash flows and other factors. Depending on the circumstances, the Independent Trustees may be satisfied with a fund's performance notwithstanding that it lags its benchmark index or peer group for certain periods.
The Independent Trustees recognize that shareholders evaluate performance on a net basis over their own holding periods, for which one-, three-, and five-year periods are often used as a proxy. For this reason, the performance information reviewed by the Board also included net cumulative calendar year total return information for each fund and an appropriate benchmark index for the most recent one-, three-, and five-year periods (for the most recent one-year period for Fidelity Advisor Freedom 2055 Fund).
Based on its review, the Board concluded that the nature, extent, and quality of services provided to each fund under the Advisory Contract should benefit each fund's shareholders.
Competitiveness of Management Fee and Total Expense Ratio. The Board noted that the funds do not pay Strategic Advisers a management fee for investment advisory services. The Board considered each fund's management fee and total expense ratio compared to "mapped groups" of competitive funds and classes, and also considered that each fund bears indirectly the expenses of the underlying Fidelity funds in which it invests. Fidelity creates "mapped groups" by combining similar Lipper investment objective categories that have comparable investment mandates. Combining Lipper investment objective categories aids the Board's management fee and total expense ratio comparisons by broadening the competitive group used for comparison and by reducing the number of universes to which various Fidelity funds are compared.
Management Fee. The Board considered two proprietary management fee comparisons for the 12-month (or shorter) periods shown in the charts below. The group of Lipper funds used by the Board for management fee comparisons is referred to below as the "Total Mapped Group." The Total Mapped Group comparison focuses on a fund's standing in terms of gross management fees before expense reimbursements or caps relative to the total universe of funds with comparable investment mandates, regardless of whether their management fee structures also are comparable. "TMG %" represents the percentage of funds in the Total Mapped Group that had management fees that were lower than a fund's. For example, a hypothetical TMG % of 50% would mean that half of the funds in the Total Mapped Group had higher, and half had lower, management fees than a fund. The funds' actual TMG %s are in the charts below. The "Asset-Size Peer Group" (ASPG) comparison focuses on a fund's standing relative to a subset of non-Fidelity funds within the Total Mapped Group that are similar in size and management fee structure. For example, if a fund is in the first quartile of the ASPG, the fund's management fee ranks in the least expensive or lowest 25% of funds in the ASPG. The ASPG represents at least 15% of the funds in the Total Mapped Group with comparable asset size and management fee structures, subject to a minimum of 50 funds (or all funds in the Total Mapped Group if fewer than 50). Additional information, such as the ASPG quartile in which a fund's management fee rate ranked, is also included in the charts and considered by the Board.
Semiannual Report
Advisor Freedom 2005 Fund

Advisor Freedom 2010 Fund

Semiannual Report
Board Approval of Investment Advisory Contracts and Management Fees - continued
Advisor Freedom 2015 Fund

Advisor Freedom 2020 Fund

Semiannual Report
Advisor Freedom 2025 Fund

Advisor Freedom 2030 Fund

Semiannual Report
Board Approval of Investment Advisory Contracts and Management Fees - continued
Advisor Freedom 2035 Fund

Advisor Freedom 2040 Fund

Semiannual Report
Advisor Freedom 2045 Fund

Advisor Freedom 2050 Fund

Semiannual Report
Board Approval of Investment Advisory Contracts and Management Fees - continued
Advisor Freedom 2055 Fund

Advisor Freedom Income Fund
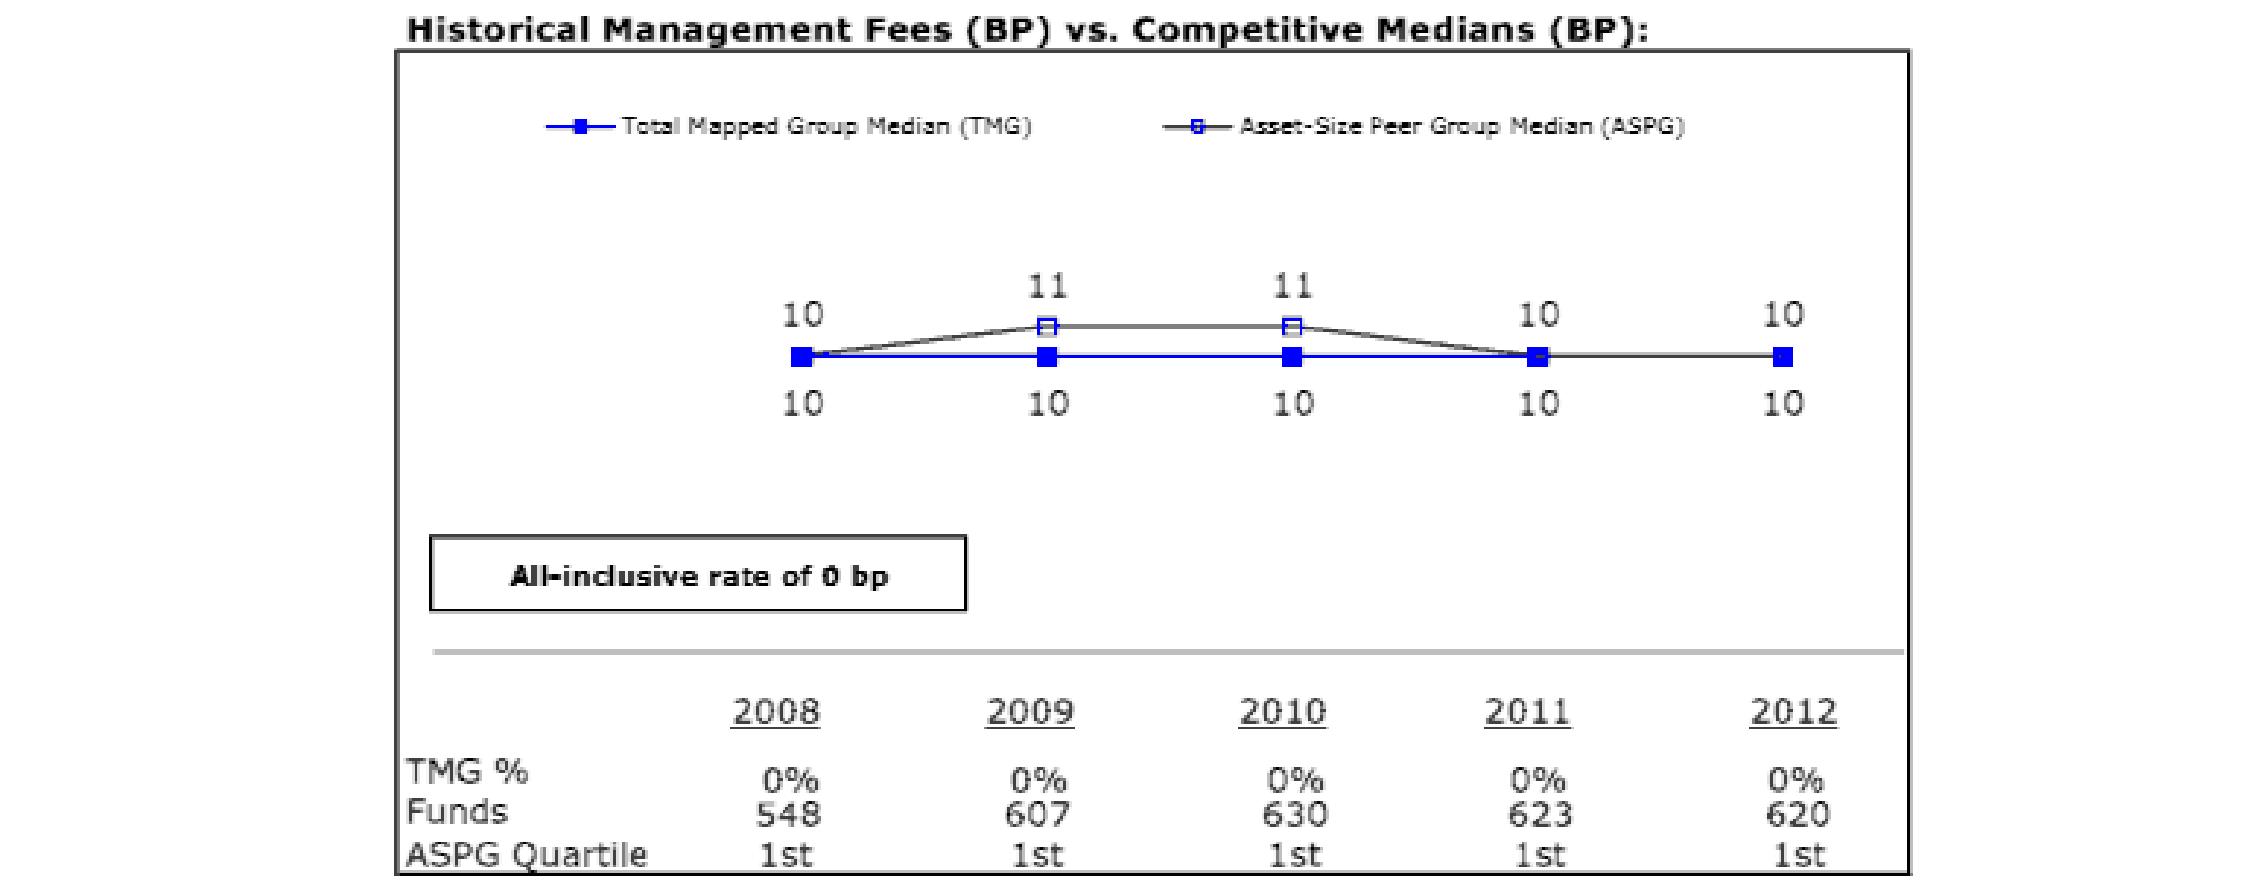
The Board noted that each fund's management fee rate of 0.00% ranked below the median of its Total Mapped Group and below the median of its ASPG for 2012. The Board further noted that many peer funds pay fund-level expenses, including management fees, to which the funds are not subject.
Based on its review, the Board concluded that each fund's management fee is fair and reasonable in light of the services that the fund receives and the other factors considered.
Total Expense Ratio. In its review of the total expense ratio of each class of each fund, the Board noted that each fund invests in Institutional Class of the underlying Fidelity fund (if that underlying fund offers multiple classes of shares) to avoid charging fund-paid 12b-1 fees at both fund levels. The Board considered that the funds do not pay transfer agent fees. Instead, Institutional Class of each underlying Fidelity fund (or the underlying fund, if that underlying fund does not offer multiple classes of shares) bears its pro rata portion of each fund's transfer agent fee according to the percentage of each fund's assets invested in that underlying fund. The Board further noted that Fidelity Management & Research Company (FMR) pays all other expenses of each fund, with limited exceptions.
For each fund except Advisor Freedom 2055, the Board noted that the total expense ratio of each of Class A, Class B, Class C, and Institutional Class of each fund ranked below its competitive median for 2012 and the total expense ratio of Class T of each fund ranked equal to its competitive median for 2012.
Semiannual Report
The Board noted that the total expense ratio of each of Class A, Class C and Institutional Class of Advisor Freedom 2055 Fund ranked below its competitive median for 2012 and the total expense ratio of Class T of Advisor Freedom 2055 Fund ranked equal to its competitive median for 2012.
Fees Charged to Other Fidelity Clients. The Board also considered Fidelity fee structures and other information with respect to clients of Fidelity, such as other mutual funds advised or subadvised by Fidelity, pension plan clients, and other institutional clients. The Board noted the findings of the 2013 ad hoc joint committee (created with the board of other Fidelity funds), which reviewed and compared Fidelity's institutional investment advisory business with its business of providing services to the Fidelity funds, including the differences in services provided, fees charged, and costs incurred, as well as competition in their respective marketplaces.
Based on its review of total expense ratios and fees charged to other Fidelity clients, the Board concluded that the total expense ratio of each class of each fund was reasonable in light of the services that the fund and its shareholders receive and the other factors considered.
Costs of the Services and Profitability. The Board considered the level of Fidelity's profits in respect of all the Fidelity funds, including the Fidelity funds in which the funds invest.
PricewaterhouseCoopers LLP (PwC), independent registered public accounting firm and auditor to Fidelity and certain Fidelity funds, has been engaged annually by the Board as part of the Board's assessment of Fidelity's profitability analysis. PwC's engagement includes the review and assessment of the methodologies used by Fidelity in determining the revenues and expenses attributable to Fidelity's mutual fund business, and completion of agreed-upon procedures surrounding the mathematical accuracy of fund profitability and its conformity to allocation methodologies. After considering PwC's reports issued under the engagement and information provided by Fidelity, the Board concluded that while other allocation methods may also be reasonable, Fidelity's profitability methodologies are reasonable in all material respects.
The Board also reviewed Fidelity's non-fund businesses and fall-out benefits related to the mutual fund business as well as cases where Fidelity's affiliates may benefit from or be related to the funds' business.
The Board concluded that the costs of the services provided by and the profits realized by Fidelity in connection with the operation of each fund were not relevant to the renewal of each fund's Advisory Contract because the funds do not pay management fees and FMR pays all other expenses of each fund, with limited exceptions.
Economies of Scale. The Board concluded that because the funds do not pay management fees and FMR pays all other expenses of each fund, with limited exceptions, economies of scale cannot be realized by the funds, but may be realized by the other Fidelity funds in which each fund invests, many of which may benefit from breakpoints in the group fee arrangement.
Additional Information Requested by the Board. In order to develop fully the factual basis for consideration of the Fidelity funds' Advisory Contracts, the Board requested and received additional information on certain topics, including: (i) Fidelity's fund profitability methodology, profitability trends for certain funds, and the impact of certain factors on fund profitability results; (ii) portfolio manager changes that have occurred during the past year and the amount of the investment that each portfolio manager has made in the Fidelity fund(s) that he or she manages; (iii) Fidelity's compensation structure for portfolio managers, research analysts, and other key personnel, including its effects on fund profitability, the rationale for the compensation structure, and the extent to which current market conditions have affected retention and recruitment; (iv) the arrangements with and compensation paid to certain fund sub-advisers on behalf of the Fidelity funds; (v) Fidelity's fee structures, including the group fee structure and definition of group assets, and the rationale for recommending different fees among different categories of funds and classes; (vi) Fidelity's voluntary waiver of its fees to maintain minimum yields for certain money market funds and classes as well as contractual waivers in place for certain funds; (vii) the methodology with respect to competitive fund data and peer group classifications; (viii) Fidelity's transfer agent fee, expense, and service structures for different funds and classes, and the impact of the increased use of omnibus accounts; and (ix) explanations regarding the relative total expense ratios of certain funds and classes, total expense competitive trends and methodologies for total expense competitive comparisons, and actions that might be taken by Fidelity to reduce total expense ratios for certain funds and classes or to achieve further economies of scale.
Based on its evaluation of all of the conclusions noted above, and after considering all factors it believed relevant, the Board ultimately concluded that the advisory fee structures are fair and reasonable, and that each fund's Advisory Contract should be renewed.
Semiannual Report
Investment Adviser
Strategic Advisers, Inc.
Boston, MA
Administrator
Fidelity Management & Research Company
Boston, MA
General Distributor
Fidelity Distributors Corporation
Smithfield, RI
Transfer and Service Agents
Fidelity Investments Institutional Operations Company, Inc.
Boston, MA
Fidelity Service Company, Inc.
Boston, MA
Custodian
The Bank of New York Mellon
New York, NY
(Fidelity Investment logo)(registered trademark)
AFFI-USAN-1113
1.792159.110
Fidelity Freedom® Index Funds - Class W
Income, 2000, 2005, 2010, 2015, 2020, 2025, 2030, 2035, 2040, 2045, 2050, 2055
Semiannual Report
September 30, 2013
(Fidelity Cover Art)
Contents
Semiannual Report
To view a fund's proxy voting guidelines and proxy voting record for the 12-month period ended June 30, visit http://www.fidelity.com/proxyvotingresults or visit the Securities and Exchange Commission's (SEC) web site at http://www.sec.gov. You may also call 1-800-835-5092 to request a free copy of the proxy voting guidelines.
Standard & Poor's, S&P and S&P 500 are registered service marks of The McGraw-Hill Companies, Inc. and have been licensed for use by Fidelity Distributors Corporation.
Other third-party marks appearing herein are the property of their respective owners.
All other marks appearing herein are registered or unregistered trademarks or service marks of FMR LLC or an affiliated company. © 2013 FMR LLC. All rights reserved.
This report and the financial statements contained herein are submitted for the general information of the shareholders of the funds. This report is not authorized for distribution to prospective investors in the funds unless preceded or accompanied by an effective prospectus.
A fund files its complete schedule of portfolio holdings with the SEC for the first and third quarters of each fiscal year on Form N-Q. Forms N-Q are available on the SEC's web site at http://www.sec.gov. A fund's Forms N-Q may be reviewed and copied at the SEC's Public Reference Room in Washington, DC. Information regarding the operation of the SEC's Public Reference Room may be obtained by calling 1-800-SEC-0330. For a complete list of a fund's portfolio holdings, view the most recent holdings listing, semiannual report, or annual report on Fidelity's web site at http://www.fidelity.com, http://www.advisor.fidelity.com, or http://www.401k.com, as applicable.
NOT FDIC INSURED • MAY LOSE VALUE • NO BANK GUARANTEE
Neither the funds nor Fidelity Distributors Corporation is a bank.
Semiannual Report
As a shareholder of a Fund, you incur two types of costs: (1) transaction costs, and (2) ongoing costs, including other Fund expenses. This Example is intended to help you understand your ongoing costs (in dollars) of investing in the Funds and to compare these costs with the ongoing costs of investing in other mutual funds.
The Example is based on an investment of $1,000 invested at the beginning of the period and held for the entire period (April 1, 2013 to September 30, 2013).
Actual Expenses
The first line of the accompanying table for each fund provides information about actual account values and actual expenses. You may use the information in this line, together with the amount you invested, to estimate the expenses that you paid over the period. Simply divide your account value by $1,000.00 (for example, an $8,600 account value divided by $1,000.00 = 8.6), then multiply the result by the number in the first line for a fund under the heading entitled "Expenses Paid During Period" to estimate the expenses you paid on your account during this period. In addition, each Fund, as a shareholder in underlying Fidelity Funds, will indirectly bear its pro-rata share of the fees and expenses incurred by the underlying Fidelity Funds. These fees and expenses are not included in each Fund's annualized expense ratio used to calculate the expense estimates in the table below.
Hypothetical Example for Comparison Purposes
The second line of the accompanying table for each fund provides information about hypothetical account values and hypothetical expenses based on a fund's actual expense ratio and an assumed rate of return of 5% per year before expenses, which is not the Fund's actual return. The hypothetical account values and expenses may not be used to estimate the actual ending account balance or expenses you paid for the period. You may use this information to compare the ongoing costs of investing in the Fund and other funds. To do so, compare this 5% hypothetical example with the 5% hypothetical examples that appear in the shareholder reports of the other funds. In addition, each Fund, as a shareholder in underlying Fidelity Funds, will indirectly bear its pro-rata share of the fees and expenses incurred by the underlying Fidelity Funds. These fees and expenses are not included in each Fund's annualized expense ratio used to calculate the expense estimates in the table below.
Please note that the expenses shown in the table are meant to highlight your ongoing costs only and do not reflect any transaction costs. Therefore, the second line of the table is useful in comparing ongoing costs only, and will not help you determine the relative total costs of owning different funds.
| Annualized
Expense Ratio B | Beginning
Account Value
April 1, 2013 | Ending
Account Value
September 30, 2013 | Expenses Paid
During Period*
April 1, 2013
to September 30, 2013 |
Fidelity Freedom Index Income Fund | .09% | | | |
Actual | | $ 1,000.00 | $ 1,003.00 | $ .45 ** |
HypotheticalA | | $ 1,000.00 | $ 1,024.62 | $ .46 ** |
Fidelity Freedom Index 2000 Fund | .09% | | | |
Actual | | $ 1,000.00 | $ 1,002.20 | $ .45 ** |
HypotheticalA | | $ 1,000.00 | $ 1,024.62 | $ .46 ** |
Fidelity Freedom Index 2005 Fund | .09% | | | |
Actual | | $ 1,000.00 | $ 1,012.90 | $ .45 ** |
HypotheticalA | | $ 1,000.00 | $ 1,024.62 | $ .46 ** |
Fidelity Freedom Index 2010 Fund | .09% | | | |
Actual | | $ 1,000.00 | $ 1,019.70 | $ .46 ** |
HypotheticalA | | $ 1,000.00 | $ 1,024.62 | $ .46 ** |
Fidelity Freedom Index 2015 Fund | .10% | | | |
Actual | | $ 1,000.00 | $ 1,022.00 | $ .51 ** |
HypotheticalA | | $ 1,000.00 | $ 1,024.57 | $ .51 ** |
Fidelity Freedom Index 2020 Fund | .10% | | | |
Actual | | $ 1,000.00 | $ 1,025.40 | $ .51 ** |
HypotheticalA | | $ 1,000.00 | $ 1,024.57 | $ .51 ** |
Fidelity Freedom Index 2025 Fund | .09% | | | |
Actual | | $ 1,000.00 | $ 1,035.00 | $ .46 ** |
HypotheticalA | | $ 1,000.00 | $ 1,024.62 | $ .46 ** |
Fidelity Freedom Index 2030 Fund | .09% | | | |
Actual | | $ 1,000.00 | $ 1,039.20 | $ .46 ** |
HypotheticalA | | $ 1,000.00 | $ 1,024.62 | $ .46 ** |
Fidelity Freedom Index 2035 Fund | .08% | | | |
Actual | | $ 1,000.00 | $ 1,049.10 | $ .41 ** |
HypotheticalA | | $ 1,000.00 | $ 1,024.67 | $ .41 ** |
| Annualized
Expense Ratio B | Beginning
Account Value
April 1, 2013 | Ending
Account Value
September 30, 2013 | Expenses Paid
During Period*
April 1, 2013
to September 30, 2013 |
Fidelity Freedom Index 2040 Fund | .08% | | | |
Actual | | $ 1,000.00 | $ 1,050.30 | $ .41 ** |
HypotheticalA | | $ 1,000.00 | $ 1,024.67 | $ .41 ** |
Fidelity Freedom Index 2045 Fund | .08% | | | |
Actual | | $ 1,000.00 | $ 1,052.10 | $ .41 ** |
HypotheticalA | | $ 1,000.00 | $ 1,024.67 | $ .41 ** |
Fidelity Freedom Index 2050 Fund | .08% | | | |
Actual | | $ 1,000.00 | $ 1,053.20 | $ .41 ** |
HypotheticalA | | $ 1,000.00 | $ 1,024.67 | $ .41 ** |
Fidelity Freedom Index 2055 Fund | .08% | | | |
Actual | | $ 1,000.00 | $ 1,056.50 | $ .41 ** |
HypotheticalA | | $ 1,000.00 | $ 1,024.67 | $ .41 ** |
A 5% return per year before expenses
B Annualized expense ratio reflects expenses net of applicable fee waivers.
* Expenses are equal to each Fund's annualized expense ratio, multiplied by the average account value over the period, multiplied by 183/365 (to reflect the one-half year period). The fees and expenses of the underlying Fidelity Funds in which the Funds invest are not included in the Funds' annualized expense ratio.
** Effective December 1, 2013, each Fund's contractual expense limitation will be changed to 0.16% from 0.19%. If these limitations had been in effect during the entire period, the annualized expense ratios and the expenses paid in the actual and hypothetical examples above would have been as follows:
| Annualized
Expense Ratio B | Expenses Paid |
Fidelity Freedom Index Income Fund | .06% | |
Actual | | $ .30 |
HypotheticalA | | $ .30 |
Fidelity Freedom Index 2000 Fund | .06% | |
Actual | | $ .30 |
HypotheticalA | | $ .30 |
Fidelity Freedom Index 2005 Fund | .06% | |
Actual | | $ .30 |
HypotheticalA | | $ .30 |
Fidelity Freedom Index 2010 Fund | .06% | |
Actual | | $ .30 |
HypotheticalA | | $ .30 |
Fidelity Freedom Index 2015 Fund | .07% | |
Actual | | $ .35 |
HypotheticalA | | $ .36 |
Fidelity Freedom Index 2020 Fund | .07% | |
Actual | | $ .36 |
HypotheticalA | | $ .36 |
Fidelity Freedom Index 2025 Fund | .06% | |
Actual | | $ .31 |
HypotheticalA | | $ .30 |
Fidelity Freedom Index 2030 Fund | .06% | |
Actual | | $ .31 |
HypotheticalA | | $ .30 |
| Annualized
Expense Ratio B | Expenses Paid |
Fidelity Freedom Index 2035 Fund | .05% | |
Actual | | $ .26 |
HypotheticalA | | $ .25 |
Fidelity Freedom Index 2040 Fund | .05% | |
Actual | | $ .26 |
HypotheticalA | | $ .25 |
Fidelity Freedom Index 2045 Fund | .05% | |
Actual | | $ .26 |
HypotheticalA | | $ .25 |
Fidelity Freedom Index 2050 Fund | .05% | |
Actual | | $ .26 |
HypotheticalA | | $ .25 |
Fidelity Freedom Index 2055 Fund | .05% | |
Actual | | $ .26 |
HypotheticalA | | $ .25 |
A 5% return per year before expenses
B Annualized expense ratio reflects expenses net of applicable fee waivers.
Semiannual Report
Fidelity Freedom Index Income Fund
Investment Changes (Unaudited)
The information in the following tables is based on the direct investments of the Fund. |
Fund Holdings as of September 30, 2013 |
| % of fund's
net assets | % of fund's net assets
6 months ago |
Commodity Funds | | |
Fidelity Series Commodity Strategy Fund Class F | 1.8 | 2.0 |
Domestic Equity Funds | | |
Spartan Total Market Index Fund Class F | 13.1 | 12.6 |
Developed International Equity Funds | | |
Fidelity Series Global ex U.S. Index Fund | 5.7 | 5.4 |
Inflation-Protected Bond Funds | | |
Fidelity Series Inflation-Protected Bond Index Fund Class F | 11.1 | 12.0 |
Investment Grade Bond Funds | | |
Spartan U.S. Bond Index Fund Class F | 30.2 | 28.0 |
Short-Term Funds | | |
Fidelity Institutional Money Market Portfolio Class F | 38.1 | 40.0 |
Net Other Assets (Liabilities)* | 0.0 | 0.0 |
| 100.0 | 100.0 |
* Amount represents less than 0.1%
Asset Allocation (% of fund's net assets) |
Period end |
 | Commodity Funds | 1.8% | |
 | Domestic Equity Funds | 13.1% | |
 | Developed International Equity Funds | 5.7% | |
 | Inflation-Protected Bond Funds | 11.1% | |
 | Investment Grade Bond Funds | 30.2% | |
 | Short-Term Funds | 38.1% | |

Six months ago |
| Commodity Funds | 2.0% | |
| Domestic Equity Funds | 12.6% | |
| Developed International Equity Funds | 5.4% | |
| Inflation-Protected Bond Funds | 12.0% | |
| Investment Grade Bond Funds | 28.0% | |
| Short-Term Funds | 40.0% | |

Expected |
| Commodity Funds | 1.0% | |
| Domestic Equity Funds | 15.7% | |
| Developed International Equity Funds | 7.2% | |
| Inflation-Protected Bond Funds | 6.0% | |
| Investment Grade Bond Funds | 40.1% | |
| Short-Term Funds | 30.0% | |

The six months ago allocation is based on the fund's holdings as of March 31, 2013. The period end allocation is based on the fund's holdings as of September 30, 2013. The expected allocation represents the fund's anticipated allocation at March 31, 2014. |
Semiannual Report
Fidelity Freedom Index Income Fund
Investments September 30, 2013 (Unaudited)
Showing Percentage of Net Assets
Domestic Equity Funds - 14.9% |
| Shares | | Value |
Commodity Funds - 1.8% |
Fidelity Series Commodity Strategy Fund Class F (a)(c) | 292,590 | | $ 2,355,351 |
Domestic Equity Funds - 13.1% |
Spartan Total Market Index Fund
Class F (c) | 349,384 | | 17,406,309 |
TOTAL DOMESTIC EQUITY FUNDS (Cost $15,612,500) |
19,761,660
|
International Equity Funds - 5.7% |
| | | |
Developed International Equity Funds - 5.7% |
Fidelity Series Global ex U.S. Index
Fund (c)
(Cost $6,373,396) | 634,671 | |
7,571,628
|
Bond Funds - 41.3% |
| | | |
Inflation-Protected Bond Funds - 11.1% |
Fidelity Series Inflation-Protected Bond Index Fund Class F (c) | 1,360,134 | | 14,771,052 |
|
| Shares | | Value |
Investment Grade Bond Funds - 30.2% |
Spartan U.S. Bond Index Fund
Class F (c) | 3,506,067 | | $ 40,214,590 |
TOTAL BOND FUNDS (Cost $55,865,446) |
54,985,642
|
Short-Term Funds - 38.1% |
| | | |
Fidelity Institutional Money Market Portfolio Class F 0.07% (b)(c)
(Cost $50,753,962) | 50,753,962 | |
50,753,962
|
TOTAL INVESTMENT PORTFOLIO - 100.0% (Cost $128,605,304) | | 133,072,892 |
NET OTHER ASSETS (LIABILITIES) - 0.0% | | (9,940) |
NET ASSETS - 100% | $ 133,062,952 |
Legend |
(a) Non-income producing |
(b) The rate quoted is the annualized seven-day yield of the fund at period end. |
(c) Affiliated company |
Affiliated Underlying Funds |
Information regarding the Fund's fiscal year to date purchases and sales of the affiliated Underlying Funds and income earned by the Fund from investments in affiliated Underlying Funds is as follows: |
Affiliate | Value,
beginning of period | Purchases | Sales
Proceeds | Dividend Income | Value,
end of
period |
Fidelity Institutional Money Market Portfolio Class F | $ 53,113,549 | $ 8,142,468 | $ 10,502,055 | $ 30,417 | $ 50,753,962 |
Fidelity Series Commodity Strategy Fund Class F | 2,640,205 | 575,424 | 653,353 | - | 2,355,351 |
Fidelity Series Global ex U.S. Index Fund | 7,160,575 | 1,286,845 | 1,361,776 | - | 7,571,628 |
Fidelity Series Inflation-Protected Bond Index Fund Class F | 15,930,060 | 2,934,617 | 3,344,424 | - | 14,771,052 |
Spartan Total Market Index Fund Class F | 16,736,513 | 3,211,386 | 3,980,684 | 48,040 | 17,406,309 |
Spartan U.S. Bond Index Fund Class F | 37,182,018 | 9,363,030 | 5,214,537 | 426,385 | 40,214,590 |
Total | $ 132,762,920 | $ 25,513,770 | $ 25,056,829 | $ 504,842 | $ 133,072,892 |
Other Information |
All investments are categorized as Level 1 under the Fair Value Hierarchy. The inputs or methodology used for valuing securities may not be an indication of the risk associated with investing in those securities. For more information on valuation inputs, please refer to the Investment Valuation section in the accompanying Notes to Financial Statements. |
See accompanying notes which are an integral part of the financial statements.
Semiannual Report
Fidelity Freedom Index Income Fund
Statement of Assets and Liabilities
| September 30, 2013 (Unaudited) |
| | |
Assets | | |
Investment in securities, at value (cost $128,605,304) - See accompanying schedule | | $ 133,072,892 |
Cash | | 1 |
Receivable for investments sold | | 3,361,619 |
Receivable for fund shares sold | | 102,755 |
Receivable from affiliate for expense reductions | | 6,713 |
Total assets | | 136,543,980 |
| | |
Liabilities | | |
Payable for investments purchased | $ 3,250,434 | |
Payable for fund shares redeemed | 213,938 | |
Transfer agent fees payable | 16,656 | |
Total liabilities | | 3,481,028 |
| | |
Net Assets | | $ 133,062,952 |
Net Assets consist of: | | |
Paid in capital | | $ 128,858,642 |
Undistributed net investment income | | 83,301 |
Accumulated undistributed net realized gain (loss) on investments | | (346,579) |
Net unrealized appreciation (depreciation) on investments | | 4,467,588 |
Net Assets, for 11,979,762 shares outstanding | | $ 133,062,952 |
Net Asset Value, offering price and redemption price per share ($133,062,952 ÷ 11,979,762 shares) | | $ 11.11 |
Statement of Operations
Six months ended September 30, 2013 (Unaudited) |
| | |
Investment Income | | |
Income distributions from underlying funds | | $ 504,842 |
| | |
Expenses | | |
Transfer agent fees | $ 99,533 | |
Independent trustees' compensation | 248 | |
Total expenses before reductions | 99,781 | |
Expense reductions | (38,962) | 60,819 |
Net investment income (loss) | | 444,023 |
Realized and Unrealized Gain (Loss) Realized gain (loss) on sale of underlying fund shares | | (27,244) |
Change in net unrealized appreciation (depreciation) on investment securities | | (119,725) |
Net gain (loss) | | (146,969) |
Net increase (decrease) in net assets resulting from operations | | $ 297,054 |
See accompanying notes which are an integral part of the financial statements.
Semiannual Report
Fidelity Freedom Index Income Fund
Financial Statements - continued
Statement of Changes in Net Assets
| Six months ended September 30, 2013 (Unaudited) | Year ended
March 31,
2013 |
Increase (Decrease) in Net Assets | | |
Operations | | |
Net investment income (loss) | $ 444,023 | $ 1,153,572 |
Net realized gain (loss) | (27,244) | 650,012 |
Change in net unrealized appreciation (depreciation) | (119,725) | 2,653,892 |
Net increase (decrease) in net assets resulting from operations | 297,054 | 4,457,476 |
Distributions to shareholders from net investment income | (443,694) | (1,128,654) |
Distributions to shareholders from net realized gain | (188,185) | (581,226) |
Total distributions | (631,879) | (1,709,880) |
Share transactions
Proceeds from sales of shares | 30,110,707 | 92,203,884 |
Reinvestment of distributions | 631,879 | 1,709,880 |
Cost of shares redeemed | (30,097,891) | (31,313,121) |
Net increase (decrease) in net assets resulting from share transactions | 644,695 | 62,600,643 |
Total increase (decrease) in net assets | 309,870 | 65,348,239 |
Net Assets | | |
Beginning of period | 132,753,082 | 67,404,843 |
End of period (including undistributed net investment income of $83,301 and undistributed net investment income of $82,972, respectively) | $ 133,062,952 | $ 132,753,082 |
Other Information Shares | | |
Sold | 2,720,882 | 8,425,114 |
Issued in reinvestment of distributions | 56,912 | 156,070 |
Redeemed | (2,721,381) | (2,846,649) |
Net increase (decrease) | 56,413 | 5,734,535 |
Financial Highlights
| Six months ended September 30, 2013 | Years ended March 31, |
| (Unaudited) | 2013 | 2012 | 2011 | 2010 E |
Selected Per-Share Data | | | | | |
Net asset value, beginning of period | $ 11.13 | $ 10.89 | $ 10.74 | $ 10.29 | $ 10.00 |
Income from Investment Operations | | | | | |
Net investment income (loss) D | .04 | .12 | .13 | .13 | .06 |
Net realized and unrealized gain (loss) | (.01) | .29 | .24 | .47 | .30 |
Total from investment operations | .03 | .41 | .37 | .60 | .36 |
Distributions from net investment income | (.04) | (.11) | (.13) | (.12) | (.07) |
Distributions from net realized gain | (.02) | (.05) | (.09) | (.03) | (.01) |
Total distributions | (.05) H | (.17) I | (.22) | (.15) | (.07) J |
Net asset value, end of period | $ 11.11 | $ 11.13 | $ 10.89 | $ 10.74 | $ 10.29 |
Total Return B,C | .30% | 3.75% | 3.52% | 5.89% | 3.62% |
Ratios to Average Net Assets F,G | | | | | |
Expenses before reductions | .15% A | .15% | .15% | .08% | .05% A |
Expenses net of fee waivers, if any | .09% A | .10% | .09% | .06% | .04% A |
Expenses net of all reductions | .09% A | .10% | .09% | .06% | .04% A |
Net investment income (loss) | .67% A | 1.06% | 1.24% | 1.27% | 1.13% A |
Supplemental Data | | | | | |
Net assets, end of period (000 omitted) | $ 133,063 | $ 132,753 | $ 67,405 | $ 38,540 | $ 6,401 |
Portfolio turnover rate G | 38% A | 19% | 31% | 36% | 18% |
A Annualized
B Total returns for periods of less than one year are not annualized.
C Total returns would have been lower if certain expenses had not been reduced during the applicable periods shown.
D Calculated based on average shares outstanding during the period.
E For the period October 2, 2009 (commencement of operations) to March 31, 2010.
F Expense ratios reflect operating expenses of the Fund. Expenses before reductions do not reflect amounts reimbursed by the investment adviser or reductions from expense offset arrangements and do not represent the amount paid by the Fund during periods when reimbursements or reductions occur. Expense ratios before reductions for start-up periods may not be representative of longer term operating periods. Expenses net of fee waivers reflect expenses after reimbursement by the investment adviser but prior to reductions from expense offset arrangements. Expenses net of all reductions represent the net expenses paid by the Fund.
G Amounts do not include the activity of the underlying funds.
H Total distributions of $.05 per share is comprised of distributions from net investment income of $.037 and distributions from net realized gain of $.016 per share.
I Total distributions of $.17 per share is comprised of distributions from net investment income of $.112 and distributions from net realized gain of $.053 per share.
J Total distributions of $.07 per share is comprised of distributions from net investment income of $.066 and distributions from net realized gain of $.005 per share.
See accompanying notes which are an integral part of the financial statements.
Semiannual Report
Fidelity Freedom Index 2000 Fund
Investment Changes (Unaudited)
The information in the following tables is based on the direct investments of the Fund. |
Fund Holdings as of September 30, 2013 |
| % of fund's
net assets | % of fund's net assets
6 months ago |
Commodity Funds | | |
Fidelity Series Commodity Strategy Fund Class F | 1.8 | 2.0 |
Domestic Equity Funds | | |
Spartan Total Market Index Fund Class F | 13.1 | 12.6 |
Developed International Equity Funds | | |
Fidelity Series Global ex U.S. Index Fund | 5.7 | 5.4 |
Inflation-Protected Bond Funds | | |
Fidelity Series Inflation-Protected Bond Index Fund Class F | 11.1 | 12.0 |
Investment Grade Bond Funds | | |
Spartan U.S. Bond Index Fund Class F | 30.2 | 28.0 |
Short-Term Funds | | |
Fidelity Institutional Money Market Portfolio Class F | 38.1 | 40.0 |
Net Other Assets (Liabilities)* | 0.0 | 0.0 |
| 100.0 | 100.0 |
* Amount represents less than 0.1%
Asset Allocation (% of fund's net assets) |
Period end |
| Commodity Funds | 1.8% | |
| Domestic Equity Funds | 13.1% | |
| Developed International Equity Funds | 5.7% | |
| Inflation-Protected Bond Funds | 11.1% | |
| Investment Grade Bond Funds | 30.2% | |
| Short-Term Funds | 38.1% | |

Six months ago |
| Commodity Funds | 2.0% | |
| Domestic Equity Funds | 12.6% | |
| Developed International Equity Funds | 5.4% | |
| Inflation-Protected Bond Funds | 12.0% | |
| Investment Grade Bond Funds | 28.0% | |
| Short-Term Funds | 40.0% | |

Expected |
| Commodity Funds | 1.0% | |
| Domestic Equity Funds | 15.7% | |
| Developed International Equity Funds | 7.2% | |
| Inflation-Protected Bond Funds | 6.0% | |
| Investment Grade Bond Funds | 40.1% | |
| Short-Term Funds | 30.0% | |

The fund invests according to an asset allocation strategy that becomes increasingly conservative over time. The six months ago allocation is based on the fund's holdings as of March 31, 2013. The period end allocation is based on the fund's holdings as of September 30, 2013. The expected allocation represents the fund's anticipated allocation at March 31, 2014. |
Semiannual Report
Fidelity Freedom Index 2000 Fund
Investments September 30, 2013 (Unaudited)
Showing Percentage of Net Assets
Domestic Equity Funds - 14.9% |
| Shares | | Value |
Commodity Funds - 1.8% |
Fidelity Series Commodity Strategy Fund Class F (a)(c) | 126,383 | | $ 1,017,387 |
Domestic Equity Funds - 13.1% |
Spartan Total Market Index Fund
Class F (c) | 152,694 | | 7,607,227 |
TOTAL DOMESTIC EQUITY FUNDS (Cost $6,740,880) |
8,624,614
|
International Equity Funds - 5.7% |
| | | |
Developed International Equity Funds - 5.7% |
Fidelity Series Global ex U.S. Index
Fund (c)
(Cost $2,781,540) | 277,067 | |
3,305,405
|
Bond Funds - 41.3% |
| | | |
Inflation-Protected Bond Funds - 11.1% |
Fidelity Series Inflation-Protected Bond Index Fund Class F (c) | 591,610 | | 6,424,881 |
|
| Shares | | Value |
Investment Grade Bond Funds - 30.2% |
Spartan U.S. Bond Index Fund
Class F (c) | 1,526,284 | | $ 17,506,476 |
TOTAL BOND FUNDS (Cost $24,072,150) |
23,931,357
|
Short-Term Funds - 38.1% |
| | | |
Fidelity Institutional Money Market Portfolio Class F 0.07% (b)(c)
(Cost $22,096,762) | 22,096,762 | |
22,096,762
|
TOTAL INVESTMENT PORTFOLIO - 100.0% (Cost $55,691,332) | | 57,958,138 |
NET OTHER ASSETS (LIABILITIES) - 0.0% | | (4,340) |
NET ASSETS - 100% | $ 57,953,798 |
Legend |
(a) Non-income producing |
(b) The rate quoted is the annualized seven-day yield of the fund at period end. |
(c) Affiliated company |
Affiliated Underlying Funds |
Information regarding the Fund's fiscal year to date purchases and sales of the affiliated Underlying Funds and income earned by the Fund from investments in affiliated Underlying Funds is as follows: |
Affiliate | Value, beginning of period | Purchases | Sales
Proceeds | Dividend Income | Value,
end of
period |
Fidelity Institutional Money Market Portfolio Class F | $ 23,501,543 | $ 3,654,893 | $ 5,059,674 | $ 13,396 | $ 22,096,762 |
Fidelity Series Commodity Strategy Fund Class F | 1,166,142 | 265,364 | 322,544 | - | 1,017,387 |
Fidelity Series Global ex U.S. Index Fund | 3,164,687 | 560,273 | 630,685 | - | 3,305,405 |
Fidelity Series Inflation-Protected Bond Index Fund Class F | 7,042,780 | 1,345,298 | 1,632,080 | - | 6,424,881 |
Spartan Total Market Index Fund Class F | 7,448,502 | 1,340,154 | 1,822,143 | 21,615 | 7,607,227 |
Spartan U.S. Bond Index Fund Class F | 16,457,641 | 4,067,288 | 2,529,628 | 187,654 | 17,506,476 |
Total | $ 58,781,295 | $ 11,233,270 | $ 11,996,754 | $ 222,665 | $ 57,958,138 |
Other Information |
All investments are categorized as Level 1 under the Fair Value Hierarchy. The inputs or methodology used for valuing securities may not be an indication of the risk associated with investing in those securities. For more information on valuation inputs, please refer to the Investment Valuation section in the accompanying Notes to Financial Statements. |
See accompanying notes which are an integral part of the financial statements.
Semiannual Report
Fidelity Freedom Index 2000 Fund
Statement of Assets and Liabilities
| September 30, 2013 (Unaudited) |
| | |
Assets | | |
Investment in securities, at value (cost $55,691,332) - See accompanying schedule | | $ 57,958,138 |
Receivable for investments sold | | 1,632,977 |
Receivable for fund shares sold | | 74,066 |
Receivable from affiliate for expense reductions | | 2,928 |
Total assets | | 59,668,109 |
| | |
Liabilities | | |
Payable for investments purchased | $ 1,267,802 | |
Payable for fund shares redeemed | 439,240 | |
Transfer agent fees payable | 7,269 | |
Total liabilities | | 1,714,311 |
| | |
Net Assets | | $ 57,953,798 |
Net Assets consist of: | | |
Paid in capital | | $ 55,612,982 |
Undistributed net investment income | | 195,559 |
Accumulated undistributed net realized gain (loss) on investments | | (121,549) |
Net unrealized appreciation (depreciation) on investments | | 2,266,806 |
Net Assets, for 5,187,586 shares outstanding | | $ 57,953,798 |
Net Asset Value, offering price and redemption price per share ($57,953,798 ÷ 5,187,586 shares) | | $ 11.17 |
Statement of Operations
Six months ended September 30, 2013 (Unaudited) |
| | |
Investment Income | | |
Income distributions from underlying funds | | $ 222,665 |
| | |
Expenses | | |
Transfer agent fees | $ 43,785 | |
Independent trustees' compensation | 109 | |
Total expenses before reductions | 43,894 | |
Expense reductions | (17,473) | 26,421 |
Net investment income (loss) | | 196,244 |
Realized and Unrealized Gain (Loss) Realized gain (loss) on sale of underlying fund shares | | 62,694 |
Change in net unrealized appreciation (depreciation) on investment securities | | (122,367) |
Net gain (loss) | | (59,673) |
Net increase (decrease) in net assets resulting from operations | | $ 136,571 |
See accompanying notes which are an integral part of the financial statements.
Semiannual Report
Statement of Changes in Net Assets
| Six months ended September 30, 2013 (Unaudited) | Year ended
March 31,
2013 |
Increase (Decrease) in Net Assets | | |
Operations | | |
Net investment income (loss) | $ 196,244 | $ 546,265 |
Net realized gain (loss) | 62,694 | 346,988 |
Change in net unrealized appreciation (depreciation) | (122,367) | 1,204,012 |
Net increase (decrease) in net assets resulting from operations | 136,571 | 2,097,265 |
Distributions to shareholders from net investment income | (84,770) | (539,630) |
Distributions to shareholders from net realized gain | (100,663) | (287,389) |
Total distributions | (185,433) | (827,019) |
Share transactions
Proceeds from sales of shares | 12,272,544 | 30,030,172 |
Reinvestment of distributions | 185,433 | 827,019 |
Cost of shares redeemed | (13,232,237) | (13,149,658) |
Net increase (decrease) in net assets resulting from share transactions | (774,260) | 17,707,533 |
Total increase (decrease) in net assets | (823,122) | 18,977,779 |
| | |
Net Assets | | |
Beginning of period | 58,776,920 | 39,799,141 |
End of period (including undistributed net investment income of $195,559 and undistributed net investment income of $84,085, respectively) | $ 57,953,798 | $ 58,776,920 |
Other Information Shares | | |
Sold | 1,103,848 | 2,735,231 |
Issued in reinvestment of distributions | 16,542 | 75,347 |
Redeemed | (1,190,141) | (1,191,832) |
Net increase (decrease) | (69,751) | 1,618,746 |
Financial Highlights
| Six months ended September 30, 2013 | Years ended March 31, |
| (Unaudited) | 2013 | 2012 | 2011 | 2010 E |
Selected Per-Share Data | | | | | |
Net asset value, beginning of period | $ 11.18 | $ 10.94 | $ 10.79 | $ 10.32 | $ 10.00 |
Income from Investment Operations | | | | | |
Net investment income (loss) D | .04 | .12 | .13 | .13 | .05 |
Net realized and unrealized gain (loss) | (.01) | .29 | .24 | .49 | .34 |
Total from investment operations | .03 | .41 | .37 | .62 | .39 |
Distributions from net investment income | (.02) | (.11) | (.12) | (.11) | (.06) |
Distributions from net realized gain | (.02) | (.06) | (.10) | (.04) | (.01) |
Total distributions | (.04) | (.17) | (.22) | (.15) | (.07) |
Net asset value, end of period | $ 11.17 | $ 11.18 | $ 10.94 | $ 10.79 | $ 10.32 |
Total Return B,C | .22% | 3.76% | 3.50% | 6.00% | 3.86% |
Ratios to Average Net Assets F,G | | | | | |
Expenses before reductions | .15% A | .15% | .15% | .08% | .05% A |
Expenses net of fee waivers, if any | .09% A | .10% | .09% | .05% | .04% A |
Expenses net of all reductions | .09% A | .10% | .09% | .05% | .04% A |
Net investment income (loss) | .67% A | 1.04% | 1.23% | 1.25% | 1.09% A |
Supplemental Data | | | | | |
Net assets, end of period (000 omitted) | $ 57,954 | $ 58,777 | $ 39,799 | $ 25,606 | $ 6,841 |
Portfolio turnover rate G | 39% A | 21% | 36% | 33% | 30% |
A Annualized
B Total returns for periods of less than one year are not annualized.
C Total returns would have been lower if certain expenses had not been reduced during the applicable periods shown.
D Calculated based on average shares outstanding during the period.
E For the period October 2, 2009 (commencement of operations) to March 31, 2010.
F Expense ratios reflect operating expenses of the Fund. Expenses before reductions do not reflect amounts reimbursed by the investment adviser or reductions from expense offset arrangements and do not represent the amount paid by the Fund during periods when reimbursements or reductions occur. Expense ratios before reductions for start-up periods may not be representative of longer term operating periods. Expenses net of fee waivers reflect expenses after reimbursement by the investment adviser but prior to reductions from expense offset arrangements. Expenses net of all reductions represent the net expenses paid by the Fund.
G Amounts do not include the activity of the underlying funds.
See accompanying notes which are an integral part of the financial statements.
Semiannual Report
Fidelity Freedom Index 2005 Fund
Investment Changes (Unaudited)
The information in the following tables is based on the direct investments of the Fund. |
Fund Holdings as of September 30, 2013 |
| % of fund's
net assets | % of fund's net assets
6 months ago |
Commodity Funds | | |
Fidelity Series Commodity Strategy Fund Class F | 3.0 | 3.8 |
Domestic Equity Funds | | |
Spartan Total Market Index Fund Class F | 21.7 | 21.5 |
Developed International Equity Funds | | |
Fidelity Series Global ex U.S. Index Fund | 9.5 | 9.2 |
Inflation-Protected Bond Funds | | |
Fidelity Series Inflation-Protected Bond Index Fund Class F | 9.1 | 9.7 |
Investment Grade Bond Funds | | |
Spartan U.S. Bond Index Fund Class F | 26.5 | 24.7 |
Short-Term Funds | | |
Fidelity Institutional Money Market Portfolio Class F | 30.2 | 31.1 |
Net Other Assets (Liabilities)* | 0.0 | 0.0 |
| 100.0 | 100.0 |
* Amount represents less than 0.1%
Asset Allocation (% of fund's net assets) |
Period end |
| Commodity Funds | 3.0% | |
| Domestic Equity Funds | 21.7% | |
| Developed International Equity Funds | 9.5% | |
| Inflation-Protected Bond Funds | 9.1% | |
| Investment Grade Bond Funds | 26.5% | |
| Short-Term Funds | 30.2% | |

Six months ago |
| Commodity Funds | 3.8% | |
| Domestic Equity Funds | 21.5% | |
| Developed International Equity Funds | 9.2% | |
| Inflation-Protected Bond Funds | 9.7% | |
| Investment Grade Bond Funds | 24.7% | |
| Short-Term Funds | 31.1% | |

Expected |
| Commodity Funds | 1.0% | |
| Domestic Equity Funds | 25.5% | |
| Developed International Equity Funds | 11.3% | |
| Inflation-Protected Bond Funds | 4.7% | |
| Investment Grade Bond Funds | 36.4% | |
| Short-Term Funds | 21.1% | |

The fund invests according to an asset allocation strategy that becomes increasingly conservative over time. The six months ago allocation is based on the fund's holdings as of March 31, 2013. The period end allocation is based on the fund's holdings as of September 30, 2013. The expected allocation represents the fund's anticipated allocation at March 31, 2014. |
Semiannual Report
Fidelity Freedom Index 2005 Fund
Investments September 30, 2013 (Unaudited)
Showing Percentage of Net Assets
Domestic Equity Funds - 24.7% |
| Shares | | Value |
Commodity Funds - 3.0% |
Fidelity Series Commodity Strategy Fund Class F (a)(c) | 227,890 | | $ 1,834,518 |
Domestic Equity Funds - 21.7% |
Spartan Total Market Index Fund
Class F (c) | 268,001 | | 13,351,790 |
TOTAL DOMESTIC EQUITY FUNDS (Cost $12,128,132) |
15,186,308
|
International Equity Funds - 9.5% |
| | | |
Developed International Equity Funds - 9.5% |
Fidelity Series Global ex U.S. Index
Fund (c)
(Cost $5,090,657) | 487,030 | |
5,810,272
|
Bond Funds - 35.6% |
| | | |
Inflation-Protected Bond Funds - 9.1% |
Fidelity Series Inflation-Protected Bond Index Fund Class F (c) | 513,786 | | 5,579,715 |
|
| Shares | | Value |
Investment Grade Bond Funds - 26.5% |
Spartan U.S. Bond Index Fund
Class F (c) | 1,423,418 | | $ 16,326,603 |
TOTAL BOND FUNDS (Cost $22,047,508) |
21,906,318
|
Short-Term Funds - 30.2% |
| | | |
Fidelity Institutional Money Market Portfolio Class F 0.07% (b)(c)
(Cost $18,560,170) | 18,560,170 | |
18,560,170
|
TOTAL INVESTMENT PORTFOLIO - 100.0% (Cost $57,826,467) | | 61,463,068 |
NET OTHER ASSETS (LIABILITIES) - 0.0% | | (4,360) |
NET ASSETS - 100% | $ 61,458,708 |
Legend |
(a) Non-income producing |
(b) The rate quoted is the annualized seven-day yield of the fund at period end. |
(c) Affiliated company |
Affiliated Underlying Funds |
Information regarding the Fund's fiscal year to date purchases and sales of the affiliated Underlying Funds and income earned by the Fund from investments in affiliated Underlying Funds is as follows: |
Affiliate | Value, beginning of period | Purchases | Sales
Proceeds | Dividend Income | Value,
end of
period |
Fidelity Institutional Money Market Portfolio Class F | $ 19,599,320 | $ 2,726,817 | $ 3,765,966 | $ 11,359 | $ 18,560,170 |
Fidelity Series Commodity Strategy Fund Class F | 2,391,366 | 339,499 | 713,024 | - | 1,834,518 |
Fidelity Series Global ex U.S. Index Fund | 5,803,062 | 716,335 | 1,084,851 | - | 5,810,272 |
Fidelity Series Inflation-Protected Bond Index Fund Class F | 6,114,582 | 879,418 | 1,127,472 | - | 5,579,715 |
Spartan Total Market Index Fund Class F | 13,558,872 | 1,748,618 | 3,086,720 | 39,698 | 13,351,790 |
Spartan U.S. Bond Index Fund Class F | 15,520,084 | 3,254,081 | 1,990,281 | 174,961 | 16,326,603 |
Total | $ 62,987,286 | $ 9,664,768 | $ 11,768,314 | $ 226,018 | $ 61,463,068 |
Other Information |
All investments are categorized as Level 1 under the Fair Value Hierarchy. The inputs or methodology used for valuing securities may not be an indication of the risk associated with investing in those securities. For more information on valuation inputs, please refer to the Investment Valuation section in the accompanying Notes to Financial Statements. |
See accompanying notes which are an integral part of the financial statements.
Semiannual Report
Fidelity Freedom Index 2005 Fund
Statement of Assets and Liabilities
| September 30, 2013 (Unaudited) |
| | |
Assets | | |
Investment in securities, at value (cost $57,826,467) - See accompanying schedule | | $ 61,463,068 |
Cash | | 2 |
Receivable for investments sold | | 1,851,042 |
Receivable for fund shares sold | | 111,975 |
Receivable from affiliate for expense reductions | | 3,261 |
Total assets | | 63,429,348 |
| | |
Liabilities | | |
Payable for investments purchased | $ 1,913,121 | |
Payable for fund shares redeemed | 49,893 | |
Transfer agent fees payable | 7,626 | |
Total liabilities | | 1,970,640 |
| | |
Net Assets | | $ 61,458,708 |
Net Assets consist of: | | |
Paid in capital | | $ 57,762,357 |
Undistributed net investment income | | 196,106 |
Accumulated undistributed net realized gain (loss) on investments | | (136,356) |
Net unrealized appreciation (depreciation) on investments | | 3,636,601 |
Net Assets, for 5,110,858 shares outstanding | | $ 61,458,708 |
Net Asset Value, offering price and redemption price per share ($61,458,708 ÷ 5,110,858 shares) | | $ 12.03 |
Statement of Operations
Six months ended September 30, 2013 (Unaudited) |
| | |
Investment Income | | |
Income distributions from underlying funds | | $ 226,018 |
| | |
Expenses | | |
Transfer agent fees | $ 46,643 | |
Independent trustees' compensation | 117 | |
Total expenses before reductions | 46,760 | |
Expense reductions | (19,647) | 27,113 |
Net investment income (loss) | | 198,905 |
Realized and Unrealized Gain (Loss) Realized gain (loss) on sale of underlying fund shares | | 97,175 |
Change in net unrealized appreciation (depreciation) on investment securities | | 482,152 |
Net gain (loss) | | 579,327 |
Net increase (decrease) in net assets resulting from operations | | $ 778,232 |
See accompanying notes which are an integral part of the financial statements.
Semiannual Report
Fidelity Freedom Index 2005 Fund
Financial Statements - continued
Statement of Changes in Net Assets
| Six months ended September 30, 2013 (Unaudited) | Year ended
March 31,
2013 |
Increase (Decrease) in Net Assets | | |
Operations | | |
Net investment income (loss) | $ 198,905 | $ 643,975 |
Net realized gain (loss) | 97,175 | 277,425 |
Change in net unrealized appreciation (depreciation) | 482,152 | 1,988,410 |
Net increase (decrease) in net assets resulting from operations | 778,232 | 2,909,810 |
Distributions to shareholders from net investment income | (74,307) | (645,508) |
Distributions to shareholders from net realized gain | (106,152) | (199,238) |
Total distributions | (180,459) | (844,746) |
Share transactions
Proceeds from sales of shares | 8,608,681 | 27,537,973 |
Reinvestment of distributions | 180,459 | 844,746 |
Cost of shares redeemed | (10,911,000) | (11,451,064) |
Net increase (decrease) in net assets resulting from share transactions | (2,121,860) | 16,931,655 |
Total increase (decrease) in net assets | (1,524,087) | 18,996,719 |
| | |
Net Assets | | |
Beginning of period | 62,982,795 | 43,986,076 |
End of period (including undistributed net investment income of $196,106 and undistributed net investment income of $71,508, respectively) | $ 61,458,708 | $ 62,982,795 |
Other Information Shares | | |
Sold | 723,687 | 2,379,763 |
Issued in reinvestment of distributions | 15,051 | 73,213 |
Redeemed | (916,360) | (989,707) |
Net increase (decrease) | (177,622) | 1,463,269 |
Financial Highlights
| Six months ended September 30, 2013 | Years ended March 31, |
| (Unaudited) | 2013 | 2012 | 2011 | 2010 E |
Selected Per-Share Data | | | | | |
Net asset value, beginning of period | $ 11.91 | $ 11.50 | $ 11.44 | $ 10.59 | $ 10.00 |
Income from Investment Operations | | | | | |
Net investment income (loss) D | .04 | .14 | .16 | .16 | .06 |
Net realized and unrealized gain (loss) | .11 | .45 | .18 | .86 | .62 |
Total from investment operations | .15 | .59 | .34 | 1.02 | .68 |
Distributions from net investment income | (.01) | (.14) | (.14) | (.12) | (.08) |
Distributions from net realized gain | (.02) | (.04) | (.14) | (.05) | (.01) |
Total distributions | (.03) | (.18) | (.28) | (.17) | (.09) |
Net asset value, end of period | $ 12.03 | $ 11.91 | $ 11.50 | $ 11.44 | $ 10.59 |
Total Return B,C | 1.29% | 5.17% | 3.11% | 9.72% | 6.78% |
Ratios to Average Net Assets F,G | | | | | |
Expenses before reductions | .15% A | .15% | .15% | .09% | .05% A |
Expenses net of fee waivers, if any | .09% A | .09% | .09% | .06% | .03% A |
Expenses net of all reductions | .09% A | .09% | .09% | .06% | .03% A |
Net investment income (loss) | .64% A | 1.22% | 1.45% | 1.42% | 1.19% A |
Supplemental Data | | | | | |
Net assets, end of period (000 omitted) | $ 61,459 | $ 62,983 | $ 43,986 | $ 23,459 | $ 2,167 |
Portfolio turnover rate G | 31% A | 23% | 37% | 53% | 15% |
A Annualized
B Total returns for periods of less than one year are not annualized.
C Total returns would have been lower if certain expenses had not been reduced during the applicable periods shown.
D Calculated based on average shares outstanding during the period.
E For the period October 2, 2009 (commencement of operations) to March 31, 2010.
F Expense ratios reflect operating expenses of the Fund. Expenses before reductions do not reflect amounts reimbursed by the investment adviser or reductions from expense offset arrangements and do not represent the amount paid by the Fund during periods when reimbursements or reductions occur. Expense ratios before reductions for start-up periods may not be representative of longer term operating periods. Expenses net of fee waivers reflect expenses after reimbursement by the investment adviser but prior to reductions from expense offset arrangements. Expenses net of all reductions represent the net expenses paid by the Fund.
G Amounts do not include the activity of the underlying funds.
See accompanying notes which are an integral part of the financial statements.
Semiannual Report
Fidelity Freedom Index 2010 Fund
Investment Changes (Unaudited)
The information in the following tables is based on the direct investments of the Fund. |
Fund Holdings as of September 30, 2013 |
| % of fund's
net assets | % of fund's net assets
6 months ago |
Commodity Funds | | |
Fidelity Series Commodity Strategy Fund Class F | 4.2 | 5.2 |
Domestic Equity Funds | | |
Spartan Total Market Index Fund Class F | 30.5 | 30.0 |
Developed International Equity Funds | | |
Fidelity Series Global ex U.S. Index Fund | 13.1 | 12.8 |
Inflation-Protected Bond Funds | | |
Fidelity Series Inflation-Protected Bond Index Fund Class F | 9.7 | 10.5 |
Investment Grade Bond Funds | | |
Spartan U.S. Bond Index Fund Class F | 28.5 | 28.4 |
Short-Term Funds | | |
Fidelity Institutional Money Market Portfolio Class F | 14.0 | 13.1 |
Net Other Assets (Liabilities)* | 0.0 | 0.0 |
| 100.0 | 100.0 |
* Amount represents less than 0.1%
Asset Allocation (% of fund's net assets) |
Period end |
| Commodity Funds | 4.2% | |
| Domestic Equity Funds | 30.5% | |
| Developed International Equity Funds | 13.1% | |
| Inflation-Protected Bond Funds | 9.7% | |
| Investment Grade Bond Funds | 28.5% | |
| Short-Term Funds | 14.0% | |

Six months ago |
| Commodity Funds | 5.2% | |
| Domestic Equity Funds | 30.0% | |
| Developed International Equity Funds | 12.8% | |
| Inflation-Protected Bond Funds | 10.5% | |
| Investment Grade Bond Funds | 28.4% | |
| Short-Term Funds | 13.1% | |

Expected |
 | Commodity Funds | 1.0% | |
| Domestic Equity Funds | 31.7% | |
| Developed International Equity Funds | 14.0% | |
| Inflation-Protected Bond Funds | 3.9% | |
| Investment Grade Bond Funds | 33.6% | |
| Short-Term Funds | 15.8% | |

The fund invests according to an asset allocation strategy that becomes increasingly conservative over time. The six months ago allocation is based on the fund's holdings as of March 31, 2013. The period end allocation is based on the fund's holdings as of September 30, 2013. The expected allocation represents the fund's anticipated allocation at March 31, 2014. |
Semiannual Report
Fidelity Freedom Index 2010 Fund
Investments September 30, 2013 (Unaudited)
Showing Percentage of Net Assets
Domestic Equity Funds - 34.7% |
| Shares | | Value |
Commodity Funds - 4.2% |
Fidelity Series Commodity Strategy Fund Class F (a)(c) | 1,935,880 | | $ 15,583,835 |
Domestic Equity Funds - 30.5% |
Spartan Total Market Index Fund
Class F (c) | 2,291,379 | | 114,156,481 |
TOTAL DOMESTIC EQUITY FUNDS (Cost $101,082,984) |
129,740,316
|
International Equity Funds - 13.1% |
| | | |
Developed International Equity Funds - 13.1% |
Fidelity Series Global ex U.S. Index
Fund (c)
(Cost $41,653,698) | 4,114,060 | |
49,080,740
|
Bond Funds - 38.2% |
| | | |
Inflation-Protected Bond Funds - 9.7% |
Fidelity Series Inflation-Protected Bond Index Fund Class F (c) | 3,338,559 | | 36,256,756 |
|
| Shares | | Value |
Investment Grade Bond Funds - 28.5% |
Spartan U.S. Bond Index Fund
Class F (c) | 9,274,397 | | $ 106,377,338 |
TOTAL BOND FUNDS (Cost $143,991,296) |
142,634,094
|
Short-Term Funds - 14.0% |
| | | |
Fidelity Institutional Money Market Portfolio Class F 0.07% (b)(c)
(Cost $52,107,693) | 52,107,693 | |
52,107,693
|
TOTAL INVESTMENT PORTFOLIO - 100.0% (Cost $338,835,671) | | 373,562,843 |
NET OTHER ASSETS (LIABILITIES) - 0.0% | | (28,614) |
NET ASSETS - 100% | $ 373,534,229 |
Legend |
(a) Non-income producing |
(b) The rate quoted is the annualized seven-day yield of the fund at period end. |
(c) Affiliated company |
Affiliated Underlying Funds |
Information regarding the Fund's fiscal year to date purchases and sales of the affiliated Underlying Funds and income earned by the Fund from investments in affiliated Underlying Funds is as follows: |
Affiliate | Value,
beginning of period | Purchases | Sales
Proceeds | Dividend Income | Value,
end of
period |
Fidelity Institutional Money Market Portfolio Class F | $ 47,815,558 | $ 9,849,949 | $ 5,557,814 | $ 28,308 | $ 52,107,693 |
Fidelity Series Commodity Strategy Fund Class F | 19,073,441 | 3,871,018 | 5,882,263 | - | 15,583,835 |
Fidelity Series Global ex U.S. Index Fund | 46,607,658 | 6,697,399 | 7,480,730 | - | 49,080,740 |
Fidelity Series Inflation-Protected Bond Index Fund Class F | 38,492,235 | 6,332,181 | 6,770,791 | - | 36,256,756 |
Spartan Total Market Index Fund Class F | 109,281,717 | 16,314,241 | 20,890,596 | 316,131 | 114,156,481 |
Spartan U.S. Bond Index Fund Class F | 103,610,011 | 18,181,893 | 12,363,003 | 1,190,131 | 106,377,338 |
Total | $ 364,880,620 | $ 61,246,681 | $ 58,945,197 | $ 1,534,570 | $ 373,562,843 |
Other Information |
All investments are categorized as Level 1 under the Fair Value Hierarchy. The inputs or methodology used for valuing securities may not be an indication of the risk associated with investing in those securities. For more information on valuation inputs, please refer to the Investment Valuation section in the accompanying Notes to Financial Statements. |
See accompanying notes which are an integral part of the financial statements.
Semiannual Report
Fidelity Freedom Index 2010 Fund
Statement of Assets and Liabilities
| September 30, 2013 (Unaudited) |
| | |
Assets | | |
Investment in securities, at value (cost $338,835,671) - See accompanying schedule | | $ 373,562,843 |
Cash | | 2 |
Receivable for investments sold | | 5,919,306 |
Receivable for fund shares sold | | 577,401 |
Receivable from affiliate for expense reductions | | 18,040 |
Total assets | | 380,077,592 |
| | |
Liabilities | | |
Payable for investments purchased | $ 5,976,508 | |
Payable for fund shares redeemed | 520,199 | |
Transfer agent fees payable | 46,656 | |
Total liabilities | | 6,543,363 |
| | |
Net Assets | | $ 373,534,229 |
Net Assets consist of: | | |
Paid in capital | | $ 339,276,415 |
Undistributed net investment income | | 1,334,772 |
Accumulated undistributed net realized gain (loss) on investments | | (1,804,130) |
Net unrealized appreciation (depreciation) on investments | | 34,727,172 |
Net Assets, for 29,967,678 shares outstanding | | $ 373,534,229 |
Net Asset Value, offering price and redemption price per share ($373,534,229 ÷ 29,967,678 shares) | | $ 12.46 |
Statement of Operations
Six months ended September 30, 2013 (Unaudited) |
| | |
Investment Income | | |
Income distributions from underlying funds | | $ 1,534,570 |
| | |
Expenses | | |
Transfer agent fees | $ 275,965 | |
Independent trustees' compensation | 684 | |
Total expenses before reductions | 276,649 | |
Expense reductions | (104,414) | 172,235 |
Net investment income (loss) | | 1,362,335 |
Realized and Unrealized Gain (Loss) Realized gain (loss) on sale of underlying fund shares | | (17,098) |
Change in net unrealized appreciation (depreciation) on investment securities | | 6,397,838 |
Net gain (loss) | | 6,380,740 |
Net increase (decrease) in net assets resulting from operations | | $ 7,743,075 |
See accompanying notes which are an integral part of the financial statements.
Semiannual Report
Statement of Changes in Net Assets
| Six months ended September 30, 2013 (Unaudited) | Year ended
March 31,
2013 |
Increase (Decrease) in Net Assets | | |
Operations | | |
Net investment income (loss) | $ 1,362,335 | $ 4,892,147 |
Net realized gain (loss) | (17,098) | 2,131,101 |
Change in net unrealized appreciation (depreciation) | 6,397,838 | 16,619,400 |
Net increase (decrease) in net assets resulting from operations | 7,743,075 | 23,642,648 |
Distributions to shareholders from net investment income | (505,726) | (4,819,893) |
Distributions to shareholders from net realized gain | (1,041,199) | (1,596,123) |
Total distributions | (1,546,925) | (6,416,016) |
Share transactions
Proceeds from sales of shares | 64,802,091 | 192,142,131 |
Reinvestment of distributions | 1,546,925 | 6,416,016 |
Cost of shares redeemed | (63,863,563) | (89,089,878) |
Net increase (decrease) in net assets resulting from share transactions | 2,485,453 | 109,468,269 |
Total increase (decrease) in net assets | 8,681,603 | 126,694,901 |
| | |
Net Assets | | |
Beginning of period | 364,852,626 | 238,157,725 |
End of period (including undistributed net investment income of $1,334,772 and undistributed net investment income of $478,163, respectively) | $ 373,534,229 | $ 364,852,626 |
Other Information Shares | | |
Sold | 5,294,584 | 16,374,593 |
Issued in reinvestment of distributions | 124,651 | 545,847 |
Redeemed | (5,194,607) | (7,514,979) |
Net increase (decrease) | 224,628 | 9,405,461 |
Financial Highlights
| Six months ended September 30, 2013 | Years ended March 31, |
| (Unaudited) | 2013 | 2012 | 2011 | 2010 E |
Selected Per-Share Data | | | | | |
Net asset value, beginning of period | $ 12.27 | $ 11.71 | $ 11.65 | $ 10.65 | $ 10.00 |
Income from Investment Operations | | | | | |
Net investment income (loss) D | .05 | .18 | .20 | .19 | .05 |
Net realized and unrealized gain (loss) | .19 | .61 | .21 | .98 | .70 |
Total from investment operations | .24 | .79 | .41 | 1.17 | .75 |
Distributions from net investment income | (.02) | (.17) | (.18) | (.13) | (.09) |
Distributions from net realized gain | (.04) | (.06) | (.17) | (.04) | (.01) |
Total distributions | (.05) H | (.23) | (.35) | (.17) | (.10) |
Net asset value, end of period | $ 12.46 | $ 12.27 | $ 11.71 | $ 11.65 | $ 10.65 |
Total Return B,C | 1.97% | 6.80% | 3.64% | 11.08% | 7.47% |
Ratios to Average Net Assets F,G | | | | | |
Expenses before reductions | .15% A | .15% | .15% | .08% | .05% A |
Expenses net of fee waivers, if any | .09%A | .10% | .09% | .05% | .03% A |
Expenses net of all reductions | .09% A | .10% | .09% | .05% | .03% A |
Net investment income (loss) | .74% A | 1.54% | 1.71% | 1.68% | 1.08% A |
Supplemental Data | | | | | |
Net assets, end of period (000 omitted) | $ 373,534 | $ 364,853 | $ 238,158 | $ 144,278 | $ 19,773 |
Portfolio turnover rate G | 32% A | 21% | 33% | 36% | 21% |
A Annualized
B Total returns for periods of less than one year are not annualized.
C Total returns would have been lower if certain expenses had not been reduced during the applicable periods shown.
D Calculated based on average shares outstanding during the period.
E For the period October 2, 2009 (commencement of operations) to March 31, 2010.
F Expense ratios reflect operating expenses of the Fund. Expenses before reductions do not reflect amounts reimbursed by the investment adviser or reductions from expense offset arrangements and do not represent the amount paid by the Fund during periods when reimbursements or reductions occur. Expense ratios before reductions for start-up periods may not be representative of longer term operating periods. Expenses net of fee waivers reflect expenses after reimbursement by the investment adviser but prior to reductions from expense offset arrangements. Expenses net of all reductions represent the net expenses paid by the Fund.
G Amounts do not include the activity of the underlying funds.
H Total distributions of $.05 per share is comprised of distributions from net investment income of $.017 and distributions from net realized gain of $.035 per share.
See accompanying notes which are an integral part of the financial statements.
Semiannual Report
Fidelity Freedom Index 2015 Fund
Investment Changes (Unaudited)
The information in the following tables is based on the direct investments of the Fund. |
Fund Holdings as of September 30, 2013 |
| % of fund's
net assets | % of fund's net assets
6 months ago |
Commodity Funds | | |
Fidelity Series Commodity Strategy Fund Class F | 4.4 | 5.5 |
Domestic Equity Funds | | |
Spartan Total Market Index Fund Class F | 32.7 | 31.3 |
Developed International Equity Funds | | |
Fidelity Series Global ex U.S. Index Fund | 14.1 | 13.4 |
Inflation-Protected Bond Funds | | |
Fidelity Series Inflation-Protected Bond Index Fund Class F | 9.7 | 10.5 |
Investment Grade Bond Funds | | |
Spartan U.S. Bond Index Fund Class F | 29.3 | 29.4 |
Short-Term Funds | | |
Fidelity Institutional Money Market Portfolio Class F | 9.8 | 9.9 |
Net Other Assets (Liabilities)* | 0.0 | 0.0 |
| 100.0 | 100.0 |
* Amount represents less than 0.1%
Asset Allocation (% of fund's net assets) |
Period end |
| Commodity Funds | 4.4% | |
| Domestic Equity Funds | 32.7% | |
| Developed International Equity Funds | 14.1% | |
| Inflation-Protected Bond Funds | 9.7% | |
| Investment Grade Bond Funds | 29.3% | |
| Short-Term Funds | 9.8% | |

Six months ago |
| Commodity Funds | 5.5% | |
| Domestic Equity Funds | 31.3% | |
| Developed International Equity Funds | 13.4% | |
| Inflation-Protected Bond Funds | 10.5% | |
| Investment Grade Bond Funds | 29.4% | |
| Short-Term Funds | 9.9% | |

Expected |
| Commodity Funds | 1.0% | |
| Domestic Equity Funds | 37.8% | |
| Developed International Equity Funds | 16.7% | |
| Inflation-Protected Bond Funds | 3.0% | |
| Investment Grade Bond Funds | 31.0% | |
| Short-Term Funds | 10.5% | |

The fund invests according to an asset allocation strategy that becomes increasingly conservative over time. The six months ago allocation is based on the fund's holdings as of March 31, 2013. The period end allocation is based on the fund's holdings as of September 30, 2013. The expected allocation represents the fund's anticipated allocation at March 31, 2014. |
Semiannual Report
Fidelity Freedom Index 2015 Fund
Investments September 30, 2013 (Unaudited)
Showing Percentage of Net Assets
Domestic Equity Funds - 37.1% |
| Shares | | Value |
Commodity Funds - 4.4% |
Fidelity Series Commodity Strategy Fund Class F (a)(c) | 4,198,314 | | $ 33,796,431 |
Domestic Equity Funds - 32.7% |
Spartan Total Market Index Fund
Class F (c) | 5,045,250 | | 251,354,338 |
TOTAL DOMESTIC EQUITY FUNDS (Cost $229,422,637) |
285,150,769
|
International Equity Funds - 14.1% |
| | | |
Developed International Equity Funds - 14.1% |
Fidelity Series Global ex U.S. Index
Fund (c)
(Cost $93,719,528) | 9,052,864 | |
108,000,673
|
Bond Funds - 39.0% |
| | | |
Inflation-Protected Bond Funds - 9.7% |
Fidelity Series Inflation-Protected Bond Index Fund Class F (c) | 6,870,532 | | 74,613,972 |
|
| Shares | | Value |
Investment Grade Bond Funds - 29.3% |
Spartan U.S. Bond Index Fund
Class F (c) | 19,613,853 | | $ 224,970,897 |
TOTAL BOND FUNDS (Cost $303,616,435) |
299,584,869
|
Short-Term Funds - 9.8% |
| | | |
Fidelity Institutional Money Market Portfolio Class F 0.07% (b)(c)
(Cost $75,504,103) | 75,504,103 | |
75,504,103
|
TOTAL INVESTMENT PORTFOLIO - 100.0% (Cost $702,262,703) | | 768,240,414 |
NET OTHER ASSETS (LIABILITIES) - 0.0% | | (59,777) |
NET ASSETS - 100% | $ 768,180,637 |
Legend |
(a) Non-income producing |
(b) The rate quoted is the annualized seven-day yield of the fund at period end. |
(c) Affiliated company |
Affiliated Underlying Funds |
Information regarding the Fund's fiscal year to date purchases and sales of the affiliated Underlying Funds and income earned by the Fund from investments in affiliated Underlying Funds is as follows: |
Affiliate | Value,
beginning of period | Purchases | Sales
Proceeds | Dividend Income | Value,
end of
period |
Fidelity Institutional Money Market Portfolio Class F | $ 66,853,664 | $ 13,790,690 | $ 5,140,252 | $ 40,649 | $ 75,504,103 |
Fidelity Series Commodity Strategy Fund Class F | 36,867,827 | 10,002,791 | 10,189,130 | - | 33,796,431 |
Fidelity Series Global ex U.S. Index Fund | 89,747,642 | 20,018,317 | 8,888,904 | - | 108,000,673 |
Fidelity Series Inflation-Protected Bond Index Fund Class F | 70,497,058 | 16,727,821 | 9,315,888 | - | 74,613,972 |
Spartan Total Market Index Fund Class F | 210,325,614 | 50,182,505 | 28,438,826 | 608,433 | 251,354,338 |
Spartan U.S. Bond Index Fund Class F | 198,036,397 | 45,029,219 | 12,200,691 | 2,419,549 | 224,970,897 |
Total | $ 672,328,202 | $ 155,751,343 | $ 74,173,691 | $ 3,068,631 | $ 768,240,414 |
Other Information |
All investments are categorized as Level 1 under the Fair Value Hierarchy. The inputs or methodology used for valuing securities may not be an indication of the risk associated with investing in those securities. For more information on valuation inputs, please refer to the Investment Valuation section in the accompanying Notes to Financial Statements. |
See accompanying notes which are an integral part of the financial statements.
Semiannual Report
Fidelity Freedom Index 2015 Fund
Statement of Assets and Liabilities
| September 30, 2013 (Unaudited) |
| | |
Assets | | |
Investment in securities, at value (cost $702,262,703) - See accompanying schedule | | $ 768,240,414 |
Cash | | 2 |
Receivable for investments sold | | 11,909,416 |
Receivable for fund shares sold | | 1,633,591 |
Receivable from affiliate for expense reductions | | 36,298 |
Total assets | | 781,819,721 |
| | |
Liabilities | | |
Payable for investments purchased | $ 12,269,092 | |
Payable for fund shares redeemed | 1,273,915 | |
Transfer agent fees payable | 96,077 | |
Total liabilities | | 13,639,084 |
| | |
Net Assets | | $ 768,180,637 |
Net Assets consist of: | | |
Paid in capital | | $ 704,295,157 |
Undistributed net investment income | | 2,714,153 |
Accumulated undistributed net realized gain (loss) on investments | | (4,806,384) |
Net unrealized appreciation (depreciation) on investments | | 65,977,711 |
Net Assets, for 60,841,470 shares outstanding | | $ 768,180,637 |
Net Asset Value, offering price and redemption price per share ($768,180,637 ÷ 60,841,470 shares) | | $ 12.63 |
Statement of Operations
Six months ended September 30, 2013 (Unaudited) |
| | |
Investment Income | | |
Income distributions from underlying funds | | $ 3,068,631 |
| | |
Expenses | | |
Transfer agent fees | $ 538,310 | |
Independent trustees' compensation | 1,309 | |
Total expenses before reductions | 539,619 | |
Expense reductions | (194,101) | 345,518 |
Net investment income (loss) | | 2,723,113 |
Realized and Unrealized Gain (Loss) Realized gain (loss) on sale of underlying fund shares | | (2,140,610) |
Change in net unrealized appreciation (depreciation) on investment securities | | 16,475,169 |
Net gain (loss) | | 14,334,559 |
Net increase (decrease) in net assets resulting from operations | | $ 17,057,672 |
See accompanying notes which are an integral part of the financial statements.
Semiannual Report
Fidelity Freedom Index 2015 Fund
Financial Statements - continued
Statement of Changes in Net Assets
| Six months ended September 30, 2013 (Unaudited) | Year ended
March 31,
2013 |
Increase (Decrease) in Net Assets | | |
Operations | | |
Net investment income (loss) | $ 2,723,113 | $ 9,006,236 |
Net realized gain (loss) | (2,140,610) | 2,479,717 |
Change in net unrealized appreciation (depreciation) | 16,475,169 | 31,949,447 |
Net increase (decrease) in net assets resulting from operations | 17,057,672 | 43,435,400 |
Distributions to shareholders from net investment income | (866,325) | (8,869,765) |
Distributions to shareholders from net realized gain | (920,469) | (2,613,234) |
Total distributions | (1,786,794) | (11,482,999) |
Share transactions
Proceeds from sales of shares | 180,154,936 | 336,987,331 |
Reinvestment of distributions | 1,786,794 | 11,482,999 |
Cost of shares redeemed | (101,308,310) | (120,522,497) |
Net increase (decrease) in net assets resulting from share transactions | 80,633,420 | 227,947,833 |
Total increase (decrease) in net assets | 95,904,298 | 259,900,234 |
Net Assets | | |
Beginning of period | 672,276,339 | 412,376,105 |
End of period (including undistributed net investment income of $2,714,153 and undistributed net investment income of $857,365, respectively) | $ 768,180,637 | $ 672,276,339 |
Other Information Shares | | |
Sold | 14,575,341 | 28,430,787 |
Issued in reinvestment of distributions | 142,261 | 968,858 |
Redeemed | (8,135,030) | (10,079,046) |
Net increase (decrease) | 6,582,572 | 19,320,599 |
Financial Highlights
| Six months ended September 30, 2013 | Years ended March 31, |
| (Unaudited) | 2013 | 2012 | 2011 | 2010 E |
Selected Per-Share Data | | | | | |
Net asset value, beginning of period | $ 12.39 | $ 11.80 | $ 11.71 | $ 10.67 | $ 10.00 |
Income from Investment Operations | | | | | |
Net investment income (loss) D | .05 | .19 | .20 | .20 | .06 |
Net realized and unrealized gain (loss) | .22 | .63 | .22 | 1.00 | .71 |
Total from investment operations | .27 | .82 | .42 | 1.20 | .77 |
Distributions from net investment income | (.02) | (.18) | (.17) | (.12) | (.09) |
Distributions from net realized gain | (.02) | (.05) | (.15) | (.04) | (.01) |
Total distributions | (.03) I | (.23) | (.33) H | (.16) | (.10) |
Net asset value, end of period | $ 12.63 | $ 12.39 | $ 11.80 | $ 11.71 | $ 10.67 |
Total Return B,C | 2.20% | 7.02% | 3.70% | 11.29% | 7.67% |
Ratios to Average Net Assets F,G | | | | | |
Expenses before reductions | .15% A | .15% | .15% | .09% | .05% A |
Expenses net of fee waivers, if any | .10% A | .10% | .09% | .06% | .03% A |
Expenses net of all reductions | .10% A | .10% | .09% | .06% | .03% A |
Net investment income (loss) | .76% A | 1.58% | 1.76% | 1.78% | 1.10% A |
Supplemental Data | | | | | |
Net assets, end of period (000 omitted) | $ 768,181 | $ 672,276 | $ 412,376 | $ 220,552 | $ 13,901 |
Portfolio turnover rate G | 21% A | 14% | 23% | 19% | 31% |
A Annualized
B Total returns for periods of less than one year are not annualized.
C Total returns would have been lower if certain expenses had not been reduced during the applicable periods shown.
D Calculated based on average shares outstanding during the period.
E For the period October 2, 2009 (commencement of operations) to March 31, 2010.
F Expense ratios reflect operating expenses of the Fund. Expenses before reductions do not reflect amounts reimbursed by the investment adviser or reductions from expense offset arrangements and do not represent the amount paid by the Fund during periods when reimbursements or reductions occur. Expense ratios before reductions for start-up periods may not be representative of longer term operating periods. Expenses net of fee waivers reflect expenses after reimbursement by the investment adviser but prior to reductions from expense offset arrangements. Expenses net of all reductions represent the net expenses paid by the Fund.
G Amounts do not include the activity of the underlying funds.
H Total distributions of $.33 per share is comprised of distributions from net investment income of $.174 and distributions from net realized gain of $.151 per share.
I Total distributions of $.03 per share is comprised of distributions from net investment income of $.016 and distributions from net realized gain of $.017 per share.
See accompanying notes which are an integral part of the financial statements.
Semiannual Report
Fidelity Freedom Index 2020 Fund
Investment Changes (Unaudited)
The information in the following tables is based on the direct investments of the Fund. |
Fund Holdings as of September 30, 2013 |
| % of fund's
net assets | % of fund's net assets
6 months ago |
Commodity Funds | | |
Fidelity Series Commodity Strategy Fund Class F | 4.7 | 6.0 |
Domestic Equity Funds | | |
Spartan Total Market Index Fund Class F | 35.3 | 34.1 |
Developed International Equity Funds | | |
Fidelity Series Global ex U.S. Index Fund | 15.2 | 14.6 |
Inflation-Protected Bond Funds | | |
Fidelity Series Inflation-Protected Bond Index Fund Class F | 8.3 | 8.8 |
Investment Grade Bond Funds | | |
Spartan U.S. Bond Index Fund Class F | 29.2 | 29.5 |
Short-Term Funds | | |
Fidelity Institutional Money Market Portfolio Class F | 7.3 | 7.0 |
Net Other Assets (Liabilities)* | 0.0 | 0.0 |
| 100.0 | 100.0 |
* Amount represents less than 0.1%
Asset Allocation (% of fund's net assets) |
Period end |
| Commodity Funds | 4.7% | |
| Domestic Equity Funds | 35.3% | |
| Developed International Equity Funds | 15.2% | |
| Inflation-Protected Bond Funds | 8.3% | |
| Investment Grade Bond Funds | 29.2% | |
| Short-Term Funds | 7.3% | |

Six months ago |
| Commodity Funds | 6.0% | |
| Domestic Equity Funds | 34.1% | |
| Developed International Equity Funds | 14.6% | |
| Inflation-Protected Bond Funds | 8.8% | |
| Investment Grade Bond Funds | 29.5% | |
| Short-Term Funds | 7.0% | |

Expected |
| Commodity Funds | 1.0% | |
| Domestic Equity Funds | 42.3% | |
| Developed International Equity Funds | 18.6% | |
| Inflation-Protected Bond Funds | 2.1% | |
| Investment Grade Bond Funds | 29.3% | |
| Short-Term Funds | 6.7% | |

The fund invests according to an asset allocation strategy that becomes increasingly conservative over time. The six months ago allocation is based on the fund's holdings as of March 31, 2013. The period end allocation is based on the fund's holdings as of September 30, 2013. The expected allocation represents the fund's anticipated allocation at March 31, 2014. |
Semiannual Report
Fidelity Freedom Index 2020 Fund
Investments September 30, 2013 (Unaudited)
Showing Percentage of Net Assets
Domestic Equity Funds - 40.0% |
| Shares | | Value |
Commodity Funds - 4.7% |
Fidelity Series Commodity Strategy Fund Class F (a)(c) | 9,788,728 | | $ 78,799,263 |
Domestic Equity Funds - 35.3% |
Spartan Total Market Index Fund Class F (c) | 11,892,987 | | 592,508,629 |
TOTAL DOMESTIC EQUITY FUNDS (Cost $539,134,505) |
671,307,892
|
International Equity Funds - 15.2% |
| | | |
Developed International Equity Funds - 15.2% |
Fidelity Series Global ex U.S. Index Fund (c)
(Cost $221,407,555) | 21,370,222 | |
254,946,752
|
Bond Funds - 37.5% |
| | | |
Inflation-Protected Bond Funds - 8.3% |
Fidelity Series Inflation-Protected Bond Index Fund Class F (c) | 12,841,628 | | 139,460,083 |
|
| Shares | | Value |
Investment Grade Bond Funds - 29.2% |
Spartan U.S. Bond Index Fund Class F (c) | 42,796,721 | | $ 490,878,393 |
TOTAL BOND FUNDS (Cost $641,231,875) |
630,338,476
|
Short-Term Funds - 7.3% |
| | | |
Fidelity Institutional Money Market Portfolio Class F 0.07% (b)(c)
(Cost $122,819,203) | 122,819,203 | |
122,819,203
|
TOTAL INVESTMENT PORTFOLIO - 100.0% (Cost $1,524,593,138) | | 1,679,412,323 |
NET OTHER ASSETS (LIABILITIES) - 0.0% | | (128,164) |
NET ASSETS - 100% | $ 1,679,284,159 |
Legend |
(a) Non-income producing |
(b) The rate quoted is the annualized seven-day yield of the fund at period end. |
(c) Affiliated company |
Affiliated Underlying Funds |
Information regarding the Fund's fiscal year to date purchases and sales of the affiliated Underlying Funds and income earned by the Fund from investments in affiliated Underlying Funds is as follows: |
Affiliate | Value,
beginning of period | Purchases | Sales
Proceeds | Dividend Income | Value,
end of
period |
Fidelity Institutional Money Market Portfolio Class F | $ 100,319,895 | $ 27,974,208 | $ 5,474,901 | $ 64,162 | $ 122,819,203 |
Fidelity Series Commodity Strategy Fund Class F | 85,724,274 | 24,262,909 | 24,280,053 | - | 78,799,263 |
Fidelity Series Global ex U.S. Index Fund | 208,642,305 | 50,485,639 | 19,908,306 | - | 254,946,752 |
Fidelity Series Inflation-Protected Bond Index Fund Class F | 125,218,309 | 35,072,380 | 14,669,499 | - | 139,460,083 |
Spartan Total Market Index Fund Class F | 488,754,404 | 125,120,876 | 65,977,755 | 1,421,815 | 592,508,629 |
Spartan U.S. Bond Index Fund Class F | 422,284,130 | 105,754,075 | 23,942,274 | 5,266,165 | 490,878,393 |
Total | $ 1,430,943,317 | $ 368,670,087 | $ 154,252,788 | $ 6,752,142 | $ 1,679,412,323 |
Other Information |
All investments are categorized as Level 1 under the Fair Value Hierarchy. The inputs or methodology used for valuing securities may not be an indication of the risk associated with investing in those securities. For more information on valuation inputs, please refer to the Investment Valuation section in the accompanying Notes to Financial Statements. |
See accompanying notes which are an integral part of the financial statements.
Semiannual Report
Fidelity Freedom Index 2020 Fund
Statement of Assets and Liabilities
| September 30, 2013 (Unaudited) |
| | |
Assets | | |
Investment in securities, at value (cost $1,524,593,138) - See accompanying schedule | | $ 1,679,412,323 |
Cash | | 2 |
Receivable for investments sold | | 25,294,736 |
Receivable for fund shares sold | | 3,452,951 |
Receivable from affiliate for expense reductions | | 79,447 |
Total assets | | 1,708,239,459 |
| | |
Liabilities | | |
Payable for investments purchased | $ 27,151,967 | |
Payable for fund shares redeemed | 1,595,718 | |
Transfer agent fees payable | 207,615 | |
Total liabilities | | 28,955,300 |
| | |
Net Assets | | $ 1,679,284,159 |
Net Assets consist of: | | |
Paid in capital | | $ 1,531,310,032 |
Undistributed net investment income | | 5,894,543 |
Accumulated undistributed net realized gain (loss) on investments | | (12,739,601) |
Net unrealized appreciation (depreciation) on investments | | 154,819,185 |
Net Assets, for 129,588,402 shares outstanding | | $ 1,679,284,159 |
Net Asset Value, offering price and redemption price per share ($1,679,284,159 ÷ 129,588,402 shares) | | $ 12.96 |
Statement of Operations
Six months ended September 30, 2013 (Unaudited) |
| | |
Investment Income | | |
Income distributions from underlying funds | | $ 6,752,142 |
| | |
Expenses | | |
Transfer agent fees | $ 1,166,093 | |
Independent trustees' compensation | 2,826 | |
Total expenses before reductions | 1,168,919 | |
Expense reductions | (423,876) | 745,043 |
Net investment income (loss) | | 6,007,099 |
Realized and Unrealized Gain (Loss) Realized gain (loss) on sale of underlying fund shares | | (6,934,376) |
Change in net unrealized appreciation (depreciation) on investment securities | | 40,986,083 |
Net gain (loss) | | 34,051,707 |
Net increase (decrease) in net assets resulting from operations | | $ 40,058,806 |
See accompanying notes which are an integral part of the financial statements.
Semiannual Report
Statement of Changes in Net Assets
| Six months ended September 30, 2013 (Unaudited) | Year ended
March 31,
2013 |
Increase (Decrease) in Net Assets | | |
Operations | | |
Net investment income (loss) | $ 6,007,099 | $ 19,425,352 |
Net realized gain (loss) | (6,934,376) | 4,318,168 |
Change in net unrealized appreciation (depreciation) | 40,986,083 | 73,633,077 |
Net increase (decrease) in net assets resulting from operations | 40,058,806 | 97,376,597 |
Distributions to shareholders from net investment income | (1,966,160) | (18,928,616) |
Distributions to shareholders from net realized gain | (1,619,190) | (5,245,578) |
Total distributions | (3,585,350) | (24,174,194) |
Share transactions
Proceeds from sales of shares | 382,523,067 | 692,133,502 |
Reinvestment of distributions | 3,585,350 | 24,174,194 |
Cost of shares redeemed | (174,132,278) | (171,044,352) |
Net increase (decrease) in net assets resulting from share transactions | 211,976,139 | 545,263,344 |
Total increase (decrease) in net assets | 248,449,595 | 618,465,747 |
| | |
Net Assets | | |
Beginning of period | 1,430,834,564 | 812,368,817 |
End of period (including undistributed net investment income of $5,894,543 and undistributed net investment income of $1,853,604, respectively) | $ 1,679,284,159 | $ 1,430,834,564 |
Other Information Shares | | |
Sold | 30,059,318 | 57,443,922 |
Issued in reinvestment of distributions | 278,582 | 2,002,137 |
Redeemed | (13,674,717) | (14,076,792) |
Net increase (decrease) | 16,663,183 | 45,369,267 |
Financial Highlights
| Six months ended September 30, 2013 | Years ended March 31, |
| (Unaudited) | 2013 | 2012 | 2011 | 2010 E |
Selected Per-Share Data | | | | | |
Net asset value, beginning of period | $ 12.67 | $ 12.03 | $ 12.00 | $ 10.81 | $ 10.00 |
Income from Investment Operations | | | | | |
Net investment income (loss) D | .05 | .20 | .22 | .21 | .05 |
Net realized and unrealized gain (loss) | .27 | .68 | .16 | 1.15 | .87 |
Total from investment operations | .32 | .88 | .38 | 1.36 | .92 |
Distributions from net investment income | (.02) | (.19) | (.19) | (.14) | (.10) |
Distributions from net realized gain | (.01) | (.05) | (.16) | (.04) | (.01) |
Total distributions | (.03) | (.24) | (.35) | (.17) H | (.11) |
Net asset value, end of period | $ 12.96 | $ 12.67 | $ 12.03 | $ 12.00 | $ 10.81 |
Total Return B,C | 2.54% | 7.38% | 3.36% | 12.67% | 9.18% |
Ratios to Average Net Assets F,G | | | | | |
Expenses before reductions | .15% A | .15% | .15% | .08% | .05% A |
Expenses net of fee waivers, if any | .10% A | .10% | .09% | .05% | .03% A |
Expenses net of all reductions | .10% A | .10% | .09% | .05% | .03% A |
Net investment income (loss) | .77% A | 1.68% | 1.85% | 1.82% | .98% A |
Supplemental Data | | | | | |
Net assets, end of period (000 omitted) | $ 1,679,284 | $ 1,430,835 | $ 812,369 | $ 424,846 | $ 38,734 |
Portfolio turnover rate G | 20% A | 11% | 20% | 21% | 21% |
A Annualized
B Total returns for periods of less than one year are not annualized.
C Total returns would have been lower if certain expenses had not been reduced during the applicable periods shown.
D Calculated based on average shares outstanding during the period.
E For the period October 2, 2009 (commencement of operations) to March 31, 2010.
F Expense ratios reflect operating expenses of the Fund. Expenses before reductions do not reflect amounts reimbursed by the investment adviser or reductions from expense offset arrangements and do not represent the amount paid by the Fund during periods when reimbursements or reductions occur. Expense ratios before reductions for start-up periods may not be representative of longer term operating periods. Expenses net of fee waivers reflect expenses after reimbursement by the investment adviser but prior to reductions from expense offset arrangements. Expenses net of all reductions represent the net expenses paid by the Fund.
G Amounts do not include the activity of the underlying funds.
H Total distributions of $.17 per share is comprised of distributions from net investment income of $.135 and distributions from net realized gain of $.037 per share.
See accompanying notes which are an integral part of the financial statements.
Semiannual Report
Fidelity Freedom Index 2025 Fund
Investment Changes (Unaudited)
The information in the following tables is based on the direct investments of the Fund. |
Fund Holdings as of September 30, 2013 |
| % of fund's
net assets | % of fund's net assets
6 months ago |
Commodity Funds | | |
Fidelity Series Commodity Strategy Fund Class F | 5.7 | 7.3 |
Domestic Equity Funds | | |
Spartan Total Market Index Fund Class F | 43.2 | 41.8 |
Developed International Equity Funds | | |
Fidelity Series Global ex U.S. Index Fund | 18.5 | 17.8 |
Inflation-Protected Bond Funds | | |
Fidelity Series Inflation-Protected Bond Index Fund Class F | 5.6 | 5.8 |
Investment Grade Bond Funds | | |
Spartan U.S. Bond Index Fund Class F | 26.0 | 26.5 |
Short-Term Funds | | |
Fidelity Institutional Money Market Portfolio Class F | 1.0 | 0.8 |
Net Other Assets (Liabilities)* | 0.0 | 0.0 |
| 100.0 | 100.0 |
* Amount represents less than 0.1%
Asset Allocation (% of fund's net assets) |
Period end |
| Commodity Funds | 5.7% | |
| Domestic Equity Funds | 43.2% | |
| Developed International Equity Funds | 18.5% | |
| Inflation-Protected Bond Funds | 5.6% | |
| Investment Grade Bond Funds | 26.0% | |
| Short-Term Funds | 1.0% | |

Six months ago |
| Commodity Funds | 7.3% | |
| Domestic Equity Funds | 41.8% | |
| Developed International Equity Funds | 17.8% | |
| Inflation-Protected Bond Funds | 5.8% | |
| Investment Grade Bond Funds | 26.5% | |
| Short-Term Funds | 0.8% | |

Expected |
| Commodity Funds | 1.0% | |
| Domestic Equity Funds | 50.2% | |
| Developed International Equity Funds | 21.9% | |
| Inflation-Protected Bond Funds | 1.2% | |
| Investment Grade Bond Funds | 25.3% | |
| Short-Term Funds | 0.4% | |

The fund invests according to an asset allocation strategy that becomes increasingly conservative over time. The six months ago allocation is based on the fund's holdings as of March 31, 2013. The period end allocation is based on the fund's holdings as of September 30, 2013. The expected allocation represents the fund's anticipated allocation at March 31, 2014. |
Semiannual Report
Fidelity Freedom Index 2025 Fund
Investments September 30, 2013 (Unaudited)
Showing Percentage of Net Assets
Domestic Equity Funds - 48.9% |
| Shares | | Value |
Commodity Funds - 5.7% |
Fidelity Series Commodity Strategy Fund Class F (a)(c) | 8,195,506 | | $ 65,973,827 |
Domestic Equity Funds - 43.2% |
Spartan Total Market Index Fund
Class F (c) | 10,088,924 | | 502,630,181 |
TOTAL DOMESTIC EQUITY FUNDS (Cost $464,917,606) |
568,604,008
|
International Equity Funds - 18.5% |
| | | |
Developed International Equity Funds - 18.5% |
Fidelity Series Global ex U.S. Index
Fund (c)
(Cost $188,372,036) | 18,030,191 | |
215,100,176
|
Bond Funds - 31.6% |
| | | |
Inflation-Protected Bond Funds - 5.6% |
Fidelity Series Inflation-Protected Bond Index Fund Class F (c) | 5,998,308 | | 65,141,624 |
|
| Shares | | Value |
Investment Grade Bond Funds - 26.0% |
Spartan U.S. Bond Index Fund
Class F (c) | 26,272,260 | | $ 301,342,817 |
TOTAL BOND FUNDS (Cost $372,968,148) |
366,484,441
|
Short-Term Funds - 1.0% |
| | | |
Fidelity Institutional Money Market Portfolio Class F 0.07% (b)(c)
(Cost $11,787,204) | 11,787,204 | |
11,787,204
|
TOTAL INVESTMENT PORTFOLIO - 100.0% (Cost $1,038,044,994) | | 1,161,975,829 |
NET OTHER ASSETS (LIABILITIES) - 0.0% | | (85,637) |
NET ASSETS - 100% | $ 1,161,890,192 |
Legend |
(a) Non-income producing |
(b) The rate quoted is the annualized seven-day yield of the fund at period end. |
(c) Affiliated company |
Affiliated Underlying Funds |
Information regarding the Fund's fiscal year to date purchases and sales of the affiliated Underlying Funds and income earned by the Fund from investments in affiliated Underlying Funds is as follows: |
Affiliate | Value,
beginning of period | Purchases | Sales
Proceeds | Dividend Income | Value,
end of
period |
Fidelity Institutional Money Market Portfolio Class F | $ 7,600,628 | $ 4,251,088 | $ 64,512 | $ 5,369 | $ 11,787,204 |
Fidelity Series Commodity Strategy Fund Class F | 71,179,350 | 19,336,092 | 18,820,111 | - | 65,973,827 |
Fidelity Series Global ex U.S. Index Fund | 173,070,220 | 37,353,878 | 8,994,923 | - | 215,100,176 |
Fidelity Series Inflation-Protected Bond Index Fund Class F | 55,570,948 | 15,773,214 | 3,498,550 | - | 65,141,624 |
Spartan Total Market Index Fund Class F | 404,921,876 | 93,417,111 | 33,060,906 | 1,180,675 | 502,630,181 |
Spartan U.S. Bond Index Fund Class F | 257,122,902 | 60,942,671 | 8,792,035 | 3,227,046 | 301,342,817 |
Total | $ 969,465,924 | $ 231,074,054 | $ 73,231,037 | $ 4,413,090 | $ 1,161,975,829 |
Other Information |
All investments are categorized as Level 1 under the Fair Value Hierarchy. The inputs or methodology used for valuing securities may not be an indication of the risk associated with investing in those securities. For more information on valuation inputs, please refer to the Investment Valuation section in the accompanying Notes to Financial Statements. |
See accompanying notes which are an integral part of the financial statements.
Semiannual Report
Fidelity Freedom Index 2025 Fund
Statement of Assets and Liabilities
| September 30, 2013 (Unaudited) |
| | |
Assets | | |
Investment in securities, at value (cost $1,038,044,994) - See accompanying schedule | | $ 1,161,975,829 |
Cash | | 2 |
Receivable for investments sold | | 21,814,862 |
Receivable for fund shares sold | | 1,995,471 |
Receivable from affiliate for expense reductions | | 58,617 |
Total assets | | 1,185,844,781 |
| | |
Liabilities | | |
Payable for investments purchased | $ 21,805,369 | |
Payable for fund shares redeemed | 2,004,961 | |
Transfer agent fees payable | 144,259 | |
Total liabilities | | 23,954,589 |
| | |
Net Assets | | $ 1,161,890,192 |
Net Assets consist of: | | |
Paid in capital | | $ 1,043,774,580 |
Undistributed net investment income | | 3,906,196 |
Accumulated undistributed net realized gain (loss) on investments | | (9,721,419) |
Net unrealized appreciation (depreciation) on investments | | 123,930,835 |
Net Assets, for 86,568,905 shares outstanding | | $ 1,161,890,192 |
Net Asset Value, offering price and redemption price per share ($1,161,890,192 ÷ 86,568,905 shares) | | $ 13.42 |
Statement of Operations
Six months ended September 30, 2013 (Unaudited) |
| | |
Investment Income | | |
Income distributions from underlying funds | | $ 4,413,090 |
| | |
Expenses | | |
Transfer agent fees | $ 795,311 | |
Independent trustees' compensation | 1,919 | |
Total expenses before reductions | 797,230 | |
Expense reductions | (305,235) | 491,995 |
Net investment income (loss) | | 3,921,095 |
Realized and Unrealized Gain (Loss) Realized gain (loss) on sale of underlying fund shares | | (5,815,453) |
Change in net unrealized appreciation (depreciation) on investment securities | | 40,482,344 |
Net gain (loss) | | 34,666,891 |
Net increase (decrease) in net assets resulting from operations | | $ 38,587,986 |
See accompanying notes which are an integral part of the financial statements.
Semiannual Report
Fidelity Freedom Index 2025 Fund
Financial Statements - continued
Statement of Changes in Net Assets
| Six months ended September 30, 2013 (Unaudited) | Year ended
March 31,
2013 |
Increase (Decrease) in Net Assets | | |
Operations | | |
Net investment income (loss) | $ 3,921,095 | $ 14,029,843 |
Net realized gain (loss) | (5,815,453) | 1,306,310 |
Change in net unrealized appreciation (depreciation) | 40,482,344 | 58,469,806 |
Net increase (decrease) in net assets resulting from operations | 38,587,986 | 73,805,959 |
Distributions to shareholders from net investment income | (1,061,711) | (13,753,827) |
Distributions to shareholders from net realized gain | (758,365) | (2,545,865) |
Total distributions | (1,820,076) | (16,299,692) |
Share transactions
Proceeds from sales of shares | 223,875,865 | 450,498,444 |
Reinvestment of distributions | 1,820,076 | 16,299,692 |
Cost of shares redeemed | (69,968,900) | (92,314,075) |
Net increase (decrease) in net assets resulting from share transactions | 155,727,041 | 374,484,061 |
Total increase (decrease) in net assets | 192,494,951 | 431,990,328 |
| | |
Net Assets | | |
Beginning of period | 969,395,241 | 537,404,913 |
End of period (including undistributed net investment income of $3,906,196 and undistributed net investment income of $1,046,812, respectively) | $ 1,161,890,192 | $ 969,395,241 |
Other Information Shares | | |
Sold | 17,107,254 | 36,760,609 |
Issued in reinvestment of distributions | 137,261 | 1,330,091 |
Redeemed | (5,314,109) | (7,472,036) |
Net increase (decrease) | 11,930,406 | 30,618,664 |
Financial Highlights
| Six months ended September 30, 2013 | Years ended March 31, |
| (Unaudited) | 2013 | 2012 | 2011 | 2010 E |
Selected Per-Share Data | | | | | |
Net asset value, beginning of period | $ 12.99 | $ 12.21 | $ 12.22 | $ 10.88 | $ 10.00 |
Income from Investment Operations | | | | | |
Net investment income (loss) D | .05 | .22 | .23 | .22 | .05 |
Net realized and unrealized gain (loss) | .40 | .80 | .11 | 1.30 | .94 |
Total from investment operations | .45 | 1.02 | .34 | 1.52 | .99 |
Distributions from net investment income | (.01) | (.21) | (.19) | (.15) | (.10) |
Distributions from net realized gain | (.01) | (.04) | (.16) | (.03) | (.01) |
Total distributions | (.02) | (.24) H | (.35) | (.18) | (.11) |
Net asset value, end of period | $ 13.42 | $ 12.99 | $ 12.21 | $ 12.22 | $ 10.88 |
Total Return B,C | 3.50% | 8.50% | 3.03% | 14.03% | 9.93% |
Ratios to Average Net Assets F,G | | | | | |
Expenses before reductions | .15% A | .15% | .15% | .09% | .05% A |
Expenses net of fee waivers, if any | .09% A | .10% | .09% | .05% | .03% A |
Expenses net of all reductions | .09% A | .10% | .09% | .05% | .03% A |
Net investment income (loss) | .74% A | 1.82% | 1.97% | 1.91% | .92% A |
Supplemental Data | | | | | |
Net assets, end of period (000 omitted) | $ 1,161,890 | $ 969,395 | $ 537,405 | $ 249,606 | $ 18,150 |
Portfolio turnover rate G | 14% A | 10% | 18% | 18% | 33% |
A Annualized
B Total returns for periods of less than one year are not annualized.
C Total returns would have been lower if certain expenses had not been reduced during the applicable periods shown.
D Calculated based on average shares outstanding during the period.
E For the period October 2, 2009 (commencement of operations) to March 31, 2010.
F Expense ratios reflect operating expenses of the Fund. Expenses before reductions do not reflect amounts reimbursed by the investment adviser or reductions from expense offset arrangements and do not represent the amount paid by the Fund during periods when reimbursements or reductions occur. Expense ratios before reductions for start-up periods may not be representative of longer term operating periods. Expenses net of fee waivers reflect expenses after reimbursement by the investment adviser but prior to reductions from expense offset arrangements. Expenses net of all reductions represent the net expenses paid by the Fund.
G Amounts do not include the activity of the underlying funds.
H Total distributions of $.24 per share is comprised of distributions from net investment income of $.205 and distributions from net realized gain of $.038 per share.
See accompanying notes which are an integral part of the financial statements.
Semiannual Report
Fidelity Freedom Index 2030 Fund
Investment Changes (Unaudited)
The information in the following tables is based on the direct investments of the Fund. |
Fund Holdings as of September 30, 2013 |
| % of fund's
net assets | % of fund's net assets
6 months ago |
Commodity Funds | | |
Fidelity Series Commodity Strategy Fund Class F | 6.1 | 7.7 |
Domestic Equity Funds | | |
Spartan Total Market Index Fund Class F | 46.6 | 44.0 |
Developed International Equity Funds | | |
Fidelity Series Global ex U.S. Index Fund | 20.1 | 18.8 |
Inflation-Protected Bond Funds | | |
Fidelity Series Inflation-Protected Bond Index Fund Class F | 2.9 | 2.7 |
Investment Grade Bond Funds | | |
Spartan U.S. Bond Index Fund Class F | 24.3 | 26.8 |
Net Other Assets (Liabilities)* | 0.0 | 0.0 |
| 100.0 | 100.0 |
* Amount represents less than 0.1%
Asset Allocation (% of fund's net assets) |
Period end |
| Commodity Funds | 6.1% | |
 | Domestic Equity Funds | 46.6% | |
 | Developed International Equity Funds | 20.1% | |
 | Inflation-Protected Bond Funds | 2.9% | |
| Investment Grade Bond Funds | 24.3% | |

Six months ago |
| Commodity Funds | 7.7% | |
| Domestic Equity Funds | 44.0% | |
| Developed International Equity Funds | 18.8% | |
| Inflation-Protected Bond Funds | 2.7% | |
| Investment Grade Bond Funds | 26.8% | |

Expected |
| Commodity Funds | 1.0% | |
| Domestic Equity Funds | 59.7% | |
| Developed International Equity Funds | 26.1% | |
| Inflation-Protected Bond Funds | 0.3% | |
| Investment Grade Bond Funds | 12.9% | |

The fund invests according to an asset allocation strategy that becomes increasingly conservative over time. The six months ago allocation is based on the fund's holdings as of March 31, 2013. The period end allocation is based on the fund's holdings as of September 30, 2013. The expected allocation represents the fund's anticipated allocation at March 31, 2014. |
Semiannual Report
Fidelity Freedom Index 2030 Fund
Investments September 30, 2013 (Unaudited)
Showing Percentage of Net Assets
Domestic Equity Funds - 52.7% |
| Shares | | Value |
Commodity Funds - 6.1% |
Fidelity Series Commodity Strategy Fund Class F (a)(b) | 10,596,960 | | $ 85,305,528 |
Domestic Equity Funds - 46.6% |
Spartan Total Market Index Fund Class F (b) | 13,199,980 | | 657,622,997 |
TOTAL DOMESTIC EQUITY FUNDS (Cost $605,868,363) |
742,928,525
|
International Equity Funds - 20.1% |
| | | |
Developed International Equity Funds - 20.1% |
Fidelity Series Global ex U.S. Index Fund (b)
(Cost $247,931,719) | 23,775,753 | |
283,644,736
|
Bond Funds - 27.2% |
| | | |
Inflation-Protected Bond Funds - 2.9% |
Fidelity Series Inflation-Protected Bond Index Fund Class F (b) | 3,773,711 | | 40,982,503 |
|
| Shares | | Value |
Investment Grade Bond Funds - 24.3% |
Spartan U.S. Bond Index Fund
Class F (b) | 29,912,971 | | $ 343,101,782 |
TOTAL BOND FUNDS (Cost $390,986,473) |
384,084,285
|
TOTAL INVESTMENT PORTFOLIO - 100.0% (Cost $1,244,786,555) | | 1,410,657,546 |
NET OTHER ASSETS (LIABILITIES) - 0.0% | | (101,495) |
NET ASSETS - 100% | $ 1,410,556,051 |
Legend |
(a) Non-income producing |
(b) Affiliated company |
Affiliated Underlying Funds |
Information regarding the Fund's fiscal year to date purchases and sales of the affiliated Underlying Funds and income earned by the Fund from investments in affiliated Underlying Funds is as follows: |
Affiliate | Value,
beginning of period | Purchases | Sales
Proceeds | Dividend Income | Value,
end of
period |
Fidelity Series Commodity Strategy Fund Class F | $ 92,677,921 | $ 26,516,294 | $ 26,421,314 | $ - | $ 85,305,528 |
Fidelity Series Global ex U.S. Index Fund | 225,863,581 | 57,428,784 | 16,858,872 | - | 283,644,736 |
Fidelity Series Inflation-Protected Bond Index Fund Class F | 33,257,799 | 11,903,278 | 2,526,637 | - | 40,982,503 |
Spartan Total Market Index Fund Class F | 529,177,253 | 133,186,020 | 53,244,602 | 1,541,831 | 657,622,997 |
Spartan U.S. Bond Index Fund Class F | 322,153,701 | 75,078,119 | 44,128,052 | 3,979,547 | 343,101,782 |
Total | $ 1,203,130,255 | $ 304,112,495 | $ 143,179,477 | $ 5,521,378 | $ 1,410,657,546 |
Other Information |
All investments are categorized as Level 1 under the Fair Value Hierarchy. The inputs or methodology used for valuing securities may not be an indication of the risk associated with investing in those securities. For more information on valuation inputs, please refer to the Investment Valuation section in the accompanying Notes to Financial Statements. |
See accompanying notes which are an integral part of the financial statements.
Semiannual Report
Fidelity Freedom Index 2030 Fund
Statement of Assets and Liabilities
| September 30, 2013 (Unaudited) |
| | |
Assets | | |
Investment in securities, at value (cost $1,244,786,555) - See accompanying schedule | | $ 1,410,657,546 |
Cash | | 1 |
Receivable for investments sold | | 46,128,991 |
Receivable for fund shares sold | | 2,059,431 |
Receivable from affiliate for expense reductions | | 73,256 |
Total assets | | 1,458,919,225 |
| | |
Liabilities | | |
Payable for investments purchased | $ 46,436,023 | |
Payable for fund shares redeemed | 1,752,399 | |
Transfer agent fees payable | 174,752 | |
Total liabilities | | 48,363,174 |
| | |
Net Assets | | $ 1,410,556,051 |
Net Assets consist of: | | |
Paid in capital | | $ 1,252,096,132 |
Undistributed net investment income | | 4,921,489 |
Accumulated undistributed net realized gain (loss) on investments | | (12,332,561) |
Net unrealized appreciation (depreciation) on investments | | 165,870,991 |
Net Assets, for 103,829,058 shares outstanding | | $ 1,410,556,051 |
Net Asset Value, offering price and redemption price per share ($1,410,556,051 ÷ 103,829,058 shares) | | $ 13.59 |
Statement of Operations
Six months ended September 30, 2013 (Unaudited) |
| | |
Investment Income | | |
Income distributions from underlying funds | | $ 5,521,378 |
| | |
Expenses | | |
Transfer agent fees | $ 976,831 | |
Independent trustees' compensation | 2,367 | |
Total expenses before reductions | 979,198 | |
Expense reductions | (388,379) | 590,819 |
Net investment income (loss) | | 4,930,559 |
Realized and Unrealized Gain (Loss) Realized gain (loss) on sale of underlying fund shares | | (7,104,488) |
Change in net unrealized appreciation (depreciation) on investment securities | | 53,698,760 |
Net gain (loss) | | 46,594,272 |
Net increase (decrease) in net assets resulting from operations | | $ 51,524,831 |
See accompanying notes which are an integral part of the financial statements.
Semiannual Report
Statement of Changes in Net Assets
| Six months ended September 30, 2013 (Unaudited) | Year ended
March 31,
2013 |
Increase (Decrease) in Net Assets | | |
Operations | | |
Net investment income (loss) | $ 4,930,559 | $ 18,005,016 |
Net realized gain (loss) | (7,104,488) | 908,090 |
Change in net unrealized appreciation (depreciation) | 53,698,760 | 77,864,594 |
Net increase (decrease) in net assets resulting from operations | 51,524,831 | 96,777,700 |
Distributions to shareholders from net investment income | (1,328,363) | (17,577,150) |
Distributions to shareholders from net realized gain | (853,947) | (2,817,704) |
Total distributions | (2,182,310) | (20,394,854) |
Share transactions
Proceeds from sales of shares | 275,701,127 | 570,548,909 |
Reinvestment of distributions | 2,182,310 | 20,394,854 |
Cost of shares redeemed | (119,714,171) | (118,202,024) |
Net increase (decrease) in net assets resulting from share transactions | 158,169,266 | 472,741,739 |
Total increase (decrease) in net assets | 207,511,787 | 549,124,585 |
Net Assets | | |
Beginning of period | 1,203,044,264 | 653,919,679 |
End of period (including undistributed net investment income of $4,921,489 and undistributed net investment income of $1,319,293, respectively) | $ 1,410,556,051 | $ 1,203,044,264 |
Other Information Shares | | |
Sold | 20,829,615 | 46,489,065 |
Issued in reinvestment of distributions | 163,837 | 1,653,806 |
Redeemed | (9,028,783) | (9,520,988) |
Net increase (decrease) | 11,964,669 | 38,621,883 |
Financial Highlights
| Six months ended September 30, 2013 | Years ended March 31, |
| (Unaudited) | 2013 | 2012 | 2011 | 2010 E |
Selected Per-Share Data | | | | | |
Net asset value, beginning of period | $ 13.10 | $ 12.28 | $ 12.34 | $ 10.96 | $ 10.00 |
Income from Investment Operations | | | | | |
Net investment income (loss) D | .05 | .24 | .24 | .22 | .04 |
Net realized and unrealized gain (loss) | .46 | .83 | .07 | 1.34 | 1.04 |
Total from investment operations | .51 | 1.07 | .31 | 1.56 | 1.08 |
Distributions from net investment income | (.01) | (.21) | (.20) | (.15) | (.11) |
Distributions from net realized gain | (.01) | (.03) | (.16) | (.03) | (.01) |
Total distributions | (.02) | (.25) I | (.37) H | (.18) | (.12) |
Net asset value, end of period | $ 13.59 | $ 13.10 | $ 12.28 | $ 12.34 | $ 10.96 |
Total Return B,C | 3.92% | 8.80% | 2.70% | 14.27% | 10.78% |
Ratios to Average Net Assets F,G | | | | | |
Expenses before reductions | .15% A | .15% | .15% | .08% | .05% A |
Expenses net of fee waivers, if any | .09% A | .10% | .09% | .05% | .03% A |
Expenses net of all reductions | .09% A | .10% | .09% | .05% | .03% A |
Net investment income (loss) | .76% A | 1.90% | 1.99% | 1.90% | .78% A |
Supplemental Data | | | | | |
Net assets, end of period (000 omitted) | $ 1,410,556 | $ 1,203,044 | $ 653,920 | $ 317,352 | $ 27,567 |
Portfolio turnover rate G | 22% A | 10% | 18% | 16% | 21% |
A Annualized
B Total returns for periods of less than one year are not annualized.
C Total returns would have been lower if certain expenses had not been reduced during the applicable periods shown.
D Calculated based on average shares outstanding during the period.
E For the period October 2, 2009 (commencement of operations) to March 31, 2010.
F Expense ratios reflect operating expenses of the Fund. Expenses before reductions do not reflect amounts reimbursed by the investment adviser or reductions from expense offset arrangements and do not represent the amount paid by the Fund during periods when reimbursements or reductions occur. Expense ratios before reductions for start-up periods may not be representative of longer term operating periods. Expenses net of fee waivers reflect expenses after reimbursement by the investment adviser but prior to reductions from expense offset arrangements. Expenses net of all reductions represent the net expenses paid by the Fund.
G Amounts do not include the activity of the underlying funds.
H Total distributions of $.37 per share is comprised of distributions from net investment income of $.203 and distributions from net realized gain of $.163 per share.
I Total distributions of $.25 per share is comprised of distributions from net investment income of $.211 and distributions from net realized gain of $.034 per share.
See accompanying notes which are an integral part of the financial statements.
Semiannual Report
Fidelity Freedom Index 2035 Fund
Investment Changes (Unaudited)
The information in the following tables is based on the direct investments of the Fund. |
Fund Holdings as of September 30, 2013 |
| % of fund's
net assets | % of fund's net assets
6 months ago |
Commodity Funds | | |
Fidelity Series Commodity Strategy Fund Class F | 6.9 | 8.8 |
Domestic Equity Funds | | |
Spartan Total Market Index Fund Class F | 52.4 | 50.7 |
Developed International Equity Funds | | |
Fidelity Series Global ex U.S. Index Fund | 22.5 | 21.6 |
Inflation-Protected Bond Funds | | |
Fidelity Series Inflation-Protected Bond Index Fund Class F | 0.1 | 0.0 |
Investment Grade Bond Funds | | |
Spartan U.S. Bond Index Fund Class F | 18.1 | 18.9 |
Net Other Assets (Liabilities)* | 0.0 | 0.0 |
| 100.0 | 100.0 |
* Amount represents less than 0.1%
Asset Allocation (% of fund's net assets) |
Period end |
| Commodity Funds | 6.9% | |
| Domestic Equity Funds | 52.4% | |
| Developed International Equity Funds | 22.5% | |
| Inflation-Protected Bond Funds | 0.1% | |
| Investment Grade Bond Funds | 18.1% | |

Six months ago |
| Commodity Funds | 8.8% | |
| Domestic Equity Funds | 50.7% | |
| Developed International Equity Funds | 21.6% | |
 | Inflation-Protected Bond Funds | 0.0% | |
| Investment Grade Bond Funds | 18.9% | |

Expected |
| Commodity Funds | 1.0% | |
| Domestic Equity Funds | 62.0% | |
| Developed International Equity Funds | 27.0% | |
| Inflation-Protected Bond Funds | 0.0% | |
| Investment Grade Bond Funds | 10.0% | |

The fund invests according to an asset allocation strategy that becomes increasingly conservative over time. The six months ago allocation is based on the fund's holdings as of March 31, 2013. The period end allocation is based on the fund's holdings as of September 30, 2013. The expected allocation represents the fund's anticipated allocation at March 31, 2014. |
Semiannual Report
Fidelity Freedom Index 2035 Fund
Investments September 30, 2013 (Unaudited)
Showing Percentage of Net Assets
Domestic Equity Funds - 59.3% |
| Shares | | Value |
Commodity Funds - 6.9% |
Fidelity Series Commodity Strategy Fund Class F (a)(b) | 7,265,815 | | $ 58,489,809 |
Domestic Equity Funds - 52.4% |
Spartan Total Market Index Fund Class F (b) | 8,949,814 | | 445,879,740 |
TOTAL DOMESTIC EQUITY FUNDS (Cost $417,971,041) |
504,369,549
|
International Equity Funds - 22.5% |
| | | |
Developed International Equity Funds - 22.5% |
Fidelity Series Global ex U.S. Index Fund (b)
(Cost $168,251,242) | 15,996,241 | |
190,835,158
|
Bond Funds - 18.2% |
| | | |
Inflation-Protected Bond Funds - 0.1% |
Fidelity Series Inflation-Protected Bond Index Fund Class F (b) | 115,287 | | 1,252,018 |
|
| Shares | | Value |
Investment Grade Bond Funds - 18.1% |
Spartan U.S. Bond Index Fund
Class F (b) | 13,399,468 | | $ 153,691,892 |
TOTAL BOND FUNDS (Cost $157,584,991) |
154,943,910
|
TOTAL INVESTMENT PORTFOLIO - 100.0% (Cost $743,807,274) | | 850,148,617 |
NET OTHER ASSETS (LIABILITIES) - 0.0% | | (55,594) |
NET ASSETS - 100% | $ 850,093,023 |
Legend |
(a) Non-income producing |
(b) Affiliated company |
Affiliated Underlying Funds |
Information regarding the Fund's fiscal year to date purchases and sales of the affiliated Underlying Funds and income earned by the Fund from investments in affiliated Underlying Funds is as follows: |
Affiliate | Value,
beginning of period | Purchases | Sales
Proceeds | Dividend Income | Value,
end of
period |
Fidelity Series Commodity Strategy Fund Class F | $ 60,712,970 | $ 19,059,798 | $ 16,318,780 | $ - | $ 58,489,809 |
Fidelity Series Global ex U.S. Index Fund | 149,104,428 | 36,177,690 | 6,406,812 | - | 190,835,158 |
Fidelity Series Inflation-Protected Bond Index Fund Class F | - | 1,248,901 | 280 | - | 1,252,018 |
Spartan Total Market Index Fund Class F | 349,146,461 | 86,248,345 | 22,018,596 | 1,018,159 | 445,879,740 |
Spartan U.S. Bond Index Fund Class F | 130,113,491 | 36,987,043 | 9,355,959 | 1,670,003 | 153,691,892 |
Total | $ 689,077,350 | $ 179,721,777 | $ 54,100,427 | $ 2,688,162 | $ 850,148,617 |
Other Information |
All investments are categorized as Level 1 under the Fair Value Hierarchy. The inputs or methodology used for valuing securities may not be an indication of the risk associated with investing in those securities. For more information on valuation inputs, please refer to the Investment Valuation section in the accompanying Notes to Financial Statements. |
See accompanying notes which are an integral part of the financial statements.
Semiannual Report
Fidelity Freedom Index 2035 Fund
Statement of Assets and Liabilities
| September 30, 2013 (Unaudited) |
| | |
Assets | | |
Investment in securities, at value (cost $743,807,274) - See accompanying schedule | | $ 850,148,617 |
Cash | | 2 |
Receivable for investments sold | | 20,864,846 |
Receivable for fund shares sold | | 2,458,826 |
Receivable from affiliate for expense reductions | | 49,512 |
Total assets | | 873,521,803 |
| | |
Liabilities | | |
Payable for investments purchased | $ 22,522,184 | |
Payable for fund shares redeemed | 801,489 | |
Transfer agent fees payable | 105,107 | |
Total liabilities | | 23,428,780 |
| | |
Net Assets | | $ 850,093,023 |
Net Assets consist of: | | |
Paid in capital | | $ 749,232,197 |
Undistributed net investment income | | 2,345,494 |
Accumulated undistributed net realized gain (loss) on investments | | (7,826,011) |
Net unrealized appreciation (depreciation) on investments | | 106,341,343 |
Net Assets, for 60,887,846 shares outstanding | | $ 850,093,023 |
Net Asset Value, offering price and redemption price per share ($850,093,023 ÷ 60,887,846 shares) | | $ 13.96 |
Statement of Operations
Six months ended September 30, 2013 (Unaudited) |
| | |
Investment Income | | |
Income distributions from underlying funds | | $ 2,688,162 |
| | |
Expenses | | |
Transfer agent fees | $ 572,526 | |
Independent trustees' compensation | 1,375 | |
Total expenses before reductions | 573,901 | |
Expense reductions | (252,567) | 321,334 |
Net investment income (loss) | | 2,366,828 |
Realized and Unrealized Gain (Loss) Realized gain (loss) on sale of underlying fund shares | | (5,102,226) |
Change in net unrealized appreciation (depreciation) on investment securities | | 40,552,144 |
Net gain (loss) | | 35,449,918 |
Net increase (decrease) in net assets resulting from operations | | $ 37,816,746 |
See accompanying notes which are an integral part of the financial statements.
Semiannual Report
Fidelity Freedom Index 2035 Fund
Financial Statements - continued
Statement of Changes in Net Assets
| Six months ended September 30, 2013 (Unaudited) | Year ended
March 31,
2013 |
Increase (Decrease) in Net Assets | | |
Operations | | |
Net investment income (loss) | $ 2,366,828 | $ 10,092,732 |
Net realized gain (loss) | (5,102,226) | (454,886) |
Change in net unrealized appreciation (depreciation) | 40,552,144 | 49,107,325 |
Net increase (decrease) in net assets resulting from operations | 37,816,746 | 58,745,171 |
Distributions to shareholders from net investment income | (525,606) | (9,902,085) |
Distributions to shareholders from net realized gain | (210,242) | (887,993) |
Total distributions | (735,848) | (10,790,078) |
Share transactions
Proceeds from sales of shares | 173,679,221 | 332,376,519 |
Reinvestment of distributions | 735,848 | 10,790,078 |
Cost of shares redeemed | (50,435,779) | (59,470,635) |
Net increase (decrease) in net assets resulting from share transactions | 123,979,290 | 283,695,962 |
Total increase (decrease) in net assets | 161,060,188 | 331,651,055 |
Net Assets | | |
Beginning of period | 689,032,835 | 357,381,780 |
End of period (including undistributed net investment income of $2,345,494 and undistributed net investment income of $504,272, respectively) | $ 850,093,023 | $ 689,032,835 |
Other Information Shares | | |
Sold | 12,821,452 | 26,770,366 |
Issued in reinvestment of distributions | 54,146 | 867,578 |
Redeemed | (3,708,688) | (4,741,259) |
Net increase (decrease) | 9,166,910 | 22,896,685 |
Financial Highlights
| Six months ended September 30, 2013 | Years ended March 31, |
| (Unaudited) | 2013 | 2012 | 2011 | 2010 E |
Selected Per-Share Data | | | | | |
Net asset value, beginning of period | $ 13.32 | $ 12.40 | $ 12.54 | $ 11.02 | $ 10.00 |
Income from Investment Operations | | | | | |
Net investment income (loss) D | .04 | .24 | .23 | .21 | .03 |
Net realized and unrealized gain (loss) | .61 | .91 | (.01) | 1.48 | 1.11 |
Total from investment operations | .65 | 1.15 | .22 | 1.69 | 1.14 |
Distributions from net investment income | (.01) | (.22) | (.19) | (.15) | (.11) |
Distributions from net realized gain | - J | (.02) | (.17) | (.03) | (.01) |
Total distributions | (.01) | (.23) I | (.36) | (.17) H | (.12) |
Net asset value, end of period | $ 13.96 | $ 13.32 | $ 12.40 | $ 12.54 | $ 11.02 |
Total Return B,C | 4.91% | 9.44% | 2.00% | 15.46% | 11.38% |
Ratios to Average Net Assets F,G | | | | | |
Expenses before reductions | .15% A | .15% | .15% | .09% | .05% A |
Expenses net of fee waivers, if any | .08%A | .09% | .08% | .05% | .03% A |
Expenses net of all reductions | .08% A | .09% | .08% | .05% | .03% A |
Net investment income (loss) | .62% A | 1.91% | 1.93% | 1.83% | .64% A |
Supplemental Data | | | | | |
Net assets, end of period (000 omitted) | $ 850,093 | $ 689,033 | $ 357,382 | $ 150,099 | $ 10,728 |
Portfolio turnover rate G | 14% A | 8% | 15% | 12% | 23% |
A Annualized
B Total returns for periods of less than one year are not annualized.
C Total returns would have been lower if certain expenses had not been reduced during the applicable periods shown.
D Calculated based on average shares outstanding during the period.
E For the period October 2, 2009 (commencement of operations) to March 31, 2010.
F Expense ratios reflect operating expenses of the Fund. Expenses before reductions do not reflect amounts reimbursed by the investment adviser or reductions from expense offset arrangements and do not represent the amount paid by the Fund during periods when reimbursements or reductions occur. Expense ratios before reductions for start-up periods may not be representative of longer term operating periods. Expenses net of fee waivers reflect expenses after reimbursement by the investment adviser but prior to reductions from expense offset arrangements. Expenses net of all reductions represent the net expenses paid by the Fund.
G Amounts do not include the activity of the underlying funds.
H Total distributions of $.17 per share is comprised of distributions from net investment income of $.145 and distributions from net realized gain of $.028 per share.
I Total distributions of $.23 per share is comprised of distributions from net investment income of $.215 and distributions from net realized gain of $.019 per share.
J Amount represents less than $.01 per share.
See accompanying notes which are an integral part of the financial statements.
Semiannual Report
Fidelity Freedom Index 2040 Fund
Investment Changes (Unaudited)
The information in the following tables is based on the direct investments of the Fund. |
Fund Holdings as of September 30, 2013 |
| % of fund's
net assets | % of fund's net assets
6 months ago |
Commodity Funds | | |
Fidelity Series Commodity Strategy Fund Class F | 7.1 | 9.0 |
Domestic Equity Funds | | |
Spartan Total Market Index Fund Class F | 53.7 | 51.6 |
Developed International Equity Funds | | |
Fidelity Series Global ex U.S. Index Fund | 22.9 | 22.0 |
Investment Grade Bond Funds | | |
Spartan U.S. Bond Index Fund Class F | 16.3 | 17.4 |
Net Other Assets (Liabilities)* | 0.0 | 0.0 |
| 100.0 | 100.0 |
* Amount represents less than 0.1%
Asset Allocation (% of fund's net assets) |
Period end |
| Commodity Funds | 7.1% | |
| Domestic Equity Funds | 53.7% | |
| Developed International Equity Funds | 22.9% | |
| Investment Grade Bond Funds | 16.3% | |

Six months ago |
| Commodity Funds | 9.0% | |
| Domestic Equity Funds | 51.6% | |
| Developed International Equity Funds | 22.0% | |
| Investment Grade Bond Funds | 17.4% | |

Expected |
| Commodity Funds | 1.0% | |
| Domestic Equity Funds | 62.0% | |
| Developed International Equity Funds | 27.0% | |
| Investment Grade Bond Funds | 10.0% | |

The fund invests according to an asset allocation strategy that becomes increasingly conservative over time. The six months ago allocation is based on the fund's holdings as of March 31, 2013. The period end allocation is based on the fund's holdings as of September 30, 2013. The expected allocation represents the fund's anticipated allocation at March 31, 2014. |
Semiannual Report
Fidelity Freedom Index 2040 Fund
Investments September 30, 2013 (Unaudited)
Showing Percentage of Net Assets
Domestic Equity Funds - 60.8% |
| Shares | | Value |
Commodity Funds - 7.1% |
Fidelity Series Commodity Strategy Fund Class F (a)(b) | 8,475,773 | | $ 68,229,973 |
Domestic Equity Funds - 53.7% |
Spartan Total Market Index Fund
Class F (b) | 10,391,956 | | 517,727,261 |
TOTAL DOMESTIC EQUITY FUNDS (Cost $480,957,295) |
585,957,234
|
International Equity Funds - 22.9% |
| | | |
Developed International Equity Funds - 22.9% |
Fidelity Series Global ex U.S. Index Fund (b)
(Cost $192,699,380) | 18,479,432 | |
220,459,628
|
Bond Funds - 16.3% |
| Shares | | Value |
Investment Grade Bond Funds - 16.3% |
Spartan U.S. Bond Index Fund
Class F (b)
(Cost $159,777,438) | 13,680,612 | | $ 156,916,621 |
TOTAL INVESTMENT PORTFOLIO - 100.0% (Cost $833,434,113) | | 963,333,483 |
NET OTHER ASSETS (LIABILITIES) - 0.0% | | (62,169) |
NET ASSETS - 100% | $ 963,271,314 |
Legend |
(a) Non-income producing |
(b) Affiliated company |
Affiliated Underlying Funds |
Information regarding the Fund's fiscal year to date purchases and sales of the affiliated Underlying Funds and income earned by the Fund from investments in affiliated Underlying Funds is as follows: |
Affiliate | Value,
beginning of period | Purchases | Sales
Proceeds | Dividend Income | Value,
end of
period |
Fidelity Series Commodity Strategy Fund Class F | $ 73,364,708 | $ 22,767,937 | $ 21,946,133 | $ - | $ 68,229,973 |
Fidelity Series Global ex U.S. Index Fund | 178,486,716 | 42,783,609 | 14,471,450 | - | 220,459,628 |
Spartan Total Market Index Fund Class F | 417,883,477 | 103,111,152 | 41,661,644 | 1,218,902 | 517,727,261 |
Spartan U.S. Bond Index Fund Class F | 140,766,317 | 37,319,781 | 16,773,158 | 1,756,844 | 156,916,621 |
Total | $ 810,501,218 | $ 205,982,479 | $ 94,852,385 | $ 2,975,746 | $ 963,333,483 |
Other Information |
All investments are categorized as Level 1 under the Fair Value Hierarchy. The inputs or methodology used for valuing securities may not be an indication of the risk associated with investing in those securities. For more information on valuation inputs, please refer to the Investment Valuation section in the accompanying Notes to Financial Statements. |
See accompanying notes which are an integral part of the financial statements.
Semiannual Report
Fidelity Freedom Index 2040 Fund
Statement of Assets and Liabilities
| September 30, 2013 (Unaudited) |
| | |
Assets | | |
Investment in securities, at value (cost $833,434,113) - See accompanying schedule | | $ 963,333,483 |
Cash | | 3 |
Receivable for investments sold | | 22,149,649 |
Receivable for fund shares sold | | 1,777,210 |
Receivable from affiliate for expense reductions | | 57,295 |
Total assets | | 987,317,640 |
| | |
Liabilities | | |
Payable for investments purchased | $ 22,208,690 | |
Payable for fund shares redeemed | 1,718,171 | |
Transfer agent fees payable | 119,465 | |
Total liabilities | | 24,046,326 |
| | |
Net Assets | | $ 963,271,314 |
Net Assets consist of: | | |
Paid in capital | | $ 839,480,406 |
Undistributed net investment income | | 2,608,915 |
Accumulated undistributed net realized gain (loss) on investments | | (8,717,377) |
Net unrealized appreciation (depreciation) on investments | | 129,899,370 |
Net Assets, for 68,717,908 shares outstanding | | $ 963,271,314 |
Net Asset Value, offering price and redemption price per share ($963,271,314 ÷ 68,717,908 shares) | | $ 14.02 |
Statement of Operations
Six months ended September 30, 2013 (Unaudited) |
| | |
Investment Income | | |
Income distributions from underlying funds | | $ 2,975,746 |
| | |
Expenses | | |
Transfer agent fees | $ 663,497 | |
Independent trustees' compensation | 1,603 | |
Total expenses before reductions | 665,100 | |
Expense reductions | (299,588) | 365,512 |
Net investment income (loss) | | 2,610,234 |
Realized and Unrealized Gain (Loss) Realized gain (loss) on sale of underlying fund shares | | (5,382,448) |
Change in net unrealized appreciation (depreciation) on investment securities | | 47,084,620 |
Net gain (loss) | | 41,702,172 |
Net increase (decrease) in net assets resulting from operations | | $ 44,312,406 |
See accompanying notes which are an integral part of the financial statements.
Semiannual Report
Fidelity Freedom Index 2040 Fund
Financial Statements - continued
Statement of Changes in Net Assets
| Six months ended September 30, 2013 (Unaudited) | Year ended
March 31,
2013 |
Increase (Decrease) in Net Assets | | |
Operations | | |
Net investment income (loss) | $ 2,610,234 | $ 11,816,207 |
Net realized gain (loss) | (5,382,448) | (604,593) |
Change in net unrealized appreciation (depreciation) | 47,084,620 | 60,336,914 |
Net increase (decrease) in net assets resulting from operations | 44,312,406 | 71,548,528 |
Distributions to shareholders from net investment income | (500,172) | (11,638,431) |
Distributions to shareholders from net realized gain | (250,086) | (1,086,469) |
Total distributions | (750,258) | (12,724,900) |
Share transactions
Proceeds from sales of shares | 203,328,761 | 409,401,579 |
Reinvestment of distributions | 750,258 | 12,724,900 |
Cost of shares redeemed | (94,819,217) | (79,800,351) |
Net increase (decrease) in net assets resulting from share transactions | 109,259,802 | 342,326,128 |
Total increase (decrease) in net assets | 152,821,950 | 401,149,756 |
Net Assets | | |
Beginning of period | 810,449,364 | 409,299,608 |
End of period (including undistributed net investment income of $2,608,915 and undistributed net investment income of $498,853, respectively) | $ 963,271,314 | $ 810,449,364 |
Other Information Shares | | |
Sold | 14,953,041 | 33,057,917 |
Issued in reinvestment of distributions | 55,045 | 1,021,451 |
Redeemed | (6,975,264) | (6,356,433) |
Net increase (decrease) | 8,032,822 | 27,722,935 |
Financial Highlights
| Six months ended September 30, 2013 | Years ended March 31, |
| (Unaudited) | 2013 | 2012 | 2011 | 2010 E |
Selected Per-Share Data | | | | | |
Net asset value, beginning of period | $ 13.36 | $ 12.42 | $ 12.58 | $ 11.04 | $ 10.00 |
Income from Investment Operations | | | | | |
Net investment income (loss) D | .04 | .24 | .23 | .21 | .03 |
Net realized and unrealized gain (loss) | .63 | .93 | (.02) | 1.50 | 1.13 |
Total from investment operations | .67 | 1.17 | .21 | 1.71 | 1.16 |
Distributions from net investment income | (.01) | (.21) | (.20) | (.15) | (.11) |
Distributions from net realized gain | - I | (.02) | (.17) | (.03) | (.01) |
Total distributions | (.01) | (.23) | (.37) | (.17) H | (.12) |
Net asset value, end of period | $ 14.02 | $ 13.36 | $ 12.42 | $ 12.58 | $ 11.04 |
Total Return B,C | 5.03% | 9.59% | 1.92% | 15.59% | 11.58% |
Ratios to Average Net Assets F,G | | | | | |
Expenses before reductions | .15% A | .15% | .15% | .08% | .05% A |
Expenses net of fee waivers, if any | .08% A | .09% | .08% | .05% | .03% A |
Expenses net of all reductions | .08% A | .09% | .08% | .05% | .03% A |
Net investment income (loss) | .59% A | 1.93% | 1.91% | 1.80% | .56% A |
Supplemental Data | | | | | |
Net assets, end of period (000 omitted) | $ 963,271 | $ 810,449 | $ 409,300 | $ 174,164 | $ 16,259 |
Portfolio turnover rate G | 22% A | 8% | 16% | 13% | 22% |
A Annualized
B Total returns for periods of less than one year are not annualized.
C Total returns would have been lower if certain expenses had not been reduced during the applicable periods shown.
D Calculated based on average shares outstanding during the period.
E For the period October 2, 2009 (commencement of operations) to March 31, 2010.
F Expense ratios reflect operating expenses of the Fund. Expenses before reductions do not reflect amounts reimbursed by the investment adviser or reductions from expense offset arrangements and do not represent the amount paid by the Fund during periods when reimbursements or reductions occur. Expense ratios before reductions for start-up periods may not be representative of longer term operating periods. Expenses net of fee waivers reflect expenses after reimbursement by the investment adviser but prior to reductions from expense offset arrangements. Expenses net of all reductions represent the net expenses paid by the Fund.
G Amounts do not include the activity of the underlying funds.
H Total distributions of $.17 per share is comprised of distributions from net investment income of $.145 and distributions from net realized gain of $.027 per share.
I Amount represents less than $.01 per share.
See accompanying notes which are an integral part of the financial statements.
Semiannual Report
Fidelity Freedom Index 2045 Fund
Investment Changes (Unaudited)
The information in the following tables is based on the direct investments of the Fund. |
Fund Holdings as of September 30, 2013 |
| % of fund's
net assets | % of fund's net assets
6 months ago |
Commodity Funds | | |
Fidelity Series Commodity Strategy Fund Class F | 7.2 | 9.3 |
Domestic Equity Funds | | |
Spartan Total Market Index Fund Class F | 54.9 | 52.9 |
Developed International Equity Funds | | |
Fidelity Series Global ex U.S. Index Fund | 23.4 | 22.6 |
Investment Grade Bond Funds | | |
Spartan U.S. Bond Index Fund Class F | 14.5 | 15.2 |
Net Other Assets (Liabilities)* | 0.0 | 0.0 |
| 100.0 | 100.0 |
* Amount represents less than 0.1%
Asset Allocation (% of fund's net assets) |
Period end |
| Commodity Funds | 7.2% | |
| Domestic Equity Funds | 54.9% | |
| Developed International Equity Funds | 23.4% | |
| Investment Grade Bond Funds | 14.5% | |

Six months ago |
| Commodity Funds | 9.3% | |
| Domestic Equity Funds | 52.9% | |
| Developed International Equity Funds | 22.6% | |
| Investment Grade Bond Funds | 15.2% | |

Expected |
| Commodity Funds | 1.0% | |
| Domestic Equity Funds | 62.0% | |
| Developed International Equity Funds | 27.0% | |
| Investment Grade Bond Funds | 10.0% | |

The fund invests according to an asset allocation strategy that becomes increasingly conservative over time. The six months ago allocation is based on the fund's holdings as of March 31, 2013. The period end allocation is based on the fund's holdings as of September 30, 2013. The expected allocation represents the fund's anticipated allocation at March 31, 2014. |
Semiannual Report
Fidelity Freedom Index 2045 Fund
Investments September 30, 2013 (Unaudited)
Showing Percentage of Net Assets
Domestic Equity Funds - 62.1% |
| Shares | | Value |
Commodity Funds - 7.2% |
Fidelity Series Commodity Strategy Fund Class F (a)(b) | 4,248,454 | | $ 34,200,052 |
Domestic Equity Funds - 54.9% |
Spartan Total Market Index Fund
Class F (b) | 5,214,155 | | 259,769,179 |
TOTAL DOMESTIC EQUITY FUNDS (Cost $246,197,955) |
293,969,231
|
International Equity Funds - 23.4% |
| | | |
Developed International Equity Funds - 23.4% |
Fidelity Series Global ex U.S. Index Fund (b)
(Cost $97,833,579) | 9,280,211 | |
110,712,917
|
Bond Funds - 14.5% |
| Shares | | Value |
Investment Grade Bond Funds - 14.5% |
Spartan U.S. Bond Index Fund
Class F (b)
(Cost $70,044,971) | 5,986,277 | | $ 68,662,603 |
TOTAL INVESTMENT PORTFOLIO - 100.0% (Cost $414,076,505) | | 473,344,751 |
NET OTHER ASSETS (LIABILITIES) - 0.0% | | (29,802) |
NET ASSETS - 100% | $ 473,314,949 |
Legend |
(a) Non-income producing |
(b) Affiliated company |
Affiliated Underlying Funds |
Information regarding the Fund's fiscal year to date purchases and sales of the affiliated Underlying Funds and income earned by the Fund from investments in affiliated Underlying Funds is as follows: |
Affiliate | Value,
beginning of period | Purchases | Sales
Proceeds | Dividend Income | Value,
end of
period |
Fidelity Series Commodity Strategy Fund Class F | $ 35,241,966 | $ 11,330,065 | $ 9,472,081 | $ - | $ 34,200,052 |
Fidelity Series Global ex U.S. Index Fund | 85,970,942 | 20,866,980 | 3,039,223 | - | 110,712,917 |
Spartan Total Market Index Fund Class F | 201,283,646 | 50,309,342 | 10,641,307 | 589,470 | 259,769,179 |
Spartan U.S. Bond Index Fund Class F | 57,993,087 | 15,756,792 | 3,256,534 | 741,445 | 68,662,603 |
Total | $ 380,489,641 | $ 98,263,179 | $ 26,409,145 | $ 1,330,915 | $ 473,344,751 |
Other Information |
All investments are categorized as Level 1 under the Fair Value Hierarchy. The inputs or methodology used for valuing securities may not be an indication of the risk associated with investing in those securities. For more information on valuation inputs, please refer to the Investment Valuation section in the accompanying Notes to Financial Statements. |
See accompanying notes which are an integral part of the financial statements.
Semiannual Report
Fidelity Freedom Index 2045 Fund
Statement of Assets and Liabilities
| September 30, 2013 (Unaudited) |
| | |
Assets | | |
Investment in securities, at value (cost $414,076,505) - See accompanying schedule | | $ 473,344,751 |
Cash | | 2 |
Receivable for investments sold | | 9,736,172 |
Receivable for fund shares sold | | 1,305,414 |
Receivable from affiliate for expense reductions | | 28,673 |
Total assets | | 484,415,012 |
| | |
Liabilities | | |
Payable for investments purchased | $ 10,535,039 | |
Payable for fund shares redeemed | 506,548 | |
Transfer agent fees payable | 58,476 | |
Total liabilities | | 11,100,063 |
| | |
Net Assets | | $ 473,314,949 |
Net Assets consist of: | | |
Paid in capital | | $ 417,100,222 |
Undistributed net investment income | | 1,150,853 |
Accumulated undistributed net realized gain (loss) on investments | | (4,204,372) |
Net unrealized appreciation (depreciation) on investments | | 59,268,246 |
Net Assets, for 33,500,336 shares outstanding | | $ 473,314,949 |
Net Asset Value, offering price and redemption price per share ($473,314,949 ÷ 33,500,336 shares) | | $ 14.13 |
Statement of Operations
Six months ended September 30, 2013 (Unaudited) |
| | |
Investment Income | | |
Income distributions from underlying funds | | $ 1,330,915 |
| | |
Expenses | | |
Transfer agent fees | $ 318,726 | |
Independent trustees' compensation | 764 | |
Total expenses before reductions | 319,490 | |
Expense reductions | (144,905) | 174,585 |
Net investment income (loss) | | 1,156,330 |
Realized and Unrealized Gain (Loss) Realized gain (loss) on sale of underlying fund shares | | (2,759,953) |
Change in net unrealized appreciation (depreciation) on investment securities | | 23,761,026 |
Net gain (loss) | | 21,001,073 |
Net increase (decrease) in net assets resulting from operations | | $ 22,157,403 |
See accompanying notes which are an integral part of the financial statements.
Semiannual Report
Fidelity Freedom Index 2045 Fund
Financial Statements - continued
Statement of Changes in Net Assets
| Six months ended September 30, 2013 (Unaudited) | Year ended
March 31,
2013 |
Increase (Decrease) in Net Assets | | |
Operations | | |
Net investment income (loss) | $ 1,156,330 | $ 5,288,977 |
Net realized gain (loss) | (2,759,953) | (362,697) |
Change in net unrealized appreciation (depreciation) | 23,761,026 | 27,209,990 |
Net increase (decrease) in net assets resulting from operations | 22,157,403 | 32,136,270 |
Distributions to shareholders from net investment income | (201,896) | (5,205,081) |
Distributions to shareholders from net realized gain | (86,527) | (420,754) |
Total distributions | (288,423) | (5,625,835) |
Share transactions
Proceeds from sales of shares | 101,430,629 | 206,739,422 |
Reinvestment of distributions | 288,423 | 5,625,835 |
Cost of shares redeemed | (30,738,983) | (37,291,170) |
Net increase (decrease) in net assets resulting from share transactions | 70,980,069 | 175,074,087 |
Total increase (decrease) in net assets | 92,849,049 | 201,584,522 |
| | |
Net Assets | | |
Beginning of period | 380,465,900 | 178,881,378 |
End of period (including undistributed net investment income of $1,150,853 and undistributed net investment income of $196,419, respectively) | $ 473,314,949 | $ 380,465,900 |
Other Information Shares | | |
Sold | 7,398,095 | 16,481,838 |
Issued in reinvestment of distributions | 21,022 | 449,676 |
Redeemed | (2,236,674) | (2,956,898) |
Net increase (decrease) | 5,182,443 | 13,974,616 |
Financial Highlights
| Six months ended September 30, 2013 | Years ended March 31, |
| (Unaudited) | 2013 | 2012 | 2011 | 2010 E |
Selected Per-Share Data | | | | | |
Net asset value, beginning of period | $ 13.44 | $ 12.47 | $ 12.63 | $ 11.05 | $ 10.00 |
Income from Investment Operations | | | | | |
Net investment income (loss) D | .04 | .25 | .23 | .21 | .03 |
Net realized and unrealized gain (loss) | .66 | .95 | (.04) | 1.54 | 1.14 |
Total from investment operations | .70 | 1.20 | .19 | 1.75 | 1.17 |
Distributions from net investment income | (.01) | (.21) | (.19) | (.14) | (.11) |
Distributions from net realized gain | - H | (.02) | (.16) | (.03) | (.01) |
Total distributions | (.01) | (.23) | (.35) | (.17) | (.12) |
Net asset value, end of period | $ 14.13 | $ 13.44 | $ 12.47 | $ 12.63 | $ 11.05 |
Total Return B,C | 5.21% | 9.76% | 1.74% | 15.91% | 11.68% |
Ratios to Average Net Assets F,G | | | | | |
Expenses before reductions | .15% A | .15% | .15% | .09% | .05% A |
Expenses net of fee waivers, if any | .08% A | .09% | .09% | .05% | .04% A |
Expenses net of all reductions | .08% A | .09% | .09% | .05% | .04% A |
Net investment income (loss) | .54% A | 1.95% | 1.94% | 1.83% | .67% A |
Supplemental Data | | | | | |
Net assets, end of period (000 omitted) | $ 473,315 | $ 380,466 | $ 178,881 | $ 53,547 | $ 4,213 |
Portfolio turnover rate G | 12% A | 7% | 15% | 11% | 24% |
A Annualized
B Total returns for periods of less than one year are not annualized.
C Total returns would have been lower if certain expenses had not been reduced during the applicable periods shown.
D Calculated based on average shares outstanding during the period.
E For the period October 2, 2009 (commencement of operations) to March 31, 2010.
F Expense ratios reflect operating expenses of the Fund. Expenses before reductions do not reflect amounts reimbursed by the investment adviser or reductions from expense offset arrangements and do not represent the amount paid by the Fund during periods when reimbursements or reductions occur. Expense ratios before reductions for start-up periods may not be representative of longer term operating periods. Expenses net of fee waivers reflect expenses after reimbursement by the investment adviser but prior to reductions from expense offset arrangements. Expenses net of all reductions represent the net expenses paid by the Fund.
G Amounts do not include the activity of the underlying funds.
H Amount represents less than $.01 per share.
See accompanying notes which are an integral part of the financial statements.
Semiannual Report
Fidelity Freedom Index 2050 Fund
Investment Changes (Unaudited)
The information in the following tables is based on the direct investments of the Fund. |
Fund Holdings as of September 30, 2013 |
| % of fund's
net assets | % of fund's net assets
6 months ago |
Commodity Funds | | |
Fidelity Series Commodity Strategy Fund Class F | 7.3 | 9.4 |
Domestic Equity Funds | | |
Spartan Total Market Index Fund Class F | 55.3 | 53.5 |
Developed International Equity Funds | | |
Fidelity Series Global ex U.S. Index Fund | 23.5 | 22.9 |
Investment Grade Bond Funds | | |
Spartan U.S. Bond Index Fund Class F | 13.9 | 14.2 |
Net Other Assets (Liabilities)* | 0.0 | 0.0 |
| 100.0 | 100.0 |
* Amount represents less than 0.1%
Asset Allocation (% of fund's net assets) |
Period end |
| Commodity Funds | 7.3% | |
| Domestic Equity Funds | 55.3% | |
| Developed International Equity Funds | 23.5% | |
| Investment Grade Bond Funds | 13.9% | |

Six months ago |
| Commodity Funds | 9.4% | |
| Domestic Equity Funds | 53.5% | |
| Developed International Equity Funds | 22.9% | |
| Investment Grade Bond Funds | 14.2% | |

Expected |
| Commodity Funds | 1.0% | |
| Domestic Equity Funds | 62.0% | |
| Developed International Equity Funds | 27.0% | |
| Investment Grade Bond Funds | 10.0% | |

The fund invests according to an asset allocation strategy that becomes increasingly conservative over time. The six months ago allocation is based on the fund's holdings as of March 31, 2013. The period end allocation is based on the fund's holdings as of September 30, 2013. The expected allocation represents the fund's anticipated allocation at March 31, 2014. |
Semiannual Report
Fidelity Freedom Index 2050 Fund
Investments September 30, 2013 (Unaudited)
Showing Percentage of Net Assets
Domestic Equity Funds - 62.6% |
| Shares | | Value |
Commodity Funds - 7.3% |
Fidelity Series Commodity Strategy Fund Class F (a)(b) | 3,700,847 | | $ 29,791,818 |
Domestic Equity Funds - 55.3% |
Spartan Total Market Index Fund
Class F (b) | 4,543,975 | | 226,380,821 |
TOTAL DOMESTIC EQUITY FUNDS (Cost $215,297,151) |
256,172,639
|
International Equity Funds - 23.5% |
| | | |
Developed International Equity Funds - 23.5% |
Fidelity Series Global ex U.S. Index
Fund (b)
(Cost $85,246,714) | 8,083,863 | |
96,440,484
|
Bond Funds - 13.9% |
| Shares | | Value |
Investment Grade Bond Funds - 13.9% |
Spartan U.S. Bond Index Fund
Class F (b)
(Cost $58,086,920) | 4,950,020 | | $ 56,776,726 |
TOTAL INVESTMENT PORTFOLIO - 100.0% (Cost $358,630,785) | | 409,389,849 |
NET OTHER ASSETS (LIABILITIES) - 0.0% | | (25,554) |
NET ASSETS - 100% | $ 409,364,295 |
Legend |
(a) Non-income producing |
(b) Affiliated company |
Affiliated Underlying Funds |
Information regarding the Fund's fiscal year to date purchases and sales of the affiliated Underlying Funds and income earned by the Fund from investments in affiliated Underlying Funds is as follows: |
Affiliate | Value,
beginning of period | Purchases | Sales
Proceeds | Dividend Income | Value,
end of
period |
Fidelity Series Commodity Strategy Fund Class F | $ 30,688,057 | $ 10,616,523 | $ 8,971,910 | $ - | $ 29,791,818 |
Fidelity Series Global ex U.S. Index Fund | 74,632,682 | 20,057,529 | 4,127,989 | - | 96,440,484 |
Spartan Total Market Index Fund Class F | 174,572,370 | 47,716,977 | 12,335,101 | 513,866 | 226,380,821 |
Spartan U.S. Bond Index Fund Class F | 46,347,615 | 15,371,649 | 3,423,193 | 607,014 | 56,776,726 |
Total | $ 326,240,724 | $ 93,762,678 | $ 28,858,193 | $ 1,120,880 | $ 409,389,849 |
Other Information |
All investments are categorized as Level 1 under the Fair Value Hierarchy. The inputs or methodology used for valuing securities may not be an indication of the risk associated with investing in those securities. For more information on valuation inputs, please refer to the Investment Valuation section in the accompanying Notes to Financial Statements. |
See accompanying notes which are an integral part of the financial statements.
Semiannual Report
Fidelity Freedom Index 2050 Fund
Statement of Assets and Liabilities
| September 30, 2013 (Unaudited) |
| | |
Assets | | |
Investment in securities, at value (cost $358,630,785) - See accompanying schedule | | $ 409,389,849 |
Cash | | 2 |
Receivable for investments sold | | 8,325,209 |
Receivable for fund shares sold | | 800,264 |
Receivable from affiliate for expense reductions | | 24,977 |
Total assets | | 418,540,301 |
| | |
Liabilities | | |
Payable for investments purchased | $ 8,732,029 | |
Payable for fund shares redeemed | 393,444 | |
Transfer agent fees payable | 50,533 | |
Total liabilities | | 9,176,006 |
| | |
Net Assets | | $ 409,364,295 |
Net Assets consist of: | | |
Paid in capital | | $ 361,206,554 |
Undistributed net investment income | | 963,208 |
Accumulated undistributed net realized gain (loss) on investments | | (3,564,531) |
Net unrealized appreciation (depreciation) on investments | | 50,759,064 |
Net Assets, for 28,795,122 shares outstanding | | $ 409,364,295 |
Net Asset Value, offering price and redemption price per share ($409,364,295 ÷ 28,795,122 shares) | | $ 14.22 |
Statement of Operations
Six months ended September 30, 2013 (Unaudited) |
| | |
Investment Income | | |
Income distributions from underlying funds | | $ 1,120,880 |
| | |
Expenses | | |
Transfer agent fees | $ 275,943 | |
Independent trustees' compensation | 660 | |
Total expenses before reductions | 276,603 | |
Expense reductions | (126,033) | 150,570 |
Net investment income (loss) | | 970,310 |
Realized and Unrealized Gain (Loss) Realized gain (loss) on sale of underlying fund shares | | (2,309,837) |
Change in net unrealized appreciation (depreciation) on investment securities | | 20,554,480 |
Net gain (loss) | | 18,244,643 |
Net increase (decrease) in net assets resulting from operations | | $ 19,214,953 |
See accompanying notes which are an integral part of the financial statements.
Semiannual Report
Statement of Changes in Net Assets
| Six months ended September 30, 2013 (Unaudited) | Year ended
March 31,
2013 |
Increase (Decrease) in Net Assets | | |
Operations | | |
Net investment income (loss) | $ 970,310 | $ 4,416,091 |
Net realized gain (loss) | (2,309,837) | (397,117) |
Change in net unrealized appreciation (depreciation) | 20,554,480 | 23,614,291 |
Net increase (decrease) in net assets resulting from operations | 19,214,953 | 27,633,265 |
Distributions to shareholders from net investment income | (152,231) | (4,334,959) |
Distributions to shareholders from net realized gain | (76,115) | (315,418) |
Total distributions | (228,346) | (4,650,377) |
Share transactions
Proceeds from sales of shares | 101,732,162 | 193,560,408 |
Reinvestment of distributions | 228,346 | 4,650,377 |
Cost of shares redeemed | (37,803,572) | (35,627,910) |
Net increase (decrease) in net assets resulting from share transactions | 64,156,936 | 162,582,875 |
Total increase (decrease) in net assets | 83,143,543 | 185,565,763 |
Net Assets | | |
Beginning of period | 326,220,752 | 140,654,989 |
End of period (including undistributed net investment income of $963,208 and undistributed net investment income of $145,129, respectively) | $ 409,364,295 | $ 326,220,752 |
Other Information Shares | | |
Sold | 7,371,397 | 15,362,337 |
Issued in reinvestment of distributions | 16,428 | 370,270 |
Redeemed | (2,741,418) | (2,810,438) |
Net increase (decrease) | 4,646,407 | 12,922,169 |
Financial Highlights
| Six months ended September 30, 2013 | Years ended March 31, |
| (Unaudited) | 2013 | 2012 | 2011 | 2010 E |
Selected Per-Share Data | | | | | |
Net asset value, beginning of period | $ 13.51 | $ 12.53 | $ 12.73 | $ 11.10 | $ 10.00 |
Income from Investment Operations | | | | | |
Net investment income (loss) D | .04 | .25 | .23 | .20 | .04 |
Net realized and unrealized gain (loss) | .68 | .95 | (.09) | 1.59 | 1.18 |
Total from investment operations | .72 | 1.20 | .14 | 1.79 | 1.22 |
Distributions from net investment income | (.01) | (.21) | (.18) | (.14) | (.11) |
Distributions from net realized gain | - I | (.02) | (.16) | (.02) | (.01) |
Total distributions | (.01) | (.22) H | (.34) | (.16) | (.12) |
Net asset value, end of period | $ 14.22 | $ 13.51 | $ 12.53 | $ 12.73 | $ 11.10 |
Total Return B,C | 5.32% | 9.75% | 1.39% | 16.19% | 12.18% |
Ratios to Average Net Assets F,G | | | | | |
Expenses before reductions | .15% A | .15% | .15% | .08% | .05% A |
Expenses net of fee waivers, if any | .08% A | .09% | .08% | .05% | .04% A |
Expenses net of all reductions | .08% A | .09% | .08% | .05% | .04% A |
Net investment income (loss) | .53% A | 2.02% | 1.89% | 1.72% | .81% A |
Supplemental Data | | | | | |
Net assets, end of period (000 omitted) | $ 409,364 | $ 326,221 | $ 140,655 | $ 36,758 | $ 1,638 |
Portfolio turnover rate G | 16% A | 8% | 15% | 11% | 19% |
A Annualized
B Total returns for periods of less than one year are not annualized.
C Total returns would have been lower if certain expenses had not been reduced during the applicable periods shown.
D Calculated based on average shares outstanding during the period.
E For the period October 2, 2009 (commencement of operations) to March 31, 2010.
F Expense ratios reflect operating expenses of the Fund. Expenses before reductions do not reflect amounts reimbursed by the investment adviser or reductions from expense offset arrangements and do not represent the amount paid by the Fund during periods when reimbursements or reductions occur. Expense ratios before reductions for start-up periods may not be representative of longer term operating periods. Expenses net of fee waivers reflect expenses after reimbursement by the investment adviser but prior to reductions from expense offset arrangements. Expenses net of all reductions represent the net expenses paid by the Fund.
G Amounts do not include the activity of the underlying funds.
H Total distributions of $.22 per share is comprised of distributions from net investment income of $.209 and distributions from net realized gain of $.015 per share.
I Amount represents less than $.01 per share.
See accompanying notes which are an integral part of the financial statements.
Semiannual Report
Fidelity Freedom Index 2055 Fund
Investment Changes (Unaudited)
The information in the following tables is based on the direct investments of the Fund. |
Fund Holdings as of September 30, 2013 |
| % of fund's
net assets | % of fund's net assets
6 months ago |
Commodity Funds | | |
Fidelity Series Commodity Strategy Fund Class F | 7.6 | 9.9 |
Domestic Equity Funds | | |
Spartan Total Market Index Fund Class F | 57.7 | 55.8 |
Developed International Equity Funds | | |
Fidelity Series Global ex U.S. Index Fund | 24.5 | 23.9 |
Investment Grade Bond Funds | | |
Spartan U.S. Bond Index Fund Class F | 10.2 | 10.4 |
Net Other Assets (Liabilities)* | 0.0 | 0.0 |
| 100.0 | 100.0 |
* Amount represents less than 0.1%
Asset Allocation (% of fund's net assets) |
Period end |
| Commodity Funds | 7.6% | |
| Domestic Equity Funds | 57.7% | |
| Developed International Equity Funds | 24.5% | |
| Investment Grade Bond Funds | 10.2% | |

Six months ago |
| Commodity Funds | 9.9% | |
| Domestic Equity Funds | 55.8% | |
| Developed International Equity Funds | 23.9% | |
| Investment Grade Bond Funds | 10.4% | |

Expected |
| Commodity Funds | 1.0% | |
| Domestic Equity Funds | 62.0% | |
| Developed International Equity Funds | 27.0% | |
| Investment Grade Bond Funds | 10.0% | |

The fund invests according to an asset allocation strategy that becomes increasingly conservative over time. The six months ago allocation is based on the fund's holdings as of March 31, 2013. The period end allocation is based on the fund's holdings as of September 30, 2013. The expected allocation represents the fund's anticipated allocation at March 31, 2014. |
Semiannual Report
Fidelity Freedom Index 2055 Fund
Investments September 30, 2013 (Unaudited)
Showing Percentage of Net Assets
Domestic Equity Funds - 65.3% |
| Shares | | Value |
Commodity Funds - 7.6% |
Fidelity Series Commodity Strategy Fund Class F (a)(b) | 542,757 | | $ 4,369,197 |
Domestic Equity Funds - 57.7% |
Spartan Total Market Index Fund
Class F (b) | 661,880 | | 32,974,854 |
TOTAL DOMESTIC EQUITY FUNDS (Cost $33,740,947) |
37,344,051
|
International Equity Funds - 24.5% |
| | | |
Developed International Equity Funds - 24.5% |
Fidelity Series Global ex U.S. Index
Fund (b)
(Cost $12,899,044) | 1,173,969 | |
14,005,448
|
Bond Funds - 10.2% |
| Shares | | Value |
Investment Grade Bond Funds - 10.2% |
Spartan U.S. Bond Index Fund
Class F (b)
(Cost $5,957,265) | 509,062 | | $ 5,838,940 |
TOTAL INVESTMENT PORTFOLIO - 100.0% (Cost $52,597,256) | | 57,188,439 |
NET OTHER ASSETS (LIABILITIES) - 0.0% | | (3,303) |
NET ASSETS - 100% | $ 57,185,136 |
Legend |
(a) Non-income producing |
(b) Affiliated company |
Affiliated Underlying Funds |
Information regarding the Fund's fiscal year to date purchases and sales of the affiliated Underlying Funds and income earned by the Fund from investments in affiliated Underlying Funds is as follows: |
Affiliate | Value, beginning of period | Purchases | Sales Proceeds | Dividend Income | Value,
end of
period |
Fidelity Series Commodity Strategy Fund Class F | $ 2,975,408 | $ 2,858,338 | $ 1,183,286 | $ - | $ 4,369,197 |
Fidelity Series Global ex U.S. Index Fund | 7,225,560 | 6,266,737 | 286,935 | - | 14,005,448 |
Spartan Total Market Index Fund Class F | 16,861,654 | 14,830,071 | 691,311 | 52,155 | 32,974,854 |
Spartan U.S. Bond Index Fund Class F | 3,144,569 | 2,913,213 | 102,573 | 51,604 | 5,838,940 |
Total | $ 30,207,191 | $ 26,868,359 | $ 2,264,105 | $ 103,759 | $ 57,188,439 |
Other Information |
All investments are categorized as Level 1 under the Fair Value Hierarchy. The inputs or methodology used for valuing securities may not be an indication of the risk associated with investing in those securities. For more information on valuation inputs, please refer to the Investment Valuation section in the accompanying Notes to Financial Statements. |
See accompanying notes which are an integral part of the financial statements.
Semiannual Report
Fidelity Freedom Index 2055 Fund
Statement of Assets and Liabilities
| September 30, 2013 (Unaudited) |
| | |
Assets | | |
Investment in securities, at value (cost $52,597,256) - See accompanying schedule | | $ 57,188,439 |
Receivable for investments sold | | 859,260 |
Receivable for fund shares sold | | 887,709 |
Receivable from affiliate for expense reductions | | 3,509 |
Total assets | | 58,938,917 |
| | |
Liabilities | | |
Payable for investments purchased | $ 1,706,109 | |
Payable for fund shares redeemed | 40,859 | |
Transfer agent fees payable | 6,813 | |
Total liabilities | | 1,753,781 |
| | |
Net Assets | | $ 57,185,136 |
Net Assets consist of: | | |
Paid in capital | | $ 52,796,073 |
Undistributed net investment income | | 85,366 |
Accumulated undistributed net realized gain (loss) on investments | | (287,486) |
Net unrealized appreciation (depreciation) on investments | | 4,591,183 |
Net Assets, for 5,074,357 shares outstanding | | $ 57,185,136 |
Net Asset Value, offering price and redemption price per share ($57,185,136 ÷ 5,074,357 shares) | | $ 11.27 |
Statement of Operations
Six months ended September 30, 2013 (Unaudited) |
| | |
Investment Income | | |
Income distributions from underlying funds | | $ 103,759 |
| | |
Expenses | | |
Transfer agent fees | $ 32,478 | |
Independent trustees' compensation | 73 | |
Total expenses before reductions | 32,551 | |
Expense reductions | (14,432) | 18,119 |
Net investment income (loss) | | 85,640 |
Realized and Unrealized Gain (Loss) Realized gain (loss) on sale of underlying fund shares | | (185,369) |
Change in net unrealized appreciation (depreciation) on investment securities | | 2,562,363 |
Net gain (loss) | | 2,376,994 |
Net increase (decrease) in net assets resulting from operations | | $ 2,462,634 |
See accompanying notes which are an integral part of the financial statements.
Semiannual Report
Fidelity Freedom Index 2055 Fund
Financial Statements - continued
Statement of Changes in Net Assets
| Six months ended September 30, 2013 (Unaudited) | Year ended
March 31,
2013 |
Increase (Decrease) in Net Assets | | |
Operations | | |
Net investment income (loss) | $ 85,640 | $ 322,252 |
Net realized gain (loss) | (185,369) | (63,543) |
Change in net unrealized appreciation (depreciation) | 2,562,363 | 1,945,207 |
Net increase (decrease) in net assets resulting from operations | 2,462,634 | 2,203,916 |
Distributions to shareholders from net investment income | (6,497) | (318,679) |
Distributions to shareholders from net realized gain | (3,248) | (20,452) |
Total distributions | (9,745) | (339,131) |
Share transactions
Proceeds from sales of shares | 29,467,220 | 31,041,974 |
Reinvestment of distributions | 9,745 | 339,131 |
Cost of shares redeemed | (4,950,165) | (10,971,866) |
Net increase (decrease) in net assets resulting from share transactions | 24,526,800 | 20,409,239 |
Total increase (decrease) in net assets | 26,979,689 | 22,274,024 |
| | |
Net Assets | | |
Beginning of period | 30,205,447 | 7,931,423 |
End of period (including undistributed net investment income of $85,366 and undistributed net investment income of $6,223, respectively) | $ 57,185,136 | $ 30,205,447 |
Other Information Shares | | |
Sold | 2,693,449 | 3,087,682 |
Issued in reinvestment of distributions | 887 | 34,273 |
Redeemed | (451,116) | (1,095,160) |
Net increase (decrease) | 2,243,220 | 2,026,795 |
Financial Highlights
| Six months ended September 30, 2013 | Years ended March 31, |
| (Unaudited) | 2013 | 2012 E |
Selected Per-Share Data | | | |
Net asset value, beginning of period | $ 10.67 | $ 9.86 | $ 10.00 |
Income from Investment Operations | | | |
Net investment income (loss) D | .02 | .21 | .14 |
Net realized and unrealized gain (loss) | .58 | .77 | (.01) |
Total from investment operations | .60 | .98 | .13 |
Distributions from net investment income | - H | (.16) | (.13) |
Distributions from net realized gain | - H | (.01) | (.14) |
Total distributions | - H | (.17) | (.27) |
Net asset value, end of period | $ 11.27 | $ 10.67 | $ 9.86 |
Total Return B,C | 5.65% | 10.05% | 1.61% |
Ratios to Average Net Assets F,G | | | |
Expenses before reductions | .15% A | .15% | .15% A |
Expenses net of fee waivers, if any | .08% A | .09% | .07% A |
Expenses net of all reductions | .08% A | .09% | .07% A |
Net investment income (loss) | .40% A | 2.06% | 1.82% A |
Supplemental Data | | | |
Net assets, end of period (000 omitted) | $ 57,185 | $ 30,205 | $ 7,931 |
Portfolio turnover rate G | 10% A | 19% | 14% A |
A Annualized
B Total returns for periods of less than one year are not annualized.
C Total returns would have been lower if certain expenses had not been reduced during the applicable periods shown.
D Calculated based on average shares outstanding during the period.
E For the period June 1, 2011 (commencement of operations) to March 31, 2012.
F Expense ratios reflect operating expenses of the Fund. Expenses before reductions do not reflect amounts reimbursed by the investment adviser or reductions from expense offset arrangements and do not represent the amount paid by the Fund during periods when reimbursements or reductions occur. Expense ratios before reductions for start-up periods may not be representative of longer term operating periods. Expenses net of fee waivers reflect expenses after reimbursement by the investment adviser but prior to reductions from expense offset arrangements. Expenses net of all reductions represent the net expenses paid by the Fund.
G Amounts do not include the activity of the underlying funds.
H Amount represents less than $.01 per share.
See accompanying notes which are an integral part of the financial statements.
Semiannual Report
Notes to Financial Statements
For the period ended September 30, 2013 (Unaudited)
1. Organization.
Fidelity Freedom Index Income Fund, Fidelity Freedom Index 2000 Fund, Fidelity Freedom Index 2005 Fund, Fidelity Freedom Index 2010 Fund, Fidelity Freedom Index 2015 Fund, Fidelity Freedom Index 2020 Fund, Fidelity Freedom Index 2025 Fund, Fidelity Freedom Index 2030 Fund, Fidelity Freedom Index 2035 Fund, Fidelity Freedom Index 2040 Fund, Fidelity Freedom Index 2045 Fund, Fidelity Freedom Index 2050 Fund and Fidelity Freedom Index 2055 Fund (the Funds) are funds of Fidelity Aberdeen Street Trust (the Trust). The Trust is registered under the Investment Company Act of 1940, as amended (the 1940 Act), as an open-end management investment company organized as a Delaware statutory trust. Each Fund is authorized to issue an unlimited number of shares. The Funds invest primarily in a combination of other Fidelity equity, bond, and short-term funds (the Underlying Funds) managed by Fidelity Management & Research Company (FMR).
2. Significant Accounting Policies.
The financial statements have been prepared in conformity with accounting principles generally accepted in the United States of America (GAAP), which require management to make certain estimates and assumptions at the date of the financial statements. Actual results could differ from those estimates. Subsequent events, if any, through the date that the financial statements were issued have been evaluated in the preparation of the financial statements. The following summarizes the significant accounting policies of the Funds:
Investment Valuation. Investments are valued as of 4:00 p.m. Eastern time on the last calendar day of the period. Each Fund categorizes the inputs to valuation techniques used to value its investments into a disclosure hierarchy consisting of three levels as shown below:
Level 1 - quoted prices in active markets for identical investments
Level 2 - other significant observable inputs (including quoted prices for similar investments, interest rates, prepayment speeds, etc.)
Level 3 - unobservable inputs (including the Fund's own assumptions based on the best information available)
Valuation techniques used to value each Fund's investments by major category are as follows. Investments in the Underlying Funds are valued at their closing net asset value (NAV) each business day and are categorized as Level 1 in the hierarchy.
Investment Transactions and Income. For financial reporting purposes, the Funds' investment holdings and NAV include trades executed through the end of the last business day of the period. The NAV per share for processing shareholder transactions is calculated as of the close of business of the New York Stock Exchange (NYSE), normally 4:00 p.m. Eastern time and includes trades executed through the end of the prior business day. Gains and losses on securities sold are determined on the basis of identified cost. Income and capital gain distributions from the Underlying Funds, if any, are recorded on the ex-dividend date.
Expenses. Expenses directly attributable to a fund are charged to that fund. Expenses attributable to more than one fund are allocated among the respective funds on the basis of relative net assets or other appropriate methods. Expenses included in the accompanying financial statements reflect the expenses of each Fund and do not include any expenses associated with the Underlying Funds. Although not included in each Fund's expenses, each Fund indirectly bears its proportionate share of the Underlying Funds' expenses through the impact of these expenses on each Underlying Fund's NAV. Expense estimates are accrued in the period to which they relate and adjustments are made when actual amounts are known.
Income Tax Information and Distributions to Shareholders. Each year, each Fund intends to qualify as a regulated investment company under Subchapter M of the Internal Revenue Code, including distributing substantially all of its taxable income and realized gains. As a result, no provision for U.S. Federal income taxes is required. Each Fund files a U.S. federal tax return, in addition to state and local tax returns as required. The Fund's federal income tax returns are subject to examination by the Internal Revenue Service (IRS) for a period of three fiscal years after they are filed. State and local tax returns may be subject to examination for an additional fiscal year depending on the jurisdiction.
Distributions are declared and recorded on the ex-dividend date. Income and capital gain distributions are determined in accordance with income tax regulations, which may differ from GAAP.
Capital accounts within the financial statements are adjusted for permanent book-tax differences. These adjustments have no impact on net assets or the results of operations. Temporary book-tax differences will reverse in a subsequent period.
Book-tax differences are primarily due to the short-term gain distributions from the Underlying Funds and losses deferred due to wash sales and excise tax regulations.
Semiannual Report
2. Significant Accounting Policies - continued
Income Tax Information and Distributions to Shareholders - continued
The federal tax cost of investment securities and unrealized appreciation (depreciation) as of period end were as follows for each Fund:
| Tax cost | Gross unrealized
appreciation | Gross unrealized
depreciation | Net unrealized
appreciation
(depreciation) on
securities and
other investments |
Fidelity Freedom Index Income Fund | $ 128,913,704 | $ 5,834,508 | $ (1,675,320) | $ 4,159,188 |
Fidelity Freedom Index 2000 Fund | 55,866,008 | 2,721,396 | (629,266) | 2,092,130 |
Fidelity Freedom Index 2005 Fund | 58,041,370 | 4,160,782 | (739,084) | 3,421,698 |
Fidelity Freedom Index 2010 Fund | 340,204,929 | 38,588,072 | (5,230,158) | 33,357,914 |
Fidelity Freedom Index 2015 Fund | 704,293,926 | 73,976,707 | (10,030,219) | 63,946,488 |
Fidelity Freedom Index 2020 Fund | 1,529,369,283 | 174,315,455 | (24,272,415) | 150,043,040 |
Fidelity Freedom Index 2025 Fund | 1,041,130,700 | 136,437,563 | (15,592,434) | 120,845,129 |
Fidelity Freedom Index 2030 Fund | 1,248,722,188 | 180,656,890 | (18,721,532) | 161,935,358 |
Fidelity Freedom Index 2035 Fund | 745,829,970 | 113,915,016 | (9,596,369) | 104,318,647 |
Fidelity Freedom Index 2040 Fund | 835,907,124 | 138,732,930 | (11,306,571) | 127,426,359 |
Fidelity Freedom Index 2045 Fund | 415,170,211 | 63,313,392 | (5,138,852) | 58,174,540 |
Fidelity Freedom Index 2050 Fund | 359,686,307 | 54,217,966 | (4,514,424) | 49,703,542 |
Fidelity Freedom Index 2055 Fund | 52,683,961 | 4,980,006 | (475,528) | 4,504,478 |
3. Purchases and Sales of Investments.
Purchases and redemptions of the Underlying Fund shares are noted in the table below.
| Purchases ($) | Redemptions ($) |
Fidelity Freedom Index Income Fund | 25,513,770 | 25,056,829 |
Fidelity Freedom Index 2000 Fund | 11,233,270 | 11,996,754 |
Fidelity Freedom Index 2005 Fund | 9,664,768 | 11,768,314 |
Fidelity Freedom Index 2010 Fund | 61,246,681 | 58,945,197 |
Fidelity Freedom Index 2015 Fund | 155,751,343 | 74,173,691 |
Fidelity Freedom Index 2020 Fund | 368,670,087 | 154,252,788 |
Fidelity Freedom Index 2025 Fund | 231,074,054 | 73,231,037 |
Fidelity Freedom Index 2030 Fund | 304,112,495 | 143,179,477 |
Fidelity Freedom Index 2035 Fund | 179,721,777 | 54,100,427 |
Fidelity Freedom Index 2040 Fund | 205,982,479 | 94,852,385 |
Fidelity Freedom Index 2045 Fund | 98,263,179 | 26,409,145 |
Fidelity Freedom Index 2050 Fund | 93,762,678 | 28,858,193 |
Fidelity Freedom Index 2055 Fund | 26,868,359 | 2,264,105 |
4. Fees and Other Transactions with Affiliates.
Management Fee. Strategic Advisers, Inc. (Strategic Advisers), an affiliate of FMR, provides the Funds with investment management related services. The Funds do not pay any fees for these services.
Other Transactions. Strategic Advisers has entered into an administration agreement with FMR under which FMR provides management and administrative services (other than investment advisory services) necessary for the operation of each Fund. Pursuant to this agreement, FMR pays all expenses of each Fund, excluding the transfer agent fees, the compensation of the independent Trustees and certain other expenses such as interest expense. FMR also contracts with other Fidelity companies to perform the services necessary for the operation of each Fund.
Transfer Agent Fees. Fidelity Investments Institutional Operations Company, Inc. (FIIOC), an affiliate of FMR, is the Funds' transfer, dividend disbursing and shareholder servicing agent. FIIOC receives an asset-based fee of .15% based on each Fund's average net assets. FIIOC pays for typesetting, printing and mailing of shareholder reports, except proxy statements.
5. Expense Reductions.
FMR contractually agreed to reimburse each Fund to the extent annual operating expenses, including acquired fund fees and expenses, exceeded certain levels of average net assets as noted in the table below. This reimbursement will remain in place through May 31, 2015. Some expenses, for example interest expense, are excluded from this reimbursement.
Semiannual Report
Notes to Financial Statements (Unaudited) - continued
5. Expense Reductions - continued
The following Funds were in reimbursement during the period:
| Expense Limitations | Reimbursement
from affiliate |
Fidelity Freedom Index Income Fund | .19% | $ 38,962 |
Fidelity Freedom Index 2000 Fund | .19% | 17,473 |
Fidelity Freedom Index 2005 Fund | .19% | 19,647 |
Fidelity Freedom Index 2010 Fund | .19% | 104,414 |
Fidelity Freedom Index 2015 Fund | .19% | 194,101 |
Fidelity Freedom Index 2020 Fund | .19% | 423,876 |
Fidelity Freedom Index 2025 Fund | .19% | 305,235 |
Fidelity Freedom Index 2030 Fund | .19% | 388,379 |
Fidelity Freedom Index 2035 Fund | .19% | 252,567 |
Fidelity Freedom Index 2040 Fund | .19% | 299,588 |
Fidelity Freedom Index 2045 Fund | .19% | 144,905 |
Fidelity Freedom Index 2050 Fund | .19% | 126,033 |
Fidelity Freedom Index 2055 Fund | .19% | 14,432 |
Effective December 1, 2013 the expense limitation will be changed to .16% for each Fund and will remain in place through May 31, 2016.
6. Other.
The Funds' organizational documents provide former and current trustees and officers with a limited indemnification against liabilities arising in connection with the performance of their duties to the Funds. In the normal course of business, the Funds may also enter into contracts that provide general indemnifications. The Funds' maximum exposure under these arrangements is unknown as this would be dependent on future claims that may be made against the Funds. The risk of material loss from such claims is considered remote.
The Funds do not invest in the Underlying Funds for the purpose of exercising management or control; however, investments by the Funds within their principal investment strategies may represent a significant portion of the Underlying Fund's net assets. At the end of the period, the following Freedom Index Funds were the owners of record of 10% or more of the total outstanding shares of the Underlying Funds.
Fund | Fidelity Freedom
Index 2020 | Fidelity Freedom
Index 2025 | Fidelity Freedom
Index 2030 | Fidelity Freedom
Index 2035 | Fidelity Freedom
Index 2040 |
Fidelity Series Global ex U.S. Index Fund | 16% | 14% | 18% | 12% | 14% |
The Funds, in aggregate, were the owners of record of more than 20% of the total outstanding shares of the following Underlying Funds.
Fund | % of shares held |
Fidelity Series Global ex U.S. Index Fund | 100% |
Semiannual Report
Board Approval of Investment Advisory Contracts and Management Fees
Fidelity Freedom Index Funds
Each year, the Board of Trustees, including the Independent Trustees (together, the Board), votes on the renewal of the management contract (the Advisory Contract) with Strategic Advisers, Inc. (Strategic Advisers) and the administration agreement for each fund. The Board, assisted by the advice of fund counsel and Independent Trustees' counsel, requests and considers a broad range of information relevant to the renewal of the Advisory Contracts throughout the year.
The Board meets regularly and, at each of its meetings, covers an extensive agenda of topics and materials and considers factors that are relevant to its annual consideration of the renewal of each fund's Advisory Contract, including the services and support provided to each fund and its shareholders. The Board has established four standing committees, Operations, Audit, Fair Valuation, and Governance and Nominating, each composed of and chaired by Independent Trustees with varying backgrounds, to which the Board has assigned specific subject matter responsibilities in order to enhance effective decision-making by the Board. The Operations Committee, of which all of the Independent Trustees are members, meets regularly throughout the year and, among other matters, considers matters specifically related to the annual consideration of the renewal of each fund's Advisory Contract. The Board, acting directly and through its Committees, requests and receives information concerning the annual consideration of the renewal of each fund's Advisory Contract. The Board also meets as needed to consider matters specifically related to the Board's annual consideration of the renewal of Advisory Contracts. Members of the Board may also meet with trustees of other Fidelity funds through ad hoc joint committees to discuss certain matters relevant to the Fidelity funds.
At its September 2013 meeting, the Board, including the Independent Trustees, unanimously determined to renew each fund's Advisory Contract. In reaching its determination, the Board considered all factors it believed relevant and reached a determination, with the assistance of fund counsel and Independent Trustees' counsel and through the exercise of its business judgment, that the renewal of the Advisory Contract was in the best interests of each fund and its shareholders and the fact that no fees are payable under the Advisory Contracts was fair and reasonable. The Board's decision to renew the Advisory Contracts was not based on any single factor, but rather was based on a comprehensive consideration of all the information provided to the Board at its meetings throughout the year. In reaching its determination, the Board was aware that shareholders in each fund have a broad range of investment choices available to them, including a wide choice among mutual funds offered by Fidelity's competitors, and that each fund's shareholders, who have the opportunity to review and weigh the disclosure provided by the fund in its prospectus and other public disclosures, have chosen to invest in that fund, which is part of the Fidelity family of funds.
Nature, Extent, and Quality of Services Provided. The Board considered Fidelity's staffing, as it relates to the funds, including the backgrounds of investment personnel of Strategic Advisers, and also considered the funds' investment objectives, strategies, and related investment philosophies. The Independent Trustees also had discussions with senior management of Fidelity's investment operations and investment groups with responsibility for the underlying Fidelity funds in which each fund invests. The Board considered the structure of the portfolio manager compensation program and whether this structure provides appropriate incentives to act in the best interests of each fund.
Resources Dedicated to Investment Management and Support Services. The Board reviewed the general qualifications and capabilities of Fidelity's investment staff, including its size, education, experience, and resources, as well as Fidelity's approach to recruiting, managing, and compensating investment personnel. The Board noted that Fidelity has continued to increase the resources devoted to non-U.S. offices, including expansion of Fidelity's global investment organization. The Board also noted that Fidelity's analysts have extensive resources, tools and capabilities that allow them to conduct sophisticated quantitative and fundamental analysis, as well as credit analysis of issuers, counterparties and guarantors. Further, the Board believes that Fidelity's investment professionals have sufficient access to global information and data so as to provide competitive investment results over time, and that those professionals also have access to sophisticated tools that permit them to assess portfolio construction and risk and performance attribution characteristics continuously, as well as to transmit new information and research conclusions rapidly around the world. Additionally, in its deliberations, the Board considered Fidelity's risk management capabilities and resources, which are an integral part of the investment management process.
Shareholder and Administrative Services. The Board considered (i) the nature, extent, quality, and cost of advisory, administrative, and shareholder services performed by Fidelity affiliates under the Advisory Contract and the administration agreement and under separate agreements covering transfer agency and pricing and bookkeeping for each fund; (ii) the nature and extent of the supervision of third party service providers, principally custodians and subcustodians; and (iii) the resources devoted to, and the record of compliance with, each fund's compliance policies and procedures.
The Board noted that the growth of fund assets over time across the complex allows Fidelity to reinvest in the development of services designed to enhance the value or convenience of the Fidelity funds as investment vehicles. These services include 24-hour access to account information and market information through telephone representatives and over the Internet, investor education materials and asset allocation tools, and the expanded availability of Fidelity Investor Centers.
Investment in a Large Fund Family. The Board considered the benefits to shareholders of investing in a Fidelity fund, including the benefits of investing in a fund that is part of a large family of funds offering a variety of investment disciplines and providing a large variety of mutual fund investor services. The Board noted that Fidelity had taken, or had made recommendations that resulted in the Fidelity funds taking, a number of actions over the previous year that benefited particular funds, including (i) continuing to dedicate additional resources to investment research and to the support of the senior management team that oversees asset management; (ii) persisting in efforts to enhance Fidelity's global research capabilities; (iii) launching new funds and making other enhancements to meet client needs for global and income-oriented solutions; (iv) continuing to launch dedicated lower cost underlying funds to meet portfolio construction needs related to expanding underlying fund options for Fidelity funds of funds, specifically for the Freedom Fund product lines; (v) rationalizing product lines and gaining increased efficiencies through the combination of several funds with other funds; (vi) strengthening Fidelity's index fund offerings by reducing investment minimums and adopting or lowering existing expense caps for certain funds and classes; (vii) enhancing Global Asset Allocation product offerings by launching new funds and strategies, including "open architecture" target date funds that utilize affiliated and unaffiliated sub-advisers; (viii) modifying the eligibility criteria for Institutional Class shares of Advisor funds to increase their marketability to a portion of the defined contribution plan market; (ix) creating a new low-cost retirement share class for certain Advisor funds to appeal to large retirement plans; (x) transitioning the management of certain Fidelity commodity funds to Geode Capital Management LLC, a registered commodity pool operator, while retaining administrative responsibilities for the funds; and (xi) taking steps toward establishing a new Fidelity adviser to manage sector-based funds and products.
Semiannual Report
Investment Performance. The Board considered whether each fund has operated in accordance with its investment objective, as well as its record of compliance with its investment restrictions and its performance history.
The Board took into account discussions with the investment adviser about fund investment performance that occur at Board meetings throughout the year. In this regard the Board noted that as part of regularly scheduled fund reviews and other reports to the Board on fund performance, the Board periodically considers annualized return information for each fund for different time periods, measured against one or more securities market indices, including a customized blended index representative of the fund's asset classes (each a "benchmark index") and a peer group of mutual funds with similar objectives ("peer group"). In its evaluation of fund investment performance at meetings throughout the year, the Board gave particular attention to information indicating underperformance of certain Fidelity funds for specific time periods and the investment adviser's explanations for such underperformance.
In addition to reviewing absolute and relative fund performance, the Independent Trustees periodically consider the appropriateness of fund performance metrics in evaluating the results achieved. In general, the Independent Trustees believe that fund performance should be evaluated based on gross performance (before fees and expenses, including acquired fund fees and expenses, but after transaction costs, if any) compared to appropriate benchmark indices, over appropriate time periods that may include full market cycles, and on net performance (after fees and expenses) compared to peer groups, as applicable, over the same periods, taking into account relevant factors including the following: general market conditions; the extent to which particular underlying funds affected performance; and fund cash flows and other factors. Depending on the circumstances, the Independent Trustees may be satisfied with a fund's performance notwithstanding that it lags its benchmark index or peer group for certain periods.
The Independent Trustees recognize that shareholders evaluate performance on a net basis over their own holding periods, for which one-, three-, and five-year periods are often used as a proxy. For this reason, the performance information reviewed by the Board also included net cumulative calendar year total return information for each fund and an appropriate benchmark index for the most recent one- and three-year periods (for the most recent one-year period for Fidelity Freedom Index® 2055 Fund).
Based on its review, the Board concluded that the nature, extent, and quality of services provided to each fund under the Advisory Contract should benefit each fund's shareholders.
Competitiveness of Management Fee and Total Expense Ratio. The Board noted that the funds do not pay Strategic Advisers a management fee for investment advisory services. The Board considered each fund's management fee and total expense ratio compared to "mapped groups" of competitive funds and classes, and also considered that each fund bears indirectly the expenses of the underlying Fidelity funds in which it invests. Fidelity creates "mapped groups" by combining similar Lipper investment objective categories that have comparable investment mandates. Combining Lipper investment objective categories aids the Board's management fee and total expense ratio comparisons by broadening the competitive group used for comparison and by reducing the number of universes to which various Fidelity funds are compared.
Management Fee. The Board considered two proprietary management fee comparisons for the 12-month (or shorter) periods shown in the charts below. The group of Lipper funds used by the Board for management fee comparisons is referred to below as the "Total Mapped Group." The Total Mapped Group comparison focuses on a fund's standing in terms of gross management fees before expense reimbursements or caps relative to the total universe of funds with comparable investment mandates, regardless of whether their management fee structures also are comparable. "TMG %" represents the percentage of funds in the Total Mapped Group that had management fees that were lower than a fund's. For example, a hypothetical TMG % of 50% would mean that half of the funds in the Total Mapped Group had higher, and half had lower, management fees than a fund. The funds' actual TMG %s are in the charts below. The "Asset-Size Peer Group" (ASPG) comparison focuses on a fund's standing relative to a subset of non-Fidelity funds within the Total Mapped Group that are similar in size and management fee structure. For example, if a fund is in the first quartile of the ASPG, the fund's management fee ranks in the least expensive or lowest 25% of funds in the ASPG. The ASPG represents at least 15% of the funds in the Total Mapped Group with comparable asset size and management fee structures, subject to a minimum of 50 funds (or all funds in the Total Mapped Group if fewer than 50). Additional information, such as the ASPG quartile in which a fund's management fee rate ranked, is also included in the charts and considered by the Board.
Semiannual Report
Board Approval of Investment Advisory Contracts and Management Fees - continued
Freedom Index 2000 Fund
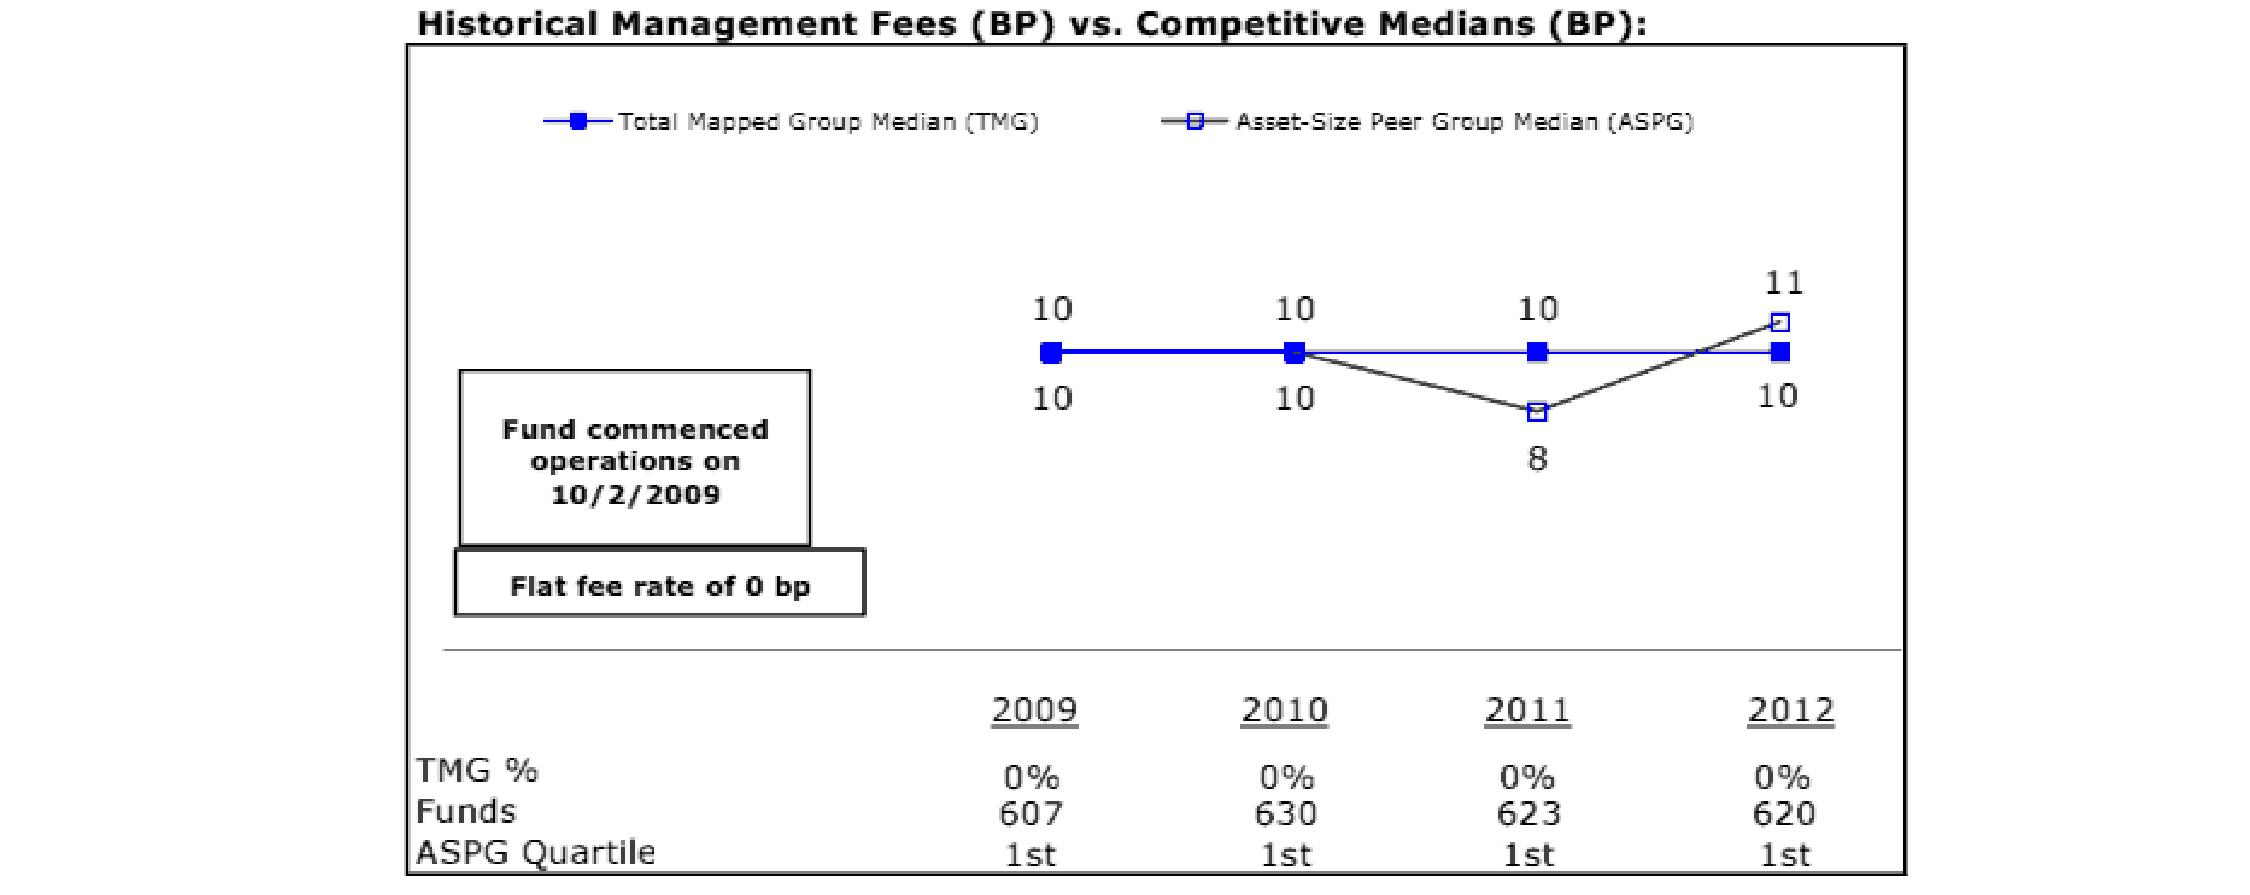
Freedom Index 2005 Fund
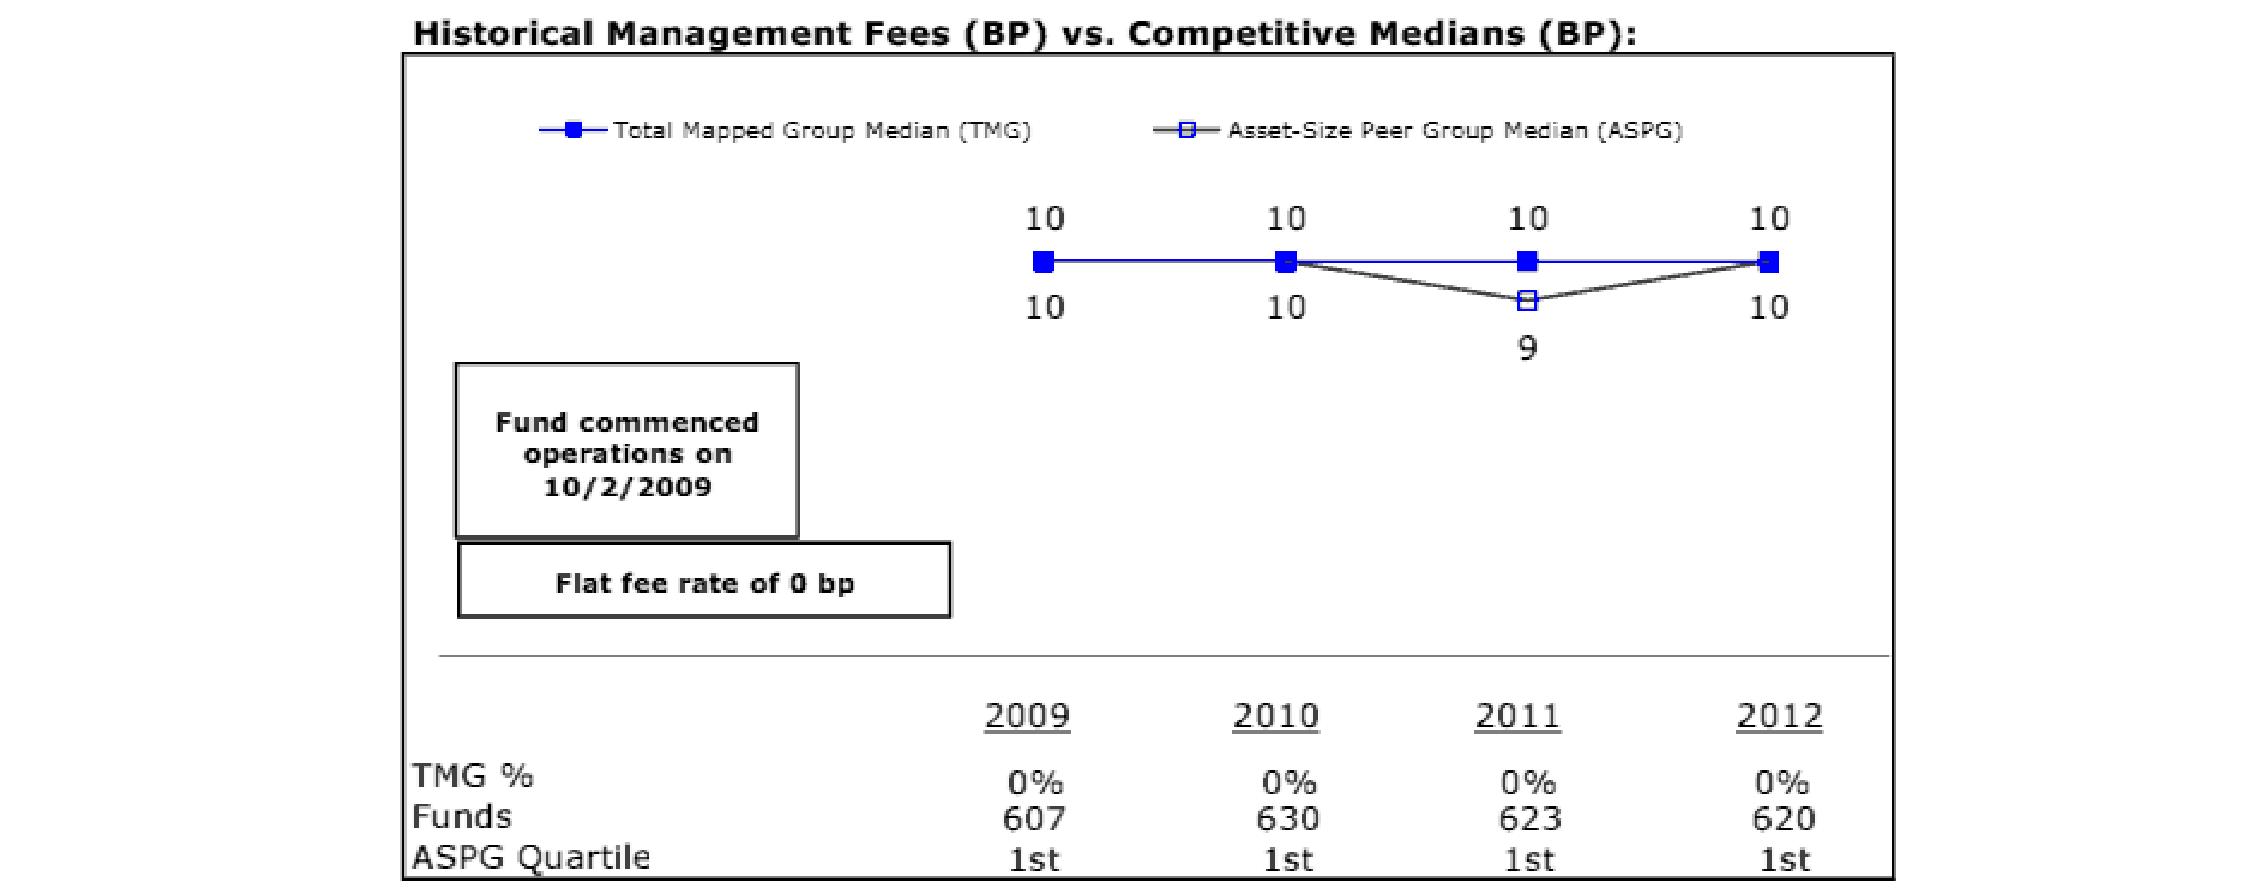
Semiannual Report
Freedom Index 2010 Fund
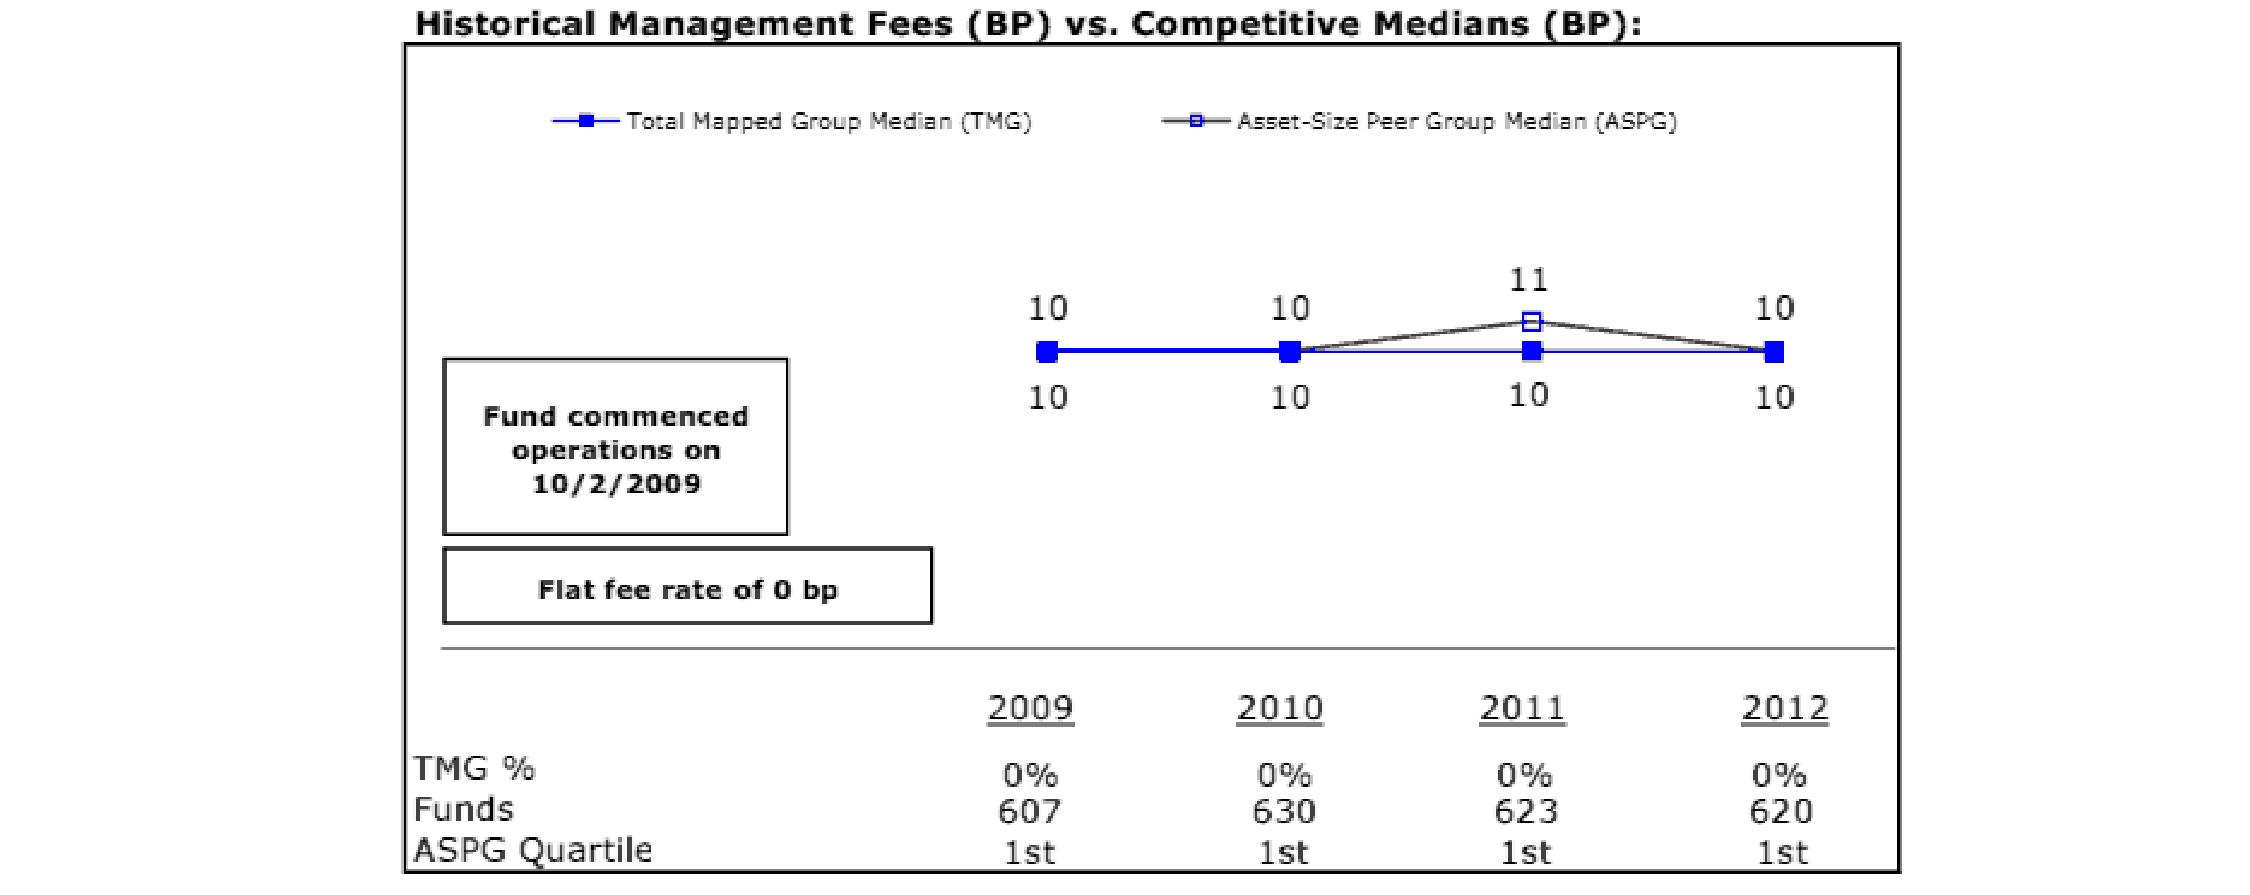
Freedom Index 2015 Fund

Semiannual Report
Board Approval of Investment Advisory Contracts and Management Fees - continued
Freedom Index 2020 Fund
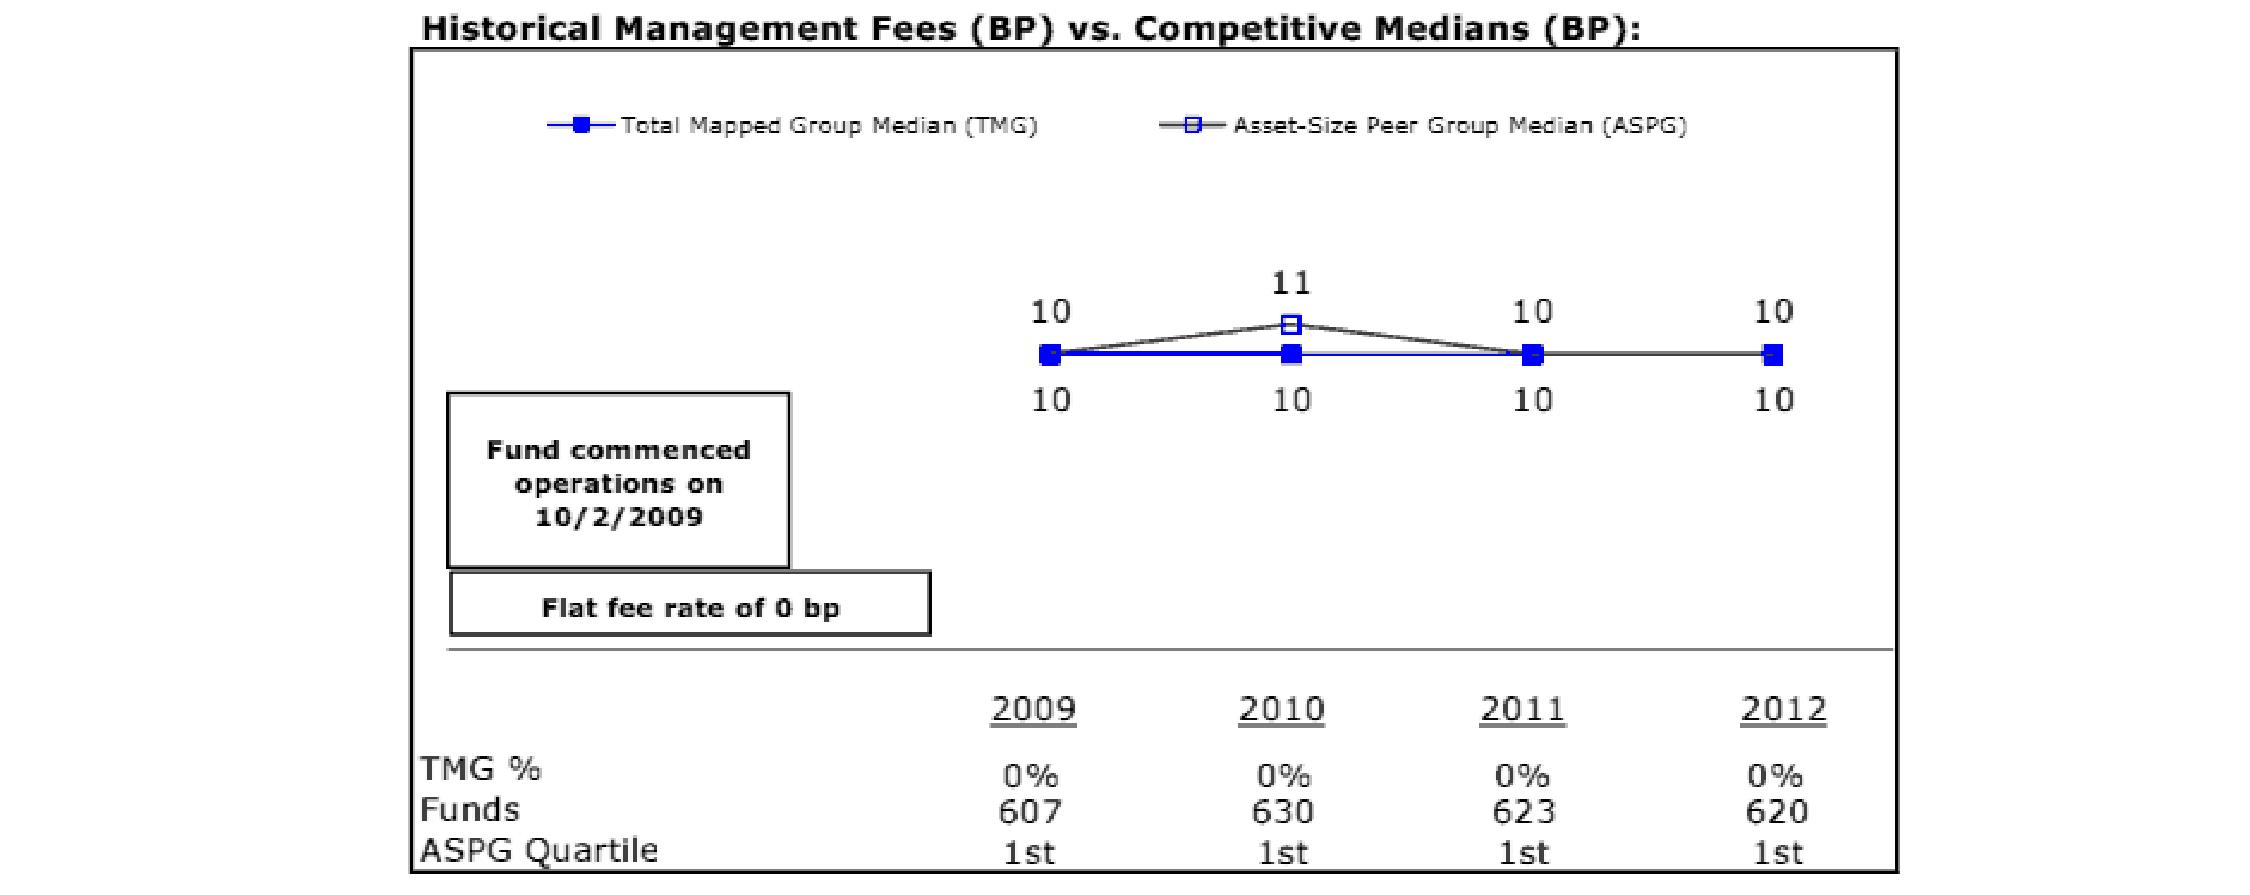
Freedom Index 2025 Fund
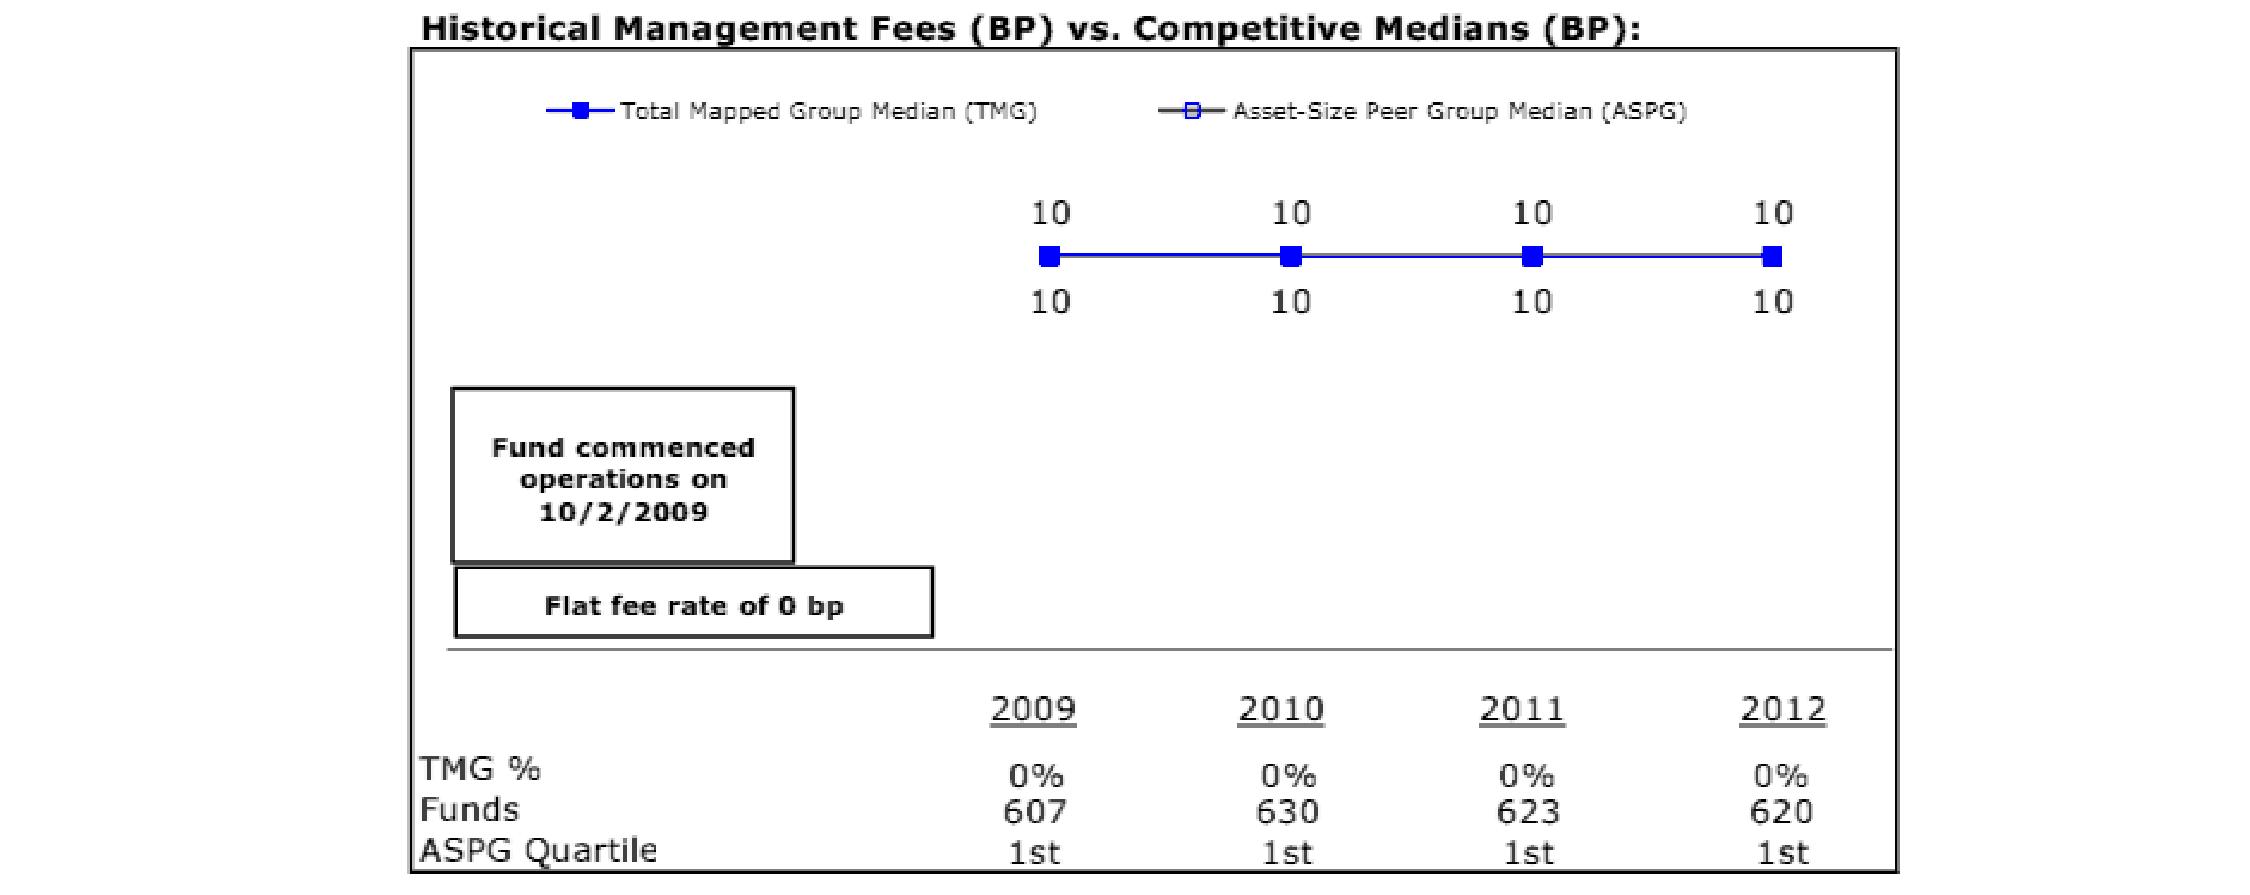
Semiannual Report
Freedom Index 2030 Fund
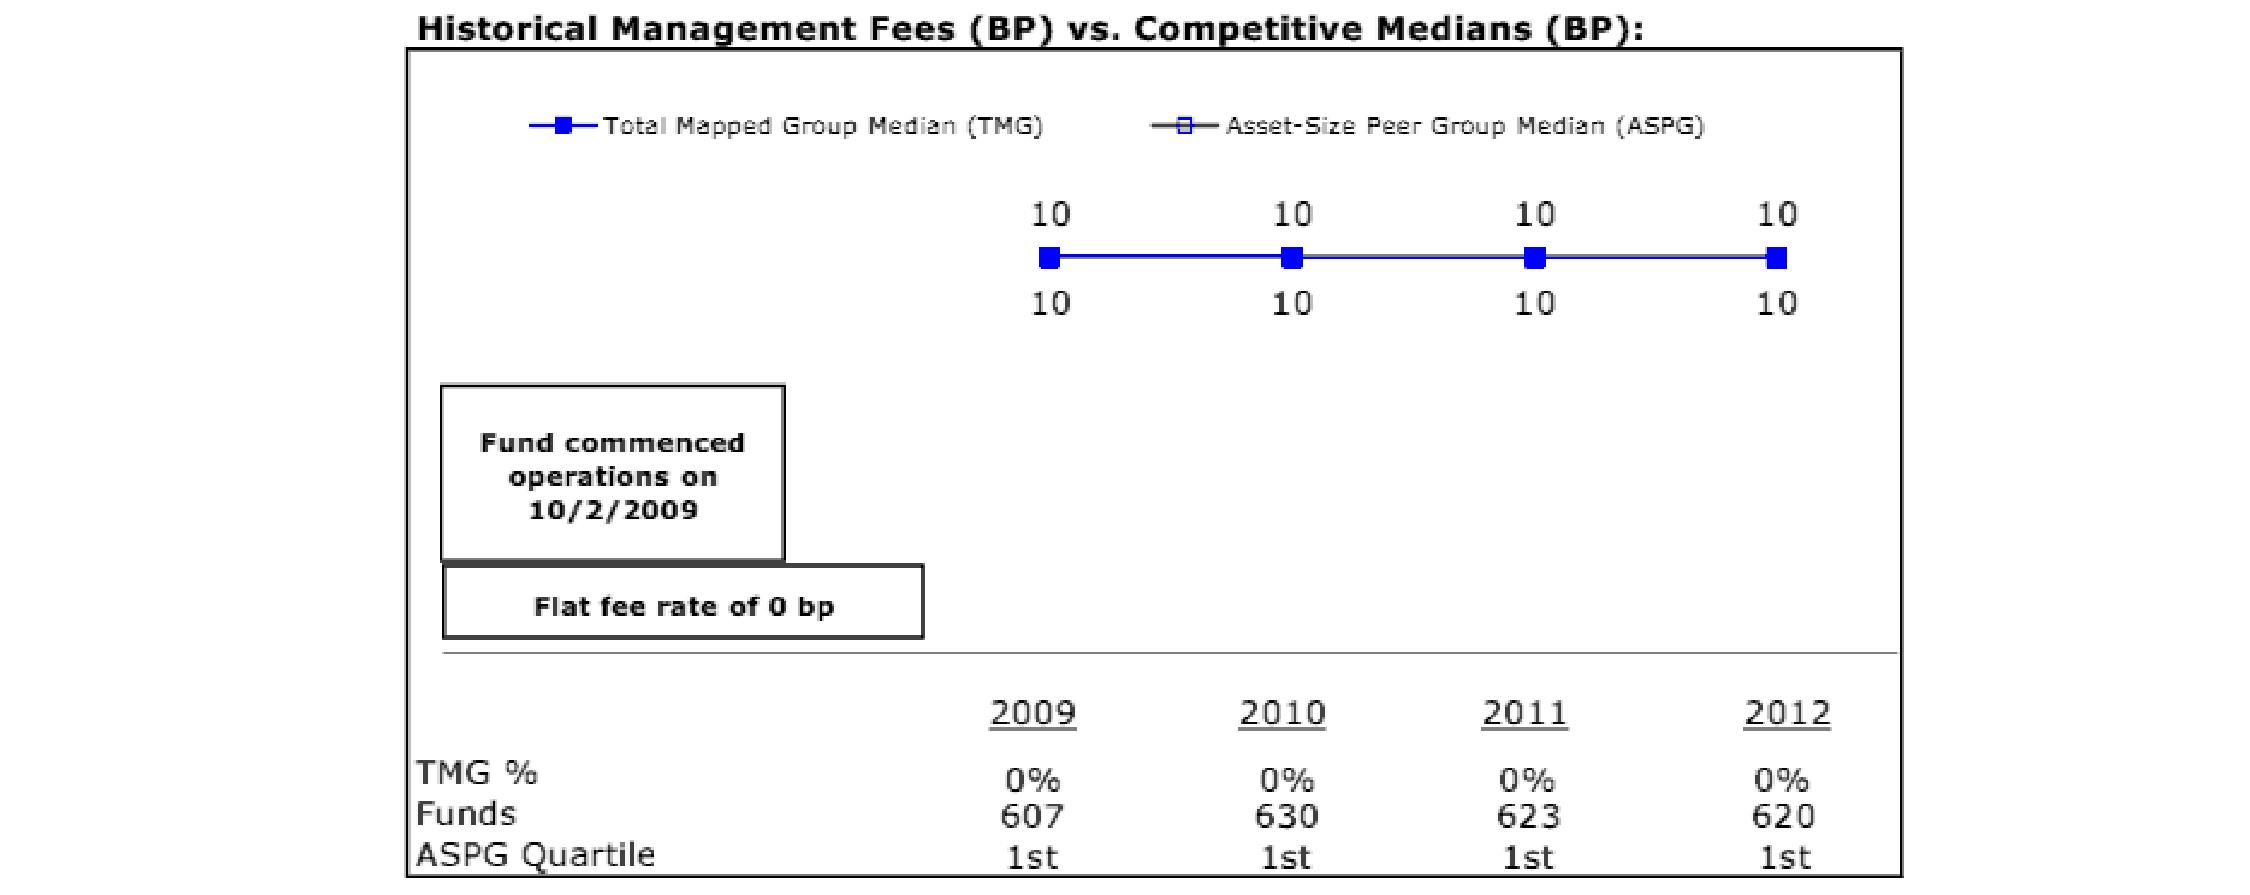
Freedom Index 2035 Fund
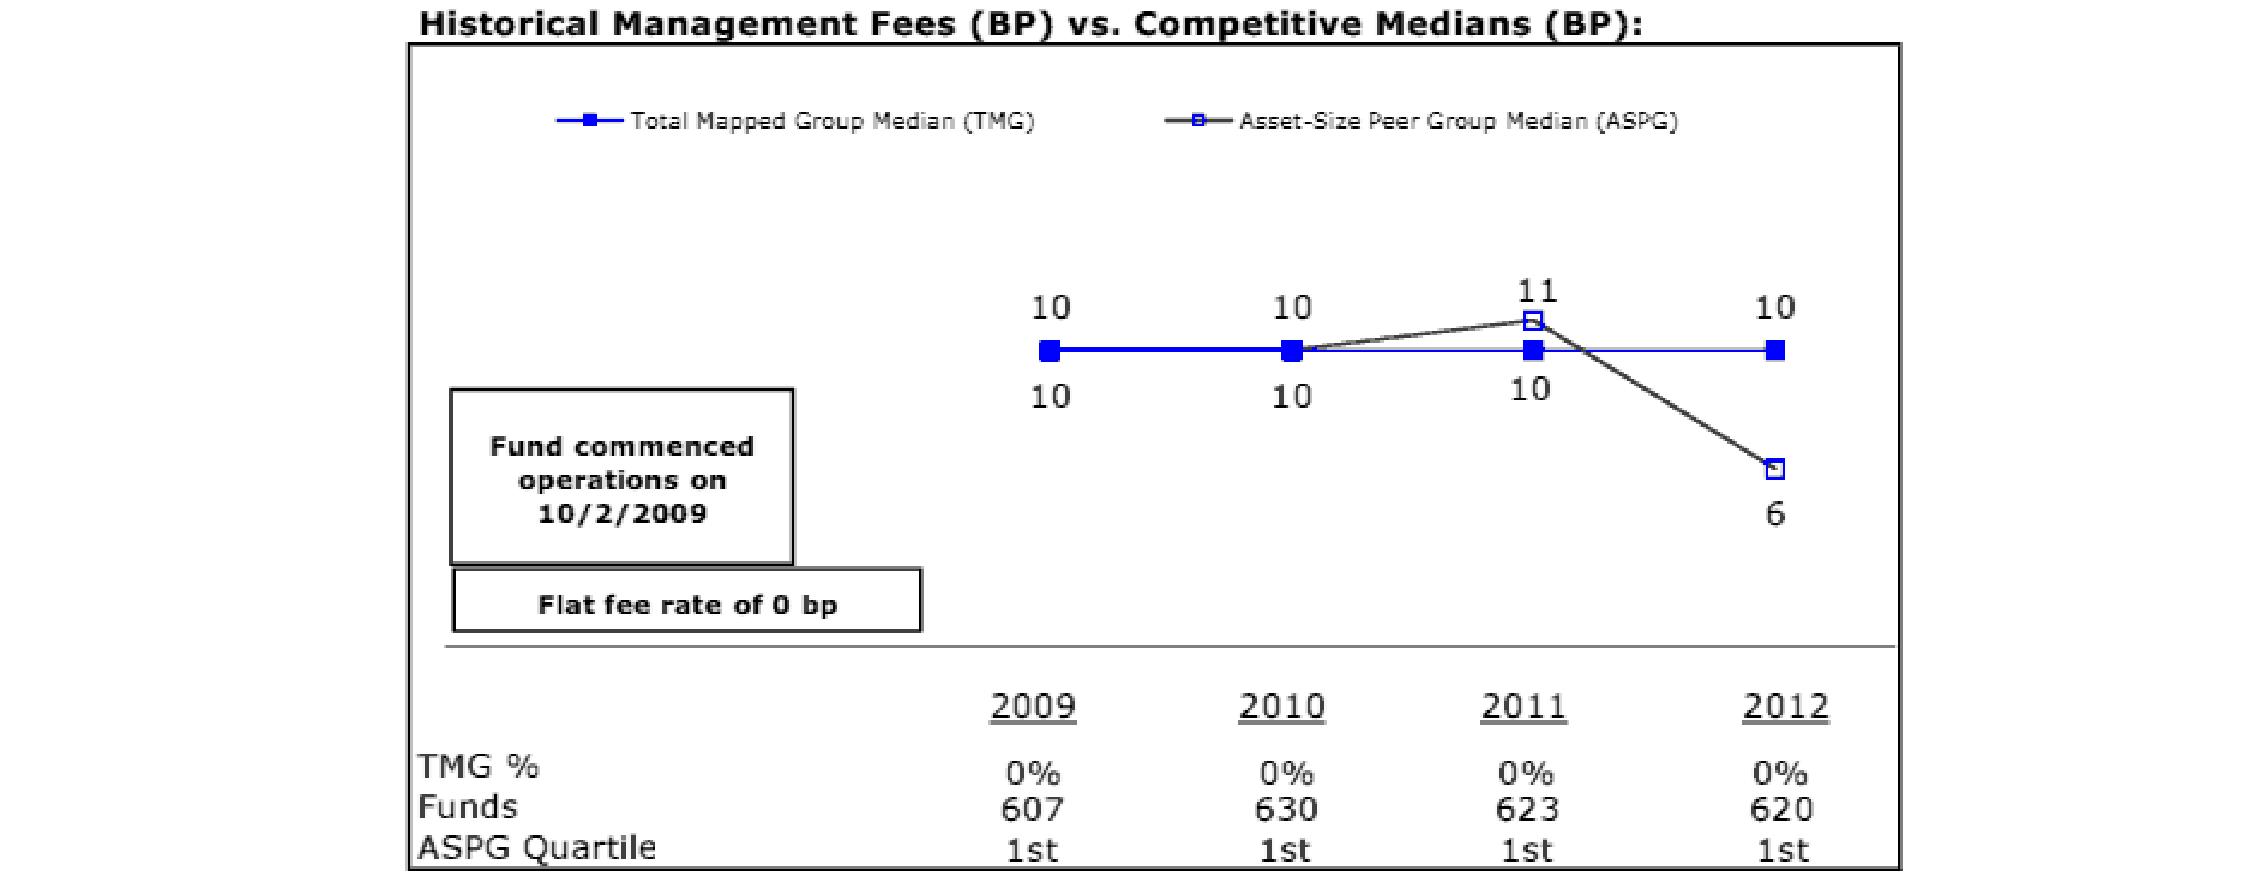
Semiannual Report
Board Approval of Investment Advisory Contracts and Management Fees - continued
Freedom Index 2040 Fund
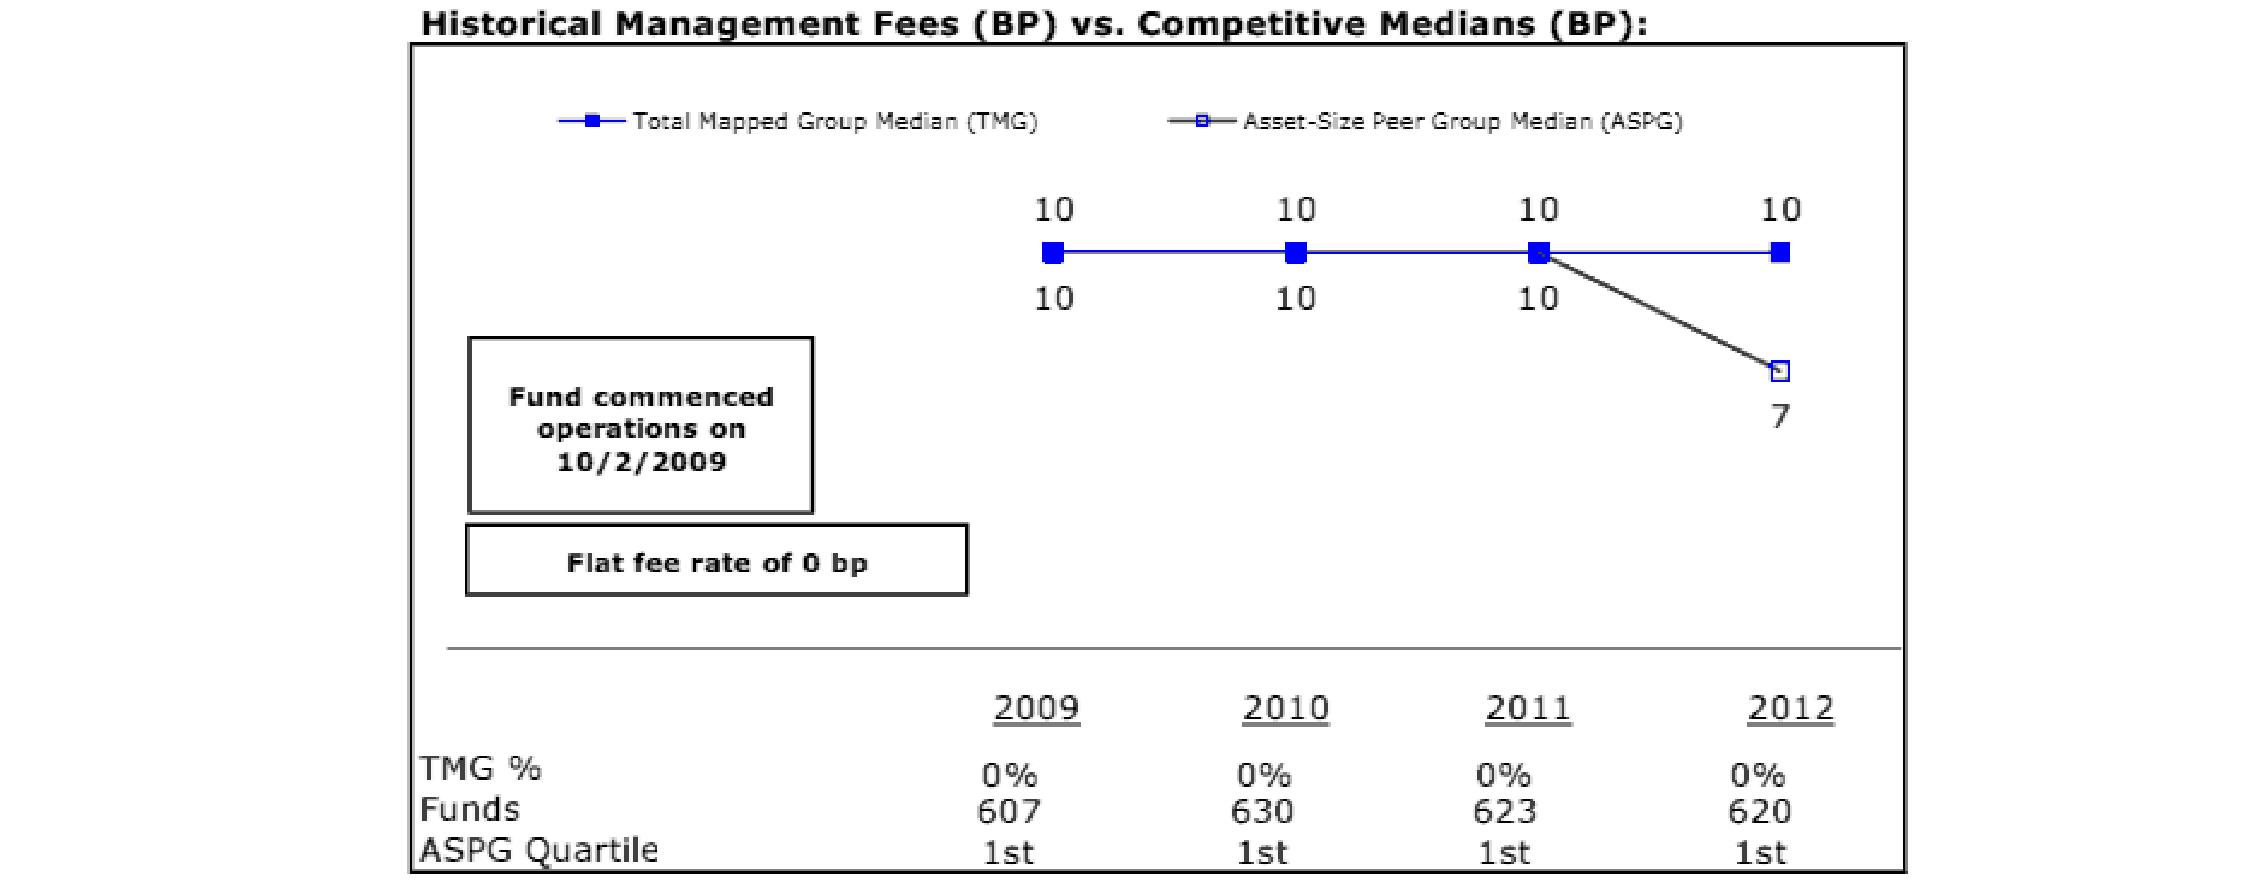
Freedom Index 2045 Fund

Semiannual Report
Freedom Index 2050 Fund
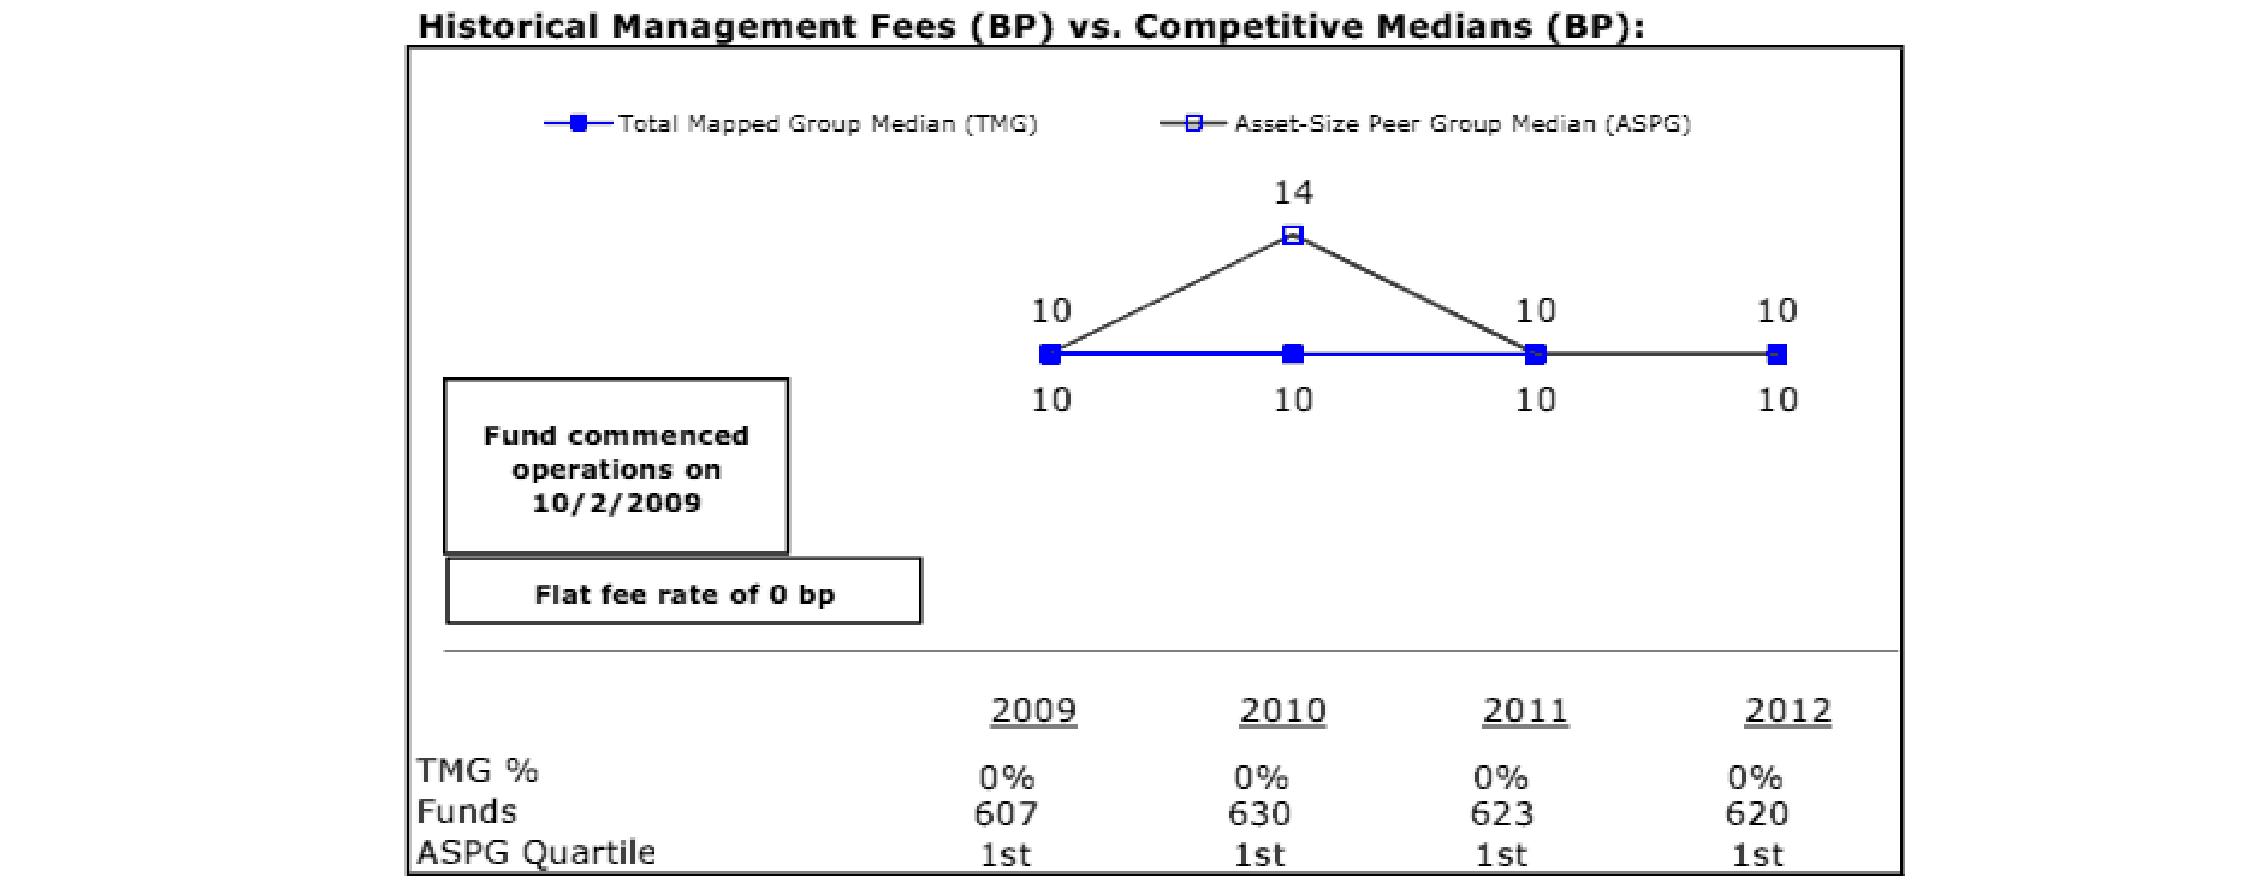
Freedom Index 2055 Fund
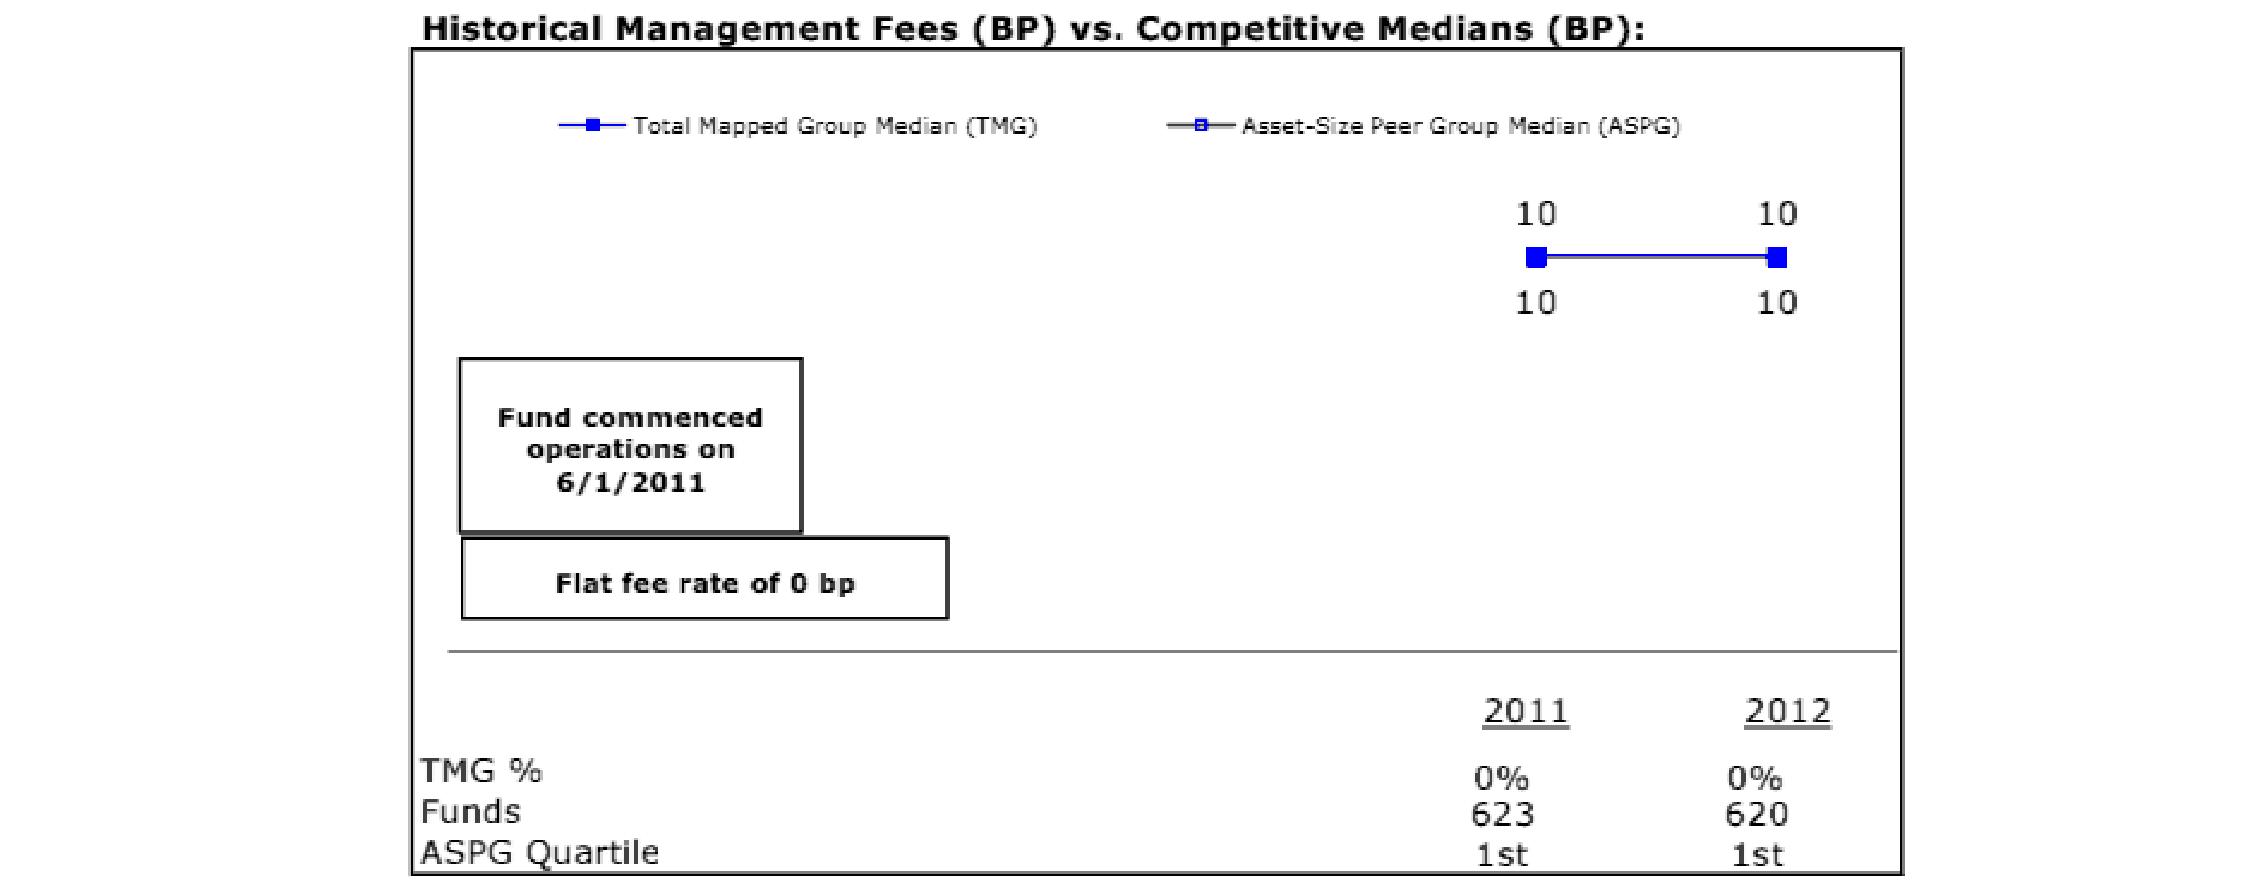
Semiannual Report
Board Approval of Investment Advisory Contracts and Management Fees - continued
Freedom Index Income Fund
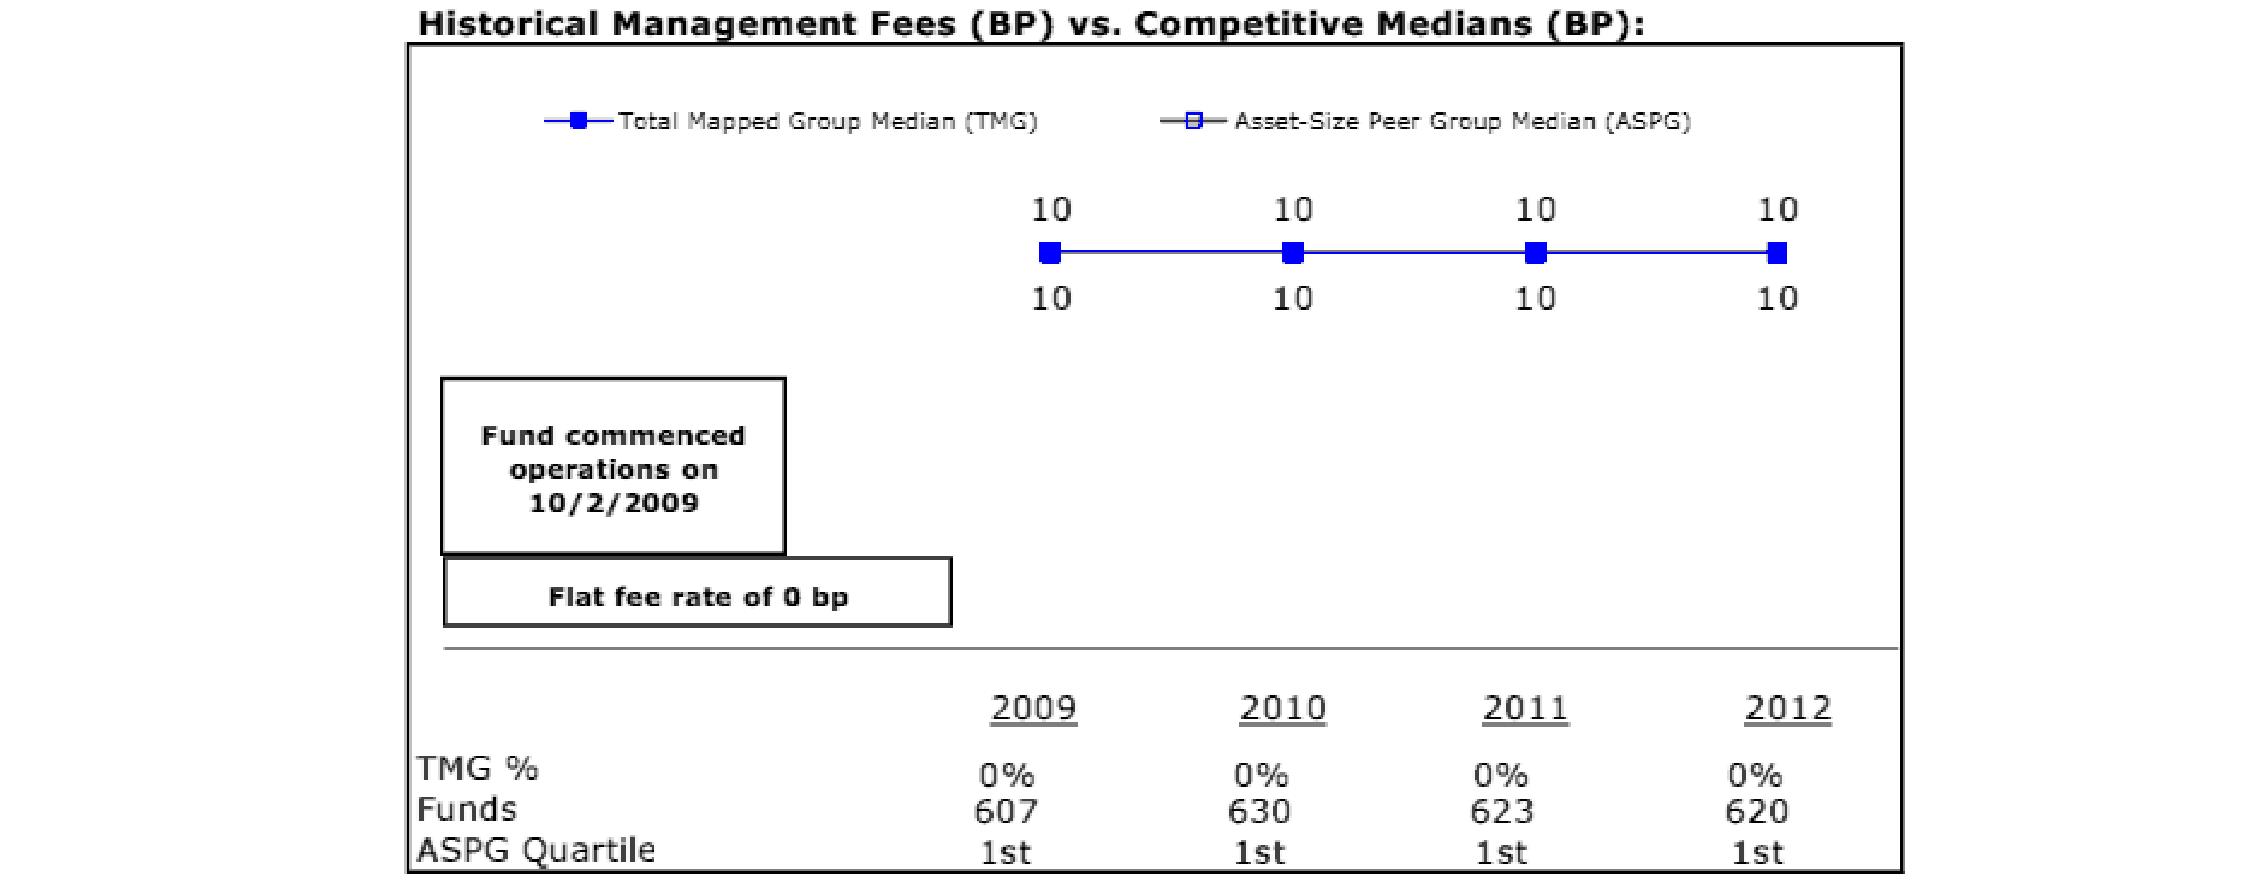
The Board noted that each fund's management fee rate of 0.00% ranked below the median of its Total Mapped Group and below the median of its ASPG for 2012. The Board further noted that many peer funds pay fund-level expenses, including management fees, to which the funds are not subject.
Based on its review, the Board concluded that each fund's management fee is fair and reasonable in light of the services that the fund receives and the other factors considered.
Total Expense Ratio. In its review of each fund's total expense ratio, the Board considered that the funds pay transfer agent fees. The Board further noted that Fidelity Management & Research Company (FMR) pays all other expenses of each fund, with limited exceptions.
The Board noted that each fund's total expense ratio ranked below its competitive median for 2012.
The Board further considered that FMR contractually agreed to reimburse each fund to the extent that total expenses (including acquired fund fees and expenses, but excluding interest, taxes, brokerage commissions, and extraordinary expenses, if any, incurred by the fund or an acquired fund in which the fund invests), as a percentage of average net assets, exceed 0.19% through May 31, 2015.
Fees Charged to Other Fidelity Clients. The Board also considered Fidelity fee structures and other information with respect to clients of Fidelity, such as other mutual funds advised or subadvised by Fidelity, pension plan clients, and other institutional clients. The Board noted the findings of the 2013 ad hoc joint committee (created with the board of other Fidelity funds), which reviewed and compared Fidelity's institutional investment advisory business with its business of providing services to the Fidelity funds, including the differences in services provided, fees charged, and costs incurred, as well as competition in their respective marketplaces.
Based on its review of total expense ratios and fees charged to other Fidelity clients, the Board concluded that each fund's total expense ratio was reasonable in light of the services that the fund and its shareholders receive and the other factors considered.
Costs of the Services and Profitability. The Board considered the level of Fidelity's profits in respect of all the Fidelity funds, including the Fidelity funds in which the funds invest.
PricewaterhouseCoopers LLP (PwC), independent registered public accounting firm and auditor to Fidelity and certain Fidelity funds, has been engaged annually by the Board as part of the Board's assessment of Fidelity's profitability analysis. PwC's engagement includes the review and assessment of the methodologies used by Fidelity in determining the revenues and expenses attributable to Fidelity's mutual fund business, and completion of agreed-upon procedures surrounding the mathematical accuracy of fund profitability and its conformity to allocation methodologies. After considering PwC's reports issued under the engagement and information provided by Fidelity, the Board concluded that while other allocation methods may also be reasonable, Fidelity's profitability methodologies are reasonable in all material respects.
The Board also reviewed Fidelity's non-fund businesses and fall-out benefits related to the mutual fund business as well as cases where Fidelity's affiliates may benefit from or be related to the funds' business.
The Board concluded that the costs of the services provided by and the profits realized by Fidelity in connection with the operation of each fund were not relevant to the renewal of each fund's Advisory Contract because the funds do not pay management fees and FMR pays all other expenses of each fund, with limited exceptions.
Semiannual Report
Economies of Scale. The Board concluded that because the funds do not pay management fees and FMR pays all other expenses of each fund, with limited exceptions, economies of scale cannot be realized by the funds, but may be realized by the other Fidelity funds in which each fund invests.
Additional Information Requested by the Board. In order to develop fully the factual basis for consideration of the Fidelity funds' Advisory Contracts, the Board requested and received additional information on certain topics, including: (i) Fidelity's fund profitability methodology, profitability trends for certain funds, and the impact of certain factors on fund profitability results; (ii) portfolio manager changes that have occurred during the past year and the amount of the investment that each portfolio manager has made in the Fidelity fund(s) that he or she manages; (iii) Fidelity's compensation structure for portfolio managers, research analysts, and other key personnel, including its effects on fund profitability, the rationale for the compensation structure, and the extent to which current market conditions have affected retention and recruitment; (iv) the arrangements with and compensation paid to certain fund sub-advisers on behalf of the Fidelity funds; (v) Fidelity's fee structures, including the group fee structure and definition of group assets, and the rationale for recommending different fees among different categories of funds and classes; (vi) Fidelity's voluntary waiver of its fees to maintain minimum yields for certain money market funds and classes as well as contractual waivers in place for certain funds; (vii) the methodology with respect to competitive fund data and peer group classifications; (viii) Fidelity's transfer agent fee, expense, and service structures for different funds and classes, and the impact of the increased use of omnibus accounts; and (ix) explanations regarding the relative total expense ratios of certain funds and classes, total expense competitive trends and methodologies for total expense competitive comparisons, and actions that might be taken by Fidelity to reduce total expense ratios for certain funds and classes or to achieve further economies of scale.
Based on its evaluation of all of the conclusions noted above, and after considering all factors it believed relevant, the Board ultimately concluded that the advisory fee structures are fair and reasonable, and that each fund's Advisory Contract should be renewed.
Semiannual Report
Semiannual Report
Investment Adviser
Strategic Advisers, Inc.
Boston, MA
Administrator
Fidelity Management & Research Company
Boston, MA
General Distributor
Fidelity Distributors Corporation
Smithfield, RI
Transfer and Service Agents
Fidelity Investments Institutional
Operations Company, Inc.
Boston, MA
Fidelity Service Company, Inc.
Boston, MA
Custodians
JPMorgan Chase Bank
New York, NY
Income, 2000, 2005, 2010, 2015, 2020, 2025, 2030, 2035, 2040, 2045, 2050
The Bank of New York Mellon
New York, NY
2055

FRX-W-USAN-1113
1.899266.103
Item 2. Code of Ethics
Not applicable.
Item 3. Audit Committee Financial Expert
Not applicable.
Item 4. Principal Accountant Fees and Services
Not applicable.
Item 5. Audit Committee of Listed Registrants
Not applicable.
Item 6. Investments
(a) Not applicable.
(b) Not applicable
Item 7. Disclosure of Proxy Voting Policies and Procedures for Closed-End Management Investment Companies
Not applicable.
Item 8. Portfolio Managers of Closed-End Management Investment Companies
Not applicable.
Item 9. Purchase of Equity Securities by Closed-End Management Investment Company and Affiliated Purchasers
Not applicable.
Item 10. Submission of Matters to a Vote of Security Holders
There were no material changes to the procedures by which shareholders may recommend nominees to the Fidelity Aberdeen Street Trust's Board of Trustees.
Item 11. Controls and Procedures
(a)(i) The President and Treasurer and the Chief Financial Officer have concluded that the Fidelity Aberdeen Street Trust's (the "Trust") disclosure controls and procedures (as defined in Rule 30a-3(c) under the Investment Company Act) provide reasonable assurances that material information relating to the Trust is made known to them by the appropriate persons, based on their evaluation of these controls and procedures as of a date within 90 days of the filing date of this report.
(a)(ii) There was no change in the Trust's internal control over financial reporting (as defined in Rule 30a-3(d) under the Investment Company Act) that occurred during the second fiscal quarter of the period covered by this report that has materially affected, or is reasonably likely to materially affect, the Trust's internal control over financial reporting.
Item 12. Exhibits
(a) | (1) | Not applicable. |
(a) | (2) | Certification pursuant to Rule 30a-2(a) under the Investment Company Act of 1940 (17 CFR 270.30a-2(a)) is filed and attached hereto as Exhibit 99.CERT. |
(a) | (3) | Not applicable. |
(b) | | Certification pursuant to Rule 30a-2(b) under the Investment Company Act of 1940 (17 CFR 270.30a-2(b)) is furnished and attached hereto as Exhibit 99.906CERT. |
SIGNATURES
Pursuant to the requirements of the Securities Exchange Act of 1934 and the Investment Company Act of 1940, the registrant has duly caused this report to be signed on its behalf by the undersigned, thereunto duly authorized.
Fidelity Aberdeen Street Trust
By: | /s/Stephanie J. Dorsey |
| Stephanie J. Dorsey |
| President and Treasurer |
| |
Date: | November 25, 2013 |
Pursuant to the requirements of the Securities Exchange Act of 1934 and the Investment Company Act of 1940, this report has been signed below by the following persons on behalf of the registrant and in the capacities and on the dates indicated.
By: | /s/Stephanie J. Dorsey |
| Stephanie J. Dorsey |
| President and Treasurer |
| |
Date: | November 25, 2013 |
By: | /s/Christine Reynolds |
| Christine Reynolds |
| Chief Financial Officer |
| |
Date: | November 25, 2013 |