UNITED STATES
SECURITIES AND EXCHANGE COMMISSION
Washington, D.C. 20549
FORM N-CSR
CERTIFIED SHAREHOLDER REPORT OF REGISTERED
MANAGEMENT INVESTMENT COMPANIES
Investment Company Act file number 811-6440
Fidelity Aberdeen Street Trust
(Exact name of registrant as specified in charter)
245 Summer St., Boston, Massachusetts 02210
(Address of principal executive offices) (Zip code)
Scott C. Goebel, Secretary
245 Summer St.
Boston, Massachusetts 02210
(Name and address of agent for service)
Registrant's telephone number, including area code: 617-563-7000
Date of fiscal year end: | March 31 |
| |
Date of reporting period: | March 31, 2015 |
This report on Form N-CSR relates solely to the Registrant's Fidelity Freedom Index Income Fund, Fidelity Freedom Index 2005 Fund, Fidelity Freedom Index 2010 Fund, Fidelity Freedom Index 2015 Fund, Fidelity Freedom Index 2020 Fund, Fidelity Freedom Index 2025 Fund, Fidelity Freedom Index 2030 Fund, Fidelity Freedom Index 2035 Fund, Fidelity Freedom Index 2040 Fund, Fidelity Freedom Index 2045 Fund, Fidelity Freedom Index 2050 Fund, Fidelity Freedom Index 2055 Fund, Fidelity Freedom Index 2060 Fund, Fidelity Freedom Income Fund, Fidelity Freedom 2005 Fund, Fidelity Freedom 2010 Fund, Fidelity Freedom 2015 Fund, Fidelity Freedom 2020 Fund, Fidelity Freedom 2025 Fund, Fidelity Freedom 2030 Fund, Fidelity Freedom 2035 Fund, Fidelity Freedom 2040 Fund, Fidelity Freedom 2045 Fund, Fidelity Freedom 2050 Fund, Fidelity Freedom 2055 Fund, Fidelity Freedom 2060 Fund, Fidelity Freedom K® Income Fund, Fidelity Freedom K® 2005 Fund, Fidelity Freedom K® 2010 Fund, Fidelity Freedom K® 2015 Fund, Fidelity Freedom K® 2020 Fund, Fidelity Freedom K® 2025 Fund, Fidelity Freedom K® 2030 Fund, Fidelity Freedom K® 2035 Fund, Fidelity Freedom K® 2040 Fund, Fidelity Freedom K® 2045 Fund, Fidelity Freedom K® 2050 Fund, Fidelity Freedom K® 2055 Fund and Fidelity Freedom K® 2060 Fund series (each, a "Fund" and collectively, the "Funds").
Item 1. Reports to Stockholders
ContentsPerformance: The Bottom LinePerformance: The Bottom LinePerformance: The Bottom LinePerformance: The Bottom LinePerformance: The Bottom LinePerformance: The Bottom LinePerformance: The Bottom LinePerformance: The Bottom LinePerformance: The Bottom LinePerformance: The Bottom LinePerformance: The Bottom LinePerformance: The Bottom LinePerformance: The Bottom LineManagement's Discussion of Fund PerformanceShareholder Expense ExampleInvestment Changes (Unaudited)Investments March 31, 2015Financial StatementsInvestment Changes (Unaudited)Investments March 31, 2015Financial StatementsInvestment Changes (Unaudited)Investments March 31, 2015Financial StatementsInvestment Changes (Unaudited)Investments March 31, 2015Financial StatementsInvestment Changes (Unaudited)Investments March 31, 2015Financial StatementsInvestment Changes (Unaudited)Investments March 31, 2015Financial StatementsInvestment Changes (Unaudited)Investments March 31, 2015Financial StatementsInvestment Changes (Unaudited)Investments March 31, 2015Financial StatementsInvestment Changes (Unaudited)Investments March 31, 2015Financial StatementsInvestment Changes (Unaudited)Investments March 31, 2015Financial StatementsInvestment Changes (Unaudited)Investments March 31, 2015Financial StatementsInvestment Changes (Unaudited)Investments March 31, 2015Financial StatementsInvestment Changes (Unaudited)Investments March 31, 2015Financial StatementsNotes to Financial StatementsReport of Independent Registered Public Accounting FirmTrustees and OfficersDistributions (Unaudited)1.
Fidelity Freedom K® Funds -
Income, 2005, 2010, 2015, 2020, 2025, 2030, 2035, 2040, 2045, 2050, 2055, 2060
Annual Report
March 31, 2015
(Fidelity Cover Art)
Contents
To view a fund's proxy voting guidelines and proxy voting record for the 12-month period ended June 30, visit http://www.fidelity.com/proxyvotingresults or visit the Securities and Exchange Commission's (SEC) web site at http://www.sec.gov. You may also call 1-800-835-5092 to request a free copy of the proxy voting guidelines.
Standard & Poor's, S&P and S&P 500 are registered service marks of The McGraw-Hill Companies, Inc. and have been licensed for use by Fidelity Distributors Corporation.
Other third-party marks appearing herein are the property of their respective owners.
All other marks appearing herein are registered or unregistered trademarks or service marks of FMR LLC or an affiliated company. © 2015 FMR LLC. All rights reserved.
This report and the financial statements contained herein are submitted for the general information of the shareholders of the funds. This report is not authorized for distribution to prospective investors in the funds unless preceded or accompanied by an effective prospectus.
A fund files its complete schedule of portfolio holdings with the SEC for the first and third quarters of each fiscal year on Form N-Q. Forms N-Q are available on the SEC's web site at http://www.sec.gov. A fund's Forms N-Q may be reviewed and copied at the SEC's Public Reference Room in Washington, DC. Information regarding the operation of the SEC's Public Reference Room may be obtained by calling 1-800-SEC-0330. For a complete list of a fund's portfolio holdings, view the most recent holdings listing, semiannual report, or annual report on Fidelity's web site at http://www.fidelity.com, http://www.advisor.fidelity.com, or http://www.401k.com, as applicable.
NOT FDIC INSURED • MAY LOSE VALUE • NO BANK GUARANTEE
Neither the funds nor Fidelity Distributors Corporation is a bank.
Annual Report
Fidelity Freedom K® Income Fund
Average annual total return reflects the change in the value of an investment, assuming reinvestment of the fund's distributions from dividend income and capital gains (the profits earned upon the sale of securities that have grown in value, if any) and assuming a constant rate of performance each year. The $10,000 table and the fund's returns do not reflect the deduction of taxes that a shareholder would pay on fund distributions or the redemption of fund shares. During periods of reimbursement by Fidelity, a fund's total return will be greater than it would be had the reimbursement not occurred. How a fund did yesterday is no guarantee of how it will do tomorrow.
Average Annual Total Returns
Periods ended March 31, 2015 | Past 1
year | Past 5
years | Life of
fund A |
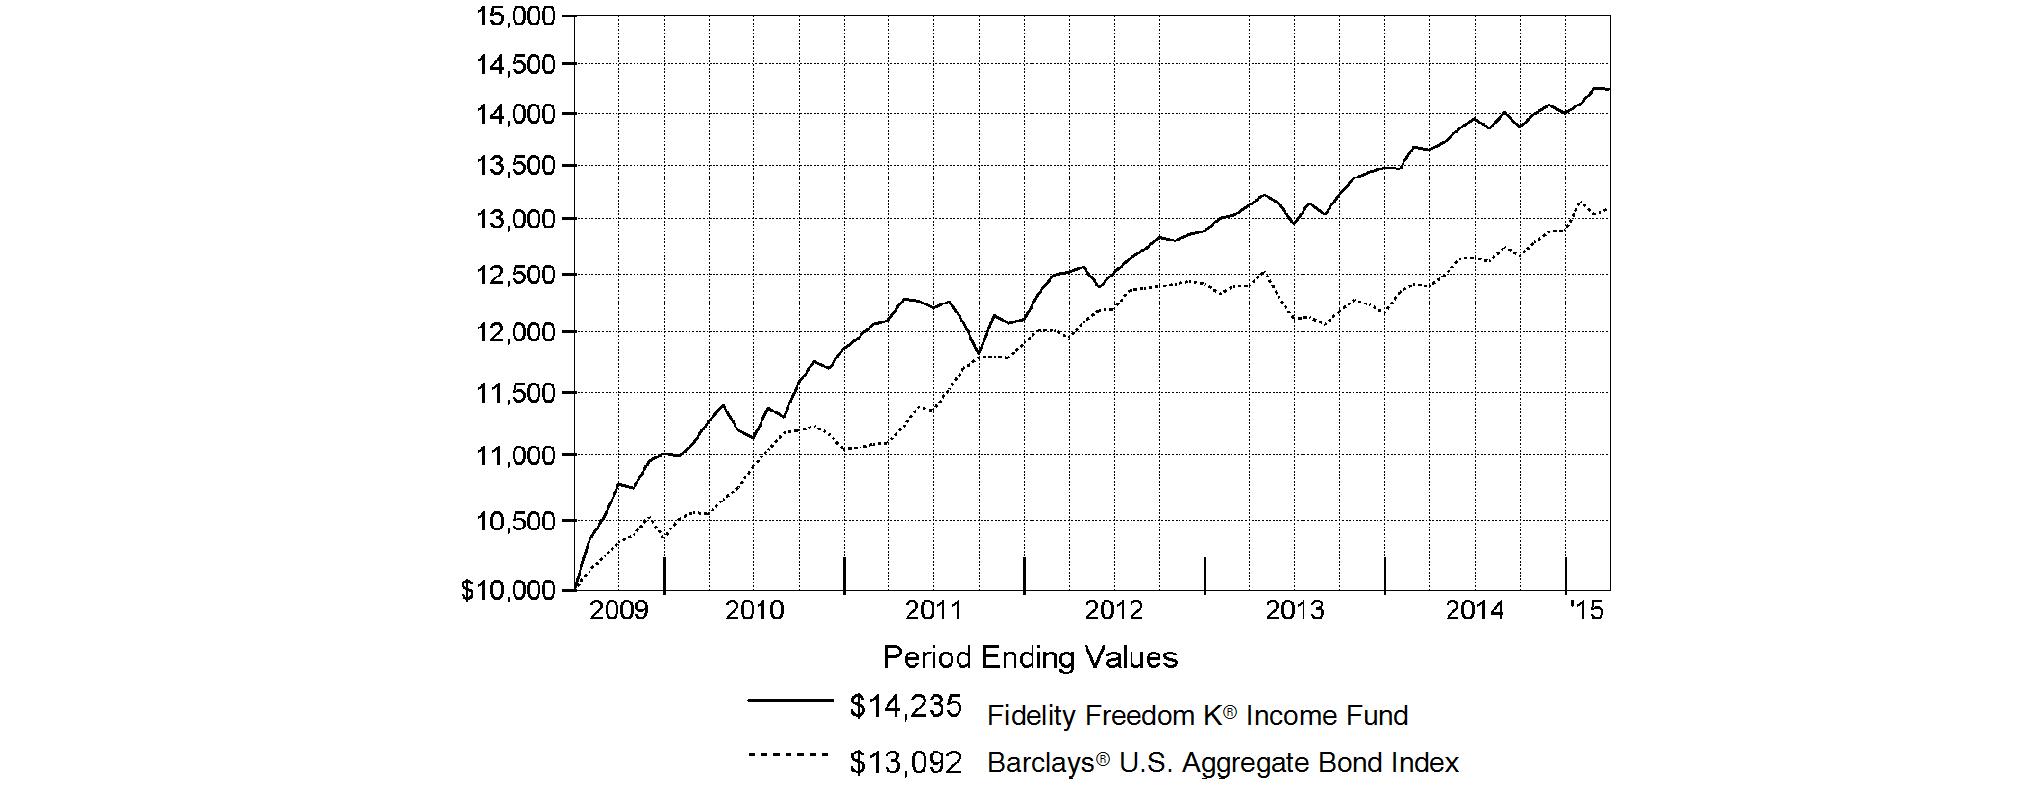
Fidelity Freedom K® Income Fund | 4.28% | 4.79% | 6.34% |
A From July 2, 2009.
$10,000 Over Life of Fund
Let's say hypothetically that $10,000 was invested in Fidelity Freedom K® Income Fund on July 2, 2009, when the fund started. The chart shows how the value of your investment would have changed, and also shows how the Barclays® U.S. Aggregate Bond Index performed over the same period.
Annual Report
Fidelity Freedom K® 2005 Fund
Performance: The Bottom Line
Average annual total return reflects the change in the value of an investment, assuming reinvestment of the fund's distributions from dividend income and capital gains (the profits earned upon the sale of securities that have grown in value, if any) and assuming a constant rate of performance each year. The $10,000 table and the fund's returns do not reflect the deduction of taxes that a shareholder would pay on fund distributions or the redemption of fund shares. During periods of reimbursement by Fidelity, a fund's total return will be greater than it would be had the reimbursement not occurred. How a fund did yesterday is no guarantee of how it will do tomorrow.
Average Annual Total Returns
Periods ended March 31, 2015 | Past 1
year | Past 5
years | Life of
fund A |
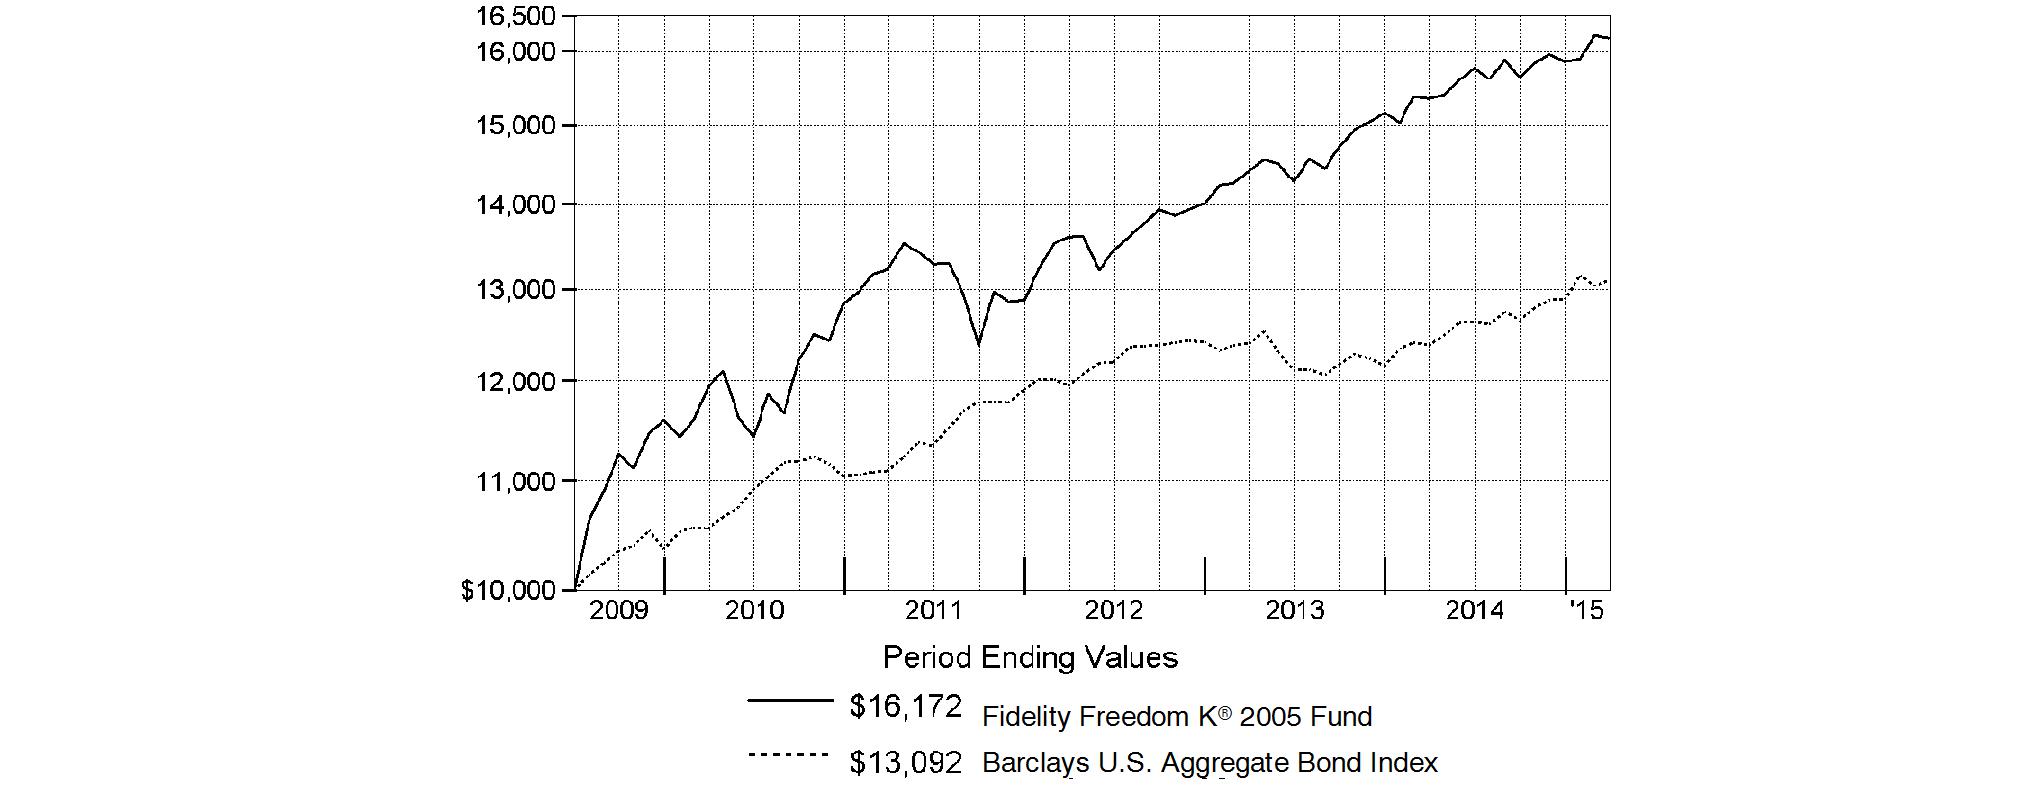
Fidelity Freedom K® 2005 Fund | 5.33% | 6.25% | 8.72% |
A From July 2, 2009.
$10,000 Over Life of Fund
Let's say hypothetically that $10,000 was invested in Fidelity Freedom K® 2005 Fund on July 2, 2009, when the fund started. The chart shows how the value of your investment would have changed, and also shows how the Barclays U.S. Aggregate Bond Index performed over the same period.
Annual Report
Fidelity Freedom K® 2010 Fund
Performance: The Bottom Line
Average annual total return reflects the change in the value of an investment, assuming reinvestment of the fund's distributions from dividend income and capital gains (the profits earned upon the sale of securities that have grown in value, if any) and assuming a constant rate of performance each year. The $10,000 table and the fund's returns do not reflect the deduction of taxes that a shareholder would pay on fund distributions or the redemption of fund shares. During periods of reimbursement by Fidelity, a fund's total return will be greater than it would be had the reimbursement not occurred. How a fund did yesterday is no guarantee of how it will do tomorrow.
Average Annual Total Returns
Periods ended March 31, 2015 | Past 1
year | Past 5
years | Life of
fund A |
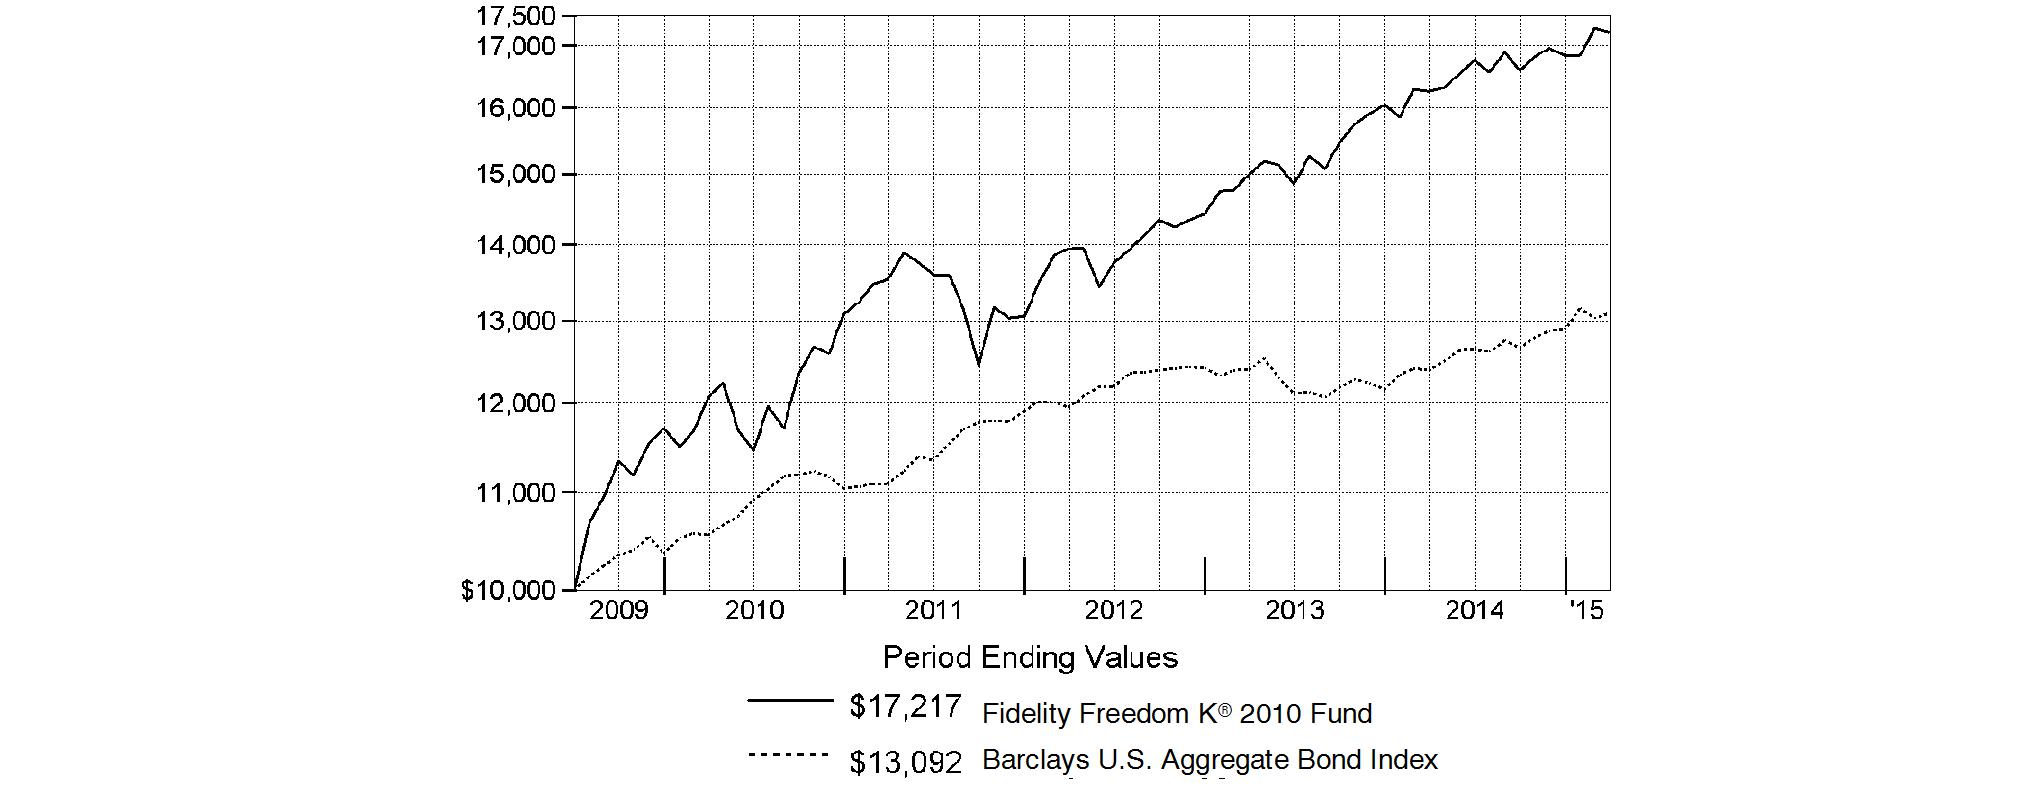
Fidelity Freedom K® 2010 Fund | 5.96% | 7.37% | 9.91% |
A From July 2, 2009.
$10,000 Over Life of Fund
Let's say hypothetically that $10,000 was invested in Fidelity Freedom K® 2010 Fund on July 2, 2009, when the fund started. The chart shows how the value of your investment would have changed, and also shows how the Barclays U.S. Aggregate Bond Index performed over the same period.
Annual Report
Fidelity Freedom K® 2015 Fund
Performance: The Bottom Line
Average annual total return reflects the change in the value of an investment, assuming reinvestment of the fund's distributions from dividend income and capital gains (the profits earned upon the sale of securities that have grown in value, if any) and assuming a constant rate of performance each year. The $10,000 table and the fund's returns do not reflect the deduction of taxes that a shareholder would pay on fund distributions or the redemption of fund shares. During periods of reimbursement by Fidelity, a fund's total return will be greater than it would be had the reimbursement not occurred. How a fund did yesterday is no guarantee of how it will do tomorrow.
Average Annual Total Returns
Periods ended March 31, 2015 | Past 1
year | Past 5
years | Life of
fund A |
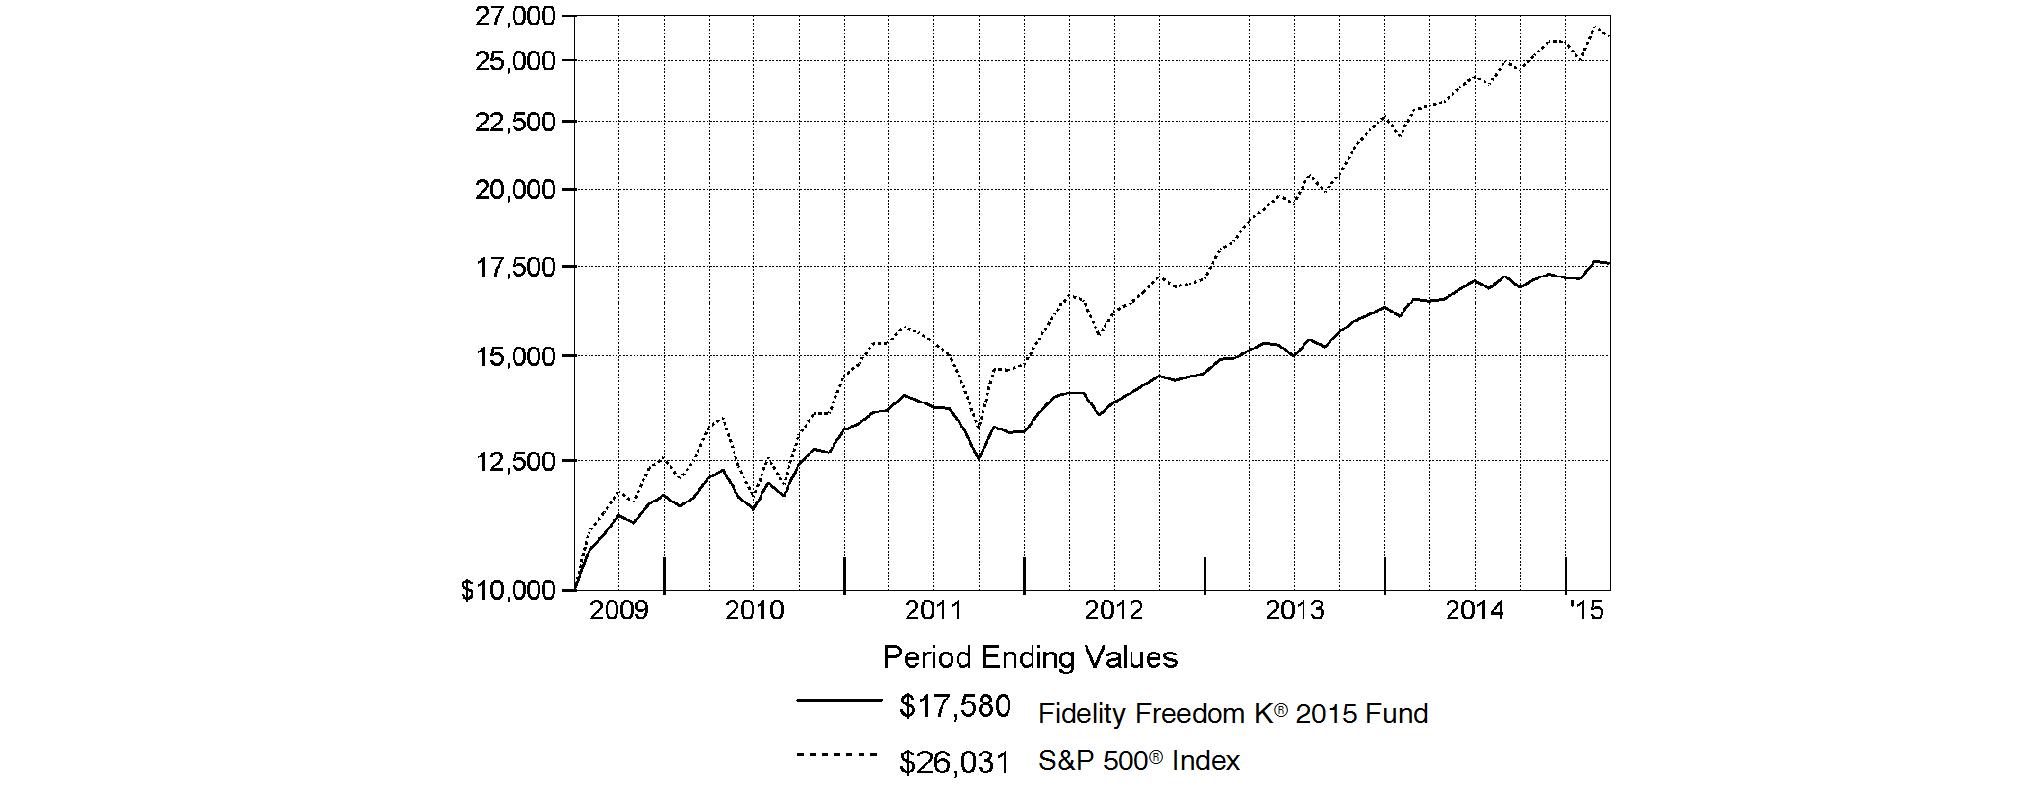
Fidelity Freedom K® 2015 Fund | 6.54% | 7.69% | 10.31% |
A From July 2, 2009.
$10,000 Over Life of Fund
Let's say hypothetically that $10,000 was invested in Fidelity Freedom K® 2015 Fund on July 2, 2009, when the fund started. The chart shows how the value of your investment would have changed, and also shows how the S&P 500® Index performed over the same period.
Annual Report
Fidelity Freedom K® 2020 Fund
Performance: The Bottom Line
Average annual total return reflects the change in the value of an investment, assuming reinvestment of the fund's distributions from dividend income and capital gains (the profits earned upon the sale of securities that have grown in value, if any) and assuming a constant rate of performance each year. The $10,000 table and the fund's returns do not reflect the deduction of taxes that a shareholder would pay on fund distributions or the redemption of fund shares. During periods of reimbursement by Fidelity, a fund's total return will be greater than it would be had the reimbursement not occurred. How a fund did yesterday is no guarantee of how it will do tomorrow.
Average Annual Total Returns
Periods ended March 31, 2015 | Past 1
year | Past 5
years | Life of
fund A |
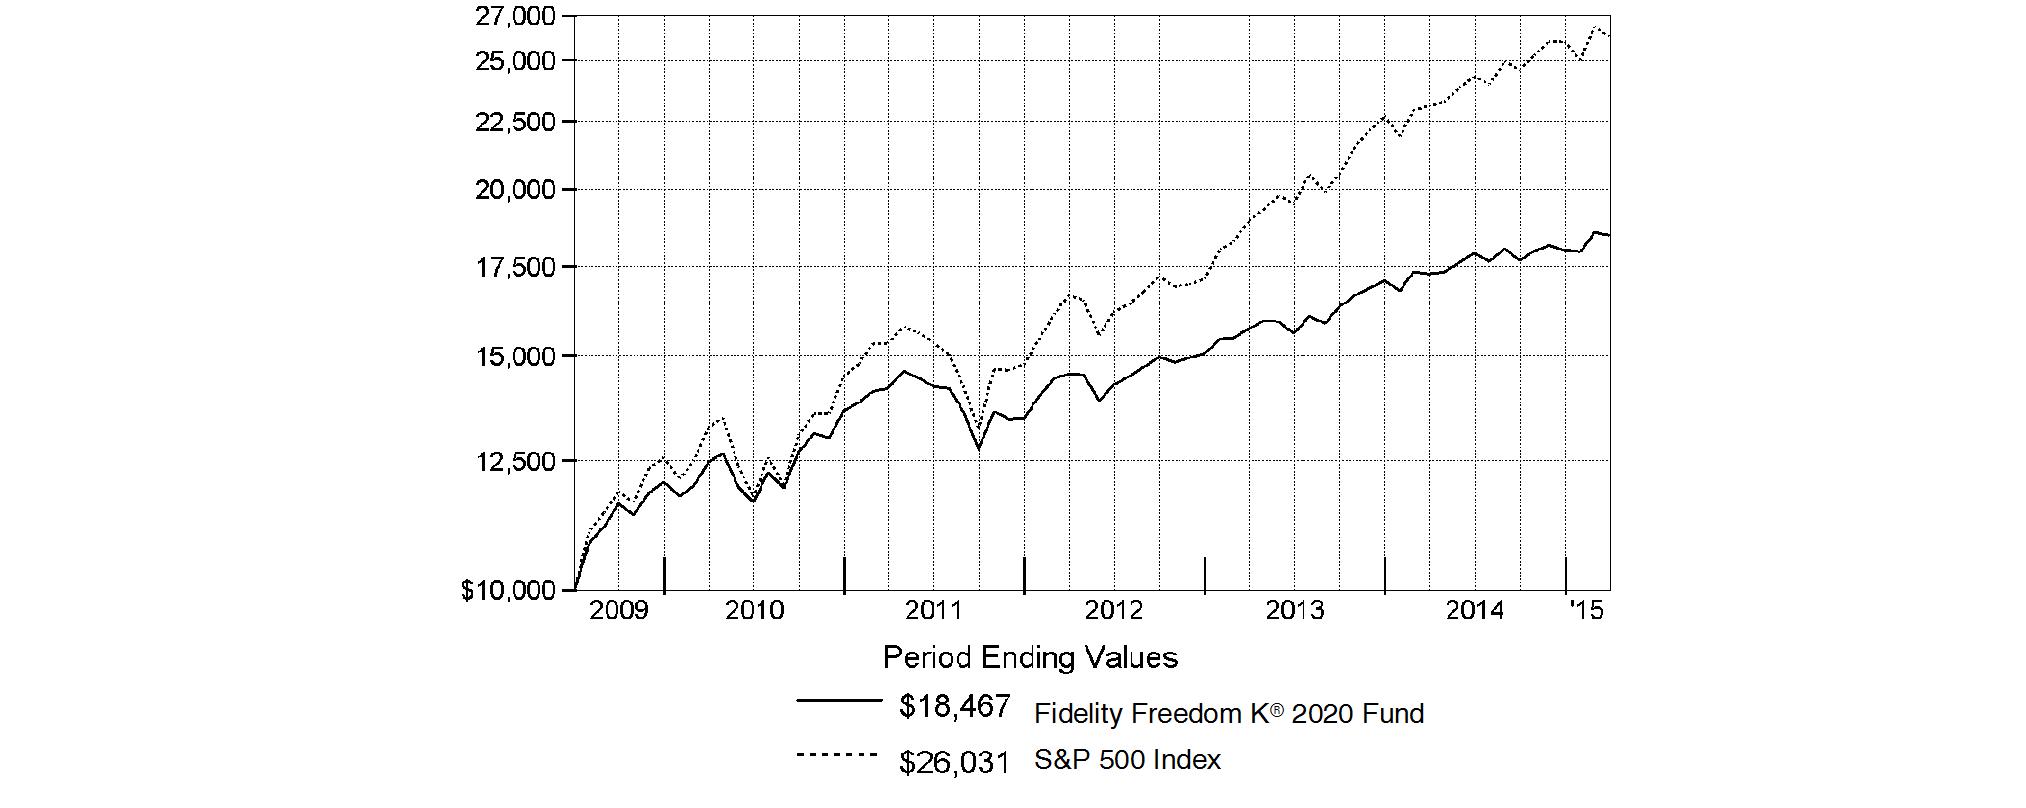
Fidelity Freedom K® 2020 Fund | 6.84% | 8.16% | 11.26% |
A From July 2, 2009.
$10,000 Over Life of Fund
Let's say hypothetically that $10,000 was invested in Fidelity Freedom K® 2020 Fund on July 2, 2009, when the fund started. The chart shows how the value of your investment would have changed, and also shows how the S&P 500 Index performed over the same period.
Annual Report
Fidelity Freedom K® 2025 Fund
Performance: The Bottom Line
Average annual total return reflects the change in the value of an investment, assuming reinvestment of the fund's distributions from dividend income and capital gains (the profits earned upon the sale of securities that have grown in value, if any) and assuming a constant rate of performance each year. The $10,000 table and the fund's returns do not reflect the deduction of taxes that a shareholder would pay on fund distributions or the redemption of fund shares. During periods of reimbursement by Fidelity, a fund's total return will be greater than it would be had the reimbursement not occurred. How a fund did yesterday is no guarantee of how it will do tomorrow.
Average Annual Total Returns
Periods ended March 31, 2015 | Past 1
year | Past 5
years | Life of
fund A |
Fidelity Freedom K® 2025 Fund | 7.35% | 8.99% | 12.24% |
A From July 2, 2009.
$10,000 Over Life of Fund
Let's say hypothetically that $10,000 was invested in Fidelity Freedom K® 2025 Fund on July 2, 2009, when the fund started. The chart shows how the value of your investment would have changed, and also shows how the S&P 500 Index performed over the same period.

Annual Report
Fidelity Freedom K® 2030 Fund
Performance: The Bottom Line
Average annual total return reflects the change in the value of an investment, assuming reinvestment of the fund's distributions from dividend income and capital gains (the profits earned upon the sale of securities that have grown in value, if any) and assuming a constant rate of performance each year. The $10,000 table and the fund's returns do not reflect the deduction of taxes that a shareholder would pay on fund distributions or the redemption of fund shares. During periods of reimbursement by Fidelity, a fund's total return will be greater than it would be had the reimbursement not occurred. How a fund did yesterday is no guarantee of how it will do tomorrow.
Average Annual Total Returns
Periods ended March 31, 2015 | Past 1
year | Past 5
years | Life of
fund A |
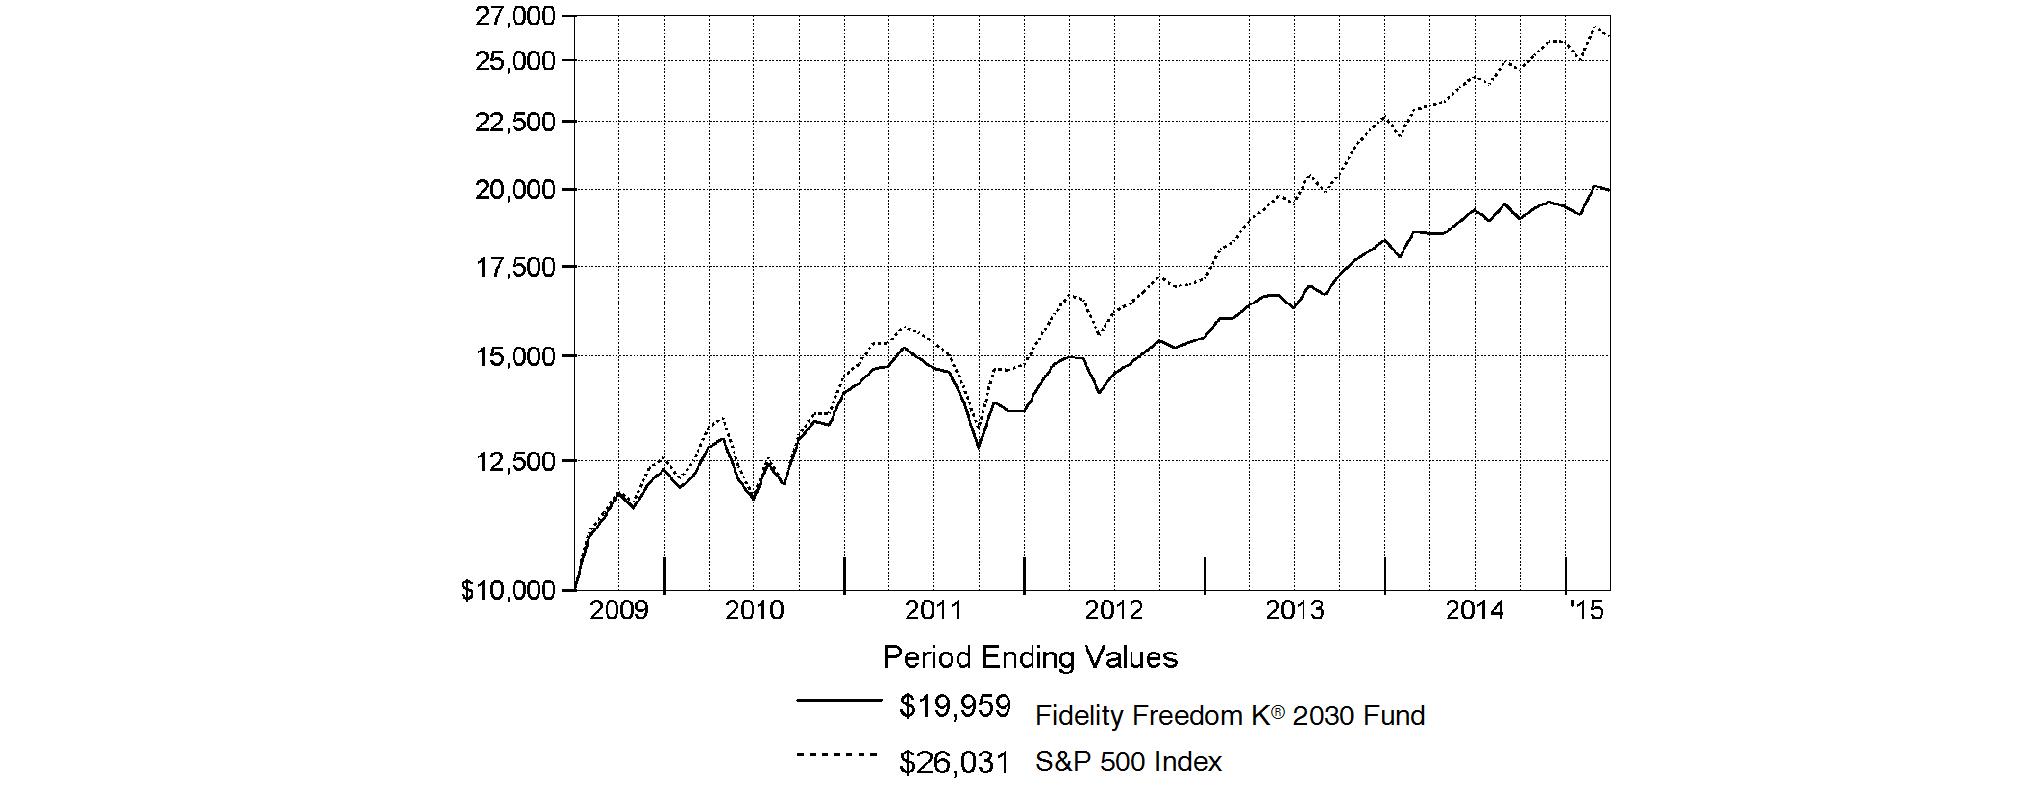
Fidelity Freedom K® 2030 Fund | 7.78% | 9.30% | 12.78% |
A From July 2, 2009.
$10,000 Over Life of Fund
Let's say hypothetically that $10,000 was invested in Fidelity Freedom K® 2030 Fund on July 2, 2009, when the fund started. The chart shows how the value of your investment would have changed, and also shows how the S&P 500 Index performed over the same period.
Annual Report
Fidelity Freedom K® 2035 Fund
Performance: The Bottom Line
Average annual total return reflects the change in the value of an investment, assuming reinvestment of the fund's distributions from dividend income and capital gains (the profits earned upon the sale of securities that have grown in value, if any) and assuming a constant rate of performance each year. The $10,000 table and the fund's returns do not reflect the deduction of taxes that a shareholder would pay on fund distributions or the redemption of fund shares. During periods of reimbursement by Fidelity, a fund's total return will be greater than it would be had the reimbursement not occurred. How a fund did yesterday is no guarantee of how it will do tomorrow.
Average Annual Total Returns
Periods ended March 31, 2015 | Past 1
year | Past 5
years | Life of
fund A |
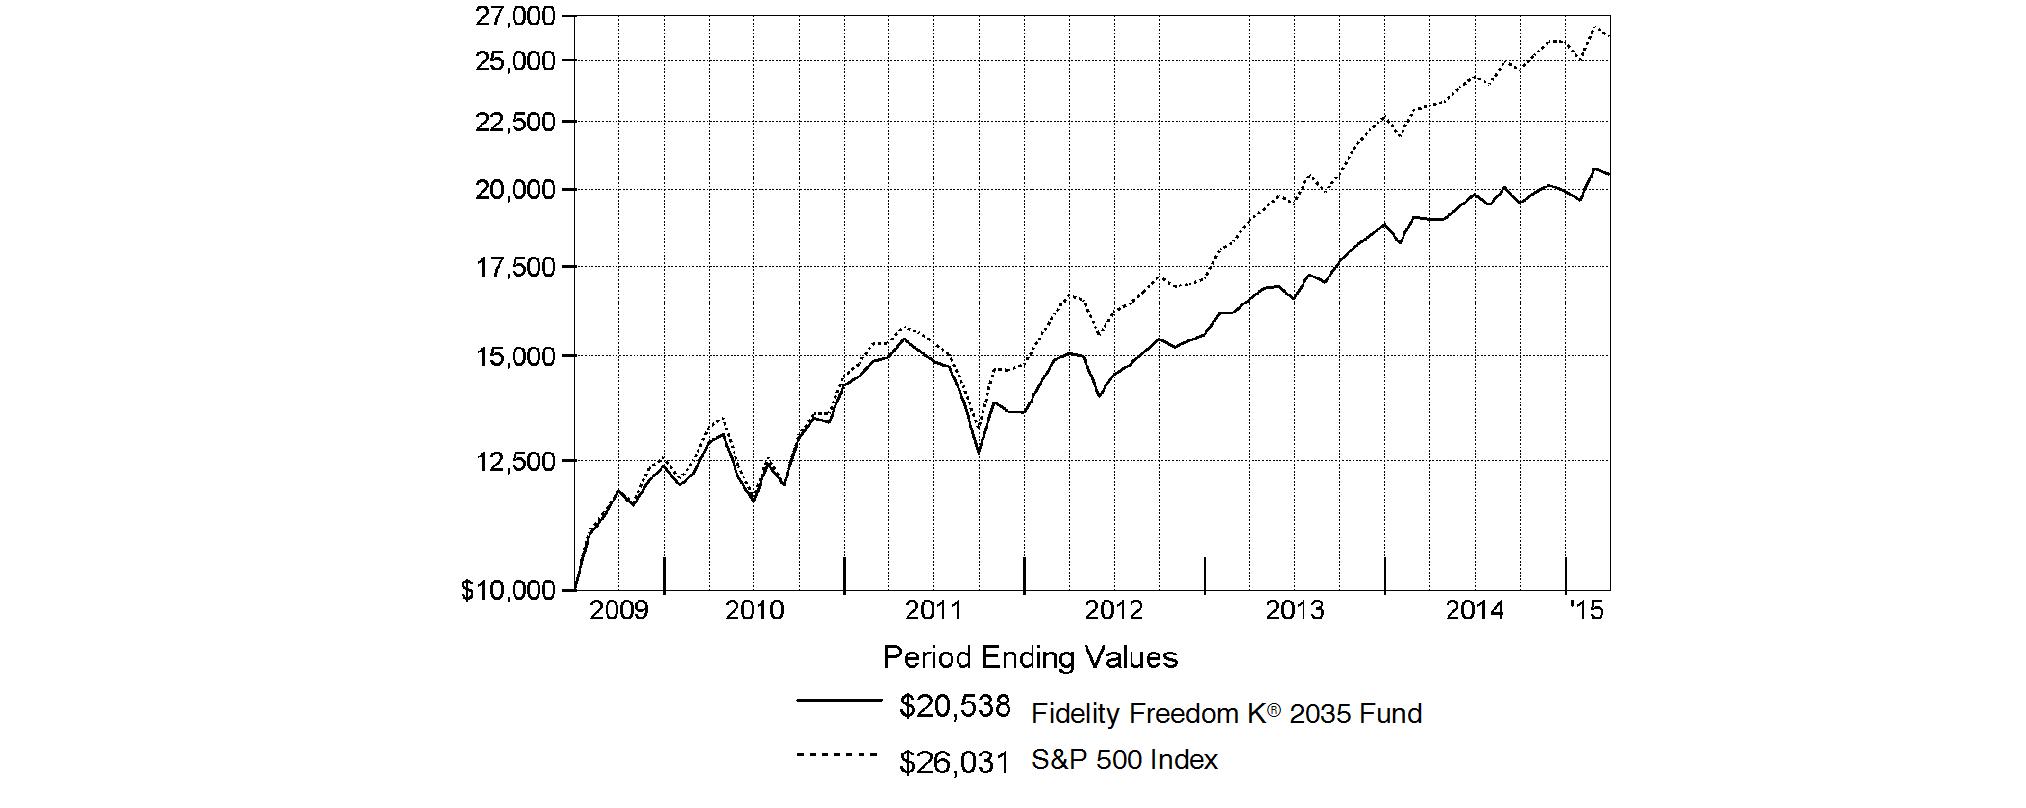
Fidelity Freedom K® 2035 Fund | 8.08% | 9.76% | 13.34% |
A From July 2, 2009.
$10,000 Over Life of Fund
Let's say hypothetically that $10,000 was invested in Fidelity Freedom K® 2035 Fund on July 2, 2009, when the fund started. The chart shows how the value of your investment would have changed, and also shows how the S&P 500 Index performed over the same period.
Annual Report
Fidelity Freedom K® 2040 Fund
Performance: The Bottom Line
Average annual total return reflects the change in the value of an investment, assuming reinvestment of the fund's distributions from dividend income and capital gains (the profits earned upon the sale of securities that have grown in value, if any) and assuming a constant rate of performance each year. The $10,000 table and the fund's returns do not reflect the deduction of taxes that a shareholder would pay on fund distributions or the redemption of fund shares. During periods of reimbursement by Fidelity, a fund's total return will be greater than it would be had the reimbursement not occurred. How a fund did yesterday is no guarantee of how it will do tomorrow.
Average Annual Total Returns
Periods ended March 31, 2015 | Past 1
year | Past 5
years | Life of
fund A |
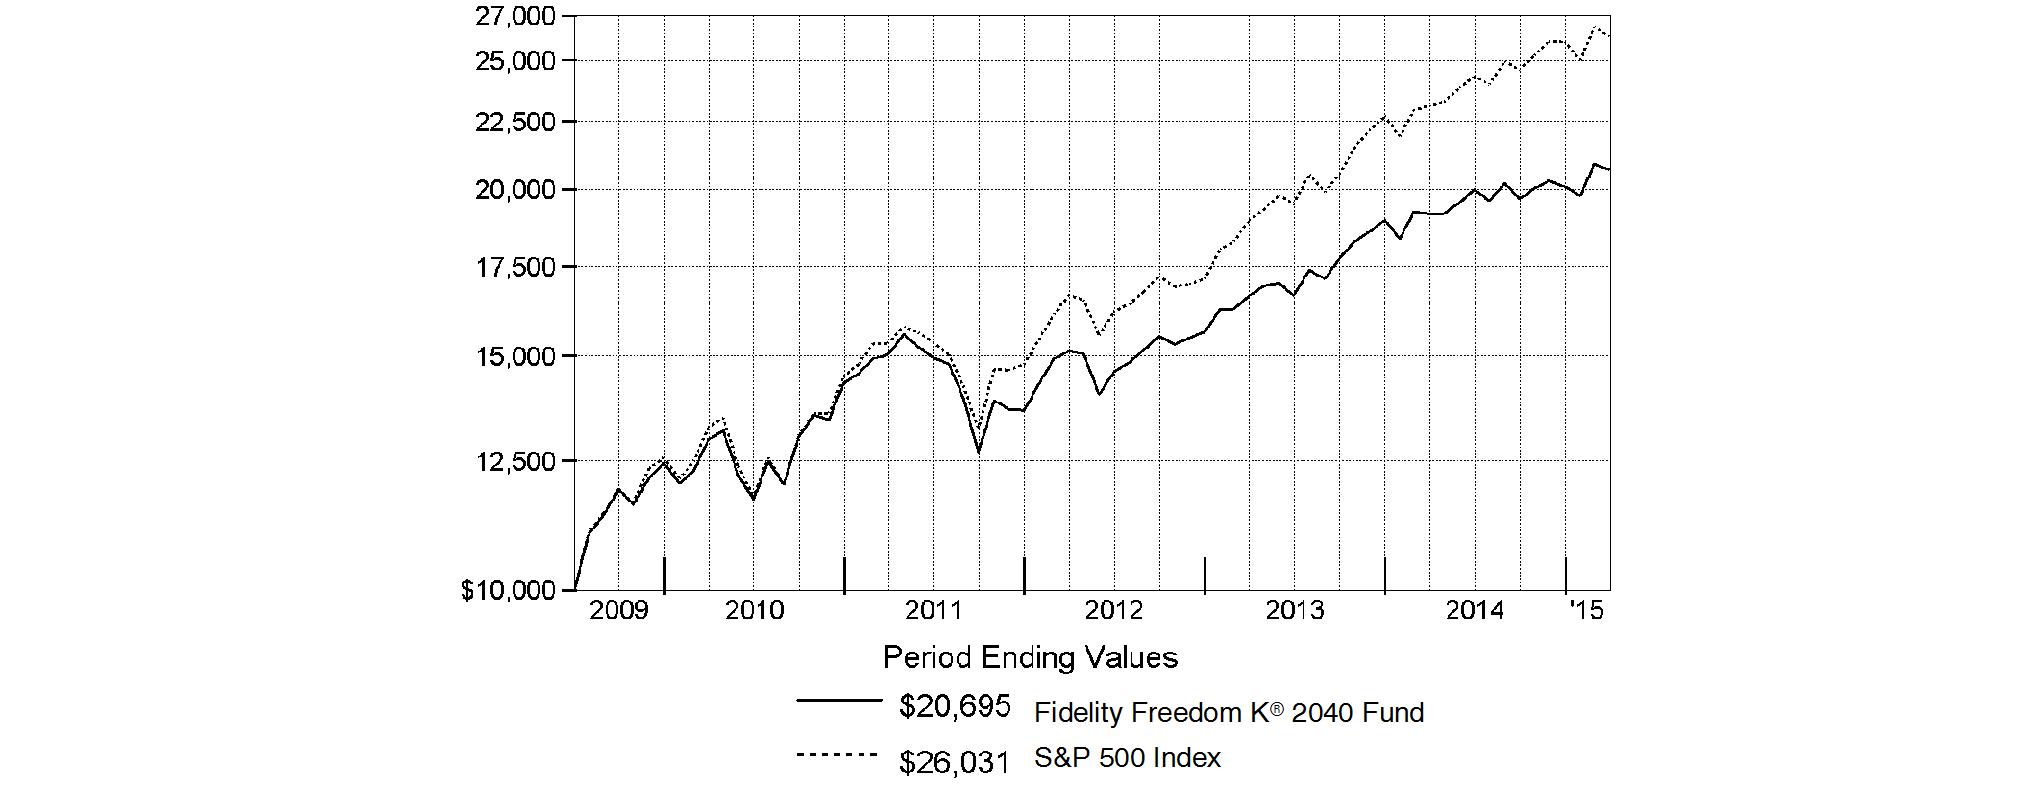
Fidelity Freedom K® 2040 Fund | 8.01% | 9.81% | 13.49% |
A From July 2, 2009.
$10,000 Over Life of Fund
Let's say hypothetically that $10,000 was invested in Fidelity Freedom K® 2040 Fund on July 2, 2009, when the fund started. The chart shows how the value of your investment would have changed, and also shows how the S&P 500 Index performed over the same period.
Annual Report
Fidelity Freedom K® 2045 Fund
Performance: The Bottom Line
Average annual total return reflects the change in the value of an investment, assuming reinvestment of the fund's distributions from dividend income and capital gains (the profits earned upon the sale of securities that have grown in value, if any) and assuming a constant rate of performance each year. The $10,000 table and the fund's returns do not reflect the deduction of taxes that a shareholder would pay on fund distributions or the redemption of fund shares. During periods of reimbursement by Fidelity, a fund's total return will be greater than it would be had the reimbursement not occurred. How a fund did yesterday is no guarantee of how it will do tomorrow.
Average Annual Total Returns
Periods ended March 31, 2015 | Past 1
year | Past 5
years | Life of
fund A |
Fidelity Freedom K® 2045 Fund | 8.10% | 9.94% | 13.67% |
A From July 2, 2009.
$10,000 Over Life of Fund
Let's say hypothetically that $10,000 was invested in Fidelity Freedom K® 2045 Fund on July 2, 2009, when the fund started. The chart shows how the value of your investment would have changed, and also shows how the S&P 500 Index performed over the same period.

Annual Report
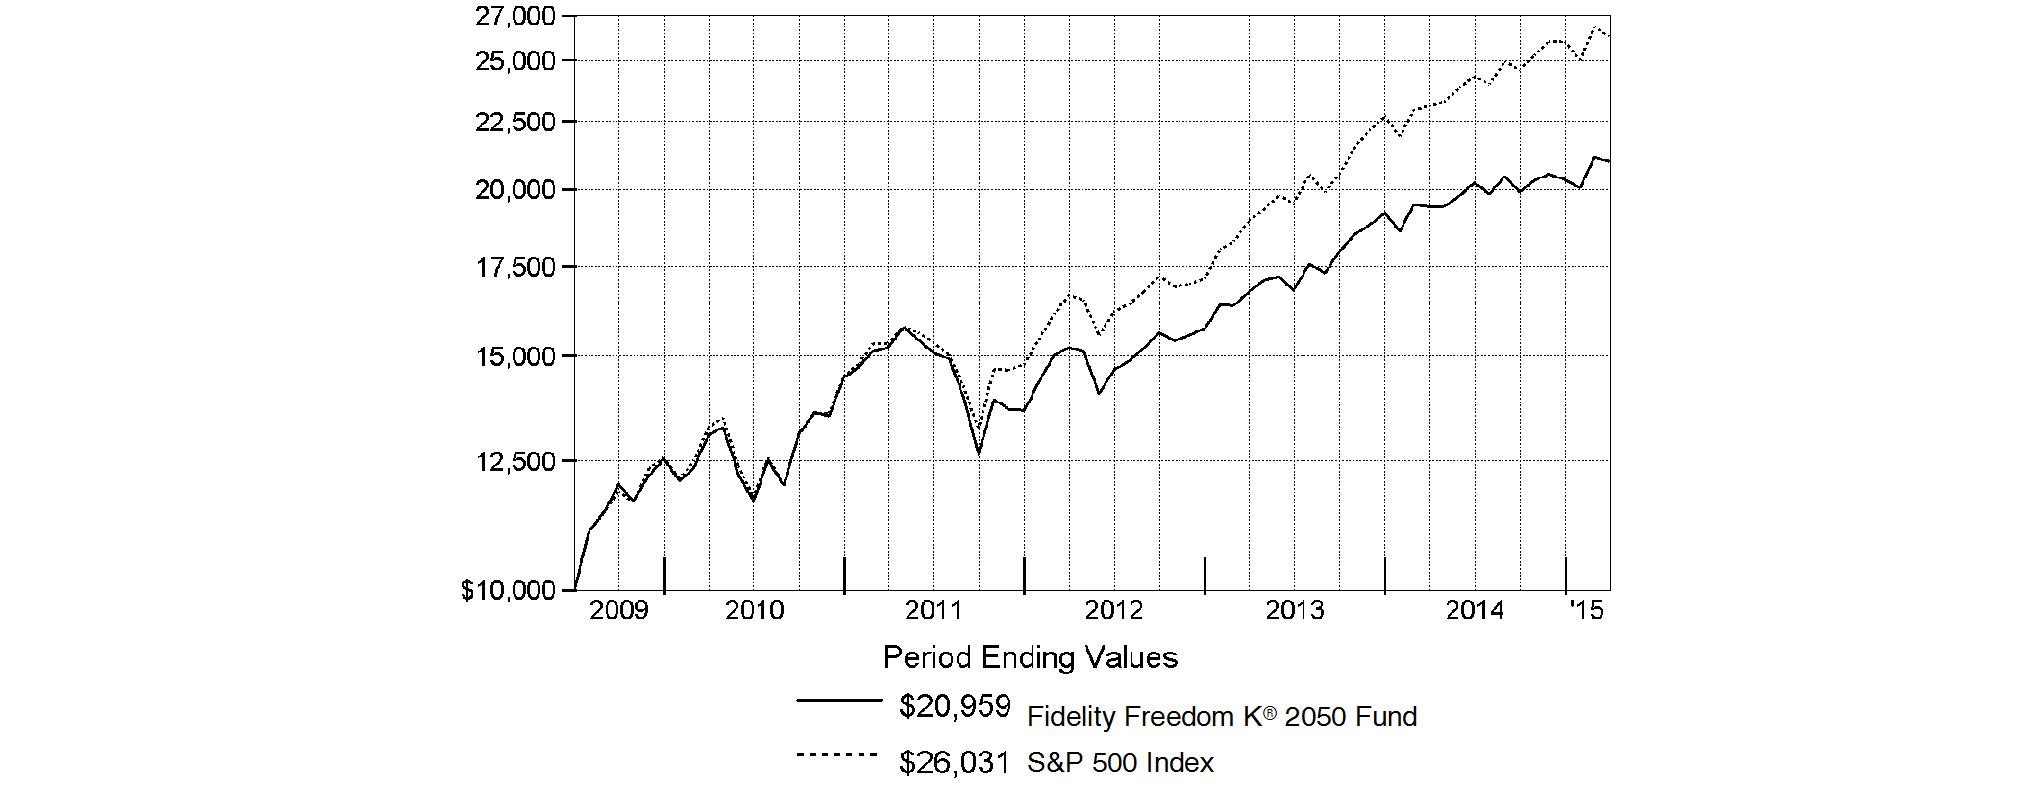
Fidelity Freedom K® 2050 Fund
Performance: The Bottom Line
Average annual total return reflects the change in the value of an investment, assuming reinvestment of the fund's distributions from dividend income and capital gains (the profits earned upon the sale of securities that have grown in value, if any) and assuming a constant rate of performance each year. The $10,000 table and the fund's returns do not reflect the deduction of taxes that a shareholder would pay on fund distributions or the redemption of fund shares. During periods of reimbursement by Fidelity, a fund's total return will be greater than it would be had the reimbursement not occurred. How a fund did yesterday is no guarantee of how it will do tomorrow.
Average Annual Total Returns
Periods ended March 31, 2015 | Past 1
year | Past 5
years | Life of
fund A |
Fidelity Freedom K® 2050 Fund | 8.09% | 9.92% | 13.74% |
A From July 2, 2009.
$10,000 Over Life of Fund
Let's say hypothetically that $10,000 was invested in Fidelity Freedom K® 2050 Fund on July 2, 2009, when the fund started. The chart shows how the value of your investment would have changed, and also shows how the S&P 500 Index performed over the same period.
Annual Report
Fidelity Freedom K® 2055 Fund
Performance: The Bottom Line
Average annual total return reflects the change in the value of an investment, assuming reinvestment of the fund's distributions from dividend income and capital gains (the profits earned upon the sale of securities that have grown in value, if any) and assuming a constant rate of performance each year. The $10,000 table and the fund's returns do not reflect the deduction of taxes that a shareholder would pay on fund distributions or the redemption of fund shares. During periods of reimbursement by Fidelity, a fund's total return will be greater than it would be had the reimbursement not occurred. How a fund did yesterday is no guarantee of how it will do tomorrow.
Average Annual Total Returns
Periods ended March 31, 2015 | Past 1
year | Life of
fund A |
Fidelity Freedom K® 2055 Fund | 8.03% | 9.03% |
A From June 1, 2011.
$10,000 Over Life of Fund
Let's say hypothetically that $10,000 was invested in Fidelity Freedom K® 2055 Fund on June 1, 2011, when the fund started. The chart shows how the value of your investment would have changed, and also shows how the S&P 500 Index performed over the same period.

-
Annual Report
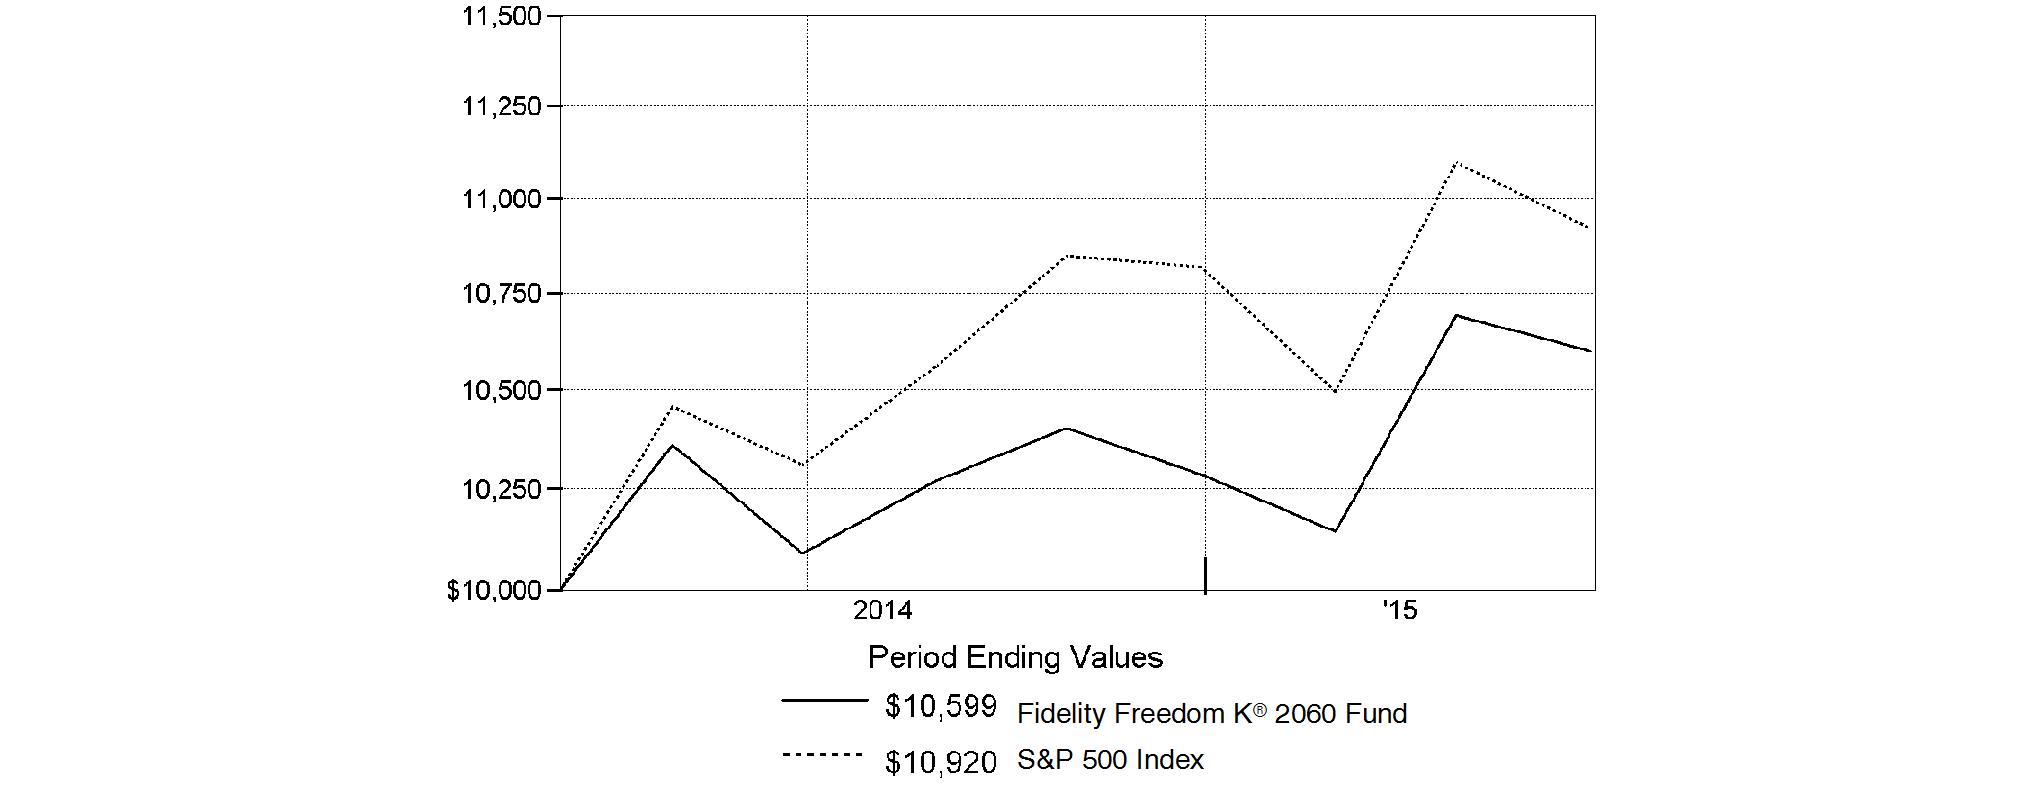
Fidelity Freedom K® 2060 Fund
Performance: The Bottom Line
Average annual total return reflects the change in the value of an investment, assuming reinvestment of the fund's distributions from dividend income and capital gains (the profits earned upon the sale of securities that have grown in value, if any) and assuming a constant rate of performance each year. The $10,000 table and the fund's returns do not reflect the deduction of taxes that a shareholder would pay on fund distributions or the redemption of fund shares. During periods of reimbursement by Fidelity, a fund's total return will be greater than it would be had the reimbursement not occurred. How a fund did yesterday is no guarantee of how it will do tomorrow.
Average annual total returns take Fidelity Freedom K® 2060 Fund's cumulative total return and show you what would have happened if Fidelity Freedom K® 2060 Fund shares had performed at a constant rate each year. These numbers will be reported once the fund is a year old.
$10,000 Over Life of Fund
Let's say hypothetically that $10,000 was invested in Fidelity Freedom K® 2060 Fund on August 5, 2014, when the fund started. The chart shows how the value of your investment would have changed, and also shows how the S&P 500 Index performed over the same period.
Annual Report
Market Recap: The U.S. stock market closed slightly off recent all-time highs for the 12 months ending March 31, 2015, supported by the relative strength of the U.S. economy and dollar, as well as the appeal of stocks relative to bonds. The large-cap S&P 500® Index returned 12.73%. Growth stocks in the index handily outperformed value-oriented names; among sectors, all save energy notched a gain. The tech-heavy Nasdaq Composite Index® gained 18.12%, while the small-cap Russell 2000® Index advanced 8.21%, rallying after earlier weakness due to growth and valuation worries. International stocks, as measured by the MSCI ACWI (All Country World Index) ex USA Index, returned -0.88% amid recessionary pressure in parts of Asia, anemic economic growth in the eurozone and a rising U.S. dollar. Within the MSCI index, Europe (-4%) was hampered by late-period deflationary concerns and currency weakness. The U.K. (-5%) endured decelerating growth and a cooling housing market. Japan (+12%) fought encroaching recession by expanding its already-aggressive economic stimulus plan; Europe followed suit in January. Emerging markets (-1%) saw late-period outflows ahead of potential U.S. Federal Reserve tightening.
Turning to fixed income: U.S. taxable investment-grade bonds posted a positive return for the one-year period, despite a February price decline related to expectations of higher inflation and interest rates. For much of the period, investors in many parts of the world sought the perceived safe haven of U.S. bonds. The Barclays® U.S. Aggregate Bond Index rose 5.72%, well ahead of the negative return for international bonds, which struggled due to a surging U.S. dollar. Among sectors in the Barclays index, U.S. Treasuries rose roughly 5%, driven by this preference for conservative investments. Sentiment changed somewhat toward period end, however, when investors snapped up riskier assets amid a rally in higher-yielding bonds.
Comments from Co-Portfolio Managers Andrew Dierdorf and Brett Sumsion: For the 12 months ending March 31, 2015, each Freedom K® Fund posted a positive absolute return that was consistent with its investment goal. [Note: Freedom K® 2060 Fund has not marked a full year's performance; however, the comments here apply generally to its life-of-fund period.] Longer-dated Funds delivered higher returns, as we would expect given their greater exposure to underlying equities, which rose overall this period. On a relative basis, the Funds performed roughly in line with or modestly lagged their respective Composite indexes. (For specific Fund results, please refer to the performance section of this report.) Aggregate allocation decisions detracted from the Funds' relative results for the full year; however, underlying manager decisions proved additive overall. Security selection in the U.S. equity asset class helped most; positioning in non-U.S. equities also contributed. Conversely, allocations to asset classes such as high-yield debt and commodities hurt. Among the Funds' U.S. equity investments, favorable picks in health care and information technology aided overall results. Outside the U.S., decisions within the energy sector helped; among countries, U.K. stock picks contributed notably. Lastly, active asset allocation was implemented effective August 1, 2014; this allows portfolio managers to make incremental shifts - within predefined risk parameters - to Fund allocations relative to the strategic glide path.
The views expressed above reflect those of the portfolio manager(s) only through the end of the period as stated on the cover of this report and do not necessarily represent the views of Fidelity or any other person in the Fidelity organization. Any such views are subject to change at any time based upon market or other conditions and Fidelity disclaims any responsibility to update such views. These views may not be relied on as investment advice and, because investment decisions for a Fidelity fund are based on numerous factors, may not be relied on as an indication of trading intent on behalf of any Fidelity fund.
Annual Report
As a shareholder of a Fund, you incur two types of costs: (1) transaction costs, and (2) ongoing costs, including other Fund expenses. This Example is intended to help you understand your ongoing costs (in dollars) of investing in the Funds and to compare these costs with the ongoing costs of investing in other mutual funds.
The Example is based on an investment of $1,000 invested at the beginning of the period and held for the entire period (October 1, 2014 to March 31, 2015).
Actual Expenses
The first line of the accompanying table for each fund provides information about actual account values and actual expenses. You may use the information in this line, together with the amount you invested, to estimate the expenses that you paid over the period. Simply divide your account value by $1,000.00 (for example, an $8,600 account value divided by $1,000.00 = 8.6), then multiply the result by the number in the first line for a fund under the heading entitled "Expenses Paid During Period" to estimate the expenses you paid on your account during this period. In addition, each Fund, as a shareholder in underlying Fidelity Funds, will indirectly bear its pro-rata share of the fees and expenses incurred by the underlying Fidelity Funds. These fees and expenses are not included in each Fund's annualized expense ratio used to calculate the expense estimates in the table below.
Hypothetical Example for Comparison Purposes
The second line of the accompanying table for each fund provides information about hypothetical account values and hypothetical expenses based on a fund's actual expense ratio and an assumed rate of return of 5% per year before expenses, which is not the Fund's actual return. The hypothetical account values and expenses may not be used to estimate the actual ending account balance or expenses you paid for the period. You may use this information to compare the ongoing costs of investing in the Fund and other funds. To do so, compare this 5% hypothetical example with the 5% hypothetical examples that appear in the shareholder reports of the other funds. In addition, each Fund, as a shareholder in underlying Fidelity Funds, will indirectly bear its pro-rata share of the fees and expenses incurred by the underlying Fidelity Funds. These fees and expenses are not included in each Fund's annualized expense ratio used to calculate the expense estimates in the table below.
Please note that the expenses shown in the table are meant to highlight your ongoing costs only and do not reflect any transaction costs. Therefore, the second line of the table is useful in comparing ongoing costs only, and will not help you determine the relative total costs of owning different funds.
| Annualized
Expense Ratio B | Beginning
Account Value
October 1, 2014 | Ending
Account Value
March 31, 2015 | Expenses Paid
During Period*
October 1, 2014
to March 31, 2015 |
Fidelity Freedom K® Income Fund | .05% | | | |
Actual | | $ 1,000.00 | $ 1,027.40 | $ .25 |
HypotheticalA | | $ 1,000.00 | $ 1,024.68 | $ .25 |
Fidelity Freedom K® 2005 Fund | .05% | | | |
Actual | | $ 1,000.00 | $ 1,034.30 | $ .25 |
HypotheticalA | | $ 1,000.00 | $ 1,024.68 | $ .25 |
Fidelity Freedom K® 2010 Fund | .05% | | | |
Actual | | $ 1,000.00 | $ 1,038.20 | $ .25 |
HypotheticalA | | $ 1,000.00 | $ 1,024.68 | $ .25 |
Fidelity Freedom K® 2015 Fund | .05% | | | |
Actual | | $ 1,000.00 | $ 1,041.90 | $ .25 |
HypotheticalA | | $ 1,000.00 | $ 1,024.68 | $ .25 |
Fidelity Freedom K® 2020 Fund | .05% | | | |
Actual | | $ 1,000.00 | $ 1,044.60 | $ .25 |
HypotheticalA | | $ 1,000.00 | $ 1,024.68 | $ .25 |
Fidelity Freedom K® 2025 Fund | .05% | | | |
Actual | | $ 1,000.00 | $ 1,047.40 | $ .26 |
HypotheticalA | | $ 1,000.00 | $ 1,024.68 | $ .25 |
Fidelity Freedom K® 2030 Fund | .05% | | | |
Actual | | $ 1,000.00 | $ 1,050.70 | $ .26 |
HypotheticalA | | $ 1,000.00 | $ 1,024.68 | $ .25 |
Fidelity Freedom K® 2035 Fund | .05% | | | |
Actual | | $ 1,000.00 | $ 1,052.50 | $ .26 |
HypotheticalA | | $ 1,000.00 | $ 1,024.68 | $ .25 |
Fidelity Freedom K® 2040 Fund | .05% | | | |
Actual | | $ 1,000.00 | $ 1,052.10 | $ .26 |
HypotheticalA | | $ 1,000.00 | $ 1,024.68 | $ .25 |
| Annualized
Expense Ratio B | Beginning
Account Value
October 1, 2014 | Ending
Account Value
March 31, 2015 | Expenses Paid
During Period*
October 1, 2014
to March 31, 2015 |
Fidelity Freedom K® 2045 Fund | .05% | | | |
Actual | | $ 1,000.00 | $ 1,052.60 | $ .26 |
HypotheticalA | | $ 1,000.00 | $ 1,024.68 | $ .25 |
Fidelity Freedom K® 2050 Fund | .05% | | | |
Actual | | $ 1,000.00 | $ 1,052.80 | $ .26 |
HypotheticalA | | $ 1,000.00 | $ 1,024.68 | $ .25 |
Fidelity Freedom K® 2055 Fund | .05% | | | |
Actual | | $ 1,000.00 | $ 1,051.80 | $ .26 |
HypotheticalA | | $ 1,000.00 | $ 1,024.68 | $ .25 |
Fidelity Freedom K® 2060 Fund | .05% | | | |
Actual | | $ 1,000.00 | $ 1,050.50 | $ .26 |
HypotheticalA | | $ 1,000.00 | $ 1,024.63 | $ .25 |
A 5% return per year before expenses
B Annualized expense ratio reflects expenses net of applicable fee waivers.
* Expenses are equal to each Fund's annualized expense ratio, multiplied by the average account value over the period, multiplied by 182/365 (to reflect the one-half year period). The fees and expenses of the underlying Fidelity Funds in which each Fund invests are not included in each Fund's annualized expense ratio.
Annual Report
Fidelity Freedom K® Income Fund
Investment Changes (Unaudited)
The information in the following tables is based on the direct investments of the Fund. |
Fund Holdings as of March 31, 2015 |
| % of fund's
net assets | % of fund's net assets
6 months ago |
Domestic Equity Funds | | |
Fidelity Series 100 Index Fund Class F | 0.6 | 0.6 |
Fidelity Series 1000 Value Index Fund Class F | 0.4 | 0.3 |
Fidelity Series All-Sector Equity Fund Class F | 2.0 | 2.0 |
Fidelity Series Blue Chip Growth Fund Class F | 1.6 | 1.8 |
Fidelity Series Commodity Strategy Fund Class F | 0.8 | 1.0 |
Fidelity Series Equity-Income Fund Class F | 2.7 | 2.7 |
Fidelity Series Growth & Income Fund Class F | 2.0 | 2.0 |
Fidelity Series Growth Company Fund Class F | 2.5 | 2.1 |
Fidelity Series Intrinsic Opportunities Fund Class F | 1.4 | 1.3 |
Fidelity Series Opportunistic Insights Fund Class F | 1.3 | 1.3 |
Fidelity Series Real Estate Equity Fund Class F | 0.2 | 0.2 |
Fidelity Series Small Cap Discovery Fund Class F | 0.4 | 0.3 |
Fidelity Series Small Cap Opportunities Fund Class F | 1.1 | 1.0 |
Fidelity Series Stock Selector Large Cap Value Fund Class F | 1.8 | 1.7 |
| 18.8 | 18.3 |
International Equity Funds | | |
Fidelity Series Emerging Markets Fund Class F | 2.7 | 1.7 |
Fidelity Series International Growth Fund Class F | 2.0 | 2.0 |
Fidelity Series International Small Cap Fund Class F | 0.4 | 0.4 |
Fidelity Series International Value Fund Class F | 2.0 | 2.4 |
| 7.1 | 6.5 |
Bond Funds | | |
Fidelity Series Emerging Markets Debt Fund Class F | 0.6 | 0.7 |
Fidelity Series Floating Rate High Income Fund Class F | 0.5 | 0.5 |
Fidelity Series High Income Fund Class F | 3.4 | 3.7 |
Fidelity Series Inflation-Protected Bond Index Fund Class F | 3.5 | 3.0 |
Fidelity Series Investment Grade Bond Fund Class F | 41.4 | 39.2 |
Fidelity Series Real Estate Income Fund Class F | 0.5 | 0.4 |
| 49.9 | 47.5 |
Short-Term Funds | | |
Fidelity Institutional Money Market Portfolio Class F | 13.5 | 15.3 |
Fidelity Series Short-Term Credit Fund Class F | 10.7 | 0.0 |
Fidelity Short-Term Bond Fund Class F | 0.0 | 12.4 |
| 24.2 | 27.7 |
Net Other Assets (Liabilities)* | 0.0 | 0.0 |
| 100.0 | 100.0 |
* Amount represents less than 0.1% |
Asset Allocation (% of fund's net assets) |
Period end |
 | Domestic Equity Funds** | 18.8% | |
 | International Equity Funds | 7.1% | |
 | Bond Funds | 49.9% | |
 | Short-Term Funds | 24.2% | |

Six months ago |
 | Domestic Equity Funds** | 18.3% | |
 | International Equity Funds | 6.5% | |
 | Bond Funds | 47.5% | |
 | Short-Term Funds | 27.7% | |

** Includes Fidelity Series Commodity Strategy Fund which invests in commodity-related investments. |
Annual Report
Fidelity Freedom K® Income Fund
Investments March 31, 2015
Showing Percentage of Net Assets
Domestic Equity Funds - 18.8% |
| Shares | | Value |
Fidelity Series 100 Index Fund Class F (c) | 946,913 | | $ 12,584,468 |
Fidelity Series 1000 Value Index Fund Class F (c) | 636,165 | | 7,125,049 |
Fidelity Series All-Sector Equity Fund Class F (c) | 2,887,028 | | 40,851,441 |
Fidelity Series Blue Chip Growth Fund Class F (c) | 2,476,840 | | 31,629,241 |
Fidelity Series Commodity Strategy Fund Class F (a)(c) | 2,649,823 | | 16,349,406 |
Fidelity Series Equity-Income Fund Class F (c) | 4,233,137 | | 53,464,522 |
Fidelity Series Growth & Income Fund Class F (c) | 3,005,358 | | 40,812,756 |
Fidelity Series Growth Company Fund Class F (c) | 3,974,018 | | 49,993,151 |
Fidelity Series Intrinsic Opportunities Fund Class F (c) | 1,814,963 | | 27,460,389 |
Fidelity Series Opportunistic Insights Fund Class F (c) | 1,719,767 | | 26,587,596 |
Fidelity Series Real Estate Equity Fund Class F (c) | 326,580 | | 4,905,231 |
Fidelity Series Small Cap Discovery Fund Class F (c) | 641,910 | | 7,253,584 |
Fidelity Series Small Cap Opportunities Fund Class F (c) | 1,581,352 | | 21,775,218 |
Fidelity Series Stock Selector Large Cap Value Fund Class F (c) | 2,752,445 | | 35,754,258 |
TOTAL DOMESTIC EQUITY FUNDS (Cost $312,688,085) |
376,546,310
|
International Equity Funds - 7.1% |
| | | |
Fidelity Series Emerging Markets Fund Class F (c) | 3,196,842 | | 54,474,185 |
Fidelity Series International Growth Fund Class F (c) | 2,754,849 | | 39,752,478 |
Fidelity Series International Small Cap Fund Class F (c) | 574,259 | | 9,130,712 |
Fidelity Series International Value Fund Class F (c) | 3,888,410 | | 39,467,365 |
TOTAL INTERNATIONAL EQUITY FUNDS (Cost $121,441,422) |
142,824,740
|
Bond Funds - 49.9% |
| Shares | | Value |
Fidelity Series Emerging Markets Debt Fund Class F (c) | 1,280,294 | | $ 12,431,653 |
Fidelity Series Floating Rate High Income Fund Class F (c) | 1,017,086 | | 9,977,614 |
Fidelity Series High Income Fund Class F (c) | 6,930,188 | | 67,915,841 |
Fidelity Series Inflation-Protected Bond Index Fund Class F (c) | 7,198,165 | | 70,254,093 |
Fidelity Series Investment Grade Bond Fund Class F (c) | 71,923,312 | | 832,152,723 |
Fidelity Series Real Estate Income Fund Class F (c) | 870,598 | | 9,846,461 |
TOTAL BOND FUNDS (Cost $994,411,122) |
1,002,578,385
|
Short-Term Funds - 24.2% |
| | | |
Fidelity Institutional Money Market Portfolio Class F 0.14% (b)(c) | 271,087,685 | | 271,087,685 |
Fidelity Series Short-Term Credit Fund Class F (c) | 21,398,526 | | 214,199,246 |
TOTAL SHORT-TERM FUNDS (Cost $485,072,946) |
485,286,931
|
TOTAL INVESTMENT PORTFOLIO - 100.0% (Cost $1,913,613,575) | 2,007,236,366 |
NET OTHER ASSETS (LIABILITIES) - 0.0% | | 79,600 |
NET ASSETS - 100% | $ 2,007,315,966 |
Legend |
(a) Non-income producing |
(b) The rate quoted is the annualized seven-day yield of the fund at period end. |
(c) Affiliated Fund |
Affiliated Underlying Funds |
Information regarding the Fund's fiscal year to date purchases and sales of the affiliated Underlying Funds and income earned by the Fund from investments in affiliated Underlying Funds is as follows: |
Affiliate | Value,
beginning of
period | Purchases | Sales
Proceeds | Dividend
Income | Value,
end of
period |
Fidelity Institutional Money Market Portfolio Class F | $ 246,990,533 | $ 24,307,675 | $ 104,851,552 | $ 277,337 | $ 271,087,685 |
Fidelity Series 100 Index Fund Class F | 7,486,906 | 3,498,979 | 2,542,306 | 273,628 | 12,584,468 |
Fidelity Series 1000 Value Index Fund Class F | 5,050,857 | 1,060,409 | 1,462,472 | 165,336 | 7,125,049 |
Fidelity Series All-Sector Equity Fund Class F | 29,534,883 | 10,562,577 | 12,093,854 | 484,595 | 40,851,441 |
Fidelity Series Blue Chip Growth Fund Class F | 23,833,744 | 10,886,443 | 19,395,555 | 130,759 | 31,629,241 |
Fidelity Series Commodity Strategy Fund Class F | 16,340,582 | 3,288,189 | 4,009,709 | - | 16,349,406 |
Fidelity Series Emerging Markets Debt Fund Class F | 9,163,332 | 2,634,238 | 2,951,851 | 741,206 | 12,431,653 |
Fidelity Series Emerging Markets Fund Class F | 21,684,123 | 28,916,614 | 5,355,002 | 424,546 | 54,474,185 |
Affiliate | Value,
beginning of
period | Purchases | Sales
Proceeds | Dividend
Income | Value,
end of
period |
Fidelity Series Equity-Income Fund Class F | $ 37,909,024 | $ 11,481,642 | $ 12,620,340 | $ 1,156,687 | $ 53,464,522 |
Fidelity Series Floating Rate High Income Fund Class F | 17,412,605 | 2,357,090 | 16,592,372 | 625,096 | 9,977,614 |
Fidelity Series Growth & Income Fund Class F | 28,302,817 | 8,487,693 | 10,125,134 | 697,063 | 40,812,756 |
Fidelity Series Growth Company Fund Class F | 29,487,542 | 3,836,994 | 4,023,264 | 176,518 | 49,993,151 |
Fidelity Series High Income Fund Class F | 75,535,231 | 11,807,289 | 42,509,676 | 4,315,416 | 67,915,841 |
Fidelity Series Inflation-Protected Bond Index Fund Class F | 43,504,752 | 20,404,375 | 11,375,734 | 178,116 | 70,254,093 |
Fidelity Series International Growth Fund Class F | 37,951,632 | 6,396,331 | 21,437,121 | 653,587 | 39,752,478 |
Fidelity Series International Small Cap Fund Class F | 9,102,058 | 1,054,343 | 4,455,353 | 108,122 | 9,130,712 |
Fidelity Series International Value Fund Class F | 38,113,298 | 6,214,342 | 16,487,369 | 1,950,450 | 39,467,365 |
Fidelity Series Intrinsic Opportunities Fund Class F | 18,154,142 | 5,543,827 | 6,136,901 | 440,065 | 27,460,389 |
Fidelity Series Investment Grade Bond Fund Class F | 542,389,512 | 167,993,395 | 133,578,115 | 19,692,338 | 832,152,723 |
Fidelity Series Opportunistic Insights Fund Class F | 17,651,876 | 6,992,238 | 8,205,710 | 23,695 | 26,587,596 |
Fidelity Series Real Estate Equity Fund Class F | 3,375,120 | 1,264,739 | 1,979,677 | 95,156 | 4,905,231 |
Fidelity Series Real Estate Income Fund Class F | 5,730,266 | 2,757,204 | 1,687,417 | 519,432 | 9,846,461 |
Fidelity Series Short-Term Credit Fund Class F | - | 214,538,736 | 554,015 | - | 214,199,246 |
Fidelity Series Small Cap Discovery Fund Class F | 4,478,629 | 2,471,888 | 2,473,220 | 22,869 | 7,253,584 |
Fidelity Series Small Cap Opportunities Fund Class F | 14,473,615 | 6,522,473 | 5,596,970 | 114,484 | 21,775,218 |
Fidelity Series Stock Selector Large Cap Value Fund Class F | 24,509,730 | 8,985,106 | 9,681,399 | 588,064 | 35,754,258 |
Fidelity Short-Term Bond Fund Class F | 202,495,760 | 30,092,519 | 319,019,515 | 2,272,892 | - |
Total | $ 1,510,662,569 | $ 604,357,348 | $ 781,201,603 | $ 36,127,457 | $ 2,007,236,366 |
Other Information |
All investments are categorized as Level 1 under the Fair Value Hierarchy. The inputs or methodology used for valuing securities may not be an indication of the risk associated with investing in those securities. For more information on valuation inputs, please refer to the Investment Valuation section in the accompanying Notes to Financial Statements. |
See accompanying notes which are an integral part of the financial statements.
Annual Report
Fidelity Freedom K® Income Fund
Statement of Assets and Liabilities
| March 31, 2015 |
| | |
Assets | | |
Investment in securities, at value (cost $1,913,613,575) - See accompanying schedule | | $ 2,007,236,366 |
Receivable for investments sold | | 8,134,719 |
Receivable for fund shares sold | | 1,250,485 |
Dividends receivable | | 175,745 |
Total assets | | 2,016,797,315 |
| | |
Liabilities | | |
Payable for investments purchased | $ 2,833,710 | |
Payable for fund shares redeemed | 6,567,229 | |
Transfer agent fees payable | 80,410 | |
Total liabilities | | 9,481,349 |
| | |
Net Assets | | $ 2,007,315,966 |
Net Assets consist of: | | |
Paid in capital | | $ 1,892,069,448 |
Undistributed net investment income | | 3,019,658 |
Accumulated undistributed net realized gain (loss) on investments | | 18,604,069 |
Net unrealized appreciation (depreciation) on investments | | 93,622,791 |
Net Assets, for 167,089,743 shares outstanding | | $ 2,007,315,966 |
Net Asset Value, offering price and redemption price per share ($2,007,315,966 ÷ 167,089,743 shares) | | $ 12.01 |
Statement of Operations
| Year ended March 31, 2015 |
| | |
Investment Income | | |
Income distributions from underlying funds | | $ 36,127,457 |
| | |
Expenses | | |
Transfer agent fees | $ 905,817 | |
Independent trustees' compensation | 8,709 | |
Total expenses | | 914,526 |
Net investment income (loss) | | 35,212,931 |
Realized and Unrealized Gain (Loss) Realized gain (loss) on sale of underlying fund shares | 10,494,155 | |
Capital gain distributions from underlying funds | 22,635,583 | |
Total net realized gain (loss) | | 33,129,738 |
Change in net unrealized appreciation (depreciation) on underlying funds | | 7,988,068 |
Net gain (loss) | | 41,117,806 |
Net increase (decrease) in net assets resulting from operations | | $ 76,330,737 |
See accompanying notes which are an integral part of the financial statements.
Annual Report
Fidelity Freedom K® Income Fund
Financial Statements - continued
Statement of Changes in Net Assets
| Year ended
March 31,
2015 | Year ended
March 31,
2014 |
Increase (Decrease) in Net Assets | | |
Operations | | |
Net investment income (loss) | $ 35,212,931 | $ 22,059,734 |
Net realized gain (loss) | 33,129,738 | 37,501,808 |
Change in net unrealized appreciation (depreciation) | 7,988,068 | 1,228,266 |
Net increase (decrease) in net assets resulting from operations | 76,330,737 | 60,789,808 |
Distributions to shareholders from net investment income | (34,356,251) | (21,494,679) |
Distributions to shareholders from net realized gain | (49,781,478) | (13,588,645) |
Total distributions | (84,137,729) | (35,083,324) |
Share transactions
Proceeds from sales of shares | 646,904,316 | 647,109,876 |
Net asset value of shares issued in exchange for the net assets of Fidelity Freedom K® 2000 Fund (note 5) | 655,598,999 | - |
Reinvestment of distributions | 84,137,729 | 35,083,324 |
Cost of shares redeemed | (882,121,296) | (763,019,417) |
Net increase (decrease) in net assets resulting from share transactions | 504,519,748 | (80,826,217) |
Total increase (decrease) in net assets | 496,712,756 | (55,119,733) |
| | |
Net Assets | | |
Beginning of period | 1,510,603,210 | 1,565,722,943 |
End of period (including undistributed net investment income of $3,019,658 and undistributed net investment income of $2,162,978, respectively) | $ 2,007,315,966 | $ 1,510,603,210 |
Other Information Shares | | |
Sold | 54,158,762 | 54,544,970 |
Issued in exchange for the shares of Fidelity Freedom K® 2000 Fund (note 5) | 54,724,457 | - |
Issued in reinvestment of distributions | 7,090,115 | 2,955,331 |
Redeemed | (73,839,837) | (64,289,080) |
Net increase (decrease) | 42,133,497 | (6,788,779) |
Financial Highlights
Years ended March 31, | 2015 | 2014 | 2013 | 2012 | 2011 |
Selected Per-Share Data | | | | | |
Net asset value, beginning of period | $ 12.09 | $ 11.88 | $ 11.66 | $ 11.64 | $ 11.10 |
Income from Investment Operations | | | | | |
Net investment income (loss) A | .22 | .17 | .16 | .19 | .20 |
Net realized and unrealized gain (loss) | .28 | .31 | .39 | .21 | .61 |
Total from investment operations | .50 | .48 | .55 | .40 | .81 |
Distributions from net investment income | (.21) | (.16) | (.16) | (.18) | (.18) |
Distributions from net realized gain | (.37) | (.10) | (.17) | (.19) | (.09) |
Total distributions | (.58) | (.27) E | (.33) | (.38) F | (.27) |
Net asset value, end of period | $ 12.01 | $ 12.09 | $ 11.88 | $ 11.66 | $ 11.64 |
Total Return | 4.28% | 4.07% | 4.77% | 3.50% | 7.37% |
Ratios to Average Net Assets B, C | | | | | |
Expenses before reductions | .05% | .05% | .05% | .05% | .05% |
Expenses net of fee waivers, if any | .05% | .05% | .05% | .05% | .05% |
Expenses net of all reductions | .05% | .05% | .05% | .05% | .05% |
Net investment income (loss) | 1.83% | 1.41% | 1.37% | 1.67% | 1.77% |
Supplemental Data | | | | | |
Net assets, end of period (000 omitted) | $ 2,007,316 | $ 1,510,603 | $ 1,565,723 | $ 1,281,332 | $ 636,056 |
Portfolio turnover rate B | 32%D | 40% | 17% | 20% | 32% |
A Calculated based on average shares outstanding during the period.
B Amounts do not include the activity of the Underlying Funds.
C Expense ratios reflect operating expenses of the Fund. Expenses before reductions do not reflect amounts reimbursed by the investment adviser or reductions from expense offset arrangements and do not represent the amount paid by the Fund during periods when reimbursements or reductions occur. Expenses net of fee waivers reflect expenses after reimbursement by the investment adviser but prior to reductions from expense offset arrangements. Expenses net of all reductions represent the net expenses paid by the Fund but do not include expenses of the underlying funds in which the Fund invests.
D The portfolio turnover rate does not include the assets acquired in the merger.
E Total distributions of $.27 per share is comprised of distributions from net investment income of $.164 and distributions from net realized gain of $.102 per share.
F Total distributions of $.38 per share is comprised of distributions from net investment income of $.182 and distributions from net realized gain of $.194 per share.
See accompanying notes which are an integral part of the financial statements.
Annual Report
Fidelity Freedom K® 2005 Fund
Investment Changes (Unaudited)
The information in the following tables is based on the direct investments of the Fund. |
Fund Holdings as of March 31, 2015 |
| % of fund's
net assets | % of fund's net assets
6 months ago |
Domestic Equity Funds | | |
Fidelity Series 100 Index Fund Class F | 1.0 | 1.0 |
Fidelity Series 1000 Value Index Fund Class F | 0.6 | 0.6 |
Fidelity Series All-Sector Equity Fund Class F | 3.2 | 3.3 |
Fidelity Series Blue Chip Growth Fund Class F | 2.5 | 2.9 |
Fidelity Series Commodity Strategy Fund Class F | 0.8 | 1.0 |
Fidelity Series Equity-Income Fund Class F | 4.2 | 4.3 |
Fidelity Series Growth & Income Fund Class F | 3.2 | 3.3 |
Fidelity Series Growth Company Fund Class F | 3.6 | 3.5 |
Fidelity Series Intrinsic Opportunities Fund Class F | 2.1 | 2.1 |
Fidelity Series Opportunistic Insights Fund Class F | 2.1 | 2.2 |
Fidelity Series Real Estate Equity Fund Class F | 0.4 | 0.4 |
Fidelity Series Small Cap Discovery Fund Class F | 0.6 | 0.5 |
Fidelity Series Small Cap Opportunities Fund Class F | 1.7 | 1.6 |
Fidelity Series Stock Selector Large Cap Value Fund Class F | 2.8 | 2.9 |
| 28.8 | 29.6 |
International Equity Funds | | |
Fidelity Series Emerging Markets Fund Class F | 4.0 | 2.9 |
Fidelity Series International Growth Fund Class F | 3.5 | 3.5 |
Fidelity Series International Small Cap Fund Class F | 0.8 | 0.8 |
Fidelity Series International Value Fund Class F | 3.5 | 3.9 |
| 11.8 | 11.1 |
Bond Funds | | |
Fidelity Series Emerging Markets Debt Fund Class F | 0.6 | 0.6 |
Fidelity Series Floating Rate High Income Fund Class F | 0.5 | 0.5 |
Fidelity Series High Income Fund Class F | 3.5 | 4.3 |
Fidelity Series Inflation-Protected Bond Index Fund Class F | 3.0 | 2.2 |
Fidelity Series Investment Grade Bond Fund Class F | 36.5 | 33.5 |
Fidelity Series Real Estate Income Fund Class F | 0.5 | 0.5 |
| 44.6 | 41.6 |
Short-Term Funds | | |
Fidelity Institutional Money Market Portfolio Class F | 8.6 | 9.7 |
Fidelity Series Short-Term Credit Fund Class F | 6.2 | 0.0 |
Fidelity Short-Term Bond Fund Class F | 0.0 | 8.0 |
| 14.8 | 17.7 |
Net Other Assets (Liabilities)* | 0.0 | 0.0 |
| 100.0 | 100.0 |
* Amount represents less than 0.1% |
Asset Allocation (% of fund's net assets) |
Period end |
 | Domestic Equity Funds** | 28.8% | |
 | International Equity Funds | 11.8% | |
 | Bond Funds | 44.6% | |
 | Short-Term Funds | 14.8% | |

Six months ago |
 | Domestic Equity Funds** | 29.6% | |
 | International Equity Funds | 11.1% | |
 | Bond Funds | 41.6% | |
 | Short-Term Funds | 17.7% | |

** Includes Fidelity Series Commodity Strategy Fund which invests in commodity-related investments. |
Annual Report
Fidelity Freedom K® 2005 Fund
Investments March 31, 2015
Showing Percentage of Net Assets
Domestic Equity Funds - 28.8% |
| Shares | | Value |
Fidelity Series 100 Index Fund Class F (c) | 349,184 | | $ 4,640,658 |
Fidelity Series 1000 Value Index Fund Class F (c) | 235,851 | | 2,641,536 |
Fidelity Series All-Sector Equity Fund Class F (c) | 1,069,721 | | 15,136,546 |
Fidelity Series Blue Chip Growth Fund Class F (c) | 917,274 | | 11,713,591 |
Fidelity Series Commodity Strategy Fund Class F (a)(c) | 603,032 | | 3,720,710 |
Fidelity Series Equity-Income Fund Class F (c) | 1,568,531 | | 19,810,549 |
Fidelity Series Growth & Income Fund Class F (c) | 1,112,410 | | 15,106,529 |
Fidelity Series Growth Company Fund Class F (c) | 1,369,422 | | 17,227,330 |
Fidelity Series Intrinsic Opportunities Fund Class F (c) | 667,757 | | 10,103,160 |
Fidelity Series Opportunistic Insights Fund Class F (c) | 636,436 | | 9,839,302 |
Fidelity Series Real Estate Equity Fund Class F (c) | 121,359 | | 1,822,811 |
Fidelity Series Small Cap Discovery Fund Class F (c) | 238,711 | | 2,697,440 |
Fidelity Series Small Cap Opportunities Fund Class F (c) | 582,003 | | 8,014,177 |
Fidelity Series Stock Selector Large Cap Value Fund Class F (c) | 1,018,345 | | 13,228,304 |
TOTAL DOMESTIC EQUITY FUNDS (Cost $112,066,832) |
135,702,643
|
International Equity Funds - 11.8% |
| | | |
Fidelity Series Emerging Markets Fund Class F (c) | 1,091,987 | | 18,607,454 |
Fidelity Series International Growth Fund Class F (c) | 1,156,154 | | 16,683,302 |
Fidelity Series International Small Cap Fund Class F (c) | 238,328 | | 3,789,422 |
Fidelity Series International Value Fund Class F (c) | 1,611,077 | | 16,352,431 |
TOTAL INTERNATIONAL EQUITY FUNDS (Cost $46,875,195) |
55,432,609
|
Bond Funds - 44.6% |
| Shares | | Value |
Fidelity Series Emerging Markets Debt Fund Class F (c) | 305,763 | | $ 2,968,957 |
Fidelity Series Floating Rate High Income Fund Class F (c) | 237,151 | | 2,326,450 |
Fidelity Series High Income Fund Class F (c) | 1,661,485 | | 16,282,551 |
Fidelity Series Inflation-Protected Bond Index Fund Class F (c) | 1,462,232 | | 14,271,382 |
Fidelity Series Investment Grade Bond Fund Class F (c) | 14,834,597 | | 171,636,281 |
Fidelity Series Real Estate Income Fund Class F (c) | 201,822 | | 2,282,609 |
TOTAL BOND FUNDS (Cost $208,015,202) |
209,768,230
|
Short-Term Funds - 14.8% |
| | | |
Fidelity Institutional Money Market Portfolio Class F 0.14% (b)(c) | 40,706,365 | | 40,706,365 |
Fidelity Series Short-Term Credit Fund Class F (c) | 2,892,998 | | 28,958,911 |
TOTAL SHORT-TERM FUNDS (Cost $69,636,346) |
69,665,276
|
TOTAL INVESTMENT PORTFOLIO - 100.0% (Cost $436,593,575) | | 470,568,758 |
NET OTHER ASSETS (LIABILITIES) - 0.0% | | 5,375 |
NET ASSETS - 100% | $ 470,574,133 |
Legend |
(a) Non-income producing |
(b) The rate quoted is the annualized seven-day yield of the fund at period end. |
(c) Affiliated Fund |
Affiliated Underlying Funds |
Information regarding the Fund's fiscal year to date purchases and sales of the affiliated Underlying Funds and income earned by the Fund from investments in affiliated Underlying Funds is as follows: |
Affiliate | Value,
beginning of
period | Purchases | Sales
Proceeds | Dividend
Income | Value,
end of
period |
Fidelity Institutional Money Market Portfolio Class F | $ 51,961,906 | $ 7,740,604 | $ 18,996,147 | $ 42,883 | $ 40,706,365 |
Fidelity Series 100 Index Fund Class F | 4,172,909 | 1,336,977 | 1,241,621 | 94,779 | 4,640,658 |
Fidelity Series 1000 Value Index Fund Class F | 2,813,100 | 587,901 | 895,091 | 57,554 | 2,641,536 |
Fidelity Series All-Sector Equity Fund Class F | 15,334,718 | 4,990,734 | 5,328,208 | 161,305 | 15,136,546 |
Fidelity Series Blue Chip Growth Fund Class F | 13,505,714 | 4,023,128 | 8,057,826 | 46,736 | 11,713,591 |
Fidelity Series Commodity Strategy Fund Class F | 5,529,348 | 989,623 | 1,374,490 | - | 3,720,710 |
Fidelity Series Emerging Markets Debt Fund Class F | 2,992,990 | 801,189 | 676,862 | 177,200 | 2,968,957 |
Fidelity Series Emerging Markets Fund Class F | 12,030,943 | 8,811,568 | 2,017,960 | 139,692 | 18,607,454 |
Affiliate | Value,
beginning of
period | Purchases | Sales
Proceeds | Dividend
Income | Value,
end of
period |
Fidelity Series Equity-Income Fund Class F | $ 20,088,587 | $ 5,455,977 | $ 5,973,422 | $ 472,058 | $ 19,810,549 |
Fidelity Series Floating Rate High Income Fund Class F | 5,606,765 | 682,700 | 3,801,721 | 159,788 | 2,326,450 |
Fidelity Series Growth & Income Fund Class F | 15,957,846 | 3,545,817 | 5,129,836 | 294,724 | 15,106,529 |
Fidelity Series Growth Company Fund Class F | 15,907,241 | 895,698 | 2,155,281 | 60,983 | 17,227,330 |
Fidelity Series High Income Fund Class F | 26,401,733 | 3,861,673 | 12,408,126 | 1,169,398 | 16,282,551 |
Fidelity Series Inflation-Protected Bond Index Fund Class F | 10,542,477 | 6,774,639 | 2,868,825 | 35,076 | 14,271,382 |
Fidelity Series International Growth Fund Class F | 20,699,555 | 3,148,622 | 7,441,595 | 250,671 | 16,683,302 |
Fidelity Series International Small Cap Fund Class F | 4,656,665 | 661,922 | 1,425,225 | 41,575 | 3,789,422 |
Fidelity Series International Value Fund Class F | 21,001,598 | 3,653,954 | 6,655,572 | 712,561 | 16,352,431 |
Fidelity Series Intrinsic Opportunities Fund Class F | 10,396,106 | 2,245,225 | 3,392,265 | 159,637 | 10,103,160 |
Fidelity Series Investment Grade Bond Fund Class F | 146,053,367 | 53,839,656 | 32,441,877 | 4,120,568 | 171,636,281 |
Fidelity Series Opportunistic Insights Fund Class F | 9,909,787 | 2,553,783 | 3,644,149 | 8,009 | 9,839,302 |
Fidelity Series Real Estate Equity Fund Class F | 1,936,478 | 919,375 | 1,315,758 | 34,720 | 1,822,811 |
Fidelity Series Real Estate Income Fund Class F | 2,251,851 | 541,559 | 519,109 | 121,594 | 2,282,609 |
Fidelity Series Short-Term Credit Fund Class F | - | 28,968,668 | 38,724 | - | 28,958,911 |
Fidelity Series Small Cap Discovery Fund Class F | 2,689,594 | 851,624 | 1,101,921 | 9,103 | 2,697,440 |
Fidelity Series Small Cap Opportunities Fund Class F | 8,117,753 | 2,477,400 | 2,651,546 | 40,446 | 8,014,177 |
Fidelity Series Stock Selector Large Cap Value Fund Class F | 13,880,843 | 3,590,052 | 4,804,290 | 198,238 | 13,228,304 |
Fidelity Short-Term Bond Fund Class F | 42,559,093 | 5,583,727 | 48,203,414 | 360,555 | - |
Total | $ 486,998,967 | $ 159,533,795 | $ 184,560,861 | $ 8,969,853 | $ 470,568,758 |
Other Information |
All investments are categorized as Level 1 under the Fair Value Hierarchy. The inputs or methodology used for valuing securities may not be an indication of the risk associated with investing in those securities. For more information on valuation inputs, please refer to the Investment Valuation section in the accompanying Notes to Financial Statements. |
See accompanying notes which are an integral part of the financial statements.
Annual Report
Fidelity Freedom K® 2005 Fund
Statement of Assets and Liabilities
| March 31, 2015 |
| | |
Assets | | |
Investment in securities, at value (cost $436,593,575) - See accompanying schedule | | $ 470,568,758 |
Receivable for investments sold | | 1,248,330 |
Receivable for fund shares sold | | 330,126 |
Dividends receivable | | 23,706 |
Total assets | | 472,170,920 |
| | |
Liabilities | | |
Payable for investments purchased | $ 641,680 | |
Payable for fund shares redeemed | 937,089 | |
Transfer agent fees payable | 18,018 | |
Total liabilities | | 1,596,787 |
| | |
Net Assets | | $ 470,574,133 |
Net Assets consist of: | | |
Paid in capital | | $ 429,427,350 |
Undistributed net investment income | | 1,445,878 |
Accumulated undistributed net realized gain (loss) on investments | | 5,725,722 |
Net unrealized appreciation (depreciation) on investments | | 33,975,183 |
Net Assets, for 35,537,336 shares outstanding | | $ 470,574,133 |
Net Asset Value, offering price and redemption price per share ($470,574,133 ÷ 35,537,336 shares) | | $ 13.24 |
Statement of Operations
| Year ended March 31, 2015 |
| | |
Investment Income | | |
Income distributions from underlying funds | | $ 8,969,853 |
| | |
Expenses | | |
Transfer agent fees | $ 221,799 | |
Independent trustees' compensation | 2,053 | |
Total expenses | | 223,852 |
Net investment income (loss) | | 8,746,001 |
Realized and Unrealized Gain (Loss) Realized gain (loss) on sale of underlying fund shares | 3,074,497 | |
Capital gain distributions from underlying funds | 7,241,591 | |
Total net realized gain (loss) | | 10,316,088 |
Change in net unrealized appreciation (depreciation) on underlying funds | | 5,522,385 |
Net gain (loss) | | 15,838,473 |
Net increase (decrease) in net assets resulting from operations | | $ 24,584,474 |
See accompanying notes which are an integral part of the financial statements.
Annual Report
Fidelity Freedom K® 2005 Fund
Financial Statements - continued
Statement of Changes in Net Assets
| Year ended
March 31,
2015 | Year ended
March 31,
2014 |
Increase (Decrease) in Net Assets | | |
Operations | | |
Net investment income (loss) | $ 8,746,001 | $ 7,008,293 |
Net realized gain (loss) | 10,316,088 | 19,974,058 |
Change in net unrealized appreciation (depreciation) | 5,522,385 | 3,662,079 |
Net increase (decrease) in net assets resulting from operations | 24,584,474 | 30,644,430 |
Distributions to shareholders from net investment income | (14,303,298) | (1,003,197) |
Distributions to shareholders from net realized gain | (23,376,590) | (7,138,132) |
Total distributions | (37,679,888) | (8,141,329) |
Share transactions
Proceeds from sales of shares | 173,718,310 | 199,302,150 |
Reinvestment of distributions | 37,679,888 | 8,141,329 |
Cost of shares redeemed | (214,708,998) | (239,030,129) |
Net increase (decrease) in net assets resulting from share transactions | (3,310,800) | (31,586,650) |
Total increase (decrease) in net assets | (16,406,214) | (9,083,549) |
| | |
Net Assets | | |
Beginning of period | 486,980,347 | 496,063,896 |
End of period (including undistributed net investment income of $1,445,878 and undistributed net investment income of $7,003,175, respectively) | $ 470,574,133 | $ 486,980,347 |
Other Information Shares | | |
Sold | 13,137,868 | 15,183,177 |
Issued in reinvestment of distributions | 2,909,900 | 629,160 |
Redeemed | (16,275,785) | (18,210,428) |
Net increase (decrease) | (228,017) | (2,398,091) |
Financial Highlights
Years ended March 31, | 2015 | 2014 | 2013 | 2012 | 2011 |
Selected Per-Share Data | | | | | |
Net asset value, beginning of period | $ 13.62 | $ 13.00 | $ 12.65 | $ 12.82 | $ 11.85 |
Income from Investment Operations | | | | | |
Net investment income (loss) A | .24 | .19 | .19 | .21 | .21 |
Net realized and unrealized gain (loss) | .44 | .64 | .56 | .13 | 1.05 |
Total from investment operations | .68 | .83 | .75 | .34 | 1.26 |
Distributions from net investment income | (.41) | (.03) | (.18) | (.18) | (.17) |
Distributions from net realized gain | (.66) | (.19) | (.21) | (.33) | (.12) |
Total distributions | (1.06) D | (.21) E | (.40) F | (.51) | (.29) |
Net asset value, end of period | $ 13.24 | $ 13.62 | $ 13.00 | $ 12.65 | $ 12.82 |
Total Return | 5.33% | 6.48% | 6.03% | 2.83% | 10.75% |
Ratios to Average Net Assets B, C | | | | | |
Expenses before reductions | .05% | .05% | .05% | .05% | .05% |
Expenses net of fee waivers, if any | .05% | .05% | .05% | .05% | .05% |
Expenses net of all reductions | .05% | .05% | .05% | .05% | .05% |
Net investment income (loss) | 1.85% | 1.42% | 1.46% | 1.66% | 1.73% |
Supplemental Data | | | | | |
Net assets, end of period (000 omitted) | $ 470,574 | $ 486,980 | $ 496,064 | $ 388,009 | $ 257,817 |
Portfolio turnover rate B | 34% | 55% | 29% | 37% | 47% |
A Calculated based on average shares outstanding during the period.
B Amounts do not include the activity of the Underlying Funds.
C Expense ratios reflect operating expenses of the Fund. Expenses before reductions do not reflect amounts reimbursed by the investment adviser or reductions from expense offset arrangements and do not represent the amount paid by the Fund during periods when reimbursements or reductions occur. Expenses net of fee waivers reflect expenses after reimbursement by the investment adviser but prior to reductions from expense offset arrangements. Expenses net of all reductions represent the net expenses paid by the Fund but do not include expenses of the underlying funds in which the Fund invests.
D Total distributions of $1.06 per share is comprised of distributions from net investment income of $.406 and distributions from net realized gain of $.658 per share.
E Total distributions of $.21 per share is comprised of distributions from net investment income of $.026 and distributions from net realized gain of $.185 per share.
F Total distributions of $.40 per share is comprised of distributions from net investment income of $.182 and distributions from net realized gain of $.213 per share.
See accompanying notes which are an integral part of the financial statements.
Annual Report
Fidelity Freedom K® 2010 Fund
Investment Changes (Unaudited)
The information in the following tables is based on the direct investments of the Fund. |
Fund Holdings as of March 31, 2015 |
| % of fund's
net assets | % of fund's net assets
6 months ago |
Domestic Equity Funds | | |
Fidelity Series 100 Index Fund Class F | 1.2 | 1.2 |
Fidelity Series 1000 Value Index Fund Class F | 0.7 | 0.7 |
Fidelity Series All-Sector Equity Fund Class F | 3.9 | 4.2 |
Fidelity Series Blue Chip Growth Fund Class F | 3.0 | 3.5 |
Fidelity Series Commodity Strategy Fund Class F | 0.8 | 1.0 |
Fidelity Series Equity-Income Fund Class F | 5.1 | 5.2 |
Fidelity Series Growth & Income Fund Class F | 3.9 | 4.0 |
Fidelity Series Growth Company Fund Class F | 4.7 | 4.3 |
Fidelity Series Intrinsic Opportunities Fund Class F | 2.6 | 2.6 |
Fidelity Series Opportunistic Insights Fund Class F | 2.5 | 2.6 |
Fidelity Series Real Estate Equity Fund Class F | 0.5 | 0.5 |
Fidelity Series Small Cap Discovery Fund Class F | 0.7 | 0.6 |
Fidelity Series Small Cap Opportunities Fund Class F | 2.0 | 2.0 |
Fidelity Series Stock Selector Large Cap Value Fund Class F | 3.4 | 3.5 |
| 35.0 | 35.9 |
International Equity Funds | | |
Fidelity Series Emerging Markets Fund Class F | 4.8 | 3.6 |
Fidelity Series International Growth Fund Class F | 4.5 | 4.5 |
Fidelity Series International Small Cap Fund Class F | 1.0 | 1.0 |
Fidelity Series International Value Fund Class F | 4.4 | 4.8 |
| 14.7 | 13.9 |
Bond Funds | | |
Fidelity Series Emerging Markets Debt Fund Class F | 0.7 | 0.7 |
Fidelity Series Floating Rate High Income Fund Class F | 0.5 | 0.5 |
Fidelity Series High Income Fund Class F | 3.4 | 4.3 |
Fidelity Series Inflation-Protected Bond Index Fund Class F | 2.4 | 1.7 |
Fidelity Series Investment Grade Bond Fund Class F | 33.4 | 30.4 |
Fidelity Series Real Estate Income Fund Class F | 0.5 | 0.5 |
| 40.9 | 38.1 |
Short-Term Funds | | |
Fidelity Institutional Money Market Portfolio Class F | 5.2 | 6.6 |
Fidelity Series Short-Term Credit Fund Class F | 4.2 | 0.0 |
Fidelity Short-Term Bond Fund Class F | 0.0 | 5.5 |
| 9.4 | 12.1 |
Net Other Assets (Liabilities)* | 0.0 | 0.0 |
| 100.0 | 100.0 |
* Amount represents less than 0.1% |
Asset Allocation (% of fund's net assets) |
Period end |
 | Domestic Equity Funds** | 35.0% | |
 | International Equity Funds | 14.7% | |
 | Bond Funds | 40.9% | |
 | Short-Term Funds | 9.4% | |

Six months ago |
 | Domestic Equity Funds** | 35.9% | |
 | International Equity Funds | 13.9% | |
 | Bond Funds | 38.1% | |
 | Short-Term Funds | 12.1% | |

** Includes Fidelity Series Commodity Strategy Fund which invests in commodity-related investments. |
Annual Report
Fidelity Freedom K® 2010 Fund
Investments March 31, 2015
Showing Percentage of Net Assets
Domestic Equity Funds - 35.0% |
| Shares | | Value |
Fidelity Series 100 Index Fund Class F (c) | 3,291,805 | | $ 43,748,084 |
Fidelity Series 1000 Value Index Fund Class F (c) | 2,201,097 | | 24,652,285 |
Fidelity Series All-Sector Equity Fund Class F (c) | 10,103,163 | | 142,959,754 |
Fidelity Series Blue Chip Growth Fund Class F (c) | 8,758,165 | | 111,841,765 |
Fidelity Series Commodity Strategy Fund Class F (a)(c) | 4,672,635 | | 28,830,156 |
Fidelity Series Equity-Income Fund Class F (c) | 14,793,059 | | 186,836,333 |
Fidelity Series Growth & Income Fund Class F (c) | 10,503,094 | | 142,632,022 |
Fidelity Series Growth Company Fund Class F (c) | 13,769,027 | | 173,214,356 |
Fidelity Series Intrinsic Opportunities Fund Class F (c) | 6,301,996 | | 95,349,205 |
Fidelity Series Opportunistic Insights Fund Class F (c) | 6,017,503 | | 93,030,589 |
Fidelity Series Real Estate Equity Fund Class F (c) | 1,136,230 | | 17,066,169 |
Fidelity Series Small Cap Discovery Fund Class F (c) | 2,184,888 | | 24,689,234 |
Fidelity Series Small Cap Opportunities Fund Class F (c) | 5,491,642 | | 75,619,907 |
Fidelity Series Stock Selector Large Cap Value Fund Class F (c) | 9,625,284 | | 125,032,437 |
TOTAL DOMESTIC EQUITY FUNDS (Cost $1,027,055,025) |
1,285,502,296
|
International Equity Funds - 14.7% |
| | | |
Fidelity Series Emerging Markets Fund Class F (c) | 10,195,495 | | 173,731,228 |
Fidelity Series International Growth Fund Class F (c) | 11,419,053 | | 164,776,932 |
Fidelity Series International Small Cap Fund Class F (c) | 2,355,304 | | 37,449,336 |
Fidelity Series International Value Fund Class F (c) | 15,955,224 | | 161,945,521 |
TOTAL INTERNATIONAL EQUITY FUNDS (Cost $445,200,909) |
537,903,017
|
Bond Funds - 40.9% |
| Shares | | Value |
Fidelity Series Emerging Markets Debt Fund Class F (c) | 2,437,358 | | $ 23,666,750 |
Fidelity Series Floating Rate High Income Fund Class F (c) | 1,849,560 | | 18,144,186 |
Fidelity Series High Income Fund Class F (c) | 12,793,230 | | 125,373,657 |
Fidelity Series Inflation-Protected Bond Index Fund Class F (c) | 9,045,970 | | 88,288,666 |
Fidelity Series Investment Grade Bond Fund Class F (c) | 106,051,244 | | 1,227,012,891 |
Fidelity Series Real Estate Income Fund Class F (c) | 1,579,678 | | 17,866,158 |
TOTAL BOND FUNDS (Cost $1,491,273,005) |
1,500,352,308
|
Short-Term Funds - 9.4% |
| | | |
Fidelity Institutional Money Market Portfolio Class F 0.14% (b)(c) | 192,026,291 | | 192,026,291 |
Fidelity Series Short-Term Credit Fund Class F (c) | 15,365,949 | | 153,813,150 |
TOTAL SHORT-TERM FUNDS (Cost $345,685,781) |
345,839,441
|
TOTAL INVESTMENT PORTFOLIO - 100.0% (Cost $3,309,214,720) | 3,669,597,062 |
NET OTHER ASSETS (LIABILITIES) - 0.0% | | (34,867) |
NET ASSETS - 100% | $ 3,669,562,195 |
Legend |
(a) Non-income producing |
(b) The rate quoted is the annualized seven-day yield of the fund at period end. |
(c) Affiliated Fund |
Affiliated Underlying Funds |
Information regarding the Fund's fiscal year to date purchases and sales of the affiliated Underlying Funds and income earned by the Fund from investments in affiliated Underlying Funds is as follows: |
Affiliate | Value,
beginning of
period | Purchases | Sales
Proceeds | Dividend
Income | Value,
end of
period |
Fidelity Institutional Money Market Portfolio Class F | $ 334,962,376 | $ 8,755,524 | $ 151,691,609 | $ 249,312 | $ 192,026,291 |
Fidelity Series 100 Index Fund Class F | 45,182,420 | 7,546,763 | 12,965,301 | 982,316 | 43,748,084 |
Fidelity Series 1000 Value Index Fund Class F | 30,459,828 | 2,224,729 | 9,491,204 | 594,168 | 24,652,285 |
Fidelity Series All-Sector Equity Fund Class F | 187,718,960 | 22,901,446 | 70,121,245 | 1,678,209 | 142,959,754 |
Fidelity Series Blue Chip Growth Fund Class F | 142,099,487 | 26,450,085 | 80,154,942 | 490,848 | 111,841,765 |
Fidelity Series Commodity Strategy Fund Class F | 48,181,088 | 2,807,048 | 10,100,602 | - | 28,830,156 |
Fidelity Series Emerging Markets Debt Fund Class F | 27,244,103 | 3,988,143 | 6,283,795 | 1,540,913 | 23,666,750 |
Affiliate | Value,
beginning of
period | Purchases | Sales
Proceeds | Dividend
Income | Value,
end of
period |
Fidelity Series Emerging Markets Fund Class F | $ 131,220,990 | $ 67,119,478 | $ 22,238,839 | 1,486,093 | $ 173,731,228 |
Fidelity Series Equity-Income Fund Class F | 222,074,882 | 23,711,719 | 62,055,326 | 5,003,324 | 186,836,333 |
Fidelity Series Floating Rate High Income Fund Class F | 48,463,715 | 3,944,481 | 32,893,183 | 1,343,584 | 18,144,186 |
Fidelity Series Growth & Income Fund Class F | 168,310,715 | 15,778,233 | 48,961,157 | 3,056,679 | 142,632,022 |
Fidelity Series Growth Company Fund Class F | 175,859,579 | 2,624,101 | 32,231,181 | 626,672 | 173,214,356 |
Fidelity Series High Income Fund Class F | 244,241,991 | 19,956,631 | 125,061,584 | 10,325,035 | 125,373,657 |
Fidelity Series Inflation-Protected Bond Index Fund Class F | 76,857,501 | 36,534,203 | 24,020,134 | 238,613 | 88,288,666 |
Fidelity Series International Growth Fund Class F | 224,855,756 | 12,857,537 | 75,914,901 | 2,689,075 | 164,776,932 |
Fidelity Series International Small Cap Fund Class F | 52,103,797 | 2,175,586 | 15,685,600 | 446,792 | 37,449,336 |
Fidelity Series International Value Fund Class F | 227,777,669 | 18,776,719 | 67,447,407 | 7,643,687 | 161,945,521 |
Fidelity Series Intrinsic Opportunities Fund Class F | 108,238,903 | 10,371,587 | 32,032,628 | 1,630,943 | 95,349,205 |
Fidelity Series Investment Grade Bond Fund Class F | 1,157,213,539 | 294,840,138 | 257,432,611 | 31,637,446 | 1,227,012,891 |
Fidelity Series Opportunistic Insights Fund Class F | 107,650,969 | 11,834,110 | 37,147,338 | 82,053 | 93,030,589 |
Fidelity Series Real Estate Equity Fund Class F | 21,084,662 | 2,447,447 | 9,550,135 | 385,124 | 17,066,169 |
Fidelity Series Real Estate Income Fund Class F | 20,800,987 | 2,268,621 | 5,285,847 | 1,050,579 | 17,866,158 |
Fidelity Series Short-Term Credit Fund Class F | - | 153,893,916 | 234,651 | - | 153,813,150 |
Fidelity Series Small Cap Discovery Fund Class F | 27,383,990 | 1,816,850 | 6,786,851 | 88,458 | 24,689,234 |
Fidelity Series Small Cap Opportunities Fund Class F | 88,168,168 | 14,139,076 | 27,363,017 | 415,490 | 75,619,907 |
Fidelity Series Stock Selector Large Cap Value Fund Class F | 145,728,204 | 19,968,988 | 46,622,503 | 2,034,270 | 125,032,437 |
Fidelity Short-Term Bond Fund Class F | 274,250,140 | 16,726,510 | 291,313,348 | 2,142,900 | - |
Total | $ 4,338,134,419 | $ 806,459,669 | $ 1,561,086,939 | $ 77,862,583 | $ 3,669,597,062 |
Other Information |
All investments are categorized as Level 1 under the Fair Value Hierarchy. The inputs or methodology used for valuing securities may not be an indication of the risk associated with investing in those securities. For more information on valuation inputs, please refer to the Investment Valuation section in the accompanying Notes to Financial Statements. |
See accompanying notes which are an integral part of the financial statements.
Annual Report
Fidelity Freedom K® 2010 Fund
Statement of Assets and Liabilities
| March 31, 2015 |
| | |
Assets | | |
Investment in securities, at value (cost $3,309,214,720) - See accompanying schedule | | $ 3,669,597,062 |
Receivable for investments sold | | 10,561,824 |
Receivable for fund shares sold | | 1,995,620 |
Dividends receivable | | 126,065 |
Total assets | | 3,682,280,571 |
| | |
Liabilities | | |
Payable for investments purchased | $ 4,837,569 | |
Payable for fund shares redeemed | 7,732,814 | |
Transfer agent fees payable | 147,993 | |
Total liabilities | | 12,718,376 |
| | |
Net Assets | | $ 3,669,562,195 |
Net Assets consist of: | | |
Paid in capital | | $ 3,223,638,053 |
Undistributed net investment income | | 8,593,683 |
Accumulated undistributed net realized gain (loss) on investments | | 76,948,117 |
Net unrealized appreciation (depreciation) on investments | | 360,382,342 |
Net Assets, for 271,720,836 shares outstanding | | $ 3,669,562,195 |
Net Asset Value, offering price and redemption price per share ($3,669,562,195 ÷ 271,720,836 shares) | | $ 13.50 |
Statement of Operations
| Year ended March 31, 2015 |
| | |
Investment Income | | |
Income distributions from underlying funds | | $ 77,862,583 |
| | |
Expenses | | |
Transfer agent fees | $ 1,897,321 | |
Independent trustees' compensation | 17,728 | |
Total expenses | | 1,915,049 |
Net investment income (loss) | | 75,947,534 |
Realized and Unrealized Gain (Loss) Realized gain (loss) on sale of underlying fund shares | 65,143,711 | |
Capital gain distributions from underlying funds | 72,342,321 | |
Total net realized gain (loss) | | 137,486,032 |
Change in net unrealized appreciation (depreciation) on underlying funds | | 20,946,557 |
Net gain (loss) | | 158,432,589 |
Net increase (decrease) in net assets resulting from operations | | $ 234,380,123 |
See accompanying notes which are an integral part of the financial statements.
Annual Report
Statement of Changes in Net Assets
| Year ended
March 31,
2015 | Year ended
March 31,
2014 |
Increase (Decrease) in Net Assets | | |
Operations | | |
Net investment income (loss) | $ 75,947,534 | $ 67,609,529 |
Net realized gain (loss) | 137,486,032 | 252,129,951 |
Change in net unrealized appreciation (depreciation) | 20,946,557 | 45,253,139 |
Net increase (decrease) in net assets resulting from operations | 234,380,123 | 364,992,619 |
Distributions to shareholders from net investment income | (134,711,044) | (9,806,287) |
Distributions to shareholders from net realized gain | (303,393,320) | (87,556,064) |
Total distributions | (438,104,364) | (97,362,351) |
Share transactions
Proceeds from sales of shares | 833,571,107 | 1,064,119,323 |
Reinvestment of distributions | 438,104,364 | 97,362,351 |
Cost of shares redeemed | (1,736,353,492) | (1,790,931,189) |
Net increase (decrease) in net assets resulting from share transactions | (464,678,021) | (629,449,515) |
Total increase (decrease) in net assets | (668,402,262) | (361,819,247) |
| | |
Net Assets | | |
Beginning of period | 4,337,964,457 | 4,699,783,704 |
End of period (including undistributed net investment income of $8,593,683 and undistributed net investment income of $67,357,193, respectively) | $ 3,669,562,195 | $ 4,337,964,457 |
Other Information Shares | | |
Sold | 61,499,488 | 78,243,576 |
Issued in reinvestment of distributions | 33,140,333 | 7,309,486 |
Redeemed | (128,119,267) | (131,427,979) |
Net increase (decrease) | (33,479,446) | (45,874,917) |
Financial Highlights
Years ended March 31, | 2015 | 2014 | 2013 | 2012 | 2011 |
Selected Per-Share Data | | | | | |
Net asset value, beginning of period | $ 14.21 | $ 13.39 | $ 12.93 | $ 13.12 | $ 11.97 |
Income from Investment Operations | | | | | |
Net investment income (loss) A | .25 | .20 | .21 | .23 | .23 |
Net realized and unrealized gain (loss) | .53 | .90 | .74 | .14 | 1.21 |
Total from investment operations | .78 | 1.10 | .95 | .37 | 1.44 |
Distributions from net investment income | (.46) | (.03) | (.22) | (.20) | (.17) |
Distributions from net realized gain | (1.03) | (.25) | (.27) | (.36) | (.12) |
Total distributions | (1.49) | (.28) | (.49) | (.56) | (.29) |
Net asset value, end of period | $ 13.50 | $ 14.21 | $ 13.39 | $ 12.93 | $ 13.12 |
Total Return | 5.96% | 8.34% | 7.53% | 3.08% | 12.17% |
Ratios to Average Net Assets B, C | | | | | |
Expenses before reductions | .05% | .05% | .05% | .05% | .05% |
Expenses net of fee waivers, if any | .05% | .05% | .05% | .05% | .05% |
Expenses net of all reductions | .05% | .05% | .05% | .05% | .05% |
Net investment income (loss) | 1.88% | 1.48% | 1.65% | 1.85% | 1.82% |
Supplemental Data | | | | | |
Net assets, end of period (000 omitted) | $ 3,669,562 | $ 4,337,964 | $ 4,699,784 | $ 4,130,786 | $ 2,665,237 |
Portfolio turnover rate B | 20% | 39% | 30% | 28% | 42% |
A Calculated based on average shares outstanding during the period.
B Amounts do not include the activity of the Underlying Funds.
C Expense ratios reflect operating expenses of the Fund. Expenses before reductions do not reflect amounts reimbursed by the investment adviser or reductions from expense offset arrangements and do not represent the amount paid by the Fund during periods when reimbursements or reductions occur. Expenses net of fee waivers reflect expenses after reimbursement by the investment adviser but prior to reductions from expense offset arrangements. Expenses net of all reductions represent the net expenses paid by the Fund but do not include expenses of the underlying funds in which the Fund invests.
See accompanying notes which are an integral part of the financial statements.
Annual Report
Fidelity Freedom K® 2015 Fund
Investment Changes (Unaudited)
The information in the following tables is based on the direct investments of the Fund. |
Fund Holdings as of March 31, 2015 |
| % of fund's
net assets | % of fund's net assets
6 months ago |
Domestic Equity Funds | | |
Fidelity Series 100 Index Fund Class F | 1.4 | 1.4 |
Fidelity Series 1000 Value Index Fund Class F | 0.8 | 0.8 |
Fidelity Series All-Sector Equity Fund Class F | 4.6 | 4.7 |
Fidelity Series Blue Chip Growth Fund Class F | 3.6 | 4.1 |
Fidelity Series Commodity Strategy Fund Class F | 0.8 | 0.9 |
Fidelity Series Equity-Income Fund Class F | 5.9 | 6.1 |
Fidelity Series Growth & Income Fund Class F | 4.5 | 4.7 |
Fidelity Series Growth Company Fund Class F | 5.3 | 4.9 |
Fidelity Series Intrinsic Opportunities Fund Class F | 3.0 | 3.0 |
Fidelity Series Opportunistic Insights Fund Class F | 3.0 | 3.0 |
Fidelity Series Real Estate Equity Fund Class F | 0.5 | 0.5 |
Fidelity Series Small Cap Discovery Fund Class F | 0.8 | 0.7 |
Fidelity Series Small Cap Opportunities Fund Class F | 2.4 | 2.3 |
Fidelity Series Stock Selector Large Cap Value Fund Class F | 4.0 | 4.1 |
| 40.6 | 41.2 |
International Equity Funds | | |
Fidelity Series Emerging Markets Fund Class F | 5.3 | 4.0 |
Fidelity Series International Growth Fund Class F | 5.3 | 5.3 |
Fidelity Series International Small Cap Fund Class F | 1.2 | 1.2 |
Fidelity Series International Value Fund Class F | 5.2 | 5.6 |
| 17.0 | 16.1 |
Bond Funds | | |
Fidelity Series Emerging Markets Debt Fund Class F | 0.6 | 0.6 |
Fidelity Series Floating Rate High Income Fund Class F | 0.5 | 0.5 |
Fidelity Series High Income Fund Class F | 3.4 | 4.3 |
Fidelity Series Inflation-Protected Bond Index Fund Class F | 1.6 | 1.4 |
Fidelity Series Investment Grade Bond Fund Class F | 30.8 | 27.8 |
Fidelity Series Real Estate Income Fund Class F | 0.5 | 0.5 |
| 37.4 | 35.1 |
Short-Term Funds | | |
Fidelity Institutional Money Market Portfolio Class F | 2.8 | 4.2 |
Fidelity Series Short-Term Credit Fund Class F | 2.2 | 0.0 |
Fidelity Short-Term Bond Fund Class F | 0.0 | 3.4 |
| 5.0 | 7.6 |
Net Other Assets (Liabilities)* | 0.0 | 0.0 |
| 100.0 | 100.0 |
* Amount represents less than 0.1% |
Asset Allocation (% of fund's net assets) |
Period end |
 | Domestic Equity Funds** | 40.6% | |
 | International Equity Funds | 17.0% | |
 | Bond Funds | 37.4% | |
 | Short-Term Funds | 5.0% | |

Six months ago |
 | Domestic Equity Funds** | 41.2% | |
 | International Equity Funds | 16.1% | |
 | Bond Funds | 35.1% | |
 | Short-Term Funds | 7.6% | |

** Includes Fidelity Series Commodity Strategy Fund which invests in commodity-related investments. |
Annual Report
Fidelity Freedom K® 2015 Fund
Investments March 31, 2015
Showing Percentage of Net Assets
Domestic Equity Funds - 40.6% |
| Shares | | Value |
Fidelity Series 100 Index Fund Class F (c) | 7,043,251 | | $ 93,604,802 |
Fidelity Series 1000 Value Index Fund Class F (c) | 4,717,035 | | 52,830,796 |
Fidelity Series All-Sector Equity Fund Class F (c) | 21,643,613 | | 306,257,126 |
Fidelity Series Blue Chip Growth Fund Class F (c) | 18,942,925 | | 241,901,154 |
Fidelity Series Commodity Strategy Fund Class F (a)(c) | 8,452,709 | | 52,153,212 |
Fidelity Series Equity-Income Fund Class F (c) | 31,656,076 | | 399,816,243 |
Fidelity Series Growth & Income Fund Class F (c) | 22,459,766 | | 305,003,624 |
Fidelity Series Growth Company Fund Class F (c) | 28,471,617 | | 358,172,947 |
Fidelity Series Intrinsic Opportunities Fund Class F (c) | 13,486,168 | | 204,045,729 |
Fidelity Series Opportunistic Insights Fund Class F (c) | 12,889,915 | | 199,278,086 |
Fidelity Series Real Estate Equity Fund Class F (c) | 2,419,731 | | 36,344,363 |
Fidelity Series Small Cap Discovery Fund Class F (c) | 4,595,573 | | 51,929,977 |
Fidelity Series Small Cap Opportunities Fund Class F (c) | 11,825,694 | | 162,839,806 |
Fidelity Series Stock Selector Large Cap Value Fund Class F (c) | 20,518,162 | | 266,530,923 |
TOTAL DOMESTIC EQUITY FUNDS (Cost $2,226,128,298) |
2,730,708,788
|
International Equity Funds - 17.0% |
| | | |
Fidelity Series Emerging Markets Fund Class F (c) | 20,707,493 | | 352,855,673 |
Fidelity Series International Growth Fund Class F (c) | 24,655,206 | | 355,774,618 |
Fidelity Series International Small Cap Fund Class F (c) | 5,132,727 | | 81,610,353 |
Fidelity Series International Value Fund Class F (c) | 34,703,079 | | 352,236,247 |
TOTAL INTERNATIONAL EQUITY FUNDS (Cost $972,819,065) |
1,142,476,891
|
Bond Funds - 37.4% |
| Shares | | Value |
Fidelity Series Emerging Markets Debt Fund Class F (c) | 4,309,750 | | $ 41,847,670 |
Fidelity Series Floating Rate High Income Fund Class F (c) | 3,370,007 | | 33,059,773 |
Fidelity Series High Income Fund Class F (c) | 23,163,331 | | 227,000,643 |
Fidelity Series Inflation-Protected Bond Index Fund Class F (c) | 11,048,980 | | 107,838,041 |
Fidelity Series Investment Grade Bond Fund Class F (c) | 178,674,324 | | 2,067,261,932 |
Fidelity Series Real Estate Income Fund Class F (c) | 2,867,496 | | 32,431,380 |
TOTAL BOND FUNDS (Cost $2,505,894,083) |
2,509,439,439
|
Short-Term Funds - 5.0% |
| | | |
Fidelity Institutional Money Market Portfolio Class F 0.14% (b)(c) | 192,044,379 | | 192,044,379 |
Fidelity Series Short-Term Credit Fund Class F (c) | 14,623,237 | | 146,378,600 |
TOTAL SHORT-TERM FUNDS (Cost $338,276,746) |
338,422,979
|
TOTAL INVESTMENT PORTFOLIO - 100.0% (Cost $6,043,118,192) | 6,721,048,097 |
NET OTHER ASSETS (LIABILITIES) - 0.0% | | (149,538) |
NET ASSETS - 100% | $ 6,720,898,559 |
Legend |
(a) Non-income producing |
(b) The rate quoted is the annualized seven-day yield of the fund at period end. |
(c) Affiliated Fund |
Affiliated Underlying Funds |
Information regarding the Fund's fiscal year to date purchases and sales of the affiliated Underlying Funds and income earned by the Fund from investments in affiliated Underlying Funds is as follows: |
Affiliate | Value,
beginning of
period | Purchases | Sales
Proceeds | Dividend
Income | Value,
end of
period |
Fidelity Institutional Money Market Portfolio Class F | $ 388,323,850 | $ 19,695,996 | $ 215,975,467 | $ 268,914 | $ 192,044,379 |
Fidelity Series 100 Index Fund Class F | 85,798,408 | 22,109,108 | 22,106,048 | 2,028,271 | 93,604,802 |
Fidelity Series 1000 Value Index Fund Class F | 53,396,005 | 10,067,883 | 13,295,074 | 1,203,872 | 52,830,796 |
Fidelity Series All-Sector Equity Fund Class F | 346,328,439 | 57,446,661 | 100,645,394 | 3,439,098 | 306,257,126 |
Fidelity Series Blue Chip Growth Fund Class F | 279,333,485 | 48,426,566 | 132,481,662 | 982,461 | 241,901,154 |
Fidelity Series Commodity Strategy Fund Class F | 81,103,505 | 6,624,343 | 14,748,122 | - | 52,153,212 |
Fidelity Series Emerging Markets Debt Fund Class F | 42,247,330 | 11,041,672 | 9,143,177 | 2,600,622 | 41,847,670 |
Affiliate | Value,
beginning of
period | Purchases | Sales
Proceeds | Dividend
Income | Value,
end of
period |
Fidelity Series Emerging Markets Fund Class F | $ 249,572,323 | $ 138,782,750 | $ 30,798,993 | $ 2,913,892 | $ 352,855,673 |
Fidelity Series Equity-Income Fund Class F | 426,213,374 | 65,779,342 | 97,238,789 | 9,878,109 | 399,816,243 |
Fidelity Series Floating Rate High Income Fund Class F | 80,685,527 | 8,755,441 | 54,016,044 | 2,290,234 | 33,059,773 |
Fidelity Series Growth & Income Fund Class F | 327,743,855 | 40,965,509 | 78,333,234 | 6,072,895 | 305,003,624 |
Fidelity Series Growth Company Fund Class F | 344,327,084 | 6,410,948 | 45,547,673 | 1,250,421 | 358,172,947 |
Fidelity Series High Income Fund Class F | 418,501,613 | 44,823,463 | 212,208,763 | 18,005,854 | 227,000,643 |
Fidelity Series Inflation-Protected Bond Index Fund Class F | 98,132,623 | 32,087,870 | 21,102,722 | 297,357 | 107,838,041 |
Fidelity Series International Growth Fund Class F | 428,673,993 | 38,942,220 | 118,066,264 | 5,511,428 | 355,774,618 |
Fidelity Series International Small Cap Fund Class F | 103,990,762 | 7,137,085 | 27,417,825 | 916,187 | 81,610,353 |
Fidelity Series International Value Fund Class F | 433,701,625 | 50,272,709 | 96,731,466 | 15,794,070 | 352,236,247 |
Fidelity Series Intrinsic Opportunities Fund Class F | 208,329,810 | 30,148,874 | 51,821,554 | 3,301,634 | 204,045,729 |
Fidelity Series Investment Grade Bond Fund Class F | 1,723,285,662 | 598,162,627 | 305,134,324 | 49,477,579 | 2,067,261,932 |
Fidelity Series Opportunistic Insights Fund Class F | 210,943,778 | 26,954,299 | 59,763,663 | 168,086 | 199,278,086 |
Fidelity Series Real Estate Equity Fund Class F | 37,054,938 | 10,389,157 | 17,112,855 | 777,228 | 36,344,363 |
Fidelity Series Real Estate Income Fund Class F | 34,399,679 | 4,794,441 | 6,889,127 | 1,810,220 | 32,431,380 |
Fidelity Series Short-Term Credit Fund Class F | - | 146,618,755 | 386,766 | - | 146,378,600 |
Fidelity Series Small Cap Discovery Fund Class F | 52,613,189 | 5,941,483 | 11,214,417 | 175,494 | 51,929,977 |
Fidelity Series Small Cap Opportunities Fund Class F | 169,132,415 | 33,417,560 | 41,782,759 | 824,270 | 162,839,806 |
Fidelity Series Stock Selector Large Cap Value Fund Class F | 284,395,703 | 44,933,338 | 73,724,943 | 4,164,814 | 266,530,923 |
Fidelity Short-Term Bond Fund Class F | 317,907,616 | 23,500,056 | 341,747,068 | 2,351,398 | - |
Total | $ 7,226,136,591 | $ 1,534,230,156 | $ 2,199,434,193 | $ 136,504,408 | $ 6,721,048,097 |
Other Information |
All investments are categorized as Level 1 under the Fair Value Hierarchy. The inputs or methodology used for valuing securities may not be an indication of the risk associated with investing in those securities. For more information on valuation inputs, please refer to the Investment Valuation section in the accompanying Notes to Financial Statements. |
See accompanying notes which are an integral part of the financial statements.
Annual Report
Fidelity Freedom K® 2015 Fund
Statement of Assets and Liabilities
| March 31, 2015 |
| | |
Assets | | |
Investment in securities, at value (cost $6,043,118,192) - See accompanying schedule | | $ 6,721,048,097 |
Receivable for investments sold | | 26,116,849 |
Receivable for fund shares sold | | 5,059,236 |
Dividends receivable | | 120,026 |
Total assets | | 6,752,344,208 |
| | |
Liabilities | | |
Payable for investments purchased | $ 8,380,177 | |
Payable for fund shares redeemed | 22,800,800 | |
Transfer agent fees payable | 264,672 | |
Total liabilities | | 31,445,649 |
| | |
Net Assets | | $ 6,720,898,559 |
Net Assets consist of: | | |
Paid in capital | | $ 5,913,750,119 |
Undistributed net investment income | | 14,908,824 |
Accumulated undistributed net realized gain (loss) on investments | | 114,309,711 |
Net unrealized appreciation (depreciation) on investments | | 677,929,905 |
Net Assets, for 482,202,292 shares outstanding | | $ 6,720,898,559 |
Net Asset Value, offering price and redemption price per share ($6,720,898,559 ÷ 482,202,292 shares) | | $ 13.94 |
Statement of Operations
| Year ended March 31, 2015 |
| | |
Investment Income | | |
Income distributions from underlying funds | | $ 136,504,408 |
| | |
Expenses | | |
Transfer agent fees | $ 3,269,525 | |
Independent trustees' compensation | 30,309 | |
Total expenses | | 3,299,834 |
Net investment income (loss) | | 133,204,574 |
Realized and Unrealized Gain (Loss) Realized gain (loss) on sale of underlying fund shares | 50,658,317 | |
Capital gain distributions from underlying funds | 143,665,816 | |
Total net realized gain (loss) | | 194,324,133 |
Change in net unrealized appreciation (depreciation) on underlying funds | | 109,460,669 |
Net gain (loss) | | 303,784,802 |
Net increase (decrease) in net assets resulting from operations | | $ 436,989,376 |
See accompanying notes which are an integral part of the financial statements.
Annual Report
Fidelity Freedom K® 2015 Fund
Financial Statements - continued
Statement of Changes in Net Assets
| Year ended
March 31,
2015 | Year ended
March 31,
2014 |
Increase (Decrease) in Net Assets | | |
Operations | | |
Net investment income (loss) | $ 133,204,574 | $ 110,661,578 |
Net realized gain (loss) | 194,324,133 | 370,578,923 |
Change in net unrealized appreciation (depreciation) | 109,460,669 | 147,876,840 |
Net increase (decrease) in net assets resulting from operations | 436,989,376 | 629,117,341 |
Distributions to shareholders from net investment income | (228,656,023) | (14,431,750) |
Distributions to shareholders from net realized gain | (436,537,584) | (122,402,552) |
Total distributions | (665,193,607) | (136,834,302) |
Share transactions
Proceeds from sales of shares | 2,070,742,032 | 2,373,256,073 |
Reinvestment of distributions | 665,193,607 | 136,834,302 |
Cost of shares redeemed | (3,012,689,557) | (2,915,161,474) |
Net increase (decrease) in net assets resulting from share transactions | (276,753,918) | (405,071,099) |
Total increase (decrease) in net assets | (504,958,149) | 87,211,940 |
| | |
Net Assets | | |
Beginning of period | 7,225,856,708 | 7,138,644,768 |
End of period (including undistributed net investment income of $14,908,824 and undistributed net investment income of $110,360,273, respectively) | $ 6,720,898,559 | $ 7,225,856,708 |
Other Information Shares | | |
Sold | 149,078,388 | 172,742,684 |
Issued in reinvestment of distributions | 49,144,199 | 10,135,874 |
Redeemed | (216,956,617) | (211,598,007) |
Net increase (decrease) | (18,734,030) | (28,719,449) |
Financial Highlights
Years ended March 31, | 2015 | 2014 | 2013 | 2012 | 2011 |
Selected Per-Share Data | | | | | |
Net asset value, beginning of period | $ 14.42 | $ 13.48 | $ 12.98 | $ 13.17 | $ 12.01 |
Income from Investment Operations | | | | | |
Net investment income (loss) A | .27 | .21 | .22 | .24 | .23 |
Net realized and unrealized gain (loss) | .60 | .99 | .75 | .13 | 1.24 |
Total from investment operations | .87 | 1.20 | .97 | .37 | 1.47 |
Distributions from net investment income | (.47) | (.03) | (.21) | (.20) | (.18) |
Distributions from net realized gain | (.89) | (.23) | (.26) | (.36) | (.14) |
Total distributions | (1.35) E | (.26) | (.47) | (.56) | (.31) D |
Net asset value, end of period | $ 13.94 | $ 14.42 | $ 13.48 | $ 12.98 | $ 13.17 |
Total Return | 6.54% | 9.00% | 7.70% | 3.00% | 12.42% |
Ratios to Average Net Assets B, C | | | | | |
Expenses before reductions | .05% | .05% | .05% | .05% | .05% |
Expenses net of fee waivers, if any | .05% | .05% | .05% | .05% | .05% |
Expenses net of all reductions | .05% | .05% | .05% | .05% | .05% |
Net investment income (loss) | 1.91% | 1.52% | 1.68% | 1.86% | 1.83% |
Supplemental Data | | | | | |
Net assets, end of period (000 omitted) | $ 6,720,899 | $ 7,225,857 | $ 7,138,645 | $ 5,466,181 | $ 3,148,854 |
Portfolio turnover rate B | 22% | 43% | 21% | 23% | 35% |
A Calculated based on average shares outstanding during the period.
B Amounts do not include the activity of the Underlying Funds.
C Expense ratios reflect operating expenses of the Fund. Expenses before reductions do not reflect amounts reimbursed by the investment adviser or reductions from expense offset arrangements and do not represent the amount paid by the Fund during periods when reimbursements or reductions occur. Expenses net of fee waivers reflect expenses after reimbursement by the investment adviser but prior to reductions from expense offset arrangements. Expenses net of all reductions represent the net expenses paid by the Fund but do not include expenses of the underlying funds in which the Fund invests.
D Total distributions of $.31 per share is comprised of distributions from net investment income of $.176 and distributions from net realized gain of $.137 per share.
E Total distributions of $1.35 per share is comprised of distributions from net investment income of $.465 and distributions from net realized gain of $.889 per share.
See accompanying notes which are an integral part of the financial statements.
Annual Report
Fidelity Freedom K® 2020 Fund
Investment Changes (Unaudited)
The information in the following tables is based on the direct investments of the Fund. |
Fund Holdings as of March 31, 2015 |
| % of fund's
net assets | % of fund's net assets
6 months ago |
Domestic Equity Funds | | |
Fidelity Series 100 Index Fund Class F | 1.5 | 1.5 |
Fidelity Series 1000 Value Index Fund Class F | 0.9 | 0.9 |
Fidelity Series All-Sector Equity Fund Class F | 5.0 | 5.2 |
Fidelity Series Blue Chip Growth Fund Class F | 4.0 | 4.5 |
Fidelity Series Commodity Strategy Fund Class F | 0.8 | 1.0 |
Fidelity Series Equity-Income Fund Class F | 6.6 | 6.7 |
Fidelity Series Growth & Income Fund Class F | 5.0 | 5.2 |
Fidelity Series Growth Company Fund Class F | 5.9 | 5.4 |
Fidelity Series Intrinsic Opportunities Fund Class F | 3.4 | 3.3 |
Fidelity Series Opportunistic Insights Fund Class F | 3.3 | 3.4 |
Fidelity Series Real Estate Equity Fund Class F | 0.6 | 0.6 |
Fidelity Series Small Cap Discovery Fund Class F | 0.8 | 0.8 |
Fidelity Series Small Cap Opportunities Fund Class F | 2.7 | 2.5 |
Fidelity Series Stock Selector Large Cap Value Fund Class F | 4.4 | 4.5 |
| 44.9 | 45.5 |
International Equity Funds | | |
Fidelity Series Emerging Markets Fund Class F | 5.7 | 4.5 |
Fidelity Series International Growth Fund Class F | 5.9 | 5.9 |
Fidelity Series International Small Cap Fund Class F | 1.4 | 1.4 |
Fidelity Series International Value Fund Class F | 5.8 | 6.0 |
| 18.8 | 17.8 |
Bond Funds | | |
Fidelity Series Emerging Markets Debt Fund Class F | 0.6 | 0.6 |
Fidelity Series Floating Rate High Income Fund Class F | 0.5 | 0.5 |
Fidelity Series High Income Fund Class F | 3.4 | 4.3 |
Fidelity Series Inflation-Protected Bond Index Fund Class F | 0.8 | 0.9 |
Fidelity Series Investment Grade Bond Fund Class F | 27.1 | 24.2 |
Fidelity Series Real Estate Income Fund Class F | 0.5 | 0.5 |
| 32.9 | 31.0 |
Short-Term Funds | | |
Fidelity Institutional Money Market Portfolio Class F | 1.9 | 3.0 |
Fidelity Series Short-Term Credit Fund Class F | 1.5 | 0.0 |
Fidelity Short-Term Bond Fund Class F | 0.0 | 2.7 |
| 3.4 | 5.7 |
Net Other Assets (Liabilities)* | 0.0 | 0.0 |
| 100.0 | 100.0 |
* Amount represents less than 0.1% |
Asset Allocation (% of fund's net assets) |
Period end |
 | Domestic Equity Funds** | 44.9% | |
 | International Equity Funds | 18.8% | |
 | Bond Funds | 32.9% | |
 | Short-Term Funds | 3.4% | |

Six months ago |
 | Domestic Equity Funds** | 45.5% | |
 | International Equity Funds | 17.8% | |
 | Bond Funds | 31.0% | |
 | Short-Term Funds | 5.7% | |

** Includes Fidelity Series Commodity Strategy Fund which invests in commodity-related investments. |
Annual Report
Fidelity Freedom K® 2020 Fund
Investments March 31, 2015
Showing Percentage of Net Assets
Domestic Equity Funds - 44.9% |
| Shares | | Value |
Fidelity Series 100 Index Fund Class F (c) | 20,221,639 | | $ 268,745,579 |
Fidelity Series 1000 Value Index Fund Class F (c) | 13,622,368 | | 152,570,520 |
Fidelity Series All-Sector Equity Fund Class F (c) | 62,376,145 | | 882,622,458 |
Fidelity Series Blue Chip Growth Fund Class F (c) | 54,379,550 | | 694,426,859 |
Fidelity Series Commodity Strategy Fund Class F (a)(c) | 21,906,257 | | 135,161,608 |
Fidelity Series Equity-Income Fund Class F (c) | 91,305,171 | | 1,153,184,304 |
Fidelity Series Growth & Income Fund Class F (c) | 64,716,782 | | 878,853,898 |
Fidelity Series Growth Company Fund Class F (c) | 81,675,186 | | 1,027,473,838 |
Fidelity Series Intrinsic Opportunities Fund Class F (c) | 38,832,120 | | 587,529,980 |
Fidelity Series Opportunistic Insights Fund Class F (c) | 37,150,162 | | 574,341,509 |
Fidelity Series Real Estate Equity Fund Class F (c) | 6,967,385 | | 104,650,121 |
Fidelity Series Small Cap Discovery Fund Class F (c) | 13,069,213 | | 147,682,111 |
Fidelity Series Small Cap Opportunities Fund Class F (c) | 34,437,162 | | 474,199,719 |
Fidelity Series Stock Selector Large Cap Value Fund Class F (c) | 59,083,231 | | 767,491,173 |
TOTAL DOMESTIC EQUITY FUNDS (Cost $6,481,394,226) |
7,848,933,677
|
International Equity Funds - 18.8% |
| | | |
Fidelity Series Emerging Markets Fund Class F (c) | 58,048,873 | | 989,152,804 |
Fidelity Series International Growth Fund Class F (c) | 71,541,677 | | 1,032,346,404 |
Fidelity Series International Small Cap Fund Class F (c) | 14,926,331 | | 237,328,660 |
Fidelity Series International Value Fund Class F (c) | 100,895,581 | | 1,024,090,149 |
TOTAL INTERNATIONAL EQUITY FUNDS (Cost $2,857,875,750) |
3,282,918,017
|
Bond Funds - 32.9% |
| Shares | | Value |
Fidelity Series Emerging Markets Debt Fund Class F (c) | 11,245,527 | | $ 109,194,068 |
Fidelity Series Floating Rate High Income Fund Class F (c) | 8,726,058 | | 85,602,629 |
Fidelity Series High Income Fund Class F (c) | 59,955,020 | | 587,559,200 |
Fidelity Series Inflation-Protected Bond Index Fund Class F (c) | 15,144,983 | | 147,815,036 |
Fidelity Series Investment Grade Bond Fund Class F (c) | 410,350,298 | | 4,747,752,946 |
Fidelity Series Real Estate Income Fund Class F (c) | 7,439,723 | | 84,143,267 |
TOTAL BOND FUNDS (Cost $5,759,387,787) |
5,762,067,146
|
Short-Term Funds - 3.4% |
| | | |
Fidelity Institutional Money Market Portfolio Class F 0.14% (b)(c) | 335,889,086 | | 335,889,086 |
Fidelity Series Short-Term Credit Fund Class F (c) | 26,087,298 | | 261,133,855 |
TOTAL SHORT-TERM FUNDS (Cost $596,762,068) |
597,022,941
|
TOTAL INVESTMENT PORTFOLIO - 100.0% (Cost $15,695,419,831) | | 17,490,941,781 |
NET OTHER ASSETS (LIABILITIES) - 0.0% | | (487,586) |
NET ASSETS - 100% | $ 17,490,454,195 |
Legend |
(a) Non-income producing |
(b) The rate quoted is the annualized seven-day yield of the fund at period end. |
(c) Affiliated Fund |
Affiliated Underlying Funds |
Information regarding the Fund's fiscal year to date purchases and sales of the affiliated Underlying Funds and income earned by the Fund from investments in affiliated Underlying Funds is as follows: |
Affiliate | Value,
beginning of
period | Purchases | Sales
Proceeds | Dividend
Income | Value,
end of
period |
Fidelity Institutional Money Market Portfolio Class F | $ 605,962,850 | $ 35,948,463 | $ 306,022,227 | $ 453,101 | $ 335,889,086 |
Fidelity Series 100 Index Fund Class F | 222,265,705 | 67,735,953 | 41,982,366 | 5,716,648 | 268,745,579 |
Fidelity Series 1000 Value Index Fund Class F | 136,320,588 | 34,953,558 | 25,694,217 | 3,404,734 | 152,570,520 |
Fidelity Series All-Sector Equity Fund Class F | 893,854,428 | 168,254,188 | 185,122,589 | 9,723,981 | 882,622,458 |
Fidelity Series Blue Chip Growth Fund Class F | 747,989,031 | 102,161,781 | 286,631,834 | 2,745,007 | 694,426,859 |
Fidelity Series Commodity Strategy Fund Class F | 196,853,166 | 17,262,741 | 26,471,907 | - | 135,161,608 |
Fidelity Series Emerging Markets Debt Fund Class F | 119,128,172 | 14,455,226 | 18,842,503 | 6,642,677 | 109,194,068 |
Fidelity Series Emerging Markets Fund Class F | 664,985,790 | 385,445,998 | 45,362,133 | 8,049,179 | 989,152,804 |
Affiliate | Value,
beginning of
period | Purchases | Sales
Proceeds | Dividend
Income | Value,
end of
period |
Fidelity Series Equity-Income Fund Class F | $ 1,126,996,192 | $ 204,022,598 | $ 189,767,424 | $ 27,142,357 | $ 1,153,184,304 |
Fidelity Series Floating Rate High Income Fund Class F | 188,933,942 | 17,834,629 | 115,212,082 | 5,642,671 | 85,602,629 |
Fidelity Series Growth & Income Fund Class F | 863,557,686 | 122,182,180 | 146,904,861 | 16,641,994 | 878,853,898 |
Fidelity Series Growth Company Fund Class F | 914,223,789 | 22,417,159 | 54,357,654 | 3,472,997 | 1,027,473,838 |
Fidelity Series High Income Fund Class F | 1,041,552,233 | 121,497,219 | 513,126,932 | 46,167,351 | 587,559,200 |
Fidelity Series Inflation-Protected Bond Index Fund Class F | 163,620,641 | 14,931,924 | 29,448,939 | 456,693 | 147,815,036 |
Fidelity Series International Growth Fund Class F | 1,135,585,423 | 128,894,948 | 250,852,075 | 15,737,006 | 1,032,346,404 |
Fidelity Series International Small Cap Fund Class F | 263,708,117 | 22,391,234 | 43,493,486 | 2,591,053 | 237,328,660 |
Fidelity Series International Value Fund Class F | 1,147,982,030 | 160,319,136 | 187,838,154 | 44,195,222 | 1,024,090,149 |
Fidelity Series Intrinsic Opportunities Fund Class F | 555,643,492 | 83,862,188 | 100,954,813 | 9,187,766 | 587,529,980 |
Fidelity Series Investment Grade Bond Fund Class F | 3,736,165,116 | 1,325,778,010 | 426,449,118 | 109,946,393 | 4,747,752,946 |
Fidelity Series Opportunistic Insights Fund Class F | 567,128,875 | 75,573,112 | 127,048,056 | 473,492 | 574,341,509 |
Fidelity Series Real Estate Equity Fund Class F | 96,312,738 | 22,428,808 | 30,370,212 | 2,109,657 | 104,650,121 |
Fidelity Series Real Estate Income Fund Class F | 82,419,701 | 12,861,517 | 11,406,177 | 4,553,890 | 84,143,267 |
Fidelity Series Short-Term Credit Fund Class F | - | 261,447,911 | 575,488 | - | 261,133,855 |
Fidelity Series Small Cap Discovery Fund Class F | 136,671,355 | 18,493,459 | 20,530,822 | 478,549 | 147,682,111 |
Fidelity Series Small Cap Opportunities Fund Class F | 453,282,565 | 92,421,277 | 78,222,025 | 2,324,932 | 474,199,719 |
Fidelity Series Stock Selector Large Cap Value Fund Class F | 763,538,536 | 134,972,971 | 159,995,937 | 11,775,619 | 767,491,173 |
Fidelity Short-Term Bond Fund Class F | 497,916,457 | 43,157,565 | 541,636,284 | 3,969,141 | - |
Total | $ 17,322,598,618 | $ 3,711,705,753 | $ 3,964,320,315 | $ 343,602,110 | $ 17,490,941,781 |
Other Information |
All investments are categorized as Level 1 under the Fair Value Hierarchy. The inputs or methodology used for valuing securities may not be an indication of the risk associated with investing in those securities. For more information on valuation inputs, please refer to the Investment Valuation section in the accompanying Notes to Financial Statements. |
See accompanying notes which are an integral part of the financial statements.
Annual Report
Fidelity Freedom K® 2020 Fund
Statement of Assets and Liabilities
| March 31, 2015 |
| | |
Assets | | |
Investment in securities, at value (cost $15,695,419,831) - See accompanying schedule | | $ 17,490,941,781 |
Receivable for investments sold | | 60,861,766 |
Receivable for fund shares sold | | 16,413,185 |
Dividends receivable | | 213,660 |
Total assets | | 17,568,430,392 |
| | |
Liabilities | | |
Payable for investments purchased | $ 21,989,017 | |
Payable for fund shares redeemed | 55,297,527 | |
Transfer agent fees payable | 689,653 | |
Total liabilities | | 77,976,197 |
| | |
Net Assets | | $ 17,490,454,195 |
Net Assets consist of: | | |
Paid in capital | | $ 15,390,893,814 |
Undistributed net investment income | | 22,699,395 |
Accumulated undistributed net realized gain (loss) on investments | | 281,339,036 |
Net unrealized appreciation (depreciation) on investments | | 1,795,521,950 |
Net Assets, for 1,196,534,535 shares outstanding | | $ 17,490,454,195 |
Net Asset Value, offering price and redemption price per share ($17,490,454,195 ÷ 1,196,534,535 shares) | | $ 14.62 |
Statement of Operations
| Year ended March 31, 2015 |
| | |
Investment Income | | |
Income distributions from underlying funds | | $ 343,602,110 |
| | |
Expenses | | |
Transfer agent fees | $ 8,186,813 | |
Independent trustees' compensation | 75,249 | |
Total expenses | | 8,262,062 |
Net investment income (loss) | | 335,340,048 |
Realized and Unrealized Gain (Loss) Realized gain (loss) on sale of underlying fund shares | 59,475,704 | |
Capital gain distributions from underlying funds | 398,189,085 | |
Total net realized gain (loss) | | 457,664,789 |
Change in net unrealized appreciation (depreciation) on underlying funds | | 361,482,009 |
Net gain (loss) | | 819,146,798 |
Net increase (decrease) in net assets resulting from operations | | $ 1,154,486,846 |
See accompanying notes which are an integral part of the financial statements.
Annual Report
Statement of Changes in Net Assets
| Year ended
March 31,
2015 | Year ended
March 31,
2014 |
Increase (Decrease) in Net Assets | | |
Operations | | |
Net investment income (loss) | $ 335,340,048 | $ 262,430,581 |
Net realized gain (loss) | 457,664,789 | 897,404,988 |
Change in net unrealized appreciation (depreciation) | 361,482,009 | 440,491,871 |
Net increase (decrease) in net assets resulting from operations | 1,154,486,846 | 1,600,327,440 |
Distributions to shareholders from net investment income | (574,473,460) | (32,613,953) |
Distributions to shareholders from net realized gain | (1,048,384,789) | (293,525,248) |
Total distributions | (1,622,858,249) | (326,139,201) |
Share transactions
Proceeds from sales of shares | 4,701,441,140 | 4,821,205,670 |
Reinvestment of distributions | 1,622,858,249 | 326,139,201 |
Cost of shares redeemed | (5,687,397,659) | (5,151,550,145) |
Net increase (decrease) in net assets resulting from share transactions | 636,901,730 | (4,205,274) |
Total increase (decrease) in net assets | 168,530,327 | 1,269,982,965 |
| | |
Net Assets | | |
Beginning of period | 17,321,923,868 | 16,051,940,903 |
End of period (including undistributed net investment income of $22,699,395 and undistributed net investment income of $261,832,807, respectively) | $ 17,490,454,195 | $ 17,321,923,868 |
Other Information Shares | | |
Sold | 323,653,682 | 336,544,773 |
Issued in reinvestment of distributions | 114,656,389 | 23,262,425 |
Redeemed | (391,258,780) | (358,225,587) |
Net increase (decrease) | 47,051,291 | 1,581,611 |
Financial Highlights
Years ended March 31, | 2015 | 2014 | 2013 | 2012 | 2011 |
Selected Per-Share Data | | | | | |
Net asset value, beginning of period | $ 15.07 | $ 13.98 | $ 13.42 | $ 13.72 | $ 12.37 |
Income from Investment Operations | | | | | |
Net investment income (loss) A | .28 | .22 | .24 | .25 | .24 |
Net realized and unrealized gain (loss) | .68 | 1.15 | .82 | .06 | 1.42 |
Total from investment operations | .96 | 1.37 | 1.06 | .31 | 1.66 |
Distributions from net investment income | (.49) | (.03) | (.23) | (.21) | (.18) |
Distributions from net realized gain | (.91) | (.25) | (.27) | (.40) | (.13) |
Total distributions | (1.41) D | (.28) | (.50) | (.61) | (.31) |
Net asset value, end of period | $ 14.62 | $ 15.07 | $ 13.98 | $ 13.42 | $ 13.72 |
Total Return | 6.84% | 9.95% | 8.17% | 2.50% | 13.62% |
Ratios to Average Net Assets B, C | | | | | |
Expenses before reductions | .05% | .05% | .05% | .05% | .05% |
Expenses net of fee waivers, if any | .05% | .05% | .05% | .05% | .05% |
Expenses net of all reductions | .05% | .05% | .05% | .05% | .05% |
Net investment income (loss) | 1.92% | 1.56% | 1.78% | 1.94% | 1.89% |
Supplemental Data | | | | | |
Net assets, end of period (000 omitted) | $ 17,490,454 | $ 17,321,924 | $ 16,051,941 | $ 12,054,451 | $ 6,632,569 |
Portfolio turnover rate B | 21% | 43% | 23% | 21% | 37% |
A Calculated based on average shares outstanding during the period.
B Amounts do not include the activity of the Underlying Funds.
C Expense ratios reflect operating expenses of the Fund. Expenses before reductions do not reflect amounts reimbursed by the investment adviser or reductions from expense offset arrangements and do not represent the amount paid by the Fund during periods when reimbursements or reductions occur. Expenses net of fee waivers reflect expenses after reimbursement by the investment adviser but prior to reductions from expense offset arrangements. Expenses net of all reductions represent the net expenses paid by the Fund but do not include expenses of the underlying funds in which the Fund invests.
D Total distributions of $1.41 per share is comprised of distributions from net investment income of $.492 and distributions from net realized gain of $.914 per share.
See accompanying notes which are an integral part of the financial statements.
Annual Report
Fidelity Freedom K® 2025 Fund
Investment Changes (Unaudited)
The information in the following tables is based on the direct investments of the Fund. |
Fund Holdings as of March 31, 2015 |
| % of fund's
net assets | % of fund's net assets
6 months ago |
Domestic Equity Funds | | |
Fidelity Series 100 Index Fund Class F | 1.8 | 1.8 |
Fidelity Series 1000 Value Index Fund Class F | 1.0 | 1.0 |
Fidelity Series All-Sector Equity Fund Class F | 5.8 | 6.0 |
Fidelity Series Blue Chip Growth Fund Class F | 4.6 | 5.2 |
Fidelity Series Commodity Strategy Fund Class F | 0.8 | 1.0 |
Fidelity Series Equity-Income Fund Class F | 7.5 | 7.8 |
Fidelity Series Growth & Income Fund Class F | 5.7 | 6.0 |
Fidelity Series Growth Company Fund Class F | 6.6 | 6.2 |
Fidelity Series Intrinsic Opportunities Fund Class F | 3.8 | 3.8 |
Fidelity Series Opportunistic Insights Fund Class F | 3.7 | 3.9 |
Fidelity Series Real Estate Equity Fund Class F | 0.7 | 0.7 |
Fidelity Series Small Cap Discovery Fund Class F | 1.0 | 0.9 |
Fidelity Series Small Cap Opportunities Fund Class F | 3.0 | 3.0 |
Fidelity Series Stock Selector Large Cap Value Fund Class F | 5.0 | 5.2 |
| 51.0 | 52.5 |
International Equity Funds | | |
Fidelity Series Emerging Markets Fund Class F | 6.4 | 5.6 |
Fidelity Series International Growth Fund Class F | 6.8 | 6.8 |
Fidelity Series International Small Cap Fund Class F | 1.6 | 1.6 |
Fidelity Series International Value Fund Class F | 6.7 | 7.2 |
| 21.5 | 21.2 |
Bond Funds | | |
Fidelity Series Emerging Markets Debt Fund Class F | 0.6 | 0.7 |
Fidelity Series Floating Rate High Income Fund Class F | 0.5 | 0.5 |
Fidelity Series High Income Fund Class F | 3.4 | 4.7 |
Fidelity Series Inflation-Protected Bond Index Fund Class F | 0.0* | 0.5 |
Fidelity Series Investment Grade Bond Fund Class F | 19.7 | 18.7 |
Fidelity Series Real Estate Income Fund Class F | 0.5 | 0.5 |
| 24.7 | 25.6 |
Short-Term Funds | | |
Fidelity Institutional Money Market Portfolio Class F | 1.7 | 0.4 |
Fidelity Series Short-Term Credit Fund Class F | 1.1 | 0.0 |
Fidelity Short-Term Bond Fund Class F | 0.0 | 0.3 |
| 2.8 | 0.7 |
Net Other Assets (Liabilities)* | 0.0 | 0.0 |
| 100.0 | 100.0 |
* Amount represents less than 0.1% |
Asset Allocation (% of fund's net assets) |
Period end |
 | Domestic Equity Funds** | 51.0% | |
 | International Equity Funds | 21.5% | |
 | Bond Funds | 24.7% | |
 | Short-Term Funds | 2.8% | |

Six months ago |
 | Domestic Equity Funds** | 52.5% | |
 | International Equity Funds | 21.2% | |
 | Bond Funds | 25.6% | |
 | Short-Term Funds | 0.7% | |

** Includes Fidelity Series Commodity Strategy Fund which invests in commodity-related investments. |
Annual Report
Fidelity Freedom K® 2025 Fund
Investments March 31, 2015
Showing Percentage of Net Assets
Domestic Equity Funds - 51.0% |
| Shares | | Value |
Fidelity Series 100 Index Fund Class F (c) | 17,133,387 | | $ 227,702,715 |
Fidelity Series 1000 Value Index Fund Class F (c) | 11,584,708 | | 129,748,733 |
Fidelity Series All-Sector Equity Fund Class F (c) | 52,529,745 | | 743,295,885 |
Fidelity Series Blue Chip Growth Fund Class F (c) | 46,056,414 | | 588,140,403 |
Fidelity Series Commodity Strategy Fund Class F (a)(c) | 15,907,533 | | 98,149,478 |
Fidelity Series Equity-Income Fund Class F (c) | 76,467,078 | | 965,779,195 |
Fidelity Series Growth & Income Fund Class F (c) | 54,627,893 | | 741,846,793 |
Fidelity Series Growth Company Fund Class F (c) | 68,222,662 | | 858,241,086 |
Fidelity Series Intrinsic Opportunities Fund Class F (c) | 32,644,708 | | 493,914,435 |
Fidelity Series Opportunistic Insights Fund Class F (c) | 31,284,930 | | 483,665,019 |
Fidelity Series Real Estate Equity Fund Class F (c) | 5,878,582 | | 88,296,301 |
Fidelity Series Small Cap Discovery Fund Class F (c) | 11,557,711 | | 130,602,139 |
Fidelity Series Small Cap Opportunities Fund Class F (c) | 28,550,849 | | 393,145,194 |
Fidelity Series Stock Selector Large Cap Value Fund Class F (c) | 50,097,395 | | 650,765,165 |
TOTAL DOMESTIC EQUITY FUNDS (Cost $5,502,512,238) |
6,593,292,541
|
International Equity Funds - 21.5% |
| | | |
Fidelity Series Emerging Markets Fund Class F (c) | 48,335,008 | | 823,628,539 |
Fidelity Series International Growth Fund Class F (c) | 61,488,394 | | 887,277,524 |
Fidelity Series International Small Cap Fund Class F (c) | 12,751,002 | | 202,740,935 |
Fidelity Series International Value Fund Class F (c) | 85,884,164 | | 871,724,264 |
TOTAL INTERNATIONAL EQUITY FUNDS (Cost $2,473,438,435) |
2,785,371,262
|
Bond Funds - 24.7% |
| Shares | | Value |
Fidelity Series Emerging Markets Debt Fund Class F (c) | 8,256,665 | | $ 80,172,214 |
Fidelity Series Floating Rate High Income Fund Class F (c) | 6,379,696 | | 62,584,818 |
Fidelity Series High Income Fund Class F (c) | 45,114,883 | | 442,125,851 |
Fidelity Series Inflation-Protected Bond Index Fund Class F (c) | 291,841 | | 2,848,364 |
Fidelity Series Investment Grade Bond Fund Class F (c) | 219,321,099 | | 2,537,545,120 |
Fidelity Series Real Estate Income Fund Class F (c) | 5,463,263 | | 61,789,506 |
TOTAL BOND FUNDS (Cost $3,182,118,635) |
3,187,065,873
|
Short-Term Funds - 2.8% |
| | | |
Fidelity Institutional Money Market Portfolio Class F 0.14% (b)(c) | 227,514,242 | | 227,514,242 |
Fidelity Series Short-Term Credit Fund Class F (c) | 13,829,544 | | 138,433,736 |
TOTAL SHORT-TERM FUNDS (Cost $365,809,683) |
365,947,978
|
TOTAL INVESTMENT PORTFOLIO - 100.0% (Cost $11,523,878,991) | | 12,931,677,654 |
NET OTHER ASSETS (LIABILITIES) - 0.0% | | (396,151) |
NET ASSETS - 100% | $ 12,931,281,503 |
Legend |
(a) Non-income producing |
(b) The rate quoted is the annualized seven-day yield of the fund at period end. |
(c) Affiliated Fund |
Affiliated Underlying Funds |
Information regarding the Fund's fiscal year to date purchases and sales of the affiliated Underlying Funds and income earned by the Fund from investments in affiliated Underlying Funds is as follows: |
Affiliate | Value,
beginning of
period | Purchases | Sales
Proceeds | Dividend
Income | Value,
end of
period |
Fidelity Institutional Money Market Portfolio Class F | $ 30,377,402 | $ 207,543,752 | $ 10,406,912 | $ 96,928 | $ 227,514,242 |
Fidelity Series 100 Index Fund Class F | 182,410,365 | 60,336,155 | 32,145,037 | 4,718,961 | 227,702,715 |
Fidelity Series 1000 Value Index Fund Class F | 122,574,455 | 24,890,848 | 23,534,962 | 2,811,253 | 129,748,733 |
Fidelity Series All-Sector Equity Fund Class F | 715,821,743 | 177,725,281 | 153,732,734 | 8,023,971 | 743,295,885 |
Fidelity Series Blue Chip Growth Fund Class F | 603,581,385 | 100,439,995 | 222,713,162 | 2,245,893 | 588,140,403 |
Fidelity Series Commodity Strategy Fund Class F | 148,551,214 | 17,515,164 | 30,734,525 | - | 98,149,478 |
Fidelity Series Emerging Markets Debt Fund Class F | 80,533,314 | 14,574,174 | 11,020,110 | 4,661,498 | 80,172,214 |
Affiliate | Value,
beginning of
period | Purchases | Sales
Proceeds | Dividend
Income | Value,
end of
period |
Fidelity Series Emerging Markets Fund Class F | $ 541,833,587 | $ 357,812,510 | $ 58,524,531 | $ 6,934,260 | $ 823,628,539 |
Fidelity Series Equity-Income Fund Class F | 892,099,428 | 215,918,189 | 150,680,247 | 21,976,600 | 965,779,195 |
Fidelity Series Floating Rate High Income Fund Class F | 105,509,655 | 16,336,726 | 55,106,977 | 3,585,232 | 62,584,818 |
Fidelity Series Growth & Income Fund Class F | 689,238,591 | 145,577,240 | 125,428,108 | 13,519,860 | 741,846,793 |
Fidelity Series Growth Company Fund Class F | 724,030,320 | 40,431,122 | 24,252,029 | 2,824,360 | 858,241,086 |
Fidelity Series High Income Fund Class F | 743,046,588 | 108,860,301 | 363,882,538 | 33,758,186 | 442,125,851 |
Fidelity Series Inflation-Protected Bond Index Fund Class F | 61,490,480 | 8,127,537 | 67,259,176 | 110,469 | 2,848,364 |
Fidelity Series International Growth Fund Class F | 905,212,840 | 134,127,192 | 167,558,988 | 12,874,098 | 887,277,524 |
Fidelity Series International Small Cap Fund Class F | 215,573,958 | 27,870,479 | 36,674,530 | 2,158,480 | 202,740,935 |
Fidelity Series International Value Fund Class F | 910,926,175 | 176,024,242 | 134,985,462 | 36,244,171 | 871,724,264 |
Fidelity Series Intrinsic Opportunities Fund Class F | 442,679,378 | 93,190,460 | 81,614,970 | 7,585,279 | 493,914,435 |
Fidelity Series Investment Grade Bond Fund Class F | 2,021,522,254 | 703,220,241 | 247,668,293 | 59,837,026 | 2,537,545,120 |
Fidelity Series Opportunistic Insights Fund Class F | 449,091,202 | 92,225,736 | 105,711,116 | 389,631 | 483,665,019 |
Fidelity Series Real Estate Equity Fund Class F | 81,126,643 | 24,383,374 | 30,598,950 | 1,717,132 | 88,296,301 |
Fidelity Series Real Estate Income Fund Class F | 56,279,472 | 12,525,721 | 7,196,695 | 3,228,951 | 61,789,506 |
Fidelity Series Short-Term Credit Fund Class F | - | 138,527,356 | 232,139 | - | 138,433,736 |
Fidelity Series Small Cap Discovery Fund Class F | 106,159,140 | 28,326,344 | 15,308,437 | 399,118 | 130,602,139 |
Fidelity Series Small Cap Opportunities Fund Class F | 362,057,625 | 99,695,715 | 74,530,851 | 1,944,940 | 393,145,194 |
Fidelity Series Stock Selector Large Cap Value Fund Class F | 581,248,217 | 158,602,252 | 110,259,407 | 9,724,148 | 650,765,165 |
Fidelity Short-Term Bond Fund Class F | 24,859,824 | 124,863,750 | 149,940,248 | 766,046 | - |
Total | $ 11,797,835,255 | $ 3,309,671,856 | $ 2,491,701,134 | $ 242,136,491 | $ 12,931,677,654 |
Other Information |
All investments are categorized as Level 1 under the Fair Value Hierarchy. The inputs or methodology used for valuing securities may not be an indication of the risk associated with investing in those securities. For more information on valuation inputs, please refer to the Investment Valuation section in the accompanying Notes to Financial Statements. |
See accompanying notes which are an integral part of the financial statements.
Annual Report
Fidelity Freedom K® 2025 Fund
Statement of Assets and Liabilities
| March 31, 2015 |
| | |
Assets | | |
Investment in securities, at value (cost $11,523,878,991) - See accompanying schedule | | $ 12,931,677,654 |
Receivable for investments sold | | 65,625,441 |
Receivable for fund shares sold | | 14,836,089 |
Dividends receivable | | 112,998 |
Total assets | | 13,012,252,182 |
| | |
Liabilities | | |
Payable for investments purchased | $ 43,727,557 | |
Payable for fund shares redeemed | 36,735,972 | |
Transfer agent fees payable | 507,150 | |
Total liabilities | | 80,970,679 |
| | |
Net Assets | | $ 12,931,281,503 |
Net Assets consist of: | | |
Paid in capital | | $ 11,288,750,513 |
Undistributed net investment income | | 24,296,035 |
Accumulated undistributed net realized gain (loss) on investments | | 210,436,292 |
Net unrealized appreciation (depreciation) on investments | | 1,407,798,663 |
Net Assets, for 846,869,998 shares outstanding | | $ 12,931,281,503 |
Net Asset Value, offering price and redemption price per share ($12,931,281,503 ÷ 846,869,998 shares) | | $ 15.27 |
Statement of Operations
| Year ended March 31, 2015 |
| | |
Investment Income | | |
Income distributions from underlying funds | | $ 242,136,491 |
| | |
Expenses | | |
Transfer agent fees | $ 5,801,322 | |
Independent trustees' compensation | 52,860 | |
Total expenses | | 5,854,182 |
Net investment income (loss) | | 236,282,309 |
Realized and Unrealized Gain (Loss) Realized gain (loss) on sale of underlying fund shares | 16,825,316 | |
Capital gain distributions from underlying funds | 322,315,394 | |
Total net realized gain (loss) | | 339,140,710 |
Change in net unrealized appreciation (depreciation) on underlying funds | | 299,046,850 |
Net gain (loss) | | 638,187,560 |
Net increase (decrease) in net assets resulting from operations | | $ 874,469,869 |
See accompanying notes which are an integral part of the financial statements.
Annual Report
Fidelity Freedom K® 2025 Fund
Financial Statements - continued
Statement of Changes in Net Assets
| Year ended
March 31,
2015 | Year ended
March 31,
2014 |
Increase (Decrease) in Net Assets | | |
Operations | | |
Net investment income (loss) | $ 236,282,309 | $ 174,906,282 |
Net realized gain (loss) | 339,140,710 | 656,832,468 |
Change in net unrealized appreciation (depreciation) | 299,046,850 | 430,813,027 |
Net increase (decrease) in net assets resulting from operations | 874,469,869 | 1,262,551,777 |
Distributions to shareholders from net investment income | (386,604,762) | (19,149,282) |
Distributions to shareholders from net realized gain | (767,580,506) | (198,584,527) |
Total distributions | (1,154,185,268) | (217,733,809) |
Share transactions
Proceeds from sales of shares | 3,970,707,652 | 3,726,420,199 |
Reinvestment of distributions | 1,154,185,268 | 217,733,809 |
Cost of shares redeemed | (3,711,276,454) | (3,079,294,678) |
Net increase (decrease) in net assets resulting from share transactions | 1,413,616,466 | 864,859,330 |
Total increase (decrease) in net assets | 1,133,901,067 | 1,909,677,298 |
| | |
Net Assets | | |
Beginning of period | 11,797,380,436 | 9,887,703,138 |
End of period (including undistributed net investment income of $24,296,035 and undistributed net investment income of $174,618,488, respectively) | $ 12,931,281,503 | $ 11,797,380,436 |
Other Information Shares | | |
Sold | 262,338,074 | 251,471,985 |
Issued in reinvestment of distributions | 78,489,870 | 15,141,433 |
Redeemed | (245,266,208) | (206,818,599) |
Net increase (decrease) | 95,561,736 | 59,794,819 |
Financial Highlights
Years ended March 31, | 2015 | 2014 | 2013 | 2012 | 2011 |
Selected Per-Share Data | | | | | |
Net asset value, beginning of period | $ 15.70 | $ 14.30 | $ 13.59 | $ 13.99 | $ 12.50 |
Income from Investment Operations | | | | | |
Net investment income (loss) A | .29 | .24 | .26 | .26 | .25 |
Net realized and unrealized gain (loss) | .78 | 1.47 | .95 | (.02) | 1.57 |
Total from investment operations | 1.07 | 1.71 | 1.21 | .24 | 1.82 |
Distributions from net investment income | (.49) | (.03) | (.24) | (.21) | (.19) |
Distributions from net realized gain | (1.01) | (.28) | (.26) | (.43) | (.14) |
Total distributions | (1.50) | (.31) | (.50) | (.64) | (.33) |
Net asset value, end of period | $ 15.27 | $ 15.70 | $ 14.30 | $ 13.59 | $ 13.99 |
Total Return | 7.35% | 12.13% | 9.17% | 2.02% | 14.72% |
Ratios to Average Net Assets B, C | | | | | |
Expenses before reductions | .05% | .05% | .05% | .05% | .05% |
Expenses net of fee waivers, if any | .05% | .05% | .05% | .05% | .05% |
Expenses net of all reductions | .05% | .05% | .05% | .05% | .05% |
Net investment income (loss) | 1.91% | 1.60% | 1.89% | 1.95% | 1.90% |
Supplemental Data | | | | | |
Net assets, end of period (000 omitted) | $ 12,931,282 | $ 11,797,380 | $ 9,887,703 | $ 6,678,966 | $ 3,454,146 |
Portfolio turnover rate B | 20% | 44% | 23% | 20% | 38% |
A Calculated based on average shares outstanding during the period.
B Amounts do not include the activity of the Underlying Funds.
C Expense ratios reflect operating expenses of the Fund. Expenses before reductions do not reflect amounts reimbursed by the investment adviser or reductions from expense offset arrangements and do not represent the amount paid by the Fund during periods when reimbursements or reductions occur. Expenses net of fee waivers reflect expenses after reimbursement by the investment adviser but prior to reductions from expense offset arrangements. Expenses net of all reductions represent the net expenses paid by the Fund but do not include expenses of the underlying funds in which the Fund invests.
See accompanying notes which are an integral part of the financial statements.
Annual Report
Fidelity Freedom K® 2030 Fund
Investment Changes (Unaudited)
The information in the following tables is based on the direct investments of the Fund. |
Fund Holdings as of March 31, 2015 |
| % of fund's
net assets | % of fund's net assets
6 months ago |
Domestic Equity Funds | | |
Fidelity Series 100 Index Fund Class F | 2.1 | 2.2 |
Fidelity Series 1000 Value Index Fund Class F | 1.2 | 1.2 |
Fidelity Series All-Sector Equity Fund Class F | 6.9 | 7.1 |
Fidelity Series Blue Chip Growth Fund Class F | 5.4 | 6.1 |
Fidelity Series Commodity Strategy Fund Class F | 0.7 | 1.0 |
Fidelity Series Equity-Income Fund Class F | 8.9 | 9.2 |
Fidelity Series Growth & Income Fund Class F | 6.8 | 7.1 |
Fidelity Series Growth Company Fund Class F | 7.9 | 7.2 |
Fidelity Series Intrinsic Opportunities Fund Class F | 4.6 | 4.6 |
Fidelity Series Opportunistic Insights Fund Class F | 4.5 | 4.7 |
Fidelity Series Real Estate Equity Fund Class F | 0.8 | 0.8 |
Fidelity Series Small Cap Discovery Fund Class F | 1.2 | 1.0 |
Fidelity Series Small Cap Opportunities Fund Class F | 3.7 | 3.6 |
Fidelity Series Stock Selector Large Cap Value Fund Class F | 5.9 | 6.2 |
| 60.6 | 62.0 |
International Equity Funds | | |
Fidelity Series Emerging Markets Fund Class F | 7.3 | 6.4 |
Fidelity Series International Growth Fund Class F | 8.3 | 8.3 |
Fidelity Series International Small Cap Fund Class F | 1.9 | 1.9 |
Fidelity Series International Value Fund Class F | 8.1 | 8.6 |
| 25.6 | 25.2 |
Bond Funds | | |
Fidelity Series Emerging Markets Debt Fund Class F | 0.6 | 0.7 |
Fidelity Series Floating Rate High Income Fund Class F | 0.5 | 0.5 |
Fidelity Series High Income Fund Class F | 3.5 | 4.7 |
Fidelity Series Inflation-Protected Bond Index Fund Class F | 0.0* | 0.1 |
Fidelity Series Investment Grade Bond Fund Class F | 7.5 | 6.3 |
Fidelity Series Real Estate Income Fund Class F | 0.5 | 0.5 |
| 12.6 | 12.8 |
Short-Term Funds | | |
Fidelity Institutional Money Market Portfolio Class F | 0.7 | 0.0* |
Fidelity Series Short-Term Credit Fund Class F | 0.5 | 0.0 |
Fidelity Short-Term Bond Fund Class F | 0.0 | 0.0* |
| 1.2 | 0.0* |
Net Other Assets (Liabilities)* | 0.0 | 0.0 |
| 100.0 | 100.0 |
Asset Allocation (% of fund's net assets) |
Period end |
 | Domestic Equity Funds** | 60.6% | |
 | International Equity Funds | 25.6% | |
 | Bond Funds | 12.6% | |
 | Short-Term Funds | 1.2% | |

Six months ago |
 | Domestic Equity Funds** | 62.0% | |
 | International Equity Funds | 25.2% | |
 | Bond Funds | 12.8% | |
 | Short-Term Funds | 0.0%* | |

* Amount represents less than 0.1% |
** Includes Fidelity Series Commodity Strategy Fund which invests in commodity-related investments. |
Annual Report
Fidelity Freedom K® 2030 Fund
Investments March 31, 2015
Showing Percentage of Net Assets
Domestic Equity Funds - 60.6% |
| Shares | | Value |
Fidelity Series 100 Index Fund Class F (c) | 25,201,335 | | $ 334,925,739 |
Fidelity Series 1000 Value Index Fund Class F (c) | 17,038,196 | | 190,827,792 |
Fidelity Series All-Sector Equity Fund Class F (c) | 77,589,373 | | 1,097,889,628 |
Fidelity Series Blue Chip Growth Fund Class F (c) | 67,953,999 | | 867,772,567 |
Fidelity Series Commodity Strategy Fund Class F (a)(c) | 19,547,637 | | 120,608,919 |
Fidelity Series Equity-Income Fund Class F (c) | 112,724,997 | | 1,423,716,716 |
Fidelity Series Growth & Income Fund Class F (c) | 80,342,855 | | 1,091,055,976 |
Fidelity Series Growth Company Fund Class F (c) | 100,445,674 | | 1,263,606,579 |
Fidelity Series Intrinsic Opportunities Fund Class F (c) | 48,226,375 | | 729,665,054 |
Fidelity Series Opportunistic Insights Fund Class F (c) | 46,210,111 | | 714,408,317 |
Fidelity Series Real Estate Equity Fund Class F (c) | 8,547,542 | | 128,384,080 |
Fidelity Series Small Cap Discovery Fund Class F (c) | 16,824,225 | | 190,113,741 |
Fidelity Series Small Cap Opportunities Fund Class F (c) | 42,748,836 | | 588,651,475 |
Fidelity Series Stock Selector Large Cap Value Fund Class F (c) | 73,264,172 | | 951,701,595 |
TOTAL DOMESTIC EQUITY FUNDS (Cost $8,133,012,165) |
9,693,328,178
|
International Equity Funds - 25.6% |
| | | |
Fidelity Series Emerging Markets Fund Class F (c) | 68,676,585 | | 1,170,249,013 |
Fidelity Series International Growth Fund Class F (c) | 91,904,007 | | 1,326,174,819 |
Fidelity Series International Small Cap Fund Class F (c) | 19,109,126 | | 303,835,097 |
Fidelity Series International Value Fund Class F (c) | 128,570,069 | | 1,304,986,197 |
TOTAL INTERNATIONAL EQUITY FUNDS (Cost $3,688,720,831) |
4,105,245,126
|
Bond Funds - 12.6% |
| Shares | | Value |
Fidelity Series Emerging Markets Debt Fund Class F (c) | 10,358,746 | | $ 100,583,426 |
Fidelity Series Floating Rate High Income Fund Class F (c) | 7,885,747 | | 77,359,176 |
Fidelity Series High Income Fund Class F (c) | 57,128,890 | | 559,863,120 |
Fidelity Series Inflation-Protected Bond Index Fund Class F (c) | 60,419 | | 589,685 |
Fidelity Series Investment Grade Bond Fund Class F (c) | 103,656,675 | | 1,199,307,725 |
Fidelity Series Real Estate Income Fund Class F (c) | 6,769,795 | | 76,566,379 |
TOTAL BOND FUNDS (Cost $1,993,126,592) |
2,014,269,511
|
Short-Term Funds - 1.2% |
| | | |
Fidelity Institutional Money Market Portfolio Class F 0.14% (b)(c) | 101,132,949 | | 101,132,949 |
Fidelity Series Short-Term Credit Fund Class F (c) | 8,487,613 | | 84,961,005 |
TOTAL SHORT-TERM FUNDS (Cost $186,009,078) |
186,093,954
|
TOTAL INVESTMENT PORTFOLIO - 100.0% (Cost $14,000,868,666) | 15,998,936,769 |
NET OTHER ASSETS (LIABILITIES) - 0.0% | | (561,823) |
NET ASSETS - 100% | $ 15,998,374,946 |
Legend |
(a) Non-income producing |
(b) The rate quoted is the annualized seven-day yield of the fund at period end. |
(c) Affiliated Fund |
Affiliated Underlying Funds |
Information regarding the Fund's fiscal year to date purchases and sales of the affiliated Underlying Funds and income earned by the Fund from investments in affiliated Underlying Funds is as follows: |
Affiliate | Value,
beginning of
period | Purchases | Sales
Proceeds | Dividend
Income | Value,
end of
period |
Fidelity Institutional Money Market Portfolio Class F | $ - | $ 109,728,392 | $ 8,595,442 | $ 44,813 | $ 101,132,949 |
Fidelity Series 100 Index Fund Class F | 270,540,783 | 89,568,910 | 51,152,075 | 6,910,586 | 334,925,739 |
Fidelity Series 1000 Value Index Fund Class F | 182,252,090 | 32,329,130 | 32,089,460 | 4,123,612 | 190,827,792 |
Fidelity Series All-Sector Equity Fund Class F | 1,005,346,504 | 280,335,631 | 191,024,072 | 11,790,807 | 1,097,889,628 |
Fidelity Series Blue Chip Growth Fund Class F | 884,558,224 | 121,951,918 | 295,231,263 | 3,295,933 | 867,772,567 |
Fidelity Series Commodity Strategy Fund Class F | 183,342,610 | 16,925,105 | 32,880,677 | - | 120,608,919 |
Fidelity Series Emerging Markets Debt Fund Class F | 102,167,682 | 15,381,935 | 11,911,744 | 5,933,398 | 100,583,426 |
Affiliate | Value,
beginning of
period | Purchases | Sales
Proceeds | Dividend
Income | Value,
end of
period |
Fidelity Series Emerging Markets Fund Class F | $ 796,348,784 | $ 480,640,532 | $ 81,501,009 | $ 10,013,987 | $ 1,170,249,013 |
Fidelity Series Equity-Income Fund Class F | 1,341,799,407 | 286,889,342 | 217,544,047 | 32,619,450 | 1,423,716,716 |
Fidelity Series Floating Rate High Income Fund Class F | 126,537,640 | 16,669,286 | 60,692,957 | 4,358,328 | 77,359,176 |
Fidelity Series Growth & Income Fund Class F | 1,036,668,308 | 182,560,431 | 175,952,781 | 20,086,884 | 1,091,055,976 |
Fidelity Series Growth Company Fund Class F | 1,080,456,652 | 35,216,860 | 24,937,269 | 4,138,685 | 1,263,606,579 |
Fidelity Series High Income Fund Class F | 982,696,990 | 115,889,727 | 480,353,376 | 42,735,433 | 559,863,120 |
Fidelity Series Inflation-Protected Bond Index Fund Class F | 16,132,795 | 7,280,133 | 22,831,681 | 35,029 | 589,685 |
Fidelity Series International Growth Fund Class F | 1,360,847,043 | 168,288,416 | 226,269,901 | 19,307,025 | 1,326,174,819 |
Fidelity Series International Small Cap Fund Class F | 305,087,429 | 42,987,287 | 38,346,102 | 3,257,147 | 303,835,097 |
Fidelity Series International Value Fund Class F | 1,358,828,103 | 252,930,018 | 187,435,870 | 54,570,223 | 1,304,986,197 |
Fidelity Series Intrinsic Opportunities Fund Class F | 675,406,959 | 113,024,626 | 117,551,133 | 11,183,196 | 729,665,054 |
Fidelity Series Investment Grade Bond Fund Class F | 764,788,281 | 520,629,386 | 111,711,032 | 25,243,051 | 1,199,307,725 |
Fidelity Series Opportunistic Insights Fund Class F | 667,834,335 | 115,031,471 | 138,956,473 | 571,498 | 714,408,317 |
Fidelity Series Real Estate Equity Fund Class F | 107,186,720 | 40,663,641 | 38,615,341 | 2,479,755 | 128,384,080 |
Fidelity Series Real Estate Income Fund Class F | 71,200,199 | 13,647,360 | 8,513,331 | 4,038,379 | 76,566,379 |
Fidelity Series Short-Term Credit Fund Class F | - | 85,028,304 | 152,323 | - | 84,961,005 |
Fidelity Series Small Cap Discovery Fund Class F | 158,742,122 | 37,379,006 | 22,765,329 | 588,640 | 190,113,741 |
Fidelity Series Small Cap Opportunities Fund Class F | 546,133,920 | 131,344,300 | 97,069,235 | 2,878,490 | 588,651,475 |
Fidelity Series Stock Selector Large Cap Value Fund Class F | 901,915,192 | 198,006,908 | 181,593,502 | 14,273,238 | 951,701,595 |
Fidelity Short-Term Bond Fund Class F | - | 128,608,631 | 128,712,167 | 413,005 | - |
Total | $ 14,926,818,772 | $ 3,638,936,686 | $ 2,984,389,592 | $ 284,890,592 | $ 15,998,936,769 |
Other Information |
All investments are categorized as Level 1 under the Fair Value Hierarchy. The inputs or methodology used for valuing securities may not be an indication of the risk associated with investing in those securities. For more information on valuation inputs, please refer to the Investment Valuation section in the accompanying Notes to Financial Statements. |
See accompanying notes which are an integral part of the financial statements.
Annual Report
Fidelity Freedom K® 2030 Fund
Statement of Assets and Liabilities
| March 31, 2015 |
| | |
Assets | | |
Investment in securities, at value (cost $14,000,868,666) - See accompanying schedule | | $ 15,998,936,769 |
Receivable for investments sold | | 48,779,897 |
Receivable for fund shares sold | | 19,902,898 |
Dividends receivable | | 69,453 |
Total assets | | 16,067,689,017 |
| | |
Liabilities | | |
Payable for investments purchased | $ 20,041,778 | |
Payable for fund shares redeemed | 48,643,041 | |
Transfer agent fees payable | 629,252 | |
Total liabilities | | 69,314,071 |
| | |
Net Assets | | $ 15,998,374,946 |
Net Assets consist of: | | |
Paid in capital | | $ 13,671,156,484 |
Undistributed net investment income | | 19,549,925 |
Accumulated undistributed net realized gain (loss) on investments | | 309,600,434 |
Net unrealized appreciation (depreciation) on investments | | 1,998,068,103 |
Net Assets, for 1,023,918,525 shares outstanding | | $ 15,998,374,946 |
Net Asset Value, offering price and redemption price per share ($15,998,374,946 ÷ 1,023,918,525 shares) | | $ 15.62 |
Statement of Operations
| Year ended March 31, 2015 |
| | |
Investment Income | | |
Income distributions from underlying funds | | $ 284,890,592 |
| | |
Expenses | | |
Transfer agent fees | $ 7,250,188 | |
Independent trustees' compensation | 66,221 | |
Total expenses | | 7,316,409 |
Net investment income (loss) | | 277,574,183 |
Realized and Unrealized Gain (Loss) Realized gain (loss) on sale of underlying fund shares | 34,926,191 | |
Capital gain distributions from underlying funds | 468,486,936 | |
Total net realized gain (loss) | | 503,413,127 |
Change in net unrealized appreciation (depreciation) on underlying funds | | 382,644,697 |
Net gain (loss) | | 886,057,824 |
Net increase (decrease) in net assets resulting from operations | | $ 1,163,632,007 |
See accompanying notes which are an integral part of the financial statements.
Annual Report
Statement of Changes in Net Assets
| Year ended
March 31,
2015 | Year ended
March 31,
2014 |
Increase (Decrease) in Net Assets | | |
Operations | | |
Net investment income (loss) | $ 277,574,183 | $ 222,217,124 |
Net realized gain (loss) | 503,413,127 | 836,006,177 |
Change in net unrealized appreciation (depreciation) | 382,644,697 | 690,958,999 |
Net increase (decrease) in net assets resulting from operations | 1,163,632,007 | 1,749,182,300 |
Distributions to shareholders from net investment income | (480,022,949) | (24,505,853) |
Distributions to shareholders from net realized gain | (1,005,183,302) | (274,101,284) |
Total distributions | (1,485,206,251) | (298,607,137) |
Share transactions
Proceeds from sales of shares | 4,382,287,362 | 4,187,539,586 |
Reinvestment of distributions | 1,485,206,251 | 298,607,137 |
Cost of shares redeemed | (4,473,783,934) | (3,948,144,278) |
Net increase (decrease) in net assets resulting from share transactions | 1,393,709,679 | 538,002,445 |
Total increase (decrease) in net assets | 1,072,135,435 | 1,988,577,608 |
| | |
Net Assets | | |
Beginning of period | 14,926,239,511 | 12,937,661,903 |
End of period (including undistributed net investment income of $19,549,925 and undistributed net investment income of $221,998,691, respectively) | $ 15,998,374,946 | $ 14,926,239,511 |
Other Information Shares | | |
Sold | 283,378,088 | 277,666,183 |
Issued in reinvestment of distributions | 99,033,693 | 20,494,657 |
Redeemed | (289,083,944) | (260,727,298) |
Net increase (decrease) | 93,327,837 | 37,433,542 |
Financial Highlights
Years ended March 31, | 2015 | 2014 | 2013 | 2012 | 2011 |
Selected Per-Share Data | | | | | |
Net asset value, beginning of period | $ 16.04 | $ 14.49 | $ 13.75 | $ 14.22 | $ 12.67 |
Income from Investment Operations | | | | | |
Net investment income (loss) A | .28 | .24 | .27 | .26 | .25 |
Net realized and unrealized gain (loss) | .87 | 1.64 | .99 | (.07) | 1.62 |
Total from investment operations | 1.15 | 1.88 | 1.26 | .19 | 1.87 |
Distributions from net investment income | (.50) | (.03) | (.25) | (.22) | (.18) |
Distributions from net realized gain | (1.07) | (.30) | (.26) | (.44) | (.14) |
Total distributions | (1.57) | (.33) | (.52) D | (.66) | (.32) |
Net asset value, end of period | $ 15.62 | $ 16.04 | $ 14.49 | $ 13.75 | $ 14.22 |
Total Return | 7.78% | 13.20% | 9.46% | 1.62% | 14.95% |
Ratios to Average Net Assets B, C | | | | | |
Expenses before reductions | .05% | .05% | .05% | .05% | .05% |
Expenses net of fee waivers, if any | .05% | .05% | .05% | .05% | .05% |
Expenses net of all reductions | .05% | .05% | .05% | .05% | .05% |
Net investment income (loss) | 1.80% | 1.58% | 1.94% | 1.99% | 1.88% |
Supplemental Data | | | | | |
Net assets, end of period (000 omitted) | $ 15,998,375 | $ 14,926,240 | $ 12,937,662 | $ 9,206,764 | $ 4,890,405 |
Portfolio turnover rate B | 19% | 56% | 25% | 19% | 37% |
A Calculated based on average shares outstanding during the period.
B Amounts do not include the activity of the Underlying Funds.
C Expense ratios reflect operating expenses of the Fund. Expenses before reductions do not reflect amounts reimbursed by the investment adviser or reductions from expense offset arrangements and do not represent the amount paid by the Fund during periods when reimbursements or reductions occur. Expenses net of fee waivers reflect expenses after reimbursement by the investment adviser but prior to reductions from expense offset arrangements. Expenses net of all reductions represent the net expenses paid by the Fund but do not include expenses of the underlying funds in which the Fund invests.
D Total distributions of $.52 per share is comprised of distributions from net investment income of $.252 and distributions from net realized gain of $.264 per share.
See accompanying notes which are an integral part of the financial statements.
Annual Report
Fidelity Freedom K® 2035 Fund
Investment Changes (Unaudited)
The information in the following tables is based on the direct investments of the Fund. |
Fund Holdings as of March 31, 2015 |
| % of fund's
net assets | % of fund's net assets
6 months ago |
Domestic Equity Funds | | |
Fidelity Series 100 Index Fund Class F | 2.2 | 2.3 |
Fidelity Series 1000 Value Index Fund Class F | 1.3 | 1.3 |
Fidelity Series All-Sector Equity Fund Class F | 7.4 | 7.5 |
Fidelity Series Blue Chip Growth Fund Class F | 5.9 | 6.6 |
Fidelity Series Commodity Strategy Fund Class F | 0.7 | 1.0 |
Fidelity Series Equity-Income Fund Class F | 9.7 | 9.8 |
Fidelity Series Growth & Income Fund Class F | 7.4 | 7.6 |
Fidelity Series Growth Company Fund Class F | 8.5 | 7.7 |
Fidelity Series Intrinsic Opportunities Fund Class F | 4.9 | 4.9 |
Fidelity Series Opportunistic Insights Fund Class F | 4.8 | 4.9 |
Fidelity Series Real Estate Equity Fund Class F | 0.9 | 0.9 |
Fidelity Series Small Cap Discovery Fund Class F | 1.3 | 1.1 |
Fidelity Series Small Cap Opportunities Fund Class F | 4.0 | 3.8 |
Fidelity Series Stock Selector Large Cap Value Fund Class F | 6.4 | 6.5 |
| 65.4 | 65.9 |
International Equity Funds | | |
Fidelity Series Emerging Markets Fund Class F | 7.8 | 6.6 |
Fidelity Series International Growth Fund Class F | 9.0 | 9.1 |
Fidelity Series International Small Cap Fund Class F | 2.1 | 2.0 |
Fidelity Series International Value Fund Class F | 8.8 | 9.1 |
| 27.7 | 26.8 |
Bond Funds | | |
Fidelity Series Emerging Markets Debt Fund Class F | 0.6 | 0.6 |
Fidelity Series Floating Rate High Income Fund Class F | 0.5 | 0.5 |
Fidelity Series High Income Fund Class F | 3.4 | 4.5 |
Fidelity Series Investment Grade Bond Fund Class F | 0.6 | 0.5 |
Fidelity Series Real Estate Income Fund Class F | 0.5 | 0.5 |
| 5.6 | 6.6 |
Short-Term Funds | | |
Fidelity Institutional Money Market Portfolio Class F | 0.7 | 0.5 |
Fidelity Series Short-Term Credit Fund Class F | 0.6 | 0.0 |
Fidelity Short-Term Bond Fund Class F | 0.0 | 0.2 |
| 1.3 | 0.7 |
Net Other Assets (Liabilities)* | 0.0 | 0.0 |
| 100.0 | 100.0 |
* Amount represents less than 0.1% |
Asset Allocation (% of fund's net assets) |
Period end |
 | Domestic Equity Funds** | 65.4% | |
 | International Equity Funds | 27.7% | |
 | Bond Funds | 5.6% | |
 | Short-Term Funds | 1.3% | |

Six months ago |
 | Domestic Equity Funds** | 65.9% | |
 | International Equity Funds | 26.8% | |
 | Bond Funds | 6.6% | |
 | Short-Term Funds | 0.7% | |

** Includes Fidelity Series Commodity Strategy Fund which invests in commodity-related investments. |
Annual Report
Fidelity Freedom K® 2035 Fund
Investments March 31, 2015
Showing Percentage of Net Assets
Domestic Equity Funds - 65.4% |
| Shares | | Value |
Fidelity Series 100 Index Fund Class F (c) | 17,103,844 | | $ 227,310,084 |
Fidelity Series 1000 Value Index Fund Class F (c) | 11,535,099 | | 129,193,107 |
Fidelity Series All-Sector Equity Fund Class F (c) | 53,068,815 | | 750,923,736 |
Fidelity Series Blue Chip Growth Fund Class F (c) | 46,578,429 | | 594,806,534 |
Fidelity Series Commodity Strategy Fund Class F (a)(c) | 12,344,343 | | 76,164,598 |
Fidelity Series Equity-Income Fund Class F (c) | 77,550,423 | | 979,461,841 |
Fidelity Series Growth & Income Fund Class F (c) | 54,953,387 | | 746,266,999 |
Fidelity Series Growth Company Fund Class F (c) | 68,459,562 | | 861,221,285 |
Fidelity Series Intrinsic Opportunities Fund Class F (c) | 32,980,362 | | 498,992,875 |
Fidelity Series Opportunistic Insights Fund Class F (c) | 31,606,391 | | 488,634,803 |
Fidelity Series Real Estate Equity Fund Class F (c) | 5,810,882 | | 87,279,453 |
Fidelity Series Small Cap Discovery Fund Class F (c) | 11,544,931 | | 130,457,715 |
Fidelity Series Small Cap Opportunities Fund Class F (c) | 29,292,891 | | 403,363,106 |
Fidelity Series Stock Selector Large Cap Value Fund Class F (c) | 50,088,896 | | 650,654,761 |
TOTAL DOMESTIC EQUITY FUNDS (Cost $5,606,741,864) |
6,624,730,897
|
International Equity Funds - 27.7% |
| | | |
Fidelity Series Emerging Markets Fund Class F (c) | 46,191,450 | | 787,102,310 |
Fidelity Series International Growth Fund Class F (c) | 63,045,607 | | 909,748,102 |
Fidelity Series International Small Cap Fund Class F (c) | 13,153,038 | | 209,133,309 |
Fidelity Series International Value Fund Class F (c) | 88,275,854 | | 895,999,915 |
TOTAL INTERNATIONAL EQUITY FUNDS (Cost $2,527,520,361) |
2,801,983,636
|
Bond Funds - 5.6% |
| Shares | | Value |
Fidelity Series Emerging Markets Debt Fund Class F (c) | 6,477,081 | | $ 62,892,454 |
Fidelity Series Floating Rate High Income Fund Class F (c) | 4,973,184 | | 48,786,936 |
Fidelity Series High Income Fund Class F (c) | 35,753,995 | | 350,389,153 |
Fidelity Series Investment Grade Bond Fund Class F (c) | 5,320,338 | | 61,556,313 |
Fidelity Series Real Estate Income Fund Class F (c) | 4,271,202 | | 48,307,293 |
TOTAL BOND FUNDS (Cost $573,552,359) |
571,932,149
|
Short-Term Funds - 1.3% |
| | | |
Fidelity Institutional Money Market Portfolio Class F 0.14% (b)(c) | 68,512,980 | | 68,512,980 |
Fidelity Series Short-Term Credit Fund Class F (c) | 5,860,530 | | 58,663,906 |
TOTAL SHORT-TERM FUNDS (Cost $127,118,281) |
127,176,886
|
TOTAL INVESTMENT PORTFOLIO - 100.0% (Cost $8,834,932,865) | 10,125,823,568 |
NET OTHER ASSETS (LIABILITIES) - 0.0% | | (353,224) |
NET ASSETS - 100% | $ 10,125,470,344 |
Legend |
(a) Non-income producing |
(b) The rate quoted is the annualized seven-day yield of the fund at period end. |
(c) Affiliated Fund |
Affiliated Underlying Funds |
Information regarding the Fund's fiscal year to date purchases and sales of the affiliated Underlying Funds and income earned by the Fund from investments in affiliated Underlying Funds is as follows: |
Affiliate | Value,
beginning of
period | Purchases | Sales
Proceeds | Dividend
Income | Value,
end of
period |
Fidelity Institutional Money Market Portfolio Class F | $ - | $ 71,844,373 | $ 3,331,393 | $ 32,468 | $ 68,512,980 |
Fidelity Series 100 Index Fund Class F | 172,649,223 | 69,871,800 | 32,207,365 | 4,608,416 | 227,310,084 |
Fidelity Series 1000 Value Index Fund Class F | 116,024,811 | 27,783,619 | 19,965,912 | 2,755,881 | 129,193,107 |
Fidelity Series All-Sector Equity Fund Class F | 660,425,414 | 203,311,975 | 113,130,313 | 7,943,280 | 750,923,736 |
Fidelity Series Blue Chip Growth Fund Class F | 567,272,210 | 112,667,493 | 188,776,325 | 2,187,092 | 594,806,534 |
Fidelity Series Commodity Strategy Fund Class F | 87,568,097 | 26,871,847 | 10,054,551 | - | 76,164,598 |
Fidelity Series Emerging Markets Debt Fund Class F | 61,981,828 | 12,900,433 | 8,910,248 | 3,601,008 | 62,892,454 |
Affiliate | Value,
beginning of
period | Purchases | Sales
Proceeds | Dividend
Income | Value,
end of
period |
Fidelity Series Emerging Markets Fund Class F | $ 493,886,898 | $ 360,577,215 | $ 50,707,620 | $ 6,536,720 | $ 787,102,310 |
Fidelity Series Equity-Income Fund Class F | 867,095,141 | 240,047,237 | 135,024,658 | 21,499,701 | 979,461,841 |
Fidelity Series Floating Rate High Income Fund Class F | 67,788,064 | 11,114,071 | 26,968,837 | 2,492,875 | 48,786,936 |
Fidelity Series Growth & Income Fund Class F | 660,008,711 | 160,655,706 | 105,487,782 | 13,142,248 | 746,266,999 |
Fidelity Series Growth Company Fund Class F | 679,779,024 | 85,539,321 | 18,107,652 | 2,750,475 | 861,221,285 |
Fidelity Series High Income Fund Class F | 604,792,352 | 82,060,939 | 300,927,273 | 25,953,939 | 350,389,153 |
Fidelity Series International Growth Fund Class F | 860,036,992 | 151,391,734 | 116,304,802 | 13,024,890 | 909,748,102 |
Fidelity Series International Small Cap Fund Class F | 194,597,886 | 41,243,679 | 23,192,347 | 2,147,205 | 209,133,309 |
Fidelity Series International Value Fund Class F | 867,583,803 | 227,629,187 | 120,804,994 | 36,357,831 | 895,999,915 |
Fidelity Series Intrinsic Opportunities Fund Class F | 428,520,087 | 102,053,817 | 70,332,436 | 7,415,419 | 498,992,875 |
Fidelity Series Investment Grade Bond Fund Class F | 131,900,060 | 51,411,917 | 123,949,130 | 2,320,390 | 61,556,313 |
Fidelity Series Opportunistic Insights Fund Class F | 424,537,199 | 99,549,839 | 81,605,610 | 383,882 | 488,634,803 |
Fidelity Series Real Estate Equity Fund Class F | 74,721,789 | 37,914,750 | 38,144,764 | 1,605,718 | 87,279,453 |
Fidelity Series Real Estate Income Fund Class F | 43,505,962 | 10,980,479 | 6,327,487 | 2,495,367 | 48,307,293 |
Fidelity Series Short-Term Credit Fund Class F | - | 58,685,949 | 80,725 | - | 58,663,906 |
Fidelity Series Small Cap Discovery Fund Class F | 98,838,323 | 34,973,439 | 14,988,189 | 390,118 | 130,457,715 |
Fidelity Series Small Cap Opportunities Fund Class F | 344,179,416 | 107,793,671 | 55,337,650 | 1,910,104 | 403,363,106 |
Fidelity Series Stock Selector Large Cap Value Fund Class F | 575,737,253 | 160,957,470 | 106,703,125 | 9,616,686 | 650,654,761 |
Fidelity Short-Term Bond Fund Class F | - | 68,689,772 | 68,764,787 | 276,686 | - |
Total | $ 9,083,430,543 | $ 2,618,521,732 | $ 1,840,135,975 | $ 171,448,399 | $ 10,125,823,568 |
Other Information |
All investments are categorized as Level 1 under the Fair Value Hierarchy. The inputs or methodology used for valuing securities may not be an indication of the risk associated with investing in those securities. For more information on valuation inputs, please refer to the Investment Valuation section in the accompanying Notes to Financial Statements. |
See accompanying notes which are an integral part of the financial statements.
Annual Report
Fidelity Freedom K® 2035 Fund
Statement of Assets and Liabilities
| March 31, 2015 |
| | |
Assets | | |
Investment in securities, at value (cost $8,834,932,865) - See accompanying schedule | | $ 10,125,823,568 |
Receivable for investments sold | | 26,936,821 |
Receivable for fund shares sold | | 15,005,120 |
Dividends receivable | | 47,882 |
Total assets | | 10,167,813,391 |
| | |
Liabilities | | |
Payable for investments purchased | $ 13,022,059 | |
Payable for fund shares redeemed | 28,923,303 | |
Transfer agent fees payable | 397,685 | |
Total liabilities | | 42,343,047 |
| | |
Net Assets | | $ 10,125,470,344 |
Net Assets consist of: | | |
Paid in capital | | $ 8,626,236,400 |
Undistributed net investment income | | 8,324,784 |
Accumulated undistributed net realized gain (loss) on investments | | 200,018,457 |
Net unrealized appreciation (depreciation) on investments | | 1,290,890,703 |
Net Assets, for 628,984,540 shares outstanding | | $ 10,125,470,344 |
Net Asset Value, offering price and redemption price per share ($10,125,470,344 ÷ 628,984,540 shares) | | $ 16.10 |
Statement of Operations
| Year ended March 31, 2015 |
| | |
Investment Income | | |
Income distributions from underlying funds | | $ 171,448,399 |
| | |
Expenses | | |
Transfer agent fees | $ 4,488,702 | |
Independent trustees' compensation | 40,815 | |
Total expenses | | 4,529,517 |
Net investment income (loss) | | 166,918,882 |
Realized and Unrealized Gain (Loss) Realized gain (loss) on sale of underlying fund shares | 10,185,356 | |
Capital gain distributions from underlying funds | 311,714,061 | |
Total net realized gain (loss) | | 321,899,417 |
Change in net unrealized appreciation (depreciation) on underlying funds | | 253,821,907 |
Net gain (loss) | | 575,721,324 |
Net increase (decrease) in net assets resulting from operations | | $ 742,640,206 |
See accompanying notes which are an integral part of the financial statements.
Annual Report
Fidelity Freedom K® 2035 Fund
Financial Statements - continued
Statement of Changes in Net Assets
| Year ended
March 31,
2015 | Year ended
March 31,
2014 |
Increase (Decrease) in Net Assets | | |
Operations | | |
Net investment income (loss) | $ 166,918,882 | $ 123,791,954 |
Net realized gain (loss) | 321,899,417 | 555,018,887 |
Change in net unrealized appreciation (depreciation) | 253,821,907 | 471,199,890 |
Net increase (decrease) in net assets resulting from operations | 742,640,206 | 1,150,010,731 |
Distributions to shareholders from net investment income | (282,220,773) | (11,191,676) |
Distributions to shareholders from net realized gain | (663,806,908) | (164,311,064) |
Total distributions | (946,027,681) | (175,502,740) |
Share transactions
Proceeds from sales of shares | 3,172,959,264 | 2,879,083,996 |
Reinvestment of distributions | 946,027,681 | 175,502,740 |
Cost of shares redeemed | (2,873,209,328) | (2,275,258,549) |
Net increase (decrease) in net assets resulting from share transactions | 1,245,777,617 | 779,328,187 |
Total increase (decrease) in net assets | 1,042,390,142 | 1,753,836,178 |
| | |
Net Assets | | |
Beginning of period | 9,083,080,202 | 7,329,244,024 |
End of period (including undistributed net investment income of $8,324,784 and $123,626,674, respectively) | $ 10,125,470,344 | $ 9,083,080,202 |
Other Information Shares | | |
Sold | 199,345,062 | 185,996,763 |
Issued in reinvestment of distributions | 61,384,971 | 11,890,432 |
Redeemed | (180,515,961) | (146,109,003) |
Net increase (decrease) | 80,214,072 | 51,778,192 |
Financial Highlights
Years ended March 31, | 2015 | 2014 | 2013 | 2012 | 2011 |
Selected Per-Share Data | | | | | |
Net asset value, beginning of period | $ 16.55 | $ 14.75 | $ 13.88 | $ 14.46 | $ 12.78 |
Income from Investment Operations | | | | | |
Net investment income (loss) A | .28 | .23 | .26 | .24 | .23 |
Net realized and unrealized gain (loss) | .95 | 1.92 | 1.09 | (.17) | 1.76 |
Total from investment operations | 1.23 | 2.15 | 1.35 | .07 | 1.99 |
Distributions from net investment income | (.48) | (.02) | (.24) | (.20) | (.18) |
Distributions from net realized gain | (1.19) | (.32) | (.23) | (.45) | (.13) |
Total distributions | (1.68) F | (.35) D | (.48) E | (.65) | (.31) |
Net asset value, end of period | $ 16.10 | $ 16.55 | $ 14.75 | $ 13.88 | $ 14.46 |
Total Return | 8.08% | 14.83% | 10.01% | .78% | 15.76% |
Ratios to Average Net Assets B, C | | | | | |
Expenses before reductions | .05% | .05% | .05% | .05% | .05% |
Expenses net of fee waivers, if any | .05% | .05% | .05% | .05% | .05% |
Expenses net of all reductions | .05% | .05% | .05% | .05% | .05% |
Net investment income (loss) | 1.75% | 1.50% | 1.90% | 1.81% | 1.75% |
Supplemental Data | | | | | |
Net assets, end of period (000 omitted) | $ 10,125,470 | $ 9,083,080 | $ 7,329,244 | $ 4,783,034 | $ 2,321,903 |
Portfolio turnover rate B | 19% | 50% | 26% | 17% | 37% |
A Calculated based on average shares outstanding during the period.
B Amounts do not include the activity of the Underlying Funds.
C Expense ratios reflect operating expenses of the Fund. Expenses before reductions do not reflect amounts reimbursed by the investment adviser or reductions from expense offset arrangements and do not represent the amount paid by the Fund during periods when reimbursements or reductions occur. Expenses net of fee waivers reflect expenses after reimbursement by the investment adviser but prior to reductions from expense offset arrangements. Expenses net of all reductions represent the net expenses paid by the Fund but do not include expenses of the underlying funds in which the Fund invests.
D Total distributions of $.35 per share is comprised of distributions from net investment income of $.022 and distributions from net realized gain of $.323 per share.
E Total distributions of $.48 per share is comprised of distributions from net investment income of $.243 and distributions from net realized gain of $.232 per share.
F Total distributions of $1.68 per share is comprised of distributions from net investment income of $.484 and distributions from net realized gain of $1.191 per share.
See accompanying notes which are an integral part of the financial statements.
Annual Report
Fidelity Freedom K® 2040 Fund
Investment Changes (Unaudited)
The information in the following tables is based on the direct investments of the Fund. |
Fund Holdings as of March 31, 2015 |
| % of fund's
net assets | % of fund's net assets
6 months ago |
Domestic Equity Funds | | |
Fidelity Series 100 Index Fund Class F | 2.2 | 2.3 |
Fidelity Series 1000 Value Index Fund Class F | 1.3 | 1.3 |
Fidelity Series All-Sector Equity Fund Class F | 7.4 | 7.5 |
Fidelity Series Blue Chip Growth Fund Class F | 5.9 | 6.6 |
Fidelity Series Commodity Strategy Fund Class F | 0.7 | 1.0 |
Fidelity Series Equity-Income Fund Class F | 9.7 | 9.8 |
Fidelity Series Growth & Income Fund Class F | 7.4 | 7.6 |
Fidelity Series Growth Company Fund Class F | 8.5 | 7.7 |
Fidelity Series Intrinsic Opportunities Fund Class F | 4.9 | 4.9 |
Fidelity Series Opportunistic Insights Fund Class F | 4.8 | 4.9 |
Fidelity Series Real Estate Equity Fund Class F | 0.9 | 0.9 |
Fidelity Series Small Cap Discovery Fund Class F | 1.3 | 1.1 |
Fidelity Series Small Cap Opportunities Fund Class F | 4.0 | 3.8 |
Fidelity Series Stock Selector Large Cap Value Fund Class F | 6.4 | 6.5 |
| 65.4 | 65.9 |
International Equity Funds | | |
Fidelity Series Emerging Markets Fund Class F | 7.8 | 6.6 |
Fidelity Series International Growth Fund Class F | 9.0 | 9.1 |
Fidelity Series International Small Cap Fund Class F | 2.1 | 2.1 |
Fidelity Series International Value Fund Class F | 8.8 | 9.1 |
| 27.7 | 26.9 |
Bond Funds | | |
Fidelity Series Emerging Markets Debt Fund Class F | 0.6 | 0.7 |
Fidelity Series Floating Rate High Income Fund Class F | 0.5 | 0.5 |
Fidelity Series High Income Fund Class F | 3.4 | 4.4 |
Fidelity Series Investment Grade Bond Fund Class F | 0.6 | 0.5 |
Fidelity Series Real Estate Income Fund Class F | 0.5 | 0.5 |
| 5.6 | 6.6 |
Short-Term Funds | | |
Fidelity Institutional Money Market Portfolio Class F | 0.7 | 0.4 |
Fidelity Series Short-Term Credit Fund Class F | 0.6 | 0.0 |
Fidelity Short-Term Bond Fund Class F | 0.0 | 0.2 |
| 1.3 | 0.6 |
Net Other Assets (Liabilities)* | 0.0 | 0.0 |
| 100.0 | 100.0 |
* Amount represents less than 0.1% |
Asset Allocation (% of fund's net assets) |
Period end |
 | Domestic Equity Funds** | 65.4% | |
 | International Equity Funds | 27.7% | |
 | Bond Funds | 5.6% | |
 | Short-Term Funds | 1.3% | |

Six months ago |
 | Domestic Equity Funds** | 65.9% | |
 | International Equity Funds | 26.9% | |
 | Bond Funds | 6.6% | |
 | Short-Term Funds | 0.6% | |

** Includes Fidelity Series Commodity Strategy Fund which invests in commodity-related investments. |
Annual Report
Fidelity Freedom K® 2040 Fund
Investments March 31, 2015
Showing Percentage of Net Assets
Domestic Equity Funds - 65.4% |
| Shares | | Value |
Fidelity Series 100 Index Fund Class F (c) | 18,510,901 | | $ 246,009,880 |
Fidelity Series 1000 Value Index Fund Class F (c) | 12,461,606 | | 139,569,989 |
Fidelity Series All-Sector Equity Fund Class F (c) | 57,259,080 | | 810,215,975 |
Fidelity Series Blue Chip Growth Fund Class F (c) | 50,268,728 | | 641,931,656 |
Fidelity Series Commodity Strategy Fund Class F (a)(c) | 13,322,276 | | 82,198,443 |
Fidelity Series Equity-Income Fund Class F (c) | 83,655,144 | | 1,056,564,474 |
Fidelity Series Growth & Income Fund Class F (c) | 59,282,544 | | 805,056,953 |
Fidelity Series Growth Company Fund Class F (c) | 73,752,266 | | 927,803,511 |
Fidelity Series Intrinsic Opportunities Fund Class F (c) | 35,575,084 | | 538,251,014 |
Fidelity Series Opportunistic Insights Fund Class F (c) | 34,101,208 | | 527,204,674 |
Fidelity Series Real Estate Equity Fund Class F (c) | 6,237,040 | | 93,680,334 |
Fidelity Series Small Cap Discovery Fund Class F (c) | 12,363,874 | | 139,711,779 |
Fidelity Series Small Cap Opportunities Fund Class F (c) | 31,531,547 | | 434,189,400 |
Fidelity Series Stock Selector Large Cap Value Fund Class F (c) | 54,006,435 | | 701,543,585 |
TOTAL DOMESTIC EQUITY FUNDS (Cost $6,011,016,214) |
7,143,931,667
|
International Equity Funds - 27.7% |
| | | |
Fidelity Series Emerging Markets Fund Class F (c) | 49,772,580 | | 848,124,765 |
Fidelity Series International Growth Fund Class F (c) | 67,971,344 | | 980,826,501 |
Fidelity Series International Small Cap Fund Class F (c) | 14,185,176 | | 225,544,302 |
Fidelity Series International Value Fund Class F (c) | 95,161,310 | | 965,887,301 |
TOTAL INTERNATIONAL EQUITY FUNDS (Cost $2,711,497,693) |
3,020,382,869
|
Bond Funds - 5.6% |
| Shares | | Value |
Fidelity Series Emerging Markets Debt Fund Class F (c) | 6,992,439 | | $ 67,896,580 |
Fidelity Series Floating Rate High Income Fund Class F (c) | 5,386,324 | | 52,839,836 |
Fidelity Series High Income Fund Class F (c) | 38,482,882 | | 377,132,245 |
Fidelity Series Investment Grade Bond Fund Class F (c) | 5,692,345 | | 65,860,431 |
Fidelity Series Real Estate Income Fund Class F (c) | 4,620,652 | | 52,259,577 |
TOTAL BOND FUNDS (Cost $617,412,432) |
615,988,669
|
Short-Term Funds - 1.3% |
| | | |
Fidelity Institutional Money Market Portfolio Class F 0.14% (b)(c) | 75,528,852 | | 75,528,852 |
Fidelity Series Short-Term Credit Fund Class F (c) | 6,456,701 | | 64,631,579 |
TOTAL SHORT-TERM FUNDS (Cost $140,095,864) |
140,160,431
|
TOTAL INVESTMENT PORTFOLIO - 100.0% (Cost $9,480,022,203) | 10,920,463,636 |
NET OTHER ASSETS (LIABILITIES) - 0.0% | | (379,520) |
NET ASSETS - 100% | $ 10,920,084,116 |
Legend |
(a) Non-income producing |
(b) The rate quoted is the annualized seven-day yield of the fund at period end. |
(c) Affiliated Fund |
Affiliated Underlying Funds |
Information regarding the Fund's fiscal year to date purchases and sales of the affiliated Underlying Funds and income earned by the Fund from investments in affiliated Underlying Funds is as follows: |
Affiliate | Value,
beginning of
period | Purchases | Sales
Proceeds | Dividend
Income | Value,
end of
period |
Fidelity Institutional Money Market Portfolio Class F | $ - | $ 79,061,005 | $ 3,532,153 | $ 35,501 | $ 75,528,852 |
Fidelity Series 100 Index Fund Class F | 186,816,726 | 72,796,166 | 32,186,337 | 4,982,754 | 246,009,880 |
Fidelity Series 1000 Value Index Fund Class F | 126,228,300 | 26,892,605 | 19,496,527 | 2,978,336 | 139,569,989 |
Fidelity Series All-Sector Equity Fund Class F | 739,405,434 | 191,719,899 | 122,622,295 | 8,556,731 | 810,215,975 |
Fidelity Series Blue Chip Growth Fund Class F | 618,018,537 | 112,856,519 | 201,370,980 | 2,371,246 | 641,931,656 |
Fidelity Series Commodity Strategy Fund Class F | 94,463,488 | 28,715,904 | 10,355,348 | - | 82,198,443 |
Fidelity Series Emerging Markets Debt Fund Class F | 67,776,214 | 12,744,980 | 9,278,784 | 3,916,803 | 67,896,580 |
Affiliate | Value,
beginning of
period | Purchases | Sales
Proceeds | Dividend
Income | Value,
end of
period |
Fidelity Series Emerging Markets Fund Class F | $ 543,401,982 | $ 373,893,124 | $ 52,234,460 | $ 6,966,268 | $ 848,124,765 |
Fidelity Series Equity-Income Fund Class F | 943,017,142 | 243,414,773 | 138,426,503 | 23,309,773 | 1,056,564,474 |
Fidelity Series Floating Rate High Income Fund Class F | 67,250,469 | 11,061,855 | 22,081,045 | 2,590,290 | 52,839,836 |
Fidelity Series Growth & Income Fund Class F | 705,394,536 | 171,340,713 | 105,223,971 | 14,153,432 | 805,056,953 |
Fidelity Series Growth Company Fund Class F | 740,299,626 | 81,893,766 | 18,410,712 | 2,986,298 | 927,803,511 |
Fidelity Series High Income Fund Class F | 658,002,950 | 87,338,921 | 329,621,338 | 28,150,636 | 377,132,245 |
Fidelity Series International Growth Fund Class F | 936,746,179 | 150,103,488 | 122,036,442 | 14,109,297 | 980,826,501 |
Fidelity Series International Small Cap Fund Class F | 210,119,333 | 42,628,674 | 23,227,498 | 2,349,850 | 225,544,302 |
Fidelity Series International Value Fund Class F | 944,848,072 | 229,309,553 | 123,103,676 | 39,369,487 | 965,887,301 |
Fidelity Series Intrinsic Opportunities Fund Class F | 460,535,921 | 104,444,160 | 68,376,819 | 8,003,858 | 538,251,014 |
Fidelity Series Investment Grade Bond Fund Class F | 152,040,096 | 54,042,749 | 142,735,557 | 2,608,813 | 65,860,431 |
Fidelity Series Opportunistic Insights Fund Class F | 458,608,688 | 104,473,679 | 86,215,622 | 414,155 | 527,204,674 |
Fidelity Series Real Estate Equity Fund Class F | 82,954,695 | 37,558,392 | 40,719,070 | 1,743,788 | 93,680,334 |
Fidelity Series Real Estate Income Fund Class F | 47,350,685 | 11,354,252 | 6,605,297 | 2,704,508 | 52,259,577 |
Fidelity Series Short-Term Credit Fund Class F | - | 64,651,829 | 84,899 | - | 64,631,579 |
Fidelity Series Small Cap Discovery Fund Class F | 110,597,321 | 31,923,709 | 15,270,633 | 423,791 | 139,711,779 |
Fidelity Series Small Cap Opportunities Fund Class F | 375,744,889 | 110,665,188 | 59,498,909 | 2,065,061 | 434,189,400 |
Fidelity Series Stock Selector Large Cap Value Fund Class F | 623,788,223 | 163,298,517 | 108,296,265 | 10,355,994 | 701,543,585 |
Fidelity Short-Term Bond Fund Class F | - | 75,444,230 | 75,530,046 | 303,099 | - |
Total | $ 9,893,409,506 | $ 2,673,628,650 | $ 1,936,541,186 | $ 185,449,769 | $ 10,920,463,636 |
Other Information |
All investments are categorized as Level 1 under the Fair Value Hierarchy. The inputs or methodology used for valuing securities may not be an indication of the risk associated with investing in those securities. For more information on valuation inputs, please refer to the Investment Valuation section in the accompanying Notes to Financial Statements. |
See accompanying notes which are an integral part of the financial statements.
Annual Report
Fidelity Freedom K® 2040 Fund
Statement of Assets and Liabilities
| March 31, 2015 |
| | |
Assets | | |
Investment in securities, at value (cost $9,480,022,203) - See accompanying schedule | | $ 10,920,463,636 |
Receivable for investments sold | | 28,261,901 |
Receivable for fund shares sold | | 17,508,955 |
Dividends receivable | | 52,805 |
Total assets | | 10,966,287,297 |
| | |
Liabilities | | |
Payable for investments purchased | $ 14,116,138 | |
Payable for fund shares redeemed | 31,658,734 | |
Transfer agent fees payable | 428,309 | |
Total liabilities | | 46,203,181 |
| | |
Net Assets | | $ 10,920,084,116 |
Net Assets consist of: | | |
Paid in capital | | $ 9,252,544,480 |
Undistributed net investment income | | 8,735,260 |
Accumulated undistributed net realized gain (loss) on investments | | 218,362,943 |
Net unrealized appreciation (depreciation) on investments | | 1,440,441,433 |
Net Assets, for 676,474,945 shares outstanding | | $ 10,920,084,116 |
Net Asset Value, offering price and redemption price per share ($10,920,084,116 ÷ 676,474,945 shares) | | $ 16.14 |
Statement of Operations
| Year ended March 31, 2015 |
| | |
Investment Income | | |
Income distributions from underlying funds | | $ 185,449,769 |
| | |
Expenses | | |
Transfer agent fees | $ 4,866,331 | |
Independent trustees' compensation | 44,307 | |
Total expenses | | 4,910,638 |
Net investment income (loss) | | 180,539,131 |
Realized and Unrealized Gain (Loss) Realized gain (loss) on sale of underlying fund shares | 16,414,642 | |
Capital gain distributions from underlying funds | 336,527,766 | |
Total net realized gain (loss) | | 352,942,408 |
Change in net unrealized appreciation (depreciation) on underlying funds | | 273,552,016 |
Net gain (loss) | | 626,494,424 |
Net increase (decrease) in net assets resulting from operations | | $ 807,033,555 |
See accompanying notes which are an integral part of the financial statements.
Annual Report
Statement of Changes in Net Assets
| Year ended
March 31,
2015 | Year ended
March 31,
2014 |
Increase (Decrease) in Net Assets | | |
Operations | | |
Net investment income (loss) | $ 180,539,131 | $ 134,093,224 |
Net realized gain (loss) | 352,942,408 | 631,747,463 |
Change in net unrealized appreciation (depreciation) | 273,552,016 | 520,125,716 |
Net increase (decrease) in net assets resulting from operations | 807,033,555 | 1,285,966,403 |
Distributions to shareholders from net investment income | (305,708,534) | (12,426,918) |
Distributions to shareholders from net realized gain | (747,971,170) | (188,663,267) |
Total distributions | (1,053,679,704) | (201,090,185) |
Share transactions
Proceeds from sales of shares | 3,318,761,866 | 3,061,609,220 |
Reinvestment of distributions | 1,053,679,704 | 201,090,185 |
Cost of shares redeemed | (3,098,738,545) | (2,664,743,887) |
Net increase (decrease) in net assets resulting from share transactions | 1,273,703,025 | 597,955,518 |
Total increase (decrease) in net assets | 1,027,056,876 | 1,682,831,736 |
| | |
Net Assets | | |
Beginning of period | 9,893,027,240 | 8,210,195,504 |
End of period (including undistributed net investment income of $8,735,260 and undistributed net investment income of $133,904,663, respectively) | $ 10,920,084,116 | $ 9,893,027,240 |
Other Information Shares | | |
Sold | 207,805,569 | 196,549,519 |
Issued in reinvestment of distributions | 68,178,497 | 13,578,000 |
Redeemed | (193,823,770) | (170,450,334) |
Net increase (decrease) | 82,160,296 | 39,677,185 |
Financial Highlights
Years ended March 31, | 2015 | 2014 | 2013 | 2012 | 2011 |
Selected Per-Share Data | | | | | |
Net asset value, beginning of period | $ 16.65 | $ 14.80 | $ 13.93 | $ 14.55 | $ 12.85 |
Income from Investment Operations | | | | | |
Net investment income (loss) A | .28 | .23 | .26 | .24 | .24 |
Net realized and unrealized gain (loss) | .94 | 1.98 | 1.09 | (.19) | 1.77 |
Total from investment operations | 1.22 | 2.21 | 1.35 | .05 | 2.01 |
Distributions from net investment income | (.49) | (.02) | (.25) | (.20) | (.18) |
Distributions from net realized gain | (1.24) | (.33) | (.24) | (.47) | (.13) |
Total distributions | (1.73) | (.36) D | (.48) E | (.67) | (.31) |
Net asset value, end of period | $ 16.14 | $ 16.65 | $ 14.80 | $ 13.93 | $ 14.55 |
Total Return | 8.01% | 15.20% | 10.04% | .67% | 15.81% |
Ratios to Average Net Assets B, C | | | | | |
Expenses before reductions | .05% | .05% | .05% | .05% | .05% |
Expenses net of fee waivers, if any | .05% | .05% | .05% | .05% | .05% |
Expenses net of all reductions | .05% | .05% | .05% | .05% | .05% |
Net investment income (loss) | 1.74% | 1.47% | 1.90% | 1.82% | 1.79% |
Supplemental Data | | | | | |
Net assets, end of period (000 omitted) | $ 10,920,084 | $ 9,893,027 | $ 8,210,196 | $ 5,609,633 | $ 2,881,829 |
Portfolio turnover rate B | 19% | 50% | 27% | 18% | 38% |
A Calculated based on average shares outstanding during the period.
B Amounts do not include the activity of the Underlying Funds.
C Expense ratios reflect operating expenses of the Fund. Expenses before reductions do not reflect amounts reimbursed by the investment adviser or reductions from expense offset arrangements and do not represent the amount paid by the Fund during periods when reimbursements or reductions occur. Expenses net of fee waivers reflect expenses after reimbursement by the investment adviser but prior to reductions from expense offset arrangements. Expenses net of all reductions represent the net expenses paid by the Fund but do not include expenses of the underlying funds in which the Fund invests.
D Total distributions of $.36 per share is comprised of distributions from net investment income of $.022 and distributions from net realized gain of $.334 per share.
E Total distributions of $.48 per share is comprised of distributions from net investment income of $.245 and distributions from net realized gain of $.237 per share.
See accompanying notes which are an integral part of the financial statements.
Annual Report
Fidelity Freedom K® 2045 Fund
Investment Changes (Unaudited)
The information in the following tables is based on the direct investments of the Fund. |
Fund Holdings as of March 31, 2015 |
| % of fund's
net assets | % of fund's net assets
6 months ago |
Domestic Equity Funds | | |
Fidelity Series 100 Index Fund Class F | 2.3 | 2.3 |
Fidelity Series 1000 Value Index Fund Class F | 1.3 | 1.3 |
Fidelity Series All-Sector Equity Fund Class F | 7.4 | 7.6 |
Fidelity Series Blue Chip Growth Fund Class F | 5.8 | 6.5 |
Fidelity Series Commodity Strategy Fund Class F | 0.8 | 1.0 |
Fidelity Series Equity-Income Fund Class F | 9.6 | 9.8 |
Fidelity Series Growth & Income Fund Class F | 7.4 | 7.6 |
Fidelity Series Growth Company Fund Class F | 8.5 | 7.7 |
Fidelity Series Intrinsic Opportunities Fund Class F | 4.9 | 4.8 |
Fidelity Series Opportunistic Insights Fund Class F | 4.8 | 5.0 |
Fidelity Series Real Estate Equity Fund Class F | 0.9 | 0.9 |
Fidelity Series Small Cap Discovery Fund Class F | 1.3 | 1.1 |
Fidelity Series Small Cap Opportunities Fund Class F | 4.0 | 3.8 |
Fidelity Series Stock Selector Large Cap Value Fund Class F | 6.4 | 6.5 |
| 65.4 | 65.9 |
International Equity Funds | | |
Fidelity Series Emerging Markets Fund Class F | 7.8 | 6.6 |
Fidelity Series International Growth Fund Class F | 9.0 | 9.1 |
Fidelity Series International Small Cap Fund Class F | 2.1 | 2.0 |
Fidelity Series International Value Fund Class F | 8.8 | 9.1 |
| 27.7 | 26.8 |
Bond Funds | | |
Fidelity Series Emerging Markets Debt Fund Class F | 0.6 | 0.7 |
Fidelity Series Floating Rate High Income Fund Class F | 0.5 | 0.5 |
Fidelity Series High Income Fund Class F | 3.4 | 4.4 |
Fidelity Series Investment Grade Bond Fund Class F | 0.6 | 0.5 |
Fidelity Series Real Estate Income Fund Class F | 0.5 | 0.5 |
| 5.6 | 6.6 |
Short-Term Funds | | |
Fidelity Institutional Money Market Portfolio Class F | 0.7 | 0.5 |
Fidelity Series Short-Term Credit Fund Class F | 0.6 | 0.0 |
Fidelity Short-Term Bond Fund Class F | 0.0 | 0.2 |
| 1.3 | 0.7 |
Net Other Assets (Liabilities)* | 0.0 | 0.0 |
| 100.0 | 100.0 |
* Amount represents less than 0.1% |
Asset Allocation (% of fund's net assets) |
Period end |
 | Domestic Equity Funds** | 65.4% | |
 | International Equity Funds | 27.7% | |
 | Bond Funds | 5.6% | |
 | Short-Term Funds | 1.3% | |

Six months ago |
 | Domestic Equity Funds** | 65.9% | |
 | International Equity Funds | 26.8% | |
 | Bond Funds | 6.6% | |
 | Short-Term Funds | 0.7% | |

** Includes Fidelity Series Commodity Strategy Fund which invests in commodity-related investments. |
Annual Report
Fidelity Freedom K® 2045 Fund
Investments March 31, 2015
Showing Percentage of Net Assets
Domestic Equity Funds - 65.4% |
| Shares | | Value |
Fidelity Series 100 Index Fund Class F (c) | 10,110,212 | | $ 134,364,716 |
Fidelity Series 1000 Value Index Fund Class F (c) | 6,818,758 | | 76,370,087 |
Fidelity Series All-Sector Equity Fund Class F (c) | 31,278,906 | | 442,596,515 |
Fidelity Series Blue Chip Growth Fund Class F (c) | 27,229,868 | | 347,725,411 |
Fidelity Series Commodity Strategy Fund Class F (a)(c) | 7,284,788 | | 44,947,143 |
Fidelity Series Equity-Income Fund Class F (c) | 45,548,029 | | 575,271,601 |
Fidelity Series Growth & Income Fund Class F (c) | 32,352,812 | | 439,351,183 |
Fidelity Series Growth Company Fund Class F (c) | 40,245,375 | | 506,286,818 |
Fidelity Series Intrinsic Opportunities Fund Class F (c) | 19,441,063 | | 294,143,277 |
Fidelity Series Opportunistic Insights Fund Class F (c) | 18,628,774 | | 288,000,852 |
Fidelity Series Real Estate Equity Fund Class F (c) | 3,449,834 | | 51,816,510 |
Fidelity Series Small Cap Discovery Fund Class F (c) | 6,927,887 | | 78,285,120 |
Fidelity Series Small Cap Opportunities Fund Class F (c) | 17,439,446 | | 240,141,171 |
Fidelity Series Stock Selector Large Cap Value Fund Class F (c) | 29,574,939 | | 384,178,458 |
TOTAL DOMESTIC EQUITY FUNDS (Cost $3,337,956,235) |
3,903,478,862
|
International Equity Funds - 27.7% |
| | | |
Fidelity Series Emerging Markets Fund Class F (c) | 27,206,794 | | 463,603,778 |
Fidelity Series International Growth Fund Class F (c) | 37,186,309 | | 536,598,443 |
Fidelity Series International Small Cap Fund Class F (c) | 7,751,777 | | 123,253,248 |
Fidelity Series International Value Fund Class F (c) | 52,063,040 | | 528,439,860 |
TOTAL INTERNATIONAL EQUITY FUNDS (Cost $1,506,135,142) |
1,651,895,329
|
Bond Funds - 5.6% |
| Shares | | Value |
Fidelity Series Emerging Markets Debt Fund Class F (c) | 3,818,317 | | $ 37,075,862 |
Fidelity Series Floating Rate High Income Fund Class F (c) | 2,939,773 | | 28,839,171 |
Fidelity Series High Income Fund Class F (c) | 21,048,011 | | 206,270,511 |
Fidelity Series Investment Grade Bond Fund Class F (c) | 3,127,101 | | 36,180,564 |
Fidelity Series Real Estate Income Fund Class F (c) | 2,514,767 | | 28,442,017 |
TOTAL BOND FUNDS (Cost $337,567,175) |
336,808,125
|
Short-Term Funds - 1.3% |
| | | |
Fidelity Institutional Money Market Portfolio Class F 0.14% (b)(c) | 40,185,919 | | 40,185,919 |
Fidelity Series Short-Term Credit Fund Class F (c) | 3,417,907 | | 34,213,249 |
TOTAL SHORT-TERM FUNDS (Cost $74,364,989) |
74,399,168
|
TOTAL INVESTMENT PORTFOLIO - 100.0% (Cost $5,256,023,541) | | 5,966,581,484 |
NET OTHER ASSETS (LIABILITIES) - 0.0% | | (207,790) |
NET ASSETS - 100% | $ 5,966,373,694 |
Legend |
(a) Non-income producing |
(b) The rate quoted is the annualized seven-day yield of the fund at period end. |
(c) Affiliated Fund |
Affiliated Underlying Funds |
Information regarding the Fund's fiscal year to date purchases and sales of the affiliated Underlying Funds and income earned by the Fund from investments in affiliated Underlying Funds is as follows: |
Affiliate | Value,
beginning of
period | Purchases | Sales
Proceeds | Dividend
Income | Value,
end of
period |
Fidelity Institutional Money Market Portfolio Class F | $ - | $ 41,794,318 | $ 1,608,400 | $ 19,019 | $ 40,185,919 |
Fidelity Series 100 Index Fund Class F | 96,450,636 | 43,718,795 | 15,512,599 | 2,654,124 | 134,364,716 |
Fidelity Series 1000 Value Index Fund Class F | 64,824,449 | 18,782,017 | 10,268,549 | 1,588,250 | 76,370,087 |
Fidelity Series All-Sector Equity Fund Class F | 374,096,364 | 128,354,842 | 59,908,813 | 4,574,348 | 442,596,515 |
Fidelity Series Blue Chip Growth Fund Class F | 317,259,373 | 80,202,763 | 109,549,412 | 1,249,082 | 347,725,411 |
Fidelity Series Commodity Strategy Fund Class F | 48,412,770 | 17,723,559 | 4,994,926 | - | 44,947,143 |
Fidelity Series Emerging Markets Debt Fund Class F | 34,486,400 | 8,750,650 | 4,415,912 | 2,050,091 | 37,075,862 |
Affiliate | Value,
beginning of
period | Purchases | Sales
Proceeds | Dividend
Income | Value,
end of
period |
Fidelity Series Emerging Markets Fund Class F | $ 276,640,827 | $ 223,197,448 | $ 26,961,371 | $ 3,752,357 | $ 463,603,778 |
Fidelity Series Equity-Income Fund Class F | 481,392,128 | 159,412,789 | 69,173,479 | 12,204,238 | 575,271,601 |
Fidelity Series Floating Rate High Income Fund Class F | 17,731,701 | 19,926,205 | 7,102,278 | 1,076,374 | 28,839,171 |
Fidelity Series Growth & Income Fund Class F | 360,241,576 | 112,840,195 | 51,239,948 | 7,408,754 | 439,351,183 |
Fidelity Series Growth Company Fund Class F | 374,401,742 | 76,034,876 | 9,108,264 | 1,573,422 | 506,286,818 |
Fidelity Series High Income Fund Class F | 336,587,013 | 55,676,452 | 165,835,353 | 14,755,642 | 206,270,511 |
Fidelity Series International Growth Fund Class F | 479,724,233 | 106,453,217 | 58,734,990 | 7,465,306 | 536,598,443 |
Fidelity Series International Small Cap Fund Class F | 107,956,652 | 28,459,115 | 11,451,863 | 1,238,686 | 123,253,248 |
Fidelity Series International Value Fund Class F | 483,859,618 | 148,073,724 | 58,732,613 | 20,941,415 | 528,439,860 |
Fidelity Series Intrinsic Opportunities Fund Class F | 236,647,607 | 69,792,895 | 34,723,818 | 4,222,457 | 294,143,277 |
Fidelity Series Investment Grade Bond Fund Class F | 93,224,389 | 32,345,976 | 90,902,302 | 1,541,988 | 36,180,564 |
Fidelity Series Opportunistic Insights Fund Class F | 235,493,289 | 70,123,618 | 44,311,015 | 220,649 | 288,000,852 |
Fidelity Series Real Estate Equity Fund Class F | 44,239,883 | 26,693,692 | 26,492,059 | 905,441 | 51,816,510 |
Fidelity Series Real Estate Income Fund Class F | 24,219,693 | 7,522,265 | 3,381,866 | 1,428,178 | 28,442,017 |
Fidelity Series Short-Term Credit Fund Class F | - | 34,207,413 | 28,369 | - | 34,213,249 |
Fidelity Series Small Cap Discovery Fund Class F | 57,730,624 | 21,361,913 | 7,756,679 | 229,031 | 78,285,120 |
Fidelity Series Small Cap Opportunities Fund Class F | 192,739,544 | 69,533,315 | 26,777,119 | 1,088,512 | 240,141,171 |
Fidelity Series Stock Selector Large Cap Value Fund Class F | 321,736,857 | 107,806,993 | 56,815,192 | 5,538,381 | 384,178,458 |
Fidelity Short-Term Bond Fund Class F | - | 39,435,355 | 39,475,774 | 160,303 | - |
Total | $ 5,060,097,368 | $ 1,748,224,400 | $ 995,262,963 | $ 97,866,048 | $ 5,966,581,484 |
Other Information |
All investments are categorized as Level 1 under the Fair Value Hierarchy. The inputs or methodology used for valuing securities may not be an indication of the risk associated with investing in those securities. For more information on valuation inputs, please refer to the Investment Valuation section in the accompanying Notes to Financial Statements. |
See accompanying notes which are an integral part of the financial statements.
Annual Report
Fidelity Freedom K® 2045 Fund
Statement of Assets and Liabilities
| March 31, 2015 |
| | |
Assets | | |
Investment in securities, at value (cost $5,256,023,541) - See accompanying schedule | | $ 5,966,581,484 |
Receivable for investments sold | | 12,889,398 |
Receivable for fund shares sold | | 14,116,314 |
Dividends receivable | | 27,880 |
Total assets | | 5,993,615,076 |
| | |
Liabilities | | |
Payable for investments purchased | $ 7,914,232 | |
Payable for fund shares redeemed | 19,093,374 | |
Transfer agent fees payable | 233,776 | |
Total liabilities | | 27,241,382 |
| | |
Net Assets | | $ 5,966,373,694 |
Net Assets consist of: | | |
Paid in capital | | $ 5,135,066,907 |
Undistributed net investment income | | 4,852,400 |
Accumulated undistributed net realized gain (loss) on investments | | 115,896,444 |
Net unrealized appreciation (depreciation) on investments | | 710,557,943 |
Net Assets, for 360,158,012 shares outstanding | | $ 5,966,373,694 |
Net Asset Value, offering price and redemption price per share ($5,966,373,694 ÷ 360,158,012 shares) | | $ 16.57 |
Statement of Operations
| Year ended March 31, 2015 |
| | |
Investment Income | | |
Income distributions from underlying funds | | $ 97,886,048 |
| | |
Expenses | | |
Transfer agent fees | $ 2,568,169 | |
Independent trustees' compensation | 23,207 | |
Total expenses | | 2,591,376 |
Net investment income (loss) | | 95,294,672 |
Realized and Unrealized Gain (Loss) Realized gain (loss) on sale of underlying fund shares | 3,965,274 | |
Capital gain distributions from underlying funds | 179,361,814 | |
Total net realized gain (loss) | | 183,327,088 |
Change in net unrealized appreciation (depreciation) on underlying funds | | 149,557,398 |
Net gain (loss) | | 332,884,486 |
Net increase (decrease) in net assets resulting from operations | | $ 428,179,158 |
See accompanying notes which are an integral part of the financial statements.
Annual Report
Fidelity Freedom K® 2045 Fund
Financial Statements - continued
Statement of Changes in Net Assets
| Year ended
March 31,
2015 | Year ended
March 31,
2014 |
Increase (Decrease) in Net Assets | | |
Operations | | |
Net investment income (loss) | $ 95,294,672 | $ 66,147,143 |
Net realized gain (loss) | 183,327,088 | 303,045,217 |
Change in net unrealized appreciation (depreciation) | 149,557,398 | 273,085,851 |
Net increase (decrease) in net assets resulting from operations | 428,179,158 | 642,278,211 |
Distributions to shareholders from net investment income | (156,508,980) | (5,761,733) |
Distributions to shareholders from net realized gain | (364,672,767) | (80,603,752) |
Total distributions | (521,181,747) | (86,365,485) |
Share transactions
Proceeds from sales of shares | 2,148,367,254 | 1,887,417,974 |
Reinvestment of distributions | 521,181,747 | 86,365,485 |
Cost of shares redeemed | (1,670,076,420) | (1,284,028,057) |
Net increase (decrease) in net assets resulting from share transactions | 999,472,581 | 689,755,402 |
Total increase (decrease) in net assets | 906,469,992 | 1,245,668,128 |
| | |
Net Assets | | |
Beginning of period | 5,059,903,702 | 3,814,235,574 |
End of period (including undistributed net investment income of $4,852,400 and undistributed net investment income of $66,066,708, respectively) | $ 5,966,373,694 | $ 5,059,903,702 |
Other Information Shares | | |
Sold | 131,342,013 | 118,830,944 |
Issued in reinvestment of distributions | 32,858,503 | 5,730,983 |
Redeemed | (102,018,105) | (80,479,587) |
Net increase (decrease) | 62,182,411 | 44,082,340 |
Financial Highlights
Years ended March 31, | 2015 | 2014 | 2013 | 2012 | 2011 |
Selected Per-Share Data | | | | | |
Net asset value, beginning of period | $ 16.98 | $ 15.02 | $ 14.07 | $ 14.68 | $ 12.91 |
Income from Investment Operations | | | | | |
Net investment income (loss) A | .28 | .24 | .28 | .25 | .25 |
Net realized and unrealized gain (loss) | .98 | 2.05 | 1.12 | (.22) | 1.81 |
Total from investment operations | 1.26 | 2.29 | 1.40 | .03 | 2.06 |
Distributions from net investment income | (.48) | (.02) | (.25) | (.20) | (.18) |
Distributions from net realized gain | (1.19) | (.31) | (.20) | (.44) | (.11) |
Total distributions | (1.67) | (.33) | (.45) | (.64) | (.29) |
Net asset value, end of period | $ 16.57 | $ 16.98 | $ 15.02 | $ 14.07 | $ 14.68 |
Total Return | 8.10% | 15.52% | 10.27% | .45% | 16.12% |
Ratios to Average Net Assets B, C | | | | | |
Expenses before reductions | .05% | .05% | .05% | .05% | .05% |
Expenses net of fee waivers, if any | .05% | .05% | .05% | .05% | .05% |
Expenses net of all reductions | .05% | .05% | .05% | .05% | .05% |
Net investment income (loss) | 1.74% | 1.49% | 1.96% | 1.85% | 1.83% |
Supplemental Data | | | | | |
Net assets, end of period (000 omitted) | $ 5,966,374 | $ 5,059,904 | $ 3,814,236 | $ 2,254,813 | $ 927,418 |
Portfolio turnover rate B | 18% | 47% | 27% | 14% | 39% |
A Calculated based on average shares outstanding during the period.
B Amounts do not include the activity of the Underlying Funds.
C Expense ratios reflect operating expenses of the Fund. Expenses before reductions do not reflect amounts reimbursed by the investment adviser or reductions from expense offset arrangements and do not represent the amount paid by the Fund during periods when reimbursements or reductions occur. Expenses net of fee waivers reflect expenses after reimbursement by the investment adviser but prior to reductions from expense offset arrangements. Expenses net of all reductions represent the net expenses paid by the Fund but do not include expenses of the underlying funds in which the Fund invests.
See accompanying notes which are an integral part of the financial statements.
Annual Report
Fidelity Freedom K® 2050 Fund
Investment Changes (Unaudited)
The information in the following tables is based on the direct investments of the Fund. |
Fund Holdings as of March 31, 2015 |
| % of fund's
net assets | % of fund's net assets
6 months ago |
Domestic Equity Funds | | |
Fidelity Series 100 Index Fund Class F | 2.3 | 2.3 |
Fidelity Series 1000 Value Index Fund Class F | 1.3 | 1.3 |
Fidelity Series All-Sector Equity Fund Class F | 7.4 | 7.6 |
Fidelity Series Blue Chip Growth Fund Class F | 5.8 | 6.5 |
Fidelity Series Commodity Strategy Fund Class F | 0.8 | 1.0 |
Fidelity Series Equity-Income Fund Class F | 9.6 | 9.8 |
Fidelity Series Growth & Income Fund Class F | 7.4 | 7.6 |
Fidelity Series Growth Company Fund Class F | 8.4 | 7.7 |
Fidelity Series Intrinsic Opportunities Fund Class F | 4.9 | 4.8 |
Fidelity Series Opportunistic Insights Fund Class F | 4.8 | 5.0 |
Fidelity Series Real Estate Equity Fund Class F | 0.9 | 0.9 |
Fidelity Series Small Cap Discovery Fund Class F | 1.3 | 1.1 |
Fidelity Series Small Cap Opportunities Fund Class F | 4.0 | 3.8 |
Fidelity Series Stock Selector Large Cap Value Fund Class F | 6.5 | 6.5 |
| 65.4 | 65.9 |
International Equity Funds | | |
Fidelity Series Emerging Markets Fund Class F | 7.8 | 6.6 |
Fidelity Series International Growth Fund Class F | 9.0 | 9.1 |
Fidelity Series International Small Cap Fund Class F | 2.1 | 2.0 |
Fidelity Series International Value Fund Class F | 8.8 | 9.0 |
| 27.7 | 26.7 |
Bond Funds | | |
Fidelity Series Emerging Markets Debt Fund Class F | 0.6 | 0.7 |
Fidelity Series Floating Rate High Income Fund Class F | 0.5 | 0.5 |
Fidelity Series High Income Fund Class F | 3.4 | 4.4 |
Fidelity Series Inflation-Protected Bond Index Fund Class F | 0.0* | 0.0 |
Fidelity Series Investment Grade Bond Fund Class F | 0.6 | 0.5 |
Fidelity Series Real Estate Income Fund Class F | 0.5 | 0.5 |
| 5.6 | 6.6 |
Short-Term Funds | | |
Fidelity Institutional Money Market Portfolio Class F | 0.7 | 0.5 |
Fidelity Series Short-Term Credit Fund Class F | 0.6 | 0.0 |
Fidelity Short-Term Bond Fund Class F | 0.0 | 0.3 |
| 1.3 | 0.8 |
Net Other Assets (Liabilities)* | 0.0 | 0.0 |
| 100.0 | 100.0 |
* Amount represents less than 0.1% |
Asset Allocation (% of fund's net assets) |
Period end |
 | Domestic Equity Funds** | 65.4% | |
 | International Equity Funds | 27.7% | |
 | Bond Funds | 5.6% | |
 | Short-Term Funds | 1.3% | |

Six months ago |
 | Domestic Equity Funds** | 65.9% | |
 | International Equity Funds | 26.7% | |
 | Bond Funds | 6.6% | |
 | Short-Term Funds | 0.8% | |

** Includes Fidelity Series Commodity Strategy Fund which invests in commodity-related investments. |
Annual Report
Fidelity Freedom K® 2050 Fund
Investments March 31, 2015
Showing Percentage of Net Assets
Domestic Equity Funds - 65.4% |
| Shares | | Value |
Fidelity Series 100 Index Fund Class F (c) | 8,257,583 | | $ 109,743,283 |
Fidelity Series 1000 Value Index Fund Class F (c) | 5,560,195 | | 62,274,188 |
Fidelity Series All-Sector Equity Fund Class F (c) | 25,493,779 | | 360,736,975 |
Fidelity Series Blue Chip Growth Fund Class F (c) | 22,133,532 | | 282,645,207 |
Fidelity Series Commodity Strategy Fund Class F (a)(c) | 5,930,799 | | 36,593,031 |
Fidelity Series Equity-Income Fund Class F (c) | 37,042,607 | | 467,848,127 |
Fidelity Series Growth & Income Fund Class F (c) | 26,358,028 | | 357,942,022 |
Fidelity Series Growth Company Fund Class F (c) | 32,456,194 | | 408,298,916 |
Fidelity Series Intrinsic Opportunities Fund Class F (c) | 15,840,136 | | 239,661,253 |
Fidelity Series Opportunistic Insights Fund Class F (c) | 15,182,339 | | 234,718,961 |
Fidelity Series Real Estate Equity Fund Class F (c) | 2,829,854 | | 42,504,403 |
Fidelity Series Small Cap Discovery Fund Class F (c) | 5,645,482 | | 63,793,950 |
Fidelity Series Small Cap Opportunities Fund Class F (c) | 14,245,891 | | 196,165,923 |
Fidelity Series Stock Selector Large Cap Value Fund Class F (c) | 24,138,835 | | 313,563,460 |
TOTAL DOMESTIC EQUITY FUNDS (Cost $2,731,813,148) |
3,176,489,699
|
International Equity Funds - 27.7% |
| | | |
Fidelity Series Emerging Markets Fund Class F (c) | 22,139,585 | | 377,258,531 |
Fidelity Series International Growth Fund Class F (c) | 30,254,346 | | 436,570,208 |
Fidelity Series International Small Cap Fund Class F (c) | 6,331,389 | | 100,669,089 |
Fidelity Series International Value Fund Class F (c) | 42,363,026 | | 429,984,715 |
TOTAL INTERNATIONAL EQUITY FUNDS (Cost $1,232,538,127) |
1,344,482,543
|
Bond Funds - 5.6% |
| Shares | | Value |
Fidelity Series Emerging Markets Debt Fund Class F (c) | 3,105,592 | | $ 30,155,303 |
Fidelity Series Floating Rate High Income Fund Class F (c) | 2,391,771 | | 23,463,275 |
Fidelity Series High Income Fund Class F (c) | 17,126,707 | | 167,841,727 |
Fidelity Series Inflation-Protected Bond Index Fund Class F (c) | 7,378 | | 72,011 |
Fidelity Series Investment Grade Bond Fund Class F (c) | 2,520,084 | | 29,157,370 |
Fidelity Series Real Estate Income Fund Class F (c) | 2,046,219 | | 23,142,731 |
TOTAL BOND FUNDS (Cost $274,776,298) |
273,832,417
|
Short-Term Funds - 1.3% |
| | | |
Fidelity Institutional Money Market Portfolio Class F 0.14% (b)(c) | 32,968,210 | | 32,968,210 |
Fidelity Series Short-Term Credit Fund Class F (c) | 2,752,086 | | 27,548,384 |
TOTAL SHORT-TERM FUNDS (Cost $60,489,074) |
60,516,594
|
TOTAL INVESTMENT PORTFOLIO - 100.0% (Cost $4,299,616,647) | | 4,855,321,253 |
NET OTHER ASSETS (LIABILITIES) - 0.0% | | (167,571) |
NET ASSETS - 100% | $ 4,855,153,682 |
Legend |
(a) Non-income producing |
(b) The rate quoted is the annualized seven-day yield of the fund at period end. |
(c) Affiliated Fund |
Affiliated Underlying Funds |
Information regarding the Fund's fiscal year to date purchases and sales of the affiliated Underlying Funds and income earned by the Fund from investments in affiliated Underlying Funds is as follows: |
Affiliate | Value,
beginning of
period | Purchases | Sales
Proceeds | Dividend
Income | Value,
end of
period |
Fidelity Institutional Money Market Portfolio Class F | $ - | $ 34,257,934 | $ 1,289,723 | $ 15,489 | $ 32,968,210 |
Fidelity Series 100 Index Fund Class F | 75,274,302 | 37,827,398 | 11,061,374 | 2,135,368 | 109,743,283 |
Fidelity Series 1000 Value Index Fund Class F | 50,619,150 | 16,804,318 | 7,539,504 | 1,275,867 | 62,274,188 |
Fidelity Series All-Sector Equity Fund Class F | 289,963,763 | 113,850,032 | 42,813,676 | 3,672,465 | 360,736,975 |
Fidelity Series Blue Chip Growth Fund Class F | 247,191,104 | 72,153,026 | 84,554,284 | 1,001,786 | 282,645,207 |
Fidelity Series Commodity Strategy Fund Class F | 38,016,442 | 14,989,187 | 3,472,281 | - | 36,593,031 |
Fidelity Series Emerging Markets Debt Fund Class F | 26,888,551 | 7,790,631 | 3,113,878 | 1,629,006 | 30,155,303 |
Affiliate | Value,
beginning of
period | Purchases | Sales
Proceeds | Dividend
Income | Value,
end of
period |
Fidelity Series Emerging Markets Fund Class F | $ 216,696,020 | $ 187,789,411 | $ 19,642,505 | $ 3,008,978 | $ 377,258,531 |
Fidelity Series Equity-Income Fund Class F | 375,951,952 | 139,725,796 | 50,487,656 | 9,700,254 | 467,848,127 |
Fidelity Series Floating Rate High Income Fund Class F | 3,834,984 | 26,156,904 | 5,200,343 | 702,524 | 23,463,275 |
Fidelity Series Growth & Income Fund Class F | 280,090,032 | 100,705,045 | 36,682,623 | 5,876,251 | 357,942,022 |
Fidelity Series Growth Company Fund Class F | 293,247,654 | 69,406,623 | 6,010,196 | 1,256,574 | 408,298,916 |
Fidelity Series High Income Fund Class F | 262,406,674 | 49,504,334 | 127,969,911 | 11,727,638 | 167,841,727 |
Fidelity Series Inflation-Protected Bond Index Fund Class F | - | 72,011 | - | 32 | 72,011 |
Fidelity Series International Growth Fund Class F | 374,496,629 | 94,944,664 | 40,145,244 | 6,007,045 | 436,570,208 |
Fidelity Series International Small Cap Fund Class F | 84,667,970 | 25,332,869 | 8,095,147 | 992,614 | 100,669,089 |
Fidelity Series International Value Fund Class F | 377,702,134 | 128,476,047 | 40,097,954 | 16,887,689 | 429,984,715 |
Fidelity Series Intrinsic Opportunities Fund Class F | 184,799,994 | 62,333,612 | 25,415,818 | 3,368,457 | 239,661,253 |
Fidelity Series Investment Grade Bond Fund Class F | 83,062,491 | 29,154,885 | 84,405,083 | 1,333,416 | 29,157,370 |
Fidelity Series Opportunistic Insights Fund Class F | 183,883,122 | 62,347,530 | 32,891,399 | 176,501 | 234,718,961 |
Fidelity Series Real Estate Equity Fund Class F | 35,195,509 | 22,918,583 | 21,507,499 | 722,565 | 42,504,403 |
Fidelity Series Real Estate Income Fund Class F | 18,880,645 | 6,617,519 | 2,413,958 | 1,140,518 | 23,142,731 |
Fidelity Series Short-Term Credit Fund Class F | - | 27,545,233 | 24,392 | - | 27,548,384 |
Fidelity Series Small Cap Discovery Fund Class F | 44,906,535 | 19,595,048 | 6,422,452 | 185,678 | 63,793,950 |
Fidelity Series Small Cap Opportunities Fund Class F | 151,389,190 | 59,660,667 | 18,827,353 | 871,987 | 196,165,923 |
Fidelity Series Stock Selector Large Cap Value Fund Class F | 251,228,133 | 95,565,894 | 42,148,255 | 4,447,655 | 313,563,460 |
Fidelity Short-Term Bond Fund Class F | - | 31,261,267 | 31,293,779 | 128,721 | - |
Total | $ 3,950,392,980 | $ 1,536,786,468 | $ 753,526,287 | $ 78,265,078 | $ 4,855,321,253 |
Other Information |
All investments are categorized as Level 1 under the Fair Value Hierarchy. The inputs or methodology used for valuing securities may not be an indication of the risk associated with investing in those securities. For more information on valuation inputs, please refer to the Investment Valuation section in the accompanying Notes to Financial Statements. |
See accompanying notes which are an integral part of the financial statements.
Annual Report
Fidelity Freedom K® 2050 Fund
Statement of Assets and Liabilities
| March 31, 2015 |
| | |
Assets | | |
Investment in securities, at value (cost $4,299,616,647) - See accompanying schedule | | $ 4,855,321,253 |
Receivable for investments sold | | 10,705,436 |
Receivable for fund shares sold | | 12,574,981 |
Dividends receivable | | 22,443 |
Total assets | | 4,878,624,113 |
| | |
Liabilities | | |
Payable for investments purchased | $ 6,427,554 | |
Payable for fund shares redeemed | 16,854,268 | |
Transfer agent fees payable | 188,609 | |
Total liabilities | | 23,470,431 |
| | |
Net Assets | | $ 4,855,153,682 |
Net Assets consist of: | | |
Paid in capital | | $ 4,204,092,546 |
Undistributed net investment income | | 3,658,715 |
Accumulated undistributed net realized gain (loss) on investments | | 91,697,815 |
Net unrealized appreciation (depreciation) on investments | | 555,704,606 |
Net Assets, for 291,238,730 shares outstanding | | $ 4,855,153,682 |
Net Asset Value, offering price and redemption price per share ($4,855,153,682 ÷ 291,238,730 shares) | | $ 16.67 |
Statement of Operations
| Year ended March 31, 2015 |
| | |
Investment Income | | |
Income distributions from underlying funds | | $ 78,265,078 |
| | |
Expenses | | |
Transfer agent fees | $ 2,047,525 | |
Independent trustees' compensation | 18,448 | |
Total expenses | | 2,065,973 |
Net investment income (loss) | | 76,199,105 |
Realized and Unrealized Gain (Loss) Realized gain (loss) on sale of underlying fund shares | 1,046,331 | |
Capital gain distributions from underlying funds | 143,915,201 | |
Total net realized gain (loss) | | 144,961,532 |
Change in net unrealized appreciation (depreciation) on underlying funds | | 120,621,752 |
Net gain (loss) | | 265,583,284 |
Net increase (decrease) in net assets resulting from operations | | $ 341,782,389 |
See accompanying notes which are an integral part of the financial statements.
Annual Report
Statement of Changes in Net Assets
| Year ended
March 31,
2015 | Year ended
March 31,
2014 |
Increase (Decrease) in Net Assets | | |
Operations | | |
Net investment income (loss) | $ 76,199,105 | $ 51,346,412 |
Net realized gain (loss) | 144,961,532 | 232,331,535 |
Change in net unrealized appreciation (depreciation) | 120,621,752 | 216,623,771 |
Net increase (decrease) in net assets resulting from operations | 341,782,389 | 500,301,718 |
Distributions to shareholders from net investment income | (123,727,434) | (4,183,728) |
Distributions to shareholders from net realized gain | (280,338,195) | (61,363,019) |
Total distributions | (404,065,629) | (65,546,747) |
Share transactions
Proceeds from sales of shares | 1,934,879,948 | 1,659,411,166 |
Reinvestment of distributions | 404,065,629 | 65,546,747 |
Cost of shares redeemed | (1,371,749,697) | (1,127,516,370) |
Net increase (decrease) in net assets resulting from share transactions | 967,195,880 | 597,441,543 |
Total increase (decrease) in net assets | 904,912,640 | 1,032,196,514 |
| | |
Net Assets | | |
Beginning of period | 3,950,241,042 | 2,918,044,528 |
End of period (including undistributed net investment income of $3,658,715 and undistributed net investment income of $51,187,044, respectively) | $ 4,855,153,682 | $ 3,950,241,042 |
Other Information Shares | | |
Sold | 117,558,771 | 104,032,436 |
Issued in reinvestment of distributions | 25,322,033 | 4,335,101 |
Redeemed | (83,294,106) | (70,340,311) |
Net increase (decrease) | 59,586,698 | 38,027,226 |
Financial Highlights
Years ended March 31, | 2015 | 2014 | 2013 | 2012 | 2011 |
Selected Per-Share Data | | | | | |
Net asset value, beginning of period | $ 17.05 | $ 15.07 | $ 14.11 | $ 14.77 | $ 12.94 |
Income from Investment Operations | | | | | |
Net investment income (loss) A | .29 | .24 | .27 | .24 | .24 |
Net realized and unrealized gain (loss) | .98 | 2.07 | 1.13 | (.27) | 1.86 |
Total from investment operations | 1.27 | 2.31 | 1.40 | (.03) | 2.10 |
Distributions from net investment income | (.48) | (.02) | (.25) | (.19) | (.17) |
Distributions from net realized gain | (1.17) | (.31) | (.20) | (.44) | (.11) |
Total distributions | (1.65) | (.33) | (.44) E | (.63) | (.27) D |
Net asset value, end of period | $ 16.67 | $ 17.05 | $ 15.07 | $ 14.11 | $ 14.77 |
Total Return | 8.09% | 15.60% | 10.26% | .06% | 16.43% |
Ratios to Average Net Assets B, C | | | | | |
Expenses before reductions | .05% | .05% | .05% | .05% | .05% |
Expenses net of fee waivers, if any | .05% | .05% | .05% | .05% | .05% |
Expenses net of all reductions | .05% | .05% | .05% | .05% | .05% |
Net investment income (loss) | 1.75% | 1.49% | 1.94% | 1.78% | 1.77% |
Supplemental Data | | | | | |
Net assets, end of period (000 omitted) | $ 4,855,154 | $ 3,950,241 | $ 2,918,045 | $ 1,705,495 | $ 677,007 |
Portfolio turnover rate B | 17% | 48% | 29% | 14% | 42% |
A Calculated based on average shares outstanding during the period.
B Amounts do not include the activity of the Underlying Funds.
C Expense ratios reflect operating expenses of the Fund. Expenses before reductions do not reflect amounts reimbursed by the investment adviser or reductions from expense offset arrangements and do not represent the amount paid by the Fund during periods when reimbursements or reductions occur. Expenses net of fee waivers reflect expenses after reimbursement by the investment adviser but prior to reductions from expense offset arrangements. Expenses net of all reductions represent the net expenses paid by the Fund but do not include expenses of the underlying funds in which the Fund invests.
D Total distributions of $.27 per share is comprised of distributions from net investment income of $.167 and distributions from net realized gain of $.106 per share.
E Total distributions of $.44 per share is comprised of distributions from net investment income of $.245 and distributions from net realized gain of $.198 per share.
See accompanying notes which are an integral part of the financial statements.
Annual Report
Fidelity Freedom K® 2055 Fund
Investment Changes (Unaudited)
The information in the following tables is based on the direct investments of the Fund. |
Fund Holdings as of March 31, 2015 |
| % of fund's
net assets | % of fund's net assets
6 months ago |
Domestic Equity Funds | | |
Fidelity Series 100 Index Fund Class F | 2.3 | 2.3 |
Fidelity Series 1000 Value Index Fund Class F | 1.3 | 1.3 |
Fidelity Series All-Sector Equity Fund Class F | 7.4 | 7.6 |
Fidelity Series Blue Chip Growth Fund Class F | 5.8 | 6.6 |
Fidelity Series Commodity Strategy Fund Class F | 0.8 | 1.0 |
Fidelity Series Equity-Income Fund Class F | 9.7 | 9.8 |
Fidelity Series Growth & Income Fund Class F | 7.4 | 7.5 |
Fidelity Series Growth Company Fund Class F | 8.4 | 7.6 |
Fidelity Series Intrinsic Opportunities Fund Class F | 4.9 | 4.9 |
Fidelity Series Opportunistic Insights Fund Class F | 4.8 | 5.0 |
Fidelity Series Real Estate Equity Fund Class F | 0.9 | 0.9 |
Fidelity Series Small Cap Discovery Fund Class F | 1.3 | 1.3 |
Fidelity Series Small Cap Opportunities Fund Class F | 4.0 | 3.8 |
Fidelity Series Stock Selector Large Cap Value Fund Class F | 6.5 | 6.5 |
| 65.5 | 66.1 |
International Equity Funds | | |
Fidelity Series Emerging Markets Fund Class F | 7.7 | 6.6 |
Fidelity Series International Growth Fund Class F | 9.0 | 9.0 |
Fidelity Series International Small Cap Fund Class F | 2.0 | 2.0 |
Fidelity Series International Value Fund Class F | 8.9 | 8.9 |
| 27.6 | 26.5 |
Bond Funds | | |
Fidelity Series Emerging Markets Debt Fund Class F | 0.5 | 0.6 |
Fidelity Series Floating Rate High Income Fund Class F | 0.5 | 0.5 |
Fidelity Series High Income Fund Class F | 3.4 | 4.4 |
Fidelity Series Inflation-Protected Bond Index Fund Class F | 0.1 | 0.0 |
Fidelity Series Investment Grade Bond Fund Class F | 0.5 | 0.5 |
Fidelity Series Real Estate Income Fund Class F | 0.5 | 0.5 |
| 5.5 | 6.5 |
Short-Term Funds | | |
Fidelity Institutional Money Market Portfolio Class F | 0.8 | 0.6 |
Fidelity Series Short-Term Credit Fund Class F | 0.6 | 0.0 |
Fidelity Short-Term Bond Fund Class F | 0.0 | 0.3 |
| 1.4 | 0.9 |
Net Other Assets (Liabilities)* | 0.0 | 0.0 |
| 100.0 | 100.0 |
* Amount represents less than 0.1% |
Asset Allocation (% of fund's net assets) |
Period end |
 | Domestic Equity Funds** | 65.5% | |
 | International Equity Funds | 27.6% | |
 | Bond Funds | 5.5% | |
 | Short-Term Funds | 1.4% | |

Six months ago |
 | Domestic Equity Funds** | 66.1% | |
 | International Equity Funds | 26.5% | |
 | Bond Funds | 6.5% | |
 | Short-Term Funds | 0.9% | |

** Includes Fidelity Series Commodity Strategy Fund which invests in commodity-related investments. |
Annual Report
Fidelity Freedom K® 2055 Fund
Investments March 31, 2015
Showing Percentage of Net Assets
Domestic Equity Funds - 65.5% |
| Shares | | Value |
Fidelity Series 100 Index Fund Class F (c) | 1,661,147 | | $ 22,076,639 |
Fidelity Series 1000 Value Index Fund Class F (c) | 1,122,713 | | 12,574,387 |
Fidelity Series All-Sector Equity Fund Class F (c) | 5,112,934 | | 72,348,012 |
Fidelity Series Blue Chip Growth Fund Class F (c) | 4,397,866 | | 56,160,751 |
Fidelity Series Commodity Strategy Fund Class F (a)(c) | 1,231,576 | | 7,598,824 |
Fidelity Series Equity-Income Fund Class F (c) | 7,436,320 | | 93,920,725 |
Fidelity Series Growth & Income Fund Class F (c) | 5,305,247 | | 72,045,256 |
Fidelity Series Growth Company Fund Class F (c) | 6,463,014 | | 81,304,718 |
Fidelity Series Intrinsic Opportunities Fund Class F (c) | 3,178,110 | | 48,084,803 |
Fidelity Series Opportunistic Insights Fund Class F (c) | 3,044,953 | | 47,074,969 |
Fidelity Series Real Estate Equity Fund Class F (c) | 577,324 | | 8,671,410 |
Fidelity Series Small Cap Discovery Fund Class F (c) | 1,132,123 | | 12,792,986 |
Fidelity Series Small Cap Opportunities Fund Class F (c) | 2,860,329 | | 39,386,727 |
Fidelity Series Stock Selector Large Cap Value Fund Class F (c) | 4,868,437 | | 63,241,001 |
TOTAL DOMESTIC EQUITY FUNDS (Cost $582,822,552) |
637,281,208
|
International Equity Funds - 27.6% |
| | | |
Fidelity Series Emerging Markets Fund Class F (c) | 4,388,320 | | 74,776,974 |
Fidelity Series International Growth Fund Class F (c) | 6,079,429 | | 87,726,158 |
Fidelity Series International Small Cap Fund Class F (c) | 1,262,724 | | 20,077,314 |
Fidelity Series International Value Fund Class F (c) | 8,514,162 | | 86,418,742 |
TOTAL INTERNATIONAL EQUITY FUNDS (Cost $262,578,955) |
268,999,188
|
Bond Funds - 5.5% |
| Shares | | Value |
Fidelity Series Emerging Markets Debt Fund Class F (c) | 567,799 | | $ 5,513,325 |
Fidelity Series Floating Rate High Income Fund Class F (c) | 472,998 | | 4,640,111 |
Fidelity Series High Income Fund Class F (c) | 3,346,126 | | 32,792,039 |
Fidelity Series Inflation-Protected Bond Index Fund Class F (c) | 72,665 | | 709,208 |
Fidelity Series Investment Grade Bond Fund Class F (c) | 466,682 | | 5,399,515 |
Fidelity Series Real Estate Income Fund Class F (c) | 410,224 | | 4,639,636 |
TOTAL BOND FUNDS (Cost $55,252,876) |
53,693,834
|
Short-Term Funds - 1.4% |
| | | |
Fidelity Institutional Money Market Portfolio Class F 0.14% (b)(c) | 7,780,101 | | 7,780,101 |
Fidelity Series Short-Term Credit Fund Class F (c) | 553,450 | | 5,540,036 |
TOTAL SHORT-TERM FUNDS (Cost $13,314,610) |
13,320,137
|
TOTAL INVESTMENT PORTFOLIO - 100.0% (Cost $913,968,993) | | 973,294,367 |
NET OTHER ASSETS (LIABILITIES) - 0.0% | | (32,998) |
NET ASSETS - 100% | $ 973,261,369 |
Legend |
(a) Non-income producing |
(b) The rate quoted is the annualized seven-day yield of the fund at period end. |
(c) Affiliated Fund |
Affiliated Underlying Funds |
Information regarding the Fund's fiscal year to date purchases and sales of the affiliated Underlying Funds and income earned by the Fund from investments in affiliated Underlying Funds is as follows: |
Affiliate | Value,
beginning of
period | Purchases | Sales
Proceeds | Dividend
Income | Value,
end of
period |
Fidelity Institutional Money Market Portfolio Class F | $ - | $ 8,070,998 | $ 290,897 | $ 3,405 | $ 7,780,101 |
Fidelity Series 100 Index Fund Class F | 10,656,078 | 11,715,156 | 1,503,143 | 384,434 | 22,076,639 |
Fidelity Series 1000 Value Index Fund Class F | 7,189,640 | 6,345,351 | 1,284,683 | 230,222 | 12,574,387 |
Fidelity Series All-Sector Equity Fund Class F | 35,206,123 | 42,535,950 | 4,741,832 | 671,628 | 72,348,012 |
Fidelity Series Blue Chip Growth Fund Class F | 35,034,182 | 28,967,518 | 16,183,398 | 171,393 | 56,160,751 |
Fidelity Series Commodity Strategy Fund Class F | 5,636,764 | 4,611,648 | 390,810 | - | 7,598,824 |
Fidelity Series Emerging Markets Debt Fund Class F | 3,710,480 | 2,359,096 | 316,195 | 262,224 | 5,513,325 |
Fidelity Series Emerging Markets Fund Class F | 29,803,002 | 49,282,459 | 2,440,348 | 572,198 | 74,776,974 |
Affiliate | Value,
beginning of
period | Purchases | Sales
Proceeds | Dividend
Income | Value,
end of
period |
Fidelity Series Equity-Income Fund Class F | $ 53,600,742 | $ 49,608,441 | $ 9,261,056 | $ 1,589,825 | $ 93,920,725 |
Fidelity Series Floating Rate High Income Fund Class F | 56,679 | 5,432,711 | 626,134 | 114,987 | 4,640,111 |
Fidelity Series Growth & Income Fund Class F | 40,332,280 | 36,127,249 | 6,638,457 | 959,289 | 72,045,256 |
Fidelity Series Growth Company Fund Class F | 39,165,705 | 33,912,129 | 681,274 | 218,943 | 81,304,718 |
Fidelity Series High Income Fund Class F | 36,432,429 | 14,779,645 | 15,835,881 | 1,896,308 | 32,792,039 |
Fidelity Series Inflation-Protected Bond Index Fund Class F | - | 774,968 | 65,369 | 330 | 709,208 |
Fidelity Series International Growth Fund Class F | 51,886,010 | 38,649,101 | 4,452,601 | 1,062,342 | 87,726,158 |
Fidelity Series International Small Cap Fund Class F | 12,372,156 | 8,952,894 | 1,191,269 | 181,312 | 20,077,314 |
Fidelity Series International Value Fund Class F | 52,556,423 | 43,855,267 | 3,873,678 | 3,036,501 | 86,418,742 |
Fidelity Series Intrinsic Opportunities Fund Class F | 26,409,477 | 23,095,471 | 4,623,204 | 577,265 | 48,084,803 |
Fidelity Series Investment Grade Bond Fund Class F | 12,160,371 | 8,713,468 | 15,684,582 | 219,539 | 5,399,515 |
Fidelity Series Opportunistic Insights Fund Class F | 26,030,199 | 23,102,766 | 5,687,192 | 32,045 | 47,074,969 |
Fidelity Series Real Estate Equity Fund Class F | 5,860,474 | 8,141,154 | 6,366,118 | 117,113 | 8,671,410 |
Fidelity Series Real Estate Income Fund Class F | 1,659,974 | 3,177,550 | 190,340 | 187,651 | 4,639,636 |
Fidelity Series Short-Term Credit Fund Class F | - | 5,534,509 | - | - | 5,540,036 |
Fidelity Series Small Cap Discovery Fund Class F | 6,582,268 | 7,245,371 | 2,139,428 | 32,240 | 12,792,986 |
Fidelity Series Small Cap Opportunities Fund Class F | 21,354,847 | 20,317,263 | 3,394,535 | 149,540 | 39,386,727 |
Fidelity Series Stock Selector Large Cap Value Fund Class F | 35,624,913 | 33,522,578 | 6,859,994 | 817,882 | 63,241,001 |
Fidelity Short-Term Bond Fund Class F | - | 5,640,728 | 5,650,314 | 24,435 | - |
Total | $ 549,321,216 | $ 524,471,439 | $ 120,372,732 | $ 13,513,051 | $ 973,294,367 |
Other Information |
All investments are categorized as Level 1 under the Fair Value Hierarchy. The inputs or methodology used for valuing securities may not be an indication of the risk associated with investing in those securities. For more information on valuation inputs, please refer to the Investment Valuation section in the accompanying Notes to Financial Statements. |
See accompanying notes which are an integral part of the financial statements.
Annual Report
Fidelity Freedom K® 2055 Fund
Statement of Assets and Liabilities
| March 31, 2015 |
| | |
Assets | | |
Investment in securities, at value (cost $913,968,993) - See accompanying schedule | | $ 973,294,367 |
Receivable for investments sold | | 1,304,567 |
Receivable for fund shares sold | | 4,893,345 |
Dividends receivable | | 4,469 |
Total assets | | 979,496,748 |
| | |
Liabilities | | |
Payable for investments purchased | $ 2,555,389 | |
Payable for fund shares redeemed | 3,642,578 | |
Transfer agent fees payable | 37,412 | |
Total liabilities | | 6,235,379 |
| | |
Net Assets | | $ 973,261,369 |
Net Assets consist of: | | |
Paid in capital | | $ 896,940,349 |
Undistributed net investment income | | 699,894 |
Accumulated undistributed net realized gain (loss) on investments | | 16,295,752 |
Net unrealized appreciation (depreciation) on investments | | 59,325,374 |
Net Assets, for 79,290,174 shares outstanding | | $ 973,261,369 |
Net Asset Value, offering price and redemption price per share ($973,261,369 ÷ 79,290,174 shares) | | $ 12.27 |
Statement of Operations
| Year ended March 31, 2015 |
| | |
Investment Income | | |
Income distributions from underlying funds | | $ 13,513,051 |
| | |
Expenses | | |
Transfer agent fees | $ 347,256 | |
Independent trustees' compensation | 3,008 | |
Total expenses | | 350,264 |
Net investment income (loss) | | 13,162,787 |
Realized and Unrealized Gain (Loss) Realized gain (loss) on sale of underlying fund shares | (689,769) | |
Capital gain distributions from underlying funds | 25,887,371 | |
Total net realized gain (loss) | | 25,197,602 |
Change in net unrealized appreciation (depreciation) on underlying funds | | 20,564,211 |
Net gain (loss) | | 45,761,813 |
Net increase (decrease) in net assets resulting from operations | | $ 58,924,600 |
See accompanying notes which are an integral part of the financial statements.
Annual Report
Fidelity Freedom K® 2055 Fund
Financial Statements - continued
Statement of Changes in Net Assets
| Year ended
March 31,
2015 | Year ended
March 31,
2014 |
Increase (Decrease) in Net Assets | | |
Operations | | |
Net investment income (loss) | $ 13,162,787 | $ 5,444,404 |
Net realized gain (loss) | 25,197,602 | 21,051,050 |
Change in net unrealized appreciation (depreciation) | 20,564,211 | 27,788,141 |
Net increase (decrease) in net assets resulting from operations | 58,924,600 | 54,283,595 |
Distributions to shareholders from net investment income | (17,897,594) | (238,637) |
Distributions to shareholders from net realized gain | (29,749,905) | (2,600,273) |
Total distributions | (47,647,499) | (2,838,910) |
Share transactions
Proceeds from sales of shares | 642,055,771 | 437,597,445 |
Reinvestment of distributions | 47,647,499 | 2,838,910 |
Cost of shares redeemed | (277,019,718) | (151,153,116) |
Net increase (decrease) in net assets resulting from share transactions | 412,683,552 | 289,283,239 |
Total increase (decrease) in net assets | 423,960,653 | 340,727,924 |
| | |
Net Assets | | |
Beginning of period | 549,300,716 | 208,572,792 |
End of period (including undistributed net investment income of $699,894 and undistributed net investment income of $5,434,701, respectively) | $ 973,261,369 | $ 549,300,716 |
Other Information Shares | | |
Sold | 53,192,518 | 38,298,258 |
Issued in reinvestment of distributions | 4,039,174 | 263,353 |
Redeemed | (22,933,630) | (13,177,477) |
Net increase (decrease) | 34,298,062 | 25,384,134 |
Financial Highlights
Years ended March 31, | 2015 | 2014 | 2013 | 2012 E |
Selected Per-Share Data | | | | |
Net asset value, beginning of period | $ 12.21 | $ 10.64 | $ 9.84 | $ 10.00 |
Income from Investment Operations | | | | |
Net investment income (loss) C | .21 | .17 | .22 | .14 |
Net realized and unrealized gain (loss) | .72 | 1.53 | .79 | (.11) |
Total from investment operations | .93 | 1.70 | 1.01 | .03 |
Distributions from net investment income | (.30) | (.01) | (.15) | (.10) |
Distributions from net realized gain | (.57) | (.12) | (.06) | (.08) |
Total distributions | (.87) | (.13) | (.21) | (.19) G |
Net asset value, end of period | $ 12.27 | $ 12.21 | $ 10.64 | $ 9.84 |
Total Return B | 8.03% | 16.15% | 10.48% | .47% |
Ratios to Average Net Assets D, F | | | | |
Expenses before reductions | .05% | .05% | .05% | .05% A |
Expenses net of fee waivers, if any | .05% | .05% | .05% | .05% A |
Expenses net of all reductions | .05% | .05% | .05% | .05% A |
Net investment income (loss) | 1.78% | 1.50% | 2.17% | 1.78% A |
Supplemental Data | | | | |
Net assets, end of period (000 omitted) | $ 973,261 | $ 549,301 | $ 208,573 | $ 24,870 |
Portfolio turnover rate D | 16% | 45% | 27% | 7% A |
A Annualized
B Total returns for periods of less than one year are not annualized.
C Calculated based on average shares outstanding during the period.
D Amounts do not include the activity of the Underlying Funds.
E For the period June 1, 2011 (commencement of operations) to March 31, 2012.
F Expense ratios reflect operating expenses of the Fund. Expenses before reductions do not reflect amounts reimbursed by the investment adviser or reductions from expense offset arrangements and do not represent the amount paid by the Fund during periods when reimbursements or reductions occur. Expenses net of fee waivers reflect expenses after reimbursement by the investment adviser but prior to reductions from expense offset arrangements. Expenses net of all reductions represent the net expenses paid by the Fund but do not include expenses of the underlying funds in which the Fund invests.
G Total distributions of $.19 per share is comprised of distributions from net investment income of $.104 and distributions from net realized gain of $.081 per share.
See accompanying notes which are an integral part of the financial statements.
Annual Report
Fidelity Freedom K® 2060 Fund
Investment Changes (Unaudited)
The information in the following tables is based on the direct investments of the Fund. |
Fund Holdings as of March 31, 2015 |
| % of fund's
net assets | % of fund's net assets
6 months ago |
Domestic Equity Funds | | |
Fidelity Series 100 Index Fund Class F | 2.4 | 2.3 |
Fidelity Series 1000 Value Index Fund Class F | 1.3 | 1.3 |
Fidelity Series All-Sector Equity Fund Class F | 7.7 | 7.5 |
Fidelity Series Blue Chip Growth Fund Class F | 6.0 | 6.6 |
Fidelity Series Commodity Strategy Fund Class F | 0.8 | 1.0 |
Fidelity Series Equity-Income Fund Class F | 10.0 | 9.8 |
Fidelity Series Growth & Income Fund Class F | 7.6 | 7.6 |
Fidelity Series Growth Company Fund Class F | 6.4 | 7.9 |
Fidelity Series Intrinsic Opportunities Fund Class F | 5.2 | 4.9 |
Fidelity Series Opportunistic Insights Fund Class F | 5.0 | 4.9 |
Fidelity Series Real Estate Equity Fund Class F | 0.9 | 0.9 |
Fidelity Series Small Cap Discovery Fund Class F | 1.4 | 1.2 |
Fidelity Series Small Cap Opportunities Fund Class F | 4.1 | 3.7 |
Fidelity Series Stock Selector Large Cap Value Fund Class F | 6.7 | 6.5 |
| 65.5 | 66.1 |
International Equity Funds | | |
Fidelity Series Emerging Markets Fund Class F | 7.7 | 6.5 |
Fidelity Series International Growth Fund Class F | 9.0 | 9.1 |
Fidelity Series International Small Cap Fund Class F | 2.1 | 2.0 |
Fidelity Series International Value Fund Class F | 8.9 | 9.2 |
| 27.7 | 26.8 |
Bond Funds | | |
Fidelity Series Emerging Markets Debt Fund Class F | 0.5 | 0.6 |
Fidelity Series Floating Rate High Income Fund Class F | 0.5 | 0.5 |
Fidelity Series High Income Fund Class F | 3.3 | 4.3 |
Fidelity Series Inflation-Protected Bond Index Fund Class F | 0.1 | 0.0 |
Fidelity Series Investment Grade Bond Fund Class F | 0.5 | 0.5 |
Fidelity Series Real Estate Income Fund Class F | 0.5 | 0.5 |
| 5.4 | 6.4 |
Short-Term Funds | | |
Fidelity Institutional Money Market Portfolio Class F | 0.9 | 0.5 |
Fidelity Series Short-Term Credit Fund Class F | 0.5 | 0.0 |
Fidelity Short-Term Bond Fund Class F | 0.0 | 0.2 |
| 1.4 | 0.7 |
Net Other Assets (Liabilities)* | 0.0 | 0.0 |
| 100.0 | 100.0 |
* Amount represents less than 0.1% |
Asset Allocation (% of fund's net assets) |
Period end |
 | Domestic Equity Funds** | 65.5% | |
 | International Equity Funds | 27.7% | |
 | Bond Funds | 5.4% | |
 | Short-Term Funds | 1.4% | |

Six months ago |
 | Domestic Equity Funds** | 66.1% | |
 | International Equity Funds | 26.8% | |
 | Bond Funds | 6.4% | |
 | Short-Term Funds | 0.7% | |

** Includes Fidelity Series Commodity Strategy Fund which invests in commodity-related investments. |
Annual Report
Fidelity Freedom K® 2060 Fund
Investments March 31, 2015
Showing Percentage of Net Assets
Domestic Equity Funds - 65.5% |
| Shares | | Value |
Fidelity Series 100 Index Fund Class F (c) | 14,390 | | $ 191,241 |
Fidelity Series 1000 Value Index Fund Class F (c) | 9,677 | | 108,383 |
Fidelity Series All-Sector Equity Fund Class F (c) | 43,918 | | 621,439 |
Fidelity Series Blue Chip Growth Fund Class F (c) | 38,094 | | 486,459 |
Fidelity Series Commodity Strategy Fund Class F (a)(c) | 10,280 | | 63,430 |
Fidelity Series Equity-Income Fund Class F (c) | 64,440 | | 813,879 |
Fidelity Series Growth & Income Fund Class F (c) | 45,707 | | 620,700 |
Fidelity Series Growth Company Fund Class F (c) | 41,530 | | 522,443 |
Fidelity Series Intrinsic Opportunities Fund Class F (c) | 28,084 | | 424,913 |
Fidelity Series Opportunistic Insights Fund Class F (c) | 26,464 | | 409,138 |
Fidelity Series Real Estate Equity Fund Class F (c) | 4,943 | | 74,247 |
Fidelity Series Small Cap Discovery Fund Class F (c) | 9,700 | | 109,607 |
Fidelity Series Small Cap Opportunities Fund Class F (c) | 24,060 | | 331,301 |
Fidelity Series Stock Selector Large Cap Value Fund Class F (c) | 41,758 | | 542,431 |
TOTAL DOMESTIC EQUITY FUNDS (Cost $5,330,514) |
5,319,611
|
International Equity Funds - 27.7% |
| | | |
Fidelity Series Emerging Markets Fund Class F (c) | 36,816 | | 627,343 |
Fidelity Series International Growth Fund Class F (c) | 50,496 | | 728,661 |
Fidelity Series International Small Cap Fund Class F (c) | 10,565 | | 167,981 |
Fidelity Series International Value Fund Class F (c) | 71,234 | | 723,024 |
TOTAL INTERNATIONAL EQUITY FUNDS (Cost $2,232,058) |
2,247,009
|
Bond Funds - 5.4% |
| Shares | | Value |
Fidelity Series Emerging Markets Debt Fund Class F (c) | 4,668 | | $ 45,326 |
Fidelity Series Floating Rate High Income Fund Class F (c) | 4,034 | | 39,573 |
Fidelity Series High Income Fund Class F (c) | 27,024 | | 264,831 |
Fidelity Series Inflation-Protected Bond Index Fund Class F (c) | 765 | | 7,464 |
Fidelity Series Investment Grade Bond Fund Class F (c) | 3,759 | | 43,493 |
Fidelity Series Real Estate Income Fund Class F (c) | 3,417 | | 38,651 |
TOTAL BOND FUNDS (Cost $438,917) |
439,338
|
Short-Term Funds - 1.4% |
| | | |
Fidelity Institutional Money Market Portfolio Class F 0.14% (b)(c) | 74,288 | | 74,288 |
Fidelity Series Short-Term Credit Fund Class F (c) | 3,528 | | 35,311 |
TOTAL SHORT-TERM FUNDS (Cost $109,564) |
109,599
|
TOTAL INVESTMENT PORTFOLIO - 100.0% (Cost $8,111,053) | | 8,115,557 |
NET OTHER ASSETS (LIABILITIES) - 0.0% | | (142) |
NET ASSETS - 100% | $ 8,115,415 |
Legend |
(a) Non-income producing |
(b) The rate quoted is the annualized seven-day yield of the fund at period end. |
(c) Affiliated Fund |
Affiliated Underlying Funds |
Information regarding the Fund's fiscal year to date purchases and sales of the affiliated Underlying Funds and income earned by the Fund from investments in affiliated Underlying Funds is as follows: |
Affiliate | Value,
beginning of
period | Purchases | Sales
Proceeds | Dividend
Income | Value,
end of
period |
Fidelity Institutional Money Market Portfolio Class F | $ - | $ 77,840 | $ 3,552 | $ 4 | $ 74,288 |
Fidelity Series 100 Index Fund Class F | - | 193,669 | 829 | 96 | 191,241 |
Fidelity Series 1000 Value Index Fund Class F | - | 109,725 | 752 | 115 | 108,383 |
Fidelity Series All-Sector Equity Fund Class F | - | 634,186 | 4,276 | 565 | 621,439 |
Fidelity Series Blue Chip Growth Fund Class F | - | 526,063 | 43,677 | 31 | 486,459 |
Fidelity Series Commodity Strategy Fund Class F | - | 72,727 | 7,343 | - | 63,430 |
Fidelity Series Emerging Markets Debt Fund Class F | - | 45,109 | 95 | 175 | 45,326 |
Fidelity Series Emerging Markets Fund Class F | - | 622,040 | 12 | 102 | 627,343 |
Affiliate | Value,
beginning of
period | Purchases | Sales
Proceeds | Dividend
Income | Value,
end of
period |
Fidelity Series Equity-Income Fund Class F | $ - | $ 826,062 | $ 4,003 | $ 197 | $ 813,879 |
Fidelity Series Floating Rate High Income Fund Class F | - | 39,585 | 6 | 129 | 39,573 |
Fidelity Series Growth & Income Fund Class F | - | 626,523 | 2,476 | 109 | 620,700 |
Fidelity Series Growth Company Fund Class F | - | 523,776 | 119 | 38 | 522,443 |
Fidelity Series High Income Fund Class F | - | 266,277 | 1,123 | 1,138 | 264,831 |
Fidelity Series Inflation-Protected Bond Index Fund Class F | - | 7,973 | 540 | 2 | 7,464 |
Fidelity Series International Growth Fund Class F | - | 721,955 | 243 | 193 | 728,661 |
Fidelity Series International Small Cap Fund Class F | - | 165,118 | 33 | 34 | 167,981 |
Fidelity Series International Value Fund Class F | - | 723,474 | 231 | 554 | 723,024 |
Fidelity Series Intrinsic Opportunities Fund Class F | - | 421,439 | 2,286 | 109 | 424,913 |
Fidelity Series Investment Grade Bond Fund Class F | - | 47,921 | 4,669 | 81 | 43,493 |
Fidelity Series Opportunistic Insights Fund Class F | - | 416,899 | 7,763 | 8 | 409,138 |
Fidelity Series Real Estate Equity Fund Class F | - | 73,905 | 974 | 22 | 74,247 |
Fidelity Series Real Estate Income Fund Class F | - | 38,500 | 1 | 122 | 38,651 |
Fidelity Series Short-Term Credit Fund Class F | - | 35,276 | - | - | 35,311 |
Fidelity Series Small Cap Discovery Fund Class F | - | 107,904 | 459 | 4 | 109,607 |
Fidelity Series Small Cap Opportunities Fund Class F | - | 346,918 | 21,482 | 28 | 331,301 |
Fidelity Series Stock Selector Large Cap Value Fund Class F | - | 552,636 | 4,392 | 723 | 542,431 |
Fidelity Short-Term Bond Fund Class F | - | 34,355 | 34,413 | 33 | - |
Total | $ - | $ 8,257,855 | $ 145,749 | $ 4,612 | $ 8,115,557 |
Other Information |
All investments are categorized as Level 1 under the Fair Value Hierarchy. The inputs or methodology used for valuing securities may not be an indication of the risk associated with investing in those securities. For more information on valuation inputs, please refer to the Investment Valuation section in the accompanying Notes to Financial Statements. |
See accompanying notes which are an integral part of the financial statements.
Annual Report
Fidelity Freedom K® 2060 Fund
Statement of Assets and Liabilities
| March 31, 2015 |
| | |
Assets | | |
Investment in securities, at value (cost $8,111,053) - See accompanying schedule | | $ 8,115,557 |
Receivable for investments sold | | 3,553 |
Receivable for fund shares sold | | 183,949 |
Dividends receivable | | 21 |
Total assets | | 8,303,080 |
| | |
Liabilities | | |
Payable for investments purchased | $ 184,521 | |
Payable for fund shares redeemed | 2,959 | |
Transfer agent fees payable | 185 | |
Total liabilities | | 187,665 |
| | |
Net Assets | | $ 8,115,415 |
Net Assets consist of: | | |
Paid in capital | | $ 8,084,657 |
Undistributed net investment income | | 2,357 |
Accumulated undistributed net realized gain (loss) on investments | | 23,897 |
Net unrealized appreciation (depreciation) on investments | | 4,504 |
Net Assets, for 777,782 shares outstanding | | $ 8,115,415 |
Net Asset Value, offering price and redemption price per share ($8,115,415 ÷ 777,782 shares) | | $ 10.43 |
Statement of Operations
| For the period August 5, 2014
(commencement of operations)
to March 31, 2015 |
| | |
Investment Income | | |
Income distributions from underlying funds | | $ 4,612 |
| | |
Expenses | | |
Transfer agent fees | $ 270 | |
Independent trustees' compensation | 1 | |
Total expenses | | 271 |
Net investment income (loss) | | 4,341 |
Realized and Unrealized Gain (Loss) Realized gain (loss) on sale of underlying fund shares | (1,052) | |
Capital gain distributions from underlying funds | 26,506 | |
Total net realized gain (loss) | | 25,454 |
Change in net unrealized appreciation (depreciation) on underlying funds | | 4,504 |
Net gain (loss) | | 29,958 |
Net increase (decrease) in net assets resulting from operations | | $ 34,299 |
See accompanying notes which are an integral part of the financial statements.
Annual Report
Statement of Changes in Net Assets
| For the period
August 5, 2014
(commencement of
operations) to
March 31, 2015 |
Increase (Decrease) in Net Assets | |
Operations | |
Net investment income (loss) | $ 4,341 |
Net realized gain (loss) | 25,454 |
Change in net unrealized appreciation (depreciation) | 4,504 |
Net increase (decrease) in net assets resulting from operations | 34,299 |
Distributions to shareholders from net investment income | (1,984) |
Distributions to shareholders from net realized gain | (1,557) |
Total distributions | (3,541) |
Share transactions
Proceeds from sales of shares | 8,469,274 |
Reinvestment of distributions | 3,541 |
Cost of shares redeemed | (388,158) |
Net increase (decrease) in net assets resulting from share transactions | 8,084,657 |
Total increase (decrease) in net assets | 8,115,415 |
| |
Net Assets | |
Beginning of period | - |
End of period (including undistributed net investment income of $2,357) | $ 8,115,415 |
Other Information Shares | |
Sold | 814,547 |
Issued in reinvestment of distributions | 346 |
Redeemed | (37,111) |
Net increase (decrease) | 777,782 |
Financial Highlights
Year ended March 31, | 2015 E |
Selected Per-Share Data | |
Net asset value, beginning of period | $ 10.00 |
Income from Investment Operations | |
Net investment income (loss) C | .05 |
Net realized and unrealized gain (loss) | .55 |
Total from investment operations | .60 |
Distributions from net investment income | (.09) |
Distributions from net realized gain | (.07) |
Total distributions | (.17) G |
Net asset value, end of period | $ 10.43 |
Total Return B | 5.99% |
Ratios to Average Net Assets D, F | |
Expenses before reductions | .05% A |
Expenses net of fee waivers, if any | .05% A |
Expenses net of all reductions | .05% A |
Net investment income (loss) | .71% A |
Supplemental Data | |
Net assets, end of period (000 omitted) | $ 8,115 |
Portfolio turnover rate D | 15% A |
A Annualized
B Total returns for periods of less than one year are not annualized.
C Calculated based on average shares outstanding during the period.
D Amounts do not include the activity of the Underlying Funds.
E For the period August 5, 2014 (commencement of operations) to March 31, 2015.
F Expense ratios reflect operating expenses of the Fund. Expenses before reductions do not reflect amounts reimbursed by the investment adviser or reductions from expense offset arrangements and do not represent the amount paid by the Fund during periods when reimbursements or reductions occur. Expenses net of fee waivers reflect expenses after reimbursement by the investment adviser but prior to reductions from expense offset arrangements. Expenses net of all reductions represent the net expenses paid by the Fund but do not include expenses of the underlying funds in which the Fund invests.
G Total distributions of $.17 per share is comprised of distributions from net investment income of $.093 and distributions from net realized gain of $.073 per share.
See accompanying notes which are an integral part of the financial statements.
Annual Report
For the period ended March 31, 2015
1. Organization.
Fidelity Freedom K® Income Fund, Fidelity Freedom K® 2005 Fund, Fidelity Freedom K® 2010 Fund, Fidelity Freedom K® 2015 Fund, Fidelity Freedom K® 2020 Fund, Fidelity Freedom K® 2025 Fund, Fidelity Freedom K® 2030 Fund, Fidelity Freedom K® 2035 Fund, Fidelity Freedom K® 2040 Fund, Fidelity Freedom K® 2045 Fund, Fidelity Freedom K® 2050 Fund, Fidelity Freedom K® 2055 Fund and Fidelity Freedom K® 2060 Fund (the Funds) are funds of Fidelity Aberdeen Street Trust (the Trust). The Trust is registered under the Investment Company Act of 1940, as amended (the 1940 Act), as an open-end management investment company organized as a Delaware statutory trust. Each Fund is authorized to issue an unlimited number of shares. Share transactions on the Statement of Changes in Net Assets may contain exchanges between funds. The Funds invest primarily in a combination of other Fidelity equity, bond, and short-term funds (the Underlying Funds) managed by Fidelity Management & Research Company (FMR).
2. Significant Accounting Policies.
The financial statements have been prepared in conformity with accounting principles generally accepted in the United States of America (GAAP), which require management to make certain estimates and assumptions at the date of the financial statements. Actual results could differ from those estimates. Subsequent events, if any, through the date that the financial statements were issued have been evaluated in the preparation of the financial statements. The following summarizes the significant accounting policies of the Funds:
Investment Valuation. Investments are valued as of 4:00 p.m. Eastern time on the last calendar day of the period. Each Fund categorizes the inputs to valuation techniques used to value its investments into a disclosure hierarchy consisting of three levels as shown below:
Level 1 - quoted prices in active markets for identical investments
Level 2 - other significant observable inputs (including quoted prices for similar investments, interest rates, prepayment speeds, etc.)
Level 3 - unobservable inputs (including the Fund's own assumptions based on the best information available)
Valuation techniques used to value each Fund's investments by major category are as follows. Investments in the Underlying Funds are valued at their closing net asset value (NAV) each business day and are categorized as Level 1 in the hierarchy.
Investment Transactions and Income. For financial reporting purposes, the Funds' investment holdings and NAV include trades executed through the end of the last business day of the period. The NAV per share for processing shareholder transactions is calculated as of the close of business of the New York Stock Exchange (NYSE), normally 4:00 p.m. Eastern time and includes trades executed through the end of the prior business day. Gains and losses on securities sold are determined on the basis of identified cost. Income and capital gain distributions from the Underlying Funds, if any, are recorded on the ex-dividend date.
Expenses. Expenses directly attributable to a fund are charged to that fund. Expenses attributable to more than one fund are allocated among the respective funds on the basis of relative net assets or other appropriate methods. Expenses included in the accompanying financial statements reflect the expenses of each Fund and do not include any expenses associated with the Underlying Funds. Although not included in each Fund's expenses, each Fund indirectly bears its proportionate share of the Underlying Funds' expenses through the impact of these expenses on each Underlying Fund's NAV. Expense estimates are accrued in the period to which they relate and adjustments are made when actual amounts are known.
Income Tax Information and Distributions to Shareholders. Each year, each Fund intends to qualify as a regulated investment company under Subchapter M of the Internal Revenue Code, including distributing substantially all of its taxable income and realized gains. As a result, no provision for U.S. Federal income taxes is required. As of March 31, 2015, each Fund did not have any unrecognized tax benefits in the financial statements; nor is each Fund aware of any tax positions for which it is reasonably possible that the total amounts of unrecognized tax benefits will significantly change in the next twelve months. Each Fund files a U.S. federal tax return, in addition to state and local tax returns as required. Each Fund's federal income tax returns are subject to examination by the Internal Revenue Service (IRS) for a period of three fiscal years after they are filed. State and local tax returns may be subject to examination for an additional fiscal year depending on the jurisdiction.
Distributions are declared and recorded on the ex-dividend date. Income and capital gain distributions are determined in accordance with income tax regulations, which may differ from GAAP.
Capital accounts within the financial statements are adjusted for permanent book-tax differences. These adjustments have no impact on net assets or the results of operations. Capital accounts are not adjusted for temporary book-tax differences which will reverse in a subsequent period.
Book-tax differences are primarily due to short-term gain distributions from the Underlying Funds and losses deferred due to wash sales.
Annual Report
2. Significant Accounting Policies - continued
Income Tax Information and Distributions to Shareholders - continued
The federal tax cost of investment securities and unrealized appreciation (depreciation) as of period end were as follows for each Fund:
| Tax cost | Gross unrealized
appreciation | Gross unrealized
depreciation | Net unrealized
appreciation
(depreciation) on
securities |
Fidelity Freedom K® Income Fund | $ 1,915,413,861 | $ 108,281,046 | $ (16,458,541) | $ 91,822,505 |
Fidelity Freedom K® 2005 Fund | 437,684,850 | 36,633,332 | (3,749,424) | 32,883,908 |
Fidelity Freedom K® 2010 Fund | 3,313,318,002 | 382,920,420 | (26,641,360) | 356,279,060 |
Fidelity Freedom K® 2015 Fund | 6,054,210,585 | 718,522,004 | (51,684,492) | 666,837,512 |
Fidelity Freedom K® 2020 Fund | 15,721,646,295 | 1,909,594,687 | (140,299,201) | 1,769,295,486 |
Fidelity Freedom K® 2025 Fund | 11,550,422,696 | 1,484,978,182 | (103,723,224) | 1,381,254,958 |
Fidelity Freedom K® 2030 Fund | 14,032,492,383 | 2,090,767,074 | (124,322,688) | 1,966,444,386 |
Fidelity Freedom K® 2035 Fund | 8,858,526,349 | 1,353,133,948 | (85,836,729) | 1,267,297,219 |
Fidelity Freedom K® 2040 Fund | 9,504,438,491 | 1,504,101,609 | (88,076,464) | 1,416,025,145 |
Fidelity Freedom K® 2045 Fund | 5,268,274,479 | 749,500,251 | (51,193,246) | 698,307,005 |
Fidelity Freedom K® 2050 Fund | 4,310,424,747 | 587,827,680 | (42,931,174) | 544,896,506 |
Fidelity Freedom K® 2055 Fund | 915,768,692 | 69,822,476 | (12,296,801) | 57,525,675 |
Fidelity Freedom K® 2060 Fund | 8,112,446 | 64,891 | (61,780) | 3,111 |
The tax-based components of distributable earnings as of period end were as follows for each Fund:
| Undistributed
ordinary income | Undistributed
long-term
capital gain | Net unrealized
appreciation
(depreciation)
on securities
and other
investments |
Fidelity Freedom K® Income Fund | $ 3,688,664 | $ 19,735,349 | $ 91,822,505 |
Fidelity Freedom K® 2005 Fund | 1,667,542 | 6,595,334 | 32,883,908 |
Fidelity Freedom K® 2010 Fund | 8,809,987 | 80,835,096 | 356,279,060 |
Fidelity Freedom K® 2015 Fund | 15,102,823 | 125,208,107 | 666,837,512 |
Fidelity Freedom K® 2020 Fund | 28,828,046 | 301,436,850 | 1,769,295,486 |
Fidelity Freedom K® 2025 Fund | 31,005,870 | 230,270,162 | 1,381,254,958 |
Fidelity Freedom K® 2030 Fund | 29,002,379 | 331,771,698 | 1,966,444,386 |
Fidelity Freedom K® 2035 Fund | 16,356,941 | 215,579,784 | 1,267,297,219 |
Fidelity Freedom K® 2040 Fund | 17,068,169 | 234,446,323 | 1,416,025,145 |
Fidelity Freedom K® 2045 Fund | 10,438,499 | 122,561,283 | 698,307,005 |
Fidelity Freedom K® 2050 Fund | 8,923,622 | 97,241,009 | 544,896,506 |
Fidelity Freedom K® 2055 Fund | 1,588,677 | 17,206,668 | 57,525,675 |
Fidelity Freedom K® 2060 Fund | 4,711 | 22,936 | 3,111 |
The tax character of distributions paid was as follows:
March 31, 2015 | | | |
| Ordinary Income | Long-term
Capital Gains | Total |
Fidelity Freedom K® Income Fund | $ 53,805,905 | $ 30,331,824 | $ 84,137,729 |
Fidelity Freedom K® 2005 Fund | 22,481,943 | 15,197,945 | 37,679,888 |
Fidelity Freedom K® 2010 Fund | 228,848,337 | 209,256,027 | 438,104,364 |
Fidelity Freedom K® 2015 Fund | 383,424,222 | 281,769,385 | 665,193,607 |
Fidelity Freedom K® 2020 Fund | 947,599,920 | 675,258,329 | 1,622,858,249 |
Fidelity Freedom K® 2025 Fund | 666,991,099 | 487,194,169 | 1,154,185,268 |
Fidelity Freedom K® 2030 Fund | 859,824,028 | 625,382,223 | 1,485,206,251 |
Fidelity Freedom K® 2035 Fund | 538,245,599 | 407,782,082 | 946,027,681 |
Fidelity Freedom K® 2040 Fund | 584,025,924 | 469,653,780 | 1,053,679,704 |
Fidelity Freedom K® 2045 Fund | 301,521,331 | 219,660,416 | 521,181,747 |
Fidelity Freedom K® 2050 Fund | 236,311,024 | 167,754,605 | 404,065,629 |
Fidelity Freedom K® 2055 Fund | 35,260,749 | 12,386,750 | 47,647,499 |
Fidelity Freedom K® 2060 Fund | 3,264 | 277 | 3,541 |
Annual Report
Notes to Financial Statements - continued
2. Significant Accounting Policies - continued
Income Tax Information and Distributions to Shareholders - continued
March 31, 2014 | | | |
| Ordinary Income | Long-term
Capital Gains | Total |
Fidelity Freedom K® Income Fund | $ 22,160,789 | $ 12,922,535 | $ 35,083,324 |
Fidelity Freedom K® 2005 Fund | 1,427,627 | 6,713,702 | 8,141,329 |
Fidelity Freedom K® 2010 Fund | 14,008,978 | 83,353,373 | 97,362,351 |
Fidelity Freedom K® 2015 Fund | 21,380,367 | 115,453,935 | 136,834,302 |
Fidelity Freedom K® 2020 Fund | 47,756,129 | 278,383,072 | 326,139,201 |
Fidelity Freedom K® 2025 Fund | 29,787,739 | 187,946,070 | 217,733,809 |
Fidelity Freedom K® 2030 Fund | 40,843,016 | 257,764,121 | 298,607,137 |
Fidelity Freedom K® 2035 Fund | 20,348,330 | 155,154,410 | 175,502,740 |
Fidelity Freedom K® 2040 Fund | 22,029,539 | 179,060,646 | 201,090,185 |
Fidelity Freedom K® 2045 Fund | 10,210,641 | 76,154,844 | 86,365,485 |
Fidelity Freedom K® 2050 Fund | 7,570,647 | 57,976,100 | 65,546,747 |
Fidelity Freedom K® 2055 Fund | 455,326 | 2,383,584 | 2,838,910 |
New Accounting Pronouncement. In June 2014, the Financial Accounting Standards Board issued Accounting Standard Update No. 2014-11, Repurchase-to-Maturity Transactions, Repurchase Financings, and Disclosures (the Update). The Update amends the accounting for certain repurchase agreements and expands disclosure requirements for reverse repurchase agreements, securities lending and other similar transactions. The disclosure requirements are effective for annual and interim reporting periods beginning after December 15, 2014. Management is currently evaluating the impact of the Update on the Funds' financial statements and related disclosures.
3. Purchases and Redemptions of Underlying Fund Shares.
Purchases and redemptions of the Underlying Fund shares and in-kind transactions, other than securities acquired in the merger, are noted in the table below.
| Purchases ($) | Redemptions ($) |
Fidelity Freedom K® Income Fund | 604,357,348 | 781,201,603 |
Fidelity Freedom K® 2005 Fund | 159,533,795 | 184,560,861 |
Fidelity Freedom K® 2010 Fund | 806,459,669 | 1,561,086,939 |
Fidelity Freedom K® 2015 Fund | 1,534,230,156 | 2,199,434,193 |
Fidelity Freedom K® 2020 Fund | 3,711,705,753 | 3,964,320,315 |
Fidelity Freedom K® 2025 Fund | 3,309,671,856 | 2,491,701,134 |
Fidelity Freedom K® 2030 Fund | 3,638,936,686 | 2,984,389,592 |
Fidelity Freedom K® 2035 Fund | 2,618,521,732 | 1,840,135,975 |
Fidelity Freedom K® 2040 Fund | 2,673,628,650 | 1,936,541,186 |
Fidelity Freedom K® 2045 Fund | 1,748,224,400 | 995,262,963 |
Fidelity Freedom K® 2050 Fund | 1,536,786,468 | 753,526,287 |
Fidelity Freedom K® 2055 Fund | 524,471,439 | 120,372,732 |
Fidelity Freedom K® 2060 Fund | 8,257,855 | 145,749 |
4. Fees and Other Transactions with Affiliates.
Management Fee. Strategic Advisers, Inc. (the investment adviser), an affiliate of FMR provides the Funds with investment management related services. The Funds do not pay any fees for these services.
Other Transactions. The investment adviser has entered into an administration agreement with FMR under which FMR provides management and administrative services (other than investment advisory services) necessary for the operation of each Fund. Pursuant to this agreement, FMR pays all expenses of each Fund, excluding transfer agent fees, compensation of the independent Trustees and certain other expenses such as interest expense. FMR also contracts with other Fidelity companies to perform the services necessary for the operation of each Fund. The Funds do not pay any fees for these services.
Transfer Agent Fees. Fidelity Investments Institutional Operations Company, Inc. (FIIOC), an affiliate of the investment adviser, is the Funds' transfer, dividend disbursing and shareholder servicing agent. FIIOC receives an asset-based fee of .05% based on each Fund's average net assets. FIIOC pays for typesetting, printing and mailing of shareholder reports, except proxy statements.
Other. During the period, the investment adviser reimbursed Fidelity Freedom K® 2015 Fund for certain losses in the amount of $3,457.
Annual Report
4. Fees and Other Transactions with Affiliates - continued
Reallocation of Underlying Fund Investments. During the period, the investment adviser reallocated investments of the Funds. This involved taxable redemptions of the Funds' interest in Fidelity Short-Term Bond Fund Class F, ("selected Underlying Fund") for investments and non-taxable exchanges of those investments for shares of Fidelity Series Short-Term Credit Fund Class F which is an affiliated investment company managed by FMR. Realized gains and losses on the redemptions of the selected Underlying Fund in connection with the reallocation are included in the accompanying Statements of Operations as "Realized gain (loss) on sale of underlying fund shares."
Details of these transactions with the related gain (loss) for the Funds are presented in the accompanying table:
| Value of Investments
reallocated | Realized Gain (Loss) on
redemptions of selected
Underlying Fund |
Freedom K® Income Fund | $ 214,526,230 | $ 4,512,417 |
Freedom K® 2005 Fund | 28,966,980 | 590,692 |
Freedom K® 2010 Fund | 153,884,946 | 3,136,311 |
Freedom K® 2015 Fund | 146,610,209 | 3,076,132 |
Freedom K® 2020 Fund | 261,432,672 | 3,930,255 |
Freedom K® 2025 Fund | 138,519,281 | 333,881 |
Freedom K® 2030 Fund | 85,023,348 | 148,030 |
Freedom K® 2035 Fund | 58,682,529 | 101,496 |
Freedom K® 2040 Fund | 64,648,061 | 111,487 |
Freedom K® 2045 Fund | 34,205,419 | 58,829 |
Freedom K® 2050 Fund | 27,543,627 | 47,124 |
Freedom K® 2055 Fund | 5,527,058 | 9,865 |
Freedom K® 2060 Fund | 34,333 | 58 |
5. Merger Information.
On July 25, 2014, the Fidelity Freedom K® Income Fund acquired all of the assets and assumed all of the liabilities of Fidelity Freedom K® 2000 Fund ("Target Fund") pursuant to an Agreement and Plan of Reorganization approved by the Board of Trustees ("The Board") on May 14, 2014. The acquisition was accomplished by an exchange of shares of the Fidelity Freedom K® Income Fund for corresponding shares then outstanding of the Target Fund at its net asset value on the acquisition date. The reorganization provides shareholders of the Target Fund access to a larger portfolio with a similar investment objective. The reorganization qualified as a tax-free reorganization for federal income tax purposes with no gain or loss recognized to the fund or its shareholders. The Target Fund's net assets of $655,598,999, including securities of $654,936,024 and unrealized appreciation of $34,639,903, were combined with the Fidelity Freedom K® Income Fund's net assets of $1,523,134,246 for total net assets after the acquisition of $2,178,733,245.
Pro forma results of operations of the combined entity for the entire period ended March 31, 2015, as though the acquisition had occurred as of the beginning of the year (rather than on the actual acquisition dates), are as follows:
Net investment income (loss) | $ 38,720,036 |
Total net realized gain (loss) | 34,000,241 |
Total change in net unrealized appreciation (depreciation) | 18,092,569 |
Net increase (decrease) in net assets resulting from operations | $ 90,812,846 |
Because the combined investment portfolios have been managed as a single portfolio since the acquisitions were completed, it is not practicable to separate the amounts of revenue and earnings of the acquired fund that have been included in the Fidelity Freedom K® Income Fund's accompanying Statement of Operations since July 25, 2014.
6. Other.
The Funds' organizational documents provide former and current trustees and officers with a limited indemnification against liabilities arising in connection with the performance of their duties to the Funds. In the normal course of business, the Funds may also enter into contracts that provide general indemnifications. The Funds' maximum exposure under these arrangements is unknown as this would be dependent on future claims that may be made against the Funds. The risk of material loss from such claims is considered remote.
Annual Report
Notes to Financial Statements - continued
6. Other - continued
The Funds do not invest in the Underlying Funds for the purpose of exercising management or control; however, investments by the Funds within their principal investment strategies may represent a significant portion of the Underlying Fund's net assets. At the end of the period, the following Funds were the owners of record of 10% or more of the total outstanding shares of the Underlying Funds.
Fund | Fidelity Freedom K® 2020 Fund | Fidelity Freedom K® 2030 Fund |
Fidelity Series 1000 Value Index Fund | - | 10% |
Fidelity Series All-Sector Equity Fund | - | 10% |
Fidelity Series Blue Chip Growth Fund | - | 12% |
Fidelity Series Emerging Markets Fund | - | 10% |
Fidelity Series Equity-Income Fund | - | 11% |
Fidelity Series Growth & Income Fund | - | 11% |
Fidelity Series Growth Company Fund | - | 11% |
Fidelity Series Inflation-Protected Bond Index Fund | 13% | - |
Fidelity Series International Growth Fund | - | 10% |
Fidelity Series International Small Cap Fund | - | 10% |
Fidelity Series International Value Fund | - | 10% |
Fidelity Series Intrinsic Opportunities Fund | - | 11% |
Fidelity Series Investment Grade Bond Fund | 18% | - |
Fidelity Series Opportunistic Insights Fund | - | 12% |
Fidelity Series Real Estate Equity Fund | - | 10% |
Fidelity Series Short-Term Credit Fund | 11% | - |
Fidelity Series Small Cap Discovery Fund | - | 12% |
Fidelity Series Small Cap Opportunities Fund | - | 10% |
Fidelity Series Stock Selector Large Cap Value Fund | - | 11% |
The Funds, in aggregate, were the owners of record of more than 20% of the total outstanding shares of the following Underlying Funds.
Fund | % of shares held |
Fidelity Series 100 Index Fund | 50% |
Fidelity Series 1000 Value Index Fund | 53% |
Fidelity Series All-Sector Equity Fund | 52% |
Fidelity Series Blue Chip Growth Fund | 59% |
Fidelity Series Commodity Strategy Fund | 42% |
Fidelity Series Emerging Markets Debt Fund | 52% |
Fidelity Series Emerging Markets Fund | 54% |
Fidelity Series Equity-Income Fund | 59% |
Fidelity Series Floating Rate High Income Fund | 52% |
Fidelity Series Growth & Income Fund | 59% |
Fidelity Series Growth Company Fund | 59% |
Fidelity Series High Income Fund | 50% |
Fidelity Series Inflation-Protected Bond Index Fund | 39% |
Fidelity Series International Growth Fund | 53% |
Fidelity Series International Small Cap Fund | 53% |
Fidelity Series International Value Fund | 53% |
Fidelity Series Intrinsic Opportunities Fund | 59% |
Fidelity Series Investment Grade Bond Fund | 49% |
Fidelity Series Opportunistic Insights Fund | 59% |
Fidelity Series Real Estate Equity Fund | 53% |
Fidelity Series Real Estate Income Fund | 52% |
Fidelity Series Short-Term Credit Fund | 53% |
Fidelity Series Small Cap Discovery Fund | 59% |
Fidelity Series Small Cap Opportunities Fund | 53% |
Fidelity Series Stock Selector Large Cap Value Fund | 59% |
Annual Report
To the Trustees of Fidelity Aberdeen Street Trust and the Shareholders of Fidelity Freedom K® Income Fund, Fidelity Freedom K® 2005 Fund, Fidelity Freedom K® 2010 Fund, Fidelity Freedom K® 2015 Fund, Fidelity Freedom K® 2020 Fund, Fidelity Freedom K® 2025 Fund, Fidelity Freedom K® 2030 Fund, Fidelity Freedom K® 2035 Fund, Fidelity Freedom K® 2040 Fund, Fidelity Freedom K® 2045 Fund, Fidelity Freedom K® 2050 Fund, Fidelity Freedom K® 2055 Fund and Fidelity Freedom K® 2060 Fund:
In our opinion, the accompanying statements of assets and liabilities, including the schedules of investments, and the related statements of operations and of changes in net assets and the financial highlights present fairly, in all material respects, the financial position of Fidelity Freedom K® Income Fund, Fidelity Freedom K® 2005 Fund, Fidelity Freedom K® 2010 Fund, Fidelity Freedom K® 2015 Fund, Fidelity Freedom K® 2020 Fund, Fidelity Freedom K® 2025 Fund, Fidelity Freedom K® 2030 Fund, Fidelity Freedom K® 2035 Fund, Fidelity Freedom K® 2040 Fund, Fidelity Freedom K® 2045 Fund, Fidelity Freedom K® 2050 Fund, Fidelity Freedom K® 2055 Fund and Fidelity Freedom K® 2060 Fund (funds of Fidelity Aberdeen Street Trust) at March 31, 2015 and the results of each of their operations, the changes in each of their net assets, and the financial highlights for each of the periods indicated, in conformity with accounting principles generally accepted in the United States of America. These financial statements and financial highlights (hereafter referred to as "financial statements") are the responsibility of the Fidelity Aberdeen Street Trust's management. Our responsibility is to express an opinion on these financial statements based on our audits. We conducted our audits of these financial statements in accordance with the standards of the Public Company Accounting Oversight Board (United States). Those standards require that we plan and perform the audit to obtain reasonable assurance about whether the financial statements are free of material misstatement. An audit includes examining, on a test basis, evidence supporting the amounts and disclosures in the financial statements, assessing the accounting principles used and significant estimates made by management, and evaluating the overall financial statement presentation. We believe that our audits, which included confirmation of securities at March 31, 2015 by correspondence with the custodian and brokers, provide a reasonable basis for our opinion.
PricewaterhouseCoopers LLP
Boston, Massachusetts
May 21, 2015
Annual Report
The Trustees, Member of the Advisory Board, and officers of the trust and funds, as applicable, are listed below. The Board of Trustees governs each Fidelity Freedom K® Fund and is responsible for protecting the interests of shareholders. The Trustees are experienced executives who meet periodically throughout the year to oversee each Fidelity Freedom K® Fund's activities, review contractual arrangements with companies that provide services to each Fidelity Freedom K® Fund, oversee management of the risks associated with such activities and contractual arrangements, and review each Fidelity Freedom K® Fund's performance. If the interests of a Fidelity Freedom K® Fund and an underlying Fidelity fund were to diverge, a conflict of interest could arise and affect how the Trustees and Member of the Advisory Board fulfill their fiduciary duties to the affected funds. Strategic Advisers has structured the Fidelity Freedom K® Funds to avoid these potential conflicts, although there may be situations where a conflict of interest is unavoidable. In such instances, Strategic Advisers, the Trustees, and Member of the Advisory Board would take reasonable steps to minimize and, if possible, eliminate the conflict. Except for Elizabeth S. Acton and John Engler, each of the Trustees oversees 235 funds. Ms. Acton and Mr. Engler each oversees 217 funds.
The Trustees hold office without limit in time except that (a) any Trustee may resign; (b) any Trustee may be removed by written instrument, signed by at least two-thirds of the number of Trustees prior to such removal; (c) any Trustee who requests to be retired or who has become incapacitated by illness or injury may be retired by written instrument signed by a majority of the other Trustees; and (d) any Trustee may be removed at any special meeting of shareholders by a two-thirds vote of the outstanding voting securities of the trust. Each Trustee who is not an interested person (as defined in the 1940 Act) of the trust and the funds (Independent Trustee), shall retire not later than the last day of the month in which his or her 75th birthday occurs. The Independent Trustees may waive this mandatory retirement age policy with respect to individual Trustees. The officers and Advisory Board Member hold office without limit in time, except that any officer and Advisory Board Member may resign or may be removed by a vote of a majority of the Trustees at any regular meeting or any special meeting of the Trustees. Except as indicated, each individual has held the office shown or other offices in the same company for the past five years.
Experience, Skills, Attributes, and Qualifications of the Funds' Trustees. The Governance and Nominating Committee has adopted a statement of policy that describes the experience, qualifications, attributes, and skills that are necessary and desirable for potential Independent Trustee candidates (Statement of Policy). The Board believes that each Trustee satisfied at the time he or she was initially elected or appointed a Trustee, and continues to satisfy, the standards contemplated by the Statement of Policy. The Governance and Nominating Committee also engages professional search firms to help identify potential Independent Trustee candidates who have the experience, qualifications, attributes, and skills consistent with the Statement of Policy. From time to time, additional criteria based on the composition and skills of the current Independent Trustees, as well as experience or skills that may be appropriate in light of future changes to board composition, business conditions, and regulatory or other developments, have also been considered by the professional search firms and the Governance and Nominating Committee. In addition, the Board takes into account the Trustees' commitment and participation in Board and committee meetings, as well as their leadership of standing and ad hoc committees throughout their tenure.
In determining that a particular Trustee was and continues to be qualified to serve as a Trustee, the Board has considered a variety of criteria, none of which, in isolation, was controlling. The Board believes that, collectively, the Trustees have balanced and diverse experience, qualifications, attributes, and skills, which allow the Board to operate effectively in governing each fund and protecting the interests of shareholders. Information about the specific experience, skills, attributes, and qualifications of each Trustee, which in each case led to the Board's conclusion that the Trustee should serve (or continue to serve) as a trustee of the funds, is provided below.
Board Structure and Oversight Function. Abigail P. Johnson is an interested person (as defined in the 1940 Act) and currently serves as Chairman. The Trustees have determined that an interested Chairman is appropriate and benefits shareholders because an interested Chairman has a personal and professional stake in the quality and continuity of services provided to the funds. Independent Trustees exercise their informed business judgment to appoint an individual of their choosing to serve as Chairman, regardless of whether the Trustee happens to be independent or a member of management. The Independent Trustees have determined that they can act independently and effectively without having an Independent Trustee serve as Chairman and that a key structural component for assuring that they are in a position to do so is for the Independent Trustees to constitute a substantial majority for the Board. The Independent Trustees also regularly meet in executive session. Albert R. Gamper, Jr. serves as Chairman of the Independent Trustees and as such (i) acts as a liaison between the Independent Trustees and management with respect to matters important to the Independent Trustees and (ii) with management prepares agendas for Board meetings.
Fidelity funds are overseen by different Boards of Trustees. The funds' Board oversees Fidelity's investment-grade bond, money market, and asset allocation funds and other Boards oversee Fidelity's equity and high income funds. The asset allocation funds may invest in Fidelity funds that are overseen by such other Boards. The use of separate Boards, each with its own committee structure, allows the Trustees of each group of Fidelity funds to focus on the unique issues of the funds they oversee, including common research, investment, and operational issues. On occasion, the separate Boards establish joint committees to address issues of overlapping consequences for the Fidelity funds overseen by each Board.
The Trustees operate using a system of committees to facilitate the timely and efficient consideration of all matters of importance to the Trustees, each fund, and fund shareholders and to facilitate compliance with legal and regulatory requirements and oversight of the funds' activities and associated risks. The Board, acting through its committees, has charged FMR and its affiliates with (i) identifying events or circumstances the occurrence of which could have demonstrably adverse effects on the funds' business and/or reputation; (ii) implementing processes and controls to lessen the possibility that such events or circumstances occur or to mitigate the effects of such events or circumstances if they do occur; and (iii) creating and maintaining a system designed to evaluate continuously business and market conditions in order to facilitate the identification and implementation processes described in (i) and (ii) above. Because the day-to-day operations and activities of the funds are carried out by or through FMR, its affiliates, and other service providers, the funds' exposure to risks is mitigated but not eliminated by the processes overseen by the Trustees. While each of the Board's committees has responsibility for overseeing different aspects of the funds' activities, oversight is exercised primarily through the Operations and Audit Committees. In addition, an ad hoc Board committee of Independent Trustees has worked with FMR to enhance the Board's oversight of investment and financial risks, legal and regulatory risks, technology risks, and operational risks, including the development of additional risk reporting to the Board. Appropriate personnel, including but not limited to the funds' Chief Compliance Officer (CCO), FMR's internal auditor, the independent accountants, the funds' Treasurer and portfolio management personnel, make periodic reports to the Board's committees, as appropriate, including an annual review of FMR's risk management program for the Fidelity funds. The responsibilities of each standing committee, including their oversight responsibilities, are described further under "Standing Committees of the Funds' Trustees."
Annual Report
The funds' Statement of Additional Information (SAI) includes more information about the Trustees. To request a free copy, call Fidelity at 1-800-835-5092.
Interested Trustee*:
Correspondence intended for the Trustee who is an interested person may be sent to Fidelity Investments, 245 Summer Street, Boston, Massachusetts 02210.
Name, Year of Birth; Principal Occupations and Other Relevant Experience+ |
Abigail P. Johnson (1961) |
Year of Election or Appointment: 2009 Trustee Chairman of the Board of Trustees |
| Ms. Johnson also serves as Trustee of other Fidelity funds. Ms. Johnson serves as President (2013-present) and Chief Executive Officer (2014-present) of FMR LLC (diversified financial services company), President of Fidelity Financial Services (2012-present) and President of Personal, Workplace and Institutional Services (2005-present). Ms. Johnson is Chairman and Director of FMR Co., Inc. (investment adviser firm, 2011-present), Chairman and Director of FMR (investment adviser firm, 2011-present), and the Vice Chairman and Director (2007-present) of FMR LLC. Previously, Ms. Johnson served as President and a Director of FMR (2001-2005), a Trustee of other investment companies advised by FMR, Fidelity Investments Money Management, Inc. (investment adviser firm), and FMR Co., Inc. (2001-2005), Senior Vice President of the Fidelity funds (2001-2005), and managed a number of Fidelity funds. Ms. Abigail P. Johnson and Mr. Arthur E. Johnson are not related. |
* Trustee has been determined to be an "Interested Trustee" by virtue of, among other things, her affiliation with the trust or various entities under common control with FMR.
+ The information above includes the Trustee's principal occupation during the last five years and other information relating to the experience, attributes, and skills relevant to the Trustee's qualifications to serve as a Trustee, which led to the conclusion that the Trustee should serve as a Trustee for each fund.
Independent Trustees:
Correspondence intended for each Independent Trustee (that is, the Trustees other than the Interested Trustee) may be sent to Fidelity Investments, P.O. Box 55235, Boston, Massachusetts 02205-5235.
Name, Year of Birth; Principal Occupations and Other Relevant Experience+ |
Elizabeth S. Acton (1951) |
Year of Election or Appointment: 2013 Trustee |
| Ms. Acton also serves as Trustee or Member of the Advisory Board of other Fidelity funds. Prior to her retirement in April 2012, Ms. Acton was Executive Vice President, Finance (2011-2012), Executive Vice President, Chief Financial Officer (2002-2011), and Treasurer (2004-2005) of Comerica Incorporated (financial services). Prior to joining Comerica, Ms. Acton held a variety of positions at Ford Motor Company (1983-2002), including Vice President and Treasurer (2000-2002) and Executive Vice President and Chief Financial Officer of Ford Motor Credit Company (1998-2000). Ms. Acton currently serves as a member of the Board of Directors and Audit and Finance Committees of Beazer Homes USA, Inc. (homebuilding, 2012-present). |
John Engler (1948) |
Year of Election or Appointment: 2014 Trustee |
| Mr. Engler also serves as Trustee or Member of the Advisory Board of other Fidelity funds. He serves as president of the Business Roundtable (2011-present), and on the board of directors/trustees for Universal Forest Products (manufacturer and distributor of wood and wood-alternative products, 2003-present), K12 Inc. (technology-based education company, 2012-present), and the Annie E. Casey Foundation (2004-present). Previously, Mr. Engler served as a trustee of The Munder Funds (2003-2014), president and CEO of the National Association of Manufacturers (2004-2011) and as governor of Michigan (1991-2003). He is a past chairman of the National Governors Association. |
Albert R. Gamper, Jr. (1942) |
Year of Election or Appointment: 2006 Trustee Chairman of the Independent Trustees |
| Mr. Gamper also serves as Trustee of other Fidelity funds. Prior to his retirement in December 2004, Mr. Gamper served as Chairman of the Board of CIT Group Inc. (commercial finance). During his tenure with CIT Group Inc. Mr. Gamper served in numerous senior management positions, including Chairman (1987-1989; 1999-2001; 2002-2004), Chief Executive Officer (1987-2004), and President (2002-2003). Mr. Gamper currently serves as a member of the Board of Directors of Public Service Enterprise Group (utilities, 2000-present), and Member of the Board of Trustees of Barnabas Health Care System (1997-present). Previously, Mr. Gamper served as Vice Chairman of the Independent Trustees of certain Fidelity funds (2011-2012) and as Chairman of the Board of Governors, Rutgers University (2004-2007). |
Robert F. Gartland (1951) |
Year of Election or Appointment: 2010 Trustee |
| Mr. Gartland also serves as Trustee of other Fidelity funds. Mr. Gartland is Chairman and an investor in Gartland and Mellina Group Corp. (consulting, 2009-present). Previously, Mr. Gartland served as a partner and investor of Vietnam Partners LLC (investments and consulting, 2008-2011). Prior to his retirement, Mr. Gartland held a variety of positions at Morgan Stanley (financial services, 1979-2007) including Managing Director (1987-2007). |
Arthur E. Johnson (1947) |
Year of Election or Appointment: 2008 Trustee |
| Mr. Johnson also serves as Trustee of other Fidelity funds. Mr. Johnson serves as a member of the Board of Directors of Eaton Corporation plc (diversified power management, 2009-present), AGL Resources, Inc. (holding company, 2002-present) and Booz Allen Hamilton (management consulting, 2011-present). Prior to his retirement, Mr. Johnson served as Senior Vice President of Corporate Strategic Development of Lockheed Martin Corporation (defense contractor, 1999-2009). He previously served on the Board of Directors of IKON Office Solutions, Inc. (1999-2008) and Delta Airlines (2005-2007). Mr. Arthur E. Johnson is not related to Ms. Abigail P. Johnson. |
Michael E. Kenneally (1954) |
Year of Election or Appointment: 2009 Trustee |
| Mr. Kenneally also serves as Trustee of other Fidelity funds. Mr. Kenneally served as a Member of the Advisory Board for certain Fidelity funds before joining the Board of Trustees (2008-2009). Prior to his retirement, Mr. Kenneally served as Chairman and Global Chief Executive Officer of Credit Suisse Asset Management. Before joining Credit Suisse, he was an Executive Vice President and Chief Investment Officer for Bank of America Corporation. Earlier roles at Bank of America included Director of Research, Senior Portfolio Manager and Research Analyst, and Mr. Kenneally was awarded the Chartered Financial Analyst (CFA) designation in 1991. |
James H. Keyes (1940) |
Year of Election or Appointment: 2007 Trustee |
| Mr. Keyes also serves as Trustee of other Fidelity funds. Mr. Keyes serves as a member of the Board and Non-Executive Chairman of Navistar International Corporation (manufacture and sale of trucks, buses, and diesel engines, since 2002). Previously, Mr. Keyes served as a member of the Board of Pitney Bowes, Inc. (integrated mail, messaging, and document management solutions, 1998-2013). Prior to his retirement, Mr. Keyes served as Chairman (1993-2002) and Chief Executive Officer (1988-2002) of Johnson Controls (automotive, building, and energy) and as a member of the Board of LSI Logic Corporation (semiconductor technologies, 1984-2008). |
Marie L. Knowles (1946) |
Year of Election or Appointment: 2001 Trustee Vice Chairman of the Independent Trustees |
| Ms. Knowles also serves as Trustee of other Fidelity funds. Prior to Ms. Knowles' retirement in June 2000, she served as Executive Vice President and Chief Financial Officer of Atlantic Richfield Company (ARCO) (diversified energy, 1996-2000). From 1993 to 1996, she was a Senior Vice President of ARCO and President of ARCO Transportation Company. She served as a Director of ARCO from 1996 to 1998. Ms. Knowles currently serves as a Director and Chairman of the Audit Committee of McKesson Corporation (healthcare service, since 2002). Ms. Knowles is a member of the Board of the Catalina Island Conservancy and of the Santa Catalina Island Company (2009-present). She also serves as a member of the Advisory Board for the School of Engineering of the University of Southern California. Previously, Ms. Knowles served as a Director of Phelps Dodge Corporation (copper mining and manufacturing, 1994-2007), URS Corporation (engineering and construction, 2000-2003) and America West (airline, 1999-2002). |
+ The information above includes each Trustee's principal occupation during the last five years and other information relating to the experience, attributes, and skills relevant to each Trustee's qualifications to serve as a Trustee, which led to the conclusion that each Trustee should serve as a Trustee for each fund.
Advisory Board Member and Officers:
Correspondence intended for each officer and Geoffrey A. von Kuhn may be sent to Fidelity Investments, 245 Summer Street, Boston, Massachusetts 02210. Officers appear below in alphabetical order.
Name, Year of Birth; Principal Occupation |
Geoffrey A. von Kuhn (1951) |
Year of Election or Appointment: 2015 Member of the Advisory Board |
| Mr. von Kuhn also serves as a Trustee or Member of the Advisory Board of other Fidelity funds. Mr. von Kuhn is Chief Administrative Officer for FMR LLC (diversified financial services company, 2013-present), a Director of Pembroke Real Estate, Inc. (2009-present), and a Director of Discovery Natural Resources LLC (2012-present). Previously, Mr. von Kuhn was a managing director of Crosby Group (private wealth management company, 2007-2013), a member of the management committee and senior executive in the Wealth Management Group of AmSouth Bank (2001-2006), and head of the U.S. private bank at Citigroup (2000-2001). |
Elizabeth Paige Baumann (1968) |
Year of Election or Appointment: 2012 Anti-Money Laundering (AML) Officer |
| Ms. Baumann also serves as AML Officer of other funds. She is Chief AML Officer of FMR LLC (diversified financial services company, 2012-present) and is an employee of Fidelity Investments. Previously, Ms. Baumann served as Vice President and Deputy Anti-Money Laundering Officer (2007-2012). |
Marc Bryant (1966) |
Year of Election or Appointment: 2013 Assistant Secretary |
| Mr. Bryant also serves as an officer of other funds. He is Senior Vice President and Deputy General Counsel of FMR LLC (diversified financial services company). Previously, Mr. Bryant served as Secretary and Chief Legal Officer of Fidelity Rutland Square Trust II (2010-2014). Prior to joining Fidelity Investments, Mr. Bryant served as a Senior Vice President and the Head of Global Retail Legal for AllianceBernstein L.P. (2006-2010), and as the General Counsel for ProFund Advisors LLC (2001-2006). |
Jonathan Davis (1968) |
Year of Election or Appointment: 2010 Assistant Treasurer |
| Mr. Davis also serves as Assistant Treasurer of other funds. Mr. Davis is an employee of Fidelity Investments. Previously, Mr. Davis served as Vice President and Associate General Counsel of FMR LLC (diversified financial services company, 2003-2010). |
Adrien E. Deberghes (1967) |
Year of Election or Appointment: 2010 Assistant Treasurer |
| Mr. Deberghes also serves as an officer of other funds. He is an employee of Fidelity Investments (2008-present). Prior to joining Fidelity Investments, Mr. Deberghes was Senior Vice President of Mutual Fund Administration at State Street Corporation (2007-2008), Senior Director of Mutual Fund Administration at Investors Bank & Trust (2005-2007), and Director of Finance for Dunkin' Brands (2000-2005). |
Stephanie J. Dorsey (1969) |
Year of Election or Appointment: 2013 President and Treasurer |
| Ms. Dorsey also serves as an officer of other funds. She is an employee of Fidelity Investments (2008-present) and has served in other fund officer roles. Prior to joining Fidelity Investments, Ms. Dorsey served as Treasurer (2004-2008) of the JPMorgan Mutual Funds and Vice President (2004-2008) of JPMorgan Chase Bank. |
Howard J. Galligan III (1966) |
Year of Election or Appointment: 2014 Chief Financial Officer |
| Mr. Galligan also serves as Chief Financial Officer of other funds. Mr. Galligan serves as President of Fidelity Pricing and Cash Management Services (FPCMS) (2014-present) and as a Director of Strategic Advisers, Inc. (investment adviser firm, 2008-present). Previously, Mr. Galligan served as Chief Administrative Officer of Asset Management (2011-2014) and Chief Operating Officer and Senior Vice President of Investment Support for Strategic Advisers, Inc. (2003-2011). |
Scott C. Goebel (1968) |
Year of Election or Appointment: 2008 Secretary and Chief Legal Officer (CLO) |
| Mr. Goebel serves as Secretary and CLO of other funds. Mr. Goebel also serves as Secretary of Fidelity SelectCo, LLC (investment adviser firm, 2013-present), Fidelity Investments Money Management, Inc. (FIMM) (investment adviser firm, 2010-present) and Fidelity Research and Analysis Company (FRAC) (investment adviser firm, 2010-present); General Counsel, Secretary, and Senior Vice President of FMR (investment adviser firm, 2008-present) and FMR Co., Inc. (investment adviser firm, 2008-present); Chief Legal Officer of Fidelity Management & Research (Hong Kong) Limited (investment adviser firm, 2008-present); and Assistant Secretary of Fidelity Management & Research (Japan) Limited (investment adviser firm, 2008-present) and FMR Investment Management (U.K.) Limited (investment adviser firm, 2008-present). Previously, Mr. Goebel served as Secretary and CLO of other Fidelity funds (2008-2013), Assistant Secretary of FIMM (2008-2010), FRAC (2008-2010), and certain funds (2007-2008); and as Vice President and Secretary of Fidelity Distributors Corporation (FDC) (2005-2007). Mr. Goebel has been employed by FMR LLC (diversified financial services company) or an affiliate since 2001. |
Bruce T. Herring (1965) |
Year of Election or Appointment: 2013 Vice President of Fidelity's Asset Allocation Funds |
| Mr. Herring also serves as Vice President of other funds. He serves as Chief Investment Officer of Fidelity Global Asset Allocation (GAA) (2013-present), Group Chief Investment Officer of FMR (investment adviser firm), and President of Fidelity Research & Analysis Company (investment adviser firm, 2010-present). Previously, Mr. Herring served as Vice President of certain Equity Funds (2006-2014), Chief Investment Officer and Director of Fidelity Management & Research (U.K.) Inc. (investment adviser firm, 2010-2013), Vice President (2005-2006) and Senior Vice President (2006-2007) of Fidelity Management & Research Company (investment adviser firm), Vice President of FMR Co., Inc. (investment adviser firm, 2001-2007), and as a portfolio manager for Fidelity U.S. Equity Funds. |
Chris Maher (1972) |
Year of Election or Appointment: 2013 Assistant Treasurer |
| Mr. Maher serves as Assistant Treasurer of other funds. Mr. Maher is Vice President of Valuation Oversight and is an employee of Fidelity Investments. Previously, Mr. Maher served as Vice President of Asset Management Compliance (2013), Vice President of the Program Management Group of FMR (investment adviser firm, 2010-2013), and Vice President of Valuation Oversight (2008-2010). |
Nancy D. Prior (1967) |
Year of Election or Appointment: 2014 Vice President |
| Ms. Prior also serves as Vice President of other funds. Ms. Prior serves as a Director of Fidelity Investments Money Management, Inc. (FIMM) (investment adviser firm, 2014-present), President, Fixed Income (2014-present), Vice Chairman of Pyramis Global Advisors, LLC (investment adviser firm, 2014-present), and is an employee of Fidelity Investments (2002-present). Previously, Ms. Prior served as Vice President of Fidelity's Money Market Funds (2012-2014), President, Money Market and Short Duration Bond of FMR (investment adviser firm, 2013-2014), President, Money Market Group of FMR (2011-2014), Managing Director of Research (2009-2011), Senior Vice President and Deputy General Counsel (2007-2009), and Assistant Secretary of other Fidelity funds (2008-2009). |
Kenneth B. Robins (1969) |
Year of Election or Appointment: 2009 Assistant Treasurer |
| Mr. Robins also serves as an officer of other funds. Mr. Robins serves as Executive Vice President of Fidelity Investments Money Management, Inc. (FIMM) (investment adviser firm, 2013-present) and is an employee of Fidelity Investments (2004-present). Previously, Mr. Robins served in other fund officer roles. |
Stephen Sadoski (1971) |
Year of Election or Appointment: 2013 Deputy Treasurer |
| Mr. Sadoski also serves as Deputy Treasurer of other funds. He is an employee of Fidelity Investments (2012-present) and has served in another fund officer role. Prior to joining Fidelity Investments, Mr. Sadoski served as an assistant chief accountant in the Division of Investment Management of the Securities and Exchange Commission (SEC) (2009-2012) and as a senior manager at Deloitte & Touche LLP (1997-2009). |
Stacie M. Smith (1974) |
Year of Election or Appointment: 2013 Assistant Treasurer |
| Ms. Smith also serves as an officer of other funds. She is an employee of Fidelity Investments (2009-present) and has served in other fund officer roles. Prior to joining Fidelity Investments, Ms. Smith served as Senior Audit Manager of Ernst & Young LLP (1996-2009). |
Renee Stagnone (1975) |
Year of Election or Appointment: 2013 Deputy Treasurer |
| Ms. Stagnone also serves as Deputy Treasurer of other funds. Ms. Stagnone is an employee of Fidelity Investments. |
Michael H. Whitaker (1967) |
Year of Election or Appointment: 2008 Chief Compliance Officer |
| Mr. Whitaker also serves as Chief Compliance Officer of other funds. Mr. Whitaker also serves as Compliance Officer of FMR Co., Inc. (investment adviser firm, 2014-present), FMR (investment adviser firm, 2014-present), Fidelity Investments Money Management, Inc. (investment adviser firm, 2014-present), and is an employee of Fidelity Investments (2007-present). Prior to joining Fidelity Investments, Mr. Whitaker worked at MFS Investment Management where he served as Senior Vice President and Chief Compliance Officer (2004-2006), and Assistant General Counsel. |
Derek L. Young (1964) |
Year of Election or Appointment: 2009 Vice President of Fidelity's Asset Allocation Funds |
| Mr. Young also serves as Trustee or an officer of other funds. He is President and a Director of Strategic Advisers, Inc. (investment adviser firm, 2011-present), President of Fidelity Global Asset Allocation (GAA) (2011-present), and Vice Chairman of Pyramis Global Advisors, LLC (investment adviser firm, 2011-present). Previously, Mr. Young served as Chief Investment Officer of GAA (2009-2011) and as a portfolio manager. |
Joseph F. Zambello (1957) |
Year of Election or Appointment: 2011 Deputy Treasurer |
| Mr. Zambello also serves as Deputy Treasurer of other funds. Mr. Zambello is an employee of Fidelity Investments. Previously, Mr. Zambello served as Vice President of the Program Management Group of FMR (investment adviser firm, 2009-2011) and Vice President of the Transfer Agent Oversight Group (2005-2009). |
Annual Report
The Board of Trustees of each fund voted to pay to shareholders of record at the opening of business on record date, the following distributions per share derived from capital gains realized from sales of portfolio securities and dividends derived from net investment income:
| Pay Date | Record Date | Dividends | Capital Gains |
Fidelity Freedom K® Income Fund | 05/11/15 | 05/08/15 | $0.000 | $0.126 |
Fidelity Freedom K® 2005 Fund | 05/18/15 | 05/15/15 | $0.041 | $0.194 |
Fidelity Freedom K® 2010 Fund | 05/18/15 | 05/15/15 | $0.033 | $0.309 |
Fidelity Freedom K® 2015 Fund | 05/18/15 | 05/15/15 | $0.032 | $0.266 |
Fidelity Freedom K® 2020 Fund | 05/18/15 | 05/15/15 | $0.020 | $0.260 |
Fidelity Freedom K® 2025 Fund | 05/18/15 | 05/15/15 | $0.029 | $0.281 |
Fidelity Freedom K® 2030 Fund | 05/18/15 | 05/15/15 | $0.020 | $0.337 |
Fidelity Freedom K® 2035 Fund | 05/18/15 | 05/15/15 | $0.014 | $0.357 |
Fidelity Freedom K® 2040 Fund | 05/18/15 | 05/15/15 | $0.014 | $0.362 |
Fidelity Freedom K® 2045 Fund | 05/18/15 | 05/15/15 | $0.014 | $0.355 |
Fidelity Freedom K® 2050 Fund | 05/18/15 | 05/15/15 | $0.013 | $0.350 |
Fidelity Freedom K® 2055 Fund | 05/18/15 | 05/15/15 | $0.009 | $0.219 |
Fidelity Freedom K® 2060 Fund | 05/18/15 | 05/15/15 | $0.002 | $0.018 |
The funds hereby designate as capital gain dividend the amounts noted below for the taxable year ended March 31, 2015, or, if subsequently determined to be different, the net capital gain of such year.
Fidelity Freedom K® Income Fund | $25,643,225 |
Fidelity Freedom K® 2005 Fund | $7,822,722 |
Fidelity Freedom K® 2010 Fund | $111,421,124 |
Fidelity Freedom K® 2015 Fund | $147,181,585 |
Fidelity Freedom K® 2020 Fund | $344,423,056 |
Fidelity Freedom K® 2025 Fund | $261,365,206 |
Fidelity Freedom K® 2030 Fund | $381,686,783 |
Fidelity Freedom K® 2035 Fund | $246,553,629 |
Fidelity Freedom K® 2040 Fund | $268,197,567 |
Fidelity Freedom K® 2045 Fund | $140,721,502 |
Fidelity Freedom K® 2050 Fund | $111,160,441 |
Fidelity Freedom K® 2055 Fund | $19,726,805 |
Fidelity Freedom K® 2060 Fund | $23,213 |
A percentage of the dividends distributed during the fiscal year for the following funds was derived from interest on U.S. Government securities which is generally exempt from state income tax:
Fidelity Freedom K® Income Fund | 7.61% |
Fidelity Freedom K® 2005 Fund | 5.40% |
Fidelity Freedom K® 2010 Fund | 4.25% |
Fidelity Freedom K® 2015 Fund | 3.25% |
Fidelity Freedom K® 2020 Fund | 2.46% |
Fidelity Freedom K® 2025 Fund | 1.47% |
Fidelity Freedom K® 2030 Fund | 0.47% |
Fidelity Freedom K® 2035 Fund | 0.07% |
Fidelity Freedom K® 2040 Fund | 0.08% |
Fidelity Freedom K® 2045 Fund | 0.08% |
Fidelity Freedom K® 2050 Fund | 0.09% |
Fidelity Freedom K® 2055 Fund | 0.09% |
Fidelity Freedom K® 2060 Fund | 0.05% |
Annual Report
Distributions (Unaudited) - continued
A percentage of the dividends distributed during the fiscal year for the following funds qualifies for the dividends-received deduction for corporate shareholders:
Fidelity Freedom K® Income Fund | |
May 2014 June 2014 July 2014 August 2014 September 2014 October 2014 November 2014 December 2014 February 2015 March 2015 | 2% 15% 15% 15% 15% 15% 15% 15% 3% 3% |
| |
Fidelity Freedom K® 2005 Fund | |
May 2014 December 2014 | 10% 19% |
Fidelity Freedom K® 2010 Fund | |
May 2014 December 2014 | 11% 20% |
Fidelity Freedom K® 2015 Fund | |
May 2014 December 2014 | 13% 23% |
Fidelity Freedom K® 2020 Fund | |
May 2014 December 2014 | 14% 24% |
Fidelity Freedom K® 2025 Fund | |
May 2014 December 2014 | 15% 29% |
Fidelity Freedom K® 2030 Fund | |
May 2014 December 2014 | 17% 33% |
Fidelity Freedom K® 2035 Fund | |
May 2014 December 2014 | 18% 35% |
Fidelity Freedom K® 2040 Fund | |
May 2014 December 2014 | 18% 35% |
Fidelity Freedom K® 2045 Fund | |
May 2014 December 2014 | 17% 35% |
Fidelity Freedom K® 2050 Fund | |
May 2014 December 2014 | 17% 36% |
Fidelity Freedom K® 2055 Fund | |
May 2014 December 2014 | 23% 36% |
Fidelity Freedom K® 2060 Fund | |
December 2014 | 41% |
Annual Report
A percentage of the dividends distributed during the fiscal year for the following funds may be taken into account as a dividend for purposes of the maximum rate under section 1(h)(11) of the Internal Revenue Code.
Fidelity Freedom K® Income Fund | |
May 2014 June 2014 July 2014 August 2014 September 2014 October 2014 November 2014 December 2014 February 2015 March 2015 | 3% 25% 25% 25% 25% 25% 25% 25% 3% 3% |
| |
Fidelity Freedom K® 2005 Fund | |
May 2014 December 2014 | 17% 31% |
Fidelity Freedom K® 2010 Fund | |
May 2014 December 2014 | 19% 35% |
Fidelity Freedom K® 2015 Fund | |
May 2014 December 2014 | 21% 39% |
Fidelity Freedom K® 2020 Fund | |
May 2014 December 2014 | 23% 42% |
Fidelity Freedom K® 2025 Fund | |
May 2014 December 2014 | 25% 50% |
Fidelity Freedom K® 2030 Fund | |
May 2014 December 2014 | 28% 58% |
Fidelity Freedom K® 2035 Fund | |
May 2014 December 2014 | 29% 61% |
Fidelity Freedom K® 2040 Fund | |
May 2014 December 2014 | 1% 61% |
Fidelity Freedom K® 2045 Fund | |
May 2014 December 2014 | 28% 62% |
Fidelity Freedom K® 2050 Fund | |
May 2014 December 2014 | 28% 63% |
Fidelity Freedom K® 2055 Fund | |
May 2014 December 2014 | 26% 64% |
Fidelity Freedom K® 2060 Fund | |
December 2014 | 68% |
The funds will notify shareholders in January 2016 of amounts for use in preparing 2015 income tax returns.
Annual Report
Investment Adviser
Strategic Advisers, Inc.
Boston, MA
Administrator
Fidelity Management & Research Company
Boston, MA
General Distributor
Fidelity Distributors Corporation
Smithfield, RI
Transfer and Service Agents
Fidelity Investments Institutional
Operations Company, Inc.
Boston, MA
Fidelity Service Company, Inc.
Boston, MA
Custodians
JPMorgan Chase Bank
New York, NY
Income, 2005, 2010, 2015, 2020, 2025, 2030, 2035, 2040, 2045, 2050, 2060
The Bank of New York Mellon
New York, NY
2055
FF-K-UANNPRO-0515
1.927081.104
ContentsPerformance: The Bottom LinePerformance: The Bottom LinePerformance: The Bottom LinePerformance: The Bottom LinePerformance: The Bottom LinePerformance: The Bottom LinePerformance: The Bottom LinePerformance: The Bottom LinePerformance: The Bottom LinePerformance: The Bottom LinePerformance: The Bottom LinePerformance: The Bottom LinePerformance: The Bottom LineManagement's Discussion of Fund PerformanceShareholder Expense ExampleInvestment Changes (Unaudited)Investments March 31, 2015Financial StatementsInvestment Changes (Unaudited)Investments March 31, 2015Financial StatementsInvestment Changes (Unaudited)Investments March 31, 2015Financial StatementsInvestment Changes (Unaudited)Investments March 31, 2015Financial StatementsInvestment Changes (Unaudited)Investments March 31, 2015Financial StatementsInvestment Changes (Unaudited)Investments March 31, 2015Financial StatementsInvestment Changes (Unaudited)Investments March 31, 2015Financial StatementsInvestment Changes (Unaudited)Investments March 31, 2015Financial StatementsInvestment Changes (Unaudited)Investments March 31, 2015Financial StatementsInvestment Changes (Unaudited)Investments March 31, 2015Financial StatementsInvestment Changes (Unaudited)Investments March 31, 2015Financial StatementsInvestment Changes (Unaudited)Investments March 31, 2015Financial StatementsInvestment Changes (Unaudited)Investments March 31, 2015Financial StatementsNotes to Financial StatementsReport of Independent Registered Public Accounting FirmTrustees and OfficersDistributions (Unaudited)
Fidelity Freedom® Index Funds -
Income, 2005, 2010, 2015, 2020, 2025, 2030, 2035, 2040, 2045, 2050, 2055, 2060
(formerly Fidelity Freedom Index Funds - Class W)
Annual Report
March 31, 2015
(Fidelity Cover Art)
Contents
To view a fund's proxy voting guidelines and proxy voting record for the 12-month period ended June 30, visit http://www.fidelity.com/proxyvotingresults or visit the Securities and Exchange Commission's (SEC) web site at http://www.sec.gov. You may also call 1-800-835-5092 (plan accounts) or 1-800-544-8544 (all other accounts) to request a free copy of the proxy voting guidelines.
Standard & Poor's, S&P and S&P 500 are registered service marks of The McGraw-Hill Companies, Inc. and have been licensed for use by Fidelity Distributors Corporation.
Other third-party marks appearing herein are the property of their respective owners.
All other marks appearing herein are registered or unregistered trademarks or service marks of FMR LLC or an affiliated company. © 2015 FMR LLC. All rights reserved.
This report and the financial statements contained herein are submitted for the general information of the shareholders of the funds. This report is not authorized for distribution to prospective investors in the funds unless preceded or accompanied by an effective prospectus.
A fund files its complete schedule of portfolio holdings with the SEC for the first and third quarters of each fiscal year on Form N-Q. Forms N-Q are available on the SEC's web site at http://www.sec.gov. A fund's Forms N-Q may be reviewed and copied at the SEC's Public Reference Room in Washington, DC. Information regarding the operation of the SEC's Public Reference Room may be obtained by calling 1-800-SEC-0330. For a complete list of a fund's portfolio holdings, view the most recent holdings listing, semiannual report, or annual report on Fidelity's web site at http://www.fidelity.com, http://www.advisor.fidelity.com, or http://www.401k.com, as applicable.
NOT FDIC INSURED • MAY LOSE VALUE • NO BANK GUARANTEE
Neither the funds nor Fidelity Distributors Corporation is a bank.
Annual Report
Fidelity Freedom® Index Income Fund
Average annual total return reflects the change in the value of an investment, assuming reinvestment of the fund's distributions from dividend income and capital gains (the profits earned upon the sale of securities that have grown in value, if any) and assuming a constant rate of performance each year. The $10,000 table and the fund's returns do not reflect the deduction of taxes that a shareholder would pay on fund distributions or the redemption of fund shares. During periods of reimbursement by Fidelity, a fund's total return will be greater than it would be had the reimbursement not occurred. How a fund did yesterday is no guarantee of how it will do tomorrow.
Average Annual Total Returns
Periods ended March 31, 2015 | Past 1
year | Past 5
years | Life of
fund A |
Fidelity Freedom Index Income Fund | 3.83% | 3.99% | 4.30% |
A From October 2, 2009.
$10,000 Over Life of Fund
Let's say hypothetically that $10,000 was invested in Fidelity Freedom Index Income Fund on October 2, 2009, when the fund started. The chart shows how the value of your investment would have changed, and also shows how the Barclays® U.S. Aggregate Bond Index performed over the same period.
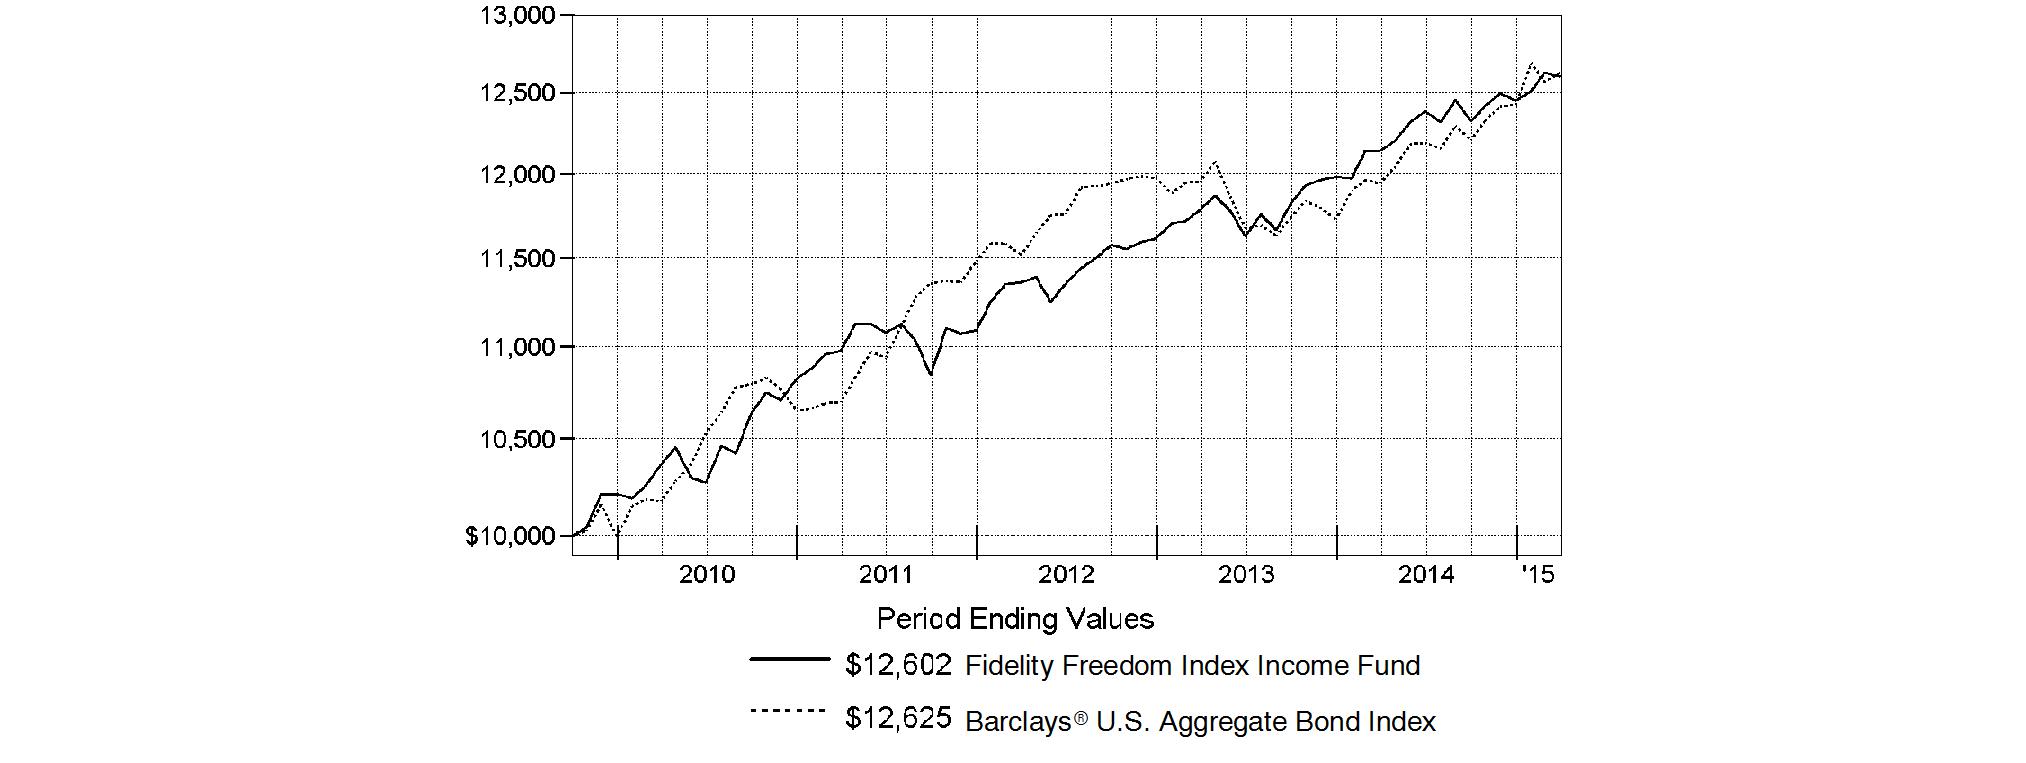
Annual Report
Fidelity Freedom Index 2005 Fund
Performance: The Bottom Line
Average annual total return reflects the change in the value of an investment, assuming reinvestment of the fund's distributions from dividend income and capital gains (the profits earned upon the sale of securities that have grown in value, if any) and assuming a constant rate of performance each year. The $10,000 table and the fund's returns do not reflect the deduction of taxes that a shareholder would pay on fund distributions or the redemption of fund shares. During periods of reimbursement by Fidelity, a fund's total return will be greater than it would be had the reimbursement not occurred. How a fund did yesterday is no guarantee of how it will do tomorrow.
Average Annual Total Returns
Periods ended March 31, 2015 | Past 1
year | Past 5
years | Life of
fund A |
Fidelity Freedom Index 2005 Fund | 4.87% | 5.60% | 6.34% |
A From October 2, 2009.
$10,000 Over Life of Fund
Let's say hypothetically that $10,000 was invested in Fidelity Freedom Index 2005 Fund on October 2, 2009, when the fund started. The chart shows how the value of your investment would have changed, and also shows how the Barclays U.S. Aggregate Bond Index performed over the same period.
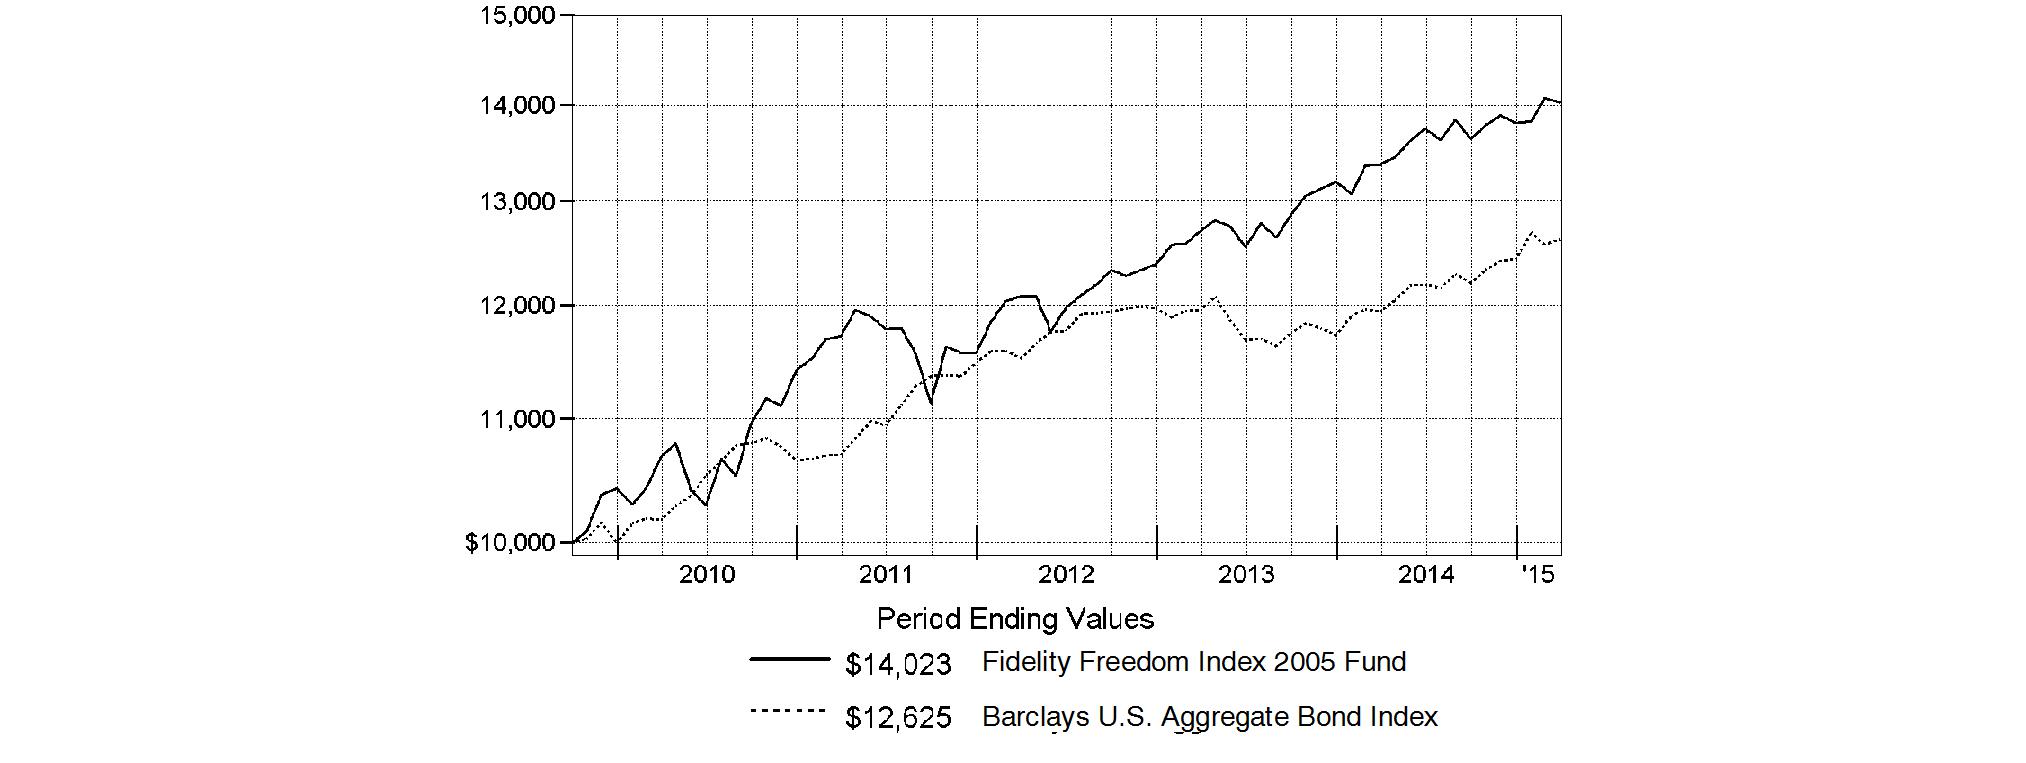
-
Annual Report
Fidelity Freedom Index 2010 Fund
Performance: The Bottom Line
Average annual total return reflects the change in the value of an investment, assuming reinvestment of the fund's distributions from dividend income and capital gains (the profits earned upon the sale of securities that have grown in value, if any) and assuming a constant rate of performance each year. The $10,000 table and the fund's returns do not reflect the deduction of taxes that a shareholder would pay on fund distributions or the redemption of fund shares. During periods of reimbursement by Fidelity, a fund's total return will be greater than it would be had the reimbursement not occurred. How a fund did yesterday is no guarantee of how it will do tomorrow.
Average Annual Total Returns
Periods ended March 31, 2015 | Past 1
year | Past 5
years | Life of
fund A |
Fidelity Freedom Index 2010 Fund | 5.36% | 6.76% | 7.53% |
A From October 2, 2009.
$10,000 Over Life of Fund
Let's say hypothetically that $10,000 was invested in Fidelity Freedom Index 2010 Fund on October 2, 2009, when the fund started. The chart shows how the value of your investment would have changed, and also shows how the Barclays U.S. Aggregate Bond Index performed over the same period.
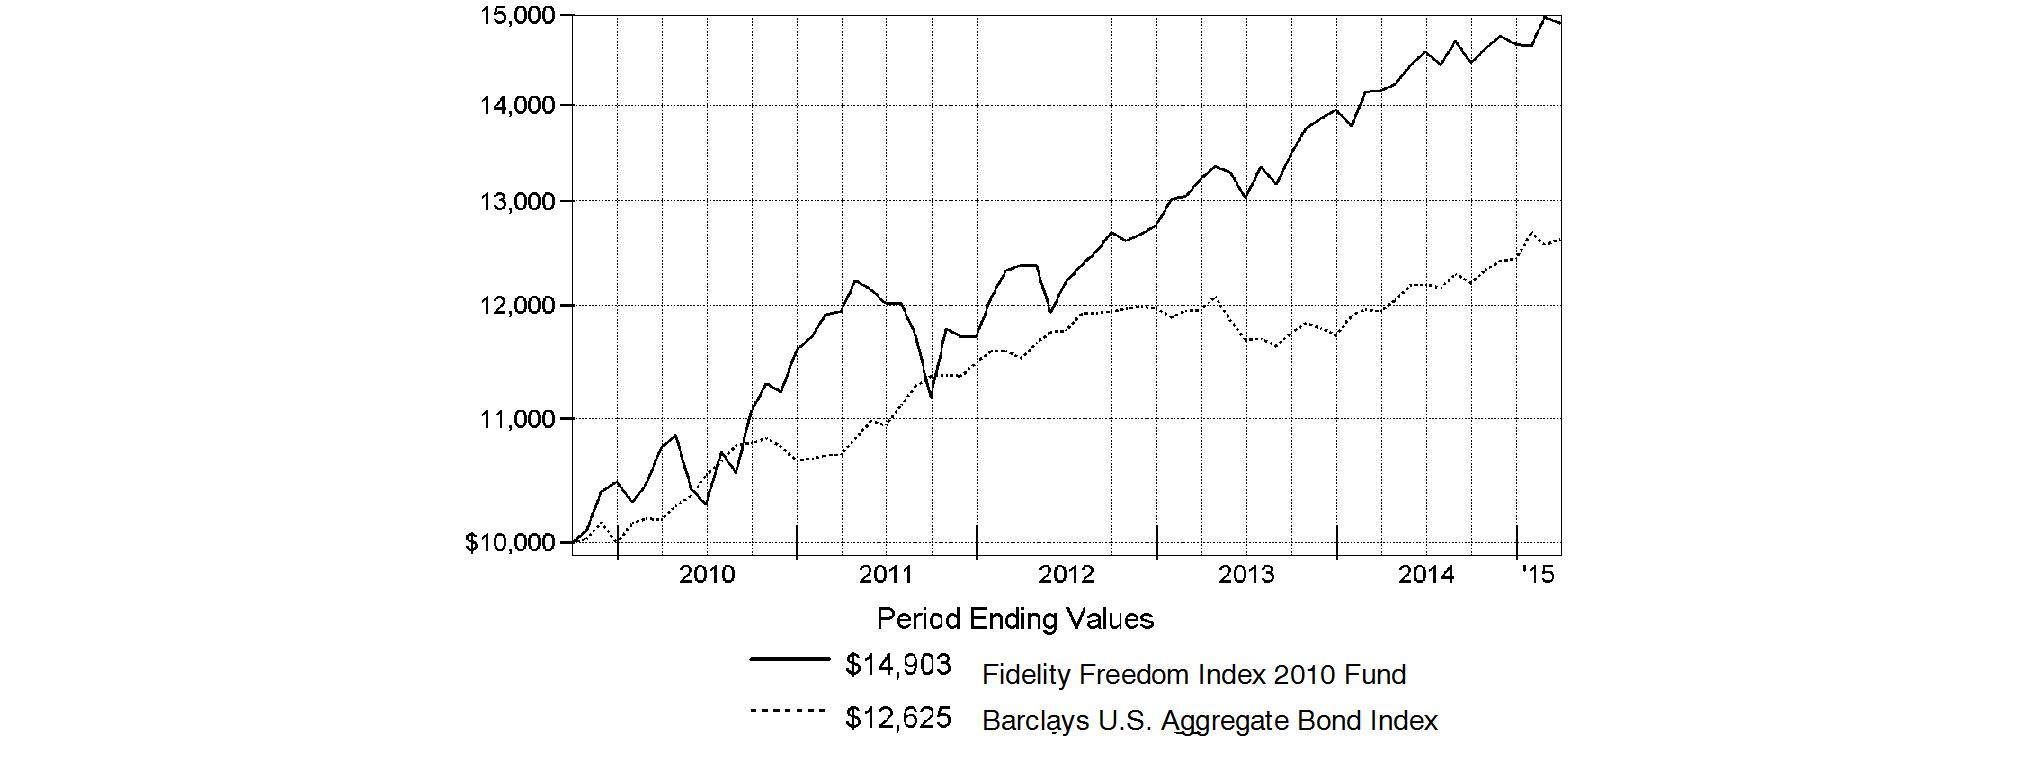
Annual Report
Fidelity Freedom Index 2015 Fund
Performance: The Bottom Line
Average annual total return reflects the change in the value of an investment, assuming reinvestment of the fund's distributions from dividend income and capital gains (the profits earned upon the sale of securities that have grown in value, if any) and assuming a constant rate of performance each year. The $10,000 table and the fund's returns do not reflect the deduction of taxes that a shareholder would pay on fund distributions or the redemption of fund shares. During periods of reimbursement by Fidelity, a fund's total return will be greater than it would be had the reimbursement not occurred. How a fund did yesterday is no guarantee of how it will do tomorrow.
Average Annual Total Returns
Periods ended March 31, 2015 | Past 1
year | Past 5
years | Life of
fund A |
Fidelity Freedom Index 2015 Fund | 5.87% | 7.09% | 7.87% |
A From October 2, 2009.
$10,000 Over Life of Fund
Let's say hypothetically that $10,000 was invested in Fidelity Freedom Index 2015 Fund on October 2, 2009, when the fund started. The chart shows how the value of your investment would have changed, and also shows how the S&P 500® Index performed over the same period.
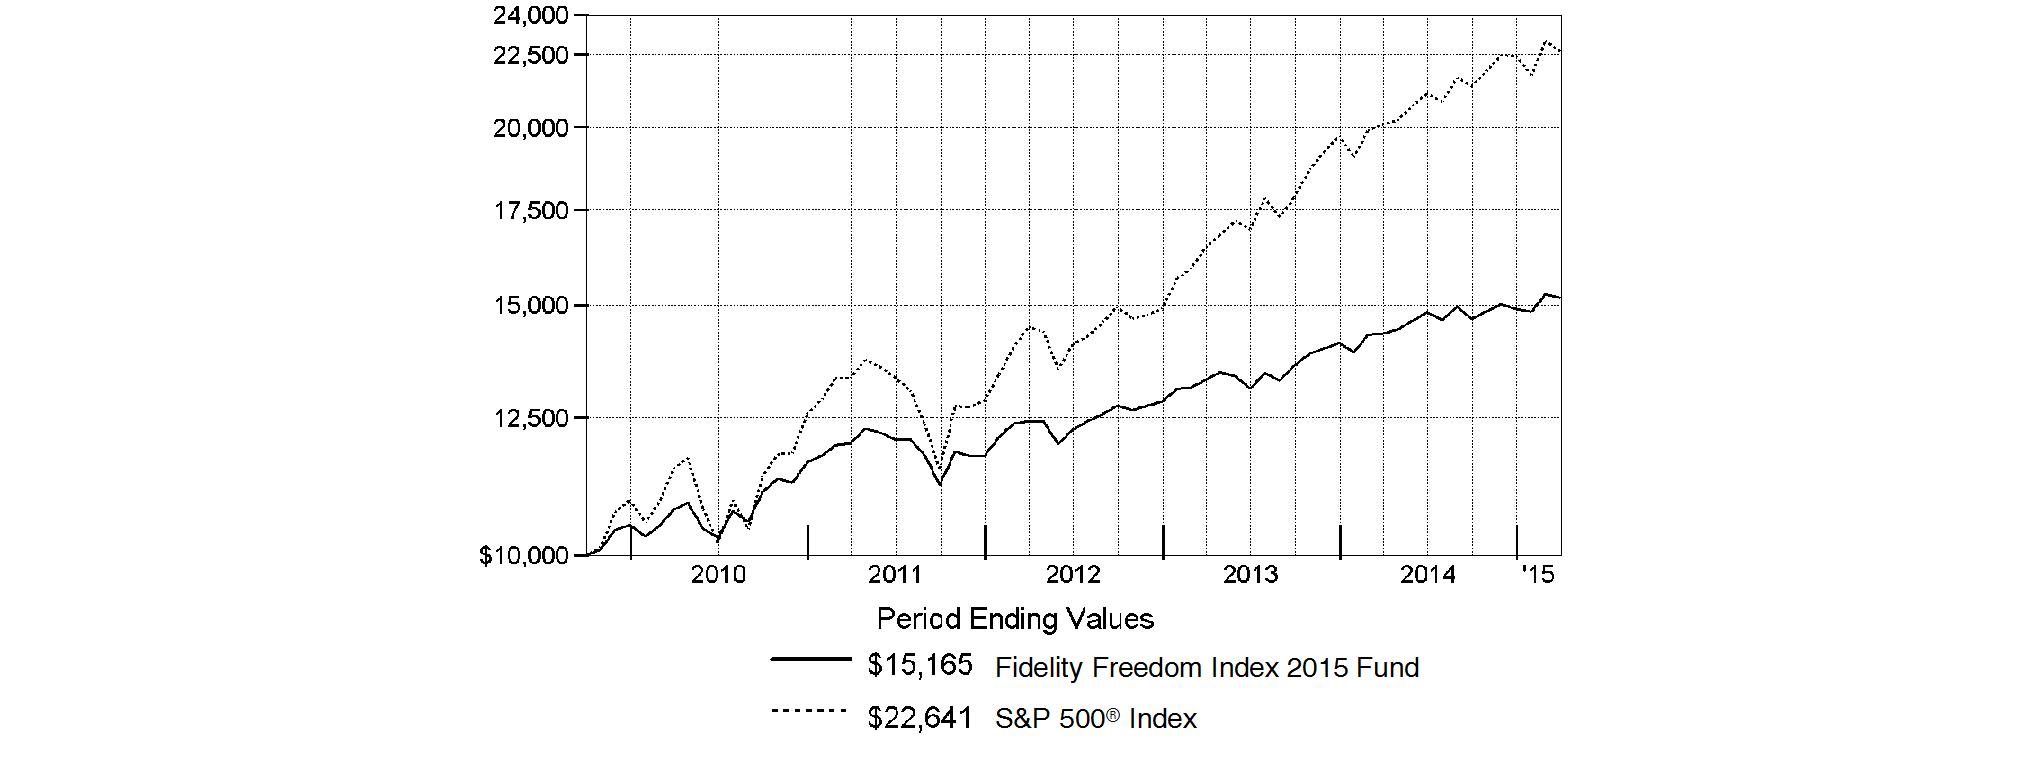
-
Annual Report
Fidelity Freedom Index 2020 Fund
Performance: The Bottom Line
Average annual total return reflects the change in the value of an investment, assuming reinvestment of the fund's distributions from dividend income and capital gains (the profits earned upon the sale of securities that have grown in value, if any) and assuming a constant rate of performance each year. The $10,000 table and the fund's returns do not reflect the deduction of taxes that a shareholder would pay on fund distributions or the redemption of fund shares. During periods of reimbursement by Fidelity, a fund's total return will be greater than it would be had the reimbursement not occurred. How a fund did yesterday is no guarantee of how it will do tomorrow.
Average Annual Total Returns
Periods ended March 31, 2015 | Past 1
year | Past 5
years | Life of
fund A |
Fidelity Freedom Index 2020 Fund | 6.18% | 7.58% | 8.60% |
A From October 2, 2009.
$10,000 Over Life of Fund
Let's say hypothetically that $10,000 was invested in Fidelity Freedom Index 2020 Fund on October 2, 2009, when the fund started. The chart shows how the value of your investment would have changed, and also shows how the S&P 500 Index performed over the same period.
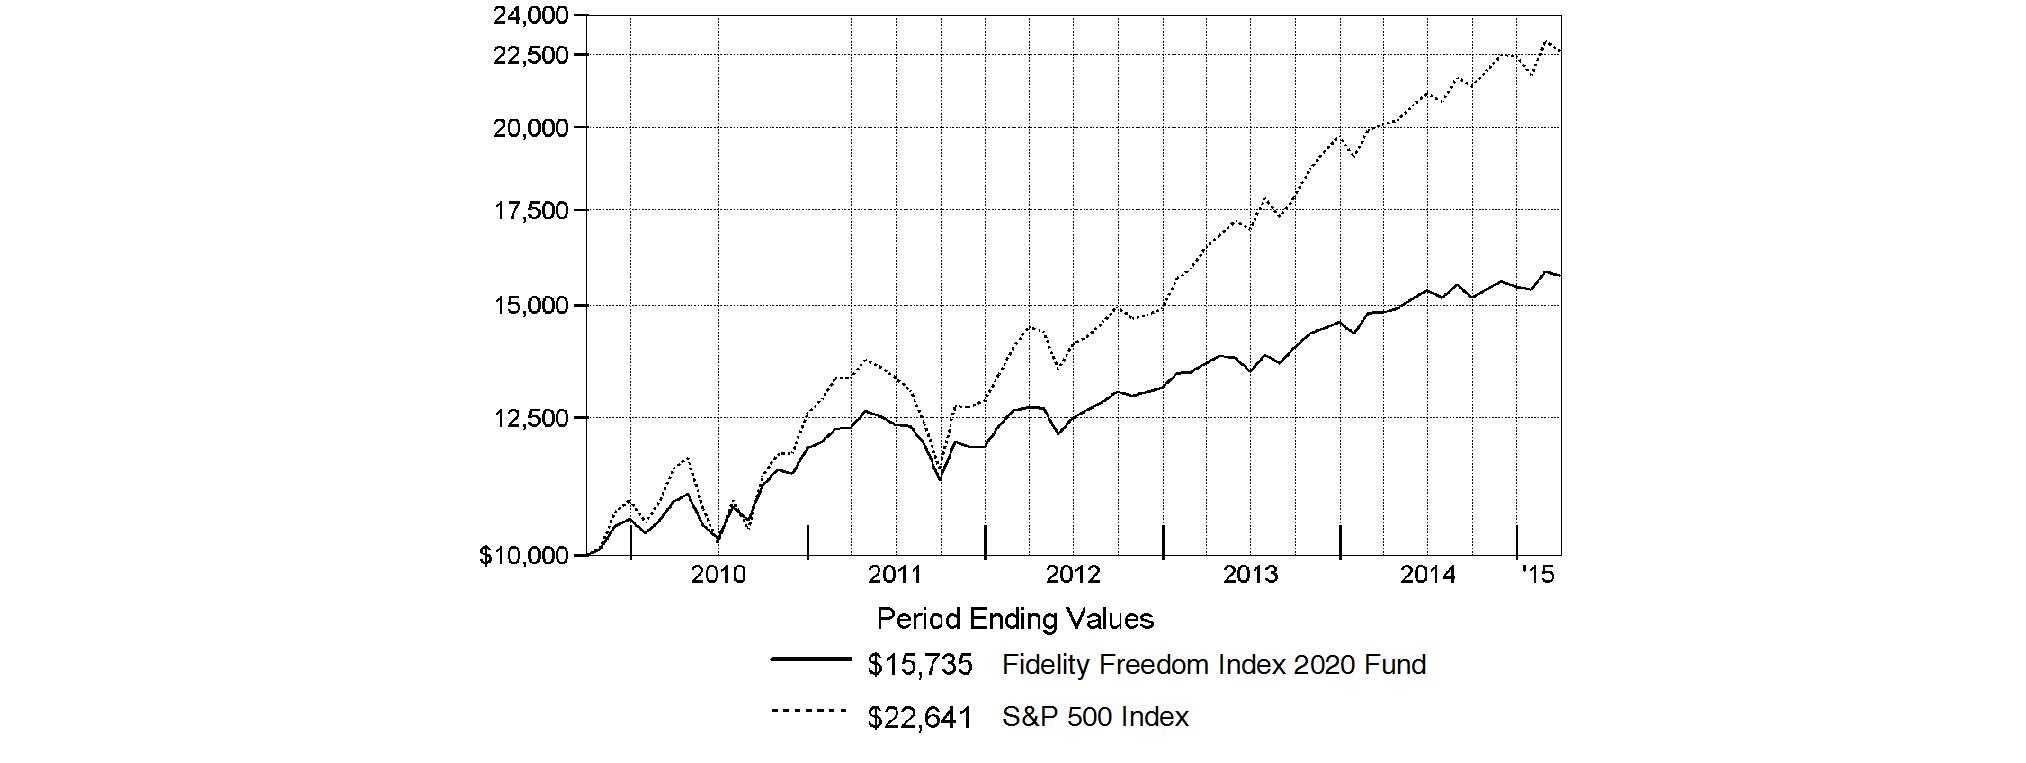
Annual Report
Fidelity Freedom Index 2025 Fund
Performance: The Bottom Line
Average annual total return reflects the change in the value of an investment, assuming reinvestment of the fund's distributions from dividend income and capital gains (the profits earned upon the sale of securities that have grown in value, if any) and assuming a constant rate of performance each year. The $10,000 table and the fund's returns do not reflect the deduction of taxes that a shareholder would pay on fund distributions or the redemption of fund shares. During periods of reimbursement by Fidelity, a fund's total return will be greater than it would be had the reimbursement not occurred. How a fund did yesterday is no guarantee of how it will do tomorrow.
Average Annual Total Returns
Periods ended March 31, 2015 | Past 1
year | Past 5
years | Life of
fund A |
Fidelity Freedom Index 2025 Fund | 6.73% | 8.54% | 9.62% |
A From October 2, 2009.
$10,000 Over Life of Fund
Let's say hypothetically that $10,000 was invested in Fidelity Freedom Index 2025 Fund on October 2, 2009, when the fund started. The chart shows how the value of your investment would have changed, and also shows how the S&P 500 Index performed over the same period.
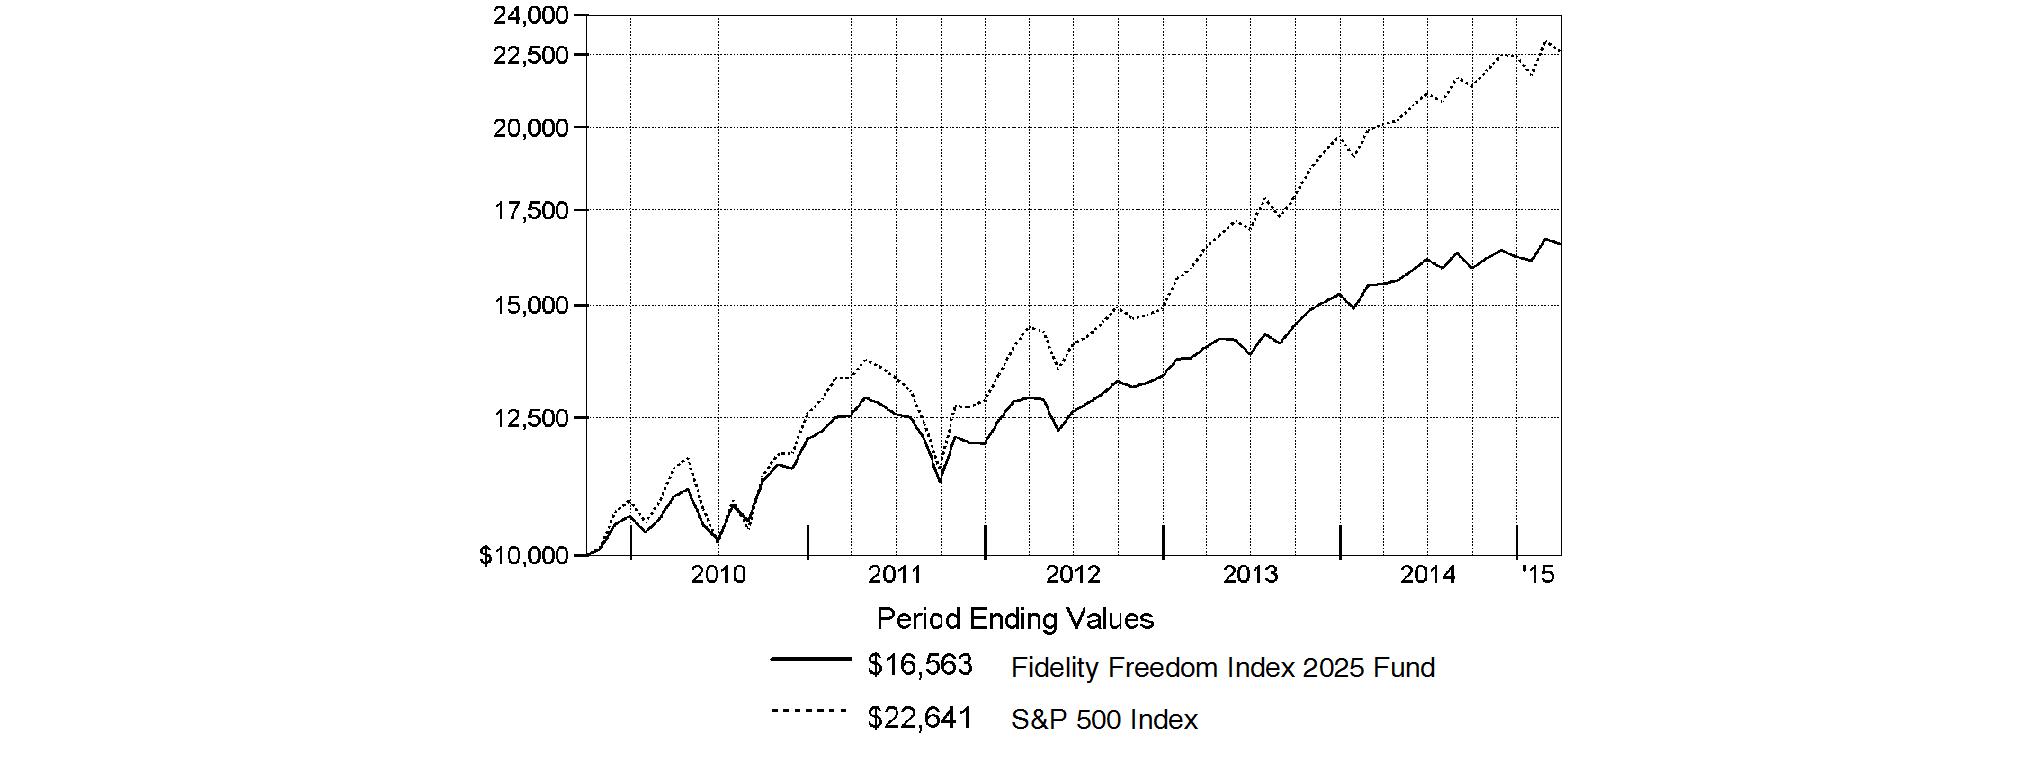
-
Annual Report
Fidelity Freedom Index 2030 Fund
Performance: The Bottom Line
Average annual total return reflects the change in the value of an investment, assuming reinvestment of the fund's distributions from dividend income and capital gains (the profits earned upon the sale of securities that have grown in value, if any) and assuming a constant rate of performance each year. The $10,000 table and the fund's returns do not reflect the deduction of taxes that a shareholder would pay on fund distributions or the redemption of fund shares. During periods of reimbursement by Fidelity, a fund's total return will be greater than it would be had the reimbursement not occurred. How a fund did yesterday is no guarantee of how it will do tomorrow.
Average Annual Total Returns
Periods ended March 31, 2015 | Past 1
year | Past 5
years | Life of
fund A |
Fidelity Freedom Index 2030 Fund | 7.16% | 8.87% | 10.07% |
A From October 2, 2009.
$10,000 Over Life of Fund
Let's say hypothetically that $10,000 was invested in Fidelity Freedom Index 2030 Fund on October 2, 2009, when the fund started. The chart shows how the value of your investment would have changed, and also shows how the S&P 500 Index performed over the same period.

Annual Report
Fidelity Freedom Index 2035 Fund
Performance: The Bottom Line
Average annual total return reflects the change in the value of an investment, assuming reinvestment of the fund's distributions from dividend income and capital gains (the profits earned upon the sale of securities that have grown in value, if any) and assuming a constant rate of performance each year. The $10,000 table and the fund's returns do not reflect the deduction of taxes that a shareholder would pay on fund distributions or the redemption of fund shares. During periods of reimbursement by Fidelity, a fund's total return will be greater than it would be had the reimbursement not occurred. How a fund did yesterday is no guarantee of how it will do tomorrow.
Average Annual Total Returns
Periods ended March 31, 2015 | Past 1
year | Past 5
years | Life of
fund A |
Fidelity Freedom Index 2035 Fund | 7.25% | 9.44% | 10.70% |
A From October 2, 2009.
$10,000 Over Life of Fund
Let's say hypothetically that $10,000 was invested in Fidelity Freedom Index 2035 Fund on October 2, 2009, when the fund started. The chart shows how the value of your investment would have changed, and also shows how the S&P 500 Index performed over the same period.

-
Annual Report
Fidelity Freedom Index 2040 Fund
Performance: The Bottom Line
Average annual total return reflects the change in the value of an investment, assuming reinvestment of the fund's distributions from dividend income and capital gains (the profits earned upon the sale of securities that have grown in value, if any) and assuming a constant rate of performance each year. The $10,000 table and the fund's returns do not reflect the deduction of taxes that a shareholder would pay on fund distributions or the redemption of fund shares. During periods of reimbursement by Fidelity, a fund's total return will be greater than it would be had the reimbursement not occurred. How a fund did yesterday is no guarantee of how it will do tomorrow.
Average Annual Total Returns
Periods ended March 31, 2015 | Past 1
year | Past 5
years | Life of
fund A |
Fidelity Freedom Index 2040 Fund | 7.27% | 9.51% | 10.80% |
A From October 2, 2009.
$10,000 Over Life of Fund
Let's say hypothetically that $10,000 was invested in Fidelity Freedom Index 2040 Fund on October 2, 2009, when the fund started. The chart shows how the value of your investment would have changed, and also shows how the S&P 500 Index performed over the same period.

Annual Report
Fidelity Freedom Index 2045 Fund
Performance: The Bottom Line
Average annual total return reflects the change in the value of an investment, assuming reinvestment of the fund's distributions from dividend income and capital gains (the profits earned upon the sale of securities that have grown in value, if any) and assuming a constant rate of performance each year. The $10,000 table and the fund's returns do not reflect the deduction of taxes that a shareholder would pay on fund distributions or the redemption of fund shares. During periods of reimbursement by Fidelity, a fund's total return will be greater than it would be had the reimbursement not occurred. How a fund did yesterday is no guarantee of how it will do tomorrow.
Average Annual Total Returns
Periods ended March 31, 2015 | Past 1
year | Past 5
years | Life of
fund A |
Fidelity Freedom Index 2045 Fund | 7.22% | 9.62% | 10.92% |
A From October 2, 2009.
$10,000 Over Life of Fund
Let's say hypothetically that $10,000 was invested in Fidelity Freedom Index 2045 Fund on October 2, 2009, when the fund started. The chart shows how the value of your investment would have changed, and also shows how the S&P 500 Index performed over the same period.
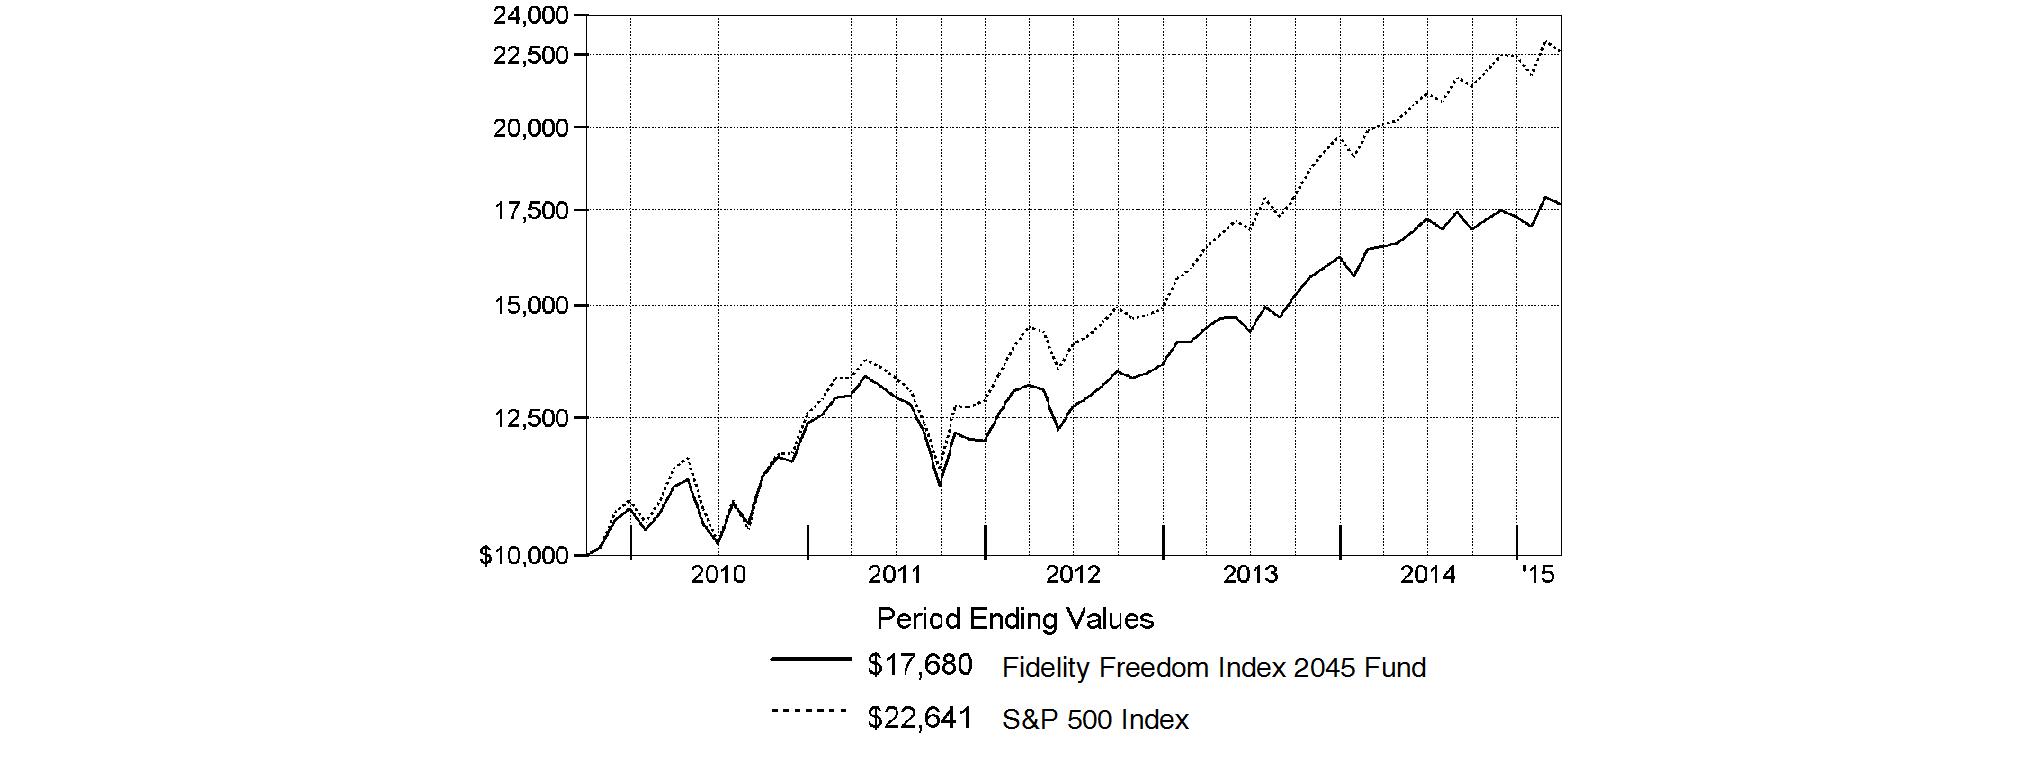
-
Annual Report
Fidelity Freedom Index 2050 Fund
Performance: The Bottom Line
Average annual total return reflects the change in the value of an investment, assuming reinvestment of the fund's distributions from dividend income and capital gains (the profits earned upon the sale of securities that have grown in value, if any) and assuming a constant rate of performance each year. The $10,000 table and the fund's returns do not reflect the deduction of taxes that a shareholder would pay on fund distributions or the redemption of fund shares. During periods of reimbursement by Fidelity, a fund's total return will be greater than it would be had the reimbursement not occurred. How a fund did yesterday is no guarantee of how it will do tomorrow.
Average Annual Total Returns
Periods ended March 31, 2015 | Past 1
year | Past 5
years | Life of
fund A |
Fidelity Freedom Index 2050 Fund | 7.25% | 9.63% | 11.02% |
A From October 2, 2009.
$10,000 Over Life of Fund
Let's say hypothetically that $10,000 was invested in Fidelity Freedom Index 2050 Fund on October 2, 2009, when the fund started. The chart shows how the value of your investment would have changed, and also shows how the S&P 500 Index performed over the same period.
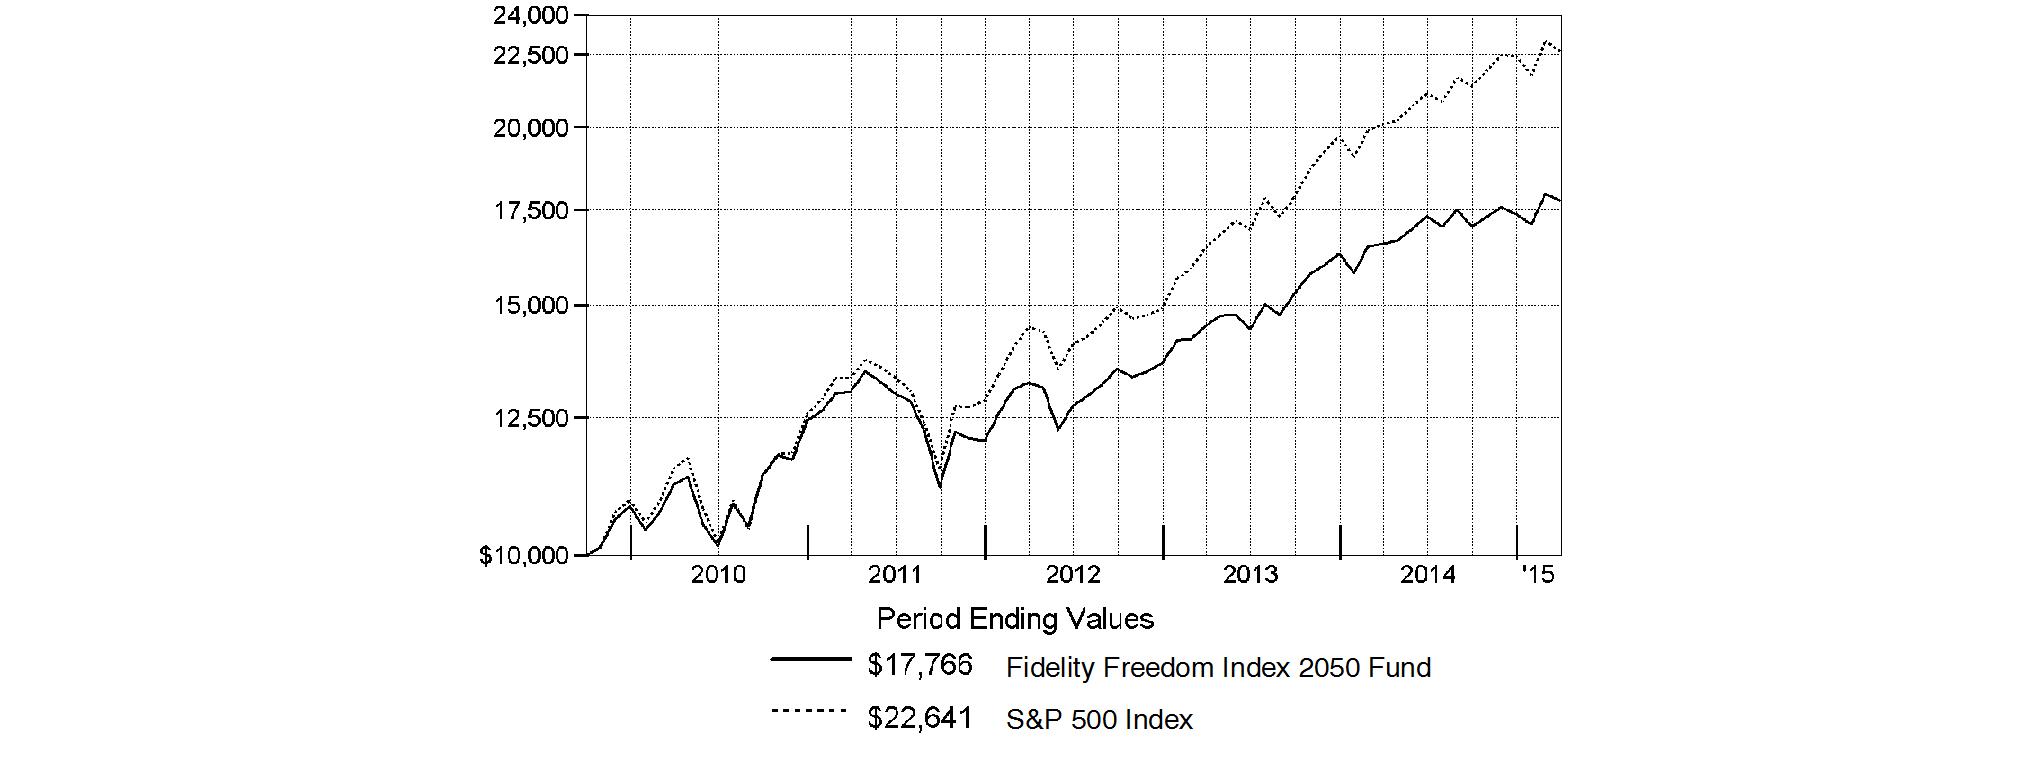
Annual Report
Fidelity Freedom Index 2055 Fund
Performance: The Bottom Line
Average annual total return reflects the change in the value of an investment, assuming reinvestment of the fund's distributions from dividend income and capital gains (the profits earned upon the sale of securities that have grown in value, if any) and assuming a constant rate of performance each year. The $10,000 table and the fund's returns do not reflect the deduction of taxes that a shareholder would pay on fund distributions or the redemption of fund shares. During periods of reimbursement by Fidelity, a fund's total return will be greater than it would be had the reimbursement not occurred. How a fund did yesterday is no guarantee of how it will do tomorrow.
Average Annual Total Returns
Periods ended March 31, 2015 | Past 1
year | Life of
fund A |
Fidelity Freedom Index 2055 Fund | 7.27% | 8.70% |
A From June 1, 2011.
$10,000 Over Life of Fund
Let's say hypothetically that $10,000 was invested in Fidelity Freedom Index 2055 Fund on June 1, 2011, when the fund started. The chart shows how the value of your investment would have changed, and also shows how the S&P 500 Index performed over the same period.
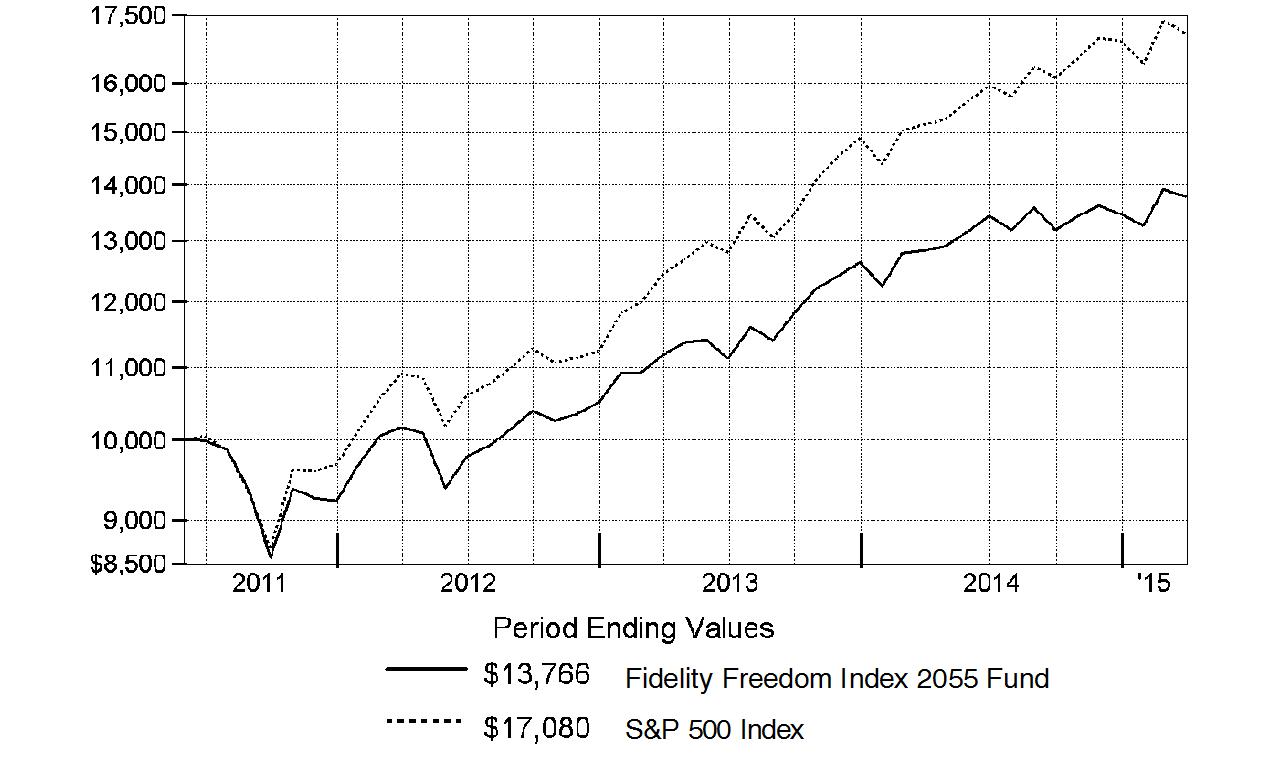
-
Annual Report
Fidelity Freedom Index 2060 Fund
Performance: The Bottom Line
Average annual total return reflects the change in the value of an investment, assuming reinvestment of the fund's distributions from dividend income and capital gains (the profits earned upon the sale of securities that have grown in value, if any) and assuming a constant rate of performance each year. The $10,000 table and the fund's returns do not reflect the deduction of taxes that a shareholder would pay on fund distributions or the redemption of fund shares. During periods of reimbursement by Fidelity, a fund's total return will be greater than it would be had the reimbursement not occurred. How a fund did yesterday is no guarantee of how it will do tomorrow.
Average annual total returns take Fidelity Freedom Index 2060 Fund's cumulative total return and show you what would have happened if Fidelity Freedom Index 2060 Fund shares had performed at a constant rate each year. These numbers will be reported once the fund is a year old.
$10,000 Over Life of Fund
Let's say hypothetically that $10,000 was invested in Fidelity Freedom Index 2060 Fund on August 5, 2014, when the fund started. The chart shows how the value of your investment would have changed, and also shows how the S&P 500 Index performed over the same period.
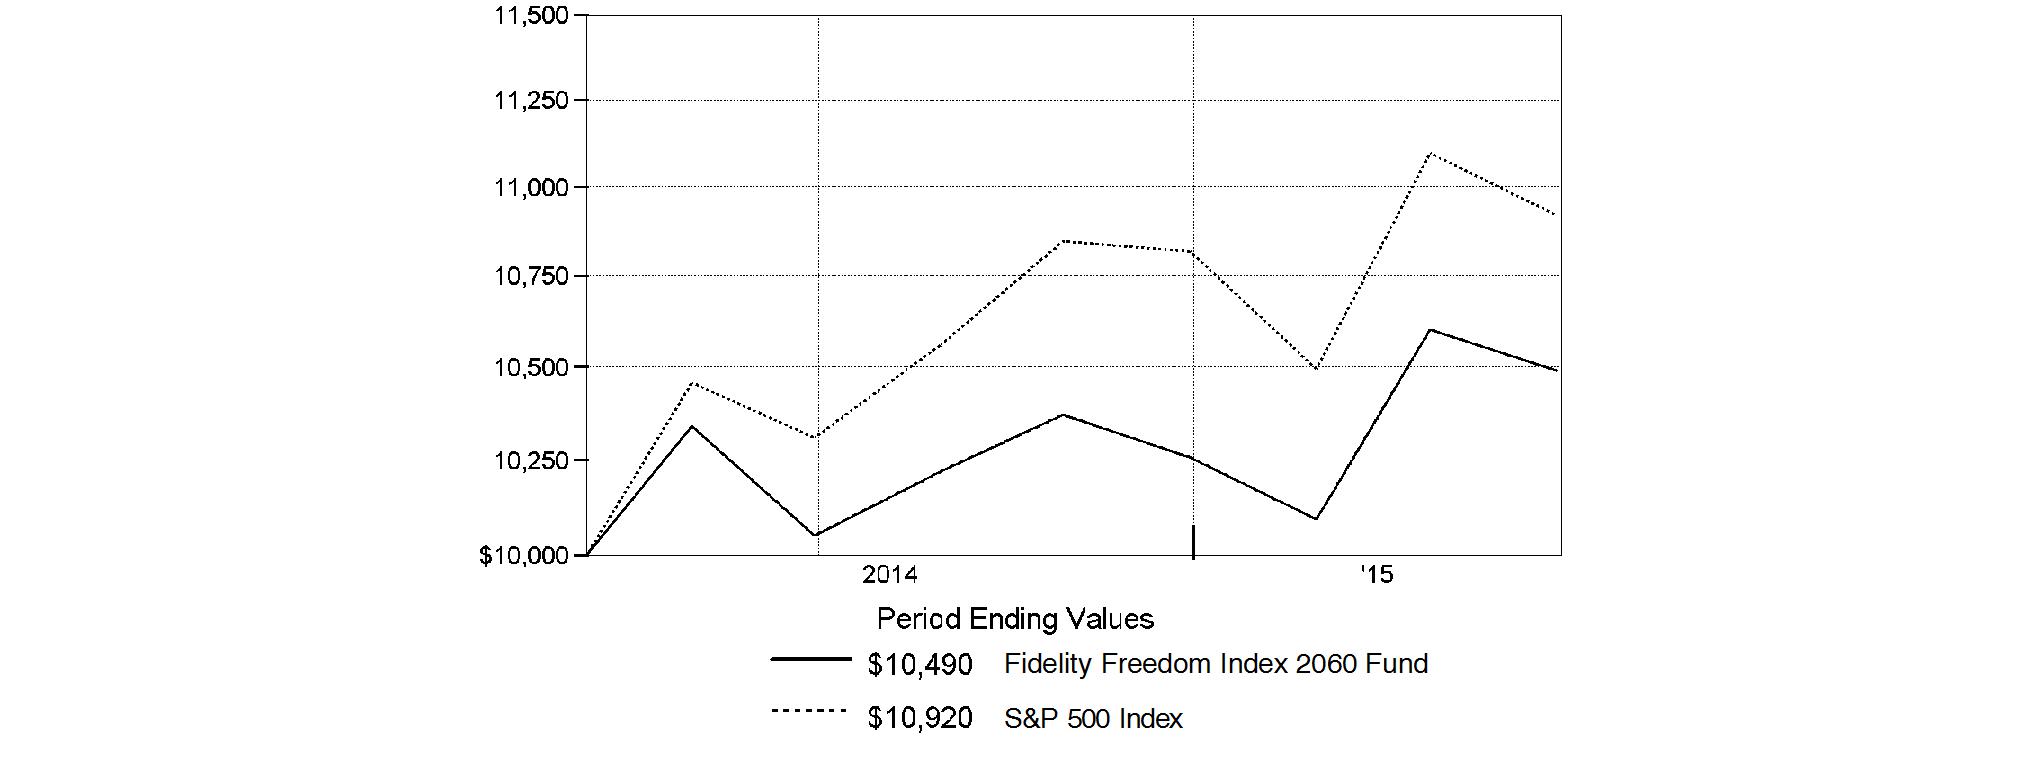
Annual Report
Market Recap: The U.S. stock market closed slightly off recent all-time highs for the 12 months ending March 31, 2015, supported by the relative strength of the U.S. economy and dollar, as well as the appeal of stocks relative to bonds. The large-cap S&P 500® Index returned 12.73%. Growth stocks in the index handily outperformed value-oriented names; among sectors, all save energy notched a gain. The tech-heavy Nasdaq Composite Index® gained 18.12%, while the small-cap Russell 2000® Index advanced 8.21%, rallying after earlier weakness due to growth and valuation worries. International stocks, as measured by the MSCI ACWI (All Country World Index) ex USA Index, returned -0.88% amid recessionary pressure in parts of Asia, anemic economic growth in the eurozone and a rising U.S. dollar. Within the MSCI ACWI ex USA index, Europe (-4%) was hampered by late-period deflationary concerns and currency weakness. The U.K. (-5%) endured decelerating growth and a cooling housing market. Japan (+12%) fought encroaching recession by expanding its already-aggressive economic stimulus plan; Europe followed suit in January. Emerging markets (-1%) saw late-period outflows ahead of potential U.S. Federal Reserve tightening.
Turning to fixed income: U.S. taxable investment-grade bonds posted a positive return for the one-year period, despite a February price decline related to expectations of higher inflation and interest rates. For much of the period, investors in many parts of the world sought the perceived safe haven of U.S. bonds. The Barclays® U.S. Aggregate Bond Index rose 5.72%, well ahead of the negative return for international bonds, which struggled due to a surging U.S. dollar. Among sectors in the Barclays index, U.S. Treasuries rose roughly 5%, driven by this preference for conservative investments. Sentiment changed somewhat toward period end, however, when investors snapped up riskier assets amid a rally in higher-yielding bonds.
Comments from Co-Portfolio Managers Andrew Dierdorf and Brett Sumsion: For the 12 months ending March 31, 2015, each of the Freedom® Index Funds posted a positive absolute return. [Note: Freedom® Index 2060 has not marked a full year's performance; however, the comments here apply generally to its life-of-fund period.] The longer-dated Funds, designed for investors with the longest time horizon until retirement, delivered the highest returns. This is consistent with what we would anticipate, given that these Funds have greater exposure to underlying equities, which, in aggregate, delivered a solid gain during the 12-month period. (For specific Fund results, please refer to the performance section of this shareholder update.) Spartan® Total Market Index Fund Class F, with its broad exposure to U.S. equities, posted a 12% gain for the period. U.S. stock indexes generally outperformed their non-U.S. regional counterparts. For the year, Fidelity® Series Global ex U.S. Index Fund returned -1%. Fidelity Series® Commodity Strategy Fund Class F registered a -27% return. Interest-rate sensitive U.S. investment-grade bonds, as measured by Spartan® U.S. Bond Index Fund Class F, returned 6%. Fidelity Series Inflation-Protected Bond Index Fund Class F returned 1%, and the return for Fidelity Institutional Money Market Portfolio Class F was flat for the one-year period.
The views expressed above reflect those of the portfolio manager(s) only through the end of the period as stated on the cover of this report and do not necessarily represent the views of Fidelity or any other person in the Fidelity organization. Any such views are subject to change at any time based upon market or other conditions and Fidelity disclaims any responsibility to update such views. These views may not be relied on as investment advice and, because investment decisions for a Fidelity fund are based on numerous factors, may not be relied on as an indication of trading intent on behalf of any Fidelity fund.
Annual Report
As a shareholder of a Fund, you incur two types of costs: (1) transaction costs, and (2) ongoing costs, including other Fund expenses. This Example is intended to help you understand your ongoing costs (in dollars) of investing in the Funds and to compare these costs with the ongoing costs of investing in other mutual funds.
The Example is based on an investment of $1,000 invested at the beginning of the period and held for the entire period (October 1, 2014 to March 31, 2015).
Actual Expenses
The first line of the accompanying table for each fund provides information about actual account values and actual expenses. You may use the information in this line, together with the amount you invested, to estimate the expenses that you paid over the period. Simply divide your account value by $1,000.00 (for example, an $8,600 account value divided by $1,000.00 = 8.6), then multiply the result by the number in the first line for a fund under the heading entitled "Expenses Paid During Period" to estimate the expenses you paid on your account during this period. In addition, each Fund, as a shareholder in underlying Fidelity Funds, will indirectly bear its pro-rata share of the fees and expenses incurred by the underlying Fidelity Funds. These fees and expenses are not included in each Fund's annualized expense ratio used to calculate the expense estimates in the table below.
Hypothetical Example for Comparison Purposes
The second line of the accompanying table for each fund provides information about hypothetical account values and hypothetical expenses based on a fund's actual expense ratio and an assumed rate of return of 5% per year before expenses, which is not the Fund's actual return. The hypothetical account values and expenses may not be used to estimate the actual ending account balance or expenses you paid for the period. You may use this information to compare the ongoing costs of investing in the Fund and other funds. To do so, compare this 5% hypothetical example with the 5% hypothetical examples that appear in the shareholder reports of the other funds. In addition, each Fund, as a shareholder in underlying Fidelity Funds, will indirectly bear its pro-rata share of the fees and expenses incurred by the underlying Fidelity Funds. These fees and expenses are not included in each Fund's annualized expense ratio used to calculate the expense estimates in the table below.
Please note that the expenses shown in the table are meant to highlight your ongoing costs only and do not reflect any transaction costs. Therefore, the second line of the table is useful in comparing ongoing costs only, and will not help you determine the relative total costs of owning different funds.
| Annualized
Expense RatioB | Beginning
Account Value
October 1, 2014 | Ending
Account Value
March 31, 2015 | Expenses Paid
During Period*
October 1, 2014
to March 31, 2015 |
Fidelity Freedom Index Income Fund | .08% | | | |
Actual | | $ 1,000.00 | $ 1,022.70 | $ .40 |
HypotheticalA | | $ 1,000.00 | $ 1,024.53 | $ .40 |
Fidelity Freedom Index 2005 Fund | .08% | | | |
Actual | | $ 1,000.00 | $ 1,028.60 | $ .40 |
HypotheticalA | | $ 1,000.00 | $ 1,024.53 | $ .40 |
Fidelity Freedom Index 2010 Fund | .08% | | | |
Actual | | $ 1,000.00 | $ 1,031.40 | $ .41 |
HypotheticalA | | $ 1,000.00 | $ 1,024.53 | $ .40 |
Fidelity Freedom Index 2015 Fund | .08% | | | |
Actual | | $ 1,000.00 | $ 1,034.80 | $ .41 |
HypotheticalA | | $ 1,000.00 | $ 1,024.53 | $ .40 |
Fidelity Freedom Index 2020 Fund | .08% | | | |
Actual | | $ 1,000.00 | $ 1,036.80 | $ .41 |
HypotheticalA | | $ 1,000.00 | $ 1,024.53 | $ .40 |
Fidelity Freedom Index 2025 Fund | .08% | | | |
Actual | | $ 1,000.00 | $ 1,040.00 | $ .41 |
HypotheticalA | | $ 1,000.00 | $ 1,024.53 | $ .40 |
Fidelity Freedom Index 2030 Fund | .08% | | | |
Actual | | $ 1,000.00 | $ 1,042.30 | $ .41 |
HypotheticalA | | $ 1,000.00 | $ 1,024.53 | $ .40 |
Fidelity Freedom Index 2035 Fund | .08% | | | |
Actual | | $ 1,000.00 | $ 1,043.20 | $ .41 |
HypotheticalA | | $ 1,000.00 | $ 1,024.53 | $ .40 |
Fidelity Freedom Index 2040 Fund | .08% | | | |
Actual | | $ 1,000.00 | $ 1,043.10 | $ .41 |
HypotheticalA | | $ 1,000.00 | $ 1,024.53 | $ .40 |
| Annualized
Expense RatioB | Beginning
Account Value
October 1, 2014 | Ending
Account Value
March 31, 2015 | Expenses Paid
During Period*
October 1, 2014
to March 31, 2015 |
Fidelity Freedom Index 2045 Fund | .08% | | | |
Actual | | $ 1,000.00 | $ 1,043.20 | $ .41 |
HypotheticalA | | $ 1,000.00 | $ 1,024.53 | $ .40 |
Fidelity Freedom Index 2050 Fund | .08% | | | |
Actual | | $ 1,000.00 | $ 1,043.70 | $ .41 |
HypotheticalA | | $ 1,000.00 | $ 1,024.53 | $ .40 |
Fidelity Freedom Index 2055 Fund | .09% | | | |
Actual | | $ 1,000.00 | $ 1,043.70 | $ .46 |
HypotheticalA | | $ 1,000.00 | $ 1,024.48 | $ .45 |
Fidelity Freedom Index 2060 Fund | .09% | | | |
Actual | | $ 1,000.00 | $ 1,043.80 | $ .46 |
HypotheticalA | | $ 1,000.00 | $ 1,024.48 | $ .45 |
A 5% return per year before expenses
B Annualized expense ratio reflects expenses net of applicable fee waivers.
* Expenses are equal to each Fund's annualized expense ratio, multiplied by the average account value over the period, multiplied by 182/365 (to reflect the one-half year period). The fees and expenses of the underlying Fidelity Funds in which each Fund invests are not included in each Fund's annualized expense ratio.
Annual Report
Fidelity Freedom Index Income Fund
Investment Changes (Unaudited)
The information in the following tables is based on the direct investments of the Fund. |
Fund Holdings as of March 31, 2015 |
| % of fund's
net assets | % of fund's net assets
6 months ago |
Domestic Equity Funds | | |
Spartan Total Market Index Fund Class F | 15.6 | 15.7 |
Commodity Funds | | |
Fidelity Series Commodity Strategy Fund Class F | 1.0 | 1.0 |
International Equity Funds | | |
Fidelity Series Global ex U.S. Index Fund | 7.2 | 7.1 |
Bond Funds | | |
Spartan U.S. Bond Index Fund Class F | 40.2 | 40.2 |
Inflation-Protected Bond Funds | | |
Fidelity Series Inflation-Protected Bond Index Fund Class F | 6.0 | 6.0 |
Short-Term Funds | | |
Fidelity Institutional Money Market Portfolio Class F | 30.0 | 30.0 |
Net Other Assets (Liabilities)* | 0.0 | 0.0 |
| 100.0 | 100.0 |
* Amount represents less than 0.1%
Asset Allocation (% of fund's net assets) |
Period end |
 | Domestic Equity Funds | 15.6% | |
 | Commodity Funds | 1.0% | |
 | International Equity Funds | 7.2% | |
 | Bond Funds | 40.2% | |
 | Inflation-Protected Bond Funds | 6.0% | |
 | Short-Term Funds | 30.0% | |

Six months ago |
 | Domestic Equity Funds | 15.7% | |
 | Commodity Funds | 1.0% | |
 | International Equity Funds | 7.1% | |
 | Bond Funds | 40.2% | |
 | Inflation-Protected Bond Funds | 6.0% | |
 | Short-Term Funds | 30.0% | |

Annual Report
Fidelity Freedom Index Income Fund
Investments March 31, 2015
Showing Percentage of Net Assets
Domestic Equity Funds - 15.6% |
| Shares | | Value |
Spartan Total Market Index Fund Class F (c)
(Cost $24,978,753) | 623,836 | | $ 38,029,067 |
Commodity Funds - 1.0% |
| | | |
Fidelity Series Commodity Strategy Fund Class F (a)(c)
(Cost $3,335,813) | 407,723 | |
2,515,650
|
International Equity Funds - 7.2% |
| | | |
Fidelity Series Global ex U.S. Index Fund (c)
(Cost $15,939,381) | 1,483,300 | |
17,502,936
|
Bond Funds - 40.2% |
| | | |
Spartan U.S. Bond Index Fund Class F (c)
(Cost $95,692,993) | 8,295,284 | |
98,299,117
|
Inflation-Protected Bond Funds - 6.0% |
| | | |
Fidelity Series Inflation-Protected Bond Index Fund Class F (c)
(Cost $15,927,648) | 1,501,132 | |
14,651,050
|
Short-Term Funds - 30.0% |
| Shares | | Value |
Fidelity Institutional Money Market Portfolio Class F 0.14% (b)(c)
(Cost $73,277,092) | 73,277,092 | | $ 73,277,092 |
TOTAL INVESTMENT
PORTFOLIO - 100.0% (Cost $229,151,680) | | 244,274,912 |
NET OTHER ASSETS (LIABILITIES) - 0.0% | | (14,562) |
NET ASSETS - 100% | $ 244,260,350 |
Legend |
(a) Non-income producing |
(b) The rate quoted is the annualized seven-day yield of the fund at period end. |
(c) Affiliated Fund |
Affiliated Underlying Funds |
Information regarding the Fund's fiscal year to date purchases and sales of the affiliated Underlying Funds and income earned by the Fund from investments in affiliated Underlying Funds is as follows: |
Affiliate | Value,
beginning of
period | Purchases | Sales
Proceeds | Dividend
Income | Value,
end of
period |
Fidelity Institutional Money Market Portfolio Class F | $ 49,383,751 | $ 16,788,259 | $ 10,935,216 | $ 63,444 | $ 73,277,092 |
Fidelity Series Commodity Strategy Fund Class F | 1,835,278 | 1,177,007 | 370,380 | - | 2,515,650 |
Fidelity Series Global ex U.S. Index Fund | 11,864,285 | 5,266,584 | 3,211,581 | 486,432 | 17,502,936 |
Fidelity Series Inflation-Protected Bond Index Fund Class F | 9,758,510 | 3,576,372 | 2,064,900 | 37,403 | 14,651,050 |
Spartan Total Market Index Fund Class F | 25,952,370 | 9,710,986 | 10,446,539 | 575,727 | 38,029,067 |
Spartan U.S. Bond Index Fund Class F | 66,140,085 | 21,004,838 | 15,555,807 | 2,204,604 | 98,299,117 |
Total | $ 164,934,279 | $ 57,524,046 | $ 42,584,423 | $ 3,367,610 | $ 244,274,912 |
Other Information |
All investments are categorized as Level 1 under the Fair Value Hierarchy. The inputs or methodology used for valuing securities may not be an indication of the risk associated with investing in those securities. For more information on valuation inputs, please refer to the Investment Valuation section in the accompanying Notes to Financial Statements. |
See accompanying notes which are an integral part of the financial statements.
Annual Report
Fidelity Freedom Index Income Fund
Statement of Assets and Liabilities
| March 31, 2015 |
| | |
Assets | | |
Investment in securities, at value (cost $229,151,680) - See accompanying schedule | | $ 244,274,912 |
Cash | | 2 |
Receivable for investments sold | | 316,699 |
Receivable for fund shares sold | | 140,081 |
Receivable from affiliate for expense reductions | | 16,176 |
Total assets | | 244,747,870 |
| | |
Liabilities | | |
Payable for investments purchased | $ 400,900 | |
Payable for fund shares redeemed | 55,894 | |
Transfer agent fees payable | 30,726 | |
Total liabilities | | 487,520 |
| | |
Net Assets | | $ 244,260,350 |
Net Assets consist of: | | |
Paid in capital | | $ 229,944,428 |
Undistributed net investment income | | 122,645 |
Accumulated undistributed net realized gain (loss) on investments | | (929,955) |
Net unrealized appreciation (depreciation) on investments | | 15,123,232 |
Net Assets, for 21,206,270 shares outstanding | | $ 244,260,350 |
Net Asset Value, offering price and redemption price per share ($244,260,350 ÷ 21,206,270 shares) | | $ 11.52 |
Statement of Operations
| Year ended March 31, 2015 |
| | |
Investment Income | | |
Income distributions from underlying funds | | $ 3,367,610 |
| | |
Expenses | | |
Transfer agent fees | $ 323,236 | |
Independent trustees' compensation | 912 | |
Total expenses before reductions | 324,148 | |
Expense reductions | (152,659) | 171,489 |
Net investment income (loss) | | 3,196,121 |
Realized and Unrealized Gain (Loss) Realized gain (loss) on sale of underlying fund shares | 125,664 | |
Capital gain distributions from underlying funds | 316,361 | |
Total net realized gain (loss) | | 442,025 |
Change in net unrealized appreciation (depreciation) on investment securities | | 3,973,356 |
Net gain (loss) | | 4,415,381 |
Net increase (decrease) in net assets resulting from operations | | $ 7,611,502 |
See accompanying notes which are an integral part of the financial statements.
Annual Report
Fidelity Freedom Index Income Fund
Financial Statements - continued
Statement of Changes in Net Assets
| Year ended
March 31,
2015 | Year ended
March 31,
2014 |
Increase (Decrease) in Net Assets | | |
Operations | | |
Net investment income (loss) | $ 3,196,121 | $ 1,722,884 |
Net realized gain (loss) | 442,025 | 482,838 |
Change in net unrealized appreciation (depreciation) | 3,973,356 | 2,175,838 |
Net increase (decrease) in net assets resulting from operations | 7,611,502 | 4,381,560 |
Distributions to shareholders from net investment income | (3,110,656) | (1,641,918) |
Distributions to shareholders from net realized gain | (1,121,248) | (188,185) |
Total distributions | (4,231,904) | (1,830,103) |
Share transactions
Proceeds from sales of shares | 82,572,873 | 84,388,161 |
Net asset value of shares issued in exchange for the net assets of Fidelity Freedom Index 2000 Fund (note 6) | 60,344,330 | - |
Reinvestment of distributions | 4,231,904 | 1,830,103 |
Cost of shares redeemed | (71,193,900) | (56,597,258) |
Net increase (decrease) in net assets resulting from share transactions | 75,955,207 | 29,621,006 |
Total increase (decrease) in net assets | 79,334,805 | 32,172,463 |
| | |
Net Assets | | |
Beginning of period | 164,925,545 | 132,753,082 |
End of period (including undistributed net investment income of $122,645 and undistributed net investment income of $163,938, respectively) | $ 244,260,350 | $ 164,925,545 |
Other Information Shares | | |
Sold | 7,222,949 | 7,568,262 |
Issued in exchange for the shares of Fidelity Freedom Index 2000 Fund (note 6) | 5,261,057 | - |
Issued in reinvestment of distributions | 371,475 | 163,960 |
Redeemed | (6,223,071) | (5,081,711) |
Net increase (decrease) | 6,632,410 | 2,650,511 |
Financial Highlights
Years ended March 31, | 2015 | 2014 | 2013 | 2012 | 2011 |
Selected Per-Share Data | | | | | |
Net asset value, beginning of period | $ 11.32 | $ 11.13 | $ 10.89 | $ 10.74 | $ 10.29 |
Income from Investment Operations | | | | | |
Net investment income (loss) B | .17 | .13 | .12 | .13 | .13 |
Net realized and unrealized gain (loss) | .26 | .20 | .29 | .24 | .47 |
Total from investment operations | .43 | .33 | .41 | .37 | .60 |
Distributions from net investment income | (.16) | (.12) | (.11) | (.13) | (.12) |
Distributions from net realized gain | (.07) | (.02) | (.05) | (.09) | (.03) |
Total distributions | (.23) | (.14) | (.17) E | (.22) | (.15) |
Net asset value, end of period | $ 11.52 | $ 11.32 | $ 11.13 | $ 10.89 | $ 10.74 |
Total ReturnA | 3.83% | 2.98% | 3.75% | 3.52% | 5.89% |
Ratios to Average Net Assets C, D | | | | | |
Expenses before reductions | .15% | .15% | .15% | .15% | .08% |
Expenses net of fee waivers, if any | .08% | .08% | .10% | .09% | .06% |
Expenses net of all reductions | .08% | .08% | .10% | .09% | .06% |
Net investment income (loss) | 1.49% | 1.20% | 1.06% | 1.24% | 1.27% |
Supplemental Data | | | | | |
Net assets, end of period (000 omitted) | $ 244,260 | $ 164,926 | $ 132,753 | $ 67,405 | $ 38,540 |
Portfolio turnover rateD | 20% F | 43% | 19% | 31% | 36% |
A Total returns would have been lower if certain expenses had not been reduced during the applicable periods shown.
B Calculated based on average shares outstanding during the period.
C Expense ratios reflect operating expenses of the Fund. Expenses before reductions do not reflect amounts reimbursed by the investment adviser or reductions from expense offset arrangements and do not represent the amount paid by the Fund during periods when reimbursements or reductions occur. Expenses net of fee waivers reflect expenses after reimbursement by the investment adviser but prior to reductions from expense offset arrangements. Expenses net of all reductions represent the net expenses paid by the Fund.
D Amounts do not include the activity of the Underlying Funds.
E Total distributions of $.17 per share is comprised of distributions from net investment income of $.112 and distributions from net realized gain of $.053 per share.
F The portfolio turnover rate does not include the assets acquired in the merger.
See accompanying notes which are an integral part of the financial statements.
Annual Report
Fidelity Freedom Index 2005 Fund
Investment Changes (Unaudited)
The information in the following tables is based on the direct investments of the Fund. |
Fund Holdings as of March 31, 2015 |
| % of fund's
net assets | % of fund's net assets
6 months ago |
Domestic Equity Funds | | |
Spartan Total Market Index Fund Class F | 25.6 | 26.3 |
Commodity Funds | | |
Fidelity Series Commodity Strategy Fund Class F | 1.0 | 1.0 |
International Equity Funds | | |
Fidelity Series Global ex U.S. Index Fund | 11.5 | 11.7 |
Bond Funds | | |
Spartan U.S. Bond Index Fund Class F | 36.5 | 36.1 |
Inflation-Protected Bond Funds | | |
Fidelity Series Inflation-Protected Bond Index Fund Class F | 4.6 | 4.5 |
Short-Term Funds | | |
Fidelity Institutional Money Market Portfolio Class F | 20.8 | 20.4 |
Net Other Assets (Liabilities)* | 0.0 | 0.0 |
| 100.0 | 100.0 |
* Amount represents less than 0.1%
Asset Allocation (% of fund's net assets) |
Period end |
 | Domestic Equity Funds | 25.6% | |
 | Commodity Funds | 1.0% | |
 | International Equity Funds | 11.5% | |
 | Bond Funds | 36.5% | |
 | Inflation-Protected Bond Funds | 4.6% | |
 | Short-Term Funds | 20.8% | |

Six months ago |
 | Domestic Equity Funds | 26.3% | |
 | Commodity Funds | 1.0% | |
 | International Equity Funds | 11.7% | |
 | Bond Funds | 36.1% | |
 | Inflation-Protected Bond Funds | 4.5% | |
 | Short-Term Funds | 20.4% | |

Annual Report
Fidelity Freedom Index 2005 Fund
Investments March 31, 2015
Showing Percentage of Net Assets
Domestic Equity Funds - 25.6% |
| Shares | | Value |
Spartan Total Market Index Fund Class F (c)
(Cost $12,433,897) | 313,008 | | $ 19,080,970 |
Commodity Funds - 1.0% |
| | | |
Fidelity Series Commodity Strategy Fund Class F (a)(c)
(Cost $1,005,550) | 124,097 | |
765,679
|
International Equity Funds - 11.5% |
| | | |
Fidelity Series Global ex U.S. Index Fund (c)
(Cost $7,908,593) | 724,806 | |
8,552,711
|
Bond Funds - 36.5% |
| | | |
Spartan U.S. Bond Index Fund Class F (c)
(Cost $26,403,730) | 2,291,661 | |
27,156,184
|
Inflation-Protected Bond Funds - 4.6% |
| | | |
Fidelity Series Inflation-Protected Bond Index Fund Class F (c)
(Cost $3,698,063) | 352,275 | |
3,438,202
|
Short-Term Funds - 20.8% |
| Shares | | Value |
Fidelity Institutional Money Market Portfolio Class F 0.14% (b)(c)
(Cost $15,526,643) | 15,526,643 | | $ 15,526,643 |
TOTAL INVESTMENT
PORTFOLIO - 100.0% (Cost $66,976,476) | | 74,520,389 |
NET OTHER ASSETS (LIABILITIES) - 0.0% | | (4,433) |
NET ASSETS - 100% | $ 74,515,956 |
Legend |
(a) Non-income producing |
(b) The rate quoted is the annualized seven-day yield of the fund at period end. |
(c) Affiliated Fund |
Affiliated Underlying Funds |
Information regarding the Fund's fiscal year to date purchases and sales of the affiliated Underlying Funds and income earned by the Fund from investments in affiliated Underlying Funds is as follows: |
Affiliate | Value,
beginning of
period | Purchases | Sales
Proceeds | Dividend
Income | Value,
end of
period |
Fidelity Institutional Money Market Portfolio Class F | $ 13,090,373 | $ 4,801,246 | $ 2,364,975 | $ 13,411 | $ 15,526,643 |
Fidelity Series Commodity Strategy Fund Class F | 710,419 | 397,600 | 114,542 | - | 765,679 |
Fidelity Series Global ex U.S. Index Fund | 7,971,676 | 2,635,838 | 1,743,811 | 235,863 | 8,552,711 |
Fidelity Series Inflation-Protected Bond Index Fund Class F | 2,942,860 | 1,011,049 | 479,725 | 9,032 | 3,438,202 |
Spartan Total Market Index Fund Class F | 17,935,104 | 5,091,835 | 5,808,317 | 298,930 | 19,080,970 |
Spartan U.S. Bond Index Fund Class F | 23,753,792 | 7,593,045 | 4,933,250 | 636,318 | 27,156,184 |
Total | $ 66,404,224 | $ 21,530,613 | $ 15,444,620 | $ 1,193,554 | $ 74,520,389 |
Other Information |
All investments are categorized as Level 1 under the Fair Value Hierarchy. The inputs or methodology used for valuing securities may not be an indication of the risk associated with investing in those securities. For more information on valuation inputs, please refer to the Investment Valuation section in the accompanying Notes to Financial Statements. |
See accompanying notes which are an integral part of the financial statements.
Annual Report
Fidelity Freedom Index 2005 Fund
Statement of Assets and Liabilities
| March 31, 2015 |
| | |
Assets | | |
Investment in securities, at value (cost $66,976,476) - See accompanying schedule | | $ 74,520,389 |
Cash | | 2 |
Receivable for investments sold | | 76,648 |
Receivable for fund shares sold | | 166,088 |
Receivable from affiliate for expense reductions | | 4,552 |
Total assets | | 74,767,679 |
| | |
Liabilities | | |
Payable for investments purchased | $ 149,948 | |
Payable for fund shares redeemed | 92,724 | |
Transfer agent fees payable | 9,051 | |
Total liabilities | | 251,723 |
| | |
Net Assets | | $ 74,515,956 |
Net Assets consist of: | | |
Paid in capital | | $ 67,169,284 |
Undistributed net investment income | | 148,792 |
Accumulated undistributed net realized gain (loss) on investments | | (346,033) |
Net unrealized appreciation (depreciation) on investments | | 7,543,913 |
Net Assets, for 5,863,641 shares outstanding | | $ 74,515,956 |
Net Asset Value, offering price and redemption price per share ($74,515,956 ÷ 5,863,641 shares) | | $ 12.71 |
Statement of Operations
| Year ended March 31, 2015 |
| | |
Investment Income | | |
Income distributions from underlying funds | | $ 1,193,554 |
| | |
Expenses | | |
Transfer agent fees | $ 103,756 | |
Independent trustees' compensation | 297 | |
Total expenses before reductions | 104,053 | |
Expense reductions | (52,026) | 52,027 |
Net investment income (loss) | | 1,141,527 |
Realized and Unrealized Gain (Loss) Realized gain (loss) on sale of underlying fund shares | 172,926 | |
Capital gain distributions from underlying funds | 76,128 | |
Total net realized gain (loss) | | 249,054 |
Change in net unrealized appreciation (depreciation) on investment securities | | 1,857,244 |
Net gain (loss) | | 2,106,298 |
Net increase (decrease) in net assets resulting from operations | | $ 3,247,825 |
See accompanying notes which are an integral part of the financial statements.
Annual Report
Fidelity Freedom Index 2005 Fund
Financial Statements - continued
Statement of Changes in Net Assets
| Year ended
March 31,
2015 | Year ended
March 31,
2014 |
Increase (Decrease) in Net Assets | | |
Operations | | |
Net investment income (loss) | $ 1,141,527 | $ 818,568 |
Net realized gain (loss) | 249,054 | (56,387) |
Change in net unrealized appreciation (depreciation) | 1,857,244 | 2,532,220 |
Net increase (decrease) in net assets resulting from operations | 3,247,825 | 3,294,401 |
Distributions to shareholders from net investment income | (1,807,862) | (74,307) |
Distributions to shareholders from net realized gain | (305,811) | (106,152) |
Total distributions | (2,113,673) | (180,459) |
Share transactions
Proceeds from sales of shares | 24,413,084 | 23,371,800 |
Reinvestment of distributions | 2,113,673 | 180,459 |
Cost of shares redeemed | (19,545,829) | (23,248,120) |
Net increase (decrease) in net assets resulting from share transactions | 6,980,928 | 304,139 |
Total increase (decrease) in net assets | 8,115,080 | 3,418,081 |
| | |
Net Assets | | |
Beginning of period | 66,400,876 | 62,982,795 |
End of period (including undistributed net investment income of $148,792 and undistributed net investment income of $815,769, respectively) | $ 74,515,956 | $ 66,400,876 |
Other Information Shares | | |
Sold | 1,936,294 | 1,928,121 |
Issued in reinvestment of distributions | 169,465 | 15,051 |
Redeemed | (1,554,263) | (1,919,507) |
Net increase (decrease) | 551,496 | 23,665 |
Financial Highlights
Years ended March 31, | 2015 | 2014 | 2013 | 2012 | 2011 |
Selected Per-Share Data | | | | | |
Net asset value, beginning of period | $ 12.50 | $ 11.91 | $ 11.50 | $ 11.44 | $ 10.59 |
Income from Investment Operations | | | | | |
Net investment income (loss) B | .21 | .16 | .14 | .16 | .16 |
Net realized and unrealized gain (loss) | .39 | .46 | .45 | .18 | .86 |
Total from investment operations | .60 | .62 | .59 | .34 | 1.02 |
Distributions from net investment income | (.33) | (.01) | (.14) | (.14) | (.12) |
Distributions from net realized gain | (.06) | (.02) | (.04) | (.14) | (.05) |
Total distributions | (.39) | (.03) | (.18) | (.28) | (.17) |
Net asset value, end of period | $ 12.71 | $ 12.50 | $ 11.91 | $ 11.50 | $ 11.44 |
Total ReturnA | 4.87% | 5.25% | 5.17% | 3.11% | 9.72% |
Ratios to Average Net Assets C, D | | | | | |
Expenses before reductions | .15% | .15% | .15% | .15% | .09% |
Expenses net of fee waivers, if any | .08% | .08% | .09% | .09% | .06% |
Expenses net of all reductions | .08% | .08% | .09% | .09% | .06% |
Net investment income (loss) | 1.65% | 1.29% | 1.22% | 1.45% | 1.42% |
Supplemental Data | | | | | |
Net assets, end of period (000 omitted) | $ 74,516 | $ 66,401 | $ 62,983 | $ 43,986 | $ 23,459 |
Portfolio turnover rateD | 22% | 49% | 23% | 37% | 53% |
A Total returns would have been lower if certain expenses had not been reduced during the applicable periods shown.
B Calculated based on average shares outstanding during the period.
C Expense ratios reflect operating expenses of the Fund. Expenses before reductions do not reflect amounts reimbursed by the investment adviser or reductions from expense offset arrangements and do not represent the amount paid by the Fund during periods when reimbursements or reductions occur. Expenses net of fee waivers reflect expenses after reimbursement by the investment adviser but prior to reductions from expense offset arrangements. Expenses net of all reductions represent the net expenses paid by the Fund.
D Amounts do not include the activity of the Underlying Funds.
See accompanying notes which are an integral part of the financial statements.
Annual Report
Fidelity Freedom Index 2010 Fund
Investment Changes (Unaudited)
The information in the following tables is based on the direct investments of the Fund. |
Fund Holdings as of March 31, 2015 |
| % of fund's
net assets | % of fund's net assets
6 months ago |
Domestic Equity Funds | | |
Spartan Total Market Index Fund Class F | 31.7 | 32.5 |
Commodity Funds | | |
Fidelity Series Commodity Strategy Fund Class F | 1.1 | 1.1 |
International Equity Funds | | |
Fidelity Series Global ex U.S. Index Fund | 14.2 | 14.4 |
Bond Funds | | |
Spartan U.S. Bond Index Fund Class F | 33.7 | 33.3 |
Inflation-Protected Bond Funds | | |
Fidelity Series Inflation-Protected Bond Index Fund Class F | 3.8 | 3.7 |
Short-Term Funds | | |
Fidelity Institutional Money Market Portfolio Class F | 15.5 | 15.0 |
Net Other Assets (Liabilities)* | 0.0 | 0.0 |
| 100.0 | 100.0 |
* Amount represents less than 0.1%
Asset Allocation (% of fund's net assets) |
Period end |
 | Domestic Equity Funds | 31.7% | |
 | Commodity Funds | 1.1% | |
 | International Equity Funds | 14.2% | |
 | Bond Funds | 33.7% | |
 | Inflation-Protected Bond Funds | 3.8% | |
 | Short-Term Funds | 15.5% | |

Six months ago |
 | Domestic Equity Funds | 32.5% | |
 | Commodity Funds | 1.1% | |
 | International Equity Funds | 14.4% | |
 | Bond Funds | 33.3% | |
 | Inflation-Protected Bond Funds | 3.7% | |
 | Short-Term Funds | 15.0% | |

Annual Report
Fidelity Freedom Index 2010 Fund
Investments March 31, 2015
Showing Percentage of Net Assets
Domestic Equity Funds - 31.7% |
| Shares | | Value |
Spartan Total Market Index Fund Class F (c)
(Cost $95,771,671) | 2,504,363 | | $ 152,665,953 |
Commodity Funds - 1.1% |
| | | |
Fidelity Series Commodity Strategy Fund Class F (a)(c)
(Cost $6,799,146) | 856,217 | |
5,282,858
|
International Equity Funds - 14.2% |
| | | |
Fidelity Series Global ex U.S. Index Fund (c)
(Cost $61,270,339) | 5,774,819 | |
68,142,870
|
Bond Funds - 33.7% |
| | | |
Spartan U.S. Bond Index Fund Class F (c)
(Cost $157,844,851) | 13,683,011 | |
162,143,677
|
Inflation-Protected Bond Funds - 3.8% |
| | | |
Fidelity Series Inflation-Protected Bond Index Fund Class F (c)
(Cost $19,444,839) | 1,874,351 | |
18,293,669
|
Short-Term Funds - 15.5% |
| Shares | | Value |
Fidelity Institutional Money Market Portfolio Class F 0.14% (b)(c)
(Cost $74,362,251) | 74,362,251 | | $ 74,362,251 |
TOTAL INVESTMENT
PORTFOLIO - 100.0% (Cost $415,493,097) | | 480,891,278 |
NET OTHER ASSETS (LIABILITIES) - 0.0% | | (30,284) |
NET ASSETS - 100% | $ 480,860,994 |
Legend |
(a) Non-income producing |
(b) The rate quoted is the annualized seven-day yield of the fund at period end. |
(c) Affiliated Fund |
Affiliated Underlying Funds |
Information regarding the Fund's fiscal year to date purchases and sales of the affiliated Underlying Funds and income earned by the Fund from investments in affiliated Underlying Funds is as follows: |
Affiliate | Value,
beginning of
period | Purchases | Sales
Proceeds | Dividend
Income | Value,
end of
period |
Fidelity Institutional Money Market Portfolio Class F | $ 61,765,294 | $ 23,905,785 | $ 11,308,827 | $ 64,403 | $ 74,362,251 |
Fidelity Series Commodity Strategy Fund Class F | 5,054,630 | 2,608,315 | 804,316 | - | 5,282,858 |
Fidelity Series Global ex U.S. Index Fund | 63,263,246 | 21,102,026 | 14,154,362 | 1,811,573 | 68,142,870 |
Fidelity Series Inflation-Protected Bond Index Fund Class F | 15,577,134 | 5,535,396 | 2,678,249 | 48,093 | 18,293,669 |
Spartan Total Market Index Fund Class F | 142,949,184 | 40,563,047 | 45,605,051 | 2,318,977 | 152,665,953 |
Spartan U.S. Bond Index Fund Class F | 142,180,606 | 46,630,562 | 31,292,074 | 3,826,678 | 162,143,677 |
Total | $ 430,790,094 | $ 140,345,131 | $ 105,842,879 | $ 8,069,724 | $ 480,891,278 |
Other Information |
All investments are categorized as Level 1 under the Fair Value Hierarchy. The inputs or methodology used for valuing securities may not be an indication of the risk associated with investing in those securities. For more information on valuation inputs, please refer to the Investment Valuation section in the accompanying Notes to Financial Statements. |
See accompanying notes which are an integral part of the financial statements.
Annual Report
Fidelity Freedom Index 2010 Fund
Statement of Assets and Liabilities
| March 31, 2015 |
| | |
Assets | | |
Investment in securities, at value (cost $415,493,097) - See accompanying schedule | | $ 480,891,278 |
Cash | | 2 |
Receivable for investments sold | | 827,434 |
Receivable for fund shares sold | | 317,508 |
Receivable from affiliate for expense reductions | | 29,809 |
Total assets | | 482,066,031 |
| | |
Liabilities | | |
Payable for investments purchased | $ 812,744 | |
Payable for fund shares redeemed | 331,854 | |
Transfer agent fees payable | 60,439 | |
Total liabilities | | 1,205,037 |
| | |
Net Assets | | $ 480,860,994 |
Net Assets consist of: | | |
Paid in capital | | $ 417,583,832 |
Undistributed net investment income | | 931,171 |
Accumulated undistributed net realized gain (loss) on investments | | (3,052,190) |
Net unrealized appreciation (depreciation) on investments | | 65,398,181 |
Net Assets, for 35,982,693 shares outstanding | | $ 480,860,994 |
Net Asset Value, offering price and redemption price per share ($480,860,994 ÷ 35,982,693 shares) | | $ 13.36 |
Statement of Operations
| Year ended March 31, 2015 |
| | |
Investment Income | | |
Income distributions from underlying funds | | $ 8,069,724 |
| | |
Expenses | | |
Transfer agent fees | $ 675,304 | |
Independent trustees' compensation | 1,922 | |
Total expenses before reductions | 677,226 | |
Expense reductions | (330,143) | 347,083 |
Net investment income (loss) | | 7,722,641 |
Realized and Unrealized Gain (Loss) Realized gain (loss) on sale of underlying fund shares | 1,835,884 | |
Capital gain distributions from underlying funds | 409,577 | |
Total net realized gain (loss) | | 2,245,461 |
Change in net unrealized appreciation (depreciation) on investment securities | | 13,763,042 |
Net gain (loss) | | 16,008,503 |
Net increase (decrease) in net assets resulting from operations | | $ 23,731,144 |
See accompanying notes which are an integral part of the financial statements.
Annual Report
Statement of Changes in Net Assets
| Year ended
March 31,
2015 | Year ended
March 31,
2014 |
Increase (Decrease) in Net Assets | | |
Operations | | |
Net investment income (loss) | $ 7,722,641 | $ 5,662,861 |
Net realized gain (loss) | 2,245,461 | (1,660,246) |
Change in net unrealized appreciation (depreciation) | 13,763,042 | 23,305,805 |
Net increase (decrease) in net assets resulting from operations | 23,731,144 | 27,308,420 |
Distributions to shareholders from net investment income | (12,415,603) | (505,726) |
Distributions to shareholders from net realized gain | (1,861,538) | (1,041,199) |
Total distributions | (14,277,141) | (1,546,925) |
Share transactions
Proceeds from sales of shares | 171,912,696 | 172,483,332 |
Reinvestment of distributions | 14,276,796 | 1,546,925 |
Cost of shares redeemed | (145,549,163) | (133,877,716) |
Net increase (decrease) in net assets resulting from share transactions | 40,640,329 | 40,152,541 |
Total increase (decrease) in net assets | 50,094,332 | 65,914,036 |
| | |
Net Assets | | |
Beginning of period | 430,766,662 | 364,852,626 |
End of period (including undistributed net investment income of $931,171 and undistributed net investment income of $5,643,094, respectively) | $ 480,860,994 | $ 430,766,662 |
Other Information Shares | | |
Sold | 12,965,019 | 13,720,828 |
Issued in reinvestment of distributions | 1,092,180 | 124,651 |
Redeemed | (11,006,242) | (10,656,793) |
Net increase (decrease) | 3,050,957 | 3,188,686 |
Financial Highlights
Years ended March 31, | 2015 | 2014 | 2013 | 2012 | 2011 |
Selected Per-Share Data | | | | | |
Net asset value, beginning of period | $ 13.08 | $ 12.27 | $ 11.71 | $ 11.65 | $ 10.65 |
Income from Investment Operations | | | | | |
Net investment income (loss) B | .23 | .18 | .18 | .20 | .19 |
Net realized and unrealized gain (loss) | .46 | .68 | .61 | .21 | .98 |
Total from investment operations | .69 | .86 | .79 | .41 | 1.17 |
Distributions from net investment income | (.35) | (.02) | (.17) | (.18) | (.13) |
Distributions from net realized gain | (.05) | (.04) | (.06) | (.17) | (.04) |
Total distributions | (.41) E | (.05) F | (.23) | (.35) | (.17) |
Net asset value, end of period | $ 13.36 | $ 13.08 | $ 12.27 | $ 11.71 | $ 11.65 |
Total ReturnA | 5.36% | 7.05% | 6.80% | 3.64% | 11.08% |
Ratios to Average Net Assets C, D | | | | | |
Expenses before reductions | .15% | .15% | .15% | .15% | .08% |
Expenses net of fee waivers, if any | .08% | .09% | .10% | .09% | .05% |
Expenses net of all reductions | .08% | .09% | .10% | .09% | .05% |
Net investment income (loss) | 1.72% | 1.45% | 1.54% | 1.71% | 1.68% |
Supplemental Data | | | | | |
Net assets, end of period (000 omitted) | $ 480,861 | $ 430,767 | $ 364,853 | $ 238,158 | $ 144,278 |
Portfolio turnover rateD | 23% | 39% | 21% | 33% | 36% |
A Total returns would have been lower if certain expenses had not been reduced during the applicable periods shown.
B Calculated based on average shares outstanding during the period.
C Expense ratios reflect operating expenses of the Fund. Expenses before reductions do not reflect amounts reimbursed by the investment adviser or reductions from expense offset arrangements and do not represent the amount paid by the Fund during periods when reimbursements or reductions occur. Expenses net of fee waivers reflect expenses after reimbursement by the investment adviser but prior to reductions from expense offset arrangements. Expenses net of all reductions represent the net expenses paid by the Fund.
D Amounts do not include the activity of the Underlying Funds.
E Total distributions of $.41 per share is comprised of distributions from net investment income of $.353 and distributions from net realized gain of $.055 per share.
F Total distributions of $.05 per share is comprised of distributions from net investment income of $.017 and distributions from net realized gain of $.035 per share.
See accompanying notes which are an integral part of the financial statements.
Annual Report
Fidelity Freedom Index 2015 Fund
Investment Changes (Unaudited)
The information in the following tables is based on the direct investments of the Fund. |
Fund Holdings as of March 31, 2015 |
| % of fund's
net assets | % of fund's net assets
6 months ago |
Domestic Equity Funds | | |
Spartan Total Market Index Fund Class F | 37.3 | 37.9 |
Commodity Funds | | |
Fidelity Series Commodity Strategy Fund Class F | 1.1 | 1.1 |
International Equity Funds | | |
Fidelity Series Global ex U.S. Index Fund | 16.6 | 16.7 |
Bond Funds | | |
Spartan U.S. Bond Index Fund Class F | 31.3 | 31.0 |
Inflation-Protected Bond Funds | | |
Fidelity Series Inflation-Protected Bond Index Fund Class F | 3.0 | 2.9 |
Short-Term Funds | | |
Fidelity Institutional Money Market Portfolio Class F | 10.7 | 10.4 |
Net Other Assets (Liabilities)* | 0.0 | 0.0 |
| 100.0 | 100.0 |
* Amount represents less than 0.1%
Asset Allocation (% of fund's net assets) |
Period end |
 | Domestic Equity Funds | 37.3% | |
 | Commodity Funds | 1.1% | |
 | International Equity Funds | 16.6% | |
 | Bond Funds | 31.3% | |
 | Inflation-Protected Bond Funds | 3.0% | |
 | Short-Term Funds | 10.7% | |

Six months ago |
 | Domestic Equity Funds | 37.9% | |
 | Commodity Funds | 1.1% | |
 | International Equity Funds | 16.7% | |
 | Bond Funds | 31.0% | |
 | Inflation-Protected Bond Funds | 2.9% | |
 | Short-Term Funds | 10.4% | |

Annual Report
Fidelity Freedom Index 2015 Fund
Investments March 31, 2015
Showing Percentage of Net Assets
Domestic Equity Funds - 37.3% |
| Shares | | Value |
Spartan Total Market Index Fund Class F (c)
(Cost $220,600,731) | 5,580,862 | | $ 340,209,373 |
Commodity Funds - 1.1% |
| | | |
Fidelity Series Commodity Strategy Fund Class F (a)(c)
(Cost $12,946,386) | 1,652,003 | |
10,192,857
|
International Equity Funds - 16.6% |
| | | |
Fidelity Series Global ex U.S. Index Fund (c)
(Cost $138,584,333) | 12,807,959 | |
151,133,912
|
Bond Funds - 31.3% |
| | | |
Spartan U.S. Bond Index Fund Class F (c)
(Cost $278,650,401) | 24,034,763 | |
284,811,941
|
Inflation-Protected Bond Funds - 3.0% |
| | | |
Fidelity Series Inflation-Protected Bond Index Fund Class F (c)
(Cost $29,224,532) | 2,792,647 | |
27,256,240
|
Short-Term Funds - 10.7% |
| Shares | | Value |
Fidelity Institutional Money Market Portfolio Class F 0.14% (b)(c)
(Cost $97,245,743) | 97,245,743 | | $ 97,245,743 |
TOTAL INVESTMENT
PORTFOLIO - 100.0% (Cost $777,252,126) | | 910,850,066 |
NET OTHER ASSETS (LIABILITIES) - 0.0% | | (49,148) |
NET ASSETS - 100% | $ 910,800,918 |
Legend |
(a) Non-income producing |
(b) The rate quoted is the annualized seven-day yield of the fund at period end. |
(c) Affiliated Fund |
Affiliated Underlying Funds |
Information regarding the Fund's fiscal year to date purchases and sales of the affiliated Underlying Funds and income earned by the Fund from investments in affiliated Underlying Funds is as follows: |
Affiliate | Value,
beginning of
period | Purchases | Sales
Proceeds | Dividend
Income | Value,
end of
period |
Fidelity Institutional Money Market Portfolio Class F | $ 82,337,568 | $ 27,047,306 | $ 12,139,132 | $ 85,940 | $ 97,245,743 |
Fidelity Series Commodity Strategy Fund Class F | 10,536,660 | 4,038,460 | 1,232,546 | - | 10,192,857 |
Fidelity Series Global ex U.S. Index Fund | 140,043,903 | 38,505,204 | 21,834,977 | 4,283,312 | 151,133,912 |
Fidelity Series Inflation-Protected Bond Index Fund Class F | 23,095,716 | 7,574,763 | 3,109,295 | 72,830 | 27,256,240 |
Spartan Total Market Index Fund Class F | 317,553,360 | 69,891,253 | 80,874,854 | 5,509,241 | 340,209,373 |
Spartan U.S. Bond Index Fund Class F | 255,197,485 | 69,632,336 | 48,089,460 | 6,888,758 | 284,811,941 |
Total | $ 828,764,692 | $ 216,689,322 | $ 167,280,264 | $ 16,840,081 | $ 910,850,066 |
Other Information |
All investments are categorized as Level 1 under the Fair Value Hierarchy. The inputs or methodology used for valuing securities may not be an indication of the risk associated with investing in those securities. For more information on valuation inputs, please refer to the Investment Valuation section in the accompanying Notes to Financial Statements. |
See accompanying notes which are an integral part of the financial statements.
Annual Report
Fidelity Freedom Index 2015 Fund
Statement of Assets and Liabilities
| March 31, 2015 |
| | |
Assets | | |
Investment in securities, at value (cost $777,252,126) - See accompanying schedule | | $ 910,850,066 |
Cash | | 2 |
Receivable for investments sold | | 1,110,252 |
Receivable for fund shares sold | | 2,957,068 |
Receivable from affiliate for expense reductions | | 54,892 |
Total assets | | 914,972,280 |
| | |
Liabilities | | |
Payable for investments purchased | $ 3,058,083 | |
Payable for fund shares redeemed | 999,866 | |
Transfer agent fees payable | 113,413 | |
Total liabilities | | 4,171,362 |
| | |
Net Assets | | $ 910,800,918 |
Net Assets consist of: | | |
Paid in capital | | $ 784,553,064 |
Undistributed net investment income | | 1,583,721 |
Accumulated undistributed net realized gain (loss) on investments | | (8,933,807) |
Net unrealized appreciation (depreciation) on investments | | 133,597,940 |
Net Assets, for 66,875,822 shares outstanding | | $ 910,800,918 |
Net Asset Value, offering price and redemption price per share ($910,800,918 ÷ 66,875,822 shares) | | $ 13.62 |
Statement of Operations
| Year ended March 31, 2015 |
| | |
Investment Income | | |
Income distributions from underlying funds | | $ 16,840,081 |
| | |
Expenses | | |
Transfer agent fees | $ 1,306,231 | |
Independent trustees' compensation | 3,731 | |
Total expenses before reductions | 1,309,962 | |
Expense reductions | (631,870) | 678,092 |
Net investment income (loss) | | 16,161,989 |
Realized and Unrealized Gain (Loss) Realized gain (loss) on sale of underlying fund shares | 2,274,604 | |
Capital gain distributions from underlying funds | 708,980 | |
Total net realized gain (loss) | | 2,983,584 |
Change in net unrealized appreciation (depreciation) on investment securities | | 30,401,705 |
Net gain (loss) | | 33,385,289 |
Net increase (decrease) in net assets resulting from operations | | $ 49,547,278 |
See accompanying notes which are an integral part of the financial statements.
Annual Report
Fidelity Freedom Index 2015 Fund
Financial Statements - continued
Statement of Changes in Net Assets
| Year ended
March 31,
2015 | Year ended
March 31,
2014 |
Increase (Decrease) in Net Assets | | |
Operations | | |
Net investment income (loss) | $ 16,161,989 | $ 11,925,345 |
Net realized gain (loss) | 2,983,584 | (5,999,147) |
Change in net unrealized appreciation (depreciation) | 30,401,705 | 53,693,693 |
Net increase (decrease) in net assets resulting from operations | 49,547,278 | 59,619,891 |
Distributions to shareholders from net investment income | (26,437,104) | (866,325) |
Distributions to shareholders from net realized gain | (3,310,019) | (920,469) |
Total distributions | (29,747,123) | (1,786,794) |
Share transactions
Proceeds from sales of shares | 317,662,725 | 322,845,321 |
Reinvestment of distributions | 29,743,322 | 1,786,794 |
Cost of shares redeemed | (285,126,876) | (226,019,959) |
Net increase (decrease) in net assets resulting from share transactions | 62,279,171 | 98,612,156 |
Total increase (decrease) in net assets | 82,079,326 | 156,445,253 |
| | |
Net Assets | | |
Beginning of period | 828,721,592 | 672,276,339 |
End of period (including distributions in excess of net investment income of $1,583,721 and undistributed net investment income of $11,916,385, respectively) | $ 910,800,918 | $ 828,721,592 |
Other Information Shares | | |
Sold | 23,586,465 | 25,550,569 |
Issued in reinvestment of distributions | 2,234,721 | 142,261 |
Redeemed | (21,200,909) | (17,696,183) |
Net increase (decrease) | 4,620,277 | 7,996,647 |
Financial Highlights
Years ended March 31, | 2015 | 2014 | 2013 | 2012 | 2011 |
Selected Per-Share Data | | | | | |
Net asset value, beginning of period | $ 13.31 | $ 12.39 | $ 11.80 | $ 11.71 | $ 10.67 |
Income from Investment Operations | | | | | |
Net investment income (loss) B | .25 | .20 | .19 | .20 | .20 |
Net realized and unrealized gain (loss) | .52 | .75 | .63 | .22 | 1.00 |
Total from investment operations | .77 | .95 | .82 | .42 | 1.20 |
Distributions from net investment income | (.41) | (.02) | (.18) | (.17) | (.12) |
Distributions from net realized gain | (.05) | (.02) | (.05) | (.15) | (.04) |
Total distributions | (.46) | (.03) D | (.23) | (.33) E | (.16) |
Net asset value, end of period | $ 13.62 | $ 13.31 | $ 12.39 | $ 11.80 | $ 11.71 |
Total ReturnA | 5.87% | 7.71% | 7.02% | 3.70% | 11.29% |
Ratios to Average Net Assets C, F | | | | | |
Expenses before reductions | .15% | .15% | .15% | .15% | .09% |
Expenses net of fee waivers, if any | .08% | .09% | .10% | .09% | .06% |
Expenses net of all reductions | .08% | .09% | .10% | .09% | .06% |
Net investment income (loss) | 1.86% | 1.56% | 1.58% | 1.76% | 1.78% |
Supplemental Data | | | | | |
Net assets, end of period (000 omitted) | $ 910,801 | $ 828,722 | $ 672,276 | $ 412,376 | $ 220,552 |
Portfolio turnover rate F | 19% | 29% | 14% | 23% | 19% |
A Total returns would have been lower if certain expenses had not been reduced during the applicable periods shown.
B Calculated based on average shares outstanding during the period.
C Expense ratios reflect operating expenses of the Fund. Expenses before reductions do not reflect amounts reimbursed by the investment adviser or reductions from expense offset arrangements and do not represent the amount paid by the Fund during periods when reimbursements or reductions occur. Expenses net of fee waivers reflect expenses after reimbursement by the investment adviser but prior to reductions from expense offset arrangements. Expenses net of all reductions represent the net expenses paid by the Fund.
D Total distributions of $.03 per share is comprised of distributions from net investment income of $.016 and distributions from net realized gain of $.017 per share.
E Total distributions of $.33 per share is comprised of distributions from net investment income of $.174 and distributions from net realized gain of $.151 per share.
F Amounts do not include the activity of the Underlying Funds.
See accompanying notes which are an integral part of the financial statements.
Annual Report
Fidelity Freedom Index 2020 Fund
Investment Changes (Unaudited)
The information in the following tables is based on the direct investments of the Fund. |
Fund Holdings as of March 31, 2015 |
| % of fund's
net assets | % of fund's net assets
6 months ago |
Domestic Equity Funds | | |
Spartan Total Market Index Fund Class F | 41.3 | 41.9 |
Commodity Funds | | |
Fidelity Series Commodity Strategy Fund Class F | 1.2 | 1.2 |
International Equity Funds | | |
Fidelity Series Global ex U.S. Index Fund | 18.4 | 18.5 |
Bond Funds | | |
Spartan U.S. Bond Index Fund Class F | 29.7 | 29.4 |
Inflation-Protected Bond Funds | | |
Fidelity Series Inflation-Protected Bond Index Fund Class F | 2.2 | 2.1 |
Short-Term Funds | | |
Fidelity Institutional Money Market Portfolio Class F | 7.2 | 6.9 |
Net Other Assets (Liabilities)* | 0.0 | 0.0 |
| 100.0 | 100.0 |
* Amount represents less than 0.1%
Asset Allocation (% of fund's net assets) |
Period end |
 | Domestic Equity Funds | 41.3% | |
 | Commodity Funds | 1.2% | |
 | International Equity Funds | 18.4% | |
 | Bond Funds | 29.7% | |
 | Inflation-Protected Bond Funds | 2.2% | |
 | Short-Term Funds | 7.2% | |

Six months ago |
 | Domestic Equity Funds | 41.9% | |
 | Commodity Funds | 1.2% | |
 | International Equity Funds | 18.5% | |
 | Bond Funds | 29.4% | |
 | Inflation-Protected Bond Funds | 2.1% | |
 | Short-Term Funds | 6.9% | |

Annual Report
Fidelity Freedom Index 2020 Fund
Investments March 31, 2015
Showing Percentage of Net Assets
Domestic Equity Funds - 41.3% |
| Shares | | Value |
Spartan Total Market Index Fund Class F (c)
(Cost $714,318,181) | 16,667,127 | | $ 1,016,028,091 |
Commodity Funds - 1.2% |
| | | |
Fidelity Series Commodity Strategy Fund Class F (a)(c)
(Cost $37,180,714) | 4,764,617 | |
29,397,689
|
International Equity Funds - 18.4% |
| | | |
Fidelity Series Global ex U.S. Index Fund (c)
(Cost $422,151,892) | 38,228,268 | |
451,093,557
|
Bond Funds - 29.7% |
| | | |
Spartan U.S. Bond Index Fund Class F (c)
(Cost $715,668,302) | 61,612,148 | |
730,103,959
|
Inflation-Protected Bond Funds - 2.2% |
| | | |
Fidelity Series Inflation-Protected Bond Index Fund Class F (c)
(Cost $57,121,933) | 5,483,909 | |
53,522,953
|
Short-Term Funds - 7.2% |
| Shares | | Value |
Fidelity Institutional Money Market Portfolio Class F 0.14% (b)(c)
(Cost $178,071,493) | 178,071,493 | | $ 178,071,493 |
TOTAL INVESTMENT
PORTFOLIO - 100.0% (Cost $2,124,512,515) | | 2,458,217,742 |
NET OTHER ASSETS (LIABILITIES) - 0.0% | | (157,150) |
NET ASSETS - 100% | $ 2,458,060,592 |
Legend |
(a) Non-income producing |
(b) The rate quoted is the annualized seven-day yield of the fund at period end. |
(c) Affiliated Fund |
Affiliated Underlying Funds |
Information regarding the Fund's fiscal year to date purchases and sales of the affiliated Underlying Funds and income earned by the Fund from investments in affiliated Underlying Funds is as follows: |
Affiliate | Value,
beginning of
period | Purchases | Sales
Proceeds | Dividend
Income | Value,
end of
period |
Fidelity Institutional Money Market Portfolio Class F | $ 130,902,811 | $ 60,419,673 | $ 13,250,991 | $ 145,139 | $ 178,071,493 |
Fidelity Series Commodity Strategy Fund Class F | 26,035,113 | 14,079,950 | 2,314,782 | - | 29,397,689 |
Fidelity Series Global ex U.S. Index Fund | 374,673,788 | 134,902,040 | 44,888,345 | 11,620,022 | 451,093,557 |
Fidelity Series Inflation-Protected Bond Index Fund Class F | 39,870,441 | 18,006,036 | 3,858,414 | 131,105 | 53,522,953 |
Spartan Total Market Index Fund Class F | 851,805,895 | 254,838,744 | 182,899,854 | 14,899,955 | 1,016,028,091 |
Spartan U.S. Bond Index Fund Class F | 587,591,013 | 216,543,978 | 93,615,105 | 16,406,122 | 730,103,959 |
Total | $ 2,010,879,061 | $ 698,790,421 | $ 340,827,491 | $ 43,202,343 | $ 2,458,217,742 |
Other Information |
All investments are categorized as Level 1 under the Fair Value Hierarchy. The inputs or methodology used for valuing securities may not be an indication of the risk associated with investing in those securities. For more information on valuation inputs, please refer to the Investment Valuation section in the accompanying Notes to Financial Statements. |
See accompanying notes which are an integral part of the financial statements.
Annual Report
Fidelity Freedom Index 2020 Fund
Statement of Assets and Liabilities
| March 31, 2015 |
| | |
Assets | | |
Investment in securities, at value (cost $2,124,512,515) - See accompanying schedule | | $ 2,458,217,742 |
Cash | | 2 |
Receivable for investments sold | | 4,758,793 |
Receivable for fund shares sold | | 2,381,720 |
Receivable from affiliate for expense reductions | | 146,253 |
Total assets | | 2,465,504,510 |
| | |
Liabilities | | |
Payable for investments purchased | $ 4,860,411 | |
Payable for fund shares redeemed | 2,277,795 | |
Transfer agent fees payable | 305,712 | |
Total liabilities | | 7,443,918 |
| | |
Net Assets | | $ 2,458,060,592 |
Net Assets consist of: | | |
Paid in capital | | $ 2,144,455,975 |
Undistributed net investment income | | 3,823,128 |
Accumulated undistributed net realized gain (loss) on investments | | (23,923,738) |
Net unrealized appreciation (depreciation) on investments | | 333,705,227 |
Net Assets, for 174,287,557 shares outstanding | | $ 2,458,060,592 |
Net Asset Value, offering price and redemption price per share ($2,458,060,592 ÷ 174,287,557 shares) | | $ 14.10 |
Statement of Operations
| Year ended March 31, 2015 |
| | |
Investment Income | | |
Income distributions from underlying funds | | $ 43,202,343 |
| | |
Expenses | | |
Transfer agent fees | $ 3,279,355 | |
Independent trustees' compensation | 9,249 | |
Total expenses before reductions | 3,288,604 | |
Expense reductions | (1,537,688) | 1,750,916 |
Net investment income (loss) | | 41,451,427 |
Realized and Unrealized Gain (Loss) Realized gain (loss) on sale of underlying fund shares | 3,728,477 | |
Capital gain distributions from underlying funds | 1,423,234 | |
Total net realized gain (loss) | | 5,151,711 |
Change in net unrealized appreciation (depreciation) on investment securities | | 85,647,273 |
Net gain (loss) | | 90,798,984 |
Net increase (decrease) in net assets resulting from operations | | $ 132,250,411 |
See accompanying notes which are an integral part of the financial statements.
Annual Report
Statement of Changes in Net Assets
| Year ended
March 31,
2015 | Year ended
March 31,
2014 |
Increase (Decrease) in Net Assets | | |
Operations | | |
Net investment income (loss) | $ 41,451,427 | $ 28,437,907 |
Net realized gain (loss) | 5,151,711 | (17,072,508) |
Change in net unrealized appreciation (depreciation) | 85,647,273 | 134,224,852 |
Net increase (decrease) in net assets resulting from operations | 132,250,411 | 145,590,251 |
Distributions to shareholders from net investment income | (65,898,256) | (1,966,160) |
Distributions to shareholders from net realized gain | (6,253,111) | (1,619,190) |
Total distributions | (72,151,367) | (3,585,350) |
Share transactions
Proceeds from sales of shares | 873,744,245 | 797,855,180 |
Reinvestment of distributions | 72,149,473 | 3,585,350 |
Cost of shares redeemed | (558,701,334) | (363,510,831) |
Net increase (decrease) in net assets resulting from share transactions | 387,192,384 | 437,929,699 |
Total increase (decrease) in net assets | 447,291,428 | 579,934,600 |
| | |
Net Assets | | |
Beginning of period | 2,010,769,164 | 1,430,834,564 |
End of period (including undistributed net investment income of $3,823,128 and undistributed net investment income of $28,325,351, respectively) | $ 2,458,060,592 | $ 2,010,769,164 |
Other Information Shares | | |
Sold | 62,615,778 | 61,136,146 |
Issued in reinvestment of distributions | 5,241,833 | 278,582 |
Redeemed | (40,115,166) | (27,794,835) |
Net increase (decrease) | 27,742,445 | 33,619,893 |
Financial Highlights
Years ended March 31, | 2015 | 2014 | 2013 | 2012 | 2011 |
Selected Per-Share Data | | | | | |
Net asset value, beginning of period | $ 13.72 | $ 12.67 | $ 12.03 | $ 12.00 | $ 10.81 |
Income from Investment Operations | | | | | |
Net investment income (loss) B | .26 | .22 | .20 | .22 | .21 |
Net realized and unrealized gain (loss) | .57 | .86 | .68 | .16 | 1.15 |
Total from investment operations | .83 | 1.08 | .88 | .38 | 1.36 |
Distributions from net investment income | (.41) | (.02) | (.19) | (.19) | (.14) |
Distributions from net realized gain | (.04) | (.01) | (.05) | (.16) | (.04) |
Total distributions | (.45) | (.03) | (.24) | (.35) | (.17) E |
Net asset value, end of period | $ 14.10 | $ 13.72 | $ 12.67 | $ 12.03 | $ 12.00 |
Total ReturnA | 6.18% | 8.55% | 7.38% | 3.36% | 12.67% |
Ratios to Average Net Assets C, D | | | | | |
Expenses before reductions | .15% | .15% | .15% | .15% | .08% |
Expenses net of fee waivers, if any | .08% | .09% | .10% | .09% | .05% |
Expenses net of all reductions | .08% | .09% | .10% | .09% | .05% |
Net investment income (loss) | 1.90% | 1.66% | 1.68% | 1.85% | 1.82% |
Supplemental Data | | | | | |
Net assets, end of period (000 omitted) | $ 2,458,061 | $ 2,010,769 | $ 1,430,835 | $ 812,369 | $ 424,846 |
Portfolio turnover rateD | 16% | 25% | 11% | 20% | 21% |
A Total returns would have been lower if certain expenses had not been reduced during the applicable periods shown.
B Calculated based on average shares outstanding during the period.
C Expense ratios reflect operating expenses of the Fund. Expenses before reductions do not reflect amounts reimbursed by the investment adviser or reductions from expense offset arrangements and do not represent the amount paid by the Fund during periods when reimbursements or reductions occur. Expenses net of fee waivers reflect expenses after reimbursement by the investment adviser but prior to reductions from expense offset arrangements. Expenses net of all reductions represent the net expenses paid by the Fund.
D Amounts do not include the portfolio activity of the Underlying Funds.
E Total distributions of $.17 per share is comprised of distributions from net investment income of $.135 and distributions from net realized gain of $.037 per share.
See accompanying notes which are an integral part of the financial statements.
Annual Report
Fidelity Freedom Index 2025 Fund
Investment Changes (Unaudited)
The information in the following tables is based on the direct investments of the Fund. |
Fund Holdings as of March 31, 2015 |
| % of fund's
net assets | % of fund's net assets
6 months ago |
Domestic Equity Funds | | |
Spartan Total Market Index Fund Class F | 47.2 | 48.3 |
Commodity Funds | | |
Fidelity Series Commodity Strategy Fund Class F | 1.2 | 1.3 |
International Equity Funds | | |
Fidelity Series Global ex U.S. Index Fund | 20.9 | 21.3 |
Bond Funds | | |
Spartan U.S. Bond Index Fund Class F | 27.0 | 26.4 |
Inflation-Protected Bond Funds | | |
Fidelity Series Inflation-Protected Bond Index Fund Class F | 1.4 | 1.3 |
Short-Term Funds | | |
Fidelity Institutional Money Market Portfolio Class F | 2.3 | 1.4 |
Net Other Assets (Liabilities)* | 0.0 | 0.0 |
| 100.0 | 100.0 |
* Amount represents less than 0.1%
Asset Allocation (% of fund's net assets) |
Period end |
 | Domestic Equity Funds | 47.2% | |
 | Commodity Funds | 1.2% | |
 | International Equity Funds | 20.9% | |
 | Bond Funds | 27.0% | |
 | Inflation-Protected Bond Funds | 1.4% | |
 | Short-Term Funds | 2.3% | |

Six months ago |
 | Domestic Equity Funds | 48.3% | |
 | Commodity Funds | 1.3% | |
 | International Equity Funds | 21.3% | |
 | Bond Funds | 26.4% | |
 | Inflation-Protected Bond Funds | 1.3% | |
 | Short-Term Funds | 1.4% | |

Annual Report
Fidelity Freedom Index 2025 Fund
Investments March 31, 2015
Showing Percentage of Net Assets
Domestic Equity Funds - 47.2% |
| Shares | | Value |
Spartan Total Market Index Fund Class F (c)
(Cost $571,181,069) | 13,350,539 | | $ 813,848,831 |
Commodity Funds - 1.2% |
| | | |
Fidelity Series Commodity Strategy Fund Class F (a)(c)
(Cost $27,131,649) | 3,500,135 | |
21,595,836
|
International Equity Funds - 20.9% |
| | | |
Fidelity Series Global ex U.S. Index Fund (c)
(Cost $337,350,342) | 30,526,901 | |
360,217,432
|
Bond Funds - 27.0% |
| | | |
Spartan U.S. Bond Index Fund Class F (c)
(Cost $457,400,090) | 39,310,533 | |
465,829,814
|
Inflation-Protected Bond Funds - 1.4% |
| | | |
Fidelity Series Inflation-Protected Bond Index Fund Class F (c)
(Cost $25,087,711) | 2,404,427 | |
23,467,212
|
Short-Term Funds - 2.3% |
| Shares | | Value |
Fidelity Institutional Money Market Portfolio Class F 0.14% (b)(c)
(Cost $39,095,330) | 39,095,330 | | $ 39,095,330 |
TOTAL INVESTMENT
PORTFOLIO - 100.0% (Cost $1,457,246,191) | | 1,724,054,455 |
NET OTHER ASSETS (LIABILITIES) - 0.0% | | (111,869) |
NET ASSETS - 100% | $ 1,723,942,586 |
Legend |
(a) Non-income producing |
(b) The rate quoted is the annualized seven-day yield of the fund at period end. |
(c) Affiliated Fund |
Affiliated Underlying Funds |
Information regarding the Fund's fiscal year to date purchases and sales of the affiliated Underlying Funds and income earned by the Fund from investments in affiliated Underlying Funds is as follows: |
Affiliate | Value,
beginning of
period | Purchases | Sales
Proceeds | Dividend
Income | Value,
end of
period |
Fidelity Institutional Money Market Portfolio Class F | $ 8,889,754 | $ 31,042,260 | $ 836,683 | $ 21,372 | $ 39,095,330 |
Fidelity Series Commodity Strategy Fund Class F | 18,080,775 | 10,478,648 | 799,909 | - | 21,595,836 |
Fidelity Series Global ex U.S. Index Fund | 292,431,042 | 112,392,069 | 32,760,133 | 9,462,235 | 360,217,432 |
Fidelity Series Inflation-Protected Bond Index Fund Class F | 15,943,970 | 8,619,271 | 838,575 | 55,330 | 23,467,212 |
Spartan Total Market Index Fund Class F | 666,715,286 | 217,673,132 | 144,267,344 | 12,114,725 | 813,848,831 |
Spartan U.S. Bond Index Fund Class F | 346,002,325 | 155,493,872 | 47,509,054 | 10,134,029 | 465,829,814 |
Total | $ 1,348,063,152 | $ 535,699,252 | $ 227,011,698 | $ 31,787,691 | $ 1,724,054,455 |
Other Information |
All investments are categorized as Level 1 under the Fair Value Hierarchy. The inputs or methodology used for valuing securities may not be an indication of the risk associated with investing in those securities. For more information on valuation inputs, please refer to the Investment Valuation section in the accompanying Notes to Financial Statements. |
See accompanying notes which are an integral part of the financial statements.
Annual Report
Fidelity Freedom Index 2025 Fund
Statement of Assets and Liabilities
| March 31, 2015 |
| | |
Assets | | |
Investment in securities, at value (cost $1,457,246,191) - See accompanying schedule | | $ 1,724,054,455 |
Cash | | 2 |
Receivable for investments sold | | 5,050,848 |
Receivable for fund shares sold | | 2,048,053 |
Receivable from affiliate for expense reductions | | 100,112 |
Total assets | | 1,731,253,470 |
| | |
Liabilities | | |
Payable for investments purchased | $ 5,854,789 | |
Payable for fund shares redeemed | 1,242,303 | |
Transfer agent fees payable | 213,792 | |
Total liabilities | | 7,310,884 |
| | |
Net Assets | | $ 1,723,942,586 |
Net Assets consist of: | | |
Paid in capital | | $ 1,475,307,466 |
Undistributed net investment income | | 1,398,870 |
Accumulated undistributed net realized gain (loss) on investments | | (19,572,014) |
Net unrealized appreciation (depreciation) on investments | | 266,808,264 |
Net Assets, for 116,490,251 shares outstanding | | $ 1,723,942,586 |
Net Asset Value, offering price and redemption price per share ($1,723,942,586 ÷ 116,490,251 shares) | | $ 14.80 |
Statement of Operations
| Year ended March 31, 2015 |
| | |
Investment Income | | |
Income distributions from underlying funds | | $ 31,787,691 |
| | |
Expenses | | |
Transfer agent fees | $ 2,265,098 | |
Independent trustees' compensation | 6,362 | |
Total expenses before reductions | 2,271,460 | |
Expense reductions | (1,029,624) | 1,241,836 |
Net investment income (loss) | | 30,545,855 |
Realized and Unrealized Gain (Loss) Realized gain (loss) on sale of underlying fund shares | 366,114 | |
Capital gain distributions from underlying funds | 775,543 | |
Total net realized gain (loss) | | 1,141,657 |
Change in net unrealized appreciation (depreciation) on investment securities | | 66,937,634 |
Net gain (loss) | | 68,079,291 |
Net increase (decrease) in net assets resulting from operations | | $ 98,625,146 |
See accompanying notes which are an integral part of the financial statements.
Annual Report
Fidelity Freedom Index 2025 Fund
Financial Statements - continued
Statement of Changes in Net Assets
| Year ended
March 31,
2015 | Year ended
March 31,
2014 |
Increase (Decrease) in Net Assets | | |
Operations | | |
Net investment income (loss) | $ 30,545,855 | $ 20,678,304 |
Net realized gain (loss) | 1,141,657 | (13,968,643) |
Change in net unrealized appreciation (depreciation) | 66,937,634 | 116,422,139 |
Net increase (decrease) in net assets resulting from operations | 98,625,146 | 123,131,800 |
Distributions to shareholders from net investment income | (49,810,335) | (1,061,767) |
Distributions to shareholders from net realized gain | (2,839,047) | (758,380) |
Total distributions | (52,649,382) | (1,820,147) |
Share transactions
Proceeds from sales of shares | 613,985,377 | 451,158,524 |
Reinvestment of distributions | 52,645,983 | 1,820,147 |
Cost of shares redeemed | (336,656,079) | (195,694,024) |
Net increase (decrease) in net assets resulting from share transactions | 329,975,281 | 257,284,647 |
Total increase (decrease) in net assets | 375,951,045 | 378,596,300 |
| | |
Net Assets | | |
Beginning of period | 1,347,991,541 | 969,395,241 |
End of period (including undistributed net investment income of $1,398,870 and undistributed net investment income of $20,663,349, respectively) | $ 1,723,942,586 | $ 1,347,991,541 |
Other Information Shares | | |
Sold | 42,032,704 | 33,398,610 |
Issued in reinvestment of distributions | 3,647,656 | 137,266 |
Redeemed | (23,082,044) | (14,282,440) |
Net increase (decrease) | 22,598,316 | 19,253,436 |
Financial Highlights
Years ended March 31, | 2015 | 2014 | 2013 | 2012 | 2011 |
Selected Per-Share Data | | | | | |
Net asset value, beginning of period | $ 14.36 | $ 12.99 | $ 12.21 | $ 12.22 | $ 10.88 |
Income from Investment Operations | | | | | |
Net investment income (loss) B | .30 | .24 | .22 | .23 | .22 |
Net realized and unrealized gain (loss) | .65 | 1.15 | .80 | .11 | 1.30 |
Total from investment operations | .95 | 1.39 | 1.02 | .34 | 1.52 |
Distributions from net investment income | (.48) F | (.01) | (.21) | (.19) | (.15) |
Distributions from net realized gain | (.03) F | (.01) | (.04) | (.16) | (.03) |
Total distributions | (.51) | (.02) | (.24) E | (.35) | (.18) |
Net asset value, end of period | $ 14.80 | $ 14.36 | $ 12.99 | $ 12.21 | $ 12.22 |
Total ReturnA | 6.73% | 10.75% | 8.50% | 3.03% | 14.03% |
Ratios to Average Net Assets C, D | | | | | |
Expenses before reductions | .15% | .15% | .15% | .15% | .09% |
Expenses net of fee waivers, if any | .08% | .09% | .10% | .09% | .05% |
Expenses net of all reductions | .08% | .09% | .10% | .09% | .05% |
Net investment income (loss) | 2.03% | 1.78% | 1.82% | 1.97% | 1.91% |
Supplemental Data | | | | | |
Net assets, end of period (000 omitted) | $ 1,723,943 | $ 1,347,992 | $ 969,395 | $ 537,405 | $ 249,606 |
Portfolio turnover rateD | 15% | 21% | 10% | 18% | 18% |
A Total returns would have been lower if certain expenses had not been reduced during the applicable periods shown.
B Calculated based on average shares outstanding during the period.
C Expense ratios reflect operating expenses of the Fund. Expenses before reductions do not reflect amounts reimbursed by the investment adviser or reductions from expense offset arrangements and do not represent the amount paid by the Fund during periods when reimbursements or reductions occur. Expenses net of fee waivers reflect expenses after reimbursement by the investment adviser but prior to reductions from expense offset arrangements. Expenses net of all reductions represent the net expenses paid by the Fund.
D Amounts do not include the portfolio activity of the Underlying Funds.
E Total distributions of $.24 per share is comprised of distributions from net investment income of $.205 and distributions from net realized gain of $.038 per share.
F The amount shown reflects certain reclassifications related to book to tax differences
See accompanying notes which are an integral part of the financial statements.
Annual Report
Fidelity Freedom Index 2030 Fund
Investment Changes (Unaudited)
The information in the following tables is based on the direct investments of the Fund. |
Fund Holdings as of March 31, 2015 |
| % of fund's
net assets | % of fund's net assets
6 months ago |
Domestic Equity Funds | | |
Spartan Total Market Index Fund Class F | 56.7 | 57.6 |
Commodity Funds | | |
Fidelity Series Commodity Strategy Fund Class F | 1.3 | 1.3 |
International Equity Funds | | |
Fidelity Series Global ex U.S. Index Fund | 25.0 | 25.2 |
Bond Funds | | |
Spartan U.S. Bond Index Fund Class F | 16.5 | 15.4 |
Inflation-Protected Bond Funds | | |
Fidelity Series Inflation-Protected Bond Index Fund Class F | 0.5 | 0.5 |
Net Other Assets (Liabilities)* | 0.0 | 0.0 |
| 100.0 | 100.0 |
* Amount represents less than 0.1%
Asset Allocation (% of fund's net assets) |
Period end |
 | Domestic Equity Funds | 56.7% | |
 | Commodity Funds | 1.3% | |
 | International Equity Funds | 25.0% | |
 | Bond Funds | 16.5% | |
 | Inflation-Protected Bond Funds | 0.5% | |

Six months ago |
 | Domestic Equity Funds | 57.6% | |
 | Commodity Funds | 1.3% | |
 | International Equity Funds | 25.2% | |
 | Bond Funds | 15.4% | |
 | Inflation-Protected Bond Funds | 0.5% | |

Annual Report
Fidelity Freedom Index 2030 Fund
Investments March 31, 2015
Showing Percentage of Net Assets
Domestic Equity Funds - 56.7% |
| Shares | | Value |
Spartan Total Market Index Fund Class F (b)
(Cost $924,020,124) | 20,686,214 | | $ 1,261,031,633 |
Commodity Funds - 1.3% |
| | | |
Fidelity Series Commodity Strategy Fund Class F (a)(b)
(Cost $35,780,599) | 4,634,761 | |
28,596,473
|
International Equity Funds - 25.0% |
| | | |
Fidelity Series Global ex U.S. Index Fund (b)
(Cost $527,368,440) | 47,155,275 | |
556,432,245
|
Bond Funds - 16.5% |
| | | |
Spartan U.S. Bond Index Fund Class F (b)
(Cost $358,664,767) | 30,930,037 | |
366,520,937
|
Inflation-Protected Bond Funds - 0.5% |
| Shares | | Value |
Fidelity Series Inflation-Protected Bond Index Fund Class F (b)
(Cost $12,954,488) | 1,253,455 | | $ 12,233,723 |
TOTAL INVESTMENT
PORTFOLIO - 100.0% (Cost $1,858,788,418) | | 2,224,815,011 |
NET OTHER ASSETS (LIABILITIES) - 0.0% | | (139,038) |
NET ASSETS - 100% | $ 2,224,675,973 |
Legend |
(a) Non-income producing |
(b) Affiliated Fund |
Affiliated Underlying Funds |
Information regarding the Fund's fiscal year to date purchases and sales of the affiliated Underlying Funds and income earned by the Fund from investments in affiliated Underlying Funds is as follows: |
Affiliate | Value,
beginning of
period | Purchases | Sales
Proceeds | Dividend
Income | Value,
end of
period |
Fidelity Series Commodity Strategy Fund Class F | $ 22,931,791 | $ 14,336,280 | $ 686,345 | $ - | $ 28,596,473 |
Fidelity Series Global ex U.S. Index Fund | 434,876,304 | 179,692,492 | 40,585,428 | 14,083,317 | 556,432,245 |
Fidelity Series Inflation-Protected Bond Index Fund Class F | 6,461,823 | 6,197,140 | 290,751 | 25,500 | 12,233,723 |
Spartan Total Market Index Fund Class F | 995,646,687 | 320,666,256 | 165,074,944 | 18,029,628 | 1,261,031,633 |
Spartan U.S. Bond Index Fund Class F | 244,386,298 | 136,256,402 | 22,984,512 | 7,523,405 | 366,520,937 |
Total | $ 1,704,302,903 | $ 657,148,570 | $ 229,621,980 | $ 39,661,850 | $ 2,224,815,011 |
Other Information |
All investments are categorized as Level 1 under the Fair Value Hierarchy. The inputs or methodology used for valuing securities may not be an indication of the risk associated with investing in those securities. For more information on valuation inputs, please refer to the Investment Valuation section in the accompanying Notes to Financial Statements. |
See accompanying notes which are an integral part of the financial statements.
Annual Report
Fidelity Freedom Index 2030 Fund
Statement of Assets and Liabilities
| March 31, 2015 |
| | |
Assets | | |
Investment in securities, at value (cost $1,858,788,418) - See accompanying schedule | | $ 2,224,815,011 |
Cash | | 1 |
Receivable for investments sold | | 4,418,296 |
Receivable for fund shares sold | | 2,581,211 |
Receivable from affiliate for expense reductions | | 135,440 |
Total assets | | 2,231,949,959 |
| | |
Liabilities | | |
Payable for investments purchased | $ 6,004,693 | |
Payable for fund shares redeemed | 993,142 | |
Transfer agent fees payable | 276,151 | |
Total liabilities | | 7,273,986 |
| | |
Net Assets | | $ 2,224,675,973 |
Net Assets consist of: | | |
Paid in capital | | $ 1,885,404,283 |
Undistributed net investment income | | 1,555,526 |
Accumulated undistributed net realized gain (loss) on investments | | (28,310,429) |
Net unrealized appreciation (depreciation) on investments | | 366,026,593 |
Net Assets, for 146,874,463 shares outstanding | | $ 2,224,675,973 |
Net Asset Value, offering price and redemption price per share ($2,224,675,973 ÷ 146,874,463 shares) | | $ 15.15 |
Statement of Operations
| Year ended March 31, 2015 |
| | |
Investment Income | | |
Income distributions from underlying funds | | $ 39,661,850 |
| | |
Expenses | | |
Transfer agent fees | $ 2,883,186 | |
Independent trustees' compensation | 8,078 | |
Total expenses before reductions | 2,891,264 | |
Expense reductions | (1,374,153) | 1,517,111 |
Net investment income (loss) | | 38,144,739 |
Realized and Unrealized Gain (Loss) Realized gain (loss) on sale of underlying fund shares | 392,974 | |
Capital gain distributions from underlying funds | 579,440 | |
Total net realized gain (loss) | | 972,414 |
Change in net unrealized appreciation (depreciation) on investment securities | | 92,592,543 |
Net gain (loss) | | 93,564,957 |
Net increase (decrease) in net assets resulting from operations | | $ 131,709,696 |
See accompanying notes which are an integral part of the financial statements.
Annual Report
Fidelity Freedom Index 2030 Fund
Financial Statements - continued
Statement of Changes in Net Assets
| Year ended
March 31,
2015 | Year ended
March 31,
2014 |
Increase (Decrease) in Net Assets | | |
Operations | | |
Net investment income (loss) | $ 38,144,739 | $ 26,545,430 |
Net realized gain (loss) | 972,414 | (22,179,059) |
Change in net unrealized appreciation (depreciation) | 92,592,543 | 161,261,819 |
Net increase (decrease) in net assets resulting from operations | 131,709,696 | 165,628,190 |
Distributions to shareholders from net investment income | (63,028,753) | (1,328,362) |
Distributions to shareholders from net realized gain | (1,972,532) | (853,947) |
Total distributions | (65,001,285) | (2,182,309) |
Share transactions
Proceeds from sales of shares | 761,647,137 | 614,655,308 |
Reinvestment of distributions | 65,000,525 | 2,182,309 |
Cost of shares redeemed | (372,896,016) | (279,111,846) |
Net increase (decrease) in net assets resulting from share transactions | 453,751,646 | 337,725,771 |
Total increase (decrease) in net assets | 520,460,057 | 501,171,652 |
| | |
Net Assets | | |
Beginning of period | 1,704,215,916 | 1,203,044,264 |
End of period (including undistributed net investment income of $1,555,526 and undistributed net investment income of $26,536,361, respectively) | $ 2,224,675,973 | $ 1,704,215,916 |
Other Information Shares | | |
Sold | 50,906,447 | 44,768,709 |
Issued in reinvestment of distributions | 4,408,075 | 163,837 |
Redeemed | (24,999,737) | (20,237,257) |
Net increase (decrease) | 30,314,785 | 24,695,289 |
Financial Highlights
Years ended March 31, | 2015 | 2014 | 2013 | 2012 | 2011 |
Selected Per-Share Data | | | | | |
Net asset value, beginning of period | $ 14.62 | $ 13.10 | $ 12.28 | $ 12.34 | $ 10.96 |
Income from Investment Operations | | | | | |
Net investment income (loss) B | .30 | .25 | .24 | .24 | .22 |
Net realized and unrealized gain (loss) | .73 | 1.29 | .83 | .07 | 1.34 |
Total from investment operations | 1.03 | 1.54 | 1.07 | .31 | 1.56 |
Distributions from net investment income | (.48) | (.01) | (.21) | (.20) | (.15) |
Distributions from net realized gain | (.02) | (.01) | (.03) | (.16) | (.03) |
Total distributions | (.50) | (.02) | (.25) F | (.37) E | (.18) |
Net asset value, end of period | $ 15.15 | $ 14.62 | $ 13.10 | $ 12.28 | $ 12.34 |
Total ReturnA | 7.16% | 11.80% | 8.80% | 2.70% | 14.27% |
Ratios to Average Net Assets C, D | | | | | |
Expenses before reductions | .15% | .15% | .15% | .15% | .08% |
Expenses net of fee waivers, if any | .08% | .08% | .10% | .09% | .05% |
Expenses net of all reductions | .08% | .08% | .10% | .09% | .05% |
Net investment income (loss) | 1.99% | 1.84% | 1.90% | 1.99% | 1.90% |
Supplemental Data | | | | | |
Net assets, end of period (000 omitted) | $ 2,224,676 | $ 1,704,216 | $ 1,203,044 | $ 653,920 | $ 317,352 |
Portfolio turnover rateD | 12% | 32% | 10% | 18% | 16% |
A Total returns would have been lower if certain expenses had not been reduced during the applicable periods shown.
B Calculated based on average shares outstanding during the period.
C Expense ratios reflect operating expenses of the Fund. Expenses before reductions do not reflect amounts reimbursed by the investment adviser or reductions from expense offset arrangements and do not represent the amount paid by the Fund during periods when reimbursements or reductions occur. Expenses net of fee waivers reflect expenses after reimbursement by the investment adviser but prior to reductions from expense offset arrangements. Expenses net of all reductions represent the net expenses paid by the Fund.
D Amounts do not include the portfolio activity of the Underlying Funds.
E Total distributions of $.37 per share is comprised of distributions from net investment income of $.203 and distributions from net realized gain of $.163 per share.
F Total distributions of $.25 per share is comprised of distributions from net investment income of $.211 and distributions from net realized gain of $.034 per share.
See accompanying notes which are an integral part of the financial statements.
Annual Report
Fidelity Freedom Index 2035 Fund
Investment Changes (Unaudited)
The information in the following tables is based on the direct investments of the Fund. |
Fund Holdings as of March 31, 2015 |
| % of fund's
net assets | % of fund's net assets
6 months ago |
Domestic Equity Funds | | |
Spartan Total Market Index Fund Class F | 61.5 | 61.6 |
Commodity Funds | | |
Fidelity Series Commodity Strategy Fund Class F | 1.3 | 1.3 |
International Equity Funds | | |
Fidelity Series Global ex U.S. Index Fund | 27.1 | 27.0 |
Bond Funds | | |
Spartan U.S. Bond Index Fund Class F | 10.1 | 10.1 |
Net Other Assets (Liabilities)* | 0.0 | 0.0 |
| 100.0 | 100.0 |
* Amount represents less than 0.1%
Asset Allocation (% of fund's net assets) |
Period end |
 | Domestic Equity Funds | 61.5% | |
 | Commodity Funds | 1.3% | |
 | International Equity Funds | 27.1% | |
 | Bond Funds | 10.1% | |

Six months ago |
 | Domestic Equity Funds | 61.6% | |
 | Commodity Funds | 1.3% | |
 | International Equity Funds | 27.0% | |
 | Bond Funds | 10.1% | |

Annual Report
Fidelity Freedom Index 2035 Fund
Investments March 31, 2015
Showing Percentage of Net Assets
Domestic Equity Funds - 61.5% |
| Shares | | Value |
Spartan Total Market Index Fund Class F (b)
(Cost $573,727,487) | 12,939,626 | | $ 788,799,598 |
Commodity Funds - 1.3% |
| | | |
Fidelity Series Commodity Strategy Fund Class F (a)(b)
(Cost $20,621,127) | 2,649,340 | |
16,346,430
|
International Equity Funds - 27.1% |
| | | |
Fidelity Series Global ex U.S. Index Fund (b)
(Cost $329,668,169) | 29,429,138 | |
347,263,824
|
Bond Funds - 10.1% |
| Shares | | Value |
Spartan U.S. Bond Index Fund Class F (b)
(Cost $126,827,031) | 10,950,119 | | $ 129,758,913 |
TOTAL INVESTMENT
PORTFOLIO - 100.0% (Cost $1,050,843,814) | | 1,282,168,765 |
NET OTHER ASSETS (LIABILITIES) - 0.0% | | (78,192) |
NET ASSETS - 100% | $ 1,282,090,573 |
Legend |
(a) Non-income producing |
(b) Affiliated Fund |
Affiliated Underlying Funds |
Information regarding the Fund's fiscal year to date purchases and sales of the affiliated Underlying Funds and income earned by the Fund from investments in affiliated Underlying Funds is as follows: |
Affiliate | Value,
beginning of
period | Purchases | Sales
Proceeds | Dividend
Income | Value,
end of
period |
Fidelity Series Commodity Strategy Fund Class F | $ 13,907,445 | $ 8,318,665 | $ 1,027,773 | $ - | $ 16,346,430 |
Fidelity Series Global ex U.S. Index Fund | 269,994,724 | 115,711,644 | 26,273,930 | 9,169,191 | 347,263,824 |
Spartan Total Market Index Fund Class F | 617,660,332 | 200,971,727 | 99,558,805 | 11,696,639 | 788,799,598 |
Spartan U.S. Bond Index Fund Class F | 99,446,648 | 42,045,803 | 15,122,563 | 2,894,148 | 129,758,913 |
Total | $ 1,001,009,149 | $ 367,047,839 | $ 141,983,071 | $ 23,759,978 | $ 1,282,168,765 |
Other Information |
All investments are categorized as Level 1 under the Fair Value Hierarchy. The inputs or methodology used for valuing securities may not be an indication of the risk associated with investing in those securities. For more information on valuation inputs, please refer to the Investment Valuation section in the accompanying Notes to Financial Statements. |
See accompanying notes which are an integral part of the financial statements.
Annual Report
Fidelity Freedom Index 2035 Fund
Statement of Assets and Liabilities
| March 31, 2015 |
| | |
Assets | | |
Investment in securities, at value (cost $1,050,843,814) - See accompanying schedule | | $ 1,282,168,765 |
Cash | | 1 |
Receivable for investments sold | | 1,444,808 |
Receivable for fund shares sold | | 1,951,931 |
Receivable from affiliate for expense reductions | | 80,048 |
Total assets | | 1,285,645,553 |
| | |
Liabilities | | |
Payable for investments purchased | $ 2,927,686 | |
Payable for fund shares redeemed | 468,616 | |
Transfer agent fees payable | 158,678 | |
Total liabilities | | 3,554,980 |
| | |
Net Assets | | $ 1,282,090,573 |
Net Assets consist of: | | |
Paid in capital | | $ 1,067,724,455 |
Undistributed net investment income | | 396,686 |
Accumulated undistributed net realized gain (loss) on investments | | (17,355,519) |
Net unrealized appreciation (depreciation) on investments | | 231,324,951 |
Net Assets, for 81,838,070 shares outstanding | | $ 1,282,090,573 |
Net Asset Value, offering price and redemption price per share ($1,282,090,573 ÷ 81,838,070 shares) | | $ 15.67 |
Statement of Operations
| Year ended March 31, 2015 |
| | |
Investment Income | | |
Income distributions from underlying funds | | $ 23,759,978 |
| | |
Expenses | | |
Transfer agent fees | $ 1,699,408 | |
Independent trustees' compensation | 4,775 | |
Total expenses before reductions | 1,704,183 | |
Expense reductions | (831,148) | 873,035 |
Net investment income (loss) | | 22,886,943 |
Realized and Unrealized Gain (Loss) Realized gain (loss) on sale of underlying fund shares | (502,139) | |
Capital gain distributions from underlying funds | 211,982 | |
Total net realized gain (loss) | | (290,157) |
Change in net unrealized appreciation (depreciation) on investment securities | | 56,597,069 |
Net gain (loss) | | 56,306,912 |
Net increase (decrease) in net assets resulting from operations | | $ 79,193,855 |
See accompanying notes which are an integral part of the financial statements.
Annual Report
Fidelity Freedom Index 2035 Fund
Financial Statements - continued
Statement of Changes in Net Assets
| Year ended
March 31,
2015 | Year ended
March 31,
2014 |
Increase (Decrease) in Net Assets | | |
Operations | | |
Net investment income (loss) | $ 22,886,943 | $ 15,151,715 |
Net realized gain (loss) | (290,157) | (13,919,545) |
Change in net unrealized appreciation (depreciation) | 56,597,069 | 108,938,683 |
Net increase (decrease) in net assets resulting from operations | 79,193,855 | 110,170,853 |
Distributions to shareholders from net investment income | (37,537,173) | (525,606) |
Distributions to shareholders from net realized gain | (505,497) | (210,242) |
Total distributions | (38,042,670) | (735,848) |
Share transactions
Proceeds from sales of shares | 449,193,461 | 357,508,064 |
Reinvestment of distributions | 38,042,623 | 735,848 |
Cost of shares redeemed | (247,258,739) | (155,749,709) |
Net increase (decrease) in net assets resulting from share transactions | 239,977,345 | 202,494,203 |
Total increase (decrease) in net assets | 281,128,530 | 311,929,208 |
| | |
Net Assets | | |
Beginning of period | 1,000,962,043 | 689,032,835 |
End of period (including undistributed net investment income of $396,686 and undistributed net investment income of $15,130,381, respectively) | $ 1,282,090,573 | $ 1,000,962,043 |
Other Information Shares | | |
Sold | 29,107,598 | 25,363,164 |
Issued in reinvestment of distributions | 2,491,825 | 54,146 |
Redeemed | (16,022,304) | (10,877,295) |
Net increase (decrease) | 15,577,119 | 14,540,015 |
Financial Highlights
Years ended March 31, | 2015 | 2014 | 2013 | 2012 | 2011 |
Selected Per-Share Data | | | | | |
Net asset value, beginning of period | $ 15.11 | $ 13.32 | $ 12.40 | $ 12.54 | $ 11.02 |
Income from Investment Operations | | | | | |
Net investment income (loss) B | .31 | .25 | .24 | .23 | .21 |
Net realized and unrealized gain (loss) | .77 | 1.55 | .91 | (.01) | 1.48 |
Total from investment operations | 1.08 | 1.80 | 1.15 | .22 | 1.69 |
Distributions from net investment income | (.51) | (.01) | (.22) | (.19) | (.15) |
Distributions from net realized gain | (.01) | - E | (.02) | (.17) | (.03) |
Total distributions | (.52) | (.01) | (.23) G | (.36) | (.17) F |
Net asset value, end of period | $ 15.67 | $ 15.11 | $ 13.32 | $ 12.40 | $ 12.54 |
Total ReturnA | 7.25% | 13.56% | 9.44% | 2.00% | 15.46% |
Ratios to Average Net Assets C, D | | | | | |
Expenses before reductions | .15% | .15% | .15% | .15% | .09% |
Expenses net of fee waivers, if any | .08% | .08% | .09% | .08% | .05% |
Expenses net of all reductions | .08% | .08% | .09% | .08% | .05% |
Net investment income (loss) | 2.02% | 1.79% | 1.91% | 1.93% | 1.83% |
Supplemental Data | | | | | |
Net assets, end of period (000 omitted) | $ 1,282,091 | $ 1,000,962 | $ 689,033 | $ 357,382 | $ 150,099 |
Portfolio turnover rateD | 13% | 25% | 8% | 15% | 12% |
A Total returns would have been lower if certain expenses had not been reduced during the applicable periods shown.
B Calculated based on average shares outstanding during the period.
C Expense ratios reflect operating expenses of the Fund. Expenses before reductions do not reflect amounts reimbursed by the investment adviser or reductions from expense offset arrangements and do not represent the amount paid by the Fund during periods when reimbursements or reductions occur. Expenses net of fee waivers reflect expenses after reimbursement by the investment adviser but prior to reductions from expense offset arrangements. Expenses net of all reductions represent the net expenses paid by the Fund.
D Amounts do not include the activity of the Underlying Funds.
E Amount represents less than $.01 per share.
F Total distributions of $.17 per share is comprised of distributions from net investment income of $.145 and distributions from net realized gain of $.028 per share.
G Total distributions of $.23 per share is comprised of distributions from net investment income of $.215 and distributions from net realized gain of $.019 per share.
See accompanying notes which are an integral part of the financial statements.
Annual Report
Fidelity Freedom Index 2040 Fund
Investment Changes (Unaudited)
The information in the following tables is based on the direct investments of the Fund. |
Fund Holdings as of March 31, 2015 |
| % of fund's
net assets | % of fund's net assets
6 months ago |
Domestic Equity Funds | | |
Spartan Total Market Index Fund Class F | 61.5 | 61.6 |
Commodity Funds | | |
Fidelity Series Commodity Strategy Fund Class F | 1.3 | 1.3 |
International Equity Funds | | |
Fidelity Series Global ex U.S. Index Fund | 27.1 | 27.0 |
Bond Funds | | |
Spartan U.S. Bond Index Fund Class F | 10.1 | 10.1 |
Net Other Assets (Liabilities)* | 0.0 | 0.0 |
| 100.0 | 100.0 |
* Amount represents less than 0.1%
Asset Allocation (% of fund's net assets) |
Period end |
 | Domestic Equity Funds | 61.5% | |
 | Commodity Funds | 1.3% | |
 | International Equity Funds | 27.1% | |
 | Bond Funds | 10.1% | |

Six months ago |
 | Domestic Equity Funds | 61.6% | |
 | Commodity Funds | 1.3% | |
 | International Equity Funds | 27.0% | |
 | Bond Funds | 10.1% | |

Annual Report
Fidelity Freedom Index 2040 Fund
Investments March 31, 2015
Showing Percentage of Net Assets
Domestic Equity Funds - 61.5% |
| Shares | | Value |
Spartan Total Market Index Fund Class F (b)
(Cost $674,897,532) | 15,252,928 | | $ 929,818,472 |
Commodity Funds - 1.3% |
| | | |
Fidelity Series Commodity Strategy Fund Class F (a)(b)
(Cost $24,241,731) | 3,122,757 | |
19,267,411
|
International Equity Funds - 27.1% |
| | | |
Fidelity Series Global ex U.S. Index Fund (b)
(Cost $386,630,767) | 34,690,343 | |
409,346,045
|
Bond Funds - 10.1% |
| Shares | | Value |
Spartan U.S. Bond Index Fund Class F (b)
(Cost $149,968,379) | 12,907,924 | | $ 152,958,903 |
TOTAL INVESTMENT
PORTFOLIO - 100.0% (Cost $1,235,738,409) | | 1,511,390,831 |
NET OTHER ASSETS (LIABILITIES) - 0.0% | | (92,346) |
NET ASSETS - 100% | $ 1,511,298,485 |
Legend |
(a) Non-income producing |
(b) Affiliated Fund |
Affiliated Underlying Funds |
Information regarding the Fund's fiscal year to date purchases and sales of the affiliated Underlying Funds and income earned by the Fund from investments in affiliated Underlying Funds is as follows: |
Affiliate | Value,
beginning of
period | Purchases | Sales
Proceeds | Dividend
Income | Value,
end of
period |
Fidelity Series Commodity Strategy Fund Class F | $ 16,502,693 | $ 9,548,620 | $ 1,152,686 | $ - | $ 19,267,411 |
Fidelity Series Global ex U.S. Index Fund | 318,086,471 | 135,959,075 | 31,312,099 | 10,456,940 | 409,346,045 |
Spartan Total Market Index Fund Class F | 727,555,177 | 233,426,959 | 112,032,335 | 13,395,026 | 929,818,472 |
Spartan U.S. Bond Index Fund Class F | 117,159,505 | 50,085,386 | 18,289,966 | 3,375,080 | 152,958,903 |
Total | $ 1,179,303,846 | $ 429,020,040 | $ 162,787,086 | $ 27,227,046 | $ 1,511,390,831 |
Other Information |
All investments are categorized as Level 1 under the Fair Value Hierarchy. The inputs or methodology used for valuing securities may not be an indication of the risk associated with investing in those securities. For more information on valuation inputs, please refer to the Investment Valuation section in the accompanying Notes to Financial Statements. |
See accompanying notes which are an integral part of the financial statements.
Annual Report
Fidelity Freedom Index 2040 Fund
Statement of Assets and Liabilities
| March 31, 2015 |
| | |
Assets | | |
Investment in securities, at value (cost $1,235,738,409) - See accompanying schedule | | $ 1,511,390,831 |
Cash | | 3 |
Receivable for investments sold | | 1,492,929 |
Receivable for fund shares sold | | 2,935,657 |
Receivable from affiliate for expense reductions | | 94,668 |
Total assets | | 1,515,914,088 |
| | |
Liabilities | | |
Payable for investments purchased | $ 3,533,734 | |
Payable for fund shares redeemed | 894,233 | |
Transfer agent fees payable | 187,636 | |
Total liabilities | | 4,615,603 |
| | |
Net Assets | | $ 1,511,298,485 |
Net Assets consist of: | | |
Paid in capital | | $ 1,254,150,021 |
Undistributed net investment income | | 468,349 |
Accumulated undistributed net realized gain (loss) on investments | | (18,972,307) |
Net unrealized appreciation (depreciation) on investments | | 275,652,422 |
Net Assets, for 95,890,444 shares outstanding | | $ 1,511,298,485 |
Net Asset Value, offering price and redemption price per share ($1,511,298,485 ÷ 95,890,444 shares) | | $ 15.76 |
Statement of Operations
| Year ended March 31, 2015 |
| | |
Investment Income | | |
Income distributions from underlying funds | | $ 27,227,046 |
| | |
Expenses | | |
Transfer agent fees | $ 1,981,595 | |
Independent trustees' compensation | 5,563 | |
Total expenses before reductions | 1,987,158 | |
Expense reductions | (972,985) | 1,014,173 |
Net investment income (loss) | | 26,212,873 |
Realized and Unrealized Gain (Loss) Realized gain (loss) on sale of underlying fund shares | (419,014) | |
Capital gain distributions from underlying funds | 241,680 | |
Total net realized gain (loss) | | (177,334) |
Change in net unrealized appreciation (depreciation) on investment securities | | 66,273,268 |
Net gain (loss) | | 66,095,934 |
Net increase (decrease) in net assets resulting from operations | | $ 92,308,807 |
See accompanying notes which are an integral part of the financial statements.
Annual Report
Fidelity Freedom Index 2040 Fund
Financial Statements - continued
Statement of Changes in Net Assets
| Year ended
March 31,
2015 | Year ended
March 31,
2014 |
Increase (Decrease) in Net Assets | | |
Operations | | |
Net investment income (loss) | $ 26,212,873 | $ 17,506,315 |
Net realized gain (loss) | (177,334) | (15,030,659) |
Change in net unrealized appreciation (depreciation) | 66,273,268 | 126,564,404 |
Net increase (decrease) in net assets resulting from operations | 92,308,807 | 129,040,060 |
Distributions to shareholders from net investment income | (43,440,271) | (500,509) |
Distributions to shareholders from net realized gain | (238,257) | (250,125) |
Total distributions | (43,678,528) | (750,634) |
Share transactions
Proceeds from sales of shares | 525,257,082 | 445,413,402 |
Reinvestment of distributions | 43,676,943 | 750,634 |
Cost of shares redeemed | (285,515,086) | (205,653,559) |
Net increase (decrease) in net assets resulting from share transactions | 283,418,939 | 240,510,477 |
Total increase (decrease) in net assets | 332,049,218 | 368,799,903 |
| | |
Net Assets | | |
Beginning of period | 1,179,249,267 | 810,449,364 |
End of period (including undistributed net investment income of $486,349 and undistributed net investment income of $17,504,659, respectively) | $ 1,511,298,485 | $ 1,179,249,267 |
Other Information Shares | | |
Sold | 33,774,823 | 31,421,859 |
Issued in reinvestment of distributions | 2,844,037 | 55,075 |
Redeemed | (18,397,611) | (14,492,825) |
Net increase (decrease) | 18,221,249 | 16,984,109 |
Financial Highlights
Years ended March 31, | 2015 | 2014 | 2013 | 2012 | 2011 |
Selected Per-Share Data | | | | | |
Net asset value, beginning of period | $ 15.18 | $ 13.36 | $ 12.42 | $ 12.58 | $ 11.04 |
Income from Investment Operations | | | | | |
Net investment income (loss) B | .31 | .25 | .24 | .23 | .21 |
Net realized and unrealized gain (loss) | .78 | 1.58 | .93 | (.02) | 1.50 |
Total from investment operations | 1.09 | 1.83 | 1.17 | .21 | 1.71 |
Distributions from net investment income | (.50) | (.01) | (.21) | (.20) | (.15) |
Distributions from net realized gain | - E | - E | (.02) | (.17) | (.03) |
Total distributions | (.51) G | (.01) | (.23) | (.37) | (.17) F |
Net asset value, end of period | $ 15.76 | $ 15.18 | $ 13.36 | $ 12.42 | $ 12.58 |
Total ReturnA | 7.27% | 13.72% | 9.59% | 1.92% | 15.59% |
Ratios to Average Net Assets C, D | | | | | |
Expenses before reductions | .15% | .15% | .15% | .15% | .08% |
Expenses net of fee waivers, if any | .08% | .08% | .09% | .08% | .05% |
Expenses net of all reductions | .08% | .08% | .09% | .08% | .05% |
Net investment income (loss) | 1.99% | 1.78% | 1.93% | 1.91% | 1.80% |
Supplemental Data | | | | | |
Net assets, end of period (000 omitted) | $ 1,511,298 | $ 1,179,249 | $ 810,449 | $ 409,300 | $ 174,164 |
Portfolio turnover rateD | 12% | 26% | 8% | 16% | 13% |
A Total returns would have been lower if certain expenses had not been reduced during the applicable periods shown.
B Calculated based on average shares outstanding during the period.
C Expense ratios reflect operating expenses of the Fund. Expenses before reductions do not reflect amounts reimbursed by the investment adviser or reductions from expense offset arrangements and do not represent the amount paid by the Fund during periods when reimbursements or reductions occur. Expenses net of fee waivers reflect expenses after reimbursement by the investment adviser but prior to reductions from expense offset arrangements. Expenses net of all reductions represent the net expenses paid by the Fund.
D Amounts do not include the portfolio activity of the Underlying Funds.
E Amount represents less than $.01 per share.
F Total distributions of $.17 per share is comprised of distributions from net investment income of $.145 and distributions from net realized gain of $.027 per share.
G Total distributions of $.51 per share is comprised of distributions from net investment income of $.502 and distributions from net realized gain of $.003 per share.
See accompanying notes which are an integral part of the financial statements.
Annual Report
Fidelity Freedom Index 2045 Fund
Investment Changes (Unaudited)
The information in the following tables is based on the direct investments of the Fund. |
Fund Holdings as of March 31, 2015 |
| % of fund's
net assets | % of fund's net assets
6 months ago |
Domestic Equity Funds | | |
Spartan Total Market Index Fund Class F | 61.5 | 61.6 |
Commodity Funds | | |
Fidelity Series Commodity Strategy Fund Class F | 1.3 | 1.3 |
International Equity Funds | | |
Fidelity Series Global ex U.S. Index Fund | 27.1 | 27.0 |
Bond Funds | | |
Spartan U.S. Bond Index Fund Class F | 10.1 | 10.1 |
Net Other Assets (Liabilities)* | 0.0 | 0.0 |
| 100.0 | 100.0 |
* Amount represents less than 0.1%
Asset Allocation (% of fund's net assets) |
Period end |
 | Domestic Equity Funds | 61.5% | |
 | Commodity Funds | 1.3% | |
 | International Equity Funds | 27.1% | |
 | Bond Funds | 10.1% | |

Six months ago |
 | Domestic Equity Funds | 61.6% | |
 | Commodity Funds | 1.3% | |
 | International Equity Funds | 27.0% | |
 | Bond Funds | 10.1% | |

Annual Report
Fidelity Freedom Index 2045 Fund
Investments March 31, 2015
Showing Percentage of Net Assets
Domestic Equity Funds - 61.5% |
| Shares | | Value |
Spartan Total Market Index Fund Class F (b)
(Cost $339,416,906) | 7,572,789 | | $ 461,637,208 |
Commodity Funds - 1.3% |
| | | |
Fidelity Series Commodity Strategy Fund Class F (a)(b)
(Cost $12,095,986) | 1,550,435 | |
9,566,183
|
International Equity Funds - 27.1% |
| | | |
Fidelity Series Global ex U.S. Index Fund (b)
(Cost $193,725,940) | 17,223,065 | |
203,232,169
|
Bond Funds - 10.1% |
| Shares | | Value |
Spartan U.S. Bond Index Fund Class F (b)
(Cost $74,678,871) | 6,408,456 | | $ 75,940,199 |
TOTAL INVESTMENT
PORTFOLIO - 100.0% (Cost $619,917,703) | | 750,375,759 |
NET OTHER ASSETS (LIABILITIES) - 0.0% | | (45,643) |
NET ASSETS - 100% | $ 750,330,116 |
Legend |
(a) Non-income producing |
(b) Affiliated Fund |
Affiliated Underlying Funds |
Information regarding the Fund's fiscal year to date purchases and sales of the affiliated Underlying Funds and income earned by the Fund from investments in affiliated Underlying Funds is as follows: |
Affiliate | Value,
beginning of
period | Purchases | Sales
Proceeds | Dividend
Income | Value,
end of
period |
Fidelity Series Commodity Strategy Fund Class F | $ 8,139,069 | $ 4,710,703 | $ 441,757 | $ - | $ 9,566,183 |
Fidelity Series Global ex U.S. Index Fund | 155,802,035 | 67,786,878 | 12,965,979 | 5,377,761 | 203,232,169 |
Spartan Total Market Index Fund Class F | 356,300,786 | 118,395,458 | 53,400,047 | 6,856,887 | 461,637,208 |
Spartan U.S. Bond Index Fund Class F | 57,387,668 | 25,795,656 | 9,205,001 | 1,680,743 | 75,940,199 |
Total | $ 577,629,558 | $ 216,688,695 | $ 76,012,784 | $ 13,915,391 | $ 750,375,759 |
Other Information |
All investments are categorized as Level 1 under the Fair Value Hierarchy. The inputs or methodology used for valuing securities may not be an indication of the risk associated with investing in those securities. For more information on valuation inputs, please refer to the Investment Valuation section in the accompanying Notes to Financial Statements. |
See accompanying notes which are an integral part of the financial statements.
Annual Report
Fidelity Freedom Index 2045 Fund
Statement of Assets and Liabilities
| March 31, 2015 |
| | |
Assets | | |
Investment in securities, at value (cost $619,917,703) - See accompanying schedule | | $ 750,375,759 |
Cash | | 1 |
Receivable for investments sold | | 556,115 |
Receivable for fund shares sold | | 1,469,032 |
Receivable from affiliate for expense reductions | | 46,838 |
Total assets | | 752,447,745 |
| | |
Liabilities | | |
Payable for investments purchased | $ 1,827,173 | |
Payable for fund shares redeemed | 197,634 | |
Transfer agent fees payable | 92,822 | |
Total liabilities | | 2,117,629 |
| | |
Net Assets | | $ 750,330,116 |
Net Assets consist of: | | |
Paid in capital | | $ 628,700,987 |
Undistributed net investment income | | 235,436 |
Accumulated undistributed net realized gain (loss) on investments | | (9,064,363) |
Net unrealized appreciation (depreciation) on investments | | 130,458,056 |
Net Assets, for 47,216,330 shares outstanding | | $ 750,330,116 |
Net Asset Value, offering price and redemption price per share ($750,330,116 ÷ 47,216,330 shares) | | $ 15.89 |
Statement of Operations
| Year ended March 31, 2015 |
| | |
Investment Income | | |
Income distributions from underlying funds | | $ 13,915,391 |
| | |
Expenses | | |
Transfer agent fees | $ 987,105 | |
Independent trustees' compensation | 2,770 | |
Total expenses before reductions | 989,875 | |
Expense reductions | (482,229) | 507,646 |
Net investment income (loss) | | 13,407,745 |
Realized and Unrealized Gain (Loss) Realized gain (loss) on sale of underlying fund shares | (365,387) | |
Capital gain distributions from underlying funds | 124,379 | |
Total net realized gain (loss) | | (241,008) |
Change in net unrealized appreciation (depreciation) on investment securities | | 32,435,775 |
Net gain (loss) | | 32,194,767 |
Net increase (decrease) in net assets resulting from operations | | $ 45,602,512 |
See accompanying notes which are an integral part of the financial statements.
Annual Report
Fidelity Freedom Index 2045 Fund
Financial Statements - continued
Statement of Changes in Net Assets
| Year ended
March 31,
2015 | Year ended
March 31,
2014 |
Increase (Decrease) in Net Assets | | |
Operations | | |
Net investment income (loss) | $ 13,407,745 | $ 8,376,410 |
Net realized gain (loss) | (241,008) | (7,163,458) |
Change in net unrealized appreciation (depreciation) | 32,435,775 | 62,515,061 |
Net increase (decrease) in net assets resulting from operations | 45,602,512 | 63,728,013 |
Distributions to shareholders from net investment income | (21,509,196) | (201,896) |
Distributions to shareholders from net realized gain | (249,524) | (86,527) |
Total distributions | (21,758,720) | (288,423) |
Share transactions
Proceeds from sales of shares | 279,166,902 | 235,287,532 |
Reinvestment of distributions | 21,758,207 | 288,423 |
Cost of shares redeemed | (152,042,180) | (101,878,050) |
Net increase (decrease) in net assets resulting from share transactions | 148,882,929 | 133,697,905 |
Total increase (decrease) in net assets | 172,726,721 | 197,137,495 |
| | |
Net Assets | | |
Beginning of period | 577,603,395 | 380,465,900 |
End of period (including undistributed net investment income of $235,436 and undistributed net investment income of $8,370,933, respectively) | $ 750,330,116 | $ 577,603,395 |
Other Information Shares | | |
Sold | 17,837,964 | 16,405,492 |
Issued in reinvestment of distributions | 1,403,694 | 21,022 |
Redeemed | (9,734,905) | (7,034,830) |
Net increase (decrease) | 9,506,753 | 9,391,684 |
Financial Highlights
Years ended March 31, | 2015 | 2014 | 2013 | 2012 | 2011 |
Selected Per-Share Data | | | | | |
Net asset value, beginning of period | $ 15.32 | $ 13.44 | $ 12.47 | $ 12.63 | $ 11.05 |
Income from Investment Operations | | | | | |
Net investment income (loss) B | .32 | .25 | .25 | .23 | .21 |
Net realized and unrealized gain (loss) | .77 | 1.64 | .95 | (.04) | 1.54 |
Total from investment operations | 1.09 | 1.89 | 1.20 | .19 | 1.75 |
Distributions from net investment income | (.51) | (.01) | (.21) | (.19) | (.14) |
Distributions from net realized gain | (.01) | - D | (.02) | (.16) | (.03) |
Total distributions | (.52) | (.01) | (.23) | (.35) | (.17) |
Net asset value, end of period | $ 15.89 | $ 15.32 | $ 13.44 | $ 12.47 | $ 12.63 |
Total ReturnA | 7.22% | 14.07% | 9.76% | 1.74% | 15.91% |
Ratios to Average Net Assets C, E | | | | | |
Expenses before reductions | .15% | .15% | .15% | .15% | .09% |
Expenses net of fee waivers, if any | .08% | .08% | .09% | .09% | .05% |
Expenses net of all reductions | .08% | .08% | .09% | .09% | .05% |
Net investment income (loss) | 2.04% | 1.75% | 1.95% | 1.94% | 1.83% |
Supplemental Data | | | | | |
Net assets, end of period (000 omitted) | $ 750,330 | $ 577,603 | $ 380,466 | $ 178,881 | $ 53,547 |
Portfolio turnover rate E | 12% | 22% | 7% | 15% | 11% |
A Total returns would have been lower if certain expenses had not been reduced during the applicable periods shown.
B Calculated based on average shares outstanding during the period.
C Expense ratios reflect operating expenses of the Fund. Expenses before reductions do not reflect amounts reimbursed by the investment adviser or reductions from expense offset arrangements and do not represent the amount paid by the Fund during periods when reimbursements or reductions occur. Expenses net of fee waivers reflect expenses after reimbursement by the investment adviser but prior to reductions from expense offset arrangements. Expenses net of all reductions represent the net expenses paid by the Fund.
D Amount represents less than $.01 per share.
E Amounts do not include the activity of the Underlying Funds.
See accompanying notes which are an integral part of the financial statements.
Annual Report
Fidelity Freedom Index 2050 Fund
Investment Changes (Unaudited)
The information in the following tables is based on the direct investments of the Fund. |
Fund Holdings as of March 31, 2015 |
| % of fund's
net assets | % of fund's net assets
6 months ago |
Domestic Equity Funds | | |
Spartan Total Market Index Fund Class F | 61.5 | 61.6 |
Commodity Funds | | |
Fidelity Series Commodity Strategy Fund Class F | 1.3 | 1.3 |
International Equity Funds | | |
Fidelity Series Global ex U.S. Index Fund | 27.1 | 27.0 |
Bond Funds | | |
Spartan U.S. Bond Index Fund Class F | 10.1 | 10.1 |
Net Other Assets (Liabilities)* | 0.0 | 0.0 |
| 100.0 | 100.0 |
* Amount represents less than 0.1%
Asset Allocation (% of fund's net assets) |
Period end |
 | Domestic Equity Funds | 61.5% | |
 | Commodity Funds | 1.3% | |
 | International Equity Funds | 27.1% | |
 | Bond Funds | 10.1% | |

Six months ago |
 | Domestic Equity Funds | 61.6% | |
 | Commodity Funds | 1.3% | |
 | International Equity Funds | 27.0% | |
 | Bond Funds | 10.1% | |

Annual Report
Fidelity Freedom Index 2050 Fund
Investments March 31, 2015
Showing Percentage of Net Assets
Domestic Equity Funds - 61.5% |
| Shares | | Value |
Spartan Total Market Index Fund Class F (b)
(Cost $340,510,674) | 7,363,954 | | $ 448,906,657 |
Commodity Funds - 1.3% |
| | | |
Fidelity Series Commodity Strategy Fund Class F (a)(b)
(Cost $11,685,799) | 1,507,806 | |
9,303,161
|
International Equity Funds - 27.1% |
| | | |
Fidelity Series Global ex U.S. Index Fund (b)
(Cost $189,431,723) | 16,748,134 | |
197,627,987
|
Bond Funds - 10.1% |
| Shares | | Value |
Spartan U.S. Bond Index Fund Class F (b)
(Cost $72,821,671) | 6,231,654 | | $ 73,845,102 |
TOTAL INVESTMENT
PORTFOLIO - 100.0% (Cost $614,449,867) | | 729,682,907 |
NET OTHER ASSETS (LIABILITIES) - 0.0% | | (44,272) |
NET ASSETS - 100% | $ 729,638,635 |
Legend |
(a) Non-income producing |
(b) Affiliated Fund |
Affiliated Underlying Funds |
Information regarding the Fund's fiscal year to date purchases and sales of the affiliated Underlying Funds and income earned by the Fund from investments in affiliated Underlying Funds is as follows: |
Affiliate | Value,
beginning of
period | Purchases | Sales
Proceeds | Dividend
Income | Value,
end of
period |
Fidelity Series Commodity Strategy Fund Class F | $ 7,401,876 | $ 4,997,634 | $ 452,926 | $ - | $ 9,303,161 |
Fidelity Series Global ex U.S. Index Fund | 140,715,309 | 73,418,688 | 9,935,722 | 4,944,508 | 197,627,987 |
Spartan Total Market Index Fund Class F | 321,748,874 | 130,602,014 | 40,605,714 | 6,279,887 | 448,906,657 |
Spartan U.S. Bond Index Fund Class F | 51,829,069 | 27,440,903 | 7,259,036 | 1,559,404 | 73,845,102 |
Total | $ 521,695,128 | $ 236,459,239 | $ 58,253,398 | $ 12,783,799 | $ 729,682,907 |
Other Information |
All investments are categorized as Level 1 under the Fair Value Hierarchy. The inputs or methodology used for valuing securities may not be an indication of the risk associated with investing in those securities. For more information on valuation inputs, please refer to the Investment Valuation section in the accompanying Notes to Financial Statements. |
See accompanying notes which are an integral part of the financial statements.
Annual Report
Fidelity Freedom Index 2050 Fund
Statement of Assets and Liabilities
| March 31, 2015 |
| | |
Assets | | |
Investment in securities, at value (cost $614,449,867) - See accompanying schedule | | $ 729,682,907 |
Cash | | 2 |
Receivable for investments sold | | 720,072 |
Receivable for fund shares sold | | 1,399,910 |
Receivable from affiliate for expense reductions | | 45,493 |
Total assets | | 731,848,384 |
| | |
Liabilities | | |
Payable for investments purchased | $ 1,709,022 | |
Payable for fund shares redeemed | 410,582 | |
Transfer agent fees payable | 90,145 | |
Total liabilities | | 2,209,749 |
| | |
Net Assets | | $ 729,638,635 |
Net Assets consist of: | | |
Paid in capital | | $ 622,013,769 |
Undistributed net investment income | | 245,903 |
Accumulated undistributed net realized gain (loss) on investments | | (7,854,077) |
Net unrealized appreciation (depreciation) on investments | | 115,233,040 |
Net Assets, for 45,585,099 shares outstanding | | $ 729,638,635 |
Net Asset Value, offering price and redemption price per share ($729,638,635 ÷ 45,585,099 shares) | | $ 16.01 |
Statement of Operations
| Year ended March 31, 2015 |
| | |
Investment Income | | |
Income distributions from underlying funds | | $ 12,783,799 |
| | |
Expenses | | |
Transfer agent fees | $ 915,673 | |
Independent trustees' compensation | 2,547 | |
Total expenses before reductions | 918,220 | |
Expense reductions | (442,054) | 476,166 |
Net investment income (loss) | | 12,307,633 |
Realized and Unrealized Gain (Loss) Realized gain (loss) on sale of underlying fund shares | (446,504) | |
Capital gain distributions from underlying funds | 114,306 | |
Total net realized gain (loss) | | (332,198) |
Change in net unrealized appreciation (depreciation) on investment securities | | 30,228,527 |
Net gain (loss) | | 29,896,329 |
Net increase (decrease) in net assets resulting from operations | | $ 42,203,962 |
See accompanying notes which are an integral part of the financial statements.
Annual Report
Fidelity Freedom Index 2050 Fund
Financial Statements - continued
Statement of Changes in Net Assets
| Year ended
March 31,
2015 | Year ended
March 31,
2014 |
Increase (Decrease) in Net Assets | | |
Operations | | |
Net investment income (loss) | $ 12,307,633 | $ 7,517,695 |
Net realized gain (loss) | (332,198) | (6,075,160) |
Change in net unrealized appreciation (depreciation) | 30,228,527 | 54,799,929 |
Net increase (decrease) in net assets resulting from operations | 42,203,962 | 56,242,464 |
Distributions to shareholders from net investment income | (19,534,628) | (152,231) |
Distributions to shareholders from net realized gain | (229,721) | (76,115) |
Total distributions | (19,764,349) | (228,346) |
Share transactions
Proceeds from sales of shares | 303,314,847 | 248,450,079 |
Reinvestment of distributions | 19,764,349 | 228,346 |
Cost of shares redeemed | (137,551,869) | (109,241,600) |
Net increase (decrease) in net assets resulting from share transactions | 185,527,327 | 139,436,825 |
Total increase (decrease) in net assets | 207,966,940 | 195,450,943 |
| | |
Net Assets | | |
Beginning of period | 521,671,695 | 326,220,752 |
End of period (including undistributed net investment income of $245,903 and undistributed net investment income of $7,510,593, respectively) | $ 729,638,635 | $ 521,671,695 |
Other Information Shares | | |
Sold | 19,214,072 | 17,208,842 |
Issued in reinvestment of distributions | 1,266,166 | 16,428 |
Redeemed | (8,733,331) | (7,535,793) |
Net increase (decrease) | 11,746,907 | 9,689,477 |
Financial Highlights
Years ended March 31, | 2015 | 2014 | 2013 | 2012 | 2011 |
Selected Per-Share Data | | | | | |
Net asset value, beginning of period | $ 15.42 | $ 13.51 | $ 12.53 | $ 12.73 | $ 11.10 |
Income from Investment Operations | | | | | |
Net investment income (loss) B | .32 | .26 | .25 | .23 | .20 |
Net realized and unrealized gain (loss) | .78 | 1.66 | .95 | (.09) | 1.59 |
Total from investment operations | 1.10 | 1.92 | 1.20 | .14 | 1.79 |
Distributions from net investment income | (.50) | (.01) | (.21) | (.18) | (.14) |
Distributions from net realized gain | (.01) | - D | (.01) | (.16) | (.02) |
Total distributions | (.51) | (.01) | (.22) E | (.34) | (.16) |
Net asset value, end of period | $ 16.01 | $ 15.42 | $ 13.51 | $ 12.53 | $ 12.73 |
Total ReturnA | 7.25% | 14.21% | 9.75% | 1.39% | 16.19% |
Ratios to Average Net Assets C, F | | | | | |
Expenses before reductions | .15% | .15% | .15% | .15% | .08% |
Expenses net of fee waivers, if any | .08% | .08% | .09% | .08% | .05% |
Expenses net of all reductions | .08% | .08% | .09% | .08% | .05% |
Net investment income (loss) | 2.02% | 1.79% | 2.02% | 1.89% | 1.72% |
Supplemental Data | | | | | |
Net assets, end of period (000 omitted) | $ 729,639 | $ 521,672 | $ 326,221 | $ 140,655 | $ 36,758 |
Portfolio turnover rate F | 10% | 24% | 8% | 15% | 11% |
A Total returns would have been lower if certain expenses had not been reduced during the applicable periods shown.
B Calculated based on average shares outstanding during the period.
C Expense ratios reflect operating expenses of the Fund. Expenses before reductions do not reflect amounts reimbursed by the investment adviser or reductions from expense offset arrangements and do not represent the amount paid by the Fund during periods when reimbursements or reductions occur. Expenses net of fee waivers reflect expenses after reimbursement by the investment adviser but prior to reductions from expense offset arrangements. Expenses net of all reductions represent the net expenses paid by the Fund.
D Amount represents less than $.01 per share.
E Total distributions of $.22 per share is comprised of distributions from net investment income of $.209 and distributions from net realized gain of $.015 per share.
F Amounts do not include the activity of the Underlying Funds.
See accompanying notes which are an integral part of the financial statements.
Annual Report
Fidelity Freedom Index 2055 Fund
Investment Changes (Unaudited)
The information in the following tables is based on the direct investments of the Fund. |
Fund Holdings as of March 31, 2015 |
| % of fund's
net assets | % of fund's net assets
6 months ago |
Domestic Equity Funds | | |
Spartan Total Market Index Fund Class F | 61.5 | 61.6 |
Commodity Funds | | |
Fidelity Series Commodity Strategy Fund Class F | 1.3 | 1.3 |
International Equity Funds | | |
Fidelity Series Global ex U.S. Index Fund | 27.1 | 27.0 |
Bond Funds | | |
Spartan U.S. Bond Index Fund Class F | 10.1 | 10.1 |
Net Other Assets (Liabilities)* | 0.0 | 0.0 |
| 100.0 | 100.0 |
* Amount represents less than 0.1%
Asset Allocation (% of fund's net assets) |
Period end |
 | Domestic Equity Funds | 61.5% | |
 | Commodity Funds | 1.3% | |
 | International Equity Funds | 27.1% | |
 | Bond Funds | 10.1% | |

Six months ago |
 | Domestic Equity Funds | 61.6% | |
 | Commodity Funds | 1.3% | |
 | International Equity Funds | 27.0% | |
 | Bond Funds | 10.1% | |

Annual Report
Fidelity Freedom Index 2055 Fund
Investments March 31, 2015
Showing Percentage of Net Assets
Domestic Equity Funds - 61.5% |
| Shares | | Value |
Spartan Total Market Index Fund Class F (b)
(Cost $96,547,179) | 1,848,137 | | $ 112,662,412 |
Commodity Funds - 1.3% |
| | | |
Fidelity Series Commodity Strategy Fund Class F (a)(b)
(Cost $2,866,110) | 378,497 | |
2,335,329
|
International Equity Funds - 27.1% |
| | | |
Fidelity Series Global ex U.S. Index Fund (b)
(Cost $49,490,510) | 4,203,263 | |
49,598,498
|
Bond Funds - 10.1% |
| Shares | | Value |
Spartan U.S. Bond Index Fund Class F (b)
(Cost $18,217,955) | 1,563,883 | | $ 18,532,010 |
TOTAL INVESTMENT
PORTFOLIO - 100.0% (Cost $167,121,754) | | 183,128,249 |
NET OTHER ASSETS (LIABILITIES) - 0.0% | | (11,019) |
NET ASSETS - 100% | $ 183,117,230 |
Legend |
(a) Non-income producing |
(b) Affiliated Fund |
Affiliated Underlying Funds |
Information regarding the Fund's fiscal year to date purchases and sales of the affiliated Underlying Funds and income earned by the Fund from investments in affiliated Underlying Funds is as follows: |
Affiliate | Value,
beginning of
period | Purchases | Sales
Proceeds | Dividend
Income | Value,
end of
period |
Fidelity Series Commodity Strategy Fund Class F | $ 1,265,436 | $ 1,720,424 | $ 55,720 | $ - | $ 2,335,329 |
Fidelity Series Global ex U.S. Index Fund | 23,764,856 | 29,060,735 | 1,618,863 | 1,139,289 | 49,598,498 |
Spartan Total Market Index Fund Class F | 54,304,573 | 57,785,390 | 7,330,520 | 1,403,332 | 112,662,412 |
Spartan U.S. Bond Index Fund Class F | 8,753,183 | 10,771,265 | 1,376,260 | 336,649 | 18,532,010 |
Total | $ 88,088,048 | $ 99,337,814 | $ 10,381,363 | $ 2,879,270 | $ 183,128,249 |
Other Information |
All investments are categorized as Level 1 under the Fair Value Hierarchy. The inputs or methodology used for valuing securities may not be an indication of the risk associated with investing in those securities. For more information on valuation inputs, please refer to the Investment Valuation section in the accompanying Notes to Financial Statements. |
See accompanying notes which are an integral part of the financial statements.
Annual Report
Fidelity Freedom Index 2055 Fund
Statement of Assets and Liabilities
| March 31, 2015 |
| | |
Assets | | |
Investment in securities, at value (cost $167,121,754) - See accompanying schedule | | $ 183,128,249 |
Receivable for investments sold | | 12,310 |
Receivable for fund shares sold | | 549,125 |
Receivable from affiliate for expense reductions | | 11,318 |
Total assets | | 183,701,002 |
| | |
Liabilities | | |
Payable for investments purchased | $ 495,643 | |
Payable for fund shares redeemed | 65,697 | |
Transfer agent fees payable | 22,432 | |
Total liabilities | | 583,772 |
| | |
Net Assets | | $ 183,117,230 |
Net Assets consist of: | | |
Paid in capital | | $ 167,916,804 |
Undistributed net investment income | | 54,606 |
Accumulated undistributed net realized gain (loss) on investments | | (860,675) |
Net unrealized appreciation (depreciation) on investments | | 16,006,495 |
Net Assets, for 14,409,992 shares outstanding | | $ 183,117,230 |
Net Asset Value, offering price and redemption price per share ($183,117,230 ÷ 14,409,992 shares) | | $ 12.71 |
Statement of Operations
| Year ended March 31, 2015 |
| | |
Investment Income | | |
Income distributions from underlying funds | | $ 2,879,270 |
| | |
Expenses | | |
Transfer agent fees | $ 197,809 | |
Independent trustees' compensation | 528 | |
Total expenses before reductions | 198,337 | |
Expense reductions | (87,338) | 110,999 |
Net investment income (loss) | | 2,768,271 |
Realized and Unrealized Gain (Loss) Realized gain (loss) on sale of underlying fund shares | (97,637) | |
Capital gain distributions from underlying funds | 26,403 | |
Total net realized gain (loss) | | (71,234) |
Change in net unrealized appreciation (depreciation) on investment securities | | 6,181,419 |
Net gain (loss) | | 6,110,185 |
Net increase (decrease) in net assets resulting from operations | | $ 8,878,456 |
See accompanying notes which are an integral part of the financial statements.
Annual Report
Fidelity Freedom Index 2055 Fund
Financial Statements - continued
Statement of Changes in Net Assets
| Year ended
March 31,
2015 | Year ended
March 31,
2014 |
Increase (Decrease) in Net Assets | | |
Operations | | |
Net investment income (loss) | $ 2,768,271 | $ 1,052,928 |
Net realized gain (loss) | (71,234) | (648,393) |
Change in net unrealized appreciation (depreciation) | 6,181,419 | 7,796,256 |
Net increase (decrease) in net assets resulting from operations | 8,878,456 | 8,200,791 |
Distributions to shareholders from net investment income | (2,770,049) | (1,023,210) |
Distributions to shareholders from net realized gain | - | (21,734) |
Total distributions | (2,770,049) | (1,044,944) |
Share transactions
Proceeds from sales of shares | 117,409,257 | 68,264,589 |
Reinvestment of distributions | 2,769,950 | 1,044,944 |
Cost of shares redeemed | (31,254,586) | (18,586,625) |
Net increase (decrease) in net assets resulting from share transactions | 88,924,621 | 50,722,908 |
Total increase (decrease) in net assets | 95,033,028 | 57,878,755 |
| | |
Net Assets | | |
Beginning of period | 88,084,202 | 30,205,447 |
End of period (including distributions in excess of net investment income of 54,606 and undistributed net investment income of $35,045, respectively) | $ 183,117,230 | $ 88,084,202 |
Other Information Shares | | |
Sold | 9,392,878 | 5,994,072 |
Issued in reinvestment of distributions | 220,333 | 88,319 |
Redeemed | (2,499,994) | (1,616,753) |
Net increase (decrease) | 7,113,217 | 4,465,638 |
Financial Highlights
Years ended March 31, | 2015 | 2014 | 2013 | 2012E |
Selected Per-Share Data | | | | |
Net asset value, beginning of period | $ 12.07 | $ 10.67 | $ 9.86 | $ 10.00 |
Income from Investment Operations | | | | |
Net investment income (loss) D | .26 | .21 | .21 | .14 |
Net realized and unrealized gain (loss) | .62 | 1.36 | .77 | (.01) |
Total from investment operations | .88 | 1.57 | .98 | .13 |
Distributions from net investment income | (.24) | (.17) | (.16) | (.13) |
Distributions from net realized gain | - | - G | (.01) | (.14) |
Total distributions | (.24) | (.17) | (.17) | (.27) |
Net asset value, end of period | $ 12.71 | $ 12.07 | $ 10.67 | $ 9.86 |
Total ReturnB, C | 7.27% | 14.76% | 10.05% | 1.61% |
Ratios to Average Net Assets F, H | | | | |
Expenses before reductions | .15% | .15% | .15% | .15%A |
Expenses net of fee waivers, if any | .08% | .08% | .09% | .07%A |
Expenses net of all reductions | .08% | .08% | .09% | .07%A |
Net investment income (loss) | 2.10% | 1.82% | 2.06% | 1.82%A |
Supplemental Data | | | | |
Net assets, end of period (000 omitted) | $ 183,117 | $ 88,084 | $ 30,205 | $ 7,931 |
Portfolio turnover rate H | 8% | 21% | 19% | 14%A |
A Annualized
B Total returns for periods of less than one year are not annualized.
C Total returns would have been lower if certain expenses had not been reduced during the applicable periods shown.
D Calculated based on average shares outstanding during the period.
E For the period June 1, 2011 (commencement of operations) to March 31, 2012.
F Expense ratios reflect operating expenses of the Fund. Expenses before reductions do not reflect amounts reimbursed by the investment adviser or reductions from expense offset arrangements and do not represent the amount paid by the Fund during periods when reimbursements or reductions occur. Expense ratios before reductions for start-up periods may not be representative of longer term operating periods. Expenses net of fee waivers reflect expenses after reimbursement by the investment adviser but prior to reductions from expense offset arrangements. Expenses net of all reductions represent the net expenses paid by the Fund.
G Amount represents less than $.01 per share.
H Amounts do not include the activity of the Underlying Funds.
See accompanying notes which are an integral part of the financial statements.
Annual Report
Fidelity Freedom Index 2060 Fund
Investment Changes (Unaudited)
The information in the following tables is based on the direct investments of the Fund. |
Fund Holdings as of March 31, 2015 |
| % of fund's
net assets | % of fund's net assets
6 months ago |
Domestic Equity Funds | | |
Spartan Total Market Index Fund Class F | 61.5 | 61.7 |
Commodity Funds | | |
Fidelity Series Commodity Strategy Fund Class F | 1.3 | 1.3 |
International Equity Funds | | |
Fidelity Series Global ex U.S. Index Fund | 27.1 | 27.0 |
Bond Funds | | |
Spartan U.S. Bond Index Fund Class F | 10.1 | 10.0 |
Net Other Assets (Liabilities)* | 0.0 | 0.0 |
| 100.0 | 100.0 |
* Amount represents less than 0.1%
Asset Allocation (% of fund's net assets) |
Period end |
 | Domestic Equity Funds | 61.5% | |
 | Commodity Funds | 1.3% | |
 | International Equity Funds | 27.1% | |
 | Bond Funds | 10.1% | |

Six months ago |
 | Domestic Equity Funds | 61.7% | |
 | Commodity Funds | 1.3% | |
 | International Equity Funds | 27.0% | |
 | Bond Funds | 10.0% | |

Annual Report
Fidelity Freedom Index 2060 Fund
Investments March 31, 2015
Showing Percentage of Net Assets
Domestic Equity Funds - 61.5% |
| Shares | | Value |
Spartan Total Market Index Fund Class F (b)
(Cost $2,210,188) | 36,941 | | $ 2,251,929 |
Commodity Funds - 1.3% |
| | | |
Fidelity Series Commodity Strategy Fund Class F (a)(b)
(Cost $49,561) | 7,648 | |
47,185
|
International Equity Funds - 27.1% |
| | | |
Fidelity Series Global ex U.S. Index Fund (b)
(Cost $975,891) | 84,013 | |
991,357
|
Bond Funds - 10.1% |
| Shares | | Value |
Spartan U.S. Bond Index Fund Class F (b)
(Cost $367,759) | 31,207 | | $ 369,806 |
TOTAL INVESTMENT
PORTFOLIO - 100.0% (Cost $3,603,399) | | 3,660,277 |
NET OTHER ASSETS (LIABILITIES) - 0.0% | | (95) |
NET ASSETS - 100% | $ 3,660,182 |
Legend |
(a) Non-income producing |
(b) Affiliated Fund |
Affiliated Underlying Funds |
Information regarding the Fund's fiscal year to date purchases and sales of the affiliated Underlying Funds and income earned by the Fund from investments in affiliated Underlying Funds is as follows: |
Affiliate | Value,
beginning of
period | Purchases | Sales
Proceeds | Dividend
Income | Value,
end of
period |
Fidelity Series Commodity Strategy Fund Class F | $ - | $ 53,491 | $ 3,490 | $ - | $ 47,185 |
Fidelity Series Global ex U.S. Index Fund | - | 1,056,390 | 74,989 | 3,677 | 991,357 |
Spartan Total Market Index Fund Class F | - | 2,378,901 | 166,535 | 4,499 | 2,251,929 |
Spartan U.S. Bond Index Fund Class F | - | 399,061 | 31,166 | 1,751 | 369,806 |
Total | $ - | $ 3,887,843 | $ 276,180 | $ 9,927 | $ 3,660,277 |
Other Information |
All investments are categorized as Level 1 under the Fair Value Hierarchy. The inputs or methodology used for valuing securities may not be an indication of the risk associated with investing in those securities. For more information on valuation inputs, please refer to the Investment Valuation section in the accompanying Notes to Financial Statements. |
See accompanying notes which are an integral part of the financial statements.
Annual Report
Fidelity Freedom Index 2060 Fund
Statement of Assets and Liabilities
| March 31, 2015 |
| | |
Assets | | |
Investment in securities, at value (cost $3,603,399) - See accompanying schedule | | $ 3,660,277 |
Receivable for fund shares sold | | 31,692 |
Receivable from affiliate for expense reductions | | 302 |
Total assets | | 3,692,271 |
| | |
Liabilities | | |
Payable for investments purchased | $ 30,664 | |
Payable for fund shares redeemed | 1,020 | |
Transfer agent fees payable | 405 | |
Total liabilities | | 32,089 |
| | |
Net Assets | | $ 3,660,182 |
Net Assets consist of: | | |
Paid in capital | | $ 3,610,663 |
Undistributed net investment income | | 929 |
Accumulated undistributed net realized gain (loss) on investments | | (8,288) |
Net unrealized appreciation (depreciation) on investments | | 56,878 |
Net Assets, for 354,472 shares outstanding | | $ 3,660,182 |
Net Asset Value, offering price and redemption price per share ($3,660,182 ÷ 354,472 shares) | | $ 10.33 |
Statement of Operations
| For the period August 5, 2014
(commencement of operations)
to March 31, 2015 |
Investment Income | | |
Income distributions from underlying funds | | $ 9,927 |
| | |
Expenses | | |
Transfer agent fees | $ 1,037 | |
Independent trustees' compensation | 2 | |
Total expenses before reductions | 1,039 | |
Expense reductions | (451) | 588 |
Net investment income (loss) | | 9,339 |
Realized and Unrealized Gain (Loss) Realized gain (loss) on sale of underlying fund shares | (8,285) | |
Capital gain distributions from underlying funds | 89 | |
Total net realized gain (loss) | | (8,196) |
Change in net unrealized appreciation (depreciation) on investment securities | | 56,878 |
Net gain (loss) | | 48,682 |
Net increase (decrease) in net assets resulting from operations | | $ 58,021 |
See accompanying notes which are an integral part of the financial statements.
Annual Report
Fidelity Freedom Index 2060 Fund
Financial Statements - continued
Statement of Changes in Net Assets
| For the period
August 5, 2014
(commencement of
operations) to
March 31, 2015 |
Increase (Decrease) in Net Assets | |
Operations | |
Net investment income (loss) | $ 9,339 |
Net realized gain (loss) | (8,196) |
Change in net unrealized appreciation (depreciation) | 56,878 |
Net increase (decrease) in net assets resulting from operations | 58,021 |
Distributions to shareholders from net investment income | (8,394) |
Distributions to shareholders from net realized gain | (108) |
Total distributions | (8,502) |
Share transactions
Proceeds from sales of shares | 3,964,409 |
Reinvestment of distributions | 8,392 |
Cost of shares redeemed | (362,138) |
Net increase (decrease) in net assets resulting from share transactions | 3,610,663 |
Total increase (decrease) in net assets | 3,660,182 |
| |
Net Assets | |
Beginning of period | - |
End of period (including undistributed net investment income of $929) | $ 3,660,182 |
Other Information Shares | |
Sold | 389,045 |
Issued in reinvestment of distributions | 821 |
Redeemed | (35,394) |
Net increase (decrease) | 354,472 |
Financial Highlights
Year ended March 31, | 2015E |
Selected Per-Share Data | |
Net asset value, beginning of period | $ 10.00 |
Income from Investment Operations | |
Net investment income (loss) D | .09 |
Net realized and unrealized gain (loss) | .40 |
Total from investment operations | .49 |
Distributions from net investment income | (.16) |
Distributions from net realized gain | - G |
Total distributions | (.16) |
Net asset value, end of period | $ 10.33 |
Total ReturnB, C | 4.90% |
Ratios to Average Net Assets F, H | |
Expenses before reductions | .15%A |
Expenses net of fee waivers, if any | .09%A |
Expenses net of all reductions | .09%A |
Net investment income (loss) | 1.35%A |
Supplemental Data | |
Net assets, end of period (000 omitted) | $ 3,660 |
Portfolio turnover rate H | 33% A |
A Annualized
B Total returns for periods of less than one year are not annualized.
C Total returns would have been lower if certain expenses had not been reduced during the applicable periods shown.
D Calculated based on average shares outstanding during the period.
E For the period August 5, 2014 (commencement of operations) to March 31, 2015.
F Expense ratios reflect operating expenses of the Fund. Expenses before reductions do not reflect amounts reimbursed by the investment adviser or reductions from expense offset arrangements and do not represent the amount paid by the Fund during periods when reimbursements or reductions occur. Expense ratios before reductions for start-up periods may not be representative of longer term operating periods. Expenses net of fee waivers reflect expenses after reimbursement by the investment adviser but prior to reductions from expense offset arrangements. Expenses net of all reductions represent the net expenses paid by the Fund.
G Amount represents less than $.01 per share.
H Amounts do not include the activity of the Underlying Funds.
See accompanying notes which are an integral part of the financial statements.
Annual Report
For the period ended March 31, 2015
1. Organization.
Fidelity Freedom Index Income Fund, Fidelity Freedom Index 2005 Fund, Fidelity Freedom Index 2010 Fund, Fidelity Freedom Index 2015 Fund, Fidelity Freedom Index 2020 Fund, Fidelity Freedom Index 2025 Fund, Fidelity Freedom Index 2030 Fund, Fidelity Freedom Index 2035 Fund, Fidelity Freedom Index 2040 Fund, Fidelity Freedom Index 2045 Fund, Fidelity Freedom Index 2050 Fund, Fidelity Freedom Index 2055 Fund and Fidelity Freedom Index 2060 Fund (the Funds) are funds of Fidelity Aberdeen Street Trust (the Trust). The Trust is registered under the Investment Company Act of 1940, as amended (the 1940 Act), as an open-end management investment company organized as a Delaware statutory trust. Each Fund is authorized to issue an unlimited number of shares. The Funds invest primarily in a combination of other Fidelity equity, bond, and short-term funds (the Underlying Funds) managed by Fidelity Management & Research Company (FMR).
In April 2015, the Board of Trustees approved the creation of an additional class of shares. The Funds' will commence sale of shares of Class W in June 2015.
2. Significant Accounting Policies.
The financial statements have been prepared in conformity with accounting principles generally accepted in the United States of America (GAAP), which require management to make certain estimates and assumptions at the date of the financial statements. Actual results could differ from those estimates. Subsequent events, if any, through the date that the financial statements were issued have been evaluated in the preparation of the financial statements. The following summarizes the significant accounting policies of the Funds:
Investment Valuation. Investments are valued as of 4:00 p.m. Eastern time on the last calendar day of the period. Each Fund categorizes the inputs to valuation techniques used to value its investments into a disclosure hierarchy consisting of three levels as shown below:
Level 1 - quoted prices in active markets for identical investments
Level 2 - other significant observable inputs (including quoted prices for similar investments, interest rates, prepayment speeds, etc.)
Level 3 - unobservable inputs (including the Fund's own assumptions based on the best information available)
Valuation techniques used to value each Fund's investments by major category are as follows. Investments in the Underlying Funds are valued at their closing net asset value (NAV) each business day and are categorized as Level 1 in the hierarchy.
Investment Transactions and Income. For financial reporting purposes, the Funds' investment holdings and NAV include trades executed through the end of the last business day of the period. The NAV per share for processing shareholder transactions is calculated as of the close of business of the New York Stock Exchange (NYSE), normally 4:00 p.m. Eastern time and includes trades executed through the end of the prior business day. Gains and losses on securities sold are determined on the basis of identified cost. Income and capital gain distributions from the Underlying Funds, if any, are recorded on the ex-dividend date.
Expenses. Expenses directly attributable to a fund are charged to that fund. Expenses attributable to more than one fund are allocated among the respective funds on the basis of relative net assets or other appropriate methods. Expenses included in the accompanying financial statements reflect the expenses of each Fund and do not include any expenses associated with the Underlying Funds. Although not included in each Fund's expenses, each Fund indirectly bears its proportionate share of the Underlying Funds' expenses through the impact of these expenses on each Underlying Fund's NAV. Expense estimates are accrued in the period to which they relate and adjustments are made when actual amounts are known.
Income Tax Information and Distributions to Shareholders. Each year, each Fund intends to qualify as a regulated investment company under Subchapter M of the Internal Revenue Code, including distributing substantially all of its taxable income and realized gains. As a result, no provision for U.S. Federal income taxes is required. As of March 31, 2015, each Fund did not have any unrecognized tax benefits in the financial statements; nor is each Fund aware of any tax positions for which it is reasonably possible that the total amounts of unrecognized tax benefits will significantly change in the next twelve months. Each Fund files a U.S. federal tax return, in addition to state and local tax returns as required. Each Fund's federal income tax returns are subject to examination by the Internal Revenue Service (IRS) for a period of three fiscal years after they are filed. State and local tax returns may be subject to examination for an additional fiscal year depending on the jurisdiction.
Distributions are declared and recorded on the ex-dividend date. Income and capital gain distributions are determined in accordance with income tax regulations, which may differ from GAAP. For Fidelity Freedom Index 2025, these differences resulted in distribution reclassifications.
Capital accounts within the financial statements are adjusted for permanent book-tax differences. These adjustments have no impact on net assets or the results of operations. Capital accounts are not adjusted for temporary book-tax differences which will reverse in a subsequent period.
Book-tax differences are primarily due to the short-term gain distributions from the Underlying Funds, capital loss carryforwards and losses deferred due to wash sales.
Annual Report
2. Significant Accounting Policies - continued
Income Tax Information and Distributions to Shareholders - continued
The federal tax cost of investment securities and unrealized appreciation (depreciation) as of period end were as follows for each Fund:
| Tax cost | Gross unrealized appreciation | Gross unrealized depreciation | Net unrealized appreciation (depreciation) on securities |
Fidelity Freedom Index Income Fund | $ 230,058,461 | $ 16,723,942 | $ (2,507,491) | $ 14,216,451 |
Fidelity Freedom Index 2005 Fund | 67,249,193 | 7,886,691 | (615,495) | 7,271,196 |
Fidelity Freedom Index 2010 Fund | 417,112,032 | 66,919,799 | (3,140,553) | 63,779,246 |
Fidelity Freedom Index 2015 Fund | 780,009,681 | 137,070,303 | (6,229,918) | 130,840,385 |
Fidelity Freedom Index 2020 Fund | 2,131,121,154 | 344,073,956 | (16,977,368) | 327,096,588 |
Fidelity Freedom Index 2025 Fund | 1,462,190,232 | 273,496,851 | (11,632,628) | 261,864,223 |
Fidelity Freedom Index 2030 Fund | 1,864,468,451 | 375,953,345 | (15,606,785) | 360,346,560 |
Fidelity Freedom Index 2035 Fund | 1,054,242,393 | 237,387,817 | (9,461,445) | 227,926,372 |
Fidelity Freedom Index 2040 Fund | 1,239,663,242 | 282,333,207 | (10,605,618) | 271,727,589 |
Fidelity Freedom Index 2045 Fund | 621,958,247 | 134,227,069 | (5,809,557) | 128,417,512 |
Fidelity Freedom Index 2050 Fund | 616,559,248 | 118,824,369 | (5,700,710) | 113,123,659 |
Fidelity Freedom Index 2055 Fund | 167,430,853 | 17,508,694 | (1,811,298) | 15,697,396 |
Fidelity Freedom Index 2060 Fund | 3,611,705 | 65,113 | (16,541) | 48,572 |
The tax-based components of distributable earnings as of period end were as follows for each Fund:
| Undistributed ordinary income | Undistributed long-term capital gain | Capital loss carryforward | Net unrealized appreciation (depreciation) on securities and other investments |
Fidelity Freedom Index Income Fund | $ 122,646 | $ - | $ (23,174) | $ 14,216,451 |
Fidelity Freedom Index 2005 Fund | 148,792 | - | (73,316) | 7,271,196 |
Fidelity Freedom Index 2010 Fund | 931,170 | - | (1,433,255) | 63,779,246 |
Fidelity Freedom Index 2015 Fund | 1,583,722 | - | (6,176,252) | 130,840,385 |
Fidelity Freedom Index 2020 Fund | 3,823,128 | - | (17,315,098) | 327,096,588 |
Fidelity Freedom Index 2025 Fund | 1,398,869 | - | (14,627,972) | 261,864,223 |
Fidelity Freedom Index 2030 Fund | 1,555,527 | - | (22,630,397) | 360,346,560 |
Fidelity Freedom Index 2035 Fund | 396,687 | - | (13,956,940) | 227,926,372 |
Fidelity Freedom Index 2040 Fund | 468,349 | - | (15,047,474) | 271,727,589 |
Fidelity Freedom Index 2045 Fund | 235,436 | - | (7,023,819) | 128,417,512 |
Fidelity Freedom Index 2050 Fund | 245,903 | - | (5,744,696) | 113,123,659 |
Fidelity Freedom Index 2055 Fund | 54,607 | - | (551,576) | 15,697,396 |
Fidelity Freedom Index 2060 Fund | 929 | 18 | - | 48,572 |
Capital loss carryforwards are only available to offset future capital gains of the Funds to the extent provided by regulations and may be limited. Under the Regulated Investment Company Modernization Act of 2010 (the Act), the Funds are permitted to carry forward capital losses incurred in taxable years beginning after December 22, 2010 for an unlimited period and such capital losses are required to be used prior to any losses that expire. The
Annual Report
Notes to Financial Statements - continued
2. Significant Accounting Policies - continued
Income Tax Information and Distributions to Shareholders - continued
capital loss carryforward information presented below, including any applicable limitation, is estimated as of fiscal period end and is subject to adjustment.
| No expiration | | |
| Short-term | Long-term | Total capital loss carryfoward |
| | | |
Fidelity Freedom Index Income Fund | $ - | $ (23,174) | $ (23,174) |
Fidelity Freedom Index 2005 Fund | - | (73,316) | (73,316) |
Fidelity Freedom Index 2010 Fund | - | (1,433,255) | (1,433,255) |
Fidelity Freedom Index 2015 Fund | (335,614) | (5,840,639) | (6,176,253) |
Fidelity Freedom Index 2020 Fund | (685,896) | (16,629,202) | (17,315,098) |
Fidelity Freedom Index 2025 Fund | (1,482,489) | (13,145,483) | (14,627,972) |
Fidelity Freedom Index 2030 Fund | (4,058,117) | (18,572,280) | (22,630,397) |
Fidelity Freedom Index 2035 Fund | (2,460,544) | (11,496,396) | (13,956,940) |
Fidelity Freedom Index 2040 Fund | (2,818,435) | (12,229,039) | (15,047,474) |
Fidelity Freedom Index 2045 Fund | (1,800,183) | (5,223,636) | (7,023,819) |
Fidelity Freedom Index 2050 Fund | (1,771,760) | (3,972,936) | (5,744,696) |
Fidelity Freedom Index 2055 Fund | (258,224) | (293,352) | (551,576) |
The tax character of distributions paid was as follows:
March 31, 2015 | | | |
| Ordinary Income | Long-term Capital Gains | Total |
Fidelity Freedom Index Income Fund | $ 4,145,839 | $ 86,065 | $ 4,231,904 |
Fidelity Freedom Index 2005 Fund | 2,113,673 | - | 2,113,673 |
Fidelity Freedom Index 2010 Fund | 14,277,141 | - | 14,277,141 |
Fidelity Freedom Index 2015 Fund | 29,747,123 | - | 29,747,123 |
Fidelity Freedom Index 2020 Fund | 72,151,367 | - | 72,151,367 |
Fidelity Freedom Index 2025 Fund | 52,649,382 | - | 52,649,382 |
Fidelity Freedom Index 2030 Fund | 65,001,285 | - | 65,001,285 |
Fidelity Freedom Index 2035 Fund | 38,042,670 | - | 38,042,670 |
Fidelity Freedom Index 2040 Fund | 43,678,528 | - | 43,678,528 |
Fidelity Freedom Index 2045 Fund | 21,758,720 | - | 21,758,720 |
Fidelity Freedom Index 2050 Fund | 19,764,349 | - | 19,764,349 |
Fidelity Freedom Index 2055 Fund | 2,770,049 | - | 2,770,049 |
Fidelity Freedom Index 2060 Fund | 8,502 | - | 8,502 |
March 31, 2014 | | | |
| Ordinary Income | Long-term Capital Gains | Total |
Fidelity Freedom Index Income Fund | $ 1,665,442 | $ 164,661 | $ 1,830,103 |
Fidelity Freedom Index 2005 Fund | 74,307 | 106,152 | 180,459 |
Fidelity Freedom Index 2010 Fund | 535,474 | 1,011,451 | 1,546,925 |
Fidelity Freedom Index 2015 Fund | 1,082,906 | 703,888 | 1,786,794 |
Fidelity Freedom Index 2020 Fund | 2,428,786 | 1,156,564 | 3,585,350 |
Fidelity Freedom Index 2025 Fund | 1,289,281 | 530,866 | 1,820,147 |
Fidelity Freedom Index 2030 Fund | 1,707,894 | 474,415 | 2,182,309 |
Fidelity Freedom Index 2035 Fund | 683,287 | 52,561 | 735,848 |
Fidelity Freedom Index 2040 Fund | 750,634 | - | 750,634 |
Fidelity Freedom Index 2045 Fund | 230,738 | 57,685 | 288,423 |
Fidelity Freedom Index 2050 Fund | 177,603 | 50,743 | 228,346 |
Fidelity Freedom Index 2055 Fund | 1,044,944 | - | 1,044,944 |
Fidelity Freedom Index 2060 Fund | - | - | - |
Annual Report
2. Significant Accounting Policies - continued
New Accounting Pronouncement. In June 2014, the Financial Accounting Standards Board issued Accounting Standard Update No. 2014-11, Repurchase-to-Maturity Transactions, Repurchase Financings, and Disclosures (the Update). The Update amends the accounting for certain repurchase agreements and expands disclosure requirements for reverse repurchase agreements, securities lending and other similar transactions. The disclosure requirements are effective for annual and interim reporting periods beginning after December 15, 2014. Management is currently evaluating the impact of the Update on the Funds' financial statements and related disclosures.
3. Purchases and Redemptions of Underlying Fund Shares.
Purchases and redemptions of the Underlying Fund shares, other than securities acquired in the merger, are noted in the table below.
| Purchases ($) | Redemptions ($) |
Fidelity Freedom Index Income Fund | 57,524,046 | 42,584,423 |
Fidelity Freedom Index 2005 Fund | 21,530,613 | 15,444,620 |
Fidelity Freedom Index 2010 Fund | 140,345,131 | 105,842,879 |
Fidelity Freedom Index 2015 Fund | 216,689,322 | 167,280,264 |
Fidelity Freedom Index 2020 Fund | 698,790,421 | 340,827,491 |
Fidelity Freedom Index 2025 Fund | 535,699,252 | 227,011,698 |
Fidelity Freedom Index 2030 Fund | 657,148,570 | 229,621,980 |
Fidelity Freedom Index 2035 Fund | 367,047,839 | 141,983,071 |
Fidelity Freedom Index 2040 Fund | 429,020,040 | 162,787,086 |
Fidelity Freedom Index 2045 Fund | 216,688,695 | 76,012,784 |
Fidelity Freedom Index 2050 Fund | 236,459,239 | 58,253,398 |
Fidelity Freedom Index 2055 Fund | 99,337,814 | 10,381,363 |
Fidelity Freedom Index 2060 Fund | 3,887,843 | 276,180 |
4. Fees and Other Transactions with Affiliates.
Management Fee. Strategic Advisers, Inc. (the investment adviser), an affiliate of FMR, provides the Funds with investment management related services. The Funds do not pay any fees for these services.
Other Transactions. The investment adviser has entered into an administration agreement with FMR under which FMR provides management and administrative services (other than investment advisory services) necessary for the operation of each Fund. Pursuant to this agreement, FMR pays all expenses of each Fund, excluding transfer agent fees, compensation of the independent Trustees and certain other expenses such as interest expense. FMR also contracts with other Fidelity companies to perform the services necessary for the operation of each Fund. The Funds do not pay any fees for these services.
Transfer Agent Fees. Fidelity Investments Institutional Operations Company, Inc. (FIIOC), an affiliate of the investment adviser, is the Funds' transfer, dividend disbursing and shareholder servicing agent. FIIOC receives an asset-based fee of .15% based on each Fund's average net assets. FIIOC pays for typesetting, printing and mailing of shareholder reports, except proxy statements.
5. Expense Reductions.
FMR contractually agreed to reimburse each Fund to the extent annual operating expenses, including acquired fund fees and expenses, exceeded certain levels of average net assets as noted in the table below. This reimbursement will remain in place through May 31, 2018. Some expenses, for example interest expense, are excluded from this reimbursement.
The following Funds were in reimbursement during the period:
| Expense Limitations | Reimbursement
from affiliate |
Fidelity Freedom Index Income Fund | .16% | $ 152,659 |
Fidelity Freedom Index 2005 Fund | .16% | 52,026 |
Fidelity Freedom Index 2010 Fund | .16% | 330,143 |
Fidelity Freedom Index 2015 Fund | .16% | 631,870 |
Fidelity Freedom Index 2020 Fund | .16% | 1,537,688 |
Fidelity Freedom Index 2025 Fund | .16% | 1,029,624 |
Annual Report
Notes to Financial Statements - continued
5. Expense Reductions - continued
| Expense Limitations | Reimbursement
from affiliate |
Fidelity Freedom Index 2030 Fund | .16% | $ 1,374,153 |
Fidelity Freedom Index 2035 Fund | .16% | 831,148 |
Fidelity Freedom Index 2040 Fund | .16% | 972,985 |
Fidelity Freedom Index 2045 Fund | .16% | 482,229 |
Fidelity Freedom Index 2050 Fund | .16% | 442,054 |
Fidelity Freedom Index 2055 Fund | .16% | 87,338 |
Fidelity Freedom Index 2060 Fund | .16% | 451 |
6. Merger Information.
On July 25, 2014, the Fidelity Freedom Index Income Fund acquired all of the assets and assumed all of the liabilities of Fidelity Freedom Index 2000 Fund ("Target Fund") pursuant to an Agreement and Plan of Reorganization approved by the Board of Trustees ("The Board") on May 14, 2014. The acquisition was accomplished by an exchange of shares of the Fidelity Freedom Index Income Fund for corresponding shares then outstanding of the Target Fund at its net asset value on the acquisition date. The reorganization provides shareholders of the Target Fund access to a larger portfolio with a similar investment objective. The reorganization qualified as a tax-free reorganization for federal income tax purposes with no gain or loss recognized to the fund or its shareholders. The Target Fund's net assets of $60,344,330, including securities of $60,301,984 and unrealized appreciation of $4,386,725, were combined with the Fidelity Freedom Index Income Fund's net assets of $169,743,228 for total net assets after the acquisition of $230,087,558.
Pro forma results of operations of the combined entity for the entire period ended March 31, 2015, as though the acquisition had occurred as of the beginning of the year (rather than on the actual acquisition dates), are as follows:
Net investment income (loss) | $ 3,421,788 |
Total net realized gain (loss) | 433,004 |
Total change in net unrealized appreciation (depreciation) | 5,073,666 |
Net increase (decrease) in net assets resulting from operations | $ 8,928,458 |
Because the combined investment portfolios have been managed as a single portfolio since the acquisitions were completed, it is not practicable to separate the amounts of revenue and earnings of the acquired fund that have been included in the Fidelity Freedom Index Income Fund's accompanying Statement of Operations since July 25, 2014.
7. Other.
The Funds' organizational documents provide former and current trustees and officers with a limited indemnification against liabilities arising in connection with the performance of their duties to the Funds. In the normal course of business, the Funds may also enter into contracts that provide general indemnifications. The Funds' maximum exposure under these arrangements is unknown as this would be dependent on future claims that may be made against the Funds. The risk of material loss from such claims is considered remote.
The Funds do not invest in the Underlying Funds for the purpose of exercising management or control; however, investments by the Funds within their principal investment strategies may represent a significant portion of the Underlying Fund's net assets. At the end of the period, the following Funds were the owners of record of 10% or more of the total outstanding shares of the Underlying Funds.
Fund | Fidelity Freedom Index 2020 Fund | Fidelity Freedom Index 2025 Fund | Fidelity Freedom Index 2030 Fund | Fidelity Freedom Index 2035 Fund | Fidelity Freedom Index 2040 Fund |
Fidelity Series Global ex U.S. Index Fund | 16% | 13% | 20% | 12% | 15% |
The Funds, in aggregate, were the owners of record of more than 20% of the total outstanding shares of the following Underlying Funds.
Fund | % of shares held |
Fidelity Series Global ex U.S. Index Fund | 100% |
Spartan Total Market Index Fund | 22% |
Annual Report
To the Trustees of Fidelity Aberdeen Street Trust and the Shareholders of Fidelity Freedom Index Income Fund, Fidelity Freedom Index 2005 Fund, Fidelity Freedom Index 2010 Fund, Fidelity Freedom Index 2015 Fund, Fidelity Freedom Index 2020 Fund, Fidelity Freedom Index 2025 Fund, Fidelity Freedom Index 2030 Fund, Fidelity Freedom Index 2035 Fund, Fidelity Freedom Index 2040 Fund, Fidelity Freedom Index 2045 Fund, Fidelity Freedom Index 2050 Fund, Fidelity Freedom Index 2055 Fund and Fidelity Freedom Index 2060 Fund:
We have audited the accompanying statements of assets and liabilities of Fidelity Freedom Index Income Fund, Fidelity Freedom Index 2005 Fund, Fidelity Freedom Index 2010 Fund, Fidelity Freedom Index 2015 Fund, Fidelity Freedom Index 2020 Fund, Fidelity Freedom Index 2025 Fund, Fidelity Freedom Index 2030 Fund, Fidelity Freedom Index 2035 Fund, Fidelity Freedom Index 2040 Fund, Fidelity Freedom Index 2045 Fund, Fidelity Freedom Index 2050 Fund, Fidelity Freedom Index 2055 Fund, and Fidelity Freedom Index 2060 Fund, (the "Funds") including the schedules of investments, as of March 31, 2015, and the related statements of operations, the statements of changes in net assets and the financial highlights for each of the periods presented. These financial statements and financial highlights are the responsibility of the Funds' management. Our responsibility is to express an opinion on these financial statements and financial highlights based on our audits.
We conducted our audits in accordance with the standards of the Public Company Accounting Oversight Board (United States). Those standards require that we plan and perform the audit to obtain reasonable assurance about whether the financial statements and financial highlights are free of material misstatement. The Funds are not required to have, nor were we engaged to perform, an audit of their internal control over financial reporting. Our audits included consideration of internal control over financial reporting as a basis for designing audit procedures that are appropriate in the circumstances, but not for the purpose of expressing an opinion on the effectiveness of the Funds' internal control over financial reporting. Accordingly, we express no such opinion. An audit also includes examining, on a test basis, evidence supporting the amounts and disclosures in the financial statements, assessing the accounting principles used and significant estimates made by management, as well as evaluating the overall financial statement presentation. Our procedures included confirmation of securities owned as of March 31, 2015, by correspondence with the custodians. We believe that our audits provide a reasonable basis for our opinion.
In our opinion, the financial statements and financial highlights referred to above present fairly, in all material respects, the financial position of Fidelity Freedom Index Income Fund, Fidelity Freedom Index 2005 Fund, Fidelity Freedom Index 2010 Fund, Fidelity Freedom Index 2015 Fund, Fidelity Freedom Index 2020 Fund, Fidelity Freedom Index 2025 Fund, Fidelity Freedom Index 2030 Fund, Fidelity Freedom Index 2035 Fund, Fidelity Freedom Index 2040 Fund, Fidelity Freedom Index 2045 Fund, Fidelity Freedom Index 2050 Fund, Fidelity Freedom Index 2055 Fund and Fidelity Freedom Index 2060 Fund as of March 31, 2015, the results of their operations, the changes in their net assets and the financial highlights for each of the periods presented, in conformity with accounting principles generally accepted in the United States of America.
DELOITTE & TOUCHE LLP
Boston, Massachusetts
May 21, 2015
Annual Report
The Trustees, Member of the Advisory Board, and officers of the trust and funds, as applicable, are listed below. The Board of Trustees governs each Fidelity Freedom Index Fund and is responsible for protecting the interests of shareholders. The Trustees are experienced executives who meet periodically throughout the year to oversee each Fidelity Freedom Index Fund's activities, review contractual arrangements with companies that provide services to each Fidelity Freedom Index Fund, oversee management of the risks associated with such activities and contractual arrangements, and review each Fidelity Freedom Index Fund's performance. If the interests of a Fidelity Freedom Index Fund and an underlying Fidelity fund were to diverge, a conflict of interest could arise and affect how the Trustees and Member of the Advisory Board fulfill their fiduciary duties to the affected funds. Strategic Advisers has structured the Fidelity Freedom Index Funds to avoid these potential conflicts, although there may be situations where a conflict of interest is unavoidable. In such instances, Strategic Advisers, the Trustees, and Member of the Advisory Board would take reasonable steps to minimize and, if possible, eliminate the conflict. Except for Elizabeth S. Acton and John Engler, each of the Trustees oversees 235 funds. Ms. Acton and Mr. Engler each oversees 217 funds.
The Trustees hold office without limit in time except that (a) any Trustee may resign; (b) any Trustee may be removed by written instrument, signed by at least two-thirds of the number of Trustees prior to such removal; (c) any Trustee who requests to be retired or who has become incapacitated by illness or injury may be retired by written instrument signed by a majority of the other Trustees; and (d) any Trustee may be removed at any special meeting of shareholders by a two-thirds vote of the outstanding voting securities of the trust. Each Trustee who is not an interested person (as defined in the 1940 Act) of the trust and the funds (Independent Trustee), shall retire not later than the last day of the month in which his or her 75th birthday occurs. The Independent Trustees may waive this mandatory retirement age policy with respect to individual Trustees. The officers and Advisory Board Member hold office without limit in time, except that any officer and Advisory Board Member may resign or may be removed by a vote of a majority of the Trustees at any regular meeting or any special meeting of the Trustees. Except as indicated, each individual has held the office shown or other offices in the same company for the past five years.
Experience, Skills, Attributes, and Qualifications of the Funds' Trustees. The Governance and Nominating Committee has adopted a statement of policy that describes the experience, qualifications, attributes, and skills that are necessary and desirable for potential Independent Trustee candidates (Statement of Policy). The Board believes that each Trustee satisfied at the time he or she was initially elected or appointed a Trustee, and continues to satisfy, the standards contemplated by the Statement of Policy. The Governance and Nominating Committee also engages professional search firms to help identify potential Independent Trustee candidates who have the experience, qualifications, attributes, and skills consistent with the Statement of Policy. From time to time, additional criteria based on the composition and skills of the current Independent Trustees, as well as experience or skills that may be appropriate in light of future changes to board composition, business conditions, and regulatory or other developments, have also been considered by the professional search firms and the Governance and Nominating Committee. In addition, the Board takes into account the Trustees' commitment and participation in Board and committee meetings, as well as their leadership of standing and ad hoc committees throughout their tenure.
In determining that a particular Trustee was and continues to be qualified to serve as a Trustee, the Board has considered a variety of criteria, none of which, in isolation, was controlling. The Board believes that, collectively, the Trustees have balanced and diverse experience, qualifications, attributes, and skills, which allow the Board to operate effectively in governing each fund and protecting the interests of shareholders. Information about the specific experience, skills, attributes, and qualifications of each Trustee, which in each case led to the Board's conclusion that the Trustee should serve (or continue to serve) as a trustee of the funds, is provided below.
Board Structure and Oversight Function. Abigail P. Johnson is an interested person (as defined in the 1940 Act) and currently serves as Chairman. The Trustees have determined that an interested Chairman is appropriate and benefits shareholders because an interested Chairman has a personal and professional stake in the quality and continuity of services provided to the funds. Independent Trustees exercise their informed business judgment to appoint an individual of their choosing to serve as Chairman, regardless of whether the Trustee happens to be independent or a member of management. The Independent Trustees have determined that they can act independently and effectively without having an Independent Trustee serve as Chairman and that a key structural component for assuring that they are in a position to do so is for the Independent Trustees to constitute a substantial majority for the Board. The Independent Trustees also regularly meet in executive session. Albert R. Gamper, Jr. serves as Chairman of the Independent Trustees and as such (i) acts as a liaison between the Independent Trustees and management with respect to matters important to the Independent Trustees and (ii) with management prepares agendas for Board meetings.
Fidelity funds are overseen by different Boards of Trustees. The funds' Board oversees Fidelity's investment-grade bond, money market, and asset allocation funds and other Boards oversee Fidelity's equity and high income funds. The asset allocation funds may invest in Fidelity funds that are overseen by such other Boards. The use of separate Boards, each with its own committee structure, allows the Trustees of each group of Fidelity funds to focus on the unique issues of the funds they oversee, including common research, investment, and operational issues. On occasion, the separate Boards establish joint committees to address issues of overlapping consequences for the Fidelity funds overseen by each Board.
The Trustees operate using a system of committees to facilitate the timely and efficient consideration of all matters of importance to the Trustees, each fund, and fund shareholders and to facilitate compliance with legal and regulatory requirements and oversight of the funds' activities and associated risks. The Board, acting through its committees, has charged FMR and its affiliates with (i) identifying events or circumstances the occurrence of which could have demonstrably adverse effects on the funds' business and/or reputation; (ii) implementing processes and controls to lessen the possibility that such events or circumstances occur or to mitigate the effects of such events or circumstances if they do occur; and (iii) creating and maintaining a system designed to evaluate continuously business and market conditions in order to facilitate the identification and implementation processes described in (i) and (ii) above. Because the day-to-day operations and activities of the funds are carried out by or through FMR, its affiliates, and other service providers, the funds' exposure to risks is mitigated but not eliminated by the processes overseen by the Trustees. While each of the Board's committees has responsibility for overseeing different aspects of the funds' activities, oversight is exercised primarily through the Operations and Audit Committees. In addition, an ad hoc Board committee of Independent Trustees has worked with FMR to enhance the Board's oversight of investment and financial risks, legal and regulatory risks, technology risks, and operational risks, including the development of additional risk reporting to the Board. Appropriate personnel, including but not limited to the funds' Chief Compliance Officer (CCO), FMR's internal auditor, the independent accountants, the funds' Treasurer and portfolio management personnel, make periodic reports to the Board's committees, as appropriate, including an annual review of FMR's risk management program for the Fidelity funds. The responsibilities of each standing committee, including their oversight responsibilities, are described further under "Standing Committees of the Funds' Trustees."
Annual Report
The funds' Statement of Additional Information (SAI) includes more information about the Trustees. To request a free copy, call Fidelity at 1-800-835-5092 (plan accounts) or 1-800-544-8544 (all other accounts).
Interested Trustee*:
Correspondence intended for the Trustee who is an interested person may be sent to Fidelity Investments, 245 Summer Street, Boston, Massachusetts 02210.
Name, Year of Birth; Principal Occupations and Other Relevant Experience+ |
Abigail P. Johnson (1961) |
Year of Election or Appointment: 2009 Trustee Chairman of the Board of Trustees |
| Ms. Johnson also serves as Trustee of other Fidelity funds. Ms. Johnson serves as President (2013-present) and Chief Executive Officer (2014-present) of FMR LLC (diversified financial services company), President of Fidelity Financial Services (2012-present) and President of Personal, Workplace and Institutional Services (2005-present). Ms. Johnson is Chairman and Director of FMR Co., Inc. (investment adviser firm, 2011-present), Chairman and Director of FMR (investment adviser firm, 2011-present), and the Vice Chairman and Director (2007-present) of FMR LLC. Previously, Ms. Johnson served as President and a Director of FMR (2001-2005), a Trustee of other investment companies advised by FMR, Fidelity Investments Money Management, Inc. (investment adviser firm), and FMR Co., Inc. (2001-2005), Senior Vice President of the Fidelity funds (2001-2005), and managed a number of Fidelity funds. Ms. Abigail P. Johnson and Mr. Arthur E. Johnson are not related. |
* Trustee has been determined to be an "Interested Trustee" by virtue of, among other things, her affiliation with the trust or various entities under common control with FMR.
+ The information above includes the Trustee's principal occupation during the last five years and other information relating to the experience, attributes, and skills relevant to the Trustee's qualifications to serve as a Trustee, which led to the conclusion that the Trustee should serve as a Trustee for each fund.
Independent Trustees:
Correspondence intended for each Independent Trustee (that is, the Trustees other than the Interested Trustee) may be sent to Fidelity Investments, P.O. Box 55235, Boston, Massachusetts 02205-5235.
Name, Year of Birth; Principal Occupations and Other Relevant Experience+ |
Elizabeth S. Acton (1951) |
Year of Election or Appointment: 2013 Trustee |
| Ms. Acton also serves as Trustee or Member of the Advisory Board of other Fidelity funds. Prior to her retirement in April 2012, Ms. Acton was Executive Vice President, Finance (2011-2012), Executive Vice President, Chief Financial Officer (2002-2011), and Treasurer (2004-2005) of Comerica Incorporated (financial services). Prior to joining Comerica, Ms. Acton held a variety of positions at Ford Motor Company (1983-2002), including Vice President and Treasurer (2000-2002) and Executive Vice President and Chief Financial Officer of Ford Motor Credit Company (1998-2000). Ms. Acton currently serves as a member of the Board of Directors and Audit and Finance Committees of Beazer Homes USA, Inc. (homebuilding, 2012-present). |
John Engler (1948) |
Year of Election or Appointment: 2014 Trustee |
| Mr. Engler also serves as Trustee or Member of the Advisory Board of other Fidelity funds. He serves as president of the Business Roundtable (2011-present), and on the board of directors/trustees for Universal Forest Products (manufacturer and distributor of wood and wood-alternative products, 2003-present), K12 Inc. (technology-based education company, 2012-present), and the Annie E. Casey Foundation (2004-present). Previously, Mr. Engler served as a trustee of The Munder Funds (2003-2014), president and CEO of the National Association of Manufacturers (2004-2011) and as governor of Michigan (1991-2003). He is a past chairman of the National Governors Association. |
Albert R. Gamper, Jr. (1942) |
Year of Election or Appointment: 2006 Trustee Chairman of the Independent Trustees |
| Mr. Gamper also serves as Trustee of other Fidelity funds. Prior to his retirement in December 2004, Mr. Gamper served as Chairman of the Board of CIT Group Inc. (commercial finance). During his tenure with CIT Group Inc. Mr. Gamper served in numerous senior management positions, including Chairman (1987-1989; 1999-2001; 2002-2004), Chief Executive Officer (1987-2004), and President (2002-2003). Mr. Gamper currently serves as a member of the Board of Directors of Public Service Enterprise Group (utilities, 2000-present), and Member of the Board of Trustees of Barnabas Health Care System (1997-present). Previously, Mr. Gamper served as Vice Chairman of the Independent Trustees of certain Fidelity funds (2011-2012) and as Chairman of the Board of Governors, Rutgers University (2004-2007). |
Robert F. Gartland (1951) |
Year of Election or Appointment: 2010 Trustee |
| Mr. Gartland also serves as Trustee of other Fidelity funds. Mr. Gartland is Chairman and an investor in Gartland and Mellina Group Corp. (consulting, 2009-present). Previously, Mr. Gartland served as a partner and investor of Vietnam Partners LLC (investments and consulting, 2008-2011). Prior to his retirement, Mr. Gartland held a variety of positions at Morgan Stanley (financial services, 1979-2007) including Managing Director (1987-2007). |
Arthur E. Johnson (1947) |
Year of Election or Appointment: 2008 Trustee |
| Mr. Johnson also serves as Trustee of other Fidelity funds. Mr. Johnson serves as a member of the Board of Directors of Eaton Corporation plc (diversified power management, 2009-present), AGL Resources, Inc. (holding company, 2002-present) and Booz Allen Hamilton (management consulting, 2011-present). Prior to his retirement, Mr. Johnson served as Senior Vice President of Corporate Strategic Development of Lockheed Martin Corporation (defense contractor, 1999-2009). He previously served on the Board of Directors of IKON Office Solutions, Inc. (1999-2008) and Delta Airlines (2005-2007). Mr. Arthur E. Johnson is not related to Ms. Abigail P. Johnson. |
Michael E. Kenneally (1954) |
Year of Election or Appointment: 2009 Trustee |
| Mr. Kenneally also serves as Trustee of other Fidelity funds. Mr. Kenneally served as a Member of the Advisory Board for certain Fidelity funds before joining the Board of Trustees (2008-2009). Prior to his retirement, Mr. Kenneally served as Chairman and Global Chief Executive Officer of Credit Suisse Asset Management. Before joining Credit Suisse, he was an Executive Vice President and Chief Investment Officer for Bank of America Corporation. Earlier roles at Bank of America included Director of Research, Senior Portfolio Manager and Research Analyst, and Mr. Kenneally was awarded the Chartered Financial Analyst (CFA) designation in 1991. |
James H. Keyes (1940) |
Year of Election or Appointment: 2007 Trustee |
| Mr. Keyes also serves as Trustee of other Fidelity funds. Mr. Keyes serves as a member of the Board and Non-Executive Chairman of Navistar International Corporation (manufacture and sale of trucks, buses, and diesel engines, since 2002). Previously, Mr. Keyes served as a member of the Board of Pitney Bowes, Inc. (integrated mail, messaging, and document management solutions, 1998-2013). Prior to his retirement, Mr. Keyes served as Chairman (1993-2002) and Chief Executive Officer (1988-2002) of Johnson Controls (automotive, building, and energy) and as a member of the Board of LSI Logic Corporation (semiconductor technologies, 1984-2008). |
Marie L. Knowles (1946) |
Year of Election or Appointment: 2001 Trustee Vice Chairman of the Independent Trustees |
| Ms. Knowles also serves as Trustee of other Fidelity funds. Prior to Ms. Knowles' retirement in June 2000, she served as Executive Vice President and Chief Financial Officer of Atlantic Richfield Company (ARCO) (diversified energy, 1996-2000). From 1993 to 1996, she was a Senior Vice President of ARCO and President of ARCO Transportation Company. She served as a Director of ARCO from 1996 to 1998. Ms. Knowles currently serves as a Director and Chairman of the Audit Committee of McKesson Corporation (healthcare service, since 2002). Ms. Knowles is a member of the Board of the Catalina Island Conservancy and of the Santa Catalina Island Company (2009-present). She also serves as a member of the Advisory Board for the School of Engineering of the University of Southern California. Previously, Ms. Knowles served as a Director of Phelps Dodge Corporation (copper mining and manufacturing, 1994-2007), URS Corporation (engineering and construction, 2000-2003) and America West (airline, 1999-2002). |
+ The information above includes each Trustee's principal occupation during the last five years and other information relating to the experience, attributes, and skills relevant to each Trustee's qualifications to serve as a Trustee, which led to the conclusion that each Trustee should serve as a Trustee for each fund.
Advisory Board Member and Officers:
Correspondence intended for each officer and Geoffrey A. von Kuhn may be sent to Fidelity Investments, 245 Summer Street, Boston, Massachusetts 02210. Officers appear below in alphabetical order.
Name, Year of Birth; Principal Occupation |
Geoffrey A. von Kuhn (1951) |
Year of Election or Appointment: 2015 Member of the Advisory Board |
| Mr. von Kuhn also serves as a Trustee or Member of the Advisory Board of other Fidelity funds. Mr. von Kuhn is Chief Administrative Officer for FMR LLC (diversified financial services company, 2013-present), a Director of Pembroke Real Estate, Inc. (2009-present), and a Director of Discovery Natural Resources LLC (2012-present). Previously, Mr. von Kuhn was a managing director of Crosby Group (private wealth management company, 2007-2013), a member of the management committee and senior executive in the Wealth Management Group of AmSouth Bank (2001-2006), and head of the U.S. private bank at Citigroup (2000-2001). |
Elizabeth Paige Baumann (1968) |
Year of Election or Appointment: 2012 Anti-Money Laundering (AML) Officer |
| Ms. Baumann also serves as AML Officer of other funds. She is Chief AML Officer of FMR LLC (diversified financial services company, 2012-present) and is an employee of Fidelity Investments. Previously, Ms. Baumann served as Vice President and Deputy Anti-Money Laundering Officer (2007-2012). |
Marc Bryant (1966) |
Year of Election or Appointment: 2013 Assistant Secretary |
| Mr. Bryant also serves as an officer of other funds. He is Senior Vice President and Deputy General Counsel of FMR LLC (diversified financial services company). Previously, Mr. Bryant served as Secretary and Chief Legal Officer of Fidelity Rutland Square Trust II (2010-2014). Prior to joining Fidelity Investments, Mr. Bryant served as a Senior Vice President and the Head of Global Retail Legal for AllianceBernstein L.P. (2006-2010), and as the General Counsel for ProFund Advisors LLC (2001-2006). |
Jonathan Davis (1968) |
Year of Election or Appointment: 2010 Assistant Treasurer |
| Mr. Davis also serves as Assistant Treasurer of other funds. Mr. Davis is an employee of Fidelity Investments. Previously, Mr. Davis served as Vice President and Associate General Counsel of FMR LLC (diversified financial services company, 2003-2010). |
Adrien E. Deberghes (1967) |
Year of Election or Appointment: 2010 Assistant Treasurer |
| Mr. Deberghes also serves as an officer of other funds. He is an employee of Fidelity Investments (2008-present). Prior to joining Fidelity Investments, Mr. Deberghes was Senior Vice President of Mutual Fund Administration at State Street Corporation (2007-2008), Senior Director of Mutual Fund Administration at Investors Bank & Trust (2005-2007), and Director of Finance for Dunkin' Brands (2000-2005). |
Stephanie J. Dorsey (1969) |
Year of Election or Appointment: 2013 President and Treasurer |
| Ms. Dorsey also serves as an officer of other funds. She is an employee of Fidelity Investments (2008-present) and has served in other fund officer roles. Prior to joining Fidelity Investments, Ms. Dorsey served as Treasurer (2004-2008) of the JPMorgan Mutual Funds and Vice President (2004-2008) of JPMorgan Chase Bank. |
Howard J. Galligan III (1966) |
Year of Election or Appointment: 2014 Chief Financial Officer |
| Mr. Galligan also serves as Chief Financial Officer of other funds. Mr. Galligan serves as President of Fidelity Pricing and Cash Management Services (FPCMS) (2014-present) and as a Director of Strategic Advisers, Inc. (investment adviser firm, 2008-
present). Previously, Mr. Galligan served as Chief Administrative Officer of Asset Management (2011-2014) and Chief Operating Officer and Senior Vice President of Investment Support for Strategic Advisers, Inc. (2003-2011). |
Scott C. Goebel (1968) |
Year of Election or Appointment: 2008 Secretary and Chief Legal Officer (CLO) |
| Mr. Goebel serves as Secretary and CLO of other funds. Mr. Goebel also serves as Secretary of Fidelity SelectCo, LLC (investment adviser firm, 2013-present), Fidelity Investments Money Management, Inc. (FIMM) (investment adviser firm, 2010-present) and Fidelity Research and Analysis Company (FRAC) (investment adviser firm, 2010-present); General Counsel, Secretary, and Senior Vice President of FMR (investment adviser firm, 2008-present) and FMR Co., Inc. (investment adviser firm, 2008-present); Chief Legal Officer of Fidelity Management & Research (Hong Kong) Limited (investment adviser firm, 2008-present); and Assistant Secretary of Fidelity Management & Research (Japan) Limited (investment adviser firm, 2008-present) and FMR Investment Management (U.K.) Limited (investment adviser firm, 2008-present). Previously, Mr. Goebel served as Secretary and CLO of other Fidelity funds (2008-2013), Assistant Secretary of FIMM (2008-2010), FRAC (2008-2010), and certain funds (2007-2008); and as Vice President and Secretary of Fidelity Distributors Corporation (FDC) (2005-2007). Mr. Goebel has been employed by FMR LLC (diversified financial services company) or an affiliate since 2001. |
Bruce T. Herring (1965) |
Year of Election or Appointment: 2013 Vice President of Fidelity's Asset Allocation Funds |
| Mr. Herring also serves as Vice President of other funds. He serves as Chief Investment Officer of Fidelity Global Asset Allocation (GAA) (2013-present), Group Chief Investment Officer of FMR (investment adviser firm), and President of Fidelity Research & Analysis Company (investment adviser firm, 2010-present). Previously, Mr. Herring served as Vice President of certain Equity Funds (2006-2014), Chief Investment Officer and Director of Fidelity Management & Research (U.K.) Inc. (investment adviser firm, 2010-2013), Vice President (2005-2006) and Senior Vice President (2006-2007) of Fidelity Management & Research Company (investment adviser firm), Vice President of FMR Co., Inc. (investment adviser firm, 2001-2007), and as a portfolio manager for Fidelity U.S. Equity Funds. |
Chris Maher (1972) |
Year of Election or Appointment: 2013 Assistant Treasurer |
| Mr. Maher serves as Assistant Treasurer of other funds. Mr. Maher is Vice President of Valuation Oversight and is an employee of Fidelity Investments. Previously, Mr. Maher served as Vice President of Asset Management Compliance (2013), Vice President of the Program Management Group of FMR (investment adviser firm, 2010-2013), and Vice President of Valuation Oversight (2008-2010). |
Nancy D. Prior (1967) |
Year of Election or Appointment: 2014 Vice President |
| Ms. Prior also serves as Vice President of other funds. Ms. Prior serves as a Director of Fidelity Investments Money Management, Inc. (FIMM) (investment adviser firm, 2014-present), President, Fixed Income (2014-present), Vice Chairman of Pyramis Global Advisors, LLC (investment adviser firm, 2014-present), and is an employee of Fidelity Investments (2002-present). Previously, Ms. Prior served as Vice President of Fidelity's Money Market Funds (2012-2014), President, Money Market and Short Duration Bond of FMR (investment adviser firm, 2013-2014), President, Money Market Group of FMR (2011-2014), Managing Director of Research (2009-2011), Senior Vice President and Deputy General Counsel (2007-2009), and Assistant Secretary of other Fidelity funds (2008-2009). |
Kenneth B. Robins (1969) |
Year of Election or Appointment: 2009 Assistant Treasurer |
| Mr. Robins also serves as an officer of other funds. Mr. Robins serves as Executive Vice President of Fidelity Investments Money Management, Inc. (FIMM) (investment adviser firm, 2013-present) and is an employee of Fidelity Investments (2004-present). Previously, Mr. Robins served in other fund officer roles. |
Stephen Sadoski (1971) |
Year of Election or Appointment: 2013 Deputy Treasurer |
| Mr. Sadoski also serves as Deputy Treasurer of other funds. He is an employee of Fidelity Investments (2012-present) and has served in another fund officer role. Prior to joining Fidelity Investments, Mr. Sadoski served as an assistant chief accountant in the Division of Investment Management of the Securities and Exchange Commission (SEC) (2009-2012) and as a senior manager at Deloitte & Touche LLP (1997-2009). |
Stacie M. Smith (1974) |
Year of Election or Appointment: 2013 Assistant Treasurer |
| Ms. Smith also serves as an officer of other funds. She is an employee of Fidelity Investments (2009-present) and has served in other fund officer roles. Prior to joining Fidelity Investments, Ms. Smith served as Senior Audit Manager of Ernst & Young LLP (1996-2009). |
Renee Stagnone (1975) |
Year of Election or Appointment: 2013 Deputy Treasurer |
| Ms. Stagnone also serves as Deputy Treasurer of other funds. Ms. Stagnone is an employee of Fidelity Investments. |
Michael H. Whitaker (1967) |
Year of Election or Appointment: 2008 Chief Compliance Officer |
| Mr. Whitaker also serves as Chief Compliance Officer of other funds. Mr. Whitaker also serves as Compliance Officer of FMR Co., Inc. (investment adviser firm, 2014-present), FMR (investment adviser firm, 2014-present), Fidelity Investments Money Management, Inc. (investment adviser firm, 2014-present), and is an employee of Fidelity Investments (2007-present). Prior to joining Fidelity Investments, Mr. Whitaker worked at MFS Investment Management where he served as Senior Vice President and Chief Compliance Officer (2004-2006), and Assistant General Counsel. |
Derek L. Young (1964) |
Year of Election or Appointment: 2009 Vice President of Fidelity's Asset Allocation Funds |
| Mr. Young also serves as Trustee or an officer of other funds. He is President and a Director of Strategic Advisers, Inc. (investment adviser firm, 2011-present), President of Fidelity Global Asset Allocation (GAA) (2011-present), and Vice Chairman of Pyramis Global Advisors, LLC (investment adviser firm, 2011-present). Previously, Mr. Young served as Chief Investment Officer of GAA (2009-2011) and as a portfolio manager. |
Joseph F. Zambello (1957) |
Year of Election or Appointment: 2011 Deputy Treasurer |
| Mr. Zambello also serves as Deputy Treasurer of other funds. Mr. Zambello is an employee of Fidelity Investments. Previously, Mr. Zambello served as Vice President of the Program Management Group of FMR (investment adviser firm, 2009-2011) and Vice President of the Transfer Agent Oversight Group (2005-2009). |
Annual Report
The funds hereby designate as capital gain dividend the amounts noted below for the taxable year ended March 31, 2015, or, if subsequently determined to be different, the net capital gain of such year.
Fidelity Freedom Index 2060 Fund | $18 |
A percentage of the dividends distributed during the fiscal year for the following funds were derived from interest on U.S. Government securities which is generally exempt from state income tax:
Fidelity Freedom Index Income Fund | 24.29% |
Fidelity Freedom Index 2005 Fund | 18.65% |
Fidelity Freedom Index 2010 Fund | 16.13% |
Fidelity Freedom Index 2015 Fund | 13.65% |
Fidelity Freedom Index 2020 Fund | 12.06% |
Fidelity Freedom Index 2025 Fund | 9.69% |
Fidelity Freedom Index 2030 Fund | 5.55% |
Fidelity Freedom Index 2035 Fund | 3.26% |
Fidelity Freedom Index 2040 Fund | 3.32% |
Fidelity Freedom Index 2045 Fund | 3.24% |
Fidelity Freedom Index 2050 Fund | 3.27% |
Fidelity Freedom Index 2055 Fund | 3.16% |
Fidelity Freedom Index 2060 Fund | 4.88% |
A percentage of the dividends distributed during the fiscal year for the following funds qualify for the dividends-received deduction for corporate shareholders:
Fidelity Freedom Index Income Fund | |
May 2014 | 4% |
June 2014 | 19% |
July 2014 | 19% |
August 2014 | 19% |
September 2014 | 19% |
October 2014 | 19% |
November 2014 | 19% |
December 2014 | 19% |
February 2015 | 0% |
March 2015 | 0% |
| |
Fidelity Freedom Index 2005 Fund | |
May 2014 | 16% |
December 2014 | 27% |
| |
Fidelity Freedom Index 2010 Fund | |
May 2014 | 25% |
December 2014 | 31% |
| |
Fidelity Freedom Index 2015 Fund | |
May 2014 | 28% |
December 2014 | 34% |
| |
Fidelity Freedom Index 2020 Fund | |
May 2014 | 31% |
December 2014 | 36% |
| |
Fidelity Freedom Index 2025 Fund | |
May 2014 | 37% |
December 2014 | 38% |
| |
Fidelity Freedom Index 2030 Fund | |
May 2014 | 44% |
December 2014 | 45% |
| |
Fidelity Freedom Index 2035 Fund | |
May 2014 | 49% |
December 2014 | 48% |
| |
Fidelity Freedom Index 2040 Fund | |
May 2014 | 50% |
December 2014 | 48% |
| |
Fidelity Freedom Index 2045 Fund | |
May 2014 | 52% |
December 2014 | 48% |
| |
Fidelity Freedom Index 2050 Fund | |
May 2014 | 52% |
December 2014 | 48% |
| |
Fidelity Freedom Index 2055 Fund | |
May 2014 | 12% |
December 2014 | 47% |
| |
Fidelity Freedom Index 2060 Fund | |
December 2014 | 49% |
A percentage of the dividends distributed during the fiscal year for the following funds may be taken into account as a dividend for purposes of the maximum rate under section 1(h)(11) of the Internal Revenue Code.
Fidelity Freedom Index Income Fund | |
May 2014 | 7% |
June 2014 | 33% |
July 2014 | 33% |
August 2014 | 33% |
September 2014 | 33% |
October 2014 | 33% |
November 2014 | 33% |
December 2014 | 33% |
February 2015 | 0% |
March 2015 | 0% |
| |
Fidelity Freedom Index 2005 Fund | |
May 2014 | 33% |
December 2014 | 45% |
| |
Fidelity Freedom Index 2010 Fund | |
May 2014 | 37% |
December 2014 | 52% |
| |
Fidelity Freedom Index 2015 Fund | |
May 2014 | 41% |
December 2014 | 57% |
| |
Fidelity Freedom Index 2020 Fund | |
May 2014 | 46% |
December 2014 | 61% |
| |
Fidelity Freedom Index 2025 Fund | |
May 2014 | 55% |
December 2014 | 64% |
| |
Fidelity Freedom Index 2030 Fund | |
May 2014 | 64% |
December 2014 | 77% |
Fidelity Freedom Index 2035 Fund | |
May 2014 | 72% |
December 2014 | 81% |
| |
Fidelity Freedom Index 2040 Fund | |
May 2014 | 73% |
December 2014 | 81% |
| |
Fidelity Freedom Index 2045 Fund | |
May 2014 | 75% |
December 2014 | 81% |
| |
Fidelity Freedom Index 2050 Fund | |
May 2014 | 76% |
December 2014 | 81% |
| |
Fidelity Freedom Index 2055 Fund | |
May 2014 | 95% |
December 2014 | 81% |
| |
Fidelity Freedom Index 2060 Fund | |
December 2014 | 85% |
The funds will notify shareholders in January 2016 of amounts for use in preparing 2015 income tax returns.
Annual Report
ContentsPerformance: The Bottom LinePerformance: The Bottom LinePerformance: The Bottom LinePerformance: The Bottom LinePerformance: The Bottom LinePerformance: The Bottom LinePerformance: The Bottom LinePerformance: The Bottom LinePerformance: The Bottom LinePerformance: The Bottom LinePerformance: The Bottom LinePerformance: The Bottom LinePerformance: The Bottom LineManagement's Discussion of Fund PerformanceShareholder Expense ExampleInvestment Changes (Unaudited)Investments March 31, 2015Financial StatementsInvestment Changes (Unaudited)Investments March 31, 2015Financial StatementsInvestment Changes (Unaudited)Investments March 31, 2015Financial StatementsInvestment Changes (Unaudited)Investments March 31, 2015Financial StatementsInvestment Changes (Unaudited)Investments March 31, 2015Financial StatementsInvestment Changes (Unaudited)Investments March 31, 2015Financial StatementsInvestment Changes (Unaudited)Investments March 31, 2015Financial StatementsInvestment Changes (Unaudited)Investments March 31, 2015Financial StatementsInvestment Changes (Unaudited)Investments March 31, 2015Financial StatementsInvestment Changes (Unaudited)Investments March 31, 2015Financial StatementsInvestment Changes (Unaudited)Investments March 31, 2015Financial StatementsInvestment Changes (Unaudited)Investments March 31, 2015Financial StatementsInvestment Changes (Unaudited)Investments March 31, 2015Financial StatementsNotes to Financial StatementsReport of Independent Registered Public Accounting FirmTrustees and OfficersDistributions (Unaudited)
Fidelity Freedom® Funds -
Income, 2005, 2010, 2015, 2020, 2025, 2030, 2035, 2040, 2045, 2050, 2055, 2060
Annual Report
March 31, 2015
(Fidelity Cover Art)
Contents
To view a fund's proxy voting guidelines and proxy voting record for the 12-month period ended June 30, visit http://www.fidelity.com/proxyvotingresults or visit the Securities and Exchange Commission's (SEC) web site at http://www.sec.gov. You may also call 1-800-544-8544 to request a free copy of the proxy voting guidelines.
Standard & Poor's, S&P and S&P 500 are registered service marks of The McGraw-Hill Companies, Inc. and have been licensed for use by Fidelity Distributors Corporation.
Other third-party marks appearing herein are the property of their respective owners.
All other marks appearing herein are registered or unregistered trademarks or service marks of FMR LLC or an affiliated company. © 2015 FMR LLC. All rights reserved.
This report and the financial statements contained herein are submitted for the general information of the shareholders of the funds. This report is not authorized for distribution to prospective investors in the funds unless preceded or accompanied by an effective prospectus.
A fund files its complete schedule of portfolio holdings with the SEC for the first and third quarters of each fiscal year on Form N-Q. Forms N-Q are available on the SEC's web site at http://www.sec.gov. A fund's Forms N-Q may be reviewed and copied at the SEC's Public Reference Room in Washington, DC. Information regarding the operation of the SEC's Public Reference Room may be obtained by calling 1-800-SEC-0330. For a complete list of a fund's portfolio holdings, view the most recent holdings listing, semiannual report, or annual report on Fidelity's web site at http://www.fidelity.com, http://www.advisor.fidelity.com, or http://www.401k.com, as applicable.
NOT FDIC INSURED • MAY LOSE VALUE • NO BANK GUARANTEE
Neither the funds nor Fidelity Distributors Corporation is a bank.
Annual Report
Fidelity Freedom Income Fund
Performance: The Bottom Line
Average annual total return reflects the change in the value of an investment, assuming reinvestment of the fund's distributions from dividend income and capital gains (the profits earned upon the sale of securities that have grown in value, if any) and assuming a constant rate of performance each year. The $10,000 table and the fund's returns do not reflect the deduction of taxes that a shareholder would pay on fund distributions or the redemption of fund shares. During periods of reimbursement by Fidelity, a fund's total return will be greater than it would be had the reimbursement not occurred. How a fund did yesterday is no guarantee of how it will do tomorrow.
Average Annual Total Returns
Periods ended March 31, 2015 | Past 1
year | Past 5
years | Past 10
years |
Fidelity Freedom Income Fund | 4.31% | 4.76% | 4.34% |
$10,000 Over 10 Years
Let's say hypothetically that $10,000 was invested in Fidelity Freedom Income Fund on March 31, 2005. The chart shows how the value of your investment would have changed, and also shows how the Barclays® U.S. Aggregate Bond Index performed over the same period.
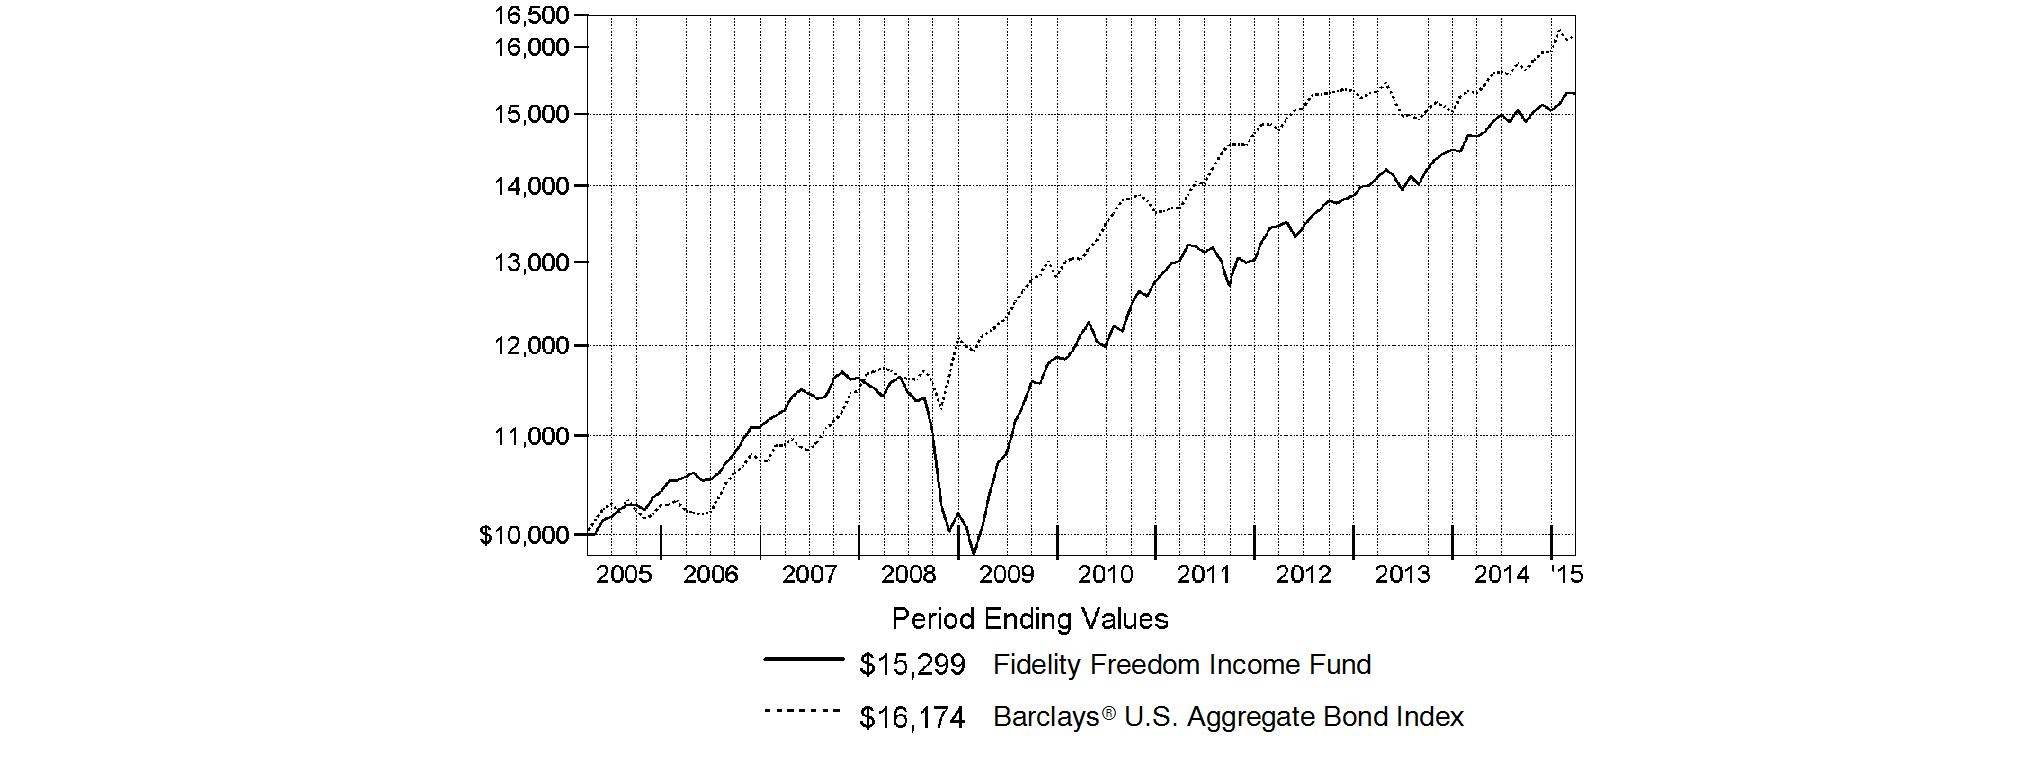
Annual Report
Fidelity Freedom 2005 Fund
Performance: The Bottom Line
Average annual total return reflects the change in the value of an investment, assuming reinvestment of the fund's distributions from dividend income and capital gains (the profits earned upon the sale of securities that have grown in value, if any) and assuming a constant rate of performance each year. The $10,000 table and the fund's returns do not reflect the deduction of taxes that a shareholder would pay on fund distributions or the redemption of fund shares. During periods of reimbursement by Fidelity, a fund's total return will be greater than it would be had the reimbursement not occurred. How a fund did yesterday is no guarantee of how it will do tomorrow.
Average Annual Total Returns
Periods ended March 31, 2015 | | Past 1
year | Past 5
years | Past 10
years |
Fidelity Freedom 2005 Fund | | 5.26% | 6.18% | 4.96% |
$10,000 Over 10 Years
Let's say hypothetically that $10,000 was invested in Fidelity Freedom 2005 Fund on March 31, 2005. The chart shows how the value of your investment would have changed, and also shows how the Barclays U.S. Aggregate Bond Index performed over the same period.
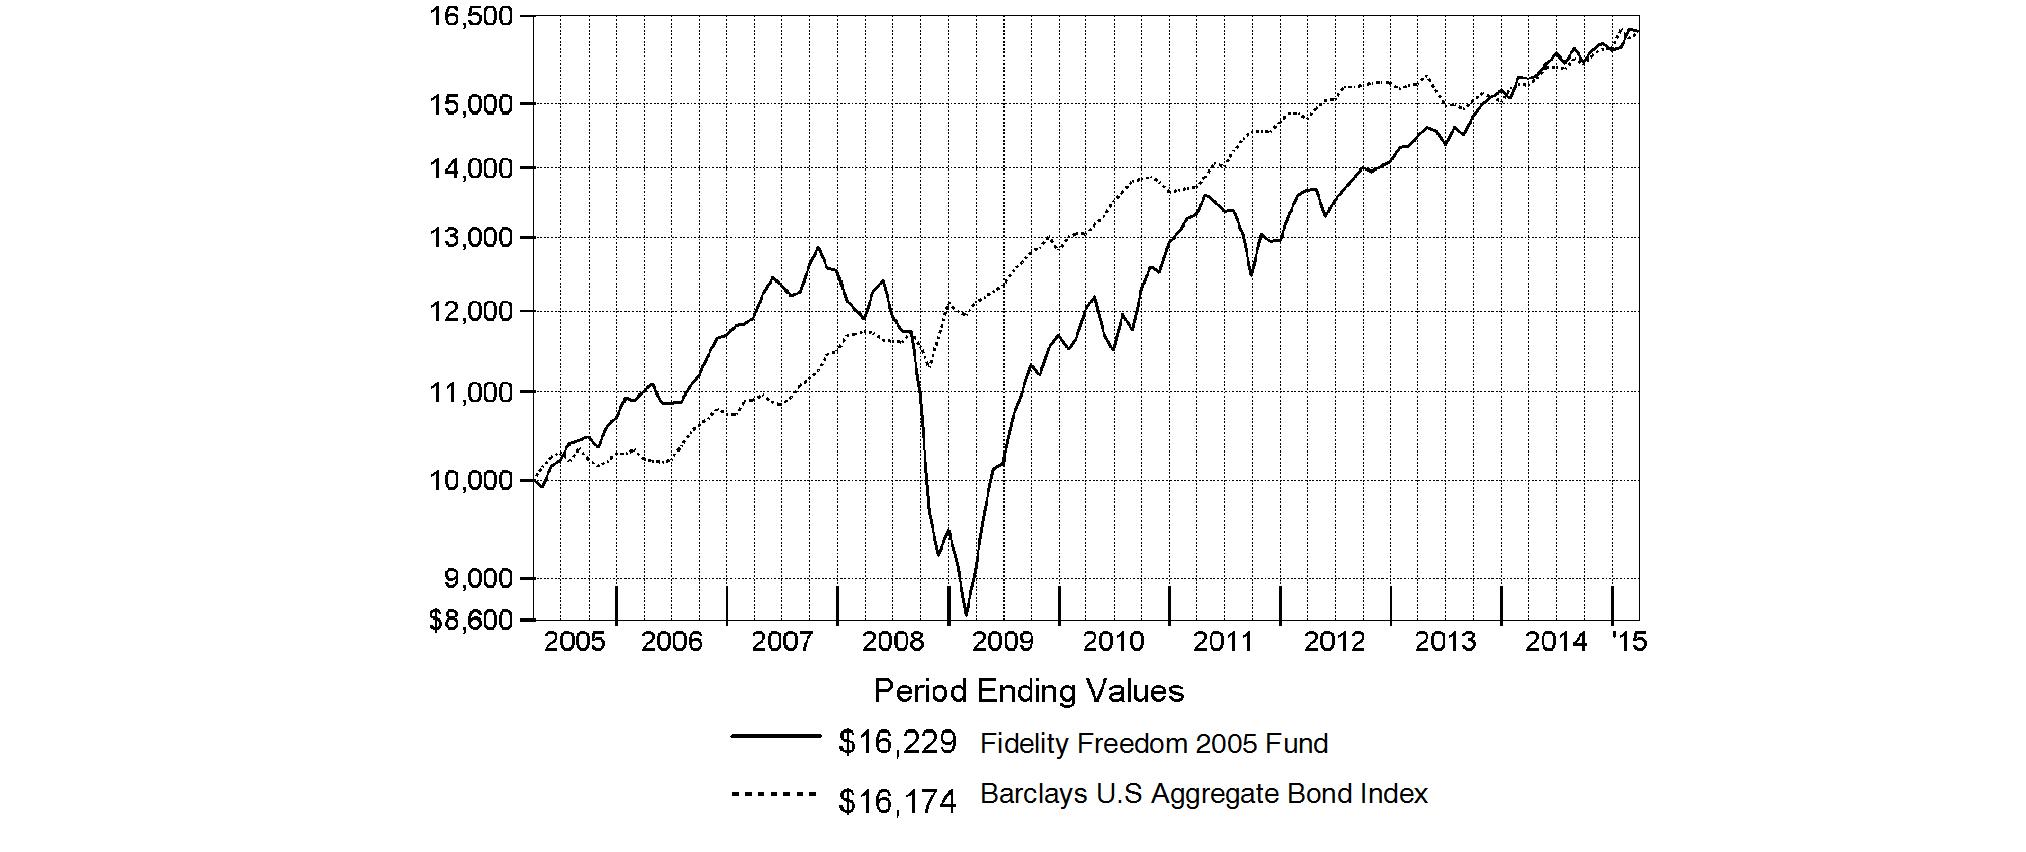
Annual Report
Fidelity Freedom 2010 Fund
Performance: The Bottom Line
Average annual total return reflects the change in the value of an investment, assuming reinvestment of the fund's distributions from dividend income and capital gains (the profits earned upon the sale of securities that have grown in value, if any) and assuming a constant rate of performance each year. The $10,000 table and the fund's returns do not reflect the deduction of taxes that a shareholder would pay on fund distributions or the redemption of fund shares. During periods of reimbursement by Fidelity, a fund's total return will be greater than it would be had the reimbursement not occurred. How a fund did yesterday is no guarantee of how it will do tomorrow.
Average Annual Total Returns
Periods ended March 31, 2015 | Past 1
year | Past 5
years | Past 10
years |
Fidelity Freedom 2010 Fund | 5.91% | 7.30% | 5.59% |
$10,000 Over 10 Years
Let's say hypothetically that $10,000 was invested in Fidelity Freedom 2010 Fund on March 31, 2005. The chart shows how the value of your investment would have changed, and also shows how the Barclays U.S. Aggregate Bond Index performed over the same period.
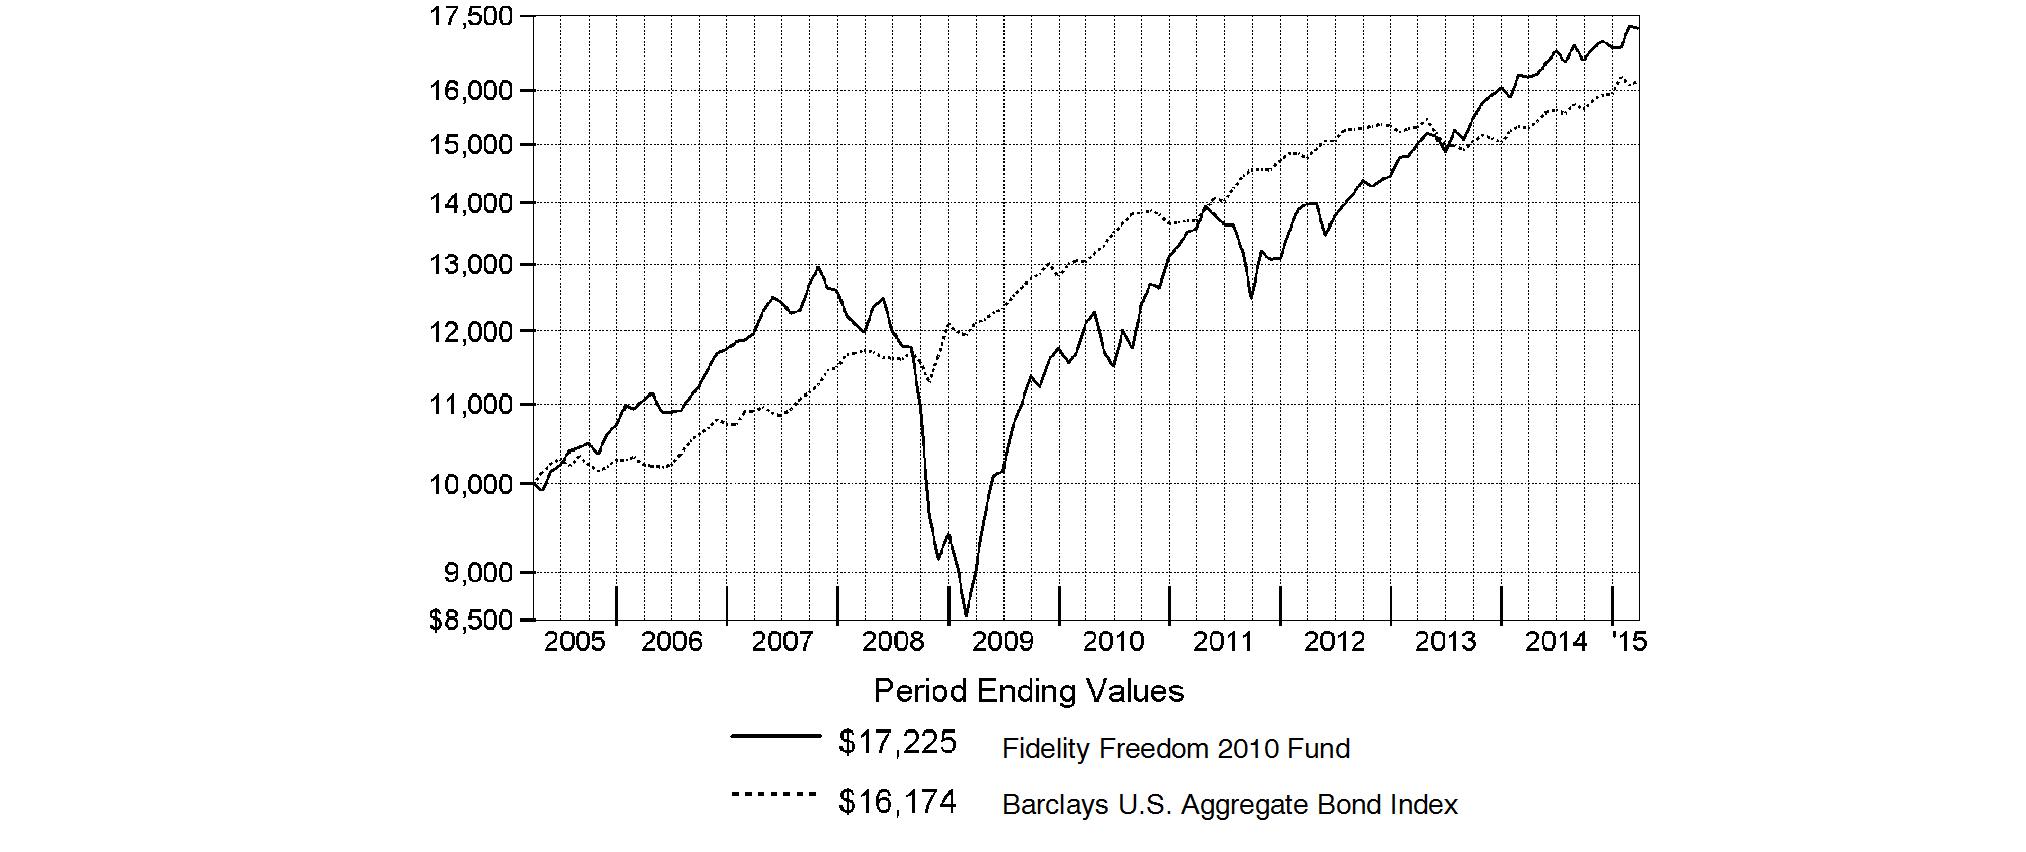
Annual Report
Fidelity Freedom 2015 Fund
Performance: The Bottom Line
Average annual total return reflects the change in the value of an investment, assuming reinvestment of the fund's distributions from dividend income and capital gains (the profits earned upon the sale of securities that have grown in value, if any) and assuming a constant rate of performance each year. The $10,000 table and the fund's returns do not reflect the deduction of taxes that a shareholder would pay on fund distributions or the redemption of fund shares. During periods of reimbursement by Fidelity, a fund's total return will be greater than it would be had the reimbursement not occurred. How a fund did yesterday is no guarantee of how it will do tomorrow.
Average Annual Total Returns
Periods ended March 31, 2015 | | Past 1
year | Past 5
years | Past 10
years |
Fidelity Freedom 2015 Fund | | 6.42% | 7.59% | 5.82% |
$10,000 Over 10 Years
Let's say hypothetically that $10,000 was invested in Fidelity Freedom 2015 Fund on March 31, 2005. The chart shows how the value of your investment would have changed, and also shows how the S&P 500® Index performed over the same period.
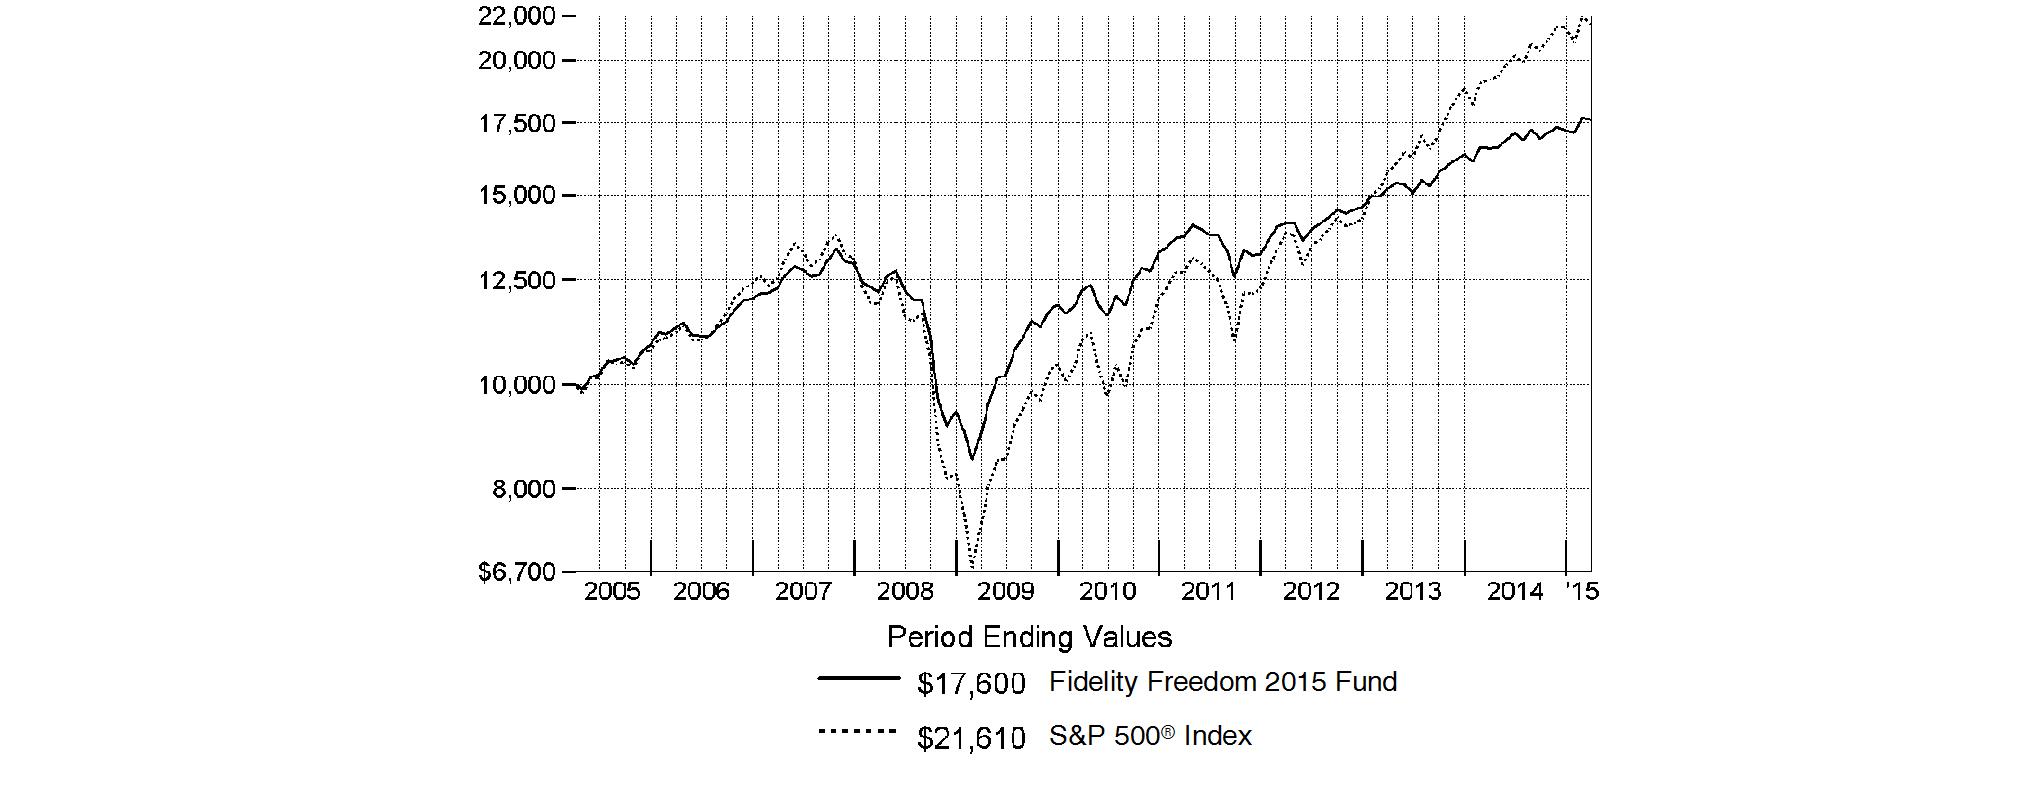
Annual Report
Fidelity Freedom 2020 Fund
Performance: The Bottom Line
Average annual total return reflects the change in the value of an investment, assuming reinvestment of the fund's distributions from dividend income and capital gains (the profits earned upon the sale of securities that have grown in value, if any) and assuming a constant rate of performance each year. The $10,000 table and the fund's returns do not reflect the deduction of taxes that a shareholder would pay on fund distributions or the redemption of fund shares. During periods of reimbursement by Fidelity, a fund's total return will be greater than it would be had the reimbursement not occurred. How a fund did yesterday is no guarantee of how it will do tomorrow.
Average Annual Total Returns
Periods ended March 31, 2015 | Past 1
year | Past 5
years | Past 10
years |
Fidelity Freedom 2020 Fund | 6.71% | 8.05% | 5.88% |
$10,000 Over 10 Years
Let's say hypothetically that $10,000 was invested in Fidelity Freedom 2020 Fund on March 31, 2005. The chart shows how the value of your investment would have changed, and also shows how the S&P 500 Index performed over the same period.
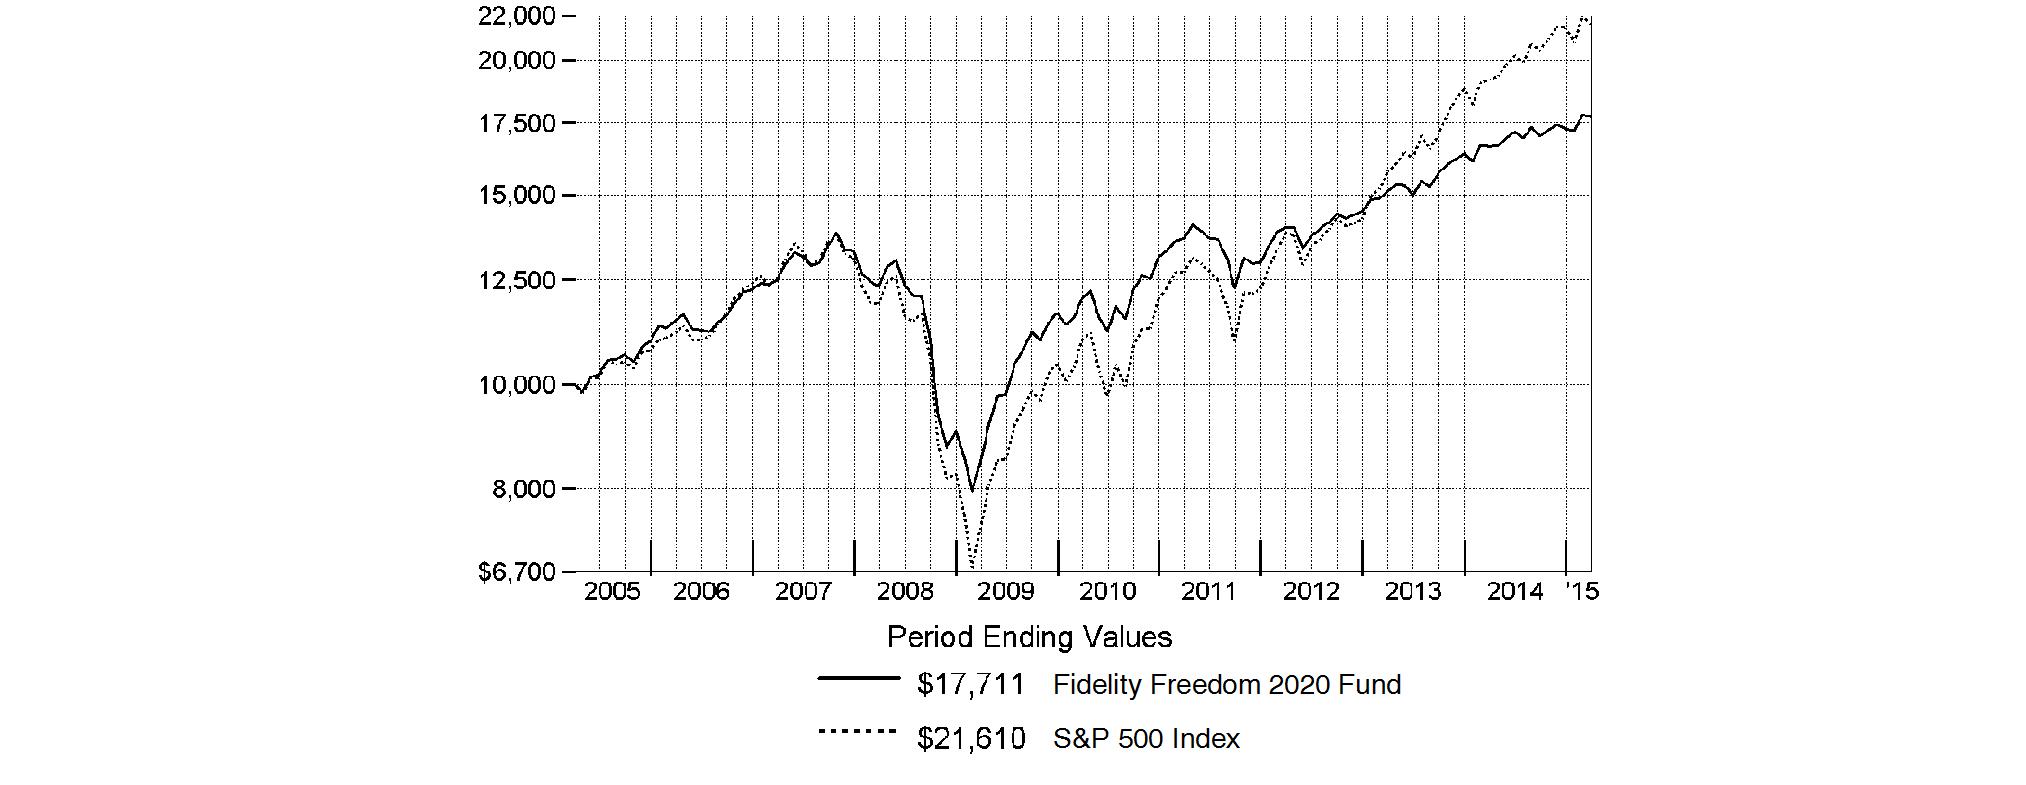
Annual Report
Fidelity Freedom 2025 Fund
Performance: The Bottom Line
Average annual total return reflects the change in the value of an investment, assuming reinvestment of the fund's distributions from dividend income and capital gains (the profits earned upon the sale of securities that have grown in value, if any) and assuming a constant rate of performance each year. The $10,000 table and the fund's returns do not reflect the deduction of taxes that a shareholder would pay on fund distributions or the redemption of fund shares. During periods of reimbursement by Fidelity, a fund's total return will be greater than it would be had the reimbursement not occurred. How a fund did yesterday is no guarantee of how it will do tomorrow.
Average Annual Total Returns
Periods ended March 31, 2015 | | Past 1
year | Past 5
years | Past 10
years |
Fidelity Freedom 2025 Fund | | 7.23% | 8.88% | 6.25% |
$10,000 Over 10 Years
Let's say hypothetically that $10,000 was invested in Fidelity Freedom 2025 Fund on March 31, 2005. The chart shows how the value of your investment would have changed, and also shows how the S&P 500 Index performed over the same period.
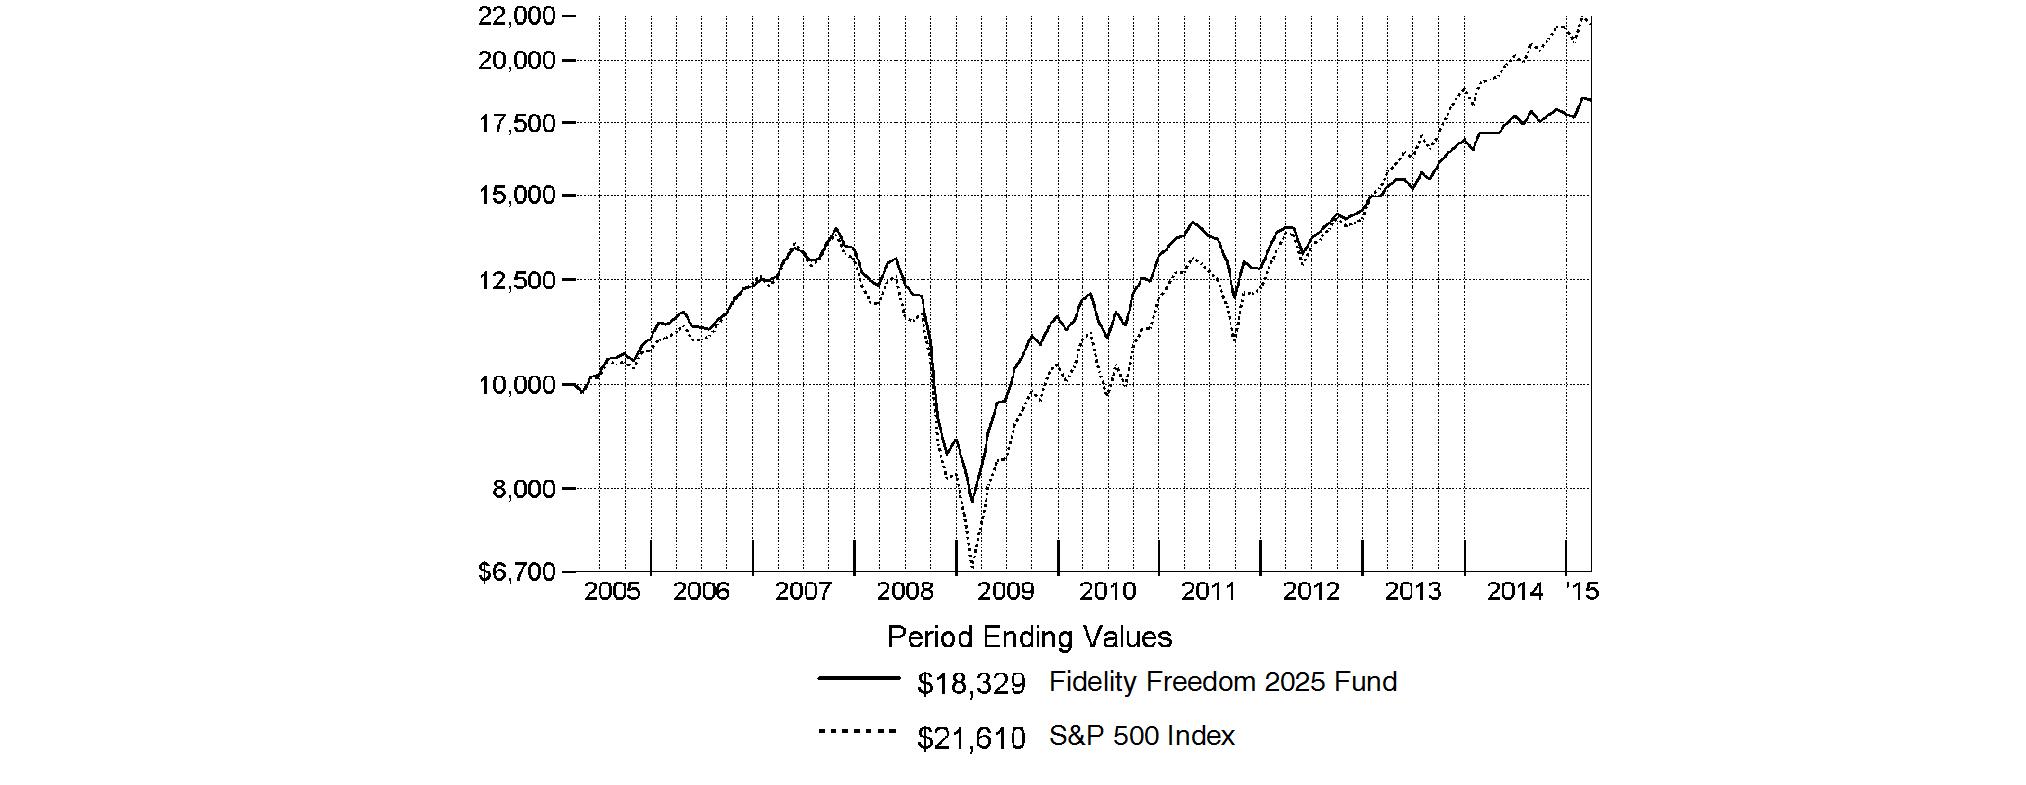
Annual Report
Fidelity Freedom 2030 Fund
Performance: The Bottom Line
Average annual total return reflects the change in the value of an investment, assuming reinvestment of the fund's distributions from dividend income and capital gains (the profits earned upon the sale of securities that have grown in value, if any) and assuming a constant rate of performance each year. The $10,000 table and the fund's returns do not reflect the deduction of taxes that a shareholder would pay on fund distributions or the redemption of fund shares. During periods of reimbursement by Fidelity, a fund's total return will be greater than it would be had the reimbursement not occurred. How a fund did yesterday is no guarantee of how it will do tomorrow.
Average Annual Total Returns
Periods ended March 31, 2015 | Past 1
year | Past 5
years | Past 10
years |
Fidelity Freedom 2030 Fund | 7.76% | 9.19% | 6.15% |
$10,000 Over 10 Years
Let's say hypothetically that $10,000 was invested in Fidelity Freedom 2030 Fund on March 31, 2005. The chart shows how the value of your investment would have changed, and also shows how the S&P 500 Index performed over the same period.
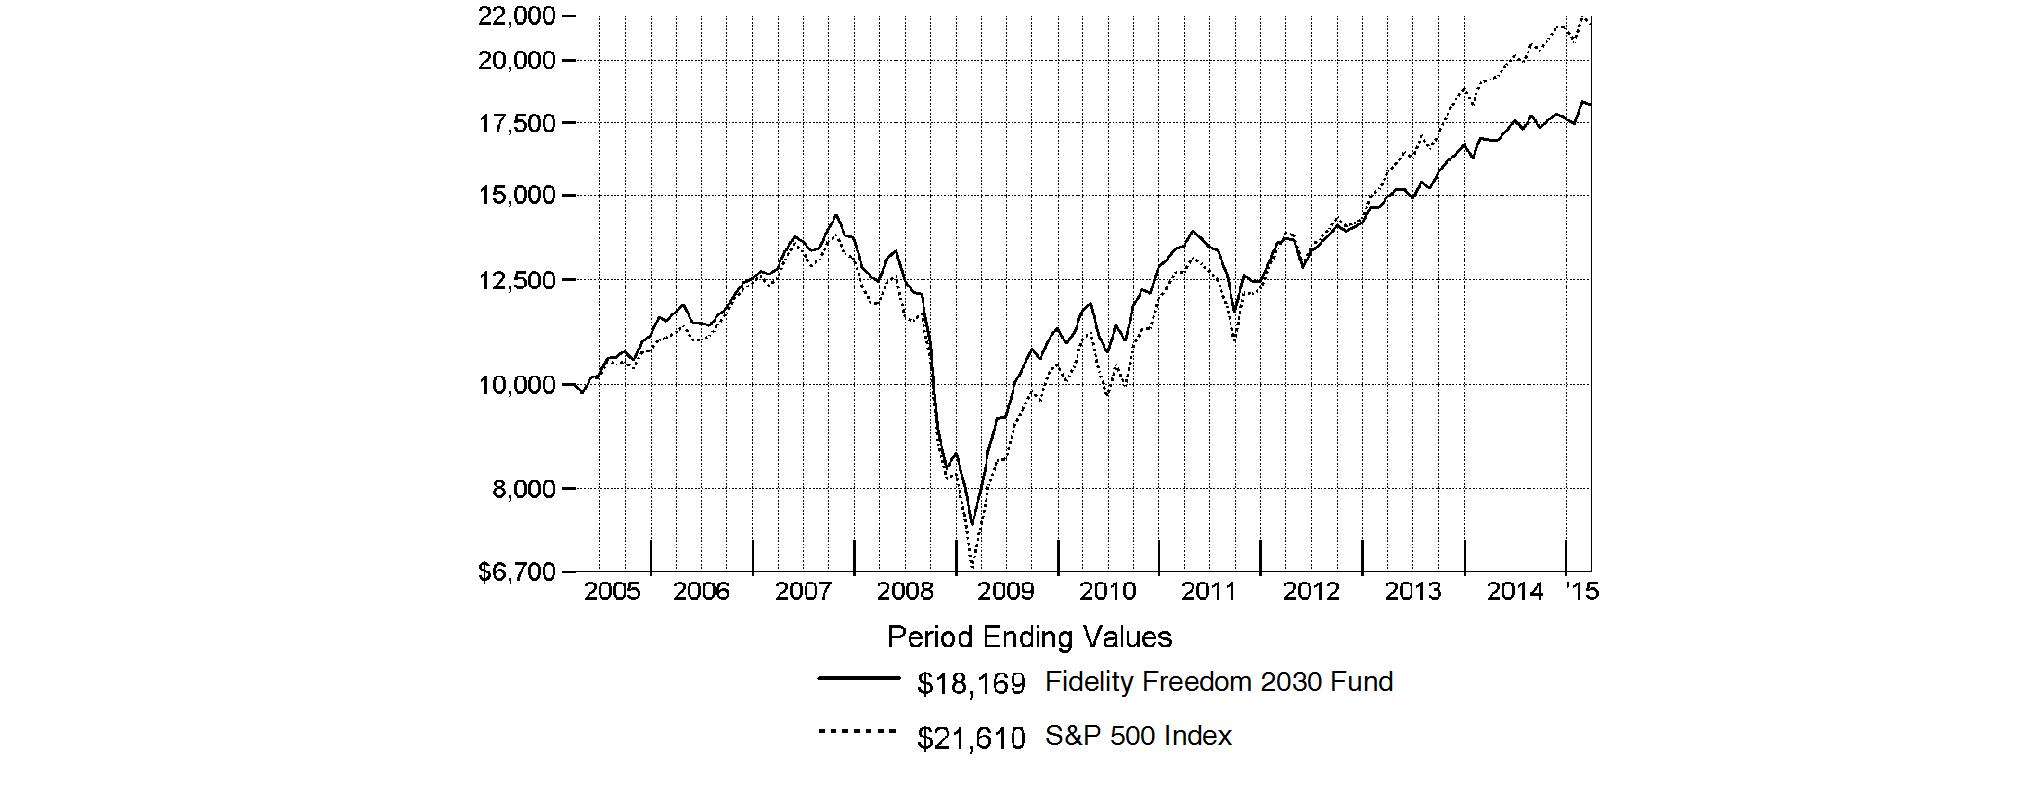
Annual Report
Fidelity Freedom 2035 Fund
Performance: The Bottom Line
Average annual total return reflects the change in the value of an investment, assuming reinvestment of the fund's distributions from dividend income and capital gains (the profits earned upon the sale of securities that have grown in value, if any) and assuming a constant rate of performance each year. The $10,000 table and the fund's returns do not reflect the deduction of taxes that a shareholder would pay on fund distributions or the redemption of fund shares. During periods of reimbursement by Fidelity, a fund's total return will be greater than it would be had the reimbursement not occurred. How a fund did yesterday is no guarantee of how it will do tomorrow.
Average Annual Total Returns
Periods ended March 31, 2015 | Past 1
year | Past 5
years | Past 10
years |
Fidelity Freedom 2035 Fund | 7.90% | 9.62% | 6.31% |
$10,000 Over 10 Years
Let's say hypothetically that $10,000 was invested in Fidelity Freedom 2035 Fund on March 31, 2005. The chart shows how the value of your investment would have changed, and also shows how the S&P 500 Index performed over the same period.
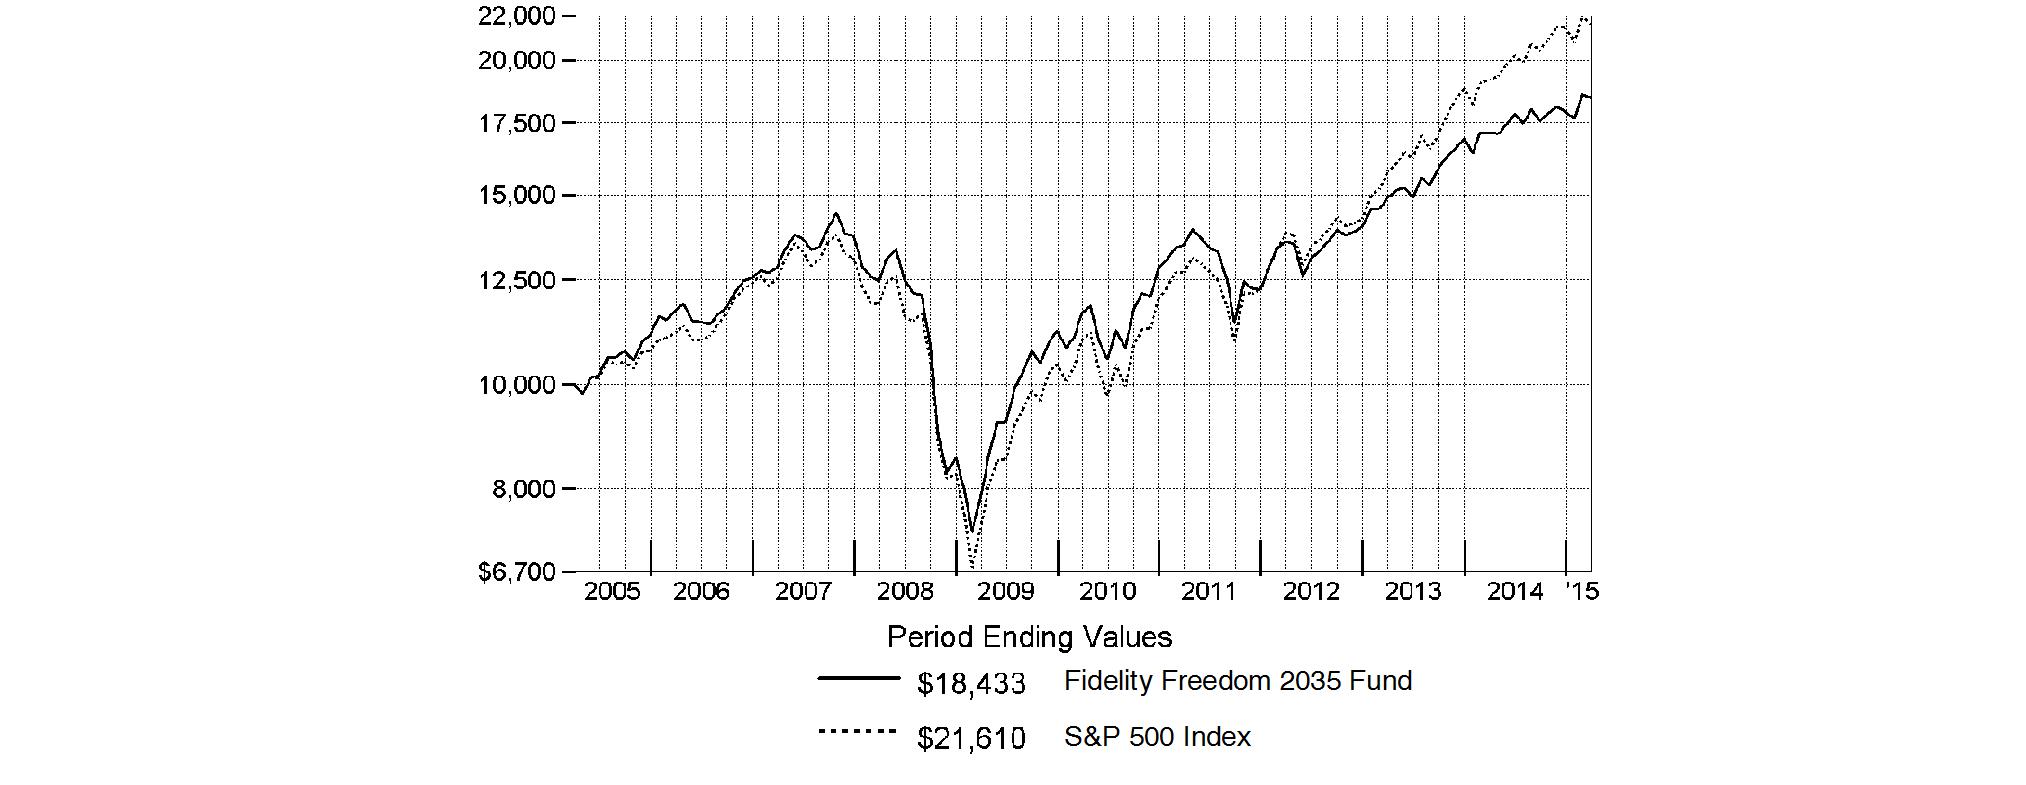
Annual Report
Fidelity Freedom 2040 Fund
Performance: The Bottom Line
Average annual total return reflects the change in the value of an investment, assuming reinvestment of the fund's distributions from dividend income and capital gains (the profits earned upon the sale of securities that have grown in value, if any) and assuming a constant rate of performance each year. The $10,000 table and the fund's returns do not reflect the deduction of taxes that a shareholder would pay on fund distributions or the redemption of fund shares. During periods of reimbursement by Fidelity, a fund's total return will be greater than it would be had the reimbursement not occurred. How a fund did yesterday is no guarantee of how it will do tomorrow.
Average Annual Total Returns
Periods ended March 31, 2015 | Past 1
year | Past 5
years | Past 10
years |
Fidelity Freedom 2040 Fund | 7.86% | 9.68% | 6.28% |
$10,000 Over 10 Years
Let's say hypothetically that $10,000 was invested in Fidelity Freedom 2040 Fund on March 31, 2005. The chart shows how the value of your investment would have changed, and also shows how the S&P 500 Index performed over the same period.
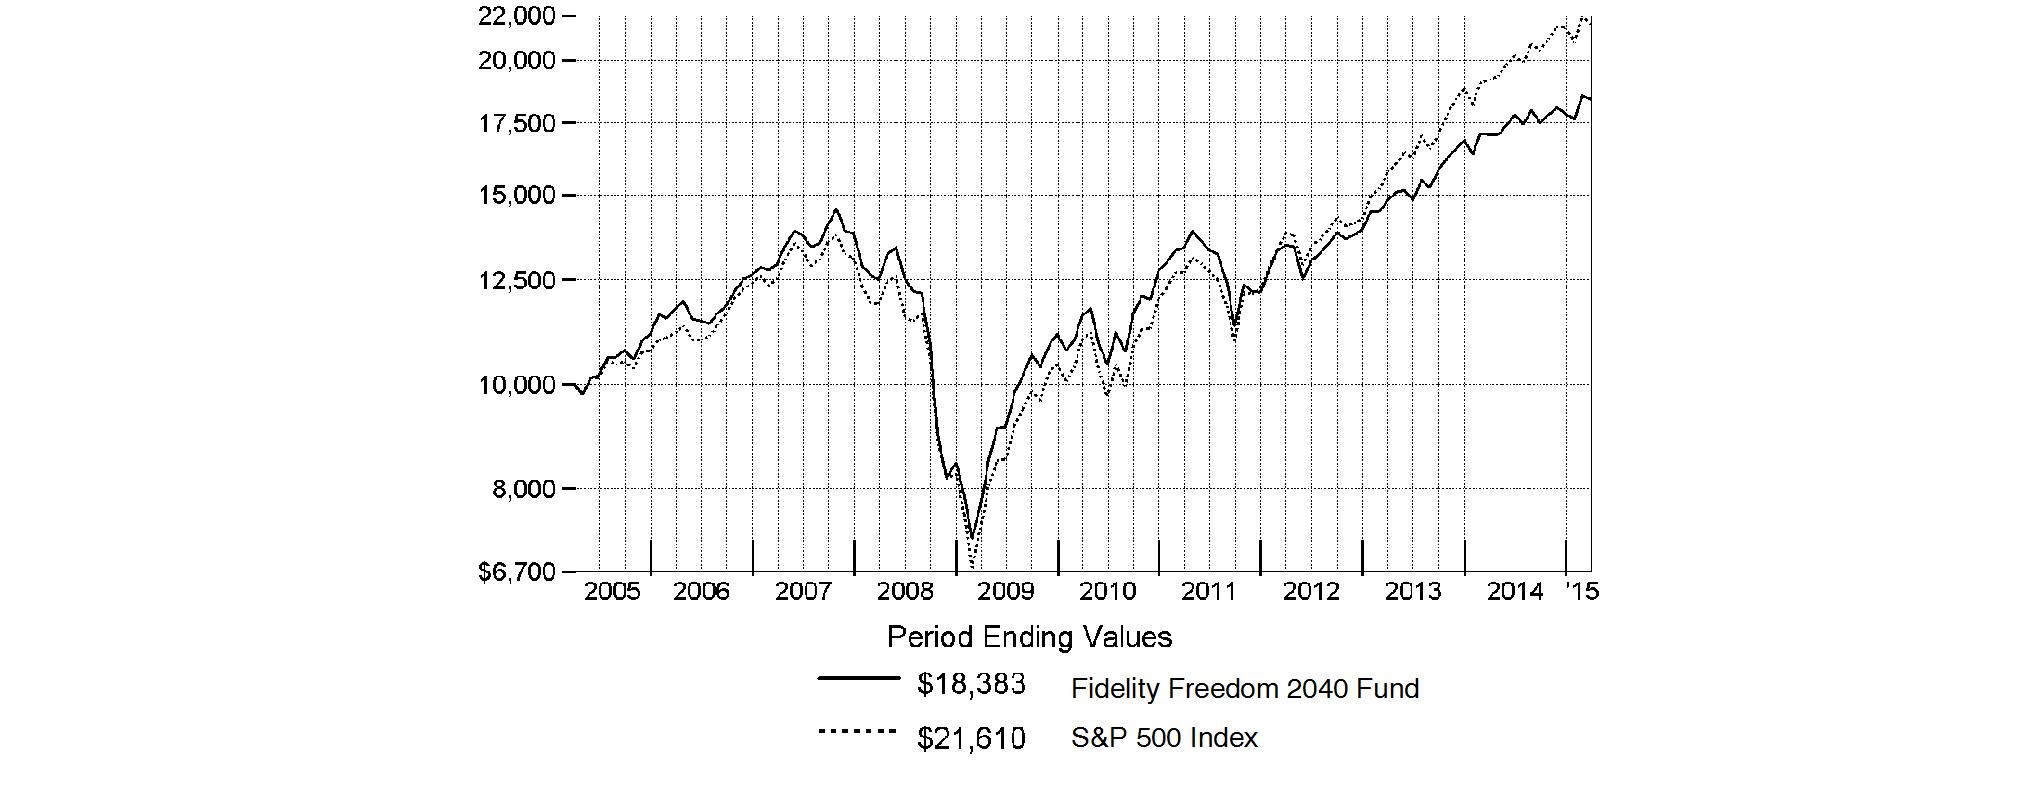
Annual Report
Fidelity Freedom 2045 Fund
Performance: The Bottom Line
Average annual total return reflects the change in the value of an investment, assuming reinvestment of the fund's distributions from dividend income and capital gains (the profits earned upon the sale of securities that have grown in value, if any) and assuming a constant rate of performance each year. The $10,000 table and the fund's returns do not reflect the deduction of taxes that a shareholder would pay on fund distributions or the redemption of fund shares. During periods of reimbursement by Fidelity, a fund's total return will be greater than it would be had the reimbursement not occurred. How a fund did yesterday is no guarantee of how it will do tomorrow.
Average Annual Total Returns
Periods ended March 31, 2015 | Past 1
year | Past 5
years | Life of
fundA |
Fidelity Freedom 2045 Fund | 7.93% | 9.79% | 5.40% |
A From June 1, 2006.
$10,000 Over Life of Fund
Let's say hypothetically that $10,000 was invested in Fidelity Freedom 2045 Fund on June 1, 2006, when the fund started. The chart shows how the value of your investment would have changed, and also shows how the S&P 500 Index performed over the same period.
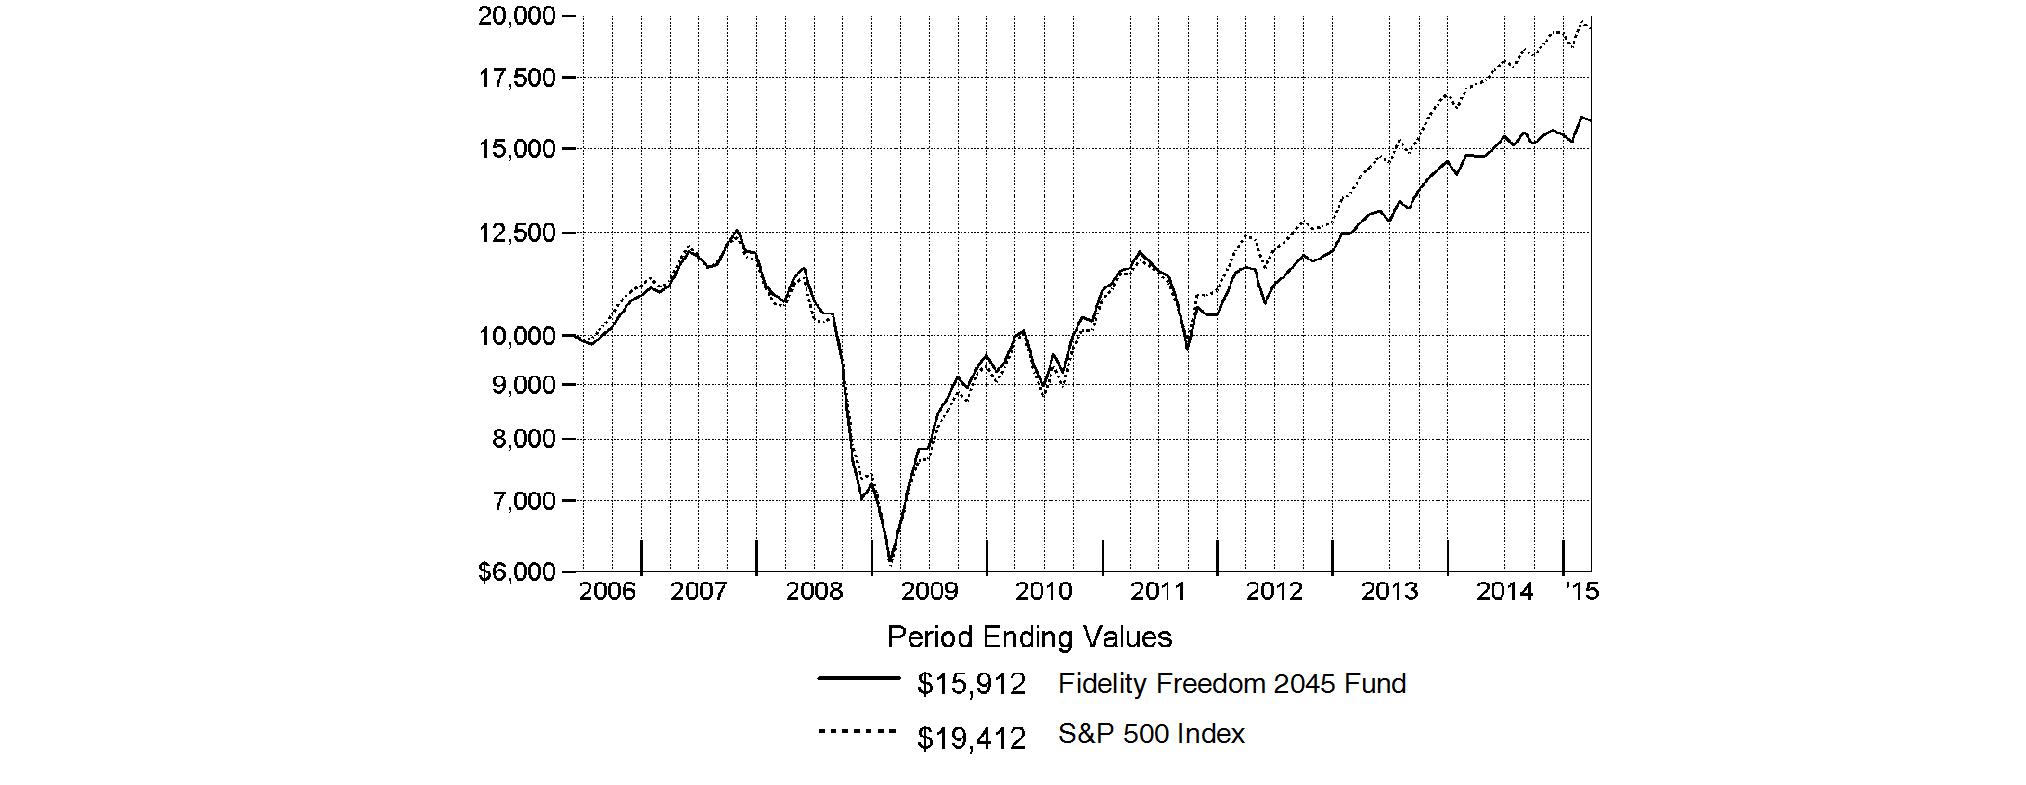
Annual Report
Fidelity Freedom 2050 Fund
Performance: The Bottom Line
Average annual total return reflects the change in the value of an investment, assuming reinvestment of the fund's distributions from dividend income and capital gains (the profits earned upon the sale of securities that have grown in value, if any) and assuming a constant rate of performance each year. The $10,000 table and the fund's returns do not reflect the deduction of taxes that a shareholder would pay on fund distributions or the redemption of fund shares. During periods of reimbursement by Fidelity, a fund's total return will be greater than it would be had the reimbursement not occurred. How a fund did yesterday is no guarantee of how it will do tomorrow.
Average Annual Total Returns
Periods ended March 31, 2015 | Past 1
year | Past 5
years | Life of
fundA |
Fidelity Freedom 2050 Fund | 7.91% | 9.78% | 5.18% |
A From June 1, 2006.
$10,000 Over Life of Fund
Let's say hypothetically that $10,000 was invested in Fidelity Freedom 2050 Fund on June 1, 2006, when the fund started. The chart shows how the value of your investment would have changed, and also shows how the S&P 500 Index performed over the same period.

Annual Report
Fidelity Freedom 2055 Fund
Performance: The Bottom Line
Average annual total return reflects the change in the value of an investment, assuming reinvestment of the fund's distributions from dividend income and capital gains (the profits earned upon the sale of securities that have grown in value, if any) and assuming a constant rate of performance each year. The $10,000 table and the fund's returns do not reflect the deduction of taxes that a shareholder would pay on fund distributions or the redemption of fund shares. During periods of reimbursement by Fidelity, a fund's total return will be greater than it would be had the reimbursement not occurred. How a fund did yesterday is no guarantee of how it will do tomorrow.
Average Annual Total Returns
Periods ended March 31, 2015 | Past 1
year | Life of
fundA |
Fidelity Freedom 2055 Fund | 7.98% | 8.91% |
A From June 1, 2011.
$10,000 Over Life of Fund
Let's say hypothetically that $10,000 was invested in Fidelity Freedom 2055 Fund on June 1, 2011, when the fund started. The chart shows how the value of your investment would have changed, and also shows how the S&P 500 Index performed over the same period.
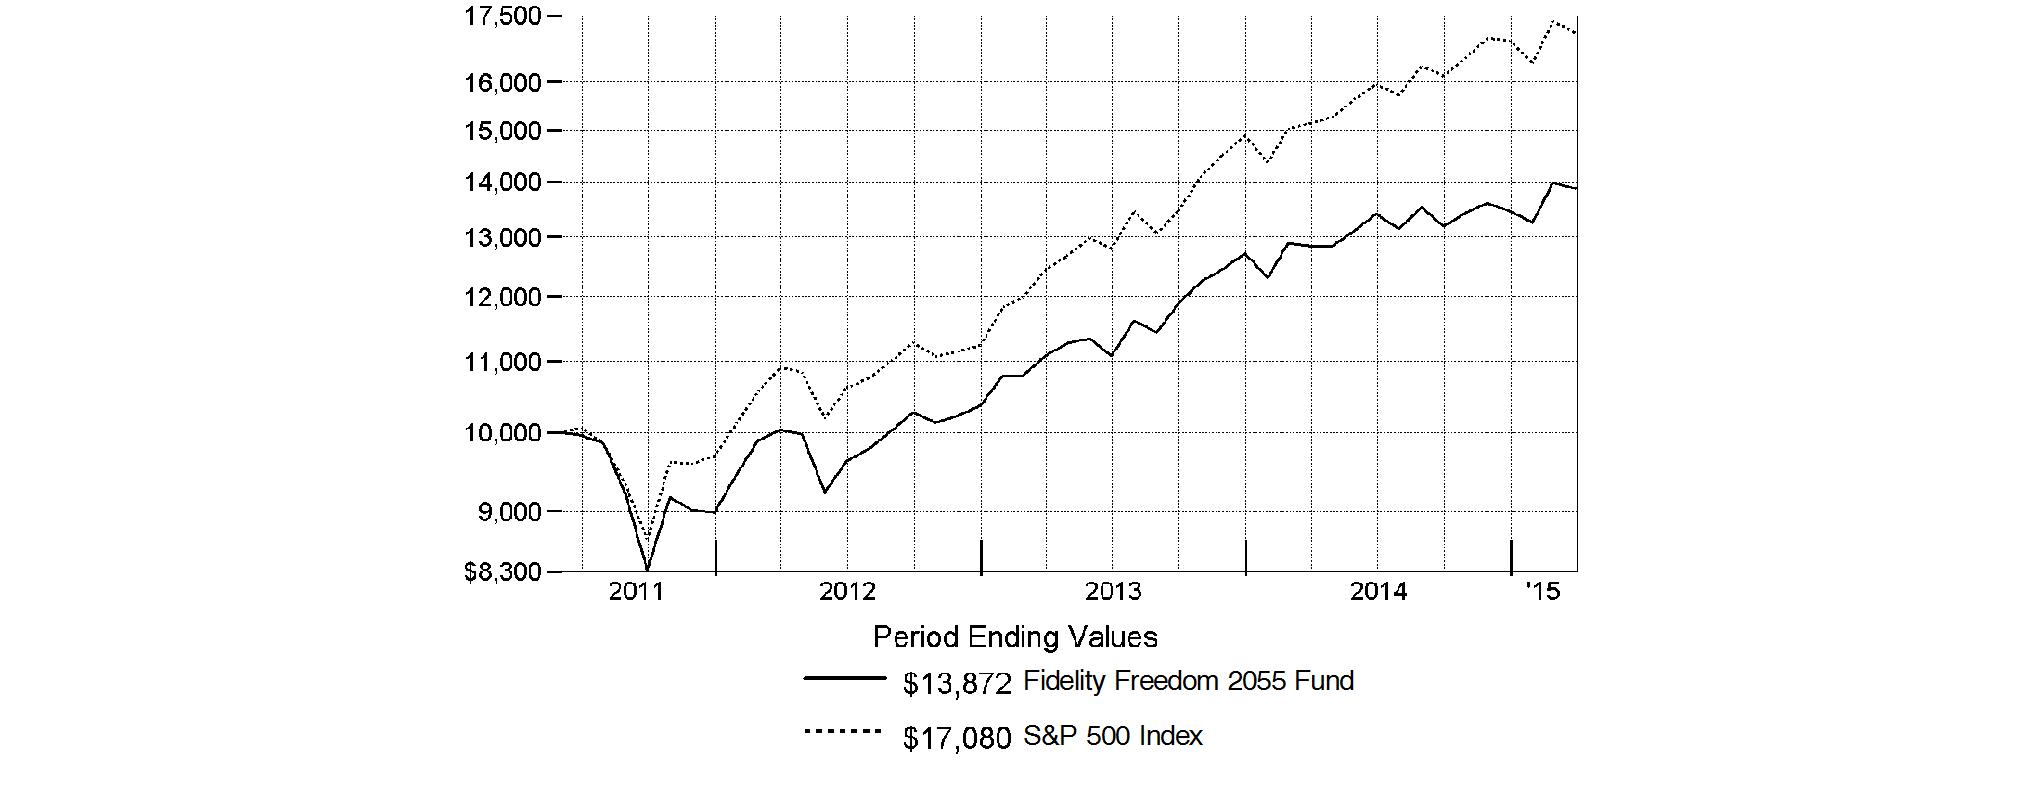
-
Annual Report
Fidelity Freedom 2060 Fund
Performance: The Bottom Line
Average annual total return reflects the change in the value of an investment, assuming reinvestment of the fund's distributions from dividend income and capital gains (the profits earned upon the sale of securities that have grown in value, if any) and assuming a constant rate of performance each year. The $10,000 table and the fund's returns do not reflect the deduction of taxes that a shareholder would pay on fund distributions or the redemption of fund shares. During periods of reimbursement by Fidelity, a fund's total return will be greater than it would be had the reimbursement not occurred. How a fund did yesterday is no guarantee of how it will do tomorrow.
Average annual total returns take Fidelity Freedom 2060 Fund's cumulative total return and show you what would have happened if Fidelity Freedom 2060 Fund shares had performed at a constant rate each year. These numbers will be reported once the fund is a year old.
$10,000 Over Life of Fund
Let's say hypothetically that $10,000 was invested in Fidelity Freedom 2060 Fund on August 5, 2014, when the fund started. The chart shows how the value of your investment would have changed, and also shows how the S&P 500 Index performed over the same period.
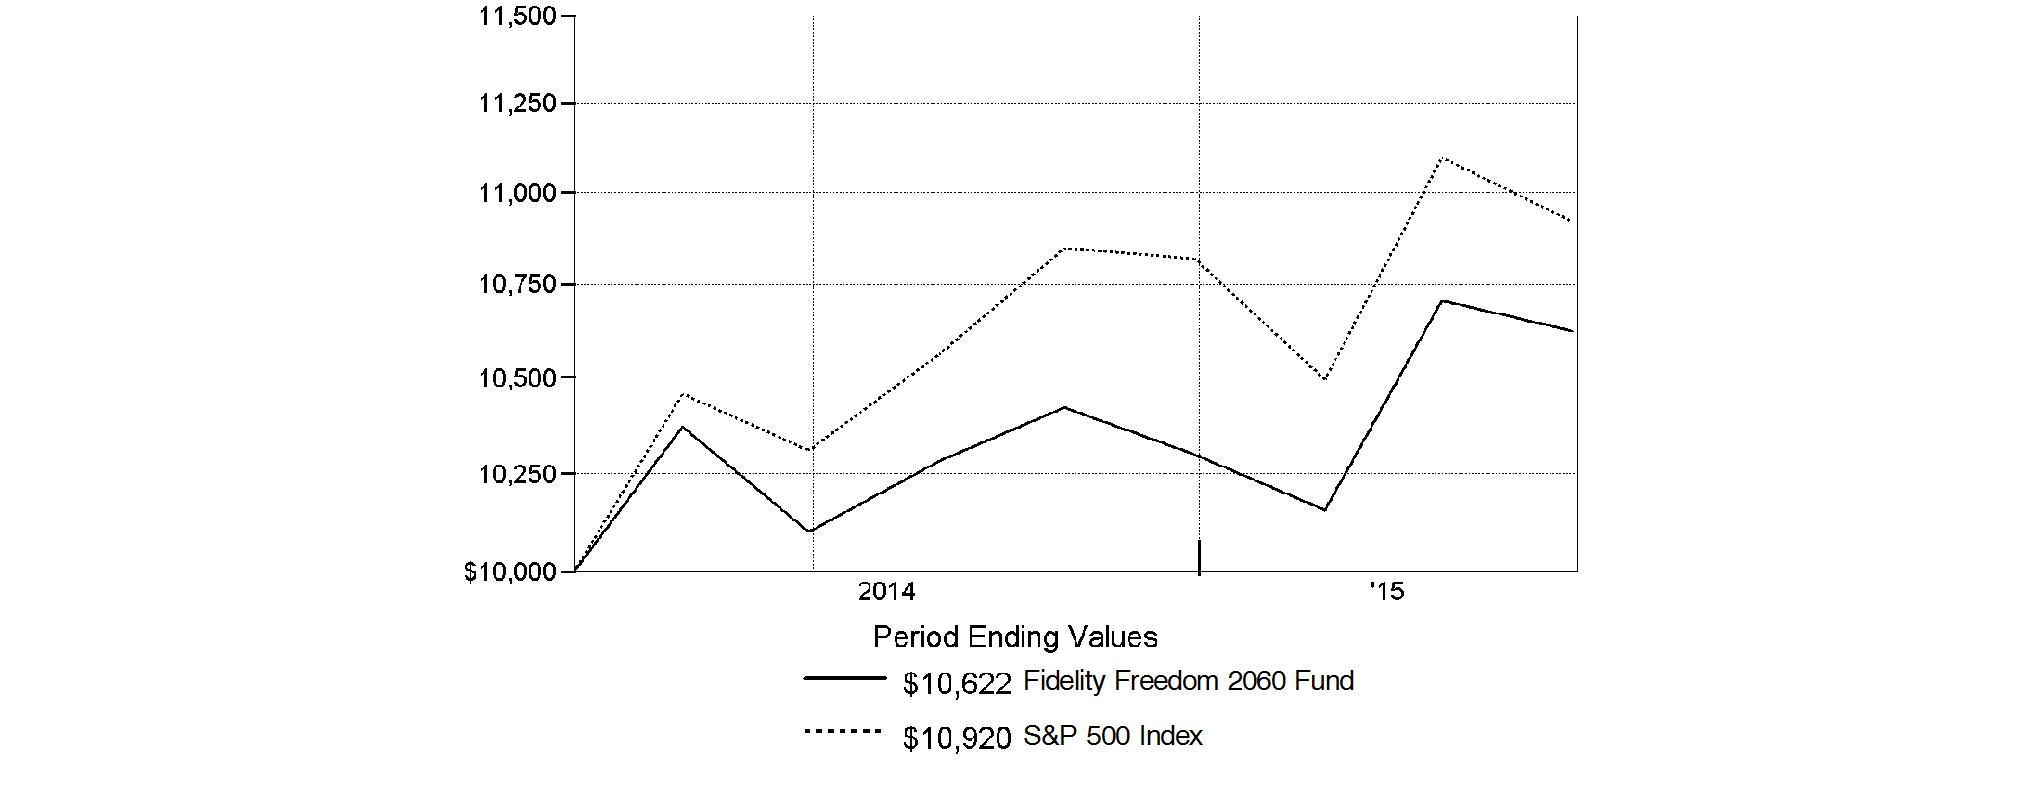
Annual Report
Market Recap: The U.S. stock market closed slightly off recent all-time highs for the 12 months ending March 31, 2015, supported by the relative strength of the U.S. economy and dollar, as well as the appeal of stocks relative to bonds. The large-cap S&P 500® Index returned 12.73%. Growth stocks in the index handily outperformed value-oriented names; among sectors, all save energy notched a gain. The tech-heavy Nasdaq Composite Index® gained 18.12%, while the small-cap Russell 2000® Index advanced 8.21%, rallying after earlier weakness due to growth and valuation worries. International stocks, as measured by the MSCI ACWI (All Country World Index) ex USA Index, returned -0.88% amid recessionary pressure in parts of Asia, anemic economic growth in the eurozone and a rising U.S. dollar. Within the MSCI index, Europe (-4%) was hampered by late-period deflationary concerns and currency weakness. The U.K. (-5%) endured decelerating growth and a cooling housing market. Japan (+12%) fought encroaching recession by expanding its already-aggressive economic stimulus plan; Europe followed suit in January. Emerging markets (-1%) saw late-period outflows ahead of potential U.S. Federal Reserve tightening.
Turning to fixed income: U.S. taxable investment-grade bonds posted a positive return for the one-year period, despite a February price decline related to expectations of higher inflation and interest rates. For much of the period, investors in many parts of the world sought the perceived safe haven of U.S. bonds. The Barclays® U.S. Aggregate Bond Index rose 5.72%, well ahead of the negative return for international bonds, which struggled due to a surging U.S. dollar. Among sectors in the Barclays index, U.S. Treasuries rose roughly 5%, driven by this preference for conservative investments. Sentiment changed somewhat toward period end, however, when investors snapped up riskier assets amid a rally in higher-yielding bonds.
Comments from Co-Portfolio Managers Andrew Dierdorf and Brett Sumsion: For the 12 months ending March 31, 2015, each Freedom® Fund posted a positive absolute return that was consistent with its investment goal. [Note: Freedom® 2060 Fund has not marked a full year's performance; however, the comments here apply generally to its life-of-fund period.] Longer-dated Funds delivered higher returns, as we would expect given their greater exposure to underlying equities, which rose overall this period. On a relative basis, each Fund performed roughly in line with or modestly lagged its respective Composite indexes. (For specific Fund results, please refer to the performance section of this report.) Aggregate allocation decisions detracted from the Funds' relative results for the full year; however, underlying manager decisions proved additive overall. Security selection in the U.S. equity asset class helped most; positioning in non-U.S. equities also contributed. Conversely, allocations to asset classes such as high-yield debt and commodities hurt. Among the Funds' U.S. equity investments, favorable picks in health care and information technology aided overall results. Outside the U.S., decisions within the energy sector helped; among countries, U.K. stock picks contributed notably. Lastly, active asset allocation was implemented effective August 1, 2014; this allows portfolio managers to make incremental shifts - within predefined risk parameters - to Fund allocations relative to the strategic glide path.
The views expressed above reflect those of the portfolio manager(s) only through the end of the period as stated on the cover of this report and do not necessarily represent the views of Fidelity or any other person in the Fidelity organization. Any such views are subject to change at any time based upon market or other conditions and Fidelity disclaims any responsibility to update such views. These views may not be relied on as investment advice and, because investment decisions for a Fidelity fund are based on numerous factors, may not be relied on as an indication of trading intent on behalf of any Fidelity fund.
Annual Report
As a shareholder of a Fund, you incur two types of costs: (1) transaction costs and (2) ongoing costs, including other Fund expenses. This Example is intended to help you understand your ongoing costs (in dollars) of investing in the Funds and to compare these costs with the ongoing costs of investing in other mutual funds.
The Example is based on an investment of $1,000 invested at the beginning of the period and held for the entire period (October 1, 2014 to March 31, 2015).
Actual Expenses
The first line of the accompanying table for each fund provides information about actual account values and actual expenses. You may use the information in this line, together with the amount you invested, to estimate the expenses that you paid over the period. Simply divide your account value by $1,000.00 (for example, an $8,600 account value divided by $1,000.00 = 8.6), then multiply the result by the number in the first line for a fund under the heading entitled "Expenses Paid During Period" to estimate the expenses you paid on your account during this period. A small balance maintenance fee of $12.00 that is charged once a year may apply for certain accounts with a value of less than $2,000. This fee is not included in the table below. If it was, the estimate of expenses you paid during the period would be higher, and your ending account value lower, by this amount. In addition, each Fund, as a shareholder in underlying Fidelity Funds, will indirectly bear its pro-rata share of the fees and expenses incurred by the underlying Fidelity Funds. These fees and expenses are not included in each Fund's annualized expense ratio used to calculate the expense estimates in the table below.
Hypothetical Example for Comparison Purposes
The second line of the accompanying table for each fund provides information about hypothetical account values and hypothetical expenses based on a fund's actual expense ratio and an assumed rate of return of 5% per year before expenses, which is not the Fund's actual return. The hypothetical account values and expenses may not be used to estimate the actual ending account balance or expenses you paid for the period. You may use this information to compare the ongoing costs of investing in the Fund and other funds. To do so, compare this 5% hypothetical example with the 5% hypothetical examples that appear in the shareholder reports of the other funds. A small balance maintenance fee of $12.00 that is charged once a year may apply for certain accounts with a value of less than $2,000. This fee is not included in the table below. If it was, the estimate of expenses you paid during the period would be higher, and your ending account value lower, by this amount. In addition, each Fund, as a shareholder in underlying Fidelity Funds, will indirectly bear its pro-rata share of the fees and expenses incurred by the underlying Fidelity Funds. These fees and expenses are not included in each Fund's annualized expense ratio used to calculate the expense estimates in the table below.
Please note that the expenses shown in the table are meant to highlight your ongoing costs only and do not reflect any transaction costs. Therefore, the second line of the table is useful in comparing ongoing costs only, and will not help you determine the relative total costs of owning different funds.
| Annualized
Expense RatioB | Beginning
Account Value
October 1, 2014 | Ending
Account Value
March 31, 2015 | Expenses Paid
During Period*
October 1, 2014 to March 31, 2015 |
Freedom Income | 0.0% | | | |
Actual | | $ 1,000.00 | $ 1,028.10 | $ - |
HypotheticalA | | $ 1,000.00 | $ 1,024.93 | $ - |
Freedom 2005 | 0.0% | | | |
Actual | | $ 1,000.00 | $ 1,034.20 | $ - |
HypotheticalA | | $ 1,000.00 | $ 1,024.93 | $ - |
Freedom 2010 | 0.0% | | | |
Actual | | $ 1,000.00 | $ 1,038.50 | $ - |
HypotheticalA | | $ 1,000.00 | $ 1,024.93 | $ - |
Freedom 2015 | 0.0% | | | |
Actual | | $ 1,000.00 | $ 1,042.30 | $ - |
HypotheticalA | | $ 1,000.00 | $ 1,024.93 | $ - |
Freedom 2020 | 0.0% | | | |
Actual | | $ 1,000.00 | $ 1,044.10 | $ - |
HypotheticalA | | $ 1,000.00 | $ 1,024.93 | $ - |
Freedom 2025 | 0.0% | | | |
Actual | | $ 1,000.00 | $ 1,047.10 | $ - |
HypotheticalA | | $ 1,000.00 | $ 1,024.93 | $ - |
Freedom 2030 | 0.0% | | | |
Actual | | $ 1,000.00 | $ 1,050.80 | $ - |
HypotheticalA | | $ 1,000.00 | $ 1,024.93 | $ - |
Freedom 2035 | 0.0% | | | |
Actual | | $ 1,000.00 | $ 1,052.00 | $ - |
HypotheticalA | | $ 1,000.00 | $ 1,024.93 | $ - |
Freedom 2040 | 0.0% | | | |
Actual | | $ 1,000.00 | $ 1,051.70 | $ - |
HypotheticalA | | $ 1,000.00 | $ 1,024.93 | $ - |
| Annualized
Expense RatioB | Beginning
Account Value
October 1, 2014 | Ending
Account Value
March 31, 2015 | Expenses Paid
During Period*
October 1, 2014 to March 31, 2015 |
Freedom 2045 | 0.0% | | | |
Actual | | $ 1,000.00 | $ 1,051.70 | $ - |
HypotheticalA | | $ 1,000.00 | $ 1,024.93 | $ - |
Freedom 2050 | 0.0% | | | |
Actual | | $ 1,000.00 | $ 1,052.10 | $ - |
HypotheticalA | | $ 1,000.00 | $ 1,024.93 | $ - |
Freedom 2055 | 0.0% | | | |
Actual | | $ 1,000.00 | $ 1,052.10 | $ - |
HypotheticalA | | $ 1,000.00 | $ 1,024.93 | $ - |
Freedom 2060 | 0.0% | | | |
Actual | | $ 1,000.00 | $ 1,051.70 | $ - |
HypotheticalA | | $ 1,000.00 | $ 1,024.93 | $ - |
A 5% return per year before expenses
B Annualized expense ratio reflects expenses net of applicable fee waivers.
* Expenses are equal to each Fund's annualized expense ratio, multiplied by the average account value over the period, multiplied by 182/365 (to reflect the one-half year period). The fees and expenses of the underlying Fidelity Funds in which each Fund invests are not included in each Fund's annualized expense ratio.
Annual Report
Fidelity Freedom Income Fund
Investment Changes (Unaudited)
The information in the following tables is based on the direct investments of the Fund. |
Fund Holdings as of March 31, 2015 |
| % of fund's
net assets | % of fund's net assets
6 months ago |
Domestic Equity Funds | | |
Fidelity Series 100 Index Fund | 0.6 | 0.6 |
Fidelity Series 1000 Value Index Fund | 0.4 | 0.4 |
Fidelity Series All-Sector Equity Fund | 2.0 | 2.0 |
Fidelity Series Blue Chip Growth Fund | 1.6 | 1.7 |
Fidelity Series Commodity Strategy Fund | 0.8 | 1.0 |
Fidelity Series Equity-Income Fund | 2.7 | 2.7 |
Fidelity Series Growth & Income Fund | 2.0 | 2.0 |
Fidelity Series Growth Company Fund | 2.4 | 2.1 |
Fidelity Series Intrinsic Opportunities Fund | 1.4 | 1.3 |
Fidelity Series Opportunistic Insights Fund | 1.3 | 1.3 |
Fidelity Series Real Estate Equity Fund | 0.3 | 0.2 |
Fidelity Series Small Cap Discovery Fund | 0.4 | 0.3 |
Fidelity Series Small Cap Opportunities Fund | 1.1 | 1.0 |
Fidelity Series Stock Selector Large Cap Value Fund | 1.8 | 1.7 |
| 18.8 | 18.3 |
International Equity Funds | | |
Fidelity Series Emerging Markets Fund | 2.7 | 1.7 |
Fidelity Series International Growth Fund | 2.0 | 2.0 |
Fidelity Series International Small Cap Fund | 0.4 | 0.4 |
Fidelity Series International Value Fund | 2.0 | 2.4 |
| 7.1 | 6.5 |
Bond Funds | | |
Fidelity Series Emerging Markets Debt Fund | 0.6 | 0.7 |
Fidelity Series Floating Rate High Income Fund | 0.5 | 0.5 |
Fidelity Series High Income Fund | 3.4 | 3.7 |
Fidelity Series Inflation-Protected Bond Index Fund | 3.5 | 3.0 |
Fidelity Series Investment Grade Bond Fund | 41.5 | 39.1 |
Fidelity Series Real Estate Income Fund | 0.5 | 0.5 |
| 50.0 | 47.5 |
Short-Term Funds | | |
Fidelity Institutional Money Market Portfolio Institutional Class | 13.7 | 15.3 |
Fidelity Series Short-Term Credit Fund | 10.4 | 0.0 |
Fidelity Short-Term Bond Fund | 0.0 | 12.4 |
| 24.1 | 27.7 |
Net Other Assets (Liabilities)* | 0.0 | 0.0 |
| 100.0 | 100.0 |
* Amount represents less than 0.1% |
Asset Allocation (% of fund's net assets) |
Period end |
 | Domestic Equity Funds** | 18.8% | |
 | International Equity Funds | 7.1% | |
 | Bond Funds | 50.0% | |
 | Short-Term Funds | 24.1% | |

Six months ago |
 | Domestic Equity Funds** | 18.3% | |
 | International Equity Funds | 6.5% | |
 | Bond Funds | 47.5% | |
 | Short-Term Funds | 27.7% | |

** Includes Fidelity Series Commodity Strategy Fund which invests in commodity-related investments. |
Annual Report
Fidelity Freedom Income Fund
Investments March 31, 2015
Showing Percentage of Net Assets
Domestic Equity Funds - 18.8% |
| Shares | | Value |
Fidelity Series 100 Index Fund (c) | 1,175,348 | | $ 15,620,377 |
Fidelity Series 1000 Value Index Fund (c) | 790,464 | | 8,853,201 |
Fidelity Series All-Sector Equity Fund (c) | 3,585,241 | | 50,767,019 |
Fidelity Series Blue Chip Growth Fund (c) | 3,075,942 | | 39,279,781 |
Fidelity Series Commodity Strategy Fund (a)(c) | 3,301,820 | | 20,207,136 |
Fidelity Series Equity-Income Fund (c) | 5,274,797 | | 66,567,935 |
Fidelity Series Growth & Income Fund (c) | 3,736,446 | | 50,666,205 |
Fidelity Series Growth Company Fund (c) | 4,800,285 | | 60,387,580 |
Fidelity Series Intrinsic Opportunities Fund (c) | 2,254,341 | | 34,063,092 |
Fidelity Series Opportunistic Insights Fund (c) | 2,137,996 | | 32,989,272 |
Fidelity Series Real Estate Equity Fund (c) | 407,963 | | 6,123,519 |
Fidelity Series Small Cap Discovery Fund (c) | 795,129 | | 8,977,011 |
Fidelity Series Small Cap Opportunities Fund (c) | 1,974,482 | | 27,030,652 |
Fidelity Series Stock Selector Large Cap Value Fund (c) | 3,418,294 | | 44,403,641 |
TOTAL DOMESTIC EQUITY FUNDS (Cost $375,549,286) |
465,936,421
|
International Equity Funds - 7.1% |
| | | |
Fidelity Series Emerging Markets Fund (c) | 3,986,872 | | 67,776,831 |
Fidelity Series International Growth Fund (c) | 3,415,343 | | 49,146,790 |
Fidelity Series International Small Cap Fund (c) | 712,171 | | 11,302,150 |
Fidelity Series International Value Fund (c) | 4,819,714 | | 48,823,702 |
TOTAL INTERNATIONAL EQUITY FUNDS (Cost $149,760,644) |
177,049,473
|
Bond Funds - 50.0% |
| Shares | | Value |
Fidelity Series Emerging Markets Debt Fund (c) | 1,577,239 | | $ 15,314,992 |
Fidelity Series Floating Rate High Income Fund (c) | 1,258,705 | | 12,347,894 |
Fidelity Series High Income Fund (c) | 8,613,079 | | 84,408,172 |
Fidelity Series Inflation-Protected Bond Index Fund (c) | 8,899,166 | | 86,766,870 |
Fidelity Series Investment Grade Bond Fund (c) | 89,023,266 | | 1,029,999,184 |
Fidelity Series Real Estate Income Fund (c) | 1,072,222 | | 12,126,833 |
TOTAL BOND FUNDS (Cost $1,176,030,659) |
1,240,963,945
|
Short-Term Funds - 24.1% |
| | | |
Fidelity Institutional Money Market Portfolio Institutional Class 0.14% (b)(c) | 340,763,561 | | 340,763,561 |
Fidelity Series Short-Term Credit Fund (c) | 25,872,163 | | 258,980,352 |
TOTAL SHORT-TERM FUNDS (Cost $599,485,192) |
599,743,913
|
TOTAL INVESTMENT PORTFOLIO - 100.0% (Cost $2,300,825,781) | 2,483,693,752 |
NET OTHER ASSETS (LIABILITIES) - 0.0% | 154,431 |
NET ASSETS - 100% | $ 2,483,848,183 |
Legend |
(a) Non-income producing |
(b) The rate quoted is the annualized seven-day yield of the fund at period end. |
(c) Affiliated Fund |
Affiliated Underlying Funds |
Information regarding the Fund's fiscal year to date purchases and sales of the affiliated Underlying Funds and income earned by the Fund from investments in affiliated Underlying Funds is as follows: |
Affiliate | Value,
beginning of period | Purchases | Sales
Proceeds | Dividend
Income | Value,
end of
period |
Fidelity Institutional Money Market Portfolio Institutional Class | $ 315,186,440 | $ 10,591,804 | $ 114,327,404 | $ 339,711 | $ 340,763,561 |
Fidelity Series 100 Index Fund | 9,648,168 | 3,389,133 | 2,566,291 | 316,567 | 15,620,377 |
Fidelity Series 1000 Value Index Fund | 6,525,131 | 750,945 | 1,520,596 | 191,416 | 8,853,201 |
Fidelity Series All-Sector Equity Fund | 39,680,671 | 10,144,566 | 15,657,189 | 490,265 | 50,767,019 |
Fidelity Series Blue Chip Growth Fund | 31,024,803 | 10,280,602 | 22,044,296 | 90,975 | 39,279,781 |
Fidelity Series Commodity Strategy Fund | 21,411,536 | 2,331,619 | 4,542,802 | - | 20,207,136 |
Fidelity Series Emerging Markets Debt Fund | 11,516,148 | 2,555,982 | 3,181,365 | 881,540 | 15,314,992 |
Fidelity Series Emerging Markets Fund | 29,873,873 | 30,877,324 | 4,936,477 | 423,376 | 67,776,831 |
Fidelity Series Equity-Income Fund | 47,681,281 | 11,041,031 | 12,960,140 | 1,293,695 | 66,567,935 |
Fidelity Series Floating Rate High Income Fund | 22,696,268 | 1,733,611 | 20,466,870 | 754,627 | 12,347,894 |
Fidelity Series Growth & Income Fund | 36,754,479 | 6,670,311 | 10,241,479 | 773,540 | 50,666,205 |
Fidelity Series Growth Company Fund | 38,619,812 | 1,648,725 | 5,425,541 | 116,045 | 60,387,580 |
Fidelity Series High Income Fund | 97,635,763 | 9,689,194 | 52,391,879 | 5,208,500 | 84,408,172 |
Fidelity Series Inflation-Protected Bond Index Fund | 55,561,616 | 21,038,020 | 11,588,676 | 101,912 | 86,766,870 |
Fidelity Series International Growth Fund | 48,317,595 | 4,195,206 | 24,092,048 | 683,322 | 49,146,790 |
Fidelity Series International Small Cap Fund | 11,575,332 | 585,087 | 5,106,526 | 104,781 | 11,302,150 |
Fidelity Series International Value Fund | 48,545,522 | 5,133,896 | 19,467,624 | 2,227,507 | 48,823,702 |
Fidelity Series Intrinsic Opportunities Fund | 23,022,608 | 5,486,635 | 6,653,096 | 480,150 | 34,063,092 |
Fidelity Series Investment Grade Bond Fund | 692,091,325 | 151,310,162 | 128,417,213 | 23,204,208 | 1,029,999,184 |
Fidelity Series Opportunistic Insights Fund | 22,767,504 | 6,418,362 | 8,747,076 | - | 32,989,272 |
Fidelity Series Real Estate Equity Fund | 4,260,927 | 1,805,693 | 2,727,450 | 110,206 | 6,123,519 |
Fidelity Series Real Estate Income Fund | 7,150,017 | 2,993,937 | 1,786,359 | 611,091 | 12,126,833 |
Fidelity Series Short-Term Credit Fund | - | 258,867,310 | 145,811 | - | 258,980,352 |
Fidelity Series Small Cap Discovery Fund | 5,839,177 | 2,299,266 | 2,544,068 | 15,225 | 8,977,011 |
Fidelity Series Small Cap Opportunities Fund | 18,609,723 | 6,741,756 | 6,032,292 | 88,900 | 27,030,652 |
Fidelity Series Stock Selector Large Cap Value Fund | 31,134,984 | 8,298,151 | 9,911,194 | 628,615 | 44,403,641 |
Fidelity Short-Term Bond Fund | 258,079,795 | 23,873,616 | 388,793,380 | 2,512,969 | - |
Total | $ 1,935,210,498 | $ 600,751,944 | $ 886,275,142 | $ 41,649,143 | $ 2,483,693,752 |
Other Information |
All investments are categorized as Level 1 under the Fair Value Hierarchy. The inputs or methodology used for valuing securities may not be an indication of the risk associated with investing in those securities. For more information on valuation inputs, please refer to the Investment Valuation section in the accompanying Notes to Financial Statements. |
See accompanying notes which are an integral part of the financial statements.
Annual Report
Fidelity Freedom Income Fund
Statement of Assets and Liabilities
| March 31, 2015 |
| | |
Assets | | |
Investment in securities, at value (cost $2,300,825,781) - See accompanying schedule | | $ 2,483,693,752 |
Cash | | 14 |
Receivable for investments sold | | 4,995,941 |
Receivable for fund shares sold | | 1,286,503 |
Dividends receivable | | 193,024 |
Total assets | | 2,490,169,234 |
| | |
Liabilities | | |
Payable for investments purchased | $ 3,607,359 | |
Payable for fund shares redeemed | 2,713,692 | |
Total liabilities | | 6,321,051 |
| | |
Net Assets | | $ 2,483,848,183 |
Net Assets consist of: | | |
Paid in capital | | $ 2,277,416,692 |
Undistributed net investment income | | 3,358,995 |
Accumulated undistributed net realized gain (loss) on investments | | 20,204,525 |
Net unrealized appreciation (depreciation) on investments | | 182,867,971 |
Net Assets, for 211,437,079 shares outstanding | | $ 2,483,848,183 |
Net Asset Value, offering price and redemption price per share ($2,483,848,183 ÷ 211,437,079 shares) | | $ 11.75 |
Statement of Operations
| Year ended March 31, 2015 |
| | |
Investment Income | | |
Income distributions from underlying funds | | $ 41,649,143 |
| | |
Expenses | | |
Independent trustees' compensation | $ 10,206 | |
Total expenses before reductions | 10,206 | |
Expense reductions | (10,206) | - |
Net investment income (loss) | | 41,649,143 |
Realized and Unrealized Gain (Loss) Realized gain (loss) on sale of underlying fund shares | 11,075,468 | |
Capital gain distributions from underlying funds | 27,249,331 | |
Total net realized gain (loss) | | 38,324,799 |
Change in net unrealized appreciation (depreciation) on underlying funds | | 12,186,519 |
Net gain (loss) | | 50,511,318 |
Net increase (decrease) in net assets resulting from operations | | $ 92,160,461 |
See accompanying notes which are an integral part of the financial statements.
Annual Report
Fidelity Freedom Income Fund
Financial Statements - continued
Statement of Changes in Net Assets
| Year ended
March 31,
2015 | Year ended
March 31,
2014 |
Increase (Decrease) in Net Assets | | |
Operations | | |
Net investment income (loss) | $ 41,649,143 | $ 28,103,737 |
Net realized gain (loss) | 38,324,799 | 82,420,127 |
Change in net unrealized appreciation (depreciation) | 12,186,519 | (32,326,241) |
Net increase (decrease) in net assets resulting from operations | 92,160,461 | 78,197,623 |
Distributions to shareholders from net investment income | (41,088,085) | (27,364,452) |
Distributions to shareholders from net realized gain | (68,781,810) | (61,063,652) |
Total distributions | (109,869,895) | (88,428,104) |
Share transactions
Proceeds from sales of shares | 417,211,028 | 449,219,245 |
Net asset value of shares issued in exchange for the net assets of Fidelity Freedom 2000 Fund (note 6) | 811,551,284 | - |
Reinvestment of distributions | 108,253,529 | 87,164,850 |
Cost of shares redeemed | (770,668,399) | (782,609,209) |
Net increase (decrease) in net assets resulting from share transactions | 566,347,442 | (246,225,114) |
Total increase (decrease) in net assets | 548,638,008 | (256,455,595) |
| | |
Net Assets | | |
Beginning of period | 1,935,210,175 | 2,191,665,770 |
End of period (including undistributed net investment income of $3,358,995 and undistributed net investment income of $2,797,937, respectively) | $ 2,483,848,183 | $ 1,935,210,175 |
Other Information Shares | | |
Sold | 35,672,865 | 38,107,770 |
Issued in exchange for the shares of Fidelity Freedom 2000 Fund (note 6) | 69,244,991 | - |
Issued in reinvestment of distributions | 9,327,503 | 7,406,503 |
Redeemed | (65,948,473) | (66,443,845) |
Net increase (decrease) | 48,296,886 | (20,929,572) |
Financial Highlights
Years ended March 31, | 2015 | 2014 | 2013 | 2012 | 2011 |
Selected Per-Share Data | | | | | |
Net asset value, beginning of period | $ 11.86 | $ 11.91 | $ 11.60 | $ 11.48 | $ 10.96 |
Income from Investment Operations | | | | | |
Net investment income (loss) B | .21 | .16 | .15 | .18 | .19 |
Net realized and unrealized gain (loss) | .28 | .30 | .40 | .21 | .60 |
Total from investment operations | .49 | .46 | .55 | .39 | .79 |
Distributions from net investment income | (.20) | (.16) | (.16) | (.19) | (.20) |
Distributions from net realized gain | (.40) | (.35) | (.08) | (.08) | (.07) |
Total distributions | (.60) | (.51) | (.24) | (.27) | (.27) |
Net asset value, end of period | $ 11.75 | $ 11.86 | $ 11.91 | $ 11.60 | $ 11.48 |
Total ReturnA | 4.31% | 3.95% | 4.79% | 3.47% | 7.33% |
Ratios to Average Net Assets C,E | | | | | |
Expenses before reductions D | .00% | .00% | .00% | .00% | .00% |
Expenses net of fee waivers, if any | .00% | .00% | .00% | .00% | .00% |
Expenses net of all reductions | .00% | .00% | .00% | .00% | .00% |
Net investment income (loss) | 1.77% | 1.37% | 1.32% | 1.58% | 1.71% |
Supplemental Data | | | | | |
Net assets, end of period (000 omitted) | $ 2,483,848 | $ 1,935,210 | $ 2,191,666 | $ 2,383,705 | $ 2,859,662 |
Portfolio turnover rate C | 26%F | 31% | 14% | 20% | 38% |
A Total returns would have been lower if certain expenses had not been reduced during the applicable periods shown.
B Calculated based on average shares outstanding during the period.
C Amounts do not include the activity of the Underlying Funds.
D Amount represents less than .01%.
E Expense ratios reflect operating expenses of the Fund. Expenses before reductions do not reflect amounts reimbursed by the investment adviser or reductions from expense offset arrangements and do not represent the amount paid by the Fund during periods when reimbursements or reductions occur. Expenses net of fee waivers reflect expenses after reimbursement by the investment adviser but prior to reductions from expense offset arrangements. Expenses net of all reductions represent the net expenses paid by the Fund but do not include expenses of the underlying funds in which the Fund invests.
F The portfolio turnover rate does not include the assets acquired in the merger.
See accompanying notes which are an integral part of the financial statements.
Annual Report
Fidelity Freedom 2005 Fund
Investment Changes (Unaudited)
The information in the following tables is based on the direct investments of the Fund. |
Fund Holdings as of March 31, 2015 |
| % of fund's net assets | % of fund's net assets 6 months ago |
Domestic Equity Funds | | |
Fidelity Series 100 Index Fund | 1.0 | 1.0 |
Fidelity Series 1000 Value Index Fund | 0.5 | 0.6 |
Fidelity Series All-Sector Equity Fund | 3.2 | 3.4 |
Fidelity Series Blue Chip Growth Fund | 2.5 | 2.9 |
Fidelity Series Commodity Strategy Fund | 0.8 | 0.9 |
Fidelity Series Equity-Income Fund | 4.2 | 4.3 |
Fidelity Series Growth & Income Fund | 3.2 | 3.3 |
Fidelity Series Growth Company Fund | 3.8 | 3.5 |
Fidelity Series Intrinsic Opportunities Fund | 2.1 | 2.1 |
Fidelity Series Opportunistic Insights Fund | 2.1 | 2.1 |
Fidelity Series Real Estate Equity Fund | 0.4 | 0.4 |
Fidelity Series Small Cap Discovery Fund | 0.5 | 0.5 |
Fidelity Series Small Cap Opportunities Fund | 1.7 | 1.6 |
Fidelity Series Stock Selector Large Cap Value Fund | 2.8 | 2.9 |
| 28.8 | 29.5 |
International Equity Funds | | |
Fidelity Series Emerging Markets Fund | 4.0 | 2.9 |
Fidelity Series International Growth Fund | 3.5 | 3.5 |
Fidelity Series International Small Cap Fund | 0.8 | 0.8 |
Fidelity Series International Value Fund | 3.5 | 3.9 |
| 11.8 | 11.1 |
Bond Funds | | |
Fidelity Series Emerging Markets Debt Fund | 0.6 | 0.7 |
Fidelity Series Floating Rate High Income Fund | 0.5 | 0.5 |
Fidelity Series High Income Fund | 3.5 | 4.3 |
Fidelity Series Inflation-Protected Bond Index Fund | 3.0 | 2.2 |
Fidelity Series Investment Grade Bond Fund | 36.5 | 33.5 |
Fidelity Series Real Estate Income Fund | 0.5 | 0.5 |
| 44.6 | 41.7 |
Short-Term Funds | | |
Fidelity Institutional Money Market Portfolio Institutional Class | 8.4 | 9.7 |
Fidelity Series Short-Term Credit Fund | 6.4 | 0.0 |
Fidelity Short-Term Bond Fund | 0.0 | 8.0 |
| 14.8 | 17.7 |
Net Other Assets (Liabilities)* | 0.0 | 0.0 |
| 100.0 | 100.0 |
* Amount represents less than 0.1% |
Asset Allocation (% of fund's net assets) |
Period end |
 | Domestic Equity Funds** | 28.8% | |
 | International Equity Funds | 11.8% | |
 | Bond Funds | 44.6% | |
 | Short-Term Funds | 14.8% | |

Six months ago |
 | Domestic Equity Funds** | 29.5% | |
 | International Equity Funds | 11.1% | |
 | Bond Funds | 41.7% | |
 | Short-Term Funds | 17.7% | |

** Includes Fidelity Series Commodity Strategy Fund which invests in commodity-related investments. |
Annual Report
Fidelity Freedom 2005 Fund
Investments March 31, 2015
Showing Percentage of Net Assets
Domestic Equity Funds - 28.8% |
| Shares | | Value |
Fidelity Series 100 Index Fund (c) | 472,233 | | $ 6,275,981 |
Fidelity Series 1000 Value Index Fund (c) | 319,118 | | 3,574,116 |
Fidelity Series All-Sector Equity Fund (c) | 1,447,418 | | 20,495,442 |
Fidelity Series Blue Chip Growth Fund (c) | 1,241,538 | | 15,854,437 |
Fidelity Series Commodity Strategy Fund (a)(c) | 825,963 | | 5,054,896 |
Fidelity Series Equity-Income Fund (c) | 2,126,124 | | 26,831,691 |
Fidelity Series Growth & Income Fund (c) | 1,508,473 | | 20,454,897 |
Fidelity Series Growth Company Fund (c) | 1,915,899 | | 24,102,011 |
Fidelity Series Intrinsic Opportunities Fund (c) | 904,441 | | 13,666,097 |
Fidelity Series Opportunistic Insights Fund (c) | 862,569 | | 13,309,437 |
Fidelity Series Real Estate Equity Fund (c) | 162,029 | | 2,432,048 |
Fidelity Series Small Cap Discovery Fund (c) | 320,651 | | 3,620,151 |
Fidelity Series Small Cap Opportunities Fund (c) | 792,162 | | 10,844,701 |
Fidelity Series Stock Selector Large Cap Value Fund (c) | 1,379,402 | | 17,918,432 |
TOTAL DOMESTIC EQUITY FUNDS (Cost $160,744,034) |
184,434,337
|
International Equity Funds - 11.8% |
| | | |
Fidelity Series Emerging Markets Fund (c) | 1,486,638 | | 25,272,843 |
Fidelity Series International Growth Fund (c) | 1,571,012 | | 22,606,868 |
Fidelity Series International Small Cap Fund (c) | 324,499 | | 5,149,802 |
Fidelity Series International Value Fund (c) | 2,193,866 | | 22,223,858 |
TOTAL INTERNATIONAL EQUITY FUNDS (Cost $71,274,657) |
75,253,371
|
Bond Funds - 44.6% |
| Shares | | Value |
Fidelity Series Emerging Markets Debt Fund (c) | 422,175 | | $ 4,099,321 |
Fidelity Series Floating Rate High Income Fund (c) | 323,181 | | 3,170,407 |
Fidelity Series High Income Fund (c) | 2,256,902 | | 22,117,636 |
Fidelity Series Inflation-Protected Bond Index Fund (c) | 1,991,895 | | 19,420,974 |
Fidelity Series Investment Grade Bond Fund (c) | 20,176,379 | | 233,440,707 |
Fidelity Series Real Estate Income Fund (c) | 273,791 | | 3,096,582 |
TOTAL BOND FUNDS (Cost $286,030,593) |
285,345,627
|
Short-Term Funds - 14.8% |
| | | |
Fidelity Institutional Money Market Portfolio Institutional Class 0.14% (b)(c) | 53,736,658 | | 53,736,658 |
Fidelity Series Short-Term Credit Fund (c) | 4,088,513 | | 40,926,018 |
TOTAL SHORT-TERM FUNDS (Cost $94,621,849) |
94,662,676
|
TOTAL INVESTMENT PORTFOLIO - 100.0% (Cost $612,671,133) | 639,696,011 |
NET OTHER ASSETS (LIABILITIES) - 0.0% | | 26,834 |
NET ASSETS - 100% | $ 639,722,845 |
Legend |
(a) Non-income producing |
(b) The rate quoted is the annualized seven-day yield of the fund at period end. |
(c) Affiliated Fund |
Affiliated Underlying Funds |
Information regarding the Fund's fiscal year to date purchases and sales of the affiliated Underlying Funds and income earned by the Fund from investments in affiliated Underlying Funds is as follows: |
Affiliate | Value,
beginning of period | Purchases | Sales
Proceeds | Dividend
Income | Value,
end of
period |
Fidelity Institutional Money Market Portfolio Institutional Class | $ 71,382,952 | $ 2,675,924 | $ 20,322,217 | $ 59,248 | $ 53,736,658 |
Fidelity Series 100 Index Fund | 5,694,585 | 1,146,414 | 1,085,082 | 129,507 | 6,275,981 |
Fidelity Series 1000 Value Index Fund | 3,839,487 | 333,991 | 785,041 | 77,695 | 3,574,116 |
Fidelity Series All-Sector Equity Fund | 21,652,381 | 3,876,991 | 5,217,398 | 192,677 | 20,495,442 |
Fidelity Series Blue Chip Growth Fund | 18,369,503 | 3,168,122 | 8,776,809 | 36,599 | 15,854,437 |
Fidelity Series Commodity Strategy Fund | 7,480,697 | 599,735 | 1,039,083 | - | 5,054,896 |
Fidelity Series Emerging Markets Debt Fund | 4,214,020 | 606,590 | 510,353 | 243,321 | 4,099,321 |
Fidelity Series Emerging Markets Fund | 16,344,100 | 11,202,825 | 1,931,098 | 161,410 | 25,272,843 |
Fidelity Series Equity-Income Fund | 27,479,103 | 4,373,652 | 5,338,952 | 601,092 | 26,831,691 |
Fidelity Series Floating Rate High Income Fund | 7,700,080 | 550,370 | 4,858,132 | 214,999 | 3,170,407 |
Fidelity Series Growth & Income Fund | 21,730,756 | 2,269,504 | 4,539,422 | 367,025 | 20,454,897 |
Fidelity Series Growth Company Fund | 22,151,810 | 824,047 | 2,448,124 | 45,902 | 24,102,011 |
Fidelity Series High Income Fund | 36,278,424 | 3,289,755 | 15,272,409 | 1,587,733 | 22,117,636 |
Fidelity Series Inflation-Protected Bond Index Fund | 14,652,336 | 7,400,129 | 2,382,079 | 23,065 | 19,420,974 |
Fidelity Series International Growth Fund | 28,419,831 | 1,826,951 | 8,039,138 | 306,280 | 22,606,868 |
Fidelity Series International Small Cap Fund | 6,403,800 | 313,967 | 1,430,961 | 47,129 | 5,149,802 |
Fidelity Series International Value Fund | 28,812,022 | 2,512,569 | 6,869,139 | 950,568 | 22,223,858 |
Fidelity Series Intrinsic Opportunities Fund | 14,140,423 | 1,331,036 | 2,986,702 | 194,507 | 13,666,097 |
Fidelity Series Investment Grade Bond Fund | 200,878,253 | 50,616,846 | 23,896,111 | 5,491,205 | 233,440,707 |
Fidelity Series Opportunistic Insights Fund | 13,502,942 | 2,074,258 | 3,649,636 | - | 13,309,437 |
Fidelity Series Real Estate Equity Fund | 2,845,214 | 445,498 | 1,274,337 | 46,276 | 2,432,048 |
Fidelity Series Real Estate Income Fund | 3,088,323 | 398,168 | 401,558 | 163,360 | 3,096,582 |
Fidelity Series Short-Term Credit Fund | - | 40,885,487 | 295 | - | 40,926,018 |
Fidelity Series Small Cap Discovery Fund | 3,617,455 | 779,539 | 1,140,007 | 6,934 | 3,620,151 |
Fidelity Series Small Cap Opportunities Fund | 11,031,125 | 2,194,937 | 2,511,686 | 35,806 | 10,844,701 |
Fidelity Series Stock Selector Large Cap Value Fund | 18,893,896 | 2,472,400 | 4,201,618 | 246,952 | 17,918,432 |
Fidelity Short-Term Bond Fund | 58,383,026 | 4,055,666 | 62,541,776 | 450,306 | - |
Total | $ 668,986,544 | $ 152,225,371 | $ 193,449,163 | $ 11,679,596 | $ 639,696,011 |
Other Information |
All investments are categorized as Level 1 under the Fair Value Hierarchy. The inputs or methodology used for valuing securities may not be an indication of the risk associated with investing in those securities. For more information on valuation inputs, please refer to the Investment Valuation section in the accompanying Notes to Financial Statements. |
See accompanying notes which are an integral part of the financial statements.
Annual Report
Fidelity Freedom 2005 Fund
Statement of Assets and Liabilities
| March 31, 2015 |
| | |
Assets | | |
Investment in securities, at value (cost $612,671,133) - See accompanying schedule | | $ 639,696,011 |
Receivable for investments sold | | 877,464 |
Receivable for fund shares sold | | 1,721,984 |
Dividends receivable | | 30,461 |
Total assets | | 642,325,920 |
| | |
Liabilities | | |
Payable for investments purchased | $ 1,752,191 | |
Payable for fund shares redeemed | 850,884 | |
Total liabilities | | 2,603,075 |
| | |
Net Assets | | $ 639,722,845 |
Net Assets consist of: | | |
Paid in capital | | $ 605,859,945 |
Undistributed net investment income | | 1,901,792 |
Accumulated undistributed net realized gain (loss) on investments | | 4,936,230 |
Net unrealized appreciation (depreciation) on investments | | 27,024,878 |
Net Assets, for 52,264,763 shares outstanding | | $ 639,722,845 |
Net Asset Value, offering price and redemption price per share ($639,722,845 ÷ 52,264,763 shares) | | $ 12.24 |
Statement of Operations
| Year ended March 31, 2015 |
| | |
Investment Income | | |
Income distributions from underlying funds | | $ 11,679,596 |
| | |
Expenses | | |
Independent trustees' compensation | $ 2,836 | |
Total expenses before reductions | 2,836 | |
Expense reductions | (2,836) | - |
Net investment income (loss) | | 11,679,596 |
Realized and Unrealized Gain (Loss) Realized gain (loss) on sale of underlying fund shares | 4,142,889 | |
Capital gain distributions from underlying funds | 10,128,102 | |
Total net realized gain (loss) | | 14,270,991 |
Change in net unrealized appreciation (depreciation) on underlying funds | | 7,790,686 |
Net gain (loss) | | 22,061,677 |
Net increase (decrease) in net assets resulting from operations | | $ 33,741,273 |
See accompanying notes which are an integral part of the financial statements.
Annual Report
Fidelity Freedom 2005 Fund
Financial Statements - continued
Statement of Changes in Net Assets
| Year ended
March 31,
2015 | Year ended
March 31,
2014 |
Increase (Decrease) in Net Assets | | |
Operations | | |
Net investment income (loss) | $ 11,679,596 | $ 9,408,832 |
Net realized gain (loss) | 14,270,991 | 30,476,006 |
Change in net unrealized appreciation (depreciation) | 7,790,686 | 2,143,507 |
Net increase (decrease) in net assets resulting from operations | 33,741,273 | 42,028,345 |
Distributions to shareholders from net investment income | (11,888,764) | (8,744,650) |
Distributions to shareholders from net realized gain | (8,829,757) | (5,826,392) |
Total distributions | (20,718,521) | (14,571,042) |
Share transactions
Proceeds from sales of shares | 116,890,373 | 158,367,969 |
Reinvestment of distributions | 20,575,995 | 14,471,314 |
Cost of shares redeemed | (179,752,812) | (235,493,332) |
Net increase (decrease) in net assets resulting from share transactions | (42,286,444) | (62,654,049) |
Total increase (decrease) in net assets | (29,263,692) | (35,196,746) |
| | |
Net Assets | | |
Beginning of period | 668,986,537 | 704,183,283 |
End of period (including undistributed net investment income of $1,901,792 and undistributed net investment income of $2,110,959, respectively) | $ 639,722,845 | $ 668,986,537 |
Other Information Shares | | |
Sold | 9,595,185 | 13,497,980 |
Issued in reinvestment of distributions | 1,709,561 | 1,225,512 |
Redeemed | (14,764,112) | (20,077,345) |
Net increase (decrease) | (3,459,366) | (5,353,853) |
Financial Highlights
Years ended March 31, | 2015 | 2014 | 2013 | 2012 | 2011 |
Selected Per-Share Data | | | | | |
Net asset value, beginning of period | $ 12.01 | $ 11.53 | $ 11.11 | $ 11.13 | $ 10.32 |
Income from Investment Operations | | | | | |
Net investment income (loss) B | .22 | .16 | .15 | .17 | .17 |
Net realized and unrealized gain (loss) | .40 | .58 | .51 | .12 | .91 |
Total from investment operations | .62 | .74 | .66 | .29 | 1.08 |
Distributions from net investment income | (.23) | (.15) | (.17) | (.18) | (.19) |
Distributions from net realized gain | (.17) | (.10) | (.07) | (.13) | (.09) |
Total distributions | (.39) H | (.26) G | (.24) | (.31) | (.27) F |
Net asset value, end of period | $ 12.24 | $ 12.01 | $ 11.53 | $ 11.11 | $ 11.13 |
Total ReturnA | 5.26% | 6.43% | 5.99% | 2.76% | 10.64% |
Ratios to Average Net AssetsC, E | | | | | |
Expenses before reductionsD | 0.00% | 0.00% | 0.00% | 0.00% | 0.00% |
Expenses net of fee waivers, if any | 0.00% | 0.00% | 0.00% | 0.00% | 0.00% |
Expenses net of all reductions | 0.00% | 0.00% | 0.00% | 0.00% | 0.00% |
Net investment income (loss) | 1.79% | 1.38% | 1.38% | 1.58% | 1.60% |
Supplemental Data | | | | | |
Net assets, end of period (000 omitted) | $ 639,723 | $ 668,987 | $ 704,183 | $ 797,849 | $ 932,400 |
Portfolio turnover rateC | 23% | 44% | 22% | 29% | 38% |
A Total returns would have been lower if certain expenses had not been reduced during the applicable periods shown.
B Calculated based on average shares outstanding during the period.
C Amounts do not include the activity of the Underlying Funds.
D Amount represents less than .01%.
E Expense ratios reflect operating expenses of the Fund. Expenses before reductions do not reflect amounts reimbursed by the investment adviser or reductions from expense offset arrangements and do not represent the amount paid by the Fund during periods when reimbursements or reductions occur. Expenses net of fee waivers reflect expenses after reimbursement by the investment adviser but prior to reductions from expense offset arrangements. Expenses net of all reductions represent the net expenses paid by the Fund but do not include expenses of the underlying funds in which the Fund invests.
F Total distributions of $.27 per share is comprised of distributions from net investment income of $.188 and distributions from net realized gain of $.085 per share.
G Total distributions of $.26 per share is comprised of distributions from net investment income of $.153 and distributions from net realized gain of $.103 per share.
H Total distributions of $.39 per share is comprised of distributions from net investment income of $.225 and distributions from net realized gain of $.168 per share.
See accompanying notes which are an integral part of the financial statements.
Annual Report
Fidelity Freedom 2010 Fund
Investment Changes (Unaudited)
The information in the following tables is based on the direct investments of the Fund. |
Fund Holdings as of March 31, 2015 |
| % of fund's net assets | % of fund's net assets 6 months ago |
Domestic Equity Funds | | |
Fidelity Series 100 Index Fund | 1.2 | 1.2 |
Fidelity Series 1000 Value Index Fund | 0.7 | 0.7 |
Fidelity Series All-Sector Equity Fund | 3.9 | 4.2 |
Fidelity Series Blue Chip Growth Fund | 3.0 | 3.5 |
Fidelity Series Commodity Strategy Fund | 0.8 | 1.0 |
Fidelity Series Equity-Income Fund | 5.1 | 5.2 |
Fidelity Series Growth & Income Fund | 3.9 | 4.0 |
Fidelity Series Growth Company Fund | 4.6 | 4.2 |
Fidelity Series Intrinsic Opportunities Fund | 2.6 | 2.6 |
Fidelity Series Opportunistic Insights Fund | 2.5 | 2.6 |
Fidelity Series Real Estate Equity Fund | 0.5 | 0.5 |
Fidelity Series Small Cap Discovery Fund | 0.7 | 0.6 |
Fidelity Series Small Cap Opportunities Fund | 2.1 | 2.0 |
Fidelity Series Stock Selector Large Cap Value Fund | 3.4 | 3.5 |
| 35.0 | 35.8 |
International Equity Funds | | |
Fidelity Series Emerging Markets Fund | 4.8 | 3.6 |
Fidelity Series International Growth Fund | 4.5 | 4.5 |
Fidelity Series International Small Cap Fund | 1.0 | 1.0 |
Fidelity Series International Value Fund | 4.4 | 4.8 |
| 14.7 | 13.9 |
Bond Funds | | |
Fidelity Series Emerging Markets Debt Fund | 0.6 | 0.7 |
Fidelity Series Floating Rate High Income Fund | 0.5 | 0.5 |
Fidelity Series High Income Fund | 3.4 | 4.4 |
Fidelity Series Inflation-Protected Bond Index Fund | 2.4 | 1.7 |
Fidelity Series Investment Grade Bond Fund | 33.5 | 30.4 |
Fidelity Series Real Estate Income Fund | 0.5 | 0.5 |
| 40.9 | 38.2 |
Short-Term Funds | | |
Fidelity Institutional Money Market Portfolio Institutional Class | 5.3 | 6.6 |
Fidelity Series Short-Term Credit Fund | 4.1 | 0.0 |
Fidelity Short-Term Bond Fund | 0.0 | 5.5 |
| 9.4 | 12.1 |
Net Other Assets (Liabilities)* | 0.0 | 0.0 |
| 100.0 | 100.0 |
* Amount represents less than 0.1% |
Asset Allocation (% of fund's net assets) |
Period end |
 | Domestic Equity Funds** | 35.0% | |
 | International Equity Funds | 14.7% | |
 | Bond Funds | 40.9% | |
 | Short-Term Funds | 9.4% | |

Six months ago |
 | Domestic Equity Funds** | 35.8% | |
 | International Equity Funds | 13.9% | |
 | Bond Funds | 38.2% | |
 | Short-Term Funds | 12.1% | |

** Includes Fidelity Series Commodity Strategy Fund which invests in commodity-related investments. |
Annual Report
Fidelity Freedom 2010 Fund
Investments March 31, 2015
Showing Percentage of Net Assets
Domestic Equity Funds - 35.0% |
| Shares | | Value |
Fidelity Series 100 Index Fund (c) | 4,449,331 | | $ 59,131,612 |
Fidelity Series 1000 Value Index Fund (c) | 2,996,839 | | 33,564,594 |
Fidelity Series All-Sector Equity Fund (c) | 13,636,113 | | 193,087,366 |
Fidelity Series Blue Chip Growth Fund (c) | 11,724,550 | | 149,722,505 |
Fidelity Series Commodity Strategy Fund (a)(c) | 6,349,388 | | 38,858,253 |
Fidelity Series Equity-Income Fund (c) | 20,006,352 | | 252,480,161 |
Fidelity Series Growth & Income Fund (c) | 14,205,854 | | 192,631,386 |
Fidelity Series Growth Company Fund (c) | 18,119,277 | | 227,940,501 |
Fidelity Series Intrinsic Opportunities Fund (c) | 8,523,959 | | 128,797,023 |
Fidelity Series Opportunistic Insights Fund (c) | 8,143,222 | | 125,649,909 |
Fidelity Series Real Estate Equity Fund (c) | 1,540,910 | | 23,129,058 |
Fidelity Series Small Cap Discovery Fund (c) | 3,030,562 | | 34,215,045 |
Fidelity Series Small Cap Opportunities Fund (c) | 7,465,550 | | 102,203,374 |
Fidelity Series Stock Selector Large Cap Value Fund (c) | 13,022,196 | | 169,158,331 |
TOTAL DOMESTIC EQUITY FUNDS (Cost $1,428,697,146) |
1,730,569,118
|
International Equity Funds - 14.7% |
| | | |
Fidelity Series Emerging Markets Fund (c) | 13,758,613 | | 233,896,417 |
Fidelity Series International Growth Fund (c) | 15,382,189 | | 221,349,699 |
Fidelity Series International Small Cap Fund (c) | 3,177,572 | | 50,428,068 |
Fidelity Series International Value Fund (c) | 21,480,494 | | 217,597,409 |
TOTAL INTERNATIONAL EQUITY FUNDS (Cost $656,388,462) |
723,271,593
|
Bond Funds - 40.9% |
| Shares | | Value |
Fidelity Series Emerging Markets Debt Fund (c) | 3,262,716 | | $ 31,680,969 |
Fidelity Series Floating Rate High Income Fund (c) | 2,494,327 | | 24,469,351 |
Fidelity Series High Income Fund (c) | 17,221,525 | | 168,770,946 |
Fidelity Series Inflation-Protected Bond Index Fund (c) | 12,190,844 | | 118,860,726 |
Fidelity Series Investment Grade Bond Fund (c) | 142,844,346 | | 1,652,709,077 |
Fidelity Series Real Estate Income Fund (c) | 2,123,198 | | 24,013,368 |
TOTAL BOND FUNDS (Cost $2,019,847,536) |
2,020,504,437
|
Short-Term Funds - 9.4% |
| | | |
Fidelity Institutional Money Market Portfolio Institutional Class 0.14% (b)(c) | 263,421,239 | | 263,421,239 |
Fidelity Series Short-Term Credit Fund (c) | 20,250,625 | | 202,708,753 |
TOTAL SHORT-TERM FUNDS (Cost $465,927,486) |
466,129,992
|
TOTAL INVESTMENT PORTFOLIO - 100.0% (Cost $4,570,860,630) | 4,940,475,140 |
NET OTHER ASSETS (LIABILITIES) - 0.0% | | 115,016 |
NET ASSETS - 100% | $ 4,940,590,156 |
Legend |
(a) Non-income producing |
(b) The rate quoted is the annualized seven-day yield of the fund at period end. |
(c) Affiliated Fund |
Affiliated Underlying Funds |
Information regarding the Fund's fiscal year to date purchases and sales of the affiliated Underlying Funds and income earned by the Fund from investments in affiliated Underlying Funds is as follows: |
Affiliate | Value,
beginning of period | Purchases | Sales
Proceeds | Dividend
Income | Value,
end of
period |
Fidelity Institutional Money Market Portfolio Institutional Class | $ 418,224,875 | $ 941,864 | $ 155,745,499 | $ 319,125 | $ 263,421,239 |
Fidelity Series 100 Index Fund | 56,501,356 | 7,593,729 | 9,974,221 | 1,219,777 | 59,131,612 |
Fidelity Series 1000 Value Index Fund | 38,096,578 | 1,593,315 | 7,946,119 | 744,263 | 33,564,594 |
Fidelity Series All-Sector Equity Fund | 232,484,736 | 24,041,086 | 66,149,516 | 1,828,135 | 193,087,366 |
Fidelity Series Blue Chip Growth Fund | 178,547,607 | 23,514,013 | 82,255,594 | 353,954 | 149,722,505 |
Fidelity Series Commodity Strategy Fund | 61,359,478 | 2,442,202 | 9,391,596 | - | 38,858,253 |
Fidelity Series Emerging Markets Debt Fund | 33,936,822 | 4,594,934 | 5,174,371 | 1,948,723 | 31,680,969 |
Fidelity Series Emerging Markets Fund | 163,736,237 | 92,283,372 | 18,944,390 | 1,597,664 | 233,896,417 |
Fidelity Series Equity-Income Fund | 277,416,481 | 22,264,520 | 50,857,883 | 5,890,782 | 252,480,161 |
Fidelity Series Floating Rate High Income Fund | 60,450,661 | 3,780,202 | 38,019,188 | 1,668,079 | 24,469,351 |
Fidelity Series Growth & Income Fund | 210,558,853 | 12,685,877 | 40,083,729 | 3,536,693 | 192,631,386 |
Fidelity Series Growth Company Fund | 222,959,428 | 2,969,807 | 32,522,779 | 439,301 | 227,940,501 |
Fidelity Series High Income Fund | 304,930,425 | 20,946,152 | 139,446,436 | 12,988,006 | 168,770,946 |
Fidelity Series Inflation-Protected Bond Index Fund | 96,672,358 | 43,797,314 | 20,236,842 | 145,769 | 118,860,726 |
Fidelity Series International Growth Fund | 280,773,999 | 9,250,080 | 72,510,215 | 3,027,251 | 221,349,699 |
Fidelity Series International Small Cap Fund | 65,102,967 | 1,259,593 | 14,574,023 | 466,777 | 50,428,068 |
Fidelity Series International Value Fund | 284,162,212 | 16,771,554 | 61,599,248 | 9,363,366 | 217,597,409 |
Fidelity Series Intrinsic Opportunities Fund | 135,140,799 | 8,457,029 | 25,967,817 | 1,874,182 | 128,797,023 |
Fidelity Series Investment Grade Bond Fund | 1,443,968,946 | 361,594,103 | 194,595,822 | 38,980,805 | 1,652,709,077 |
Fidelity Series Opportunistic Insights Fund | 134,604,533 | 9,920,817 | 32,217,099 | - | 125,649,909 |
Fidelity Series Real Estate Equity Fund | 26,666,981 | 2,152,509 | 9,679,340 | 455,030 | 23,129,058 |
Fidelity Series Real Estate Income Fund | 26,083,652 | 2,310,797 | 4,490,219 | 1,300,118 | 24,013,368 |
Fidelity Series Short-Term Credit Fund | - | 202,617,179 | 111,032 | - | 202,708,753 |
Fidelity Series Small Cap Discovery Fund | 33,947,819 | 3,768,280 | 6,813,652 | 65,078 | 34,215,045 |
Fidelity Series Small Cap Opportunities Fund | 109,302,533 | 14,880,516 | 22,939,383 | 340,734 | 102,203,374 |
Fidelity Series Stock Selector Large Cap Value Fund | 182,321,741 | 19,069,315 | 39,598,738 | 2,346,956 | 169,158,331 |
Fidelity Short-Term Bond Fund | 341,984,979 | 12,434,385 | 354,987,088 | 2,464,340 | - |
Total | $ 5,419,937,056 | $ 927,934,544 | $ 1,516,831,839 | $ 93,364,908 | $ 4,940,475,140 |
Other Information |
All investments are categorized as Level 1 under the Fair Value Hierarchy. The inputs or methodology used for valuing securities may not be an indication of the risk associated with investing in those securities. For more information on valuation inputs, please refer to the Investment Valuation section in the accompanying Notes to Financial Statements. |
See accompanying notes which are an integral part of the financial statements.
Annual Report
Fidelity Freedom 2010 Fund
Statement of Assets and Liabilities
| March 31, 2015 |
| | |
Assets | | |
Investment in securities, at value (cost $4,570,860,630) - See accompanying schedule | | $ 4,940,475,140 |
Receivable for investments sold | | 9,614,765 |
Receivable for fund shares sold | | 3,094,953 |
Other receivables | | 60,662 |
Dividends receivable | | 151,076 |
Total assets | | 4,953,396,596 |
| | |
Liabilities | | |
Payable for investments purchased | $ 6,667,419 | |
Payable for fund shares redeemed | 6,078,359 | |
Other payables and accrued expenses | 60,662 | |
Total liabilities | | 12,806,440 |
| | |
Net Assets | | $ 4,940,590,156 |
Net Assets consist of: | | |
Paid in capital | | $ 4,487,676,501 |
Undistributed net investment income | | 13,928,125 |
Accumulated undistributed net realized gain (loss) on investments | | 69,371,020 |
Net unrealized appreciation (depreciation) on investments | | 369,614,510 |
Net Assets, for 313,787,741 shares outstanding | | $ 4,940,590,156 |
Net Asset Value, offering price and redemption price per share ($4,940,590,156 ÷ 313,787,741 shares) | | $ 15.75 |
Statement of Operations
| Year ended March 31, 2015 |
| | |
Investment Income | | |
Income distributions from underlying funds | | $ 93,364,908 |
| | |
Expenses | | |
Independent trustees' compensation | $ 22,558 | |
Total expenses before reductions | 22,558 | |
Expense reductions | (22,558) | - |
Net investment income (loss) | | 93,364,908 |
Realized and Unrealized Gain (Loss) Realized gain (loss) on sale of underlying fund shares | 28,200,053 | |
Capital gain distributions from underlying funds | 93,363,094 | |
Total net realized gain (loss) | | 121,563,147 |
Change in net unrealized appreciation (depreciation) on underlying funds | | 81,235,546 |
Net gain (loss) | | 202,798,693 |
Net increase (decrease) in net assets resulting from operations | | $ 296,163,601 |
See accompanying notes which are an integral part of the financial statements.
Annual Report
Fidelity Freedom 2010 Fund
Financial Statements - continued
Statement of Changes in Net Assets
| Year ended
March 31,
2015 | Year ended
March 31,
2014 |
Increase (Decrease) in Net Assets | | |
Operations | | |
Net investment income (loss) | $ 93,364,908 | $ 80,709,645 |
Net realized gain (loss) | 121,563,147 | 306,363,482 |
Change in net unrealized appreciation (depreciation) | 81,235,546 | 60,205,897 |
Net increase (decrease) in net assets resulting from operations | 296,163,601 | 447,279,024 |
Distributions to shareholders from net investment income | (95,294,381) | (76,879,519) |
Distributions to shareholders from net realized gain | (121,157,748) | (57,935,343) |
Total distributions | (216,452,129) | (134,814,862) |
Share transactions
Proceeds from sales of shares | 643,396,098 | 894,227,928 |
Reinvestment of distributions | 214,226,048 | 133,669,782 |
Cost of shares redeemed | (1,416,664,920) | (1,799,731,983) |
Net increase (decrease) in net assets resulting from share transactions | (559,042,774) | (771,834,273) |
Total increase (decrease) in net assets | (479,331,302) | (459,370,111) |
| | |
Net Assets | | |
Beginning of period | 5,419,921,458 | 5,879,291,569 |
End of period (including undistributed net investment income of $13,928,125 and undistributed net investment income of $15,857,598, respectively) | $ 4,940,590,156 | $ 5,419,921,458 |
Other Information Shares | | |
Sold | 41,281,295 | 59,360,372 |
Issued in reinvestment of distributions | 13,915,072 | 8,772,832 |
Redeemed | (90,929,728) | (119,469,549) |
Net increase (decrease) | (35,733,361) | (51,336,345) |
Financial Highlights
Years ended March 31, | 2015 | 2014 | 2013 | 2012 | 2011 |
Selected Per-Share Data | | | | | |
Net asset value, beginning of period | $ 15.51 | $ 14.67 | $ 13.99 | $ 14.05 | $ 12.89 |
Income from Investment Operations | | | | | |
Net investment income (loss) B | .28 | .22 | .22 | .23 | .22 |
Net realized and unrealized gain (loss) | .62 | .99 | .80 | .17 | 1.31 |
Total from investment operations | .90 | 1.21 | 1.02 | .40 | 1.53 |
Distributions from net investment income | (.29) | (.21) | (.24) | (.26) | (.25) |
Distributions from net realized gain | (.36) | (.16) | (.10) | (.20) | (.12) |
Total distributions | (.66) F | (.37) | (.34) | (.46) | (.37) |
Net asset value, end of period | $ 15.75 | $ 15.51 | $ 14.67 | $ 13.99 | $ 14.05 |
Total ReturnA | 5.91% | 8.31% | 7.43% | 3.01% | 12.02% |
Ratios to Average Net AssetsC, E | | | | | |
Expenses before reductionsD | 0.00% | 0.00% | 0.00% | 0.00% | 0.00% |
Expenses net of fee waivers, if any | 0.00% | 0.00% | 0.00% | 0.00% | 0.00% |
Expenses net of all reductions | 0.00% | 0.00% | 0.00% | 0.00% | 0.00% |
Net investment income (loss) | 1.81% | 1.43% | 1.54% | 1.67% | 1.64% |
Supplemental Data | | | | | |
Net assets, end of period (000 omitted) | $ 4,940,590 | $ 5,419,921 | $ 5,879,292 | $ 7,060,086 | $ 9,701,251 |
Portfolio turnover rateC | 18% | 35% | 19% | 18% | 34% |
A Total returns would have been lower if certain expenses had not been reduced during the applicable periods shown.
B Calculated based on average shares outstanding during the period.
C Amounts do not include the activity of the Underlying Funds.
D Amount represents less than .01%.
E Expense ratios reflect operating expenses of the Fund. Expenses before reductions do not reflect amounts reimbursed by the investment adviser or reductions from expense offset arrangements and do not represent the amount paid by the Fund during periods when reimbursements or reductions occur. Expenses net of fee waivers reflect expenses after reimbursement by the investment adviser but prior to reductions from expense offset arrangements. Expenses net of all reductions represent the net expenses paid by the Fund but do not include expenses of the underlying funds in which the Fund invests.
F Total distributions of $.66 per share is comprised of distributions from net investment income of $.294 and distributions from net realized gain of $.361 per share.
See accompanying notes which are an integral part of the financial statements.
Annual Report
Fidelity Freedom 2015 Fund
Investment Changes (Unaudited)
The information in the following tables is based on the direct investments of the Fund. |
Fund Holdings as of March 31, 2015 |
| % of fund's net assets | % of fund's net assets 6 months ago |
Domestic Equity Funds | | |
Fidelity Series 100 Index Fund | 1.4 | 1.3 |
Fidelity Series 1000 Value Index Fund | 0.8 | 0.8 |
Fidelity Series All-Sector Equity Fund | 4.5 | 4.7 |
Fidelity Series Blue Chip Growth Fund | 3.6 | 4.1 |
Fidelity Series Commodity Strategy Fund | 0.8 | 1.0 |
Fidelity Series Equity-Income Fund | 6.0 | 6.0 |
Fidelity Series Growth & Income Fund | 4.5 | 4.6 |
Fidelity Series Growth Company Fund | 5.3 | 4.9 |
Fidelity Series Intrinsic Opportunities Fund | 3.0 | 3.0 |
Fidelity Series Opportunistic Insights Fund | 3.0 | 3.1 |
Fidelity Series Real Estate Equity Fund | 0.5 | 0.5 |
Fidelity Series Small Cap Discovery Fund | 0.8 | 0.7 |
Fidelity Series Small Cap Opportunities Fund | 2.4 | 2.3 |
Fidelity Series Stock Selector Large Cap Value Fund | 4.0 | 4.1 |
| 40.6 | 41.1 |
International Equity Funds | | |
Fidelity Series Emerging Markets Fund | 5.3 | 4.0 |
Fidelity Series International Growth Fund | 5.3 | 5.3 |
Fidelity Series International Small Cap Fund | 1.2 | 1.2 |
Fidelity Series International Value Fund | 5.2 | 5.6 |
| 17.0 | 16.1 |
Bond Funds | | |
Fidelity Series Emerging Markets Debt Fund | 0.6 | 0.6 |
Fidelity Series Floating Rate High Income Fund | 0.5 | 0.5 |
Fidelity Series High Income Fund | 3.4 | 4.3 |
Fidelity Series Inflation-Protected Bond Index Fund | 1.6 | 1.4 |
Fidelity Series Investment Grade Bond Fund | 30.8 | 27.8 |
Fidelity Series Real Estate Income Fund | 0.5 | 0.5 |
| 37.4 | 35.1 |
Short-Term Funds | | |
Fidelity Institutional Money Market Portfolio Institutional Class | 2.8 | 4.2 |
Fidelity Series Short-Term Credit Fund | 2.2 | 0.0 |
Fidelity Short-Term Bond Fund | 0.0 | 3.5 |
| 5.0 | 7.7 |
Net Other Assets (Liabilities)* | 0.0 | 0.0 |
| 100.0 | 100.0 |
* Amount represents less than 0.1% |
Asset Allocation (% of fund's net assets) |
Period end |
 | Domestic Equity Funds** | 40.6% | |
 | International Equity Funds | 17.0% | |
 | Bond Funds | 37.4% | |
 | Short-Term Funds | 5.0% | |

Six months ago |
 | Domestic Equity Funds** | 41.1% | |
 | International Equity Funds | 16.1% | |
 | Bond Funds | 35.1% | |
 | Short-Term Funds | 7.7% | |

** Includes Fidelity Series Commodity Strategy Fund which invests in commodity-related investments. |
Annual Report
Fidelity Freedom 2015 Fund
Investments March 31, 2015
Showing Percentage of Net Assets
Domestic Equity Funds - 40.6% |
| Shares | | Value |
Fidelity Series 100 Index Fund (c) | 6,350,944 | | $ 84,404,041 |
Fidelity Series 1000 Value Index Fund (c) | 4,257,558 | | 47,684,655 |
Fidelity Series All-Sector Equity Fund (c) | 19,485,856 | | 275,919,719 |
Fidelity Series Blue Chip Growth Fund (c) | 16,867,493 | | 215,397,883 |
Fidelity Series Commodity Strategy Fund (a)(c) | 7,729,067 | | 47,301,893 |
Fidelity Series Equity-Income Fund (c) | 28,582,487 | | 360,710,990 |
Fidelity Series Growth & Income Fund (c) | 20,276,972 | | 274,955,734 |
Fidelity Series Growth Company Fund (c) | 25,598,902 | | 322,034,186 |
Fidelity Series Intrinsic Opportunities Fund (c) | 12,165,218 | | 183,816,439 |
Fidelity Series Opportunistic Insights Fund (c) | 11,636,187 | | 179,546,372 |
Fidelity Series Real Estate Equity Fund (c) | 2,185,003 | | 32,796,898 |
Fidelity Series Small Cap Discovery Fund (c) | 4,324,840 | | 48,827,445 |
Fidelity Series Small Cap Opportunities Fund (c) | 10,656,391 | | 145,885,993 |
Fidelity Series Stock Selector Large Cap Value Fund (c) | 18,548,102 | | 240,939,850 |
TOTAL DOMESTIC EQUITY FUNDS (Cost $2,000,242,576) |
2,460,222,098
|
International Equity Funds - 17.0% |
| | | |
Fidelity Series Emerging Markets Fund (c) | 18,684,282 | | 317,632,796 |
Fidelity Series International Growth Fund (c) | 22,240,732 | | 320,044,137 |
Fidelity Series International Small Cap Fund (c) | 4,634,227 | | 73,545,184 |
Fidelity Series International Value Fund (c) | 31,326,218 | | 317,334,587 |
TOTAL INTERNATIONAL EQUITY FUNDS (Cost $906,341,749) |
1,028,556,704
|
Bond Funds - 37.4% |
| Shares | | Value |
Fidelity Series Emerging Markets Debt Fund (c) | 3,896,857 | | $ 37,838,482 |
Fidelity Series Floating Rate High Income Fund (c) | 3,025,209 | | 29,677,305 |
Fidelity Series High Income Fund (c) | 20,840,110 | | 204,233,074 |
Fidelity Series Inflation-Protected Bond Index Fund (c) | 9,968,126 | | 97,189,232 |
Fidelity Series Investment Grade Bond Fund (c) | 161,090,131 | | 1,863,812,814 |
Fidelity Series Real Estate Income Fund (c) | 2,588,653 | | 29,277,662 |
TOTAL BOND FUNDS (Cost $2,220,546,732) |
2,262,028,569
|
Short-Term Funds - 5.0% |
| | | |
Fidelity Institutional Money Market Portfolio Institutional Class 0.14% (b)(c) | 172,766,198 | | 172,766,198 |
Fidelity Series Short-Term Credit Fund (c) | 13,237,014 | | 132,502,510 |
TOTAL SHORT-TERM FUNDS (Cost $305,136,338) |
305,268,708
|
TOTAL INVESTMENT PORTFOLIO - 100.0% (Cost $5,432,267,395) | | 6,056,076,079 |
NET OTHER ASSETS (LIABILITIES) - 0.0% | | 84,972 |
NET ASSETS - 100% | $ 6,056,161,051 |
Legend |
(a) Non-income producing |
(b) The rate quoted is the annualized seven-day yield of the fund at period end. |
(c) Affiliated Fund |
Affiliated Underlying Funds |
Information regarding the Fund's fiscal year to date purchases and sales of the affiliated Underlying Funds and income earned by the Fund from investments in affiliated Underlying Funds is as follows: |
Affiliate | Value,
beginning of period | Purchases | Sales
Proceeds | Dividend
Income | Value,
end of
period |
Fidelity Institutional Money Market Portfolio Institutional Class | $ 343,323,111 | $ 3,836,380 | $ 174,393,293 | $ 239,011 | $ 172,766,198 |
Fidelity Series 100 Index Fund | 74,144,497 | 17,042,619 | 13,668,507 | 1,746,116 | 84,404,041 |
Fidelity Series 1000 Value Index Fund | 46,636,335 | 6,736,801 | 8,048,431 | 1,034,912 | 47,684,655 |
Fidelity Series All-Sector Equity Fund | 304,480,675 | 37,001,391 | 68,467,772 | 2,549,289 | 275,919,719 |
Fidelity Series Blue Chip Growth Fund | 245,927,345 | 27,055,406 | 98,793,761 | 489,258 | 215,397,883 |
Fidelity Series Commodity Strategy Fund | 71,305,753 | 3,084,902 | 8,460,636 | - | 47,301,893 |
Fidelity Series Emerging Markets Debt Fund | 38,684,092 | 6,445,570 | 5,265,469 | 2,282,261 | 37,838,482 |
Fidelity Series Emerging Markets Fund | 221,111,054 | 122,701,851 | 22,171,542 | 2,147,019 | 317,632,796 |
Fidelity Series Equity-Income Fund | 374,262,216 | 43,131,106 | 60,977,217 | 8,080,526 | 360,710,990 |
Fidelity Series Floating Rate High Income Fund | 71,234,961 | 4,565,837 | 44,039,706 | 1,982,462 | 29,677,305 |
Fidelity Series Growth & Income Fund | 287,336,651 | 22,459,842 | 47,730,334 | 4,861,198 | 274,955,734 |
Fidelity Series Growth Company Fund | 310,869,608 | 2,513,713 | 38,395,889 | 608,577 | 322,034,186 |
Fidelity Series High Income Fund | 368,959,968 | 28,737,944 | 172,138,229 | 15,690,465 | 204,233,074 |
Fidelity Series Inflation-Protected Bond Index Fund | 86,994,900 | 23,455,219 | 12,152,850 | 126,965 | 97,189,232 |
Fidelity Series International Growth Fund | 379,239,842 | 18,906,703 | 83,589,906 | 4,274,518 | 320,044,137 |
Fidelity Series International Small Cap Fund | 91,329,509 | 2,813,281 | 18,814,813 | 659,196 | 73,545,184 |
Fidelity Series International Value Fund | 383,398,185 | 28,171,110 | 63,631,675 | 13,382,132 | 317,334,587 |
Fidelity Series Intrinsic Opportunities Fund | 182,385,954 | 18,302,777 | 32,300,989 | 2,599,102 | 183,816,439 |
Fidelity Series Investment Grade Bond Fund | 1,524,098,569 | 469,888,639 | 175,703,804 | 42,343,955 | 1,863,812,814 |
Fidelity Series Opportunistic Insights Fund | 185,117,642 | 15,660,871 | 39,585,199 | - | 179,546,372 |
Fidelity Series Real Estate Equity Fund | 37,652,632 | 10,368,521 | 20,970,735 | 666,448 | 32,796,898 |
Fidelity Series Real Estate Income Fund | 30,501,002 | 2,778,804 | 4,118,968 | 1,559,347 | 29,277,662 |
Fidelity Series Short-Term Credit Fund | - | 132,519,453 | 149,455 | - | 132,502,510 |
Fidelity Series Small Cap Discovery Fund | 46,909,221 | 4,618,582 | 7,069,740 | 88,657 | 48,827,445 |
Fidelity Series Small Cap Opportunities Fund | 148,780,208 | 23,520,180 | 28,000,546 | 468,696 | 145,885,993 |
Fidelity Series Stock Selector Large Cap Value Fund | 253,084,912 | 26,590,431 | 48,658,916 | 3,276,543 | 240,939,850 |
Fidelity Short-Term Bond Fund | 280,721,154 | 9,707,367 | 290,817,287 | 1,886,611 | - |
Total | $ 6,388,489,996 | $ 1,112,615,300 | $ 1,588,115,669 | $ 113,043,264 | $ 6,056,076,079 |
Other Information |
All investments are categorized as Level 1 under the Fair Value Hierarchy. The inputs or methodology used for valuing securities may not be an indication of the risk associated with investing in those securities. For more information on valuation inputs, please refer to the Investment Valuation section in the accompanying Notes to Financial Statements. |
See accompanying notes which are an integral part of the financial statements.
Annual Report
Fidelity Freedom 2015 Fund
Statement of Assets and Liabilities
| March 31, 2015 |
| | |
Assets | | |
Investment in securities, at value (cost $5,432,267,395) - See accompanying schedule | | $ 6,056,076,079 |
Cash | | 2 |
Receivable for investments sold | | 15,251,234 |
Receivable for fund shares sold | | 6,236,639 |
Dividends receivable | | 98,740 |
Total assets | | 6,077,662,694 |
| | |
Liabilities | | |
Payable for investments purchased | $ 7,919,097 | |
Payable for fund shares redeemed | 13,582,546 | |
Total liabilities | | 21,501,643 |
| | |
Net Assets | | $ 6,056,161,051 |
Net Assets consist of: | | |
Paid in capital | | $ 5,319,063,450 |
Undistributed net investment income | | 13,862,788 |
Accumulated undistributed net realized gain (loss) on investments | | 99,426,129 |
Net unrealized appreciation (depreciation) on investments | | 623,808,684 |
Net Assets, for 468,711,852 shares outstanding | | $ 6,056,161,051 |
Net Asset Value, offering price and redemption price per share ($6,056,161,051 ÷ 468,711,852 shares) | | $ 12.92 |
Statement of Operations
| Year ended March 31, 2015 |
| | |
Investment Income | | |
Income distributions from underlying funds | | $ 113,043,264 |
| | |
Expenses | | |
Independent trustees' compensation | $ 26,893 | |
Total expenses before reductions | 26,893 | |
Expense reductions | (26,893) | - |
Net investment income (loss) | | 113,043,264 |
Realized and Unrealized Gain (Loss) Realized gain (loss) on sale of underlying fund shares | 34,183,348 | |
Capital gain distributions from underlying funds | 127,194,123 | |
Total net realized gain (loss) | | 161,377,471 |
Change in net unrealized appreciation (depreciation) on underlying funds | | 108,905,073 |
Net gain (loss) | | 270,282,544 |
Net increase (decrease) in net assets resulting from operations | | $ 383,325,808 |
See accompanying notes which are an integral part of the financial statements.
Annual Report
Statement of Changes in Net Assets
| Year ended
March 31,
2015 | Year ended
March 31,
2014 |
Increase (Decrease) in Net Assets | | |
Operations | | |
Net investment income (loss) | $ 113,043,264 | $ 94,589,547 |
Net realized gain (loss) | 161,377,471 | 315,329,933 |
Change in net unrealized appreciation (depreciation) | 108,905,073 | 141,730,739 |
Net increase (decrease) in net assets resulting from operations | 383,325,808 | 551,650,219 |
Distributions to shareholders from net investment income | (116,494,554) | (90,435,088) |
Distributions to shareholders from net realized gain | (261,240,607) | (141,215,345) |
Total distributions | (377,735,161) | (231,650,433) |
Share transactions
Proceeds from sales of shares | 1,457,638,108 | 1,789,616,931 |
Reinvestment of distributions | 375,369,098 | 230,425,067 |
Cost of shares redeemed | (2,170,922,299) | (2,458,725,456) |
Net increase (decrease) in net assets resulting from share transactions | (337,915,093) | (438,683,458) |
Total increase (decrease) in net assets | (332,324,446) | (118,683,672) |
| | |
Net Assets | | |
Beginning of period | 6,388,485,497 | 6,507,169,169 |
End of period (including undistributed net investment income of $13,862,788 and undistributed net investment income of $17,314,079, respectively) | $ 6,056,161,051 | $ 6,388,485,497 |
Other Information Shares | | |
Sold | 113,989,864 | 142,426,148 |
Issued in reinvestment of distributions | 29,849,055 | 18,209,266 |
Redeemed | (169,874,789) | (195,752,343) |
Net increase (decrease) | (26,035,870) | (35,116,929) |
Financial Highlights
Years ended March 31, | 2015 | 2014 | 2013 | 2012 | 2011 |
Selected Per-Share Data | | | | | |
Net asset value, beginning of period | $ 12.91 | $ 12.28 | $ 11.69 | $ 11.74 | $ 10.74 |
Income from Investment Operations | | | | | |
Net investment income (loss) B | .23 | .18 | .18 | .20 | .18 |
Net realized and unrealized gain (loss) | .57 | .91 | .69 | .12 | 1.12 |
Total from investment operations | .80 | 1.09 | .87 | .32 | 1.30 |
Distributions from net investment income | (.25) | (.18) | (.20) | (.21) | (.20) |
Distributions from net realized gain | (.54) | (.28) | (.08) | (.16) | (.10) |
Total distributions | (.79) | (.46) | (.28) | (.37) | (.30) |
Net asset value, end of period | $ 12.92 | $ 12.91 | $ 12.28 | $ 11.69 | $ 11.74 |
Total ReturnA | 6.42% | 8.95% | 7.60% | 2.95% | 12.24% |
Ratios to Average Net AssetsC, E | | | | | |
Expenses before reductionsD | 0.00% | 0.00% | 0.00% | 0.00% | 0.00% |
Expenses net of fee waivers, if any | 0.00% | 0.00% | 0.00% | 0.00% | 0.00% |
Expenses net of all reductions | 0.00% | 0.00% | 0.00% | 0.00% | 0.00% |
Net investment income (loss) | 1.83% | 1.47% | 1.57% | 1.71% | 1.66% |
Supplemental Data | | | | | |
Net assets, end of period (000 omitted) | $ 6,056,161 | $ 6,388,485 | $ 6,507,169 | $ 7,255,215 | $ 8,851,315 |
Portfolio turnover rateC | 18% | 39% | 23% | 24% | 43% |
A Total returns would have been lower if certain expenses had not been reduced during the applicable periods shown.
B Calculated based on average shares outstanding during the period.
C Amounts do not include the activity of the Underlying Funds.
D Amount represents less than .01%.
E Expense ratios reflect operating expenses of the Fund. Expenses before reductions do not reflect amounts reimbursed by the investment adviser or reductions from expense offset arrangements and do not represent the amount paid by the Fund during periods when reimbursements or reductions occur. Expenses net of fee waivers reflect expenses after reimbursement by the investment adviser but prior to reductions from expense offset arrangements. Expenses net of all reductions represent the net expenses paid by the Fund but do not include expenses of the underlying funds in which the Fund invests.
See accompanying notes which are an integral part of the financial statements.
Annual Report
Fidelity Freedom 2020 Fund
Investment Changes (Unaudited)
The information in the following tables is based on the direct investments of the Fund. |
Fund Holdings as of March 31, 2015 |
| % of fund's net assets | % of fund's net assets 6 months ago |
Domestic Equity Funds | | |
Fidelity Series 100 Index Fund | 1.5 | 1.5 |
Fidelity Series 1000 Value Index Fund | 0.9 | 0.9 |
Fidelity Series All-Sector Equity Fund | 5.0 | 5.2 |
Fidelity Series Blue Chip Growth Fund | 4.0 | 4.5 |
Fidelity Series Commodity Strategy Fund | 0.8 | 1.0 |
Fidelity Series Equity-Income Fund | 6.6 | 6.7 |
Fidelity Series Growth & Income Fund | 5.0 | 5.2 |
Fidelity Series Growth Company Fund | 5.9 | 5.4 |
Fidelity Series Intrinsic Opportunities Fund | 3.4 | 3.3 |
Fidelity Series Opportunistic Insights Fund | 3.3 | 3.4 |
Fidelity Series Real Estate Equity Fund | 0.6 | 0.6 |
Fidelity Series Small Cap Discovery Fund | 0.8 | 0.7 |
Fidelity Series Small Cap Opportunities Fund | 2.7 | 2.6 |
Fidelity Series Stock Selector Large Cap Value Fund | 4.4 | 4.5 |
| 44.9 | 45.5 |
International Equity Funds | | |
Fidelity Series Emerging Markets Fund | 5.7 | 4.5 |
Fidelity Series International Growth Fund | 5.9 | 5.9 |
Fidelity Series International Small Cap Fund | 1.4 | 1.3 |
Fidelity Series International Value Fund | 5.8 | 6.0 |
| 18.8 | 17.7 |
Bond Funds | | |
Fidelity Series Emerging Markets Debt Fund | 0.6 | 0.7 |
Fidelity Series Floating Rate High Income Fund | 0.5 | 0.5 |
Fidelity Series High Income Fund | 3.3 | 4.3 |
Fidelity Series Inflation-Protected Bond Index Fund | 0.8 | 0.8 |
Fidelity Series Investment Grade Bond Fund | 27.2 | 24.2 |
Fidelity Series Real Estate Income Fund | 0.5 | 0.5 |
| 32.9 | 31.0 |
Short-Term Funds | | |
Fidelity Institutional Money Market Portfolio Institutional Class | 1.9 | 3.1 |
Fidelity Series Short-Term Credit Fund | 1.5 | 0.0 |
Fidelity Short-Term Bond Fund | 0.0 | 2.7 |
| 3.4 | 5.8 |
Net Other Assets (Liabilities)* | 0.0 | 0.0 |
| 100.0 | 100.0 |
* Amount represents less than 0.1% |
Asset Allocation (% of fund's net assets) |
Period end |
 | Domestic Equity Funds** | 44.9% | |
 | International Equity Funds | 18.8% | |
 | Bond Funds | 32.9% | |
 | Short-Term Funds | 3.4% | |

Six months ago |
 | Domestic Equity Funds** | 45.5% | |
 | International Equity Funds | 17.7% | |
 | Bond Funds | 31.0% | |
 | Short-Term Funds | 5.8% | |

** Includes Fidelity Series Commodity Strategy Fund which invests in commodity-related investments. |
Annual Report
Fidelity Freedom 2020 Fund
Investments March 31, 2015
Showing Percentage of Net Assets
Domestic Equity Funds - 44.9% |
| Shares | | Value |
Fidelity Series 100 Index Fund (c) | 14,915,898 | | $ 198,232,278 |
Fidelity Series 1000 Value Index Fund (c) | 10,041,997 | | 112,470,370 |
Fidelity Series All-Sector Equity Fund (c) | 45,847,889 | | 649,206,107 |
Fidelity Series Blue Chip Growth Fund (c) | 40,179,184 | | 513,088,185 |
Fidelity Series Commodity Strategy Fund (a)(c) | 16,229,963 | | 99,327,375 |
Fidelity Series Equity-Income Fund (c) | 67,136,107 | | 847,257,671 |
Fidelity Series Growth & Income Fund (c) | 47,668,137 | | 646,379,942 |
Fidelity Series Growth Company Fund (c) | 60,110,747 | | 756,193,199 |
Fidelity Series Intrinsic Opportunities Fund (c) | 28,607,054 | | 432,252,591 |
Fidelity Series Opportunistic Insights Fund (c) | 27,379,388 | | 422,463,954 |
Fidelity Series Real Estate Equity Fund (c) | 5,121,443 | | 76,872,858 |
Fidelity Series Small Cap Discovery Fund (c) | 9,481,592 | | 107,047,176 |
Fidelity Series Small Cap Opportunities Fund (c) | 25,480,945 | | 348,834,138 |
Fidelity Series Stock Selector Large Cap Value Fund (c) | 43,469,853 | | 564,673,391 |
TOTAL DOMESTIC EQUITY FUNDS (Cost $4,700,633,370) |
5,774,299,235
|
International Equity Funds - 18.8% |
| | | |
Fidelity Series Emerging Markets Fund (c) | 42,835,757 | | 728,207,865 |
Fidelity Series International Growth Fund (c) | 52,738,577 | | 758,908,123 |
Fidelity Series International Small Cap Fund (c) | 11,004,904 | | 174,647,827 |
Fidelity Series International Value Fund (c) | 74,368,818 | | 753,356,123 |
TOTAL INTERNATIONAL EQUITY FUNDS (Cost $2,139,518,961) |
2,415,119,938
|
Bond Funds - 32.9% |
| Shares | | Value |
Fidelity Series Emerging Markets Debt Fund (c) | 8,365,065 | | $ 81,224,782 |
Fidelity Series Floating Rate High Income Fund (c) | 6,404,588 | | 62,829,011 |
Fidelity Series High Income Fund (c) | 44,157,977 | | 432,748,175 |
Fidelity Series Inflation-Protected Bond Index Fund (c) | 11,013,082 | | 107,377,552 |
Fidelity Series Investment Grade Bond Fund (c) | 302,134,028 | | 3,495,690,699 |
Fidelity Series Real Estate Income Fund (c) | 5,463,990 | | 61,797,725 |
TOTAL BOND FUNDS (Cost $4,186,406,126) |
4,241,667,944
|
Short-Term Funds - 3.4% |
| | | |
Fidelity Institutional Money Market Portfolio Institutional Class 0.14% (b)(c) | 246,531,532 | | 246,531,532 |
Fidelity Series Short-Term Credit Fund (c) | 19,096,469 | | 191,155,658 |
TOTAL SHORT-TERM FUNDS (Cost $437,496,226) |
437,687,190
|
TOTAL INVESTMENT PORTFOLIO - 100.0% (Cost $11,464,054,683) | 12,868,774,307 |
NET OTHER ASSETS (LIABILITIES) - 0.0% | 123,351 |
NET ASSETS - 100% | $ 12,868,897,658 |
Legend |
(a) Non-income producing |
(b) The rate quoted is the annualized seven-day yield of the fund at period end. |
(c) Affiliated Fund |
Affiliated Underlying Funds |
Information regarding the Fund's fiscal year to date purchases and sales of the affiliated Underlying Funds and income earned by the Fund from investments in affiliated Underlying Funds is as follows: |
Affiliate | Value,
beginning of
period | Purchases | Sales
Proceeds | Dividend
Income | Value,
end of
period |
Fidelity Institutional Money Market Portfolio Institutional Class | $ 466,401,937 | $ 7,073,494 | $ 226,943,899 | $ 339,341 | $ 246,531,532 |
Fidelity Series 100 Index Fund | 170,714,134 | 41,457,803 | 29,725,106 | 4,082,583 | 198,232,278 |
Fidelity Series 1000 Value Index Fund | 106,653,964 | 18,052,460 | 17,714,327 | 2,432,433 | 112,470,370 |
Fidelity Series All-Sector Equity Fund | 689,012,324 | 91,769,042 | 137,258,702 | 6,001,923 | 649,206,107 |
Fidelity Series Blue Chip Growth Fund | 574,866,870 | 53,825,520 | 212,511,583 | 1,144,509 | 513,088,185 |
Fidelity Series Commodity Strategy Fund | 152,205,617 | 5,724,906 | 19,345,276 | - | 99,327,375 |
Fidelity Series Emerging Markets Debt Fund | 91,640,657 | 6,994,966 | 13,330,358 | 4,914,520 | 81,224,782 |
Fidelity Series Emerging Markets Fund | 520,378,783 | 267,227,560 | 49,797,873 | 4,979,456 | 728,207,865 |
Fidelity Series Equity-Income Fund | 865,558,337 | 107,552,769 | 135,528,918 | 18,843,961 | 847,257,671 |
Fidelity Series Floating Rate High Income Fund | 146,038,914 | 8,441,727 | 87,249,407 | 4,139,064 | 62,829,011 |
Fidelity Series Growth & Income Fund | 666,200,956 | 54,762,499 | 104,694,273 | 11,348,134 | 646,379,942 |
Fidelity Series Growth Company Fund | 715,780,446 | 6,017,046 | 75,067,285 | 1,418,578 | 756,193,199 |
Fidelity Series High Income Fund | 800,653,966 | 66,363,567 | 388,212,706 | 34,016,582 | 432,748,175 |
Fidelity Series Inflation-Protected Bond Index Fund | 126,348,976 | 4,604,591 | 22,791,282 | 166,481 | 107,377,552 |
Fidelity Series International Growth Fund | 873,348,978 | 55,912,962 | 183,980,669 | 10,186,751 | 758,908,123 |
Fidelity Series International Small Cap Fund | 202,752,005 | 7,507,905 | 31,586,060 | 1,556,469 | 174,647,827 |
Fidelity Series International Value Fund | 882,234,808 | 78,845,969 | 137,393,640 | 31,184,303 | 753,356,123 |
Fidelity Series Intrinsic Opportunities Fund | 428,212,561 | 39,472,464 | 71,838,946 | 6,085,812 | 432,252,591 |
Fidelity Series Investment Grade Bond Fund | 2,873,877,960 | 854,611,295 | 317,790,021 | 79,152,451 | 3,495,690,699 |
Fidelity Series Opportunistic Insights Fund | 435,329,662 | 34,302,714 | 90,367,167 | - | 422,463,954 |
Fidelity Series Real Estate Equity Fund | 80,768,805 | 22,314,345 | 39,113,891 | 1,519,563 | 76,872,858 |
Fidelity Series Real Estate Income Fund | 63,788,575 | 6,227,654 | 8,469,352 | 3,280,587 | 61,797,725 |
Fidelity Series Short-Term Credit Fund | - | 191,136,571 | 172,039 | - | 191,155,658 |
Fidelity Series Small Cap Discovery Fund | 96,453,819 | 16,306,097 | 15,109,199 | 188,169 | 107,047,176 |
Fidelity Series Small Cap Opportunities Fund | 347,048,808 | 53,743,676 | 55,745,161 | 1,103,432 | 348,834,138 |
Fidelity Series Stock Selector Large Cap Value Fund | 585,492,849 | 63,705,041 | 107,430,350 | 7,700,178 | 564,673,391 |
Fidelity Short-Term Bond Fund | 382,229,079 | 11,877,527 | 394,658,809 | 2,693,331 | - |
Total | $ 13,343,993,790 | $ 2,175,832,170 | $ 2,973,826,299 | $ 238,478,611 | $ 12,868,774,307 |
Other Information |
All investments are categorized as Level 1 under the Fair Value Hierarchy. The inputs or methodology used for valuing securities may not be an indication of the risk associated with investing in those securities. For more information on valuation inputs, please refer to the Investment Valuation section in the accompanying Notes to Financial Statements. |
See accompanying notes which are an integral part of the financial statements.
Annual Report
Fidelity Freedom 2020 Fund
Statement of Assets and Liabilities
| March 31, 2015 |
| | |
Assets | | |
Investment in securities, at value (cost $11,464,054,683) - See accompanying schedule | | $ 12,868,774,307 |
Receivable for investments sold | | 29,085,602 |
Receivable for fund shares sold | | 10,569,548 |
Other receivables | | 110,130 |
Dividends receivable | | 142,532 |
Total assets | | 12,908,682,119 |
| | |
Liabilities | | |
Payable for investments purchased | $ 16,886,112 | |
Payable for fund shares redeemed | 22,788,223 | |
Other payables and accrued expenses | 110,126 | |
Total liabilities | | 39,784,461 |
| | |
Net Assets | | $ 12,868,897,658 |
Net Assets consist of: | | |
Paid in capital | | $ 11,214,528,759 |
Undistributed net investment income | | 31,063,751 |
Accumulated undistributed net realized gain (loss) on investments | | 218,585,524 |
Net unrealized appreciation (depreciation) on investments | | 1,404,719,624 |
Net Assets, for 816,341,132 shares outstanding | | $ 12,868,897,658 |
Net Asset Value, offering price and redemption price per share ($12,868,897,658 ÷ 816,341,132 shares) | | $ 15.76 |
Statement of Operations
| Year ended March 31, 2015 |
| | |
Investment Income | | |
Income distributions from underlying funds | | $ 238,478,611 |
| | |
Expenses | | |
Independent trustees' compensation | $ 56,625 | |
Total expenses before reductions | 56,625 | |
Expense reductions | (56,625) | - |
Net investment income (loss) | | 238,478,611 |
Realized and Unrealized Gain (Loss) Realized gain (loss) on sale of underlying fund shares | 69,325,928 | |
Capital gain distributions from underlying funds | 293,387,187 | |
Total net realized gain (loss) | | 362,713,115 |
Change in net unrealized appreciation (depreciation) on underlying funds | | 253,450,186 |
Net gain (loss) | | 616,163,301 |
Net increase (decrease) in net assets resulting from operations | | $ 854,641,912 |
See accompanying notes which are an integral part of the financial statements.
Annual Report
Fidelity Freedom 2020 Fund
Financial Statements - continued
Statement of Changes in Net Assets
| Year ended
March 31,
2015 | Year ended
March 31,
2014 |
Increase (Decrease) in Net Assets | | |
Operations | | |
Net investment income (loss) | $ 238,478,611 | $ 200,826,961 |
Net realized gain (loss) | 362,713,115 | 769,435,526 |
Change in net unrealized appreciation (depreciation) | 253,450,186 | 291,167,426 |
Net increase (decrease) in net assets resulting from operations | 854,641,912 | 1,261,429,913 |
Distributions to shareholders from net investment income | (241,771,826) | (195,765,130) |
Distributions to shareholders from net realized gain | (638,629,792) | (306,443,495) |
Total distributions | (880,401,618) | (502,208,625) |
Share transactions
Proceeds from sales of shares | 2,545,585,063 | 2,983,245,610 |
Reinvestment of distributions | 876,256,708 | 500,298,195 |
Cost of shares redeemed | (3,871,167,620) | (4,478,732,337) |
Net increase (decrease) in net assets resulting from share transactions | (449,325,849) | (995,188,532) |
Total increase (decrease) in net assets | (475,085,555) | (235,967,244) |
| | |
Net Assets | | |
Beginning of period | 13,343,983,213 | 13,579,950,457 |
End of period (including undistributed net investment income of $31,063,751 and undistributed net investment income of $34,356,966, respectively) | $ 12,868,897,658 | $ 13,343,983,213 |
Other Information Shares | | |
Sold | 163,297,632 | 194,232,688 |
Issued in reinvestment of distributions | 57,245,532 | 32,283,255 |
Redeemed | (248,377,994) | (291,421,357) |
Net increase (decrease) | (27,834,830) | (64,905,414) |
Financial Highlights
Years ended March 31, | 2015 | 2014 | 2013 | 2012 | 2011 |
Selected Per-Share Data | | | | | |
Net asset value, beginning of period | $ 15.81 | $ 14.94 | $ 14.16 | $ 14.33 | $ 12.98 |
Income from Investment Operations | | | | | |
Net investment income (loss) B | .28 | .23 | .24 | .24 | .22 |
Net realized and unrealized gain (loss) | .73 | 1.22 | .89 | .08 | 1.50 |
Total from investment operations | 1.01 | 1.45 | 1.13 | .32 | 1.72 |
Distributions from net investment income | (.29) | (.23) | (.25) | (.26) | (.24) |
Distributions from net realized gain | (.77) | (.36) | (.10) | (.22) | (.14) |
Total distributions | (1.06) | (.58) H | (.35) | (.49) G | (.37) F |
Net asset value, end of period | $ 15.76 | $ 15.81 | $ 14.94 | $ 14.16 | $ 14.33 |
Total ReturnA | 6.71% | 9.83% | 8.12% | 2.45% | 13.47% |
Ratios to Average Net Assets C,E | | | | | |
Expenses before reductions D | .00% | .00% | .00% | .00% | .00% |
Expenses net of fee waivers, if any | .00% | .00% | .00% | .00% | .00% |
Expenses net of all reductions | .00% | .00% | .00% | .00% | .00% |
Net investment income (loss) | 1.83% | 1.49% | 1.65% | 1.74% | 1.69% |
Supplemental Data | | | | | |
Net assets, end of period (000 omitted) | $ 12,868,898 | $ 13,343,983 | $ 13,579,950 | $ 15,423,976 | $ 19,923,391 |
Portfolio turnover rate C | 17% | 39% | 25% | 24% | 42% |
A Total returns would have been lower if certain expenses had not been reduced during the applicable periods shown.
B Calculated based on average shares outstanding during the period.
C Amounts do not include the activity of the Underlying Funds.
D Amount represents less than .01%.
E Expense ratios reflect operating expenses of the Fund. Expenses before reductions do not reflect amounts reimbursed by the investment adviser or reductions from expense offset arrangements and do not represent the amount paid by the Fund during periods when reimbursements or reductions occur. Expenses net of fee waivers reflect expenses after reimbursement by the investment adviser but prior to reductions from expense offset arrangements. Expenses net of all reductions represent the net expenses paid by the Fund but do not include expenses of the underlying funds in which the Fund invests.
F Total distributions of $.37 per share is comprised of distributions from net investment income of $.236 and distributions from net realized gain of $.135 per share.
G Total distributions of $.49 per share is comprised of distributions from net investment income of $.264 and distributions from net realized gain of $.222 per share.
H Total distributions of $.58 per share is comprised of distributions from net investment income of $.228 and distributions from net realized gain of $.356 per share.
See accompanying notes which are an integral part of the financial statements.
Annual Report
Fidelity Freedom 2025 Fund
Investment Changes (Unaudited)
The information in the following tables is based on the direct investments of the Fund. |
Fund Holdings as of March 31, 2015 |
| % of fund's net assets | % of fund's net assets 6 months ago |
Domestic Equity Funds | | |
Fidelity Series 100 Index Fund | 1.8 | 1.8 |
Fidelity Series 1000 Value Index Fund | 1.0 | 1.0 |
Fidelity Series All-Sector Equity Fund | 5.7 | 6.1 |
Fidelity Series Blue Chip Growth Fund | 4.6 | 5.2 |
Fidelity Series Commodity Strategy Fund | 0.8 | 1.0 |
Fidelity Series Equity-Income Fund | 7.5 | 7.8 |
Fidelity Series Growth & Income Fund | 5.7 | 6.0 |
Fidelity Series Growth Company Fund | 6.6 | 6.2 |
Fidelity Series Intrinsic Opportunities Fund | 3.8 | 3.8 |
Fidelity Series Opportunistic Insights Fund | 3.7 | 3.9 |
Fidelity Series Real Estate Equity Fund | 0.7 | 0.7 |
Fidelity Series Small Cap Discovery Fund | 1.0 | 0.9 |
Fidelity Series Small Cap Opportunities Fund | 3.1 | 3.0 |
Fidelity Series Stock Selector Large Cap Value Fund | 5.0 | 5.2 |
| 51.0 | 52.6 |
International Equity Funds | | |
Fidelity Series Emerging Markets Fund | 6.4 | 5.5 |
Fidelity Series International Growth Fund | 6.9 | 6.9 |
Fidelity Series International Small Cap Fund | 1.6 | 1.6 |
Fidelity Series International Value Fund | 6.7 | 7.2 |
| 21.6 | 21.2 |
Bond Funds | | |
Fidelity Series Emerging Markets Debt Fund | 0.6 | 0.7 |
Fidelity Series Floating Rate High Income Fund | 0.5 | 0.5 |
Fidelity Series High Income Fund | 3.4 | 4.7 |
Fidelity Series Inflation-Protected Bond Index Fund | 0.0* | 0.5 |
Fidelity Series Investment Grade Bond Fund | 19.6 | 18.6 |
Fidelity Series Real Estate Income Fund | 0.5 | 0.5 |
| 24.6 | 25.5 |
Short-Term Funds | | |
Fidelity Institutional Money Market Portfolio Institutional Class | 1.7 | 0.4 |
Fidelity Series Short-Term Credit Fund | 1.1 | 0.0 |
Fidelity Short-Term Bond Fund | 0.0 | 0.3 |
| 2.8 | 0.7 |
Net Other Assets (Liabilities)* | 0.0 | 0.0 |
| 100.0 | 100.0 |
* Amount represents less than 0.1% |
Asset Allocation (% of fund's net assets) |
Period end |
 | Domestic Equity Funds** | 51.0% | |
 | International Equity Funds | 21.6% | |
 | Bond Funds | 24.6% | |
 | Short-Term Funds | 2.8% | |

Six months ago |
 | Domestic Equity Funds** | 52.6% | |
 | International Equity Funds | 21.2% | |
 | Bond Funds | 25.5% | |
 | Short-Term Funds | 0.7% | |

** Includes Fidelity Series Commodity Strategy Fund which invests in commodity-related investments. |
Annual Report
Fidelity Freedom 2025 Fund
Investments March 31, 2015
Showing Percentage of Net Assets
Domestic Equity Funds - 51.0% |
| Shares | | Value |
Fidelity Series 100 Index Fund (c) | 11,993,940 | | $ 159,399,458 |
Fidelity Series 1000 Value Index Fund (c) | 8,109,907 | | 90,830,961 |
Fidelity Series All-Sector Equity Fund (c) | 36,754,480 | | 520,443,442 |
Fidelity Series Blue Chip Growth Fund (c) | 32,254,772 | | 411,893,436 |
Fidelity Series Commodity Strategy Fund (a)(c) | 11,141,179 | | 68,184,018 |
Fidelity Series Equity-Income Fund (c) | 53,467,515 | | 674,760,034 |
Fidelity Series Growth & Income Fund (c) | 38,304,433 | | 519,408,110 |
Fidelity Series Growth Company Fund (c) | 47,805,000 | | 601,386,899 |
Fidelity Series Intrinsic Opportunities Fund (c) | 22,867,772 | | 345,532,038 |
Fidelity Series Opportunistic Insights Fund (c) | 21,948,096 | | 338,659,119 |
Fidelity Series Real Estate Equity Fund (c) | 4,114,001 | | 61,751,153 |
Fidelity Series Small Cap Discovery Fund (c) | 8,087,930 | | 91,312,733 |
Fidelity Series Small Cap Opportunities Fund (c) | 20,224,759 | | 276,876,952 |
Fidelity Series Stock Selector Large Cap Value Fund (c) | 35,093,251 | | 455,861,329 |
TOTAL DOMESTIC EQUITY FUNDS (Cost $3,768,429,912) |
4,616,299,682
|
International Equity Funds - 21.6% |
| | | |
Fidelity Series Emerging Markets Fund (c) | 33,951,934 | | 577,182,870 |
Fidelity Series International Growth Fund (c) | 43,199,882 | | 621,646,306 |
Fidelity Series International Small Cap Fund (c) | 8,946,664 | | 141,983,562 |
Fidelity Series International Value Fund (c) | 60,330,328 | | 611,146,218 |
TOTAL INTERNATIONAL EQUITY FUNDS (Cost $1,721,938,336) |
1,951,958,956
|
Bond Funds - 24.6% |
| Shares | | Value |
Fidelity Series Emerging Markets Debt Fund (c) | 5,820,607 | | $ 56,518,096 |
Fidelity Series Floating Rate High Income Fund (c) | 4,473,914 | | 43,889,096 |
Fidelity Series High Income Fund (c) | 31,492,772 | | 308,629,168 |
Fidelity Series Inflation-Protected Bond Index Fund (c) | 14,237 | | 138,815 |
Fidelity Series Investment Grade Bond Fund (c) | 153,740,188 | | 1,778,773,980 |
Fidelity Series Real Estate Income Fund (c) | 3,818,414 | | 43,186,262 |
TOTAL BOND FUNDS (Cost $2,194,823,452) |
2,231,135,417
|
Short-Term Funds - 2.8% |
| | | |
Fidelity Institutional Money Market Portfolio Institutional Class 0.14% (b)(c) | 158,393,897 | | 158,393,897 |
Fidelity Series Short-Term Credit Fund (c) | 9,674,562 | | 96,842,363 |
TOTAL SHORT-TERM FUNDS (Cost $255,139,514) |
255,236,260
|
TOTAL INVESTMENT PORTFOLIO - 100.0% (Cost $7,940,331,214) | 9,054,630,315 |
NET OTHER ASSETS (LIABILITIES) - 0.0% | | 50,303 |
NET ASSETS - 100% | $ 9,054,680,618 |
Legend |
(a) Non-income producing |
(b) The rate quoted is the annualized seven-day yield of the fund at period end. |
(c) Affiliated Fund |
Affiliated Underlying Funds |
Information regarding the Fund's fiscal year to date purchases and sales of the affiliated Underlying Funds and income earned by the Fund from investments in affiliated Underlying Funds is as follows: |
Affiliate | Value,
beginning of period | Purchases | Sales
Proceeds | Dividend
Income | Value,
end of
period |
Fidelity Institutional Money Market Portfolio Institutional Class | $ 22,696,772 | $ 142,597,446 | $ 6,900,321 | $ 68,250 | $ 158,393,897 |
Fidelity Series 100 Index Fund | 135,981,212 | 32,325,415 | 21,450,112 | 3,237,162 | 159,399,458 |
Fidelity Series 1000 Value Index Fund | 90,366,773 | 9,671,748 | 13,524,445 | 1,925,396 | 90,830,961 |
Fidelity Series All-Sector Equity Fund | 539,615,520 | 87,952,813 | 111,538,717 | 4,722,328 | 520,443,442 |
Fidelity Series Blue Chip Growth Fund | 450,138,170 | 41,233,570 | 155,381,600 | 900,768 | 411,893,436 |
Fidelity Series Commodity Strategy Fund | 111,369,829 | 4,814,707 | 21,377,703 | - | 68,184,018 |
Fidelity Series Emerging Markets Debt Fund | 60,799,948 | 5,875,283 | 7,400,865 | 3,322,998 | 56,518,096 |
Fidelity Series Emerging Markets Fund | 411,909,585 | 214,267,851 | 38,259,022 | 4,129,408 | 577,182,870 |
Fidelity Series Equity-Income Fund | 666,794,181 | 97,647,226 | 96,623,056 | 14,679,816 | 674,760,034 |
Fidelity Series Floating Rate High Income Fund | 80,433,032 | 6,624,783 | 40,212,755 | 2,541,053 | 43,889,096 |
Fidelity Series Growth & Income Fund | 514,444,684 | 59,716,795 | 78,179,670 | 8,851,165 | 519,408,110 |
Fidelity Series Growth Company Fund | 554,554,808 | 5,019,653 | 43,355,512 | 1,107,197 | 601,386,899 |
Fidelity Series High Income Fund | 558,444,640 | 55,166,968 | 272,224,703 | 23,925,237 | 308,629,168 |
Fidelity Series Inflation-Protected Bond Index Fund | 46,324,698 | 3,610,812 | 50,300,075 | 41,974 | 138,815 |
Fidelity Series International Growth Fund | 677,952,768 | 52,209,451 | 119,141,941 | 7,997,921 | 621,646,306 |
Fidelity Series International Small Cap Fund | 163,071,946 | 9,777,765 | 27,851,916 | 1,246,052 | 141,983,562 |
Fidelity Series International Value Fund | 682,890,475 | 77,825,715 | 93,115,179 | 24,556,578 | 611,146,218 |
Fidelity Series Intrinsic Opportunities Fund | 331,697,110 | 37,437,578 | 52,028,172 | 4,788,045 | 345,532,038 |
Fidelity Series Investment Grade Bond Fund | 1,516,542,260 | 373,059,342 | 154,888,697 | 41,419,276 | 1,778,773,980 |
Fidelity Series Opportunistic Insights Fund | 338,726,862 | 36,504,545 | 70,429,853 | - | 338,659,119 |
Fidelity Series Real Estate Equity Fund | 60,585,246 | 20,665,370 | 29,536,122 | 1,190,718 | 61,751,153 |
Fidelity Series Real Estate Income Fund | 42,376,447 | 5,541,398 | 4,894,685 | 2,231,685 | 43,186,262 |
Fidelity Series Short-Term Credit Fund | - | 96,762,877 | 17,272 | - | 96,842,363 |
Fidelity Series Small Cap Discovery Fund | 80,274,543 | 13,794,474 | 10,614,181 | 158,097 | 91,312,733 |
Fidelity Series Small Cap Opportunities Fund | 273,900,130 | 49,023,356 | 49,179,249 | 886,105 | 276,876,952 |
Fidelity Series Stock Selector Large Cap Value Fund | 434,700,255 | 79,036,593 | 74,896,519 | 6,059,778 | 455,861,329 |
Fidelity Short-Term Bond Fund | 18,560,826 | 86,811,529 | 105,530,517 | 491,175 | - |
Total | $ 8,865,152,720 | $ 1,704,975,063 | $ 1,748,852,859 | $ 160,478,182 | $ 9,054,630,315 |
Other Information |
All investments are categorized as Level 1 under the Fair Value Hierarchy. The inputs or methodology used for valuing securities may not be an indication of the risk associated with investing in those securities. For more information on valuation inputs, please refer to the Investment Valuation section in the accompanying Notes to Financial Statements. |
See accompanying notes which are an integral part of the financial statements.
Annual Report
Fidelity Freedom 2025 Fund
Statement of Assets and Liabilities
| March 31, 2015 |
| | |
Assets | | |
Investment in securities, at value (cost $7,940,331,214) - See accompanying schedule | | $ 9,054,630,315 |
Cash | | 2 |
Receivable for investments sold | | 34,353,228 |
Receivable for fund shares sold | | 9,962,349 |
Dividends receivable | | 71,988 |
Total assets | | 9,099,017,882 |
| | |
Liabilities | | |
Payable for investments purchased | $ 31,854,788 | |
Payable for fund shares redeemed | 12,482,476 | |
Total liabilities | | 44,337,264 |
| | |
Net Assets | | $ 9,054,680,618 |
Net Assets consist of: | | |
Paid in capital | | $ 7,757,650,435 |
Undistributed net investment income | | 17,931,312 |
Accumulated undistributed net realized gain (loss) on investments | | 164,799,770 |
Net unrealized appreciation (depreciation) on investments | | 1,114,299,101 |
Net Assets, for 670,448,623 shares outstanding | | $ 9,054,680,618 |
Net Asset Value, offering price and redemption price per share ($9,054,680,618 ÷ 670,448,623 shares) | | $ 13.51 |
Statement of Operations
| Year ended March 31, 2015 |
| | |
Investment Income | | |
Income distributions from underlying funds | | $ 160,478,182 |
| | |
Expenses | | |
Independent trustees' compensation | $ 38,342 | |
Total expenses before reductions | 38,342 | |
Expense reductions | (38,342) | - |
Net investment income (loss) | | 160,478,182 |
Realized and Unrealized Gain (Loss) Realized gain (loss) on sale of underlying fund shares | 41,469,299 | |
Capital gain distributions from underlying funds | 227,132,407 | |
Total net realized gain (loss) | | 268,601,706 |
Change in net unrealized appreciation (depreciation) on underlying funds | | 191,886,086 |
Net gain (loss) | | 460,487,792 |
Net increase (decrease) in net assets resulting from operations | | $ 620,965,974 |
See accompanying notes which are an integral part of the financial statements.
Annual Report
Fidelity Freedom 2025 Fund
Financial Statements - continued
Statement of Changes in Net Assets
| Year ended
March 31,
2015 | Year ended
March 31,
2014 |
Increase (Decrease) in Net Assets | | |
Operations | | |
Net investment income (loss) | $ 160,478,182 | $ 131,256,193 |
Net realized gain (loss) | 268,601,706 | 508,228,772 |
Change in net unrealized appreciation (depreciation) | 191,886,086 | 339,592,482 |
Net increase (decrease) in net assets resulting from operations | 620,965,974 | 979,077,447 |
Distributions to shareholders from net investment income | (162,079,001) | (128,129,218) |
Distributions to shareholders from net realized gain | (433,254,114) | (255,623,742) |
Total distributions | (595,333,115) | (383,752,960) |
Share transactions
Proceeds from sales of shares | 2,060,840,400 | 2,313,017,183 |
Reinvestment of distributions | 593,531,513 | 382,765,357 |
Cost of shares redeemed | (2,490,476,823) | (2,655,839,084) |
Net increase (decrease) in net assets resulting from share transactions | 163,895,090 | 39,943,456 |
Total increase (decrease) in net assets | 189,527,949 | 635,267,943 |
| | |
Net Assets | | |
Beginning of period | 8,865,152,669 | 8,229,884,726 |
End of period (including undistributed net investment income of $17,931,312 and undistributed net investment income of $19,532,131, respectively) | $ 9,054,680,618 | $ 8,865,152,669 |
Other Information Shares | | |
Sold | 154,616,669 | 177,835,325 |
Issued in reinvestment of distributions | 45,379,169 | 29,206,295 |
Redeemed | (186,949,013) | (203,894,544) |
Net increase (decrease) | 13,046,825 | 3,147,076 |
Financial Highlights
Years ended March 31, | 2015 | 2014 | 2013 | 2012 | 2011 |
Selected Per-Share Data | | | | | |
Net asset value, beginning of period | $ 13.49 | $ 12.58 | $ 11.81 | $ 12.02 | $ 10.77 |
Income from Investment Operations | | | | | |
Net investment income (loss) B | .24 | .20 | .21 | .20 | .18 |
Net realized and unrealized gain (loss) | .69 | 1.30 | .84 | - | 1.37 |
Total from investment operations | .93 | 1.50 | 1.05 | .20 | 1.55 |
Distributions from net investment income | (.25) | (.20) | (.22) | (.22) | (.19) |
Distributions from net realized gain | (.66) | (.39) | (.06) | (.19) | (.11) |
Total distributions | (.91) | (.59) | (.28) | (.41) | (.30) |
Net asset value, end of period | $ 13.51 | $ 13.49 | $ 12.58 | $ 11.81 | $ 12.02 |
Total ReturnA | 7.23% | 12.08% | 9.03% | 1.93% | 14.57% |
Ratios to Average Net Assets C,E | | | | | |
Expenses before reductions D | .00% | .00% | .00% | .00% | .00% |
Expenses net of fee waivers, if any | .00% | .00% | .00% | .00% | .00% |
Expenses net of all reductions | .00% | .00% | .00% | .00% | .00% |
Net investment income (loss) | 1.81% | 1.53% | 1.73% | 1.75% | 1.67% |
Supplemental Data | | | | | |
Net assets, end of period (000 omitted) | $ 9,054,681 | $ 8,865,153 | $ 8,229,885 | $ 8,598,936 | $ 10,159,991 |
Portfolio turnover rate C | 19% | 46% | 31% | 28% | 49% |
A Total returns would have been lower if certain expenses had not been reduced during the applicable periods shown.
B Calculated based on average shares outstanding during the period.
C Amounts do not include the activity of the Underlying Funds.
D Amount represents less than .01%.
E Expense ratios reflect operating expenses of the Fund. Expenses before reductions do not reflect amounts reimbursed by the investment adviser or reductions from expense offset arrangements and do not represent the amount paid by the Fund during periods when reimbursements or reductions occur. Expenses net of fee waivers reflect expenses after reimbursement by the investment adviser but prior to reductions from expense offset arrangements. Expenses net of all reductions represent the net expenses paid by the Fund but do not include expenses of the underlying funds in which the Fund invests.
See accompanying notes which are an integral part of the financial statements.
Annual Report
Fidelity Freedom 2030 Fund
Investment Changes (Unaudited)
The information in the following tables is based on the direct investments of the Fund. |
Fund Holdings as of March 31, 2015 |
| % of fund's net assets | % of fund's net assets 6 months ago |
Domestic Equity Funds | | |
Fidelity Series 100 Index Fund | 2.1 | 2.2 |
Fidelity Series 1000 Value Index Fund | 1.2 | 1.2 |
Fidelity Series All-Sector Equity Fund | 6.9 | 7.1 |
Fidelity Series Blue Chip Growth Fund | 5.4 | 6.1 |
Fidelity Series Commodity Strategy Fund | 0.7 | 1.0 |
Fidelity Series Equity-Income Fund | 8.9 | 9.2 |
Fidelity Series Growth & Income Fund | 6.8 | 7.1 |
Fidelity Series Growth Company Fund | 7.9 | 7.4 |
Fidelity Series Intrinsic Opportunities Fund | 4.6 | 4.6 |
Fidelity Series Opportunistic Insights Fund | 4.5 | 4.6 |
Fidelity Series Real Estate Equity Fund | 0.8 | 0.8 |
Fidelity Series Small Cap Discovery Fund | 1.2 | 1.1 |
Fidelity Series Small Cap Opportunities Fund | 3.7 | 3.5 |
Fidelity Series Stock Selector Large Cap Value Fund | 5.9 | 6.1 |
| 60.6 | 62.0 |
International Equity Funds | | |
Fidelity Series Emerging Markets Fund | 7.3 | 6.4 |
Fidelity Series International Growth Fund | 8.3 | 8.3 |
Fidelity Series International Small Cap Fund | 1.9 | 1.9 |
Fidelity Series International Value Fund | 8.1 | 8.6 |
| 25.6 | 25.2 |
Bond Funds | | |
Fidelity Series Emerging Markets Debt Fund | 0.6 | 0.7 |
Fidelity Series Floating Rate High Income Fund | 0.5 | 0.5 |
Fidelity Series High Income Fund | 3.5 | 4.7 |
Fidelity Series Inflation-Protected Bond Index Fund | 0.0* | 0.1 |
Fidelity Series Investment Grade Bond Fund | 7.5 | 6.3 |
Fidelity Series Real Estate Income Fund | 0.5 | 0.5 |
| 12.6 | 12.8 |
Short-Term Funds | | |
Fidelity Institutional Money Market Portfolio Institutional Class | 0.6 | 0.0* |
Fidelity Series Short-Term Credit Fund | 0.6 | 0.0 |
Fidelity Short-Term Bond Fund | 0.0 | 0.0* |
| 1.2 | 0.0* |
Net Other Assets (Liabilities)* | 0.0 | 0.0 |
| 100.0 | 100.0 |
* Amount represents less than 0.1% |
Asset Allocation (% of fund's net assets) |
Period end |
 | Domestic Equity Funds** | 60.6% | |
 | International Equity Funds | 25.6% | |
 | Bond Funds | 12.6% | |
 | Short-Term Funds | 1.2% | |

Six months ago |
 | Domestic Equity Funds** | 62.0% | |
 | International Equity Funds | 25.2% | |
 | Bond Funds | 12.8% | |
 | Short-Term Funds | 0.0%* | |

** Includes Fidelity Series Commodity Strategy Fund which invests in commodity-related investments. |
Annual Report
Fidelity Freedom 2030 Fund
Investments March 31, 2015
Showing Percentage of Net Assets
Domestic Equity Funds - 60.6% |
| Shares | | Value |
Fidelity Series 100 Index Fund (c) | 17,086,470 | | $ 227,079,186 |
Fidelity Series 1000 Value Index Fund (c) | 11,557,281 | | 129,441,543 |
Fidelity Series All-Sector Equity Fund (c) | 52,718,261 | | 746,490,580 |
Fidelity Series Blue Chip Growth Fund (c) | 46,278,443 | | 590,975,714 |
Fidelity Series Commodity Strategy Fund (a)(c) | 13,392,873 | | 81,964,383 |
Fidelity Series Equity-Income Fund (c) | 76,607,203 | | 966,782,909 |
Fidelity Series Growth & Income Fund (c) | 54,688,491 | | 741,575,937 |
Fidelity Series Growth Company Fund (c) | 68,575,326 | | 862,677,598 |
Fidelity Series Intrinsic Opportunities Fund (c) | 32,832,737 | | 496,102,649 |
Fidelity Series Opportunistic Insights Fund (c) | 31,482,313 | | 485,772,091 |
Fidelity Series Real Estate Equity Fund (c) | 5,800,486 | | 87,065,299 |
Fidelity Series Small Cap Discovery Fund (c) | 11,557,340 | | 130,482,368 |
Fidelity Series Small Cap Opportunities Fund (c) | 29,244,619 | | 400,358,830 |
Fidelity Series Stock Selector Large Cap Value Fund (c) | 49,818,490 | | 647,142,187 |
TOTAL DOMESTIC EQUITY FUNDS (Cost $5,424,143,208) |
6,593,911,274
|
International Equity Funds - 25.6% |
| | | |
Fidelity Series Emerging Markets Fund (c) | 46,794,103 | | 795,499,759 |
Fidelity Series International Growth Fund (c) | 62,616,868 | | 901,056,737 |
Fidelity Series International Small Cap Fund (c) | 13,044,380 | | 207,014,304 |
Fidelity Series International Value Fund (c) | 87,586,536 | | 887,251,612 |
TOTAL INTERNATIONAL EQUITY FUNDS (Cost $2,522,666,532) |
2,790,822,412
|
Bond Funds - 12.6% |
| Shares | | Value |
Fidelity Series Emerging Markets Debt Fund (c) | 7,081,024 | | $ 68,756,744 |
Fidelity Series Floating Rate High Income Fund (c) | 5,361,891 | | 52,600,154 |
Fidelity Series High Income Fund (c) | 38,805,254 | | 380,291,487 |
Fidelity Series Inflation-Protected Bond Index Fund (c) | 141,941 | | 1,383,920 |
Fidelity Series Investment Grade Bond Fund (c) | 70,528,694 | | 816,016,994 |
Fidelity Series Real Estate Income Fund (c) | 4,603,961 | | 52,070,803 |
TOTAL BOND FUNDS (Cost $1,363,408,574) |
1,371,120,102
|
Short-Term Funds - 1.2% |
| | | |
Fidelity Institutional Money Market Portfolio Institutional Class 0.14% (b)(c) | 69,189,113 | | 69,189,113 |
Fidelity Series Short-Term Credit Fund (c) | 5,851,524 | | 58,573,753 |
TOTAL SHORT-TERM FUNDS (Cost $127,704,351) |
127,762,866
|
TOTAL INVESTMENT
PORTFOLIO - 100.0% (Cost $9,437,922,665) | 10,883,616,654 |
NET OTHER ASSETS (LIABILITIES) - 0.0% | | 40,958 |
NET ASSETS - 100% | $ 10,883,657,612 |
Legend |
(a) Non-income producing |
(b) The rate quoted is the annualized seven-day yield of the fund at period end. |
(c) Affiliated Fund |
Affiliated Underlying Funds |
Information regarding the Fund's fiscal year to date purchases and sales of the affiliated Underlying Funds and income earned by the Fund from investments in affiliated Underlying Funds is as follows: |
Affiliate | Value,
beginning of
period | Purchases | Sales
Proceeds | Dividend
Income | Value,
end of
period |
Fidelity Institutional Money Market Portfolio Institutional Class | $ - | $ 75,766,667 | $ 6,577,554 | $ 31,381 | $ 69,189,113 |
Fidelity Series 100 Index Fund | 196,854,718 | 46,528,289 | 34,850,106 | 4,601,711 | 227,079,186 |
Fidelity Series 1000 Value Index Fund | 132,719,985 | 10,570,885 | 20,132,562 | 2,745,664 | 129,441,543 |
Fidelity Series All-Sector Equity Fund | 750,530,409 | 132,847,151 | 142,356,459 | 6,757,725 | 746,490,580 |
Fidelity Series Blue Chip Growth Fund | 645,355,733 | 49,180,820 | 212,211,053 | 1,288,964 | 590,975,714 |
Fidelity Series Commodity Strategy Fund | 130,856,874 | 3,757,062 | 20,080,322 | - | 81,964,383 |
Fidelity Series Emerging Markets Debt Fund | 74,886,059 | 6,303,749 | 9,046,476 | 4,084,893 | 68,756,744 |
Fidelity Series Emerging Markets Fund | 600,517,152 | 266,445,214 | 57,932,894 | 5,767,774 | 795,499,759 |
Fidelity Series Equity-Income Fund | 979,306,437 | 129,304,381 | 152,228,388 | 21,259,087 | 966,782,909 |
Fidelity Series Floating Rate High Income Fund | 92,954,002 | 7,029,630 | 43,826,752 | 2,996,913 | 52,600,154 |
Fidelity Series Growth & Income Fund | 751,040,925 | 77,028,430 | 120,110,705 | 12,802,696 | 741,575,937 |
Fidelity Series Growth Company Fund | 812,968,012 | 7,136,267 | 79,225,312 | 1,585,361 | 862,677,598 |
Fidelity Series High Income Fund | 718,813,081 | 57,953,286 | 355,808,112 | 29,564,615 | 380,291,487 |
Fidelity Series Inflation-Protected Bond Index Fund | 11,883,054 | 4,120,343 | 14,591,444 | 12,163 | 1,383,920 |
Fidelity Series International Growth Fund | 994,811,339 | 55,212,458 | 164,288,150 | 11,647,650 | 901,056,737 |
Fidelity Series International Small Cap Fund | 223,138,476 | 12,433,327 | 24,224,981 | 1,822,477 | 207,014,304 |
Fidelity Series International Value Fund | 991,907,231 | 111,577,870 | 134,919,649 | 35,653,410 | 887,251,612 |
Fidelity Series Intrinsic Opportunities Fund | 487,259,008 | 46,126,056 | 77,736,114 | 6,917,497 | 496,102,649 |
Fidelity Series Investment Grade Bond Fund | 556,116,244 | 317,849,208 | 76,286,051 | 16,972,286 | 816,016,994 |
Fidelity Series Opportunistic Insights Fund | 490,214,253 | 40,869,402 | 93,966,531 | - | 485,772,091 |
Fidelity Series Real Estate Equity Fund | 77,738,879 | 36,128,434 | 40,782,512 | 1,692,910 | 87,065,299 |
Fidelity Series Real Estate Income Fund | 52,085,449 | 5,780,284 | 5,989,160 | 2,723,682 | 52,070,803 |
Fidelity Series Short-Term Credit Fund | - | 58,545,490 | 30,279 | - | 58,573,753 |
Fidelity Series Small Cap Discovery Fund | 111,913,861 | 23,951,638 | 16,799,080 | 225,285 | 130,482,368 |
Fidelity Series Small Cap Opportunities Fund | 397,238,995 | 63,124,991 | 64,298,923 | 1,271,316 | 400,358,830 |
Fidelity Series Stock Selector Large Cap Value Fund | 652,438,477 | 85,269,719 | 115,744,315 | 8,660,301 | 647,142,187 |
Fidelity Short-Term Bond Fund | - | 86,053,616 | 86,114,794 | 258,969 | - |
Total | $ 10,933,548,653 | $ 1,816,894,667 | $ 2,170,158,678 | $ 181,344,730 | $ 10,883,616,654 |
Other Information |
All investments are categorized as Level 1 under the Fair Value Hierarchy. The inputs or methodology used for valuing securities may not be an indication of the risk associated with investing in those securities. For more information on valuation inputs, please refer to the Investment Valuation section in the accompanying Notes to Financial Statements. |
See accompanying notes which are an integral part of the financial statements.
Annual Report
Fidelity Freedom 2030 Fund
Statement of Assets and Liabilities
| March 31, 2015 |
| | |
Assets | | |
Investment in securities, at value (cost $9,437,922,665) - See accompanying schedule | | $ 10,883,616,654 |
Receivable for investments sold | | 20,181,748 |
Receivable for fund shares sold | | 10,685,049 |
Dividends receivable | | 43,579 |
Other receivables | | 79,397 |
Total assets | | 10,914,606,427 |
| | |
Liabilities | | |
Payable for investments purchased | $ 14,391,453 | |
Payable for fund shares redeemed | 16,477,964 | |
Other payables and accrued expenses | 79,398 | |
Total liabilities | | 30,948,815 |
| | |
Net Assets | | $ 10,883,657,612 |
Net Assets consist of: | | |
Paid in capital | | $ 9,190,169,889 |
Undistributed net investment income | | 13,978,790 |
Accumulated undistributed net realized gain (loss) on investments | | 233,814,944 |
Net unrealized appreciation (depreciation) on investments | | 1,445,693,989 |
Net Assets, for 654,924,332 shares outstanding | | $ 10,883,657,612 |
Net Asset Value, offering price and redemption price per share ($10,883,657,612 ÷ 654,924,332 shares) | | $ 16.62 |
Statement of Operations
| Year ended March 31, 2015 |
| | |
Investment Income | | |
Income distributions from underlying funds | | $ 181,344,730 |
| | |
Expenses | | |
Independent trustees' compensation | $ 46,834 | |
Total expenses before reductions | 46,834 | |
Expense reductions | (46,834) | - |
Net investment income (loss) | | 181,344,730 |
Realized and Unrealized Gain (Loss) Realized gain (loss) on sale of underlying fund shares | 61,154,026 | |
Capital gain distributions from underlying funds | 321,465,404 | |
Total net realized gain (loss) | | 382,619,430 |
Change in net unrealized appreciation (depreciation) on underlying funds | | 242,179,119 |
Net gain (loss) | | 624,798,549 |
Net increase (decrease) in net assets resulting from operations | | $ 806,143,279 |
See accompanying notes which are an integral part of the financial statements.
Annual Report
Statement of Changes in Net Assets
| Year ended
March 31,
2015 | Year ended
March 31,
2014 |
Increase (Decrease) in Net Assets | | |
Operations | | |
Net investment income (loss) | $ 181,344,730 | $ 164,058,689 |
Net realized gain (loss) | 382,619,430 | 675,797,127 |
Change in net unrealized appreciation (depreciation) | 242,179,119 | 507,568,680 |
Net increase (decrease) in net assets resulting from operations | 806,143,279 | 1,347,424,496 |
Distributions to shareholders from net investment income | (182,703,661) | (169,795,986) |
Distributions to shareholders from net realized gain | (517,563,966) | (171,704,685) |
Total distributions | (700,267,627) | (341,500,671) |
Share transactions
Proceeds from sales of shares | 2,103,387,892 | 2,439,155,764 |
Reinvestment of distributions | 697,940,205 | 340,644,395 |
Cost of shares redeemed | (2,957,094,876) | (3,488,572,553) |
Net increase (decrease) in net assets resulting from share transactions | (155,766,779) | (708,772,394) |
Total increase (decrease) in net assets | (49,891,127) | 297,151,431 |
| | |
Net Assets | | |
Beginning of period | 10,933,548,739 | 10,636,397,308 |
End of period (including undistributed net investment income of $13,978,790 and undistributed net investment income of $15,337,721, respectively) | $ 10,883,657,612 | $ 10,933,548,739 |
Other Information Shares | | |
Sold | 128,583,860 | 154,825,192 |
Issued in reinvestment of distributions | 43,483,344 | 21,082,429 |
Redeemed | (180,864,639) | (220,419,480) |
Net increase (decrease) | (8,797,435) | (44,511,859) |
Financial Highlights
Years ended March 31, | 2015 | 2014 | 2013 | 2012 | 2011 |
Selected Per-Share Data | | | | | |
Net asset value, beginning of period | $ 16.47 | $ 15.02 | $ 14.07 | $ 14.40 | $ 12.87 |
Income from Investment Operations | | | | | |
Net investment income (loss) B | .27 | .24 | .25 | .24 | .21 |
Net realized and unrealized gain (loss) | .95 | 1.71 | 1.04 | (.07) | 1.67 |
Total from investment operations | 1.22 | 1.95 | 1.29 | .17 | 1.88 |
Distributions from net investment income | (.28) | (.25) | (.27) | (.26) | (.22) |
Distributions from net realized gain | (.79) | (.25) | (.07) | (.24) | (.13) |
Total distributions | (1.07) | (.50) | (.34) | (.50) | (.35) |
Net asset value, end of period | $ 16.62 | $ 16.47 | $ 15.02 | $ 14.07 | $ 14.40 |
Total ReturnA | 7.76% | 13.08% | 9.30% | 1.48% | 14.81% |
Ratios to Average Net AssetsC, E | | | | | |
Expenses before reductionsD | 0.00% | 0.00% | 0.00% | 0.00% | 0.00% |
Expenses net of fee waivers, if any | 0.00% | 0.00% | 0.00% | 0.00% | 0.00% |
Expenses net of all reductions | 0.00% | 0.00% | 0.00% | 0.00% | 0.00% |
Net investment income (loss) | 1.68% | 1.50% | 1.77% | 1.75% | 1.62% |
Supplemental Data | | | | | |
Net assets, end of period (000 omitted) | $ 10,883,658 | $ 10,933,549 | $ 10,636,397 | $ 11,654,912 | $ 14,745,053 |
Portfolio turnover rateC | 17% | 54% | 29% | 26% | 44% |
A Total returns would have been lower if certain expenses had not been reduced during the applicable periods shown.
B Calculated based on average shares outstanding during the period.
C Amounts do not include the activity of the Underlying Funds.
D Amount represents less than .01%.
E Expense ratios reflect operating expenses of the Fund. Expenses before reductions do not reflect amounts reimbursed by the investment adviser or reductions from expense offset arrangements and do not represent the amount paid by the Fund during periods when reimbursements or reductions occur. Expenses net of fee waivers reflect expenses after reimbursement by the investment adviser but prior to reductions from expense offset arrangements. Expenses net of all reductions represent the net expenses paid by the Fund but do not include expenses of the underlying funds in which the Fund invests.
See accompanying notes which are an integral part of the financial statements.
Annual Report
Fidelity Freedom 2035 Fund
Investment Changes (Unaudited)
The information in the following tables is based on the direct investments of the Fund. |
Fund Holdings as of March 31, 2015 |
| % of fund's net assets | % of fund's net assets 6 months ago |
Domestic Equity Funds | | |
Fidelity Series 100 Index Fund | 2.2 | 2.3 |
Fidelity Series 1000 Value Index Fund | 1.3 | 1.3 |
Fidelity Series All-Sector Equity Fund | 7.4 | 7.6 |
Fidelity Series Blue Chip Growth Fund | 5.9 | 6.5 |
Fidelity Series Commodity Strategy Fund | 0.8 | 1.0 |
Fidelity Series Equity-Income Fund | 9.7 | 9.8 |
Fidelity Series Growth & Income Fund | 7.4 | 7.5 |
Fidelity Series Growth Company Fund | 8.5 | 7.9 |
Fidelity Series Intrinsic Opportunities Fund | 4.9 | 4.8 |
Fidelity Series Opportunistic Insights Fund | 4.8 | 4.9 |
Fidelity Series Real Estate Equity Fund | 0.8 | 0.9 |
Fidelity Series Small Cap Discovery Fund | 1.3 | 1.1 |
Fidelity Series Small Cap Opportunities Fund | 4.0 | 3.8 |
Fidelity Series Stock Selector Large Cap Value Fund | 6.4 | 6.5 |
| 65.4 | 65.9 |
International Equity Funds | | |
Fidelity Series Emerging Markets Fund | 7.8 | 6.6 |
Fidelity Series International Growth Fund | 9.0 | 9.1 |
Fidelity Series International Small Cap Fund | 2.0 | 2.0 |
Fidelity Series International Value Fund | 8.8 | 9.1 |
| 27.6 | 26.8 |
Bond Funds | | |
Fidelity Series Emerging Markets Debt Fund | 0.6 | 0.7 |
Fidelity Series Floating Rate High Income Fund | 0.5 | 0.5 |
Fidelity Series High Income Fund | 3.5 | 4.4 |
Fidelity Series Investment Grade Bond Fund | 0.6 | 0.5 |
Fidelity Series Real Estate Income Fund | 0.5 | 0.5 |
| 5.7 | 6.6 |
Short-Term Funds | | |
Fidelity Institutional Money Market Portfolio Institutional Class | 0.7 | 0.5 |
Fidelity Series Short-Term Credit Fund | 0.6 | 0.0 |
Fidelity Short-Term Bond Fund | 0.0 | 0.2 |
| 1.3 | 0.7 |
Net Other Assets (Liabilities)* | 0.0 | 0.0 |
| 100.0 | 100.0 |
* Amount represents less than 0.1% |
Asset Allocation (% of fund's net assets) |
Period end |
 | Domestic Equity Funds** | 65.4% | |
 | International Equity Funds | 27.6% | |
 | Bond Funds | 5.7% | |
 | Short-Term Funds | 1.3% | |

Six months ago |
 | Domestic Equity Funds** | 65.9% | |
 | International Equity Funds | 26.8% | |
 | Bond Funds | 6.6% | |
 | Short-Term Funds | 0.7% | |

** Includes Fidelity Series Commodity Strategy Fund which invests in commodity-related investments. |
Annual Report
Fidelity Freedom 2035 Fund
Investments March 31, 2015
Showing Percentage of Net Assets
Domestic Equity Funds - 65.4% |
| Shares | | Value |
Fidelity Series 100 Index Fund (c) | 10,619,409 | | $ 141,131,943 |
Fidelity Series 1000 Value Index Fund (c) | 7,096,352 | | 79,479,138 |
Fidelity Series All-Sector Equity Fund (c) | 32,950,600 | | 466,580,492 |
Fidelity Series Blue Chip Growth Fund (c) | 29,104,686 | | 371,666,841 |
Fidelity Series Commodity Strategy Fund (a)(c) | 7,764,714 | | 47,520,051 |
Fidelity Series Equity-Income Fund (c) | 48,255,201 | | 608,980,639 |
Fidelity Series Growth & Income Fund (c) | 34,258,986 | | 464,551,848 |
Fidelity Series Growth Company Fund (c) | 42,351,120 | | 532,777,087 |
Fidelity Series Intrinsic Opportunities Fund (c) | 20,511,928 | | 309,935,239 |
Fidelity Series Opportunistic Insights Fund (c) | 19,676,645 | | 303,610,636 |
Fidelity Series Real Estate Equity Fund (c) | 3,573,229 | | 53,634,170 |
Fidelity Series Small Cap Discovery Fund (c) | 6,979,706 | | 78,800,884 |
Fidelity Series Small Cap Opportunities Fund (c) | 18,266,364 | | 250,066,526 |
Fidelity Series Stock Selector Large Cap Value Fund (c) | 31,207,074 | | 405,379,894 |
TOTAL DOMESTIC EQUITY FUNDS (Cost $3,386,008,670) |
4,114,115,388
|
International Equity Funds - 27.6% |
| | | |
Fidelity Series Emerging Markets Fund (c) | 28,744,005 | | 488,648,083 |
Fidelity Series International Growth Fund (c) | 39,232,141 | | 564,550,503 |
Fidelity Series International Small Cap Fund (c) | 8,186,628 | | 129,921,785 |
Fidelity Series International Value Fund (c) | 54,911,386 | | 556,252,337 |
TOTAL INTERNATIONAL EQUITY FUNDS (Cost $1,551,333,881) |
1,739,372,708
|
Bond Funds - 5.7% |
| Shares | | Value |
Fidelity Series Emerging Markets Debt Fund (c) | 4,027,006 | | $ 39,102,232 |
Fidelity Series Floating Rate High Income Fund (c) | 3,102,837 | | 30,438,836 |
Fidelity Series High Income Fund (c) | 22,183,996 | | 217,403,165 |
Fidelity Series Investment Grade Bond Fund (c) | 3,377,108 | | 39,073,141 |
Fidelity Series Real Estate Income Fund (c) | 2,656,339 | | 30,043,197 |
TOTAL BOND FUNDS (Cost $358,909,256) |
356,060,571
|
Short-Term Funds - 1.3% |
| | | |
Fidelity Institutional Money Market Portfolio Institutional Class 0.14% (b)(c) | 43,037,218 | | 43,037,218 |
Fidelity Series Short-Term Credit Fund (c) | 3,670,045 | | 36,737,149 |
TOTAL SHORT-TERM FUNDS (Cost $79,737,667) |
79,774,367
|
TOTAL INVESTMENT PORTFOLIO - 100.0% (Cost $5,375,989,474) | 6,289,323,034 |
NET OTHER ASSETS (LIABILITIES) - 0.0% | | 21,729 |
NET ASSETS - 100% | $ 6,289,344,763 |
Legend |
(a) Non-income producing |
(b) The rate quoted is the annualized seven-day yield of the fund at period end. |
(c) Affiliated Fund |
Affiliated Underlying Funds |
Information regarding the Fund's fiscal year to date purchases and sales of the affiliated Underlying Funds and income earned by the Fund from investments in affiliated Underlying Funds is as follows: |
Affiliate | Value,
beginning of
period | Purchases | Sales
Proceeds | Dividend
Income | Value,
end of
period |
Fidelity Institutional Money Market Portfolio Institutional Class | $ - | $ 45,069,060 | $ 2,031,842 | $ 21,085 | $ 43,037,218 |
Fidelity Series 100 Index Fund | 116,855,094 | 33,112,285 | 20,089,929 | 2,794,027 | 141,131,943 |
Fidelity Series 1000 Value Index Fund | 78,969,816 | 9,398,059 | 12,557,437 | 1,656,405 | 79,479,138 |
Fidelity Series All-Sector Equity Fund | 455,645,924 | 83,934,853 | 75,539,199 | 4,145,711 | 466,580,492 |
Fidelity Series Blue Chip Growth Fund | 384,199,586 | 39,341,376 | 118,050,637 | 787,836 | 371,666,841 |
Fidelity Series Commodity Strategy Fund | 59,625,273 | 12,559,346 | 6,351,741 | - | 47,520,051 |
Fidelity Series Emerging Markets Debt Fund | 42,339,110 | 4,535,811 | 5,846,739 | 2,297,480 | 39,102,232 |
Fidelity Series Emerging Markets Fund | 345,709,520 | 187,140,017 | 36,141,214 | 3,395,816 | 488,648,083 |
Fidelity Series Equity-Income Fund | 585,356,017 | 101,602,449 | 84,041,817 | 12,902,120 | 608,980,639 |
Fidelity Series Floating Rate High Income Fund | 46,886,694 | 4,570,124 | 19,012,184 | 1,596,230 | 30,438,836 |
Fidelity Series Growth & Income Fund | 445,453,573 | 66,126,555 | 67,269,429 | 7,729,476 | 464,551,848 |
Fidelity Series Growth Company Fund | 471,518,107 | 4,373,987 | 17,622,416 | 969,789 | 532,777,087 |
Fidelity Series High Income Fund | 411,114,191 | 37,019,009 | 207,733,508 | 16,574,038 | 217,403,165 |
Fidelity Series International Growth Fund | 584,594,559 | 48,506,914 | 77,362,485 | 7,219,736 | 564,550,503 |
Fidelity Series International Small Cap Fund | 131,044,568 | 15,631,185 | 14,236,608 | 1,102,794 | 129,921,785 |
Fidelity Series International Value Fund | 589,329,236 | 90,007,178 | 73,475,462 | 21,885,555 | 556,252,337 |
Fidelity Series Intrinsic Opportunities Fund | 289,015,131 | 37,582,092 | 41,283,813 | 4,205,738 | 309,935,239 |
Fidelity Series Investment Grade Bond Fund | 90,966,353 | 25,717,332 | 79,011,668 | 1,468,365 | 39,073,141 |
Fidelity Series Opportunistic Insights Fund | 285,023,821 | 40,450,372 | 51,308,529 | - | 303,610,636 |
Fidelity Series Real Estate Equity Fund | 50,522,403 | 10,751,749 | 16,112,153 | 993,220 | 53,634,170 |
Fidelity Series Real Estate Income Fund | 29,556,336 | 4,199,960 | 3,822,422 | 1,549,756 | 30,043,197 |
Fidelity Series Short-Term Credit Fund | - | 36,730,646 | 30,225 | - | 36,737,149 |
Fidelity Series Small Cap Discovery Fund | 67,629,258 | 14,229,925 | 10,003,446 | 135,762 | 78,800,884 |
Fidelity Series Small Cap Opportunities Fund | 233,044,554 | 49,959,026 | 36,152,572 | 775,090 | 250,066,526 |
Fidelity Series Stock Selector Large Cap Value Fund | 388,744,710 | 66,400,741 | 64,596,751 | 5,312,884 | 405,379,894 |
Fidelity Short-Term Bond Fund | - | 42,943,634 | 42,992,904 | 159,789 | - |
Total | $ 6,183,143,834 | $ 1,111,893,685 | $ 1,182,677,130 | $ 99,678,702 | $ 6,289,323,034 |
Other Information |
All investments are categorized as Level 1 under the Fair Value Hierarchy. The inputs or methodology used for valuing securities may not be an indication of the risk associated with investing in those securities. For more information on valuation inputs, please refer to the Investment Valuation section in the accompanying Notes to Financial Statements. |
See accompanying notes which are an integral part of the financial statements.
Annual Report
Fidelity Freedom 2035 Fund
Statement of Assets and Liabilities
| March 31, 2015 |
| | |
Assets | | |
Investment in securities, at value (cost $5,375,989,474) - See accompanying schedule | | $ 6,289,323,034 |
Cash | | 1 |
Receivable for investments sold | | 13,965,657 |
Receivable for fund shares sold | | 7,611,740 |
Dividends receivable | | 27,319 |
Total assets | | 6,310,927,751 |
| | |
Liabilities | | |
Payable for investments purchased | $ 8,215,813 | |
Payable for fund shares redeemed | 13,367,175 | |
Total liabilities | | 21,582,988 |
| | |
Net Assets | | $ 6,289,344,763 |
Net Assets consist of: | | |
Paid in capital | | $ 5,235,563,228 |
Undistributed net investment income | | 5,294,921 |
Accumulated undistributed net realized gain (loss) on investments | | 135,153,054 |
Net unrealized appreciation (depreciation) on investments | | 913,333,560 |
Net Assets, for 459,939,203 shares outstanding | | $ 6,289,344,763 |
Net Asset Value, offering price and redemption price per share ($6,289,344,763 ÷ 459,939,203 shares) | | $ 13.67 |
Statement of Operations
| Year ended March 31, 2015 |
| | |
Investment Income | | |
Income distributions from underlying funds | | $ 99,678,702 |
| | |
Expenses | | |
Independent trustees' compensation | $ 26,662 | |
Total expenses before reductions | 26,662 | |
Expense reductions | (26,662) | - |
Net investment income (loss) | | 99,678,702 |
Realized and Unrealized Gain (Loss) Realized gain (loss) on sale of underlying fund shares | 23,538,567 | |
Capital gain distributions from underlying funds | 195,571,031 | |
Total net realized gain (loss) | | 219,109,598 |
Change in net unrealized appreciation (depreciation) on underlying funds | | 153,427,180 |
Net gain (loss) | | 372,536,778 |
Net increase (decrease) in net assets resulting from operations | | $ 472,215,480 |
See accompanying notes which are an integral part of the financial statements.
Annual Report
Fidelity Freedom 2035 Fund
Financial Statements - continued
Statement of Changes in Net Assets
| Year ended
March 31,
2015 | Year ended
March 31,
2014 |
Increase (Decrease) in Net Assets | | |
Operations | | |
Net investment income (loss) | $ 99,678,702 | $ 84,570,749 |
Net realized gain (loss) | 219,109,598 | 394,327,659 |
Change in net unrealized appreciation (depreciation) | 153,427,180 | 341,346,689 |
Net increase (decrease) in net assets resulting from operations | 472,215,480 | 820,245,097 |
Distributions to shareholders from net investment income | (101,858,771) | (86,034,343) |
Distributions to shareholders from net realized gain | (335,577,653) | (258,952,323) |
Total distributions | (437,436,424) | (344,986,666) |
Share transactions
Proceeds from sales of shares | 1,464,517,062 | 1,702,143,678 |
Reinvestment of distributions | 436,665,855 | 344,488,628 |
Cost of shares redeemed | (1,829,761,212) | (1,987,277,487) |
Net increase (decrease) in net assets resulting from share transactions | 71,421,705 | 59,354,819 |
Total increase (decrease) in net assets | 106,200,761 | 534,613,250 |
| | |
Net Assets | | |
Beginning of period | 6,183,144,002 | 5,648,530,752 |
End of period (including undistributed net investment income of $5,294,921 and undistributed net investment income of $7,474,991, respectively) | $ 6,289,344,763 | $ 6,183,144,002 |
Other Information Shares | | |
Sold | 108,867,490 | 130,400,080 |
Issued in reinvestment of distributions | 33,126,797 | 26,279,054 |
Redeemed | (136,109,768) | (151,979,015) |
Net increase (decrease) | 5,884,519 | 4,700,119 |
Financial Highlights
Years ended March 31, | 2015 | 2014 | 2013 | 2012 | 2011 |
Selected Per-Share Data | | | | | |
Net asset value, beginning of period | $ 13.62 | $ 12.57 | $ 11.68 | $ 12.04 | $ 10.66 |
Income from Investment Operations | | | | | |
Net investment income (loss) B | .22 | .18 | .20 | .18 | .16 |
Net realized and unrealized gain (loss) | .80 | 1.63 | .93 | (.14) | 1.48 |
Total from investment operations | 1.02 | 1.81 | 1.13 | .04 | 1.64 |
Distributions from net investment income | (.23) | (.19) | (.21) | (.19) | (.17) |
Distributions from net realized gain | (.75) | (.57) | (.03) | (.21) | (.10) |
Total distributions | (.97) G | (.76) | (.24) | (.40) | (.26) F |
Net asset value, end of period | $ 13.67 | $ 13.62 | $ 12.57 | $ 11.68 | $ 12.04 |
Total ReturnA | 7.90% | 14.76% | 9.85% | .63% | 15.63% |
Ratios to Average Net Assets C,E | | | | | |
Expenses before reductions D | .00% | .00% | .00% | .00% | .00% |
Expenses net of fee waivers, if any | .00% | .00% | .00% | .00% | .00% |
Expenses net of all reductions | .00% | .00% | .00% | .00% | .00% |
Net investment income (loss) | 1.62% | 1.42% | 1.70% | 1.57% | 1.49% |
Supplemental Data | | | | | |
Net assets, end of period (000 omitted) | $ 6,289,345 | $ 6,183,144 | $ 5,648,531 | $ 5,857,392 | $ 6,909,265 |
Portfolio turnover rate C | 18% | 54% | 36% | 30% | 47% |
A Total returns would have been lower if certain expenses had not been reduced during the applicable periods shown.
B Calculated based on average shares outstanding during the period.
C Amounts do not include the activity of the Underlying Funds.
D Amount represents less than .01%.
E Expense ratios reflect operating expenses of the Fund. Expenses before reductions do not reflect amounts reimbursed by the investment adviser or reductions from expense offset arrangements and do not represent the amount paid by the Fund during periods when reimbursements or reductions occur. Expenses net of fee waivers reflect expenses after reimbursement by the investment adviser but prior to reductions from expense offset arrangements. Expenses net of all reductions represent the net expenses paid by the Fund but do not include expenses of the underlying funds in which the Fund invests.
F Total distributions of $.26 per share is comprised of distributions from net investment income of $.168 and distributions from net realized gain of $.095 per share.
G Total distributions of $.97 per share is comprised of distributions from net investment income of $.226 and distributions from net realized gain of $.746 per share.
See accompanying notes which are an integral part of the financial statements.
Annual Report
Fidelity Freedom 2040 Fund
Investment Changes (Unaudited)
The information in the following tables is based on the direct investments of the Fund. |
Fund Holdings as of March 31, 2015 |
| % of fund's
net assets | % of fund's net assets
6 months ago |
Domestic Equity Funds | | |
Fidelity Series 100 Index Fund | 2.2 | 2.3 |
Fidelity Series 1000 Value Index Fund | 1.3 | 1.3 |
Fidelity Series All-Sector Equity Fund | 7.4 | 7.6 |
Fidelity Series Blue Chip Growth Fund | 5.9 | 6.5 |
Fidelity Series Commodity Strategy Fund | 0.8 | 1.0 |
Fidelity Series Equity-Income Fund | 9.7 | 9.8 |
Fidelity Series Growth & Income Fund | 7.4 | 7.5 |
Fidelity Series Growth Company Fund | 8.6 | 7.9 |
Fidelity Series Intrinsic Opportunities Fund | 4.9 | 4.8 |
Fidelity Series Opportunistic Insights Fund | 4.8 | 4.9 |
Fidelity Series Real Estate Equity Fund | 0.8 | 0.9 |
Fidelity Series Small Cap Discovery Fund | 1.2 | 1.1 |
Fidelity Series Small Cap Opportunities Fund | 4.0 | 3.8 |
Fidelity Series Stock Selector Large Cap Value Fund | 6.4 | 6.5 |
| 65.4 | 65.9 |
International Equity Funds | | |
Fidelity Series Emerging Markets Fund | 7.7 | 6.6 |
Fidelity Series International Growth Fund | 9.0 | 9.1 |
Fidelity Series International Small Cap Fund | 2.1 | 2.0 |
Fidelity Series International Value Fund | 8.8 | 9.1 |
| 27.6 | 26.8 |
Bond Funds | | |
Fidelity Series Emerging Markets Debt Fund | 0.6 | 0.7 |
Fidelity Series Floating Rate High Income Fund | 0.5 | 0.5 |
Fidelity Series High Income Fund | 3.5 | 4.4 |
Fidelity Series Investment Grade Bond Fund | 0.6 | 0.5 |
Fidelity Series Real Estate Income Fund | 0.5 | 0.5 |
| 5.7 | 6.6 |
Short-Term Funds | | |
Fidelity Institutional Money Market Portfolio Institutional Class | 0.7 | 0.5 |
Fidelity Series Short-Term Credit Fund | 0.6 | 0.0 |
Fidelity Short-Term Bond Fund | 0.0 | 0.2 |
| 1.3 | 0.7 |
Net Other Assets (Liabilities)* | 0.0 | 0.0 |
| 100.0 | 100.0 |
* Amount represents less than 0.1% |
Asset Allocation (% of fund's net assets) |
Period end |
 | Domestic Equity Funds** | 65.4% | |
 | International Equity Funds | 27.6% | |
 | Bond Funds | 5.7% | |
 | Short-Term Funds | 1.3% | |

Six months ago |
 | Domestic Equity Funds** | 65.9% | |
 | International Equity Funds | 26.8% | |
 | Bond Funds | 6.6% | |
 | Short-Term Funds | 0.7% | |

** Includes Fidelity Series Commodity Strategy Fund which invests in commodity-related investments. |
Annual Report
Fidelity Freedom 2040 Fund
Investments March 31, 2015
Showing Percentage of Net Assets
Domestic Equity Funds - 65.4% |
| Shares | | Value |
Fidelity Series 100 Index Fund (c) | 11,606,685 | | $ 154,252,842 |
Fidelity Series 1000 Value Index Fund (c) | 7,790,781 | | 87,256,742 |
Fidelity Series All-Sector Equity Fund (c) | 36,106,187 | | 511,263,608 |
Fidelity Series Blue Chip Growth Fund (c) | 31,857,167 | | 406,816,021 |
Fidelity Series Commodity Strategy Fund (a)(c) | 8,533,541 | | 52,225,272 |
Fidelity Series Equity-Income Fund (c) | 52,877,864 | | 667,318,641 |
Fidelity Series Growth & Income Fund (c) | 37,524,198 | | 508,828,132 |
Fidelity Series Growth Company Fund (c) | 46,927,741 | | 590,350,986 |
Fidelity Series Intrinsic Opportunities Fund (c) | 22,481,000 | | 339,687,916 |
Fidelity Series Opportunistic Insights Fund (c) | 21,562,950 | | 332,716,326 |
Fidelity Series Real Estate Equity Fund (c) | 3,927,269 | | 58,948,306 |
Fidelity Series Small Cap Discovery Fund (c) | 7,626,895 | | 86,107,650 |
Fidelity Series Small Cap Opportunities Fund (c) | 20,015,541 | | 274,012,755 |
Fidelity Series Stock Selector Large Cap Value Fund (c) | 34,190,856 | | 444,139,218 |
TOTAL DOMESTIC EQUITY FUNDS (Cost $3,685,105,938) |
4,513,924,415
|
International Equity Funds - 27.6% |
| | | |
Fidelity Series Emerging Markets Fund (c) | 31,510,863 | | 535,684,671 |
Fidelity Series International Growth Fund (c) | 43,044,540 | | 619,410,927 |
Fidelity Series International Small Cap Fund (c) | 8,983,505 | | 142,568,230 |
Fidelity Series International Value Fund (c) | 60,223,426 | | 610,063,307 |
TOTAL INTERNATIONAL EQUITY FUNDS (Cost $1,704,042,828) |
1,907,727,135
|
Bond Funds - 5.7% |
| Shares | | Value |
Fidelity Series Emerging Markets Debt Fund (c) | 4,433,884 | | $ 43,053,009 |
Fidelity Series Floating Rate High Income Fund (c) | 3,402,510 | | 33,378,622 |
Fidelity Series High Income Fund (c) | 24,293,090 | | 238,072,282 |
Fidelity Series Investment Grade Bond Fund (c) | 3,707,102 | | 42,891,175 |
Fidelity Series Real Estate Income Fund (c) | 2,917,373 | | 32,995,483 |
TOTAL BOND FUNDS (Cost $395,028,948) |
390,390,571
|
Short-Term Funds - 1.3% |
| | | |
Fidelity Institutional Money Market Portfolio Institutional Class 0.14% (b)(c) | 47,624,725 | | 47,624,725 |
Fidelity Series Short-Term Credit Fund (c) | 4,145,664 | | 41,498,101 |
TOTAL SHORT-TERM FUNDS (Cost $89,081,370) |
89,122,826
|
TOTAL INVESTMENT PORTFOLIO -
100.0% (Cost $5,873,259,084) | | 6,901,164,947 |
NET OTHER ASSETS (LIABILITIES) - 0.0% | | 26,368 |
NET ASSETS - 100% | $ 6,901,191,315 |
Legend |
(a) Non-income producing |
(b) The rate quoted is the annualized seven-day yield of the fund at period end. |
(c) Affiliated Fund |
Affiliated Underlying Funds |
Information regarding the Fund's fiscal year to date purchases and sales of the affiliated Underlying Funds and income earned by the Fund from investments in affiliated Underlying Funds is as follows: |
Affiliate | Value,
beginning of
period | Purchases | Sales
Proceeds | Dividend
Income | Value,
end of
period |
Fidelity Institutional Money Market Portfolio Institutional Class | $ - | $ 50,842,596 | $ 3,217,870 | $ 23,755 | $ 47,624,725 |
Fidelity Series 100 Index Fund | 132,182,651 | 34,469,106 | 25,067,857 | 3,127,843 | 154,252,842 |
Fidelity Series 1000 Value Index Fund | 88,818,697 | 8,962,877 | 14,719,660 | 1,862,474 | 87,256,742 |
Fidelity Series All-Sector Equity Fund | 530,850,832 | 82,384,016 | 105,534,688 | 4,638,309 | 511,263,608 |
Fidelity Series Blue Chip Growth Fund | 434,800,755 | 38,395,351 | 140,592,646 | 881,343 | 406,816,021 |
Fidelity Series Commodity Strategy Fund | 68,145,428 | 12,582,012 | 8,030,992 | - | 52,225,272 |
Fidelity Series Emerging Markets Debt Fund | 48,032,273 | 4,523,819 | 7,357,107 | 2,581,525 | 43,053,009 |
Fidelity Series Emerging Markets Fund | 392,322,377 | 197,474,777 | 45,772,960 | 3,749,483 | 535,684,671 |
Fidelity Series Equity-Income Fund | 663,378,358 | 103,939,335 | 107,196,113 | 14,508,128 | 667,318,641 |
Fidelity Series Floating Rate High Income Fund | 46,042,055 | 4,356,289 | 14,798,399 | 1,667,448 | 33,378,622 |
Fidelity Series Growth & Income Fund | 498,732,866 | 71,487,048 | 84,075,612 | 8,643,812 | 508,828,132 |
Fidelity Series Growth Company Fund | 535,921,647 | 4,789,244 | 33,818,489 | 1,086,790 | 590,350,986 |
Fidelity Series High Income Fund | 466,573,194 | 38,923,199 | 241,632,110 | 18,614,381 | 238,072,282 |
Fidelity Series International Growth Fund | 663,052,817 | 47,215,776 | 100,645,009 | 8,073,434 | 619,410,927 |
Fidelity Series International Small Cap Fund | 149,525,292 | 15,027,989 | 19,082,082 | 1,232,856 | 142,568,230 |
Fidelity Series International Value Fund | 668,441,245 | 92,396,825 | 95,302,052 | 24,467,022 | 610,063,307 |
Fidelity Series Intrinsic Opportunities Fund | 323,978,793 | 39,843,271 | 51,484,627 | 4,715,704 | 339,687,916 |
Fidelity Series Investment Grade Bond Fund | 108,679,701 | 26,632,225 | 94,067,693 | 1,702,368 | 42,891,175 |
Fidelity Series Opportunistic Insights Fund | 323,205,608 | 40,993,637 | 64,569,089 | - | 332,716,326 |
Fidelity Series Real Estate Equity Fund | 58,408,988 | 13,334,306 | 22,381,044 | 1,128,136 | 58,948,306 |
Fidelity Series Real Estate Income Fund | 33,526,125 | 4,191,885 | 4,847,573 | 1,738,310 | 32,995,483 |
Fidelity Series Short-Term Credit Fund | - | 41,467,685 | 11,049 | - | 41,498,101 |
Fidelity Series Small Cap Discovery Fund | 77,656,176 | 13,697,342 | 12,836,976 | 152,709 | 86,107,650 |
Fidelity Series Small Cap Opportunities Fund | 263,257,832 | 53,424,388 | 46,001,646 | 866,491 | 274,012,755 |
Fidelity Series Stock Selector Large Cap Value Fund | 440,593,793 | 67,564,795 | 80,959,747 | 5,944,221 | 444,139,218 |
Fidelity Short-Term Bond Fund | - | 48,433,916 | 48,490,986 | 180,159 | - |
Total | $ 7,016,127,503 | $ 1,157,353,709 | $ 1,472,494,076 | $ 111,586,701 | $ 6,901,164,947 |
Other Information |
All investments are categorized as Level 1 under the Fair Value Hierarchy. The inputs or methodology used for valuing securities may not be an indication of the risk associated with investing in those securities. For more information on valuation inputs, please refer to the Investment Valuation section in the accompanying Notes to Financial Statements. |
See accompanying notes which are an integral part of the financial statements.
Annual Report
Fidelity Freedom 2040 Fund
Statement of Assets and Liabilities
| March 31, 2015 |
| | |
Assets | | |
Investment in securities, at value (cost $5,873,259,084) - See accompanying schedule | | $ 6,901,164,947 |
Receivable for investments sold | | 11,442,513 |
Receivable for fund shares sold | | 7,206,653 |
Dividends receivable | | 30,866 |
Total assets | | 6,919,844,979 |
| | |
Liabilities | | |
Payable for investments purchased | $ 9,311,779 | |
Payable for fund shares redeemed | 9,341,885 | |
Total liabilities | | 18,653,664 |
| | |
Net Assets | | $ 6,901,191,315 |
Net Assets consist of: | | |
Paid in capital | | $ 5,708,845,860 |
Undistributed net investment income | | 5,784,713 |
Accumulated undistributed net realized gain (loss) on investments | | 158,654,879 |
Net unrealized appreciation (depreciation) on investments | | 1,027,905,863 |
Net Assets, for 716,356,702 shares outstanding | | $ 6,901,191,315 |
Net Asset Value, offering price and redemption price per share ($6,901,191,315 ÷ 716,356,702 shares) | | $ 9.63 |
Statement of Operations
| Year ended March 31, 2015 |
| | |
Investment Income | | |
Income distributions from underlying funds | | $ 111,586,701 |
| | |
Expenses | | |
Independent trustees' compensation | $ 29,988 | |
Total expenses before reductions | 29,988 | |
Expense reductions | (29,988) | - |
Net investment income (loss) | | 111,586,701 |
Realized and Unrealized Gain (Loss) Realized gain (loss) on sale of underlying fund shares | 40,140,804 | |
Capital gain distributions from underlying funds | 218,660,489 | |
Total net realized gain (loss) | | 258,801,293 |
Change in net unrealized appreciation (depreciation) on underlying funds | | 160,036,995 |
Net gain (loss) | | 418,838,288 |
Net increase (decrease) in net assets resulting from operations | | $ 530,424,989 |
See accompanying notes which are an integral part of the financial statements.
Annual Report
Statement of Changes in Net Assets
| Year ended
March 31,
2015 | Year ended
March 31,
2014 |
Increase (Decrease) in Net Assets | | |
Operations | | |
Net investment income (loss) | $ 111,586,701 | $ 98,038,650 |
Net realized gain (loss) | 258,801,293 | 447,473,003 |
Change in net unrealized appreciation (depreciation) | 160,036,995 | 438,379,792 |
Net increase (decrease) in net assets resulting from operations | 530,424,989 | 983,891,445 |
Distributions to shareholders from net investment income | (113,793,541) | (100,637,238) |
Distributions to shareholders from net realized gain | (394,091,363) | (246,052,806) |
Total distributions | (507,884,904) | (346,690,044) |
Share transactions
Proceeds from sales of shares | 1,483,734,986 | 1,725,921,015 |
Reinvestment of distributions | 506,217,688 | 345,778,163 |
Cost of shares redeemed | (2,127,429,073) | (2,451,342,538) |
Net increase (decrease) in net assets resulting from share transactions | (137,476,399) | (379,643,360) |
Total increase (decrease) in net assets | (114,936,314) | 257,558,041 |
| | |
Net Assets | | |
Beginning of period | 7,016,127,629 | 6,758,569,588 |
End of period (including undistributed net investment income of $5,784,713 and undistributed net investment income of $7,991,553, respectively) | $ 6,901,191,315 | $ 7,016,127,629 |
Other Information Shares | | |
Sold | 156,496,312 | 188,076,691 |
Issued in reinvestment of distributions | 54,503,721 | 37,447,686 |
Redeemed | (224,315,197) | (265,580,026) |
Net increase (decrease) | (13,315,164) | (40,055,649) |
Financial Highlights
Years ended March 31, | 2015 | 2014 | 2013 | 2012 | 2011 |
Selected Per-Share Data | | | | | |
Net asset value, beginning of period | $ 9.62 | $ 8.78 | $ 8.15 | $ 8.41 | $ 7.45 |
Income from Investment Operations | | | | | |
Net investment income (loss) B | .15 | .13 | .14 | .12 | .12 |
Net realized and unrealized gain (loss) | .57 | 1.17 | .66 | (.10) | 1.03 |
Total from investment operations | .72 | 1.30 | .80 | .02 | 1.15 |
Distributions from net investment income | (.16) | (.13) | (.15) | (.13) | (.12) |
Distributions from net realized gain | (.55) | (.33) | (.02) | (.15) | (.07) |
Total distributions | (.71) | (.46) | (.17) | (.28) | (.19) |
Net asset value, end of period | $ 9.63 | $ 9.62 | $ 8.78 | $ 8.15 | $ 8.41 |
Total ReturnA | 7.86% | 15.08% | 9.94% | .58% | 15.66% |
Ratios to Average Net Assets C,E | | | | | |
Expenses before reductions D | .00% | .00% | .00% | .00% | .00% |
Expenses net of fee waivers, if any | .00% | .00% | .00% | .00% | .00% |
Expenses net of all reductions | .00% | .00% | .00% | .00% | .00% |
Net investment income (loss) | 1.61% | 1.40% | 1.70% | 1.55% | 1.52% |
Supplemental Data | | | | | |
Net assets, end of period (000 omitted) | $ 6,901,191 | $ 7,016,128 | $ 6,758,570 | $ 7,293,065 | $ 9,073,364 |
Portfolio turnover rate C | 17% | 49% | 33% | 27% | 46% |
A Total returns would have been lower if certain expenses had not been reduced during the applicable periods shown.
B Calculated based on average shares outstanding during the period.
C Amounts do not include the activity of the Underlying Funds.
D Amount represents less than .01%.
E Expense ratios reflect operating expenses of the Fund. Expenses before reductions do not reflect amounts reimbursed by the investment adviser or reductions from expense offset arrangements and do not represent the amount paid by the Fund during periods when reimbursements or reductions occur. Expenses net of fee waivers reflect expenses after reimbursement by the investment adviser but prior to reductions from expense offset arrangements. Expenses net of all reductions represent the net expenses paid by the Fund but do not include expenses of the underlying funds in which the Fund invests.
See accompanying notes which are an integral part of the financial statements.
Annual Report
Fidelity Freedom 2045 Fund
Investment Changes (Unaudited)
The information in the following tables is based on the direct investments of the Fund. |
Fund Holdings as of March 31, 2015 |
| % of fund's
net assets | % of fund's net assets
6 months ago |
Domestic Equity Funds | | |
Fidelity Series 100 Index Fund | 2.2 | 2.3 |
Fidelity Series 1000 Value Index Fund | 1.3 | 1.3 |
Fidelity Series All-Sector Equity Fund | 7.4 | 7.5 |
Fidelity Series Blue Chip Growth Fund | 5.9 | 6.6 |
Fidelity Series Commodity Strategy Fund | 0.8 | 1.0 |
Fidelity Series Equity-Income Fund | 9.7 | 9.8 |
Fidelity Series Growth & Income Fund | 7.4 | 7.6 |
Fidelity Series Growth Company Fund | 8.5 | 7.8 |
Fidelity Series Intrinsic Opportunities Fund | 4.9 | 4.8 |
Fidelity Series Opportunistic Insights Fund | 4.8 | 4.9 |
Fidelity Series Real Estate Equity Fund | 0.8 | 0.9 |
Fidelity Series Small Cap Discovery Fund | 1.3 | 1.1 |
Fidelity Series Small Cap Opportunities Fund | 4.0 | 3.8 |
Fidelity Series Stock Selector Large Cap Value Fund | 6.4 | 6.5 |
| 65.4 | 65.9 |
International Equity Funds | | |
Fidelity Series Emerging Markets Fund | 7.8 | 6.6 |
Fidelity Series International Growth Fund | 9.0 | 9.1 |
Fidelity Series International Small Cap Fund | 2.1 | 2.0 |
Fidelity Series International Value Fund | 8.8 | 9.1 |
| 27.7 | 26.8 |
Bond Funds | | |
Fidelity Series Emerging Markets Debt Fund | 0.6 | 0.7 |
Fidelity Series Floating Rate High Income Fund | 0.5 | 0.5 |
Fidelity Series High Income Fund | 3.5 | 4.4 |
Fidelity Series Investment Grade Bond Fund | 0.6 | 0.5 |
Fidelity Series Real Estate Income Fund | 0.5 | 0.5 |
| 5.7 | 6.6 |
Short-Term Funds | | |
Fidelity Institutional Money Market Portfolio Institutional Class | 0.7 | 0.5 |
Fidelity Series Short-Term Credit Fund | 0.5 | 0.0 |
Fidelity Short-Term Bond Fund | 0.0 | 0.2 |
| 1.2 | 0.7 |
Net Other Assets (Liabilities)* | 0.0 | 0.0 |
| 100.0 | 100.0 |
* Amount represents less than 0.1% |
Asset Allocation (% of fund's net assets) |
Period end |
 | Domestic Equity Funds** | 65.4% | |
 | International Equity Funds | 27.7% | |
 | Bond Funds | 5.7% | |
 | Short-Term Funds | 1.2% | |

Six months ago |
 | Domestic Equity Funds** | 65.9% | |
 | International Equity Funds | 26.8% | |
 | Bond Funds | 6.6% | |
 | Short-Term Funds | 0.7% | |

** Includes Fidelity Series Commodity Strategy Fund which invests in commodity-related investments. |
Annual Report
Fidelity Freedom 2045 Fund
Investments March 31, 2015
Showing Percentage of Net Assets
Domestic Equity Funds - 65.4% |
| Shares | | Value |
Fidelity Series 100 Index Fund (c) | 5,058,600 | | $ 67,228,796 |
Fidelity Series 1000 Value Index Fund (c) | 3,394,290 | | 38,016,048 |
Fidelity Series All-Sector Equity Fund (c) | 15,686,624 | | 222,122,602 |
Fidelity Series Blue Chip Growth Fund (c) | 13,851,116 | | 176,878,750 |
Fidelity Series Commodity Strategy Fund (a)(c) | 3,683,062 | | 22,540,341 |
Fidelity Series Equity-Income Fund (c) | 22,972,329 | | 289,910,792 |
Fidelity Series Growth & Income Fund (c) | 16,310,060 | | 221,164,420 |
Fidelity Series Growth Company Fund (c) | 20,125,600 | | 253,180,046 |
Fidelity Series Intrinsic Opportunities Fund (c) | 9,764,549 | | 147,542,328 |
Fidelity Series Opportunistic Insights Fund (c) | 9,367,238 | | 144,536,478 |
Fidelity Series Real Estate Equity Fund (c) | 1,698,913 | | 25,500,687 |
Fidelity Series Small Cap Discovery Fund (c) | 3,359,627 | | 37,930,193 |
Fidelity Series Small Cap Opportunities Fund (c) | 8,696,975 | | 119,061,588 |
Fidelity Series Stock Selector Large Cap Value Fund (c) | 14,853,042 | | 192,941,019 |
TOTAL DOMESTIC EQUITY FUNDS (Cost $1,561,007,723) |
1,958,554,088
|
International Equity Funds - 27.7% |
| | | |
Fidelity Series Emerging Markets Fund (c) | 13,694,556 | | 232,807,451 |
Fidelity Series International Growth Fund (c) | 18,688,780 | | 268,931,545 |
Fidelity Series International Small Cap Fund (c) | 3,896,758 | | 61,841,557 |
Fidelity Series International Value Fund (c) | 26,163,320 | | 265,034,435 |
TOTAL INTERNATIONAL EQUITY FUNDS (Cost $721,766,711) |
828,614,988
|
Bond Funds - 5.7% |
| Shares | | Value |
Fidelity Series Emerging Markets Debt Fund (c) | 1,916,674 | | $ 18,610,906 |
Fidelity Series Floating Rate High Income Fund (c) | 1,472,698 | | 14,447,165 |
Fidelity Series High Income Fund (c) | 10,578,942 | | 103,673,631 |
Fidelity Series Investment Grade Bond Fund (c) | 1,583,930 | | 18,326,071 |
Fidelity Series Real Estate Income Fund (c) | 1,261,790 | | 14,270,842 |
TOTAL BOND FUNDS (Cost $170,986,077) |
169,328,615
|
Short-Term Funds - 1.2% |
| | | |
Fidelity Institutional Money Market Portfolio Institutional Class 0.14% (b)(c) | 20,244,795 | | 20,244,795 |
Fidelity Series Short-Term Credit Fund (c) | 1,715,483 | | 17,171,981 |
TOTAL SHORT-TERM FUNDS (Cost $37,399,621) |
37,416,776
|
TOTAL INVESTMENT
PORTFOLIO - 100.0% (Cost $2,491,160,132) | | 2,993,914,467 |
NET OTHER ASSETS (LIABILITIES) - 0.0% | | 11,467 |
NET ASSETS - 100% | $ 2,993,925,934 |
Legend |
(a) Non-income producing |
(b) The rate quoted is the annualized seven-day yield of the fund at period end. |
(c) Affiliated Fund |
Affiliated Underlying Funds |
Information regarding the Fund's fiscal year to date purchases and sales of the affiliated Underlying Funds and income earned by the Fund from investments in affiliated Underlying Funds is as follows: |
Affiliate | Value,
beginning of period | Purchases | Sales
Proceeds | Dividend
Income | Value,
end of
period |
Fidelity Institutional Money Market Portfolio Institutional Class | $ - | $ 21,590,975 | $ 1,346,181 | $ 9,946 | $ 20,244,795 |
Fidelity Series 100 Index Fund | 54,558,320 | 18,506,545 | 11,148,747 | 1,325,256 | 67,228,796 |
Fidelity Series 1000 Value Index Fund | 36,616,173 | 6,869,668 | 7,166,992 | 792,257 | 38,016,048 |
Fidelity Series All-Sector Equity Fund | 216,505,363 | 46,088,124 | 41,509,695 | 1,966,715 | 222,122,602 |
Fidelity Series Blue Chip Growth Fund | 178,765,046 | 26,303,271 | 59,581,359 | 374,377 | 176,878,750 |
Fidelity Series Commodity Strategy Fund | 27,921,204 | 6,938,931 | 3,640,194 | - | 22,540,341 |
Fidelity Series Emerging Markets Debt Fund | 19,613,800 | 2,919,962 | 3,011,365 | 1,077,739 | 18,610,906 |
Fidelity Series Emerging Markets Fund | 161,351,747 | 97,063,717 | 21,655,638 | 1,623,659 | 232,807,451 |
Fidelity Series Equity-Income Fund | 273,425,805 | 60,032,531 | 46,383,360 | 6,094,662 | 289,910,792 |
Fidelity Series Floating Rate High Income Fund | 10,300,834 | 9,542,295 | 4,487,658 | 560,262 | 14,447,165 |
Fidelity Series Growth & Income Fund | 201,469,445 | 47,180,624 | 36,969,856 | 3,613,222 | 221,164,420 |
Fidelity Series Growth Company Fund | 219,850,555 | 2,379,973 | 4,236,942 | 459,914 | 253,180,046 |
Fidelity Series High Income Fund | 191,699,240 | 20,869,543 | 98,034,563 | 7,813,753 | 103,673,631 |
Fidelity Series International Growth Fund | 273,021,558 | 33,091,240 | 41,291,998 | 3,425,409 | 268,931,545 |
Fidelity Series International Small Cap Fund | 61,312,740 | 9,853,410 | 8,166,872 | 522,859 | 61,841,557 |
Fidelity Series International Value Fund | 275,213,523 | 53,398,437 | 39,838,339 | 10,477,785 | 265,034,435 |
Fidelity Series Intrinsic Opportunities Fund | 133,537,235 | 24,809,286 | 22,388,315 | 1,992,004 | 147,542,328 |
Fidelity Series Investment Grade Bond Fund | 54,056,972 | 13,289,296 | 49,842,063 | 810,786 | 18,326,071 |
Fidelity Series Opportunistic Insights Fund | 133,237,438 | 24,673,685 | 27,316,802 | - | 144,536,478 |
Fidelity Series Real Estate Equity Fund | 25,097,355 | 5,972,836 | 9,649,749 | 475,231 | 25,500,687 |
Fidelity Series Real Estate Income Fund | 13,756,607 | 2,575,339 | 2,109,762 | 732,718 | 14,270,842 |
Fidelity Series Short-Term Credit Fund | - | 17,188,485 | 33,692 | - | 17,171,981 |
Fidelity Series Small Cap Discovery Fund | 32,784,584 | 7,580,981 | 5,787,963 | 65,955 | 37,930,193 |
Fidelity Series Small Cap Opportunities Fund | 109,449,040 | 27,548,197 | 19,503,037 | 368,294 | 119,061,588 |
Fidelity Series Stock Selector Large Cap Value Fund | 181,560,826 | 39,201,707 | 34,809,179 | 2,520,518 | 192,941,019 |
Fidelity Short-Term Bond Fund | - | 20,350,105 | 20,373,187 | 74,952 | - |
Total | $ 2,885,105,410 | $ 645,819,163 | $ 620,283,508 | $ 47,178,273 | $ 2,993,914,467 |
Other Information |
All investments are categorized as Level 1 under the Fair Value Hierarchy. The inputs or methodology used for valuing securities may not be an indication of the risk associated with investing in those securities. For more information on valuation inputs, please refer to the Investment Valuation section in the accompanying Notes to Financial Statements. |
See accompanying notes which are an integral part of the financial statements.
Annual Report
Fidelity Freedom 2045 Fund
Statement of Assets and Liabilities
| March 31, 2015 |
| | |
Assets | | |
Investment in securities, at value (cost $2,491,160,132) - See accompanying schedule | | $ 2,993,914,467 |
Cash | | 4 |
Receivable for investments sold | | 9,601,142 |
Receivable for fund shares sold | | 6,058,601 |
Dividends receivable | | 12,784 |
Total assets | | 3,009,586,998 |
| | |
Liabilities | | |
Payable for investments purchased | $ 3,656,690 | |
Payable for fund shares redeemed | 12,004,374 | |
Total liabilities | | 15,661,064 |
| | |
Net Assets | | $ 2,993,925,934 |
Net Assets consist of: | | |
Paid in capital | | $ 2,427,387,400 |
Undistributed net investment income | | 2,610,789 |
Accumulated undistributed net realized gain (loss) on investments | | 61,173,410 |
Net unrealized appreciation (depreciation) on investments | | 502,754,335 |
Net Assets, for 276,174,182 shares outstanding | | $ 2,993,925,934 |
Net Asset Value, offering price and redemption price per share ($2,993,925,934 ÷ 276,174,182 shares) | | $ 10.84 |
Statement of Operations
| Year ended March 31, 2015 |
| | |
Investment Income | | |
Income distributions from underlying funds | | $ 47,178,273 |
| | |
Expenses | | |
Independent trustees' compensation | $ 12,592 | |
Total expenses before reductions | 12,592 | |
Expense reductions | (12,592) | - |
Net investment income (loss) | | 47,178,273 |
Realized and Unrealized Gain (Loss) Realized gain (loss) on sale of underlying fund shares | 10,990,835 | |
Capital gain distributions from underlying funds | 92,832,008 | |
Total net realized gain (loss) | | 103,822,843 |
Change in net unrealized appreciation (depreciation) on underlying funds | | 72,282,553 |
Net gain (loss) | | 176,105,396 |
Net increase (decrease) in net assets resulting from operations | | $ 223,283,669 |
See accompanying notes which are an integral part of the financial statements.
Annual Report
Statement of Changes in Net Assets
| Year ended
March 31,
2015 | Year ended
March 31,
2014 |
Increase (Decrease) in Net Assets | | |
Operations | | |
Net investment income (loss) | $ 47,178,273 | $ 38,752,222 |
Net realized gain (loss) | 103,822,843 | 268,404,942 |
Change in net unrealized appreciation (depreciation) | 72,282,553 | 83,601,264 |
Net increase (decrease) in net assets resulting from operations | 223,283,669 | 390,758,428 |
Distributions to shareholders from net investment income | (47,958,563) | (39,174,244) |
Distributions to shareholders from net realized gain | (230,593,594) | (178,770,881) |
Total distributions | (278,552,157) | (217,945,125) |
Share transactions
Proceeds from sales of shares | 935,975,186 | 1,035,937,284 |
Reinvestment of distributions | 278,276,671 | 217,741,479 |
Cost of shares redeemed | (1,050,162,996) | (1,021,851,958) |
Net increase (decrease) in net assets resulting from share transactions | 164,088,861 | 231,826,805 |
Total increase (decrease) in net assets | 108,820,373 | 404,640,108 |
| | |
Net Assets | | |
Beginning of period | 2,885,105,561 | 2,480,465,453 |
End of period (including undistributed net investment income of $2,610,789 and undistributed net investment income of $3,391,079, respectively) | $ 2,993,925,934 | $ 2,885,105,561 |
Other Information Shares | | |
Sold | 87,545,773 | 97,196,672 |
Issued in reinvestment of distributions | 26,697,457 | 20,534,147 |
Redeemed | (98,275,320) | (95,547,536) |
Net increase (decrease) | 15,967,910 | 22,183,283 |
Financial Highlights
Years ended March 31, | 2015 | 2014 | 2013 | 2012 | 2011 |
Selected Per-Share Data | | | | | |
Net asset value, beginning of period | $ 11.09 | $ 10.42 | $ 9.65 | $ 9.98 | $ 8.81 |
Income from Investment Operations | | | | | |
Net investment income (loss) B | .17 | .15 | .17 | .15 | .14 |
Net realized and unrealized gain (loss) | .64 | 1.39 | .79 | (.15) | 1.25 |
Total from investment operations | .81 | 1.54 | .96 | - | 1.39 |
Distributions from net investment income | (.18) | (.15) | (.17) | (.15) | (.14) |
Distributions from net realized gain | (.89) | (.72) | (.02) | (.17) | (.08) |
Total distributions | (1.06) F | (.87) | (.19) | (.33) G | (.22) |
Net asset value, end of period | $ 10.84 | $ 11.09 | $ 10.42 | $ 9.65 | $ 9.98 |
Total ReturnA | 7.93% | 15.38% | 10.14% | .29% | 15.99% |
Ratios to Average Net Assets C,E | | | | | |
Expenses before reductions D | .00% | .00% | .00% | .00% | .00% |
Expenses net of fee waivers, if any | .00% | .00% | .00% | .00% | .00% |
Expenses net of all reductions | .00% | .00% | .00% | .00% | .00% |
Net investment income (loss) | 1.62% | 1.42% | 1.75% | 1.57% | 1.55% |
Supplemental Data | | | | | |
Net assets, end of period (000 omitted) | $ 2,993,926 | $ 2,885,106 | $ 2,480,465 | $ 2,432,828 | $ 2,660,423 |
Portfolio turnover rate C | 21% | 53% | 45% | 40% | 50% |
A Total returns would have been lower if certain expenses had not been reduced during the applicable periods shown.
B Calculated based on average shares outstanding during the period.
C Amounts do not include the activity of the Underlying Funds.
D Amount represents less than .01%.
E Expense ratios reflect operating expenses of the Fund. Expenses before reductions do not reflect amounts reimbursed by the investment adviser or reductions from expense offset arrangements and do not represent the amount paid by the Fund during periods when reimbursements or reductions occur. Expenses net of fee waivers reflect expenses after reimbursement by the investment adviser but prior to reductions from expense offset arrangements. Expenses net of all reductions represent the net expenses paid by the Fund but do not include expenses of the underlying funds in which the Fund invests.
F Total distributions of $1.06 per share is comprised of distributions from net investment income of $.178 and distributions from net realized gain of $.886 per share.
G Total distributions of $.33 per share is comprised of distributions from net investment income of $.153 and distributions from net realized gain of $.174 per share.
See accompanying notes which are an integral part of the financial statements.
Annual Report
Fidelity Freedom 2050 Fund
Investment Changes (Unaudited)
The information in the following tables is based on the direct investments of the Fund. |
Fund Holdings as of March 31, 2015 |
| % of fund's
net assets | % of fund's
net assets
6 months ago |
Domestic Equity Funds | | |
Fidelity Series 100 Index Fund | 2.2 | 2.3 |
Fidelity Series 1000 Value Index Fund | 1.3 | 1.3 |
Fidelity Series All-Sector Equity Fund | 7.4 | 7.5 |
Fidelity Series Blue Chip Growth Fund | 5.9 | 6.6 |
Fidelity Series Commodity Strategy Fund | 0.7 | 1.0 |
Fidelity Series Equity-Income Fund | 9.7 | 9.8 |
Fidelity Series Growth & Income Fund | 7.4 | 7.6 |
Fidelity Series Growth Company Fund | 8.6 | 7.8 |
Fidelity Series Intrinsic Opportunities Fund | 4.9 | 4.8 |
Fidelity Series Opportunistic Insights Fund | 4.8 | 4.9 |
Fidelity Series Real Estate Equity Fund | 0.8 | 0.9 |
Fidelity Series Small Cap Discovery Fund | 1.3 | 1.1 |
Fidelity Series Small Cap Opportunities Fund | 4.0 | 3.8 |
Fidelity Series Stock Selector Large Cap Value Fund | 6.4 | 6.5 |
| 65.4 | 65.9 |
International Equity Funds | | |
Fidelity Series Emerging Markets Fund | 7.8 | 6.6 |
Fidelity Series International Growth Fund | 9.0 | 9.1 |
Fidelity Series International Small Cap Fund | 2.1 | 2.0 |
Fidelity Series International Value Fund | 8.8 | 9.1 |
| 27.7 | 26.8 |
Bond Funds | | |
Fidelity Series Emerging Markets Debt Fund | 0.6 | 0.7 |
Fidelity Series Floating Rate High Income Fund | 0.5 | 0.5 |
Fidelity Series High Income Fund | 3.5 | 4.4 |
Fidelity Series Investment Grade Bond Fund | 0.6 | 0.5 |
Fidelity Series Real Estate Income Fund | 0.5 | 0.5 |
| 5.7 | 6.6 |
Short-Term Funds | | |
Fidelity Institutional Money Market Portfolio Institutional Class | 0.6 | 0.5 |
Fidelity Series Short-Term Credit Fund | 0.6 | 0.0 |
Fidelity Short-Term Bond Fund | 0.0 | 0.2 |
| 1.2 | 0.7 |
Net Other Assets (Liabilities)* | 0.0 | 0.0 |
| 100.0 | 100.0 |
* Amount represents less than 0.1% |
Asset Allocation (% of fund's net assets) |
Period end |
 | Domestic Equity Funds** | 65.4% | |
 | International Equity Funds | 27.7% | |
 | Bond Funds | 5.7% | |
 | Short-Term Funds | 1.2% | |

Six months ago |
 | Domestic Equity Funds** | 65.9% | |
 | International Equity Funds | 26.8% | |
 | Bond Funds | 6.6% | |
 | Short-Term Funds | 0.7% | |

** Includes Fidelity Series Commodity Strategy Fund which invests in commodity-related investments. |
Annual Report
Fidelity Freedom 2050 Fund
Investments March 31, 2015
Showing Percentage of Net Assets
Domestic Equity Funds - 65.4% |
| Shares | | Value |
Fidelity Series 100 Index Fund (c) | 3,973,036 | | $ 52,801,653 |
Fidelity Series 1000 Value Index Fund (c) | 2,687,108 | | 30,095,605 |
Fidelity Series All-Sector Equity Fund (c) | 12,408,915 | | 175,710,242 |
Fidelity Series Blue Chip Growth Fund (c) | 10,958,891 | | 139,945,042 |
Fidelity Series Commodity Strategy Fund (a)(c) | 2,920,479 | | 17,873,333 |
Fidelity Series Equity-Income Fund (c) | 18,181,675 | | 229,452,732 |
Fidelity Series Growth & Income Fund (c) | 12,898,204 | | 174,899,640 |
Fidelity Series Growth Company Fund (c) | 16,247,826 | | 204,397,654 |
Fidelity Series Intrinsic Opportunities Fund (c) | 7,729,560 | | 116,793,646 |
Fidelity Series Opportunistic Insights Fund (c) | 7,411,250 | | 114,355,587 |
Fidelity Series Real Estate Equity Fund (c) | 1,342,313 | | 20,148,123 |
Fidelity Series Small Cap Discovery Fund (c) | 2,720,234 | | 30,711,446 |
Fidelity Series Small Cap Opportunities Fund (c) | 6,883,577 | | 94,236,168 |
Fidelity Series Stock Selector Large Cap Value Fund (c) | 11,742,932 | | 152,540,691 |
TOTAL DOMESTIC EQUITY FUNDS (Cost $1,230,426,456) |
1,553,961,562
|
International Equity Funds - 27.7% |
| | | |
Fidelity Series Emerging Markets Fund (c) | 10,870,821 | | 184,803,949 |
Fidelity Series International Growth Fund (c) | 14,837,275 | | 213,508,384 |
Fidelity Series International Small Cap Fund (c) | 3,092,764 | | 49,082,171 |
Fidelity Series International Value Fund (c) | 20,769,309 | | 210,393,105 |
TOTAL INTERNATIONAL EQUITY FUNDS (Cost $568,712,939) |
657,787,609
|
Bond Funds - 5.7% |
| Shares | | Value |
Fidelity Series Emerging Markets Debt Fund (c) | 1,521,365 | | $ 14,772,457 |
Fidelity Series Floating Rate High Income Fund (c) | 1,168,538 | | 11,463,362 |
Fidelity Series High Income Fund (c) | 8,405,259 | | 82,371,541 |
Fidelity Series Investment Grade Bond Fund (c) | 1,257,675 | | 14,551,304 |
Fidelity Series Real Estate Income Fund (c) | 1,001,264 | | 11,324,294 |
TOTAL BOND FUNDS (Cost $136,619,459) |
134,482,958
|
Short-Term Funds - 1.2% |
| | | |
Fidelity Institutional Money Market Portfolio Institutional Class 0.14% (b)(c) | 15,473,117 | | 15,473,117 |
Fidelity Series Short-Term Credit Fund (c) | 1,358,247 | | 13,596,057 |
TOTAL SHORT-TERM FUNDS (Cost $29,055,592) |
29,069,174
|
TOTAL INVESTMENT
PORTFOLIO - 100.0% (Cost $1,964,814,446) | | 2,375,301,303 |
NET OTHER ASSETS (LIABILITIES) - 0.0% | | 6,555 |
NET ASSETS - 100% | $ 2,375,307,858 |
Legend |
(a) Non-income producing |
(b) The rate quoted is the annualized seven-day yield of the fund at period end. |
(c) Affiliated Fund |
Affiliated Underlying Funds |
Information regarding the Fund's fiscal year to date purchases and sales of the affiliated Underlying Funds and income earned by the Fund from investments in affiliated Underlying Funds is as follows: |
Affiliate | Value,
beginning of
period | Purchases | Sales
Proceeds | Dividend
Income | Value,
end of
period |
Fidelity Institutional Money Market Portfolio Institutional Class | $ - | $ 17,136,204 | $ 1,663,087 | $ 7,854 | $ 15,473,117 |
Fidelity Series 100 Index Fund | 43,437,076 | 15,232,779 | 10,135,486 | 1,073,251 | 52,801,653 |
Fidelity Series 1000 Value Index Fund | 29,193,046 | 5,919,214 | 6,377,256 | 641,960 | 30,095,605 |
Fidelity Series All-Sector Equity Fund | 171,908,645 | 39,063,452 | 36,040,016 | 1,587,277 | 175,710,242 |
Fidelity Series Blue Chip Growth Fund | 142,858,069 | 22,652,940 | 50,866,410 | 300,297 | 139,945,042 |
Fidelity Series Commodity Strategy Fund | 22,092,892 | 6,051,290 | 3,343,423 | - | 17,873,333 |
Fidelity Series Emerging Markets Debt Fund | 15,655,302 | 2,553,879 | 2,707,530 | 864,394 | 14,772,457 |
Fidelity Series Emerging Markets Fund | 128,651,888 | 80,763,839 | 21,420,295 | 1,310,702 | 184,803,949 |
Fidelity Series Equity-Income Fund | 218,047,954 | 51,684,175 | 42,549,789 | 4,895,077 | 229,452,732 |
Fidelity Series Floating Rate High Income Fund | 2,444,842 | 13,517,815 | 3,798,069 | 364,543 | 11,463,362 |
Fidelity Series Growth & Income Fund | 160,990,778 | 40,556,053 | 34,316,458 | 2,902,426 | 174,899,640 |
Fidelity Series Growth Company Fund | 173,988,659 | 3,278,763 | 1,108,553 | 369,681 | 204,397,654 |
Fidelity Series High Income Fund | 152,678,622 | 17,893,480 | 79,525,290 | 6,262,517 | 82,371,541 |
Fidelity Series International Growth Fund | 216,729,141 | 30,549,964 | 37,157,981 | 2,748,812 | 213,508,384 |
Fidelity Series International Small Cap Fund | 50,200,876 | 7,389,309 | 7,635,364 | 419,586 | 49,082,171 |
Fidelity Series International Value Fund | 218,471,087 | 46,780,668 | 35,886,251 | 8,441,655 | 210,393,105 |
Fidelity Series Intrinsic Opportunities Fund | 106,551,829 | 21,577,279 | 20,686,384 | 1,603,892 | 116,793,646 |
Fidelity Series Investment Grade Bond Fund | 48,909,595 | 11,272,152 | 46,370,769 | 702,188 | 14,551,304 |
Fidelity Series Opportunistic Insights Fund | 106,220,724 | 21,384,673 | 24,488,687 | - | 114,355,587 |
Fidelity Series Real Estate Equity Fund | 20,389,328 | 4,702,785 | 8,240,497 | 382,822 | 20,148,123 |
Fidelity Series Real Estate Income Fund | 10,920,937 | 2,346,297 | 1,977,701 | 588,417 | 11,324,294 |
Fidelity Series Short-Term Credit Fund | - | 13,584,915 | 2,442 | - | 13,596,057 |
Fidelity Series Small Cap Discovery Fund | 26,465,759 | 6,740,521 | 5,282,689 | 53,883 | 30,711,446 |
Fidelity Series Small Cap Opportunities Fund | 86,232,465 | 24,542,234 | 17,912,833 | 295,858 | 94,236,168 |
Fidelity Series Stock Selector Large Cap Value Fund | 144,792,536 | 33,759,735 | 31,609,619 | 2,033,230 | 152,540,691 |
Fidelity Short-Term Bond Fund | - | 16,212,860 | 16,230,384 | 59,693 | - |
Total | $ 2,297,832,050 | $ 557,147,275 | $ 547,333,263 | $ 37,910,015 | $ 2,375,301,303 |
Other Information |
All investments are categorized as Level 1 under the Fair Value Hierarchy. The inputs or methodology used for valuing securities may not be an indication of the risk associated with investing in those securities. For more information on valuation inputs, please refer to the Investment Valuation section in the accompanying Notes to Financial Statements. |
See accompanying notes which are an integral part of the financial statements.
Annual Report
Fidelity Freedom 2050 Fund
Statement of Assets and Liabilities
| March 31, 2015 |
| | |
Assets | | |
Investment in securities, at value (cost $1,964,814,446) - See accompanying schedule | | $ 2,375,301,303 |
Cash | | 6 |
Receivable for investments sold | | 3,936,119 |
Receivable for fund shares sold | | 4,605,152 |
Dividends receivable | | 10,099 |
Total assets | | 2,383,852,679 |
| | |
Liabilities | | |
Payable for investments purchased | $ 3,257,055 | |
Payable for fund shares redeemed | 5,287,766 | |
Total liabilities | | 8,544,821 |
| | |
Net Assets | | $ 2,375,307,858 |
Net Assets consist of: | | |
Paid in capital | | $ 1,912,546,611 |
Undistributed net investment income | | 2,105,386 |
Accumulated undistributed net realized gain (loss) on investments | | 50,169,004 |
Net unrealized appreciation (depreciation) on investments | | 410,486,857 |
Net Assets, for 217,872,307 shares outstanding | | $ 2,375,307,858 |
Net Asset Value, offering price and redemption price per share ($2,375,307,858 ÷ 217,872,307 shares) | | $ 10.90 |
Statement of Operations
| Year ended March 31, 2015 |
| | |
Investment Income | | |
Income distributions from underlying funds | | $ 37,910,015 |
| | |
Expenses | | |
Independent trustees' compensation | $ 10,089 | |
Total expenses before reductions | 10,089 | |
Expense reductions | (10,089) | - |
Net investment income (loss) | | 37,910,015 |
Realized and Unrealized Gain (Loss) Realized gain (loss) on sale of underlying fund shares | 7,691,857 | |
Capital gain distributions from underlying funds | 74,825,896 | |
Total net realized gain (loss) | | 82,517,753 |
Change in net unrealized appreciation (depreciation) on underlying funds | | 59,963,370 |
Net gain (loss) | | 142,481,123 |
Net increase (decrease) in net assets resulting from operations | | $ 180,391,138 |
See accompanying notes which are an integral part of the financial statements.
Annual Report
Fidelity Freedom 2050 Fund
Financial Statements - continued
Statement of Changes in Net Assets
| Year ended
March 31,
2015 | Year ended
March 31,
2014 |
Increase (Decrease) in Net Assets | | |
Operations | | |
Net investment income (loss) | $ 37,910,015 | $ 31,613,224 |
Net realized gain (loss) | 82,517,753 | 216,769,237 |
Change in net unrealized appreciation (depreciation) | 59,963,370 | 75,333,644 |
Net increase (decrease) in net assets resulting from operations | 180,391,138 | 323,716,105 |
Distributions to shareholders from net investment income | (38,403,121) | (32,163,946) |
Distributions to shareholders from net realized gain | (182,970,831) | (110,735,026) |
Total distributions | (221,373,952) | (142,898,972) |
Share transactions
Proceeds from sales of shares | 838,982,359 | 885,246,939 |
Reinvestment of distributions | 220,900,399 | 142,690,732 |
Cost of shares redeemed | (941,424,321) | (980,667,252) |
Net increase (decrease) in net assets resulting from share transactions | 118,458,437 | 47,270,419 |
Total increase (decrease) in net assets | 77,475,623 | 228,087,552 |
| | |
Net Assets | | |
Beginning of period | 2,297,832,235 | 2,069,744,683 |
End of period (including undistributed net investment income of $2,105,386 and undistributed net investment income of $2,598,491, respectively) | $ 2,375,307,858 | $ 2,297,832,235 |
Other Information Shares | | |
Sold | 78,104,778 | 82,759,367 |
Issued in reinvestment of distributions | 21,105,948 | 13,290,285 |
Redeemed | (87,508,152) | (91,210,233) |
Net increase (decrease) | 11,702,574 | 4,839,419 |
Financial Highlights
Years ended March 31, | 2015 | 2014 | 2013 | 2012 | 2011 |
Selected Per-Share Data | | | | | |
Net asset value, beginning of period | $ 11.15 | $ 10.28 | $ 9.51 | $ 9.88 | $ 8.69 |
Income from Investment Operations | | | | | |
Net investment income (loss) B | .17 | .15 | .16 | .14 | .13 |
Net realized and unrealized gain (loss) | .65 | 1.41 | .79 | (.19) | 1.27 |
Total from investment operations | .82 | 1.56 | .95 | (.05) | 1.40 |
Distributions from net investment income | (.18) | (.15) | (.17) | (.14) | (.13) |
Distributions from net realized gain | (.89) | (.54) | (.02) | (.18) | (.08) |
Total distributions | (1.07) | (.69) | (.18) F | (.32) | (.21) |
Net asset value, end of period | $ 10.90 | $ 11.15 | $ 10.28 | $ 9.51 | $ 9.88 |
Total ReturnA | 7.91% | 15.53% | 10.18% | (.17) % | 16.29% |
Ratios to Average Net Assets C,E | | | | | |
Expenses before reductions D | .00% | .00% | .00% | .00% | .00% |
Expenses net of fee waivers, if any | .00% | .00% | .00% | .00% | .00% |
Expenses net of all reductions | .00% | .00% | .00% | .00% | .00% |
Net investment income (loss) | 1.62% | 1.41% | 1.71% | 1.49% | 1.47% |
Supplemental Data | | | | | |
Net assets, end of period (000 omitted) | $ 2,375,308 | $ 2,297,832 | $ 2,069,745 | $ 2,066,305 | $ 2,166,229 |
Portfolio turnover rate C | 23% | 57% | 44% | 41% | 51% |
A Total returns would have been lower if certain expenses had not been reduced during the applicable periods shown.
B Calculated based on average shares outstanding during the period.
C Amounts do not include the activity of the Underlying Funds.
D Amount represents less than .01%.
E Expense ratios reflect operating expenses of the Fund. Expenses before reductions do not reflect amounts reimbursed by the investment adviser or reductions from expense offset arrangements and do not represent the amount paid by the Fund during periods when reimbursements or reductions occur. Expenses net of fee waivers reflect expenses after reimbursement by the investment adviser but prior to reductions from expense offset arrangements. Expenses net of all reductions represent the net expenses paid by the Fund but do not include expenses of the underlying funds in which the Fund invests.
F Total distributions of $.18 per share is comprised of distributions from net investment income of $.167 and distributions from net realized gain of $.016 per share.
See accompanying notes which are an integral part of the financial statements.
Annual Report
Fidelity Freedom 2055 Fund
Investment Changes (Unaudited)
The information in the following tables is based on the direct investments of the Fund. |
Fund Holdings as of March 31, 2015 |
| % of fund's
net assets | % of fund's net assets
6 months ago |
Domestic Equity Funds | | |
Fidelity Series 100 Index Fund | 2.3 | 2.3 |
Fidelity Series 1000 Value Index Fund | 1.3 | 1.3 |
Fidelity Series All-Sector Equity Fund | 7.4 | 7.6 |
Fidelity Series Blue Chip Growth Fund | 5.8 | 6.6 |
Fidelity Series Commodity Strategy Fund | 0.8 | 1.0 |
Fidelity Series Equity-Income Fund | 9.6 | 9.8 |
Fidelity Series Growth & Income Fund | 7.4 | 7.6 |
Fidelity Series Growth Company Fund | 8.3 | 7.6 |
Fidelity Series Intrinsic Opportunities Fund | 5.0 | 4.9 |
Fidelity Series Opportunistic Insights Fund | 4.8 | 5.0 |
Fidelity Series Real Estate Equity Fund | 0.9 | 0.9 |
Fidelity Series Small Cap Discovery Fund | 1.3 | 1.2 |
Fidelity Series Small Cap Opportunities Fund | 4.1 | 3.8 |
Fidelity Series Stock Selector Large Cap Value Fund | 6.5 | 6.6 |
| 65.5 | 66.2 |
International Equity Funds | | |
Fidelity Series Emerging Markets Fund | 7.6 | 6.6 |
Fidelity Series International Growth Fund | 9.0 | 9.0 |
Fidelity Series International Small Cap Fund | 2.1 | 2.0 |
Fidelity Series International Value Fund | 8.9 | 8.9 |
| 27.6 | 26.5 |
Bond Funds | | |
Fidelity Series Emerging Markets Debt Fund | 0.6 | 0.6 |
Fidelity Series Floating Rate High Income Fund | 0.5 | 0.5 |
Fidelity Series High Income Fund | 3.3 | 4.4 |
Fidelity Series Inflation-Protected Bond Index Fund | 0.1 | 0.0 |
Fidelity Series Investment Grade Bond Fund | 0.5 | 0.5 |
Fidelity Series Real Estate Income Fund | 0.5 | 0.5 |
| 5.5 | 6.5 |
Short-Term Funds | | |
Fidelity Institutional Money Market Portfolio Institutional Class | 0.8 | 0.5 |
Fidelity Series Short-Term Credit Fund | 0.6 | 0.0 |
Fidelity Short-Term Bond Fund | 0.0 | 0.3 |
| 1.4 | 0.8 |
Net Other Assets (Liabilities)* | 0.0 | 0.0 |
| 100.0 | 100.0 |
* Amount represents less than 0.1% |
Asset Allocation (% of fund's net assets) |
Period end |
 | Domestic Equity Funds** | 65.5% | |
 | International Equity Funds | 27.6% | |
 | Bond Funds | 5.5% | |
 | Short-Term Funds | 1.4% | |

Six months ago |
 | Domestic Equity Funds** | 66.2% | |
 | International Equity Funds | 26.5% | |
 | Bond Funds | 6.5% | |
 | Short-Term Funds | 0.8% | |

** Includes Fidelity Series Commodity Strategy Fund which invests in commodity-related investments. |
Annual Report
Fidelity Freedom 2055 Fund
Investments March 31, 2015
Showing Percentage of Net Assets
Domestic Equity Funds - 65.5% |
| Shares | | Value |
Fidelity Series 100 Index Fund (c) | 897,542 | | $ 11,928,340 |
Fidelity Series 1000 Value Index Fund (c) | 606,718 | | 6,795,241 |
Fidelity Series All-Sector Equity Fund (c) | 2,768,830 | | 39,206,632 |
Fidelity Series Blue Chip Growth Fund (c) | 2,401,364 | | 30,665,419 |
Fidelity Series Commodity Strategy Fund (a)(c) | 649,419 | | 3,974,444 |
Fidelity Series Equity-Income Fund (c) | 4,024,726 | | 50,792,034 |
Fidelity Series Growth & Income Fund (c) | 2,878,033 | | 39,026,124 |
Fidelity Series Growth Company Fund (c) | 3,492,190 | | 43,931,745 |
Fidelity Series Intrinsic Opportunities Fund (c) | 1,723,898 | | 26,048,098 |
Fidelity Series Opportunistic Insights Fund (c) | 1,653,323 | | 25,510,768 |
Fidelity Series Real Estate Equity Fund (c) | 312,010 | | 4,683,274 |
Fidelity Series Small Cap Discovery Fund (c) | 613,373 | | 6,924,978 |
Fidelity Series Small Cap Opportunities Fund (c) | 1,558,456 | | 21,335,264 |
Fidelity Series Stock Selector Large Cap Value Fund (c) | 2,638,585 | | 34,275,216 |
TOTAL DOMESTIC EQUITY FUNDS (Cost $308,812,580) |
345,097,577
|
International Equity Funds - 27.6% |
| | | |
Fidelity Series Emerging Markets Fund (c) | 2,374,699 | | 40,369,885 |
Fidelity Series International Growth Fund (c) | 3,302,693 | | 47,525,753 |
Fidelity Series International Small Cap Fund (c) | 686,447 | | 10,893,920 |
Fidelity Series International Value Fund (c) | 4,624,137 | | 46,842,504 |
TOTAL INTERNATIONAL EQUITY FUNDS (Cost $139,999,604) |
145,632,062
|
Bond Funds - 5.5% |
| Shares | | Value |
Fidelity Series Emerging Markets Debt Fund (c) | 312,988 | | $ 3,039,112 |
Fidelity Series Floating Rate High Income Fund (c) | 256,172 | | 2,513,043 |
Fidelity Series High Income Fund (c) | 1,798,502 | | 17,625,324 |
Fidelity Series Inflation-Protected Bond Index Fund (c) | 54,175 | | 528,211 |
Fidelity Series Investment Grade Bond Fund (c) | 257,313 | | 2,977,111 |
Fidelity Series Real Estate Income Fund (c) | 222,205 | | 2,513,133 |
TOTAL BOND FUNDS (Cost $29,935,546) |
29,195,934
|
Short-Term Funds - 1.4% |
| | | |
Fidelity Institutional Money Market Portfolio Institutional Class 0.14% (b)(c) | 4,263,640 | | 4,263,640 |
Fidelity Series Short-Term Credit Fund (c) | 303,688 | | 3,039,920 |
TOTAL SHORT-TERM FUNDS (Cost $7,300,527) |
7,303,560
|
TOTAL INVESTMENT
PORTFOLIO - 100.0% (Cost $486,048,257) | | 527,229,133 |
NET OTHER ASSETS (LIABILITIES) - 0.0% | | 2,239 |
NET ASSETS - 100% | $ 527,231,372 |
Legend |
(a) Non-income producing |
(b) The rate quoted is the annualized seven-day yield of the fund at period end. |
(c) Affiliated Fund |
Affiliated Underlying Funds |
Information regarding the Fund's fiscal year to date purchases and sales of the affiliated Underlying Funds and income earned by the Fund from investments in affiliated Underlying Funds is as follows: |
Affiliate | Value,
beginning of
period | Purchases | Sales
Proceeds | Dividend
Income | Value,
end of
period |
Fidelity Institutional Money Market Portfolio Institutional Class | $ - | $ 4,677,944 | $ 414,304 | $ 1,897 | $ 4,263,640 |
Fidelity Series 100 Index Fund | 6,752,975 | 5,877,650 | 1,446,837 | 207,026 | 11,928,340 |
Fidelity Series 1000 Value Index Fund | 4,559,334 | 3,105,244 | 1,086,292 | 123,302 | 6,795,241 |
Fidelity Series All-Sector Equity Fund | 22,811,660 | 21,219,838 | 4,715,136 | 309,567 | 39,206,632 |
Fidelity Series Blue Chip Growth Fund | 22,349,823 | 13,783,592 | 10,274,400 | 56,132 | 30,665,419 |
Fidelity Series Commodity Strategy Fund | 3,559,161 | 2,150,375 | 445,907 | - | 3,974,444 |
Fidelity Series Emerging Markets Debt Fund | 2,363,975 | 1,133,016 | 321,558 | 150,072 | 3,039,112 |
Fidelity Series Emerging Markets Fund | 19,367,917 | 24,765,431 | 2,761,236 | 273,807 | 40,369,885 |
Fidelity Series Equity-Income Fund | 33,927,106 | 24,096,071 | 7,401,655 | 867,096 | 50,792,034 |
Fidelity Series Floating Rate High Income Fund | 35,333 | 3,106,535 | 498,499 | 64,002 | 2,513,043 |
Fidelity Series Growth & Income Fund | 25,757,262 | 17,828,498 | 5,918,664 | 514,962 | 39,026,124 |
Fidelity Series Growth Company Fund | 25,518,091 | 13,480,833 | 237,294 | 69,147 | 43,931,745 |
Fidelity Series High Income Fund | 23,275,226 | 7,242,289 | 11,375,122 | 1,091,769 | 17,625,324 |
Fidelity Series Inflation-Protected Bond Index Fund | - | 560,542 | 32,148 | 84 | 528,211 |
Fidelity Series International Growth Fund | 33,103,533 | 18,678,295 | 5,070,884 | 533,691 | 47,525,753 |
Fidelity Series International Small Cap Fund | 7,871,008 | 4,288,371 | 1,181,958 | 84,418 | 10,893,920 |
Fidelity Series International Value Fund | 33,456,859 | 21,729,138 | 4,733,928 | 1,663,317 | 46,842,504 |
Fidelity Series Intrinsic Opportunities Fund | 16,664,325 | 11,462,835 | 3,886,790 | 296,851 | 26,048,098 |
Fidelity Series Investment Grade Bond Fund | 7,777,380 | 5,181,507 | 10,110,194 | 125,222 | 2,977,111 |
Fidelity Series Opportunistic Insights Fund | 16,658,254 | 11,082,023 | 4,345,026 | - | 25,510,768 |
Fidelity Series Real Estate Equity Fund | 3,648,853 | 3,316,754 | 2,897,188 | 65,999 | 4,683,274 |
Fidelity Series Real Estate Income Fund | 1,006,887 | 1,735,141 | 222,138 | 103,204 | 2,513,133 |
Fidelity Series Short-Term Credit Fund | - | 3,036,887 | - | - | 3,039,920 |
Fidelity Series Small Cap Discovery Fund | 4,085,792 | 3,499,588 | 1,283,820 | 10,309 | 6,924,978 |
Fidelity Series Small Cap Opportunities Fund | 13,560,084 | 9,926,957 | 2,651,811 | 55,903 | 21,335,264 |
Fidelity Series Stock Selector Large Cap Value Fund | 22,536,321 | 16,227,327 | 5,292,054 | 396,519 | 34,275,216 |
Fidelity Short-Term Bond Fund | - | 3,191,840 | 3,197,920 | 12,316 | - |
Total | $ 350,647,159 | $ 256,384,521 | $ 91,802,763 | $ 7,076,612 | $ 527,229,133 |
Other Information |
All investments are categorized as Level 1 under the Fair Value Hierarchy. The inputs or methodology used for valuing securities may not be an indication of the risk associated with investing in those securities. For more information on valuation inputs, please refer to the Investment Valuation section in the accompanying Notes to Financial Statements. |
See accompanying notes which are an integral part of the financial statements.
Annual Report
Fidelity Freedom 2055 Fund
Statement of Assets and Liabilities
| March 31, 2015 |
| | |
Assets | | |
Investment in securities, at value (cost $486,048,257) - See accompanying schedule | | $ 527,229,133 |
Receivable for investments sold | | 754,660 |
Receivable for fund shares sold | | 2,062,192 |
Dividends receivable | | 2,238 |
Total assets | | 530,048,223 |
| | |
Liabilities | | |
Payable for investments purchased | $ 1,443,957 | |
Payable for fund shares redeemed | 1,372,894 | |
Total liabilities | | 2,816,851 |
| | |
Net Assets | | $ 527,231,372 |
Net Assets consist of: | | |
Paid in capital | | $ 476,730,697 |
Undistributed net investment income | | 420,767 |
Accumulated undistributed net realized gain (loss) on investments | | 8,899,032 |
Net unrealized appreciation (depreciation) on investments | | 41,180,876 |
Net Assets, for 43,724,750 shares outstanding | | $ 527,231,372 |
Net Asset Value, offering price and redemption price per share ($527,231,372 ÷ 43,724,750 shares) | | $ 12.06 |
Statement of Operations
| Year ended March 31, 2015 |
| | |
Investment Income | | |
Income distributions from underlying funds | | $ 7,076,612 |
| | |
Expenses | | |
Independent trustees' compensation | $ 1,786 | |
Total expenses before reductions | 1,786 | |
Expense reductions | (1,786) | - |
Net investment income (loss) | | 7,076,612 |
Realized and Unrealized Gain (Loss) Realized gain (loss) on sale of underlying fund shares | (337,160) | |
Capital gain distributions from underlying funds | 14,462,113 | |
Total net realized gain (loss) | | 14,124,953 |
Change in net unrealized appreciation (depreciation) on underlying funds | | 12,337,377 |
Net gain (loss) | | 26,462,330 |
Net increase (decrease) in net assets resulting from operations | | $ 33,538,942 |
See accompanying notes which are an integral part of the financial statements.
Annual Report
Statement of Changes in Net Assets
| Year ended
March 31,
2015 | Year ended
March 31,
2014 |
Increase (Decrease) in Net Assets | | |
Operations | | |
Net investment income (loss) | $ 7,076,612 | $ 3,524,634 |
Net realized gain (loss) | 14,124,953 | 13,989,943 |
Change in net unrealized appreciation (depreciation) | 12,337,377 | 19,631,328 |
Net increase (decrease) in net assets resulting from operations | 33,538,942 | 37,145,905 |
Distributions to shareholders from net investment income | (7,011,171) | (3,358,444) |
Distributions to shareholders from net realized gain | (13,050,953) | (8,053,803) |
Total distributions | (20,062,124) | (11,412,247) |
Share transactions
Proceeds from sales of shares | 340,009,147 | 282,840,215 |
Reinvestment of distributions | 20,046,206 | 11,402,617 |
Cost of shares redeemed | (196,948,054) | (124,471,168) |
Net increase (decrease) in net assets resulting from share transactions | 163,107,299 | 169,771,664 |
Total increase (decrease) in net assets | 176,584,117 | 195,505,322 |
| | |
Net Assets | | |
Beginning of period | 350,647,255 | 155,141,933 |
End of period (including undistributed net investment income of $420,767 and undistributed net investment income of $355,326, respectively) | $ 527,231,372 | $ 350,647,255 |
Other Information Shares | | |
Sold | 28,776,439 | 25,273,492 |
Issued in reinvestment of distributions | 1,718,872 | 1,001,008 |
Redeemed | (16,665,631) | (11,073,541) |
Net increase (decrease) | 13,829,680 | 15,200,959 |
Financial Highlights
Years ended March 31, | 2015 | 2014 | 2013 | 2012G |
Selected Per-Share Data | | | | |
Net asset value, beginning of period | $ 11.73 | $ 10.56 | $ 9.77 | $ 10.00 |
Income from Investment Operations | | | | |
Net investment income (loss) D | .19 | .16 | .20 | .13 |
Net realized and unrealized gain (loss) | .72 | 1.51 | .80 | (.12) |
Total from investment operations | .91 | 1.67 | 1.00 | .01 |
Distributions from net investment income | (.18) | (.14) | (.14) | (.11) |
Distributions from net realized gain | (.39) | (.36) | (.06) | (.13) |
Total distributions | (.58) J | (.50) | (.21) I | (.24) |
Net asset value, end of period | $ 12.06 | $ 11.73 | $ 10.56 | $ 9.77 |
Total ReturnB, C | 7.98% | 16.00% | 10.39% | .32% |
Ratios to Average Net Assets E,H | | | | |
Expenses before reductions F | .00% | .00% | .00% | .00%A |
Expenses net of fee waivers, if any | .00% | .00% | .00% | .00%A |
Expenses net of all reductions | .00% | .00% | .00% | .00%A |
Net investment income (loss) | 1.64% | 1.40% | 1.99% | 1.69%A |
Supplemental Data | | | | |
Net assets, end of period (000 omitted) | $ 527,231 | $ 350,647 | $ 155,142 | $ 20,978 |
Portfolio turnover rate E | 21% | 47% | 45% | 8%A |
A Annualized
B Total returns for periods of less than one year are not annualized.
C Total returns would have been lower if certain expenses had not been reduced during the applicable periods shown.
D Calculated based on average shares outstanding during the period.
E Amounts do not include the activity of the Underlying Funds.
F Amount represents less than .01%.
G For the period June 1, 2011 (commencement of operations) to March 31, 2012.
H Expense ratios reflect operating expenses of the Fund. Expenses before reductions do not reflect amounts reimbursed by the investment adviser or reductions from expense offset arrangements and do not represent the amount paid by the Fund during periods when reimbursements or reductions occur. Expense ratios before reductions for start-up periods may not be representative of longer term operating periods. Expenses net of fee waivers reflect expenses after reimbursement by the investment adviser but prior to reductions from expense offset arrangements. Expenses net of all reductions represent the net expenses paid by the Fund but do not include expenses of the underlying funds in which the Fund invests.
I Total distributions of $.21 per share is comprised of distributions from net investment income of $.141 and distributions from net realized gain of $.064 per share.
J Total distributions of $.58 per share is comprised of distributions from net investment income of $.184 and distributions from net realized gain of $.394 per share.
See accompanying notes which are an integral part of the financial statements.
Annual Report
Fidelity Freedom 2060 Fund
Investment Changes (Unaudited)
The information in the following tables is based on the direct investments of the Fund. |
Fund Holdings as of March 31, 2015 |
| % of fund's
net assets | % of fund's net assets
6 months ago |
Domestic Equity Funds | | |
Fidelity Series 100 Index Fund | 2.3 | 2.3 |
Fidelity Series 1000 Value Index Fund | 1.3 | 1.3 |
Fidelity Series All-Sector Equity Fund | 7.5 | 7.7 |
Fidelity Series Blue Chip Growth Fund | 5.9 | 6.5 |
Fidelity Series Commodity Strategy Fund | 0.8 | 1.0 |
Fidelity Series Equity-Income Fund | 9.9 | 9.9 |
Fidelity Series Growth & Income Fund | 7.5 | 7.6 |
Fidelity Series Growth Company Fund | 7.6 | 7.3 |
Fidelity Series Intrinsic Opportunities Fund | 5.1 | 4.9 |
Fidelity Series Opportunistic Insights Fund | 4.9 | 5.0 |
Fidelity Series Real Estate Equity Fund | 0.9 | 0.9 |
Fidelity Series Small Cap Discovery Fund | 1.3 | 1.3 |
Fidelity Series Small Cap Opportunities Fund | 4.0 | 3.9 |
Fidelity Series Stock Selector Large Cap Value Fund | 6.6 | 6.5 |
| 65.6 | 66.1 |
International Equity Funds | | |
Fidelity Series Emerging Markets Fund | 7.6 | 6.5 |
Fidelity Series International Growth Fund | 9.0 | 9.1 |
Fidelity Series International Small Cap Fund | 2.1 | 2.0 |
Fidelity Series International Value Fund | 8.9 | 9.2 |
| 27.6 | 26.8 |
Bond Funds | | |
Fidelity Series Emerging Markets Debt Fund | 0.5 | 0.6 |
Fidelity Series Floating Rate High Income Fund | 0.5 | 0.5 |
Fidelity Series High Income Fund | 3.3 | 4.3 |
Fidelity Series Inflation-Protected Bond Index Fund | 0.1 | 0.0 |
Fidelity Series Investment Grade Bond Fund | 0.5 | 0.5 |
Fidelity Series Real Estate Income Fund | 0.5 | 0.5 |
| 5.4 | 6.4 |
Short-Term Funds | | |
Fidelity Institutional Money Market Portfolio Institutional Class | 0.9 | 0.5 |
Fidelity Series Short-Term Credit Fund | 0.5 | 0.0 |
Fidelity Short-Term Bond Fund | 0.0 | 0.2 |
| 1.4 | 0.7 |
Net Other Assets (Liabilities)* | 0.0 | 0.0 |
| 100.0 | 100.0 |
* Amount represents less than 0.1% |
Asset Allocation (% of fund's net assets) |
Period end |
 | Domestic Equity Funds** | 65.6% | |
 | International Equity Funds | 27.6% | |
 | Bond Funds | 5.4% | |
 | Short-Term Funds | 1.4% | |

Six months ago |
 | Domestic Equity Funds** | 66.1% | |
 | International Equity Funds | 26.8% | |
 | Bond Funds | 6.4% | |
 | Short-Term Funds | 0.7% | |

** Includes Fidelity Series Commodity Strategy Fund which invests in commodity-related investments. |
Annual Report
Fidelity Freedom 2060 Fund
Investments March 31, 2015
Showing Percentage of Net Assets
Domestic Equity Funds - 65.6% |
| Shares | | Value |
Fidelity Series 100 Index Fund (c) | 15,641 | | $ 207,862 |
Fidelity Series 1000 Value Index Fund (c) | 10,515 | | 117,767 |
Fidelity Series All-Sector Equity Fund (c) | 47,686 | | 675,235 |
Fidelity Series Blue Chip Growth Fund (c) | 41,097 | | 524,806 |
Fidelity Series Commodity Strategy Fund (a)(c) | 11,928 | | 73,002 |
Fidelity Series Equity-Income Fund (c) | 69,856 | | 881,584 |
Fidelity Series Growth & Income Fund (c) | 49,750 | | 674,614 |
Fidelity Series Growth Company Fund (c) | 54,123 | | 680,865 |
Fidelity Series Intrinsic Opportunities Fund (c) | 29,985 | | 453,075 |
Fidelity Series Opportunistic Insights Fund (c) | 28,631 | | 441,774 |
Fidelity Series Real Estate Equity Fund (c) | 5,373 | | 80,643 |
Fidelity Series Small Cap Discovery Fund (c) | 10,548 | | 119,086 |
Fidelity Series Small Cap Opportunities Fund (c) | 26,402 | | 361,437 |
Fidelity Series Stock Selector Large Cap Value Fund (c) | 45,393 | | 589,650 |
TOTAL DOMESTIC EQUITY FUNDS (Cost $5,814,306) | 5,881,400 |
International Equity Funds - 27.6% |
| | | |
Fidelity Series Emerging Markets Fund (c) | 40,242 | | 684,113 |
Fidelity Series International Growth Fund (c) | 56,000 | | 805,839 |
Fidelity Series International Small Cap Fund (c) | 11,679 | | 185,351 |
Fidelity Series International Value Fund (c) | 78,932 | | 799,577 |
TOTAL INTERNATIONAL EQUITY FUNDS (Cost $2,453,856) | 2,474,880 |
Bond Funds - 5.4% |
| Shares | | Value |
Fidelity Series Emerging Markets Debt Fund (c) | 5,080 | | $ 49,324 |
Fidelity Series Floating Rate High Income Fund (c) | 4,369 | | 42,857 |
Fidelity Series High Income Fund (c) | 29,918 | | 293,195 |
Fidelity Series Inflation-Protected Bond Index Fund (c) | 1,115 | | 10,866 |
Fidelity Series Investment Grade Bond Fund (c) | 4,146 | | 47,966 |
Fidelity Series Real Estate Income Fund (c) | 3,778 | | 42,734 |
TOTAL BOND FUNDS (Cost $490,602) | 486,942 |
Short-Term Funds - 1.4% |
| | | |
Fidelity Institutional Money Market Portfolio Institutional Class 0.14% (b)(c) | 77,035 | | 77,035 |
Fidelity Series Short-Term Credit Fund (c) | 4,741 | | 47,454 |
TOTAL SHORT-TERM FUNDS (Cost $124,442) | 124,489 |
TOTAL INVESTMENT
PORTFOLIO - 100.0% (Cost $8,883,206) | | 8,967,711 |
NET OTHER ASSETS (LIABILITIES) - 0.0% | | 39 |
NET ASSETS - 100% | $ 8,967,750 |
Legend |
(a) Non-income producing |
(b) The rate quoted is the annualized seven-day yield of the fund at period end. |
(c) Affiliated Fund |
Affiliated Underlying Funds |
Information regarding the Fund's fiscal year to date purchases and sales of the affiliated Underlying Funds and income earned by the Fund from investments in affiliated Underlying Funds is as follows: |
Affiliate | Value,
beginning of
period | Purchases | Sales
Proceeds | Dividend
Income | Value,
end of
period |
Fidelity Institutional Money Market Portfolio Institutional Class | $ - | $ 80,588 | $ 3,552 | $ 17 | $ 77,035 |
Fidelity Series 100 Index Fund | - | 220,187 | 12,403 | 1,095 | 207,862 |
Fidelity Series 1000 Value Index Fund | - | 126,813 | 8,371 | 706 | 117,767 |
Fidelity Series All-Sector Equity Fund | - | 737,080 | 49,080 | 2,013 | 675,235 |
Fidelity Series Blue Chip Growth Fund | - | 591,718 | 92,994 | 193 | 524,806 |
Fidelity Series Commodity Strategy Fund | - | 86,644 | 7,377 | - | 73,002 |
Fidelity Series Emerging Markets Debt Fund | - | 51,368 | 1,703 | 591 | 49,324 |
Fidelity Series Emerging Markets Fund | - | 717,340 | 27,436 | 1,313 | 684,113 |
Fidelity Series Equity-Income Fund | - | 962,083 | 69,173 | 2,123 | 881,584 |
Fidelity Series Floating Rate High Income Fund | - | 44,816 | 1,566 | 395 | 42,857 |
Fidelity Series Growth & Income Fund | - | 716,129 | 45,763 | 1,150 | 674,614 |
Fidelity Series Growth Company Fund | - | 658,773 | - | 319 | 680,865 |
Fidelity Series High Income Fund | - | 312,017 | 14,689 | 3,769 | 293,195 |
Fidelity Series Inflation-Protected Bond Index Fund | - | 11,301 | 457 | 1 | 10,866 |
Fidelity Series International Growth Fund | - | 817,433 | 31,056 | 2,549 | 805,839 |
Fidelity Series International Small Cap Fund | - | 194,182 | 14,600 | 408 | 185,351 |
Fidelity Series International Value Fund | - | 832,555 | 28,890 | 7,931 | 799,577 |
Fidelity Series Intrinsic Opportunities Fund | - | 469,155 | 30,909 | 970 | 453,075 |
Fidelity Series Investment Grade Bond Fund | - | 71,607 | 23,918 | 246 | 47,966 |
Fidelity Series Opportunistic Insights Fund | - | 469,219 | 35,927 | - | 441,774 |
Fidelity Series Real Estate Equity Fund | - | 89,286 | 11,300 | 221 | 80,643 |
Fidelity Series Real Estate Income Fund | - | 44,121 | 1,495 | 500 | 42,734 |
Fidelity Series Short-Term Credit Fund | - | 47,407 | - | - | 47,454 |
Fidelity Series Small Cap Discovery Fund | - | 124,795 | 11,779 | 34 | 119,086 |
Fidelity Series Small Cap Opportunities Fund | - | 376,662 | 30,567 | 222 | 361,437 |
Fidelity Series Stock Selector Large Cap Value Fund | - | 638,365 | 40,705 | 2,624 | 589,650 |
Fidelity Short-Term Bond Fund | - | 48,706 | 48,770 | 91 | - |
Total | $ - | $ 9,540,350 | $ 644,480 | $ 29,481 | $ 8,967,711 |
Other Information |
All investments are categorized as Level 1 under the Fair Value Hierarchy. The inputs or methodology used for valuing securities may not be an indication of the risk associated with investing in those securities. For more information on valuation inputs, please refer to the Investment Valuation section in the accompanying Notes to Financial Statements. |
See accompanying notes which are an integral part of the financial statements.
Annual Report
Fidelity Freedom 2060 Fund
Statement of Assets and Liabilities
| March 31, 2015 |
| | |
Assets | | |
Investment in securities, at value (cost $8,883,206) - See accompanying schedule | | $ 8,967,711 |
Receivable for fund shares sold | | 98,244 |
Dividends receivable | | 33 |
Total assets | | 9,065,988 |
| | |
Liabilities | | |
Payable for investments purchased | $ 94,587 | |
Payable for fund shares redeemed | 3,651 | |
Total liabilities | | 98,238 |
| | |
Net Assets | | $ 8,967,750 |
Net Assets consist of: | | |
Paid in capital | | $ 8,818,067 |
Undistributed net investment income | | 4,970 |
Accumulated undistributed net realized gain (loss) on investments | | 60,208 |
Net unrealized appreciation (depreciation) on investments | | 84,505 |
Net Assets, for 858,478 shares outstanding | | $ 8,967,750 |
Net Asset Value, offering price and redemption price per share ($8,967,750 ÷ 858,478 shares) | | $ 10.45 |
Statement of Operations
| For the period August 5, 2014
(commencement of operations)
to March 31, 2015 |
| | |
Investment Income | | |
Income distributions from underlying funds | | $ 29,481 |
| | |
Expenses | | |
Independent trustees' compensation | $ 5 | |
Total expenses before reductions | 5 | |
Expense reductions | (5) | - |
Net investment income (loss) | | 29,481 |
Realized and Unrealized Gain (Loss) Realized gain (loss) on sale of underlying fund shares | (12,665) | |
Capital gain distributions from underlying funds | 88,973 | |
Total net realized gain (loss) | | 76,308 |
Change in net unrealized appreciation (depreciation) on underlying funds | | 84,505 |
Net gain (loss) | | 160,813 |
Net increase (decrease) in net assets resulting from operations | | $ 190,294 |
See accompanying notes which are an integral part of the financial statements.
Annual Report
Statement of Changes in Net Assets
| For the period
August 5, 2014
(commencement of
operations)
to March 31, 2015 |
Increase (Decrease) in Net Assets | |
Operations | |
Net investment income (loss) | $ 29,481 |
Net realized gain (loss) | 76,308 |
Change in net unrealized appreciation (depreciation) | 84,505 |
Net increase (decrease) in net assets resulting from operations | 190,294 |
Distributions to shareholders from net investment income | (24,511) |
Distributions to shareholders from net realized gain | (16,100) |
Total distributions | (40,611) |
Share transactions
Proceeds from sales of shares | 9,587,801 |
Reinvestment of distributions | 40,604 |
Cost of shares redeemed | (810,338) |
Net increase (decrease) in net assets resulting from share transactions | 8,818,067 |
Total increase (decrease) in net assets | 8,967,750 |
| |
Net Assets | |
Beginning of period | - |
End of period (including undistributed net investment income of $4,970) | $ 8,967,750 |
Other Information Shares | |
Sold | 933,332 |
Issued in reinvestment of distributions | 3,965 |
Redeemed | (78,819) |
Net increase (decrease) | 858,478 |
Financial Highlights
Year ended March 31, | 2015G |
Selected Per-Share Data | |
Net asset value, beginning of period | $ 10.00 |
Income from Investment Operations | |
Net investment income (loss) D | .10 |
Net realized and unrealized gain (loss) | .52 |
Total from investment operations | .62 |
Distributions from net investment income | (.10) |
Distributions from net realized gain | (.07) |
Total distributions | (.17) |
Net asset value, end of period | $ 10.45 |
Total ReturnB, C | 6.22% |
Ratios to Average Net AssetsE,H | |
Expenses before reductionsF | .00%A |
Expenses net of fee waivers, if any | .00%A |
Expenses net of all reductions | .00%A |
Net investment income (loss) | 1.54%A |
Supplemental Data | |
Net assets, end of period (000 omitted) | $ 8,968 |
Portfolio turnover rateE | 28%A |
A Annualized
B Total returns for periods of less than one year are not annualized.
C Total returns would have been lower if certain expenses had not been reduced during the applicable periods shown.
D Calculated based on average shares outstanding during the period.
E Amounts do not include the activity of the Underlying Funds.
F Amount represents less than .01%.
G For the period August 5, 2014 (commencement of operations) to March 31, 2015.
H Expense ratios reflect operating expenses of the Fund. Expenses before reductions do not reflect amounts reimbursed by the investment adviser or reductions from expense offset arrangements and do not represent the amount paid by the Fund during periods when reimbursements or reductions occur. Expense ratios before reductions for start-up periods may not be representative of longer term operating periods. Expenses net of fee waivers reflect expenses after reimbursement by the investment adviser but prior to reductions from expense offset arrangements. Expenses net of all reductions represent the net expenses paid by the Fund but do not include expenses of the underlying funds in which the Fund invests.
See accompanying notes which are an integral part of the financial statements.
Annual Report
For the period ended March 31, 2015
1. Organization.
Freedom Income Fund, Freedom 2005 Fund, Freedom 2010 Fund, Freedom 2015 Fund, Freedom 2020 Fund, Freedom 2025 Fund, Freedom 2030 Fund, Freedom 2035 Fund, Freedom 2040 Fund, Freedom 2045 Fund, Freedom 2050 Fund, Freedom 2055 Fund and Freedom 2060 Fund (the Funds) are funds of Fidelity Aberdeen Street Trust (the Trust). The Trust is registered under the Investment Company Act of 1940, as amended (the 1940 Act), as an open-end management investment company organized as a Delaware statutory trust. Each Fund is authorized to issue an unlimited number of shares. Share transactions on the Statement of Changes in Net Assets may contain exchanges between funds. The Funds invest primarily in a combination of other Fidelity equity, bond, and short-term funds (the Underlying Funds) managed by Fidelity Management & Research Company (FMR).
2. Significant Accounting Policies.
The financial statements have been prepared in conformity with accounting principles generally accepted in the United States of America (GAAP), which require management to make certain estimates and assumptions at the date of the financial statements. Actual results could differ from those estimates. Subsequent events, if any, through the date that the financial statements were issued have been evaluated in the preparation of the financial statements. The following summarizes the significant accounting policies of the Funds:
Investment Valuation. Investments are valued as of 4:00 p.m. Eastern time on the last calendar day of the period. Each Fund categorizes the inputs to valuation techniques used to value its investments into a disclosure hierarchy consisting of three levels as shown below:
Level 1 - quoted prices in active markets for identical investments
Level 2 - other significant observable inputs (including quoted prices for similar investments, interest rates, prepayment speeds, etc.)
Level 3 - unobservable inputs (including the Fund's own assumptions based on the best information available)
Valuation techniques used to value each Fund's investments by major category are as follows. Investments in the Underlying Funds are valued at their closing net asset value (NAV) each business day and are categorized as Level 1 in the hierarchy.
Investment Transactions and Income. For financial reporting purposes, the Funds' investment holdings and NAV include trades executed through the end of the last business day of the period. The NAV per share for processing shareholder transactions is calculated as of the close of business of the New York Stock Exchange (NYSE), normally 4:00 p.m. Eastern time and includes trades executed through the end of the prior business day. Gains and losses on securities sold are determined on the basis of identified cost. Income and capital gain distributions from the Underlying Funds, if any, are recorded on the ex-dividend date.
Expenses. Expenses directly attributable to a fund are charged to that fund. Expenses attributable to more than one fund are allocated among the respective funds on the basis of relative net assets or other appropriate methods. Expenses included in the accompanying financial statements reflect the expenses of each Fund and do not include any expenses associated with the Underlying Funds. Although not included in each Fund's expenses, each Fund indirectly bears its proportionate share of the Underlying Funds' expenses through the impact of these expenses on each Underlying Fund's NAV. Expense estimates are accrued in the period to which they relate and adjustments are made when actual amounts are known.
Deferred Trustee Compensation. Under a Deferred Compensation Plan (the Plan) for Freedom 2010 Fund, Freedom 2020 Fund and Freedom 2030 Fund, independent Trustees may elect to defer receipt of a portion of their annual compensation. Deferred amounts are invested in a cross-section of Fidelity funds, are marked-to-market and remain in the Fund until distributed in accordance with the Plan. The investment of deferred amounts and the offsetting payable to the Trustees are included in the accompanying Statement of Assets and Liabilities.
Income Tax Information and Distributions to Shareholders. Each year, each Fund intends to qualify as a regulated investment company under Subchapter M of the Internal Revenue Code, including distributing substantially all of its taxable income and realized gains. As a result, no provision for U.S. Federal income taxes is required. As of March 31, 2015, each Fund did not have any unrecognized tax benefits in the financial statements; nor is each Fund aware of any tax positions for which it is reasonably possible that the total amounts of unrecognized tax benefits will significantly change in the next twelve months. Each Fund files a U.S. federal tax return, in addition to state and local tax returns as required. Each Fund's federal income tax returns are subject to examination by the Internal Revenue Service (IRS) for a period of three fiscal years after they are filed. State and local tax returns may be subject to examination for an additional fiscal year depending on the jurisdiction.
Distributions are declared and recorded on the ex-dividend date. Income and capital gain distributions are determined in accordance with income tax regulations, which may differ from GAAP.
Capital accounts within the financial statements are adjusted for permanent book-tax differences. These adjustments have no impact on net assets or the results of operations. Capital accounts are not adjusted for temporary book-tax differences which will reverse in a subsequent period.
Book-tax differences are primarily due to the short-term gain distributions from the Underlying Funds, deferred trustees compensation and losses deferred due to wash sales.
Annual Report
Notes to Financial Statements - continued
2. Significant Accounting Policies - continued
Income Tax Information and Distributions to Shareholders - continued
The federal tax cost of investment securities and unrealized appreciation (depreciation) as of period end were as follows for each Fund:
| Tax cost | Gross unrealized
appreciation | Gross unrealized
depreciation | Net unrealized
appreciation
(depreciation) on
securities |
Freedom Income | $ 2,302,075,205 | $ 198,575,010 | $ (16,956,463) | $ 181,618,547 |
Freedom 2005 | 614,064,807 | 35,813,136 | (10,181,932) | 25,631,204 |
Freedom 2010 | 4,580,738,938 | 419,661,008 | (59,924,806) | 359,736,202 |
Freedom 2015 | 5,440,749,224 | 662,508,004 | (47,181,149) | 615,326,855 |
Freedom 2020 | 11,483,199,452 | 1,492,475,359 | (106,900,504) | 1,385,574,855 |
Freedom 2025 | 7,953,327,946 | 1,162,867,692 | (61,565,323) | 1,101,302,369 |
Freedom 2030 | 9,456,378,755 | 1,508,523,748 | (81,285,849) | 1,427,237,899 |
Freedom 2035 | 5,387,077,960 | 950,607,761 | (48,362,687) | 902,245,074 |
Freedom 2040 | 5,885,099,198 | 1,064,035,401 | (47,969,652) | 1,016,065,749 |
Freedom 2045 | 2,498,782,411 | 517,315,105 | (22,183,049) | 495,132,056 |
Freedom 2050 | 1,971,408,190 | 420,987,952 | (17,094,839) | 403,893,113 |
Freedom 2055 | 487,250,831 | 45,763,296 | (5,784,994) | 39,978,302 |
Freedom 2060 | 8,896,746 | 166,672 | (95,707) | 70,965 |
The tax-based components of distributable earnings as of period end were as follows for each Fund:
| Undistributed
ordinary income | Undistributed
long-term
capital gain | Net unrealized
appreciation
(depreciation) on
securities and other investments |
Freedom Income | $ 4,036,479 | $ 20,776,462 | $ 181,618,547 |
Freedom 2005 | 1,996,291 | 6,235,404 | 25,631,204 |
Freedom 2010 | 15,176,695 | 78,061,421 | 359,736,202 |
Freedom 2015 | 15,166,328 | 106,604,421 | 615,326,855 |
Freedom 2020 | 35,086,417 | 233,817,756 | 1,385,574,855 |
Freedom 2025 | 22,246,106 | 173,481,709 | 1,101,302,369 |
Freedom 2030 | 19,749,367 | 246,579,852 | 1,427,237,899 |
Freedom 2035 | 8,904,852 | 142,631,611 | 902,245,074 |
Freedom 2040 | 8,882,105 | 167,397,600 | 1,016,065,749 |
Freedom 2045 | 4,462,905 | 66,943,573 | 495,132,056 |
Freedom 2050 | 3,932,655 | 54,935,476 | 403,893,113 |
Freedom 2055 | 840,431 | 9,681,942 | 39,978,302 |
Freedom 2060 | 11,420 | 67,297 | 70,965 |
The tax character of distributions paid was as follows:
March 31, 2015 | Ordinary Income | Long-term
Capital Gains | Total |
Freedom Income | $ 53,231,215 | $ 56,638,680 | $ 109,869,895 |
Freedom 2005 | 15,685,902 | 5,032,619 | 20,718,521 |
Freedom 2010 | 131,944,034 | 84,508,095 | 216,452,129 |
Freedom 2015 | 185,342,090 | 192,393,071 | 377,735,161 |
Freedom 2020 | 397,060,719 | 483,340,899 | 880,401,618 |
Freedom 2025 | 262,539,268 | 332,793,847 | 595,333,115 |
Freedom 2030 | 292,676,448 | 407,591,179 | 700,267,627 |
Freedom 2035 | 182,021,849 | 255,414,575 | 437,436,424 |
Freedom 2040 | 218,541,691 | 289,343,213 | 507,884,904 |
Freedom 2045 | 84,658,690 | 193,893,467 | 278,552,157 |
Freedom 2050 | 68,766,576 | 152,607,376 | 221,373,952 |
Freedom 2055 | 13,286,592 | 6,775,532 | 20,062,124 |
Freedom 2060 | 38,689 | 1,922 | 40,611 |
Annual Report
2. Significant Accounting Policies - continued
Income Tax Information and Distributions to Shareholders - continued
March 31, 2014 | Ordinary Income | Long-term
Capital Gains | Total |
Freedom Income | $ 42,425,460 | $ 46,002,644 | $ 88,428,104 |
Freedom 2000 | 18,496,879 | 17,410,601 | 35,907,480 |
Freedom 2005 | 14,571,042 | - | 14,571,042 |
Freedom 2010 | 134,814,862 | - | 134,814,862 |
Freedom 2015 | 168,278,021 | 63,372,412 | 231,650,433 |
Freedom 2020 | 367,800,832 | 134,407,793 | 502,208,625 |
Freedom 2025 | 249,715,948 | 134,037,012 | 383,752,960 |
Freedom 2030 | 333,395,841 | 8,104,830 | 341,500,671 |
Freedom 2035 | 185,729,589 | 159,257,077 | 344,986,666 |
Freedom 2040 | 219,071,348 | 127,618,696 | 346,690,044 |
Freedom 2045 | 85,329,537 | 132,615,588 | 217,945,125 |
Freedom 2050 | 70,130,892 | 72,768,080 | 142,898,972 |
Freedom 2055 | 8,125,979 | 3,286,268 | 11,412,247 |
New Accounting Pronouncement. In June 2014, the Financial Accounting Standards Board issued Accounting Standard Update No. 2014-11, Repurchase-to-Maturity Transactions, Repurchase Financings, and Disclosures (the Update). The Update amends the accounting for certain repurchase agreements and expands disclosure requirements for reverse repurchase agreements, securities lending and other similar transactions. The disclosure requirements are effective for annual and interim reporting periods beginning after December 15, 2014. Management is currently evaluating the impact of the Update on the Funds' financial statements and related disclosures.
3. Purchases and Redemptions of Underlying Fund Shares.
Purchases and redemptions of the Underlying Fund shares and in-kind transactions, other than securities acquired in the merger, are noted in the table below.
| Purchases ($) | Redemptions ($) |
Freedom Income | 600,751,944 | 886,275,142 |
Freedom 2005 | 152,225,371 | 193,449,163 |
Freedom 2010 | 927,934,544 | 1,516,831,839 |
Freedom 2015 | 1,112,615,300 | 1,588,115,669 |
Freedom 2020 | 2,175,832,170 | 2,973,826,299 |
Freedom 2025 | 1,704,975,063 | 1,748,852,859 |
Freedom 2030 | 1,816,894,667 | 2,170,158,678 |
Freedom 2035 | 1,111,893,685 | 1,182,677,130 |
Freedom 2040 | 1,157,353,709 | 1,472,494,076 |
Freedom 2045 | 645,819,163 | 620,283,508 |
Freedom 2050 | 557,147,275 | 547,333,263 |
Freedom 2055 | 256,384,521 | 91,802,763 |
Freedom 2060 | 9,540,350 | 644,480 |
4. Fees and Other Transactions with Affiliates.
Management Fee. Strategic Advisers, Inc. (the investment adviser), an affiliate of FMR, provides the Funds with investment management related services. The Funds do not pay any fees for these services.
Other Transactions. The investment adviser has entered into an administration agreement with FMR under which FMR provides management and administrative services (other than investment advisory services) necessary for the operation of each Fund. Pursuant to this agreement, FMR pays all expenses of each Fund, excluding compensation of the independent Trustees and certain other expenses such as interest expense. FMR also contracts with other Fidelity companies to perform the services necessary for the operation of each Fund. The Funds do not pay any fees for these services.
Reallocation of Underlying Fund Investments. During the period, the investment adviser reallocated investments of the Funds. This involved taxable redemptions of the Funds' interest in Fidelity Short-Term Bond Fund, ("selected Underlying Fund") for investments and non-taxable exchanges of those investments for shares of Fidelity Series Short-Term Credit Fund which is an affiliated investment company managed by FMR. Realized gains and losses on the redemptions of the selected Underlying Fund in connection with the reallocation are included in the accompanying Statements of Operations as "Realized gain (loss) on sale of underlying fund shares."
Annual Report
Notes to Financial Statements - continued
4. Fees and Other Transactions with Affiliates - continued
Reallocation of Underlying Fund Investments - continued
Details of these transactions with the related gain (loss) for the Funds are presented in the accompanying table:
| Value of Investments
reallocated | Realized Gain (Loss)
on redemptions
of selected
Underlying Fund |
Freedom Income | $ 258,853,958 | $ 1,860,398 |
Freedom 2005 | 40,826,804 | (801,590) |
Freedom 2010 | 202,606,729 | (3,238,234) |
Freedom 2015 | 132,512,618 | 1,271,592 |
Freedom 2020 | 191,126,713 | 2,375,657 |
Freedom 2025 | 96,757,886 | 254,043 |
Freedom 2030 | 58,542,470 | 115,930 |
Freedom 2035 | 36,728,752 | 66,779 |
Freedom 2040 | 41,465,546 | 75,371 |
Freedom 2045 | 17,187,599 | 31,717 |
Freedom 2050 | 13,583,990 | 25,009 |
Freedom 2055 | 3,032,427 | 6,269 |
Freedom 2060 | 46,913 | 67 |
Other. During the period the following Funds were reimbursed by the investment adviser for certain losses:
| Amount |
Freedom Income | $ 73 |
Freedom 2005 | 315 |
Freedom 2010 | 225 |
Freedom 2015 | 1,985 |
Freedom 2020 | 1,475 |
Freedom 2030 | 1,150 |
Freedom 2035 | 3,116 |
5. Expense Reductions.
FMR voluntarily agreed to reimburse each Fund's operating expenses. Some expenses, for example interest expense, are excluded from this reimbursement.
The following Funds were in reimbursement during the period:
Freedom Income | $ 10,206 |
Freedom 2005 | 2,836 |
Freedom 2010 | 22,558 |
Freedom 2015 | 26,893 |
Freedom 2020 | 56,625 |
Freedom 2025 | 38,342 |
Freedom 2030 | 46,834 |
Freedom 2035 | 26,662 |
Freedom 2040 | 29,988 |
Freedom 2045 | 12,592 |
Freedom 2050 | 10,089 |
Freedom 2055 | 1,786 |
Freedom 2060 | 5 |
6. Merger Information.
On July 25, 2014, the Fidelity Freedom Income Fund acquired all of the assets and assumed all of the liabilities of Fidelity Freedom 2000 Fund ("Target Fund") pursuant to an Agreement and Plan of Reorganization approved by the Board of Trustees ("The Board") on May 14, 2014. The acquisition was accomplished by an exchange of shares of the Fidelity Freedom Income Fund for corresponding shares then outstanding of the Target Fund at its net asset value on the acquisition date. The reorganization provides shareholders of the Target Fund access to a larger portfolio with a similar investment
Annual Report
6. Merger Information - continued
objective. The reorganization qualified as a tax-free reorganization for federal income tax purposes with no gain or loss recognized to the fund or its shareholders. The Target Fund's net assets of $811,551,284, including securities of $810,744,529 and unrealized appreciation of $60,799,908, were combined with the Fidelity Freedom Income Fund's net assets of $1,890,950,497 for total net assets after the acquisition of $2,702,501,781.
Pro forma results of operations of the combined entity for the entire period ended March 31, 2015, as though the acquisition had occurred as of the beginning of the year (rather than on the actual acquisition dates), are as follows:
Net investment income (loss) | $ 45,878,080 |
Total net realized gain (loss) | 39,593,702 |
Total change in net unrealized appreciation (depreciation) | 24,209,434 |
Net increase (decrease) in net assets resulting from operations | $ 109,681,216 |
Because the combined investment portfolios have been managed as a single portfolio since the acquisitions were completed, it is not practicable to separate the amounts of revenue and earnings of the acquired fund that have been included in the Fidelity Freedom Income Fund's accompanying Statement of Operations since July 25, 2014.
7. Other.
The Funds' organizational documents provide former and current trustees and officers with a limited indemnification against liabilities arising in connection with the performance of their duties to the Funds. In the normal course of business, the Funds may also enter into contracts that provide general indemnifications. The Funds' maximum exposure under these arrangements is unknown as this would be dependent on future claims that may be made against the Funds. The risk of material loss from such claims is considered remote.
The Funds do not invest in the Underlying Funds for the purpose of exercising management or control; however, investments by the Funds within their principal investment strategies may represent a significant portion of the Underlying Fund's net assets. At the end of the period, the following Funds were the owners of record of 10% or more of the total outstanding shares of the Underlying Funds.
Fund | Freedom Income | Freedom 2010 | Freedom 2020 |
Fidelity Series Inflation-Protected Bond Index Fund | - | 11% | - |
Fidelity Series Investment Grade Bond Fund | - | - | 13% |
Fidelity Series Short-Term Credit Fund | 11% | - | - |
The Funds, in aggregate, were the owners of record of more than 20% of the total outstanding shares of the following Underlying Funds.
Fund | % of shares held |
Fidelity Series 100 Index Fund | 34% |
Fidelity Series 1000 Value Index Fund | 36% |
Fidelity Series All-Sector Equity Fund | 36% |
Fidelity Series Blue Chip Growth Fund | 41% |
Fidelity Series Commodity Strategy Fund | 31% |
Fidelity Series Emerging Markets Debt Fund | 37% |
Fidelity Series Emerging Markets Fund | 37% |
Fidelity Series Equity-Income Fund | 41% |
Fidelity Series Floating Rate High Income Fund | 37% |
Fidelity Series Growth & Income Fund | 41% |
Fidelity Series Growth Company Fund | 41% |
Fidelity Series High Income Fund | 35% |
Fidelity Series Inflation-Protected Bond Index Fund | 39% |
Fidelity Series International Growth Fund | 36% |
Fidelity Series International Small Cap Fund | 36% |
Fidelity Series International Value Fund | 36% |
Fidelity Series Intrinsic Opportunities Fund | 41% |
Fidelity Series Investment Grade Bond Fund | 41% |
Fidelity Series Opportunistic Insights Fund | 41% |
Fidelity Series Real Estate Equity Fund | 36% |
Fidelity Series Real Estate Income Fund | 37% |
Fidelity Series Short-Term Credit Fund | 47% |
Fidelity Series Small Cap Discovery Fund | 40% |
Fidelity Series Small Cap Opportunities Fund | 36% |
Fidelity Series Stock Selector Large Cap Value Fund | 41% |
Annual Report
To the Trustees of Fidelity Aberdeen Street Trust and the Shareholders of Fidelity Freedom Income Fund, Fidelity Freedom 2005 Fund, Fidelity Freedom 2010 Fund, Fidelity Freedom 2015 Fund, Fidelity Freedom 2020 Fund, Fidelity Freedom 2025 Fund, Fidelity Freedom 2030 Fund, Fidelity Freedom 2035 Fund, Fidelity Freedom 2040 Fund, Fidelity Freedom 2045 Fund, Fidelity Freedom 2050 Fund, Fidelity Freedom 2055 Fund and Fidelity Freedom 2060 Fund:
In our opinion, the accompanying statements of assets and liabilities, including the schedules of investments, and the related statements of operations and of changes in net assets and the financial highlights present fairly, in all material respects, the financial positions of Fidelity Freedom Income Fund, Fidelity Freedom 2005 Fund, Fidelity Freedom 2010 Fund, Fidelity Freedom 2015 Fund, Fidelity Freedom 2020 Fund, Fidelity Freedom 2025 Fund, Fidelity Freedom 2030 Fund, Fidelity Freedom 2035 Fund, Fidelity Freedom 2040 Fund, Fidelity Freedom 2045 Fund, Fidelity Freedom 2050 Fund, Fidelity Freedom 2055 Fund and Fidelity Freedom 2060 Fund (funds of Fidelity Aberdeen Street Trust) at March 31, 2015, the results of each of their operations for the periods indicated, the changes in each of their net assets for each of the periods indicated and the financial highlights for each of the periods indicated, in conformity with accounting principles generally accepted in the United States of America. These financial statements and financial highlights (hereafter referred to as "financial statements") are the responsibility of the Fidelity Aberdeen Street Trust's management. Our responsibility is to express an opinion on these financial statements based on our audits. We conducted our audits of these financial statements in accordance with the standards of the Public Company Accounting Oversight Board (United States). Those standards require that we plan and perform the audit to obtain reasonable assurance about whether the financial statements are free of material misstatement. An audit includes examining, on a test basis, evidence supporting the amounts and disclosures in the financial statements, assessing the accounting principles used and significant estimates made by management, and evaluating the overall financial statement presentation. We believe that our audits, which included confirmation of securities at March 31, 2015 by correspondence with the custodian and brokers, provide a reasonable basis for our opinion.
PricewaterhouseCoopers LLP
Boston, Massachusetts
May 21, 2015
Annual Report
The Trustees, Member of the Advisory Board, and officers of the trust and funds, as applicable, are listed below. The Board of Trustees governs each Fidelity Freedom® Fund and is responsible for protecting the interests of shareholders. The Trustees are experienced executives who meet periodically throughout the year to oversee each Fidelity Freedom® Fund's activities, review contractual arrangements with companies that provide services to each Fidelity Freedom Fund, oversee management of the risks associated with such activities and contractual arrangements, and review each Fidelity Freedom Fund's performance. If the interests of a Fidelity Freedom Fund and an underlying Fidelity fund were to diverge, a conflict of interest could arise and affect how the Trustees and Member of the Advisory Board fulfill their fiduciary duties to the affected funds. Strategic Advisers has structured the Fidelity Freedom Funds to avoid these potential conflicts, although there may be situations where a conflict of interest is unavoidable. In such instances, Strategic Advisers, the Trustees, and Member of the Advisory Board would take reasonable steps to minimize and, if possible, eliminate the conflict. Except for Elizabeth S. Acton and John Engler, each of the Trustees oversees 235 funds. Ms. Acton and Mr. Engler each oversees 217 funds.
The Trustees hold office without limit in time except that (a) any Trustee may resign; (b) any Trustee may be removed by written instrument, signed by at least two-thirds of the number of Trustees prior to such removal; (c) any Trustee who requests to be retired or who has become incapacitated by illness or injury may be retired by written instrument signed by a majority of the other Trustees; and (d) any Trustee may be removed at any special meeting of shareholders by a two-thirds vote of the outstanding voting securities of the trust. Each Trustee who is not an interested person (as defined in the 1940 Act) of the trust and the funds (Independent Trustee), shall retire not later than the last day of the month in which his or her 75th birthday occurs. The Independent Trustees may waive this mandatory retirement age policy with respect to individual Trustees. The officers and Advisory Board Member hold office without limit in time, except that any officer and Advisory Board Member may resign or may be removed by a vote of a majority of the Trustees at any regular meeting or any special meeting of the Trustees. Except as indicated, each individual has held the office shown or other offices in the same company for the past five years.
Experience, Skills, Attributes, and Qualifications of the Funds' Trustees. The Governance and Nominating Committee has adopted a statement of policy that describes the experience, qualifications, attributes, and skills that are necessary and desirable for potential Independent Trustee candidates (Statement of Policy). The Board believes that each Trustee satisfied at the time he or she was initially elected or appointed a Trustee, and continues to satisfy, the standards contemplated by the Statement of Policy. The Governance and Nominating Committee also engages professional search firms to help identify potential Independent Trustee candidates who have the experience, qualifications, attributes, and skills consistent with the Statement of Policy. From time to time, additional criteria based on the composition and skills of the current Independent Trustees, as well as experience or skills that may be appropriate in light of future changes to board composition, business conditions, and regulatory or other developments, have also been considered by the professional search firms and the Governance and Nominating Committee. In addition, the Board takes into account the Trustees' commitment and participation in Board and committee meetings, as well as their leadership of standing and ad hoc committees throughout their tenure.
In determining that a particular Trustee was and continues to be qualified to serve as a Trustee, the Board has considered a variety of criteria, none of which, in isolation, was controlling. The Board believes that, collectively, the Trustees have balanced and diverse experience, qualifications, attributes, and skills, which allow the Board to operate effectively in governing each fund and protecting the interests of shareholders. Information about the specific experience, skills, attributes, and qualifications of each Trustee, which in each case led to the Board's conclusion that the Trustee should serve (or continue to serve) as a trustee of the funds, is provided below.
Board Structure and Oversight Function. Abigail P. Johnson is an interested person (as defined in the 1940 Act) and currently serves as Chairman. The Trustees have determined that an interested Chairman is appropriate and benefits shareholders because an interested Chairman has a personal and professional stake in the quality and continuity of services provided to the funds. Independent Trustees exercise their informed business judgment to appoint an individual of their choosing to serve as Chairman, regardless of whether the Trustee happens to be independent or a member of management. The Independent Trustees have determined that they can act independently and effectively without having an Independent Trustee serve as Chairman and that a key structural component for assuring that they are in a position to do so is for the Independent Trustees to constitute a substantial majority for the Board. The Independent Trustees also regularly meet in executive session. Albert R. Gamper, Jr. serves as Chairman of the Independent Trustees and as such (i) acts as a liaison between the Independent Trustees and management with respect to matters important to the Independent Trustees and (ii) with management prepares agendas for Board meetings.
Fidelity funds are overseen by different Boards of Trustees. The funds' Board oversees Fidelity's investment-grade bond, money market, and asset allocation funds and other Boards oversee Fidelity's equity and high income funds. The asset allocation funds may invest in Fidelity funds that are overseen by such other Boards. The use of separate Boards, each with its own committee structure, allows the Trustees of each group of Fidelity funds to focus on the unique issues of the funds they oversee, including common research, investment, and operational issues. On occasion, the separate Boards establish joint committees to address issues of overlapping consequences for the Fidelity funds overseen by each Board.
The Trustees operate using a system of committees to facilitate the timely and efficient consideration of all matters of importance to the Trustees, each fund, and fund shareholders and to facilitate compliance with legal and regulatory requirements and oversight of the funds' activities and associated risks. The Board, acting through its committees, has charged FMR and its affiliates with (i) identifying events or circumstances the occurrence of which could have demonstrably adverse effects on the funds' business and/or reputation; (ii) implementing processes and controls to lessen the possibility that such events or circumstances occur or to mitigate the effects of such events or circumstances if they do occur; and (iii) creating and maintaining a system designed to evaluate continuously business and market conditions in order to facilitate the identification and implementation processes described in (i) and (ii) above. Because the day-to-day operations and activities of the funds are carried out by or through FMR, its affiliates, and other service providers, the funds' exposure to risks is mitigated but not eliminated by the processes overseen by the Trustees. While each of the Board's committees has responsibility for overseeing different aspects of the funds' activities, oversight is exercised primarily through the Operations and Audit Committees. In addition, an ad hoc Board committee of Independent Trustees has worked with FMR to enhance the Board's oversight of investment and financial risks, legal and regulatory risks, technology risks, and operational risks, including the development of additional risk reporting to the Board. Appropriate personnel, including but not limited to the funds' Chief Compliance Officer (CCO), FMR's internal auditor, the independent accountants, the funds' Treasurer and portfolio management personnel, make periodic reports to the Board's committees, as appropriate, including an annual review of FMR's risk management program for the Fidelity funds. The responsibilities of each standing committee, including their oversight responsibilities, are described further under "Standing Committees of the Funds' Trustees."
Annual Report
The funds' Statement of Additional Information (SAI) includes more information about the Trustees. To request a free copy, call Fidelity at 1-800-544-8544.
Interested Trustee*:
Correspondence intended for the Trustee who is an interested person may be sent to Fidelity Investments, 245 Summer Street, Boston, Massachusetts 02210.
Name, Year of Birth; Principal Occupations and Other Relevant Experience+ |
Abigail P. Johnson (1961) |
Year of Election or Appointment: 2009 Trustee Chairman of the Board of Trustees |
| Ms. Johnson also serves as Trustee of other Fidelity funds. Ms. Johnson serves as President (2013-present) and Chief Executive Officer (2014-present) of FMR LLC (diversified financial services company), President of Fidelity Financial Services (2012-present) and President of Personal, Workplace and Institutional Services (2005-present). Ms. Johnson is Chairman and Director of FMR Co., Inc. (investment adviser firm, 2011-present), Chairman and Director of FMR (investment adviser firm, 2011-present), and the Vice Chairman and Director (2007-present) of FMR LLC. Previously, Ms. Johnson served as President and a Director of FMR (2001-2005), a Trustee of other investment companies advised by FMR, Fidelity Investments Money Management, Inc. (investment adviser firm), and FMR Co., Inc. (2001-2005), Senior Vice President of the Fidelity funds (2001-2005), and managed a number of Fidelity funds. Ms. Abigail P. Johnson and Mr. Arthur E. Johnson are not related. |
* Trustee has been determined to be an "Interested Trustee" by virtue of, among other things, her affiliation with the trust or various entities under common control with FMR.
+ The information above includes the Trustee's principal occupation during the last five years and other information relating to the experience, attributes, and skills relevant to the Trustee's qualifications to serve as a Trustee, which led to the conclusion that the Trustee should serve as a Trustee for each fund.
Independent Trustees:
Correspondence intended for each Independent Trustee (that is, the Trustees other than the Interested Trustee) may be sent to Fidelity Investments, P.O. Box 55235, Boston, Massachusetts 02205-5235.
Name, Year of Birth; Principal Occupations and Other Relevant Experience+ |
Elizabeth S. Acton (1951) |
Year of Election or Appointment: 2013 Trustee |
| Ms. Acton also serves as Trustee or Member of the Advisory Board of other Fidelity funds. Prior to her retirement in April 2012, Ms. Acton was Executive Vice President, Finance (2011-2012), Executive Vice President, Chief Financial Officer (2002-2011), and Treasurer (2004-2005) of Comerica Incorporated (financial services). Prior to joining Comerica, Ms. Acton held a variety of positions at Ford Motor Company (1983-2002), including Vice President and Treasurer (2000-2002) and Executive Vice President and Chief Financial Officer of Ford Motor Credit Company (1998-2000). Ms. Acton currently serves as a member of the Board of Directors and Audit and Finance Committees of Beazer Homes USA, Inc. (homebuilding, 2012-present). |
John Engler (1948) |
Year of Election or Appointment: 2014 Trustee |
| Mr. Engler also serves as Trustee or Member of the Advisory Board of other Fidelity funds. He serves as president of the Business Roundtable (2011-present), and on the board of directors/trustees for Universal Forest Products (manufacturer and distributor of wood and wood-alternative products, 2003-present), K12 Inc. (technology-based education company, 2012-present), and the Annie E. Casey Foundation (2004-present). Previously, Mr. Engler served as a trustee of The Munder Funds (2003-2014), president and CEO of the National Association of Manufacturers (2004-2011) and as governor of Michigan (1991-2003). He is a past chairman of the National Governors Association. |
Albert R. Gamper, Jr. (1942) |
Year of Election or Appointment: 2006 Trustee Chairman of the Independent Trustees |
| Mr. Gamper also serves as Trustee of other Fidelity funds. Prior to his retirement in December 2004, Mr. Gamper served as Chairman of the Board of CIT Group Inc. (commercial finance). During his tenure with CIT Group Inc. Mr. Gamper served in numerous senior management positions, including Chairman (1987-1989; 1999-2001; 2002-2004), Chief Executive Officer (1987-2004), and President (2002-2003). Mr. Gamper currently serves as a member of the Board of Directors of Public Service Enterprise Group (utilities, 2000-present), and Member of the Board of Trustees of Barnabas Health Care System (1997-present). Previously, Mr. Gamper served as Vice Chairman of the Independent Trustees of certain Fidelity funds (2011-2012) and as Chairman of the Board of Governors, Rutgers University (2004-2007). |
Robert F. Gartland (1951) |
Year of Election or Appointment: 2010 Trustee |
| Mr. Gartland also serves as Trustee of other Fidelity funds. Mr. Gartland is Chairman and an investor in Gartland and Mellina Group Corp. (consulting, 2009-present). Previously, Mr. Gartland served as a partner and investor of Vietnam Partners LLC (investments and consulting, 2008-2011). Prior to his retirement, Mr. Gartland held a variety of positions at Morgan Stanley (financial services, 1979-2007) including Managing Director (1987-2007). |
Arthur E. Johnson (1947) |
Year of Election or Appointment: 2008 Trustee |
| Mr. Johnson also serves as Trustee of other Fidelity funds. Mr. Johnson serves as a member of the Board of Directors of Eaton Corporation plc (diversified power management, 2009-present), AGL Resources, Inc. (holding company, 2002-present) and Booz Allen Hamilton (management consulting, 2011-present). Prior to his retirement, Mr. Johnson served as Senior Vice President of Corporate Strategic Development of Lockheed Martin Corporation (defense contractor, 1999-2009). He previously served on the Board of Directors of IKON Office Solutions, Inc. (1999-2008) and Delta Airlines (2005-2007). Mr. Arthur E. Johnson is not related to Ms. Abigail P. Johnson. |
Michael E. Kenneally (1954) |
Year of Election or Appointment: 2009 Trustee |
| Mr. Kenneally also serves as Trustee of other Fidelity funds. Mr. Kenneally served as a Member of the Advisory Board for certain Fidelity funds before joining the Board of Trustees (2008-2009). Prior to his retirement, Mr. Kenneally served as Chairman and Global Chief Executive Officer of Credit Suisse Asset Management. Before joining Credit Suisse, he was an Executive Vice President and Chief Investment Officer for Bank of America Corporation. Earlier roles at Bank of America included Director of Research, Senior Portfolio Manager and Research Analyst, and Mr. Kenneally was awarded the Chartered Financial Analyst (CFA) designation in 1991. |
James H. Keyes (1940) |
Year of Election or Appointment: 2007 Trustee |
| Mr. Keyes also serves as Trustee of other Fidelity funds. Mr. Keyes serves as a member of the Board and Non-Executive Chairman of Navistar International Corporation (manufacture and sale of trucks, buses, and diesel engines, since 2002). Previously, Mr. Keyes served as a member of the Board of Pitney Bowes, Inc. (integrated mail, messaging, and document management solutions, 1998-2013). Prior to his retirement, Mr. Keyes served as Chairman (1993-2002) and Chief Executive Officer (1988-2002) of Johnson Controls (automotive, building, and energy) and as a member of the Board of LSI Logic Corporation (semiconductor technologies, 1984-2008). |
Marie L. Knowles (1946) |
Year of Election or Appointment: 2001 Trustee Vice Chairman of the Independent Trustees |
| Ms. Knowles also serves as Trustee of other Fidelity funds. Prior to Ms. Knowles' retirement in June 2000, she served as Executive Vice President and Chief Financial Officer of Atlantic Richfield Company (ARCO) (diversified energy, 1996-2000). From 1993 to 1996, she was a Senior Vice President of ARCO and President of ARCO Transportation Company. She served as a Director of ARCO from 1996 to 1998. Ms. Knowles currently serves as a Director and Chairman of the Audit Committee of McKesson Corporation (healthcare service, since 2002). Ms. Knowles is a member of the Board of the Catalina Island Conservancy and of the Santa Catalina Island Company (2009-present). She also serves as a member of the Advisory Board for the School of Engineering of the University of Southern California. Previously, Ms. Knowles served as a Director of Phelps Dodge Corporation (copper mining and manufacturing, 1994-2007), URS Corporation (engineering and construction, 2000-2003) and America West (airline, 1999-2002). |
+ The information above includes each Trustee's principal occupation during the last five years and other information relating to the experience, attributes, and skills relevant to each Trustee's qualifications to serve as a Trustee, which led to the conclusion that each Trustee should serve as a Trustee for each fund.
Advisory Board Member and Officers:
Correspondence intended for each officer and Geoffrey A. von Kuhn may be sent to Fidelity Investments, 245 Summer Street, Boston, Massachusetts 02210. Officers appear below in alphabetical order.
Name, Year of Birth; Principal Occupation |
Geoffrey A. von Kuhn (1951) |
Year of Election or Appointment: 2015 Member of the Advisory Board |
| Mr. von Kuhn also serves as a Trustee or Member of the Advisory Board of other Fidelity funds. Mr. von Kuhn is Chief Administrative Officer for FMR LLC (diversified financial services company, 2013-present), a Director of Pembroke Real Estate, Inc. (2009-present), and a Director of Discovery Natural Resources LLC (2012-present). Previously, Mr. von Kuhn was a managing director of Crosby Group (private wealth management company, 2007-2013), a member of the management committee and senior executive in the Wealth Management Group of AmSouth Bank (2001-2006), and head of the U.S. private bank at Citigroup (2000-2001). |
Elizabeth Paige Baumann (1968) |
Year of Election or Appointment: 2012 Anti-Money Laundering (AML) Officer |
| Ms. Baumann also serves as AML Officer of other funds. She is Chief AML Officer of FMR LLC (diversified financial services company, 2012-present) and is an employee of Fidelity Investments. Previously, Ms. Baumann served as Vice President and Deputy Anti-Money Laundering Officer (2007-2012). |
Marc Bryant (1966) |
Year of Election or Appointment: 2013 Assistant Secretary |
| Mr. Bryant also serves as an officer of other funds. He is Senior Vice President and Deputy General Counsel of FMR LLC (diversified financial services company). Previously, Mr. Bryant served as Secretary and Chief Legal Officer of Fidelity Rutland Square Trust II (2010-2014). Prior to joining Fidelity Investments, Mr. Bryant served as a Senior Vice President and the Head of Global Retail Legal for AllianceBernstein L.P. (2006-2010), and as the General Counsel for ProFund Advisors LLC (2001-2006). |
Jonathan Davis (1968) |
Year of Election or Appointment: 2010 Assistant Treasurer |
| Mr. Davis also serves as Assistant Treasurer of other funds. Mr. Davis is an employee of Fidelity Investments. Previously, Mr. Davis served as Vice President and Associate General Counsel of FMR LLC (diversified financial services company, 2003-2010). |
Adrien E. Deberghes (1967) |
Year of Election or Appointment: 2010 Assistant Treasurer |
| Mr. Deberghes also serves as an officer of other funds. He is an employee of Fidelity Investments (2008-present). Prior to joining Fidelity Investments, Mr. Deberghes was Senior Vice President of Mutual Fund Administration at State Street Corporation (2007-2008), Senior Director of Mutual Fund Administration at Investors Bank & Trust (2005-2007), and Director of Finance for Dunkin' Brands (2000-2005). |
Stephanie J. Dorsey (1969) |
Year of Election or Appointment: 2013 President and Treasurer |
| Ms. Dorsey also serves as an officer of other funds. She is an employee of Fidelity Investments (2008-present) and has served in other fund officer roles. Prior to joining Fidelity Investments, Ms. Dorsey served as Treasurer (2004-2008) of the JPMorgan Mutual Funds and Vice President (2004-2008) of JPMorgan Chase Bank. |
Howard J. Galligan III (1966) |
Year of Election or Appointment: 2014 Chief Financial Officer |
| Mr. Galligan also serves as Chief Financial Officer of other funds. Mr. Galligan serves as President of Fidelity Pricing and Cash Management Services (FPCMS) (2014-present) and as a Director of Strategic Advisers, Inc. (investment adviser firm, 2008-present). Previously, Mr. Galligan served as Chief Administrative Officer of Asset Management (2011-2014) and Chief Operating Officer and Senior Vice President of Investment Support for Strategic Advisers, Inc. (2003-2011). |
Scott C. Goebel (1968) |
Year of Election or Appointment: 2008 Secretary and Chief Legal Officer (CLO) |
| Mr. Goebel serves as Secretary and CLO of other funds. Mr. Goebel also serves as Secretary of Fidelity SelectCo, LLC (investment adviser firm, 2013-present), Fidelity Investments Money Management, Inc. (FIMM) (investment adviser firm, 2010-present) and Fidelity Research and Analysis Company (FRAC) (investment adviser firm, 2010-present); General Counsel, Secretary, and Senior Vice President of FMR (investment adviser firm, 2008-present) and FMR Co., Inc. (investment adviser firm, 2008-present); Chief Legal Officer of Fidelity Management & Research (Hong Kong) Limited (investment adviser firm, 2008-present); and Assistant Secretary of Fidelity Management & Research (Japan) Limited (investment adviser firm, 2008-present) and FMR Investment Management (U.K.) Limited (investment adviser firm, 2008-present). Previously, Mr. Goebel served as Secretary and CLO of other Fidelity funds (2008-2013), Assistant Secretary of FIMM (2008-2010), FRAC (2008-2010), and certain funds (2007-2008); and as Vice President and Secretary of Fidelity Distributors Corporation (FDC) (2005-2007). Mr. Goebel has been employed by FMR LLC (diversified financial services company) or an affiliate since 2001. |
Bruce T. Herring (1965) |
Year of Election or Appointment: 2013 Vice President of Fidelity's Asset Allocation Funds |
| Mr. Herring also serves as Vice President of other funds. He serves as Chief Investment Officer of Fidelity Global Asset Allocation (GAA) (2013-present), Group Chief Investment Officer of FMR (investment adviser firm), and President of Fidelity Research & Analysis Company (investment adviser firm, 2010-present). Previously, Mr. Herring served as Vice President of certain Equity Funds (2006-2014), Chief Investment Officer and Director of Fidelity Management & Research (U.K.) Inc. (investment adviser firm, 2010-2013), Vice President (2005-2006) and Senior Vice President (2006-2007) of Fidelity Management & Research Company (investment adviser firm), Vice President of FMR Co., Inc. (investment adviser firm, 2001-2007), and as a portfolio manager for Fidelity U.S. Equity Funds. |
Chris Maher (1972) |
Year of Election or Appointment: 2013 Assistant Treasurer |
| Mr. Maher serves as Assistant Treasurer of other funds. Mr. Maher is Vice President of Valuation Oversight and is an employee of Fidelity Investments. Previously, Mr. Maher served as Vice President of Asset Management Compliance (2013), Vice President of the Program Management Group of FMR (investment adviser firm, 2010-2013), and Vice President of Valuation Oversight (2008-2010). |
Nancy D. Prior (1967) |
Year of Election or Appointment: 2014 Vice President |
| Ms. Prior also serves as Vice President of other funds. Ms. Prior serves as a Director of Fidelity Investments Money Management, Inc. (FIMM) (investment adviser firm, 2014-present), President, Fixed Income (2014-present), Vice Chairman of Pyramis Global Advisors, LLC (investment adviser firm, 2014-present), and is an employee of Fidelity Investments (2002-present). Previously, Ms. Prior served as Vice President of Fidelity's Money Market Funds (2012-2014), President, Money Market and Short Duration Bond of FMR (investment adviser firm, 2013-2014), President, Money Market Group of FMR (2011-2014), Managing Director of Research (2009-2011), Senior Vice President and Deputy General Counsel (2007-2009), and Assistant Secretary of other Fidelity funds (2008-2009). |
Kenneth B. Robins (1969) |
Year of Election or Appointment: 2009 Assistant Treasurer |
| Mr. Robins also serves as an officer of other funds. Mr. Robins serves as Executive Vice President of Fidelity Investments Money Management, Inc. (FIMM) (investment adviser firm, 2013-present) and is an employee of Fidelity Investments (2004-present). Previously, Mr. Robins served in other fund officer roles. |
Stephen Sadoski (1971) |
Year of Election or Appointment: 2013 Deputy Treasurer |
| Mr. Sadoski also serves as Deputy Treasurer of other funds. He is an employee of Fidelity Investments (2012-present) and has served in another fund officer role. Prior to joining Fidelity Investments, Mr. Sadoski served as an assistant chief accountant in the Division of Investment Management of the Securities and Exchange Commission (SEC) (2009-2012) and as a senior manager at Deloitte & Touche LLP (1997-2009). |
Stacie M. Smith (1974) |
Year of Election or Appointment: 2013 Assistant Treasurer |
| Ms. Smith also serves as an officer of other funds. She is an employee of Fidelity Investments (2009-present) and has served in other fund officer roles. Prior to joining Fidelity Investments, Ms. Smith served as Senior Audit Manager of Ernst & Young LLP (1996-2009). |
Renee Stagnone (1975) |
Year of Election or Appointment: 2013 Deputy Treasurer |
| Ms. Stagnone also serves as Deputy Treasurer of other funds. Ms. Stagnone is an employee of Fidelity Investments. |
Michael H. Whitaker (1967) |
Year of Election or Appointment: 2008 Chief Compliance Officer |
| Mr. Whitaker also serves as Chief Compliance Officer of other funds. Mr. Whitaker also serves as Compliance Officer of FMR Co., Inc. (investment adviser firm, 2014-present), FMR (investment adviser firm, 2014-present), Fidelity Investments Money Management, Inc. (investment adviser firm, 2014-present), and is an employee of Fidelity Investments (2007-present). Prior to joining Fidelity Investments, Mr. Whitaker worked at MFS Investment Management where he served as Senior Vice President and Chief Compliance Officer (2004-2006), and Assistant General Counsel. |
Derek L. Young (1964) |
Year of Election or Appointment: 2009 Vice President of Fidelity's Asset Allocation Funds |
| Mr. Young also serves as Trustee or an officer of other funds. He is President and a Director of Strategic Advisers, Inc. (investment adviser firm, 2011-present), President of Fidelity Global Asset Allocation (GAA) (2011-present), and Vice Chairman of Pyramis Global Advisors, LLC (investment adviser firm, 2011-present). Previously, Mr. Young served as Chief Investment Officer of GAA (2009-2011) and as a portfolio manager. |
Joseph F. Zambello (1957) |
Year of Election or Appointment: 2011 Deputy Treasurer |
| Mr. Zambello also serves as Deputy Treasurer of other funds. Mr. Zambello is an employee of Fidelity Investments. Previously, Mr. Zambello served as Vice President of the Program Management Group of FMR (investment adviser firm, 2009-2011) and Vice President of the Transfer Agent Oversight Group (2005-2009). |
Annual Report
The Board of Trustees of each fund voted to pay to shareholders of record at the opening of business on record date, the following distributions per share derived from capital gains realized from sales of portfolio securities and dividends derived from net investment income:
| Pay Date | Record Date | Dividends | Capital Gains |
Fidelity Freedom Income Fund | 5/11/2015 | 5/08/2015 | $0.000 | $0.103 |
Fidelity Freedom 2005 Fund | 5/11/2015 | 5/08/2015 | $0.037 | $0.121 |
Fidelity Freedom 2010 Fund | 5/11/2015 | 5/08/2015 | $0.046 | $0.255 |
Fidelity Freedom 2015 Fund | 5/11/2015 | 5/08/2015 | $0.030 | $0.232 |
Fidelity Freedom 2020 Fund | 5/11/2015 | 5/08/2015 | $0.039 | $0.292 |
Fidelity Freedom 2025 Fund | 5/11/2015 | 5/08/2015 | $0.027 | $0.265 |
Fidelity Freedom 2030 Fund | 5/11/2015 | 5/08/2015 | $0.022 | $0.384 |
Fidelity Freedom 2035 Fund | 5/11/2015 | 5/08/2015 | $0.012 | $0.317 |
Fidelity Freedom 2040 Fund | 5/11/2015 | 5/08/2015 | $0.009 | $0.238 |
Fidelity Freedom 2045 Fund | 5/11/2015 | 5/08/2015 | $0.010 | $0.249 |
Fidelity Freedom 2050 Fund | 5/11/2015 | 5/08/2015 | $0.010 | $0.259 |
Fidelity Freedom 2055 Fund | 5/11/2015 | 5/08/2015 | $0.010 | $0.224 |
Fidelity Freedom 2060 Fund | 5/11/2015 | 5/08/2015 | $0.005 | $0.066 |
The funds hereby designate as capital gain dividend the amounts noted below for the taxable year ended March 31, 2015, or, if subsequently determined to be different, the net capital gain of such year.
Fidelity Freedom Income Fund | $28,517,389 |
Fidelity Freedom 2005 Fund | $11,111,820 |
Fidelity Freedom 2010 Fund | $90,740,792 |
Fidelity Freedom 2015 Fund | $119,421,116 |
Fidelity Freedom 2020 Fund | $267,601,273 |
Fidelity Freedom 2025 Fund | $202,888,731 |
Fidelity Freedom 2030 Fund | $285,201,439 |
Fidelity Freedom 2035 Fund | $167,319,034 |
Fidelity Freedom 2040 Fund | $197,960,597 |
Fidelity Freedom 2045 Fund | $80,925,103 |
Fidelity Freedom 2050 Fund | $63,748,432 |
Fidelity Freedom 2055 Fund | $11,098,550 |
Fidelity Freedom 2060 Fund | $69,219 |
A percentage of the dividends distributed during the fiscal year for the following funds were derived from interest on U.S. Government securities which is generally exempt from state income tax:
Fidelity Freedom Income Fund | 7.46% |
Fidelity Freedom 2005 Fund | 5.30% |
Fidelity Freedom 2010 Fund | 4.16% |
Fidelity Freedom 2015 Fund | 3.21% |
Fidelity Freedom 2020 Fund | 2.43% |
Fidelity Freedom 2025 Fund | 1.46% |
Fidelity Freedom 2030 Fund | 0.47% |
Fidelity Freedom 2035 Fund | 0.07% |
Fidelity Freedom 2040 Fund | 0.08% |
Fidelity Freedom 2045 Fund | 0.08% |
Fidelity Freedom 2050 Fund | 0.09% |
Fidelity Freedom 2055 Fund | 0.08% |
Fidelity Freedom 2060 Fund | 0.04% |
Annual Report
Distributions (Unaudited) - continued
A percentage of the dividends distributed during the fiscal year for the following funds qualify for the dividends-received deduction for corporate shareholders:
Fidelity Freedom Income Fund | |
May 2014 June 2014 July 2014 August 2014 September 2014 October 2014 November 2014 December 2014 February 2015 March 2015 | 5% 14% 14% 14% 14% 14% 14% 14% 2% 2% |
| |
Fidelity Freedom 2010 Fund | |
May 2014 December 2014 | 3% 21% |
Fidelity Freedom 2015 Fund | |
May 2014 December 2014 | 2% 23% |
Fidelity Freedom 2020 Fund | |
May 2014 December 2014 | 2% 25% |
Fidelity Freedom 2025 Fund | |
May 2014 December 2014 | 3% 28% |
Fidelity Freedom 2030 Fund | |
May 2014 December 2014 | 7% 33% |
Fidelity Freedom 2035 Fund | |
May 2014 December 2014 | 1% 35% |
Fidelity Freedom 2040 Fund | |
May 2014 December 2014 | 3% 35% |
Fidelity Freedom 2045 Fund | |
May 2014 December 2014 | 4% 36% |
Fidelity Freedom 2050 Fund | |
May 2014 December 2014 | 4% 36% |
Fidelity Freedom 2055 Fund | |
May 2014 December 2014 | 2% 36% |
Fidelity Freedom 2060 Fund | |
December 2014 | 38% |
Annual Report
A percentage of the dividends distributed during the fiscal year for the following funds may be taken into account as a dividend for purposes of the maximum rate under section 1(h)(11) of the Internal Revenue Code.
Fidelity Freedom Income Fund | |
May 2014 June 2014 July 2014 August 2014 September 2014 October 2014 November 2014 December 2014 February 2015 March 2015 | 10% 24% 24% 24% 24% 24% 24% 24% 3% 3% |
| |
Fidelity Freedom 2010 Fund | |
May 2014 December 2014 | 6% 36% |
Fidelity Freedom 2015 Fund | |
May 2014 December 2014 | 3% 40% |
Fidelity Freedom 2020 Fund | |
May 2014 December 2014 | 2% 43% |
Fidelity Freedom 2025 Fund | |
May 2014 December 2014 | 3% 49% |
Fidelity Freedom 2030 Fund | |
May 2014 December 2014 | 7% 57% |
Fidelity Freedom 2035 Fund | |
May 2014 December 2014 | 7% 61% |
Fidelity Freedom 2040 Fund | |
May 2014 December 2014 | 2% 60% |
Fidelity Freedom 2045 Fund | |
May 2014 December 2014 | 4% 62% |
Fidelity Freedom 2050 Fund | |
May 2014 December 2014 | 7% 63% |
Fidelity Freedom 2055 Fund | |
May 2014 December 2014 | 3% 64% |
Fidelity Freedom 2060 Fund | |
December 2014 | 70% |
The funds will notify shareholders in January 2016 of amounts for use in preparing 2015 income tax returns.
Annual Report
Item 2. Code of Ethics
As of the end of the period, March 31, 2015, Fidelity Aberdeen Street Trust (the trust) has adopted a code of ethics, as defined in Item 2 of Form N-CSR, that applies to its President and Treasurer and its Chief Financial Officer. A copy of the code of ethics is filed as an exhibit to this Form N-CSR.
Item 3. Audit Committee Financial Expert
The Board of Trustees of the trust has determined that James H. Keyes is an audit committee financial expert, as defined in Item 3 of Form N-CSR. Mr. Keyes is independent for purposes of Item 3 of Form N-CSR.
Item 4. Principal Accountant Fees and Services
Fees and Services
The following table presents fees billed by Deloitte & Touche LLP, the member firms of Deloitte Touche Tohmatsu, and their respective affiliates (collectively, "Deloitte Entities") in each of the last two fiscal years for services rendered to Fidelity Freedom Index Income Fund, Fidelity Freedom Index 2005 Fund, Fidelity Freedom Index 2010 Fund, Fidelity Freedom Index 2015 Fund, Fidelity Freedom Index 2020 Fund, Fidelity Freedom Index 2025 Fund, Fidelity Freedom Index 2030 Fund, Fidelity Freedom Index 2035 Fund, Fidelity Freedom Index 2040 Fund, Fidelity Freedom Index 2045 Fund, Fidelity Freedom Index 2050 Fund, Fidelity Freedom Index 2055 Fund and Fidelity Freedom Index 2060 Fund (the "Funds"):
Services Billed by Deloitte Entities
March 31, 2015 FeesA,B
| Audit Fees | Audit-Related Fees | Tax Fees | All Other Fees |
Fidelity Freedom Index Income Fund | $17,000 | $- | $4,700 | $600 |
Fidelity Freedom Index 2005 Fund | $17,000 | $- | $4,900 | $600 |
Fidelity Freedom Index 2010 Fund | $17,000 | $- | $4,700 | $600 |
Fidelity Freedom Index 2015 Fund | $17,000 | $- | $4,700 | $600 |
Fidelity Freedom Index 2020 Fund | $17,000 | $- | $4,700 | $600 |
Fidelity Freedom Index 2025 Fund | $17,000 | $- | $4,700 | $600 |
Fidelity Freedom Index 2030 Fund | $17,000 | $- | $4,700 | $600 |
Fidelity Freedom Index 2035 Fund | $17,000 | $- | $4,700 | $600 |
Fidelity Freedom Index 2040 Fund | $17,000 | $- | $4,700 | $600 |
Fidelity Freedom Index 2045 Fund | $17,000 | $- | $5,000 | $600 |
Fidelity Freedom Index 2050 Fund | $17,000 | $- | $4,700 | $600 |
Fidelity Freedom Index 2055 Fund | $17,000 | $- | $4,700 | $600 |
Fidelity Freedom Index 2060 Fund | $12,000 | $- | $4,700 | $400 |
March 31, 2014 FeesA,B
| Audit Fees | Audit-Related Fees | Tax Fees | All Other Fees |
Fidelity Freedom Index Income Fund | $16,000 | $- | $4,700 | $500 |
Fidelity Freedom Index 2005 Fund | $16,000 | $- | $4,900 | $500 |
Fidelity Freedom Index 2010 Fund | $16,000 | $- | $4,700 | $500 |
Fidelity Freedom Index 2015 Fund | $16,000 | $- | $4,700 | $500 |
Fidelity Freedom Index 2020 Fund | $16,000 | $- | $4,700 | $500 |
Fidelity Freedom Index 2025 Fund | $16,000 | $- | $4,700 | $500 |
Fidelity Freedom Index 2030 Fund | $16,000 | $- | $4,700 | $500 |
Fidelity Freedom Index 2035 Fund | $16,000 | $- | $4,700 | $500 |
Fidelity Freedom Index 2040 Fund | $16,000 | $- | $4,700 | $500 |
Fidelity Freedom Index 2045 Fund | $16,000 | $- | $4,700 | $500 |
Fidelity Freedom Index 2050 Fund | $16,000 | $- | $4,700 | $500 |
Fidelity Freedom Index 2055 Fund | $16,000 | $- | $4,900 | $500 |
Fidelity Freedom Index 2060 Fund | $- | $- | $- | $- |
A Amounts may reflect rounding.
B Fidelity Freedom Index 2060 Fund commenced operations on August 5, 2014.
The following table presents fees billed by PricewaterhouseCoopers LLP ("PwC") in each of the last two fiscal years for services rendered to Fidelity Freedom Income Fund, Fidelity Freedom 2005 Fund, Fidelity Freedom 2010 Fund, Fidelity Freedom 2015 Fund, Fidelity Freedom 2020 Fund, Fidelity Freedom 2025 Fund, Fidelity Freedom 2030 Fund, Fidelity Freedom 2035 Fund, Fidelity Freedom 2040 Fund, Fidelity Freedom 2045 Fund, Fidelity Freedom 2050 Fund, Fidelity Freedom 2055 Fund, Fidelity Freedom 2060 Fund, Fidelity Freedom K® Income Fund, Fidelity Freedom K® 2005 Fund, Fidelity Freedom K® 2010 Fund, Fidelity Freedom K® 2015 Fund, Fidelity Freedom K® 2020 Fund, Fidelity Freedom K® 2025 Fund, Fidelity Freedom K® 2030 Fund, Fidelity Freedom K® 2035 Fund, Fidelity Freedom K® 2040 Fund, Fidelity Freedom K® 2045 Fund, Fidelity Freedom K® 2050 Fund, Fidelity Freedom K® 2055 Fund and Fidelity Freedom K® 2060 Fund (the "Funds"):
Services Billed by PwC
March 31, 2015 FeesA,B
| Audit Fees | Audit-Related Fees | Tax Fees | All Other Fees |
Fidelity Freedom Income Fund | $23,000 | $- | $2,600 | $- |
Fidelity Freedom 2005 Fund | $22,000 | $- | $2,600 | $- |
Fidelity Freedom 2010 Fund | $22,000 | $- | $2,600 | $- |
Fidelity Freedom 2015 Fund | $22,000 | $- | $2,600 | $- |
Fidelity Freedom 2020 Fund | $22,000 | $- | $2,600 | $- |
Fidelity Freedom 2025 Fund | $22,000 | $- | $2,600 | $- |
Fidelity Freedom 2030 Fund | $22,000 | $- | $2,500 | $- |
Fidelity Freedom 2035 Fund | $22,000 | $- | $2,500 | $- |
Fidelity Freedom 2040 Fund | $22,000 | $- | $2,500 | $- |
Fidelity Freedom 2045 Fund | $22,000 | $- | $2,500 | $- |
Fidelity Freedom 2050 Fund | $22,000 | $- | $2,600 | $- |
Fidelity Freedom 2055 Fund | $24,000 | $- | $2,600 | $- |
Fidelity Freedom 2060 Fund | $16,000 | $- | $2,500 | $- |
Fidelity Freedom K® Income Fund | $22,000 | $- | $2,600 | $- |
Fidelity Freedom K® 2005 Fund | $22,000 | $- | $2,600 | $- |
Fidelity Freedom K® 2010 Fund | $22,000 | $- | $2,600 | $- |
Fidelity Freedom K® 2015 Fund | $22,000 | $- | $2,600 | $- |
Fidelity Freedom K® 2020 Fund | $22,000 | $- | $2,600 | $- |
Fidelity Freedom K® 2025 Fund | $22,000 | $- | $2,600 | $- |
Fidelity Freedom K® 2030 Fund | $22,000 | $- | $2,600 | $- |
Fidelity Freedom K® 2035 Fund | $22,000 | $- | $2,600 | $- |
Fidelity Freedom K® 2040 Fund | $22,000 | $- | $2,600 | $- |
Fidelity Freedom K® 2045 Fund | $22,000 | $- | $2,600 | $- |
Fidelity Freedom K® 2050 Fund | $22,000 | $- | $2,600 | $- |
Fidelity Freedom K® 2055 Fund | $24,000 | $- | $2,600 | $- |
Fidelity Freedom K® 2060 Fund | $16,000 | $- | $2,500 | $- |
March 31, 2014 FeesA,B
| Audit Fees | Audit-Related Fees | Tax Fees | All Other Fees |
Fidelity Freedom Income Fund | $22,000 | $- | $2,500 | $- |
Fidelity Freedom 2005 Fund | $22,000 | $- | $2,500 | $- |
Fidelity Freedom 2010 Fund | $22,000 | $- | $2,500 | $- |
Fidelity Freedom 2015 Fund | $22,000 | $- | $2,500 | $- |
Fidelity Freedom 2020 Fund | $22,000 | $- | $2,500 | $- |
Fidelity Freedom 2025 Fund | $22,000 | $- | $2,500 | $- |
Fidelity Freedom 2030 Fund | $22,000 | $- | $2,500 | $- |
Fidelity Freedom 2035 Fund | $22,000 | $- | $2,500 | $- |
Fidelity Freedom 2040 Fund | $22,000 | $- | $2,500 | $- |
Fidelity Freedom 2045 Fund | $22,000 | $- | $2,500 | $- |
Fidelity Freedom 2050 Fund | $22,000 | $- | $2,500 | $- |
Fidelity Freedom 2055 Fund | $23,000 | $- | $2,500 | $- |
Fidelity Freedom 2060 Fund | $- | $- | $- | $- |
Fidelity Freedom K® Income Fund | $22,000 | $- | $2,500 | $- |
Fidelity Freedom K® 2005 Fund | $22,000 | $- | $2,500 | $- |
Fidelity Freedom K® 2010 Fund | $22,000 | $- | $2,500 | $- |
Fidelity Freedom K® 2015 Fund | $22,000 | $- | $2,500 | $- |
Fidelity Freedom K® 2020 Fund | $22,000 | $- | $2,500 | $- |
Fidelity Freedom K® 2025 Fund | $22,000 | $- | $2,500 | $- |
Fidelity Freedom K® 2030 Fund | $22,000 | $- | $2,500 | $- |
Fidelity Freedom K® 2035 Fund | $22,000 | $- | $2,500 | $- |
Fidelity Freedom K® 2040 Fund | $22,000 | $- | $2,500 | $- |
Fidelity Freedom K® 2045 Fund | $22,000 | $- | $2,500 | $- |
Fidelity Freedom K® 2050 Fund | $22,000 | $- | $2,500 | $- |
Fidelity Freedom K® 2055 Fund | $23,000 | $- | $2,500 | $- |
Fidelity Freedom K® 2060 Fund | $- | $- | $- | $- |
A Amounts may reflect rounding.
B Fidelity Freedom 2060 Fund and Fidelity Freedom K® 2060 Fund commenced operations on August 5, 2014.
The following table presents fees billed by PwC and Deloitte Entities that were required to be approved by the Audit Committee for services that relate directly to the operations and financial reporting of the Funds and that are rendered on behalf of Fidelity Management & Research Company ("FMR") and entities controlling, controlled by, or under common control with FMR (not including any sub-adviser whose role is primarily portfolio management and is subcontracted with or overseen by another investment adviser) that provide ongoing services to the Funds ("Fund Service Providers"):
Services Billed by Deloitte Entities
| March 31, 2015A,B | March 31, 2014A,B |
Audit-Related Fees | $- | $765,000 |
Tax Fees | $- | $- |
All Other Fees | $220,000 | $700,000 |
A Amounts may reflect rounding.
B May include amounts billed prior to the Fidelity Freedom Index 2060 Fund's commencement operations.
Services Billed by PwC
| March 31, 2015A,B | March 31, 2014A,B |
Audit-Related Fees | $5,900,000 | $4,970,000 |
Tax Fees | $- | $- |
All Other Fees | $- | $50,000 |
A Amounts may reflect rounding.
B May include amounts billed prior to the Fidelity Freedom 2060 Fund and Fidelity Freedom K® 2060 Fund's commencement operations.
"Audit-Related Fees" represent fees billed for assurance and related services that are reasonably related to the performance of the fund audit or the review of the fund's financial statements and that are not reported under Audit Fees.
"Tax Fees" represent fees billed for tax compliance, tax advice or tax planning that relate directly to the operations and financial reporting of the fund.
"All Other Fees" represent fees billed for services provided to the fund or Fund Service Provider, a significant portion of which are assurance related, that relate directly to the operations and financial reporting of the fund, excluding those services that are reported under Audit Fees, Audit-Related Fees or Tax Fees.
Assurance services must be performed by an independent public accountant.
* * *
The aggregate non-audit fees billed by PwC and Deloitte Entities for services rendered to the Funds, FMR (not including any sub-adviser whose role is primarily portfolio management and is subcontracted with or overseen by another investment adviser), and any Fund Service Provider for each of the last two fiscal years of the Funds are as follows:
Billed By | March 31, 2015 A,B | March 31, 2014 A,B,C |
Deloitte Entities | $1,435,000 | $1,570,000 |
PwC | $8,155,000 | $5,550,000 |
A Amounts may reflect rounding.
B May include amounts billed prior to the Fidelity Freedom Index 2060 Fund, Fidelity Freedom 2060 Fund and Fidelity Freedom K® 2060 Fund's commencement operations.
C Reflects current period presentation.
The trust's Audit Committee has considered non-audit services that were not pre-approved that were provided by PwC and Deloitte Entities to Fund Service Providers to be compatible with maintaining the independence of PwC and Deloitte Entities in their audits of the Funds, taking into account representations from PwC and Deloitte Entities, in accordance with Public Company Accounting Oversight Board rules, regarding their independence from the Funds and their related entities and FMR's review of the appropriateness and permissibility under applicable law of such non-audit services prior to their provision to the Fund Service Providers.
Audit Committee Pre-Approval Policies and Procedures
The trust's Audit Committee must pre-approve all audit and non-audit services provided by a fund's independent registered public accounting firm relating to the operations or financial reporting of the fund. Prior to the commencement of any audit or non-audit services to a fund, the Audit Committee reviews the services to determine whether they are appropriate and permissible under applicable law.
The Audit Committee has adopted policies and procedures to, among other purposes, provide a framework for the Committee's consideration of non-audit services by the audit firms that audit the Fidelity funds. The policies and procedures require that any non-audit service provided by a fund audit firm to a Fidelity fund and any non-audit service provided by a fund auditor to a Fund Service Provider that relates directly to the operations and financial reporting of a Fidelity fund ("Covered Service") are subject to approval by the Audit Committee before such service is provided.
All Covered Services must be approved in advance of provision of the service either: (i) by formal resolution of the Audit Committee, or (ii) by oral or written approval of the service by the Chair of the Audit Committee (or if the Chair is unavailable, such other member of the Audit Committee as may be designated by the Chair to act in the Chair's absence). The approval contemplated by (ii) above is permitted where the Treasurer determines that action on such an engagement is necessary before the next meeting of the Audit Committee.
Non-audit services provided by a fund audit firm to a Fund Service Provider that do not relate directly to the operations and financial reporting of a Fidelity fund are reported to the Audit Committee on a periodic basis.
Non-Audit Services Approved Pursuant to Rule 2-01(c)(7)(i)(C) and (ii) of Regulation S-X ("De Minimis Exception")
There were no non-audit services approved or required to be approved by the Audit Committee pursuant to the De Minimis Exception during the Funds' last two fiscal years relating to services provided to (i) the Funds or (ii) any Fund Service Provider that relate directly to the operations and financial reporting of the Funds.
Item 5. Audit Committee of Listed Registrants
Not applicable.
Item 6. Investments
(a) Not applicable.
(b) Not applicable
Item 7. Disclosure of Proxy Voting Policies and Procedures for Closed-End Management Investment Companies
Not applicable.
Item 8. Portfolio Managers of Closed-End Management Investment Companies
Not applicable.
Item 9. Purchase of Equity Securities by Closed-End Management Investment Company and Affiliated Purchasers
Not applicable.
Item 10. Submission of Matters to a Vote of Security Holders
There were no material changes to the procedures by which shareholders may recommend nominees to the trust's Board of Trustees.
Item 11. Controls and Procedures
(a)(i) The President and Treasurer and the Chief Financial Officer have concluded that the trust's disclosure controls and procedures (as defined in Rule 30a-3(c) under the Investment Company Act) provide reasonable assurances that material information relating to the trust is made known to them by the appropriate persons, based on their evaluation of these controls and procedures as of a date within 90 days of the filing date of this report.
(a)(ii) There was no change in the trust's internal control over financial reporting (as defined in Rule 30a-3(d) under the Investment Company Act) that occurred during the second fiscal quarter of the period covered by this report that has materially affected, or is reasonably likely to materially affect, the trust's internal control over financial reporting.
Item 12. Exhibits
(a) | (1) | Code of Ethics pursuant to Item 2 of Form N-CSR is filed and attached hereto as EX-99.CODE ETH. |
(a) | (2) | Certification pursuant to Rule 30a-2(a) under the Investment Company Act of 1940 (17 CFR 270.30a-2(a)) is filed and attached hereto as Exhibit 99.CERT. |
(a) | (3) | Not applicable. |
(b) | | Certification pursuant to Rule 30a-2(b) under the Investment Company Act of 1940 (17 CFR 270.30a-2(b)) is furnished and attached hereto as Exhibit 99.906CERT. |
SIGNATURES
Pursuant to the requirements of the Securities Exchange Act of 1934 and the Investment Company Act of 1940, the registrant has duly caused this report to be signed on its behalf by the undersigned, thereunto duly authorized.
Fidelity Aberdeen Street Trust
By: | /s/Stephanie J. Dorsey |
| Stephanie J. Dorsey |
| President and Treasurer |
| |
Date: | May 29, 2015 |
Pursuant to the requirements of the Securities Exchange Act of 1934 and the Investment Company Act of 1940, this report has been signed below by the following persons on behalf of the registrant and in the capacities and on the dates indicated.
By: | /s/Stephanie J. Dorsey |
| Stephanie J. Dorsey |
| President and Treasurer |
| |
Date: | May 29, 2015 |
By: | /s/Howard J. Galligan III |
| Howard J. Galligan III |
| Chief Financial Officer |
| |
Date: | May 29, 2015 |