UNITED STATES
SECURITIES AND EXCHANGE COMMISSION
Washington, D.C. 20549
FORM N-CSR
CERTIFIED SHAREHOLDER REPORT OF REGISTERED
MANAGEMENT INVESTMENT COMPANIES
Investment Company Act file number 811-06440
Fidelity Aberdeen Street Trust
(Exact name of registrant as specified in charter)
245 Summer St., Boston, MA 02210
(Address of principal executive offices) (Zip code)
Cynthia Lo Bessette, Secretary
245 Summer St.
Boston, Massachusetts 02210
(Name and address of agent for service)
Registrant's telephone number, including area code:
617-563-7000
| |
Date of fiscal year end: | March 31 |
|
|
Date of reporting period: | September 30, 2022 |
Item 1.
Reports to Stockholders
Fidelity Advisor Freedom Funds®
Fidelity Advisor Freedom® Income Fund
Fidelity Advisor Freedom® 2005 Fund
Fidelity Advisor Freedom® 2010 Fund
Fidelity Advisor Freedom® 2015 Fund
Fidelity Advisor Freedom® 2020 Fund
Fidelity Advisor Freedom® 2025 Fund
Fidelity Advisor Freedom® 2030 Fund
Fidelity Advisor Freedom® 2035 Fund
Fidelity Advisor Freedom® 2040 Fund
Fidelity Advisor Freedom® 2045 Fund
Fidelity Advisor Freedom® 2050 Fund
Fidelity Advisor Freedom® 2055 Fund
Fidelity Advisor Freedom® 2060 Fund
Fidelity Advisor Freedom® 2065 Fund
Semi-Annual Report
September 30, 2022
Contents
To view a fund's proxy voting guidelines and proxy voting record for the 12-month period ended June 30, visit http://www.fidelity.com/proxyvotingresults or visit the Securities and Exchange Commission's (SEC) web site at http://www.sec.gov.
You may also call 1-877-208-0098 to request a free copy of the proxy voting guidelines.
Standard & Poor's, S&P and S&P 500 are registered service marks of The McGraw-Hill Companies, Inc. and have been licensed for use by Fidelity Distributors Corporation.
Other third-party marks appearing herein are the property of their respective owners.
All other marks appearing herein are registered or unregistered trademarks or service marks of FMR LLC or an affiliated company. © 2022 FMR LLC. All rights reserved.
This report and the financial statements contained herein are submitted for the general information of the shareholders of the Fund. This report is not authorized for distribution to prospective investors in the Fund unless preceded or accompanied by an effective prospectus.
A fund files its complete schedule of portfolio holdings with the SEC for the first and third quarters of each fiscal year on Form N-PORT. Forms N-PORT are available on the SEC's web site at http://www.sec.gov. A fund's Forms N-PORT may be reviewed and copied at the SEC's Public Reference Room in Washington, DC. Information regarding the operation of the SEC's Public Reference Room may be obtained by calling 1-800-SEC-0330.
For a complete list of a fund's portfolio holdings, view the most recent holdings listing, semiannual report, or annual report on Fidelity's web site at http://www.fidelity.com, http://www.institutional.fidelity.com, or http://www.401k.com, as applicable.
NOT FDIC INSURED •MAY LOSE VALUE •NO BANK GUARANTEE
Neither the Fund nor Fidelity Distributors Corporation is a bank.
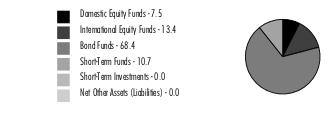
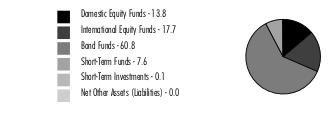
The information in the following table is based on the direct Investments of the Fund.
Top Holdings (% of Fund's net assets) |
| |
| Fidelity Series Investment Grade Bond Fund | 39.1 | |
| Fidelity Series 0-5 Year Inflation-Protected Bond Index Fund | 20.0 | |
| Fidelity Series Government Money Market Fund 3.00% | 8.6 | |
| Fidelity Series Emerging Markets Opportunities Fund | 5.6 | |
| Fidelity Series International Developed Markets Bond Index Fund | 4.0 | |
| Fidelity Series Long-Term Treasury Bond Index Fund | 3.6 | |
| Fidelity Series Short-Term Credit Fund | 2.1 | |
| Fidelity Series Overseas Fund | 2.0 | |
| Fidelity Series International Value Fund | 2.0 | |
| Fidelity Series International Growth Fund | 1.9 | |
| | 88.9 | |
| |
Asset Allocation (% of Fund's net assets) |
|
Percentages shown as 0.0% may reflect amounts less than 0.05%. |
|
Domestic Equity Funds category includes Fidelity Series Commodity Strategy Fund which invests in commodity-related investments.
Fidelity Advisor Freedom® Income Fund
Showing Percentage of Net Assets
| U.S. Treasury Obligations - 0.0% |
| | | Principal Amount (a) | Value ($) |
U.S. Treasury Bills, yield at date of purchase 3.15% to 3.29% 12/15/22 to 12/29/22 (b) (Cost $99,263) | | 100,000 | 99,314 |
| | | | |
| Domestic Equity Funds - 7.5% |
| | | Shares | Value ($) |
| Fidelity Advisor Series Equity Growth Fund (c) | | 124,352 | 1,510,882 |
| Fidelity Advisor Series Growth Opportunities Fund (c) | | 121,228 | 1,063,167 |
| Fidelity Advisor Series Small Cap Fund (c) | | 62,367 | 652,981 |
| Fidelity Series All-Sector Equity Fund (c) | | 69,163 | 593,415 |
| Fidelity Series Commodity Strategy Fund (c) | | 1,048,930 | 2,192,264 |
| Fidelity Series Large Cap Stock Fund (c) | | 156,393 | 2,309,930 |
| Fidelity Series Large Cap Value Index Fund (c) | | 19,221 | 244,496 |
| Fidelity Series Opportunistic Insights Fund (c) | | 96,635 | 1,373,182 |
| Fidelity Series Small Cap Opportunities Fund (c) | | 71,362 | 769,286 |
| Fidelity Series Stock Selector Large Cap Value Fund (c) | | 131,142 | 1,464,857 |
| Fidelity Series Value Discovery Fund (c) | | 109,774 | 1,511,586 |
| TOTAL DOMESTIC EQUITY FUNDS (Cost $13,203,383) | | | 13,686,046 |
| | | | |
| International Equity Funds - 13.4% |
| | | Shares | Value ($) |
| Fidelity Series Canada Fund (c) | | 125,527 | 1,556,533 |
| Fidelity Series Emerging Markets Fund (c) | | 149,137 | 1,079,755 |
| Fidelity Series Emerging Markets Opportunities Fund (c) | | 705,904 | 10,249,719 |
| Fidelity Series International Growth Fund (c) | | 281,160 | 3,604,471 |
| Fidelity Series International Small Cap Fund (c) | | 68,574 | 938,094 |
| Fidelity Series International Value Fund (c) | | 421,176 | 3,617,898 |
| Fidelity Series Overseas Fund (c) | | 381,732 | 3,637,909 |
| TOTAL INTERNATIONAL EQUITY FUNDS (Cost $25,995,394) | | | 24,684,379 |
| | | | |
| Bond Funds - 68.4% |
| | | Shares | Value ($) |
| Fidelity Series 0-5 Year Inflation-Protected Bond Index Fund (c) | | 3,798,829 | 36,658,699 |
| Fidelity Series 5+ Year Inflation-Protected Bond Index Fund (c) | | 20,960 | 167,471 |
| Fidelity Series Emerging Markets Debt Fund (c) | | 135,810 | 931,655 |
| Fidelity Series Emerging Markets Debt Local Currency Fund (c) | | 38,250 | 304,852 |
| Fidelity Series Floating Rate High Income Fund (c) | | 21,337 | 185,636 |
| Fidelity Series High Income Fund (c) | | 125,946 | 992,452 |
| Fidelity Series International Credit Fund (c) | | 14,078 | 110,793 |
| Fidelity Series International Developed Markets Bond Index Fund (c) | | 862,190 | 7,345,860 |
| Fidelity Series Investment Grade Bond Fund (c) | | 7,348,974 | 71,725,982 |
| Fidelity Series Long-Term Treasury Bond Index Fund (c) | | 1,113,111 | 6,645,271 |
| Fidelity Series Real Estate Income Fund (c) | | 49,430 | 470,569 |
| TOTAL BOND FUNDS (Cost $139,129,768) | | | 125,539,240 |
| | | | |
| Short-Term Funds - 10.7% |
| | | Shares | Value ($) |
| Fidelity Cash Central Fund 3.10% (d) | | 53,195 | 53,206 |
| Fidelity Series Government Money Market Fund 3.00% (c)(e) | | 15,689,272 | 15,689,272 |
| Fidelity Series Short-Term Credit Fund (c) | | 403,896 | 3,828,932 |
| TOTAL SHORT-TERM FUNDS (Cost $19,744,466) | | | 19,571,410 |
| | | | |
| TOTAL INVESTMENT IN SECURITIES - 100.0% (Cost $198,172,274) | 183,580,389 |
NET OTHER ASSETS (LIABILITIES) - 0.0% | (2,900) |
| NET ASSETS - 100.0% | 183,577,489 |
| | |
| Futures Contracts |
| | Number of contracts | Expiration Date | Notional Amount ($) | Value ($) | Unrealized Appreciation/ (Depreciation) ($) |
| Purchased | | | | | |
| | | | | | |
| Treasury Contracts | | | | | |
| CBOT 10-Year U.S. Treasury Note Contracts (United States) | 29 | Dec 2022 | 3,249,813 | (199,944) | (199,944) |
| CBOT Ultra Long Term U.S. Treasury Bond Contracts (United States) | 2 | Dec 2022 | 274,000 | (2,926) | (2,926) |
| | | | | | |
| TOTAL PURCHASED | | | | | (202,870) |
| | | | | | |
| Sold | | | | | |
| | | | | | |
| Equity Index Contracts | | | | | |
| CME E-mini S&P 500 Index Contracts (United States) | 4 | Dec 2022 | 720,300 | 18,378 | 18,378 |
| ICE E-mini MSCI EAFE Index Contracts (United States) | 7 | Dec 2022 | 581,210 | 58,885 | 58,885 |
| ICE E-mini MSCI Emerging Markets Index Contracts (United States) | 5 | Dec 2022 | 217,875 | 117 | 117 |
| | | | | | |
| TOTAL SOLD | | | | | 77,380 |
| | | | | | |
| TOTAL FUTURES CONTRACTS | | | | | (125,490) |
| The notional amount of futures purchased as a percentage of Net Assets is 1.9% |
| The notional amount of futures sold as a percentage of Net Assets is 0.8% |
Legend
| (a) | Amount is stated in United States dollars unless otherwise noted. |
| (b) | Security or a portion of the security was pledged to cover margin requirements for futures contracts. At period end, the value of securities pledged amounted to $99,314. |
| (d) | Affiliated fund that is generally available only to investment companies and other accounts managed by Fidelity Investments. The rate quoted is the annualized seven-day yield of the fund at period end. A complete unaudited listing of the fund's holdings as of its most recent quarter end is available upon request. In addition, each Fidelity Central Fund's financial statements are available on the SEC's website or upon request. |
| (e) | The rate quoted is the annualized seven-day yield of the fund at period end. |
Affiliated Central Funds
Fiscal year to date information regarding the Fund's investments in Fidelity Central Funds, including the ownership percentage, is presented below.
| Affiliate | Value, beginning of period ($) | Purchases ($) | Sales Proceeds ($) | Dividend Income ($) | Realized Gain (loss) ($) | Change in Unrealized appreciation (depreciation) ($) | Value, end of period ($) | %ownership, end of period |
| Fidelity Cash Central Fund 3.10% | 53,365 | 765,489 | 765,648 | 1,196 | - | - | 53,206 | 0.0% |
| Total | 53,365 | 765,489 | 765,648 | 1,196 | - | - | 53,206 | |
| | | | | | | | | |
Amounts in the income column in the above table include any capital gain distributions from underlying funds, which are presented in the corresponding line item in the Statement of Operations, if applicable.
Affiliated Underlying Funds
Fiscal year to date information regarding the Fund's investments in affiliated Underlying Funds is presented below. Exchanges between classes of the same affiliated Underlying Funds may occur. If an Underlying Funds changes its name, the name presented below is the name in effect at period end.
| Affiliate | Value, beginning of period ($) | Purchases ($) | Sales Proceeds ($) | Dividend Income ($) | Realized Gain (loss) ($) | Change in Unrealized appreciation (depreciation) ($) | Value, end of period ($) |
| Fidelity Advisor Series Equity Growth Fund | 1,730,921 | 417,979 | 266,358 | - | (16,418) | (355,242) | 1,510,882 |
| Fidelity Advisor Series Growth Opportunities Fund | 1,187,018 | 438,989 | 212,908 | - | (24,070) | (325,862) | 1,063,167 |
| Fidelity Advisor Series Small Cap Fund | 785,658 | 156,657 | 143,546 | - | (12,042) | (133,746) | 652,981 |
| Fidelity Series 0-5 Year Inflation-Protected Bond Index Fund | 34,146,354 | 9,628,616 | 5,601,677 | - | (87,396) | (1,427,198) | 36,658,699 |
| Fidelity Series 5+ Year Inflation-Protected Bond Index Fund | 211,922 | 1,680,400 | 1,687,471 | - | (16,667) | (20,713) | 167,471 |
| Fidelity Series All-Sector Equity Fund | 742,393 | 97,154 | 96,452 | - | (7,375) | (142,305) | 593,415 |
| Fidelity Series Canada Fund | 1,847,336 | 254,010 | 167,156 | - | (2,821) | (374,836) | 1,556,533 |
| Fidelity Series Commodity Strategy Fund | 3,167,711 | 1,914,381 | 1,077,677 | 1,542,273 | (244,555) | (1,567,596) | 2,192,264 |
| Fidelity Series Emerging Markets Debt Fund | 1,099,191 | 121,215 | 102,737 | 27,963 | (5,547) | (180,467) | 931,655 |
| Fidelity Series Emerging Markets Debt Local Currency Fund | 361,867 | 18,631 | 34,610 | - | (4,283) | (36,753) | 304,852 |
| Fidelity Series Emerging Markets Fund | 1,298,074 | 200,851 | 123,747 | - | (9,200) | (286,223) | 1,079,755 |
| Fidelity Series Emerging Markets Opportunities Fund | 11,695,185 | 2,222,628 | 1,108,505 | - | (71,786) | (2,487,803) | 10,249,719 |
| Fidelity Series Floating Rate High Income Fund | 216,914 | 16,336 | 36,639 | 5,377 | (2,888) | (8,087) | 185,636 |
| Fidelity Series Government Money Market Fund 3.00% | 21,517,858 | 1,393,121 | 7,221,707 | 111,476 | - | - | 15,689,272 |
| Fidelity Series High Income Fund | 1,284,707 | 90,722 | 221,880 | 30,708 | (19,140) | (141,957) | 992,452 |
| Fidelity Series Inflation-Protected Bond Index Fund | 4,270,619 | 54,593 | 4,250,090 | 19,406 | 126,753 | (201,875) | - |
| Fidelity Series International Credit Fund | 128,486 | 1,754 | - | 1,754 | - | (19,447) | 110,793 |
| Fidelity Series International Developed Markets Bond Index Fund | 6,624,405 | 2,132,470 | 752,625 | 11,070 | (38,704) | (619,686) | 7,345,860 |
| Fidelity Series International Growth Fund | 4,235,213 | 890,734 | 531,398 | - | (64,862) | (925,216) | 3,604,471 |
| Fidelity Series International Small Cap Fund | 1,169,533 | 158,947 | 111,261 | - | (11,880) | (267,245) | 938,094 |
| Fidelity Series International Value Fund | 4,278,116 | 782,182 | 482,217 | - | (29,633) | (930,550) | 3,617,898 |
| Fidelity Series Investment Grade Bond Fund | 85,065,499 | 5,715,304 | 10,317,247 | 1,130,473 | (598,752) | (8,138,822) | 71,725,982 |
| Fidelity Series Large Cap Stock Fund | 2,723,467 | 669,373 | 472,010 | 135,657 | 21,717 | (632,617) | 2,309,930 |
| Fidelity Series Large Cap Value Index Fund | 294,561 | 45,397 | 46,257 | - | 2,474 | (51,679) | 244,496 |
| Fidelity Series Long-Term Treasury Bond Index Fund | 7,881,047 | 1,285,658 | 755,670 | 93,613 | (50,452) | (1,715,312) | 6,645,271 |
| Fidelity Series Opportunistic Insights Fund | 1,599,533 | 388,801 | 252,898 | - | (23,104) | (339,150) | 1,373,182 |
| Fidelity Series Overseas Fund | 4,258,859 | 929,802 | 460,812 | - | (39,678) | (1,050,262) | 3,637,909 |
| Fidelity Series Real Estate Income Fund | 783,758 | 67,063 | 273,953 | 36,304 | 11,219 | (117,518) | 470,569 |
| Fidelity Series Short-Term Credit Fund | 5,389,935 | 286,261 | 1,726,385 | 34,492 | (40,432) | (80,447) | 3,828,932 |
| Fidelity Series Small Cap Opportunities Fund | 969,997 | 117,935 | 116,707 | 36,170 | (10,950) | (190,989) | 769,286 |
| Fidelity Series Stock Selector Large Cap Value Fund | 1,738,355 | 295,616 | 272,682 | - | 2,255 | (298,687) | 1,464,857 |
| Fidelity Series Value Discovery Fund | 1,770,556 | 238,393 | 257,092 | - | 12,870 | (253,141) | 1,511,586 |
| | 214,475,048 | 32,711,973 | 39,182,374 | 3,216,736 | (1,255,347) | (23,321,431) | 183,427,869 |
Amounts in the income column in the above table include any capital gain distributions from underlying funds, which are presented in the corresponding line item in the Statement of Operations, if applicable.
Purchases and Sales Proceeds in the table above include the value of shares purchased or redeemed through in-kind transactions, if applicable.
Investment Valuation
The following is a summary of the inputs used, as of September 30, 2022, involving the Fund's assets and liabilities carried at fair value. The inputs or methodology used for valuing securities may not be an indication of the risk associated with investing in those securities. For more information on valuation inputs, and their aggregation into the levels used below, please refer to the Investment Valuation section in the accompanying Notes to Financial Statements.
| Valuation Inputs at Reporting Date: |
| Description | Total ($) | Level 1 ($) | Level 2 ($) | Level 3 ($) |
Investments in Securities: | | | | |
|
| Other Short-Term Investments | 99,314 | - | 99,314 | - |
|
| Domestic Equity Funds | 13,686,046 | 13,686,046 | - | - |
|
| International Equity Funds | 24,684,379 | 24,684,379 | - | - |
|
| Bond Funds | 125,539,240 | 125,539,240 | - | - |
|
| Short-Term Funds | 19,571,410 | 19,571,410 | - | - |
| Total Investments in Securities: | 183,580,389 | 183,481,075 | 99,314 | - |
Derivative Instruments: | | | | |
|
| Assets | | | | |
Futures Contracts | 77,380 | 77,380 | - | - |
| Total Assets | 77,380 | 77,380 | - | - |
|
| Liabilities | | | | |
Futures Contracts | (202,870) | (202,870) | - | - |
| Total Liabilities | (202,870) | (202,870) | - | - |
| Total Derivative Instruments: | (125,490) | (125,490) | - | - |
Value of Derivative Instruments
The following table is a summary of the Fund's value of derivative instruments by primary risk exposure as of September 30, 2022. For additional information on derivative instruments, please refer to the Derivative Instruments section in the accompanying Notes to Financial Statements.
Primary Risk Exposure / Derivative Type | Value |
| Asset ($) | Liability ($) |
| Equity Risk | | |
Futures Contracts (a) | 77,380 | 0 |
| Total Equity Risk | 77,380 | 0 |
| Interest Rate Risk | | |
Futures Contracts (a) | 0 | (202,870) |
| Total Interest Rate Risk | 0 | (202,870) |
| Total Value of Derivatives | 77,380 | (202,870) |
(a)Reflects gross cumulative appreciation (depreciation) on futures contracts as presented in the Schedule of Investments. In the Statement of Assets and Liabilities, the period end daily variation margin is included in receivable or payable for daily variation margin on futures contracts, and the net cumulative appreciation (depreciation) is included in Total accumulated earnings (loss).
Fidelity Advisor Freedom® Income Fund
| Statement of Assets and Liabilities |
| | | | September 30, 2022 (Unaudited) |
| | | | | |
| Assets | | | | |
| Investment in securities, at value - See accompanying schedule: | $ | | | |
Unaffiliated issuers (cost $99,263) | | $99,314 | | |
Fidelity Central Funds (cost $53,206) | | 53,206 | | |
Other affiliated issuers (cost $198,019,805) | | 183,427,869 | | |
| | | | | |
| Total Investment in Securities (cost $198,172,274) | | | $ | 183,580,389 |
| Cash | | | | 30,922 |
| Receivable for investments sold | | | | 1,538,726 |
| Receivable for fund shares sold | | | | 355,814 |
| Distributions receivable from Fidelity Central Funds | | | | 297 |
| Receivable for daily variation margin on futures contracts | | | | 377 |
Total assets | | | | 185,506,525 |
| Liabilities | | | | |
| Payable for investments purchased | | $1,412,811 | | |
| Payable for fund shares redeemed | | 411,913 | | |
| Accrued management fee | | 72,346 | | |
| Distribution and service plan fees payable | | 29,645 | | |
| Payable for daily variation margin on futures contracts | | 2,321 | | |
| Total Liabilities | | | | 1,929,036 |
| Net Assets | | | $ | 183,577,489 |
| Net Assets consist of: | | | | |
| Paid in capital | | | $ | 198,535,897 |
| Total accumulated earnings (loss) | | | | (14,958,408) |
| Net Assets | | | $ | 183,577,489 |
| | | | | |
| Net Asset Value and Maximum Offering Price | | | | |
| Class A : | | | | |
Net Asset Value and redemption price per share ($62,983,660 ÷ 6,692,087 shares) (a) | | | $ | 9.41 |
| Maximum offering price per share (100/94.25 of $9.41) | | | $ | 9.98 |
| Class M : | | | | |
Net Asset Value and redemption price per share ($26,942,185 ÷ 2,869,323 shares) (a) | | | $ | 9.39 |
| Maximum offering price per share (100/96.50 of $9.39) | | | $ | 9.73 |
| Class C : | | | | |
Net Asset Value and offering price per share ($4,947,838 ÷ 531,004 shares) (a) | | | $ | 9.32 |
| Class I : | | | | |
Net Asset Value , offering price and redemption price per share ($68,934,954 ÷ 7,295,081 shares) | | | $ | 9.45 |
| Class Z : | | | | |
Net Asset Value , offering price and redemption price per share ($6,849,269 ÷ 725,742 shares) | | | $ | 9.44 |
| Class Z6 : | | | | |
Net Asset Value , offering price and redemption price per share ($12,919,583 ÷ 1,368,573 shares) | | | $ | 9.44 |
(a)Redemption price per share is equal to net asset value less any applicable contingent deferred sales charge. |
| Statement of Operations |
| | | | Six months ended September 30, 2022 (Unaudited) |
| Investment Income | | | | |
| Dividends: | | | | |
| Affiliated issuers | | | $ | 3,057,438 |
| Interest | | | | 919 |
| Income from Fidelity Central Funds | | | | 1,196 |
| Total Income | | | | 3,059,553 |
| Expenses | | | | |
| Management fee | $ | 454,777 | | |
| Distribution and service plan fees | | 187,995 | | |
| Independent trustees' fees and expenses | | 345 | | |
| Total expenses before reductions | | 643,117 | | |
| Expense reductions | | (55) | | |
| Total expenses after reductions | | | | 643,062 |
| Net Investment income (loss) | | | | 2,416,491 |
| Realized and Unrealized Gain (Loss) | | | | |
| Net realized gain (loss) on: | | | | |
| Investment Securities: | | | | |
| Unaffiliated issuers | | 2 | | |
| Affiliated issuers | | (1,255,347) | | |
| Futures contracts | | (75,504) | | |
| Capital gain distributions from underlying funds: | | | | |
| Affiliated issuers | | 159,298 | | |
| Total net realized gain (loss) | | | | (1,171,551) |
| Change in net unrealized appreciation (depreciation) on: | | | | |
| Investment Securities: | | | | |
| Unaffiliated issuers | | 52 | | |
| Affiliated issuers | | (23,321,431) | | |
| Futures contracts | | (168,825) | | |
| Total change in net unrealized appreciation (depreciation) | | | | (23,490,204) |
| Net gain (loss) | | | | (24,661,755) |
| Net increase (decrease) in net assets resulting from operations | | | $ | (22,245,264) |
| Statement of Changes in Net Assets |
| |
| | Six months ended September 30, 2022 (Unaudited) | | Year ended March 31, 2022 |
| Increase (Decrease) in Net Assets | | | | |
| Operations | | | | |
| Net investment income (loss) | $ | 2,416,491 | $ | 5,214,786 |
| Net realized gain (loss) | | (1,171,551) | | 7,224,171 |
| Change in net unrealized appreciation (depreciation) | | (23,490,204) | | (13,960,590) |
| Net increase (decrease) in net assets resulting from operations | | (22,245,264) | | (1,521,633) |
| Distributions to shareholders | | (5,460,009) | | (12,106,656) |
| Share transactions - net increase (decrease) | | (3,291,046) | | (10,275,204) |
| Total increase (decrease) in net assets | | (30,996,319) | | (23,903,493) |
| | | | | |
| Net Assets | | | | |
| Beginning of period | | 214,573,808 | | 238,477,301 |
| End of period | $ | 183,577,489 | $ | 214,573,808 |
| | | | | |
| | | | | |
Financial Highlights
| Fidelity Advisor Freedom® Income Fund Class A |
| |
| | Six months ended (Unaudited) September 30, 2022 | | Years ended March 31, 2022 | | 2021 | | 2020 | | 2019 | | 2018 |
Selected Per-Share Data | | | | | | | | | | | | |
| Net asset value, beginning of period | $ | 10.82 | $ | 11.49 | $ | 10.50 | $ | 10.76 | $ | 11.01 | $ | 10.94 |
| Income from Investment Operations | | | | | | | | | | | | |
Net investment income (loss) A,B | | .12 | | .24 | | .09 | | .18 | | .20 | | .15 |
| Net realized and unrealized gain (loss) | | (1.25) | | (.34) | | 1.30 | | (.06) C | | .12 | | .34 |
| Total from investment operations | | (1.13) | | (.10) | | 1.39 | | .12 | | .32 | | .49 |
| Distributions from net investment income | | (.03) | | (.23) | | (.11) | | (.18) | | (.19) | | (.15) |
| Distributions from net realized gain | | (.24) | | (.34) | | (.30) | | (.20) | | (.38) | | (.26) |
| Total distributions | | (.28) D | | (.57) | | (.40) D | | (.38) | | (.57) | | (.42) D |
| Net asset value, end of period | $ | 9.41 | $ | 10.82 | $ | 11.49 | $ | 10.50 | $ | 10.76 | $ | 11.01 |
Total Return E,F,G | | (10.64)% | | (1.04)% | | 13.41% | | 1.04% C | | 3.14% | | 4.47% |
Ratios to Average Net Assets B,H,I | | | | | | | | | | | | |
| Expenses before reductions | | .72% J | | .72% | | .72% | | .72% | | .71% K | | .63% |
| Expenses net of fee waivers, if any | | .72% J | | .72% | | .72% | | .72% | | .71% K | | .63% |
| Expenses net of all reductions | | .72% J | | .72% | | .72% | | .72% | | .71% K | | .63% |
| Net investment income (loss) | | 2.35% J | | 2.11% | | .80% | | 1.64% | | 1.84% | | 1.38% |
| Supplemental Data | | | | | | | | | | | | |
| Net assets, end of period (000 omitted) | $ | 62,984 | $ | 75,687 | $ | 73,935 | $ | 61,807 | $ | 69,817 | $ | 76,141 |
Portfolio turnover rate L | | 33% J | | 47% | | 29% | | 25% | | 36% | | 21% |
A Calculated based on average shares outstanding during the period.
B Net investment income (loss) is affected by the timing of the declaration of dividends by any underlying mutual funds or exchange-traded funds (ETFs). Net investment income (loss) of any such underlying funds is not included in the Fund's net investment income (loss) ratio.
C Amount includes a reimbursement from the investment adviser for an operational error which amounted to less than $.01 per share. Excluding this reimbursement, the total return would have been .93%.
D Total distributions per share do not sum due to rounding.
E Total returns for periods of less than one year are not annualized.
F Total returns would have been lower if certain expenses had not been reduced during the applicable periods shown.
G Total returns do not include the effect of the sales charges.
H Fees and expenses of any underlying mutual funds or exchange-traded funds (ETFs) are not included in the Fund's expense ratio. The Fund indirectly bears its proportionate share of these expenses. For additional expense information related to investments in Fidelity Central Funds, please refer to the "Investments in Fidelity Central Funds" note found in the Notes to Financial Statements section of the most recent Annual or Semi-Annual report.
I Expense ratios reflect operating expenses of the class. Expenses before reductions do not reflect amounts reimbursed, waived, or reduced through arrangements with the investment adviser, brokerage services, or other offset arrangements, if applicable, and do not represent the amount paid by the class during periods when reimbursements, waivers or reductions occur.
J Annualized
K On certain classes, the size and fluctuation of net assets and expense amounts may cause ratios to differ from contractual rates.
L Amount does not include the portfolio activity of any underlying mutual funds or exchange-traded funds (ETFs).
| Fidelity Advisor Freedom® Income Fund Class M |
| |
| | Six months ended (Unaudited) September 30, 2022 | | Years ended March 31, 2022 | | 2021 | | 2020 | | 2019 | | 2018 |
Selected Per-Share Data | | | | | | | | | | | | |
| Net asset value, beginning of period | $ | 10.79 | $ | 11.47 | $ | 10.49 | $ | 10.74 | $ | 11.00 | $ | 10.93 |
| Income from Investment Operations | | | | | | | | | | | | |
Net investment income (loss) A,B | | .11 | | .21 | | .06 | | .15 | | .17 | | .13 |
| Net realized and unrealized gain (loss) | | (1.24) | | (.34) | | 1.30 | | (.04) C | | .12 | | .33 |
| Total from investment operations | | (1.13) | | (.13) | | 1.36 | | .11 | | .29 | | .46 |
| Distributions from net investment income | | (.02) | | (.21) | | (.08) | | (.16) | | (.17) | | (.13) |
| Distributions from net realized gain | | (.24) | | (.34) | | (.30) | | (.20) | | (.38) | | (.26) |
| Total distributions | | (.27) D | | (.55) | | (.38) | | (.36) | | (.55) | | (.39) |
| Net asset value, end of period | $ | 9.39 | $ | 10.79 | $ | 11.47 | $ | 10.49 | $ | 10.74 | $ | 11.00 |
Total Return E,F,G | | (10.68)% | | (1.31)% | | 13.06% | | .90% C | | 2.78% | | 4.22% |
Ratios to Average Net Assets B,H,I | | | | | | | | | | | | |
| Expenses before reductions | | .97% J | | .97% | | .96% K | | .97% | | .96% K | | .89% |
| Expenses net of fee waivers, if any | | .97% J | | .97% | | .96% K | | .97% | | .96% K | | .89% |
| Expenses net of all reductions | | .97% J | | .97% | | .96% K | | .97% | | .96% K | | .89% |
| Net investment income (loss) | | 2.10% J | | 1.86% | | .55% | | 1.39% | | 1.59% | | 1.13% |
| Supplemental Data | | | | | | | | | | | | |
| Net assets, end of period (000 omitted) | $ | 26,942 | $ | 31,925 | $ | 36,006 | $ | 36,147 | $ | 38,059 | $ | 38,204 |
Portfolio turnover rate L | | 33% J | | 47% | | 29% | | 25% | | 36% | | 21% |
A Calculated based on average shares outstanding during the period.
B Net investment income (loss) is affected by the timing of the declaration of dividends by any underlying mutual funds or exchange-traded funds (ETFs). Net investment income (loss) of any such underlying funds is not included in the Fund's net investment income (loss) ratio.
C Amount includes a reimbursement from the investment adviser for an operational error which amounted to less than $.01 per share. Excluding this reimbursement, the total return would have been .79%.
D Total distributions per share do not sum due to rounding.
E Total returns for periods of less than one year are not annualized.
F Total returns would have been lower if certain expenses had not been reduced during the applicable periods shown.
G Total returns do not include the effect of the sales charges.
H Fees and expenses of any underlying mutual funds or exchange-traded funds (ETFs) are not included in the Fund's expense ratio. The Fund indirectly bears its proportionate share of these expenses. For additional expense information related to investments in Fidelity Central Funds, please refer to the "Investments in Fidelity Central Funds" note found in the Notes to Financial Statements section of the most recent Annual or Semi-Annual report.
I Expense ratios reflect operating expenses of the class. Expenses before reductions do not reflect amounts reimbursed, waived, or reduced through arrangements with the investment adviser, brokerage services, or other offset arrangements, if applicable, and do not represent the amount paid by the class during periods when reimbursements, waivers or reductions occur.
J Annualized
K On certain classes, the size and fluctuation of net assets and expense amounts may cause ratios to differ from contractual rates.
L Amount does not include the portfolio activity of any underlying mutual funds or exchange-traded funds (ETFs).
| Fidelity Advisor Freedom® Income Fund Class C |
| |
| | Six months ended (Unaudited) September 30, 2022 | | Years ended March 31, 2022 | | 2021 | | 2020 | | 2019 | | 2018 |
Selected Per-Share Data | | | | | | | | | | | | |
| Net asset value, beginning of period | $ | 10.72 | $ | 11.43 | $ | 10.47 | $ | 10.73 | $ | 10.98 | $ | 10.91 |
| Income from Investment Operations | | | | | | | | | | | | |
Net investment income (loss) A,B | | .08 | | .15 | | .01 | | .10 | | .12 | | .07 |
| Net realized and unrealized gain (loss) | | (1.23) | | (.33) | | 1.29 | | (.06) C | | .12 | | .33 |
| Total from investment operations | | (1.15) | | (.18) | | 1.30 | | .04 | | .24 | | .40 |
| Distributions from net investment income | | - D | | (.20) | | (.04) | | (.10) | | (.11) | | (.07) |
| Distributions from net realized gain | | (.24) | | (.34) | | (.30) | | (.20) | | (.38) | | (.26) |
| Total distributions | | (.25) E | | (.53) E | | (.34) | | (.30) | | (.49) | | (.33) |
| Net asset value, end of period | $ | 9.32 | $ | 10.72 | $ | 11.43 | $ | 10.47 | $ | 10.73 | $ | 10.98 |
Total Return F,G,H | | (10.91)% | | (1.75)% | | 12.49% | | .30% C | | 2.35% | | 3.69% |
Ratios to Average Net Assets B,I,J | | | | | | | | | | | | |
| Expenses before reductions | | 1.47% K | | 1.47% | | 1.47% | | 1.46% L | | 1.46% L | | 1.39% |
| Expenses net of fee waivers, if any | | 1.47% K | | 1.47% | | 1.47% | | 1.46% L | | 1.46% B,L | | 1.39% |
| Expenses net of all reductions | | 1.47% K | | 1.47% | | 1.46% | | 1.46% L | | 1.46% L | | 1.39% |
| Net investment income (loss) | | 1.60% K | | 1.36% | | .05% | | .89% | | 1.09% | | .63% |
| Supplemental Data | | | | | | | | | | | | |
| Net assets, end of period (000 omitted) | $ | 4,948 | $ | 6,378 | $ | 8,255 | $ | 7,918 | $ | 8,915 | $ | 13,727 |
Portfolio turnover rate M | | 33% K | | 47% | | 29% | | 25% | | 36% | | 21% |
A Calculated based on average shares outstanding during the period.
B Net investment income (loss) is affected by the timing of the declaration of dividends by any underlying mutual funds or exchange-traded funds (ETFs). Net investment income (loss) of any such underlying funds is not included in the Fund's net investment income (loss) ratio.
C Amount includes a reimbursement from the investment adviser for an operational error which amounted to less than $.01 per share. Excluding this reimbursement, the total return would have been .19%.
D Amount represents less than $.005 per share.
E Total distributions per share do not sum due to rounding.
F Total returns for periods of less than one year are not annualized.
G Total returns would have been lower if certain expenses had not been reduced during the applicable periods shown.
H Total returns do not include the effect of the contingent deferred sales charge.
I Fees and expenses of any underlying mutual funds or exchange-traded funds (ETFs) are not included in the Fund's expense ratio. The Fund indirectly bears its proportionate share of these expenses. For additional expense information related to investments in Fidelity Central Funds, please refer to the "Investments in Fidelity Central Funds" note found in the Notes to Financial Statements section of the most recent Annual or Semi-Annual report.
J Expense ratios reflect operating expenses of the class. Expenses before reductions do not reflect amounts reimbursed, waived, or reduced through arrangements with the investment adviser, brokerage services, or other offset arrangements, if applicable, and do not represent the amount paid by the class during periods when reimbursements, waivers or reductions occur.
K Annualized
L On certain classes, the size and fluctuation of net assets and expense amounts may cause ratios to differ from contractual rates.
M Amount does not include the portfolio activity of any underlying mutual funds or exchange-traded funds (ETFs).
| Fidelity Advisor Freedom® Income Fund Class I |
| |
| | Six months ended (Unaudited) September 30, 2022 | | Years ended March 31, 2022 | | 2021 | | 2020 | | 2019 | | 2018 |
Selected Per-Share Data | | | | | | | | | | | | |
| Net asset value, beginning of period | $ | 10.86 | $ | 11.53 | $ | 10.53 | $ | 10.79 | $ | 11.05 | $ | 10.98 |
| Income from Investment Operations | | | | | | | | | | | | |
Net investment income (loss) A,B | | .13 | | .27 | | .12 | | .21 | | .23 | | .18 |
| Net realized and unrealized gain (loss) | | (1.25) | | (.34) | | 1.31 | | (.06) C | | .11 | | .33 |
| Total from investment operations | | (1.12) | | (.07) | | 1.43 | | .15 | | .34 | | .51 |
| Distributions from net investment income | | (.05) | | (.26) | | (.13) | | (.21) | | (.22) | | (.18) |
| Distributions from net realized gain | | (.24) | | (.34) | | (.30) | | (.20) | | (.38) | | (.26) |
| Total distributions | | (.29) | | (.60) | | (.43) | | (.41) | | (.60) | | (.44) |
| Net asset value, end of period | $ | 9.45 | $ | 10.86 | $ | 11.53 | $ | 10.53 | $ | 10.79 | $ | 11.05 |
Total Return D,E | | (10.48)% | | (.80)% | | 13.72% | | 1.30% C | | 3.30% | | 4.70% |
Ratios to Average Net Assets B,F,G | | | | | | | | | | | | |
| Expenses before reductions | | .47% H | | .46% I | | .46% I | | .47% | | .46% I | | .39% |
| Expenses net of fee waivers, if any | | .47% H | | .46% I | | .46% I | | .47% | | .46% I | | .39% |
| Expenses net of all reductions | | .47% H | | .46% I | | .46% I | | .47% | | .46% I | | .39% |
| Net investment income (loss) | | 2.60% H | | 2.36% | | 1.05% | | 1.89% | | 2.09% | | 1.63% |
| Supplemental Data | | | | | | | | | | | | |
| Net assets, end of period (000 omitted) | $ | 68,935 | $ | 79,536 | $ | 87,775 | $ | 83,215 | $ | 82,975 | $ | 83,723 |
Portfolio turnover rate J | | 33% H | | 47% | | 29% | | 25% | | 36% | | 21% |
A Calculated based on average shares outstanding during the period.
B Net investment income (loss) is affected by the timing of the declaration of dividends by any underlying mutual funds or exchange-traded funds (ETFs). Net investment income (loss) of any such underlying funds is not included in the Fund's net investment income (loss) ratio.
C Amount includes a reimbursement from the investment adviser for an operational error which amounted to less than $.01 per share. Excluding this reimbursement, the total return would have been 1.19%.
D Total returns for periods of less than one year are not annualized.
E Total returns would have been lower if certain expenses had not been reduced during the applicable periods shown.
F Fees and expenses of any underlying mutual funds or exchange-traded funds (ETFs) are not included in the Fund's expense ratio. The Fund indirectly bears its proportionate share of these expenses. For additional expense information related to investments in Fidelity Central Funds, please refer to the "Investments in Fidelity Central Funds" note found in the Notes to Financial Statements section of the most recent Annual or Semi-Annual report.
G Expense ratios reflect operating expenses of the class. Expenses before reductions do not reflect amounts reimbursed, waived, or reduced through arrangements with the investment adviser, brokerage services, or other offset arrangements, if applicable, and do not represent the amount paid by the class during periods when reimbursements, waivers or reductions occur.
H Annualized
I On certain classes, the size and fluctuation of net assets and expense amounts may cause ratios to differ from contractual rates.
J Amount does not include the portfolio activity of any underlying mutual funds or exchange-traded funds (ETFs).
| Fidelity Advisor Freedom® Income Fund Class Z |
| |
| | Six months ended (Unaudited) September 30, 2022 | | Years ended March 31, 2022 | | 2021 | | 2020 | | 2019 A |
Selected Per-Share Data | | | | | | | | | | |
| Net asset value, beginning of period | $ | 10.85 | $ | 11.52 | $ | 10.53 | $ | 10.79 | $ | 10.91 |
| Income from Investment Operations | | | | | | | | | | |
Net investment income (loss) B,C | | .13 | | .28 | | .12 | | .21 | | .24 |
| Net realized and unrealized gain (loss) | | (1.24) | | (.34) | | 1.31 | | (.05) D | | .01 |
| Total from investment operations | | (1.11) | | (.06) | | 1.43 | | .16 | | .25 |
| Distributions from net investment income | | (.05) | | (.27) | | (.14) | | (.22) | | (.15) |
| Distributions from net realized gain | | (.24) | | (.34) | | (.30) | | (.20) | | (.22) |
| Total distributions | | (.30) E | | (.61) | | (.44) | | (.42) | | (.37) |
| Net asset value, end of period | $ | 9.44 | $ | 10.85 | $ | 11.52 | $ | 10.53 | $ | 10.79 |
Total Return F,G | | (10.44)% | | (.75)% | | 13.72% | | 1.36% D | | 2.47% |
Ratios to Average Net Assets C,H,I | | | | | | | | | | |
| Expenses before reductions | | .41% J,K | | .41% J | | .42% | | .42% | | .42% K |
| Expenses net of fee waivers, if any | | .41% J,K | | .41% J | | .42% | | .42% | | .42% K |
| Expenses net of all reductions | | .41% J,K | | .41% J | | .42% | | .42% | | .42% K |
| Net investment income (loss) | | 2.65% K | | 2.41% | | 1.10% | | 1.94% | | 4.60% K |
| Supplemental Data | | | | | | | | | | |
| Net assets, end of period (000 omitted) | $ | 6,849 | $ | 7,064 | $ | 8,919 | $ | 3,128 | $ | 765 |
Portfolio turnover rate L | | 33% K | | 47% | | 29% | | 25% | | 36% |
A For the period October 2, 2018 (commencement of sale of shares) through March 31, 2019.
B Calculated based on average shares outstanding during the period.
C Net investment income (loss) is affected by the timing of the declaration of dividends by any underlying mutual funds or exchange-traded funds (ETFs). Net investment income (loss) of any such underlying funds is not included in the Fund's net investment income (loss) ratio.
D Amount includes a reimbursement from the investment adviser for an operational error which amounted to less than $.01 per share. Excluding this reimbursement, the total return would have been 1.25%.
E Total distributions per share do not sum due to rounding.
F Total returns for periods of less than one year are not annualized.
G Total returns would have been lower if certain expenses had not been reduced during the applicable periods shown.
H Fees and expenses of any underlying mutual funds or exchange-traded funds (ETFs) are not included in the Fund's expense ratio. The Fund indirectly bears its proportionate share of these expenses. For additional expense information related to investments in Fidelity Central Funds, please refer to the "Investments in Fidelity Central Funds" note found in the Notes to Financial Statements section of the most recent Annual or Semi-Annual report.
I Expense ratios reflect operating expenses of the class. Expenses before reductions do not reflect amounts reimbursed, waived, or reduced through arrangements with the investment adviser, brokerage services, or other offset arrangements, if applicable, and do not represent the amount paid by the class during periods when reimbursements, waivers or reductions occur.
J On certain classes, the size and fluctuation of net assets and expense amounts may cause ratios to differ from contractual rates.
K Annualized
L Amount does not include the portfolio activity of any underlying mutual funds or exchange-traded funds (ETFs).
| Fidelity Advisor Freedom® Income Fund Class Z6 |
| |
| | Six months ended (Unaudited) September 30, 2022 | | Years ended March 31, 2022 | | 2021 | | 2020 | | 2019 | | 2018 A |
Selected Per-Share Data | | | | | | | | | | | | |
| Net asset value, beginning of period | $ | 10.85 | $ | 11.52 | $ | 10.52 | $ | 10.78 | $ | 11.04 | $ | 11.09 |
| Income from Investment Operations | | | | | | | | | | | | |
Net investment income (loss) B,C | | .14 | | .28 | | .13 | | .22 | | .23 | | .27 |
| Net realized and unrealized gain (loss) | | (1.25) | | (.34) | | 1.31 | | (.06) D | | .13 | | .03 |
| Total from investment operations | | (1.11) | | (.06) | | 1.44 | | .16 | | .36 | | .30 |
| Distributions from net investment income | | (.05) | | (.27) | | (.14) | | (.22) | | (.24) | | (.16) |
| Distributions from net realized gain | | (.24) | | (.34) | | (.30) | | (.20) | | (.38) | | (.19) |
| Total distributions | | (.30) E | | (.61) | | (.44) | | (.42) | | (.62) | | (.35) |
| Net asset value, end of period | $ | 9.44 | $ | 10.85 | $ | 11.52 | $ | 10.52 | $ | 10.78 | $ | 11.04 |
Total Return F,G | | (10.44)% | | (.71)% | | 13.87% | | 1.38% D | | 3.48% | | 2.69% |
Ratios to Average Net Assets C,H,I | | | | | | | | | | | | |
| Expenses before reductions | | .37% J,K | | .36% K | | .37% | | .36% K | | .37% | | .37% J |
| Expenses net of fee waivers, if any | | .37% J,K | | .36% K | | .37% | | .36% K | | .37% | | .37% J |
| Expenses net of all reductions | | .36% J,K | | .36% K | | .37% | | .36% K | | .37% | | .37% J |
| Net investment income (loss) | | 2.70% J | | 2.46% | | 1.15% | | 1.99% | | 2.19% | | 2.92% J |
| Supplemental Data | | | | | | | | | | | | |
| Net assets, end of period (000 omitted) | $ | 12,920 | $ | 13,984 | $ | 23,587 | $ | 21,248 | $ | 25,022 | $ | 1,693 |
Portfolio turnover rate L | | 33% J | | 47% | | 29% | | 25% | | 36% | | 21% |
A For the period June 6, 2017 (commencement of sale of shares) through March 31, 2018.
B Calculated based on average shares outstanding during the period.
C Net investment income (loss) is affected by the timing of the declaration of dividends by any underlying mutual funds or exchange-traded funds (ETFs). Net investment income (loss) of any such underlying funds is not included in the Fund's net investment income (loss) ratio.
D Amount includes a reimbursement from the investment adviser for an operational error which amounted to less than $.01 per share. Excluding this reimbursement, the total return would have been 1.27%.
E Total distributions per share do not sum due to rounding.
F Total returns for periods of less than one year are not annualized.
G Total returns would have been lower if certain expenses had not been reduced during the applicable periods shown.
H Expense ratios reflect operating expenses of the class. Expenses before reductions do not reflect amounts reimbursed, waived, or reduced through arrangements with the investment adviser, brokerage services, or other offset arrangements, if applicable, and do not represent the amount paid by the class during periods when reimbursements, waivers or reductions occur.
I Fees and expenses of any underlying mutual funds or exchange-traded funds (ETFs) are not included in the Fund's expense ratio. The Fund indirectly bears its proportionate share of these expenses. For additional expense information related to investments in Fidelity Central Funds, please refer to the "Investments in Fidelity Central Funds" note found in the Notes to Financial Statements section of the most recent Annual or Semi-Annual report.
J Annualized
K On certain classes, the size and fluctuation of net assets and expense amounts may cause ratios to differ from contractual rates.
L Amount does not include the portfolio activity of any underlying mutual funds or exchange-traded funds (ETFs).
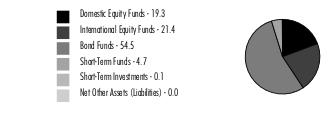
The information in the following table is based on the direct Investments of the Fund.
Top Holdings (% of Fund's net assets) |
| |
| Fidelity Series Investment Grade Bond Fund | 38.4 | |
| Fidelity Series 0-5 Year Inflation-Protected Bond Index Fund | 18.8 | |
| Fidelity Series Government Money Market Fund 3.00% | 8.2 | |
| Fidelity Series Emerging Markets Opportunities Fund | 5.8 | |
| Fidelity Series International Developed Markets Bond Index Fund | 4.0 | |
| Fidelity Series Long-Term Treasury Bond Index Fund | 3.7 | |
| Fidelity Series Overseas Fund | 2.1 | |
| Fidelity Series International Value Fund | 2.1 | |
| Fidelity Series International Growth Fund | 2.1 | |
| Fidelity Series Short-Term Credit Fund | 2.0 | |
| | 87.2 | |
| |
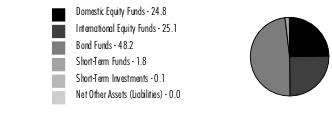
Asset Allocation (% of Fund's net assets) |
|
Percentages shown as 0.0% may reflect amounts less than 0.05%. |
|
Domestic Equity Funds category includes Fidelity Series Commodity Strategy Fund which invests in commodity-related investments.
Fidelity Advisor Freedom® 2005 Fund
Showing Percentage of Net Assets
| U.S. Treasury Obligations - 0.1% |
| | | Principal Amount (a) | Value ($) |
U.S. Treasury Bills, yield at date of purchase 3.15% to 3.29% 12/15/22 to 12/29/22 (b) (Cost $59,587) | | 60,000 | 59,623 |
| | | | |
| Domestic Equity Funds - 8.5% |
| | | Shares | Value ($) |
| Fidelity Advisor Series Equity Growth Fund (c) | | 89,366 | 1,085,794 |
| Fidelity Advisor Series Growth Opportunities Fund (c) | | 87,105 | 763,914 |
| Fidelity Advisor Series Small Cap Fund (c) | | 44,801 | 469,069 |
| Fidelity Series All-Sector Equity Fund (c) | | 49,673 | 426,194 |
| Fidelity Series Commodity Strategy Fund (c) | | 649,925 | 1,358,344 |
| Fidelity Series Large Cap Stock Fund (c) | | 112,404 | 1,660,214 |
| Fidelity Series Large Cap Value Index Fund (c) | | 14,019 | 178,320 |
| Fidelity Series Opportunistic Insights Fund (c) | | 69,446 | 986,821 |
| Fidelity Series Small Cap Opportunities Fund (c) | | 51,981 | 560,354 |
| Fidelity Series Stock Selector Large Cap Value Fund (c) | | 94,245 | 1,052,719 |
| Fidelity Series Value Discovery Fund (c) | | 79,127 | 1,089,584 |
| TOTAL DOMESTIC EQUITY FUNDS (Cost $8,888,553) | | | 9,631,327 |
| | | | |
| International Equity Funds - 14.1% |
| | | Shares | Value ($) |
| Fidelity Series Canada Fund (c) | | 83,081 | 1,030,207 |
| Fidelity Series Emerging Markets Fund (c) | | 95,542 | 691,727 |
| Fidelity Series Emerging Markets Opportunities Fund (c) | | 452,450 | 6,569,572 |
| Fidelity Series International Growth Fund (c) | | 186,026 | 2,384,859 |
| Fidelity Series International Small Cap Fund (c) | | 45,341 | 620,261 |
| Fidelity Series International Value Fund (c) | | 278,669 | 2,393,765 |
| Fidelity Series Overseas Fund (c) | | 252,584 | 2,407,125 |
| TOTAL INTERNATIONAL EQUITY FUNDS (Cost $15,811,801) | | | 16,097,516 |
| | | | |
| Bond Funds - 67.1% |
| | | Shares | Value ($) |
| Fidelity Series 0-5 Year Inflation-Protected Bond Index Fund (c) | | 2,226,968 | 21,490,240 |
| Fidelity Series 5+ Year Inflation-Protected Bond Index Fund (c) | | 87,128 | 696,156 |
| Fidelity Series Emerging Markets Debt Fund (c) | | 83,985 | 576,135 |
| Fidelity Series Emerging Markets Debt Local Currency Fund (c) | | 23,814 | 189,801 |
| Fidelity Series Floating Rate High Income Fund (c) | | 13,251 | 115,285 |
| Fidelity Series High Income Fund (c) | | 78,217 | 616,348 |
| Fidelity Series International Credit Fund (c) | | 13,379 | 105,296 |
| Fidelity Series International Developed Markets Bond Index Fund (c) | | 530,978 | 4,523,934 |
| Fidelity Series Investment Grade Bond Fund (c) | | 4,480,613 | 43,730,781 |
| Fidelity Series Long-Term Treasury Bond Index Fund (c) | | 700,152 | 4,179,906 |
| Fidelity Series Real Estate Income Fund (c) | | 30,674 | 292,018 |
| TOTAL BOND FUNDS (Cost $84,950,634) | | | 76,515,900 |
| | | | |
| Short-Term Funds - 10.2% |
| | | Shares | Value ($) |
| Fidelity Cash Central Fund 3.10% (d) | | 81,922 | 81,939 |
| Fidelity Series Government Money Market Fund 3.00% (c)(e) | | 9,322,833 | 9,322,833 |
| Fidelity Series Short-Term Credit Fund (c) | | 239,459 | 2,270,068 |
| TOTAL SHORT-TERM FUNDS (Cost $11,779,176) | | | 11,674,840 |
| | | | |
| TOTAL INVESTMENT IN SECURITIES - 100.0% (Cost $121,489,751) | 113,979,206 |
NET OTHER ASSETS (LIABILITIES) - 0.0% | (1,815) |
| NET ASSETS - 100.0% | 113,977,391 |
| | |
| Futures Contracts |
| | Number of contracts | Expiration Date | Notional Amount ($) | Value ($) | Unrealized Appreciation/ (Depreciation) ($) |
| Purchased | | | | | |
| | | | | | |
| Treasury Contracts | | | | | |
| CBOT 10-Year U.S. Treasury Note Contracts (United States) | 19 | Dec 2022 | 2,129,188 | (130,998) | (130,998) |
| CBOT Ultra Long Term U.S. Treasury Bond Contracts (United States) | 2 | Dec 2022 | 274,000 | (2,926) | (2,926) |
| | | | | | |
| TOTAL PURCHASED | | | | | (133,924) |
| | | | | | |
| Sold | | | | | |
| | | | | | |
| Equity Index Contracts | | | | | |
| CME E-mini S&P 500 Index Contracts (United States) | 3 | Dec 2022 | 540,225 | 11,857 | 11,857 |
| ICE E-mini MSCI EAFE Index Contracts (United States) | 5 | Dec 2022 | 415,150 | 35,096 | 35,096 |
| ICE E-mini MSCI Emerging Markets Index Contracts (United States) | 3 | Dec 2022 | 130,725 | 70 | 70 |
| | | | | | |
| TOTAL SOLD | | | | | 47,023 |
| | | | | | |
| TOTAL FUTURES CONTRACTS | | | | | (86,901) |
| The notional amount of futures purchased as a percentage of Net Assets is 2.1% |
| The notional amount of futures sold as a percentage of Net Assets is 1.0% |
Legend
| (a) | Amount is stated in United States dollars unless otherwise noted. |
| (b) | Security or a portion of the security was pledged to cover margin requirements for futures contracts. At period end, the value of securities pledged amounted to $59,623. |
| (d) | Affiliated fund that is generally available only to investment companies and other accounts managed by Fidelity Investments. The rate quoted is the annualized seven-day yield of the fund at period end. A complete unaudited listing of the fund's holdings as of its most recent quarter end is available upon request. In addition, each Fidelity Central Fund's financial statements are available on the SEC's website or upon request. |
| (e) | The rate quoted is the annualized seven-day yield of the fund at period end. |
Affiliated Central Funds
Fiscal year to date information regarding the Fund's investments in Fidelity Central Funds, including the ownership percentage, is presented below.
| Affiliate | Value, beginning of period ($) | Purchases ($) | Sales Proceeds ($) | Dividend Income ($) | Realized Gain (loss) ($) | Change in Unrealized appreciation (depreciation) ($) | Value, end of period ($) | %ownership, end of period |
| Fidelity Cash Central Fund 3.10% | 55,815 | 629,396 | 603,272 | 1,128 | - | - | 81,939 | 0.0% |
| Total | 55,815 | 629,396 | 603,272 | 1,128 | - | - | 81,939 | |
| | | | | | | | | |
Amounts in the income column in the above table include any capital gain distributions from underlying funds, which are presented in the corresponding line item in the Statement of Operations, if applicable.
Affiliated Underlying Funds
Fiscal year to date information regarding the Fund's investments in affiliated Underlying Funds is presented below. Exchanges between classes of the same affiliated Underlying Funds may occur. If an Underlying Funds changes its name, the name presented below is the name in effect at period end.
| Affiliate | Value, beginning of period ($) | Purchases ($) | Sales Proceeds ($) | Dividend Income ($) | Realized Gain (loss) ($) | Change in Unrealized appreciation (depreciation) ($) | Value, end of period ($) |
| Fidelity Advisor Series Equity Growth Fund | 1,435,837 | 223,414 | 282,107 | - | (16,126) | (275,224) | 1,085,794 |
| Fidelity Advisor Series Growth Opportunities Fund | 984,605 | 271,778 | 217,234 | - | (27,320) | (247,915) | 763,914 |
| Fidelity Advisor Series Small Cap Fund | 651,729 | 74,802 | 142,942 | - | (10,834) | (103,686) | 469,069 |
| Fidelity Series 0-5 Year Inflation-Protected Bond Index Fund | 20,907,595 | 5,530,599 | 4,066,421 | - | (48,959) | (832,574) | 21,490,240 |
| Fidelity Series 5+ Year Inflation-Protected Bond Index Fund | 1,031,370 | 1,090,884 | 1,265,089 | - | (74,303) | (86,706) | 696,156 |
| Fidelity Series All-Sector Equity Fund | 615,810 | 34,338 | 106,039 | - | (8,193) | (109,722) | 426,194 |
| Fidelity Series Canada Fund | 1,362,090 | 106,948 | 179,279 | - | 2,963 | (262,515) | 1,030,207 |
| Fidelity Series Commodity Strategy Fund | 2,118,309 | 1,161,956 | 802,050 | 961,240 | (126,413) | (993,458) | 1,358,344 |
| Fidelity Series Emerging Markets Debt Fund | 731,304 | 63,604 | 100,752 | 17,727 | (18,063) | (99,958) | 576,135 |
| Fidelity Series Emerging Markets Debt Local Currency Fund | 241,705 | 7,561 | 33,180 | - | (6,006) | (20,279) | 189,801 |
| Fidelity Series Emerging Markets Fund | 908,970 | 98,964 | 120,715 | - | (8,338) | (187,154) | 691,727 |
| Fidelity Series Emerging Markets Opportunities Fund | 8,189,517 | 1,158,990 | 1,085,346 | - | (91,631) | (1,601,958) | 6,569,572 |
| Fidelity Series Floating Rate High Income Fund | 145,049 | 7,873 | 30,612 | 3,425 | (1,232) | (5,793) | 115,285 |
| Fidelity Series Government Money Market Fund 3.00% | 13,492,074 | 751,099 | 4,920,340 | 66,605 | - | - | 9,322,833 |
| Fidelity Series High Income Fund | 859,033 | 44,492 | 184,513 | 19,664 | (7,013) | (95,651) | 616,348 |
| Fidelity Series Inflation-Protected Bond Index Fund | 2,727,543 | 31,496 | 2,709,283 | 14,159 | 69,545 | (119,301) | - |
| Fidelity Series International Credit Fund | 122,111 | 1,667 | - | 1,667 | - | (18,482) | 105,296 |
| Fidelity Series International Developed Markets Bond Index Fund | 4,388,303 | 1,273,324 | 718,003 | 7,026 | (36,237) | (383,453) | 4,523,934 |
| Fidelity Series International Growth Fund | 3,109,470 | 471,654 | 511,790 | - | (72,298) | (612,177) | 2,384,859 |
| Fidelity Series International Small Cap Fund | 852,805 | 86,557 | 126,824 | - | (34,301) | (157,976) | 620,261 |
| Fidelity Series International Value Fund | 3,141,037 | 400,685 | 493,530 | - | (31,695) | (622,732) | 2,393,765 |
| Fidelity Series Investment Grade Bond Fund | 55,392,046 | 2,768,543 | 8,954,415 | 703,880 | (576,067) | (4,899,326) | 43,730,781 |
| Fidelity Series Large Cap Stock Fund | 2,259,110 | 362,722 | 495,008 | 100,504 | 79,946 | (546,556) | 1,660,214 |
| Fidelity Series Large Cap Value Index Fund | 244,343 | 21,100 | 49,010 | - | 9,029 | (47,142) | 178,320 |
| Fidelity Series Long-Term Treasury Bond Index Fund | 5,351,573 | 708,726 | 724,014 | 60,602 | (61,472) | (1,094,907) | 4,179,906 |
| Fidelity Series Opportunistic Insights Fund | 1,326,831 | 209,675 | 265,668 | - | (20,232) | (263,785) | 986,821 |
| Fidelity Series Overseas Fund | 3,126,870 | 498,202 | 463,976 | - | (54,940) | (699,031) | 2,407,125 |
| Fidelity Series Real Estate Income Fund | 522,278 | 33,368 | 197,563 | 21,836 | 11,181 | (77,246) | 292,018 |
| Fidelity Series Short-Term Credit Fund | 3,379,362 | 138,620 | 1,175,053 | 20,809 | (27,290) | (45,571) | 2,270,068 |
| Fidelity Series Small Cap Opportunities Fund | 804,665 | 52,830 | 140,884 | 26,398 | (8,038) | (148,219) | 560,354 |
| Fidelity Series Stock Selector Large Cap Value Fund | 1,441,992 | 150,705 | 313,762 | - | 28,983 | (255,199) | 1,052,719 |
| Fidelity Series Value Discovery Fund | 1,468,683 | 124,023 | 320,635 | - | 60,874 | (243,361) | 1,089,584 |
| | 143,334,019 | 17,961,199 | 31,196,037 | 2,025,542 | (1,104,480) | (15,157,057) | 113,837,644 |
Amounts in the income column in the above table include any capital gain distributions from underlying funds, which are presented in the corresponding line item in the Statement of Operations, if applicable.
Purchases and Sales Proceeds in the table above include the value of shares purchased or redeemed through in-kind transactions, if applicable.
Investment Valuation
The following is a summary of the inputs used, as of September 30, 2022, involving the Fund's assets and liabilities carried at fair value. The inputs or methodology used for valuing securities may not be an indication of the risk associated with investing in those securities. For more information on valuation inputs, and their aggregation into the levels used below, please refer to the Investment Valuation section in the accompanying Notes to Financial Statements.
| Valuation Inputs at Reporting Date: |
| Description | Total ($) | Level 1 ($) | Level 2 ($) | Level 3 ($) |
Investments in Securities: | | | | |
|
| Other Short-Term Investments | 59,623 | - | 59,623 | - |
|
| Domestic Equity Funds | 9,631,327 | 9,631,327 | - | - |
|
| International Equity Funds | 16,097,516 | 16,097,516 | - | - |
|
| Bond Funds | 76,515,900 | 76,515,900 | - | - |
|
| Short-Term Funds | 11,674,840 | 11,674,840 | - | - |
| Total Investments in Securities: | 113,979,206 | 113,919,583 | 59,623 | - |
Derivative Instruments: | | | | |
|
| Assets | | | | |
Futures Contracts | 47,023 | 47,023 | - | - |
| Total Assets | 47,023 | 47,023 | - | - |
|
| Liabilities | | | | |
Futures Contracts | (133,924) | (133,924) | - | - |
| Total Liabilities | (133,924) | (133,924) | - | - |
| Total Derivative Instruments: | (86,901) | (86,901) | - | - |
Value of Derivative Instruments
The following table is a summary of the Fund's value of derivative instruments by primary risk exposure as of September 30, 2022. For additional information on derivative instruments, please refer to the Derivative Instruments section in the accompanying Notes to Financial Statements.
Primary Risk Exposure / Derivative Type | Value |
| Asset ($) | Liability ($) |
| Equity Risk | | |
Futures Contracts (a) | 47,023 | 0 |
| Total Equity Risk | 47,023 | 0 |
| Interest Rate Risk | | |
Futures Contracts (a) | 0 | (133,924) |
| Total Interest Rate Risk | 0 | (133,924) |
| Total Value of Derivatives | 47,023 | (133,924) |
(a)Reflects gross cumulative appreciation (depreciation) on futures contracts as presented in the Schedule of Investments. In the Statement of Assets and Liabilities, the period end daily variation margin is included in receivable or payable for daily variation margin on futures contracts, and the net cumulative appreciation (depreciation) is included in Total accumulated earnings (loss).
Fidelity Advisor Freedom® 2005 Fund
| Statement of Assets and Liabilities |
| | | | September 30, 2022 (Unaudited) |
| | | | | |
| Assets | | | | |
| Investment in securities, at value - See accompanying schedule: | $ | | | |
Unaffiliated issuers (cost $59,587) | | $59,623 | | |
Fidelity Central Funds (cost $81,939) | | 81,939 | | |
Other affiliated issuers (cost $121,348,225) | | 113,837,644 | | |
| | | | | |
| Total Investment in Securities (cost $121,489,751) | | | $ | 113,979,206 |
| Cash | | | | 21,697 |
| Receivable for investments sold | | | | 955,222 |
| Receivable for fund shares sold | | | | 56,378 |
| Distributions receivable from Fidelity Central Funds | | | | 284 |
| Receivable for daily variation margin on futures contracts | | | | 108 |
Total assets | | | | 115,012,895 |
| Liabilities | | | | |
| Payable for investments purchased | | 740,731 | | |
| Payable for fund shares redeemed | | 228,937 | | |
| Accrued management fee | | 45,102 | | |
| Distribution and service plan fees payable | | 18,889 | | |
| Payable for daily variation margin on futures contracts | | 1,845 | | |
| Total Liabilities | | | | 1,035,504 |
| Net Assets | | | $ | 113,977,391 |
| Net Assets consist of: | | | | |
| Paid in capital | | | $ | 121,615,591 |
| Total accumulated earnings (loss) | | | | (7,638,200) |
| Net Assets | | | $ | 113,977,391 |
| | | | | |
| Net Asset Value and Maximum Offering Price | | | | |
| Class A : | | | | |
Net Asset Value and redemption price per share ($45,587,164 ÷ 4,759,846 shares) (a) | | | $ | 9.58 |
| Maximum offering price per share (100/94.25 of $9.58) | | | $ | 10.16 |
| Class M : | | | | |
Net Asset Value and redemption price per share ($19,143,921 ÷ 2,004,421 shares) (a) | | | $ | 9.55 |
| Maximum offering price per share (100/96.50 of $9.55) | | | $ | 9.90 |
| Class C : | | | | |
Net Asset Value and offering price per share ($748,584 ÷ 78,234 shares) (a) | | | $ | 9.57 |
| Class I : | | | | |
Net Asset Value , offering price and redemption price per share ($36,121,877 ÷ 3,738,472 shares) | | | $ | 9.66 |
| Class Z : | | | | |
Net Asset Value , offering price and redemption price per share ($6,080,283 ÷ 633,784 shares) | | | $ | 9.59 |
| Class Z6 : | | | | |
Net Asset Value , offering price and redemption price per share ($6,295,562 ÷ 654,544 shares) | | | $ | 9.62 |
(a)Redemption price per share is equal to net asset value less any applicable contingent deferred sales charge. |
| Statement of Operations |
| | | | Six months ended September 30, 2022 (Unaudited) |
| Investment Income | | | | |
| Dividends: | | | | |
| Affiliated issuers | | | $ | 1,910,091 |
| Interest | | | | 553 |
| Income from Fidelity Central Funds | | | | 1,128 |
| Total Income | | | | 1,911,772 |
| Expenses | | | | |
| Management fee | $ | 291,606 | | |
| Distribution and service plan fees | | 122,621 | | |
| Independent trustees' fees and expenses | | 223 | | |
| Total expenses before reductions | | 414,450 | | |
| Expense reductions | | (61) | | |
| Total expenses after reductions | | | | 414,389 |
| Net Investment income (loss) | | | | 1,497,383 |
| Realized and Unrealized Gain (Loss) | | | | |
| Net realized gain (loss) on: | | | | |
| Investment Securities: | | | | |
| Unaffiliated issuers | | 8 | | |
| Affiliated issuers | | (1,104,480) | | |
| Futures contracts | | (22,239) | | |
| Capital gain distributions from underlying funds: | | | | |
| Affiliated issuers | | 115,451 | | |
| Total net realized gain (loss) | | | | (1,011,260) |
| Change in net unrealized appreciation (depreciation) on: | | | | |
| Investment Securities: | | | | |
| Unaffiliated issuers | | 37 | | |
| Affiliated issuers | | (15,157,057) | | |
| Futures contracts | | (128,070) | | |
| Total change in net unrealized appreciation (depreciation) | | | | (15,285,090) |
| Net gain (loss) | | | | (16,296,350) |
| Net increase (decrease) in net assets resulting from operations | | | $ | (14,798,967) |
| Statement of Changes in Net Assets |
| |
| | Six months ended September 30, 2022 (Unaudited) | | Year ended March 31, 2022 |
| Increase (Decrease) in Net Assets | | | | |
| Operations | | | | |
| Net investment income (loss) | $ | 1,497,383 | $ | 3,331,846 |
| Net realized gain (loss) | | (1,011,260) | | 6,843,136 |
| Change in net unrealized appreciation (depreciation) | | (15,285,090) | | (10,720,439) |
| Net increase (decrease) in net assets resulting from operations | | (14,798,967) | | (545,457) |
| Distributions to shareholders | | (3,733,968) | | (10,944,435) |
| Share transactions - net increase (decrease) | | (10,916,771) | | (7,545,903) |
| Total increase (decrease) in net assets | | (29,449,706) | | (19,035,795) |
| | | | | |
| Net Assets | | | | |
| Beginning of period | | 143,427,097 | | 162,462,892 |
| End of period | $ | 113,977,391 | $ | 143,427,097 |
| | | | | |
| | | | | |
Financial Highlights
| Fidelity Advisor Freedom® 2005 Fund Class A |
| |
| | Six months ended (Unaudited) September 30, 2022 | | Years ended March 31, 2022 | | 2021 | | 2020 | | 2019 | | 2018 |
Selected Per-Share Data | | | | | | | | | | | | |
| Net asset value, beginning of period | $ | 11.07 | $ | 11.99 | $ | 10.85 | $ | 11.36 | $ | 11.92 | $ | 11.84 |
| Income from Investment Operations | | | | | | | | | | | | |
Net investment income (loss) A,B | | .12 | | .25 | | .10 | | .19 | | .21 | | .16 |
| Net realized and unrealized gain (loss) | | (1.31) | | (.33) | | 1.64 | | (.16) | | .14 | | .53 |
| Total from investment operations | | (1.19) | | (.08) | | 1.74 | | .03 | | .35 | | .69 |
| Distributions from net investment income | | (.01) | | (.26) | | (.11) | | (.20) | | (.22) | | (.17) |
| Distributions from net realized gain | | (.29) | | (.59) | | (.49) | | (.34) | | (.68) | | (.44) |
| Total distributions | | (.30) | | (.84) C | | (.60) | | (.54) | | (.91) C | | (.61) |
| Net asset value, end of period | $ | 9.58 | $ | 11.07 | $ | 11.99 | $ | 10.85 | $ | 11.36 | $ | 11.92 |
Total Return D,E,F | | (10.96)% | | (.90)% | | 16.31% | | .04% | | 3.24% | | 5.87% |
Ratios to Average Net Assets B,G,H | | | | | | | | | | | | |
| Expenses before reductions | | .72% I | | .72% | | .72% | | .72% | | .73% | | .66% |
| Expenses net of fee waivers, if any | | .72% I | | .72% | | .72% | | .72% | | .73% | | .66% |
| Expenses net of all reductions | | .72% I | | .72% | | .71% | | .72% | | .73% | | .66% |
| Net investment income (loss) | | 2.29% I | | 2.07% | | .81% | | 1.62% | | 1.80% | | 1.34% |
| Supplemental Data | | | | | | | | | | | | |
| Net assets, end of period (000 omitted) | $ | 45,587 | $ | 64,023 | $ | 76,060 | $ | 74,103 | $ | 86,981 | $ | 101,642 |
Portfolio turnover rate J | | 28% I | | 45% | | 31% | | 28% | | 28% | | 20% |
A Calculated based on average shares outstanding during the period.
B Net investment income (loss) is affected by the timing of the declaration of dividends by any underlying mutual funds or exchange-traded funds (ETFs). Net investment income (loss) of any such underlying funds is not included in the Fund's net investment income (loss) ratio.
C Total distributions per share do not sum due to rounding.
D Total returns for periods of less than one year are not annualized.
E Total returns would have been lower if certain expenses had not been reduced during the applicable periods shown.
F Total returns do not include the effect of the sales charges.
G Fees and expenses of any underlying mutual funds or exchange-traded funds (ETFs) are not included in the Fund's expense ratio. The Fund indirectly bears its proportionate share of these expenses. For additional expense information related to investments in Fidelity Central Funds, please refer to the "Investments in Fidelity Central Funds" note found in the Notes to Financial Statements section of the most recent Annual or Semi-Annual report.
H Expense ratios reflect operating expenses of the class. Expenses before reductions do not reflect amounts reimbursed, waived, or reduced through arrangements with the investment adviser, brokerage services, or other offset arrangements, if applicable, and do not represent the amount paid by the class during periods when reimbursements, waivers or reductions occur.
I Annualized
J Amount does not include the portfolio activity of any underlying mutual funds or exchange-traded funds (ETFs).
| Fidelity Advisor Freedom® 2005 Fund Class M |
| |
| | Six months ended (Unaudited) September 30, 2022 | | Years ended March 31, 2022 | | 2021 | | 2020 | | 2019 | | 2018 |
Selected Per-Share Data | | | | | | | | | | | | |
| Net asset value, beginning of period | $ | 11.05 | $ | 11.97 | $ | 10.83 | $ | 11.35 | $ | 11.91 | $ | 11.83 |
| Income from Investment Operations | | | | | | | | | | | | |
Net investment income (loss) A,B | | .10 | | .22 | | .07 | | .16 | | .18 | | .13 |
| Net realized and unrealized gain (loss) | | (1.31) | | (.32) | | 1.64 | | (.17) | | .14 | | .53 |
| Total from investment operations | | (1.21) | | (.10) | | 1.71 | | (.01) | | .32 | | .66 |
| Distributions from net investment income | | - C | | (.23) | | (.08) | | (.17) | | (.19) | | (.14) |
| Distributions from net realized gain | | (.29) | | (.59) | | (.49) | | (.34) | | (.68) | | (.44) |
| Total distributions | | (.29) | | (.82) | | (.57) | | (.51) | | (.88) D | | (.58) |
| Net asset value, end of period | $ | 9.55 | $ | 11.05 | $ | 11.97 | $ | 10.83 | $ | 11.35 | $ | 11.91 |
Total Return E,F,G | | (11.11)% | | (1.13)% | | 16.06% | | (.31)% | | 2.98% | | 5.64% |
Ratios to Average Net Assets B,H,I | | | | | | | | | | | | |
| Expenses before reductions | | .97% J | | .96% K | | .97% | | .97% | | .98% | | .91% |
| Expenses net of fee waivers, if any | | .97% J | | .96% K | | .97% | | .97% | | .98% | | .91% |
| Expenses net of all reductions | | .97% J | | .96% K | | .97% | | .97% | | .98% | | .91% |
| Net investment income (loss) | | 2.04% J | | 1.82% | | .56% | | 1.37% | | 1.55% | | 1.08% |
| Supplemental Data | | | | | | | | | | | | |
| Net assets, end of period (000 omitted) | $ | 19,144 | $ | 20,760 | $ | 21,606 | $ | 22,480 | $ | 24,132 | $ | 25,730 |
Portfolio turnover rate L | | 28% J | | 45% | | 31% | | 28% | | 28% | | 20% |
A Calculated based on average shares outstanding during the period.
B Net investment income (loss) is affected by the timing of the declaration of dividends by any underlying mutual funds or exchange-traded funds (ETFs). Net investment income (loss) of any such underlying funds is not included in the Fund's net investment income (loss) ratio.
C Amount represents less than $.005 per share.
D Total distributions per share do not sum due to rounding.
E Total returns for periods of less than one year are not annualized.
F Total returns would have been lower if certain expenses had not been reduced during the applicable periods shown.
G Total returns do not include the effect of the sales charges.
H Fees and expenses of any underlying mutual funds or exchange-traded funds (ETFs) are not included in the Fund's expense ratio. The Fund indirectly bears its proportionate share of these expenses. For additional expense information related to investments in Fidelity Central Funds, please refer to the "Investments in Fidelity Central Funds" note found in the Notes to Financial Statements section of the most recent Annual or Semi-Annual report.
I Expense ratios reflect operating expenses of the class. Expenses before reductions do not reflect amounts reimbursed, waived, or reduced through arrangements with the investment adviser, brokerage services, or other offset arrangements, if applicable, and do not represent the amount paid by the class during periods when reimbursements, waivers or reductions occur.
J Annualized
K On certain classes, the size and fluctuation of net assets and expense amounts may cause ratios to differ from contractual rates.
L Amount does not include the portfolio activity of any underlying mutual funds or exchange-traded funds (ETFs).
| Fidelity Advisor Freedom® 2005 Fund Class C |
| |
| | Six months ended (Unaudited) September 30, 2022 | | Years ended March 31, 2022 | | 2021 | | 2020 | | 2019 | | 2018 |
Selected Per-Share Data | | | | | | | | | | | | |
| Net asset value, beginning of period | $ | 11.09 | $ | 11.99 | $ | 10.85 | $ | 11.35 | $ | 11.91 | $ | 11.81 |
| Income from Investment Operations | | | | | | | | | | | | |
Net investment income (loss) A,B | | .08 | | .16 | | .01 | | .10 | | .12 | | .07 |
| Net realized and unrealized gain (loss) | | (1.32) | | (.32) | | 1.64 | | (.16) | | .13 | | .54 |
| Total from investment operations | | (1.24) | | (.16) | | 1.65 | | (.06) | | .25 | | .61 |
| Distributions from net investment income | | - | | (.16) | | (.02) | | (.10) | | (.12) | | (.07) |
| Distributions from net realized gain | | (.28) | | (.59) | | (.49) | | (.34) | | (.68) | | (.44) |
| Total distributions | | (.28) | | (.74) C | | (.51) | | (.44) | | (.81) C | | (.51) |
| Net asset value, end of period | $ | 9.57 | $ | 11.09 | $ | 11.99 | $ | 10.85 | $ | 11.35 | $ | 11.91 |
Total Return D,E,F | | (11.34)% | | (1.55)% | | 15.42% | | (.70)% | | 2.35% | | 5.21% |
Ratios to Average Net Assets B,G,H | | | | | | | | | | | | |
| Expenses before reductions | | 1.47% I | | 1.46% J | | 1.47% | | 1.47% | | 1.48% | | 1.41% |
| Expenses net of fee waivers, if any | | 1.47% I | | 1.46% J | | 1.47% | | 1.47% | | 1.48% | | 1.41% |
| Expenses net of all reductions | | 1.47% I | | 1.46% J | | 1.47% | | 1.47% | | 1.48% | | 1.41% |
| Net investment income (loss) | | 1.54% I | | 1.32% | | .06% | | .87% | | 1.05% | | .58% |
| Supplemental Data | | | | | | | | | | | | |
| Net assets, end of period (000 omitted) | $ | 749 | $ | 1,051 | $ | 1,360 | $ | 1,642 | $ | 2,302 | $ | 5,867 |
Portfolio turnover rate K | | 28% I | | 45% | | 31% | | 28% | | 28% | | 20% |
A Calculated based on average shares outstanding during the period.
B Net investment income (loss) is affected by the timing of the declaration of dividends by any underlying mutual funds or exchange-traded funds (ETFs). Net investment income (loss) of any such underlying funds is not included in the Fund's net investment income (loss) ratio.
C Total distributions per share do not sum due to rounding.
D Total returns for periods of less than one year are not annualized.
E Total returns would have been lower if certain expenses had not been reduced during the applicable periods shown.
F Total returns do not include the effect of the contingent deferred sales charge.
G Fees and expenses of any underlying mutual funds or exchange-traded funds (ETFs) are not included in the Fund's expense ratio. The Fund indirectly bears its proportionate share of these expenses. For additional expense information related to investments in Fidelity Central Funds, please refer to the "Investments in Fidelity Central Funds" note found in the Notes to Financial Statements section of the most recent Annual or Semi-Annual report.
H Expense ratios reflect operating expenses of the class. Expenses before reductions do not reflect amounts reimbursed, waived, or reduced through arrangements with the investment adviser, brokerage services, or other offset arrangements, if applicable, and do not represent the amount paid by the class during periods when reimbursements, waivers or reductions occur.
I Annualized
J On certain classes, the size and fluctuation of net assets and expense amounts may cause ratios to differ from contractual rates.
K Amount does not include the portfolio activity of any underlying mutual funds or exchange-traded funds (ETFs).
| Fidelity Advisor Freedom® 2005 Fund Class I |
| |
| | Six months ended (Unaudited) September 30, 2022 | | Years ended March 31, 2022 | | 2021 | | 2020 | | 2019 | | 2018 |
Selected Per-Share Data | | | | | | | | | | | | |
| Net asset value, beginning of period | $ | 11.16 | $ | 12.08 | $ | 10.93 | $ | 11.45 | $ | 12.00 | $ | 11.92 |
| Income from Investment Operations | | | | | | | | | | | | |
Net investment income (loss) A,B | | .13 | | .28 | | .13 | | .22 | | .24 | | .19 |
| Net realized and unrealized gain (loss) | | (1.33) | | (.33) | | 1.66 | | (.17) | | .14 | | .54 |
| Total from investment operations | | (1.20) | | (.05) | | 1.79 | | .05 | | .38 | | .73 |
| Distributions from net investment income | | (.02) | | (.29) | | (.15) | | (.23) | | (.25) | | (.20) |
| Distributions from net realized gain | | (.29) | | (.59) | | (.49) | | (.34) | | (.68) | | (.44) |
| Total distributions | | (.30) C | | (.87) C | | (.64) | | (.57) | | (.93) | | (.65) C |
| Net asset value, end of period | $ | 9.66 | $ | 11.16 | $ | 12.08 | $ | 10.93 | $ | 11.45 | $ | 12.00 |
Total Return D,E | | (10.89)% | | (.64)% | | 16.62% | | .21% | | 3.53% | | 6.13% |
Ratios to Average Net Assets B,F,G | | | | | | | | | | | | |
| Expenses before reductions | | .47% H | | .46% I | | .47% | | .47% | | .48% | | .41% |
| Expenses net of fee waivers, if any | | .47% H | | .46% I | | .47% | | .47% | | .48% | | .41% |
| Expenses net of all reductions | | .47% H | | .46% I | | .46% | | .47% | | .48% | | .41% |
| Net investment income (loss) | | 2.54% H | | 2.32% | | 1.06% | | 1.87% | | 2.05% | | 1.58% |
| Supplemental Data | | | | | | | | | | | | |
| Net assets, end of period (000 omitted) | $ | 36,122 | $ | 45,986 | $ | 54,932 | $ | 46,911 | $ | 49,013 | $ | 59,386 |
Portfolio turnover rate J | | 28% H | | 45% | | 31% | | 28% | | 28% | | 20% |
A Calculated based on average shares outstanding during the period.
B Net investment income (loss) is affected by the timing of the declaration of dividends by any underlying mutual funds or exchange-traded funds (ETFs). Net investment income (loss) of any such underlying funds is not included in the Fund's net investment income (loss) ratio.
C Total distributions per share do not sum due to rounding.
D Total returns for periods of less than one year are not annualized.
E Total returns would have been lower if certain expenses had not been reduced during the applicable periods shown.
F Fees and expenses of any underlying mutual funds or exchange-traded funds (ETFs) are not included in the Fund's expense ratio. The Fund indirectly bears its proportionate share of these expenses. For additional expense information related to investments in Fidelity Central Funds, please refer to the "Investments in Fidelity Central Funds" note found in the Notes to Financial Statements section of the most recent Annual or Semi-Annual report.
G Expense ratios reflect operating expenses of the class. Expenses before reductions do not reflect amounts reimbursed, waived, or reduced through arrangements with the investment adviser, brokerage services, or other offset arrangements, if applicable, and do not represent the amount paid by the class during periods when reimbursements, waivers or reductions occur.
H Annualized
I On certain classes, the size and fluctuation of net assets and expense amounts may cause ratios to differ from contractual rates.
J Amount does not include the portfolio activity of any underlying mutual funds or exchange-traded funds (ETFs).
| Fidelity Advisor Freedom® 2005 Fund Class Z |
| |
| | Six months ended (Unaudited) September 30, 2022 | | Years ended March 31, 2022 | | 2021 | | 2020 | | 2019 A |
Selected Per-Share Data | | | | | | | | | | |
| Net asset value, beginning of period | $ | 11.09 | $ | 12.01 | $ | 10.88 | $ | 11.41 | $ | 11.84 |
| Income from Investment Operations | | | | | | | | | | |
Net investment income (loss) B,C | | .13 | | .28 | | .13 | | .22 | | .20 |
| Net realized and unrealized gain (loss) | | (1.32) | | (.31) | | 1.64 | | (.16) | | .01 |
| Total from investment operations | | (1.19) | | (.03) | | 1.77 | | .06 | | .21 |
| Distributions from net investment income | | (.02) | | (.31) | | (.15) | | (.25) | | (.26) |
| Distributions from net realized gain | | (.29) | | (.59) | | (.49) | | (.34) | | (.39) |
| Total distributions | | (.31) | | (.89) D | | (.64) | | (.59) | | (.64) D |
| Net asset value, end of period | $ | 9.59 | $ | 11.09 | $ | 12.01 | $ | 10.88 | $ | 11.41 |
Total Return E,F | | (10.94)% | | (.48)% | | 16.59% | | .32% | | 2.09% |
Ratios to Average Net Assets C,G,H | | | | | | | | | | |
| Expenses before reductions | | .41% I,J | | .42% | | .41% J | | .42% | | .43% I |
| Expenses net of fee waivers, if any | | .41% I,J | | .42% | | .41% J | | .42% | | .43% I |
| Expenses net of all reductions | | .41% I,J | | .42% | | .41% J | | .42% | | .43% I |
| Net investment income (loss) | | 2.59% I | | 2.37% | | 1.11% | | 1.92% | | 3.58% I |
| Supplemental Data | | | | | | | | | | |
| Net assets, end of period (000 omitted) | $ | 6,080 | $ | 5,885 | $ | 4,101 | $ | 2,851 | $ | 126 |
Portfolio turnover rate K | | 28% I | | 45% | | 31% | | 28% | | 28% |
A For the period October 2, 2018 (commencement of sale of shares) through March 31, 2019.
B Calculated based on average shares outstanding during the period.
C Net investment income (loss) is affected by the timing of the declaration of dividends by any underlying mutual funds or exchange-traded funds (ETFs). Net investment income (loss) of any such underlying funds is not included in the Fund's net investment income (loss) ratio.
D Total distributions per share do not sum due to rounding.
E Total returns for periods of less than one year are not annualized.
F Total returns would have been lower if certain expenses had not been reduced during the applicable periods shown.
G Fees and expenses of any underlying mutual funds or exchange-traded funds (ETFs) are not included in the Fund's expense ratio. The Fund indirectly bears its proportionate share of these expenses. For additional expense information related to investments in Fidelity Central Funds, please refer to the "Investments in Fidelity Central Funds" note found in the Notes to Financial Statements section of the most recent Annual or Semi-Annual report.
H Expense ratios reflect operating expenses of the class. Expenses before reductions do not reflect amounts reimbursed, waived, or reduced through arrangements with the investment adviser, brokerage services, or other offset arrangements, if applicable, and do not represent the amount paid by the class during periods when reimbursements, waivers or reductions occur.
I Annualized
J On certain classes, the size and fluctuation of net assets and expense amounts may cause ratios to differ from contractual rates.
K Amount does not include the portfolio activity of any underlying mutual funds or exchange-traded funds (ETFs).
| Fidelity Advisor Freedom® 2005 Fund Class Z6 |
| |
| | Six months ended (Unaudited) September 30, 2022 | | Years ended March 31, 2022 | | 2021 | | 2020 | | 2019 | | 2018 A |
Selected Per-Share Data | | | | | | | | | | | | |
| Net asset value, beginning of period | $ | 11.11 | $ | 12.04 | $ | 10.90 | $ | 11.42 | $ | 12.00 | $ | 12.04 |
| Income from Investment Operations | | | | | | | | | | | | |
Net investment income (loss) B,C | | .14 | | .29 | | .14 | | .23 | | .25 | | .13 |
| Net realized and unrealized gain (loss) | | (1.32) | | (.32) | | 1.65 | | (.16) | | .13 | | .33 |
| Total from investment operations | | (1.18) | | (.03) | | 1.79 | | .07 | | .38 | | .46 |
| Distributions from net investment income | | (.02) | | (.31) | | (.16) | | (.25) | | (.28) | | (.19) |
| Distributions from net realized gain | | (.29) | | (.59) | | (.49) | | (.34) | | (.68) | | (.31) |
| Total distributions | | (.31) | | (.90) | | (.65) | | (.59) | | (.96) | | (.50) |
| Net asset value, end of period | $ | 9.62 | $ | 11.11 | $ | 12.04 | $ | 10.90 | $ | 11.42 | $ | 12.00 |
Total Return D,E | | (10.82)% | | (.52)% | | 16.72% | | .35% | | 3.53% | | 3.78% |
Ratios to Average Net Assets C,F,G | | | | | | | | | | | | |
| Expenses before reductions | | .36% H,I | | .36% | | .37% | | .37% | | .37% | | .39% H,I |
| Expenses net of fee waivers, if any | | .36% H,I | | .36% | | .37% | | .37% | | .37% | | .39% H,I |
| Expenses net of all reductions | | .36% H,I | | .36% | | .37% | | .37% | | .37% | | .39% H,I |
| Net investment income (loss) | | 2.64% H | | 2.42% | | 1.16% | | 1.97% | | 2.16% | | 1.30% H |
| Supplemental Data | | | | | | | | | | | | |
| Net assets, end of period (000 omitted) | $ | 6,296 | $ | 5,722 | $ | 4,404 | $ | 2,652 | $ | 1,849 | $ | 1,408 |
Portfolio turnover rate J | | 28% H | | 45% | | 31% | | 28% | | 28% | | 20% |
A For the period June 6, 2017 (commencement of sale of shares) through March 31, 2018.
B Calculated based on average shares outstanding during the period.
C Net investment income (loss) is affected by the timing of the declaration of dividends by any underlying mutual funds or exchange-traded funds (ETFs). Net investment income (loss) of any such underlying funds is not included in the Fund's net investment income (loss) ratio.
D Total returns for periods of less than one year are not annualized.
E Total returns would have been lower if certain expenses had not been reduced during the applicable periods shown.
F Fees and expenses of any underlying mutual funds or exchange-traded funds (ETFs) are not included in the Fund's expense ratio. The Fund indirectly bears its proportionate share of these expenses. For additional expense information related to investments in Fidelity Central Funds, please refer to the "Investments in Fidelity Central Funds" note found in the Notes to Financial Statements section of the most recent Annual or Semi-Annual report.
G Expense ratios reflect operating expenses of the class. Expenses before reductions do not reflect amounts reimbursed, waived, or reduced through arrangements with the investment adviser, brokerage services, or other offset arrangements, if applicable, and do not represent the amount paid by the class during periods when reimbursements, waivers or reductions occur.
H Annualized
I On certain classes, the size and fluctuation of net assets and expense amounts may cause ratios to differ from contractual rates.
J Amount does not include the portfolio activity of any underlying mutual funds or exchange-traded funds (ETFs).
The information in the following table is based on the direct Investments of the Fund.
Top Holdings (% of Fund's net assets) |
| |
| Fidelity Series Investment Grade Bond Fund | 34.8 | |
| Fidelity Series 0-5 Year Inflation-Protected Bond Index Fund | 13.3 | |
| Fidelity Series Emerging Markets Opportunities Fund | 6.7 | |
| Fidelity Series Government Money Market Fund 3.00% | 6.1 | |
| Fidelity Series International Developed Markets Bond Index Fund | 4.0 | |
| Fidelity Series Long-Term Treasury Bond Index Fund | 3.9 | |
| Fidelity Series 5+ Year Inflation-Protected Bond Index Fund | 3.1 | |
| Fidelity Series Overseas Fund | 2.8 | |
| Fidelity Series International Value Fund | 2.8 | |
| Fidelity Series International Growth Fund | 2.8 | |
| | 80.3 | |
| |
Asset Allocation (% of Fund's net assets) |
|
Percentages shown as 0.0% may reflect amounts less than 0.05%. |
|
Domestic Equity Funds category includes Fidelity Series Commodity Strategy Fund which invests in commodity-related investments.
Fidelity Advisor Freedom® 2010 Fund
Showing Percentage of Net Assets
| U.S. Treasury Obligations - 0.1% |
| | | Principal Amount (a) | Value ($) |
U.S. Treasury Bills, yield at date of purchase 2.43% to 3.29% 10/20/22 to 12/29/22 (b) (Cost $148,976) | | 150,000 | 149,053 |
| | | | |
| Domestic Equity Funds - 13.8% |
| | | Shares | Value ($) |
| Fidelity Advisor Series Equity Growth Fund (c) | | 366,274 | 4,450,232 |
| Fidelity Advisor Series Growth Opportunities Fund (c) | | 357,814 | 3,138,028 |
| Fidelity Advisor Series Small Cap Fund (c) | | 184,919 | 1,936,100 |
| Fidelity Series All-Sector Equity Fund (c) | | 205,280 | 1,761,305 |
| Fidelity Series Commodity Strategy Fund (c) | | 1,554,643 | 3,249,204 |
| Fidelity Series Large Cap Stock Fund (c) | | 459,853 | 6,792,035 |
| Fidelity Series Large Cap Value Index Fund (c) | | 57,429 | 730,498 |
| Fidelity Series Opportunistic Insights Fund (c) | | 284,787 | 4,046,818 |
| Fidelity Series Small Cap Opportunities Fund (c) | | 212,213 | 2,287,652 |
| Fidelity Series Stock Selector Large Cap Value Fund (c) | | 386,339 | 4,315,406 |
| Fidelity Series Value Discovery Fund (c) | | 323,340 | 4,452,392 |
| TOTAL DOMESTIC EQUITY FUNDS (Cost $34,074,860) | | | 37,159,670 |
| | | | |
| International Equity Funds - 17.7% |
| | | Shares | Value ($) |
| Fidelity Series Canada Fund (c) | | 261,419 | 3,241,590 |
| Fidelity Series Emerging Markets Fund (c) | | 267,700 | 1,938,151 |
| Fidelity Series Emerging Markets Opportunities Fund (c) | | 1,247,585 | 18,114,932 |
| Fidelity Series International Growth Fund (c) | | 583,086 | 7,475,158 |
| Fidelity Series International Small Cap Fund (c) | | 142,557 | 1,950,177 |
| Fidelity Series International Value Fund (c) | | 873,493 | 7,503,304 |
| Fidelity Series Overseas Fund (c) | | 791,749 | 7,545,371 |
| TOTAL INTERNATIONAL EQUITY FUNDS (Cost $47,667,965) | | | 47,768,683 |
| | | | |
| Bond Funds - 60.8% |
| | | Shares | Value ($) |
| Fidelity Series 0-5 Year Inflation-Protected Bond Index Fund (c) | | 3,702,863 | 35,732,626 |
| Fidelity Series 5+ Year Inflation-Protected Bond Index Fund (c) | | 1,053,402 | 8,416,683 |
| Fidelity Series Emerging Markets Debt Fund (c) | | 199,917 | 1,371,431 |
| Fidelity Series Emerging Markets Debt Local Currency Fund (c) | | 57,426 | 457,688 |
| Fidelity Series Floating Rate High Income Fund (c) | | 32,469 | 282,482 |
| Fidelity Series High Income Fund (c) | | 185,051 | 1,458,200 |
| Fidelity Series International Credit Fund (c) | | 32,154 | 253,050 |
| Fidelity Series International Developed Markets Bond Index Fund (c) | | 1,272,180 | 10,838,977 |
| Fidelity Series Investment Grade Bond Fund (c) | | 9,614,448 | 93,837,009 |
| Fidelity Series Long-Term Treasury Bond Index Fund (c) | | 1,765,228 | 10,538,411 |
| Fidelity Series Real Estate Income Fund (c) | | 72,597 | 691,128 |
| TOTAL BOND FUNDS (Cost $183,428,275) | | | 163,877,685 |
| | | | |
| Short-Term Funds - 7.6% |
| | | Shares | Value ($) |
| Fidelity Cash Central Fund 3.10% (d) | | 147,570 | 147,599 |
| Fidelity Series Government Money Market Fund 3.00% (c)(e) | | 16,383,823 | 16,383,823 |
| Fidelity Series Short-Term Credit Fund (c) | | 414,049 | 3,925,189 |
| TOTAL SHORT-TERM FUNDS (Cost $20,638,093) | | | 20,456,611 |
| | | | |
| TOTAL INVESTMENT IN SECURITIES - 100.0% (Cost $285,958,169) | 269,411,702 |
NET OTHER ASSETS (LIABILITIES) - 0.0% | (59,482) |
| NET ASSETS - 100.0% | 269,352,220 |
| | |
| Futures Contracts |
| | Number of contracts | Expiration Date | Notional Amount ($) | Value ($) | Unrealized Appreciation/ (Depreciation) ($) |
| Purchased | | | | | |
| | | | | | |
| Treasury Contracts | | | | | |
| CBOT 10-Year U.S. Treasury Note Contracts (United States) | 44 | Dec 2022 | 4,930,750 | (301,470) | (301,470) |
| CBOT Ultra Long Term U.S. Treasury Bond Contracts (United States) | 4 | Dec 2022 | 548,000 | (7,182) | (7,182) |
| | | | | | |
| TOTAL PURCHASED | | | | | (308,652) |
| | | | | | |
| Sold | | | | | |
| | | | | | |
| Equity Index Contracts | | | | | |
| CME E-mini S&P 500 Index Contracts (United States) | 6 | Dec 2022 | 1,080,450 | 21,036 | 21,036 |
| ICE E-mini MSCI EAFE Index Contracts (United States) | 12 | Dec 2022 | 996,360 | 105,058 | 105,058 |
| ICE E-mini MSCI Emerging Markets Index Contracts (United States) | 9 | Dec 2022 | 392,175 | 211 | 211 |
| | | | | | |
| TOTAL SOLD | | | | | 126,305 |
| | | | | | |
| TOTAL FUTURES CONTRACTS | | | | | (182,347) |
| The notional amount of futures purchased as a percentage of Net Assets is 2.0% |
| The notional amount of futures sold as a percentage of Net Assets is 0.9% |
Legend
| (a) | Amount is stated in United States dollars unless otherwise noted. |
| (b) | Security or a portion of the security was pledged to cover margin requirements for futures contracts. At period end, the value of securities pledged amounted to $149,053. |
| (d) | Affiliated fund that is generally available only to investment companies and other accounts managed by Fidelity Investments. The rate quoted is the annualized seven-day yield of the fund at period end. A complete unaudited listing of the fund's holdings as of its most recent quarter end is available upon request. In addition, each Fidelity Central Fund's financial statements are available on the SEC's website or upon request. |
| (e) | The rate quoted is the annualized seven-day yield of the fund at period end. |
Affiliated Central Funds
Fiscal year to date information regarding the Fund's investments in Fidelity Central Funds, including the ownership percentage, is presented below.
| Affiliate | Value, beginning of period ($) | Purchases ($) | Sales Proceeds ($) | Dividend Income ($) | Realized Gain (loss) ($) | Change in Unrealized appreciation (depreciation) ($) | Value, end of period ($) | %ownership, end of period |
| Fidelity Cash Central Fund 3.10% | 121,986 | 1,246,462 | 1,220,849 | 2,049 | - | - | 147,599 | 0.0% |
| Total | 121,986 | 1,246,462 | 1,220,849 | 2,049 | - | - | 147,599 | |
| | | | | | | | | |
Amounts in the income column in the above table include any capital gain distributions from underlying funds, which are presented in the corresponding line item in the Statement of Operations, if applicable.
Affiliated Underlying Funds
Fiscal year to date information regarding the Fund's investments in affiliated Underlying Funds is presented below. Exchanges between classes of the same affiliated Underlying Funds may occur. If an Underlying Funds changes its name, the name presented below is the name in effect at period end.
| Affiliate | Value, beginning of period ($) | Purchases ($) | Sales Proceeds ($) | Dividend Income ($) | Realized Gain (loss) ($) | Change in Unrealized appreciation (depreciation) ($) | Value, end of period ($) |
| Fidelity Advisor Series Equity Growth Fund | 5,628,251 | 723,384 | 732,815 | - | (75,856) | (1,092,732) | 4,450,232 |
| Fidelity Advisor Series Growth Opportunities Fund | 3,859,646 | 976,948 | 596,084 | - | (89,974) | (1,012,508) | 3,138,028 |
| Fidelity Advisor Series Small Cap Fund | 2,554,673 | 244,758 | 401,966 | - | (44,632) | (416,733) | 1,936,100 |
| Fidelity Series 0-5 Year Inflation-Protected Bond Index Fund | 33,791,489 | 8,193,427 | 4,771,616 | - | (93,618) | (1,387,056) | 35,732,626 |
| Fidelity Series 5+ Year Inflation-Protected Bond Index Fund | 9,444,444 | 2,163,076 | 1,505,252 | - | (128,859) | (1,556,726) | 8,416,683 |
| Fidelity Series All-Sector Equity Fund | 2,413,957 | 108,456 | 291,136 | - | (33,178) | (436,794) | 1,761,305 |
| Fidelity Series Canada Fund | 4,161,643 | 200,037 | 305,621 | - | 2,621 | (817,090) | 3,241,590 |
| Fidelity Series Commodity Strategy Fund | 4,945,170 | 2,625,333 | 1,629,978 | 2,296,931 | (370,842) | (2,320,479) | 3,249,204 |
| Fidelity Series Emerging Markets Debt Fund | 1,693,283 | 100,758 | 142,993 | 41,809 | (24,476) | (255,141) | 1,371,431 |
| Fidelity Series Emerging Markets Debt Local Currency Fund | 563,000 | 4,258 | 47,094 | - | (8,600) | (53,876) | 457,688 |
| Fidelity Series Emerging Markets Fund | 2,458,307 | 201,643 | 183,787 | - | (8,749) | (529,263) | 1,938,151 |
| Fidelity Series Emerging Markets Opportunities Fund | 22,149,317 | 2,332,236 | 1,701,586 | - | (174,843) | (4,490,192) | 18,114,932 |
| Fidelity Series Floating Rate High Income Fund | 338,625 | 10,649 | 50,184 | 8,145 | (4,952) | (11,656) | 282,482 |
| Fidelity Series Government Money Market Fund 3.00% | 23,543,772 | 1,116,265 | 8,276,214 | 115,052 | - | - | 16,383,823 |
| Fidelity Series High Income Fund | 2,005,415 | 60,633 | 364,091 | 46,720 | (34,408) | (209,349) | 1,458,200 |
| Fidelity Series Inflation-Protected Bond Index Fund | 5,369,336 | 37,009 | 5,306,245 | 30,117 | 137,046 | (237,146) | - |
| Fidelity Series International Credit Fund | 293,461 | 4,006 | - | 4,007 | - | (44,417) | 253,050 |
| Fidelity Series International Developed Markets Bond Index Fund | 10,248,891 | 2,581,030 | 1,003,829 | 16,766 | (66,306) | (920,809) | 10,838,977 |
| Fidelity Series International Growth Fund | 9,550,160 | 1,051,353 | 987,004 | - | (89,809) | (2,049,542) | 7,475,158 |
| Fidelity Series International Small Cap Fund | 2,640,861 | 141,434 | 225,538 | - | (59,833) | (546,747) | 1,950,177 |
| Fidelity Series International Value Fund | 9,646,462 | 918,061 | 998,340 | - | (63,915) | (1,998,964) | 7,503,304 |
| Fidelity Series Investment Grade Bond Fund | 117,440,520 | 3,499,222 | 15,378,561 | 1,513,175 | (1,005,504) | (10,718,668) | 93,837,009 |
| Fidelity Series Large Cap Stock Fund | 8,855,618 | 1,211,993 | 1,385,469 | 411,188 | 178,125 | (2,068,232) | 6,792,035 |
| Fidelity Series Large Cap Value Index Fund | 957,808 | 52,451 | 125,678 | - | 23,905 | (177,988) | 730,498 |
| Fidelity Series Long-Term Treasury Bond Index Fund | 13,147,649 | 1,416,087 | 1,148,088 | 152,433 | (94,373) | (2,782,864) | 10,538,411 |
| Fidelity Series Opportunistic Insights Fund | 5,201,135 | 687,733 | 703,734 | - | (110,445) | (1,027,871) | 4,046,818 |
| Fidelity Series Overseas Fund | 9,603,263 | 1,134,837 | 836,112 | - | (69,984) | (2,286,633) | 7,545,371 |
| Fidelity Series Real Estate Income Fund | 1,214,196 | 60,085 | 425,106 | 53,316 | 21,610 | (179,657) | 691,128 |
| Fidelity Series Short-Term Credit Fund | 5,897,136 | 151,908 | 1,997,657 | 35,899 | (51,812) | (74,386) | 3,925,189 |
| Fidelity Series Small Cap Opportunities Fund | 3,154,164 | 173,392 | 413,552 | 108,038 | (50,304) | (576,048) | 2,287,652 |
| Fidelity Series Stock Selector Large Cap Value Fund | 5,652,465 | 430,762 | 851,287 | - | 66,115 | (982,649) | 4,315,406 |
| Fidelity Series Value Discovery Fund | 5,757,199 | 307,405 | 873,393 | - | 176,053 | (914,872) | 4,452,392 |
| | 334,181,316 | 32,920,629 | 53,660,010 | 4,833,596 | (2,149,797) | (42,177,088) | 269,115,050 |
Amounts in the income column in the above table include any capital gain distributions from underlying funds, which are presented in the corresponding line item in the Statement of Operations, if applicable.
Purchases and Sales Proceeds in the table above include the value of shares purchased or redeemed through in-kind transactions, if applicable.
Investment Valuation
The following is a summary of the inputs used, as of September 30, 2022, involving the Fund's assets and liabilities carried at fair value. The inputs or methodology used for valuing securities may not be an indication of the risk associated with investing in those securities. For more information on valuation inputs, and their aggregation into the levels used below, please refer to the Investment Valuation section in the accompanying Notes to Financial Statements.
| Valuation Inputs at Reporting Date: |
| Description | Total ($) | Level 1 ($) | Level 2 ($) | Level 3 ($) |
Investments in Securities: | | | | |
|
| Other Short-Term Investments | 149,053 | - | 149,053 | - |
|
| Domestic Equity Funds | 37,159,670 | 37,159,670 | - | - |
|
| International Equity Funds | 47,768,683 | 47,768,683 | - | - |
|
| Bond Funds | 163,877,685 | 163,877,685 | - | - |
|
| Short-Term Funds | 20,456,611 | 20,456,611 | - | - |
| Total Investments in Securities: | 269,411,702 | 269,262,649 | 149,053 | - |
Derivative Instruments: | | | | |
|
| Assets | | | | |
Futures Contracts | 126,305 | 126,305 | - | - |
| Total Assets | 126,305 | 126,305 | - | - |
|
| Liabilities | | | | |
Futures Contracts | (308,652) | (308,652) | - | - |
| Total Liabilities | (308,652) | (308,652) | - | - |
| Total Derivative Instruments: | (182,347) | (182,347) | - | - |
Value of Derivative Instruments
The following table is a summary of the Fund's value of derivative instruments by primary risk exposure as of September 30, 2022. For additional information on derivative instruments, please refer to the Derivative Instruments section in the accompanying Notes to Financial Statements.
Primary Risk Exposure / Derivative Type | Value |
| Asset ($) | Liability ($) |
| Equity Risk | | |
Futures Contracts (a) | 126,305 | 0 |
| Total Equity Risk | 126,305 | 0 |
| Interest Rate Risk | | |
Futures Contracts (a) | 0 | (308,652) |
| Total Interest Rate Risk | 0 | (308,652) |
| Total Value of Derivatives | 126,305 | (308,652) |
(a)Reflects gross cumulative appreciation (depreciation) on futures contracts as presented in the Schedule of Investments. In the Statement of Assets and Liabilities, the period end daily variation margin is included in receivable or payable for daily variation margin on futures contracts, and the net cumulative appreciation (depreciation) is included in Total accumulated earnings (loss).
Fidelity Advisor Freedom® 2010 Fund
| Statement of Assets and Liabilities |
| | | | September 30, 2022 (Unaudited) |
| | | | | |
| Assets | | | | |
| Investment in securities, at value - See accompanying schedule: | $ | | | |
Unaffiliated issuers (cost $148,976) | | $149,053 | | |
Fidelity Central Funds (cost $147,599) | | 147,599 | | |
Other affiliated issuers (cost $285,661,594) | | 269,115,050 | | |
| | | | | |
| Total Investment in Securities (cost $285,958,169) | | | $ | 269,411,702 |
| Receivable for investments sold | | | | 2,907,677 |
| Receivable for fund shares sold | | | | 57,579 |
| Distributions receivable from Fidelity Central Funds | | | | 513 |
| Receivable for daily variation margin on futures contracts | | | | 368 |
Total assets | | | | 272,377,839 |
| Liabilities | | | | |
| Payable for investments purchased | | 2,098,066 | | |
| Payable for fund shares redeemed | | 759,585 | | |
| Accrued management fee | | 113,062 | | |
| Distribution and service plan fees payable | | 47,206 | | |
| Payable for daily variation margin on futures contracts | | 7,700 | | |
| Total Liabilities | | | | 3,025,619 |
| Net Assets | | | $ | 269,352,220 |
| Net Assets consist of: | | | | |
| Paid in capital | | | $ | 285,764,596 |
| Total accumulated earnings (loss) | | | | (16,412,376) |
| Net Assets | | | $ | 269,352,220 |
| | | | | |
| Net Asset Value and Maximum Offering Price | | | | |
| Class A : | | | | |
Net Asset Value and redemption price per share ($107,214,673 ÷ 11,134,147 shares) (a) | | | $ | 9.63 |
| Maximum offering price per share (100/94.25 of $9.63) | | | $ | 10.22 |
| Class M : | | | | |
Net Asset Value and redemption price per share ($49,339,129 ÷ 5,159,520 shares) (a) | | | $ | 9.56 |
| Maximum offering price per share (100/96.50 of $9.56) | | | $ | 9.91 |
| Class C : | | | | |
Net Asset Value and offering price per share ($2,461,145 ÷ 259,050 shares) (a) | | | $ | 9.50 |
| Class I : | | | | |
Net Asset Value , offering price and redemption price per share ($82,018,819 ÷ 8,477,919 shares) | | | $ | 9.67 |
| Class Z : | | | | |
Net Asset Value , offering price and redemption price per share ($9,091,991 ÷ 946,598 shares) | | | $ | 9.60 |
| Class Z6 : | | | | |
Net Asset Value , offering price and redemption price per share ($19,226,463 ÷ 1,995,777 shares) | | | $ | 9.63 |
(a)Redemption price per share is equal to net asset value less any applicable contingent deferred sales charge. |
| Statement of Operations |
| | | | Six months ended September 30, 2022 (Unaudited) |
| Investment Income | | | | |
| Dividends: | | | | |
| Affiliated issuers | | | $ | 4,377,524 |
| Interest | | | | 1,271 |
| Income from Fidelity Central Funds | | | | 2,049 |
| Total Income | | | | 4,380,844 |
| Expenses | | | | |
| Management fee | $ | 724,778 | | |
| Distribution and service plan fees | | 305,682 | | |
| Independent trustees' fees and expenses | | 524 | | |
| Total expenses before reductions | | 1,030,984 | | |
| Expense reductions | | (30) | | |
| Total expenses after reductions | | | | 1,030,954 |
| Net Investment income (loss) | | | | 3,349,890 |
| Realized and Unrealized Gain (Loss) | | | | |
| Net realized gain (loss) on: | | | | |
| Investment Securities: | | | | |
| Unaffiliated issuers | | 80 | | |
| Affiliated issuers | | (2,149,797) | | |
| Futures contracts | | (69,146) | | |
| Capital gain distributions from underlying funds: | | | | |
| Affiliated issuers | | 456,072 | | |
| Total net realized gain (loss) | | | | (1,762,791) |
| Change in net unrealized appreciation (depreciation) on: | | | | |
| Investment Securities: | | | | |
| Unaffiliated issuers | | 77 | | |
| Affiliated issuers | | (42,177,088) | | |
| Futures contracts | | (269,578) | | |
| Total change in net unrealized appreciation (depreciation) | | | | (42,446,589) |
| Net gain (loss) | | | | (44,209,380) |
| Net increase (decrease) in net assets resulting from operations | | | $ | (40,859,490) |
| Statement of Changes in Net Assets |
| |
| | Six months ended September 30, 2022 (Unaudited) | | Year ended March 31, 2022 |
| Increase (Decrease) in Net Assets | | | | |
| Operations | | | | |
| Net investment income (loss) | $ | 3,349,890 | $ | 7,669,107 |
| Net realized gain (loss) | | (1,762,791) | | 20,103,123 |
| Change in net unrealized appreciation (depreciation) | | (42,446,589) | | (27,720,911) |
| Net increase (decrease) in net assets resulting from operations | | (40,859,490) | | 51,319 |
| Distributions to shareholders | | (11,289,222) | | (30,763,243) |
| Share transactions - net increase (decrease) | | (12,867,013) | | (9,416,963) |
| Total increase (decrease) in net assets | | (65,015,725) | | (40,128,887) |
| | | | | |
| Net Assets | | | | |
| Beginning of period | | 334,367,945 | | 374,496,832 |
| End of period | $ | 269,352,220 | $ | 334,367,945 |
| | | | | |
| | | | | |
Financial Highlights
| Fidelity Advisor Freedom® 2010 Fund Class A |
| |
| | Six months ended (Unaudited) September 30, 2022 | | Years ended March 31, 2022 | | 2021 | | 2020 | | 2019 | | 2018 |
Selected Per-Share Data | | | | | | | | | | | | |
| Net asset value, beginning of period | $ | 11.46 | $ | 12.53 | $ | 10.97 | $ | 11.78 | $ | 12.42 | $ | 12.34 |
| Income from Investment Operations | | | | | | | | | | | | |
Net investment income (loss) A,B | | .11 | | .25 | | .10 | | .19 | | .21 | | .16 |
| Net realized and unrealized gain (loss) | | (1.55) | | (.26) | | 2.18 | | (.31) | | .15 | | .72 |
| Total from investment operations | | (1.44) | | (.01) | | 2.28 | | (.12) | | .36 | | .88 |
| Distributions from net investment income | | - C | | (.26) | | (.11) | | (.20) | | (.21) | | (.17) |
| Distributions from net realized gain | | (.39) | | (.80) | | (.61) | | (.49) | | (.79) | | (.62) |
| Total distributions | | (.39) | | (1.06) | | (.72) | | (.69) | | (1.00) | | (.80) D |
| Net asset value, end of period | $ | 9.63 | $ | 11.46 | $ | 12.53 | $ | 10.97 | $ | 11.78 | $ | 12.42 |
Total Return E,F,G | | (12.79)% | | (.41)% | | 21.28% | | (1.39)% | | 3.28% | | 7.18% |
Ratios to Average Net Assets B,H,I | | | | | | | | | | | | |
| Expenses before reductions | | .74% J | | .75% | | .76% | | .77% | | .77% K | | .69% |
| Expenses net of fee waivers, if any | | .74% J | | .75% | | .76% | | .77% | | .77% K | | .69% |
| Expenses net of all reductions | | .74% J | | .75% | | .76% | | .77% | | .77% K | | .69% |
| Net investment income (loss) | | 2.17% J | | 2.06% | | .81% | | 1.56% | | 1.75% | | 1.29% |
| Supplemental Data | | | | | | | | | | | | |
| Net assets, end of period (000 omitted) | $ | 107,215 | $ | 137,046 | $ | 164,212 | $ | 162,920 | $ | 198,633 | $ | 230,553 |
Portfolio turnover rate L | | 22% J | | 37% | | 26% | | 23% | | 24% | | 20% |
A Calculated based on average shares outstanding during the period.
B Net investment income (loss) is affected by the timing of the declaration of dividends by any underlying mutual funds or exchange-traded funds (ETFs). Net investment income (loss) of any such underlying funds is not included in the Fund's net investment income (loss) ratio.
C Amount represents less than $.005 per share.
D Total distributions per share do not sum due to rounding.
E Total returns for periods of less than one year are not annualized.
F Total returns would have been lower if certain expenses had not been reduced during the applicable periods shown.
G Total returns do not include the effect of the sales charges.
H Fees and expenses of any underlying mutual funds or exchange-traded funds (ETFs) are not included in the Fund's expense ratio. The Fund indirectly bears its proportionate share of these expenses. For additional expense information related to investments in Fidelity Central Funds, please refer to the "Investments in Fidelity Central Funds" note found in the Notes to Financial Statements section of the most recent Annual or Semi-Annual report.
I Expense ratios reflect operating expenses of the class. Expenses before reductions do not reflect amounts reimbursed, waived, or reduced through arrangements with the investment adviser, brokerage services, or other offset arrangements, if applicable, and do not represent the amount paid by the class during periods when reimbursements, waivers or reductions occur.
J Annualized
K On certain classes, the size and fluctuation of net assets and expense amounts may cause ratios to differ from contractual rates.
L Amount does not include the portfolio activity of any underlying mutual funds or exchange-traded funds (ETFs).
| Fidelity Advisor Freedom® 2010 Fund Class M |
| |
| | Six months ended (Unaudited) September 30, 2022 | | Years ended March 31, 2022 | | 2021 | | 2020 | | 2019 | | 2018 |
Selected Per-Share Data | | | | | | | | | | | | |
| Net asset value, beginning of period | $ | 11.39 | $ | 12.46 | $ | 10.92 | $ | 11.73 | $ | 12.37 | $ | 12.30 |
| Income from Investment Operations | | | | | | | | | | | | |
Net investment income (loss) A,B | | .10 | | .22 | | .07 | | .15 | | .18 | | .13 |
| Net realized and unrealized gain (loss) | | (1.54) | | (.26) | | 2.16 | | (.30) | | .15 | | .71 |
| Total from investment operations | | (1.44) | | (.04) | | 2.23 | | (.15) | | .33 | | .84 |
| Distributions from net investment income | | - | | (.24) | | (.09) | | (.17) | | (.18) | | (.15) |
| Distributions from net realized gain | | (.39) | | (.80) | | (.61) | | (.49) | | (.79) | | (.62) |
| Total distributions | | (.39) | | (1.03) C | | (.69) C | | (.66) | | (.97) | | (.77) |
| Net asset value, end of period | $ | 9.56 | $ | 11.39 | $ | 12.46 | $ | 10.92 | $ | 11.73 | $ | 12.37 |
Total Return D,E,F | | (12.93)% | | (.63)% | | 20.90% | | (1.63)% | | 3.06% | | 6.89% |
Ratios to Average Net Assets B,G,H | | | | | | | | | | | | |
| Expenses before reductions | | .99% I | | 1.00% | | 1.01% | | 1.02% | | 1.02% J | | .94% |
| Expenses net of fee waivers, if any | | .99% I | | 1.00% | | 1.01% | | 1.02% | | 1.02% J | | .94% |
| Expenses net of all reductions | | .99% I | | 1.00% | | 1.01% | | 1.02% | | 1.02% J | | .94% |
| Net investment income (loss) | | 1.92% I | | 1.81% | | .56% | | 1.31% | | 1.50% | | 1.03% |
| Supplemental Data | | | | | | | | | | | | |
| Net assets, end of period (000 omitted) | $ | 49,339 | $ | 60,633 | $ | 69,654 | $ | 64,750 | $ | 71,679 | $ | 77,068 |
Portfolio turnover rate K | | 22% I | | 37% | | 26% | | 23% | | 24% | | 20% |
A Calculated based on average shares outstanding during the period.
B Net investment income (loss) is affected by the timing of the declaration of dividends by any underlying mutual funds or exchange-traded funds (ETFs). Net investment income (loss) of any such underlying funds is not included in the Fund's net investment income (loss) ratio.
C Total distributions per share do not sum due to rounding.
D Total returns for periods of less than one year are not annualized.
E Total returns would have been lower if certain expenses had not been reduced during the applicable periods shown.
F Total returns do not include the effect of the sales charges.
G Fees and expenses of any underlying mutual funds or exchange-traded funds (ETFs) are not included in the Fund's expense ratio. The Fund indirectly bears its proportionate share of these expenses. For additional expense information related to investments in Fidelity Central Funds, please refer to the "Investments in Fidelity Central Funds" note found in the Notes to Financial Statements section of the most recent Annual or Semi-Annual report.
H Expense ratios reflect operating expenses of the class. Expenses before reductions do not reflect amounts reimbursed, waived, or reduced through arrangements with the investment adviser, brokerage services, or other offset arrangements, if applicable, and do not represent the amount paid by the class during periods when reimbursements, waivers or reductions occur.
I Annualized
J On certain classes, the size and fluctuation of net assets and expense amounts may cause ratios to differ from contractual rates.
K Amount does not include the portfolio activity of any underlying mutual funds or exchange-traded funds (ETFs).
| Fidelity Advisor Freedom® 2010 Fund Class C |
| |
| | Six months ended (Unaudited) September 30, 2022 | | Years ended March 31, 2022 | | 2021 | | 2020 | | 2019 | | 2018 |
Selected Per-Share Data | | | | | | | | | | | | |
| Net asset value, beginning of period | $ | 11.34 | $ | 12.42 | $ | 10.87 | $ | 11.66 | $ | 12.29 | $ | 12.22 |
| Income from Investment Operations | | | | | | | | | | | | |
Net investment income (loss) A,B | | .07 | | .16 | | .01 | | .10 | | .12 | | .07 |
| Net realized and unrealized gain (loss) | | (1.53) | | (.27) | | 2.16 | | (.30) | | .14 | | .70 |
| Total from investment operations | | (1.46) | | (.11) | | 2.17 | | (.20) | | .26 | | .77 |
| Distributions from net investment income | | - | | (.18) | | (.02) | | (.10) | | (.11) | | (.08) |
| Distributions from net realized gain | | (.38) | | (.80) | | (.60) | | (.49) | | (.78) | | (.62) |
| Total distributions | | (.38) | | (.97) C | | (.62) | | (.59) | | (.89) | | (.70) |
| Net asset value, end of period | $ | 9.50 | $ | 11.34 | $ | 12.42 | $ | 10.87 | $ | 11.66 | $ | 12.29 |
Total Return D,E,F | | (13.14)% | | (1.19)% | | 20.36% | | (2.02)% | | 2.45% | | 6.37% |
Ratios to Average Net Assets B,G,H | | | | | | | | | | | | |
| Expenses before reductions | | 1.50% I,J | | 1.50% | | 1.51% | | 1.51% I | | 1.52% I | | 1.44% |
| Expenses net of fee waivers, if any | | 1.50% I,J | | 1.50% | | 1.51% | | 1.51% I | | 1.52% I | | 1.44% |
| Expenses net of all reductions | | 1.50% I,J | | 1.50% | | 1.51% | | 1.51% I | | 1.52% I | | 1.44% |
| Net investment income (loss) | | 1.42% J | | 1.31% | | .06% | | .81% | | 1.00% | | .54% |
| Supplemental Data | | | | | | | | | | | | |
| Net assets, end of period (000 omitted) | $ | 2,461 | $ | 4,335 | $ | 6,544 | $ | 8,343 | $ | 10,765 | $ | 26,227 |
Portfolio turnover rate K | | 22% J | | 37% | | 26% | | 23% | | 24% | | 20% |
A Calculated based on average shares outstanding during the period.
B Net investment income (loss) is affected by the timing of the declaration of dividends by any underlying mutual funds or exchange-traded funds (ETFs). Net investment income (loss) of any such underlying funds is not included in the Fund's net investment income (loss) ratio.
C Total distributions per share do not sum due to rounding.
D Total returns for periods of less than one year are not annualized.
E Total returns would have been lower if certain expenses had not been reduced during the applicable periods shown.
F Total returns do not include the effect of the contingent deferred sales charge.
G Fees and expenses of any underlying mutual funds or exchange-traded funds (ETFs) are not included in the Fund's expense ratio. The Fund indirectly bears its proportionate share of these expenses. For additional expense information related to investments in Fidelity Central Funds, please refer to the "Investments in Fidelity Central Funds" note found in the Notes to Financial Statements section of the most recent Annual or Semi-Annual report.
H Expense ratios reflect operating expenses of the class. Expenses before reductions do not reflect amounts reimbursed, waived, or reduced through arrangements with the investment adviser, brokerage services, or other offset arrangements, if applicable, and do not represent the amount paid by the class during periods when reimbursements, waivers or reductions occur.
I On certain classes, the size and fluctuation of net assets and expense amounts may cause ratios to differ from contractual rates.
J Annualized
K Amount does not include the portfolio activity of any underlying mutual funds or exchange-traded funds (ETFs).
| Fidelity Advisor Freedom® 2010 Fund Class I |
| |
| | Six months ended (Unaudited) September 30, 2022 | | Years ended March 31, 2022 | | 2021 | | 2020 | | 2019 | | 2018 |
Selected Per-Share Data | | | | | | | | | | | | |
| Net asset value, beginning of period | $ | 11.50 | $ | 12.58 | $ | 11.02 | $ | 11.82 | $ | 12.47 | $ | 12.40 |
| Income from Investment Operations | | | | | | | | | | | | |
Net investment income (loss) A,B | | .13 | | .29 | | .13 | | .22 | | .24 | | .19 |
| Net realized and unrealized gain (loss) | | (1.56) | | (.28) | | 2.19 | | (.30) | | .14 | | .72 |
| Total from investment operations | | (1.43) | | .01 | | 2.32 | | (.08) | | .38 | | .91 |
| Distributions from net investment income | | (.01) | | (.30) | | (.15) | | (.23) | | (.25) | | (.21) |
| Distributions from net realized gain | | (.39) | | (.80) | | (.61) | | (.49) | | (.79) | | (.62) |
| Total distributions | | (.40) | | (1.09) C | | (.76) | | (.72) | | (1.03) C | | (.84) C |
| Net asset value, end of period | $ | 9.67 | $ | 11.50 | $ | 12.58 | $ | 11.02 | $ | 11.82 | $ | 12.47 |
Total Return D,E | | (12.68)% | | (.21)% | | 21.50% | | (1.04)% | | 3.50% | | 7.39% |
Ratios to Average Net Assets B,F,G | | | | | | | | | | | | |
| Expenses before reductions | | .49% H | | .50% | | .51% | | .52% | | .52% I | | .45% |
| Expenses net of fee waivers, if any | | .49% H | | .50% | | .51% | | .52% | | .52% I | | .45% |
| Expenses net of all reductions | | .49% H | | .50% | | .51% | | .52% | | .52% I | | .45% |
| Net investment income (loss) | | 2.42% H | | 2.31% | | 1.06% | | 1.81% | | 2.00% | | 1.53% |
| Supplemental Data | | | | | | | | | | | | |
| Net assets, end of period (000 omitted) | $ | 82,019 | $ | 103,754 | $ | 114,929 | $ | 107,764 | $ | 131,896 | $ | 137,019 |
Portfolio turnover rate J | | 22% H | | 37% | | 26% | | 23% | | 24% | | 20% |
A Calculated based on average shares outstanding during the period.
B Net investment income (loss) is affected by the timing of the declaration of dividends by any underlying mutual funds or exchange-traded funds (ETFs). Net investment income (loss) of any such underlying funds is not included in the Fund's net investment income (loss) ratio.
C Total distributions per share do not sum due to rounding.
D Total returns for periods of less than one year are not annualized.
E Total returns would have been lower if certain expenses had not been reduced during the applicable periods shown.
F Fees and expenses of any underlying mutual funds or exchange-traded funds (ETFs) are not included in the Fund's expense ratio. The Fund indirectly bears its proportionate share of these expenses. For additional expense information related to investments in Fidelity Central Funds, please refer to the "Investments in Fidelity Central Funds" note found in the Notes to Financial Statements section of the most recent Annual or Semi-Annual report.
G Expense ratios reflect operating expenses of the class. Expenses before reductions do not reflect amounts reimbursed, waived, or reduced through arrangements with the investment adviser, brokerage services, or other offset arrangements, if applicable, and do not represent the amount paid by the class during periods when reimbursements, waivers or reductions occur.
H Annualized
I On certain classes, the size and fluctuation of net assets and expense amounts may cause ratios to differ from contractual rates.
J Amount does not include the portfolio activity of any underlying mutual funds or exchange-traded funds (ETFs).
| Fidelity Advisor Freedom® 2010 Fund Class Z |
| |
| | Six months ended (Unaudited) September 30, 2022 | | Years ended March 31, 2022 | | 2021 | | 2020 | | 2019 A |
Selected Per-Share Data | | | | | | | | | | |
| Net asset value, beginning of period | $ | 11.42 | $ | 12.51 | $ | 10.95 | $ | 11.78 | $ | 12.30 |
| Income from Investment Operations | | | | | | | | | | |
Net investment income (loss) B,C | | .13 | | .29 | | .14 | | .22 | | .27 |
| Net realized and unrealized gain (loss) | | (1.54) | | (.27) | | 2.18 | | (.30) | | (.11) |
| Total from investment operations | | (1.41) | | .02 | | 2.32 | | (.08) | | .16 |
| Distributions from net investment income | | (.02) | | (.31) | | (.15) | | (.26) | | (.26) |
| Distributions from net realized gain | | (.39) | | (.80) | | (.61) | | (.49) | | (.42) |
| Total distributions | | (.41) | | (1.11) | | (.76) | | (.75) | | (.68) |
| Net asset value, end of period | $ | 9.60 | $ | 11.42 | $ | 12.51 | $ | 10.95 | $ | 11.78 |
Total Return D,E | | (12.65)% | | (.20)% | | 21.71% | | (1.05)% | | 1.65% |
Ratios to Average Net Assets C,F,G | | | | | | | | | | |
| Expenses before reductions | | .43% H,I | | .44% | | .45% | | .46% H | | .47% H,I |
| Expenses net of fee waivers, if any | | .43% H,I | | .44% | | .45% | | .46% H | | .47% H,I |
| Expenses net of all reductions | | .43% H,I | | .44% | | .45% | | .46% H | | .47% H,I |
| Net investment income (loss) | | 2.48% I | | 2.37% | | 1.12% | | 1.87% | | 4.58% I |
| Supplemental Data | | | | | | | | | | |
| Net assets, end of period (000 omitted) | $ | 9,092 | $ | 8,545 | $ | 6,514 | $ | 5,895 | $ | 257 |
Portfolio turnover rate J | | 22% I | | 37% | | 26% | | 23% | | 24% |
A For the period October 2, 2018 (commencement of sale of shares) through March 31, 2019.
B Calculated based on average shares outstanding during the period.
C Net investment income (loss) is affected by the timing of the declaration of dividends by any underlying mutual funds or exchange-traded funds (ETFs). Net investment income (loss) of any such underlying funds is not included in the Fund's net investment income (loss) ratio.
D Total returns for periods of less than one year are not annualized.
E Total returns would have been lower if certain expenses had not been reduced during the applicable periods shown.
F Fees and expenses of any underlying mutual funds or exchange-traded funds (ETFs) are not included in the Fund's expense ratio. The Fund indirectly bears its proportionate share of these expenses. For additional expense information related to investments in Fidelity Central Funds, please refer to the "Investments in Fidelity Central Funds" note found in the Notes to Financial Statements section of the most recent Annual or Semi-Annual report.
G Expense ratios reflect operating expenses of the class. Expenses before reductions do not reflect amounts reimbursed, waived, or reduced through arrangements with the investment adviser, brokerage services, or other offset arrangements, if applicable, and do not represent the amount paid by the class during periods when reimbursements, waivers or reductions occur.
H On certain classes, the size and fluctuation of net assets and expense amounts may cause ratios to differ from contractual rates.
I Annualized
J Amount does not include the portfolio activity of any underlying mutual funds or exchange-traded funds (ETFs).
| Fidelity Advisor Freedom® 2010 Fund Class Z6 |
| |
| | Six months ended (Unaudited) September 30, 2022 | | Years ended March 31, 2022 | | 2021 | | 2020 | | 2019 | | 2018 A |
Selected Per-Share Data | | | | | | | | | | | | |
| Net asset value, beginning of period | $ | 11.45 | $ | 12.54 | $ | 10.99 | $ | 11.81 | $ | 12.47 | $ | 12.50 |
| Income from Investment Operations | | | | | | | | | | | | |
Net investment income (loss) B,C | | .13 | | .30 | | .14 | | .23 | | .25 | | .05 |
| Net realized and unrealized gain (loss) | | (1.54) | | (.27) | | 2.19 | | (.31) | | .15 | | .53 |
| Total from investment operations | | (1.41) | | .03 | | 2.33 | | (.08) | | .40 | | .58 |
| Distributions from net investment income | | (.02) | | (.32) | | (.17) | | (.26) | | (.27) | | (.20) |
| Distributions from net realized gain | | (.39) | | (.80) | | (.61) | | (.49) | | (.79) | | (.42) |
| Total distributions | | (.41) | | (1.12) | | (.78) | | (.74) D | | (1.06) | | (.61) D |
| Net asset value, end of period | $ | 9.63 | $ | 11.45 | $ | 12.54 | $ | 10.99 | $ | 11.81 | $ | 12.47 |
Total Return E,F | | (12.61)% | | (.10)% | | 21.67% | | (1.01)% | | 3.66% | | 4.62% |
Ratios to Average Net Assets C,G,H | | | | | | | | | | | | |
| Expenses before reductions | | .38% I | | .38% | | .38% | | .39% | | .39% | | .41% I,J |
| Expenses net of fee waivers, if any | | .38% I | | .38% | | .38% | | .39% | | .39% | | .41% I,J |
| Expenses net of all reductions | | .38% I | | .38% | | .38% | | .39% | | .39% | | .41% I,J |
| Net investment income (loss) | | 2.54% I | | 2.43% | | 1.18% | | 1.94% | | 2.13% | | .45% I |
| Supplemental Data | | | | | | | | | | | | |
| Net assets, end of period (000 omitted) | $ | 19,226 | $ | 20,054 | $ | 12,643 | $ | 8,352 | $ | 6,566 | $ | 4,744 |
Portfolio turnover rate K | | 22% I | | 37% | | 26% | | 23% | | 24% | | 20% |
A For the period June 6, 2017 (commencement of sale of shares) through March 31, 2018.
B Calculated based on average shares outstanding during the period.
C Net investment income (loss) is affected by the timing of the declaration of dividends by any underlying mutual funds or exchange-traded funds (ETFs). Net investment income (loss) of any such underlying funds is not included in the Fund's net investment income (loss) ratio.
D Total distributions per share do not sum due to rounding.
E Total returns for periods of less than one year are not annualized.
F Total returns would have been lower if certain expenses had not been reduced during the applicable periods shown.
G Fees and expenses of any underlying mutual funds or exchange-traded funds (ETFs) are not included in the Fund's expense ratio. The Fund indirectly bears its proportionate share of these expenses. For additional expense information related to investments in Fidelity Central Funds, please refer to the "Investments in Fidelity Central Funds" note found in the Notes to Financial Statements section of the most recent Annual or Semi-Annual report.
H Expense ratios reflect operating expenses of the class. Expenses before reductions do not reflect amounts reimbursed, waived, or reduced through arrangements with the investment adviser, brokerage services, or other offset arrangements, if applicable, and do not represent the amount paid by the class during periods when reimbursements, waivers or reductions occur.
I Annualized
J On certain classes, the size and fluctuation of net assets and expense amounts may cause ratios to differ from contractual rates.
K Amount does not include the portfolio activity of any underlying mutual funds or exchange-traded funds (ETFs).
The information in the following table is based on the direct Investments of the Fund.
Top Holdings (% of Fund's net assets) |
| |
| Fidelity Series Investment Grade Bond Fund | 31.3 | |
| Fidelity Series Emerging Markets Opportunities Fund | 7.7 | |
| Fidelity Series 0-5 Year Inflation-Protected Bond Index Fund | 7.7 | |
| Fidelity Series 5+ Year Inflation-Protected Bond Index Fund | 5.7 | |
| Fidelity Series Long-Term Treasury Bond Index Fund | 4.2 | |
| Fidelity Series International Developed Markets Bond Index Fund | 4.0 | |
| Fidelity Series Government Money Market Fund 3.00% | 3.8 | |
| Fidelity Series Large Cap Stock Fund | 3.6 | |
| Fidelity Series Overseas Fund | 3.5 | |
| Fidelity Series International Value Fund | 3.5 | |
| | 75.0 | |
| |
Domestic Equity Funds category includes Fidelity Series Commodity Strategy Fund which invests in commodity-related investments.
Asset Allocation (% of Fund's net assets) |
|
Percentages shown as 0.0% may reflect amounts less than 0.05%. |
|
Fidelity Advisor Freedom® 2015 Fund
Showing Percentage of Net Assets
| U.S. Treasury Obligations - 0.0% |
| | | Principal Amount (a) | Value ($) |
U.S. Treasury Bills, yield at date of purchase 2.2% to 3.29% 10/13/22 to 12/29/22 (b) (Cost $308,059) | | 310,000 | 308,205 |
| | | | |
| Domestic Equity Funds - 19.3% |
| | | Shares | Value ($) |
| Fidelity Advisor Series Equity Growth Fund (c) | | 1,103,294 | 13,405,023 |
| Fidelity Advisor Series Growth Opportunities Fund (c) | | 1,077,981 | 9,453,892 |
| Fidelity Advisor Series Small Cap Fund (c) | | 557,326 | 5,835,207 |
| Fidelity Series All-Sector Equity Fund (c) | | 618,734 | 5,308,738 |
| Fidelity Series Commodity Strategy Fund (c) | | 3,264,690 | 6,823,202 |
| Fidelity Series Large Cap Stock Fund (c) | | 1,384,962 | 20,455,896 |
| Fidelity Series Large Cap Value Index Fund (c) | | 173,574 | 2,207,858 |
| Fidelity Series Opportunistic Insights Fund (c) | | 859,193 | 12,209,138 |
| Fidelity Series Small Cap Opportunities Fund (c) | | 642,750 | 6,928,842 |
| Fidelity Series Stock Selector Large Cap Value Fund (c) | | 1,163,750 | 12,999,091 |
| Fidelity Series Value Discovery Fund (c) | | 976,214 | 13,442,467 |
| TOTAL DOMESTIC EQUITY FUNDS (Cost $96,699,294) | | | 109,069,354 |
| | | | |
| International Equity Funds - 21.4% |
| | | Shares | Value ($) |
| Fidelity Series Canada Fund (c) | | 689,248 | 8,546,675 |
| Fidelity Series Emerging Markets Fund (c) | | 646,384 | 4,679,821 |
| Fidelity Series Emerging Markets Opportunities Fund (c) | | 3,001,207 | 43,577,519 |
| Fidelity Series International Growth Fund (c) | | 1,535,472 | 19,684,752 |
| Fidelity Series International Small Cap Fund (c) | | 375,170 | 5,132,332 |
| Fidelity Series International Value Fund (c) | | 2,300,275 | 19,759,365 |
| Fidelity Series Overseas Fund (c) | | 2,085,081 | 19,870,819 |
| TOTAL INTERNATIONAL EQUITY FUNDS (Cost $115,555,721) | | | 121,251,283 |
| | | | |
| Bond Funds - 54.6% |
| | | Shares | Value ($) |
| Fidelity Series 0-5 Year Inflation-Protected Bond Index Fund (c) | | 4,496,396 | 43,390,222 |
| Fidelity Series 5+ Year Inflation-Protected Bond Index Fund (c) | | 4,048,280 | 32,345,757 |
| Fidelity Series Emerging Markets Debt Fund (c) | | 425,216 | 2,916,983 |
| Fidelity Series Emerging Markets Debt Local Currency Fund (c) | | 122,601 | 977,131 |
| Fidelity Series Floating Rate High Income Fund (c) | | 68,861 | 599,091 |
| Fidelity Series High Income Fund (c) | | 389,284 | 3,067,555 |
| Fidelity Series International Credit Fund (c) | | 76,531 | 602,303 |
| Fidelity Series International Developed Markets Bond Index Fund (c) | | 2,677,950 | 22,816,138 |
| Fidelity Series Investment Grade Bond Fund (c) | | 18,146,373 | 177,108,603 |
| Fidelity Series Long-Term Treasury Bond Index Fund (c) | | 3,937,472 | 23,506,706 |
| Fidelity Series Real Estate Income Fund (c) | | 152,796 | 1,454,619 |
| TOTAL BOND FUNDS (Cost $348,841,371) | | | 308,785,108 |
| | | | |
| Short-Term Funds - 4.7% |
| | | Shares | Value ($) |
| Fidelity Cash Central Fund 3.10% (d) | | 262,118 | 262,171 |
| Fidelity Series Government Money Market Fund 3.00% (c)(e) | | 21,603,742 | 21,603,742 |
| Fidelity Series Short-Term Credit Fund (c) | | 509,231 | 4,827,512 |
| TOTAL SHORT-TERM FUNDS (Cost $26,924,268) | | | 26,693,425 |
| | | | |
| TOTAL INVESTMENT IN SECURITIES - 100.0% (Cost $588,328,713) | 566,107,375 |
NET OTHER ASSETS (LIABILITIES) - 0.0% | (126,385) |
| NET ASSETS - 100.0% | 565,980,990 |
| | |
| Futures Contracts |
| | Number of contracts | Expiration Date | Notional Amount ($) | Value ($) | Unrealized Appreciation/ (Depreciation) ($) |
| Purchased | | | | | |
| | | | | | |
| Treasury Contracts | | | | | |
| CBOT 10-Year U.S. Treasury Note Contracts (United States) | 92 | Dec 2022 | 10,309,750 | (632,411) | (632,411) |
| CBOT Ultra Long Term U.S. Treasury Bond Contracts (United States) | 9 | Dec 2022 | 1,233,000 | (16,146) | (16,146) |
| | | | | | |
| TOTAL PURCHASED | | | | | (648,557) |
| | | | | | |
| Sold | | | | | |
| | | | | | |
| Equity Index Contracts | | | | | |
| CME E-mini S&P 500 Index Contracts (United States) | 13 | Dec 2022 | 2,340,975 | 38,208 | 38,208 |
| ICE E-mini MSCI EAFE Index Contracts (United States) | 29 | Dec 2022 | 2,407,870 | 275,141 | 275,141 |
| ICE E-mini MSCI Emerging Markets Index Contracts (United States) | 18 | Dec 2022 | 784,350 | 422 | 422 |
| | | | | | |
| TOTAL SOLD | | | | | 313,771 |
| | | | | | |
| TOTAL FUTURES CONTRACTS | | | | | (334,786) |
| The notional amount of futures purchased as a percentage of Net Assets is 2.0% |
| The notional amount of futures sold as a percentage of Net Assets is 0.9% |
Legend
| (a) | Amount is stated in United States dollars unless otherwise noted. |
| (b) | Security or a portion of the security was pledged to cover margin requirements for futures contracts. At period end, the value of securities pledged amounted to $308,205. |
| (d) | Affiliated fund that is generally available only to investment companies and other accounts managed by Fidelity Investments. The rate quoted is the annualized seven-day yield of the fund at period end. A complete unaudited listing of the fund's holdings as of its most recent quarter end is available upon request. In addition, each Fidelity Central Fund's financial statements are available on the SEC's website or upon request. |
| (e) | The rate quoted is the annualized seven-day yield of the fund at period end. |
Affiliated Central Funds
Fiscal year to date information regarding the Fund's investments in Fidelity Central Funds, including the ownership percentage, is presented below.
| Affiliate | Value, beginning of period ($) | Purchases ($) | Sales Proceeds ($) | Dividend Income ($) | Realized Gain (loss) ($) | Change in Unrealized appreciation (depreciation) ($) | Value, end of period ($) | %ownership, end of period |
| Fidelity Cash Central Fund 3.10% | 392,069 | 3,301,632 | 3,431,530 | 3,862 | - | - | 262,171 | 0.0% |
| Total | 392,069 | 3,301,632 | 3,431,530 | 3,862 | - | - | 262,171 | |
| | | | | | | | | |
Amounts in the income column in the above table include any capital gain distributions from underlying funds, which are presented in the corresponding line item in the Statement of Operations, if applicable.
Affiliated Underlying Funds
Fiscal year to date information regarding the Fund's investments in affiliated Underlying Funds is presented below. Exchanges between classes of the same affiliated Underlying Funds may occur. If an Underlying Funds changes its name, the name presented below is the name in effect at period end.
| Affiliate | Value, beginning of period ($) | Purchases ($) | Sales Proceeds ($) | Dividend Income ($) | Realized Gain (loss) ($) | Change in Unrealized appreciation (depreciation) ($) | Value, end of period ($) |
| Fidelity Advisor Series Equity Growth Fund | 17,090,705 | 1,858,761 | 1,950,957 | - | (246,439) | (3,347,047) | 13,405,023 |
| Fidelity Advisor Series Growth Opportunities Fund | 11,720,610 | 2,744,081 | 1,622,750 | - | (453,578) | (2,934,471) | 9,453,892 |
| Fidelity Advisor Series Small Cap Fund | 7,757,541 | 612,326 | 1,115,462 | - | (130,675) | (1,288,523) | 5,835,207 |
| Fidelity Series 0-5 Year Inflation-Protected Bond Index Fund | 40,394,461 | 10,539,621 | 5,744,175 | - | (116,647) | (1,683,038) | 43,390,222 |
| Fidelity Series 5+ Year Inflation-Protected Bond Index Fund | 34,874,501 | 8,338,450 | 4,489,180 | - | (438,450) | (5,939,564) | 32,345,757 |
| Fidelity Series All-Sector Equity Fund | 7,330,350 | 226,568 | 810,508 | - | (105,951) | (1,331,721) | 5,308,738 |
| Fidelity Series Canada Fund | 11,113,065 | 468,464 | 855,281 | - | 50,426 | (2,229,999) | 8,546,675 |
| Fidelity Series Commodity Strategy Fund | 10,623,401 | 5,540,099 | 3,617,623 | 4,886,569 | (785,826) | (4,936,849) | 6,823,202 |
| Fidelity Series Emerging Markets Debt Fund | 3,626,658 | 183,826 | 293,649 | 89,744 | (58,281) | (541,571) | 2,916,983 |
| Fidelity Series Emerging Markets Debt Local Currency Fund | 1,205,895 | 7,818 | 101,951 | - | (20,394) | (114,237) | 977,131 |
| Fidelity Series Emerging Markets Fund | 6,017,747 | 452,303 | 464,724 | - | (19,162) | (1,306,343) | 4,679,821 |
| Fidelity Series Emerging Markets Opportunities Fund | 54,223,177 | 4,980,419 | 4,215,498 | - | (300,847) | (11,109,732) | 43,577,519 |
| Fidelity Series Floating Rate High Income Fund | 727,513 | 21,996 | 114,669 | 17,398 | (11,852) | (23,897) | 599,091 |
| Fidelity Series Government Money Market Fund 3.00% | 32,567,120 | 2,808,441 | 13,771,819 | 144,480 | - | - | 21,603,742 |
| Fidelity Series High Income Fund | 4,308,592 | 118,309 | 836,766 | 100,301 | (62,234) | (460,346) | 3,067,555 |
| Fidelity Series Inflation-Protected Bond Index Fund | 9,603,893 | 70,534 | 9,481,537 | 68,266 | 247,320 | (440,210) | - |
| Fidelity Series International Credit Fund | 698,487 | 9,537 | - | 9,537 | - | (105,721) | 602,303 |
| Fidelity Series International Developed Markets Bond Index Fund | 22,044,901 | 5,208,848 | 2,320,349 | 35,863 | (167,871) | (1,949,391) | 22,816,138 |
| Fidelity Series International Growth Fund | 25,534,360 | 2,341,777 | 2,457,888 | - | (326,391) | (5,407,106) | 19,684,752 |
| Fidelity Series International Small Cap Fund | 7,074,526 | 233,331 | 543,289 | - | (150,922) | (1,481,314) | 5,132,332 |
| Fidelity Series International Value Fund | 25,791,086 | 2,148,942 | 2,665,549 | - | 94,435 | (5,609,549) | 19,759,365 |
| Fidelity Series Investment Grade Bond Fund | 226,567,329 | 7,927,926 | 34,793,555 | 2,902,497 | (2,671,922) | (19,921,175) | 177,108,603 |
| Fidelity Series Large Cap Stock Fund | 26,891,734 | 3,159,900 | 3,816,693 | 1,247,755 | 391,565 | (6,170,610) | 20,455,896 |
| Fidelity Series Large Cap Value Index Fund | 2,908,521 | 105,501 | 332,991 | - | 68,774 | (541,947) | 2,207,858 |
| Fidelity Series Long-Term Treasury Bond Index Fund | 29,647,133 | 3,082,708 | 2,709,390 | 344,400 | (260,664) | (6,253,081) | 23,506,706 |
| Fidelity Series Opportunistic Insights Fund | 15,794,099 | 1,835,652 | 1,931,557 | - | (376,458) | (3,112,598) | 12,209,138 |
| Fidelity Series Overseas Fund | 25,676,347 | 2,566,887 | 2,058,732 | - | (154,296) | (6,159,387) | 19,870,819 |
| Fidelity Series Real Estate Income Fund | 2,601,759 | 132,208 | 933,438 | 117,496 | 38,839 | (384,749) | 1,454,619 |
| Fidelity Series Short-Term Credit Fund | 8,157,727 | 213,651 | 3,381,830 | 45,884 | (92,196) | (69,840) | 4,827,512 |
| Fidelity Series Small Cap Opportunities Fund | 9,577,921 | 511,196 | 1,248,152 | 328,294 | (164,165) | (1,747,958) | 6,928,842 |
| Fidelity Series Stock Selector Large Cap Value Fund | 17,164,449 | 1,033,873 | 2,394,465 | - | 247,060 | (3,051,826) | 12,999,091 |
| Fidelity Series Value Discovery Fund | 17,482,673 | 734,185 | 2,512,050 | - | 528,452 | (2,790,793) | 13,442,467 |
| | 716,798,281 | 70,218,138 | 113,586,477 | 10,338,484 | (5,448,350) | (102,444,593) | 565,536,999 |
Amounts in the income column in the above table include any capital gain distributions from underlying funds, which are presented in the corresponding line item in the Statement of Operations, if applicable.
Purchases and Sales Proceeds in the table above include the value of shares purchased or redeemed through in-kind transactions, if applicable.
Investment Valuation
The following is a summary of the inputs used, as of September 30, 2022, involving the Fund's assets and liabilities carried at fair value. The inputs or methodology used for valuing securities may not be an indication of the risk associated with investing in those securities. For more information on valuation inputs, and their aggregation into the levels used below, please refer to the Investment Valuation section in the accompanying Notes to Financial Statements.
| Valuation Inputs at Reporting Date: |
| Description | Total ($) | Level 1 ($) | Level 2 ($) | Level 3 ($) |
Investments in Securities: | | | | |
|
| Other Short-Term Investments | 308,205 | - | 308,205 | - |
|
| Domestic Equity Funds | 109,069,354 | 109,069,354 | - | - |
|
| International Equity Funds | 121,251,283 | 121,251,283 | - | - |
|
| Bond Funds | 308,785,108 | 308,785,108 | - | - |
|
| Short-Term Funds | 26,693,425 | 26,693,425 | - | - |
| Total Investments in Securities: | 566,107,375 | 565,799,170 | 308,205 | - |
Derivative Instruments: | | | | |
|
| Assets | | | | |
Futures Contracts | 313,771 | 313,771 | - | - |
| Total Assets | 313,771 | 313,771 | - | - |
|
| Liabilities | | | | |
Futures Contracts | (648,557) | (648,557) | - | - |
| Total Liabilities | (648,557) | (648,557) | - | - |
| Total Derivative Instruments: | (334,786) | (334,786) | - | - |
Value of Derivative Instruments
The following table is a summary of the Fund's value of derivative instruments by primary risk exposure as of September 30, 2022. For additional information on derivative instruments, please refer to the Derivative Instruments section in the accompanying Notes to Financial Statements.
Primary Risk Exposure / Derivative Type | Value |
| Asset ($) | Liability ($) |
| Equity Risk | | |
Futures Contracts (a) | 313,771 | 0 |
| Total Equity Risk | 313,771 | 0 |
| Interest Rate Risk | | |
Futures Contracts (a) | 0 | (648,557) |
| Total Interest Rate Risk | 0 | (648,557) |
| Total Value of Derivatives | 313,771 | (648,557) |
(a)Reflects gross cumulative appreciation (depreciation) on futures contracts as presented in the Schedule of Investments. In the Statement of Assets and Liabilities, the period end daily variation margin is included in receivable or payable for daily variation margin on futures contracts, and the net cumulative appreciation (depreciation) is included in Total accumulated earnings (loss).
Fidelity Advisor Freedom® 2015 Fund
| Statement of Assets and Liabilities |
| | | | September 30, 2022 (Unaudited) |
| | | | | |
| Assets | | | | |
| Investment in securities, at value - See accompanying schedule: | $ | | | |
Unaffiliated issuers (cost $308,059) | | $308,205 | | |
Fidelity Central Funds (cost $262,169) | | 262,171 | | |
Other affiliated issuers (cost $587,758,485) | | 565,536,999 | | |
| | | | | |
| Total Investment in Securities (cost $588,328,713) | | | $ | 566,107,375 |
| Receivable for investments sold | | | | 6,882,025 |
| Receivable for fund shares sold | | | | 103,595 |
| Distributions receivable from Fidelity Central Funds | | | | 920 |
| Receivable for daily variation margin on futures contracts | | | | 1,446 |
Total assets | | | | 573,095,361 |
| Liabilities | | | | |
| Payable for investments purchased | | 5,186,189 | | |
| Payable for fund shares redeemed | | 1,552,176 | | |
| Accrued management fee | | 260,020 | | |
| Distribution and service plan fees payable | | 100,473 | | |
| Payable for daily variation margin on futures contracts | | 15,513 | | |
| Total Liabilities | | | | 7,114,371 |
| Net Assets | | | $ | 565,980,990 |
| Net Assets consist of: | | | | |
| Paid in capital | | | $ | 588,858,791 |
| Total accumulated earnings (loss) | | | | (22,877,801) |
| Net Assets | | | $ | 565,980,990 |
| | | | | |
| Net Asset Value and Maximum Offering Price | | | | |
| Class A : | | | | |
Net Asset Value and redemption price per share ($249,589,164 ÷ 26,858,209 shares) (a) | | | $ | 9.29 |
| Maximum offering price per share (100/94.25 of $9.29) | | | $ | 9.86 |
| Class M : | | | | |
Net Asset Value and redemption price per share ($85,264,286 ÷ 9,223,372 shares) (a) | | | $ | 9.24 |
| Maximum offering price per share (100/96.50 of $9.24) | | | $ | 9.58 |
| Class C : | | | | |
Net Asset Value and offering price per share ($9,642,799 ÷ 1,053,126 shares) (a) | | | $ | 9.16 |
| Class I : | | | | |
Net Asset Value , offering price and redemption price per share ($164,952,777 ÷ 17,552,128 shares) | | | $ | 9.40 |
| Class Z : | | | | |
Net Asset Value , offering price and redemption price per share ($26,307,130 ÷ 2,824,922 shares) | | | $ | 9.31 |
| Class Z6 : | | | | |
Net Asset Value , offering price and redemption price per share ($30,224,834 ÷ 3,230,592 shares) | | | $ | 9.36 |
(a)Redemption price per share is equal to net asset value less any applicable contingent deferred sales charge. |
| Statement of Operations |
| | | | Six months ended September 30, 2022 (Unaudited) |
| Investment Income | | | | |
| Dividends: | | | | |
| Affiliated issuers | | | $ | 8,975,158 |
| Interest | | | | 2,655 |
| Income from Fidelity Central Funds | | | | 3,862 |
| Total Income | | | | 8,981,675 |
| Expenses | | | | |
| Management fee | $ | 1,680,392 | | |
| Distribution and service plan fees | | 652,000 | | |
| Independent trustees' fees and expenses | | 1,125 | | |
| Total expenses before reductions | | 2,333,517 | | |
| Expense reductions | | (21) | | |
| Total expenses after reductions | | | | 2,333,496 |
| Net Investment income (loss) | | | | 6,648,179 |
| Realized and Unrealized Gain (Loss) | | | | |
| Net realized gain (loss) on: | | | | |
| Investment Securities: | | | | |
| Unaffiliated issuers | | 218 | | |
| Affiliated issuers | | (5,448,350) | | |
| Futures contracts | | (220,879) | | |
| Capital gain distributions from underlying funds: | | | | |
| Affiliated issuers | | 1,363,326 | | |
| Total net realized gain (loss) | | | | (4,305,685) |
| Change in net unrealized appreciation (depreciation) on: | | | | |
| Investment Securities: | | | | |
| Unaffiliated issuers | | 147 | | |
| Affiliated issuers | | (102,444,593) | | |
| Futures contracts | | (527,156) | | |
| Total change in net unrealized appreciation (depreciation) | | | | (102,971,602) |
| Net gain (loss) | | | | (107,277,287) |
| Net increase (decrease) in net assets resulting from operations | | | $ | (100,629,108) |
| Statement of Changes in Net Assets |
| |
| | Six months ended September 30, 2022 (Unaudited) | | Year ended March 31, 2022 |
| Increase (Decrease) in Net Assets | | | | |
| Operations | | | | |
| Net investment income (loss) | $ | 6,648,179 | $ | 16,852,885 |
| Net realized gain (loss) | | (4,305,685) | | 55,607,699 |
| Change in net unrealized appreciation (depreciation) | | (102,971,602) | | (68,047,088) |
| Net increase (decrease) in net assets resulting from operations | | (100,629,108) | | 4,413,496 |
| Distributions to shareholders | | (30,103,233) | | (78,805,498) |
| Share transactions - net increase (decrease) | | (20,582,024) | | (53,924,482) |
| Total increase (decrease) in net assets | | (151,314,365) | | (128,316,484) |
| | | | | |
| Net Assets | | | | |
| Beginning of period | | 717,295,355 | | 845,611,839 |
| End of period | $ | 565,980,990 | $ | 717,295,355 |
| | | | | |
| | | | | |
Financial Highlights
| Fidelity Advisor Freedom® 2015 Fund Class A |
| |
| | Six months ended (Unaudited) September 30, 2022 | | Years ended March 31, 2022 | | 2021 | | 2020 | | 2019 | | 2018 |
Selected Per-Share Data | | | | | | | | | | | | |
| Net asset value, beginning of period | $ | 11.40 | $ | 12.59 | $ | 10.71 | $ | 11.79 | $ | 12.59 | $ | 12.43 |
| Income from Investment Operations | | | | | | | | | | | | |
Net investment income (loss) A,B | | .10 | | .25 | | .09 | | .18 | | .21 | | .16 |
| Net realized and unrealized gain (loss) | | (1.72) | | (.21) | | 2.66 | | (.44) | | .14 | | .87 |
| Total from investment operations | | (1.62) | | .04 | | 2.75 | | (.26) | | .35 | | 1.03 |
| Distributions from net investment income | | - | | (.26) | | (.11) | | (.19) | | (.21) | | (.18) |
| Distributions from net realized gain | | (.49) | | (.97) | | (.76) | | (.62) | | (.94) | | (.70) |
| Total distributions | | (.49) | | (1.23) | | (.87) | | (.82) C | | (1.15) | | (.87) C |
| Net asset value, end of period | $ | 9.29 | $ | 11.40 | $ | 12.59 | $ | 10.71 | $ | 11.79 | $ | 12.59 |
Total Return D,E,F | | (14.61)% | | (.08)% | | 26.45% | | (2.77)% | | 3.26% | | 8.42% |
Ratios to Average Net Assets B,G,H | | | | | | | | | | | | |
| Expenses before reductions | | .78% I | | .79% | | .80% | | .81% | | .82% | | .72% |
| Expenses net of fee waivers, if any | | .78% I | | .79% | | .80% | | .81% | | .82% | | .72% |
| Expenses net of all reductions | | .78% I | | .79% | | .80% | | .81% | | .82% | | .72% |
| Net investment income (loss) | | 2.01% I | | 2.03% | | .79% | | 1.50% | | 1.71% | | 1.22% |
| Supplemental Data | | | | | | | | | | | | |
| Net assets, end of period (000 omitted) | $ | 249,589 | $ | 315,460 | $ | 385,409 | $ | 360,371 | $ | 476,763 | $ | 551,179 |
Portfolio turnover rate J | | 22% I | | 35% | | 27% | | 22% | | 21% | | 19% |
A Calculated based on average shares outstanding during the period.
B Net investment income (loss) is affected by the timing of the declaration of dividends by any underlying mutual funds or exchange-traded funds (ETFs). Net investment income (loss) of any such underlying funds is not included in the Fund's net investment income (loss) ratio.
C Total distributions per share do not sum due to rounding.
D Total returns for periods of less than one year are not annualized.
E Total returns would have been lower if certain expenses had not been reduced during the applicable periods shown.
F Total returns do not include the effect of the sales charges.
G Fees and expenses of any underlying mutual funds or exchange-traded funds (ETFs) are not included in the Fund's expense ratio. The Fund indirectly bears its proportionate share of these expenses. For additional expense information related to investments in Fidelity Central Funds, please refer to the "Investments in Fidelity Central Funds" note found in the Notes to Financial Statements section of the most recent Annual or Semi-Annual report.
H Expense ratios reflect operating expenses of the class. Expenses before reductions do not reflect amounts reimbursed, waived, or reduced through arrangements with the investment adviser, brokerage services, or other offset arrangements, if applicable, and do not represent the amount paid by the class during periods when reimbursements, waivers or reductions occur.
I Annualized
J Amount does not include the portfolio activity of any underlying mutual funds or exchange-traded funds (ETFs).
| Fidelity Advisor Freedom® 2015 Fund Class M |
| |
| | Six months ended (Unaudited) September 30, 2022 | | Years ended March 31, 2022 | | 2021 | | 2020 | | 2019 | | 2018 |
Selected Per-Share Data | | | | | | | | | | | | |
| Net asset value, beginning of period | $ | 11.35 | $ | 12.55 | $ | 10.68 | $ | 11.76 | $ | 12.56 | $ | 12.41 |
| Income from Investment Operations | | | | | | | | | | | | |
Net investment income (loss) A,B | | .09 | | .22 | | .06 | | .15 | | .17 | | .12 |
| Net realized and unrealized gain (loss) | | (1.72) | | (.21) | | 2.65 | | (.44) | | .15 | | .87 |
| Total from investment operations | | (1.63) | | .01 | | 2.71 | | (.29) | | .32 | | .99 |
| Distributions from net investment income | | - | | (.24) | | (.08) | | (.16) | | (.18) | | (.15) |
| Distributions from net realized gain | | (.48) | | (.97) | | (.76) | | (.62) | | (.94) | | (.70) |
| Total distributions | | (.48) | | (1.21) | | (.84) | | (.79) C | | (1.12) | | (.84) C |
| Net asset value, end of period | $ | 9.24 | $ | 11.35 | $ | 12.55 | $ | 10.68 | $ | 11.76 | $ | 12.56 |
Total Return D,E,F | | (14.71)% | | (.35)% | | 26.13% | | (3.00)% | | 3.01% | | 8.10% |
Ratios to Average Net Assets B,G,H | | | | | | | | | | | | |
| Expenses before reductions | | 1.03% I | | 1.04% | | 1.05% | | 1.06% | | 1.07% | | .98% |
| Expenses net of fee waivers, if any | | 1.03% I | | 1.04% | | 1.05% | | 1.06% | | 1.07% | | .98% |
| Expenses net of all reductions | | 1.03% I | | 1.04% | | 1.05% | | 1.06% | | 1.07% | | .98% |
| Net investment income (loss) | | 1.76% I | | 1.78% | | .54% | | 1.25% | | 1.45% | | .96% |
| Supplemental Data | | | | | | | | | | | | |
| Net assets, end of period (000 omitted) | $ | 85,264 | $ | 107,957 | $ | 134,240 | $ | 123,857 | $ | 152,212 | $ | 167,835 |
Portfolio turnover rate J | | 22% I | | 35% | | 27% | | 22% | | 21% | | 19% |
A Calculated based on average shares outstanding during the period.
B Net investment income (loss) is affected by the timing of the declaration of dividends by any underlying mutual funds or exchange-traded funds (ETFs). Net investment income (loss) of any such underlying funds is not included in the Fund's net investment income (loss) ratio.
C Total distributions per share do not sum due to rounding.
D Total returns for periods of less than one year are not annualized.
E Total returns would have been lower if certain expenses had not been reduced during the applicable periods shown.
F Total returns do not include the effect of the sales charges.
G Fees and expenses of any underlying mutual funds or exchange-traded funds (ETFs) are not included in the Fund's expense ratio. The Fund indirectly bears its proportionate share of these expenses. For additional expense information related to investments in Fidelity Central Funds, please refer to the "Investments in Fidelity Central Funds" note found in the Notes to Financial Statements section of the most recent Annual or Semi-Annual report.
H Expense ratios reflect operating expenses of the class. Expenses before reductions do not reflect amounts reimbursed, waived, or reduced through arrangements with the investment adviser, brokerage services, or other offset arrangements, if applicable, and do not represent the amount paid by the class during periods when reimbursements, waivers or reductions occur.
I Annualized
J Amount does not include the portfolio activity of any underlying mutual funds or exchange-traded funds (ETFs).
| Fidelity Advisor Freedom® 2015 Fund Class C |
| |
| | Six months ended (Unaudited) September 30, 2022 | | Years ended March 31, 2022 | | 2021 | | 2020 | | 2019 | | 2018 |
Selected Per-Share Data | | | | | | | | | | | | |
| Net asset value, beginning of period | $ | 11.28 | $ | 12.46 | $ | 10.62 | $ | 11.69 | $ | 12.47 | $ | 12.32 |
| Income from Investment Operations | | | | | | | | | | | | |
Net investment income (loss) A,B | | .06 | | .16 | | - | | .09 | | .11 | | .06 |
| Net realized and unrealized gain (loss) | | (1.70) | | (.20) | | 2.62 | | (.44) | | .16 | | .86 |
| Total from investment operations | | (1.64) | | (.04) | | 2.62 | | (.35) | | .27 | | .92 |
| Distributions from net investment income | | - | | (.17) | | (.03) | | (.09) | | (.13) | | (.08) |
| Distributions from net realized gain | | (.48) | | (.97) | | (.74) | | (.62) | | (.93) | | (.70) |
| Total distributions | | (.48) | | (1.14) | | (.78) C | | (.72) C | | (1.05) C | | (.77) C |
| Net asset value, end of period | $ | 9.16 | $ | 11.28 | $ | 12.46 | $ | 10.62 | $ | 11.69 | $ | 12.47 |
Total Return D,E,F | | (14.89)% | | (.74)% | | 25.36% | | (3.48)% | | 2.60% | | 7.57% |
Ratios to Average Net Assets B,G,H | | | | | | | | | | | | |
| Expenses before reductions | | 1.53% I | | 1.54% | | 1.55% | | 1.56% | | 1.57% | | 1.48% |
| Expenses net of fee waivers, if any | | 1.53% I | | 1.54% | | 1.55% | | 1.56% | | 1.57% | | 1.48% |
| Expenses net of all reductions | | 1.53% I | | 1.54% | | 1.55% | | 1.55% | | 1.57% | | 1.48% |
| Net investment income (loss) | | 1.26% I | | 1.28% | | .04% | | .76% | | .96% | | .47% |
| Supplemental Data | | | | | | | | | | | | |
| Net assets, end of period (000 omitted) | $ | 9,643 | $ | 12,554 | $ | 20,654 | $ | 20,129 | $ | 31,274 | $ | 54,730 |
Portfolio turnover rate J | | 22% I | | 35% | | 27% | | 22% | | 21% | | 19% |
A Calculated based on average shares outstanding during the period.
B Net investment income (loss) is affected by the timing of the declaration of dividends by any underlying mutual funds or exchange-traded funds (ETFs). Net investment income (loss) of any such underlying funds is not included in the Fund's net investment income (loss) ratio.
C Total distributions per share do not sum due to rounding.
D Total returns for periods of less than one year are not annualized.
E Total returns would have been lower if certain expenses had not been reduced during the applicable periods shown.
F Total returns do not include the effect of the contingent deferred sales charge.
G Fees and expenses of any underlying mutual funds or exchange-traded funds (ETFs) are not included in the Fund's expense ratio. The Fund indirectly bears its proportionate share of these expenses. For additional expense information related to investments in Fidelity Central Funds, please refer to the "Investments in Fidelity Central Funds" note found in the Notes to Financial Statements section of the most recent Annual or Semi-Annual report.
H Expense ratios reflect operating expenses of the class. Expenses before reductions do not reflect amounts reimbursed, waived, or reduced through arrangements with the investment adviser, brokerage services, or other offset arrangements, if applicable, and do not represent the amount paid by the class during periods when reimbursements, waivers or reductions occur.
I Annualized
J Amount does not include the portfolio activity of any underlying mutual funds or exchange-traded funds (ETFs).
| Fidelity Advisor Freedom® 2015 Fund Class I |
| |
| | Six months ended (Unaudited) September 30, 2022 | | Years ended March 31, 2022 | | 2021 | | 2020 | | 2019 | | 2018 |
Selected Per-Share Data | | | | | | | | | | | | |
| Net asset value, beginning of period | $ | 11.52 | $ | 12.71 | $ | 10.81 | $ | 11.89 | $ | 12.69 | $ | 12.53 |
| Income from Investment Operations | | | | | | | | | | | | |
Net investment income (loss) A,B | | .12 | | .29 | | .13 | | .21 | | .24 | | .19 |
| Net realized and unrealized gain (loss) | | (1.75) | | (.22) | | 2.67 | | (.44) | | .14 | | .88 |
| Total from investment operations | | (1.63) | | .07 | | 2.80 | | (.23) | | .38 | | 1.07 |
| Distributions from net investment income | | (.01) | | (.29) | | (.14) | | (.22) | | (.24) | | (.21) |
| Distributions from net realized gain | | (.49) | | (.97) | | (.76) | | (.62) | | (.94) | | (.70) |
| Total distributions | | (.49) C | | (1.26) | | (.90) | | (.85) C | | (1.18) | | (.91) |
| Net asset value, end of period | $ | 9.40 | $ | 11.52 | $ | 12.71 | $ | 10.81 | $ | 11.89 | $ | 12.69 |
Total Return D,E | | (14.47)% | | .20% | | 26.71% | | (2.50)% | | 3.55% | | 8.66% |
Ratios to Average Net Assets B,F,G | | | | | | | | | | | | |
| Expenses before reductions | | .53% H | | .54% | | .55% | | .56% | | .57% | | .48% |
| Expenses net of fee waivers, if any | | .53% H | | .54% | | .55% | | .56% | | .57% | | .48% |
| Expenses net of all reductions | | .53% H | | .54% | | .55% | | .56% | | .57% | | .48% |
| Net investment income (loss) | | 2.26% H | | 2.28% | | 1.04% | | 1.75% | | 1.95% | | 1.46% |
| Supplemental Data | | | | | | | | | | | | |
| Net assets, end of period (000 omitted) | $ | 164,953 | $ | 222,906 | $ | 256,243 | $ | 238,048 | $ | 304,221 | $ | 324,189 |
Portfolio turnover rate I | | 22% H | | 35% | | 27% | | 22% | | 21% | | 19% |
A Calculated based on average shares outstanding during the period.
B Net investment income (loss) is affected by the timing of the declaration of dividends by any underlying mutual funds or exchange-traded funds (ETFs). Net investment income (loss) of any such underlying funds is not included in the Fund's net investment income (loss) ratio.
C Total distributions per share do not sum due to rounding.
D Total returns for periods of less than one year are not annualized.
E Total returns would have been lower if certain expenses had not been reduced during the applicable periods shown.
F Fees and expenses of any underlying mutual funds or exchange-traded funds (ETFs) are not included in the Fund's expense ratio. The Fund indirectly bears its proportionate share of these expenses. For additional expense information related to investments in Fidelity Central Funds, please refer to the "Investments in Fidelity Central Funds" note found in the Notes to Financial Statements section of the most recent Annual or Semi-Annual report.
G Expense ratios reflect operating expenses of the class. Expenses before reductions do not reflect amounts reimbursed, waived, or reduced through arrangements with the investment adviser, brokerage services, or other offset arrangements, if applicable, and do not represent the amount paid by the class during periods when reimbursements, waivers or reductions occur.
H Annualized
I Amount does not include the portfolio activity of any underlying mutual funds or exchange-traded funds (ETFs).
| Fidelity Advisor Freedom® 2015 Fund Class Z |
| |
| | Six months ended (Unaudited) September 30, 2022 | | Years ended March 31, 2022 | | 2021 | | 2020 | | 2019 A |
Selected Per-Share Data | | | | | | | | | | |
| Net asset value, beginning of period | $ | 11.42 | $ | 12.62 | $ | 10.74 | $ | 11.85 | $ | 12.50 |
| Income from Investment Operations | | | | | | | | | | |
Net investment income (loss) B,C | | .12 | | .29 | | .13 | | .22 | | .27 |
| Net realized and unrealized gain (loss) | | (1.73) | | (.21) | | 2.66 | | (.45) | | (.17) |
| Total from investment operations | | (1.61) | | .08 | | 2.79 | | (.23) | | .10 |
| Distributions from net investment income | | (.01) | | (.31) | | (.15) | | (.26) | | (.27) |
| Distributions from net realized gain | | (.49) | | (.97) | | (.76) | | (.62) | | (.48) |
| Total distributions | | (.50) | | (1.28) | | (.91) | | (.88) | | (.75) |
| Net asset value, end of period | $ | 9.31 | $ | 11.42 | $ | 12.62 | $ | 10.74 | $ | 11.85 |
Total Return D,E | | (14.49)% | | .25% | | 26.82% | | (2.48)% | | 1.29% |
Ratios to Average Net Assets C,F,G | | | | | | | | | | |
| Expenses before reductions | | .47% H | | .48% | | .48% | | .49% | | .51% H |
| Expenses net of fee waivers, if any | | .47% H | | .48% | | .48% | | .49% | | .51% H |
| Expenses net of all reductions | | .47% H | | .48% | | .48% | | .49% | | .51% H |
| Net investment income (loss) | | 2.33% H | | 2.35% | | 1.11% | | 1.82% | | 4.73% H |
| Supplemental Data | | | | | | | | | | |
| Net assets, end of period (000 omitted) | $ | 26,307 | $ | 24,200 | $ | 20,850 | $ | 16,135 | $ | 1,522 |
Portfolio turnover rate I | | 22% H | | 35% | | 27% | | 22% | | 21% |
A For the period October 2, 2018 (commencement of sale of shares) through March 31, 2019.
B Calculated based on average shares outstanding during the period.
C Net investment income (loss) is affected by the timing of the declaration of dividends by any underlying mutual funds or exchange-traded funds (ETFs). Net investment income (loss) of any such underlying funds is not included in the Fund's net investment income (loss) ratio.
D Total returns for periods of less than one year are not annualized.
E Total returns would have been lower if certain expenses had not been reduced during the applicable periods shown.
F Fees and expenses of any underlying mutual funds or exchange-traded funds (ETFs) are not included in the Fund's expense ratio. The Fund indirectly bears its proportionate share of these expenses. For additional expense information related to investments in Fidelity Central Funds, please refer to the "Investments in Fidelity Central Funds" note found in the Notes to Financial Statements section of the most recent Annual or Semi-Annual report.
G Expense ratios reflect operating expenses of the class. Expenses before reductions do not reflect amounts reimbursed, waived, or reduced through arrangements with the investment adviser, brokerage services, or other offset arrangements, if applicable, and do not represent the amount paid by the class during periods when reimbursements, waivers or reductions occur.
H Annualized
I Amount does not include the portfolio activity of any underlying mutual funds or exchange-traded funds (ETFs).
| Fidelity Advisor Freedom® 2015 Fund Class Z6 |
| |
| | Six months ended (Unaudited) September 30, 2022 | | Years ended March 31, 2022 | | 2021 | | 2020 | | 2019 | | 2018 A |
Selected Per-Share Data | | | | | | | | | | | | |
| Net asset value, beginning of period | $ | 11.46 | $ | 12.66 | $ | 10.78 | $ | 11.87 | $ | 12.67 | $ | 12.66 |
| Income from Investment Operations | | | | | | | | | | | | |
Net investment income (loss) B,C | | .12 | | .30 | | .14 | | .23 | | .25 | | .18 |
| Net realized and unrealized gain (loss) | | (1.72) | | (.21) | | 2.66 | | (.45) | | .16 | | .51 |
| Total from investment operations | | (1.60) | | .09 | | 2.80 | | (.22) | | .41 | | .69 |
| Distributions from net investment income | | (.01) | | (.32) | | (.17) | | (.25) | | (.27) | | (.21) |
| Distributions from net realized gain | | (.49) | | (.97) | | (.76) | | (.62) | | (.94) | | (.47) |
| Total distributions | | (.50) | | (1.29) | | (.92) D | | (.87) | | (1.21) | | (.68) |
| Net asset value, end of period | $ | 9.36 | $ | 11.46 | $ | 12.66 | $ | 10.78 | $ | 11.87 | $ | 12.67 |
Total Return E,F | | (14.34)% | | .31% | | 26.84% | | (2.40)% | | 3.81% | | 5.42% |
Ratios to Average Net Assets C,G,H | | | | | | | | | | | | |
| Expenses before reductions | | .40% I | | .40% | | .40% | | .41% | | .41% | | .43% I,J |
| Expenses net of fee waivers, if any | | .40% I | | .40% | | .40% | | .41% | | .41% | | .43% I,J |
| Expenses net of all reductions | | .40% I | | .40% | | .40% | | .41% | | .41% | | .43% I,J |
| Net investment income (loss) | | 2.40% I | | 2.42% | | 1.19% | | 1.90% | | 2.11% | | 1.75% I |
| Supplemental Data | | | | | | | | | | | | |
| Net assets, end of period (000 omitted) | $ | 30,225 | $ | 34,218 | $ | 28,215 | $ | 15,400 | $ | 16,536 | $ | 12,903 |
Portfolio turnover rate K | | 22% I | | 35% | | 27% | | 22% | | 21% | | 19% |
A For the period June 6, 2017 (commencement of sale of shares) through March 31, 2018.
B Calculated based on average shares outstanding during the period.
C Net investment income (loss) is affected by the timing of the declaration of dividends by any underlying mutual funds or exchange-traded funds (ETFs). Net investment income (loss) of any such underlying funds is not included in the Fund's net investment income (loss) ratio.
D Total distributions per share do not sum due to rounding.
E Total returns for periods of less than one year are not annualized.
F Total returns would have been lower if certain expenses had not been reduced during the applicable periods shown.
G Fees and expenses of any underlying mutual funds or exchange-traded funds (ETFs) are not included in the Fund's expense ratio. The Fund indirectly bears its proportionate share of these expenses. For additional expense information related to investments in Fidelity Central Funds, please refer to the "Investments in Fidelity Central Funds" note found in the Notes to Financial Statements section of the most recent Annual or Semi-Annual report.
H Expense ratios reflect operating expenses of the class. Expenses before reductions do not reflect amounts reimbursed, waived, or reduced through arrangements with the investment adviser, brokerage services, or other offset arrangements, if applicable, and do not represent the amount paid by the class during periods when reimbursements, waivers or reductions occur.
I Annualized
J On certain classes, the size and fluctuation of net assets and expense amounts may cause ratios to differ from contractual rates.
K Amount does not include the portfolio activity of any underlying mutual funds or exchange-traded funds (ETFs).
The information in the following table is based on the direct Investments of the Fund.
Top Holdings (% of Fund's net assets) |
| |
| Fidelity Series Investment Grade Bond Fund | 27.8 | |
| Fidelity Series Emerging Markets Opportunities Fund | 8.7 | |
| Fidelity Series 5+ Year Inflation-Protected Bond Index Fund | 8.3 | |
| Fidelity Series Large Cap Stock Fund | 4.7 | |
| Fidelity Series Long-Term Treasury Bond Index Fund | 4.4 | |
| Fidelity Series Overseas Fund | 4.2 | |
| Fidelity Series International Value Fund | 4.2 | |
| Fidelity Series International Growth Fund | 4.2 | |
| Fidelity Series International Developed Markets Bond Index Fund | 4.0 | |
| Fidelity Series Value Discovery Fund | 3.1 | |
| | 73.6 | |
| |
Domestic Equity Funds category includes Fidelity Series Commodity Strategy Fund which invests in commodity-related investments.
Asset Allocation (% of Fund's net assets) |
|
Percentages shown as 0.0% may reflect amounts less than 0.05%. |
|
Fidelity Advisor Freedom® 2020 Fund
Showing Percentage of Net Assets
| U.S. Treasury Obligations - 0.1% |
| | | Principal Amount (a) | Value ($) |
U.S. Treasury Bills, yield at date of purchase 2.13% to 3.29% 10/13/22 to 12/29/22 (b) (Cost $766,061) | | 770,000 | 766,327 |
| | | | |
| Domestic Equity Funds - 24.8% |
| | | Shares | Value ($) |
| Fidelity Advisor Series Equity Growth Fund (c) | | 3,554,727 | 43,189,931 |
| Fidelity Advisor Series Growth Opportunities Fund (c) | | 3,473,215 | 30,460,096 |
| Fidelity Advisor Series Small Cap Fund (c) | | 1,795,825 | 18,802,283 |
| Fidelity Series All-Sector Equity Fund (c) | | 1,993,613 | 17,105,203 |
| Fidelity Series Commodity Strategy Fund (c) | | 8,046,162 | 16,816,479 |
| Fidelity Series Large Cap Stock Fund (c) | | 4,462,142 | 65,905,841 |
| Fidelity Series Large Cap Value Index Fund (c) | | 562,844 | 7,159,372 |
| Fidelity Series Opportunistic Insights Fund (c) | | 2,770,913 | 39,374,670 |
| Fidelity Series Small Cap Opportunities Fund (c) | | 2,083,512 | 22,460,259 |
| Fidelity Series Stock Selector Large Cap Value Fund (c) | | 3,749,520 | 41,882,139 |
| Fidelity Series Value Discovery Fund (c) | | 3,145,159 | 43,308,833 |
| TOTAL DOMESTIC EQUITY FUNDS (Cost $311,396,934) | | | 346,465,106 |
| | | | |
| International Equity Funds - 25.1% |
| | | Shares | Value ($) |
| Fidelity Series Canada Fund (c) | | 2,048,944 | 25,406,901 |
| Fidelity Series Emerging Markets Fund (c) | | 1,806,215 | 13,076,997 |
| Fidelity Series Emerging Markets Opportunities Fund (c) | | 8,365,805 | 121,471,485 |
| Fidelity Series International Growth Fund (c) | | 4,561,195 | 58,474,525 |
| Fidelity Series International Small Cap Fund (c) | | 1,113,880 | 15,237,881 |
| Fidelity Series International Value Fund (c) | | 6,833,366 | 58,698,617 |
| Fidelity Series Overseas Fund (c) | | 6,194,301 | 59,031,692 |
| TOTAL INTERNATIONAL EQUITY FUNDS (Cost $339,836,474) | | | 351,398,098 |
| | | | |
| Bond Funds - 48.2% |
| | | Shares | Value ($) |
| Fidelity Series 0-5 Year Inflation-Protected Bond Index Fund (c) | | 2,921,741 | 28,194,797 |
| Fidelity Series 5+ Year Inflation-Protected Bond Index Fund (c) | | 14,462,502 | 115,555,391 |
| Fidelity Series Emerging Markets Debt Fund (c) | | 1,070,186 | 7,341,476 |
| Fidelity Series Emerging Markets Debt Local Currency Fund (c) | | 303,017 | 2,415,049 |
| Fidelity Series Floating Rate High Income Fund (c) | | 168,588 | 1,466,714 |
| Fidelity Series High Income Fund (c) | | 962,170 | 7,581,897 |
| Fidelity Series International Credit Fund (c) | | 164,493 | 1,294,557 |
| Fidelity Series International Developed Markets Bond Index Fund (c) | | 6,619,267 | 56,396,155 |
| Fidelity Series Investment Grade Bond Fund (c) | | 39,742,629 | 387,888,060 |
| Fidelity Series Long-Term Treasury Bond Index Fund (c) | | 10,364,442 | 61,875,717 |
| Fidelity Series Real Estate Income Fund (c) | | 377,682 | 3,595,530 |
| TOTAL BOND FUNDS (Cost $787,866,999) | | | 673,605,343 |
| | | | |
| Short-Term Funds - 1.8% |
| | | Shares | Value ($) |
| Fidelity Cash Central Fund 3.10% (d) | | 660,005 | 660,137 |
| Fidelity Series Government Money Market Fund 3.00% (c)(e) | | 21,325,483 | 21,325,483 |
| Fidelity Series Short-Term Credit Fund (c) | | 363,625 | 3,447,160 |
| TOTAL SHORT-TERM FUNDS (Cost $25,588,561) | | | 25,432,780 |
| | | | |
| TOTAL INVESTMENT IN SECURITIES - 100.0% (Cost $1,465,455,029) | 1,397,667,654 |
NET OTHER ASSETS (LIABILITIES) - 0.0% | (308,571) |
| NET ASSETS - 100.0% | 1,397,359,083 |
| | |
| Futures Contracts |
| | Number of contracts | Expiration Date | Notional Amount ($) | Value ($) | Unrealized Appreciation/ (Depreciation) ($) |
| Purchased | | | | | |
| | | | | | |
| Treasury Contracts | | | | | |
| CBOT 10-Year U.S. Treasury Note Contracts (United States) | 228 | Dec 2022 | 25,550,250 | (1,562,507) | (1,562,507) |
| CBOT Ultra Long Term U.S. Treasury Bond Contracts (United States) | 21 | Dec 2022 | 2,877,000 | (36,999) | (36,999) |
| | | | | | |
| TOTAL PURCHASED | | | | | (1,599,506) |
| | | | | | |
| Sold | | | | | |
| | | | | | |
| Equity Index Contracts | | | | | |
| CME E-mini S&P 500 Index Contracts (United States) | 32 | Dec 2022 | 5,762,400 | 72,503 | 72,503 |
| ICE E-mini MSCI EAFE Index Contracts (United States) | 82 | Dec 2022 | 6,808,460 | 777,147 | 777,147 |
| ICE E-mini MSCI Emerging Markets Index Contracts (United States) | 47 | Dec 2022 | 2,048,025 | 2,361 | 2,361 |
| | | | | | |
| TOTAL SOLD | | | | | 852,011 |
| | | | | | |
| TOTAL FUTURES CONTRACTS | | | | | (747,495) |
| The notional amount of futures purchased as a percentage of Net Assets is 2.0% |
| The notional amount of futures sold as a percentage of Net Assets is 1.0% |
Legend
| (a) | Amount is stated in United States dollars unless otherwise noted. |
| (b) | Security or a portion of the security was pledged to cover margin requirements for futures contracts. At period end, the value of securities pledged amounted to $766,327. |
| (d) | Affiliated fund that is generally available only to investment companies and other accounts managed by Fidelity Investments. The rate quoted is the annualized seven-day yield of the fund at period end. A complete unaudited listing of the fund's holdings as of its most recent quarter end is available upon request. In addition, each Fidelity Central Fund's financial statements are available on the SEC's website or upon request. |
| (e) | The rate quoted is the annualized seven-day yield of the fund at period end. |
Affiliated Central Funds
Fiscal year to date information regarding the Fund's investments in Fidelity Central Funds, including the ownership percentage, is presented below.
| Affiliate | Value, beginning of period ($) | Purchases ($) | Sales Proceeds ($) | Dividend Income ($) | Realized Gain (loss) ($) | Change in Unrealized appreciation (depreciation) ($) | Value, end of period ($) | %ownership, end of period |
| Fidelity Cash Central Fund 3.10% | 1,250,869 | 8,753,665 | 9,344,397 | 9,668 | - | - | 660,137 | 0.0% |
| Total | 1,250,869 | 8,753,665 | 9,344,397 | 9,668 | - | - | 660,137 | |
| | | | | | | | | |
Amounts in the income column in the above table include any capital gain distributions from underlying funds, which are presented in the corresponding line item in the Statement of Operations, if applicable.
Affiliated Underlying Funds
Fiscal year to date information regarding the Fund's investments in affiliated Underlying Funds is presented below. Exchanges between classes of the same affiliated Underlying Funds may occur. If an Underlying Funds changes its name, the name presented below is the name in effect at period end.
| Affiliate | Value, beginning of period ($) | Purchases ($) | Sales Proceeds ($) | Dividend Income ($) | Realized Gain (loss) ($) | Change in Unrealized appreciation (depreciation) ($) | Value, end of period ($) |
| Fidelity Advisor Series Equity Growth Fund | 56,599,222 | 5,162,345 | 6,760,017 | - | (886,750) | (10,924,869) | 43,189,931 |
| Fidelity Advisor Series Growth Opportunities Fund | 38,815,894 | 8,324,785 | 5,547,396 | - | (1,594,289) | (9,538,898) | 30,460,096 |
| Fidelity Advisor Series Small Cap Fund | 25,690,600 | 1,636,400 | 3,858,403 | - | (453,039) | (4,213,275) | 18,802,283 |
| Fidelity Series 0-5 Year Inflation-Protected Bond Index Fund | 20,309,191 | 14,403,170 | 5,407,420 | - | (14,717) | (1,095,427) | 28,194,797 |
| Fidelity Series 5+ Year Inflation-Protected Bond Index Fund | 126,925,574 | 29,583,456 | 17,938,350 | - | (1,661,937) | (21,353,352) | 115,555,391 |
| Fidelity Series All-Sector Equity Fund | 24,276,012 | 564,114 | 3,017,680 | - | (363,527) | (4,353,716) | 17,105,203 |
| Fidelity Series Canada Fund | 34,247,494 | 1,193,258 | 3,440,704 | - | 294,742 | (6,887,889) | 25,406,901 |
| Fidelity Series Commodity Strategy Fund | 27,173,368 | 13,849,666 | 9,968,200 | 12,161,591 | (1,945,039) | (12,293,316) | 16,816,479 |
| Fidelity Series Emerging Markets Debt Fund | 9,161,970 | 536,626 | 846,648 | 225,503 | (167,738) | (1,342,734) | 7,341,476 |
| Fidelity Series Emerging Markets Debt Local Currency Fund | 3,075,117 | 19,990 | 338,926 | - | (65,657) | (275,475) | 2,415,049 |
| Fidelity Series Emerging Markets Fund | 17,295,269 | 1,065,283 | 1,525,957 | - | (115,894) | (3,641,704) | 13,076,997 |
| Fidelity Series Emerging Markets Opportunities Fund | 155,842,052 | 12,308,091 | 14,378,254 | - | (1,775,872) | (30,524,532) | 121,471,485 |
| Fidelity Series Floating Rate High Income Fund | 1,856,440 | 55,405 | 354,723 | 43,645 | (38,590) | (51,818) | 1,466,714 |
| Fidelity Series Government Money Market Fund 3.00% | 37,374,752 | 8,797,509 | 24,846,778 | 109,320 | - | - | 21,325,483 |
| Fidelity Series High Income Fund | 11,022,652 | 318,851 | 2,440,307 | 252,908 | (281,929) | (1,037,370) | 7,581,897 |
| Fidelity Series Inflation-Protected Bond Index Fund | 19,991,795 | 202,241 | 19,766,045 | 169,303 | 476,734 | (904,725) | - |
| Fidelity Series International Credit Fund | 1,501,290 | 20,497 | - | 20,498 | - | (227,230) | 1,294,557 |
| Fidelity Series International Developed Markets Bond Index Fund | 56,641,000 | 12,518,819 | 7,427,521 | 91,210 | (623,913) | (4,712,230) | 56,396,155 |
| Fidelity Series International Growth Fund | 78,139,643 | 6,067,808 | 8,380,474 | - | (1,348,579) | (16,003,873) | 58,474,525 |
| Fidelity Series International Small Cap Fund | 21,596,458 | 414,282 | 1,834,897 | - | (352,436) | (4,585,526) | 15,237,881 |
| Fidelity Series International Value Fund | 79,033,754 | 5,322,447 | 9,003,268 | - | 397,630 | (17,051,946) | 58,698,617 |
| Fidelity Series Investment Grade Bond Fund | 512,504,061 | 19,159,150 | 93,339,783 | 6,450,397 | (8,415,706) | (42,019,662) | 387,888,060 |
| Fidelity Series Large Cap Stock Fund | 89,058,863 | 8,897,384 | 13,131,964 | 4,049,608 | 1,766,329 | (20,684,771) | 65,905,841 |
| Fidelity Series Large Cap Value Index Fund | 9,632,344 | 252,531 | 1,173,217 | - | 278,071 | (1,830,357) | 7,159,372 |
| Fidelity Series Long-Term Treasury Bond Index Fund | 79,326,622 | 8,559,227 | 8,742,353 | 910,541 | (849,616) | (16,418,163) | 61,875,717 |
| Fidelity Series Opportunistic Insights Fund | 52,305,954 | 5,395,625 | 6,863,528 | - | (1,388,677) | (10,074,704) | 39,374,670 |
| Fidelity Series Overseas Fund | 78,683,012 | 6,493,681 | 7,032,550 | - | (675,182) | (18,437,269) | 59,031,692 |
| Fidelity Series Real Estate Income Fund | 6,646,911 | 322,216 | 2,505,769 | 295,081 | 109,243 | (977,071) | 3,595,530 |
| Fidelity Series Short-Term Credit Fund | 9,363,105 | 278,613 | 6,056,763 | 38,085 | (164,557) | 26,762 | 3,447,160 |
| Fidelity Series Small Cap Opportunities Fund | 31,719,066 | 1,545,583 | 4,554,623 | 1,063,099 | (637,033) | (5,612,734) | 22,460,259 |
| Fidelity Series Stock Selector Large Cap Value Fund | 56,843,759 | 2,747,106 | 8,528,148 | - | 923,074 | (10,103,652) | 41,882,139 |
| Fidelity Series Value Discovery Fund | 57,898,184 | 2,014,096 | 9,204,697 | - | 2,130,928 | (9,529,678) | 43,308,833 |
| | 1,830,551,428 | 178,030,255 | 308,215,363 | 25,880,789 | (17,443,926) | (286,681,204) | 1,396,241,190 |
Amounts in the income column in the above table include any capital gain distributions from underlying funds, which are presented in the corresponding line item in the Statement of Operations, if applicable.
Purchases and Sales Proceeds in the table above include the value of shares purchased or redeemed through in-kind transactions, if applicable.
Investment Valuation
The following is a summary of the inputs used, as of September 30, 2022, involving the Fund's assets and liabilities carried at fair value. The inputs or methodology used for valuing securities may not be an indication of the risk associated with investing in those securities. For more information on valuation inputs, and their aggregation into the levels used below, please refer to the Investment Valuation section in the accompanying Notes to Financial Statements.
| Valuation Inputs at Reporting Date: |
| Description | Total ($) | Level 1 ($) | Level 2 ($) | Level 3 ($) |
Investments in Securities: | | | | |
|
| Other Short-Term Investments | 766,327 | - | 766,327 | - |
|
| Domestic Equity Funds | 346,465,106 | 346,465,106 | - | - |
|
| International Equity Funds | 351,398,098 | 351,398,098 | - | - |
|
| Bond Funds | 673,605,343 | 673,605,343 | - | - |
|
| Short-Term Funds | 25,432,780 | 25,432,780 | - | - |
| Total Investments in Securities: | 1,397,667,654 | 1,396,901,327 | 766,327 | - |
Derivative Instruments: | | | | |
|
| Assets | | | | |
Futures Contracts | 852,011 | 852,011 | - | - |
| Total Assets | 852,011 | 852,011 | - | - |
|
| Liabilities | | | | |
Futures Contracts | (1,599,506) | (1,599,506) | - | - |
| Total Liabilities | (1,599,506) | (1,599,506) | - | - |
| Total Derivative Instruments: | (747,495) | (747,495) | - | - |
Value of Derivative Instruments
The following table is a summary of the Fund's value of derivative instruments by primary risk exposure as of September 30, 2022. For additional information on derivative instruments, please refer to the Derivative Instruments section in the accompanying Notes to Financial Statements.
Primary Risk Exposure / Derivative Type | Value |
| Asset ($) | Liability ($) |
| Equity Risk | | |
Futures Contracts (a) | 852,011 | 0 |
| Total Equity Risk | 852,011 | 0 |
| Interest Rate Risk | | |
Futures Contracts (a) | 0 | (1,599,506) |
| Total Interest Rate Risk | 0 | (1,599,506) |
| Total Value of Derivatives | 852,011 | (1,599,506) |
(a)Reflects gross cumulative appreciation (depreciation) on futures contracts as presented in the Schedule of Investments. In the Statement of Assets and Liabilities, the period end daily variation margin is included in receivable or payable for daily variation margin on futures contracts, and the net cumulative appreciation (depreciation) is included in Total accumulated earnings (loss).
Fidelity Advisor Freedom® 2020 Fund
| Statement of Assets and Liabilities |
| | | | September 30, 2022 (Unaudited) |
| | | | | |
| Assets | | | | |
| Investment in securities, at value - See accompanying schedule: | $ | | | |
Unaffiliated issuers (cost $766,061) | | $766,327 | | |
Fidelity Central Funds (cost $660,137) | | 660,137 | | |
Other affiliated issuers (cost $1,464,028,831) | | 1,396,241,190 | | |
| | | | | |
| Total Investment in Securities (cost $1,465,455,029) | | | $ | 1,397,667,654 |
| Receivable for investments sold | | | | 17,107,619 |
| Receivable for fund shares sold | | | | 4,406,184 |
| Distributions receivable from Fidelity Central Funds | | | | 2,193 |
| Receivable for daily variation margin on futures contracts | | | | 2,515 |
Total assets | | | | 1,419,186,165 |
| Liabilities | | | | |
| Payable for investments purchased | | 13,192,481 | | |
| Payable for fund shares redeemed | | 7,660,660 | | |
| Accrued management fee | | 693,866 | | |
| Distribution and service plan fees payable | | 238,686 | | |
| Payable for daily variation margin on futures contracts | | 41,389 | | |
| Total Liabilities | | | | 21,827,082 |
| Net Assets | | | $ | 1,397,359,083 |
| Net Assets consist of: | | | | |
| Paid in capital | | | $ | 1,471,411,599 |
| Total accumulated earnings (loss) | | | | (74,052,516) |
| Net Assets | | | $ | 1,397,359,083 |
| | | | | |
| Net Asset Value and Maximum Offering Price | | | | |
| Class A : | | | | |
Net Asset Value and redemption price per share ($556,528,883 ÷ 54,775,083 shares) (a) | | | $ | 10.16 |
| Maximum offering price per share (100/94.25 of $10.16) | | | $ | 10.78 |
| Class M : | | | | |
Net Asset Value and redemption price per share ($206,685,171 ÷ 20,397,602 shares) (a) | | | $ | 10.13 |
| Maximum offering price per share (100/96.50 of $10.13) | | | $ | 10.50 |
| Class C : | | | | |
Net Asset Value and offering price per share ($26,192,710 ÷ 2,625,117 shares) (a) | | | $ | 9.98 |
| Class I : | | | | |
Net Asset Value , offering price and redemption price per share ($437,710,839 ÷ 42,565,739 shares) | | | $ | 10.28 |
| Class Z : | | | | |
Net Asset Value , offering price and redemption price per share ($65,956,932 ÷ 6,476,011 shares) | | | $ | 10.18 |
| Class Z6 : | | | | |
Net Asset Value , offering price and redemption price per share ($104,284,548 ÷ 10,198,087 shares) | | | $ | 10.23 |
(a)Redemption price per share is equal to net asset value less any applicable contingent deferred sales charge. |
| Statement of Operations |
| | | | Six months ended September 30, 2022 (Unaudited) |
| Investment Income | | | | |
| Dividends: | | | | |
| Affiliated issuers | | | $ | 21,495,670 |
| Interest | | | | 6,648 |
| Income from Fidelity Central Funds | | | | 9,668 |
| Total Income | | | | 21,511,986 |
| Expenses | | | | |
| Management fee | $ | 4,527,618 | | |
| Distribution and service plan fees | | 1,564,462 | | |
| Independent trustees' fees and expenses | | 2,839 | | |
| Total expenses before reductions | | 6,094,919 | | |
| Expense reductions | | (17) | | |
| Total expenses after reductions | | | | 6,094,902 |
| Net Investment income (loss) | | | | 15,417,084 |
| Realized and Unrealized Gain (Loss) | | | | |
| Net realized gain (loss) on: | | | | |
| Investment Securities: | | | | |
| Unaffiliated issuers | | 602 | | |
| Affiliated issuers | | (17,443,926) | | |
| Futures contracts | | (651,395) | | |
| Capital gain distributions from underlying funds: | | | | |
| Affiliated issuers | | 4,385,119 | | |
| Total net realized gain (loss) | | | | (13,709,600) |
| Change in net unrealized appreciation (depreciation) on: | | | | |
| Investment Securities: | | | | |
| Unaffiliated issuers | | 268 | | |
| Affiliated issuers | | (286,681,204) | | |
| Futures contracts | | (1,218,423) | | |
| Total change in net unrealized appreciation (depreciation) | | | | (287,899,359) |
| Net gain (loss) | | | | (301,608,959) |
| Net increase (decrease) in net assets resulting from operations | | | $ | (286,191,875) |
| Statement of Changes in Net Assets |
| |
| | Six months ended September 30, 2022 (Unaudited) | | Year ended March 31, 2022 |
| Increase (Decrease) in Net Assets | | | | |
| Operations | | | | |
| Net investment income (loss) | $ | 15,417,084 | $ | 42,810,950 |
| Net realized gain (loss) | | (13,709,600) | | 154,453,262 |
| Change in net unrealized appreciation (depreciation) | | (287,899,359) | | (179,524,359) |
| Net increase (decrease) in net assets resulting from operations | | (286,191,875) | | 17,739,853 |
| Distributions to shareholders | | (88,260,015) | | (210,125,505) |
| Share transactions - net increase (decrease) | | (60,317,165) | | (97,568,805) |
| Total increase (decrease) in net assets | | (434,769,055) | | (289,954,457) |
| | | | | |
| Net Assets | | | | |
| Beginning of period | | 1,832,128,138 | | 2,122,082,595 |
| End of period | $ | 1,397,359,083 | $ | 1,832,128,138 |
| | | | | |
| | | | | |
Financial Highlights
| Fidelity Advisor Freedom® 2020 Fund Class A |
| |
| | Six months ended (Unaudited) September 30, 2022 | | Years ended March 31, 2022 | | 2021 | | 2020 | | 2019 | | 2018 |
Selected Per-Share Data | | | | | | | | | | | | |
| Net asset value, beginning of period | $ | 12.83 | $ | 14.19 | $ | 11.63 | $ | 12.97 | $ | 13.71 | $ | 13.31 |
| Income from Investment Operations | | | | | | | | | | | | |
Net investment income (loss) A,B | | .10 | | .28 | | .10 | | .19 | | .22 | | .16 |
| Net realized and unrealized gain (loss) | | (2.14) | | (.18) | | 3.43 | | (.65) | | .18 | | 1.05 |
| Total from investment operations | | (2.04) | | .10 | | 3.53 | | (.46) | | .40 | | 1.21 |
| Distributions from net investment income | | - | | (.30) | | (.12) | | (.20) | | (.22) | | (.18) |
| Distributions from net realized gain | | (.63) | | (1.16) | | (.85) | | (.68) | | (.92) | | (.62) |
| Total distributions | | (.63) | | (1.46) | | (.97) | | (.88) | | (1.14) | | (.81) C |
| Net asset value, end of period | $ | 10.16 | $ | 12.83 | $ | 14.19 | $ | 11.63 | $ | 12.97 | $ | 13.71 |
Total Return D,E,F | | (16.33)% | | .25% | | 31.39% | | (4.15)% | | 3.40% | | 9.15% |
Ratios to Average Net Assets B,G,H | | | | | | | | | | | | |
| Expenses before reductions | | .83% I | | .83% | | .84% | | .85% | | .86% | | .76% |
| Expenses net of fee waivers, if any | | .83% I | | .83% | | .84% | | .85% | | .86% | | .76% |
| Expenses net of all reductions | | .83% I | | .83% | | .84% | | .85% | | .86% | | .76% |
| Net investment income (loss) | | 1.85% I | | 2.02% | | .78% | | 1.46% | | 1.68% | | 1.18% |
| Supplemental Data | | | | | | | | | | | | |
| Net assets, end of period (000 omitted) | $ | 556,529 | $ | 741,474 | $ | 877,842 | $ | 800,330 | $ | 1,038,299 | $ | 1,196,128 |
Portfolio turnover rate J | | 22% I | | 34% | | 26% | | 25% | | 22% | | 20% |
A Calculated based on average shares outstanding during the period.
B Net investment income (loss) is affected by the timing of the declaration of dividends by any underlying mutual funds or exchange-traded funds (ETFs). Net investment income (loss) of any such underlying funds is not included in the Fund's net investment income (loss) ratio.
C Total distributions per share do not sum due to rounding.
D Total returns for periods of less than one year are not annualized.
E Total returns would have been lower if certain expenses had not been reduced during the applicable periods shown.
F Total returns do not include the effect of the sales charges.
G Fees and expenses of any underlying mutual funds or exchange-traded funds (ETFs) are not included in the Fund's expense ratio. The Fund indirectly bears its proportionate share of these expenses. For additional expense information related to investments in Fidelity Central Funds, please refer to the "Investments in Fidelity Central Funds" note found in the Notes to Financial Statements section of the most recent Annual or Semi-Annual report.
H Expense ratios reflect operating expenses of the class. Expenses before reductions do not reflect amounts reimbursed, waived, or reduced through arrangements with the investment adviser, brokerage services, or other offset arrangements, if applicable, and do not represent the amount paid by the class during periods when reimbursements, waivers or reductions occur.
I Annualized
J Amount does not include the portfolio activity of any underlying mutual funds or exchange-traded funds (ETFs).
| Fidelity Advisor Freedom® 2020 Fund Class M |
| |
| | Six months ended (Unaudited) September 30, 2022 | | Years ended March 31, 2022 | | 2021 | | 2020 | | 2019 | | 2018 |
Selected Per-Share Data | | | | | | | | | | | | |
| Net asset value, beginning of period | $ | 12.81 | $ | 14.18 | $ | 11.62 | $ | 12.96 | $ | 13.71 | $ | 13.30 |
| Income from Investment Operations | | | | | | | | | | | | |
Net investment income (loss) A,B | | .09 | | .25 | | .07 | | .16 | | .19 | | .13 |
| Net realized and unrealized gain (loss) | | (2.14) | | (.19) | | 3.43 | | (.65) | | .17 | | 1.05 |
| Total from investment operations | | (2.05) | | .06 | | 3.50 | | (.49) | | .36 | | 1.18 |
| Distributions from net investment income | | - | | (.27) | | (.09) | | (.17) | | (.19) | | (.15) |
| Distributions from net realized gain | | (.63) | | (1.16) | | (.85) | | (.68) | | (.92) | | (.62) |
| Total distributions | | (.63) | | (1.43) | | (.94) | | (.85) | | (1.11) | | (.77) |
| Net asset value, end of period | $ | 10.13 | $ | 12.81 | $ | 14.18 | $ | 11.62 | $ | 12.96 | $ | 13.71 |
Total Return C,D,E | | (16.44)% | | (.02)% | | 31.08% | | (4.38)% | | 3.07% | | 8.97% |
Ratios to Average Net Assets B,F,G | | | | | | | | | | | | |
| Expenses before reductions | | 1.08% H | | 1.08% | | 1.09% | | 1.10% | | 1.11% | | 1.01% |
| Expenses net of fee waivers, if any | | 1.08% H | | 1.08% | | 1.09% | | 1.10% | | 1.11% | | 1.01% |
| Expenses net of all reductions | | 1.08% H | | 1.08% | | 1.09% | | 1.10% | | 1.11% | | 1.01% |
| Net investment income (loss) | | 1.60% H | | 1.77% | | .53% | | 1.21% | | 1.43% | | .92% |
| Supplemental Data | | | | | | | | | | | | |
| Net assets, end of period (000 omitted) | $ | 206,685 | $ | 265,388 | $ | 309,456 | $ | 277,496 | $ | 345,810 | $ | 374,470 |
Portfolio turnover rate I | | 22% H | | 34% | | 26% | | 25% | | 22% | | 20% |
A Calculated based on average shares outstanding during the period.
B Net investment income (loss) is affected by the timing of the declaration of dividends by any underlying mutual funds or exchange-traded funds (ETFs). Net investment income (loss) of any such underlying funds is not included in the Fund's net investment income (loss) ratio.
C Total returns for periods of less than one year are not annualized.
D Total returns would have been lower if certain expenses had not been reduced during the applicable periods shown.
E Total returns do not include the effect of the sales charges.
F Fees and expenses of any underlying mutual funds or exchange-traded funds (ETFs) are not included in the Fund's expense ratio. The Fund indirectly bears its proportionate share of these expenses. For additional expense information related to investments in Fidelity Central Funds, please refer to the "Investments in Fidelity Central Funds" note found in the Notes to Financial Statements section of the most recent Annual or Semi-Annual report.
G Expense ratios reflect operating expenses of the class. Expenses before reductions do not reflect amounts reimbursed, waived, or reduced through arrangements with the investment adviser, brokerage services, or other offset arrangements, if applicable, and do not represent the amount paid by the class during periods when reimbursements, waivers or reductions occur.
H Annualized
I Amount does not include the portfolio activity of any underlying mutual funds or exchange-traded funds (ETFs).
| Fidelity Advisor Freedom® 2020 Fund Class C |
| |
| | Six months ended (Unaudited) September 30, 2022 | | Years ended March 31, 2022 | | 2021 | | 2020 | | 2019 | | 2018 |
Selected Per-Share Data | | | | | | | | | | | | |
| Net asset value, beginning of period | $ | 12.66 | $ | 14.03 | $ | 11.52 | $ | 12.86 | $ | 13.60 | $ | 13.20 |
| Income from Investment Operations | | | | | | | | | | | | |
Net investment income (loss) A,B | | .06 | | .18 | | - C | | .09 | | .12 | | .06 |
| Net realized and unrealized gain (loss) | | (2.11) | | (.18) | | 3.39 | | (.64) | | .17 | | 1.05 |
| Total from investment operations | | (2.05) | | - | | 3.39 | | (.55) | | .29 | | 1.11 |
| Distributions from net investment income | | - | | (.21) | | (.04) | | (.11) | | (.14) | | (.09) |
| Distributions from net realized gain | | (.63) | | (1.16) | | (.84) | | (.68) | | (.90) | | (.62) |
| Total distributions | | (.63) | | (1.37) | | (.88) | | (.79) | | (1.03) D | | (.71) |
| Net asset value, end of period | $ | 9.98 | $ | 12.66 | $ | 14.03 | $ | 11.52 | $ | 12.86 | $ | 13.60 |
Total Return E,F,G | | (16.65)% | | (.47)% | | 30.36% | | (4.81)% | | 2.55% | | 8.45% |
Ratios to Average Net Assets B,H,I | | | | | | | | | | | | |
| Expenses before reductions | | 1.58% J | | 1.58% | | 1.59% | | 1.60% | | 1.61% | | 1.52% |
| Expenses net of fee waivers, if any | | 1.58% J | | 1.58% | | 1.59% | | 1.60% | | 1.61% | | 1.52% |
| Expenses net of all reductions | | 1.58% J | | 1.58% | | 1.59% | | 1.60% | | 1.61% | | 1.52% |
| Net investment income (loss) | | 1.09% J | | 1.27% | | .03% | | .71% | | .93% | | .42% |
| Supplemental Data | | | | | | | | | | | | |
| Net assets, end of period (000 omitted) | $ | 26,193 | $ | 36,340 | $ | 51,480 | $ | 46,563 | $ | 63,123 | $ | 98,878 |
Portfolio turnover rate K | | 22% J | | 34% | | 26% | | 25% | | 22% | | 20% |
A Calculated based on average shares outstanding during the period.
B Net investment income (loss) is affected by the timing of the declaration of dividends by any underlying mutual funds or exchange-traded funds (ETFs). Net investment income (loss) of any such underlying funds is not included in the Fund's net investment income (loss) ratio.
C Amount represents less than $.005 per share.
D Total distributions per share do not sum due to rounding.
E Total returns for periods of less than one year are not annualized.
F Total returns would have been lower if certain expenses had not been reduced during the applicable periods shown.
G Total returns do not include the effect of the contingent deferred sales charge.
H Fees and expenses of any underlying mutual funds or exchange-traded funds (ETFs) are not included in the Fund's expense ratio. The Fund indirectly bears its proportionate share of these expenses. For additional expense information related to investments in Fidelity Central Funds, please refer to the "Investments in Fidelity Central Funds" note found in the Notes to Financial Statements section of the most recent Annual or Semi-Annual report.
I Expense ratios reflect operating expenses of the class. Expenses before reductions do not reflect amounts reimbursed, waived, or reduced through arrangements with the investment adviser, brokerage services, or other offset arrangements, if applicable, and do not represent the amount paid by the class during periods when reimbursements, waivers or reductions occur.
J Annualized
K Amount does not include the portfolio activity of any underlying mutual funds or exchange-traded funds (ETFs).
| Fidelity Advisor Freedom® 2020 Fund Class I |
| |
| | Six months ended (Unaudited) September 30, 2022 | | Years ended March 31, 2022 | | 2021 | | 2020 | | 2019 | | 2018 |
Selected Per-Share Data | | | | | | | | | | | | |
| Net asset value, beginning of period | $ | 12.97 | $ | 14.32 | $ | 11.73 | $ | 13.07 | $ | 13.82 | $ | 13.41 |
| Income from Investment Operations | | | | | | | | | | | | |
Net investment income (loss) A,B | | .12 | | .32 | | .14 | | .22 | | .26 | | .20 |
| Net realized and unrealized gain (loss) | | (2.17) | | (.18) | | 3.46 | | (.65) | | .17 | | 1.05 |
| Total from investment operations | | (2.05) | | .14 | | 3.60 | | (.43) | | .43 | | 1.25 |
| Distributions from net investment income | | - | | (.32) | | (.15) | | (.23) | | (.26) | | (.22) |
| Distributions from net realized gain | | (.64) | | (1.16) | | (.85) | | (.68) | | (.92) | | (.62) |
| Total distributions | | (.64) | | (1.49) C | | (1.01) C | | (.91) | | (1.18) | | (.84) |
| Net asset value, end of period | $ | 10.28 | $ | 12.97 | $ | 14.32 | $ | 11.73 | $ | 13.07 | $ | 13.82 |
Total Return D,E | | (16.28)% | | .53% | | 31.70% | | (3.87)% | | 3.61% | | 9.45% |
Ratios to Average Net Assets B,F,G | | | | | | | | | | | | |
| Expenses before reductions | | .58% H | | .58% | | .59% | | .60% | | .61% | | .52% |
| Expenses net of fee waivers, if any | | .58% H | | .58% | | .59% | | .60% | | .61% | | .52% |
| Expenses net of all reductions | | .58% H | | .58% | | .59% | | .60% | | .61% | | .52% |
| Net investment income (loss) | | 2.10% H | | 2.27% | | 1.03% | | 1.71% | | 1.92% | | 1.42% |
| Supplemental Data | | | | | | | | | | | | |
| Net assets, end of period (000 omitted) | $ | 437,711 | $ | 616,520 | $ | 743,070 | $ | 654,422 | $ | 795,372 | $ | 803,562 |
Portfolio turnover rate I | | 22% H | | 34% | | 26% | | 25% | | 22% | | 20% |
A Calculated based on average shares outstanding during the period.
B Net investment income (loss) is affected by the timing of the declaration of dividends by any underlying mutual funds or exchange-traded funds (ETFs). Net investment income (loss) of any such underlying funds is not included in the Fund's net investment income (loss) ratio.
C Total distributions per share do not sum due to rounding.
D Total returns for periods of less than one year are not annualized.
E Total returns would have been lower if certain expenses had not been reduced during the applicable periods shown.
F Fees and expenses of any underlying mutual funds or exchange-traded funds (ETFs) are not included in the Fund's expense ratio. The Fund indirectly bears its proportionate share of these expenses. For additional expense information related to investments in Fidelity Central Funds, please refer to the "Investments in Fidelity Central Funds" note found in the Notes to Financial Statements section of the most recent Annual or Semi-Annual report.
G Expense ratios reflect operating expenses of the class. Expenses before reductions do not reflect amounts reimbursed, waived, or reduced through arrangements with the investment adviser, brokerage services, or other offset arrangements, if applicable, and do not represent the amount paid by the class during periods when reimbursements, waivers or reductions occur.
H Annualized
I Amount does not include the portfolio activity of any underlying mutual funds or exchange-traded funds (ETFs).
| Fidelity Advisor Freedom® 2020 Fund Class Z |
| |
| | Six months ended (Unaudited) September 30, 2022 | | Years ended March 31, 2022 | | 2021 | | 2020 | | 2019 A |
Selected Per-Share Data | | | | | | | | | | |
| Net asset value, beginning of period | $ | 12.85 | $ | 14.21 | $ | 11.65 | $ | 13.02 | $ | 13.69 |
| Income from Investment Operations | | | | | | | | | | |
Net investment income (loss) B,C | | .12 | | .33 | | .15 | | .23 | | .21 |
| Net realized and unrealized gain (loss) | | (2.14) | | (.19) | | 3.43 | | (.64) | | (.15) |
| Total from investment operations | | (2.02) | | .14 | | 3.58 | | (.41) | | .06 |
| Distributions from net investment income | | - | | (.34) | | (.17) | | (.28) | | (.30) |
| Distributions from net realized gain | | (.65) | | (1.17) | | (.85) | | (.68) | | (.43) |
| Total distributions | | (.65) | | (1.50) D | | (1.02) | | (.96) | | (.73) |
| Net asset value, end of period | $ | 10.18 | $ | 12.85 | $ | 14.21 | $ | 11.65 | $ | 13.02 |
Total Return E,F | | (16.22)% | | .58% | | 31.82% | | (3.82)% | | .91% |
Ratios to Average Net Assets C,G,H | | | | | | | | | | |
| Expenses before reductions | | .50% I | | .51% | | .52% | | .53% | | .54% I,J |
| Expenses net of fee waivers, if any | | .50% I | | .51% | | .52% | | .53% | | .54% I,J |
| Expenses net of all reductions | | .50% I | | .51% | | .52% | | .53% | | .54% I,J |
| Net investment income (loss) | | 2.17% I | | 2.35% | | 1.10% | | 1.78% | | 3.41% I |
| Supplemental Data | | | | | | | | | | |
| Net assets, end of period (000 omitted) | $ | 65,957 | $ | 59,576 | $ | 45,836 | $ | 33,172 | $ | 2,585 |
Portfolio turnover rate K | | 22% I | | 34% | | 26% | | 25% | | 22% |
A For the period October 2, 2018 (commencement of sale of shares) through March 31, 2019.
B Calculated based on average shares outstanding during the period.
C Net investment income (loss) is affected by the timing of the declaration of dividends by any underlying mutual funds or exchange-traded funds (ETFs). Net investment income (loss) of any such underlying funds is not included in the Fund's net investment income (loss) ratio.
D Total distributions per share do not sum due to rounding.
E Total returns for periods of less than one year are not annualized.
F Total returns would have been lower if certain expenses had not been reduced during the applicable periods shown.
G Fees and expenses of any underlying mutual funds or exchange-traded funds (ETFs) are not included in the Fund's expense ratio. The Fund indirectly bears its proportionate share of these expenses. For additional expense information related to investments in Fidelity Central Funds, please refer to the "Investments in Fidelity Central Funds" note found in the Notes to Financial Statements section of the most recent Annual or Semi-Annual report.
H Expense ratios reflect operating expenses of the class. Expenses before reductions do not reflect amounts reimbursed, waived, or reduced through arrangements with the investment adviser, brokerage services, or other offset arrangements, if applicable, and do not represent the amount paid by the class during periods when reimbursements, waivers or reductions occur.
I Annualized
J On certain classes, the size and fluctuation of net assets and expense amounts may cause ratios to differ from contractual rates.
K Amount does not include the portfolio activity of any underlying mutual funds or exchange-traded funds (ETFs).
| Fidelity Advisor Freedom® 2020 Fund Class Z6 |
| |
| | Six months ended (Unaudited) September 30, 2022 | | Years ended March 31, 2022 | | 2021 | | 2020 | | 2019 | | 2018 A |
Selected Per-Share Data | | | | | | | | | | | | |
| Net asset value, beginning of period | $ | 12.90 | $ | 14.26 | $ | 11.69 | $ | 13.04 | $ | 13.81 | $ | 13.62 |
| Income from Investment Operations | | | | | | | | | | | | |
Net investment income (loss) B,C | | .13 | | .34 | | .16 | | .25 | | .28 | | .08 |
| Net realized and unrealized gain (loss) | | (2.15) | | (.18) | | 3.45 | | (.65) | | .17 | | .75 |
| Total from investment operations | | (2.02) | | .16 | | 3.61 | | (.40) | | .45 | | .83 |
| Distributions from net investment income | | - | | (.35) | | (.18) | | (.27) | | (.30) | | (.23) |
| Distributions from net realized gain | | (.65) | | (1.17) | | (.85) | | (.68) | | (.92) | | (.41) |
| Total distributions | | (.65) | | (1.52) | | (1.04) D | | (.95) | | (1.22) | | (.64) |
| Net asset value, end of period | $ | 10.23 | $ | 12.90 | $ | 14.26 | $ | 11.69 | $ | 13.04 | $ | 13.81 |
Total Return E,F | | (16.15)% | | .69% | | 31.94% | | (3.72)% | | 3.76% | | 6.08% |
Ratios to Average Net Assets C,G,H | | | | | | | | | | | | |
| Expenses before reductions | | .42% I | | .42% | | .42% | | .43% | | .43% | | .45% I,J |
| Expenses net of fee waivers, if any | | .42% I | | .42% | | .42% | | .43% | | .43% | | .45% I,J |
| Expenses net of all reductions | | .42% I | | .42% | | .42% | | .43% | | .43% | | .45% I,J |
| Net investment income (loss) | | 2.26% I | | 2.44% | | 1.20% | | 1.88% | | 2.10% | | .71% I |
| Supplemental Data | | | | | | | | | | | | |
| Net assets, end of period (000 omitted) | $ | 104,285 | $ | 112,829 | $ | 94,399 | $ | 57,497 | $ | 45,686 | $ | 29,132 |
Portfolio turnover rate K | | 22% I | | 34% | | 26% | | 25% | | 22% | | 20% |
A For the period June 6, 2017 (commencement of sale of shares) through March 31, 2018.
B Calculated based on average shares outstanding during the period.
C Net investment income (loss) is affected by the timing of the declaration of dividends by any underlying mutual funds or exchange-traded funds (ETFs). Net investment income (loss) of any such underlying funds is not included in the Fund's net investment income (loss) ratio.
D Total distributions per share do not sum due to rounding.
E Total returns for periods of less than one year are not annualized.
F Total returns would have been lower if certain expenses had not been reduced during the applicable periods shown.
G Fees and expenses of any underlying mutual funds or exchange-traded funds (ETFs) are not included in the Fund's expense ratio. The Fund indirectly bears its proportionate share of these expenses. For additional expense information related to investments in Fidelity Central Funds, please refer to the "Investments in Fidelity Central Funds" note found in the Notes to Financial Statements section of the most recent Annual or Semi-Annual report.
H Expense ratios reflect operating expenses of the class. Expenses before reductions do not reflect amounts reimbursed, waived, or reduced through arrangements with the investment adviser, brokerage services, or other offset arrangements, if applicable, and do not represent the amount paid by the class during periods when reimbursements, waivers or reductions occur.
I Annualized
J On certain classes, the size and fluctuation of net assets and expense amounts may cause ratios to differ from contractual rates.
K Amount does not include the portfolio activity of any underlying mutual funds or exchange-traded funds (ETFs).
The information in the following table is based on the direct Investments of the Fund.
Top Holdings (% of Fund's net assets) |
| |
| Fidelity Series Investment Grade Bond Fund | 24.2 | |
| Fidelity Series Emerging Markets Opportunities Fund | 9.4 | |
| Fidelity Series 5+ Year Inflation-Protected Bond Index Fund | 7.7 | |
| Fidelity Series Large Cap Stock Fund | 5.6 | |
| Fidelity Series Long-Term Treasury Bond Index Fund | 4.9 | |
| Fidelity Series Overseas Fund | 4.8 | |
| Fidelity Series International Value Fund | 4.7 | |
| Fidelity Series International Growth Fund | 4.7 | |
| Fidelity Series International Developed Markets Bond Index Fund | 4.0 | |
| Fidelity Series Value Discovery Fund | 3.7 | |
| | 73.7 | |
| |
Domestic Equity Funds category includes Fidelity Series Commodity Strategy Fund which invests in commodity-related investments.
Asset Allocation (% of Fund's net assets) |
|
Percentages shown as 0.0% may reflect amounts less than 0.05%. |
|
Fidelity Advisor Freedom® 2025 Fund
Showing Percentage of Net Assets
| U.S. Treasury Obligations - 0.0% |
| | | Principal Amount (a) | Value ($) |
U.S. Treasury Bills, yield at date of purchase 2.13% to 3.29% 10/13/22 to 12/29/22 (b) (Cost $1,253,175) | | 1,260,000 | 1,253,695 |
| | | | |
| Domestic Equity Funds - 29.0% |
| | | Shares | Value ($) |
| Fidelity Advisor Series Equity Growth Fund (c) | | 6,871,451 | 83,488,127 |
| Fidelity Advisor Series Growth Opportunities Fund (c) | | 6,714,846 | 58,889,196 |
| Fidelity Advisor Series Small Cap Fund (c) | | 3,472,953 | 36,361,819 |
| Fidelity Series All-Sector Equity Fund (c) | | 3,855,761 | 33,082,426 |
| Fidelity Series Commodity Strategy Fund (c) | | 13,217,466 | 27,624,505 |
| Fidelity Series Large Cap Stock Fund (c) | | 8,624,518 | 127,384,130 |
| Fidelity Series Large Cap Value Index Fund (c) | | 1,089,790 | 13,862,130 |
| Fidelity Series Opportunistic Insights Fund (c) | | 5,354,520 | 76,087,728 |
| Fidelity Series Small Cap Opportunities Fund (c) | | 4,033,066 | 43,476,453 |
| Fidelity Series Stock Selector Large Cap Value Fund (c) | | 7,248,116 | 80,961,451 |
| Fidelity Series Value Discovery Fund (c) | | 6,077,685 | 83,689,728 |
| TOTAL DOMESTIC EQUITY FUNDS (Cost $612,624,608) | | | 664,907,693 |
| | | | |
| International Equity Funds - 27.9% |
| | | Shares | Value ($) |
| Fidelity Series Canada Fund (c) | | 3,796,561 | 47,077,353 |
| Fidelity Series Emerging Markets Fund (c) | | 3,229,736 | 23,383,287 |
| Fidelity Series Emerging Markets Opportunities Fund (c) | | 14,922,559 | 216,675,555 |
| Fidelity Series International Growth Fund (c) | | 8,447,111 | 108,291,958 |
| Fidelity Series International Small Cap Fund (c) | | 2,062,680 | 28,217,460 |
| Fidelity Series International Value Fund (c) | | 12,655,080 | 108,707,137 |
| Fidelity Series Overseas Fund (c) | | 11,471,729 | 109,325,574 |
| TOTAL INTERNATIONAL EQUITY FUNDS (Cost $652,534,248) | | | 641,678,324 |
| | | | |
| Bond Funds - 42.5% |
| | | Shares | Value ($) |
| Fidelity Series 5+ Year Inflation-Protected Bond Index Fund (c) | | 22,009,902 | 175,859,114 |
| Fidelity Series Emerging Markets Debt Fund (c) | | 1,758,793 | 12,065,319 |
| Fidelity Series Emerging Markets Debt Local Currency Fund (c) | | 497,980 | 3,968,897 |
| Fidelity Series Floating Rate High Income Fund (c) | | 275,947 | 2,400,735 |
| Fidelity Series High Income Fund (c) | | 1,581,220 | 12,460,010 |
| Fidelity Series International Credit Fund (c) | | 190,708 | 1,500,869 |
| Fidelity Series International Developed Markets Bond Index Fund (c) | | 10,688,748 | 91,068,130 |
| Fidelity Series Investment Grade Bond Fund (c) | | 57,012,898 | 556,445,883 |
| Fidelity Series Long-Term Treasury Bond Index Fund (c) | | 18,939,786 | 113,070,521 |
| Fidelity Series Real Estate Income Fund (c) | | 620,894 | 5,910,912 |
| TOTAL BOND FUNDS (Cost $1,159,426,605) | | | 974,750,390 |
| | | | |
| Short-Term Funds - 0.6% |
| | | Shares | Value ($) |
| Fidelity Cash Central Fund 3.10% (d) | | 997,383 | 997,583 |
| Fidelity Series Government Money Market Fund 3.00% (c)(e) | | 12,260,231 | 12,260,231 |
| Fidelity Series Short-Term Credit Fund (c) | | 1 | 11 |
| TOTAL SHORT-TERM FUNDS (Cost $13,257,825) | | | 13,257,825 |
| | | | |
| TOTAL INVESTMENT IN SECURITIES - 100.0% (Cost $2,439,096,461) | 2,295,847,927 |
NET OTHER ASSETS (LIABILITIES) - 0.0% | (497,471) |
| NET ASSETS - 100.0% | 2,295,350,456 |
| | |
| Futures Contracts |
| | Number of contracts | Expiration Date | Notional Amount ($) | Value ($) | Unrealized Appreciation/ (Depreciation) ($) |
| Purchased | | | | | |
| | | | | | |
| Treasury Contracts | | | | | |
| CBOT 10-Year U.S. Treasury Note Contracts (United States) | 374 | Dec 2022 | 41,911,375 | (2,561,548) | (2,561,548) |
| CBOT Ultra Long Term U.S. Treasury Bond Contracts (United States) | 35 | Dec 2022 | 4,795,000 | (61,822) | (61,822) |
| | | | | | |
| TOTAL PURCHASED | | | | | (2,623,370) |
| | | | | | |
| Sold | | | | | |
| | | | | | |
| Equity Index Contracts | | | | | |
| CME E-mini S&P 500 Index Contracts (United States) | 54 | Dec 2022 | 9,724,050 | 92,530 | 92,530 |
| ICE E-mini MSCI EAFE Index Contracts (United States) | 121 | Dec 2022 | 10,046,630 | 1,357,417 | 1,357,417 |
| ICE E-mini MSCI Emerging Markets Index Contracts (United States) | 76 | Dec 2022 | 3,311,700 | 5,234 | 5,234 |
| | | | | | |
| TOTAL SOLD | | | | | 1,455,181 |
| | | | | | |
| TOTAL FUTURES CONTRACTS | | | | | (1,168,189) |
| The notional amount of futures purchased as a percentage of Net Assets is 2.0% |
| The notional amount of futures sold as a percentage of Net Assets is 0.9% |
Legend
| (a) | Amount is stated in United States dollars unless otherwise noted. |
| (b) | Security or a portion of the security was pledged to cover margin requirements for futures contracts. At period end, the value of securities pledged amounted to $1,253,695. |
| (d) | Affiliated fund that is generally available only to investment companies and other accounts managed by Fidelity Investments. The rate quoted is the annualized seven-day yield of the fund at period end. A complete unaudited listing of the fund's holdings as of its most recent quarter end is available upon request. In addition, each Fidelity Central Fund's financial statements are available on the SEC's website or upon request. |
| (e) | The rate quoted is the annualized seven-day yield of the fund at period end. |
Affiliated Central Funds
Fiscal year to date information regarding the Fund's investments in Fidelity Central Funds, including the ownership percentage, is presented below.
| Affiliate | Value, beginning of period ($) | Purchases ($) | Sales Proceeds ($) | Dividend Income ($) | Realized Gain (loss) ($) | Change in Unrealized appreciation (depreciation) ($) | Value, end of period ($) | %ownership, end of period |
| Fidelity Cash Central Fund 3.10% | 1,995,442 | 13,757,492 | 14,755,351 | 15,326 | - | - | 997,583 | 0.0% |
| Total | 1,995,442 | 13,757,492 | 14,755,351 | 15,326 | - | - | 997,583 | |
| | | | | | | | | |
Amounts in the income column in the above table include any capital gain distributions from underlying funds, which are presented in the corresponding line item in the Statement of Operations, if applicable.
Affiliated Underlying Funds
Fiscal year to date information regarding the Fund's investments in affiliated Underlying Funds is presented below. Exchanges between classes of the same affiliated Underlying Funds may occur. If an Underlying Funds changes its name, the name presented below is the name in effect at period end.
| Affiliate | Value, beginning of period ($) | Purchases ($) | Sales Proceeds ($) | Dividend Income ($) | Realized Gain (loss) ($) | Change in Unrealized appreciation (depreciation) ($) | Value, end of period ($) |
| Fidelity Advisor Series Equity Growth Fund | 105,537,469 | 9,695,562 | 9,283,400 | - | (1,015,007) | (21,446,497) | 83,488,127 |
| Fidelity Advisor Series Growth Opportunities Fund | 72,379,418 | 15,732,040 | 8,087,287 | - | (2,124,357) | (19,010,618) | 58,889,196 |
| Fidelity Advisor Series Small Cap Fund | 47,904,066 | 3,095,239 | 5,762,344 | - | (912,287) | (7,962,855) | 36,361,819 |
| Fidelity Series 0-5 Year Inflation-Protected Bond Index Fund | - | 14,287,946 | 14,326,828 | - | 38,882 | - | - |
| Fidelity Series 5+ Year Inflation-Protected Bond Index Fund | 172,715,495 | 48,867,936 | 12,350,009 | - | (1,091,299) | (32,283,009) | 175,859,114 |
| Fidelity Series All-Sector Equity Fund | 45,266,926 | 1,074,235 | 4,294,864 | - | (757,509) | (8,206,362) | 33,082,426 |
| Fidelity Series Canada Fund | 60,809,411 | 2,538,904 | 4,224,965 | - | (59,246) | (11,986,751) | 47,077,353 |
| Fidelity Series Commodity Strategy Fund | 43,498,882 | 22,888,472 | 15,320,097 | 19,990,449 | (3,599,733) | (19,843,019) | 27,624,505 |
| Fidelity Series Emerging Markets Debt Fund | 14,633,679 | 863,955 | 972,569 | 368,483 | (141,900) | (2,317,846) | 12,065,319 |
| Fidelity Series Emerging Markets Debt Local Currency Fund | 4,909,436 | 58,118 | 443,754 | - | (81,050) | (473,853) | 3,968,897 |
| Fidelity Series Emerging Markets Fund | 29,885,734 | 1,887,137 | 1,764,780 | - | (140,695) | (6,484,109) | 23,383,287 |
| Fidelity Series Emerging Markets Opportunities Fund | 269,325,801 | 21,823,981 | 17,513,896 | - | (3,349,279) | (53,611,052) | 216,675,555 |
| Fidelity Series Floating Rate High Income Fund | 2,965,603 | 98,455 | 516,091 | 71,113 | (55,822) | (91,410) | 2,400,735 |
| Fidelity Series Government Money Market Fund 3.00% | 27,190,089 | 12,329,394 | 27,259,252 | 16,290 | - | - | 12,260,231 |
| Fidelity Series High Income Fund | 17,643,256 | 557,570 | 3,594,067 | 412,219 | (505,369) | (1,641,380) | 12,460,010 |
| Fidelity Series Inflation-Protected Bond Index Fund | 26,436,598 | 336,450 | 26,153,501 | 278,929 | 642,574 | (1,262,121) | - |
| Fidelity Series International Credit Fund | 1,740,549 | 23,763 | - | 23,764 | - | (263,443) | 1,500,869 |
| Fidelity Series International Developed Markets Bond Index Fund | 89,441,480 | 20,481,846 | 10,297,409 | 145,723 | (1,010,493) | (7,547,294) | 91,068,130 |
| Fidelity Series International Growth Fund | 139,667,496 | 11,568,054 | 11,275,693 | - | (1,253,517) | (30,414,382) | 108,291,958 |
| Fidelity Series International Small Cap Fund | 38,354,082 | 1,005,680 | 2,164,507 | - | (641,933) | (8,335,862) | 28,217,460 |
| Fidelity Series International Value Fund | 141,659,255 | 10,035,564 | 12,487,390 | - | (797,541) | (29,702,751) | 108,707,137 |
| Fidelity Series Investment Grade Bond Fund | 723,365,250 | 30,545,365 | 125,479,827 | 9,208,069 | (12,367,760) | (59,617,145) | 556,445,883 |
| Fidelity Series Large Cap Stock Fund | 166,066,924 | 16,720,054 | 19,247,849 | 7,771,992 | 1,899,106 | (38,054,105) | 127,384,130 |
| Fidelity Series Large Cap Value Index Fund | 17,961,399 | 526,529 | 1,660,820 | - | 334,686 | (3,299,664) | 13,862,130 |
| Fidelity Series Long-Term Treasury Bond Index Fund | 138,739,105 | 17,620,867 | 12,389,549 | 1,638,037 | (1,828,210) | (29,071,692) | 113,070,521 |
| Fidelity Series Opportunistic Insights Fund | 97,534,370 | 10,183,788 | 9,851,308 | - | (1,977,961) | (19,801,161) | 76,087,728 |
| Fidelity Series Overseas Fund | 140,956,251 | 11,518,078 | 8,185,740 | - | (736,597) | (34,226,418) | 109,325,574 |
| Fidelity Series Real Estate Income Fund | 10,606,190 | 553,718 | 3,825,273 | 483,299 | 60,448 | (1,484,171) | 5,910,912 |
| Fidelity Series Short-Term Credit Fund | 6,815,179 | 26,780 | 6,796,041 | 11,845 | (176,019) | 130,112 | 11 |
| Fidelity Series Small Cap Opportunities Fund | 59,144,723 | 3,025,615 | 6,797,544 | 2,050,051 | (983,626) | (10,912,715) | 43,476,453 |
| Fidelity Series Stock Selector Large Cap Value Fund | 105,994,860 | 5,291,590 | 12,767,920 | - | 509,827 | (18,066,906) | 80,961,451 |
| Fidelity Series Value Discovery Fund | 107,962,263 | 3,941,660 | 14,047,442 | - | 2,949,767 | (17,116,520) | 83,689,728 |
| | 2,927,111,239 | 299,204,345 | 409,142,016 | 42,470,263 | (29,171,920) | (494,404,999) | 2,293,596,649 |
Amounts in the income column in the above table include any capital gain distributions from underlying funds, which are presented in the corresponding line item in the Statement of Operations, if applicable.
Purchases and Sales Proceeds in the table above include the value of shares purchased or redeemed through in-kind transactions, if applicable.
Investment Valuation
The following is a summary of the inputs used, as of September 30, 2022, involving the Fund's assets and liabilities carried at fair value. The inputs or methodology used for valuing securities may not be an indication of the risk associated with investing in those securities. For more information on valuation inputs, and their aggregation into the levels used below, please refer to the Investment Valuation section in the accompanying Notes to Financial Statements.
| Valuation Inputs at Reporting Date: |
| Description | Total ($) | Level 1 ($) | Level 2 ($) | Level 3 ($) |
Investments in Securities: | | | | |
|
| Other Short-Term Investments | 1,253,695 | - | 1,253,695 | - |
|
| Domestic Equity Funds | 664,907,693 | 664,907,693 | - | - |
|
| International Equity Funds | 641,678,324 | 641,678,324 | - | - |
|
| Bond Funds | 974,750,390 | 974,750,390 | - | - |
|
| Short-Term Funds | 13,257,825 | 13,257,825 | - | - |
| Total Investments in Securities: | 2,295,847,927 | 2,294,594,232 | 1,253,695 | - |
Derivative Instruments: | | | | |
|
| Assets | | | | |
Futures Contracts | 1,455,181 | 1,455,181 | - | - |
| Total Assets | 1,455,181 | 1,455,181 | - | - |
|
| Liabilities | | | | |
Futures Contracts | (2,623,370) | (2,623,370) | - | - |
| Total Liabilities | (2,623,370) | (2,623,370) | - | - |
| Total Derivative Instruments: | (1,168,189) | (1,168,189) | - | - |
Value of Derivative Instruments
The following table is a summary of the Fund's value of derivative instruments by primary risk exposure as of September 30, 2022. For additional information on derivative instruments, please refer to the Derivative Instruments section in the accompanying Notes to Financial Statements.
Primary Risk Exposure / Derivative Type | Value |
| Asset ($) | Liability ($) |
| Equity Risk | | |
Futures Contracts (a) | 1,455,181 | 0 |
| Total Equity Risk | 1,455,181 | 0 |
| Interest Rate Risk | | |
Futures Contracts (a) | 0 | (2,623,370) |
| Total Interest Rate Risk | 0 | (2,623,370) |
| Total Value of Derivatives | 1,455,181 | (2,623,370) |
(a)Reflects gross cumulative appreciation (depreciation) on futures contracts as presented in the Schedule of Investments. In the Statement of Assets and Liabilities, the period end daily variation margin is included in receivable or payable for daily variation margin on futures contracts, and the net cumulative appreciation (depreciation) is included in Total accumulated earnings (loss).
Fidelity Advisor Freedom® 2025 Fund
| Statement of Assets and Liabilities |
| | | | September 30, 2022 (Unaudited) |
| | | | | |
| Assets | | | | |
| Investment in securities, at value - See accompanying schedule: | $ | | | |
Unaffiliated issuers (cost $1,253,175) | | $1,253,695 | | |
Fidelity Central Funds (cost $997,583) | | 997,583 | | |
Other affiliated issuers (cost $2,436,845,703) | | 2,293,596,649 | | |
| | | | | |
| Total Investment in Securities (cost $2,439,096,461) | | | $ | 2,295,847,927 |
| Receivable for investments sold | | | | 28,723,283 |
| Receivable for fund shares sold | | | | 1,748,721 |
| Distributions receivable from Fidelity Central Funds | | | | 3,188 |
| Receivable for daily variation margin on futures contracts | | | | 7,288 |
Total assets | | | | 2,326,330,407 |
| Liabilities | | | | |
| Payable for investments purchased | | 24,722,195 | | |
| Payable for fund shares redeemed | | 4,590,037 | | |
| Accrued management fee | | 1,218,251 | | |
| Distribution and service plan fees payable | | 371,455 | | |
| Payable for daily variation margin on futures contracts | | 78,013 | | |
| Total Liabilities | | | | 30,979,951 |
| Net Assets | | | $ | 2,295,350,456 |
| Net Assets consist of: | | | | |
| Paid in capital | | | $ | 2,449,735,150 |
| Total accumulated earnings (loss) | | | | (154,384,694) |
| Net Assets | | | $ | 2,295,350,456 |
| | | | | |
| Net Asset Value and Maximum Offering Price | | | | |
| Class A : | | | | |
Net Asset Value and redemption price per share ($885,286,329 ÷ 84,259,715 shares) (a) | | | $ | 10.51 |
| Maximum offering price per share (100/94.25 of $10.51) | | | $ | 11.15 |
| Class M : | | | | |
Net Asset Value and redemption price per share ($324,710,844 ÷ 30,888,773 shares) (a) | | | $ | 10.51 |
| Maximum offering price per share (100/96.50 of $10.51) | | | $ | 10.89 |
| Class C : | | | | |
Net Asset Value and offering price per share ($35,116,811 ÷ 3,435,979 shares) (a) | | | $ | 10.22 |
| Class I : | | | | |
Net Asset Value , offering price and redemption price per share ($763,100,109 ÷ 71,672,689 shares) | | | $ | 10.65 |
| Class Z : | | | | |
Net Asset Value , offering price and redemption price per share ($104,741,274 ÷ 9,937,494 shares) | | | $ | 10.54 |
| Class Z6 : | | | | |
Net Asset Value , offering price and redemption price per share ($182,395,089 ÷ 17,206,456 shares) | | | $ | 10.60 |
(a)Redemption price per share is equal to net asset value less any applicable contingent deferred sales charge. |
| Statement of Operations |
| | | | Six months ended September 30, 2022 (Unaudited) |
| Investment Income | | | | |
| Dividends: | | | | |
| Affiliated issuers | | | $ | 34,081,021 |
| Interest | | | | 10,985 |
| Income from Fidelity Central Funds | | | | 15,326 |
| Total Income | | | | 34,107,332 |
| Expenses | | | | |
| Management fee | $ | 7,879,115 | | |
| Distribution and service plan fees | | 2,409,537 | | |
| Independent trustees' fees and expenses | | 4,575 | | |
| Total expenses before reductions | | 10,293,227 | | |
| Expense reductions | | (15) | | |
| Total expenses after reductions | | | | 10,293,212 |
| Net Investment income (loss) | | | | 23,814,120 |
| Realized and Unrealized Gain (Loss) | | | | |
| Net realized gain (loss) on: | | | | |
| Investment Securities: | | | | |
| Unaffiliated issuers | | 843 | | |
| Affiliated issuers | | (29,171,920) | | |
| Futures contracts | | (1,153,004) | | |
| Capital gain distributions from underlying funds: | | | | |
| Affiliated issuers | | 8,389,242 | | |
| Total net realized gain (loss) | | | | (21,934,839) |
| Change in net unrealized appreciation (depreciation) on: | | | | |
| Investment Securities: | | | | |
| Unaffiliated issuers | | 510 | | |
| Affiliated issuers | | (494,404,999) | | |
| Futures contracts | | (1,944,884) | | |
| Total change in net unrealized appreciation (depreciation) | | | | (496,349,373) |
| Net gain (loss) | | | | (518,284,212) |
| Net increase (decrease) in net assets resulting from operations | | | $ | (494,470,092) |
| Statement of Changes in Net Assets |
| |
| | Six months ended September 30, 2022 (Unaudited) | | Year ended March 31, 2022 |
| Increase (Decrease) in Net Assets | | | | |
| Operations | | | | |
| Net investment income (loss) | $ | 23,814,120 | $ | 65,845,490 |
| Net realized gain (loss) | | (21,934,839) | | 227,886,486 |
| Change in net unrealized appreciation (depreciation) | | (496,349,373) | | (263,537,178) |
| Net increase (decrease) in net assets resulting from operations | | (494,470,092) | | 30,194,798 |
| Distributions to shareholders | | (147,401,534) | | (281,648,202) |
| Share transactions - net increase (decrease) | | 7,593,430 | | 55,749,404 |
| Total increase (decrease) in net assets | | (634,278,196) | | (195,704,000) |
| | | | | |
| Net Assets | | | | |
| Beginning of period | | 2,929,628,652 | | 3,125,332,652 |
| End of period | $ | 2,295,350,456 | $ | 2,929,628,652 |
| | | | | |
| | | | | |
Financial Highlights
| Fidelity Advisor Freedom® 2025 Fund Class A |
| |
| | Six months ended (Unaudited) September 30, 2022 | | Years ended March 31, 2022 | | 2021 | | 2020 | | 2019 | | 2018 |
Selected Per-Share Data | | | | | | | | | | | | |
| Net asset value, beginning of period | $ | 13.45 | $ | 14.62 | $ | 11.55 | $ | 12.99 | $ | 13.74 | $ | 13.16 |
| Income from Investment Operations | | | | | | | | | | | | |
Net investment income (loss) A,B | | .10 | | .29 | | .10 | | .18 | | .21 | | .15 |
| Net realized and unrealized gain (loss) | | (2.36) | | (.14) | | 3.84 | | (.76) | | .18 | | 1.15 |
| Total from investment operations | | (2.26) | | .15 | | 3.94 | | (.58) | | .39 | | 1.30 |
| Distributions from net investment income | | - | | (.30) | | (.12) | | (.19) | | (.21) | | (.17) |
| Distributions from net realized gain | | (.68) | | (1.02) | | (.76) | | (.67) | | (.93) | | (.55) |
| Total distributions | | (.68) | | (1.32) | | (.87) C | | (.86) | | (1.14) | | (.72) |
| Net asset value, end of period | $ | 10.51 | $ | 13.45 | $ | 14.62 | $ | 11.55 | $ | 12.99 | $ | 13.74 |
Total Return D,E,F | | (17.27)% | | .64% | | 35.22% | | (5.09)% | | 3.34% | | 9.96% |
Ratios to Average Net Assets B,G,H | | | | | | | | | | | | |
| Expenses before reductions | | .87% I | | .88% | | .89% | | .89% | | .90% | | .80% |
| Expenses net of fee waivers, if any | | .87% I | | .88% | | .89% | | .89% | | .90% | | .80% |
| Expenses net of all reductions | | .87% I | | .88% | | .89% | | .89% | | .90% | | .80% |
| Net investment income (loss) | | 1.74% I | | 2.01% | | .76% | | 1.40% | | 1.62% | | 1.11% |
| Supplemental Data | | | | | | | | | | | | |
| Net assets, end of period (000 omitted) | $ | 885,286 | $ | 1,161,792 | $ | 1,276,609 | $ | 1,043,442 | $ | 1,304,020 | $ | 1,435,987 |
Portfolio turnover rate J | | 23% I | | 36% | | 28% | | 29% | | 24% | | 23% |
A Calculated based on average shares outstanding during the period.
B Net investment income (loss) is affected by the timing of the declaration of dividends by any underlying mutual funds or exchange-traded funds (ETFs). Net investment income (loss) of any such underlying funds is not included in the Fund's net investment income (loss) ratio.
C Total distributions per share do not sum due to rounding.
D Total returns for periods of less than one year are not annualized.
E Total returns would have been lower if certain expenses had not been reduced during the applicable periods shown.
F Total returns do not include the effect of the sales charges.
G Fees and expenses of any underlying mutual funds or exchange-traded funds (ETFs) are not included in the Fund's expense ratio. The Fund indirectly bears its proportionate share of these expenses. For additional expense information related to investments in Fidelity Central Funds, please refer to the "Investments in Fidelity Central Funds" note found in the Notes to Financial Statements section of the most recent Annual or Semi-Annual report.
H Expense ratios reflect operating expenses of the class. Expenses before reductions do not reflect amounts reimbursed, waived, or reduced through arrangements with the investment adviser, brokerage services, or other offset arrangements, if applicable, and do not represent the amount paid by the class during periods when reimbursements, waivers or reductions occur.
I Annualized
J Amount does not include the portfolio activity of any underlying mutual funds or exchange-traded funds (ETFs).
| Fidelity Advisor Freedom® 2025 Fund Class M |
| |
| | Six months ended (Unaudited) September 30, 2022 | | Years ended March 31, 2022 | | 2021 | | 2020 | | 2019 | | 2018 |
Selected Per-Share Data | | | | | | | | | | | | |
| Net asset value, beginning of period | $ | 13.46 | $ | 14.64 | $ | 11.57 | $ | 13.01 | $ | 13.76 | $ | 13.18 |
| Income from Investment Operations | | | | | | | | | | | | |
Net investment income (loss) A,B | | .09 | | .26 | | .07 | | .15 | | .18 | | .12 |
| Net realized and unrealized gain (loss) | | (2.36) | | (.15) | | 3.84 | | (.76) | | .18 | | 1.15 |
| Total from investment operations | | (2.27) | | .11 | | 3.91 | | (.61) | | .36 | | 1.27 |
| Distributions from net investment income | | - | | (.28) | | (.09) | | (.16) | | (.19) | | (.14) |
| Distributions from net realized gain | | (.68) | | (1.02) | | (.75) | | (.67) | | (.92) | | (.55) |
| Total distributions | | (.68) | | (1.29) C | | (.84) | | (.83) | | (1.11) | | (.69) |
| Net asset value, end of period | $ | 10.51 | $ | 13.46 | $ | 14.64 | $ | 11.57 | $ | 13.01 | $ | 13.76 |
Total Return D,E,F | | (17.40)% | | .38% | | 34.85% | | (5.31)% | | 3.09% | | 9.69% |
Ratios to Average Net Assets B,G,H | | | | | | | | | | | | |
| Expenses before reductions | | 1.12% I | | 1.13% | | 1.14% | | 1.14% | | 1.15% | | 1.05% |
| Expenses net of fee waivers, if any | | 1.12% I | | 1.13% | | 1.14% | | 1.14% | | 1.15% | | 1.05% |
| Expenses net of all reductions | | 1.12% I | | 1.13% | | 1.14% | | 1.14% | | 1.15% | | 1.05% |
| Net investment income (loss) | | 1.49% I | | 1.76% | | .51% | | 1.15% | | 1.37% | | .86% |
| Supplemental Data | | | | | | | | | | | | |
| Net assets, end of period (000 omitted) | $ | 324,711 | $ | 405,616 | $ | 432,038 | $ | 362,131 | $ | 423,584 | $ | 432,227 |
Portfolio turnover rate J | | 23% I | | 36% | | 28% | | 29% | | 24% | | 23% |
A Calculated based on average shares outstanding during the period.
B Net investment income (loss) is affected by the timing of the declaration of dividends by any underlying mutual funds or exchange-traded funds (ETFs). Net investment income (loss) of any such underlying funds is not included in the Fund's net investment income (loss) ratio.
C Total distributions per share do not sum due to rounding.
D Total returns for periods of less than one year are not annualized.
E Total returns would have been lower if certain expenses had not been reduced during the applicable periods shown.
F Total returns do not include the effect of the sales charges.
G Fees and expenses of any underlying mutual funds or exchange-traded funds (ETFs) are not included in the Fund's expense ratio. The Fund indirectly bears its proportionate share of these expenses. For additional expense information related to investments in Fidelity Central Funds, please refer to the "Investments in Fidelity Central Funds" note found in the Notes to Financial Statements section of the most recent Annual or Semi-Annual report.
H Expense ratios reflect operating expenses of the class. Expenses before reductions do not reflect amounts reimbursed, waived, or reduced through arrangements with the investment adviser, brokerage services, or other offset arrangements, if applicable, and do not represent the amount paid by the class during periods when reimbursements, waivers or reductions occur.
I Annualized
J Amount does not include the portfolio activity of any underlying mutual funds or exchange-traded funds (ETFs).
| Fidelity Advisor Freedom® 2025 Fund Class C |
| |
| | Six months ended (Unaudited) September 30, 2022 | | Years ended March 31, 2022 | | 2021 | | 2020 | | 2019 | | 2018 |
Selected Per-Share Data | | | | | | | | | | | | |
| Net asset value, beginning of period | $ | 13.14 | $ | 14.33 | $ | 11.35 | $ | 12.80 | $ | 13.54 | $ | 12.98 |
| Income from Investment Operations | | | | | | | | | | | | |
Net investment income (loss) A,B | | .06 | | .18 | | - C | | .08 | | .11 | | .05 |
| Net realized and unrealized gain (loss) | | (2.31) | | (.14) | | 3.77 | | (.75) | | .18 | | 1.13 |
| Total from investment operations | | (2.25) | | .04 | | 3.77 | | (.67) | | .29 | | 1.18 |
| Distributions from net investment income | | - | | (.21) | | (.04) | | (.11) | | (.13) | | (.08) |
| Distributions from net realized gain | | (.67) | | (1.02) | | (.75) | | (.66) | | (.91) | | (.54) |
| Total distributions | | (.67) | | (1.23) | | (.79) | | (.78) D | | (1.03) D | | (.62) |
| Net asset value, end of period | $ | 10.22 | $ | 13.14 | $ | 14.33 | $ | 11.35 | $ | 12.80 | $ | 13.54 |
Total Return E,F,G | | (17.61)% | | (.12)% | | 34.28% | | (5.85)% | | 2.59% | | 9.14% |
Ratios to Average Net Assets B,H,I | | | | | | | | | | | | |
| Expenses before reductions | | 1.62% J | | 1.63% | | 1.64% | | 1.64% | | 1.65% | | 1.55% |
| Expenses net of fee waivers, if any | | 1.62% J | | 1.63% | | 1.64% | | 1.64% | | 1.65% | | 1.55% |
| Expenses net of all reductions | | 1.62% J | | 1.63% | | 1.64% | | 1.64% | | 1.65% | | 1.55% |
| Net investment income (loss) | | .99% J | | 1.26% | | .01% | | .65% | | .87% | | .36% |
| Supplemental Data | | | | | | | | | | | | |
| Net assets, end of period (000 omitted) | $ | 35,117 | $ | 46,295 | $ | 60,128 | $ | 51,559 | $ | 64,691 | $ | 97,691 |
Portfolio turnover rate K | | 23% J | | 36% | | 28% | | 29% | | 24% | | 23% |
A Calculated based on average shares outstanding during the period.
B Net investment income (loss) is affected by the timing of the declaration of dividends by any underlying mutual funds or exchange-traded funds (ETFs). Net investment income (loss) of any such underlying funds is not included in the Fund's net investment income (loss) ratio.
C Amount represents less than $.005 per share.
D Total distributions per share do not sum due to rounding.
E Total returns for periods of less than one year are not annualized.
F Total returns would have been lower if certain expenses had not been reduced during the applicable periods shown.
G Total returns do not include the effect of the contingent deferred sales charge.
H Fees and expenses of any underlying mutual funds or exchange-traded funds (ETFs) are not included in the Fund's expense ratio. The Fund indirectly bears its proportionate share of these expenses. For additional expense information related to investments in Fidelity Central Funds, please refer to the "Investments in Fidelity Central Funds" note found in the Notes to Financial Statements section of the most recent Annual or Semi-Annual report.
I Expense ratios reflect operating expenses of the class. Expenses before reductions do not reflect amounts reimbursed, waived, or reduced through arrangements with the investment adviser, brokerage services, or other offset arrangements, if applicable, and do not represent the amount paid by the class during periods when reimbursements, waivers or reductions occur.
J Annualized
K Amount does not include the portfolio activity of any underlying mutual funds or exchange-traded funds (ETFs).
| Fidelity Advisor Freedom® 2025 Fund Class I |
| |
| | Six months ended (Unaudited) September 30, 2022 | | Years ended March 31, 2022 | | 2021 | | 2020 | | 2019 | | 2018 |
Selected Per-Share Data | | | | | | | | | | | | |
| Net asset value, beginning of period | $ | 13.61 | $ | 14.77 | $ | 11.66 | $ | 13.11 | $ | 13.86 | $ | 13.27 |
| Income from Investment Operations | | | | | | | | | | | | |
Net investment income (loss) A,B | | .12 | | .33 | | .14 | | .22 | | .25 | | .19 |
| Net realized and unrealized gain (loss) | | (2.39) | | (.14) | | 3.88 | | (.77) | | .18 | | 1.16 |
| Total from investment operations | | (2.27) | | .19 | | 4.02 | | (.55) | | .43 | | 1.35 |
| Distributions from net investment income | | - | | (.33) | | (.15) | | (.22) | | (.25) | | (.21) |
| Distributions from net realized gain | | (.69) | | (1.02) | | (.76) | | (.67) | | (.93) | | (.55) |
| Total distributions | | (.69) | | (1.35) | | (.91) | | (.90) C | | (1.18) | | (.76) |
| Net asset value, end of period | $ | 10.65 | $ | 13.61 | $ | 14.77 | $ | 11.66 | $ | 13.11 | $ | 13.86 |
Total Return D,E | | (17.16)% | | .89% | | 35.57% | | (4.89)% | | 3.63% | | 10.26% |
Ratios to Average Net Assets B,F,G | | | | | | | | | | | | |
| Expenses before reductions | | .62% H | | .63% | | .64% | | .64% | | .65% | | .56% |
| Expenses net of fee waivers, if any | | .62% H | | .63% | | .64% | | .64% | | .65% | | .56% |
| Expenses net of all reductions | | .62% H | | .63% | | .64% | | .64% | | .65% | | .56% |
| Net investment income (loss) | | 1.99% H | | 2.26% | | 1.01% | | 1.65% | | 1.87% | | 1.35% |
| Supplemental Data | | | | | | | | | | | | |
| Net assets, end of period (000 omitted) | $ | 763,100 | $ | 1,026,796 | $ | 1,150,782 | $ | 911,020 | $ | 1,051,420 | $ | 1,018,536 |
Portfolio turnover rate I | | 23% H | | 36% | | 28% | | 29% | | 24% | | 23% |
A Calculated based on average shares outstanding during the period.
B Net investment income (loss) is affected by the timing of the declaration of dividends by any underlying mutual funds or exchange-traded funds (ETFs). Net investment income (loss) of any such underlying funds is not included in the Fund's net investment income (loss) ratio.
C Total distributions per share do not sum due to rounding.
D Total returns for periods of less than one year are not annualized.
E Total returns would have been lower if certain expenses had not been reduced during the applicable periods shown.
F Fees and expenses of any underlying mutual funds or exchange-traded funds (ETFs) are not included in the Fund's expense ratio. The Fund indirectly bears its proportionate share of these expenses. For additional expense information related to investments in Fidelity Central Funds, please refer to the "Investments in Fidelity Central Funds" note found in the Notes to Financial Statements section of the most recent Annual or Semi-Annual report.
G Expense ratios reflect operating expenses of the class. Expenses before reductions do not reflect amounts reimbursed, waived, or reduced through arrangements with the investment adviser, brokerage services, or other offset arrangements, if applicable, and do not represent the amount paid by the class during periods when reimbursements, waivers or reductions occur.
H Annualized
I Amount does not include the portfolio activity of any underlying mutual funds or exchange-traded funds (ETFs).
| Fidelity Advisor Freedom® 2025 Fund Class Z |
| |
| | Six months ended (Unaudited) September 30, 2022 | | Years ended March 31, 2022 | | 2021 | | 2020 | | 2019 A |
Selected Per-Share Data | | | | | | | | | | |
| Net asset value, beginning of period | $ | 13.48 | $ | 14.65 | $ | 11.58 | $ | 13.05 | $ | 13.78 |
| Income from Investment Operations | | | | | | | | | | |
Net investment income (loss) B,C | | .12 | | .34 | | .15 | | .23 | | .03 |
| Net realized and unrealized gain (loss) | | (2.36) | | (.14) | | 3.85 | | (.76) | | (.02) |
| Total from investment operations | | (2.24) | | .20 | | 4.00 | | (.53) | | .01 |
| Distributions from net investment income | | - | | (.35) | | (.17) | | (.27) | | (.30) |
| Distributions from net realized gain | | (.70) | | (1.02) | | (.76) | | (.67) | | (.44) |
| Total distributions | | (.70) | | (1.37) | | (.93) | | (.94) | | (.74) |
| Net asset value, end of period | $ | 10.54 | $ | 13.48 | $ | 14.65 | $ | 11.58 | $ | 13.05 |
Total Return D,E | | (17.13)% | | .94% | | 35.65% | | (4.77)% | | .56% |
Ratios to Average Net Assets C,F,G | | | | | | | | | | |
| Expenses before reductions | | .54% H | | .54% | | .55% | | .56% | | .56% H |
| Expenses net of fee waivers, if any | | .54% H | | .54% | | .55% | | .56% | | .56% H |
| Expenses net of all reductions | | .54% H | | .54% | | .55% | | .56% | | .56% H |
| Net investment income (loss) | | 2.07% H | | 2.34% | | 1.10% | | 1.74% | | .43% H |
| Supplemental Data | | | | | | | | | | |
| Net assets, end of period (000 omitted) | $ | 104,741 | $ | 94,133 | $ | 60,905 | $ | 36,620 | $ | 3,396 |
Portfolio turnover rate I | | 23% H | | 36% | | 28% | | 29% | | 24% |
A For the period October 2, 2018 (commencement of sale of shares) through March 31, 2019.
B Calculated based on average shares outstanding during the period.
C Net investment income (loss) is affected by the timing of the declaration of dividends by any underlying mutual funds or exchange-traded funds (ETFs). Net investment income (loss) of any such underlying funds is not included in the Fund's net investment income (loss) ratio.
D Total returns for periods of less than one year are not annualized.
E Total returns would have been lower if certain expenses had not been reduced during the applicable periods shown.
F Fees and expenses of any underlying mutual funds or exchange-traded funds (ETFs) are not included in the Fund's expense ratio. The Fund indirectly bears its proportionate share of these expenses. For additional expense information related to investments in Fidelity Central Funds, please refer to the "Investments in Fidelity Central Funds" note found in the Notes to Financial Statements section of the most recent Annual or Semi-Annual report.
G Expense ratios reflect operating expenses of the class. Expenses before reductions do not reflect amounts reimbursed, waived, or reduced through arrangements with the investment adviser, brokerage services, or other offset arrangements, if applicable, and do not represent the amount paid by the class during periods when reimbursements, waivers or reductions occur.
H Annualized
I Amount does not include the portfolio activity of any underlying mutual funds or exchange-traded funds (ETFs).
| Fidelity Advisor Freedom® 2025 Fund Class Z6 |
| |
| | Six months ended (Unaudited) September 30, 2022 | | Years ended March 31, 2022 | | 2021 | | 2020 | | 2019 | | 2018 A |
Selected Per-Share Data | | | | | | | | | | | | |
| Net asset value, beginning of period | $ | 13.55 | $ | 14.71 | $ | 11.62 | $ | 13.08 | $ | 13.85 | $ | 13.53 |
| Income from Investment Operations | | | | | | | | | | | | |
Net investment income (loss) B,C | | .13 | | .36 | | .16 | | .24 | | .27 | | .10 |
| Net realized and unrealized gain (loss) | | (2.38) | | (.15) | | 3.87 | | (.77) | | .18 | | .80 |
| Total from investment operations | | (2.25) | | .21 | | 4.03 | | (.53) | | .45 | | .90 |
| Distributions from net investment income | | - | | (.36) | | (.18) | | (.26) | | (.29) | | (.22) |
| Distributions from net realized gain | | (.70) | | (1.02) | | (.76) | | (.67) | | (.93) | | (.36) |
| Total distributions | | (.70) | | (1.37) D | | (.94) | | (.93) | | (1.22) | | (.58) |
| Net asset value, end of period | $ | 10.60 | $ | 13.55 | $ | 14.71 | $ | 11.62 | $ | 13.08 | $ | 13.85 |
Total Return E,F | | (17.10)% | | 1.07% | | 35.82% | | (4.72)% | | 3.85% | | 6.61% |
Ratios to Average Net Assets C,G,H | | | | | | | | | | | | |
| Expenses before reductions | | .43% I,J | | .44% | | .44% | | .45% | | .45% | | .47% I,J |
| Expenses net of fee waivers, if any | | .43% I,J | | .44% | | .44% | | .45% | | .45% | | .47% I,J |
| Expenses net of all reductions | | .43% I,J | | .44% | | .44% | | .45% | | .45% | | .47% I,J |
| Net investment income (loss) | | 2.17% I | | 2.45% | | 1.21% | | 1.85% | | 2.07% | | .89% I |
| Supplemental Data | | | | | | | | | | | | |
| Net assets, end of period (000 omitted) | $ | 182,395 | $ | 194,996 | $ | 144,871 | $ | 77,638 | $ | 56,103 | $ | 24,926 |
Portfolio turnover rate K | | 23% I | | 36% | | 28% | | 29% | | 24% | | 23% |
A For the period June 6, 2017 (commencement of sale of shares) through March 31, 2018.
B Calculated based on average shares outstanding during the period.
C Net investment income (loss) is affected by the timing of the declaration of dividends by any underlying mutual funds or exchange-traded funds (ETFs). Net investment income (loss) of any such underlying funds is not included in the Fund's net investment income (loss) ratio.
D Total distributions per share do not sum due to rounding.
E Total returns for periods of less than one year are not annualized.
F Total returns would have been lower if certain expenses had not been reduced during the applicable periods shown.
G Fees and expenses of any underlying mutual funds or exchange-traded funds (ETFs) are not included in the Fund's expense ratio. The Fund indirectly bears its proportionate share of these expenses. For additional expense information related to investments in Fidelity Central Funds, please refer to the "Investments in Fidelity Central Funds" note found in the Notes to Financial Statements section of the most recent Annual or Semi-Annual report.
H Expense ratios reflect operating expenses of the class. Expenses before reductions do not reflect amounts reimbursed, waived, or reduced through arrangements with the investment adviser, brokerage services, or other offset arrangements, if applicable, and do not represent the amount paid by the class during periods when reimbursements, waivers or reductions occur.
I Annualized
J On certain classes, the size and fluctuation of net assets and expense amounts may cause ratios to differ from contractual rates.
K Amount does not include the portfolio activity of any underlying mutual funds or exchange-traded funds (ETFs).
The information in the following table is based on the direct Investments of the Fund.
Top Holdings (% of Fund's net assets) |
| |
| Fidelity Series Investment Grade Bond Fund | 21.5 | |
| Fidelity Series Emerging Markets Opportunities Fund | 10.1 | |
| Fidelity Series Large Cap Stock Fund | 6.3 | |
| Fidelity Series Long-Term Treasury Bond Index Fund | 5.3 | |
| Fidelity Series Overseas Fund | 5.3 | |
| Fidelity Series International Value Fund | 5.2 | |
| Fidelity Series International Growth Fund | 5.2 | |
| Fidelity Series Value Discovery Fund | 4.2 | |
| Fidelity Advisor Series Equity Growth Fund | 4.2 | |
| Fidelity Series Stock Selector Large Cap Value Fund | 4.0 | |
| | 71.3 | |
| |
Domestic Equity Funds category includes Fidelity Series Commodity Strategy Fund which invests in commodity-related investments.
Asset Allocation (% of Fund's net assets) |
|
Percentages shown as 0.0% may reflect amounts less than 0.05%. |
|
Fidelity Advisor Freedom® 2030 Fund
Showing Percentage of Net Assets
| U.S. Treasury Obligations - 0.0% |
| | | Principal Amount (a) | Value ($) |
U.S. Treasury Bills, yield at date of purchase 2.13% to 3.29% 10/13/22 to 12/29/22 (b) (Cost $1,491,483) | | 1,500,000 | 1,492,063 |
| | | | |
| Domestic Equity Funds - 32.9% |
| | | Shares | Value ($) |
| Fidelity Advisor Series Equity Growth Fund (c) | | 9,174,365 | 111,468,532 |
| Fidelity Advisor Series Growth Opportunities Fund (c) | | 8,966,858 | 78,639,342 |
| Fidelity Advisor Series Small Cap Fund (c) | | 4,639,455 | 48,575,090 |
| Fidelity Series All-Sector Equity Fund (c) | | 5,151,271 | 44,197,906 |
| Fidelity Series Commodity Strategy Fund (c) | | 15,510,093 | 32,416,094 |
| Fidelity Series Large Cap Stock Fund (c) | | 11,513,328 | 170,051,858 |
| Fidelity Series Large Cap Value Index Fund (c) | | 1,455,985 | 18,520,128 |
| Fidelity Series Opportunistic Insights Fund (c) | | 7,146,120 | 101,546,368 |
| Fidelity Series Small Cap Opportunities Fund (c) | | 5,387,617 | 58,078,507 |
| Fidelity Series Stock Selector Large Cap Value Fund (c) | | 9,677,431 | 108,096,906 |
| Fidelity Series Value Discovery Fund (c) | | 8,111,218 | 111,691,478 |
| TOTAL DOMESTIC EQUITY FUNDS (Cost $824,756,848) | | | 883,282,209 |
| | | | |
| International Equity Funds - 30.6% |
| | | Shares | Value ($) |
| Fidelity Series Canada Fund (c) | | 4,918,248 | 60,986,275 |
| Fidelity Series Emerging Markets Fund (c) | | 4,073,072 | 29,489,043 |
| Fidelity Series Emerging Markets Opportunities Fund (c) | | 18,753,876 | 272,306,275 |
| Fidelity Series International Growth Fund (c) | | 10,936,164 | 140,201,623 |
| Fidelity Series International Small Cap Fund (c) | | 2,671,416 | 36,544,973 |
| Fidelity Series International Value Fund (c) | | 16,383,973 | 140,738,325 |
| Fidelity Series Overseas Fund (c) | | 14,851,961 | 141,539,185 |
| TOTAL INTERNATIONAL EQUITY FUNDS (Cost $852,417,022) | | | 821,805,699 |
| | | | |
| Bond Funds - 35.9% |
| | | Shares | Value ($) |
| Fidelity Series 5+ Year Inflation-Protected Bond Index Fund (c) | | 11,892,333 | 95,019,737 |
| Fidelity Series Emerging Markets Debt Fund (c) | | 2,057,857 | 14,116,899 |
| Fidelity Series Emerging Markets Debt Local Currency Fund (c) | | 582,668 | 4,643,863 |
| Fidelity Series Floating Rate High Income Fund (c) | | 331,397 | 2,883,156 |
| Fidelity Series High Income Fund (c) | | 1,850,085 | 14,578,672 |
| Fidelity Series International Credit Fund (c) | | 186,983 | 1,471,553 |
| Fidelity Series International Developed Markets Bond Index Fund (c) | | 12,379,802 | 105,475,914 |
| Fidelity Series Investment Grade Bond Fund (c) | | 59,013,795 | 575,974,644 |
| Fidelity Series Long-Term Treasury Bond Index Fund (c) | | 24,037,102 | 143,501,497 |
| Fidelity Series Real Estate Income Fund (c) | | 726,877 | 6,919,867 |
| TOTAL BOND FUNDS (Cost $1,152,396,843) | | | 964,585,802 |
| | | | |
| Short-Term Funds - 0.6% |
| | | Shares | Value ($) |
| Fidelity Cash Central Fund 3.10% (d) | | 621,135 | 621,259 |
| Fidelity Series Government Money Market Fund 3.00% (c)(e) | | 14,429,145 | 14,429,145 |
| Fidelity Series Short-Term Credit Fund (c) | | 3 | 25 |
| TOTAL SHORT-TERM FUNDS (Cost $15,050,429) | | | 15,050,429 |
| | | | |
| TOTAL INVESTMENT IN SECURITIES - 100.0% (Cost $2,846,112,625) | 2,686,216,202 |
NET OTHER ASSETS (LIABILITIES) - 0.0% | (586,841) |
| NET ASSETS - 100.0% | 2,685,629,361 |
| | |
| Futures Contracts |
| | Number of contracts | Expiration Date | Notional Amount ($) | Value ($) | Unrealized Appreciation/ (Depreciation) ($) |
| Purchased | | | | | |
| | | | | | |
| Treasury Contracts | | | | | |
| CBOT 10-Year U.S. Treasury Note Contracts (United States) | 438 | Dec 2022 | 49,083,375 | (2,993,339) | (2,993,339) |
| CBOT Ultra Long Term U.S. Treasury Bond Contracts (United States) | 41 | Dec 2022 | 5,617,000 | (70,726) | (70,726) |
| | | | | | |
| TOTAL PURCHASED | | | | | (3,064,065) |
| | | | | | |
| Sold | | | | | |
| | | | | | |
| Equity Index Contracts | | | | | |
| CME E-mini S&P 500 Index Contracts (United States) | 63 | Dec 2022 | 11,344,725 | 82,057 | 82,057 |
| ICE E-mini MSCI EAFE Index Contracts (United States) | 140 | Dec 2022 | 11,624,200 | 1,572,284 | 1,572,284 |
| ICE E-mini MSCI Emerging Markets Index Contracts (United States) | 90 | Dec 2022 | 3,921,750 | 7,370 | 7,370 |
| | | | | | |
| TOTAL SOLD | | | | | 1,661,711 |
| | | | | | |
| TOTAL FUTURES CONTRACTS | | | | | (1,402,354) |
| The notional amount of futures purchased as a percentage of Net Assets is 2.0% |
| The notional amount of futures sold as a percentage of Net Assets is 0.9% |
Legend
| (a) | Amount is stated in United States dollars unless otherwise noted. |
| (b) | Security or a portion of the security was pledged to cover margin requirements for futures contracts. At period end, the value of securities pledged amounted to $1,492,063. |
| (d) | Affiliated fund that is generally available only to investment companies and other accounts managed by Fidelity Investments. The rate quoted is the annualized seven-day yield of the fund at period end. A complete unaudited listing of the fund's holdings as of its most recent quarter end is available upon request. In addition, each Fidelity Central Fund's financial statements are available on the SEC's website or upon request. |
| (e) | The rate quoted is the annualized seven-day yield of the fund at period end. |
Affiliated Central Funds
Fiscal year to date information regarding the Fund's investments in Fidelity Central Funds, including the ownership percentage, is presented below.
| Affiliate | Value, beginning of period ($) | Purchases ($) | Sales Proceeds ($) | Dividend Income ($) | Realized Gain (loss) ($) | Change in Unrealized appreciation (depreciation) ($) | Value, end of period ($) | %ownership, end of period |
| Fidelity Cash Central Fund 3.10% | 2,651,893 | 14,625,252 | 16,655,886 | 15,002 | 53 | (53) | 621,259 | 0.0% |
| Total | 2,651,893 | 14,625,252 | 16,655,886 | 15,002 | 53 | (53) | 621,259 | |
| | | | | | | | | |
Amounts in the income column in the above table include any capital gain distributions from underlying funds, which are presented in the corresponding line item in the Statement of Operations, if applicable.
Affiliated Underlying Funds
Fiscal year to date information regarding the Fund's investments in affiliated Underlying Funds is presented below. Exchanges between classes of the same affiliated Underlying Funds may occur. If an Underlying Funds changes its name, the name presented below is the name in effect at period end.
| Affiliate | Value, beginning of period ($) | Purchases ($) | Sales Proceeds ($) | Dividend Income ($) | Realized Gain (loss) ($) | Change in Unrealized appreciation (depreciation) ($) | Value, end of period ($) |
| Fidelity Advisor Series Equity Growth Fund | 137,793,553 | 12,444,194 | 9,165,080 | - | (857,977) | (28,746,158) | 111,468,532 |
| Fidelity Advisor Series Growth Opportunities Fund | 94,502,979 | 20,466,450 | 8,506,861 | - | (1,708,019) | (26,115,207) | 78,639,342 |
| Fidelity Advisor Series Small Cap Fund | 62,545,241 | 4,018,766 | 6,295,267 | - | (901,543) | (10,792,107) | 48,575,090 |
| Fidelity Series 0-5 Year Inflation-Protected Bond Index Fund | - | 12,266,170 | 12,303,137 | - | 36,967 | - | - |
| Fidelity Series 5+ Year Inflation-Protected Bond Index Fund | 87,808,843 | 28,628,536 | 3,924,416 | - | (196,620) | (17,296,606) | 95,019,737 |
| Fidelity Series All-Sector Equity Fund | 59,102,963 | 1,464,470 | 4,564,405 | - | (846,893) | (10,958,229) | 44,197,906 |
| Fidelity Series Canada Fund | 77,307,427 | 3,861,928 | 4,762,217 | - | (128,462) | (15,292,401) | 60,986,275 |
| Fidelity Series Commodity Strategy Fund | 49,864,325 | 26,895,149 | 17,105,802 | 23,232,325 | (4,149,529) | (23,088,049) | 32,416,094 |
| Fidelity Series Emerging Markets Debt Fund | 16,597,853 | 1,283,013 | 938,023 | 423,620 | (116,295) | (2,709,649) | 14,116,899 |
| Fidelity Series Emerging Markets Debt Local Currency Fund | 5,612,058 | 106,338 | 434,474 | - | (58,911) | (581,148) | 4,643,863 |
| Fidelity Series Emerging Markets Fund | 36,715,537 | 2,415,281 | 1,422,163 | - | (169,041) | (8,050,571) | 29,489,043 |
| Fidelity Series Emerging Markets Opportunities Fund | 330,872,482 | 26,959,066 | 14,878,715 | - | (3,113,948) | (67,532,610) | 272,306,275 |
| Fidelity Series Floating Rate High Income Fund | 3,392,195 | 135,831 | 475,031 | 82,021 | (44,819) | (125,020) | 2,883,156 |
| Fidelity Series Government Money Market Fund 3.00% | 13,551,946 | 14,477,303 | 13,600,104 | 8,565 | - | - | 14,429,145 |
| Fidelity Series High Income Fund | 20,222,174 | 774,739 | 3,935,897 | 475,567 | (474,920) | (2,007,424) | 14,578,672 |
| Fidelity Series Inflation-Protected Bond Index Fund | 23,061,684 | 409,266 | 22,844,923 | 322,521 | 521,568 | (1,147,595) | - |
| Fidelity Series International Credit Fund | 1,706,551 | 23,300 | - | 23,300 | - | (258,298) | 1,471,553 |
| Fidelity Series International Developed Markets Bond Index Fund | 101,923,080 | 24,010,076 | 10,623,456 | 166,307 | (984,176) | (8,849,610) | 105,475,914 |
| Fidelity Series International Growth Fund | 176,985,081 | 14,833,291 | 11,118,231 | - | (1,550,198) | (38,948,320) | 140,201,623 |
| Fidelity Series International Small Cap Fund | 48,761,896 | 1,240,265 | 1,933,723 | - | (471,629) | (11,051,836) | 36,544,973 |
| Fidelity Series International Value Fund | 179,116,446 | 13,652,704 | 13,006,846 | - | (850,845) | (38,173,134) | 140,738,325 |
| Fidelity Series Investment Grade Bond Fund | 735,865,825 | 37,647,065 | 123,847,770 | 9,396,195 | (10,121,059) | (63,569,417) | 575,974,644 |
| Fidelity Series Large Cap Stock Fund | 216,826,686 | 22,271,826 | 21,311,967 | 10,251,895 | 1,785,401 | (49,520,088) | 170,051,858 |
| Fidelity Series Large Cap Value Index Fund | 23,451,357 | 787,602 | 1,803,532 | - | 306,671 | (4,221,970) | 18,520,128 |
| Fidelity Series Long-Term Treasury Bond Index Fund | 170,410,396 | 24,170,525 | 12,593,465 | 2,042,698 | (1,799,460) | (36,686,499) | 143,501,497 |
| Fidelity Series Opportunistic Insights Fund | 127,346,178 | 13,128,112 | 10,262,751 | - | (2,059,100) | (26,606,071) | 101,546,368 |
| Fidelity Series Overseas Fund | 178,014,643 | 15,103,276 | 6,977,039 | - | (540,925) | (44,060,770) | 141,539,185 |
| Fidelity Series Real Estate Income Fund | 12,120,195 | 696,052 | 4,257,771 | 561,879 | 30,611 | (1,669,220) | 6,919,867 |
| Fidelity Series Short-Term Credit Fund | 3,396,357 | 17,475 | 3,391,036 | 5,967 | (57,196) | 34,425 | 25 |
| Fidelity Series Small Cap Opportunities Fund | 77,221,382 | 4,086,656 | 7,558,916 | 2,717,090 | (1,008,581) | (14,662,034) | 58,078,507 |
| Fidelity Series Stock Selector Large Cap Value Fund | 138,391,706 | 7,342,762 | 14,435,537 | - | (91,719) | (23,110,306) | 108,096,906 |
| Fidelity Series Value Discovery Fund | 140,961,665 | 5,594,485 | 16,131,191 | - | 2,698,900 | (21,432,381) | 111,691,478 |
| | 3,351,450,704 | 341,211,972 | 384,409,746 | 49,709,950 | (26,921,747) | (597,228,303) | 2,684,102,880 |
Amounts in the income column in the above table include any capital gain distributions from underlying funds, which are presented in the corresponding line item in the Statement of Operations, if applicable.
Purchases and Sales Proceeds in the table above include the value of shares purchased or redeemed through in-kind transactions, if applicable.
Investment Valuation
The following is a summary of the inputs used, as of September 30, 2022, involving the Fund's assets and liabilities carried at fair value. The inputs or methodology used for valuing securities may not be an indication of the risk associated with investing in those securities. For more information on valuation inputs, and their aggregation into the levels used below, please refer to the Investment Valuation section in the accompanying Notes to Financial Statements.
| Valuation Inputs at Reporting Date: |
| Description | Total ($) | Level 1 ($) | Level 2 ($) | Level 3 ($) |
Investments in Securities: | | | | |
|
| Other Short-Term Investments | 1,492,063 | - | 1,492,063 | - |
|
| Domestic Equity Funds | 883,282,209 | 883,282,209 | - | - |
|
| International Equity Funds | 821,805,699 | 821,805,699 | - | - |
|
| Bond Funds | 964,585,802 | 964,585,802 | - | - |
|
| Short-Term Funds | 15,050,429 | 15,050,429 | - | - |
| Total Investments in Securities: | 2,686,216,202 | 2,684,724,139 | 1,492,063 | - |
Derivative Instruments: | | | | |
|
| Assets | | | | |
Futures Contracts | 1,661,711 | 1,661,711 | - | - |
| Total Assets | 1,661,711 | 1,661,711 | - | - |
|
| Liabilities | | | | |
Futures Contracts | (3,064,065) | (3,064,065) | - | - |
| Total Liabilities | (3,064,065) | (3,064,065) | - | - |
| Total Derivative Instruments: | (1,402,354) | (1,402,354) | - | - |
Value of Derivative Instruments
The following table is a summary of the Fund's value of derivative instruments by primary risk exposure as of September 30, 2022. For additional information on derivative instruments, please refer to the Derivative Instruments section in the accompanying Notes to Financial Statements.
Primary Risk Exposure / Derivative Type | Value |
| Asset ($) | Liability ($) |
| Equity Risk | | |
Futures Contracts (a) | 1,661,711 | 0 |
| Total Equity Risk | 1,661,711 | 0 |
| Interest Rate Risk | | |
Futures Contracts (a) | 0 | (3,064,065) |
| Total Interest Rate Risk | 0 | (3,064,065) |
| Total Value of Derivatives | 1,661,711 | (3,064,065) |
(a)Reflects gross cumulative appreciation (depreciation) on futures contracts as presented in the Schedule of Investments. In the Statement of Assets and Liabilities, the period end daily variation margin is included in receivable or payable for daily variation margin on futures contracts, and the net cumulative appreciation (depreciation) is included in Total accumulated earnings (loss).
Fidelity Advisor Freedom® 2030 Fund
| Statement of Assets and Liabilities |
| | | | September 30, 2022 (Unaudited) |
| | | | | |
| Assets | | | | |
| Investment in securities, at value - See accompanying schedule: | $ | | | |
Unaffiliated issuers (cost $1,491,483) | | $1,492,063 | | |
Fidelity Central Funds (cost $621,259) | | 621,259 | | |
Other affiliated issuers (cost $2,843,999,883) | | 2,684,102,880 | | |
| | | | | |
| Total Investment in Securities (cost $2,846,112,625) | | | $ | 2,686,216,202 |
| Receivable for investments sold | | | | 32,466,376 |
| Receivable for fund shares sold | | | | 2,945,069 |
| Distributions receivable from Fidelity Central Funds | | | | 2,442 |
| Receivable for daily variation margin on futures contracts | | | | 8,434 |
Total assets | | | | 2,721,638,523 |
| Liabilities | | | | |
| Payable for investments purchased | | 28,691,666 | | |
| Payable for fund shares redeemed | | 5,273,330 | | |
| Accrued management fee | | 1,514,427 | | |
| Distribution and service plan fees payable | | 425,864 | | |
| Payable for daily variation margin on futures contracts | | 102,914 | | |
| Other payables and accrued expenses | | 961 | | |
| Total Liabilities | | | | 36,009,162 |
| Net Assets | | | $ | 2,685,629,361 |
| Net Assets consist of: | | | | |
| Paid in capital | | | $ | 2,854,681,313 |
| Total accumulated earnings (loss) | | | | (169,051,952) |
| Net Assets | | | $ | 2,685,629,361 |
| | | | | |
| Net Asset Value and Maximum Offering Price | | | | |
| Class A : | | | | |
Net Asset Value and redemption price per share ($985,867,257 ÷ 86,393,933 shares) (a) | | | $ | 11.41 |
| Maximum offering price per share (100/94.25 of $11.41) | | | $ | 12.11 |
| Class M : | | | | |
Net Asset Value and redemption price per share ($379,028,140 ÷ 33,541,157 shares) (a) | | | $ | 11.30 |
| Maximum offering price per share (100/96.50 of $11.30) | | | $ | 11.71 |
| Class C : | | | | |
Net Asset Value and offering price per share ($46,738,479 ÷ 4,237,796 shares) (a) | | | $ | 11.03 |
| Class I : | | | | |
Net Asset Value , offering price and redemption price per share ($937,630,350 ÷ 81,440,256 shares) | | | $ | 11.51 |
| Class Z : | | | | |
Net Asset Value , offering price and redemption price per share ($117,487,652 ÷ 10,302,877 shares) | | | $ | 11.40 |
| Class Z6 : | | | | |
Net Asset Value , offering price and redemption price per share ($218,877,483 ÷ 19,096,300 shares) | | | $ | 11.46 |
(a)Redemption price per share is equal to net asset value less any applicable contingent deferred sales charge. |
| Statement of Operations |
| | | | Six months ended September 30, 2022 (Unaudited) |
| Investment Income | | | | |
| Dividends: | | | | |
| Affiliated issuers | | | $ | 38,663,118 |
| Interest | | | | 12,606 |
| Income from Fidelity Central Funds | | | | 15,002 |
| Total Income | | | | 38,690,726 |
| Expenses | | | | |
| Management fee | $ | 9,695,325 | | |
| Distribution and service plan fees | | 2,732,969 | | |
| Independent trustees' fees and expenses | | 5,247 | | |
| Total expenses before reductions | | 12,433,541 | | |
| Expense reductions | | (14) | | |
| Total expenses after reductions | | | | 12,433,527 |
| Net Investment income (loss) | | | | 26,257,199 |
| Realized and Unrealized Gain (Loss) | | | | |
| Net realized gain (loss) on: | | | | |
| Investment Securities: | | | | |
| Unaffiliated issuers | | 1,053 | | |
| Fidelity Central Funds | | 53 | | |
| Other affiliated issuers | | (26,921,747) | | |
| Futures contracts | | (1,440,370) | | |
| Capital gain distributions from underlying funds: | | | | |
| Affiliated issuers | | 11,046,832 | | |
| Total net realized gain (loss) | | | | (17,314,179) |
| Change in net unrealized appreciation (depreciation) on: | | | | |
| Investment Securities: | | | | |
| Unaffiliated issuers | | 556 | | |
| Fidelity Central Funds | | (52) | | |
| Other affiliated issuers | | (597,228,303) | | |
| Futures contracts | | (2,189,194) | | |
| Total change in net unrealized appreciation (depreciation) | | | | (599,416,993) |
| Net gain (loss) | | | | (616,731,172) |
| Net increase (decrease) in net assets resulting from operations | | | $ | (590,473,973) |
| Statement of Changes in Net Assets |
| |
| | Six months ended September 30, 2022 (Unaudited) | | Year ended March 31, 2022 |
| Increase (Decrease) in Net Assets | | | | |
| Operations | | | | |
| Net investment income (loss) | $ | 26,257,199 | $ | 73,606,225 |
| Net realized gain (loss) | | (17,314,179) | | 273,240,703 |
| Change in net unrealized appreciation (depreciation) | | (599,416,993) | | (300,472,927) |
| Net increase (decrease) in net assets resulting from operations | | (590,473,973) | | 46,374,001 |
| Distributions to shareholders | | (179,004,533) | | (325,099,563) |
| Share transactions - net increase (decrease) | | 100,508,039 | | 179,328,125 |
| Total increase (decrease) in net assets | | (668,970,467) | | (99,397,437) |
| | | | | |
| Net Assets | | | | |
| Beginning of period | | 3,354,599,828 | | 3,453,997,265 |
| End of period | $ | 2,685,629,361 | $ | 3,354,599,828 |
| | | | | |
| | | | | |
Financial Highlights
| Fidelity Advisor Freedom® 2030 Fund Class A |
| |
| | Six months ended (Unaudited) September 30, 2022 | | Years ended March 31, 2022 | | 2021 | | 2020 | | 2019 | | 2018 |
Selected Per-Share Data | | | | | | | | | | | | |
| Net asset value, beginning of period | $ | 14.75 | $ | 16.00 | $ | 12.21 | $ | 14.01 | $ | 14.95 | $ | 14.12 |
| Income from Investment Operations | | | | | | | | | | | | |
Net investment income (loss) A,B | | .11 | | .32 | | .11 | | .19 | | .23 | | .15 |
| Net realized and unrealized gain (loss) | | (2.66) | | (.09) | | 4.67 | | (1.01) | | .19 | | 1.50 |
| Total from investment operations | | (2.55) | | .23 | | 4.78 | | (.82) | | .42 | | 1.65 |
| Distributions from net investment income | | - | | (.33) | | (.13) | | (.19) | | (.24) | | (.16) |
| Distributions from net realized gain | | (.79) | | (1.15) | | (.87) | | (.79) | | (1.13) | | (.66) |
| Total distributions | | (.79) | | (1.48) | | (.99) C | | (.98) | | (1.36) C | | (.82) |
| Net asset value, end of period | $ | 11.41 | $ | 14.75 | $ | 16.00 | $ | 12.21 | $ | 14.01 | $ | 14.95 |
Total Return D,E,F | | (17.82)% | | 1.05% | | 40.51% | | (6.61)% | | 3.43% | | 11.80% |
Ratios to Average Net Assets B,G,H | | | | | | | | | | | | |
| Expenses before reductions | | .91% I | | .92% | | .93% | | .94% | | .94% J | | .84% |
| Expenses net of fee waivers, if any | | .91% I | | .92% | | .93% | | .94% | | .94% J | | .84% |
| Expenses net of all reductions | | .91% I | | .92% | | .93% | | .94% | | .94% J | | .84% |
| Net investment income (loss) | | 1.65% I | | 1.99% | | .75% | | 1.35% | | 1.57% | | .99% |
| Supplemental Data | | | | | | | | | | | | |
| Net assets, end of period (000 omitted) | $ | 985,867 | $ | 1,246,930 | $ | 1,318,549 | $ | 1,041,706 | $ | 1,279,896 | $ | 1,374,112 |
Portfolio turnover rate K | | 23% I | | 31% | | 29% | | 33% | | 22% | | 25% |
A Calculated based on average shares outstanding during the period.
B Net investment income (loss) is affected by the timing of the declaration of dividends by any underlying mutual funds or exchange-traded funds (ETFs). Net investment income (loss) of any such underlying funds is not included in the Fund's net investment income (loss) ratio.
C Total distributions per share do not sum due to rounding.
D Total returns for periods of less than one year are not annualized.
E Total returns would have been lower if certain expenses had not been reduced during the applicable periods shown.
F Total returns do not include the effect of the sales charges.
G Fees and expenses of any underlying mutual funds or exchange-traded funds (ETFs) are not included in the Fund's expense ratio. The Fund indirectly bears its proportionate share of these expenses. For additional expense information related to investments in Fidelity Central Funds, please refer to the "Investments in Fidelity Central Funds" note found in the Notes to Financial Statements section of the most recent Annual or Semi-Annual report.
H Expense ratios reflect operating expenses of the class. Expenses before reductions do not reflect amounts reimbursed, waived, or reduced through arrangements with the investment adviser, brokerage services, or other offset arrangements, if applicable, and do not represent the amount paid by the class during periods when reimbursements, waivers or reductions occur.
I Annualized
J On certain classes, the size and fluctuation of net assets and expense amounts may cause ratios to differ from contractual rates.
K Amount does not include the portfolio activity of any underlying mutual funds or exchange-traded funds (ETFs).
| Fidelity Advisor Freedom® 2030 Fund Class M |
| |
| | Six months ended (Unaudited) September 30, 2022 | | Years ended March 31, 2022 | | 2021 | | 2020 | | 2019 | | 2018 |
Selected Per-Share Data | | | | | | | | | | | | |
| Net asset value, beginning of period | $ | 14.62 | $ | 15.88 | $ | 12.13 | $ | 13.93 | $ | 14.88 | $ | 14.06 |
| Income from Investment Operations | | | | | | | | | | | | |
Net investment income (loss) A,B | | .09 | | .28 | | .07 | | .15 | | .19 | | .11 |
| Net realized and unrealized gain (loss) | | (2.63) | | (.09) | | 4.64 | | (1.00) | | .19 | | 1.50 |
| Total from investment operations | | (2.54) | | .19 | | 4.71 | | (.85) | | .38 | | 1.61 |
| Distributions from net investment income | | - | | (.30) | | (.10) | | (.17) | | (.21) | | (.13) |
| Distributions from net realized gain | | (.78) | | (1.15) | | (.86) | | (.78) | | (1.12) | | (.66) |
| Total distributions | | (.78) | | (1.45) | | (.96) | | (.95) | | (1.33) | | (.79) |
| Net asset value, end of period | $ | 11.30 | $ | 14.62 | $ | 15.88 | $ | 12.13 | $ | 13.93 | $ | 14.88 |
Total Return C,D,E | | (17.90)% | | .81% | | 40.15% | | (6.84)% | | 3.12% | | 11.53% |
Ratios to Average Net Assets B,F,G | | | | | | | | | | | | |
| Expenses before reductions | | 1.16% H | | 1.17% | | 1.18% | | 1.19% | | 1.19% I | | 1.09% |
| Expenses net of fee waivers, if any | | 1.16% H | | 1.17% | | 1.18% | | 1.19% | | 1.19% I | | 1.09% |
| Expenses net of all reductions | | 1.16% H | | 1.17% | | 1.18% | | 1.19% | | 1.19% I | | 1.09% |
| Net investment income (loss) | | 1.40% H | | 1.74% | | .50% | | 1.10% | | 1.32% | | .74% |
| Supplemental Data | | | | | | | | | | | | |
| Net assets, end of period (000 omitted) | $ | 379,028 | $ | 477,841 | $ | 502,610 | $ | 391,371 | $ | 453,917 | $ | 452,750 |
Portfolio turnover rate J | | 23% H | | 31% | | 29% | | 33% | | 22% | | 25% |
A Calculated based on average shares outstanding during the period.
B Net investment income (loss) is affected by the timing of the declaration of dividends by any underlying mutual funds or exchange-traded funds (ETFs). Net investment income (loss) of any such underlying funds is not included in the Fund's net investment income (loss) ratio.
C Total returns for periods of less than one year are not annualized.
D Total returns would have been lower if certain expenses had not been reduced during the applicable periods shown.
E Total returns do not include the effect of the sales charges.
F Fees and expenses of any underlying mutual funds or exchange-traded funds (ETFs) are not included in the Fund's expense ratio. The Fund indirectly bears its proportionate share of these expenses. For additional expense information related to investments in Fidelity Central Funds, please refer to the "Investments in Fidelity Central Funds" note found in the Notes to Financial Statements section of the most recent Annual or Semi-Annual report.
G Expense ratios reflect operating expenses of the class. Expenses before reductions do not reflect amounts reimbursed, waived, or reduced through arrangements with the investment adviser, brokerage services, or other offset arrangements, if applicable, and do not represent the amount paid by the class during periods when reimbursements, waivers or reductions occur.
H Annualized
I On certain classes, the size and fluctuation of net assets and expense amounts may cause ratios to differ from contractual rates.
J Amount does not include the portfolio activity of any underlying mutual funds or exchange-traded funds (ETFs).
| Fidelity Advisor Freedom® 2030 Fund Class C |
| |
| | Six months ended (Unaudited) September 30, 2022 | | Years ended March 31, 2022 | | 2021 | | 2020 | | 2019 | | 2018 |
Selected Per-Share Data | | | | | | | | | | | | |
| Net asset value, beginning of period | $ | 14.32 | $ | 15.60 | $ | 11.95 | $ | 13.75 | $ | 14.71 | $ | 13.92 |
| Income from Investment Operations | | | | | | | | | | | | |
Net investment income (loss) A,B | | .06 | | .19 | | - C | | .08 | | .12 | | .03 |
| Net realized and unrealized gain (loss) | | (2.57) | | (.08) | | 4.55 | | (.98) | | .18 | | 1.48 |
| Total from investment operations | | (2.51) | | .11 | | 4.55 | | (.90) | | .30 | | 1.51 |
| Distributions from net investment income | | - | | (.24) | | (.05) | | (.12) | | (.15) | | (.07) |
| Distributions from net realized gain | | (.78) | | (1.15) | | (.85) | | (.78) | | (1.11) | | (.65) |
| Total distributions | | (.78) | | (1.39) | | (.90) | | (.90) | | (1.26) | | (.72) |
| Net asset value, end of period | $ | 11.03 | $ | 14.32 | $ | 15.60 | $ | 11.95 | $ | 13.75 | $ | 14.71 |
Total Return D,E,F | | (18.11)% | | .30% | | 39.41% | | (7.25)% | | 2.57% | | 10.97% |
Ratios to Average Net Assets B,G,H | | | | | | | | | | | | |
| Expenses before reductions | | 1.66% I | | 1.67% | | 1.68% | | 1.69% | | 1.69% J | | 1.59% |
| Expenses net of fee waivers, if any | | 1.66% I | | 1.67% | | 1.68% | | 1.69% | | 1.69% J | | 1.59% |
| Expenses net of all reductions | | 1.66% I | | 1.67% | | 1.68% | | 1.69% | | 1.69% J | | 1.59% |
| Net investment income (loss) | | .90% I | | 1.24% | | -% | | .60% | | .82% | | .24% |
| Supplemental Data | | | | | | | | | | | | |
| Net assets, end of period (000 omitted) | $ | 46,738 | $ | 58,820 | $ | 69,899 | $ | 55,554 | $ | 66,505 | $ | 96,199 |
Portfolio turnover rate K | | 23% I | | 31% | | 29% | | 33% | | 22% | | 25% |
A Calculated based on average shares outstanding during the period.
B Net investment income (loss) is affected by the timing of the declaration of dividends by any underlying mutual funds or exchange-traded funds (ETFs). Net investment income (loss) of any such underlying funds is not included in the Fund's net investment income (loss) ratio.
C Amount represents less than $.005 per share.
D Total returns for periods of less than one year are not annualized.
E Total returns would have been lower if certain expenses had not been reduced during the applicable periods shown.
F Total returns do not include the effect of the contingent deferred sales charge.
G Fees and expenses of any underlying mutual funds or exchange-traded funds (ETFs) are not included in the Fund's expense ratio. The Fund indirectly bears its proportionate share of these expenses. For additional expense information related to investments in Fidelity Central Funds, please refer to the "Investments in Fidelity Central Funds" note found in the Notes to Financial Statements section of the most recent Annual or Semi-Annual report.
H Expense ratios reflect operating expenses of the class. Expenses before reductions do not reflect amounts reimbursed, waived, or reduced through arrangements with the investment adviser, brokerage services, or other offset arrangements, if applicable, and do not represent the amount paid by the class during periods when reimbursements, waivers or reductions occur.
I Annualized
J On certain classes, the size and fluctuation of net assets and expense amounts may cause ratios to differ from contractual rates.
K Amount does not include the portfolio activity of any underlying mutual funds or exchange-traded funds (ETFs).
| Fidelity Advisor Freedom® 2030 Fund Class I |
| |
| | Six months ended (Unaudited) September 30, 2022 | | Years ended March 31, 2022 | | 2021 | | 2020 | | 2019 | | 2018 |
Selected Per-Share Data | | | | | | | | | | | | |
| Net asset value, beginning of period | $ | 14.87 | $ | 16.10 | $ | 12.29 | $ | 14.09 | $ | 15.04 | $ | 14.21 |
| Income from Investment Operations | | | | | | | | | | | | |
Net investment income (loss) A,B | | .12 | | .36 | | .15 | | .23 | | .26 | | .18 |
| Net realized and unrealized gain (loss) | | (2.68) | | (.08) | | 4.69 | | (1.01) | | .19 | | 1.51 |
| Total from investment operations | | (2.56) | | .28 | | 4.84 | | (.78) | | .45 | | 1.69 |
| Distributions from net investment income | | - | | (.36) | | (.15) | | (.22) | | (.27) | | (.21) |
| Distributions from net realized gain | | (.80) | | (1.15) | | (.88) | | (.80) | | (1.14) | | (.66) |
| Total distributions | | (.80) | | (1.51) | | (1.03) | | (1.02) | | (1.40) C | | (.86) C |
| Net asset value, end of period | $ | 11.51 | $ | 14.87 | $ | 16.10 | $ | 12.29 | $ | 14.09 | $ | 15.04 |
Total Return D,E | | (17.75)% | | 1.37% | | 40.77% | | (6.32)% | | 3.65% | | 12.04% |
Ratios to Average Net Assets B,F,G | | | | | | | | | | | | |
| Expenses before reductions | | .66% H | | .67% | | .68% | | .69% | | .69% I | | .60% |
| Expenses net of fee waivers, if any | | .66% H | | .67% | | .68% | | .69% | | .69% I | | .60% |
| Expenses net of all reductions | | .66% H | | .67% | | .68% | | .69% | | .69% I | | .60% |
| Net investment income (loss) | | 1.90% H | | 2.24% | | 1.00% | | 1.60% | | 1.82% | | 1.23% |
| Supplemental Data | | | | | | | | | | | | |
| Net assets, end of period (000 omitted) | $ | 937,630 | $ | 1,242,060 | $ | 1,325,192 | $ | 984,341 | $ | 1,108,684 | $ | 1,043,420 |
Portfolio turnover rate J | | 23% H | | 31% | | 29% | | 33% | | 22% | | 25% |
A Calculated based on average shares outstanding during the period.
B Net investment income (loss) is affected by the timing of the declaration of dividends by any underlying mutual funds or exchange-traded funds (ETFs). Net investment income (loss) of any such underlying funds is not included in the Fund's net investment income (loss) ratio.
C Total distributions per share do not sum due to rounding.
D Total returns for periods of less than one year are not annualized.
E Total returns would have been lower if certain expenses had not been reduced during the applicable periods shown.
F Fees and expenses of any underlying mutual funds or exchange-traded funds (ETFs) are not included in the Fund's expense ratio. The Fund indirectly bears its proportionate share of these expenses. For additional expense information related to investments in Fidelity Central Funds, please refer to the "Investments in Fidelity Central Funds" note found in the Notes to Financial Statements section of the most recent Annual or Semi-Annual report.
G Expense ratios reflect operating expenses of the class. Expenses before reductions do not reflect amounts reimbursed, waived, or reduced through arrangements with the investment adviser, brokerage services, or other offset arrangements, if applicable, and do not represent the amount paid by the class during periods when reimbursements, waivers or reductions occur.
H Annualized
I On certain classes, the size and fluctuation of net assets and expense amounts may cause ratios to differ from contractual rates.
J Amount does not include the portfolio activity of any underlying mutual funds or exchange-traded funds (ETFs).
| Fidelity Advisor Freedom® 2030 Fund Class Z |
| |
| | Six months ended (Unaudited) September 30, 2022 | | Years ended March 31, 2022 | | 2021 | | 2020 | | 2019 A |
Selected Per-Share Data | | | | | | | | | | |
| Net asset value, beginning of period | $ | 14.73 | $ | 15.98 | $ | 12.20 | $ | 14.03 | $ | 14.99 |
| Income from Investment Operations | | | | | | | | | | |
Net investment income (loss) B,C | | .13 | | .37 | | .16 | | .24 | | .04 |
| Net realized and unrealized gain (loss) | | (2.65) | | (.09) | | 4.67 | | (1.01) | | (.15) |
| Total from investment operations | | (2.52) | | .28 | | 4.83 | | (.77) | | (.11) |
| Distributions from net investment income | | - | | (.38) | | (.17) | | (.25) | | (.33) |
| Distributions from net realized gain | | (.81) | | (1.15) | | (.88) | | (.82) | | (.53) |
| Total distributions | | (.81) | | (1.53) | | (1.05) | | (1.06) D | | (.85) D |
| Net asset value, end of period | $ | 11.40 | $ | 14.73 | $ | 15.98 | $ | 12.20 | $ | 14.03 |
Total Return E,F | | (17.67)% | | 1.37% | | 41.01% | | (6.28)% | | (.09)% |
Ratios to Average Net Assets C,G,H | | | | | | | | | | |
| Expenses before reductions | | .57% I | | .58% | | .59% | | .60% J | | .60% I |
| Expenses net of fee waivers, if any | | .57% I | | .58% | | .59% | | .60% J | | .60% I |
| Expenses net of all reductions | | .57% I | | .58% | | .59% | | .60% J | | .60% I |
| Net investment income (loss) | | 1.99% I | | 2.33% | | 1.09% | | 1.69% | | .65% I |
| Supplemental Data | | | | | | | | | | |
| Net assets, end of period (000 omitted) | $ | 117,488 | $ | 102,337 | $ | 63,499 | $ | 38,041 | $ | 2,948 |
Portfolio turnover rate K | | 23% I | | 31% | | 29% | | 33% | | 22% |
A For the period October 2, 2018 (commencement of sale of shares) through March 31, 2019.
B Calculated based on average shares outstanding during the period.
C Net investment income (loss) is affected by the timing of the declaration of dividends by any underlying mutual funds or exchange-traded funds (ETFs). Net investment income (loss) of any such underlying funds is not included in the Fund's net investment income (loss) ratio.
D Total distributions per share do not sum due to rounding.
E Total returns for periods of less than one year are not annualized.
F Total returns would have been lower if certain expenses had not been reduced during the applicable periods shown.
G Fees and expenses of any underlying mutual funds or exchange-traded funds (ETFs) are not included in the Fund's expense ratio. The Fund indirectly bears its proportionate share of these expenses. For additional expense information related to investments in Fidelity Central Funds, please refer to the "Investments in Fidelity Central Funds" note found in the Notes to Financial Statements section of the most recent Annual or Semi-Annual report.
H Expense ratios reflect operating expenses of the class. Expenses before reductions do not reflect amounts reimbursed, waived, or reduced through arrangements with the investment adviser, brokerage services, or other offset arrangements, if applicable, and do not represent the amount paid by the class during periods when reimbursements, waivers or reductions occur.
I Annualized
J On certain classes, the size and fluctuation of net assets and expense amounts may cause ratios to differ from contractual rates.
K Amount does not include the portfolio activity of any underlying mutual funds or exchange-traded funds (ETFs).
| Fidelity Advisor Freedom® 2030 Fund Class Z6 |
| |
| | Six months ended (Unaudited) September 30, 2022 | | Years ended March 31, 2022 | | 2021 | | 2020 | | 2019 | | 2018 A |
Selected Per-Share Data | | | | | | | | | | | | |
| Net asset value, beginning of period | $ | 14.80 | $ | 16.03 | $ | 12.24 | $ | 14.05 | $ | 15.03 | $ | 14.53 |
| Income from Investment Operations | | | | | | | | | | | | |
Net investment income (loss) B,C | | .14 | | .39 | | .18 | | .26 | | .29 | | .16 |
| Net realized and unrealized gain (loss) | | (2.67) | | (.08) | | 4.68 | | (1.01) | | .19 | | .99 |
| Total from investment operations | | (2.53) | | .31 | | 4.86 | | (.75) | | .48 | | 1.15 |
| Distributions from net investment income | | - | | (.39) | | (.19) | | (.25) | | (.30) | | (.23) |
| Distributions from net realized gain | | (.81) | | (1.15) | | (.88) | | (.81) | | (1.15) | | (.42) |
| Total distributions | | (.81) | | (1.54) | | (1.07) | | (1.06) | | (1.46) D | | (.65) |
| Net asset value, end of period | $ | 11.46 | $ | 14.80 | $ | 16.03 | $ | 12.24 | $ | 14.05 | $ | 15.03 |
Total Return E,F | | (17.64)% | | 1.56% | | 41.14% | | (6.16)% | | 3.84% | | 7.90% |
Ratios to Average Net Assets C,G,H | | | | | | | | | | | | |
| Expenses before reductions | | .45% I | | .46% | | .46% | | .47% | | .47% | | .49% I,J |
| Expenses net of fee waivers, if any | | .45% I | | .46% | | .46% | | .47% | | .47% | | .49% I,J |
| Expenses net of all reductions | | .45% I | | .46% | | .46% | | .47% | | .47% | | .49% I,J |
| Net investment income (loss) | | 2.11% I | | 2.45% | | 1.22% | | 1.82% | | 2.05% | | 1.29% I |
| Supplemental Data | | | | | | | | | | | | |
| Net assets, end of period (000 omitted) | $ | 218,877 | $ | 226,612 | $ | 174,248 | $ | 83,686 | $ | 60,480 | $ | 26,854 |
Portfolio turnover rate K | | 23% I | | 31% | | 29% | | 33% | | 22% | | 25% |
A For the period June 6, 2017 (commencement of sale of shares) through March 31, 2018.
B Calculated based on average shares outstanding during the period.
C Net investment income (loss) is affected by the timing of the declaration of dividends by any underlying mutual funds or exchange-traded funds (ETFs). Net investment income (loss) of any such underlying funds is not included in the Fund's net investment income (loss) ratio.
D Total distributions per share do not sum due to rounding.
E Total returns for periods of less than one year are not annualized.
F Total returns would have been lower if certain expenses had not been reduced during the applicable periods shown.
G Fees and expenses of any underlying mutual funds or exchange-traded funds (ETFs) are not included in the Fund's expense ratio. The Fund indirectly bears its proportionate share of these expenses. For additional expense information related to investments in Fidelity Central Funds, please refer to the "Investments in Fidelity Central Funds" note found in the Notes to Financial Statements section of the most recent Annual or Semi-Annual report.
H Expense ratios reflect operating expenses of the class. Expenses before reductions do not reflect amounts reimbursed, waived, or reduced through arrangements with the investment adviser, brokerage services, or other offset arrangements, if applicable, and do not represent the amount paid by the class during periods when reimbursements, waivers or reductions occur.
I Annualized
J On certain classes, the size and fluctuation of net assets and expense amounts may cause ratios to differ from contractual rates.
K Amount does not include the portfolio activity of any underlying mutual funds or exchange-traded funds (ETFs).
The information in the following table is based on the direct Investments of the Fund.
Top Holdings (% of Fund's net assets) |
| |
| Fidelity Series Investment Grade Bond Fund | 12.1 | |
| Fidelity Series Emerging Markets Opportunities Fund | 11.6 | |
| Fidelity Series Large Cap Stock Fund | 8.0 | |
| Fidelity Series Overseas Fund | 6.3 | |
| Fidelity Series International Value Fund | 6.3 | |
| Fidelity Series International Growth Fund | 6.3 | |
| Fidelity Series Long-Term Treasury Bond Index Fund | 5.7 | |
| Fidelity Series Value Discovery Fund | 5.2 | |
| Fidelity Advisor Series Equity Growth Fund | 5.2 | |
| Fidelity Series Stock Selector Large Cap Value Fund | 5.1 | |
| | 71.8 | |
| |
Domestic Equity Funds category includes Fidelity Series Commodity Strategy Fund which invests in commodity-related investments.
Asset Allocation (% of Fund's net assets) |
|
Percentages shown as 0.0% may reflect amounts less than 0.05%. |
|
Fidelity Advisor Freedom® 2035 Fund
Showing Percentage of Net Assets
| U.S. Treasury Obligations - 0.1% |
| | | Principal Amount (a) | Value ($) |
U.S. Treasury Bills, yield at date of purchase 2.13% to 3.29% 10/13/22 to 12/29/22 (b) (Cost $1,402,678) | | 1,410,000 | 1,402,976 |
| | | | |
| Domestic Equity Funds - 41.2% |
| | | Shares | Value ($) |
| Fidelity Advisor Series Equity Growth Fund (c) | | 10,108,270 | 122,815,482 |
| Fidelity Advisor Series Growth Opportunities Fund (c) | | 9,880,525 | 86,652,201 |
| Fidelity Advisor Series Small Cap Fund (c) | | 5,119,127 | 53,597,262 |
| Fidelity Series All-Sector Equity Fund (c) | | 5,693,112 | 48,846,901 |
| Fidelity Series Commodity Strategy Fund (c) | | 13,163,807 | 27,512,356 |
| Fidelity Series Large Cap Stock Fund (c) | | 12,671,965 | 187,164,926 |
| Fidelity Series Large Cap Value Index Fund (c) | | 1,610,960 | 20,491,410 |
| Fidelity Series Opportunistic Insights Fund (c) | | 7,862,277 | 111,722,954 |
| Fidelity Series Small Cap Opportunities Fund (c) | | 5,966,523 | 64,319,122 |
| Fidelity Series Stock Selector Large Cap Value Fund (c) | | 10,657,450 | 119,043,715 |
| Fidelity Series Value Discovery Fund (c) | | 8,923,571 | 122,877,574 |
| TOTAL DOMESTIC EQUITY FUNDS (Cost $911,991,930) | | | 965,043,903 |
| | | | |
| International Equity Funds - 36.1% |
| | | Shares | Value ($) |
| Fidelity Series Canada Fund (c) | | 5,175,240 | 64,172,976 |
| Fidelity Series Emerging Markets Fund (c) | | 4,085,855 | 29,581,590 |
| Fidelity Series Emerging Markets Opportunities Fund (c) | | 18,688,360 | 271,354,993 |
| Fidelity Series International Growth Fund (c) | | 11,439,447 | 146,653,709 |
| Fidelity Series International Small Cap Fund (c) | | 2,807,529 | 38,406,997 |
| Fidelity Series International Value Fund (c) | | 17,164,816 | 147,445,772 |
| Fidelity Series Overseas Fund (c) | | 15,536,979 | 148,067,406 |
| TOTAL INTERNATIONAL EQUITY FUNDS (Cost $893,644,205) | | | 845,683,443 |
| | | | |
| Bond Funds - 22.1% |
| | | Shares | Value ($) |
| Fidelity Series 5+ Year Inflation-Protected Bond Index Fund (c) | | 287,156 | 2,294,376 |
| Fidelity Series Emerging Markets Debt Fund (c) | | 1,795,276 | 12,315,591 |
| Fidelity Series Emerging Markets Debt Local Currency Fund (c) | | 508,272 | 4,050,925 |
| Fidelity Series Floating Rate High Income Fund (c) | | 273,512 | 2,379,553 |
| Fidelity Series High Income Fund (c) | | 1,613,923 | 12,717,712 |
| Fidelity Series International Credit Fund (c) | | 147,597 | 1,161,589 |
| Fidelity Series International Developed Markets Bond Index Fund (c) | | 6,828,481 | 58,178,661 |
| Fidelity Series Investment Grade Bond Fund (c) | | 29,119,309 | 284,204,457 |
| Fidelity Series Long-Term Treasury Bond Index Fund (c) | | 22,367,376 | 133,533,237 |
| Fidelity Series Real Estate Income Fund (c) | | 634,068 | 6,036,331 |
| TOTAL BOND FUNDS (Cost $629,699,122) | | | 516,872,432 |
| | | | |
| Short-Term Funds - 0.5% |
| | | Shares | Value ($) |
| Fidelity Cash Central Fund 3.10% (d) | | 675,797 | 675,932 |
| Fidelity Series Government Money Market Fund 3.00% (c)(e) | | 11,810,061 | 11,810,061 |
| Fidelity Series Short-Term Credit Fund (c) | | 1 | 9 |
| TOTAL SHORT-TERM FUNDS (Cost $12,486,002) | | | 12,486,002 |
| | | | |
| TOTAL INVESTMENT IN SECURITIES - 100.0% (Cost $2,449,223,937) | 2,341,488,756 |
NET OTHER ASSETS (LIABILITIES) - 0.0% | (518,817) |
| NET ASSETS - 100.0% | 2,340,969,939 |
| | |
| Futures Contracts |
| | Number of contracts | Expiration Date | Notional Amount ($) | Value ($) | Unrealized Appreciation/ (Depreciation) ($) |
| Purchased | | | | | |
| | | | | | |
| Treasury Contracts | | | | | |
| CBOT 10-Year U.S. Treasury Note Contracts (United States) | 382 | Dec 2022 | 42,807,875 | (2,611,026) | (2,611,026) |
| CBOT Ultra Long Term U.S. Treasury Bond Contracts (United States) | 36 | Dec 2022 | 4,932,000 | (59,946) | (59,946) |
| | | | | | |
| TOTAL PURCHASED | | | | | (2,670,972) |
| | | | | | |
| Sold | | | | | |
| | | | | | |
| Equity Index Contracts | | | | | |
| CME E-mini S&P 500 Index Contracts (United States) | 64 | Dec 2022 | 11,524,800 | 34,177 | 34,177 |
| ICE E-mini MSCI EAFE Index Contracts (United States) | 105 | Dec 2022 | 8,718,150 | 1,182,279 | 1,182,279 |
| ICE E-mini MSCI Emerging Markets Index Contracts (United States) | 67 | Dec 2022 | 2,919,525 | 7,873 | 7,873 |
| | | | | | |
| TOTAL SOLD | | | | | 1,224,329 |
| | | | | | |
| TOTAL FUTURES CONTRACTS | | | | | (1,446,643) |
| The notional amount of futures purchased as a percentage of Net Assets is 2.0% |
| The notional amount of futures sold as a percentage of Net Assets is 1.0% |
Legend
| (a) | Amount is stated in United States dollars unless otherwise noted. |
| (b) | Security or a portion of the security was pledged to cover margin requirements for futures contracts. At period end, the value of securities pledged amounted to $1,402,976. |
| (d) | Affiliated fund that is generally available only to investment companies and other accounts managed by Fidelity Investments. The rate quoted is the annualized seven-day yield of the fund at period end. A complete unaudited listing of the fund's holdings as of its most recent quarter end is available upon request. In addition, each Fidelity Central Fund's financial statements are available on the SEC's website or upon request. |
| (e) | The rate quoted is the annualized seven-day yield of the fund at period end. |
Affiliated Central Funds
Fiscal year to date information regarding the Fund's investments in Fidelity Central Funds, including the ownership percentage, is presented below.
| Affiliate | Value, beginning of period ($) | Purchases ($) | Sales Proceeds ($) | Dividend Income ($) | Realized Gain (loss) ($) | Change in Unrealized appreciation (depreciation) ($) | Value, end of period ($) | %ownership, end of period |
| Fidelity Cash Central Fund 3.10% | 2,329,769 | 12,497,358 | 14,151,196 | 14,560 | 47 | (46) | 675,932 | 0.0% |
| Total | 2,329,769 | 12,497,358 | 14,151,196 | 14,560 | 47 | (46) | 675,932 | |
| | | | | | | | | |
Amounts in the income column in the above table include any capital gain distributions from underlying funds, which are presented in the corresponding line item in the Statement of Operations, if applicable.
Affiliated Underlying Funds
Fiscal year to date information regarding the Fund's investments in affiliated Underlying Funds is presented below. Exchanges between classes of the same affiliated Underlying Funds may occur. If an Underlying Funds changes its name, the name presented below is the name in effect at period end.
| Affiliate | Value, beginning of period ($) | Purchases ($) | Sales Proceeds ($) | Dividend Income ($) | Realized Gain (loss) ($) | Change in Unrealized appreciation (depreciation) ($) | Value, end of period ($) |
| Fidelity Advisor Series Equity Growth Fund | 154,955,626 | 11,034,504 | 10,073,513 | - | (1,353,703) | (31,747,432) | 122,815,482 |
| Fidelity Advisor Series Growth Opportunities Fund | 106,276,427 | 20,029,377 | 8,491,909 | - | (1,802,483) | (29,359,211) | 86,652,201 |
| Fidelity Advisor Series Small Cap Fund | 70,335,305 | 3,064,187 | 6,704,152 | - | (1,046,126) | (12,051,952) | 53,597,262 |
| Fidelity Series 5+ Year Inflation-Protected Bond Index Fund | 2,943,906 | 57,211 | 231,962 | - | (20,054) | (454,725) | 2,294,376 |
| Fidelity Series All-Sector Equity Fund | 66,465,075 | 1,239,541 | 5,653,820 | - | (1,133,812) | (12,070,083) | 48,846,901 |
| Fidelity Series Canada Fund | 82,926,364 | 4,131,721 | 6,474,784 | - | (187,972) | (16,222,353) | 64,172,976 |
| Fidelity Series Commodity Strategy Fund | 44,072,423 | 23,555,375 | 16,221,548 | 20,378,803 | (4,580,436) | (19,313,458) | 27,512,356 |
| Fidelity Series Emerging Markets Debt Fund | 14,487,192 | 1,073,418 | 773,529 | 371,181 | (92,604) | (2,378,886) | 12,315,591 |
| Fidelity Series Emerging Markets Debt Local Currency Fund | 4,911,448 | 119,838 | 419,734 | - | (65,652) | (494,975) | 4,050,925 |
| Fidelity Series Emerging Markets Fund | 37,314,196 | 2,130,742 | 1,576,517 | - | (267,865) | (8,018,966) | 29,581,590 |
| Fidelity Series Emerging Markets Opportunities Fund | 336,289,152 | 21,603,079 | 15,302,961 | - | (2,913,519) | (68,320,758) | 271,354,993 |
| Fidelity Series Floating Rate High Income Fund | 2,968,808 | 129,087 | 568,985 | 71,875 | (59,998) | (89,359) | 2,379,553 |
| Fidelity Series Government Money Market Fund 3.00% | - | 11,810,061 | - | 513 | - | - | 11,810,061 |
| Fidelity Series High Income Fund | 17,837,167 | 730,566 | 3,666,232 | 417,720 | (444,051) | (1,739,738) | 12,717,712 |
| Fidelity Series International Credit Fund | 1,347,087 | 18,393 | - | 18,392 | - | (203,891) | 1,161,589 |
| Fidelity Series International Developed Markets Bond Index Fund | 49,445,166 | 16,487,397 | 2,690,939 | 83,578 | (178,686) | (4,884,277) | 58,178,661 |
| Fidelity Series International Growth Fund | 189,699,394 | 12,600,936 | 12,597,074 | - | (1,760,821) | (41,288,726) | 146,653,709 |
| Fidelity Series International Small Cap Fund | 52,175,215 | 995,087 | 2,486,711 | - | (696,166) | (11,580,428) | 38,406,997 |
| Fidelity Series International Value Fund | 191,587,475 | 12,467,529 | 15,058,286 | - | (773,641) | (40,777,305) | 147,445,772 |
| Fidelity Series Investment Grade Bond Fund | 349,692,135 | 29,933,193 | 60,085,129 | 4,459,058 | (4,617,086) | (30,718,656) | 284,204,457 |
| Fidelity Series Large Cap Stock Fund | 243,838,851 | 21,210,642 | 24,580,687 | 11,375,813 | 2,027,769 | (55,331,649) | 187,164,926 |
| Fidelity Series Large Cap Value Index Fund | 26,373,112 | 564,355 | 2,059,823 | - | 435,274 | (4,821,508) | 20,491,410 |
| Fidelity Series Long-Term Treasury Bond Index Fund | 157,411,797 | 24,520,154 | 12,682,076 | 1,896,235 | (2,150,634) | (33,566,004) | 133,533,237 |
| Fidelity Series Opportunistic Insights Fund | 143,210,611 | 11,716,762 | 11,116,161 | - | (2,826,842) | (29,261,416) | 111,722,954 |
| Fidelity Series Overseas Fund | 190,746,630 | 11,851,408 | 7,141,850 | - | (836,217) | (46,552,565) | 148,067,406 |
| Fidelity Series Real Estate Income Fund | 10,601,801 | 633,288 | 3,764,554 | 483,242 | (172,607) | (1,261,597) | 6,036,331 |
| Fidelity Series Short-Term Credit Fund | - | 9 | - | - | - | - | 9 |
| Fidelity Series Small Cap Opportunities Fund | 86,839,117 | 4,621,441 | 9,658,435 | 3,009,879 | (1,219,424) | (16,263,577) | 64,319,122 |
| Fidelity Series Stock Selector Large Cap Value Fund | 155,630,044 | 5,886,775 | 16,562,446 | - | 98,109 | (26,008,767) | 119,043,715 |
| Fidelity Series Value Discovery Fund | 158,522,424 | 5,094,668 | 19,832,883 | - | 2,660,632 | (23,567,267) | 122,877,574 |
| | 2,948,903,948 | 259,310,744 | 276,476,700 | 42,566,289 | (23,978,615) | (568,349,529) | 2,339,409,848 |
Amounts in the income column in the above table include any capital gain distributions from underlying funds, which are presented in the corresponding line item in the Statement of Operations, if applicable.
Investment Valuation
The following is a summary of the inputs used, as of September 30, 2022, involving the Fund's assets and liabilities carried at fair value. The inputs or methodology used for valuing securities may not be an indication of the risk associated with investing in those securities. For more information on valuation inputs, and their aggregation into the levels used below, please refer to the Investment Valuation section in the accompanying Notes to Financial Statements.
| Valuation Inputs at Reporting Date: |
| Description | Total ($) | Level 1 ($) | Level 2 ($) | Level 3 ($) |
Investments in Securities: | | | | |
|
| Other Short-Term Investments | 1,402,976 | - | 1,402,976 | - |
|
| Domestic Equity Funds | 965,043,903 | 965,043,903 | - | - |
|
| International Equity Funds | 845,683,443 | 845,683,443 | - | - |
|
| Bond Funds | 516,872,432 | 516,872,432 | - | - |
|
| Short-Term Funds | 12,486,002 | 12,486,002 | - | - |
| Total Investments in Securities: | 2,341,488,756 | 2,340,085,780 | 1,402,976 | - |
Derivative Instruments: | | | | |
|
| Assets | | | | |
Futures Contracts | 1,224,329 | 1,224,329 | - | - |
| Total Assets | 1,224,329 | 1,224,329 | - | - |
|
| Liabilities | | | | |
Futures Contracts | (2,670,972) | (2,670,972) | - | - |
| Total Liabilities | (2,670,972) | (2,670,972) | - | - |
| Total Derivative Instruments: | (1,446,643) | (1,446,643) | - | - |
Value of Derivative Instruments
The following table is a summary of the Fund's value of derivative instruments by primary risk exposure as of September 30, 2022. For additional information on derivative instruments, please refer to the Derivative Instruments section in the accompanying Notes to Financial Statements.
Primary Risk Exposure / Derivative Type | Value |
| Asset ($) | Liability ($) |
| Equity Risk | | |
Futures Contracts (a) | 1,224,329 | 0 |
| Total Equity Risk | 1,224,329 | 0 |
| Interest Rate Risk | | |
Futures Contracts (a) | 0 | (2,670,972) |
| Total Interest Rate Risk | 0 | (2,670,972) |
| Total Value of Derivatives | 1,224,329 | (2,670,972) |
(a)Reflects gross cumulative appreciation (depreciation) on futures contracts as presented in the Schedule of Investments. In the Statement of Assets and Liabilities, the period end daily variation margin is included in receivable or payable for daily variation margin on futures contracts, and the net cumulative appreciation (depreciation) is included in Total accumulated earnings (loss).
Fidelity Advisor Freedom® 2035 Fund
| Statement of Assets and Liabilities |
| | | | September 30, 2022 (Unaudited) |
| | | | | |
| Assets | | | | |
| Investment in securities, at value - See accompanying schedule: | $ | | | |
Unaffiliated issuers (cost $1,402,678) | | $1,402,976 | | |
Fidelity Central Funds (cost $675,932) | | 675,932 | | |
Other affiliated issuers (cost $2,447,145,327) | | 2,339,409,848 | | |
| | | | | |
| Total Investment in Securities (cost $2,449,223,937) | | | $ | 2,341,488,756 |
| Receivable for investments sold | | | | 20,111,363 |
| Receivable for fund shares sold | | | | 2,202,779 |
| Distributions receivable from Fidelity Central Funds | | | | 1,951 |
| Receivable for daily variation margin on futures contracts | | | | 11,398 |
Total assets | | | | 2,363,816,247 |
| Liabilities | | | | |
| Payable for investments purchased | | 14,963,202 | | |
| Payable for fund shares redeemed | | 6,002,618 | | |
| Accrued management fee | | 1,405,966 | | |
| Distribution and service plan fees payable | | 360,332 | | |
| Payable for daily variation margin on futures contracts | | 114,190 | | |
| Total Liabilities | | | | 22,846,308 |
| Net Assets | | | $ | 2,340,969,939 |
| Net Assets consist of: | | | | |
| Paid in capital | | | $ | 2,458,521,159 |
| Total accumulated earnings (loss) | | | | (117,551,220) |
| Net Assets | | | $ | 2,340,969,939 |
| | | | | |
| Net Asset Value and Maximum Offering Price | | | | |
| Class A : | | | | |
Net Asset Value and redemption price per share ($833,793,635 ÷ 74,467,850 shares) (a) | | | $ | 11.20 |
| Maximum offering price per share (100/94.25 of $11.20) | | | $ | 11.88 |
| Class M : | | | | |
Net Asset Value and redemption price per share ($325,405,783 ÷ 29,583,970 shares) (a) | | | $ | 11.00 |
| Maximum offering price per share (100/96.50 of $11.00) | | | $ | 11.40 |
| Class C : | | | | |
Net Asset Value and offering price per share ($34,924,408 ÷ 3,281,721 shares) (a) | | | $ | 10.64 |
| Class I : | | | | |
Net Asset Value , offering price and redemption price per share ($832,931,017 ÷ 73,460,717 shares) | | | $ | 11.34 |
| Class Z : | | | | |
Net Asset Value , offering price and redemption price per share ($103,587,867 ÷ 9,230,331 shares) | | | $ | 11.22 |
| Class Z6 : | | | | |
Net Asset Value , offering price and redemption price per share ($210,327,229 ÷ 18,582,063 shares) | | | $ | 11.32 |
(a)Redemption price per share is equal to net asset value less any applicable contingent deferred sales charge. |
| Statement of Operations |
| | | | Six months ended September 30, 2022 (Unaudited) |
| Investment Income | | | | |
| Dividends: | | | | |
| Affiliated issuers | | | $ | 30,373,058 |
| Interest | | | | 11,661 |
| Income from Fidelity Central Funds | | | | 14,560 |
| Total Income | | | | 30,399,279 |
| Expenses | | | | |
| Management fee | $ | 8,996,226 | | |
| Distribution and service plan fees | | 2,310,239 | | |
| Independent trustees' fees and expenses | | 4,598 | | |
| Total expenses before reductions | | 11,311,063 | | |
| Expense reductions | | (16) | | |
| Total expenses after reductions | | | | 11,311,047 |
| Net Investment income (loss) | | | | 19,088,232 |
| Realized and Unrealized Gain (Loss) | | | | |
| Net realized gain (loss) on: | | | | |
| Investment Securities: | | | | |
| Unaffiliated issuers | | 1,003 | | |
| Fidelity Central Funds | | 47 | | |
| Other affiliated issuers | | (23,978,615) | | |
| Futures contracts | | (1,558,563) | | |
| Capital gain distributions from underlying funds: | | | | |
| Affiliated issuers | | 12,193,231 | | |
| Total net realized gain (loss) | | | | (13,342,897) |
| Change in net unrealized appreciation (depreciation) on: | | | | |
| Investment Securities: | | | | |
| Unaffiliated issuers | | 259 | | |
| Fidelity Central Funds | | (46) | | |
| Other affiliated issuers | | (568,349,529) | | |
| Futures contracts | | (1,794,924) | | |
| Total change in net unrealized appreciation (depreciation) | | | | (570,144,240) |
| Net gain (loss) | | | | (583,487,137) |
| Net increase (decrease) in net assets resulting from operations | | | $ | (564,398,905) |
| Statement of Changes in Net Assets |
| |
| | Six months ended September 30, 2022 (Unaudited) | | Year ended March 31, 2022 |
| Increase (Decrease) in Net Assets | | | | |
| Operations | | | | |
| Net investment income (loss) | $ | 19,088,232 | $ | 60,918,099 |
| Net realized gain (loss) | | (13,342,897) | | 271,127,302 |
| Change in net unrealized appreciation (depreciation) | | (570,144,240) | | (265,711,633) |
| Net increase (decrease) in net assets resulting from operations | | (564,398,905) | | 66,333,768 |
| Distributions to shareholders | | (183,581,813) | | (284,614,476) |
| Share transactions - net increase (decrease) | | 137,301,732 | | 195,925,285 |
| Total increase (decrease) in net assets | | (610,678,986) | | (22,355,423) |
| | | | | |
| Net Assets | | | | |
| Beginning of period | | 2,951,648,925 | | 2,974,004,348 |
| End of period | $ | 2,340,969,939 | $ | 2,951,648,925 |
| | | | | |
| | | | | |
Financial Highlights
| Fidelity Advisor Freedom® 2035 Fund Class A |
| |
| | Six months ended (Unaudited) September 30, 2022 | | Years ended March 31, 2022 | | 2021 | | 2020 | | 2019 | | 2018 |
Selected Per-Share Data | | | | | | | | | | | | |
| Net asset value, beginning of period | $ | 14.90 | $ | 16.02 | $ | 11.46 | $ | 13.58 | $ | 14.65 | $ | 13.61 |
| Income from Investment Operations | | | | | | | | | | | | |
Net investment income (loss) A,B | | .09 | | .30 | | .10 | | .17 | | .20 | | .12 |
| Net realized and unrealized gain (loss) | | (2.86) | | .07 | | 5.39 | | (1.28) | | .16 | | 1.67 |
| Total from investment operations | | (2.77) | | .37 | | 5.49 | | (1.11) | | .36 | | 1.79 |
| Distributions from net investment income | | - | | (.30) | | (.12) | | (.17) | | (.22) | | (.14) |
| Distributions from net realized gain | | (.93) | | (1.20) | | (.81) | | (.85) | | (1.22) | | (.61) |
| Total distributions | | (.93) | | (1.49) | | (.93) | | (1.01) | | (1.43) | | (.75) |
| Net asset value, end of period | $ | 11.20 | $ | 14.90 | $ | 16.02 | $ | 11.46 | $ | 13.58 | $ | 14.65 |
Total Return C,D,E | | (19.25)% | | 1.95% | | 49.73% | | (9.15)% | | 3.19% | | 13.26% |
Ratios to Average Net Assets B,F,G | | | | | | | | | | | | |
| Expenses before reductions | | .95% H | | .96% | | .97% | | .98% | | .99% | | .87% |
| Expenses net of fee waivers, if any | | .95% H | | .96% | | .97% | | .98% | | .99% | | .87% |
| Expenses net of all reductions | | .95% H | | .96% | | .97% | | .98% | | .99% | | .87% |
| Net investment income (loss) | | 1.35% H | | 1.87% | | .69% | | 1.23% | | 1.40% | | .80% |
| Supplemental Data | | | | | | | | | | | | |
| Net assets, end of period (000 omitted) | $ | 833,794 | $ | 1,068,426 | $ | 1,122,730 | $ | 824,792 | $ | 1,026,416 | $ | 1,082,982 |
Portfolio turnover rate I | | 20% H | | 27% | | 27% | | 33% | | 23% | | 23% |
A Calculated based on average shares outstanding during the period.
B Net investment income (loss) is affected by the timing of the declaration of dividends by any underlying mutual funds or exchange-traded funds (ETFs). Net investment income (loss) of any such underlying funds is not included in the Fund's net investment income (loss) ratio.
C Total returns for periods of less than one year are not annualized.
D Total returns would have been lower if certain expenses had not been reduced during the applicable periods shown.
E Total returns do not include the effect of the sales charges.
F Fees and expenses of any underlying mutual funds or exchange-traded funds (ETFs) are not included in the Fund's expense ratio. The Fund indirectly bears its proportionate share of these expenses. For additional expense information related to investments in Fidelity Central Funds, please refer to the "Investments in Fidelity Central Funds" note found in the Notes to Financial Statements section of the most recent Annual or Semi-Annual report.
G Expense ratios reflect operating expenses of the class. Expenses before reductions do not reflect amounts reimbursed, waived, or reduced through arrangements with the investment adviser, brokerage services, or other offset arrangements, if applicable, and do not represent the amount paid by the class during periods when reimbursements, waivers or reductions occur.
H Annualized
I Amount does not include the portfolio activity of any underlying mutual funds or exchange-traded funds (ETFs).
| Fidelity Advisor Freedom® 2035 Fund Class M |
| |
| | Six months ended (Unaudited) September 30, 2022 | | Years ended March 31, 2022 | | 2021 | | 2020 | | 2019 | | 2018 |
Selected Per-Share Data | | | | | | | | | | | | |
| Net asset value, beginning of period | $ | 14.67 | $ | 15.80 | $ | 11.33 | $ | 13.44 | $ | 14.53 | $ | 13.51 |
| Income from Investment Operations | | | | | | | | | | | | |
Net investment income (loss) A,B | | .07 | | .26 | | .06 | | .13 | | .16 | | .08 |
| Net realized and unrealized gain (loss) | | (2.81) | | .08 | | 5.31 | | (1.26) | | .16 | | 1.66 |
| Total from investment operations | | (2.74) | | .34 | | 5.37 | | (1.13) | | .32 | | 1.74 |
| Distributions from net investment income | | - | | (.27) | | (.09) | | (.14) | | (.19) | | (.12) |
| Distributions from net realized gain | | (.93) | | (1.20) | | (.81) | | (.84) | | (1.22) | | (.60) |
| Total distributions | | (.93) | | (1.47) | | (.90) | | (.98) | | (1.41) | | (.72) |
| Net asset value, end of period | $ | 11.00 | $ | 14.67 | $ | 15.80 | $ | 11.33 | $ | 13.44 | $ | 14.53 |
Total Return C,D,E | | (19.37)% | | 1.73% | | 49.26% | | (9.36)% | | 2.89% | | 12.98% |
Ratios to Average Net Assets B,F,G | | | | | | | | | | | | |
| Expenses before reductions | | 1.20% H | | 1.21% | | 1.22% | | 1.23% | | 1.24% | | 1.13% |
| Expenses net of fee waivers, if any | | 1.20% H | | 1.21% | | 1.22% | | 1.23% | | 1.24% | | 1.13% |
| Expenses net of all reductions | | 1.20% H | | 1.21% | | 1.22% | | 1.23% | | 1.24% | | 1.13% |
| Net investment income (loss) | | 1.10% H | | 1.62% | | .44% | | .98% | | 1.15% | | .55% |
| Supplemental Data | | | | | | | | | | | | |
| Net assets, end of period (000 omitted) | $ | 325,406 | $ | 408,691 | $ | 425,013 | $ | 310,544 | $ | 366,074 | $ | 364,455 |
Portfolio turnover rate I | | 20% H | | 27% | | 27% | | 33% | | 23% | | 23% |
A Calculated based on average shares outstanding during the period.
B Net investment income (loss) is affected by the timing of the declaration of dividends by any underlying mutual funds or exchange-traded funds (ETFs). Net investment income (loss) of any such underlying funds is not included in the Fund's net investment income (loss) ratio.
C Total returns for periods of less than one year are not annualized.
D Total returns would have been lower if certain expenses had not been reduced during the applicable periods shown.
E Total returns do not include the effect of the sales charges.
F Fees and expenses of any underlying mutual funds or exchange-traded funds (ETFs) are not included in the Fund's expense ratio. The Fund indirectly bears its proportionate share of these expenses. For additional expense information related to investments in Fidelity Central Funds, please refer to the "Investments in Fidelity Central Funds" note found in the Notes to Financial Statements section of the most recent Annual or Semi-Annual report.
G Expense ratios reflect operating expenses of the class. Expenses before reductions do not reflect amounts reimbursed, waived, or reduced through arrangements with the investment adviser, brokerage services, or other offset arrangements, if applicable, and do not represent the amount paid by the class during periods when reimbursements, waivers or reductions occur.
H Annualized
I Amount does not include the portfolio activity of any underlying mutual funds or exchange-traded funds (ETFs).
| Fidelity Advisor Freedom® 2035 Fund Class C |
| |
| | Six months ended (Unaudited) September 30, 2022 | | Years ended March 31, 2022 | | 2021 | | 2020 | | 2019 | | 2018 |
Selected Per-Share Data | | | | | | | | | | | | |
| Net asset value, beginning of period | $ | 14.26 | $ | 15.42 | $ | 11.09 | $ | 13.20 | $ | 14.29 | $ | 13.32 |
| Income from Investment Operations | | | | | | | | | | | | |
Net investment income (loss) A,B | | .04 | | .17 | | (.01) | | .06 | | .09 | | .01 |
| Net realized and unrealized gain (loss) | | (2.73) | | .07 | | 5.20 | | (1.23) | | .17 | | 1.62 |
| Total from investment operations | | (2.69) | | .24 | | 5.19 | | (1.17) | | .26 | | 1.63 |
| Distributions from net investment income | | - | | (.21) | | (.05) | | (.10) | | (.13) | | (.07) |
| Distributions from net realized gain | | (.93) | | (1.20) | | (.81) | | (.84) | | (1.22) | | (.60) |
| Total distributions | | (.93) | | (1.40) | | (.86) | | (.94) | | (1.35) | | (.66) |
| Net asset value, end of period | $ | 10.64 | $ | 14.26 | $ | 15.42 | $ | 11.09 | $ | 13.20 | $ | 14.29 |
Total Return C,D,E | | (19.59)% | | 1.18% | | 48.61% | | (9.84)% | | 2.39% | | 12.40% |
Ratios to Average Net Assets B,F,G | | | | | | | | | | | | |
| Expenses before reductions | | 1.70% H | | 1.71% | | 1.72% | | 1.73% | | 1.73% I | | 1.63% |
| Expenses net of fee waivers, if any | | 1.70% H | | 1.71% | | 1.72% | | 1.73% | | 1.73% I | | 1.63% |
| Expenses net of all reductions | | 1.70% H | | 1.71% | | 1.72% | | 1.73% | | 1.73% I | | 1.63% |
| Net investment income (loss) | | .60% H | | 1.12% | | (.06)% | | .48% | | .65% | | .05% |
| Supplemental Data | | | | | | | | | | | | |
| Net assets, end of period (000 omitted) | $ | 34,924 | $ | 45,937 | $ | 53,192 | $ | 37,642 | $ | 44,302 | $ | 65,519 |
Portfolio turnover rate J | | 20% H | | 27% | | 27% | | 33% | | 23% | | 23% |
A Calculated based on average shares outstanding during the period.
B Net investment income (loss) is affected by the timing of the declaration of dividends by any underlying mutual funds or exchange-traded funds (ETFs). Net investment income (loss) of any such underlying funds is not included in the Fund's net investment income (loss) ratio.
C Total returns for periods of less than one year are not annualized.
D Total returns would have been lower if certain expenses had not been reduced during the applicable periods shown.
E Total returns do not include the effect of the contingent deferred sales charge.
F Fees and expenses of any underlying mutual funds or exchange-traded funds (ETFs) are not included in the Fund's expense ratio. The Fund indirectly bears its proportionate share of these expenses. For additional expense information related to investments in Fidelity Central Funds, please refer to the "Investments in Fidelity Central Funds" note found in the Notes to Financial Statements section of the most recent Annual or Semi-Annual report.
G Expense ratios reflect operating expenses of the class. Expenses before reductions do not reflect amounts reimbursed, waived, or reduced through arrangements with the investment adviser, brokerage services, or other offset arrangements, if applicable, and do not represent the amount paid by the class during periods when reimbursements, waivers or reductions occur.
H Annualized
I On certain classes, the size and fluctuation of net assets and expense amounts may cause ratios to differ from contractual rates.
J Amount does not include the portfolio activity of any underlying mutual funds or exchange-traded funds (ETFs).
| Fidelity Advisor Freedom® 2035 Fund Class I |
| |
| | Six months ended (Unaudited) September 30, 2022 | | Years ended March 31, 2022 | | 2021 | | 2020 | | 2019 | | 2018 |
Selected Per-Share Data | | | | | | | | | | | | |
| Net asset value, beginning of period | $ | 15.07 | $ | 16.17 | $ | 11.56 | $ | 13.69 | $ | 14.75 | $ | 13.71 |
| Income from Investment Operations | | | | | | | | | | | | |
Net investment income (loss) A,B | | .10 | | .34 | | .13 | | .20 | | .23 | | .15 |
| Net realized and unrealized gain (loss) | | (2.89) | | .09 | | 5.44 | | (1.28) | | .17 | | 1.68 |
| Total from investment operations | | (2.79) | | .43 | | 5.57 | | (1.08) | | .40 | | 1.83 |
| Distributions from net investment income | | - | | (.33) | | (.14) | | (.20) | | (.25) | | (.17) |
| Distributions from net realized gain | | (.94) | | (1.20) | | (.81) | | (.85) | | (1.22) | | (.62) |
| Total distributions | | (.94) | | (1.53) | | (.96) | | (1.05) | | (1.46) | | (.79) |
| Net asset value, end of period | $ | 11.34 | $ | 15.07 | $ | 16.17 | $ | 11.56 | $ | 13.69 | $ | 14.75 |
Total Return C,D | | (19.18)% | | 2.25% | | 49.99% | | (8.91)% | | 3.47% | | 13.50% |
Ratios to Average Net Assets B,E,F | | | | | | | | | | | | |
| Expenses before reductions | | .70% G | | .71% | | .72% | | .73% | | .74% | | .64% |
| Expenses net of fee waivers, if any | | .70% G | | .71% | | .72% | | .73% | | .74% | | .64% |
| Expenses net of all reductions | | .70% G | | .71% | | .72% | | .73% | | .74% | | .64% |
| Net investment income (loss) | | 1.60% G | | 2.12% | | .94% | | 1.48% | | 1.65% | | 1.04% |
| Supplemental Data | | | | | | | | | | | | |
| Net assets, end of period (000 omitted) | $ | 832,931 | $ | 1,109,011 | $ | 1,169,461 | $ | 808,586 | $ | 907,369 | $ | 867,707 |
Portfolio turnover rate H | | 20% G | | 27% | | 27% | | 33% | | 23% | | 23% |
A Calculated based on average shares outstanding during the period.
B Net investment income (loss) is affected by the timing of the declaration of dividends by any underlying mutual funds or exchange-traded funds (ETFs). Net investment income (loss) of any such underlying funds is not included in the Fund's net investment income (loss) ratio.
C Total returns for periods of less than one year are not annualized.
D Total returns would have been lower if certain expenses had not been reduced during the applicable periods shown.
E Fees and expenses of any underlying mutual funds or exchange-traded funds (ETFs) are not included in the Fund's expense ratio. The Fund indirectly bears its proportionate share of these expenses. For additional expense information related to investments in Fidelity Central Funds, please refer to the "Investments in Fidelity Central Funds" note found in the Notes to Financial Statements section of the most recent Annual or Semi-Annual report.
F Expense ratios reflect operating expenses of the class. Expenses before reductions do not reflect amounts reimbursed, waived, or reduced through arrangements with the investment adviser, brokerage services, or other offset arrangements, if applicable, and do not represent the amount paid by the class during periods when reimbursements, waivers or reductions occur.
G Annualized
H Amount does not include the portfolio activity of any underlying mutual funds or exchange-traded funds (ETFs).
| Fidelity Advisor Freedom® 2035 Fund Class Z |
| |
| | Six months ended (Unaudited) September 30, 2022 | | Years ended March 31, 2022 | | 2021 | | 2020 | | 2019 A |
Selected Per-Share Data | | | | | | | | | | |
| Net asset value, beginning of period | $ | 14.93 | $ | 16.04 | $ | 11.47 | $ | 13.63 | $ | 14.78 |
| Income from Investment Operations | | | | | | | | | | |
Net investment income (loss) B,C | | .11 | | .36 | | .15 | | .21 | | .07 |
| Net realized and unrealized gain (loss) | | (2.87) | | .08 | | 5.39 | | (1.27) | | (.32) |
| Total from investment operations | | (2.76) | | .44 | | 5.54 | | (1.06) | | (.25) |
| Distributions from net investment income | | - | | (.35) | | (.16) | | (.22) | | (.31) |
| Distributions from net realized gain | | (.95) | | (1.20) | | (.81) | | (.88) | | (.59) |
| Total distributions | | (.95) | | (1.55) | | (.97) | | (1.10) | | (.90) |
| Net asset value, end of period | $ | 11.22 | $ | 14.93 | $ | 16.04 | $ | 11.47 | $ | 13.63 |
Total Return D,E | | (19.17)% | | 2.35% | | 50.19% | | (8.87)% | | (.96)% |
Ratios to Average Net Assets C,F,G | | | | | | | | | | |
| Expenses before reductions | | .61% H | | .61% I | | .62% | | .63% | | .63% H,I |
| Expenses net of fee waivers, if any | | .61% H | | .61% I | | .62% | | .63% | | .63% H,I |
| Expenses net of all reductions | | .61% H | | .61% I | | .62% | | .63% | | .63% H,I |
| Net investment income (loss) | | 1.69% H | | 2.22% | | 1.04% | | 1.58% | | 1.01% H |
| Supplemental Data | | | | | | | | | | |
| Net assets, end of period (000 omitted) | $ | 103,588 | $ | 97,458 | $ | 53,381 | $ | 27,968 | $ | 2,821 |
Portfolio turnover rate J | | 20% H | | 27% | | 27% | | 33% | | 23% |
A For the period October 2, 2018 (commencement of sale of shares) through March 31, 2019.
B Calculated based on average shares outstanding during the period.
C Net investment income (loss) is affected by the timing of the declaration of dividends by any underlying mutual funds or exchange-traded funds (ETFs). Net investment income (loss) of any such underlying funds is not included in the Fund's net investment income (loss) ratio.
D Total returns for periods of less than one year are not annualized.
E Total returns would have been lower if certain expenses had not been reduced during the applicable periods shown.
F Fees and expenses of any underlying mutual funds or exchange-traded funds (ETFs) are not included in the Fund's expense ratio. The Fund indirectly bears its proportionate share of these expenses. For additional expense information related to investments in Fidelity Central Funds, please refer to the "Investments in Fidelity Central Funds" note found in the Notes to Financial Statements section of the most recent Annual or Semi-Annual report.
G Expense ratios reflect operating expenses of the class. Expenses before reductions do not reflect amounts reimbursed, waived, or reduced through arrangements with the investment adviser, brokerage services, or other offset arrangements, if applicable, and do not represent the amount paid by the class during periods when reimbursements, waivers or reductions occur.
H Annualized
I On certain classes, the size and fluctuation of net assets and expense amounts may cause ratios to differ from contractual rates.
J Amount does not include the portfolio activity of any underlying mutual funds or exchange-traded funds (ETFs).
| Fidelity Advisor Freedom® 2035 Fund Class Z6 |
| |
| | Six months ended (Unaudited) September 30, 2022 | | Years ended March 31, 2022 | | 2021 | | 2020 | | 2019 | | 2018 A |
Selected Per-Share Data | | | | | | | | | | | | |
| Net asset value, beginning of period | $ | 15.04 | $ | 16.14 | $ | 11.53 | $ | 13.67 | $ | 14.75 | $ | 14.07 |
| Income from Investment Operations | | | | | | | | | | | | |
Net investment income (loss) B,C | | .12 | | .38 | | .17 | | .23 | | .26 | | .12 |
| Net realized and unrealized gain (loss) | | (2.89) | | .08 | | 5.43 | | (1.28) | | .16 | | 1.15 |
| Total from investment operations | | (2.77) | | .46 | | 5.60 | | (1.05) | | .42 | | 1.27 |
| Distributions from net investment income | | - | | (.37) | | (.17) | | (.23) | | (.29) | | (.22) |
| Distributions from net realized gain | | (.95) | | (1.20) | | (.81) | | (.86) | | (1.22) | | (.38) |
| Total distributions | | (.95) | | (1.56) D | | (.99) D | | (1.09) | | (1.50) D | | (.59) D |
| Net asset value, end of period | $ | 11.32 | $ | 15.04 | $ | 16.14 | $ | 11.53 | $ | 13.67 | $ | 14.75 |
Total Return E,F | | (19.07)% | | 2.48% | | 50.43% | | (8.74)% | | 3.65% | | 9.03% |
Ratios to Average Net Assets C,G,H | | | | | | | | | | | | |
| Expenses before reductions | | .47% I | | .48% | | .48% | | .49% | | .49% | | .51% I,J |
| Expenses net of fee waivers, if any | | .47% I | | .48% | | .48% | | .49% | | .49% | | .51% I,J |
| Expenses net of all reductions | | .47% I | | .48% | | .48% | | .49% | | .49% | | .51% I,J |
| Net investment income (loss) | | 1.83% I | | 2.35% | | 1.18% | | 1.73% | | 1.90% | | .97% I |
| Supplemental Data | | | | | | | | | | | | |
| Net assets, end of period (000 omitted) | $ | 210,327 | $ | 222,126 | $ | 150,227 | $ | 63,792 | $ | 45,355 | $ | 15,784 |
Portfolio turnover rate K | | 20% I | | 27% | | 27% | | 33% | | 23% | | 23% |
A For the period June 6, 2017 (commencement of sale of shares) through March 31, 2018.
B Calculated based on average shares outstanding during the period.
C Net investment income (loss) is affected by the timing of the declaration of dividends by any underlying mutual funds or exchange-traded funds (ETFs). Net investment income (loss) of any such underlying funds is not included in the Fund's net investment income (loss) ratio.
D Total distributions per share do not sum due to rounding.
E Total returns for periods of less than one year are not annualized.
F Total returns would have been lower if certain expenses had not been reduced during the applicable periods shown.
G Fees and expenses of any underlying mutual funds or exchange-traded funds (ETFs) are not included in the Fund's expense ratio. The Fund indirectly bears its proportionate share of these expenses. For additional expense information related to investments in Fidelity Central Funds, please refer to the "Investments in Fidelity Central Funds" note found in the Notes to Financial Statements section of the most recent Annual or Semi-Annual report.
H Expense ratios reflect operating expenses of the class. Expenses before reductions do not reflect amounts reimbursed, waived, or reduced through arrangements with the investment adviser, brokerage services, or other offset arrangements, if applicable, and do not represent the amount paid by the class during periods when reimbursements, waivers or reductions occur.
I Annualized
J On certain classes, the size and fluctuation of net assets and expense amounts may cause ratios to differ from contractual rates.
K Amount does not include the portfolio activity of any underlying mutual funds or exchange-traded funds (ETFs).
The information in the following table is based on the direct Investments of the Fund.
Top Holdings (% of Fund's net assets) |
| |
| Fidelity Series Emerging Markets Opportunities Fund | 13.0 | |
| Fidelity Series Large Cap Stock Fund | 9.5 | |
| Fidelity Series Overseas Fund | 7.3 | |
| Fidelity Series International Value Fund | 7.3 | |
| Fidelity Series International Growth Fund | 7.3 | |
| Fidelity Series Value Discovery Fund | 6.3 | |
| Fidelity Advisor Series Equity Growth Fund | 6.2 | |
| Fidelity Series Stock Selector Large Cap Value Fund | 6.1 | |
| Fidelity Series Long-Term Treasury Bond Index Fund | 5.7 | |
| Fidelity Series Opportunistic Insights Fund | 5.7 | |
| | 74.4 | |
| |
Domestic Equity Funds category includes Fidelity Series Commodity Strategy Fund which invests in commodity-related investments.
Asset Allocation (% of Fund's net assets) |
|
Percentages shown as 0.0% may reflect amounts less than 0.05%. |
|
Fidelity Advisor Freedom® 2040 Fund
Showing Percentage of Net Assets
| U.S. Treasury Obligations - 0.0% |
| | | Principal Amount (a) | Value ($) |
U.S. Treasury Bills, yield at date of purchase 1.87% to 2.42% 10/6/22 to 10/20/22 (b) (Cost $1,408,665) | | 1,410,000 | 1,408,729 |
| | | | |
| Domestic Equity Funds - 48.9% |
| | | Shares | Value ($) |
| Fidelity Advisor Series Equity Growth Fund (c) | | 10,758,323 | 130,713,622 |
| Fidelity Advisor Series Growth Opportunities Fund (c) | | 10,520,651 | 92,266,109 |
| Fidelity Advisor Series Small Cap Fund (c) | | 5,450,944 | 57,071,381 |
| Fidelity Series All-Sector Equity Fund (c) | | 6,054,998 | 51,951,886 |
| Fidelity Series Commodity Strategy Fund (c) | | 12,084,550 | 25,256,709 |
| Fidelity Series Large Cap Stock Fund (c) | | 13,493,621 | 199,300,786 |
| Fidelity Series Large Cap Value Index Fund (c) | | 1,710,637 | 21,759,308 |
| Fidelity Series Opportunistic Insights Fund (c) | | 8,367,545 | 118,902,811 |
| Fidelity Series Small Cap Opportunities Fund (c) | | 6,379,267 | 68,768,500 |
| Fidelity Series Stock Selector Large Cap Value Fund (c) | | 11,348,849 | 126,766,643 |
| Fidelity Series Value Discovery Fund (c) | | 9,497,458 | 130,780,000 |
| TOTAL DOMESTIC EQUITY FUNDS (Cost $987,650,317) | | | 1,023,537,755 |
| | | | |
| International Equity Funds - 41.4% |
| | | Shares | Value ($) |
| Fidelity Series Canada Fund (c) | | 5,365,715 | 66,534,871 |
| Fidelity Series Emerging Markets Fund (c) | | 4,102,136 | 29,699,468 |
| Fidelity Series Emerging Markets Opportunities Fund (c) | | 18,707,752 | 271,636,562 |
| Fidelity Series International Growth Fund (c) | | 11,830,412 | 151,665,886 |
| Fidelity Series International Small Cap Fund (c) | | 2,901,771 | 39,696,230 |
| Fidelity Series International Value Fund (c) | | 17,806,346 | 152,956,512 |
| Fidelity Series Overseas Fund (c) | | 16,068,432 | 153,132,159 |
| TOTAL INTERNATIONAL EQUITY FUNDS (Cost $920,597,963) | | | 865,321,688 |
| | | | |
| Bond Funds - 9.1% |
| | | Shares | Value ($) |
| Fidelity Series 5+ Year Inflation-Protected Bond Index Fund (c) | | 258,548 | 2,065,796 |
| Fidelity Series Emerging Markets Debt Fund (c) | | 1,606,334 | 11,019,453 |
| Fidelity Series Emerging Markets Debt Local Currency Fund (c) | | 454,760 | 3,624,435 |
| Fidelity Series Floating Rate High Income Fund (c) | | 255,159 | 2,219,885 |
| Fidelity Series High Income Fund (c) | | 1,443,981 | 11,378,572 |
| Fidelity Series International Credit Fund (c) | | 134,424 | 1,057,915 |
| Fidelity Series International Developed Markets Bond Index Fund (c) | | 586,163 | 4,994,109 |
| Fidelity Series Investment Grade Bond Fund (c) | | 2,943,478 | 28,728,348 |
| Fidelity Series Long-Term Treasury Bond Index Fund (c) | | 20,012,031 | 119,471,822 |
| Fidelity Series Real Estate Income Fund (c) | | 567,251 | 5,400,232 |
| TOTAL BOND FUNDS (Cost $244,969,501) | | | 189,960,567 |
| | | | |
| Short-Term Funds - 0.6% |
| | | Shares | Value ($) |
| Fidelity Cash Central Fund 3.10% (d) | | 814,398 | 814,561 |
| Fidelity Series Government Money Market Fund 3.00% (c)(e) | | 11,214,126 | 11,214,126 |
| Fidelity Series Short-Term Credit Fund (c) | | 0 | 4 |
| TOTAL SHORT-TERM FUNDS (Cost $12,028,691) | | | 12,028,691 |
| | | | |
| TOTAL INVESTMENT IN SECURITIES - 100.0% (Cost $2,166,655,137) | 2,092,257,430 |
NET OTHER ASSETS (LIABILITIES) - 0.0% | (482,431) |
| NET ASSETS - 100.0% | 2,091,774,999 |
| | |
| Futures Contracts |
| | Number of contracts | Expiration Date | Notional Amount ($) | Value ($) | Unrealized Appreciation/ (Depreciation) ($) |
| Purchased | | | | | |
| | | | | | |
| Treasury Contracts | | | | | |
| CBOT 10-Year U.S. Treasury Note Contracts (United States) | 342 | Dec 2022 | 38,325,375 | (2,337,135) | (2,337,135) |
| CBOT Ultra Long Term U.S. Treasury Bond Contracts (United States) | 32 | Dec 2022 | 4,384,000 | (56,437) | (56,437) |
| | | | | | |
| TOTAL PURCHASED | | | | | (2,393,572) |
| | | | | | |
| Sold | | | | | |
| | | | | | |
| Equity Index Contracts | | | | | |
| CME E-mini S&P 500 Index Contracts (United States) | 59 | Dec 2022 | 10,624,425 | 2,096 | 2,096 |
| ICE E-mini MSCI EAFE Index Contracts (United States) | 103 | Dec 2022 | 8,552,090 | 1,159,913 | 1,159,913 |
| ICE E-mini MSCI Emerging Markets Index Contracts (United States) | 80 | Dec 2022 | 3,486,000 | 24,938 | 24,938 |
| | | | | | |
| TOTAL SOLD | | | | | 1,186,947 |
| | | | | | |
| TOTAL FUTURES CONTRACTS | | | | | (1,206,625) |
| The notional amount of futures purchased as a percentage of Net Assets is 2.0% |
| The notional amount of futures sold as a percentage of Net Assets is 1.1% |
Share amounts shown as "0" represent less than 1 share.
Legend
| (a) | Amount is stated in United States dollars unless otherwise noted. |
| (b) | Security or a portion of the security was pledged to cover margin requirements for futures contracts. At period end, the value of securities pledged amounted to $1,379,764. |
| (d) | Affiliated fund that is generally available only to investment companies and other accounts managed by Fidelity Investments. The rate quoted is the annualized seven-day yield of the fund at period end. A complete unaudited listing of the fund's holdings as of its most recent quarter end is available upon request. In addition, each Fidelity Central Fund's financial statements are available on the SEC's website or upon request. |
| (e) | The rate quoted is the annualized seven-day yield of the fund at period end. |
Affiliated Central Funds
Fiscal year to date information regarding the Fund's investments in Fidelity Central Funds, including the ownership percentage, is presented below.
| Affiliate | Value, beginning of period ($) | Purchases ($) | Sales Proceeds ($) | Dividend Income ($) | Realized Gain (loss) ($) | Change in Unrealized appreciation (depreciation) ($) | Value, end of period ($) | %ownership, end of period |
| Fidelity Cash Central Fund 3.10% | 2,038,184 | 11,437,621 | 12,661,244 | 15,644 | 7 | (7) | 814,561 | 0.0% |
| Total | 2,038,184 | 11,437,621 | 12,661,244 | 15,644 | 7 | (7) | 814,561 | |
| | | | | | | | | |
Amounts in the income column in the above table include any capital gain distributions from underlying funds, which are presented in the corresponding line item in the Statement of Operations, if applicable.
Affiliated Underlying Funds
Fiscal year to date information regarding the Fund's investments in affiliated Underlying Funds is presented below. Exchanges between classes of the same affiliated Underlying Funds may occur. If an Underlying Funds changes its name, the name presented below is the name in effect at period end.
| Affiliate | Value, beginning of period ($) | Purchases ($) | Sales Proceeds ($) | Dividend Income ($) | Realized Gain (loss) ($) | Change in Unrealized appreciation (depreciation) ($) | Value, end of period ($) |
| Fidelity Advisor Series Equity Growth Fund | 165,373,731 | 12,006,613 | 11,185,434 | - | (1,334,465) | (34,146,823) | 130,713,622 |
| Fidelity Advisor Series Growth Opportunities Fund | 113,426,978 | 20,095,526 | 7,819,455 | - | (1,776,587) | (31,660,353) | 92,266,109 |
| Fidelity Advisor Series Small Cap Fund | 75,062,505 | 3,271,699 | 7,229,596 | - | (984,574) | (13,048,653) | 57,071,381 |
| Fidelity Series 5+ Year Inflation-Protected Bond Index Fund | 2,674,746 | 58,174 | 237,630 | - | (21,138) | (408,356) | 2,065,796 |
| Fidelity Series All-Sector Equity Fund | 70,935,366 | 1,477,968 | 6,315,308 | - | (1,325,516) | (12,820,624) | 51,951,886 |
| Fidelity Series Canada Fund | 86,333,631 | 4,903,527 | 7,638,012 | - | (319,219) | (16,745,056) | 66,534,871 |
| Fidelity Series Commodity Strategy Fund | 39,848,462 | 21,025,835 | 14,168,674 | 18,307,280 | (3,388,139) | (18,060,775) | 25,256,709 |
| Fidelity Series Emerging Markets Debt Fund | 13,057,426 | 888,246 | 698,824 | 334,334 | (92,929) | (2,134,466) | 11,019,453 |
| Fidelity Series Emerging Markets Debt Local Currency Fund | 4,427,308 | 113,250 | 411,008 | - | (57,126) | (447,989) | 3,624,435 |
| Fidelity Series Emerging Markets Fund | 36,684,889 | 3,003,385 | 1,719,188 | - | (267,624) | (8,001,994) | 29,699,468 |
| Fidelity Series Emerging Markets Opportunities Fund | 337,566,672 | 22,239,436 | 16,639,412 | - | (4,240,809) | (67,289,325) | 271,636,562 |
| Fidelity Series Floating Rate High Income Fund | 2,675,897 | 122,837 | 443,438 | 64,662 | (44,433) | (90,978) | 2,219,885 |
| Fidelity Series Government Money Market Fund 3.00% | - | 11,214,126 | - | 474 | - | - | 11,214,126 |
| Fidelity Series High Income Fund | 16,195,054 | 696,270 | 3,538,697 | 372,782 | (472,912) | (1,501,143) | 11,378,572 |
| Fidelity Series International Credit Fund | 1,226,857 | 16,751 | - | 16,751 | - | (185,693) | 1,057,915 |
| Fidelity Series International Developed Markets Bond Index Fund | 638,901 | 4,846,239 | 206,771 | 3,517 | (10,876) | (273,384) | 4,994,109 |
| Fidelity Series International Growth Fund | 197,225,844 | 12,531,509 | 13,054,044 | - | (2,565,541) | (42,471,882) | 151,665,886 |
| Fidelity Series International Small Cap Fund | 53,991,986 | 1,251,336 | 2,810,303 | - | (796,891) | (11,939,898) | 39,696,230 |
| Fidelity Series International Value Fund | 199,176,336 | 12,837,401 | 16,134,517 | - | (965,288) | (41,957,420) | 152,956,512 |
| Fidelity Series Investment Grade Bond Fund | 34,677,953 | 8,859,372 | 11,406,711 | 404,554 | (960,046) | (2,442,220) | 28,728,348 |
| Fidelity Series Large Cap Stock Fund | 260,244,135 | 21,088,920 | 24,970,732 | 12,084,218 | 1,698,799 | (58,760,336) | 199,300,786 |
| Fidelity Series Large Cap Value Index Fund | 28,147,463 | 608,510 | 2,296,421 | - | 429,564 | (5,129,808) | 21,759,308 |
| Fidelity Series Long-Term Treasury Bond Index Fund | 143,309,882 | 21,320,640 | 12,878,995 | 1,706,481 | (2,676,273) | (29,603,432) | 119,471,822 |
| Fidelity Series Opportunistic Insights Fund | 152,844,704 | 11,341,400 | 10,880,678 | - | (2,483,534) | (31,919,081) | 118,902,811 |
| Fidelity Series Overseas Fund | 198,300,462 | 11,686,860 | 7,593,669 | - | (921,248) | (48,340,246) | 153,132,159 |
| Fidelity Series Real Estate Income Fund | 9,558,193 | 580,874 | 3,464,434 | 429,802 | (157,618) | (1,116,783) | 5,400,232 |
| Fidelity Series Short-Term Credit Fund | - | 4 | - | - | - | - | 4 |
| Fidelity Series Small Cap Opportunities Fund | 92,677,106 | 5,147,087 | 10,350,586 | 3,210,893 | (1,323,988) | (17,381,119) | 68,768,500 |
| Fidelity Series Stock Selector Large Cap Value Fund | 166,096,507 | 5,233,917 | 16,791,286 | - | (522,623) | (27,249,872) | 126,766,643 |
| Fidelity Series Value Discovery Fund | 169,187,107 | 5,058,403 | 21,058,389 | - | 2,248,128 | (24,655,249) | 130,780,000 |
| | 2,671,566,101 | 223,526,115 | 231,942,212 | 36,935,748 | (23,332,906) | (549,782,958) | 2,090,034,140 |
Amounts in the income column in the above table include any capital gain distributions from underlying funds, which are presented in the corresponding line item in the Statement of Operations, if applicable.
Investment Valuation
The following is a summary of the inputs used, as of September 30, 2022, involving the Fund's assets and liabilities carried at fair value. The inputs or methodology used for valuing securities may not be an indication of the risk associated with investing in those securities. For more information on valuation inputs, and their aggregation into the levels used below, please refer to the Investment Valuation section in the accompanying Notes to Financial Statements.
| Valuation Inputs at Reporting Date: |
| Description | Total ($) | Level 1 ($) | Level 2 ($) | Level 3 ($) |
Investments in Securities: | | | | |
|
| Other Short-Term Investments | 1,408,729 | - | 1,408,729 | - |
|
| Domestic Equity Funds | 1,023,537,755 | 1,023,537,755 | - | - |
|
| International Equity Funds | 865,321,688 | 865,321,688 | - | - |
|
| Bond Funds | 189,960,567 | 189,960,567 | - | - |
|
| Short-Term Funds | 12,028,691 | 12,028,691 | - | - |
| Total Investments in Securities: | 2,092,257,430 | 2,090,848,701 | 1,408,729 | - |
Derivative Instruments: | | | | |
|
| Assets | | | | |
Futures Contracts | 1,186,947 | 1,186,947 | - | - |
| Total Assets | 1,186,947 | 1,186,947 | - | - |
|
| Liabilities | | | | |
Futures Contracts | (2,393,572) | (2,393,572) | - | - |
| Total Liabilities | (2,393,572) | (2,393,572) | - | - |
| Total Derivative Instruments: | (1,206,625) | (1,206,625) | - | - |
Value of Derivative Instruments
The following table is a summary of the Fund's value of derivative instruments by primary risk exposure as of September 30, 2022. For additional information on derivative instruments, please refer to the Derivative Instruments section in the accompanying Notes to Financial Statements.
Primary Risk Exposure / Derivative Type | Value |
| Asset ($) | Liability ($) |
| Equity Risk | | |
Futures Contracts (a) | 1,186,947 | 0 |
| Total Equity Risk | 1,186,947 | 0 |
| Interest Rate Risk | | |
Futures Contracts (a) | 0 | (2,393,572) |
| Total Interest Rate Risk | 0 | (2,393,572) |
| Total Value of Derivatives | 1,186,947 | (2,393,572) |
(a)Reflects gross cumulative appreciation (depreciation) on futures contracts as presented in the Schedule of Investments. In the Statement of Assets and Liabilities, the period end daily variation margin is included in receivable or payable for daily variation margin on futures contracts, and the net cumulative appreciation (depreciation) is included in Total accumulated earnings (loss).
Fidelity Advisor Freedom® 2040 Fund
| Statement of Assets and Liabilities |
| | | | September 30, 2022 (Unaudited) |
| | | | | |
| Assets | | | | |
| Investment in securities, at value - See accompanying schedule: | $ | | | |
Unaffiliated issuers (cost $1,408,665) | | $1,408,729 | | |
Fidelity Central Funds (cost $814,561) | | 814,561 | | |
Other affiliated issuers (cost $2,164,431,911) | | 2,090,034,140 | | |
| | | | | |
| Total Investment in Securities (cost $2,166,655,137) | | | $ | 2,092,257,430 |
| Receivable for investments sold | | | | 15,658,958 |
| Receivable for fund shares sold | | | | 2,234,104 |
| Distributions receivable from Fidelity Central Funds | | | | 2,076 |
| Receivable for daily variation margin on futures contracts | | | | 10,236 |
Total assets | | | | 2,110,162,804 |
| Liabilities | | | | |
| Payable for investments purchased | | 12,647,184 | | |
| Payable for fund shares redeemed | | 3,951,076 | | |
| Accrued management fee | | 1,336,961 | | |
| Distribution and service plan fees payable | | 328,891 | | |
| Payable for daily variation margin on futures contracts | | 123,693 | | |
| Total Liabilities | | | | 18,387,805 |
| Net Assets | | | $ | 2,091,774,999 |
| Net Assets consist of: | | | | |
| Paid in capital | | | $ | 2,183,714,641 |
| Total accumulated earnings (loss) | | | | (91,939,642) |
| Net Assets | | | $ | 2,091,774,999 |
| | | | | |
| Net Asset Value and Maximum Offering Price | | | | |
| Class A : | | | | |
Net Asset Value and redemption price per share ($745,661,671 ÷ 62,402,874 shares) (a) | | | $ | 11.95 |
| Maximum offering price per share (100/94.25 of $11.95) | | | $ | 12.68 |
| Class M : | | | | |
Net Asset Value and redemption price per share ($300,687,599 ÷ 25,438,197 shares) (a) | | | $ | 11.82 |
| Maximum offering price per share (100/96.50 of $11.82) | | | $ | 12.25 |
| Class C : | | | | |
Net Asset Value and offering price per share ($32,308,279 ÷ 2,833,755 shares) (a) | | | $ | 11.40 |
| Class I : | | | | |
Net Asset Value , offering price and redemption price per share ($735,848,491 ÷ 60,875,639 shares) | | | $ | 12.09 |
| Class Z : | | | | |
Net Asset Value , offering price and redemption price per share ($85,891,027 ÷ 7,182,588 shares) | | | $ | 11.96 |
| Class Z6 : | | | | |
Net Asset Value , offering price and redemption price per share ($191,377,932 ÷ 15,871,947 shares) | | | $ | 12.06 |
(a)Redemption price per share is equal to net asset value less any applicable contingent deferred sales charge. |
| Statement of Operations |
| | | | Six months ended September 30, 2022 (Unaudited) |
| Investment Income | | | | |
| Dividends: | | | | |
| Affiliated issuers | | | $ | 24,007,896 |
| Interest | | | | 11,208 |
| Income from Fidelity Central Funds | | | | 15,644 |
| Total Income | | | | 24,034,748 |
| Expenses | | | | |
| Management fee | $ | 8,581,760 | | |
| Distribution and service plan fees | | 2,113,772 | | |
| Independent trustees' fees and expenses | | 4,142 | | |
| Total expenses before reductions | | 10,699,674 | | |
| Expense reductions | | (16) | | |
| Total expenses after reductions | | | | 10,699,658 |
| Net Investment income (loss) | | | | 13,335,090 |
| Realized and Unrealized Gain (Loss) | | | | |
| Net realized gain (loss) on: | | | | |
| Investment Securities: | | | | |
| Unaffiliated issuers | | 689 | | |
| Fidelity Central Funds | | 7 | | |
| Other affiliated issuers | | (23,332,906) | | |
| Futures contracts | | (1,717,158) | | |
| Capital gain distributions from underlying funds: | | | | |
| Affiliated issuers | | 12,927,852 | | |
| Total net realized gain (loss) | | | | (12,121,516) |
| Change in net unrealized appreciation (depreciation) on: | | | | |
| Investment Securities: | | | | |
| Unaffiliated issuers | | 44 | | |
| Fidelity Central Funds | | (7) | | |
| Other affiliated issuers | | (549,782,958) | | |
| Futures contracts | | (1,237,848) | | |
| Total change in net unrealized appreciation (depreciation) | | | | (551,020,769) |
| Net gain (loss) | | | | (563,142,285) |
| Net increase (decrease) in net assets resulting from operations | | | $ | (549,807,195) |
| Statement of Changes in Net Assets |
| |
| | Six months ended September 30, 2022 (Unaudited) | | Year ended March 31, 2022 |
| Increase (Decrease) in Net Assets | | | | |
| Operations | | | | |
| Net investment income (loss) | $ | 13,335,090 | $ | 53,670,748 |
| Net realized gain (loss) | | (12,121,516) | | 272,405,558 |
| Change in net unrealized appreciation (depreciation) | | (551,020,769) | | (245,280,331) |
| Net increase (decrease) in net assets resulting from operations | | (549,807,195) | | 80,795,975 |
| Distributions to shareholders | | (190,516,568) | | (269,416,376) |
| Share transactions - net increase (decrease) | | 158,002,643 | | 172,603,391 |
| Total increase (decrease) in net assets | | (582,321,120) | | (16,017,010) |
| | | | | |
| Net Assets | | | | |
| Beginning of period | | 2,674,096,119 | | 2,690,113,129 |
| End of period | $ | 2,091,774,999 | $ | 2,674,096,119 |
| | | | | |
| | | | | |
Financial Highlights
| Fidelity Advisor Freedom® 2040 Fund Class A |
| |
| | Six months ended (Unaudited) September 30, 2022 | | Years ended March 31, 2022 | | 2021 | | 2020 | | 2019 | | 2018 |
Selected Per-Share Data | | | | | | | | | | | | |
| Net asset value, beginning of period | $ | 16.37 | $ | 17.54 | $ | 12.08 | $ | 14.52 | $ | 15.69 | $ | 14.57 |
| Income from Investment Operations | | | | | | | | | | | | |
Net investment income (loss) A,B | | .07 | | .32 | | .09 | | .17 | | .21 | | .12 |
| Net realized and unrealized gain (loss) | | (3.32) | | .23 | | 6.34 | | (1.55) | | .15 | | 1.81 |
| Total from investment operations | | (3.25) | | .55 | | 6.43 | | (1.38) | | .36 | | 1.93 |
| Distributions from net investment income | | - | | (.34) | | (.11) | | (.17) | | (.23) | | (.15) |
| Distributions from net realized gain | | (1.17) | | (1.38) | | (.85) | | (.88) | | (1.31) | | (.66) |
| Total distributions | | (1.17) | | (1.72) | | (.97) C | | (1.06) C | | (1.53) C | | (.81) |
| Net asset value, end of period | $ | 11.95 | $ | 16.37 | $ | 17.54 | $ | 12.08 | $ | 14.52 | $ | 15.69 |
Total Return D,E,F | | (20.67)% | | 2.74% | | 55.32% | | (10.59)% | | 3.04% | | 13.42% |
Ratios to Average Net Assets B,G,H | | | | | | | | | | | | |
| Expenses before reductions | | 1.00% I | | 1.00% | | 1.00% | | 1.00% | | .99% J | | .87% |
| Expenses net of fee waivers, if any | | 1.00% I | | 1.00% | | 1.00% | | 1.00% | | .99% J | | .87% |
| Expenses net of all reductions | | 1.00% I | | 1.00% | | 1.00% | | 1.00% | | .99% J | | .87% |
| Net investment income (loss) | | 1.02% I | | 1.82% | | .61% | | 1.17% | | 1.37% | | .78% |
| Supplemental Data | | | | | | | | | | | | |
| Net assets, end of period (000 omitted) | $ | 745,662 | $ | 963,236 | $ | 1,000,757 | $ | 729,343 | $ | 916,426 | $ | 948,970 |
Portfolio turnover rate K | | 19% I | | 26% | | 25% | | 31% | | 21% | | 23% |
A Calculated based on average shares outstanding during the period.
B Net investment income (loss) is affected by the timing of the declaration of dividends by any underlying mutual funds or exchange-traded funds (ETFs). Net investment income (loss) of any such underlying funds is not included in the Fund's net investment income (loss) ratio.
C Total distributions per share do not sum due to rounding.
D Total returns for periods of less than one year are not annualized.
E Total returns would have been lower if certain expenses had not been reduced during the applicable periods shown.
F Total returns do not include the effect of the sales charges.
G Fees and expenses of any underlying mutual funds or exchange-traded funds (ETFs) are not included in the Fund's expense ratio. The Fund indirectly bears its proportionate share of these expenses. For additional expense information related to investments in Fidelity Central Funds, please refer to the "Investments in Fidelity Central Funds" note found in the Notes to Financial Statements section of the most recent Annual or Semi-Annual report.
H Expense ratios reflect operating expenses of the class. Expenses before reductions do not reflect amounts reimbursed, waived, or reduced through arrangements with the investment adviser, brokerage services, or other offset arrangements, if applicable, and do not represent the amount paid by the class during periods when reimbursements, waivers or reductions occur.
I Annualized
J On certain classes, the size and fluctuation of net assets and expense amounts may cause ratios to differ from contractual rates.
K Amount does not include the portfolio activity of any underlying mutual funds or exchange-traded funds (ETFs).
| Fidelity Advisor Freedom® 2040 Fund Class M |
| |
| | Six months ended (Unaudited) September 30, 2022 | | Years ended March 31, 2022 | | 2021 | | 2020 | | 2019 | | 2018 |
Selected Per-Share Data | | | | | | | | | | | | |
| Net asset value, beginning of period | $ | 16.22 | $ | 17.40 | $ | 12.00 | $ | 14.44 | $ | 15.62 | $ | 14.52 |
| Income from Investment Operations | | | | | | | | | | | | |
Net investment income (loss) A,B | | .05 | | .27 | | .05 | | .13 | | .17 | | .08 |
| Net realized and unrealized gain (loss) | | (3.29) | | .23 | | 6.29 | | (1.55) | | .16 | | 1.80 |
| Total from investment operations | | (3.24) | | .50 | | 6.34 | | (1.42) | | .33 | | 1.88 |
| Distributions from net investment income | | - | | (.30) | | (.09) | | (.15) | | (.20) | | (.12) |
| Distributions from net realized gain | | (1.16) | | (1.38) | | (.85) | | (.88) | | (1.31) | | (.66) |
| Total distributions | | (1.16) | | (1.68) | | (.94) | | (1.02) C | | (1.51) | | (.78) |
| Net asset value, end of period | $ | 11.82 | $ | 16.22 | $ | 17.40 | $ | 12.00 | $ | 14.44 | $ | 15.62 |
Total Return D,E,F | | (20.80)% | | 2.50% | | 54.96% | | (10.84)% | | 2.82% | | 13.11% |
Ratios to Average Net Assets B,G,H | | | | | | | | | | | | |
| Expenses before reductions | | 1.25% I | | 1.25% | | 1.25% | | 1.25% | | 1.25% | | 1.13% |
| Expenses net of fee waivers, if any | | 1.25% I | | 1.25% | | 1.25% | | 1.25% | | 1.25% | | 1.13% |
| Expenses net of all reductions | | 1.25% I | | 1.25% | | 1.25% | | 1.25% | | 1.25% | | 1.13% |
| Net investment income (loss) | | .77% I | | 1.57% | | .36% | | .92% | | 1.12% | | .53% |
| Supplemental Data | | | | | | | | | | | | |
| Net assets, end of period (000 omitted) | $ | 300,688 | $ | 386,534 | $ | 402,667 | $ | 286,126 | $ | 356,107 | $ | 343,164 |
Portfolio turnover rate J | | 19% I | | 26% | | 25% | | 31% | | 21% | | 23% |
A Calculated based on average shares outstanding during the period.
B Net investment income (loss) is affected by the timing of the declaration of dividends by any underlying mutual funds or exchange-traded funds (ETFs). Net investment income (loss) of any such underlying funds is not included in the Fund's net investment income (loss) ratio.
C Total distributions per share do not sum due to rounding.
D Total returns for periods of less than one year are not annualized.
E Total returns would have been lower if certain expenses had not been reduced during the applicable periods shown.
F Total returns do not include the effect of the sales charges.
G Fees and expenses of any underlying mutual funds or exchange-traded funds (ETFs) are not included in the Fund's expense ratio. The Fund indirectly bears its proportionate share of these expenses. For additional expense information related to investments in Fidelity Central Funds, please refer to the "Investments in Fidelity Central Funds" note found in the Notes to Financial Statements section of the most recent Annual or Semi-Annual report.
H Expense ratios reflect operating expenses of the class. Expenses before reductions do not reflect amounts reimbursed, waived, or reduced through arrangements with the investment adviser, brokerage services, or other offset arrangements, if applicable, and do not represent the amount paid by the class during periods when reimbursements, waivers or reductions occur.
I Annualized
J Amount does not include the portfolio activity of any underlying mutual funds or exchange-traded funds (ETFs).
| Fidelity Advisor Freedom® 2040 Fund Class C |
| |
| | Six months ended (Unaudited) September 30, 2022 | | Years ended March 31, 2022 | | 2021 | | 2020 | | 2019 | | 2018 |
Selected Per-Share Data | | | | | | | | | | | | |
| Net asset value, beginning of period | $ | 15.71 | $ | 16.91 | $ | 11.71 | $ | 14.14 | $ | 15.32 | $ | 14.28 |
| Income from Investment Operations | | | | | | | | | | | | |
Net investment income (loss) A,B | | .02 | | .18 | | (.02) | | .06 | | .09 | | - C |
| Net realized and unrealized gain (loss) | | (3.18) | | .22 | | 6.11 | | (1.52) | | .18 | | 1.77 |
| Total from investment operations | | (3.16) | | .40 | | 6.09 | | (1.46) | | .27 | | 1.77 |
| Distributions from net investment income | | - | | (.22) | | (.04) | | (.09) | | (.14) | | (.07) |
| Distributions from net realized gain | | (1.15) | | (1.38) | | (.85) | | (.88) | | (1.31) | | (.66) |
| Total distributions | | (1.15) | | (1.60) | | (.89) | | (.97) | | (1.45) | | (.73) |
| Net asset value, end of period | $ | 11.40 | $ | 15.71 | $ | 16.91 | $ | 11.71 | $ | 14.14 | $ | 15.32 |
Total Return D,E,F | | (20.95)% | | 1.98% | | 54.12% | | (11.31)% | | 2.37% | | 12.52% |
Ratios to Average Net Assets B,G,H | | | | | | | | | | | | |
| Expenses before reductions | | 1.75% I | | 1.75% | | 1.75% | | 1.75% | | 1.74% J | | 1.63% |
| Expenses net of fee waivers, if any | | 1.75% I | | 1.75% | | 1.75% | | 1.75% | | 1.74% J | | 1.63% |
| Expenses net of all reductions | | 1.75% I | | 1.75% | | 1.75% | | 1.75% | | 1.74% J | | 1.63% |
| Net investment income (loss) | | .27% I | | 1.07% | | (.14)% | | .42% | | .62% | | .03% |
| Supplemental Data | | | | | | | | | | | | |
| Net assets, end of period (000 omitted) | $ | 32,308 | $ | 42,441 | $ | 56,710 | $ | 41,153 | $ | 53,715 | $ | 84,365 |
Portfolio turnover rate K | | 19% I | | 26% | | 25% | | 31% | | 21% | | 23% |
A Calculated based on average shares outstanding during the period.
B Net investment income (loss) is affected by the timing of the declaration of dividends by any underlying mutual funds or exchange-traded funds (ETFs). Net investment income (loss) of any such underlying funds is not included in the Fund's net investment income (loss) ratio.
C Amount represents less than $.005 per share.
D Total returns for periods of less than one year are not annualized.
E Total returns would have been lower if certain expenses had not been reduced during the applicable periods shown.
F Total returns do not include the effect of the contingent deferred sales charge.
G Fees and expenses of any underlying mutual funds or exchange-traded funds (ETFs) are not included in the Fund's expense ratio. The Fund indirectly bears its proportionate share of these expenses. For additional expense information related to investments in Fidelity Central Funds, please refer to the "Investments in Fidelity Central Funds" note found in the Notes to Financial Statements section of the most recent Annual or Semi-Annual report.
H Expense ratios reflect operating expenses of the class. Expenses before reductions do not reflect amounts reimbursed, waived, or reduced through arrangements with the investment adviser, brokerage services, or other offset arrangements, if applicable, and do not represent the amount paid by the class during periods when reimbursements, waivers or reductions occur.
I Annualized
J On certain classes, the size and fluctuation of net assets and expense amounts may cause ratios to differ from contractual rates.
K Amount does not include the portfolio activity of any underlying mutual funds or exchange-traded funds (ETFs).
| Fidelity Advisor Freedom® 2040 Fund Class I |
| |
| | Six months ended (Unaudited) September 30, 2022 | | Years ended March 31, 2022 | | 2021 | | 2020 | | 2019 | | 2018 |
Selected Per-Share Data | | | | | | | | | | | | |
| Net asset value, beginning of period | $ | 16.54 | $ | 17.69 | $ | 12.17 | $ | 14.62 | $ | 15.78 | $ | 14.65 |
| Income from Investment Operations | | | | | | | | | | | | |
Net investment income (loss) A,B | | .09 | | .37 | | .13 | | .21 | | .24 | | .16 |
| Net realized and unrealized gain (loss) | | (3.36) | | .23 | | 6.39 | | (1.57) | | .16 | | 1.83 |
| Total from investment operations | | (3.27) | | .60 | | 6.52 | | (1.36) | | .40 | | 1.99 |
| Distributions from net investment income | | - | | (.37) | | (.14) | | (.20) | | (.26) | | (.19) |
| Distributions from net realized gain | | (1.18) | | (1.38) | | (.85) | | (.89) | | (1.31) | | (.67) |
| Total distributions | | (1.18) | | (1.75) | | (1.00) C | | (1.09) | | (1.56) C | | (.86) |
| Net asset value, end of period | $ | 12.09 | $ | 16.54 | $ | 17.69 | $ | 12.17 | $ | 14.62 | $ | 15.78 |
Total Return D,E | | (20.58)% | | 3.03% | | 55.69% | | (10.35)% | | 3.31% | | 13.74% |
Ratios to Average Net Assets B,F,G | | | | | | | | | | | | |
| Expenses before reductions | | .75% H | | .75% | | .75% | | .75% | | .75% | | .63% |
| Expenses net of fee waivers, if any | | .75% H | | .75% | | .75% | | .75% | | .75% | | .63% |
| Expenses net of all reductions | | .75% H | | .75% | | .75% | | .75% | | .75% | | .63% |
| Net investment income (loss) | | 1.27% H | | 2.07% | | .86% | | 1.42% | | 1.62% | | 1.02% |
| Supplemental Data | | | | | | | | | | | | |
| Net assets, end of period (000 omitted) | $ | 735,848 | $ | 1,000,722 | $ | 1,045,866 | $ | 705,362 | $ | 805,102 | $ | 790,667 |
Portfolio turnover rate I | | 19% H | | 26% | | 25% | | 31% | | 21% | | 23% |
A Calculated based on average shares outstanding during the period.
B Net investment income (loss) is affected by the timing of the declaration of dividends by any underlying mutual funds or exchange-traded funds (ETFs). Net investment income (loss) of any such underlying funds is not included in the Fund's net investment income (loss) ratio.
C Total distributions per share do not sum due to rounding.
D Total returns for periods of less than one year are not annualized.
E Total returns would have been lower if certain expenses had not been reduced during the applicable periods shown.
F Fees and expenses of any underlying mutual funds or exchange-traded funds (ETFs) are not included in the Fund's expense ratio. The Fund indirectly bears its proportionate share of these expenses. For additional expense information related to investments in Fidelity Central Funds, please refer to the "Investments in Fidelity Central Funds" note found in the Notes to Financial Statements section of the most recent Annual or Semi-Annual report.
G Expense ratios reflect operating expenses of the class. Expenses before reductions do not reflect amounts reimbursed, waived, or reduced through arrangements with the investment adviser, brokerage services, or other offset arrangements, if applicable, and do not represent the amount paid by the class during periods when reimbursements, waivers or reductions occur.
H Annualized
I Amount does not include the portfolio activity of any underlying mutual funds or exchange-traded funds (ETFs).
| Fidelity Advisor Freedom® 2040 Fund Class Z |
| |
| | Six months ended (Unaudited) September 30, 2022 | | Years ended March 31, 2022 | | 2021 | | 2020 | | 2019 A |
Selected Per-Share Data | | | | | | | | | | |
| Net asset value, beginning of period | $ | 16.38 | $ | 17.54 | $ | 12.08 | $ | 14.56 | $ | 15.85 |
| Income from Investment Operations | | | | | | | | | | |
Net investment income (loss) B,C | | .09 | | .38 | | .15 | | .22 | | .36 |
| Net realized and unrealized gain (loss) | | (3.32) | | .24 | | 6.33 | | (1.55) | | (.69) |
| Total from investment operations | | (3.23) | | .62 | | 6.48 | | (1.33) | | (.33) |
| Distributions from net investment income | | - | | (.40) | | (.17) | | (.23) | | (.33) |
| Distributions from net realized gain | | (1.19) | | (1.38) | | (.85) | | (.91) | | (.63) |
| Total distributions | | (1.19) | | (1.78) | | (1.02) | | (1.15) D | | (.96) |
| Net asset value, end of period | $ | 11.96 | $ | 16.38 | $ | 17.54 | $ | 12.08 | $ | 14.56 |
Total Return E,F | | (20.53)% | | 3.14% | | 55.80% | | (10.31)% | | (1.30)% |
Ratios to Average Net Assets C,G,H | | | | | | | | | | |
| Expenses before reductions | | .64% I | | .64% | | .64% | | .65% | | .65% I,J |
| Expenses net of fee waivers, if any | | .64% I | | .64% | | .64% | | .65% | | .65% I,J |
| Expenses net of all reductions | | .64% I | | .64% | | .64% | | .65% | | .65% I,J |
| Net investment income (loss) | | 1.38% I | | 2.17% | | .97% | | 1.52% | | 5.06% I |
| Supplemental Data | | | | | | | | | | |
| Net assets, end of period (000 omitted) | $ | 85,891 | $ | 80,498 | $ | 43,822 | $ | 20,000 | $ | 1,501 |
Portfolio turnover rate K | | 19% I | | 26% | | 25% | | 31% | | 21% |
A For the period October 2, 2018 (commencement of sale of shares) through March 31, 2019.
B Calculated based on average shares outstanding during the period.
C Net investment income (loss) is affected by the timing of the declaration of dividends by any underlying mutual funds or exchange-traded funds (ETFs). Net investment income (loss) of any such underlying funds is not included in the Fund's net investment income (loss) ratio.
D Total distributions per share do not sum due to rounding.
E Total returns for periods of less than one year are not annualized.
F Total returns would have been lower if certain expenses had not been reduced during the applicable periods shown.
G Fees and expenses of any underlying mutual funds or exchange-traded funds (ETFs) are not included in the Fund's expense ratio. The Fund indirectly bears its proportionate share of these expenses. For additional expense information related to investments in Fidelity Central Funds, please refer to the "Investments in Fidelity Central Funds" note found in the Notes to Financial Statements section of the most recent Annual or Semi-Annual report.
H Expense ratios reflect operating expenses of the class. Expenses before reductions do not reflect amounts reimbursed, waived, or reduced through arrangements with the investment adviser, brokerage services, or other offset arrangements, if applicable, and do not represent the amount paid by the class during periods when reimbursements, waivers or reductions occur.
I Annualized
J On certain classes, the size and fluctuation of net assets and expense amounts may cause ratios to differ from contractual rates.
K Amount does not include the portfolio activity of any underlying mutual funds or exchange-traded funds (ETFs).
| Fidelity Advisor Freedom® 2040 Fund Class Z6 |
| |
| | Six months ended (Unaudited) September 30, 2022 | | Years ended March 31, 2022 | | 2021 | | 2020 | | 2019 | | 2018 A |
Selected Per-Share Data | | | | | | | | | | | | |
| Net asset value, beginning of period | $ | 16.50 | $ | 17.64 | $ | 12.13 | $ | 14.60 | $ | 15.76 | $ | 15.04 |
| Income from Investment Operations | | | | | | | | | | | | |
Net investment income (loss) B,C | | .11 | | .41 | | .17 | | .24 | | .28 | | .18 |
| Net realized and unrealized gain (loss) | | (3.36) | | .24 | | 6.38 | | (1.57) | | .17 | | 1.20 |
| Total from investment operations | | (3.25) | | .65 | | 6.55 | | (1.33) | | .45 | | 1.38 |
| Distributions from net investment income | | - | | (.41) | | (.18) | | (.24) | | (.30) | | (.23) |
| Distributions from net realized gain | | (1.19) | | (1.38) | | (.85) | | (.90) | | (1.31) | | (.42) |
| Total distributions | | (1.19) | | (1.79) | | (1.04) D | | (1.14) | | (1.61) | | (.66) D |
| Net asset value, end of period | $ | 12.06 | $ | 16.50 | $ | 17.64 | $ | 12.13 | $ | 14.60 | $ | 15.76 |
Total Return E,F | | (20.48)% | | 3.31% | | 56.14% | | (10.24)% | | 3.64% | | 9.12% |
Ratios to Average Net Assets C,G,H | | | | | | | | | | | | |
| Expenses before reductions | | .49% I | | .49% | | .49% | | .49% | | .49% | | .51% I,J |
| Expenses net of fee waivers, if any | | .49% I | | .49% | | .49% | | .49% | | .49% | | .51% I,J |
| Expenses net of all reductions | | .49% I | | .49% | | .49% | | .49% | | .49% | | .51% I,J |
| Net investment income (loss) | | 1.53% I | | 2.32% | | 1.12% | | 1.67% | | 1.87% | | 1.39% I |
| Supplemental Data | | | | | | | | | | | | |
| Net assets, end of period (000 omitted) | $ | 191,378 | $ | 200,666 | $ | 140,291 | $ | 57,216 | $ | 41,066 | $ | 11,861 |
Portfolio turnover rate K | | 19% I | | 26% | | 25% | | 31% | | 21% | | 23% |
A For the period June 6, 2017 (commencement of sale of shares) through March 31, 2018.
B Calculated based on average shares outstanding during the period.
C Net investment income (loss) is affected by the timing of the declaration of dividends by any underlying mutual funds or exchange-traded funds (ETFs). Net investment income (loss) of any such underlying funds is not included in the Fund's net investment income (loss) ratio.
D Total distributions per share do not sum due to rounding.
E Total returns for periods of less than one year are not annualized.
F Total returns would have been lower if certain expenses had not been reduced during the applicable periods shown.
G Fees and expenses of any underlying mutual funds or exchange-traded funds (ETFs) are not included in the Fund's expense ratio. The Fund indirectly bears its proportionate share of these expenses. For additional expense information related to investments in Fidelity Central Funds, please refer to the "Investments in Fidelity Central Funds" note found in the Notes to Financial Statements section of the most recent Annual or Semi-Annual report.
H Expense ratios reflect operating expenses of the class. Expenses before reductions do not reflect amounts reimbursed, waived, or reduced through arrangements with the investment adviser, brokerage services, or other offset arrangements, if applicable, and do not represent the amount paid by the class during periods when reimbursements, waivers or reductions occur.
I Annualized
J On certain classes, the size and fluctuation of net assets and expense amounts may cause ratios to differ from contractual rates.
K Amount does not include the portfolio activity of any underlying mutual funds or exchange-traded funds (ETFs).
The information in the following table is based on the direct Investments of the Fund.
Top Holdings (% of Fund's net assets) |
| |
| Fidelity Series Emerging Markets Opportunities Fund | 13.2 | |
| Fidelity Series Large Cap Stock Fund | 9.7 | |
| Fidelity Series Overseas Fund | 7.5 | |
| Fidelity Series International Value Fund | 7.4 | |
| Fidelity Series International Growth Fund | 7.4 | |
| Fidelity Series Value Discovery Fund | 6.4 | |
| Fidelity Advisor Series Equity Growth Fund | 6.4 | |
| Fidelity Series Stock Selector Large Cap Value Fund | 6.2 | |
| Fidelity Series Opportunistic Insights Fund | 5.8 | |
| Fidelity Series Long-Term Treasury Bond Index Fund | 5.7 | |
| | 75.7 | |
| |
Domestic Equity Funds category includes Fidelity Series Commodity Strategy Fund which invests in commodity-related investments.
Asset Allocation (% of Fund's net assets) |
|
Percentages shown as 0.0% may reflect amounts less than 0.05%. |
|
Fidelity Advisor Freedom® 2045 Fund
Showing Percentage of Net Assets
| U.S. Treasury Obligations - 0.1% |
| | | Principal Amount (a) | Value ($) |
U.S. Treasury Bills, yield at date of purchase 1.87% to 3.29% 10/6/22 to 12/29/22 (b) (Cost $968,790) | | 970,000 | 968,846 |
| | | | |
| Domestic Equity Funds - 49.9% |
| | | Shares | Value ($) |
| Fidelity Advisor Series Equity Growth Fund (c) | | 7,788,280 | 94,627,602 |
| Fidelity Advisor Series Growth Opportunities Fund (c) | | 7,615,362 | 66,786,729 |
| Fidelity Advisor Series Small Cap Fund (c) | | 3,945,626 | 41,310,702 |
| Fidelity Series All-Sector Equity Fund (c) | | 4,384,178 | 37,616,249 |
| Fidelity Series Commodity Strategy Fund (c) | | 8,319,706 | 17,388,185 |
| Fidelity Series Large Cap Stock Fund (c) | | 9,768,082 | 144,274,578 |
| Fidelity Series Large Cap Value Index Fund (c) | | 1,239,084 | 15,761,149 |
| Fidelity Series Opportunistic Insights Fund (c) | | 6,057,575 | 86,078,139 |
| Fidelity Series Small Cap Opportunities Fund (c) | | 4,612,156 | 49,719,037 |
| Fidelity Series Stock Selector Large Cap Value Fund (c) | | 8,214,229 | 91,752,940 |
| Fidelity Series Value Discovery Fund (c) | | 6,875,498 | 94,675,606 |
| TOTAL DOMESTIC EQUITY FUNDS (Cost $739,653,990) | | | 739,990,916 |
| | | | |
| International Equity Funds - 42.0% |
| | | Shares | Value ($) |
| Fidelity Series Canada Fund (c) | | 3,868,770 | 47,972,748 |
| Fidelity Series Emerging Markets Fund (c) | | 2,931,060 | 21,220,877 |
| Fidelity Series Emerging Markets Opportunities Fund (c) | | 13,420,007 | 194,858,502 |
| Fidelity Series International Growth Fund (c) | | 8,520,409 | 109,231,646 |
| Fidelity Series International Small Cap Fund (c) | | 2,092,745 | 28,628,745 |
| Fidelity Series International Value Fund (c) | | 12,822,513 | 110,145,388 |
| Fidelity Series Overseas Fund (c) | | 11,572,690 | 110,287,737 |
| TOTAL INTERNATIONAL EQUITY FUNDS (Cost $680,027,424) | | | 622,345,643 |
| | | | |
| Bond Funds - 7.5% |
| | | Shares | Value ($) |
| Fidelity Series 5+ Year Inflation-Protected Bond Index Fund (c) | | 183,269 | 1,464,318 |
| Fidelity Series Emerging Markets Debt Fund (c) | | 1,137,649 | 7,804,275 |
| Fidelity Series Emerging Markets Debt Local Currency Fund (c) | | 322,119 | 2,567,289 |
| Fidelity Series Floating Rate High Income Fund (c) | | 173,349 | 1,508,139 |
| Fidelity Series High Income Fund (c) | | 1,022,793 | 8,059,612 |
| Fidelity Series International Credit Fund (c) | | 80,987 | 637,364 |
| Fidelity Series Long-Term Treasury Bond Index Fund (c) | | 14,175,234 | 84,626,147 |
| Fidelity Series Real Estate Income Fund (c) | | 401,268 | 3,820,070 |
| TOTAL BOND FUNDS (Cost $146,664,171) | | | 110,487,214 |
| | | | |
| Short-Term Funds - 0.5% |
| | | Shares | Value ($) |
| Fidelity Cash Central Fund 3.10% (d) | | 393,579 | 393,658 |
| Fidelity Series Government Money Market Fund 3.00% (c)(e) | | 7,441,120 | 7,441,120 |
| Fidelity Series Short-Term Credit Fund (c) | | 0 | 1 |
| TOTAL SHORT-TERM FUNDS (Cost $7,834,779) | | | 7,834,779 |
| | | | |
| TOTAL INVESTMENT IN SECURITIES - 100.0% (Cost $1,575,149,154) | 1,481,627,398 |
NET OTHER ASSETS (LIABILITIES) - 0.0% | (341,890) |
| NET ASSETS - 100.0% | 1,481,285,508 |
| | |
| Futures Contracts |
| | Number of contracts | Expiration Date | Notional Amount ($) | Value ($) | Unrealized Appreciation/ (Depreciation) ($) |
| Purchased | | | | | |
| | | | | | |
| Treasury Contracts | | | | | |
| CBOT 10-Year U.S. Treasury Note Contracts (United States) | 242 | Dec 2022 | 27,119,125 | (1,653,352) | (1,653,352) |
| CBOT Ultra Long Term U.S. Treasury Bond Contracts (United States) | 23 | Dec 2022 | 3,151,000 | (40,968) | (40,968) |
| | | | | | |
| TOTAL PURCHASED | | | | | (1,694,320) |
| | | | | | |
| Sold | | | | | |
| | | | | | |
| Equity Index Contracts | | | | | |
| CME E-mini S&P 500 Index Contracts (United States) | 43 | Dec 2022 | 7,743,225 | (424) | (424) |
| ICE E-mini MSCI EAFE Index Contracts (United States) | 67 | Dec 2022 | 5,563,010 | 754,892 | 754,892 |
| ICE E-mini MSCI Emerging Markets Index Contracts (United States) | 54 | Dec 2022 | 2,353,050 | 14,622 | 14,622 |
| | | | | | |
| TOTAL SOLD | | | | | 769,090 |
| | | | | | |
| TOTAL FUTURES CONTRACTS | | | | | (925,230) |
| The notional amount of futures purchased as a percentage of Net Assets is 2.0% |
| The notional amount of futures sold as a percentage of Net Assets is 1.1% |
Share amounts shown as "0" represent less than 1 share.
Legend
| (a) | Amount is stated in United States dollars unless otherwise noted. |
| (b) | Security or a portion of the security was pledged to cover margin requirements for futures contracts. At period end, the value of securities pledged amounted to $968,846. |
| (d) | Affiliated fund that is generally available only to investment companies and other accounts managed by Fidelity Investments. The rate quoted is the annualized seven-day yield of the fund at period end. A complete unaudited listing of the fund's holdings as of its most recent quarter end is available upon request. In addition, each Fidelity Central Fund's financial statements are available on the SEC's website or upon request. |
| (e) | The rate quoted is the annualized seven-day yield of the fund at period end. |
Affiliated Central Funds
Fiscal year to date information regarding the Fund's investments in Fidelity Central Funds, including the ownership percentage, is presented below.
| Affiliate | Value, beginning of period ($) | Purchases ($) | Sales Proceeds ($) | Dividend Income ($) | Realized Gain (loss) ($) | Change in Unrealized appreciation (depreciation) ($) | Value, end of period ($) | %ownership, end of period |
| Fidelity Cash Central Fund 3.10% | 1,248,678 | 8,155,174 | 9,010,194 | 10,025 | 4 | (4) | 393,658 | 0.0% |
| Total | 1,248,678 | 8,155,174 | 9,010,194 | 10,025 | 4 | (4) | 393,658 | |
| | | | | | | | | |
Amounts in the income column in the above table include any capital gain distributions from underlying funds, which are presented in the corresponding line item in the Statement of Operations, if applicable.
Affiliated Underlying Funds
Fiscal year to date information regarding the Fund's investments in affiliated Underlying Funds is presented below. Exchanges between classes of the same affiliated Underlying Funds may occur. If an Underlying Funds changes its name, the name presented below is the name in effect at period end.
| Affiliate | Value, beginning of period ($) | Purchases ($) | Sales Proceeds ($) | Dividend Income ($) | Realized Gain (loss) ($) | Change in Unrealized appreciation (depreciation) ($) | Value, end of period ($) |
| Fidelity Advisor Series Equity Growth Fund | 117,143,229 | 10,011,057 | 7,228,316 | - | (618,674) | (24,679,694) | 94,627,602 |
| Fidelity Advisor Series Growth Opportunities Fund | 80,347,745 | 15,351,327 | 5,077,452 | - | (1,065,626) | (22,769,265) | 66,786,729 |
| Fidelity Advisor Series Small Cap Fund | 53,170,477 | 2,894,055 | 4,724,456 | - | (587,291) | (9,442,083) | 41,310,702 |
| Fidelity Series 5+ Year Inflation-Protected Bond Index Fund | 1,874,708 | 59,036 | 166,774 | - | (12,035) | (290,617) | 1,464,318 |
| Fidelity Series All-Sector Equity Fund | 50,247,860 | 1,525,031 | 4,073,972 | - | (713,689) | (9,368,981) | 37,616,249 |
| Fidelity Series Canada Fund | 60,975,539 | 4,194,945 | 5,037,923 | - | (224,037) | (11,935,776) | 47,972,748 |
| Fidelity Series Commodity Strategy Fund | 27,856,965 | 14,935,250 | 10,219,370 | 12,954,760 | (2,993,001) | (12,191,659) | 17,388,185 |
| Fidelity Series Emerging Markets Debt Fund | 9,147,664 | 589,288 | 372,722 | 234,331 | (24,394) | (1,535,561) | 7,804,275 |
| Fidelity Series Emerging Markets Debt Local Currency Fund | 3,101,511 | 100,362 | 279,893 | - | (36,098) | (318,593) | 2,567,289 |
| Fidelity Series Emerging Markets Fund | 25,698,190 | 2,544,150 | 1,159,908 | - | (194,974) | (5,666,581) | 21,220,877 |
| Fidelity Series Emerging Markets Opportunities Fund | 237,804,549 | 18,891,840 | 10,953,242 | - | (2,019,347) | (48,865,299) | 194,858,501 |
| Fidelity Series Floating Rate High Income Fund | 1,874,445 | 104,582 | 375,641 | 45,546 | (34,839) | (60,408) | 1,508,139 |
| Fidelity Series Government Money Market Fund 3.00% | - | 7,441,146 | 26 | 337 | - | - | 7,441,120 |
| Fidelity Series High Income Fund | 11,346,061 | 585,722 | 2,484,051 | 262,259 | (241,465) | (1,146,655) | 8,059,612 |
| Fidelity Series International Credit Fund | 739,147 | 10,092 | - | 10,092 | - | (111,875) | 637,364 |
| Fidelity Series International Growth Fund | 139,397,745 | 10,950,454 | 9,012,691 | - | (1,507,400) | (30,596,462) | 109,231,646 |
| Fidelity Series International Small Cap Fund | 38,184,772 | 1,304,937 | 1,791,032 | - | (298,837) | (8,771,095) | 28,628,745 |
| Fidelity Series International Value Fund | 140,774,110 | 10,773,147 | 10,755,025 | - | (632,041) | (30,014,803) | 110,145,388 |
| Fidelity Series Investment Grade Bond Fund | 9,867,145 | 128,883 | 9,612,812 | 35,577 | (416,397) | 33,181 | - |
| Fidelity Series Large Cap Stock Fund | 184,347,901 | 16,888,885 | 16,107,812 | 8,683,966 | 606,367 | (41,460,763) | 144,274,578 |
| Fidelity Series Large Cap Value Index Fund | 19,938,774 | 628,579 | 1,444,546 | - | 168,639 | (3,530,297) | 15,761,149 |
| Fidelity Series Long-Term Treasury Bond Index Fund | 100,099,271 | 15,608,996 | 8,449,764 | 1,198,227 | (1,509,737) | (21,122,619) | 84,626,147 |
| Fidelity Series Opportunistic Insights Fund | 108,269,691 | 9,443,519 | 7,110,173 | - | (1,373,446) | (23,151,452) | 86,078,139 |
| Fidelity Series Overseas Fund | 140,158,352 | 10,464,601 | 5,233,237 | - | (588,775) | (34,513,204) | 110,287,737 |
| Fidelity Series Real Estate Income Fund | 6,689,655 | 441,717 | 2,427,582 | 286,392 | (97,149) | (786,571) | 3,820,070 |
| Fidelity Series Short-Term Credit Fund | - | 1 | - | - | - | - | 1 |
| Fidelity Series Small Cap Opportunities Fund | 65,648,231 | 4,292,306 | 6,867,509 | 2,317,322 | (716,474) | (12,637,517) | 49,719,037 |
| Fidelity Series Stock Selector Large Cap Value Fund | 117,656,095 | 4,789,799 | 10,807,718 | - | (506,053) | (19,379,183) | 91,752,940 |
| Fidelity Series Value Discovery Fund | 119,846,244 | 4,547,664 | 13,685,584 | - | 586,661 | (16,619,379) | 94,675,606 |
| | 1,872,206,076 | 169,501,371 | 155,459,231 | 26,028,809 | (15,050,112) | (390,933,211) | 1,480,264,893 |
Amounts in the income column in the above table include any capital gain distributions from underlying funds, which are presented in the corresponding line item in the Statement of Operations, if applicable.
Investment Valuation
The following is a summary of the inputs used, as of September 30, 2022, involving the Fund's assets and liabilities carried at fair value. The inputs or methodology used for valuing securities may not be an indication of the risk associated with investing in those securities. For more information on valuation inputs, and their aggregation into the levels used below, please refer to the Investment Valuation section in the accompanying Notes to Financial Statements.
| Valuation Inputs at Reporting Date: |
| Description | Total ($) | Level 1 ($) | Level 2 ($) | Level 3 ($) |
Investments in Securities: | | | | |
|
| Other Short-Term Investments | 968,846 | - | 968,846 | - |
|
| Domestic Equity Funds | 739,990,916 | 739,990,916 | - | - |
|
| International Equity Funds | 622,345,643 | 622,345,643 | - | - |
|
| Bond Funds | 110,487,214 | 110,487,214 | - | - |
|
| Short-Term Funds | 7,834,779 | 7,834,779 | - | - |
| Total Investments in Securities: | 1,481,627,398 | 1,480,658,552 | 968,846 | - |
Derivative Instruments: | | | | |
|
| Assets | | | | |
Futures Contracts | 769,514 | 769,514 | - | - |
| Total Assets | 769,514 | 769,514 | - | - |
|
| Liabilities | | | | |
Futures Contracts | (1,694,744) | (1,694,744) | - | - |
| Total Liabilities | (1,694,744) | (1,694,744) | - | - |
| Total Derivative Instruments: | (925,230) | (925,230) | - | - |
Value of Derivative Instruments
The following table is a summary of the Fund's value of derivative instruments by primary risk exposure as of September 30, 2022. For additional information on derivative instruments, please refer to the Derivative Instruments section in the accompanying Notes to Financial Statements.
Primary Risk Exposure / Derivative Type | Value |
| Asset ($) | Liability ($) |
| Equity Risk | | |
Futures Contracts (a) | 769,514 | (424) |
| Total Equity Risk | 769,514 | (424) |
| Interest Rate Risk | | |
Futures Contracts (a) | 0 | (1,694,321) |
| Total Interest Rate Risk | 0 | (1,694,321) |
| Total Value of Derivatives | 769,514 | (1,694,744) |
(a)Reflects gross cumulative appreciation (depreciation) on futures contracts as presented in the Schedule of Investments. In the Statement of Assets and Liabilities, the period end daily variation margin is included in receivable or payable for daily variation margin on futures contracts, and the net cumulative appreciation (depreciation) is included in Total accumulated earnings (loss).
Fidelity Advisor Freedom® 2045 Fund
| Statement of Assets and Liabilities |
| | | | September 30, 2022 (Unaudited) |
| | | | | |
| Assets | | | | |
| Investment in securities, at value - See accompanying schedule: | $ | | | |
Unaffiliated issuers (cost $968,790) | | $968,846 | | |
Fidelity Central Funds (cost $393,658) | | 393,658 | | |
Other affiliated issuers (cost $1,573,786,706) | | 1,480,264,894 | | |
| | | | | |
| Total Investment in Securities (cost $1,575,149,154) | | | $ | 1,481,627,398 |
| Receivable for investments sold | | | | 10,292,040 |
| Receivable for fund shares sold | | | | 2,121,164 |
| Distributions receivable from Fidelity Central Funds | | | | 1,244 |
| Receivable for daily variation margin on futures contracts | | | | 8,091 |
Total assets | | | | 1,494,049,937 |
| Liabilities | | | | |
| Payable for investments purchased | | 8,440,002 | | |
| Payable for fund shares redeemed | | 3,080,265 | | |
| Accrued management fee | | 938,284 | | |
| Distribution and service plan fees payable | | 211,059 | | |
| Payable for daily variation margin on futures contracts | | 94,819 | | |
| Total Liabilities | | | | 12,764,429 |
| Net Assets | | | $ | 1,481,285,508 |
| Net Assets consist of: | | | | |
| Paid in capital | | | $ | 1,587,619,035 |
| Total accumulated earnings (loss) | | | | (106,333,527) |
| Net Assets | | | $ | 1,481,285,508 |
| | | | | |
| Net Asset Value and Maximum Offering Price | | | | |
| Class A : | | | | |
Net Asset Value and redemption price per share ($467,331,527 ÷ 49,640,699 shares) (a) | | | $ | 9.41 |
| Maximum offering price per share (100/94.25 of $9.41) | | | $ | 9.98 |
| Class M : | | | | |
Net Asset Value and redemption price per share ($195,642,790 ÷ 21,105,688 shares) (a) | | | $ | 9.27 |
| Maximum offering price per share (100/96.50 of $9.27) | | | $ | 9.61 |
| Class C : | | | | |
Net Asset Value and offering price per share ($21,757,818 ÷ 2,411,704 shares) (a) | | | $ | 9.02 |
| Class I : | | | | |
Net Asset Value , offering price and redemption price per share ($562,349,418 ÷ 59,036,379 shares) | | | $ | 9.53 |
| Class Z : | | | | |
Net Asset Value , offering price and redemption price per share ($64,885,290 ÷ 6,921,094 shares) | | | $ | 9.38 |
| Class Z6 : | | | | |
Net Asset Value , offering price and redemption price per share ($169,318,665 ÷ 17,768,665 shares) | | | $ | 9.53 |
(a)Redemption price per share is equal to net asset value less any applicable contingent deferred sales charge. |
| Statement of Operations |
| | | | Six months ended September 30, 2022 (Unaudited) |
| Investment Income | | | | |
| Dividends: | | | | |
| Affiliated issuers | | | $ | 16,739,418 |
| Interest | | | | 7,597 |
| Income from Fidelity Central Funds | | | | 10,025 |
| Total Income | | | | 16,757,040 |
| Expenses | | | | |
| Management fee | $ | 5,997,145 | | |
| Distribution and service plan fees | | 1,356,011 | | |
| Independent trustees' fees and expenses | | 2,911 | | |
| Total expenses before reductions | | 7,356,067 | | |
| Expense reductions | | (21) | | |
| Total expenses after reductions | | | | 7,356,046 |
| Net Investment income (loss) | | | | 9,400,994 |
| Realized and Unrealized Gain (Loss) | | | | |
| Net realized gain (loss) on: | | | | |
| Investment Securities: | | | | |
| Unaffiliated issuers | | 448 | | |
| Fidelity Central Funds | | 4 | | |
| Other affiliated issuers | | (15,050,112) | | |
| Futures contracts | | (1,197,064) | | |
| Capital gain distributions from underlying funds: | | | | |
| Affiliated issuers | | 9,289,391 | | |
| Total net realized gain (loss) | | | | (6,957,333) |
| Change in net unrealized appreciation (depreciation) on: | | | | |
| Investment Securities: | | | | |
| Unaffiliated issuers | | 39 | | |
| Fidelity Central Funds | | (4) | | |
| Other affiliated issuers | | (390,933,211) | | |
| Futures contracts | | (977,990) | | |
| Total change in net unrealized appreciation (depreciation) | | | | (391,911,166) |
| Net gain (loss) | | | | (398,868,499) |
| Net increase (decrease) in net assets resulting from operations | | | $ | (389,467,505) |
| Statement of Changes in Net Assets |
| |
| | Six months ended September 30, 2022 (Unaudited) | | Year ended March 31, 2022 |
| Increase (Decrease) in Net Assets | | | | |
| Operations | | | | |
| Net investment income (loss) | $ | 9,400,994 | $ | 37,884,796 |
| Net realized gain (loss) | | (6,957,333) | | 186,459,208 |
| Change in net unrealized appreciation (depreciation) | | (391,911,166) | | (168,371,249) |
| Net increase (decrease) in net assets resulting from operations | | (389,467,505) | | 55,972,755 |
| Distributions to shareholders | | (131,897,862) | | (183,271,312) |
| Share transactions - net increase (decrease) | | 128,799,068 | | 139,336,201 |
| Total increase (decrease) in net assets | | (392,566,299) | | 12,037,644 |
| | | | | |
| Net Assets | | | | |
| Beginning of period | | 1,873,851,807 | | 1,861,814,163 |
| End of period | $ | 1,481,285,508 | $ | 1,873,851,807 |
| | | | | |
| | | | | |
Financial Highlights
| Fidelity Advisor Freedom® 2045 Fund Class A |
| |
| | Six months ended (Unaudited) September 30, 2022 | | Years ended March 31, 2022 | | 2021 | | 2020 | | 2019 | | 2018 |
Selected Per-Share Data | | | | | | | | | | | | |
| Net asset value, beginning of period | $ | 12.91 | $ | 13.79 | $ | 9.43 | $ | 11.33 | $ | 12.21 | $ | 11.26 |
| Income from Investment Operations | | | | | | | | | | | | |
Net investment income (loss) A,B | | .05 | | .25 | | .07 | | .13 | | .16 | | .10 |
| Net realized and unrealized gain (loss) | | (2.64) | | .18 | | 4.97 | | (1.22) | | .13 | | 1.40 |
| Total from investment operations | | (2.59) | | .43 | | 5.04 | | (1.09) | | .29 | | 1.50 |
| Distributions from net investment income | | - | | (.27) | | (.10) | | (.14) | | (.18) | | (.12) |
| Distributions from net realized gain | | (.91) | | (1.05) | | (.59) | | (.67) | | (.99) | | (.43) |
| Total distributions | | (.91) | | (1.31) C | | (.68) C | | (.81) | | (1.17) | | (.55) |
| Net asset value, end of period | $ | 9.41 | $ | 12.91 | $ | 13.79 | $ | 9.43 | $ | 11.33 | $ | 12.21 |
Total Return D,E,F | | (20.87)% | | 2.77% | | 55.40% | | (10.68)% | | 3.13% | | 13.44% |
Ratios to Average Net Assets B,G,H | | | | | | | | | | | | |
| Expenses before reductions | | 1.00% I | | 1.00% | | 1.00% | | 1.00% | | .99% J | | .87% |
| Expenses net of fee waivers, if any | | 1.00% I | | 1.00% | | 1.00% | | 1.00% | | .99% J | | .87% |
| Expenses net of all reductions | | 1.00% I | | 1.00% | | 1.00% | | 1.00% | | .99% J | | .87% |
| Net investment income (loss) | | 1.01% I | | 1.82% | | .62% | | 1.19% | | 1.38% | | .79% |
| Supplemental Data | | | | | | | | | | | | |
| Net assets, end of period (000 omitted) | $ | 467,332 | $ | 604,140 | $ | 643,283 | $ | 456,849 | $ | 547,563 | $ | 566,474 |
Portfolio turnover rate K | | 19% I | | 27% | | 25% | | 30% | | 22% | | 21% |
A Calculated based on average shares outstanding during the period.
B Net investment income (loss) is affected by the timing of the declaration of dividends by any underlying mutual funds or exchange-traded funds (ETFs). Net investment income (loss) of any such underlying funds is not included in the Fund's net investment income (loss) ratio.
C Total distributions per share do not sum due to rounding.
D Total returns for periods of less than one year are not annualized.
E Total returns would have been lower if certain expenses had not been reduced during the applicable periods shown.
F Total returns do not include the effect of the sales charges.
G Fees and expenses of any underlying mutual funds or exchange-traded funds (ETFs) are not included in the Fund's expense ratio. The Fund indirectly bears its proportionate share of these expenses. For additional expense information related to investments in Fidelity Central Funds, please refer to the "Investments in Fidelity Central Funds" note found in the Notes to Financial Statements section of the most recent Annual or Semi-Annual report.
H Expense ratios reflect operating expenses of the class. Expenses before reductions do not reflect amounts reimbursed, waived, or reduced through arrangements with the investment adviser, brokerage services, or other offset arrangements, if applicable, and do not represent the amount paid by the class during periods when reimbursements, waivers or reductions occur.
I Annualized
J On certain classes, the size and fluctuation of net assets and expense amounts may cause ratios to differ from contractual rates.
K Amount does not include the portfolio activity of any underlying mutual funds or exchange-traded funds (ETFs).
| Fidelity Advisor Freedom® 2045 Fund Class M |
| |
| | Six months ended (Unaudited) September 30, 2022 | | Years ended March 31, 2022 | | 2021 | | 2020 | | 2019 | | 2018 |
Selected Per-Share Data | | | | | | | | | | | | |
| Net asset value, beginning of period | $ | 12.73 | $ | 13.62 | $ | 9.34 | $ | 11.22 | $ | 12.12 | $ | 11.19 |
| Income from Investment Operations | | | | | | | | | | | | |
Net investment income (loss) A,B | | .04 | | .22 | | .04 | | .10 | | .13 | | .06 |
| Net realized and unrealized gain (loss) | | (2.60) | | .18 | | 4.90 | | (1.20) | | .12 | | 1.39 |
| Total from investment operations | | (2.56) | | .40 | | 4.94 | | (1.10) | | .25 | | 1.45 |
| Distributions from net investment income | | - | | (.24) | | (.08) | | (.12) | | (.16) | | (.10) |
| Distributions from net realized gain | | (.90) | | (1.05) | | (.59) | | (.67) | | (.99) | | (.43) |
| Total distributions | | (.90) | | (1.29) | | (.66) C | | (.78) C | | (1.15) | | (.52) C |
| Net asset value, end of period | $ | 9.27 | $ | 12.73 | $ | 13.62 | $ | 9.34 | $ | 11.22 | $ | 12.12 |
Total Return D,E,F | | (20.91)% | | 2.54% | | 54.84% | | (10.80)% | | 2.79% | | 13.12% |
Ratios to Average Net Assets B,G,H | | | | | | | | | | | | |
| Expenses before reductions | | 1.25% I | | 1.25% | | 1.25% | | 1.25% | | 1.24% J | | 1.13% |
| Expenses net of fee waivers, if any | | 1.25% I | | 1.25% | | 1.25% | | 1.25% | | 1.24% J | | 1.13% |
| Expenses net of all reductions | | 1.25% I | | 1.25% | | 1.25% | | 1.25% | | 1.24% J | | 1.13% |
| Net investment income (loss) | | .75% I | | 1.57% | | .36% | | .94% | | 1.13% | | .54% |
| Supplemental Data | | | | | | | | | | | | |
| Net assets, end of period (000 omitted) | $ | 195,643 | $ | 250,719 | $ | 258,276 | $ | 181,179 | $ | 210,625 | $ | 207,442 |
Portfolio turnover rate K | | 19% I | | 27% | | 25% | | 30% | | 22% | | 21% |
A Calculated based on average shares outstanding during the period.
B Net investment income (loss) is affected by the timing of the declaration of dividends by any underlying mutual funds or exchange-traded funds (ETFs). Net investment income (loss) of any such underlying funds is not included in the Fund's net investment income (loss) ratio.
C Total distributions per share do not sum due to rounding.
D Total returns for periods of less than one year are not annualized.
E Total returns would have been lower if certain expenses had not been reduced during the applicable periods shown.
F Total returns do not include the effect of the sales charges.
G Fees and expenses of any underlying mutual funds or exchange-traded funds (ETFs) are not included in the Fund's expense ratio. The Fund indirectly bears its proportionate share of these expenses. For additional expense information related to investments in Fidelity Central Funds, please refer to the "Investments in Fidelity Central Funds" note found in the Notes to Financial Statements section of the most recent Annual or Semi-Annual report.
H Expense ratios reflect operating expenses of the class. Expenses before reductions do not reflect amounts reimbursed, waived, or reduced through arrangements with the investment adviser, brokerage services, or other offset arrangements, if applicable, and do not represent the amount paid by the class during periods when reimbursements, waivers or reductions occur.
I Annualized
J On certain classes, the size and fluctuation of net assets and expense amounts may cause ratios to differ from contractual rates.
K Amount does not include the portfolio activity of any underlying mutual funds or exchange-traded funds (ETFs).
| Fidelity Advisor Freedom® 2045 Fund Class C |
| |
| | Six months ended (Unaudited) September 30, 2022 | | Years ended March 31, 2022 | | 2021 | | 2020 | | 2019 | | 2018 |
Selected Per-Share Data | | | | | | | | | | | | |
| Net asset value, beginning of period | $ | 12.44 | $ | 13.36 | $ | 9.18 | $ | 11.07 | $ | 11.98 | $ | 11.08 |
| Income from Investment Operations | | | | | | | | | | | | |
Net investment income (loss) A,B | | .01 | | .14 | | (.02) | | .05 | | .07 | | - C |
| Net realized and unrealized gain (loss) | | (2.53) | | .17 | | 4.83 | | (1.20) | | .13 | | 1.38 |
| Total from investment operations | | (2.52) | | .31 | | 4.81 | | (1.15) | | .20 | | 1.38 |
| Distributions from net investment income | | - | | (.19) | | (.04) | | (.08) | | (.12) | | (.05) |
| Distributions from net realized gain | | (.90) | | (1.05) | | (.59) | | (.67) | | (.99) | | (.43) |
| Total distributions | | (.90) | | (1.23) D | | (.63) | | (.74) D | | (1.11) | | (.48) |
| Net asset value, end of period | $ | 9.02 | $ | 12.44 | $ | 13.36 | $ | 9.18 | $ | 11.07 | $ | 11.98 |
Total Return E,F,G | | (21.13)% | | 1.96% | | 54.24% | | (11.32)% | | 2.29% | | 12.59% |
Ratios to Average Net Assets B,H,I | | | | | | | | | | | | |
| Expenses before reductions | | 1.75% J | | 1.75% | | 1.75% | | 1.75% | | 1.74% K | | 1.63% |
| Expenses net of fee waivers, if any | | 1.75% J | | 1.75% | | 1.75% | | 1.75% | | 1.74% K | | 1.63% |
| Expenses net of all reductions | | 1.75% J | | 1.75% | | 1.75% | | 1.75% | | 1.74% K | | 1.63% |
| Net investment income (loss) | | .25% J | | 1.07% | | (.14)% | | .44% | | .63% | | .04% |
| Supplemental Data | | | | | | | | | | | | |
| Net assets, end of period (000 omitted) | $ | 21,758 | $ | 28,993 | $ | 33,637 | $ | 22,256 | $ | 25,383 | $ | 30,549 |
Portfolio turnover rate L | | 19% J | | 27% | | 25% | | 30% | | 22% | | 21% |
A Calculated based on average shares outstanding during the period.
B Net investment income (loss) is affected by the timing of the declaration of dividends by any underlying mutual funds or exchange-traded funds (ETFs). Net investment income (loss) of any such underlying funds is not included in the Fund's net investment income (loss) ratio.
C Amount represents less than $.005 per share.
D Total distributions per share do not sum due to rounding.
E Total returns for periods of less than one year are not annualized.
F Total returns would have been lower if certain expenses had not been reduced during the applicable periods shown.
G Total returns do not include the effect of the contingent deferred sales charge.
H Fees and expenses of any underlying mutual funds or exchange-traded funds (ETFs) are not included in the Fund's expense ratio. The Fund indirectly bears its proportionate share of these expenses. For additional expense information related to investments in Fidelity Central Funds, please refer to the "Investments in Fidelity Central Funds" note found in the Notes to Financial Statements section of the most recent Annual or Semi-Annual report.
I Expense ratios reflect operating expenses of the class. Expenses before reductions do not reflect amounts reimbursed, waived, or reduced through arrangements with the investment adviser, brokerage services, or other offset arrangements, if applicable, and do not represent the amount paid by the class during periods when reimbursements, waivers or reductions occur.
J Annualized
K On certain classes, the size and fluctuation of net assets and expense amounts may cause ratios to differ from contractual rates.
L Amount does not include the portfolio activity of any underlying mutual funds or exchange-traded funds (ETFs).
| Fidelity Advisor Freedom® 2045 Fund Class I |
| |
| | Six months ended (Unaudited) September 30, 2022 | | Years ended March 31, 2022 | | 2021 | | 2020 | | 2019 | | 2018 |
Selected Per-Share Data | | | | | | | | | | | | |
| Net asset value, beginning of period | $ | 13.04 | $ | 13.91 | $ | 9.50 | $ | 11.41 | $ | 12.29 | $ | 11.33 |
| Income from Investment Operations | | | | | | | | | | | | |
Net investment income (loss) A,B | | .07 | | .29 | | .10 | | .16 | | .19 | | .12 |
| Net realized and unrealized gain (loss) | | (2.66) | | .18 | | 5.02 | | (1.23) | | .13 | | 1.42 |
| Total from investment operations | | (2.59) | | .47 | | 5.12 | | (1.07) | | .32 | | 1.54 |
| Distributions from net investment income | | - | | (.29) | | (.12) | | (.16) | | (.20) | | (.14) |
| Distributions from net realized gain | | (.92) | | (1.05) | | (.59) | | (.68) | | (.99) | | (.44) |
| Total distributions | | (.92) | | (1.34) | | (.71) | | (.84) | | (1.20) C | | (.58) |
| Net asset value, end of period | $ | 9.53 | $ | 13.04 | $ | 13.91 | $ | 9.50 | $ | 11.41 | $ | 12.29 |
Total Return D,E | | (20.68)% | | 3.02% | | 55.77% | | (10.46)% | | 3.34% | | 13.77% |
Ratios to Average Net Assets B,F,G | | | | | | | | | | | | |
| Expenses before reductions | | .75% H | | .75% | | .75% | | .75% | | .75% | | .64% |
| Expenses net of fee waivers, if any | | .75% H | | .75% | | .75% | | .75% | | .75% | | .64% |
| Expenses net of all reductions | | .75% H | | .75% | | .75% | | .75% | | .75% | | .64% |
| Net investment income (loss) | | 1.25% H | | 2.07% | | .87% | | 1.44% | | 1.63% | | 1.03% |
| Supplemental Data | | | | | | | | | | | | |
| Net assets, end of period (000 omitted) | $ | 562,349 | $ | 752,617 | $ | 777,429 | $ | 522,314 | $ | 577,252 | $ | 543,170 |
Portfolio turnover rate I | | 19% H | | 27% | | 25% | | 30% | | 22% | | 21% |
A Calculated based on average shares outstanding during the period.
B Net investment income (loss) is affected by the timing of the declaration of dividends by any underlying mutual funds or exchange-traded funds (ETFs). Net investment income (loss) of any such underlying funds is not included in the Fund's net investment income (loss) ratio.
C Total distributions per share do not sum due to rounding.
D Total returns for periods of less than one year are not annualized.
E Total returns would have been lower if certain expenses had not been reduced during the applicable periods shown.
F Fees and expenses of any underlying mutual funds or exchange-traded funds (ETFs) are not included in the Fund's expense ratio. The Fund indirectly bears its proportionate share of these expenses. For additional expense information related to investments in Fidelity Central Funds, please refer to the "Investments in Fidelity Central Funds" note found in the Notes to Financial Statements section of the most recent Annual or Semi-Annual report.
G Expense ratios reflect operating expenses of the class. Expenses before reductions do not reflect amounts reimbursed, waived, or reduced through arrangements with the investment adviser, brokerage services, or other offset arrangements, if applicable, and do not represent the amount paid by the class during periods when reimbursements, waivers or reductions occur.
H Annualized
I Amount does not include the portfolio activity of any underlying mutual funds or exchange-traded funds (ETFs).
| Fidelity Advisor Freedom® 2045 Fund Class Z |
| |
| | Six months ended (Unaudited) September 30, 2022 | | Years ended March 31, 2022 | | 2021 | | 2020 | | 2019 A |
Selected Per-Share Data | | | | | | | | | | |
| Net asset value, beginning of period | $ | 12.91 | $ | 13.79 | $ | 9.43 | $ | 11.35 | $ | 12.36 |
| Income from Investment Operations | | | | | | | | | | |
Net investment income (loss) B,C | | .07 | | .30 | | .12 | | .17 | | .20 |
| Net realized and unrealized gain (loss) | | (2.62) | | .18 | | 4.96 | | (1.22) | | (.46) |
| Total from investment operations | | (2.55) | | .48 | | 5.08 | | (1.05) | | (.26) |
| Distributions from net investment income | | - | | (.31) | | (.14) | | (.18) | | (.26) |
| Distributions from net realized gain | | (.98) | | (1.05) | | (.59) | | (.69) | | (.49) |
| Total distributions | | (.98) | | (1.36) | | (.72) D | | (.87) | | (.75) |
| Net asset value, end of period | $ | 9.38 | $ | 12.91 | $ | 13.79 | $ | 9.43 | $ | 11.35 |
Total Return E,F | | (20.60)% | | 3.12% | | 55.85% | | (10.33)% | | (1.33)% |
Ratios to Average Net Assets C,G,H | | | | | | | | | | |
| Expenses before reductions | | .64% I | | .64% | | .64% | | .65% J | | .64% I,J |
| Expenses net of fee waivers, if any | | .64% I | | .64% | | .64% | | .65% J | | .64% I,J |
| Expenses net of all reductions | | .64% I | | .64% | | .64% | | .65% J | | .64% I,J |
| Net investment income (loss) | | 1.36% I | | 2.18% | | .97% | | 1.54% | | 3.71% I |
| Supplemental Data | | | | | | | | | | |
| Net assets, end of period (000 omitted) | $ | 64,885 | $ | 65,648 | $ | 35,350 | $ | 16,800 | $ | 1,376 |
Portfolio turnover rate K | | 19% I | | 27% | | 25% | | 30% | | 22% |
A For the period October 2, 2018 (commencement of sale of shares) through March 31, 2019.
B Calculated based on average shares outstanding during the period.
C Net investment income (loss) is affected by the timing of the declaration of dividends by any underlying mutual funds or exchange-traded funds (ETFs). Net investment income (loss) of any such underlying funds is not included in the Fund's net investment income (loss) ratio.
D Total distributions per share do not sum due to rounding.
E Total returns for periods of less than one year are not annualized.
F Total returns would have been lower if certain expenses had not been reduced during the applicable periods shown.
G Fees and expenses of any underlying mutual funds or exchange-traded funds (ETFs) are not included in the Fund's expense ratio. The Fund indirectly bears its proportionate share of these expenses. For additional expense information related to investments in Fidelity Central Funds, please refer to the "Investments in Fidelity Central Funds" note found in the Notes to Financial Statements section of the most recent Annual or Semi-Annual report.
H Expense ratios reflect operating expenses of the class. Expenses before reductions do not reflect amounts reimbursed, waived, or reduced through arrangements with the investment adviser, brokerage services, or other offset arrangements, if applicable, and do not represent the amount paid by the class during periods when reimbursements, waivers or reductions occur.
I Annualized
J On certain classes, the size and fluctuation of net assets and expense amounts may cause ratios to differ from contractual rates.
K Amount does not include the portfolio activity of any underlying mutual funds or exchange-traded funds (ETFs).
| Fidelity Advisor Freedom® 2045 Fund Class Z6 |
| |
| | Six months ended (Unaudited) September 30, 2022 | | Years ended March 31, 2022 | | 2021 | | 2020 | | 2019 | | 2018 A |
Selected Per-Share Data | | | | | | | | | | | | |
| Net asset value, beginning of period | $ | 13.02 | $ | 13.88 | $ | 9.48 | $ | 11.39 | $ | 12.28 | $ | 11.65 |
| Income from Investment Operations | | | | | | | | | | | | |
Net investment income (loss) B,C | | .08 | | .32 | | .14 | | .19 | | .22 | | .15 |
| Net realized and unrealized gain (loss) | | (2.66) | | .19 | | 4.99 | | (1.23) | | .12 | | .92 |
| Total from investment operations | | (2.58) | | .51 | | 5.13 | | (1.04) | | .34 | | 1.07 |
| Distributions from net investment income | | - | | (.32) | | (.15) | | (.19) | | (.24) | | (.18) |
| Distributions from net realized gain | | (.91) | | (1.05) | | (.59) | | (.69) | | (.99) | | (.26) |
| Total distributions | | (.91) | | (1.37) | | (.73) D | | (.87) D | | (1.23) | | (.44) |
| Net asset value, end of period | $ | 9.53 | $ | 13.02 | $ | 13.88 | $ | 9.48 | $ | 11.39 | $ | 12.28 |
Total Return E,F | | (20.62)% | | 3.32% | | 56.12% | | (10.22)% | | 3.58% | | 9.15% |
Ratios to Average Net Assets C,G,H | | | | | | | | | | | | |
| Expenses before reductions | | .49% I | | .49% | | .49% | | .49% | | .50% J | | .51% I,J |
| Expenses net of fee waivers, if any | | .49% I | | .49% | | .49% | | .49% | | .50% J | | .51% I,J |
| Expenses net of all reductions | | .49% I | | .49% | | .49% | | .49% | | .50% J | | .51% I,J |
| Net investment income (loss) | | 1.51% I | | 2.33% | | 1.12% | | 1.70% | | 1.88% | | 1.50% I |
| Supplemental Data | | | | | | | | | | | | |
| Net assets, end of period (000 omitted) | $ | 169,319 | $ | 171,735 | $ | 113,839 | $ | 44,798 | $ | 31,493 | $ | 9,112 |
Portfolio turnover rate K | | 19% I | | 27% | | 25% | | 30% | | 22% | | 21% |
A For the period June 6, 2017 (commencement of sale of shares) through March 31, 2018.
B Calculated based on average shares outstanding during the period.
C Net investment income (loss) is affected by the timing of the declaration of dividends by any underlying mutual funds or exchange-traded funds (ETFs). Net investment income (loss) of any such underlying funds is not included in the Fund's net investment income (loss) ratio.
D Total distributions per share do not sum due to rounding.
E Total returns for periods of less than one year are not annualized.
F Total returns would have been lower if certain expenses had not been reduced during the applicable periods shown.
G Fees and expenses of any underlying mutual funds or exchange-traded funds (ETFs) are not included in the Fund's expense ratio. The Fund indirectly bears its proportionate share of these expenses. For additional expense information related to investments in Fidelity Central Funds, please refer to the "Investments in Fidelity Central Funds" note found in the Notes to Financial Statements section of the most recent Annual or Semi-Annual report.
H Expense ratios reflect operating expenses of the class. Expenses before reductions do not reflect amounts reimbursed, waived, or reduced through arrangements with the investment adviser, brokerage services, or other offset arrangements, if applicable, and do not represent the amount paid by the class during periods when reimbursements, waivers or reductions occur.
I Annualized
J On certain classes, the size and fluctuation of net assets and expense amounts may cause ratios to differ from contractual rates.
K Amount does not include the portfolio activity of any underlying mutual funds or exchange-traded funds (ETFs).
The information in the following table is based on the direct Investments of the Fund.
Top Holdings (% of Fund's net assets) |
| |
| Fidelity Series Emerging Markets Opportunities Fund | 13.2 | |
| Fidelity Series Large Cap Stock Fund | 9.7 | |
| Fidelity Series Overseas Fund | 7.5 | |
| Fidelity Series International Value Fund | 7.4 | |
| Fidelity Series International Growth Fund | 7.4 | |
| Fidelity Series Value Discovery Fund | 6.4 | |
| Fidelity Advisor Series Equity Growth Fund | 6.4 | |
| Fidelity Series Stock Selector Large Cap Value Fund | 6.2 | |
| Fidelity Series Opportunistic Insights Fund | 5.8 | |
| Fidelity Series Long-Term Treasury Bond Index Fund | 5.7 | |
| | 75.7 | |
| |
Domestic Equity Funds category includes Fidelity Series Commodity Strategy Fund which invests in commodity-related investments.
Asset Allocation (% of Fund's net assets) |
|
Percentages shown as 0.0% may reflect amounts less than 0.05%. |
|
Fidelity Advisor Freedom® 2050 Fund
Showing Percentage of Net Assets
| U.S. Treasury Obligations - 0.1% |
| | | Principal Amount (a) | Value ($) |
U.S. Treasury Bills, yield at date of purchase 1.87% to 3.29% 10/6/22 to 12/29/22 (b) (Cost $839,065) | | 840,000 | 839,108 |
| | | | |
| Domestic Equity Funds - 50.0% |
| | | Shares | Value ($) |
| Fidelity Advisor Series Equity Growth Fund (c) | | 6,718,791 | 81,633,315 |
| Fidelity Advisor Series Growth Opportunities Fund (c) | | 6,569,609 | 57,615,472 |
| Fidelity Advisor Series Small Cap Fund (c) | | 3,403,799 | 35,637,777 |
| Fidelity Series All-Sector Equity Fund (c) | | 3,782,154 | 32,450,880 |
| Fidelity Series Commodity Strategy Fund (c) | | 7,182,215 | 15,010,829 |
| Fidelity Series Large Cap Stock Fund (c) | | 8,426,725 | 124,462,722 |
| Fidelity Series Large Cap Value Index Fund (c) | | 1,068,945 | 13,596,975 |
| Fidelity Series Opportunistic Insights Fund (c) | | 5,225,748 | 74,257,874 |
| Fidelity Series Small Cap Opportunities Fund (c) | | 3,978,706 | 42,890,455 |
| Fidelity Series Stock Selector Large Cap Value Fund (c) | | 7,086,237 | 79,153,267 |
| Fidelity Series Value Discovery Fund (c) | | 5,931,353 | 81,674,733 |
| TOTAL DOMESTIC EQUITY FUNDS (Cost $646,008,215) | | | 638,384,299 |
| | | | |
| International Equity Funds - 42.0% |
| | | Shares | Value ($) |
| Fidelity Series Canada Fund (c) | | 3,337,721 | 41,387,739 |
| Fidelity Series Emerging Markets Fund (c) | | 2,529,727 | 18,315,224 |
| Fidelity Series Emerging Markets Opportunities Fund (c) | | 11,577,223 | 168,101,280 |
| Fidelity Series International Growth Fund (c) | | 7,350,584 | 94,234,488 |
| Fidelity Series International Small Cap Fund (c) | | 1,805,352 | 24,697,217 |
| Fidelity Series International Value Fund (c) | | 11,061,951 | 95,022,162 |
| Fidelity Series Overseas Fund (c) | | 9,983,774 | 95,145,367 |
| TOTAL INTERNATIONAL EQUITY FUNDS (Cost $591,689,501) | | | 536,903,477 |
| | | | |
| Bond Funds - 7.4% |
| | | Shares | Value ($) |
| Fidelity Series 5+ Year Inflation-Protected Bond Index Fund (c) | | 158,096 | 1,263,186 |
| Fidelity Series Emerging Markets Debt Fund (c) | | 981,417 | 6,732,520 |
| Fidelity Series Emerging Markets Debt Local Currency Fund (c) | | 277,883 | 2,214,727 |
| Fidelity Series Floating Rate High Income Fund (c) | | 149,543 | 1,301,028 |
| Fidelity Series High Income Fund (c) | | 882,328 | 6,952,748 |
| Fidelity Series International Credit Fund (c) | | 63,647 | 500,900 |
| Fidelity Series Long-Term Treasury Bond Index Fund (c) | | 12,228,635 | 73,004,950 |
| Fidelity Series Real Estate Income Fund (c) | | 346,198 | 3,295,806 |
| TOTAL BOND FUNDS (Cost $126,138,053) | | | 95,265,865 |
| | | | |
| Short-Term Funds - 0.5% |
| | | Shares | Value ($) |
| Fidelity Cash Central Fund 3.10% (d) | | 323,026 | 323,090 |
| Fidelity Series Government Money Market Fund 3.00% (c)(e) | | 6,431,270 | 6,431,270 |
| Fidelity Series Short-Term Credit Fund (c) | | 1 | 13 |
| TOTAL SHORT-TERM FUNDS (Cost $6,754,373) | | | 6,754,373 |
| | | | |
| TOTAL INVESTMENT IN SECURITIES - 100.0% (Cost $1,371,429,207) | 1,278,147,122 |
NET OTHER ASSETS (LIABILITIES) - 0.0% | (292,955) |
| NET ASSETS - 100.0% | 1,277,854,167 |
| | |
| Futures Contracts |
| | Number of contracts | Expiration Date | Notional Amount ($) | Value ($) | Unrealized Appreciation/ (Depreciation) ($) |
| Purchased | | | | | |
| | | | | | |
| Treasury Contracts | | | | | |
| CBOT 10-Year U.S. Treasury Note Contracts (United States) | 209 | Dec 2022 | 23,421,063 | (1,425,830) | (1,425,830) |
| CBOT Ultra Long Term U.S. Treasury Bond Contracts (United States) | 20 | Dec 2022 | 2,740,000 | (35,292) | (35,292) |
| | | | | | |
| TOTAL PURCHASED | | | | | (1,461,122) |
| | | | | | |
| Sold | | | | | |
| | | | | | |
| Equity Index Contracts | | | | | |
| CME E-mini S&P 500 Index Contracts (United States) | 37 | Dec 2022 | 6,662,775 | (365) | (365) |
| ICE E-mini MSCI EAFE Index Contracts (United States) | 58 | Dec 2022 | 4,815,740 | 653,548 | 653,548 |
| ICE E-mini MSCI Emerging Markets Index Contracts (United States) | 47 | Dec 2022 | 2,048,025 | 12,727 | 12,727 |
| | | | | | |
| TOTAL SOLD | | | | | 665,910 |
| | | | | | |
| TOTAL FUTURES CONTRACTS | | | | | (795,212) |
| The notional amount of futures purchased as a percentage of Net Assets is 2.0% |
| The notional amount of futures sold as a percentage of Net Assets is 1.1% |
Legend
| (a) | Amount is stated in United States dollars unless otherwise noted. |
| (b) | Security or a portion of the security was pledged to cover margin requirements for futures contracts. At period end, the value of securities pledged amounted to $839,108. |
| (d) | Affiliated fund that is generally available only to investment companies and other accounts managed by Fidelity Investments. The rate quoted is the annualized seven-day yield of the fund at period end. A complete unaudited listing of the fund's holdings as of its most recent quarter end is available upon request. In addition, each Fidelity Central Fund's financial statements are available on the SEC's website or upon request. |
| (e) | The rate quoted is the annualized seven-day yield of the fund at period end. |
Affiliated Central Funds
Fiscal year to date information regarding the Fund's investments in Fidelity Central Funds, including the ownership percentage, is presented below.
| Affiliate | Value, beginning of period ($) | Purchases ($) | Sales Proceeds ($) | Dividend Income ($) | Realized Gain (loss) ($) | Change in Unrealized appreciation (depreciation) ($) | Value, end of period ($) | %ownership, end of period |
| Fidelity Cash Central Fund 3.10% | 1,098,518 | 6,993,041 | 7,768,470 | 8,558 | 1 | - | 323,090 | 0.0% |
| Total | 1,098,518 | 6,993,041 | 7,768,470 | 8,558 | 1 | - | 323,090 | |
| | | | | | | | | |
Amounts in the income column in the above table include any capital gain distributions from underlying funds, which are presented in the corresponding line item in the Statement of Operations, if applicable.
Affiliated Underlying Funds
Fiscal year to date information regarding the Fund's investments in affiliated Underlying Funds is presented below. Exchanges between classes of the same affiliated Underlying Funds may occur. If an Underlying Funds changes its name, the name presented below is the name in effect at period end.
| Affiliate | Value, beginning of period ($) | Purchases ($) | Sales Proceeds ($) | Dividend Income ($) | Realized Gain (loss) ($) | Change in Unrealized appreciation (depreciation) ($) | Value, end of period ($) |
| Fidelity Advisor Series Equity Growth Fund | 99,433,214 | 9,425,099 | 5,598,415 | - | (296,319) | (21,330,264) | 81,633,315 |
| Fidelity Advisor Series Growth Opportunities Fund | 68,200,624 | 13,748,901 | 3,979,696 | - | (698,919) | (19,655,438) | 57,615,472 |
| Fidelity Advisor Series Small Cap Fund | 45,132,112 | 2,889,988 | 3,810,936 | - | (440,415) | (8,132,972) | 35,637,777 |
| Fidelity Series 5+ Year Inflation-Protected Bond Index Fund | 1,591,252 | 64,220 | 132,822 | - | (8,587) | (250,877) | 1,263,186 |
| Fidelity Series All-Sector Equity Fund | 42,651,283 | 1,661,905 | 3,240,601 | - | (535,958) | (8,085,749) | 32,450,880 |
| Fidelity Series Canada Fund | 51,755,541 | 4,121,733 | 4,076,400 | - | (225,183) | (10,187,952) | 41,387,739 |
| Fidelity Series Commodity Strategy Fund | 23,658,649 | 13,115,174 | 8,661,029 | 11,175,549 | (2,736,618) | (10,365,347) | 15,010,829 |
| Fidelity Series Emerging Markets Debt Fund | 7,767,052 | 578,496 | 276,687 | 200,955 | (14,664) | (1,321,677) | 6,732,520 |
| Fidelity Series Emerging Markets Debt Local Currency Fund | 2,632,684 | 109,251 | 224,002 | - | (28,650) | (274,556) | 2,214,727 |
| Fidelity Series Emerging Markets Fund | 21,811,030 | 2,413,593 | 889,610 | - | (173,136) | (4,846,653) | 18,315,224 |
| Fidelity Series Emerging Markets Opportunities Fund | 201,849,774 | 18,366,564 | 8,539,887 | - | (2,075,522) | (41,499,649) | 168,101,280 |
| Fidelity Series Floating Rate High Income Fund | 1,590,996 | 103,273 | 311,751 | 39,050 | (31,704) | (49,786) | 1,301,028 |
| Fidelity Series Government Money Market Fund 3.00% | - | 6,431,270 | - | 291 | - | - | 6,431,270 |
| Fidelity Series High Income Fund | 9,630,545 | 582,011 | 2,072,365 | 224,669 | (218,313) | (969,130) | 6,952,748 |
| Fidelity Series International Credit Fund | 580,890 | 7,932 | - | 7,931 | - | (87,922) | 500,900 |
| Fidelity Series International Growth Fund | 118,322,049 | 10,458,699 | 7,053,902 | - | (1,433,682) | (26,058,676) | 94,234,488 |
| Fidelity Series International Small Cap Fund | 32,411,933 | 1,447,356 | 1,396,731 | - | (227,116) | (7,538,225) | 24,697,217 |
| Fidelity Series International Value Fund | 119,490,130 | 10,485,812 | 8,693,854 | - | (522,601) | (25,737,325) | 95,022,162 |
| Fidelity Series Investment Grade Bond Fund | 8,371,442 | 139,390 | 8,185,721 | 30,289 | (353,059) | 27,948 | - |
| Fidelity Series Large Cap Stock Fund | 156,477,660 | 15,888,115 | 12,880,480 | 7,474,451 | 123,499 | (35,146,072) | 124,462,722 |
| Fidelity Series Large Cap Value Index Fund | 16,924,449 | 683,258 | 1,129,139 | - | 81,758 | (2,963,351) | 13,596,975 |
| Fidelity Series Long-Term Treasury Bond Index Fund | 84,961,397 | 14,270,592 | 6,861,395 | 1,026,999 | (1,336,611) | (18,029,033) | 73,004,950 |
| Fidelity Series Opportunistic Insights Fund | 91,901,300 | 8,900,009 | 5,587,260 | - | (998,038) | (19,958,137) | 74,257,874 |
| Fidelity Series Overseas Fund | 118,967,596 | 10,035,428 | 3,811,888 | - | (442,813) | (29,602,956) | 95,145,367 |
| Fidelity Series Real Estate Income Fund | 5,677,483 | 408,427 | 2,031,719 | 247,383 | (71,291) | (687,094) | 3,295,806 |
| Fidelity Series Short-Term Credit Fund | - | 13 | - | - | - | - | 13 |
| Fidelity Series Small Cap Opportunities Fund | 55,723,282 | 4,165,072 | 5,568,289 | 1,998,998 | (482,967) | (10,946,643) | 42,890,455 |
| Fidelity Series Stock Selector Large Cap Value Fund | 99,868,527 | 4,984,385 | 8,650,760 | - | (495,316) | (16,553,569) | 79,153,267 |
| Fidelity Series Value Discovery Fund | 101,727,609 | 4,772,278 | 11,074,091 | - | 71,744 | (13,822,807) | 81,674,733 |
| | 1,589,110,503 | 160,258,244 | 124,739,430 | 22,426,565 | (13,570,481) | (334,073,912) | 1,276,984,924 |
Amounts in the income column in the above table include any capital gain distributions from underlying funds, which are presented in the corresponding line item in the Statement of Operations, if applicable.
Investment Valuation
The following is a summary of the inputs used, as of September 30, 2022, involving the Fund's assets and liabilities carried at fair value. The inputs or methodology used for valuing securities may not be an indication of the risk associated with investing in those securities. For more information on valuation inputs, and their aggregation into the levels used below, please refer to the Investment Valuation section in the accompanying Notes to Financial Statements.
| Valuation Inputs at Reporting Date: |
| Description | Total ($) | Level 1 ($) | Level 2 ($) | Level 3 ($) |
Investments in Securities: | | | | |
|
| Other Short-Term Investments | 839,108 | - | 839,108 | - |
|
| Domestic Equity Funds | 638,384,299 | 638,384,299 | - | - |
|
| International Equity Funds | 536,903,477 | 536,903,477 | - | - |
|
| Bond Funds | 95,265,865 | 95,265,865 | - | - |
|
| Short-Term Funds | 6,754,373 | 6,754,373 | - | - |
| Total Investments in Securities: | 1,278,147,122 | 1,277,308,014 | 839,108 | - |
Derivative Instruments: | | | | |
|
| Assets | | | | |
Futures Contracts | 666,275 | 666,275 | - | - |
| Total Assets | 666,275 | 666,275 | - | - |
|
| Liabilities | | | | |
Futures Contracts | (1,461,487) | (1,461,487) | - | - |
| Total Liabilities | (1,461,487) | (1,461,487) | - | - |
| Total Derivative Instruments: | (795,212) | (795,212) | - | - |
Value of Derivative Instruments
The following table is a summary of the Fund's value of derivative instruments by primary risk exposure as of September 30, 2022. For additional information on derivative instruments, please refer to the Derivative Instruments section in the accompanying Notes to Financial Statements.
Primary Risk Exposure / Derivative Type | Value |
| Asset ($) | Liability ($) |
| Equity Risk | | |
Futures Contracts (a) | 666,275 | (365) |
| Total Equity Risk | 666,275 | (365) |
| Interest Rate Risk | | |
Futures Contracts (a) | 0 | (1,461,123) |
| Total Interest Rate Risk | 0 | (1,461,123) |
| Total Value of Derivatives | 666,275 | (1,461,487) |
(a)Reflects gross cumulative appreciation (depreciation) on futures contracts as presented in the Schedule of Investments. In the Statement of Assets and Liabilities, the period end daily variation margin is included in receivable or payable for daily variation margin on futures contracts, and the net cumulative appreciation (depreciation) is included in Total accumulated earnings (loss).
Fidelity Advisor Freedom® 2050 Fund
| Statement of Assets and Liabilities |
| | | | September 30, 2022 (Unaudited) |
| | | | | |
| Assets | | | | |
| Investment in securities, at value - See accompanying schedule: | $ | | | |
Unaffiliated issuers (cost $839,065) | | $839,108 | | |
Fidelity Central Funds (cost $323,090) | | 323,090 | | |
Other affiliated issuers (cost $1,370,267,052) | | 1,276,984,924 | | |
| | | | | |
| Total Investment in Securities (cost $1,371,429,207) | | | $ | 1,278,147,122 |
| Receivable for investments sold | | | | 8,692,509 |
| Receivable for fund shares sold | | | | 2,241,482 |
| Distributions receivable from Fidelity Central Funds | | | | 1,042 |
| Receivable for daily variation margin on futures contracts | | | | 6,610 |
Total assets | | | | 1,289,088,765 |
| Liabilities | | | | |
| Payable for investments purchased | | 7,424,389 | | |
| Payable for fund shares redeemed | | 2,739,854 | | |
| Accrued management fee | | 808,868 | | |
| Distribution and service plan fees payable | | 179,391 | | |
| Payable for daily variation margin on futures contracts | | 82,096 | | |
| Total Liabilities | | | | 11,234,598 |
| Net Assets | | | $ | 1,277,854,167 |
| Net Assets consist of: | | | | |
| Paid in capital | | | $ | 1,383,130,326 |
| Total accumulated earnings (loss) | | | | (105,276,159) |
| Net Assets | | | $ | 1,277,854,167 |
| | | | | |
| Net Asset Value and Maximum Offering Price | | | | |
| Class A : | | | | |
Net Asset Value and redemption price per share ($397,657,320 ÷ 42,132,388 shares) (a) | | | $ | 9.44 |
| Maximum offering price per share (100/94.25 of $9.44) | | | $ | 10.02 |
| Class M : | | | | |
Net Asset Value and redemption price per share ($158,466,938 ÷ 16,981,070 shares) (a) | | | $ | 9.33 |
| Maximum offering price per share (100/96.50 of $9.33) | | | $ | 9.67 |
| Class C : | | | | |
Net Asset Value and offering price per share ($22,518,548 ÷ 2,475,700 shares) (a) | | | $ | 9.10 |
| Class I : | | | | |
Net Asset Value , offering price and redemption price per share ($497,768,892 ÷ 52,130,263 shares) | | | $ | 9.55 |
| Class Z : | | | | |
Net Asset Value , offering price and redemption price per share ($52,837,533 ÷ 5,587,134 shares) | | | $ | 9.46 |
| Class Z6 : | | | | |
Net Asset Value , offering price and redemption price per share ($148,604,936 ÷ 15,587,143 shares) | | | $ | 9.53 |
(a)Redemption price per share is equal to net asset value less any applicable contingent deferred sales charge. |
| Statement of Operations |
| | | | Six months ended September 30, 2022 (Unaudited) |
| Investment Income | | | | |
| Dividends: | | | | |
| Affiliated issuers | | | $ | 14,426,161 |
| Interest | | | | 6,555 |
| Income from Fidelity Central Funds | | | | 8,558 |
| Total Income | | | | 14,441,274 |
| Expenses | | | | |
| Management fee | $ | 5,139,061 | | |
| Distribution and service plan fees | | 1,147,336 | | |
| Independent trustees' fees and expenses | | 2,482 | | |
| Total expenses before reductions | | 6,288,879 | | |
| Expense reductions | | (22) | | |
| Total expenses after reductions | | | | 6,288,857 |
| Net Investment income (loss) | | | | 8,152,417 |
| Realized and Unrealized Gain (Loss) | | | | |
| Net realized gain (loss) on: | | | | |
| Investment Securities: | | | | |
| Unaffiliated issuers | | 381 | | |
| Fidelity Central Funds | | 1 | | |
| Other affiliated issuers | | (13,570,481) | | |
| Futures contracts | | (945,407) | | |
| Capital gain distributions from underlying funds: | | | | |
| Affiliated issuers | | 8,000,404 | | |
| Total net realized gain (loss) | | | | (6,515,102) |
| Change in net unrealized appreciation (depreciation) on: | | | | |
| Investment Securities: | | | | |
| Unaffiliated issuers | | 27 | | |
| Affiliated issuers | | (334,073,912) | | |
| Futures contracts | | (903,056) | | |
| Total change in net unrealized appreciation (depreciation) | | | | (334,976,941) |
| Net gain (loss) | | | | (341,492,043) |
| Net increase (decrease) in net assets resulting from operations | | | $ | (333,339,626) |
| Statement of Changes in Net Assets |
| |
| | Six months ended September 30, 2022 (Unaudited) | | Year ended March 31, 2022 |
| Increase (Decrease) in Net Assets | | | | |
| Operations | | | | |
| Net investment income (loss) | $ | 8,152,417 | $ | 32,099,107 |
| Net realized gain (loss) | | (6,515,102) | | 155,394,522 |
| Change in net unrealized appreciation (depreciation) | | (334,976,941) | | (141,169,664) |
| Net increase (decrease) in net assets resulting from operations | | (333,339,626) | | 46,323,965 |
| Distributions to shareholders | | (110,731,752) | | (151,405,562) |
| Share transactions - net increase (decrease) | | 131,367,684 | | 139,447,539 |
| Total increase (decrease) in net assets | | (312,703,694) | | 34,365,942 |
| | | | | |
| Net Assets | | | | |
| Beginning of period | | 1,590,557,861 | | 1,556,191,919 |
| End of period | $ | 1,277,854,167 | $ | 1,590,557,861 |
| | | | | |
| | | | | |
Financial Highlights
| Fidelity Advisor Freedom® 2050 Fund Class A |
| |
| | Six months ended (Unaudited) September 30, 2022 | | Years ended March 31, 2022 | | 2021 | | 2020 | | 2019 | | 2018 |
Selected Per-Share Data | | | | | | | | | | | | |
| Net asset value, beginning of period | $ | 12.92 | $ | 13.78 | $ | 9.43 | $ | 11.31 | $ | 12.17 | $ | 11.20 |
| Income from Investment Operations | | | | | | | | | | | | |
Net investment income (loss) A,B | | .06 | | .25 | | .07 | | .13 | | .16 | | .09 |
| Net realized and unrealized gain (loss) | | (2.64) | | .18 | | 4.96 | | (1.21) | | .13 | | 1.40 |
| Total from investment operations | | (2.58) | | .43 | | 5.03 | | (1.08) | | .29 | | 1.49 |
| Distributions from net investment income | | - | | (.27) | | (.10) | | (.14) | | (.18) | | (.12) |
| Distributions from net realized gain | | (.90) | | (1.02) | | (.58) | | (.66) | | (.97) | | (.40) |
| Total distributions | | (.90) | | (1.29) | | (.68) | | (.80) | | (1.15) | | (.52) |
| Net asset value, end of period | $ | 9.44 | $ | 12.92 | $ | 13.78 | $ | 9.43 | $ | 11.31 | $ | 12.17 |
Total Return C,D,E | | (20.79)% | | 2.76% | | 55.26% | | (10.58)% | | 3.08% | | 13.42% |
Ratios to Average Net Assets B,F,G | | | | | | | | | | | | |
| Expenses before reductions | | 1.00% H | | 1.00% | | 1.00% | | 1.00% | | .99% I | | .88% |
| Expenses net of fee waivers, if any | | 1.00% H | | 1.00% | | 1.00% | | 1.00% | | .99% I | | .88% |
| Expenses net of all reductions | | 1.00% H | | 1.00% | | 1.00% | | 1.00% | | .99% I | | .88% |
| Net investment income (loss) | | 1.02% H | | 1.83% | | .62% | | 1.20% | | 1.38% | | .79% |
| Supplemental Data | | | | | | | | | | | | |
| Net assets, end of period (000 omitted) | $ | 397,657 | $ | 500,298 | $ | 516,427 | $ | 358,407 | $ | 417,583 | $ | 418,313 |
Portfolio turnover rate J | | 17% H | | 26% | | 24% | | 32% | | 23% | | 20% |
A Calculated based on average shares outstanding during the period.
B Net investment income (loss) is affected by the timing of the declaration of dividends by any underlying mutual funds or exchange-traded funds (ETFs). Net investment income (loss) of any such underlying funds is not included in the Fund's net investment income (loss) ratio.
C Total returns for periods of less than one year are not annualized.
D Total returns would have been lower if certain expenses had not been reduced during the applicable periods shown.
E Total returns do not include the effect of the sales charges.
F Fees and expenses of any underlying mutual funds or exchange-traded funds (ETFs) are not included in the Fund's expense ratio. The Fund indirectly bears its proportionate share of these expenses. For additional expense information related to investments in Fidelity Central Funds, please refer to the "Investments in Fidelity Central Funds" note found in the Notes to Financial Statements section of the most recent Annual or Semi-Annual report.
G Expense ratios reflect operating expenses of the class. Expenses before reductions do not reflect amounts reimbursed, waived, or reduced through arrangements with the investment adviser, brokerage services, or other offset arrangements, if applicable, and do not represent the amount paid by the class during periods when reimbursements, waivers or reductions occur.
H Annualized
I On certain classes, the size and fluctuation of net assets and expense amounts may cause ratios to differ from contractual rates.
J Amount does not include the portfolio activity of any underlying mutual funds or exchange-traded funds (ETFs).
| Fidelity Advisor Freedom® 2050 Fund Class M |
| |
| | Six months ended (Unaudited) September 30, 2022 | | Years ended March 31, 2022 | | 2021 | | 2020 | | 2019 | | 2018 |
Selected Per-Share Data | | | | | | | | | | | | |
| Net asset value, beginning of period | $ | 12.79 | $ | 13.66 | $ | 9.36 | $ | 11.24 | $ | 12.11 | $ | 11.15 |
| Income from Investment Operations | | | | | | | | | | | | |
Net investment income (loss) A,B | | .04 | | .22 | | .04 | | .11 | | .13 | | .06 |
| Net realized and unrealized gain (loss) | | (2.61) | | .18 | | 4.92 | | (1.22) | | .13 | | 1.39 |
| Total from investment operations | | (2.57) | | .40 | | 4.96 | | (1.11) | | .26 | | 1.45 |
| Distributions from net investment income | | - | | (.24) | | (.08) | | (.11) | | (.16) | | (.10) |
| Distributions from net realized gain | | (.89) | | (1.02) | | (.58) | | (.65) | | (.97) | | (.40) |
| Total distributions | | (.89) | | (1.27) C | | (.66) | | (.77) C | | (1.13) | | (.49) C |
| Net asset value, end of period | $ | 9.33 | $ | 12.79 | $ | 13.66 | $ | 9.36 | $ | 11.24 | $ | 12.11 |
Total Return D,E,F | | (20.91)% | | 2.51% | | 54.91% | | (10.88)% | | 2.83% | | 13.16% |
Ratios to Average Net Assets B,G,H | | | | | | | | | | | | |
| Expenses before reductions | | 1.25% I | | 1.25% | | 1.25% | | 1.25% | | 1.25% | | 1.13% |
| Expenses net of fee waivers, if any | | 1.25% I | | 1.25% | | 1.25% | | 1.25% | | 1.25% | | 1.13% |
| Expenses net of all reductions | | 1.25% I | | 1.25% | | 1.25% | | 1.25% | | 1.25% | | 1.13% |
| Net investment income (loss) | | .77% I | | 1.58% | | .37% | | .95% | | 1.13% | | .54% |
| Supplemental Data | | | | | | | | | | | | |
| Net assets, end of period (000 omitted) | $ | 158,467 | $ | 201,272 | $ | 205,281 | $ | 143,526 | $ | 172,974 | $ | 166,634 |
Portfolio turnover rate J | | 17% I | | 26% | | 24% | | 32% | | 23% | | 20% |
A Calculated based on average shares outstanding during the period.
B Net investment income (loss) is affected by the timing of the declaration of dividends by any underlying mutual funds or exchange-traded funds (ETFs). Net investment income (loss) of any such underlying funds is not included in the Fund's net investment income (loss) ratio.
C Total distributions per share do not sum due to rounding.
D Total returns for periods of less than one year are not annualized.
E Total returns would have been lower if certain expenses had not been reduced during the applicable periods shown.
F Total returns do not include the effect of the sales charges.
G Fees and expenses of any underlying mutual funds or exchange-traded funds (ETFs) are not included in the Fund's expense ratio. The Fund indirectly bears its proportionate share of these expenses. For additional expense information related to investments in Fidelity Central Funds, please refer to the "Investments in Fidelity Central Funds" note found in the Notes to Financial Statements section of the most recent Annual or Semi-Annual report.
H Expense ratios reflect operating expenses of the class. Expenses before reductions do not reflect amounts reimbursed, waived, or reduced through arrangements with the investment adviser, brokerage services, or other offset arrangements, if applicable, and do not represent the amount paid by the class during periods when reimbursements, waivers or reductions occur.
I Annualized
J Amount does not include the portfolio activity of any underlying mutual funds or exchange-traded funds (ETFs).
| Fidelity Advisor Freedom® 2050 Fund Class C |
| |
| | Six months ended (Unaudited) September 30, 2022 | | Years ended March 31, 2022 | | 2021 | | 2020 | | 2019 | | 2018 |
Selected Per-Share Data | | | | | | | | | | | | |
| Net asset value, beginning of period | $ | 12.52 | $ | 13.41 | $ | 9.22 | $ | 11.10 | $ | 11.98 | $ | 11.05 |
| Income from Investment Operations | | | | | | | | | | | | |
Net investment income (loss) A,B | | .01 | | .15 | | (.01) | | .05 | | .07 | | - C |
| Net realized and unrealized gain (loss) | | (2.54) | | .17 | | 4.82 | | (1.20) | | .14 | | 1.38 |
| Total from investment operations | | (2.53) | | .32 | | 4.81 | | (1.15) | | .21 | | 1.38 |
| Distributions from net investment income | | - | | (.19) | | (.04) | | (.07) | | (.11) | | (.06) |
| Distributions from net realized gain | | (.89) | | (1.02) | | (.58) | | (.65) | | (.97) | | (.39) |
| Total distributions | | (.89) | | (1.21) | | (.62) | | (.73) D | | (1.09) D | | (.45) |
| Net asset value, end of period | $ | 9.10 | $ | 12.52 | $ | 13.41 | $ | 9.22 | $ | 11.10 | $ | 11.98 |
Total Return E,F,G | | (21.06)% | | 2.01% | | 54.09% | | (11.32)% | | 2.34% | | 12.59% |
Ratios to Average Net Assets B,H,I | | | | | | | | | | | | |
| Expenses before reductions | | 1.75% J | | 1.75% | | 1.75% | | 1.75% | | 1.74% K | | 1.63% |
| Expenses net of fee waivers, if any | | 1.75% J | | 1.75% | | 1.75% | | 1.75% | | 1.74% K | | 1.63% |
| Expenses net of all reductions | | 1.75% J | | 1.75% | | 1.75% | | 1.75% | | 1.74% K | | 1.63% |
| Net investment income (loss) | | .27% J | | 1.08% | | (.13)% | | .45% | | .63% | | .04% |
| Supplemental Data | | | | | | | | | | | | |
| Net assets, end of period (000 omitted) | $ | 22,519 | $ | 29,875 | $ | 33,105 | $ | 21,457 | $ | 26,139 | $ | 32,763 |
Portfolio turnover rate L | | 17% J | | 26% | | 24% | | 32% | | 23% | | 20% |
A Calculated based on average shares outstanding during the period.
B Net investment income (loss) is affected by the timing of the declaration of dividends by any underlying mutual funds or exchange-traded funds (ETFs). Net investment income (loss) of any such underlying funds is not included in the Fund's net investment income (loss) ratio.
C Amount represents less than $.005 per share.
D Total distributions per share do not sum due to rounding.
E Total returns for periods of less than one year are not annualized.
F Total returns would have been lower if certain expenses had not been reduced during the applicable periods shown.
G Total returns do not include the effect of the contingent deferred sales charge.
H Fees and expenses of any underlying mutual funds or exchange-traded funds (ETFs) are not included in the Fund's expense ratio. The Fund indirectly bears its proportionate share of these expenses. For additional expense information related to investments in Fidelity Central Funds, please refer to the "Investments in Fidelity Central Funds" note found in the Notes to Financial Statements section of the most recent Annual or Semi-Annual report.
I Expense ratios reflect operating expenses of the class. Expenses before reductions do not reflect amounts reimbursed, waived, or reduced through arrangements with the investment adviser, brokerage services, or other offset arrangements, if applicable, and do not represent the amount paid by the class during periods when reimbursements, waivers or reductions occur.
J Annualized
K On certain classes, the size and fluctuation of net assets and expense amounts may cause ratios to differ from contractual rates.
L Amount does not include the portfolio activity of any underlying mutual funds or exchange-traded funds (ETFs).
| Fidelity Advisor Freedom® 2050 Fund Class I |
| |
| | Six months ended (Unaudited) September 30, 2022 | | Years ended March 31, 2022 | | 2021 | | 2020 | | 2019 | | 2018 |
Selected Per-Share Data | | | | | | | | | | | | |
| Net asset value, beginning of period | $ | 13.05 | $ | 13.90 | $ | 9.50 | $ | 11.39 | $ | 12.25 | $ | 11.27 |
| Income from Investment Operations | | | | | | | | | | | | |
Net investment income (loss) A,B | | .07 | | .29 | | .11 | | .16 | | .19 | | .12 |
| Net realized and unrealized gain (loss) | | (2.67) | | .18 | | 4.99 | | (1.22) | | .12 | | 1.41 |
| Total from investment operations | | (2.60) | | .47 | | 5.10 | | (1.06) | | .31 | | 1.53 |
| Distributions from net investment income | | - | | (.30) | | (.12) | | (.16) | | (.20) | | (.14) |
| Distributions from net realized gain | | (.90) | | (1.02) | | (.58) | | (.67) | | (.97) | | (.41) |
| Total distributions | | (.90) | | (1.32) | | (.70) | | (.83) | | (1.17) | | (.55) |
| Net asset value, end of period | $ | 9.55 | $ | 13.05 | $ | 13.90 | $ | 9.50 | $ | 11.39 | $ | 12.25 |
Total Return C,D | | (20.69)% | | 3.01% | | 55.65% | | (10.37)% | | 3.30% | | 13.74% |
Ratios to Average Net Assets B,E,F | | | | | | | | | | | | |
| Expenses before reductions | | .75% G | | .75% | | .75% | | .75% | | .75% | | .64% |
| Expenses net of fee waivers, if any | | .75% G | | .75% | | .75% | | .75% | | .75% | | .64% |
| Expenses net of all reductions | | .75% G | | .75% | | .75% | | .75% | | .75% | | .64% |
| Net investment income (loss) | | 1.27% G | | 2.08% | | .87% | | 1.45% | | 1.63% | | 1.03% |
| Supplemental Data | | | | | | | | | | | | |
| Net assets, end of period (000 omitted) | $ | 497,769 | $ | 662,945 | $ | 675,617 | $ | 436,294 | $ | 488,167 | $ | 466,677 |
Portfolio turnover rate H | | 17% G | | 26% | | 24% | | 32% | | 23% | | 20% |
A Calculated based on average shares outstanding during the period.
B Net investment income (loss) is affected by the timing of the declaration of dividends by any underlying mutual funds or exchange-traded funds (ETFs). Net investment income (loss) of any such underlying funds is not included in the Fund's net investment income (loss) ratio.
C Total returns for periods of less than one year are not annualized.
D Total returns would have been lower if certain expenses had not been reduced during the applicable periods shown.
E Fees and expenses of any underlying mutual funds or exchange-traded funds (ETFs) are not included in the Fund's expense ratio. The Fund indirectly bears its proportionate share of these expenses. For additional expense information related to investments in Fidelity Central Funds, please refer to the "Investments in Fidelity Central Funds" note found in the Notes to Financial Statements section of the most recent Annual or Semi-Annual report.
F Expense ratios reflect operating expenses of the class. Expenses before reductions do not reflect amounts reimbursed, waived, or reduced through arrangements with the investment adviser, brokerage services, or other offset arrangements, if applicable, and do not represent the amount paid by the class during periods when reimbursements, waivers or reductions occur.
G Annualized
H Amount does not include the portfolio activity of any underlying mutual funds or exchange-traded funds (ETFs).
| Fidelity Advisor Freedom® 2050 Fund Class Z |
| |
| | Six months ended (Unaudited) September 30, 2022 | | Years ended March 31, 2022 | | 2021 | | 2020 | | 2019 A |
Selected Per-Share Data | | | | | | | | | | |
| Net asset value, beginning of period | $ | 12.94 | $ | 13.80 | $ | 9.43 | $ | 11.34 | $ | 12.34 |
| Income from Investment Operations | | | | | | | | | | |
Net investment income (loss) B,C | | .07 | | .30 | | .12 | | .17 | | .28 |
| Net realized and unrealized gain (loss) | | (2.64) | | .18 | | 4.97 | | (1.22) | | (.54) |
| Total from investment operations | | (2.57) | | .48 | | 5.09 | | (1.05) | | (.26) |
| Distributions from net investment income | | - | | (.32) | | (.14) | | (.18) | | (.25) |
| Distributions from net realized gain | | (.91) | | (1.02) | | (.58) | | (.68) | | (.49) |
| Total distributions | | (.91) | | (1.34) | | (.72) | | (.86) | | (.74) |
| Net asset value, end of period | $ | 9.46 | $ | 12.94 | $ | 13.80 | $ | 9.43 | $ | 11.34 |
Total Return D,E | | (20.65)% | | 3.10% | | 55.96% | | (10.33)% | | (1.34)% |
Ratios to Average Net Assets C,F,G | | | | | | | | | | |
| Expenses before reductions | | .64% H | | .64% | | .64% | | .65% I | | .65% H,I |
| Expenses net of fee waivers, if any | | .64% H | | .64% | | .64% | | .65% I | | .65% H,I |
| Expenses net of all reductions | | .64% H | | .64% | | .64% | | .65% I | | .65% H,I |
| Net investment income (loss) | | 1.37% H | | 2.18% | | .98% | | 1.55% | | 5.18% H |
| Supplemental Data | | | | | | | | | | |
| Net assets, end of period (000 omitted) | $ | 52,838 | $ | 49,713 | $ | 26,670 | $ | 11,414 | $ | 650 |
Portfolio turnover rate J | | 17% H | | 26% | | 24% | | 32% | | 23% |
A For the period October 2, 2018 (commencement of sale of shares) through March 31, 2019.
B Calculated based on average shares outstanding during the period.
C Net investment income (loss) is affected by the timing of the declaration of dividends by any underlying mutual funds or exchange-traded funds (ETFs). Net investment income (loss) of any such underlying funds is not included in the Fund's net investment income (loss) ratio.
D Total returns for periods of less than one year are not annualized.
E Total returns would have been lower if certain expenses had not been reduced during the applicable periods shown.
F Fees and expenses of any underlying mutual funds or exchange-traded funds (ETFs) are not included in the Fund's expense ratio. The Fund indirectly bears its proportionate share of these expenses. For additional expense information related to investments in Fidelity Central Funds, please refer to the "Investments in Fidelity Central Funds" note found in the Notes to Financial Statements section of the most recent Annual or Semi-Annual report.
G Expense ratios reflect operating expenses of the class. Expenses before reductions do not reflect amounts reimbursed, waived, or reduced through arrangements with the investment adviser, brokerage services, or other offset arrangements, if applicable, and do not represent the amount paid by the class during periods when reimbursements, waivers or reductions occur.
H Annualized
I On certain classes, the size and fluctuation of net assets and expense amounts may cause ratios to differ from contractual rates.
J Amount does not include the portfolio activity of any underlying mutual funds or exchange-traded funds (ETFs).
| Fidelity Advisor Freedom® 2050 Fund Class Z6 |
| |
| | Six months ended (Unaudited) September 30, 2022 | | Years ended March 31, 2022 | | 2021 | | 2020 | | 2019 | | 2018 A |
Selected Per-Share Data | | | | | | | | | | | | |
| Net asset value, beginning of period | $ | 13.03 | $ | 13.87 | $ | 9.48 | $ | 11.37 | $ | 12.24 | $ | 11.59 |
| Income from Investment Operations | | | | | | | | | | | | |
Net investment income (loss) B,C | | .08 | | .33 | | .14 | | .19 | | .22 | | .23 |
| Net realized and unrealized gain (loss) | | (2.67) | | .18 | | 4.98 | | (1.22) | | .12 | | .83 |
| Total from investment operations | | (2.59) | | .51 | | 5.12 | | (1.03) | | .34 | | 1.06 |
| Distributions from net investment income | | - | | (.33) | | (.15) | | (.18) | | (.24) | | (.17) |
| Distributions from net realized gain | | (.91) | | (1.02) | | (.58) | | (.68) | | (.97) | | (.24) |
| Total distributions | | (.91) | | (1.35) | | (.73) | | (.86) | | (1.21) | | (.41) |
| Net asset value, end of period | $ | 9.53 | $ | 13.03 | $ | 13.87 | $ | 9.48 | $ | 11.37 | $ | 12.24 |
Total Return D,E | | (20.64)% | | 3.30% | | 56.00% | | (10.14)% | | 3.55% | | 9.15% |
Ratios to Average Net Assets C,F,G | | | | | | | | | | | | |
| Expenses before reductions | | .49% H | | .49% | | .49% | | .49% | | .50% I | | .51% H,I |
| Expenses net of fee waivers, if any | | .49% H | | .49% | | .49% | | .49% | | .50% I | | .51% H,I |
| Expenses net of all reductions | | .49% H | | .49% | | .49% | | .49% | | .50% I | | .51% H,I |
| Net investment income (loss) | | 1.52% H | | 2.33% | | 1.13% | | 1.70% | | 1.88% | | 2.27% H |
| Supplemental Data | | | | | | | | | | | | |
| Net assets, end of period (000 omitted) | $ | 148,605 | $ | 146,454 | $ | 99,092 | $ | 33,835 | $ | 21,893 | $ | 5,410 |
Portfolio turnover rate J | | 17% H | | 26% | | 24% | | 32% | | 23% | | 20% |
A For the period June 6, 2017 (commencement of sale of shares) through March 31, 2018.
B Calculated based on average shares outstanding during the period.
C Net investment income (loss) is affected by the timing of the declaration of dividends by any underlying mutual funds or exchange-traded funds (ETFs). Net investment income (loss) of any such underlying funds is not included in the Fund's net investment income (loss) ratio.
D Total returns would have been lower if certain expenses had not been reduced during the applicable periods shown.
E Total returns for periods of less than one year are not annualized.
F Fees and expenses of any underlying mutual funds or exchange-traded funds (ETFs) are not included in the Fund's expense ratio. The Fund indirectly bears its proportionate share of these expenses. For additional expense information related to investments in Fidelity Central Funds, please refer to the "Investments in Fidelity Central Funds" note found in the Notes to Financial Statements section of the most recent Annual or Semi-Annual report.
G Expense ratios reflect operating expenses of the class. Expenses before reductions do not reflect amounts reimbursed, waived, or reduced through arrangements with the investment adviser, brokerage services, or other offset arrangements, if applicable, and do not represent the amount paid by the class during periods when reimbursements, waivers or reductions occur.
H Annualized
I On certain classes, the size and fluctuation of net assets and expense amounts may cause ratios to differ from contractual rates.
J Amount does not include the portfolio activity of any underlying mutual funds or exchange-traded funds (ETFs).
The information in the following table is based on the direct Investments of the Fund.
Top Holdings (% of Fund's net assets) |
| |
| Fidelity Series Emerging Markets Opportunities Fund | 13.2 | |
| Fidelity Series Large Cap Stock Fund | 9.7 | |
| Fidelity Series Overseas Fund | 7.5 | |
| Fidelity Series International Value Fund | 7.4 | |
| Fidelity Series International Growth Fund | 7.4 | |
| Fidelity Series Value Discovery Fund | 6.4 | |
| Fidelity Advisor Series Equity Growth Fund | 6.4 | |
| Fidelity Series Stock Selector Large Cap Value Fund | 6.2 | |
| Fidelity Series Opportunistic Insights Fund | 5.8 | |
| Fidelity Series Long-Term Treasury Bond Index Fund | 5.7 | |
| | 75.7 | |
| |
Domestic Equity Funds category includes Fidelity Series Commodity Strategy Fund which invests in commodity-related investments.
Asset Allocation (% of Fund's net assets) |
|
Percentages shown as 0.0% may reflect amounts less than 0.05%. |
|
Fidelity Advisor Freedom® 2055 Fund
Showing Percentage of Net Assets
| U.S. Treasury Obligations - 0.1% |
| | | Principal Amount (a) | Value ($) |
U.S. Treasury Bills, yield at date of purchase 2.13% to 3.29% 10/13/22 to 12/29/22 (b) (Cost $548,205) | | 550,000 | 548,280 |
| | | | |
| Domestic Equity Funds - 50.0% |
| | | Shares | Value ($) |
| Fidelity Advisor Series Equity Growth Fund (c) | | 4,276,507 | 51,959,566 |
| Fidelity Advisor Series Growth Opportunities Fund (c) | | 4,181,559 | 36,672,274 |
| Fidelity Advisor Series Small Cap Fund (c) | | 2,166,503 | 22,683,283 |
| Fidelity Series All-Sector Equity Fund (c) | | 2,407,342 | 20,654,993 |
| Fidelity Series Commodity Strategy Fund (c) | | 4,582,610 | 9,577,656 |
| Fidelity Series Large Cap Stock Fund (c) | | 5,363,609 | 79,220,498 |
| Fidelity Series Large Cap Value Index Fund (c) | | 680,390 | 8,654,555 |
| Fidelity Series Opportunistic Insights Fund (c) | | 3,326,183 | 47,265,066 |
| Fidelity Series Small Cap Opportunities Fund (c) | | 2,532,392 | 27,299,186 |
| Fidelity Series Stock Selector Large Cap Value Fund (c) | | 4,510,384 | 50,380,989 |
| Fidelity Series Value Discovery Fund (c) | | 3,775,305 | 51,985,949 |
| TOTAL DOMESTIC EQUITY FUNDS (Cost $441,101,103) | | | 406,354,015 |
| | | | |
| International Equity Funds - 42.0% |
| | | Shares | Value ($) |
| Fidelity Series Canada Fund (c) | | 2,124,529 | 26,344,165 |
| Fidelity Series Emerging Markets Fund (c) | | 1,612,163 | 11,672,060 |
| Fidelity Series Emerging Markets Opportunities Fund (c) | | 7,369,404 | 107,003,753 |
| Fidelity Series International Growth Fund (c) | | 4,679,304 | 59,988,672 |
| Fidelity Series International Small Cap Fund (c) | | 1,149,077 | 15,719,375 |
| Fidelity Series International Value Fund (c) | | 7,041,229 | 60,484,156 |
| Fidelity Series Overseas Fund (c) | | 6,355,499 | 60,567,905 |
| TOTAL INTERNATIONAL EQUITY FUNDS (Cost $393,011,114) | | | 341,780,086 |
| | | | |
| Bond Funds - 7.4% |
| | | Shares | Value ($) |
| Fidelity Series 5+ Year Inflation-Protected Bond Index Fund (c) | | 100,635 | 804,071 |
| Fidelity Series Emerging Markets Debt Fund (c) | | 624,635 | 4,284,996 |
| Fidelity Series Emerging Markets Debt Local Currency Fund (c) | | 176,866 | 1,409,625 |
| Fidelity Series Floating Rate High Income Fund (c) | | 95,179 | 828,062 |
| Fidelity Series High Income Fund (c) | | 561,566 | 4,425,138 |
| Fidelity Series International Credit Fund (c) | | 29,069 | 228,773 |
| Fidelity Series Long-Term Treasury Bond Index Fund (c) | | 7,783,384 | 46,466,804 |
| Fidelity Series Real Estate Income Fund (c) | | 220,453 | 2,098,712 |
| TOTAL BOND FUNDS (Cost $79,519,449) | | | 60,546,181 |
| | | | |
| Short-Term Funds - 0.5% |
| | | Shares | Value ($) |
| Fidelity Cash Central Fund 3.10% (d) | | 157,653 | 157,684 |
| Fidelity Series Government Money Market Fund 3.00% (c)(e) | | 4,115,841 | 4,115,841 |
| Fidelity Series Short-Term Credit Fund (c) | | 0 | 1 |
| TOTAL SHORT-TERM FUNDS (Cost $4,273,526) | | | 4,273,526 |
| | | | |
| TOTAL INVESTMENT IN SECURITIES - 100.0% (Cost $918,453,397) | 813,502,088 |
NET OTHER ASSETS (LIABILITIES) - 0.0% | (176,868) |
| NET ASSETS - 100.0% | 813,325,220 |
| | |
| Futures Contracts |
| | Number of contracts | Expiration Date | Notional Amount ($) | Value ($) | Unrealized Appreciation/ (Depreciation) ($) |
| Purchased | | | | | |
| | | | | | |
| Treasury Contracts | | | | | |
| CBOT 10-Year U.S. Treasury Note Contracts (United States) | 133 | Dec 2022 | 14,904,313 | (907,519) | (907,519) |
| CBOT Ultra Long Term U.S. Treasury Bond Contracts (United States) | 12 | Dec 2022 | 1,644,000 | (21,660) | (21,660) |
| | | | | | |
| TOTAL PURCHASED | | | | | (929,179) |
| | | | | | |
| Sold | | | | | |
| | | | | | |
| Equity Index Contracts | | | | | |
| CME E-mini S&P 500 Index Contracts (United States) | 23 | Dec 2022 | 4,141,725 | (227) | (227) |
| ICE E-mini MSCI EAFE Index Contracts (United States) | 37 | Dec 2022 | 3,072,110 | 416,882 | 416,882 |
| ICE E-mini MSCI Emerging Markets Index Contracts (United States) | 30 | Dec 2022 | 1,307,250 | 8,719 | 8,719 |
| | | | | | |
| TOTAL SOLD | | | | | 425,374 |
| | | | | | |
| TOTAL FUTURES CONTRACTS | | | | | (503,805) |
| The notional amount of futures purchased as a percentage of Net Assets is 2.0% |
| The notional amount of futures sold as a percentage of Net Assets is 1.1% |
Share amounts shown as "0" represent less than 1 share.
Legend
| (a) | Amount is stated in United States dollars unless otherwise noted. |
| (b) | Security or a portion of the security was pledged to cover margin requirements for futures contracts. At period end, the value of securities pledged amounted to $548,280. |
| (d) | Affiliated fund that is generally available only to investment companies and other accounts managed by Fidelity Investments. The rate quoted is the annualized seven-day yield of the fund at period end. A complete unaudited listing of the fund's holdings as of its most recent quarter end is available upon request. In addition, each Fidelity Central Fund's financial statements are available on the SEC's website or upon request. |
| (e) | The rate quoted is the annualized seven-day yield of the fund at period end. |
Affiliated Central Funds
Fiscal year to date information regarding the Fund's investments in Fidelity Central Funds, including the ownership percentage, is presented below.
| Affiliate | Value, beginning of period ($) | Purchases ($) | Sales Proceeds ($) | Dividend Income ($) | Realized Gain (loss) ($) | Change in Unrealized appreciation (depreciation) ($) | Value, end of period ($) | %ownership, end of period |
| Fidelity Cash Central Fund 3.10% | 681,178 | 4,133,750 | 4,657,244 | 5,241 | - | - | 157,684 | 0.0% |
| Total | 681,178 | 4,133,750 | 4,657,244 | 5,241 | - | - | 157,684 | |
| | | | | | | | | |
Amounts in the income column in the above table include any capital gain distributions from underlying funds, which are presented in the corresponding line item in the Statement of Operations, if applicable.
Affiliated Underlying Funds
Fiscal year to date information regarding the Fund's investments in affiliated Underlying Funds is presented below. Exchanges between classes of the same affiliated Underlying Funds may occur. If an Underlying Funds changes its name, the name presented below is the name in effect at period end.
| Affiliate | Value, beginning of period ($) | Purchases ($) | Sales Proceeds ($) | Dividend Income ($) | Realized Gain (loss) ($) | Change in Unrealized appreciation (depreciation) ($) | Value, end of period ($) |
| Fidelity Advisor Series Equity Growth Fund | 61,505,171 | 7,208,647 | 3,185,239 | - | (159,634) | (13,409,379) | 51,959,566 |
| Fidelity Advisor Series Growth Opportunities Fund | 42,186,078 | 9,608,334 | 2,375,795 | - | (401,629) | (12,344,714) | 36,672,274 |
| Fidelity Advisor Series Small Cap Fund | 27,916,699 | 2,455,905 | 2,308,894 | - | (196,223) | (5,184,204) | 22,683,283 |
| Fidelity Series 5+ Year Inflation-Protected Bond Index Fund | 984,233 | 61,104 | 78,123 | - | (4,200) | (158,943) | 804,071 |
| Fidelity Series All-Sector Equity Fund | 26,382,318 | 1,578,758 | 1,897,450 | - | (247,647) | (5,160,986) | 20,654,993 |
| Fidelity Series Canada Fund | 32,018,929 | 3,278,973 | 2,413,409 | - | (163,593) | (6,376,735) | 26,344,165 |
| Fidelity Series Commodity Strategy Fund | 14,646,270 | 8,619,879 | 5,390,455 | 7,076,737 | (1,779,611) | (6,518,427) | 9,577,656 |
| Fidelity Series Emerging Markets Debt Fund | 4,806,803 | 481,991 | 164,517 | 126,054 | (11,183) | (828,098) | 4,284,996 |
| Fidelity Series Emerging Markets Debt Local Currency Fund | 1,628,892 | 104,930 | 134,088 | - | (17,432) | (172,677) | 1,409,625 |
| Fidelity Series Emerging Markets Fund | 13,500,650 | 1,821,083 | 495,455 | - | (95,416) | (3,058,802) | 11,672,060 |
| Fidelity Series Emerging Markets Opportunities Fund | 124,864,746 | 14,421,204 | 4,905,085 | - | (1,091,982) | (26,285,130) | 107,003,753 |
| Fidelity Series Floating Rate High Income Fund | 984,212 | 85,763 | 190,824 | 24,483 | (8,174) | (42,915) | 828,062 |
| Fidelity Series Government Money Market Fund 3.00% | - | 4,115,841 | - | 185 | - | - | 4,115,841 |
| Fidelity Series High Income Fund | 5,956,946 | 477,123 | 1,263,992 | 140,715 | (131,890) | (613,049) | 4,425,138 |
| Fidelity Series International Credit Fund | 265,307 | 3,622 | - | 3,622 | - | (40,156) | 228,773 |
| Fidelity Series International Growth Fund | 73,193,940 | 8,132,490 | 4,164,885 | - | (678,396) | (16,494,477) | 59,988,672 |
| Fidelity Series International Small Cap Fund | 20,048,506 | 1,341,651 | 796,783 | - | (139,433) | (4,734,566) | 15,719,375 |
| Fidelity Series International Value Fund | 73,916,440 | 8,355,022 | 5,225,060 | - | (272,715) | (16,289,531) | 60,484,156 |
| Fidelity Series Investment Grade Bond Fund | 5,197,797 | 111,967 | 5,107,494 | 18,868 | (219,422) | 17,152 | - |
| Fidelity Series Large Cap Stock Fund | 96,790,688 | 12,165,514 | 7,719,032 | 4,699,550 | (224,951) | (21,791,721) | 79,220,498 |
| Fidelity Series Large Cap Value Index Fund | 10,468,796 | 650,716 | 651,392 | - | (10,790) | (1,802,775) | 8,654,555 |
| Fidelity Series Long-Term Treasury Bond Index Fund | 52,572,727 | 10,160,471 | 4,120,065 | 643,773 | (799,441) | (11,346,888) | 46,466,804 |
| Fidelity Series Opportunistic Insights Fund | 56,846,393 | 6,848,531 | 3,304,173 | - | (354,893) | (12,770,792) | 47,265,066 |
| Fidelity Series Overseas Fund | 73,593,153 | 7,897,012 | 2,073,868 | - | (242,106) | (18,606,286) | 60,567,905 |
| Fidelity Series Real Estate Income Fund | 3,513,777 | 317,195 | 1,252,388 | 157,614 | (66,882) | (412,990) | 2,098,712 |
| Fidelity Series Short-Term Credit Fund | - | 1 | - | - | - | - | 1 |
| Fidelity Series Small Cap Opportunities Fund | 34,468,083 | 3,307,646 | 3,290,991 | 1,265,812 | (229,662) | (6,955,890) | 27,299,186 |
| Fidelity Series Stock Selector Large Cap Value Fund | 61,774,562 | 4,524,060 | 5,185,404 | - | (308,483) | (10,423,746) | 50,380,989 |
| Fidelity Series Value Discovery Fund | 62,924,568 | 4,328,831 | 6,603,943 | - | (270,897) | (8,392,610) | 51,985,949 |
| | 982,956,684 | 122,464,264 | 74,298,804 | 14,157,413 | (8,126,685) | (210,199,335) | 812,796,124 |
Amounts in the income column in the above table include any capital gain distributions from underlying funds, which are presented in the corresponding line item in the Statement of Operations, if applicable.
Investment Valuation
The following is a summary of the inputs used, as of September 30, 2022, involving the Fund's assets and liabilities carried at fair value. The inputs or methodology used for valuing securities may not be an indication of the risk associated with investing in those securities. For more information on valuation inputs, and their aggregation into the levels used below, please refer to the Investment Valuation section in the accompanying Notes to Financial Statements.
| Valuation Inputs at Reporting Date: |
| Description | Total ($) | Level 1 ($) | Level 2 ($) | Level 3 ($) |
Investments in Securities: | | | | |
|
| Other Short-Term Investments | 548,280 | - | 548,280 | - |
|
| Domestic Equity Funds | 406,354,015 | 406,354,015 | - | - |
|
| International Equity Funds | 341,780,086 | 341,780,086 | - | - |
|
| Bond Funds | 60,546,181 | 60,546,181 | - | - |
|
| Short-Term Funds | 4,273,526 | 4,273,526 | - | - |
| Total Investments in Securities: | 813,502,088 | 812,953,808 | 548,280 | - |
Derivative Instruments: | | | | |
|
| Assets | | | | |
Futures Contracts | 425,601 | 425,601 | - | - |
| Total Assets | 425,601 | 425,601 | - | - |
|
| Liabilities | | | | |
Futures Contracts | (929,406) | (929,406) | - | - |
| Total Liabilities | (929,406) | (929,406) | - | - |
| Total Derivative Instruments: | (503,805) | (503,805) | - | - |
Value of Derivative Instruments
The following table is a summary of the Fund's value of derivative instruments by primary risk exposure as of September 30, 2022. For additional information on derivative instruments, please refer to the Derivative Instruments section in the accompanying Notes to Financial Statements.
Primary Risk Exposure / Derivative Type | Value |
| Asset ($) | Liability ($) |
| Equity Risk | | |
Futures Contracts (a) | 425,601 | (227) |
| Total Equity Risk | 425,601 | (227) |
| Interest Rate Risk | | |
Futures Contracts (a) | 0 | (929,179) |
| Total Interest Rate Risk | 0 | (929,179) |
| Total Value of Derivatives | 425,601 | (929,406) |
(a)Reflects gross cumulative appreciation (depreciation) on futures contracts as presented in the Schedule of Investments. In the Statement of Assets and Liabilities, the period end daily variation margin is included in receivable or payable for daily variation margin on futures contracts, and the net cumulative appreciation (depreciation) is included in Total accumulated earnings (loss).
Fidelity Advisor Freedom® 2055 Fund
| Statement of Assets and Liabilities |
| | | | September 30, 2022 (Unaudited) |
| | | | | |
| Assets | | | | |
| Investment in securities, at value - See accompanying schedule: | $ | | | |
Unaffiliated issuers (cost $548,205) | | $548,280 | | |
Fidelity Central Funds (cost $157,684) | | 157,684 | | |
Other affiliated issuers (cost $917,747,508) | | 812,796,124 | | |
| | | | | |
| Total Investment in Securities (cost $918,453,397) | | | $ | 813,502,088 |
| Receivable for investments sold | | | | 5,112,572 |
| Receivable for fund shares sold | | | | 2,336,701 |
| Distributions receivable from Fidelity Central Funds | | | | 604 |
| Receivable for daily variation margin on futures contracts | | | | 3,980 |
Total assets | | | | 820,955,945 |
| Liabilities | | | | |
| Payable for investments purchased | | 4,982,148 | | |
| Payable for fund shares redeemed | | 1,981,997 | | |
| Accrued management fee | | 509,647 | | |
| Distribution and service plan fees payable | | 105,255 | | |
| Payable for daily variation margin on futures contracts | | 51,672 | | |
| Other payables and accrued expenses | | 6 | | |
| Total Liabilities | | | | 7,630,725 |
| Net Assets | | | $ | 813,325,220 |
| Net Assets consist of: | | | | |
| Paid in capital | | | $ | 927,220,630 |
| Total accumulated earnings (loss) | | | | (113,895,410) |
| Net Assets | | | $ | 813,325,220 |
| | | | | |
| Net Asset Value and Maximum Offering Price | | | | |
| Class A : | | | | |
Net Asset Value and redemption price per share ($233,135,419 ÷ 21,936,321 shares) (a) | | | $ | 10.63 |
| Maximum offering price per share (100/94.25 of $10.63) | | | $ | 11.28 |
| Class M : | | | | |
Net Asset Value and redemption price per share ($95,224,337 ÷ 9,063,841 shares) (a) | | | $ | 10.51 |
| Maximum offering price per share (100/96.50 of $10.51) | | | $ | 10.89 |
| Class C : | | | | |
Net Asset Value and offering price per share ($12,618,012 ÷ 1,220,470 shares) (a) | | | $ | 10.34 |
| Class I : | | | | |
Net Asset Value , offering price and redemption price per share ($328,010,726 ÷ 30,623,030 shares) | | | $ | 10.71 |
| Class Z : | | | | |
Net Asset Value , offering price and redemption price per share ($36,334,739 ÷ 3,429,040 shares) | | | $ | 10.60 |
| Class Z6 : | | | | |
Net Asset Value , offering price and redemption price per share ($108,001,987 ÷ 10,096,304 shares) | | | $ | 10.70 |
(a)Redemption price per share is equal to net asset value less any applicable contingent deferred sales charge. |
| Statement of Operations |
| | | | Six months ended September 30, 2022 (Unaudited) |
| Investment Income | | | | |
| Dividends: | | | | |
| Affiliated issuers | | | $ | 9,117,759 |
| Interest | | | | 4,034 |
| Income from Fidelity Central Funds | | | | 5,241 |
| Total Income | | | | 9,127,034 |
| Expenses | | | | |
| Management fee | $ | 3,200,125 | | |
| Distribution and service plan fees | | 664,495 | | |
| Independent trustees' fees and expenses | | 1,546 | | |
| Total expenses before reductions | | 3,866,166 | | |
| Expense reductions | | (29) | | |
| Total expenses after reductions | | | | 3,866,137 |
| Net Investment income (loss) | | | | 5,260,897 |
| Realized and Unrealized Gain (Loss) | | | | |
| Net realized gain (loss) on: | | | | |
| Investment Securities: | | | | |
| Unaffiliated issuers | | 217 | | |
| Affiliated issuers | | (8,126,685) | | |
| Futures contracts | | (604,442) | | |
| Capital gain distributions from underlying funds: | | | | |
| Affiliated issuers | | 5,039,652 | | |
| Total net realized gain (loss) | | | | (3,691,258) |
| Change in net unrealized appreciation (depreciation) on: | | | | |
| Investment Securities: | | | | |
| Unaffiliated issuers | | 64 | | |
| Affiliated issuers | | (210,199,335) | | |
| Futures contracts | | (558,930) | | |
| Total change in net unrealized appreciation (depreciation) | | | | (210,758,201) |
| Net gain (loss) | | | | (214,449,459) |
| Net increase (decrease) in net assets resulting from operations | | | $ | (209,188,562) |
| Statement of Changes in Net Assets |
| |
| | Six months ended September 30, 2022 (Unaudited) | | Year ended March 31, 2022 |
| Increase (Decrease) in Net Assets | | | | |
| Operations | | | | |
| Net investment income (loss) | $ | 5,260,897 | $ | 19,793,235 |
| Net realized gain (loss) | | (3,691,258) | | 93,418,308 |
| Change in net unrealized appreciation (depreciation) | | (210,758,201) | | (85,335,748) |
| Net increase (decrease) in net assets resulting from operations | | (209,188,562) | | 27,875,795 |
| Distributions to shareholders | | (67,486,709) | | (90,652,588) |
| Share transactions - net increase (decrease) | | 106,140,361 | | 104,182,922 |
| Total increase (decrease) in net assets | | (170,534,910) | | 41,406,129 |
| | | | | |
| Net Assets | | | | |
| Beginning of period | | 983,860,130 | | 942,454,001 |
| End of period | $ | 813,325,220 | $ | 983,860,130 |
| | | | | |
| | | | | |
Financial Highlights
| Fidelity Advisor Freedom® 2055 Fund Class A |
| |
| | Six months ended (Unaudited) September 30, 2022 | | Years ended March 31, 2022 | | 2021 | | 2020 | | 2019 | | 2018 |
Selected Per-Share Data | | | | | | | �� | | | | | |
| Net asset value, beginning of period | $ | 14.52 | $ | 15.45 | $ | 10.53 | $ | 12.58 | $ | 13.37 | $ | 12.19 |
| Income from Investment Operations | | | | | | | | | | | | |
Net investment income (loss) A,B | | .06 | | .29 | | .08 | | .15 | | .18 | | .11 |
| Net realized and unrealized gain (loss) | | (2.97) | | .19 | | 5.55 | | (1.36) | | .15 | | 1.51 |
| Total from investment operations | | (2.91) | | .48 | | 5.63 | | (1.21) | | .33 | | 1.62 |
| Distributions from net investment income | | - | | (.30) | | (.11) | | (.15) | | (.19) | | (.13) |
| Distributions from net realized gain | | (.98) | | (1.12) | | (.59) | | (.69) | | (.93) | | (.32) |
| Total distributions | | (.98) | | (1.41) C | | (.71) C | | (.84) | | (1.12) | | (.44) C |
| Net asset value, end of period | $ | 10.63 | $ | 14.52 | $ | 15.45 | $ | 10.53 | $ | 12.58 | $ | 13.37 |
Total Return D,E,F | | (20.79)% | | 2.75% | | 55.31% | | (10.57)% | | 3.08% | | 13.40% |
Ratios to Average Net Assets B,G,H | | | | | | | | | | | | |
| Expenses before reductions | | 1.00% I | | 1.00% | | 1.00% | | 1.00% | | .99% J | | .88% |
| Expenses net of fee waivers, if any | | 1.00% I | | 1.00% | | 1.00% | | 1.00% | | .99% J | | .88% |
| Expenses net of all reductions | | 1.00% I | | 1.00% | | 1.00% | | 1.00% | | .99% J | | .88% |
| Net investment income (loss) | | 1.03% I | | 1.83% | | .63% | | 1.23% | | 1.41% | | .81% |
| Supplemental Data | | | | | | | | | | | | |
| Net assets, end of period (000 omitted) | $ | 233,135 | $ | 286,778 | $ | 299,927 | $ | 196,016 | $ | 212,428 | $ | 209,824 |
Portfolio turnover rate K | | 17% I | | 28% | | 23% | | 35% | | 27% | | 18% |
A Calculated based on average shares outstanding during the period.
B Net investment income (loss) is affected by the timing of the declaration of dividends by any underlying mutual funds or exchange-traded funds (ETFs). Net investment income (loss) of any such underlying funds is not included in the Fund's net investment income (loss) ratio.
C Total distributions per share do not sum due to rounding.
D Total returns for periods of less than one year are not annualized.
E Total returns would have been lower if certain expenses had not been reduced during the applicable periods shown.
F Total returns do not include the effect of the sales charges.
G Fees and expenses of any underlying mutual funds or exchange-traded funds (ETFs) are not included in the Fund's expense ratio. The Fund indirectly bears its proportionate share of these expenses. For additional expense information related to investments in Fidelity Central Funds, please refer to the "Investments in Fidelity Central Funds" note found in the Notes to Financial Statements section of the most recent Annual or Semi-Annual report.
H Expense ratios reflect operating expenses of the class. Expenses before reductions do not reflect amounts reimbursed, waived, or reduced through arrangements with the investment adviser, brokerage services, or other offset arrangements, if applicable, and do not represent the amount paid by the class during periods when reimbursements, waivers or reductions occur.
I Annualized
J On certain classes, the size and fluctuation of net assets and expense amounts may cause ratios to differ from contractual rates.
K Amount does not include the portfolio activity of any underlying mutual funds or exchange-traded funds (ETFs).
| Fidelity Advisor Freedom® 2055 Fund Class M |
| |
| | Six months ended (Unaudited) September 30, 2022 | | Years ended March 31, 2022 | | 2021 | | 2020 | | 2019 | | 2018 |
Selected Per-Share Data | | | | | | | | | | | | |
| Net asset value, beginning of period | $ | 14.38 | $ | 15.32 | $ | 10.46 | $ | 12.51 | $ | 13.31 | $ | 12.14 |
| Income from Investment Operations | | | | | | | | | | | | |
Net investment income (loss) A,B | | .05 | | .24 | | .05 | | .12 | | .15 | | .07 |
| Net realized and unrealized gain (loss) | | (2.94) | | .20 | | 5.50 | | (1.36) | | .15 | | 1.52 |
| Total from investment operations | | (2.89) | | .44 | | 5.55 | | (1.24) | | .30 | | 1.59 |
| Distributions from net investment income | | - | | (.27) | | (.09) | | (.13) | | (.18) | | (.11) |
| Distributions from net realized gain | | (.98) | | (1.12) | | (.59) | | (.68) | | (.93) | | (.31) |
| Total distributions | | (.98) | | (1.38) C | | (.69) C | | (.81) | | (1.10) C | | (.42) |
| Net asset value, end of period | $ | 10.51 | $ | 14.38 | $ | 15.32 | $ | 10.46 | $ | 12.51 | $ | 13.31 |
Total Return D,E,F | | (20.90)% | | 2.52% | | 54.88% | | (10.83)% | | 2.86% | | 13.15% |
Ratios to Average Net Assets B,G,H | | | | | | | | | | | | |
| Expenses before reductions | | 1.25% I | | 1.25% | | 1.25% | | 1.25% | | 1.25% | | 1.14% |
| Expenses net of fee waivers, if any | | 1.25% I | | 1.25% | | 1.25% | | 1.25% | | 1.25% | | 1.14% |
| Expenses net of all reductions | | 1.25% I | | 1.25% | | 1.25% | | 1.25% | | 1.25% | | 1.14% |
| Net investment income (loss) | | .78% I | | 1.58% | | .38% | | .98% | | 1.16% | | .56% |
| Supplemental Data | | | | | | | | | | | | |
| Net assets, end of period (000 omitted) | $ | 95,224 | $ | 117,059 | $ | 115,869 | $ | 74,904 | $ | 83,858 | $ | 73,101 |
Portfolio turnover rate J | | 17% I | | 28% | | 23% | | 35% | | 27% | | 18% |
A Calculated based on average shares outstanding during the period.
B Net investment income (loss) is affected by the timing of the declaration of dividends by any underlying mutual funds or exchange-traded funds (ETFs). Net investment income (loss) of any such underlying funds is not included in the Fund's net investment income (loss) ratio.
C Total distributions per share do not sum due to rounding.
D Total returns for periods of less than one year are not annualized.
E Total returns would have been lower if certain expenses had not been reduced during the applicable periods shown.
F Total returns do not include the effect of the sales charges.
G Fees and expenses of any underlying mutual funds or exchange-traded funds (ETFs) are not included in the Fund's expense ratio. The Fund indirectly bears its proportionate share of these expenses. For additional expense information related to investments in Fidelity Central Funds, please refer to the "Investments in Fidelity Central Funds" note found in the Notes to Financial Statements section of the most recent Annual or Semi-Annual report.
H Expense ratios reflect operating expenses of the class. Expenses before reductions do not reflect amounts reimbursed, waived, or reduced through arrangements with the investment adviser, brokerage services, or other offset arrangements, if applicable, and do not represent the amount paid by the class during periods when reimbursements, waivers or reductions occur.
I Annualized
J Amount does not include the portfolio activity of any underlying mutual funds or exchange-traded funds (ETFs).
| Fidelity Advisor Freedom® 2055 Fund Class C |
| |
| | Six months ended (Unaudited) September 30, 2022 | | Years ended March 31, 2022 | | 2021 | | 2020 | | 2019 | | 2018 |
Selected Per-Share Data | | | | | | | | | | | | |
| Net asset value, beginning of period | $ | 14.20 | $ | 15.16 | $ | 10.38 | $ | 12.44 | $ | 13.26 | $ | 12.11 |
| Income from Investment Operations | | | | | | | | | | | | |
Net investment income (loss) A,B | | .02 | | .17 | | (.02) | | .06 | | .08 | | .01 |
| Net realized and unrealized gain (loss) | | (2.90) | | .19 | | 5.44 | | (1.36) | | .16 | | 1.51 |
| Total from investment operations | | (2.88) | | .36 | | 5.42 | | (1.30) | | .24 | | 1.52 |
| Distributions from net investment income | | - | | (.21) | | (.05) | | (.09) | | (.13) | | (.06) |
| Distributions from net realized gain | | (.98) | | (1.12) | | (.59) | | (.68) | | (.93) | | (.31) |
| Total distributions | | (.98) | | (1.32) C | | (.64) | | (.76) C | | (1.06) | | (.37) |
| Net asset value, end of period | $ | 10.34 | $ | 14.20 | $ | 15.16 | $ | 10.38 | $ | 12.44 | $ | 13.26 |
Total Return D,E,F | | (21.10)% | | 2.03% | | 54.07% | | (11.29)% | | 2.32% | | 12.62% |
Ratios to Average Net Assets B,G,H | | | | | | | | | | | | |
| Expenses before reductions | | 1.75% I | | 1.75% | | 1.75% | | 1.75% | | 1.74% C | | 1.64% |
| Expenses net of fee waivers, if any | | 1.75% I | | 1.75% | | 1.75% | | 1.75% | | 1.74% C | | 1.64% |
| Expenses net of all reductions | | 1.75% I | | 1.75% | | 1.75% | | 1.75% | | 1.74% C | | 1.64% |
| Net investment income (loss) | | .28% I | | 1.08% | | (.12)% | | .48% | | .66% | | .05% |
| Supplemental Data | | | | | | | | | | | | |
| Net assets, end of period (000 omitted) | $ | 12,618 | $ | 15,942 | $ | 16,677 | $ | 9,928 | $ | 10,991 | $ | 10,685 |
Portfolio turnover rate J | | 17% I | | 28% | | 23% | | 35% | | 27% | | 18% |
A Calculated based on average shares outstanding during the period.
B Net investment income (loss) is affected by the timing of the declaration of dividends by any underlying mutual funds or exchange-traded funds (ETFs). Net investment income (loss) of any such underlying funds is not included in the Fund's net investment income (loss) ratio.
C On certain classes, the size and fluctuation of net assets and expense amounts may cause ratios to differ from contractual rates.
D Total returns for periods of less than one year are not annualized.
E Total returns would have been lower if certain expenses had not been reduced during the applicable periods shown.
F Total returns do not include the effect of the contingent deferred sales charge.
G Fees and expenses of any underlying mutual funds or exchange-traded funds (ETFs) are not included in the Fund's expense ratio. The Fund indirectly bears its proportionate share of these expenses. For additional expense information related to investments in Fidelity Central Funds, please refer to the "Investments in Fidelity Central Funds" note found in the Notes to Financial Statements section of the most recent Annual or Semi-Annual report.
H Expense ratios reflect operating expenses of the class. Expenses before reductions do not reflect amounts reimbursed, waived, or reduced through arrangements with the investment adviser, brokerage services, or other offset arrangements, if applicable, and do not represent the amount paid by the class during periods when reimbursements, waivers or reductions occur.
I Annualized
J Amount does not include the portfolio activity of any underlying mutual funds or exchange-traded funds (ETFs).
| Fidelity Advisor Freedom® 2055 Fund Class I |
| |
| | Six months ended (Unaudited) September 30, 2022 | | Years ended March 31, 2022 | | 2021 | | 2020 | | 2019 | | 2018 |
Selected Per-Share Data | | | | | | | | | | | | |
| Net asset value, beginning of period | $ | 14.61 | $ | 15.53 | $ | 10.57 | $ | 12.64 | $ | 13.43 | $ | 12.24 |
| Income from Investment Operations | | | | | | | | | | | | |
Net investment income (loss) A,B | | .08 | | .33 | | .12 | | .19 | | .21 | | .14 |
| Net realized and unrealized gain (loss) | | (2.99) | | .19 | | 5.57 | | (1.39) | | .15 | | 1.53 |
| Total from investment operations | | (2.91) | | .52 | | 5.69 | | (1.20) | | .36 | | 1.67 |
| Distributions from net investment income | | - | | (.33) | | (.14) | | (.18) | | (.22) | | (.16) |
| Distributions from net realized gain | | (.99) | | (1.12) | | (.59) | | (.70) | | (.93) | | (.32) |
| Total distributions | | (.99) | | (1.44) C | | (.73) | | (.87) C | | (1.15) | | (.48) |
| Net asset value, end of period | $ | 10.71 | $ | 14.61 | $ | 15.53 | $ | 10.57 | $ | 12.64 | $ | 13.43 |
Total Return D,E | | (20.69)% | | 3.00% | | 55.72% | | (10.45)% | | 3.34% | | 13.74% |
Ratios to Average Net Assets B,F,G | | | | | | | | | | | | |
| Expenses before reductions | | .75% H | | .75% | | .75% | | .75% | | .75% | | .64% |
| Expenses net of fee waivers, if any | | .75% H | | .75% | | .75% | | .75% | | .75% | | .64% |
| Expenses net of all reductions | | .75% H | | .75% | | .75% | | .75% | | .75% | | .64% |
| Net investment income (loss) | | 1.28% H | | 2.08% | | .88% | | 1.48% | | 1.66% | | 1.05% |
| Supplemental Data | | | | | | | | | | | | |
| Net assets, end of period (000 omitted) | $ | 328,011 | $ | 428,209 | $ | 432,057 | $ | 273,147 | $ | 308,366 | $ | 249,432 |
Portfolio turnover rate I | | 17% H | | 28% | | 23% | | 35% | | 27% | | 18% |
A Calculated based on average shares outstanding during the period.
B Net investment income (loss) is affected by the timing of the declaration of dividends by any underlying mutual funds or exchange-traded funds (ETFs). Net investment income (loss) of any such underlying funds is not included in the Fund's net investment income (loss) ratio.
C Total distributions per share do not sum due to rounding.
D Total returns for periods of less than one year are not annualized.
E Total returns would have been lower if certain expenses had not been reduced during the applicable periods shown.
F Fees and expenses of any underlying mutual funds or exchange-traded funds (ETFs) are not included in the Fund's expense ratio. The Fund indirectly bears its proportionate share of these expenses. For additional expense information related to investments in Fidelity Central Funds, please refer to the "Investments in Fidelity Central Funds" note found in the Notes to Financial Statements section of the most recent Annual or Semi-Annual report.
G Expense ratios reflect operating expenses of the class. Expenses before reductions do not reflect amounts reimbursed, waived, or reduced through arrangements with the investment adviser, brokerage services, or other offset arrangements, if applicable, and do not represent the amount paid by the class during periods when reimbursements, waivers or reductions occur.
H Annualized
I Amount does not include the portfolio activity of any underlying mutual funds or exchange-traded funds (ETFs).
| Fidelity Advisor Freedom® 2055 Fund Class Z |
| |
| | Six months ended (Unaudited) September 30, 2022 | | Years ended March 31, 2022 | | 2021 | | 2020 | | 2019 A |
Selected Per-Share Data | | | | | | | | | | |
| Net asset value, beginning of period | $ | 14.47 | $ | 15.40 | $ | 10.50 | $ | 12.58 | $ | 13.57 |
| Income from Investment Operations | | | | | | | | | | |
Net investment income (loss) B,C | | .08 | | .34 | | .13 | | .20 | | .38 |
| Net realized and unrealized gain (loss) | | (2.95) | | .20 | | 5.53 | | (1.36) | | (.65) |
| Total from investment operations | | (2.87) | | .54 | | 5.66 | | (1.16) | | (.27) |
| Distributions from net investment income | | - | | (.35) | | (.17) | | (.20) | | (.28) |
| Distributions from net realized gain | | (1.00) | | (1.12) | | (.59) | | (.71) | | (.43) |
| Total distributions | | (1.00) | | (1.47) | | (.76) | | (.92) D | | (.72) D |
| Net asset value, end of period | $ | 10.60 | $ | 14.47 | $ | 15.40 | $ | 10.50 | $ | 12.58 |
Total Return E,F | | (20.61)% | | 3.10% | | 55.82% | | (10.28)% | | (1.35)% |
Ratios to Average Net Assets C,G,H | | | | | | | | | | |
| Expenses before reductions | | .64% I | | .64% | | .64% | | .65% J | | .65% I,J |
| Expenses net of fee waivers, if any | | .64% I | | .64% | | .64% | | .65% J | | .65% I,J |
| Expenses net of all reductions | | .64% I | | .64% | | .64% | | .65% J | | .65% I,J |
| Net investment income (loss) | | 1.39% I | | 2.19% | | .99% | | 1.58% | | 6.29% I |
| Supplemental Data | | | | | | | | | | |
| Net assets, end of period (000 omitted) | $ | 36,335 | $ | 31,712 | $ | 16,623 | $ | 5,767 | $ | 428 |
Portfolio turnover rate K | | 17% I | | 28% | | 23% | | 35% | | 27% |
A For the period October 2, 2018 (commencement of sale of shares) through March 31, 2019.
B Calculated based on average shares outstanding during the period.
C Net investment income (loss) is affected by the timing of the declaration of dividends by any underlying mutual funds or exchange-traded funds (ETFs). Net investment income (loss) of any such underlying funds is not included in the Fund's net investment income (loss) ratio.
D Total distributions per share do not sum due to rounding.
E Total returns for periods of less than one year are not annualized.
F Total returns would have been lower if certain expenses had not been reduced during the applicable periods shown.
G Fees and expenses of any underlying mutual funds or exchange-traded funds (ETFs) are not included in the Fund's expense ratio. The Fund indirectly bears its proportionate share of these expenses. For additional expense information related to investments in Fidelity Central Funds, please refer to the "Investments in Fidelity Central Funds" note found in the Notes to Financial Statements section of the most recent Annual or Semi-Annual report.
H Expense ratios reflect operating expenses of the class. Expenses before reductions do not reflect amounts reimbursed, waived, or reduced through arrangements with the investment adviser, brokerage services, or other offset arrangements, if applicable, and do not represent the amount paid by the class during periods when reimbursements, waivers or reductions occur.
I Annualized
J On certain classes, the size and fluctuation of net assets and expense amounts may cause ratios to differ from contractual rates.
K Amount does not include the portfolio activity of any underlying mutual funds or exchange-traded funds (ETFs).
| Fidelity Advisor Freedom® 2055 Fund Class Z6 |
| |
| | Six months ended (Unaudited) September 30, 2022 | | Years ended March 31, 2022 | | 2021 | | 2020 | | 2019 | | 2018 A |
Selected Per-Share Data | | | | | | | | | | | | |
| Net asset value, beginning of period | $ | 14.60 | $ | 15.51 | $ | 10.55 | $ | 12.62 | $ | 13.42 | $ | 12.63 |
| Income from Investment Operations | | | | | | | | | | | | |
Net investment income (loss) B,C | | .09 | | .36 | | .15 | | .22 | | .24 | | .47 |
| Net realized and unrealized gain (loss) | | (2.99) | | .21 | | 5.57 | | (1.38) | | .15 | | .69 |
| Total from investment operations | | (2.90) | | .57 | | 5.72 | | (1.16) | | .39 | | 1.16 |
| Distributions from net investment income | | - | | (.36) | | (.17) | | (.21) | | (.26) | | (.19) |
| Distributions from net realized gain | | (1.00) | | (1.12) | | (.59) | | (.71) | | (.93) | | (.18) |
| Total distributions | | (1.00) | | (1.48) | | (.76) | | (.91) D | | (1.19) | | (.37) |
| Net asset value, end of period | $ | 10.70 | $ | 14.60 | $ | 15.51 | $ | 10.55 | $ | 12.62 | $ | 13.42 |
Total Return E,F | | (20.61)% | | 3.30% | | 56.14% | | (10.22)% | | 3.59% | | 9.16% |
Ratios to Average Net Assets C,G,H | | | | | | | | | | | | |
| Expenses before reductions | | .49% I | | .49% | | .49% | | .49% | | .50% J | | .50% I,J |
| Expenses net of fee waivers, if any | | .49% I | | .49% | | .49% | | .49% | | .50% J | | .50% I,J |
| Expenses net of all reductions | | .49% I | | .49% | | .49% | | .49% | | .50% J | | .50% I,J |
| Net investment income (loss) | | 1.54% I | | 2.34% | | 1.14% | | 1.73% | | 1.91% | | 4.26% I |
| Supplemental Data | | | | | | | | | | | | |
| Net assets, end of period (000 omitted) | $ | 108,002 | $ | 104,160 | $ | 61,302 | $ | 23,906 | $ | 12,968 | $ | 3,116 |
Portfolio turnover rate K | | 17% I | | 28% | | 23% | | 35% | | 27% | | 18% |
A For the period June 6, 2017 (commencement of sale of shares) through March 31, 2018.
B Calculated based on average shares outstanding during the period.
C Net investment income (loss) is affected by the timing of the declaration of dividends by any underlying mutual funds or exchange-traded funds (ETFs). Net investment income (loss) of any such underlying funds is not included in the Fund's net investment income (loss) ratio.
D Total distributions per share do not sum due to rounding.
E Total returns for periods of less than one year are not annualized.
F Total returns would have been lower if certain expenses had not been reduced during the applicable periods shown.
G Fees and expenses of any underlying mutual funds or exchange-traded funds (ETFs) are not included in the Fund's expense ratio. The Fund indirectly bears its proportionate share of these expenses. For additional expense information related to investments in Fidelity Central Funds, please refer to the "Investments in Fidelity Central Funds" note found in the Notes to Financial Statements section of the most recent Annual or Semi-Annual report.
H Expense ratios reflect operating expenses of the class. Expenses before reductions do not reflect amounts reimbursed, waived, or reduced through arrangements with the investment adviser, brokerage services, or other offset arrangements, if applicable, and do not represent the amount paid by the class during periods when reimbursements, waivers or reductions occur.
I Annualized
J On certain classes, the size and fluctuation of net assets and expense amounts may cause ratios to differ from contractual rates.
K Amount does not include the portfolio activity of any underlying mutual funds or exchange-traded funds (ETFs).
The information in the following table is based on the direct Investments of the Fund.
Top Holdings (% of Fund's net assets) |
| |
| Fidelity Series Emerging Markets Opportunities Fund | 13.2 | |
| Fidelity Series Large Cap Stock Fund | 9.7 | |
| Fidelity Series Overseas Fund | 7.5 | |
| Fidelity Series International Value Fund | 7.4 | |
| Fidelity Series International Growth Fund | 7.4 | |
| Fidelity Series Value Discovery Fund | 6.4 | |
| Fidelity Advisor Series Equity Growth Fund | 6.4 | |
| Fidelity Series Stock Selector Large Cap Value Fund | 6.2 | |
| Fidelity Series Opportunistic Insights Fund | 5.8 | |
| Fidelity Series Long-Term Treasury Bond Index Fund | 5.7 | |
| | 75.7 | |
| |
Domestic Equity Funds category includes Fidelity Series Commodity Strategy Fund which invests in commodity-related investments.
Asset Allocation (% of Fund's net assets) |
|
Percentages shown as 0.0% may reflect amounts less than 0.05%. |
|
Fidelity Advisor Freedom® 2060 Fund
Showing Percentage of Net Assets
| U.S. Treasury Obligations - 0.1% |
| | | Principal Amount (a) | Value ($) |
U.S. Treasury Bills, yield at date of purchase 2.13% to 3.29% 10/13/22 to 12/29/22 (b) (Cost $249,171) | | 250,000 | 249,205 |
| | | | |
| Domestic Equity Funds - 50.0% |
| | | Shares | Value ($) |
| Fidelity Advisor Series Equity Growth Fund (c) | | 1,913,471 | 23,248,676 |
| Fidelity Advisor Series Growth Opportunities Fund (c) | | 1,871,005 | 16,408,714 |
| Fidelity Advisor Series Small Cap Fund (c) | | 969,389 | 10,149,507 |
| Fidelity Series All-Sector Equity Fund (c) | | 1,077,119 | 9,241,680 |
| Fidelity Series Commodity Strategy Fund (c) | | 2,060,715 | 4,306,894 |
| Fidelity Series Large Cap Stock Fund (c) | | 2,399,887 | 35,446,336 |
| Fidelity Series Large Cap Value Index Fund (c) | | 304,415 | 3,872,159 |
| Fidelity Series Opportunistic Insights Fund (c) | | 1,488,260 | 21,148,177 |
| Fidelity Series Small Cap Opportunities Fund (c) | | 1,133,246 | 12,216,390 |
| Fidelity Series Stock Selector Large Cap Value Fund (c) | | 2,018,139 | 22,542,609 |
| Fidelity Series Value Discovery Fund (c) | | 1,689,217 | 23,260,518 |
| TOTAL DOMESTIC EQUITY FUNDS (Cost $208,638,419) | | | 181,841,660 |
| | | | |
| International Equity Funds - 42.0% |
| | | Shares | Value ($) |
| Fidelity Series Canada Fund (c) | | 950,703 | 11,788,713 |
| Fidelity Series Emerging Markets Fund (c) | | 722,118 | 5,228,135 |
| Fidelity Series Emerging Markets Opportunities Fund (c) | | 3,298,526 | 47,894,604 |
| Fidelity Series International Growth Fund (c) | | 2,094,338 | 26,849,416 |
| Fidelity Series International Small Cap Fund (c) | | 514,157 | 7,033,674 |
| Fidelity Series International Value Fund (c) | | 3,151,069 | 27,067,684 |
| Fidelity Series Overseas Fund (c) | | 2,844,575 | 27,108,800 |
| TOTAL INTERNATIONAL EQUITY FUNDS (Cost $184,698,896) | | | 152,971,026 |
| | | | |
| Bond Funds - 7.4% |
| | | Shares | Value ($) |
| Fidelity Series 5+ Year Inflation-Protected Bond Index Fund (c) | | 45,041 | 359,879 |
| Fidelity Series Emerging Markets Debt Fund (c) | | 279,503 | 1,917,387 |
| Fidelity Series Emerging Markets Debt Local Currency Fund (c) | | 79,139 | 630,739 |
| Fidelity Series Floating Rate High Income Fund (c) | | 42,587 | 370,510 |
| Fidelity Series High Income Fund (c) | | 251,273 | 1,980,035 |
| Fidelity Series International Credit Fund (c) | | 3,868 | 30,444 |
| Fidelity Series Long-Term Treasury Bond Index Fund (c) | | 3,482,574 | 20,790,966 |
| Fidelity Series Real Estate Income Fund (c) | | 98,675 | 939,387 |
| TOTAL BOND FUNDS (Cost $35,054,874) | | | 27,019,347 |
| | | | |
| Short-Term Funds - 0.5% |
| | | Shares | Value ($) |
| Fidelity Cash Central Fund 3.10% (d) | | 94,270 | 94,289 |
| Fidelity Series Government Money Market Fund 3.00% (c)(e) | | 1,862,215 | 1,862,215 |
| Fidelity Series Short-Term Credit Fund (c) | | 0 | 3 |
| TOTAL SHORT-TERM FUNDS (Cost $1,956,507) | | | 1,956,507 |
| | | | |
| TOTAL INVESTMENT IN SECURITIES - 100.0% (Cost $430,597,867) | 364,037,745 |
NET OTHER ASSETS (LIABILITIES) - 0.0% | (79,849) |
| NET ASSETS - 100.0% | 363,957,896 |
| | |
| Futures Contracts |
| | Number of contracts | Expiration Date | Notional Amount ($) | Value ($) | Unrealized Appreciation/ (Depreciation) ($) |
| Purchased | | | | | |
| | | | | | |
| Treasury Contracts | | | | | |
| CBOT 10-Year U.S. Treasury Note Contracts (United States) | 59 | Dec 2022 | 6,611,688 | (399,210) | (399,210) |
| CBOT Ultra Long Term U.S. Treasury Bond Contracts (United States) | 6 | Dec 2022 | 822,000 | (11,304) | (11,304) |
| | | | | | |
| TOTAL PURCHASED | | | | | (410,514) |
| | | | | | |
| Sold | | | | | |
| | | | | | |
| Equity Index Contracts | | | | | |
| CME E-mini S&P 500 Index Contracts (United States) | 10 | Dec 2022 | 1,800,750 | (99) | (99) |
| ICE E-mini MSCI EAFE Index Contracts (United States) | 17 | Dec 2022 | 1,411,510 | 191,568 | 191,568 |
| ICE E-mini MSCI Emerging Markets Index Contracts (United States) | 14 | Dec 2022 | 610,050 | 4,790 | 4,790 |
| | | | | | |
| TOTAL SOLD | | | | | 196,259 |
| | | | | | |
| TOTAL FUTURES CONTRACTS | | | | | (214,255) |
| The notional amount of futures purchased as a percentage of Net Assets is 2.0% |
| The notional amount of futures sold as a percentage of Net Assets is 1.1% |
Share amounts shown as "0" represent less than 1 share.
Legend
| (a) | Amount is stated in United States dollars unless otherwise noted. |
| (b) | Security or a portion of the security was pledged to cover margin requirements for futures contracts. At period end, the value of securities pledged amounted to $249,205. |
| (d) | Affiliated fund that is generally available only to investment companies and other accounts managed by Fidelity Investments. The rate quoted is the annualized seven-day yield of the fund at period end. A complete unaudited listing of the fund's holdings as of its most recent quarter end is available upon request. In addition, each Fidelity Central Fund's financial statements are available on the SEC's website or upon request. |
| (e) | The rate quoted is the annualized seven-day yield of the fund at period end. |
Affiliated Central Funds
Fiscal year to date information regarding the Fund's investments in Fidelity Central Funds, including the ownership percentage, is presented below.
| Affiliate | Value, beginning of period ($) | Purchases ($) | Sales Proceeds ($) | Dividend Income ($) | Realized Gain (loss) ($) | Change in Unrealized appreciation (depreciation) ($) | Value, end of period ($) | %ownership, end of period |
| Fidelity Cash Central Fund 3.10% | 251,164 | 1,344,261 | 1,501,136 | 2,399 | - | - | 94,289 | 0.0% |
| Total | 251,164 | 1,344,261 | 1,501,136 | 2,399 | - | - | 94,289 | |
| | | | | | | | | |
Amounts in the income column in the above table include any capital gain distributions from underlying funds, which are presented in the corresponding line item in the Statement of Operations, if applicable.
Affiliated Underlying Funds
Fiscal year to date information regarding the Fund's investments in affiliated Underlying Funds is presented below. Exchanges between classes of the same affiliated Underlying Funds may occur. If an Underlying Funds changes its name, the name presented below is the name in effect at period end.
| Affiliate | Value, beginning of period ($) | Purchases ($) | Sales Proceeds ($) | Dividend Income ($) | Realized Gain (loss) ($) | Change in Unrealized appreciation (depreciation) ($) | Value, end of period ($) |
| Fidelity Advisor Series Equity Growth Fund | 25,859,450 | 4,508,281 | 1,246,867 | - | (72,717) | (5,799,471) | 23,248,676 |
| Fidelity Advisor Series Growth Opportunities Fund | 17,736,820 | 5,065,119 | 900,628 | - | (133,953) | (5,358,644) | 16,408,714 |
| Fidelity Advisor Series Small Cap Fund | 11,737,384 | 1,648,563 | 907,114 | - | (73,695) | (2,255,631) | 10,149,507 |
| Fidelity Series 5+ Year Inflation-Protected Bond Index Fund | 413,795 | 48,460 | 31,202 | - | (1,363) | (69,811) | 359,879 |
| Fidelity Series All-Sector Equity Fund | 11,092,271 | 1,250,705 | 761,253 | - | (62,336) | (2,277,707) | 9,241,680 |
| Fidelity Series Canada Fund | 13,466,722 | 2,162,829 | 999,715 | - | (88,740) | (2,752,383) | 11,788,713 |
| Fidelity Series Commodity Strategy Fund | 6,166,222 | 4,158,139 | 2,321,306 | 3,151,493 | (797,432) | (2,898,729) | 4,306,894 |
| Fidelity Series Emerging Markets Debt Fund | 2,022,929 | 325,810 | 67,086 | 54,728 | (10,539) | (353,727) | 1,917,387 |
| Fidelity Series Emerging Markets Debt Local Currency Fund | 684,904 | 84,658 | 56,701 | - | (10,033) | (72,089) | 630,739 |
| Fidelity Series Emerging Markets Fund | 5,685,511 | 1,112,258 | 196,734 | - | (48,570) | (1,324,330) | 5,228,135 |
| Fidelity Series Emerging Markets Opportunities Fund | 52,507,578 | 9,204,922 | 1,901,305 | - | (565,374) | (11,351,217) | 47,894,604 |
| Fidelity Series Floating Rate High Income Fund | 413,744 | 59,899 | 81,064 | 10,627 | (2,760) | (19,309) | 370,510 |
| Fidelity Series Government Money Market Fund 3.00% | - | 1,862,215 | - | 83 | - | - | 1,862,215 |
| Fidelity Series High Income Fund | 2,504,557 | 331,775 | 533,632 | 60,894 | (38,876) | (283,789) | 1,980,035 |
| Fidelity Series International Credit Fund | 35,306 | 482 | - | 482 | - | (5,344) | 30,444 |
| Fidelity Series International Growth Fund | 30,778,566 | 5,121,263 | 1,586,671 | - | (250,007) | (7,213,735) | 26,849,416 |
| Fidelity Series International Small Cap Fund | 8,429,119 | 1,044,705 | 323,294 | - | (61,827) | (2,055,029) | 7,033,674 |
| Fidelity Series International Value Fund | 31,082,389 | 5,289,191 | 2,097,707 | - | (131,107) | (7,075,082) | 27,067,684 |
| Fidelity Series Investment Grade Bond Fund | 2,204,608 | 77,139 | 2,195,804 | 8,030 | (93,058) | 7,115 | - |
| Fidelity Series Large Cap Stock Fund | 40,694,947 | 7,390,092 | 3,040,488 | 2,062,444 | (180,658) | (9,417,557) | 35,446,336 |
| Fidelity Series Large Cap Value Index Fund | 4,401,581 | 517,567 | 255,994 | - | (16,879) | (774,116) | 3,872,159 |
| Fidelity Series Long-Term Treasury Bond Index Fund | 22,122,987 | 5,683,767 | 1,750,677 | 279,138 | (392,367) | (4,872,744) | 20,790,966 |
| Fidelity Series Opportunistic Insights Fund | 23,900,700 | 4,197,651 | 1,289,902 | - | (141,597) | (5,518,675) | 21,148,177 |
| Fidelity Series Overseas Fund | 30,946,442 | 5,100,961 | 761,116 | - | (121,166) | (8,056,321) | 27,108,800 |
| Fidelity Series Real Estate Income Fund | 1,478,278 | 202,581 | 530,841 | 70,061 | (30,826) | (179,805) | 939,387 |
| Fidelity Series Short-Term Credit Fund | - | 3 | - | - | - | - | 3 |
| Fidelity Series Small Cap Opportunities Fund | 14,491,882 | 2,181,997 | 1,332,476 | 563,665 | (141,002) | (2,984,011) | 12,216,390 |
| Fidelity Series Stock Selector Large Cap Value Fund | 25,972,743 | 3,288,659 | 2,033,956 | - | (114,626) | (4,570,211) | 22,542,609 |
| Fidelity Series Value Discovery Fund | 26,456,267 | 3,328,472 | 2,737,537 | - | (152,091) | (3,634,593) | 23,260,518 |
| | 413,287,702 | 75,248,163 | 29,941,070 | 6,261,645 | (3,733,599) | (91,166,945) | 363,694,251 |
Amounts in the income column in the above table include any capital gain distributions from underlying funds, which are presented in the corresponding line item in the Statement of Operations, if applicable.
Investment Valuation
The following is a summary of the inputs used, as of September 30, 2022, involving the Fund's assets and liabilities carried at fair value. The inputs or methodology used for valuing securities may not be an indication of the risk associated with investing in those securities. For more information on valuation inputs, and their aggregation into the levels used below, please refer to the Investment Valuation section in the accompanying Notes to Financial Statements.
| Valuation Inputs at Reporting Date: |
| Description | Total ($) | Level 1 ($) | Level 2 ($) | Level 3 ($) |
Investments in Securities: | | | | |
|
| Other Short-Term Investments | 249,205 | - | 249,205 | - |
|
| Domestic Equity Funds | 181,841,660 | 181,841,660 | - | - |
|
| International Equity Funds | 152,971,026 | 152,971,026 | - | - |
|
| Bond Funds | 27,019,347 | 27,019,347 | - | - |
|
| Short-Term Funds | 1,956,507 | 1,956,507 | - | - |
| Total Investments in Securities: | 364,037,745 | 363,788,540 | 249,205 | - |
Derivative Instruments: | | | | |
|
| Assets | | | | |
Futures Contracts | 196,358 | 196,358 | - | - |
| Total Assets | 196,358 | 196,358 | - | - |
|
| Liabilities | | | | |
Futures Contracts | (410,613) | (410,613) | - | - |
| Total Liabilities | (410,613) | (410,613) | - | - |
| Total Derivative Instruments: | (214,255) | (214,255) | - | - |
Value of Derivative Instruments
The following table is a summary of the Fund's value of derivative instruments by primary risk exposure as of September 30, 2022. For additional information on derivative instruments, please refer to the Derivative Instruments section in the accompanying Notes to Financial Statements.
Primary Risk Exposure / Derivative Type | Value |
| Asset ($) | Liability ($) |
| Equity Risk | | |
Futures Contracts (a) | 196,358 | (99) |
| Total Equity Risk | 196,358 | (99) |
| Interest Rate Risk | | |
Futures Contracts (a) | 0 | (410,515) |
| Total Interest Rate Risk | 0 | (410,515) |
| Total Value of Derivatives | 196,358 | (410,613) |
(a)Reflects gross cumulative appreciation (depreciation) on futures contracts as presented in the Schedule of Investments. In the Statement of Assets and Liabilities, the period end daily variation margin is included in receivable or payable for daily variation margin on futures contracts, and the net cumulative appreciation (depreciation) is included in Total accumulated earnings (loss).
Fidelity Advisor Freedom® 2060 Fund
| Statement of Assets and Liabilities |
| | | | September 30, 2022 (Unaudited) |
| | | | | |
| Assets | | | | |
| Investment in securities, at value - See accompanying schedule: | $ | | | |
Unaffiliated issuers (cost $249,171) | | $249,205 | | |
Fidelity Central Funds (cost $94,289) | | 94,289 | | |
Other affiliated issuers (cost $430,254,407) | | 363,694,251 | | |
| | | | | |
| Total Investment in Securities (cost $430,597,867) | | | $ | 364,037,745 |
| Receivable for investments sold | | | | 2,460,967 |
| Receivable for fund shares sold | | | | 1,378,590 |
| Distributions receivable from Fidelity Central Funds | | | | 316 |
| Receivable for daily variation margin on futures contracts | | | | 2,031 |
Total assets | | | | 367,879,649 |
| Liabilities | | | | |
| Payable for investments purchased | | 2,175,577 | | |
| Payable for fund shares redeemed | | 1,448,717 | | |
| Accrued management fee | | 226,575 | | |
| Distribution and service plan fees payable | | 47,391 | | |
| Payable for daily variation margin on futures contracts | | 23,493 | | |
| Total Liabilities | | | | 3,921,753 |
| Net Assets | | | $ | 363,957,896 |
| Net Assets consist of: | | | | |
| Paid in capital | | | $ | 435,096,646 |
| Total accumulated earnings (loss) | | | | (71,138,750) |
| Net Assets | | | $ | 363,957,896 |
| | | | | |
| Net Asset Value and Maximum Offering Price | | | | |
| Class A : | | | | |
Net Asset Value and redemption price per share ($102,311,817 ÷ 10,482,724 shares) (a) | | | $ | 9.76 |
| Maximum offering price per share (100/94.25 of $9.76) | | | $ | 10.36 |
| Class M : | | | | |
Net Asset Value and redemption price per share ($41,957,942 ÷ 4,324,284 shares) (a) | | | $ | 9.70 |
| Maximum offering price per share (100/96.50 of $9.70) | | | $ | 10.05 |
| Class C : | | | | |
Net Asset Value and offering price per share ($6,931,715 ÷ 720,671 shares) (a) | | | $ | 9.62 |
| Class I : | | | | |
Net Asset Value , offering price and redemption price per share ($143,305,367 ÷ 14,577,659 shares) | | | $ | 9.83 |
| Class Z : | | | | |
Net Asset Value , offering price and redemption price per share ($18,487,725 ÷ 1,895,543 shares) | | | $ | 9.75 |
| Class Z6 : | | | | |
Net Asset Value , offering price and redemption price per share ($50,963,330 ÷ 5,183,375 shares) | | | $ | 9.83 |
(a)Redemption price per share is equal to net asset value less any applicable contingent deferred sales charge. |
| Statement of Operations |
| | | | Six months ended September 30, 2022 (Unaudited) |
| Investment Income | | | | |
| Dividends: | | | | |
| Affiliated issuers | | | $ | 4,041,934 |
| Interest | | | | 1,758 |
| Income from Fidelity Central Funds | | | | 2,399 |
| Total Income | | | | 4,046,091 |
| Expenses | | | | |
| Management fee | $ | 1,381,845 | | |
| Distribution and service plan fees | | 291,069 | | |
| Independent trustees' fees and expenses | | 659 | | |
| Total expenses before reductions | | 1,673,573 | | |
| Expense reductions | | (76) | | |
| Total expenses after reductions | | | | 1,673,497 |
| Net Investment income (loss) | | | | 2,372,594 |
| Realized and Unrealized Gain (Loss) | | | | |
| Net realized gain (loss) on: | | | | |
| Investment Securities: | | | | |
| Unaffiliated issuers | | 59 | | |
| Affiliated issuers | | (3,733,599) | | |
| Futures contracts | | (278,666) | | |
| Capital gain distributions from underlying funds: | | | | |
| Affiliated issuers | | 2,219,711 | | |
| Total net realized gain (loss) | | | | (1,792,495) |
| Change in net unrealized appreciation (depreciation) on: | | | | |
| Investment Securities: | | | | |
| Unaffiliated issuers | | 31 | | |
| Affiliated issuers | | (91,166,945) | | |
| Futures contracts | | (226,591) | | |
| Total change in net unrealized appreciation (depreciation) | | | | (91,393,505) |
| Net gain (loss) | | | | (93,186,000) |
| Net increase (decrease) in net assets resulting from operations | | | $ | (90,813,406) |
| Statement of Changes in Net Assets |
| |
| | Six months ended September 30, 2022 (Unaudited) | | Year ended March 31, 2022 |
| Increase (Decrease) in Net Assets | | | | |
| Operations | | | | |
| Net investment income (loss) | $ | 2,372,594 | $ | 7,959,268 |
| Net realized gain (loss) | | (1,792,495) | | 35,780,430 |
| Change in net unrealized appreciation (depreciation) | | (91,393,505) | | (34,656,039) |
| Net increase (decrease) in net assets resulting from operations | | (90,813,406) | | 9,083,659 |
| Distributions to shareholders | | (26,739,838) | | (33,222,541) |
| Share transactions - net increase (decrease) | | 67,843,806 | | 86,926,804 |
| Total increase (decrease) in net assets | | (49,709,438) | | 62,787,922 |
| | | | | |
| Net Assets | | | | |
| Beginning of period | | 413,667,334 | | 350,879,412 |
| End of period | $ | 363,957,896 | $ | 413,667,334 |
| | | | | |
| | | | | |
Financial Highlights
| Fidelity Advisor Freedom® 2060 Fund Class A |
| |
| | Six months ended (Unaudited) September 30, 2022 | | Years ended March 31, 2022 | | 2021 | | 2020 | | 2019 | | 2018 |
Selected Per-Share Data | | | | | | | | | | | | |
| Net asset value, beginning of period | $ | 13.26 | $ | 14.01 | $ | 9.49 | $ | 11.31 | $ | 11.86 | $ | 10.76 |
| Income from Investment Operations | | | | | | | | | | | | |
Net investment income (loss) A,B | | .06 | | .27 | | .08 | | .14 | | .17 | | .10 |
| Net realized and unrealized gain (loss) | | (2.72) | | .16 | | 5.01 | | (1.24) | | .13 | | 1.34 |
| Total from investment operations | | (2.66) | | .43 | | 5.09 | | (1.10) | | .30 | | 1.44 |
| Distributions from net investment income | | - | | (.25) C | | (.11) | | (.14) | | (.17) | | (.11) |
| Distributions from net realized gain | | (.84) | | (.93) C | | (.46) | | (.58) | | (.68) | | (.23) |
| Total distributions | | (.84) | | (1.18) | | (.57) | | (.72) | | (.85) | | (.34) |
| Net asset value, end of period | $ | 9.76 | $ | 13.26 | $ | 14.01 | $ | 9.49 | $ | 11.31 | $ | 11.86 |
Total Return D,E,F | | (20.77)% | | 2.74% | | 55.28% | | (10.65)% | | 3.09% | | 13.44% |
Ratios to Average Net Assets B,G,H | | | | | | | | | | | | |
| Expenses before reductions | | 1.00% I | | 1.00% | | 1.00% | | 1.00% | | 1.00% | | .91% |
| Expenses net of fee waivers, if any | | 1.00% I | | 1.00% | | 1.00% | | 1.00% | | 1.00% | | .91% |
| Expenses net of all reductions | | 1.00% I | | 1.00% | | 1.00% | | 1.00% | | 1.00% | | .91% |
| Net investment income (loss) | | 1.08% I | | 1.87% | | .65% | | 1.25% | | 1.48% | | .84% |
| Supplemental Data | | | | | | | | | | | | |
| Net assets, end of period (000 omitted) | $ | 102,312 | $ | 119,726 | $ | 113,936 | $ | 65,792 | $ | 55,732 | $ | 37,880 |
Portfolio turnover rate J | | 15% I | | 28% | | 24% | | 31% | | 27% | | 16% |
A Calculated based on average shares outstanding during the period.
B Net investment income (loss) is affected by the timing of the declaration of dividends by any underlying mutual funds or exchange-traded funds (ETFs). Net investment income (loss) of any such underlying funds is not included in the Fund's net investment income (loss) ratio.
C The amount shown reflects reclassifications related to book to tax differences that were made in the year shown.
D Total returns for periods of less than one year are not annualized.
E Total returns would have been lower if certain expenses had not been reduced during the applicable periods shown.
F Total returns do not include the effect of the sales charges.
G Fees and expenses of any underlying mutual funds or exchange-traded funds (ETFs) are not included in the Fund's expense ratio. The Fund indirectly bears its proportionate share of these expenses. For additional expense information related to investments in Fidelity Central Funds, please refer to the "Investments in Fidelity Central Funds" note found in the Notes to Financial Statements section of the most recent Annual or Semi-Annual report.
H Expense ratios reflect operating expenses of the class. Expenses before reductions do not reflect amounts reimbursed, waived, or reduced through arrangements with the investment adviser, brokerage services, or other offset arrangements, if applicable, and do not represent the amount paid by the class during periods when reimbursements, waivers or reductions occur.
I Annualized
J Amount does not include the portfolio activity of any underlying mutual funds or exchange-traded funds (ETFs).
| Fidelity Advisor Freedom® 2060 Fund Class M |
| |
| | Six months ended (Unaudited) September 30, 2022 | | Years ended March 31, 2022 | | 2021 | | 2020 | | 2019 | | 2018 |
Selected Per-Share Data | | | | | | | | | | | | |
| Net asset value, beginning of period | $ | 13.21 | $ | 13.97 | $ | 9.47 | $ | 11.29 | $ | 11.85 | $ | 10.77 |
| Income from Investment Operations | | | | | | | | | | | | |
Net investment income (loss) A,B | | .05 | | .23 | | .05 | | .11 | | .14 | | .07 |
| Net realized and unrealized gain (loss) | | (2.72) | | .17 | | 5.00 | | (1.23) | | .14 | | 1.33 |
| Total from investment operations | | (2.67) | | .40 | | 5.05 | | (1.12) | | .28 | | 1.40 |
| Distributions from net investment income | | - | | (.23) C | | (.09) | | (.12) | | (.16) | | (.10) |
| Distributions from net realized gain | | (.84) | | (.93) C | | (.46) | | (.58) | | (.68) | | (.22) |
| Total distributions | | (.84) | | (1.16) | | (.55) | | (.70) | | (.84) | | (.32) |
| Net asset value, end of period | $ | 9.70 | $ | 13.21 | $ | 13.97 | $ | 9.47 | $ | 11.29 | $ | 11.85 |
Total Return D,E,F | | (20.94)% | | 2.50% | | 55.00% | | (10.87)% | | 2.82% | | 13.04% |
Ratios to Average Net Assets B,G,H | | | | | | | | | | | | |
| Expenses before reductions | | 1.25% I | | 1.25% | | 1.25% | | 1.25% | | 1.25% | | 1.16% |
| Expenses net of fee waivers, if any | | 1.25% I | | 1.25% | | 1.25% | | 1.25% | | 1.25% | | 1.16% |
| Expenses net of all reductions | | 1.25% I | | 1.25% | | 1.25% | | 1.25% | | 1.25% | | 1.16% |
| Net investment income (loss) | | .83% I | | 1.62% | | .40% | | 1.00% | | 1.23% | | .59% |
| Supplemental Data | | | | | | | | | | | | |
| Net assets, end of period (000 omitted) | $ | 41,958 | $ | 48,458 | $ | 41,642 | $ | 21,680 | $ | 19,070 | $ | 12,628 |
Portfolio turnover rate J | | 15% I | | 28% | | 24% | | 31% | | 27% | | 16% |
A Calculated based on average shares outstanding during the period.
B Net investment income (loss) is affected by the timing of the declaration of dividends by any underlying mutual funds or exchange-traded funds (ETFs). Net investment income (loss) of any such underlying funds is not included in the Fund's net investment income (loss) ratio.
C The amount shown reflects reclassifications related to book to tax differences that were made in the year shown.
D Total returns for periods of less than one year are not annualized.
E Total returns would have been lower if certain expenses had not been reduced during the applicable periods shown.
F Total returns do not include the effect of the sales charges.
G Fees and expenses of any underlying mutual funds or exchange-traded funds (ETFs) are not included in the Fund's expense ratio. The Fund indirectly bears its proportionate share of these expenses. For additional expense information related to investments in Fidelity Central Funds, please refer to the "Investments in Fidelity Central Funds" note found in the Notes to Financial Statements section of the most recent Annual or Semi-Annual report.
H Expense ratios reflect operating expenses of the class. Expenses before reductions do not reflect amounts reimbursed, waived, or reduced through arrangements with the investment adviser, brokerage services, or other offset arrangements, if applicable, and do not represent the amount paid by the class during periods when reimbursements, waivers or reductions occur.
I Annualized
J Amount does not include the portfolio activity of any underlying mutual funds or exchange-traded funds (ETFs).
| Fidelity Advisor Freedom® 2060 Fund Class C |
| |
| | Six months ended (Unaudited) September 30, 2022 | | Years ended March 31, 2022 | | 2021 | | 2020 | | 2019 | | 2018 |
Selected Per-Share Data | | | | | | | | | | | | |
| Net asset value, beginning of period | $ | 13.13 | $ | 13.92 | $ | 9.46 | $ | 11.29 | $ | 11.87 | $ | 10.81 |
| Income from Investment Operations | | | | | | | | | | | | |
Net investment income (loss) A,B | | .02 | | .16 | | (.01) | | .06 | | .08 | | .01 |
| Net realized and unrealized gain (loss) | | (2.69) | | .16 | | 4.98 | | (1.24) | | .14 | | 1.34 |
| Total from investment operations | | (2.67) | | .32 | | 4.97 | | (1.18) | | .22 | | 1.35 |
| Distributions from net investment income | | - | | (.18) C | | (.05) | | (.08) | | (.12) | | (.07) |
| Distributions from net realized gain | | (.84) | | (.93) C | | (.46) | | (.57) | | (.68) | | (.22) |
| Total distributions | | (.84) | | (1.11) | | (.51) | | (.65) | | (.80) | | (.29) |
| Net asset value, end of period | $ | 9.62 | $ | 13.13 | $ | 13.92 | $ | 9.46 | $ | 11.29 | $ | 11.87 |
Total Return D,E,F | | (21.07)% | | 1.94% | | 54.14% | | (11.27)% | | 2.33% | | 12.53% |
Ratios to Average Net Assets B,G,H | | | | | | | | | | | | |
| Expenses before reductions | | 1.75% I | | 1.75% | | 1.75% | | 1.75% | | 1.75% | | 1.66% |
| Expenses net of fee waivers, if any | | 1.75% I | | 1.75% | | 1.75% | | 1.75% | | 1.75% | | 1.66% |
| Expenses net of all reductions | | 1.75% I | | 1.75% | | 1.75% | | 1.75% | | 1.75% | | 1.66% |
| Net investment income (loss) | | .33% I | | 1.12% | | (.10)% | | .50% | | .72% | | .09% |
| Supplemental Data | | | | | | | | | | | | |
| Net assets, end of period (000 omitted) | $ | 6,932 | $ | 8,195 | $ | 6,948 | $ | 4,022 | $ | 3,723 | $ | 2,604 |
Portfolio turnover rate J | | 15% I | | 28% | | 24% | | 31% | | 27% | | 16% |
A Calculated based on average shares outstanding during the period.
B Net investment income (loss) is affected by the timing of the declaration of dividends by any underlying mutual funds or exchange-traded funds (ETFs). Net investment income (loss) of any such underlying funds is not included in the Fund's net investment income (loss) ratio.
C The amount shown reflects reclassifications related to book to tax differences that were made in the year shown.
D Total returns for periods of less than one year are not annualized.
E Total returns would have been lower if certain expenses had not been reduced during the applicable periods shown.
F Total returns do not include the effect of the contingent deferred sales charge.
G Fees and expenses of any underlying mutual funds or exchange-traded funds (ETFs) are not included in the Fund's expense ratio. The Fund indirectly bears its proportionate share of these expenses. For additional expense information related to investments in Fidelity Central Funds, please refer to the "Investments in Fidelity Central Funds" note found in the Notes to Financial Statements section of the most recent Annual or Semi-Annual report.
H Expense ratios reflect operating expenses of the class. Expenses before reductions do not reflect amounts reimbursed, waived, or reduced through arrangements with the investment adviser, brokerage services, or other offset arrangements, if applicable, and do not represent the amount paid by the class during periods when reimbursements, waivers or reductions occur.
I Annualized
J Amount does not include the portfolio activity of any underlying mutual funds or exchange-traded funds (ETFs).
| Fidelity Advisor Freedom® 2060 Fund Class I |
| |
| | Six months ended (Unaudited) September 30, 2022 | | Years ended March 31, 2022 | | 2021 | | 2020 | | 2019 | | 2018 |
Selected Per-Share Data | | | | | | | | | | | | |
| Net asset value, beginning of period | $ | 13.34 | $ | 14.09 | $ | 9.54 | $ | 11.36 | $ | 11.90 | $ | 10.80 |
| Income from Investment Operations | | | | | | | | | | | | |
Net investment income (loss) A,B | | .08 | | .30 | | .11 | | .17 | | .20 | | .13 |
| Net realized and unrealized gain (loss) | | (2.75) | | .17 | | 5.03 | | (1.24) | | .13 | | 1.33 |
| Total from investment operations | | (2.67) | | .47 | | 5.14 | | (1.07) | | .33 | | 1.46 |
| Distributions from net investment income | | - | | (.28) C | | (.13) | | (.16) | | (.20) | | (.13) |
| Distributions from net realized gain | | (.84) | | (.94) C | | (.47) | | (.59) | | (.68) | | (.23) |
| Total distributions | | (.84) | | (1.22) | | (.59) D | | (.75) | | (.87) D | | (.36) |
| Net asset value, end of period | $ | 9.83 | $ | 13.34 | $ | 14.09 | $ | 9.54 | $ | 11.36 | $ | 11.90 |
Total Return E,F | | (20.72)% | | 3.01% | | 55.62% | | (10.38)% | | 3.38% | | 13.63% |
Ratios to Average Net Assets B,G,H | | | | | | | | | | | | |
| Expenses before reductions | | .75% I | | .75% | | .75% | | .75% | | .75% | | .66% |
| Expenses net of fee waivers, if any | | .75% I | | .75% | | .75% | | .75% | | .75% | | .66% |
| Expenses net of all reductions | | .75% I | | .75% | | .75% | | .75% | | .75% | | .66% |
| Net investment income (loss) | | 1.33% I | | 2.12% | | .90% | | 1.50% | | 1.73% | | 1.09% |
| Supplemental Data | | | | | | | | | | | | |
| Net assets, end of period (000 omitted) | $ | 143,305 | $ | 177,481 | $ | 160,415 | $ | 87,182 | $ | 68,445 | $ | 43,513 |
Portfolio turnover rate J | | 15% I | | 28% | | 24% | | 31% | | 27% | | 16% |
A Calculated based on average shares outstanding during the period.
B Net investment income (loss) is affected by the timing of the declaration of dividends by any underlying mutual funds or exchange-traded funds (ETFs). Net investment income (loss) of any such underlying funds is not included in the Fund's net investment income (loss) ratio.
C The amount shown reflects reclassifications related to book to tax differences that were made in the year shown.
D Total distributions per share do not sum due to rounding.
E Total returns for periods of less than one year are not annualized.
F Total returns would have been lower if certain expenses had not been reduced during the applicable periods shown.
G Fees and expenses of any underlying mutual funds or exchange-traded funds (ETFs) are not included in the Fund's expense ratio. The Fund indirectly bears its proportionate share of these expenses. For additional expense information related to investments in Fidelity Central Funds, please refer to the "Investments in Fidelity Central Funds" note found in the Notes to Financial Statements section of the most recent Annual or Semi-Annual report.
H Expense ratios reflect operating expenses of the class. Expenses before reductions do not reflect amounts reimbursed, waived, or reduced through arrangements with the investment adviser, brokerage services, or other offset arrangements, if applicable, and do not represent the amount paid by the class during periods when reimbursements, waivers or reductions occur.
I Annualized
J Amount does not include the portfolio activity of any underlying mutual funds or exchange-traded funds (ETFs).
| Fidelity Advisor Freedom® 2060 Fund Class Z |
| |
| | Six months ended (Unaudited) September 30, 2022 | | Years ended March 31, 2022 | | 2021 | | 2020 | | 2019 A |
Selected Per-Share Data | | | | | | | | | | |
| Net asset value, beginning of period | $ | 13.23 | $ | 14.00 | $ | 9.49 | $ | 11.32 | $ | 12.10 |
| Income from Investment Operations | | | | | | | | | | |
Net investment income (loss) B,C | | .08 | | .31 | | .12 | | .18 | | .23 |
| Net realized and unrealized gain (loss) | | (2.72) | | .17 | | 5.02 | | (1.23) | | (.46) |
| Total from investment operations | | (2.64) | | .48 | | 5.14 | | (1.05) | | (.23) |
| Distributions from net investment income | | - | | (.31) D | | (.16) | | (.18) | | (.24) |
| Distributions from net realized gain | | (.84) | | (.94) D | | (.47) | | (.60) | | (.31) |
| Total distributions | | (.84) | | (1.25) | | (.63) | | (.78) | | (.55) |
| Net asset value, end of period | $ | 9.75 | $ | 13.23 | $ | 14.00 | $ | 9.49 | $ | 11.32 |
Total Return E,F | | (20.66)% | | 3.06% | | 55.88% | | (10.32)% | | (1.34)% |
Ratios to Average Net Assets C,G,H | | | | | | | | | | |
| Expenses before reductions | | .64% I | | .64% | | .65% | | .65% J | | .64% I,J |
| Expenses net of fee waivers, if any | | .64% I | | .64% | | .65% | | .65% J | | .64% I,J |
| Expenses net of all reductions | | .64% I | | .64% | | .65% | | .65% J | | .64% I,J |
| Net investment income (loss) | | 1.44% I | | 2.22% | | 1.00% | | 1.60% | | 4.28% I |
| Supplemental Data | | | | | | | | | | |
| Net assets, end of period (000 omitted) | $ | 18,488 | $ | 14,296 | $ | 5,790 | $ | 1,514 | $ | 284 |
Portfolio turnover rate K | | 15% I | | 28% | | 24% | | 31% | | 27% |
A For the period October 2, 2018 (commencement of sale of shares) through March 31, 2019.
B Calculated based on average shares outstanding during the period.
C Net investment income (loss) is affected by the timing of the declaration of dividends by any underlying mutual funds or exchange-traded funds (ETFs). Net investment income (loss) of any such underlying funds is not included in the Fund's net investment income (loss) ratio.
D The amount shown reflects reclassifications related to book to tax differences that were made in the year shown.
E Total returns for periods of less than one year are not annualized.
F Total returns would have been lower if certain expenses had not been reduced during the applicable periods shown.
G Fees and expenses of any underlying mutual funds or exchange-traded funds (ETFs) are not included in the Fund's expense ratio. The Fund indirectly bears its proportionate share of these expenses. For additional expense information related to investments in Fidelity Central Funds, please refer to the "Investments in Fidelity Central Funds" note found in the Notes to Financial Statements section of the most recent Annual or Semi-Annual report.
H Expense ratios reflect operating expenses of the class. Expenses before reductions do not reflect amounts reimbursed, waived, or reduced through arrangements with the investment adviser, brokerage services, or other offset arrangements, if applicable, and do not represent the amount paid by the class during periods when reimbursements, waivers or reductions occur.
I Annualized
J On certain classes, the size and fluctuation of net assets and expense amounts may cause ratios to differ from contractual rates.
K Amount does not include the portfolio activity of any underlying mutual funds or exchange-traded funds (ETFs).
| Fidelity Advisor Freedom® 2060 Fund Class Z6 |
| |
| | Six months ended (Unaudited) September 30, 2022 | | Years ended March 31, 2022 | | 2021 | | 2020 | | 2019 | | 2018 A |
Selected Per-Share Data | | | | | | | | | | | | |
| Net asset value, beginning of period | $ | 13.32 | $ | 14.08 | $ | 9.53 | $ | 11.36 | $ | 11.90 | $ | 11.16 |
| Income from Investment Operations | | | | | | | | | | | | |
Net investment income (loss) B,C | | .09 | | .34 | | .14 | | .20 | | .23 | | .33 |
| Net realized and unrealized gain (loss) | | (2.74) | | .17 | | 5.04 | | (1.25) | | .13 | | .69 |
| Total from investment operations | | (2.65) | | .51 | | 5.18 | | (1.05) | | .36 | | 1.02 |
| Distributions from net investment income | | - | | (.32) D | | (.15) | | (.19) | | (.22) | | (.16) |
| Distributions from net realized gain | | (.84) | | (.95) D | | (.48) | | (.60) | | (.68) | | (.13) |
| Total distributions | | (.84) | | (1.27) | | (.63) | | (.78) E | | (.90) | | (.28) E |
| Net asset value, end of period | $ | 9.83 | $ | 13.32 | $ | 14.08 | $ | 9.53 | $ | 11.36 | $ | 11.90 |
Total Return F,G | | (20.59)% | | 3.23% | | 56.12% | | (10.24)% | | 3.63% | | 9.14% |
Ratios to Average Net Assets C,H,I | | | | | | | | | | | | |
| Expenses before reductions | | .49% J | | .49% | | .49% | | .50% | | .50% K | | .50% J,K |
| Expenses net of fee waivers, if any | | .49% J | | .49% | | .49% | | .50% | | .50% K | | .50% J,K |
| Expenses net of all reductions | | .49% J | | .49% | | .49% | | .50% | | .50% K | | .50% J,K |
| Net investment income (loss) | | 1.59% J | | 2.37% | | 1.15% | | 1.75% | | 1.98% | | 3.41% J |
| Supplemental Data | | | | | | | | | | | | |
| Net assets, end of period (000 omitted) | $ | 50,963 | $ | 45,511 | $ | 22,148 | $ | 6,468 | $ | 2,493 | $ | 802 |
Portfolio turnover rate L | | 15% J | | 28% | | 24% | | 31% | | 27% | | 16% |
A For the period June 6, 2017 (commencement of sale of shares) through March 31, 2018.
B Calculated based on average shares outstanding during the period.
C Net investment income (loss) is affected by the timing of the declaration of dividends by any underlying mutual funds or exchange-traded funds (ETFs). Net investment income (loss) of any such underlying funds is not included in the Fund's net investment income (loss) ratio.
D The amount shown reflects reclassifications related to book to tax differences that were made in the year shown.
E Total distributions per share do not sum due to rounding.
F Total returns for periods of less than one year are not annualized.
G Total returns would have been lower if certain expenses had not been reduced during the applicable periods shown.
H Fees and expenses of any underlying mutual funds or exchange-traded funds (ETFs) are not included in the Fund's expense ratio. The Fund indirectly bears its proportionate share of these expenses. For additional expense information related to investments in Fidelity Central Funds, please refer to the "Investments in Fidelity Central Funds" note found in the Notes to Financial Statements section of the most recent Annual or Semi-Annual report.
I Expense ratios reflect operating expenses of the class. Expenses before reductions do not reflect amounts reimbursed, waived, or reduced through arrangements with the investment adviser, brokerage services, or other offset arrangements, if applicable, and do not represent the amount paid by the class during periods when reimbursements, waivers or reductions occur.
J Annualized
K On certain classes, the size and fluctuation of net assets and expense amounts may cause ratios to differ from contractual rates.
L Amount does not include the portfolio activity of any underlying mutual funds or exchange-traded funds (ETFs).
The information in the following table is based on the direct Investments of the Fund.
Top Holdings (% of Fund's net assets) |
| |
| Fidelity Series Emerging Markets Opportunities Fund | 13.0 | |
| Fidelity Series Large Cap Stock Fund | 9.6 | |
| Fidelity Series Overseas Fund | 7.3 | |
| Fidelity Series International Value Fund | 7.3 | |
| Fidelity Series International Growth Fund | 7.3 | |
| Fidelity Series Long-Term Treasury Bond Index Fund | 6.8 | |
| Fidelity Series Value Discovery Fund | 6.3 | |
| Fidelity Advisor Series Equity Growth Fund | 6.3 | |
| Fidelity Series Stock Selector Large Cap Value Fund | 6.1 | |
| Fidelity Series Opportunistic Insights Fund | 5.8 | |
| | 75.8 | |
| |
Domestic Equity Funds category includes Fidelity Series Commodity Strategy Fund which invests in commodity-related investments.
Asset Allocation (% of Fund's net assets) |
|
Percentages shown as 0.0% may reflect amounts less than 0.05%. |
|
Fidelity Advisor Freedom® 2065 Fund
Showing Percentage of Net Assets
| Domestic Equity Funds - 49.3% |
| | | Shares | Value ($) |
| Fidelity Advisor Series Equity Growth Fund (a) | | 310,090 | 3,767,598 |
| Fidelity Advisor Series Growth Opportunities Fund (a) | | 303,238 | 2,659,401 |
| Fidelity Advisor Series Small Cap Fund (a) | | 157,128 | 1,645,133 |
| Fidelity Series All-Sector Equity Fund (a) | | 174,513 | 1,497,324 |
| Fidelity Series Commodity Strategy Fund (a) | | 297,719 | 622,233 |
| Fidelity Series Large Cap Stock Fund (a) | | 388,901 | 5,744,068 |
| Fidelity Series Large Cap Value Index Fund (a) | | 49,292 | 626,998 |
| Fidelity Series Opportunistic Insights Fund (a) | | 241,173 | 3,427,074 |
| Fidelity Series Small Cap Opportunities Fund (a) | | 184,063 | 1,984,198 |
| Fidelity Series Stock Selector Large Cap Value Fund (a) | | 327,117 | 3,653,893 |
| Fidelity Series Value Discovery Fund (a) | | 273,758 | 3,769,649 |
| TOTAL DOMESTIC EQUITY FUNDS (Cost $35,888,228) | | | 29,397,569 |
| | | | |
| International Equity Funds - 41.5% |
| | | Shares | Value ($) |
| Fidelity Series Canada Fund (a) | | 152,403 | 1,889,800 |
| Fidelity Series Emerging Markets Fund (a) | | 118,921 | 860,987 |
| Fidelity Series Emerging Markets Opportunities Fund (a) | | 533,333 | 7,743,993 |
| Fidelity Series International Growth Fund (a) | | 338,161 | 4,335,225 |
| Fidelity Series International Small Cap Fund (a) | | 82,758 | 1,132,134 |
| Fidelity Series International Value Fund (a) | | 507,301 | 4,357,720 |
| Fidelity Series Overseas Fund (a) | | 459,222 | 4,376,383 |
| TOTAL INTERNATIONAL EQUITY FUNDS (Cost $31,861,815) | | | 24,696,242 |
| | | | |
| Bond Funds - 7.9% |
| | | Shares | Value ($) |
| Fidelity Series 5+ Year Inflation-Protected Bond Index Fund (a) | | 43,545 | 347,928 |
| Fidelity Series Emerging Markets Debt Fund (a) | | 11,946 | 81,948 |
| Fidelity Series Emerging Markets Debt Local Currency Fund (a) | | 3,383 | 26,964 |
| Fidelity Series Floating Rate High Income Fund (a) | | 7,518 | 65,408 |
| Fidelity Series International Credit Fund (a) | | 549 | 4,323 |
| Fidelity Series Long-Term Treasury Bond Index Fund (a) | | 675,049 | 4,030,040 |
| Fidelity Series Real Estate Income Fund (a) | | 17,765 | 169,127 |
| TOTAL BOND FUNDS (Cost $5,794,059) | | | 4,725,738 |
| | | | |
| Short-Term Funds - 1.3% |
| | | Shares | Value ($) |
| Fidelity Series Government Money Market Fund 3.00% (a)(b) | | 784,876 | 784,876 |
| Fidelity Series Short-Term Credit Fund (a) | | 66 | 623 |
| TOTAL SHORT-TERM FUNDS (Cost $785,499) | | | 785,499 |
| | | | |
| TOTAL INVESTMENT IN SECURITIES - 100.0% (Cost $74,329,601) | 59,605,048 |
NET OTHER ASSETS (LIABILITIES) - 0.0% | (8,438) |
| NET ASSETS - 100.0% | 59,596,610 |
| | |
Legend
| (b) | The rate quoted is the annualized seven-day yield of the fund at period end. |
Affiliated Underlying Funds
Fiscal year to date information regarding the Fund's investments in affiliated Underlying Funds is presented below. Exchanges between classes of the same affiliated Underlying Funds may occur. If an Underlying Funds changes its name, the name presented below is the name in effect at period end.
| Affiliate | Value, beginning of period ($) | Purchases ($) | Sales Proceeds ($) | Dividend Income ($) | Realized Gain (loss) ($) | Change in Unrealized appreciation (depreciation) ($) | Value, end of period ($) |
| Fidelity Advisor Series Equity Growth Fund | 3,355,824 | 1,502,865 | 235,449 | - | (43,019) | (812,623) | 3,767,598 |
| Fidelity Advisor Series Growth Opportunities Fund | 2,301,541 | 1,271,910 | 111,112 | - | (31,898) | (771,040) | 2,659,401 |
| Fidelity Advisor Series Small Cap Fund | 1,522,962 | 591,491 | 130,291 | - | (26,260) | (312,769) | 1,645,133 |
| Fidelity Series 5+ Year Inflation-Protected Bond Index Fund | 54,273 | 308,765 | 4,417 | - | (290) | (10,403) | 347,928 |
| Fidelity Series All-Sector Equity Fund | 1,439,375 | 486,859 | 89,524 | - | (11,697) | (327,689) | 1,497,324 |
| Fidelity Series Canada Fund | 1,783,893 | 693,376 | 174,353 | - | (9,408) | (403,708) | 1,889,800 |
| Fidelity Series Commodity Strategy Fund | 811,258 | 930,121 | 509,630 | 527,106 | (344,997) | (264,519) | 622,233 |
| Fidelity Series Emerging Markets Debt Fund | 277,311 | 50,990 | 220,551 | 3,922 | (36,364) | 10,562 | 81,948 |
| Fidelity Series Emerging Markets Debt Local Currency Fund | 90,087 | 18,162 | 75,377 | - | (11,989) | 6,081 | 26,964 |
| Fidelity Series Emerging Markets Fund | 763,516 | 337,455 | 30,044 | - | (7,879) | (202,061) | 860,987 |
| Fidelity Series Emerging Markets Opportunities Fund | 7,010,387 | 2,916,967 | 365,686 | - | (148,676) | (1,668,999) | 7,743,993 |
| Fidelity Series Floating Rate High Income Fund | 54,236 | 21,067 | 6,733 | 1,581 | (152) | (3,010) | 65,408 |
| Fidelity Series Government Money Market Fund 3.00% | - | 784,876 | - | 53 | - | - | 784,876 |
| Fidelity Series High Income Fund | 328,328 | 31,547 | 345,788 | 2,891 | (21,801) | 7,714 | - |
| Fidelity Series International Credit Fund | 5,013 | 69 | - | 68 | - | (759) | 4,323 |
| Fidelity Series International Growth Fund | 4,073,578 | 1,864,687 | 496,573 | - | (59,916) | (1,046,551) | 4,335,225 |
| Fidelity Series International Small Cap Fund | 1,115,058 | 378,344 | 49,655 | - | (13,502) | (298,111) | 1,132,134 |
| Fidelity Series International Value Fund | 4,113,099 | 1,593,119 | 271,098 | - | (16,688) | (1,060,712) | 4,357,720 |
| Fidelity Series Investment Grade Bond Fund | 298,348 | 219,761 | 507,413 | 1,313 | (11,463) | 767 | - |
| Fidelity Series Large Cap Stock Fund | 5,279,380 | 2,385,492 | 480,035 | 318,848 | (47,479) | (1,393,290) | 5,744,068 |
| Fidelity Series Large Cap Value Index Fund | 571,497 | 207,825 | 35,218 | - | (2,734) | (114,372) | 626,998 |
| Fidelity Series Long-Term Treasury Bond Index Fund | 2,908,529 | 2,320,489 | 343,665 | 47,330 | (72,033) | (783,280) | 4,030,040 |
| Fidelity Series Opportunistic Insights Fund | 3,101,740 | 1,357,318 | 210,238 | - | (83,192) | (738,554) | 3,427,074 |
| Fidelity Series Overseas Fund | 4,095,435 | 1,899,767 | 418,124 | - | (58,859) | (1,141,836) | 4,376,383 |
| Fidelity Series Real Estate Income Fund | 195,074 | 79,331 | 70,645 | 12,410 | (7,142) | (27,491) | 169,127 |
| Fidelity Series Short-Term Credit Fund | - | 623 | - | - | - | - | 623 |
| Fidelity Series Small Cap Opportunities Fund | 1,880,385 | 727,000 | 160,181 | 90,786 | (38,454) | (424,552) | 1,984,198 |
| Fidelity Series Stock Selector Large Cap Value Fund | 3,370,227 | 1,315,004 | 335,034 | - | (26,797) | (669,507) | 3,653,893 |
| Fidelity Series Value Discovery Fund | 3,432,621 | 1,377,920 | 475,310 | - | (34,194) | (531,388) | 3,769,649 |
| | 54,232,975 | 25,673,200 | 6,152,144 | 1,006,308 | (1,166,883) | (12,982,100) | 59,605,048 |
Amounts in the income column in the above table include any capital gain distributions from underlying funds, which are presented in the corresponding line item in the Statement of Operations, if applicable.
Investment Valuation
The following is a summary of the inputs used, as of September 30, 2022, involving the Fund's assets and liabilities carried at fair value. The inputs or methodology used for valuing securities may not be an indication of the risk associated with investing in those securities. For more information on valuation inputs, and their aggregation into the levels used below, please refer to the Investment Valuation section in the accompanying Notes to Financial Statements.
| Valuation Inputs at Reporting Date: |
| Description | Total ($) | Level 1 ($) | Level 2 ($) | Level 3 ($) |
Investments in Securities: | | | | |
|
| Domestic Equity Funds | 29,397,569 | 29,397,569 | - | - |
|
| International Equity Funds | 24,696,242 | 24,696,242 | - | - |
|
| Bond Funds | 4,725,738 | 4,725,738 | - | - |
|
| Short-Term Funds | 785,499 | 785,499 | - | - |
| Total Investments in Securities: | 59,605,048 | 59,605,048 | - | - |
Fidelity Advisor Freedom® 2065 Fund
| Statement of Assets and Liabilities |
| | | | September 30, 2022 (Unaudited) |
| | | | | |
| Assets | | | | |
| Investment in securities, at value - See accompanying schedule: | $ | | | |
Affiliated issuers (cost $74,329,601) | | 59,605,048 | | |
| Total Investment in Securities (cost $74,329,601) | | | $ | 59,605,048 |
| Cash | | | | 199 |
| Receivable for investments sold | | | | 733,331 |
| Receivable for fund shares sold | | | | 384,977 |
Total assets | | | | 60,723,555 |
| Liabilities | | | | |
| Payable for investments purchased | | 964,179 | | |
| Payable for fund shares redeemed | | 119,799 | | |
| Accrued management fee | | 36,172 | | |
| Distribution and service plan fees payable | | 6,795 | | |
| Total Liabilities | | | | 1,126,945 |
| Net Assets | | | $ | 59,596,610 |
| Net Assets consist of: | | | | |
| Paid in capital | | | $ | 75,281,661 |
| Total accumulated earnings (loss) | | | | (15,685,051) |
| Net Assets | | | $ | 59,596,610 |
| | | | | |
| Net Asset Value and Maximum Offering Price | | | | |
| Class A : | | | | |
Net Asset Value and redemption price per share ($18,300,248 ÷ 1,990,711 shares) (a) | | | $ | 9.19 |
| Maximum offering price per share (100/94.25 of $9.19) | | | $ | 9.75 |
| Class M : | | | | |
Net Asset Value and redemption price per share ($4,892,463 ÷ 533,840 shares) (a) | | | $ | 9.16 |
| Maximum offering price per share (100/96.50 of $9.16) | | | $ | 9.49 |
| Class C : | | | | |
Net Asset Value and offering price per share ($774,467 ÷ 84,917 shares) (a) | | | $ | 9.12 |
| Class I : | | | | |
Net Asset Value , offering price and redemption price per share ($23,135,682 ÷ 2,505,972 shares) | | | $ | 9.23 |
| Class Z : | | | | |
Net Asset Value , offering price and redemption price per share ($3,105,062 ÷ 335,512 shares) | | | $ | 9.25 |
| Class Z6 : | | | | |
Net Asset Value , offering price and redemption price per share ($9,388,688 ÷ 1,012,737 shares) | | | $ | 9.27 |
(a)Redemption price per share is equal to net asset value less any applicable contingent deferred sales charge. |
| Statement of Operations |
| | | | Six months ended September 30, 2022 (Unaudited) |
| Investment Income | | | | |
| Dividends: | | | | |
| Affiliated issuers | | | $ | 658,800 |
| Expenses | | | | |
| Management fee | $ | 203,054 | | |
| Distribution and service plan fees | | 38,811 | | |
| Independent trustees' fees and expenses | | 92 | | |
| Total expenses before reductions | | 241,957 | | |
| Expense reductions | | (73) | | |
| Total expenses after reductions | | | | 241,884 |
| Net Investment income (loss) | | | | 416,916 |
| Realized and Unrealized Gain (Loss) | | | | |
| Net realized gain (loss) on: | | | | |
| Investment Securities: | | | | |
| Unaffiliated issuers | | (3) | | |
| Affiliated issuers | | (1,166,883) | | |
| Capital gain distributions from underlying funds: | | | | |
| Affiliated issuers | | 347,508 | | |
| Total net realized gain (loss) | | | | (819,378) |
| Change in net unrealized appreciation (depreciation) on: | | | | |
| Investment Securities: | | | | |
| Affiliated issuers | | (12,982,100) | | |
| Total change in net unrealized appreciation (depreciation) | | | | (12,982,100) |
| Net gain (loss) | | | | (13,801,478) |
| Net increase (decrease) in net assets resulting from operations | | | $ | (13,384,562) |
| Statement of Changes in Net Assets |
| |
| | Six months ended September 30, 2022 (Unaudited) | | Year ended March 31, 2022 |
| Increase (Decrease) in Net Assets | | | | |
| Operations | | | | |
| Net investment income (loss) | $ | 416,916 | $ | 837,036 |
| Net realized gain (loss) | | (819,378) | | 3,706,673 |
| Change in net unrealized appreciation (depreciation) | | (12,982,100) | | (4,685,857) |
| Net increase (decrease) in net assets resulting from operations | | (13,384,562) | | (142,148) |
| Distributions to shareholders | | (2,981,474) | | (2,674,101) |
| Share transactions - net increase (decrease) | | 21,736,790 | | 30,921,156 |
| Total increase (decrease) in net assets | | 5,370,754 | | 28,104,907 |
| | | | | |
| Net Assets | | | | |
| Beginning of period | | 54,225,856 | | 26,120,949 |
| End of period | $ | 59,596,610 | $ | 54,225,856 |
| | | | | |
| | | | | |
Financial Highlights
| Fidelity Advisor Freedom® 2065 Fund Class A |
| |
| | Six months ended (Unaudited) September 30, 2022 | | Years ended March 31, 2022 | | 2021 | | 2020 A |
Selected Per-Share Data | | | | | | | | |
| Net asset value, beginning of period | $ | 12.30 | $ | 12.77 | $ | 8.47 | $ | 10.00 |
| Income from Investment Operations | | | | | | | | |
Net investment income (loss) B,C | | .07 | | .25 | | .08 | | .12 |
| Net realized and unrealized gain (loss) | | (2.55) | | .14 D | | 4.53 | | (1.48) |
| Total from investment operations | | (2.48) | | .39 | | 4.61 | | (1.36) |
| Distributions from net investment income | | - | | (.24) | | (.10) | | (.13) |
| Distributions from net realized gain | | (.63) | | (.62) | | (.21) | | (.04) |
| Total distributions | | (.63) | | (.86) | | (.31) | | (.17) |
| Net asset value, end of period | $ | 9.19 | $ | 12.30 | $ | 12.77 | $ | 8.47 |
Total Return E,F | | (20.75)% | | 2.75% | | 55.16% | | (13.92)% |
Ratios to Average Net Assets C,G,H | | | | | | | | |
| Expenses before reductions | | 1.00% I | | 1.00% | | 1.00% | | 1.01% I,J |
| Expenses net of fee waivers, if any | | 1.00% I | | 1.00% | | 1.00% | | 1.01% I,J |
| Expenses net of all reductions | | 1.00% I | | 1.00% | | 1.00% | | 1.01% I,J |
| Net investment income (loss) | | 1.29% I | | 1.94% | | .71% | | 1.60% I |
| Supplemental Data | | | | | | | | |
| Net assets, end of period (000 omitted) | $ | 18,300 | $ | 18,134 | $ | 9,613 | $ | 1,980 |
Portfolio turnover rate K | | 21% I | | 29% | | 31% | | 33% I |
A For the period June 28, 2019 (commencement of operations) through March 31, 2020
B Calculated based on average shares outstanding during the period.
C Net investment income (loss) is affected by the timing of the declaration of dividends by any underlying mutual funds or exchange-traded funds (ETFs). Net investment income (loss) of any such underlying funds is not included in the Fund's net investment income (loss) ratio.
D The amount shown for a share outstanding does not correspond with the aggregate net gain (loss) on investments for the period due to the timing of sales and repurchases of shares in relation to fluctuating market values of the investments of the Fund.
E Total returns for periods of less than one year are not annualized.
F Total returns do not include the effect of the sales charges.
G Fees and expenses of any underlying mutual funds or exchange-traded funds (ETFs) are not included in the Fund's expense ratio. The Fund indirectly bears its proportionate share of these expenses.
H Expense ratios reflect operating expenses of the class. Expenses before reductions do not reflect amounts reimbursed, waived, or reduced through arrangements with the investment adviser, brokerage services, or other offset arrangements, if applicable, and do not represent the amount paid by the class during periods when reimbursements, waivers or reductions occur.
I Annualized
J On certain classes, the size and fluctuation of net assets and expense amounts may cause ratios to differ from contractual rates.
K Amount does not include the portfolio activity of any underlying mutual funds or exchange-traded funds (ETFs).
| Fidelity Advisor Freedom® 2065 Fund Class M |
| |
| | Six months ended (Unaudited) September 30, 2022 | | Years ended March 31, 2022 | | 2021 | | 2020 A |
Selected Per-Share Data | | | | | | | | |
| Net asset value, beginning of period | $ | 12.27 | $ | 12.76 | $ | 8.47 | $ | 10.00 |
| Income from Investment Operations | | | | | | | | |
Net investment income (loss) B,C | | .05 | | .22 | | .05 | | .10 |
| Net realized and unrealized gain (loss) | | (2.54) | | .14 D | | 4.53 | | (1.47) |
| Total from investment operations | | (2.49) | | .36 | | 4.58 | | (1.37) |
| Distributions from net investment income | | - | | (.24) | | (.08) | | (.11) |
| Distributions from net realized gain | | (.62) | | (.61) | | (.20) | | (.04) |
| Total distributions | | (.62) | | (.85) | | (.29) E | | (.16) E |
| Net asset value, end of period | $ | 9.16 | $ | 12.27 | $ | 12.76 | $ | 8.47 |
Total Return F,G | | (20.86)% | | 2.47% | | 54.73% | | (14.05)% |
Ratios to Average Net Assets C,H,I | | | | | | | | |
| Expenses before reductions | | 1.24% J,K | | 1.25% | | 1.25% | | 1.25% J |
| Expenses net of fee waivers, if any | | 1.24% J,K | | 1.25% | | 1.25% | | 1.25% J |
| Expenses net of all reductions | | 1.24% J,K | | 1.25% | | 1.25% | | 1.25% J |
| Net investment income (loss) | | 1.04% J | | 1.69% | | .46% | | 1.35% J |
| Supplemental Data | | | | | | | | |
| Net assets, end of period (000 omitted) | $ | 4,892 | $ | 4,402 | $ | 1,230 | $ | 332 |
Portfolio turnover rate L | | 21% J | | 29% | | 31% | | 33% J |
A For the period June 28, 2019 (commencement of operations) through March 31, 2020
B Calculated based on average shares outstanding during the period.
C Net investment income (loss) is affected by the timing of the declaration of dividends by any underlying mutual funds or exchange-traded funds (ETFs). Net investment income (loss) of any such underlying funds is not included in the Fund's net investment income (loss) ratio.
D The amount shown for a share outstanding does not correspond with the aggregate net gain (loss) on investments for the period due to the timing of sales and repurchases of shares in relation to fluctuating market values of the investments of the Fund.
E Total distributions per share do not sum due to rounding.
F Total returns for periods of less than one year are not annualized.
G Total returns do not include the effect of the sales charges.
H Fees and expenses of any underlying mutual funds or exchange-traded funds (ETFs) are not included in the Fund's expense ratio. The Fund indirectly bears its proportionate share of these expenses.
I Expense ratios reflect operating expenses of the class. Expenses before reductions do not reflect amounts reimbursed, waived, or reduced through arrangements with the investment adviser, brokerage services, or other offset arrangements, if applicable, and do not represent the amount paid by the class during periods when reimbursements, waivers or reductions occur.
J Annualized
K On certain classes, the size and fluctuation of net assets and expense amounts may cause ratios to differ from contractual rates.
L Amount does not include the portfolio activity of any underlying mutual funds or exchange-traded funds (ETFs).
| Fidelity Advisor Freedom® 2065 Fund Class C |
| |
| | Six months ended (Unaudited) September 30, 2022 | | Years ended March 31, 2022 | | 2021 | | 2020 A |
Selected Per-Share Data | | | | | | | | |
| Net asset value, beginning of period | $ | 12.24 | $ | 12.73 | $ | 8.46 | $ | 10.00 |
| Income from Investment Operations | | | | | | | | |
Net investment income (loss) B,C | | .03 | | .15 | | - D | | .06 |
| Net realized and unrealized gain (loss) | | (2.53) | | .14 E | | 4.51 | | (1.47) |
| Total from investment operations | | (2.50) | | .29 | | 4.51 | | (1.41) |
| Distributions from net investment income | | - | | (.18) | | (.04) | | (.09) |
| Distributions from net realized gain | | (.62) | | (.60) | | (.20) | | (.04) |
| Total distributions | | (.62) | | (.78) | | (.24) | | (.13) |
| Net asset value, end of period | $ | 9.12 | $ | 12.24 | $ | 12.73 | $ | 8.46 |
Total Return F,G | | (21.04)% | | 2.00% | | 53.95% | | (14.38)% |
Ratios to Average Net Assets C,H,I | | | | | | | | |
| Expenses before reductions | | 1.74% J,K | | 1.75% | | 1.75% | | 1.75% K |
| Expenses net of fee waivers, if any | | 1.74% J,K | | 1.75% | | 1.75% | | 1.75% K |
| Expenses net of all reductions | | 1.74% J,K | | 1.75% | | 1.75% | | 1.75% K |
| Net investment income (loss) | | .54% K | | 1.19% | | (.04)% | | .86% K |
| Supplemental Data | | | | | | | | |
| Net assets, end of period (000 omitted) | $ | 774 | $ | 774 | $ | 434 | $ | 183 |
Portfolio turnover rate L | | 21% K | | 29% | | 31% | | 33% K |
A For the period June 28, 2019 (commencement of operations) through March 31, 2020
B Calculated based on average shares outstanding during the period.
C Net investment income (loss) is affected by the timing of the declaration of dividends by any underlying mutual funds or exchange-traded funds (ETFs). Net investment income (loss) of any such underlying funds is not included in the Fund's net investment income (loss) ratio.
D Amount represents less than $.005 per share.
E The amount shown for a share outstanding does not correspond with the aggregate net gain (loss) on investments for the period due to the timing of sales and repurchases of shares in relation to fluctuating market values of the investments of the Fund.
F Total returns for periods of less than one year are not annualized.
G Total returns do not include the effect of the contingent deferred sales charge.
H Fees and expenses of any underlying mutual funds or exchange-traded funds (ETFs) are not included in the Fund's expense ratio. The Fund indirectly bears its proportionate share of these expenses.
I Expense ratios reflect operating expenses of the class. Expenses before reductions do not reflect amounts reimbursed, waived, or reduced through arrangements with the investment adviser, brokerage services, or other offset arrangements, if applicable, and do not represent the amount paid by the class during periods when reimbursements, waivers or reductions occur.
J On certain classes, the size and fluctuation of net assets and expense amounts may cause ratios to differ from contractual rates.
K Annualized
L Amount does not include the portfolio activity of any underlying mutual funds or exchange-traded funds (ETFs).
| Fidelity Advisor Freedom® 2065 Fund Class I |
| |
| | Six months ended (Unaudited) September 30, 2022 | | Years ended March 31, 2022 | | 2021 | | 2020 A |
Selected Per-Share Data | | | | | | | | |
| Net asset value, beginning of period | $ | 12.34 | $ | 12.81 | $ | 8.48 | $ | 10.00 |
| Income from Investment Operations | | | | | | | | |
Net investment income (loss) B,C | | .08 | | .29 | | .11 | | .14 |
| Net realized and unrealized gain (loss) | | (2.56) | | .13 D | | 4.55 | | (1.48) |
| Total from investment operations | | (2.48) | | .42 | | 4.66 | | (1.34) |
| Distributions from net investment income | | - | | (.26) | | (.12) | | (.14) |
| Distributions from net realized gain | | (.63) | | (.63) | | (.21) | | (.04) |
| Total distributions | | (.63) | | (.89) | | (.33) | | (.18) |
| Net asset value, end of period | $ | 9.23 | $ | 12.34 | $ | 12.81 | $ | 8.48 |
Total Return E,F | | (20.64)% | | 2.94% | | 55.68% | | (13.78)% |
Ratios to Average Net Assets C,G,H | | | | | | | | |
| Expenses before reductions | | .75% I | | .75% | | .75% | | .75% I |
| Expenses net of fee waivers, if any | | .75% I | | .75% | | .75% | | .75% I |
| Expenses net of all reductions | | .75% I | | .75% | | .75% | | .75% I |
| Net investment income (loss) | | 1.54% I | | 2.19% | | .96% | | 1.85% I |
| Supplemental Data | | | | | | | | |
| Net assets, end of period (000 omitted) | $ | 23,136 | $ | 21,524 | $ | 11,782 | $ | 2,383 |
Portfolio turnover rate J | | 21% I | | 29% | | 31% | | 33% I |
A For the period June 28, 2019 (commencement of operations) through March 31, 2020
B Calculated based on average shares outstanding during the period.
C Net investment income (loss) is affected by the timing of the declaration of dividends by any underlying mutual funds or exchange-traded funds (ETFs). Net investment income (loss) of any such underlying funds is not included in the Fund's net investment income (loss) ratio.
D The amount shown for a share outstanding does not correspond with the aggregate net gain (loss) on investments for the period due to the timing of sales and repurchases of shares in relation to fluctuating market values of the investments of the Fund.
E Total returns for periods of less than one year are not annualized.
F Total returns would have been lower if certain expenses had not been reduced during the applicable periods shown.
G Fees and expenses of any underlying mutual funds or exchange-traded funds (ETFs) are not included in the Fund's expense ratio. The Fund indirectly bears its proportionate share of these expenses.
H Expense ratios reflect operating expenses of the class. Expenses before reductions do not reflect amounts reimbursed, waived, or reduced through arrangements with the investment adviser, brokerage services, or other offset arrangements, if applicable, and do not represent the amount paid by the class during periods when reimbursements, waivers or reductions occur.
I Annualized
J Amount does not include the portfolio activity of any underlying mutual funds or exchange-traded funds (ETFs).
| Fidelity Advisor Freedom® 2065 Fund Class Z |
| |
| | Six months ended (Unaudited) September 30, 2022 | | Years ended March 31, 2022 | | 2021 | | 2020 A |
Selected Per-Share Data | | | | | | | | |
| Net asset value, beginning of period | $ | 12.37 | $ | 12.84 | $ | 8.49 | $ | 10.00 |
| Income from Investment Operations | | | | | | | | |
Net investment income (loss) B,C | | .09 | | .30 | | .12 | | .15 |
| Net realized and unrealized gain (loss) | | (2.57) | | .13 D | | 4.56 | | (1.48) |
| Total from investment operations | | (2.48) | | .43 | | 4.68 | | (1.33) |
| Distributions from net investment income | | - | | (.28) | | (.12) | | (.14) |
| Distributions from net realized gain | | (.64) | | (.62) | | (.20) | | (.04) |
| Total distributions | | (.64) | | (.90) | | (.33) E | | (.18) |
| Net asset value, end of period | $ | 9.25 | $ | 12.37 | $ | 12.84 | $ | 8.49 |
Total Return F,G | | (20.62)% | | 3.02% | | 55.80% | | (13.68)% |
Ratios to Average Net Assets C,H,I | | | | | | | | |
| Expenses before reductions | | .64% J | | .64% | | .65% K | | .64% J |
| Expenses net of fee waivers, if any | | .64% J | | .64% | | .65% K | | .64% J |
| Expenses net of all reductions | | .64% J | | .64% | | .65% K | | .64% J |
| Net investment income (loss) | | 1.64% J | | 2.29% | | 1.07% | | 1.96% J |
| Supplemental Data | | | | | | | | |
| Net assets, end of period (000 omitted) | $ | 3,105 | $ | 1,893 | $ | 535 | $ | 176 |
Portfolio turnover rate L | | 21% J | | 29% | | 31% | | 33% J |
A For the period June 28, 2019 (commencement of operations) through March 31, 2020
B Calculated based on average shares outstanding during the period.
C Net investment income (loss) is affected by the timing of the declaration of dividends by any underlying mutual funds or exchange-traded funds (ETFs). Net investment income (loss) of any such underlying funds is not included in the Fund's net investment income (loss) ratio.
D The amount shown for a share outstanding does not correspond with the aggregate net gain (loss) on investments for the period due to the timing of sales and repurchases of shares in relation to fluctuating market values of the investments of the Fund.
E Total distributions per share do not sum due to rounding.
F Total returns for periods of less than one year are not annualized.
G Total returns would have been lower if certain expenses had not been reduced during the applicable periods shown.
H Fees and expenses of any underlying mutual funds or exchange-traded funds (ETFs) are not included in the Fund's expense ratio. The Fund indirectly bears its proportionate share of these expenses.
I Expense ratios reflect operating expenses of the class. Expenses before reductions do not reflect amounts reimbursed, waived, or reduced through arrangements with the investment adviser, brokerage services, or other offset arrangements, if applicable, and do not represent the amount paid by the class during periods when reimbursements, waivers or reductions occur.
J Annualized
K On certain classes, the size and fluctuation of net assets and expense amounts may cause ratios to differ from contractual rates.
L Amount does not include the portfolio activity of any underlying mutual funds or exchange-traded funds (ETFs).
| Fidelity Advisor Freedom® 2065 Fund Class Z6 |
| |
| | Six months ended (Unaudited) September 30, 2022 | | Years ended March 31, 2022 | | 2021 | | 2020 A |
Selected Per-Share Data | | | | | | | | |
| Net asset value, beginning of period | $ | 12.39 | $ | 12.85 | $ | 8.50 | $ | 10.00 |
| Income from Investment Operations | | | | | | | | |
Net investment income (loss) B,C | | .09 | | .32 | | .14 | | .15 |
| Net realized and unrealized gain (loss) | | (2.57) | | .14 D | | 4.55 | | (1.47) |
| Total from investment operations | | (2.48) | | .46 | | 4.69 | | (1.32) |
| Distributions from net investment income | | - | | (.29) | | (.13) | | (.14) |
| Distributions from net realized gain | | (.64) | | (.63) | | (.21) | | (.04) |
| Total distributions | | (.64) | | (.92) | | (.34) | | (.18) |
| Net asset value, end of period | $ | 9.27 | $ | 12.39 | $ | 12.85 | $ | 8.50 |
Total Return E,F | | (20.56)% | | 3.27% | | 55.97% | | (13.58)% |
Ratios to Average Net Assets C,G,H | | | | | | | | |
| Expenses before reductions | | .49% I | | .49% | | .49% | | .50% I,J |
| Expenses net of fee waivers, if any | | .49% I | | .49% | | .49% | | .50% I,J |
| Expenses net of all reductions | | .49% I | | .49% | | .49% | | .50% I,J |
| Net investment income (loss) | | 1.79% I | | 2.44% | | 1.22% | | 2.11% I |
| Supplemental Data | | | | | | | | |
| Net assets, end of period (000 omitted) | $ | 9,389 | $ | 7,499 | $ | 2,527 | $ | 905 |
Portfolio turnover rate K | | 21% I | | 29% | | 31% | | 33% I |
A For the period June 28, 2019 (commencement of operations) through March 31, 2020
B Calculated based on average shares outstanding during the period.
C Net investment income (loss) is affected by the timing of the declaration of dividends by any underlying mutual funds or exchange-traded funds (ETFs). Net investment income (loss) of any such underlying funds is not included in the Fund's net investment income (loss) ratio.
D The amount shown for a share outstanding does not correspond with the aggregate net gain (loss) on investments for the period due to the timing of sales and repurchases of shares in relation to fluctuating market values of the investments of the Fund.
E Total returns for periods of less than one year are not annualized.
F Total returns would have been lower if certain expenses had not been reduced during the applicable periods shown.
G Fees and expenses of any underlying mutual funds or exchange-traded funds (ETFs) are not included in the Fund's expense ratio. The Fund indirectly bears its proportionate share of these expenses.
H Expense ratios reflect operating expenses of the class. Expenses before reductions do not reflect amounts reimbursed, waived, or reduced through arrangements with the investment adviser, brokerage services, or other offset arrangements, if applicable, and do not represent the amount paid by the class during periods when reimbursements, waivers or reductions occur.
I Annualized
J On certain classes, the size and fluctuation of net assets and expense amounts may cause ratios to differ from contractual rates.
K Amount does not include the portfolio activity of any underlying mutual funds or exchange-traded funds (ETFs).
For the period ended September 30, 2022
1. Organization.
Fidelity Advisor Freedom Income Fund, Fidelity Advisor Freedom 2005 Fund, Fidelity Advisor Freedom 2010 Fund, Fidelity Advisor Freedom 2015 Fund, Fidelity Advisor Freedom 2020 Fund, Fidelity Advisor Freedom 2025 Fund, Fidelity Advisor Freedom 2030 Fund, Fidelity Advisor Freedom 2035 Fund, Fidelity Advisor Freedom 2040 Fund, Fidelity Advisor Freedom 2045 Fund, Fidelity Advisor Freedom 2050 Fund, Fidelity Advisor Freedom 2055 Fund, Fidelity Advisor Freedom 2060 Fund and Fidelity Advisor Freedom 2065 Fund (the Funds) are funds of Fidelity Aberdeen Street Trust (the Trust). The Trust is registered under the Investment Company Act of 1940, as amended (the 1940 Act), as an open-end management investment company organized as a Delaware statutory trust. Each Fund is authorized to issue an unlimited number of shares. Each Fund offers Class A, Class M, Class C, Class I, Class Z and Class Z6 shares, each of which has equal rights as to assets and voting privileges. Each class has exclusive voting rights with respect to matters that affect that class. Class C shares will automatically convert to Class A shares after a holding period of eight years from the initial date of purchase, with certain exceptions.
2. Investments in Fidelity Central Funds.
Funds may invest in Fidelity Central Funds, which are open-end investment companies generally available only to other investment companies and accounts managed by the investment adviser and its affiliates. The Schedule of Investments lists any Fidelity Central Funds held as an investment as of period end, but does not include the underlying holdings of each Fidelity Central Fund. An investing fund indirectly bears its proportionate share of the expenses of the underlying Fidelity Central Funds.
Based on its investment objective, each Fidelity Central Fund may invest or participate in various investment vehicles or strategies that are similar to those of the investing fund. These strategies are consistent with the investment objectives of the investing fund and may involve certain economic risks which may cause a decline in value of each of the Fidelity Central Funds and thus a decline in the value of the investing fund.
| Fidelity Central Fund | Investment Manager | Investment Objective | Investment Practices | Expense Ratio A |
| Fidelity Money Market Central Funds | Fidelity Management & Research Company LLC (FMR) | Each fund seeks to obtain a high level of current income consistent with the preservation of capital and liquidity. | Short-term Investments | Less than .005% |
A Expenses expressed as a percentage of average net assets and are as of each underlying Central Fund's most recent annual or semi-annual shareholder report.
A complete unaudited list of holdings for each Fidelity Central Fund is available upon request or at the Securities and Exchange Commission website at www.sec.gov. In addition, the financial statements of the Fidelity Central Funds which contain the significant accounting policies (including investment valuation policies) of those funds, and are not covered by the Report of Independent Registered Public Accounting Firm, are available on the Securities and Exchange Commission website or upon request.
3. Significant Accounting Policies.
Each Fund is an investment company and applies the accounting and reporting guidance of the Financial Accounting Standards Board (FASB) Accounting Standards Codification Topic 946 Financial Services - Investment Companies . The financial statements have been prepared in conformity with accounting principles generally accepted in the United States of America (GAAP), which require management to make certain estimates and assumptions at the date of the financial statements. Actual results could differ from those estimates. Subsequent events, if any, through the date that the financial statements were issued have been evaluated in the preparation of the financial statements. Each Fund's Schedule of Investments lists any underlying mutual funds or exchange-traded funds (ETFs) but does not include the underlying holdings of these funds. The following summarizes the significant accounting policies of each Fund:
Investment Valuation. Investments are valued as of 4:00 p.m. Eastern time on the last calendar day of the period. Each Fund uses a third party pricing service approved by the Board of Trustees (the Board) to value its investments. The Board of Trustees (the Board) has designated each Fund's investment adviser as the valuation designee responsible for the fair valuation function and performing fair value determinations as needed. The investment adviser has established a Fair Value Committee (the Committee) to carry out the day-to-day fair valuation responsibilities and has adopted policies and procedures to govern the fair valuation process and the activities of the Committee. In accordance with these fair valuation policies and procedures, which have been approved by the Board, each Fund attempts to obtain prices from one or more third party pricing services or brokers to value its investments. When current market prices, quotations or currency exchange rates are not readily available or reliable, investments will be fair valued in good faith by the Committee, in accordance with the policies and procedures. Factors used in determining fair value vary by investment type and may include market or investment specific events, transaction data, estimated cash flows, and market observations of comparable investments. The frequency that the fair valuation procedures are used cannot be predicted and they may be utilized to a significant extent. The Committee manages each Fund's fair valuation practices and maintains the fair valuation policies and procedures. Each Fund's investment adviser reports to the Board information regarding the fair valuation process and related material matters. Each Fund categorizes the inputs to valuation techniques used to value its investments into a disclosure hierarchy consisting of three levels as shown below:
Level 1 - unadjusted quoted prices in active markets for identical investments
Level 2 - other significant observable inputs (including quoted prices for similar investments, interest rates, prepayment speeds, etc.)
Level 3 - unobservable inputs (including the Fund's own assumptions based on the best information available)
Valuation techniques used to value each Fund's investments by major category are as follows. Investments in open-end mutual funds are valued at their closing net asset value (NAV) each business day and are categorized as Level 1 in the hierarchy. Debt securities, including restricted securities, are valued based on evaluated prices received from third party pricing services or from brokers who make markets in such securities. U.S. government and government agency obligations are valued by pricing services who utilize matrix pricing which considers yield or price of bonds of comparable quality, coupon, maturity and type or by broker-supplied prices. When independent prices are unavailable or unreliable, debt securities may be valued utilizing pricing methodologies which consider similar factors that would be used by third party pricing services. Debt securities are generally categorized as Level 2 in the hierarchy but may be Level 3 depending on the circumstances. The aggregate value of investments by input level as of September 30, 2022 is included at the end of each Fund's Schedule of Investments.
Futures contracts are valued at the settlement price established each day by the board of trade or exchange on which they are traded and are categorized as Level 1 in the hierarchy
Investment Transactions and Income. For financial reporting purposes, the Funds' investment holdings and NAV include trades executed through the end of the last business day of the period. The NAV per share for processing shareholder transactions is calculated as of the close of business of the New York Stock Exchange (NYSE), normally 4:00 p.m. Eastern time and includes trades executed through the end of the prior business day. Gains and losses on securities sold are determined on the basis of identified cost. Income and capital gain distributions from any underlying mutual funds or exchange-traded funds (ETFs) are recorded on the ex-dividend date. Distributions from any underlying mutual funds or exchange-traded funds (ETFs) that are deemed to be return of capital are recorded as a reduction of cost of investments. Interest income is accrued as earned. Interest income includes coupon interest and amortization of premium and accretion of discount on debt securities as applicable.
Class Allocations and Expenses. Investment income, realized and unrealized capital gains and losses, common expenses of a fund, and certain fund-level expense reductions, if any, are allocated daily on a pro-rata basis to each class based on the relative net assets of each class to the total net assets of a fund. Each class differs with respect to transfer agent and distribution and service plan fees incurred, as applicable. Certain expense reductions may also differ by class, if applicable. For the reporting period, the allocated portion of income and expenses to each class as a percent of its average net assets may vary due to the timing of recording these transactions in relation to fluctuating net assets of the classes. Expenses directly attributable to a fund are charged to that fund. Expenses attributable to more than one fund are allocated among the respective funds on the basis of relative net assets or other appropriate methods. Expenses included in the accompanying financial statements reflect the expenses of that fund and do not include any expenses associated with any underlying mutual funds or exchange-traded funds. Although not included in a fund's expenses, a fund indirectly bears its proportionate share of these expenses through the net asset value of each underlying mutual fund or exchange-traded fund. Expense estimates are accrued in the period to which they relate and adjustments are made when actual amounts are known.
Income Tax Information and Distributions to Shareholders. Each year, each Fund intends to qualify as a regulated investment company under Subchapter M of the Internal Revenue Code, including distributing substantially all of its taxable income and realized gains. As a result, no provision for U.S. Federal income taxes is required. Each Fund files a U.S. federal tax return, in addition to state and local tax returns as required. Each Fund's federal income tax returns are subject to examination by the Internal Revenue Service (IRS) for a period of three fiscal years after they are filed. State and local tax returns may be subject to examination for an additional fiscal year depending on the jurisdiction.
Distributions are declared and recorded on the ex-dividend date. Income and capital gain distributions are declared separately for each class. Income and capital gain distributions are determined in accordance with income tax regulations, which may differ from GAAP.
Capital accounts within the financial statements are adjusted for permanent book-tax differences. These adjustments have no impact on net assets or the results of operations. Capital accounts are not adjusted for temporary book-tax differences which will reverse in a subsequent period.
Book-tax differences are primarily due to the short-term gain distributions from the underlying mutual funds or exchange-traded funds (ETFs), futures contracts and losses deferred due to wash sales and excise tax regulations.
As of period end, the cost and unrealized appreciation (depreciation) in securities, and derivatives if applicable, for federal income tax purposes were as follows for each Fund:
| | Tax cost | Gross unrealized appreciation | Gross unrealized depreciation | Net unrealized appreciation (depreciation) |
Fidelity Advisor Freedom Income Fund | $199,174,103 | $ 3,256,542 | $ (18,975,746) | $ (15,719,204) |
Fidelity Advisor Freedom 2005 Fund | 121,927,872 | 2,800,122 | (10,835,689) | (8,035,567) |
Fidelity Advisor Freedom 2010 Fund | 287,006,229 | 8,898,354 | (26,675,228) | (17,776,874) |
Fidelity Advisor Freedom 2015 Fund | 590,116,481 | 29,256,299 | (53,600,191) | (24,343,892) |
Fidelity Advisor Freedom 2020 Fund | 1,471,442,374 | 80,677,621 | (155,199,836) | (74,522,215) |
Fidelity Advisor Freedom 2025 Fund | 2,450,234,080 | 135,956,218 | (291,510,560) | (155,554,342) |
Fidelity Advisor Freedom 2030 Fund | 2,864,129,777 | 166,807,761 | (346,123,690) | (179,315,929) |
Fidelity Advisor Freedom 2035 Fund | 2,469,294,827 | 164,591,706 | (293,844,420) | (129,252,714) |
Fidelity Advisor Freedom 2040 Fund | 2,185,317,721 | 159,606,106 | (253,873,022) | (94,266,916) |
Fidelity Advisor Freedom 2045 Fund | 1,591,196,787 | 92,008,853 | (202,503,472) | (110,494,619) |
Fidelity Advisor Freedom 2050 Fund | 1,386,245,955 | 73,824,688 | (182,718,733) | (108,894,045) |
Fidelity Advisor Freedom 2055 Fund | 930,341,217 | 22,266,204 | (139,609,139) | (117,342,935) |
Fidelity Advisor Freedom 2060 Fund | 437,148,569 | 5,654,974 | (78,980,053) | (73,325,079) |
Fidelity Advisor Freedom 2065 Fund | 75,481,162 | 373,423 | (16,249,537) | (15,876,114) |
4. Derivative Instruments.
Risk Exposures and the Use of Derivative Instruments. Each Fund's investment objectives allow for various types of derivative instruments, including futures contracts. Derivatives are investments whose value is primarily derived from underlying assets, indices or reference rates and may be transacted on an exchange or over-the-counter (OTC). Derivatives may involve a future commitment to buy or sell a specified asset based on specified terms, to exchange future cash flows at periodic intervals based on a notional principal amount, or for one party to make one or more payments upon the occurrence of specified events in exchange for periodic payments from the other party.
Derivatives were used to increase returns and to manage exposure to certain risks as defined below. The success of any strategy involving derivatives depends on analysis of numerous economic factors, and if the strategies for investment do not work as intended, the objectives may not be achieved.
Derivatives were used to increase or decrease exposure to the following risk(s):
| | |
| Equity Risk | Equity risk relates to the fluctuations in the value of financial instruments as a result of changes in market prices (other than those arising from interest rate risk or foreign exchange risk), whether caused by factors specific to an individual investment, its issuer, or all factors affecting all instruments traded in a market or market segment. |
| Interest Rate Risk | Interest rate risk relates to the fluctuations in the value of interest-bearing securities due to changes in the prevailing levels of market interest rates. |
| | |
Funds are also exposed to additional risks from investing in derivatives, such as liquidity risk and counterparty credit risk. Liquidity risk is the risk that a fund will be unable to close out the derivative in the open market in a timely manner. Counterparty credit risk is the risk that the counterparty will not be able to fulfill its obligation to a fund. Counterparty credit risk related to exchange-traded contracts may be mitigated by the protection provided by the exchange on which they trade.
Investing in derivatives may involve greater risks than investing in the underlying assets directly and, to varying degrees, may involve risk of loss in excess of any initial investment and collateral received and amounts recognized in the Statement of Assets and Liabilities. In addition, there may be the risk that the change in value of the derivative contract does not correspond to the change in value of the underlying instrument.
Net Realized Gain (Loss) and Change in Net Unrealized Appreciation (Depreciation) on Derivatives. The table below, which reflects the impacts of derivatives on the financial performance, summarizes the net realized gain (loss) and change in net unrealized appreciation (depreciation) for derivatives during the period as presented in the Statement of Operations.
| Primary Risk Exposure / Derivative Type | Net Realized Gain (Loss) | Change in Net Unrealized Appreciation (Depreciation) |
| Fidelity Advisor Freedom Income Fund | | |
| Equity Risk | | |
| Futures Contracts | $ (54,438) | $ 34,045 |
| Total Equity Risk | (54,438) | 34,045 |
| Interest Rate Risk | | |
| Futures Contracts | (21,066) | (202,870 ) |
| Total Interest Rate Risk | (21,066) | (202,870) |
| Totals | $ (75,504) | $ (168,825) |
| Fidelity Advisor Freedom 2005 Fund | | |
| Equity Risk | | |
| Futures Contracts | $ (10,158 ) | $ 5,854 |
| Total Equity Risk | (10,158) | 5,854 |
| Interest Rate Risk | | |
| Futures Contracts | (12,081 ) | (133,924) |
| Total Interest Rate Risk | (12,081) | (133,924) |
| Totals | $ (22,239) | $ (128,070) |
| Fidelity Advisor Freedom 2010 Fund | | |
| Equity Risk | | |
| Futures Contracts | $ (34,495) | $ 39,074 |
| Total Equity Risk | (34,495) | 39,074 |
| Interest Rate Risk | | |
| Futures Contracts | (34,651 ) | (308,652) |
| Total Interest Rate Risk | (34,651) | (308,652) |
| Totals | $ (69,146) | $ (269,578) |
| Fidelity Advisor Freedom 2015 Fund | | |
| Equity Risk | | |
| Futures Contracts | $ (138,672) | $ 121,401 |
| Total Equity Risk | (138,672) | 121,401 |
| Interest Rate Risk | | |
| Futures Contracts | (82,207) | (648,557) |
| Total Interest Rate Risk | (82,207) | (648,557) |
| Totals | $ (220,879) | $ (527,156) |
| Fidelity Advisor Freedom 2020 Fund | | |
| Equity Risk | | |
| Futures Contracts | $ (437,194 ) | $ 381,083 |
| Total Equity Risk | (437,194) | 381,083 |
| Interest Rate Risk | | |
| Futures Contracts | (214,201) | (1,599,506) |
| Total Interest Rate Risk | (214,201) | (1,599,506) |
| Totals | $ (651,395) | $ (1,218,423) |
| Fidelity Advisor Freedom 2025 Fund | | |
| Equity Risk | | |
| Futures Contracts | $ (790,292) | $ 678,486 |
| Total Equity Risk | (790,292) | 678,486 |
| Interest Rate Risk | | |
| Futures Contracts | (362,712) | (2,623,370) |
| Total Interest Rate Risk | (362,712) | (2,623,370) |
| Totals | $ (1,153,004) | $ (1,944,884) |
| Fidelity Advisor Freedom 2030 Fund | | |
| Equity Risk | | |
| Futures Contracts | $ (1,023,943) | $ 874,871 |
| Total Equity Risk | (1,023,943) | 874,871 |
| Interest Rate Risk | | |
| Futures Contracts | (416,427) | (3,064,065) |
| Total Interest Rate Risk | (416,427) | (3,064,065) |
| Totals | $ (1,440,370) | $ (2,189,194) |
| Fidelity Advisor Freedom 2035 Fund | | |
| Equity Risk | | |
| Futures Contracts | $ (1,163,372) | $ 876,048 |
| Total Equity Risk | (1,163,372) | 876,048 |
| Interest Rate Risk | | |
| Futures Contracts | (395,191) | (2,670,972) |
| Total Interest Rate Risk | (395,191) | (2,670,972) |
| Totals | $ (1,558,563) | $ (1,794,924) |
| Fidelity Advisor Freedom 2040 Fund | | |
| Equity Risk | $ | |
| Futures Contracts | (1,329,493) | $ 1,155,724 |
| Total Equity Risk | (1,329,493) | 1,155,724 |
| Interest Rate Risk | | |
| Futures Contracts | (387,665) | (2,393,572 ) |
| Total Interest Rate Risk | (387,665) | (2,393,572) |
| Totals | $ (1,717,158) | $ (1,237,848) |
| Fidelity Advisor Freedom 2045 Fund | | |
| Equity Risk | | |
| Futures Contracts | $ (929,343 ) | $ 716,329 |
| Total Equity Risk | (929,343) | 716,329 |
| Interest Rate Risk | | |
| Futures Contracts | (267,721) | (1,694,319) |
| Total Interest Rate Risk | (267,721) | (1,694,319) |
| Totals | $ (1,197,064) | $ (977,990) |
| Fidelity Advisor Freedom 2050 Fund | | |
| Equity Risk | | |
| Futures Contracts | $ (717,103) | $ 558,066 |
| Total Equity Risk | (717,103) | 558,066 |
| Interest Rate Risk | | |
| Futures Contracts | (228,304 ) | (1,461,122) |
| Total Interest Rate Risk | (228,304) | (1,461,122) |
| Totals | $ (945,407) | $ (903,056) |
| Fidelity Advisor Freedom 2055 Fund | | |
| Equity Risk | | |
| Futures Contracts | $ (466,734) | $ 370,249 |
| Total Equity Risk | (466,734) | 370,249 |
| Interest Rate Risk | | |
| Futures Contracts | (137,708 ) | (929,179) |
| Total Interest Rate Risk | (137,708) | (929,179) |
| Totals | $ (604,442) | $ (558,930) |
| Fidelity Advisor Freedom 2060 Fund | | |
| Equity Risk | | |
| Futures Contracts | $ (218,112 ) | $ 183,923 |
| Total Equity Risk | (218,112) | 183,923 |
| Interest Rate Risk | | |
| Futures Contracts | (60,554) | (410,514) |
| Total Interest Rate Risk | (60,554) | (410,514) |
| Totals | $ (278,666) | $ (226,591) |
If there are any open positions at period end, a summary of the value of derivatives by primary risk exposure is included at the end of the Schedule of Investments.
Futures Contracts. A futures contract is an agreement between two parties to buy or sell a specified underlying instrument for a fixed price at a specified future date. Futures contracts were used to manage exposure to the stock market bond market and fluctuations in interest rates.
Upon entering into a futures contract, a fund is required to deposit either cash or securities (initial margin) with a clearing broker in an amount equal to a certain percentage of the face value of the contract. Futures contracts are marked-to-market daily and subsequent daily payments are made or received by a fund depending on the daily fluctuations in the value of the futures contracts and are recorded as unrealized appreciation or (depreciation). This receivable and/or payable, if any, is included in daily variation margin on futures contracts in the Statement of Assets and Liabilities. Realized gain or (loss) is recorded upon the expiration or closing of a futures contract. The net realized gain (loss) and change in net unrealized appreciation (depreciation) on futures contracts during the period is presented in the Statement of Operations.
Any open futures contracts at period end are presented in the Schedule of Investments under the caption "Futures Contracts". The notional amount at value reflects each contract's exposure to the underlying instrument or index at period end, and is representative of volume of activity during the period unless an average notional amount is presented. Any securities deposited to meet initial margin requirements are identified in the Schedule of Investments. Any cash deposited to meet initial margin requirements is presented as segregated cash with brokers for derivative instruments in the Statement of Assets and Liabilities.
5. Purchases and Sales of Investments.
Purchases and sales of securities, other than short-term securities and in-kind transactions, as applicable, are noted in the table below.
| | Purchases ($) | Sales ($) |
| Fidelity Advisor Freedom Income Fund | 32,711,973 | 39,182,374 |
| Fidelity Advisor Freedom 2005 Fund | 17,961,199 | 31,196,037 |
| Fidelity Advisor Freedom 2010 Fund | 32,920,629 | 53,660,010 |
| Fidelity Advisor Freedom 2015 Fund | 70,218,138 | 113,586,477 |
| Fidelity Advisor Freedom 2020 Fund | 178,030,255 | 308,215,363 |
| Fidelity Advisor Freedom 2025 Fund | 299,204,345 | 409,142,016 |
| Fidelity Advisor Freedom 2030 Fund | 341,211,972 | 384,409,746 |
| Fidelity Advisor Freedom 2035 Fund | 259,310,744 | 276,476,700 |
| Fidelity Advisor Freedom 2040 Fund | 223,526,115 | 231,942,212 |
| Fidelity Advisor Freedom 2045 Fund | 169,501,371 | 155,459,231 |
| Fidelity Advisor Freedom 2050 Fund | 160,258,244 | 124,739,430 |
| Fidelity Advisor Freedom 2055 Fund | 122,464,264 | 74,298,804 |
Fidelity Advisor Freedom 2060 Fund | 75,248,163 | 29,941,070 |
Fidelity Advisor Freedom 2065 Fund | 25,673,200 | 6,152,144 |
6. Fees and Other Transactions with Affiliates.
Management Fee and Expense Contract . Fidelity Management & Research Company LLC (the investment adviser) and its affiliates provide the Funds with investment management related services. Under the management contract, each Class of each Fund pays a monthly management fee that is set at an annual rate by referring to each Fund's target date, indicated by its name, such that the management fee rate applicable to each Class of each Fund is reduced as the fund approaches, and then passes, its target date. In addition, under the management contract, the investment adviser pays all ordinary operating expenses of each Fund, except distribution and service plan fees, fees and expenses of the independent Trustees, and certain miscellaneous expenses such as proxy and shareholder meeting expenses. For each Fund, with the exception of Fidelity Advisor Freedom 2065 Fund, the management fee is reduced by an amount equal to the fees and expenses paid by each Fund to the independent Trustees. For the reporting period, the total annual management fee rate for each Class of each Fund was as follows:
| | Annual % of Class-Level Average Net Assets (Classes A, M, C, I) | Annual % of Class-Level Average Net Assets (Classes Z, Z6) |
| Fidelity Advisor Freedom Income Fund | .465% | .415% |
| Fidelity Advisor Freedom 2005 Fund | .465% | .415% |
| Fidelity Advisor Freedom 2010 Fund | .491% | .435% |
| Fidelity Advisor Freedom 2015 Fund | .533% | .468% |
| Fidelity Advisor Freedom 2020 Fund | .576% | .503% |
| Fidelity Advisor Freedom 2025 Fund | .618% | .538% |
| Fidelity Advisor Freedom 2030 Fund | .661% | .573% |
| Fidelity Advisor Freedom 2035 Fund | .703% | .608% |
| Fidelity Advisor Freedom 2040 Fund | .746% | .643% |
| Fidelity Advisor Freedom 2045 Fund | .746% | .643% |
| Fidelity Advisor Freedom 2050 Fund | .746% | .643% |
| Fidelity Advisor Freedom 2055 Fund | .746% | .643% |
| Fidelity Advisor Freedom 2060 Fund | .746% | .643% |
| Fidelity Advisor Freedom 2065 Fund | .746% | .643% |
Under the expense contract, the investment adviser pays class-level expenses for Class Z6 of each Fund as necessary so that Class Z6 total expenses do not exceed certain amounts of Class Z6 average net assets on an annual basis with certain exceptions, as noted in the following table:
| | Annual % of Class-Level Average Net Assets (Class Z6) |
| Fidelity Advisor Freedom Income Fund | .365% |
| Fidelity Advisor Freedom 2005 Fund | .365% |
| Fidelity Advisor Freedom 2010 Fund | .377% |
| Fidelity Advisor Freedom 2015 Fund | .396% |
| Fidelity Advisor Freedom 2020 Fund | .415% |
| Fidelity Advisor Freedom 2025 Fund | .435% |
| Fidelity Advisor Freedom 2030 Fund | .454% |
| Fidelity Advisor Freedom 2035 Fund | .474% |
| Fidelity Advisor Freedom 2040 Fund | .493% |
| Fidelity Advisor Freedom 2045 Fund | .493% |
| Fidelity Advisor Freedom 2050 Fund | .493% |
| Fidelity Advisor Freedom 2055 Fund | .493% |
| Fidelity Advisor Freedom 2060 Fund | .493% |
| Fidelity Advisor Freedom 2065 Fund | .493% |
| | |
Distribution and Service Plan Fees. In accordance with Rule 12b-1 of the 1940 Act, each Fund has adopted separate Distribution and Service Plans for each class of shares. Certain classes pay Fidelity Distributors Company LLC (FDC), an affiliate of the investment adviser, separate Distribution and Service Fees, each of which is based on an annual percentage of each class' average net assets. In addition, FDC may pay financial intermediaries for selling shares of each Fund and providing shareholder support services. For the period, the Distribution and Service Fee rates, total fees and amounts retained by FDC were as follows:
| | Distribution Fee | Service Fee | Total Fees | Retained by FDC |
| Fidelity Advisor Freedom Income Fund | | | | |
Class A | - % | .25% | $ 86,066 | $ 4,307 |
Class M | .25% | .25% | 73,728 | - |
Class C | .75% | .25% | 28,201 | 3,928 |
| | | | $ 187,995 | $ 8,235 |
| Fidelity Advisor Freedom 2005 Fund | | | | |
Class A | - % | .25% | $ 67,570 | $ 1,788 |
Class M | .25% | .25% | 50,646 | - |
Class C | .75% | .25% | 4,405 | 260 |
| | | | $ 122,621 | $ 2,048 |
| Fidelity Advisor Freedom 2010 Fund | | | | |
Class A | - % | .25% | $ 153,295 | $ - |
Class M | .25% | .25% | 136,323 | - |
Class C | .75% | .25% | 16,064 | 1,852 |
| | | | $ 305,682 | $ 1,852 |
| Fidelity Advisor Freedom 2015 Fund | | | | |
Class A | - % | .25% | $ 354,411 | $ 4,197 |
Class M | .25% | .25% | 242,402 | - |
Class C | .75% | .25% | 55,187 | 2,780 |
| | | | $ 652,000 | $ 6,977 |
| Fidelity Advisor Freedom 2020 Fund | | | | |
Class A | - % | .25% | $ 812,442 | $ 18,314 |
Class M | .25% | .25% | 594,576 | 365 |
Class C | .75% | .25% | 157,444 | 11,973 |
| | | | $ 1,564,462 | $ 30,652 |
| Fidelity Advisor Freedom 2025 Fund | | | | |
Class A | - % | .25% | $1,284,795 | $ 43,018 |
Class M | .25% | .25% | 920,574 | 421 |
Class C | .75% | .25% | 204,168 | 21,306 |
| | | | $ 2,409,537 | $ 64,745 |
| Fidelity Advisor Freedom 2030 Fund | | | | |
Class A | - % | .25% | $1,400,381 | $ 44,899 |
Class M | .25% | .25% | 1,069,536 | 1,403 |
Class C | .75% | .25% | 263,052 | 31,164 |
| | | | $ 2,732,969 | $ 77,466 |
| Fidelity Advisor Freedom 2035 Fund | | | | |
Class A | - % | .25% | $1,192,526 | $ 24,615 |
Class M | .25% | .25% | 917,222 | 1,096 |
Class C | .75% | .25% | 200,491 | 28,175 |
| | | | $ 2,310,239 | $ 53,886 |
| Fidelity Advisor Freedom 2040 Fund | | | | |
Class A | - % | .25% | $1,068,733 | $ 22,039 |
Class M | .25% | .25% | 858,652 | 1,811 |
Class C | .75% | .25% | 186,387 | 18,503 |
| | | | $ 2,113,772 | $ 42,353 |
| Fidelity Advisor Freedom 2045 Fund | | | | |
Class A | - % | .25% | $ 670,880 | $ 17,163 |
Class M | .25% | .25% | 558,614 | 1,131 |
Class C | .75% | .25% | 126,517 | 15,618 |
| | | | $ 1,356,011 | $ 33,912 |
| Fidelity Advisor Freedom 2050 Fund | | | | |
Class A | - % | .25% | $ 564,253 | $ 10,636 |
Class M | .25% | .25% | 451,442 | 1,198 |
Class C | .75% | .25% | 131,641 | 16,916 |
| | | | $ 1,147,336 | $ 28,750 |
| Fidelity Advisor Freedom 2055 Fund | | | | |
Class A | - % | .25% | $ 327,998 | $ 5,944 |
Class M | .25% | .25% | 265,664 | 705 |
Class C | .75% | .25% | 70,833 | 9,814 |
| | | | $ 664,495 | $ 16,463 |
| Fidelity Advisor Freedom 2060 Fund | | | | |
Class A | - % | .25% | $ 140,007 | $ 3,584 |
Class M | .25% | .25% | 113,010 | - |
Class C | .75% | .25% | 38,052 | 9,153 |
| | | | $ 291,069 | $ 12,737 |
| Fidelity Advisor Freedom 2065 Fund | | | | |
Class A | - % | .25% | $ 22,904 | $ 380 |
Class M | .25% | .25% | 11,962 | - |
Class C | .75% | .25% | 3,945 | 2,701 |
| | | | $ 38,811 | $ 3,081 |
Sales Load. FDC may receive a front-end sales charge of up to 5.75% for selling Class A shares and 3.50% for selling Class M shares, some of which is paid to financial intermediaries for selling shares of each Fund. Depending on the holding period, FDC may receive contingent deferred sales charges levied on Class A, Class M and Class C redemptions. The deferred sales charges are 1.00% for Class C shares, 1.00% for certain purchases of Class A shares and .25% for certain purchases of Class M shares.
For the period, sales charge amounts retained by FDC were as follows:
| | Retained by FDC |
| Fidelity Advisor Freedom Income Fund | |
Class A | $ 7,987 |
Class M | 19 |
Class C A | 43 |
| | $ 8,049 |
| Fidelity Advisor Freedom 2005 Fund | |
Class A | $ 1,131 |
Class M | 102 |
Class C A | 109 |
| | $ 1,342 |
| Fidelity Advisor Freedom 2010 Fund | |
Class A | $ 867 |
Class M | 220 |
Class C A | 26 |
| | $ 1,113 |
| Fidelity Advisor Freedom 2015 Fund | |
Class A | $ 5,967 |
Class M | 908 |
Class C A | 69 |
| | $ 6,944 |
| Fidelity Advisor Freedom 2020 Fund | |
Class A | $ 6,771 |
Class M | 2,692 |
Class C A | 727 |
| | $ 10,190 |
| Fidelity Advisor Freedom 2025 Fund | |
Class A | $ 18,642 |
Class M | 5,939 |
Class C A | 1,912 |
| | $ 26,493 |
| Fidelity Advisor Freedom 2030 Fund | |
Class A | $ 33,362 |
Class M | 8,389 |
Class C A | 2,614 |
| | $ 44,365 |
| Fidelity Advisor Freedom 2035 Fund | |
Class A | $ 26,441 |
Class M | 6,853 |
Class C A | 1,446 |
| | $ 34,740 |
| Fidelity Advisor Freedom 2040 Fund | |
Class A | $ 31,948 |
Class M | 8,794 |
Class C A | 1,142 |
| | $ 41,884 |
| Fidelity Advisor Freedom 2045 Fund | |
Class A | $ 23,477 |
Class M | 4,013 |
Class C A | 851 |
| | $ 28,341 |
| Fidelity Advisor Freedom 2050 Fund | |
Class A | $ 28,344 |
Class M | 4,285 |
Class C A | 1,074 |
| | $ 33,703 |
| Fidelity Advisor Freedom 2055 Fund | |
Class A | $ 20,569 |
Class M | 3,183 |
Class C A | 713 |
| | $ 24,465 |
| Fidelity Advisor Freedom 2060 Fund | |
Class A | $ 14,409 |
Class M | 2,006 |
Class C A | 815 |
| | $ 17,230 |
| Fidelity Advisor Freedom 2065 Fund | |
Class A | $ 7,387 |
Class M | 743 |
Class C A | 127 |
| | $ 8,257 |
A When Class C shares are initially sold, FDC pays commissions from its own resources to financial intermediaries through which the sales are made.
Interfund Trades. Funds may purchase from or sell securities to other Fidelity Funds under procedures adopted by the Board. The procedures have been designed to ensure these interfund trades are executed in accordance with Rule 17a-7 of the 1940 Act. Any interfund trades are included within the respective purchases and sales amounts shown in the Purchases and Sales of Investments note. During the period, there were no interfund trades.
Reallocation of Underlying Fund Investments.
During the period, the investment adviser reallocated investments of the Funds. This involved taxable redemptions of the Funds' interest in Fidelity Series Inflation-Protected Bond Index Fund, ("Underlying Fund") for investments and cash and non-taxable exchanges of those investments and cash for shares of Fidelity Series 0-5 Year Inflation-Protected Bond Index Fund and Fidelity Series 5+ Year Inflation-Protected Bond Index Fund which are affiliated investment companies managed by FMR. Net realized gain (loss) on the redemptions of the Underlying Fund in connection with the reallocation is included in the accompanying Statements of Operations as "Net realized gain (loss) on Affiliated issuers."
Details of these transactions with the net related gain (loss) for the Funds are presented in the accompanying table:
| | Value of Investments and Cash reallocated ($) | Net realized Gain (Loss) on redemptions of Underlying Fund ($) |
| Fidelity Advisor Freedom Income Fund | 4,025,237 | 138,468 |
| Fidelity Advisor Freedom 2005 Fund | 2,552,730 | 78,710 |
| Fidelity Advisor Freedom 2010 Fund | 5,004,220 | 157,160 |
| Fidelity Advisor Freedom 2015 Fund | 8,960,932 | 293,596 |
| Fidelity Advisor Freedom 2020 Fund | 18,388,301 | 597,716 |
| Fidelity Advisor Freedom 2025 Fund | 24,406,231 | 853,469 |
| Fidelity Advisor Freedom 2030 Fund | 20,970,164 | 767,615 |
Prior Fiscal Year Reallocation of Underlying Fund Investments. During the prior period, the investment adviser reallocated investments of the Funds. This involved taxable redemptions of the Funds' interest in Fidelity Series Inflation-Protected Bond Index Fund, ("Underlying Fund") for investments and cash and non-taxable exchanges of those investments and cash for shares of Fidelity Series 0-5 Year Inflation-Protected Bond Index Fund and Fidelity Series 5+ Year Inflation-Protected Bond Index Fund which are affiliated investment companies managed by FMR. Net realized gain (loss) on the redemptions of the Underlying Fund in connection with the reallocation is included in the accompanying Statements of Net Assets.
Details of these transactions with the net related gain (loss) for the Funds are presented in the accompanying table:
| | Value of Investments and Cash reallocated ($) | Net realized Gain (Loss) on redemptions of Underlying Fund ($) |
| Fidelity Advisor Freedom Income Fund | 18,957,388 | 1,694,537 |
| Fidelity Advisor Freedom 2005 Fund | 11,474,844 | 1,085,981 |
| Fidelity Advisor Freedom 2010 Fund | 23,030,177 | 2,201,485 |
| Fidelity Advisor Freedom 2015 Fund | 43,467,087 | 4,111,441 |
| Fidelity Advisor Freedom 2020 Fund | 91,893,601 | 8,042,241 |
| Fidelity Advisor Freedom 2025 Fund | 124,166,517 | 9,056,074 |
| Fidelity Advisor Freedom 2030 Fund | 109,994,429 | 6,403,309 |
| Fidelity Advisor Freedom 2035 Fund | 27,351,772 | 1,779,843 |
| Fidelity Advisor Freedom 2040 Fund | 30,309,863 | 2,126,636 |
| Fidelity Advisor Freedom 2045 Fund | 21,195,409 | 1,418,194 |
| Fidelity Advisor Freedom 2050 Fund | 17,928,790 | 1,128,509 |
| Fidelity Advisor Freedom 2055 Fund | 10,996,868 | 656,557 |
| Fidelity Advisor Freedom 2060 Fund | 4,427,881 | 225,709 |
| Fidelity Advisor Freedom 2065 Fund | 458,298 | 12 ,635 |
7. Expense Reductions.
Through arrangements with each applicable Fund's custodian and each class' transfer agent, credits realized as a result of certain uninvested cash balances were used to reduce each applicable Fund's or class' expenses. All of the applicable expense reductions are noted in the table below.
| | Custodian credits | Transfer Agent credits |
Fidelity Advisor Freedom Income Fund | $ 13 | $ |
| Class I | | 31 |
| Class Z | | 4 |
| Class Z6 | | 7 |
Fidelity Advisor Freedom 2005 Fund . | 23 | |
| Class A | | 2 |
| Class I | | 24 |
| Class Z | | 7 |
| Class Z6 | | 5 |
Fidelity Advisor Freedom 2010 Fund . | 10 | |
| Class I | | 9 |
| Class Z | | 4 |
| Class Z6 | | 7 |
Fidelity Advisor Freedom 2015 Fund . | 11 | |
| Class Z | | 6 |
| Class Z6 | | 4 |
Fidelity Advisor Freedom 2020 Fund . | 6 | |
| Class Z | | 6 |
| Class Z6 | | 5 |
Fidelity Advisor Freedom 2025 Fund | 4 | |
| Class Z | | 6 |
| Class Z6 | | 5 |
Fidelity Advisor Freedom 2030 Fund | 4 | |
| Class Z | | 5 |
| Class Z6 | | 5 |
Fidelity Advisor Freedom 2035 Fund | 4 | |
| Class Z | | 5 |
| Class Z6 | | 7 |
Fidelity Advisor Freedom 2040 Fund | 5 | |
| Class Z | | 5 |
| Class Z6 | | 6 |
Fidelity Advisor Freedom 2045 Fund | 6 | |
| Class Z | | 5 |
| Class Z6 | | 10 |
Fidelity Advisor Freedom 2050 Fund . | 7 | |
| Class Z | | 5 |
| Class Z6 | | 10 |
Fidelity Advisor Freedom 2055 Fund | 9 | |
| Class I | | 3 |
| Class Z | | 5 |
| Class Z6 | | 12 |
Fidelity Advisor Freedom 2060 Fund | 14 | |
| Class I | | 43 |
| Class Z | | 6 |
| Class Z6 | | 13 |
Fidelity Advisor Freedom 2065 Fund | - | |
| Class I | | 48 |
| Class Z | | 7 |
| Class Z6 | | 18 |
| | | |
| | | |
| | | |
8. Distributions to Shareholders.
Distributions to shareholders of each class were as follows:
| | Six months ended September 30, 2022 | Year ended March 31, 2022 |
| Fidelity Advisor Freedom Income Fund | | |
| Distributions to shareholders | | |
| Class A | $1,888,538 | $3,806,285 |
| Class M | 775,288 | 1,680,370 |
| Class C | 138,882 | 354,845 |
| Class I | 2,067,406 | 4,626,656 |
| Class Z | 193,585 | 432,446 |
| Class Z6 | 396,310 | 1,206,054 |
Total | $5,460,009 | $12,106,656 |
| Fidelity Advisor Freedom 2005 Fund | | |
| Distributions to shareholders | | |
| Class A | $1,636,831 | $4,893,849 |
| Class M | 559,205 | 1,453,459 |
| Class C | 24,749 | 74,934 |
| Class I | 1,186,800 | 3,644,777 |
| Class Z | 173,652 | 455,321 |
| Class Z6 | 152,731 | 422,095 |
Total | $3,733,968 | $10,944,435 |
| Fidelity Advisor Freedom 2010 Fund | | |
| Distributions to shareholders | | |
| Class A | $4,605,208 | $12,942,091 |
| Class M | 2,021,494 | 5,540,074 |
| Class C | 116,851 | 425,333 |
| Class I | 3,528,487 | 9,711,835 |
| Class Z | 312,987 | 685,779 |
| Class Z6 | 704,195 | 1,458,131 |
Total | $11,289,222 | $30,763,243 |
| Fidelity Advisor Freedom 2015 Fund | | |
| Distributions to shareholders | | |
| Class A | $13,241,737 | $35,089,484 |
| Class M | 4,503,829 | 12,061,077 |
| Class C | 521,312 | 1,554,843 |
| Class I | 9,294,316 | 24,540,604 |
| Class Z | 1,119,126 | 2,399,529 |
| Class Z6 | 1,422,913 | 3,159,961 |
Total | $30,103,233 | $78,805,498 |
| Fidelity Advisor Freedom 2020 Fund | | |
| Distributions to shareholders | | |
| Class A | $35,721,681 | $86,282,220 |
| Class M | 13,017,858 | 29,939,249 |
| Class C | 1,794,520 | 4,479,288 |
| Class I | 28,912,866 | 73,486,234 |
| Class Z | 3,212,984 | 5,184,261 |
| Class Z6 | 5,600,106 | 10,754,253 |
Total | $88,260,015 | $210,125,505 |
| Fidelity Advisor Freedom 2025 Fund | | |
| Distributions to shareholders | | |
| Class A | $58,267,197 | $112,906,269 |
| Class M | 20,449,089 | 38,051,486 |
| Class C | 2,343,908 | 4,740,698 |
| Class I | 50,815,357 | 104,035,173 |
| Class Z | 5,417,909 | 7,072,309 |
| Class Z6 | 10,108,074 | 14,842,267 |
Total | $147,401,534 | $281,648,202 |
| Fidelity Advisor Freedom 2030 Fund | | |
| Distributions to shareholders | | |
| Class A | $66,661,691 | $121,306,750 |
| Class M | 25,330,795 | 45,921,993 |
| Class C | 3,171,483 | 5,999,786 |
| Class I | 65,543,127 | 125,504,164 |
| Class Z | 5,819,527 | 7,542,987 |
| Class Z6 | 12,477,910 | 18,823,883 |
Total | $179,004,533 | $325,099,563 |
| Fidelity Advisor Freedom 2035 Fund | | |
| Distributions to shareholders | | |
| Class A | $66,541,825 | $105,176,629 |
| Class M | 25,807,848 | 39,581,594 |
| Class C | 2,946,902 | 4,598,978 |
| Class I | 67,775,059 | 111,471,958 |
| Class Z | 6,367,563 | 6,618,867 |
| Class Z6 | 14,142,616 | 17,166,450 |
Total | $183,581,813 | $284,614,476 |
| Fidelity Advisor Freedom 2040 Fund | | |
| Distributions to shareholders | | |
| Class A | $68,897,326 | $97,724,975 |
| Class M | 27,555,085 | 38,870,682 |
| Class C | 3,087,045 | 4,823,072 |
| Class I | 70,022,904 | 106,118,735 |
| Class Z | 6,276,613 | 5,700,590 |
| Class Z6 | 14,677,595 | 16,178,322 |
Total | $190,516,568 | $269,416,376 |
| Fidelity Advisor Freedom 2045 Fund | | |
| Distributions to shareholders | | |
| Class A | $42,513,058 | $60,682,638 |
| Class M | 17,805,167 | 24,631,095 |
| Class C | 2,081,234 | 2,953,949 |
| Class I | 52,170,968 | 77,811,429 |
| Class Z | 5,108,216 | 4,253,210 |
| Class Z6 | 12,219,219 | 12,938,991 |
Total | $131,897,862 | $183,271,312 |
| Fidelity Advisor Freedom 2050 Fund | | |
| Distributions to shareholders | | |
| Class A | $34,983,913 | $47,964,071 |
| Class M | 14,090,911 | 19,027,598 |
| Class C | 2,123,495 | 2,876,945 |
| Class I | 45,331,442 | 67,433,812 |
| Class Z | 3,657,699 | 3,195,028 |
| Class Z6 | 10,544,292 | 10,908,108 |
Total | $110,731,752 | $151,405,562 |
| Fidelity Advisor Freedom 2055 Fund | | |
| Distributions to shareholders | | |
| Class A | $19,783,830 | $26,515,169 |
| Class M | 8,046,542 | 10,661,468 |
| Class C | 1,093,620 | 1,450,264 |
| Class I | 28,615,073 | 43,134,192 |
| Class Z | 2,488,175 | 1,954,846 |
| Class Z6 | 7,459,469 | 6,936,649 |
Total | $67,486,709 | $90,652,588 |
| Fidelity Advisor Freedom 2060 Fund | | |
| Distributions to shareholders | | |
| Class A | $7,805,906 | $9,707,065 |
| Class M | 3,162,395 | 3,681,352 |
| Class C | 544,268 | 624,766 |
| Class I | 11,134,308 | 15,853,518 |
| Class Z | 1,062,801 | 749,134 |
| Class Z6 | 3,030,160 | 2,606,706 |
| Total | 26,739,838 | $33,222,541 |
| Fidelity Advisor Freedom 2065 Fund | | |
| Distributions to shareholders | | |
| Class A | $ 987,278 | $ 910,579 |
| Class M | 246,902 | 168,886 |
| Class C | 41,322 | 34,691 |
| Class I | 1,160,818 | 1,189,352 |
| Class Z | 114,222 | 66,373 |
| Class Z6 | 430,932 | 304,220 |
| Total | $2,981,474 | $2,674,101 |
9. Share Transactions.
Share transactions for each class were as follows and may contain in-kind transactions, automatic conversions between classes or exchanges between affiliated funds:
| | Shares | Shares | Dollars | Dollars |
| | Six months ended September 30, 2022 | Year ended March 31, 2022 | Six months ended September 30, 2022 | Year ended March 31, 2022 |
| Fidelity Advisor Freedom Income Fund | | | | |
| Class A | | | | |
| Shares sold | 728,066 | 1,795,386 | $7,350,795 | $20,496,306 |
Reinvestment of distributions | 182,024 | 323,582 | 1,833,405 | 3,695,390 |
| Shares redeemed | (1,215,566) | (1,558,349) | (12,270,200) | (17,817,349) |
| Net increase (decrease). | (305,476) | 560,619 | $(3,086,000) | $6,374,347 |
| Class M | | | | |
| Shares sold | 221,854 | 603,361 | $2,222,433 | $6,895,580 |
Reinvestment of distributions | 76,436 | 146,308 | 768,002 | 1,667,714 |
| Shares redeemed | (386,752) | (930,849) | (3,886,168) | (10,598,517) |
| Net increase (decrease). | (88,462) | (181,180) | $(895,733) | $(2,035,223) |
| Class C | | | | |
| Shares sold | 16,938 | 144,668 | $ 170,551 | $1,652,517 |
Reinvestment of distributions | 12,609 | 28,922 | 125,672 | 328,255 |
| Shares redeemed | (93,505) | (300,660) | (933,245) | (3,412,688) |
| Net increase (decrease). | (63,958) | (127,070) | $(637,022) | $(1,431,916) |
| Class I | | | | |
| Shares sold | 1,254,370 | 2,184,795 | $12,769,730 | $25,184,849 |
Reinvestment of distributions | 203,579 | 394,038 | 2,057,529 | 4,517,010 |
| Shares redeemed | (1,486,706) | (2,868,350) | (15,060,702) | (32,821,613) |
| Net increase (decrease). | (28,757) | (289,517) | $(233,443) | $(3,119,754) |
| Class Z | | | | |
| Shares sold | 224,022 | 303,202 | $2,266,338 | $3,472,111 |
Reinvestment of distributions | 14,906 | 23,601 | 150,424 | 270,452 |
| Shares redeemed | (164,310) | (450,073) | (1,666,060) | (5,163,944) |
| Net increase (decrease). | 74,618 | (123,270) | $ 750,702 | $(1,421,381) |
| Class Z6 | | | | |
| Shares sold | 361,740 | 686,975 | $ 3,633,174 | $7,859,412 |
Reinvestment of distributions | 38,738 | 105,032 | 391,038 | 1,202,861 |
| Shares redeemed | (320,804) | (1,551,252) | (3,213,762) | (17,703,550) |
| Net increase (decrease). | 79,674 | (759,245) | $810,450 | $(8,641,277) |
| Fidelity Advisor Freedom 2005 Fund | | | | |
| Class A | | | | |
| Shares sold | 391,698 | 917,559 | $4,037,382 | $10,689,695 |
Reinvestment of distributions | 153,535 | 402,523 | 1,572,200 | 4,706,048 |
| Shares redeemed | (1,566,483) | (1,885,203) | (16,179,333) | (22,348,244) |
| Net increase (decrease). | (1,021,250) | (565,121) | $(10,569,751) | $(6,952,501) |
| Class M | | | | |
| Shares sold | 166,390 | 303,051 | $1,721,190 | $3,553,028 |
Reinvestment of distributions | 54,623 | 124,303 | 558,247 | 1,450,918 |
| Shares redeemed | (94,759) | (354,805) | (974,202) | (4,217,343) |
| Net increase (decrease). | 126,254 | 72,549 | $1,305,235 | $ 786,603 |
| Class C | | | | |
| Shares sold | 2,284 | 17,982 | $ 23,662 | $ 214,355 |
Reinvestment of distributions | 2,412 | 6,335 | 24,749 | 74,310 |
| Shares redeemed | (21,280) | (42,957) | (220,679) | (511,116) |
| Net increase (decrease). | (16,584) | (18,640) | $(172,268) | $(222,451) |
| Class I | | | | |
| Shares sold | 336,875 | 1,077,635 | $3,503,545 | $12,846,260 |
Reinvestment of distributions | 114,891 | 309,159 | 1,185,679 | 3,641,515 |
| Shares redeemed | (832,172) | (1,816,463) | (8,688,681) | (21,805,618) |
| Net increase (decrease). | (380,406) | (429,669) | $(3,999,457) | $(5,317,843) |
| Class Z | | | | |
| Shares sold | 208,330 | 344,373 | $2,177,398 | $4,116,478 |
Reinvestment of distributions | 16,942 | 36,151 | 173,652 | 421,535 |
| Shares redeemed | (122,268) | (191,088) | (1,255,982) | (2,196,417) |
| Net increase (decrease). | 103,004 | 189,436 | $1,095,068 | $2,341,596 |
| Class Z6 | | | | |
| Shares sold | 230,916 | 382,829 | $2,363,560 | $4,551,187 |
Reinvestment of distributions | 14,800 | 35,915 | 151,992 | 420,149 |
| Shares redeemed | (106,047) | (269,751) | (1,091,150) | (3,152,643) |
| Net increase (decrease). | 139,669 | 148,993 | $1,424,402 | $1,818,693 |
| Fidelity Advisor Freedom 2010 Fund | | | | |
| Class A | | | | |
| Shares sold | 377,594 | 1,220,705 | $3,955,515 | $14,988,785 |
Reinvestment of distributions | 433,013 | 1,046,478 | 4,503,338 | 12,728,244 |
| Shares redeemed | (1,637,644) | (3,409,250) | (17,072,083) | (42,218,089) |
| Net increase (decrease). | (827,037) | (1,142,067) | $(8,613,230) | $(14,501,060) |
| Class M | | | | |
| Shares sold | 188,209 | 583,291 | $1,963,978 | $7,148,676 |
Reinvestment of distributions | 195,279 | 456,780 | 2,019,186 | 5,523,061 |
| Shares redeemed | (548,469) | (1,303,599) | (5,736,823) | (16,022,718) |
| Net increase (decrease). | (164,981) | (263,528) | $(1,753,659) | $(3,350,981) |
| Class C | | | | |
| Shares sold | 6,665 | 132,362 | $ 71,076 | $1,627,993 |
Reinvestment of distributions | 11,321 | 35,194 | 116,490 | 424,926 |
| Shares redeemed | (141,391) | (312,188) | (1,491,874) | (3,838,821) |
| Net increase (decrease). | (123,405) | (144,632) | $(1,304,308) | $(1,785,902) |
| Class I | | | | |
| Shares sold | 645,412 | 1,971,932 | $6,805,794 | $24,458,666 |
Reinvestment of distributions | 336,137 | 775,627 | 3,509,271 | 9,461,412 |
| Shares redeemed | (1,522,773) | (2,862,733) | (16,102,274) | (35,595,288) |
| Net increase (decrease). | (541,224) | (115,174) | $(5,787,209) | $(1,675,210) |
| Class Z | | | | |
| Shares sold | 311,687 | 245,313 | $3,261,216 | $2,995,729 |
Reinvestment of distributions | 30,152 | 56,196 | 312,373 | 680,413 |
| Shares redeemed | (143,284) | (74,233) | (1,482,539) | (899,596) |
| Net increase (decrease). | 198,555 | 227,276 | $2,091,050 | $2,776,546 |
| Class Z6 | | | | |
| Shares sold | 380,125 | 941,904 | $3,932,894 | $11,610,636 |
Reinvestment of distributions | 65,276 | 120,149 | 678,220 | 1,456,509 |
| Shares redeemed | (200,346) | (319,341) | (2,110,771) | (3,947,501) |
| Net increase (decrease). | 245,055 | 742,712 | $2,500,343 | $9,119,644 |
| Fidelity Advisor Freedom 2015 Fund | | | | |
| Class A | | | | |
| Shares sold | 891,540 | 2,601,184 | $9,144,969 | $32,154,482 |
Reinvestment of distributions | 1,290,508 | 2,850,580 | 13,085,739 | 34,696,319 |
| Shares redeemed | (3,000,974) | (8,395,329) | (30,468,961) | (104,109,568) |
| Net increase (decrease). | (818,926) | (2,943,565) | $(8,238,253) | $(37,258,767) |
| Class M | | | | |
| Shares sold | 372,222 | 966,016 | $3,815,888 | $11,918,447 |
Reinvestment of distributions | 444,674 | 991,965 | 4,491,207 | 12,028,176 |
| Shares redeemed | (1,103,807) | (3,146,462) | (11,308,170) | (38,456,317) |
| Net increase (decrease). | (286,911) | (1,188,481) | $(3,001,075) | $(14,509,694) |
| Class C | | | | |
| Shares sold | 27,246 | 92,208 | $ 275,601 | $1,131,540 |
Reinvestment of distributions | 52,014 | 128,707 | 521,179 | 1,554,795 |
| Shares redeemed | (139,520) | (764,572) | (1,421,357) | (9,396,197) |
| Net increase (decrease). | (60,260) | (543,657) | $(624,577) | $(6,709,862) |
| Class I | | | | |
| Shares sold | 1,034,617 | 3,291,469 | $10,639,052 | $41,233,735 |
Reinvestment of distributions | 900,559 | 1,970,148 | 9,221,721 | 24,193,367 |
| Shares redeemed | (3,740,198) | (6,069,268) | (38,358,461) | (76,008,489) |
| Net increase (decrease). | (1,805,022) | (807,651) | $(18,497,688) | $(10,581,387) |
| Class Z | | | | |
| Shares sold | 902,352 | 773,674 | $9,292,683 | $9,535,464 |
Reinvestment of distributions | 109,003 | 189,716 | 1,106,384 | 2,306,888 |
| Shares redeemed | (306,291) | (496,294) | (3,086,731) | (5,964,023) |
| Net increase (decrease). | 705,064 | 467,096 | $7,312,336 | $5,878,329 |
| Class Z6 | | | | |
| Shares sold | 792,097 | 1,269,246 | $8,041,445 | $15,692,340 |
Reinvestment of distributions | 137,613 | 255,952 | 1,402,274 | 3,123,788 |
| Shares redeemed | (684,156) | (768,451) | (6,976,486) | (9,559,229) |
| Net increase (decrease). | 245,554 | 756,747 | $2,467,233 | $9,256,899 |
| Fidelity Advisor Freedom 2020 Fund | | | | |
| Class A | | | | |
| Shares sold | 3,334,703 | 8,001,544 | $37,861,859 | $112,003,580 |
Reinvestment of distributions | 3,132,675 | 6,173,046 | 35,085,963 | 84,848,608 |
| Shares redeemed | (9,476,449) | (18,261,601) | (106,625,197) | (253,962,340) |
| Net increase (decrease). | (3,009,071) | (4,087,011) | $(33,677,375) | $(57,110,152) |
| Class M | | | | |
| Shares sold | 951,967 | 2,093,774 | $10,771,007 | $29,129,358 |
Reinvestment of distributions | 1,160,475 | 2,171,622 | 12,974,106 | 29,821,300 |
| Shares redeemed | (2,425,088) | (5,381,594) | (27,157,076) | (74,725,835) |
| Net increase (decrease). | (312,646) | (1,116,198) | $(3,411,963) | $(15,775,177) |
| Class C | | | | |
| Shares sold | 96,891 | 463,525 | $1,095,152 | $6,425,966 |
Reinvestment of distributions | 158,419 | 320,107 | 1,747,365 | 4,351,670 |
| Shares redeemed | (500,855) | (1,582,555) | (5,502,850) | (21,784,727) |
| Net increase (decrease). | (245,545) | (798,923) | $(2,660,333) | $(11,007,091) |
| Class I | | | | |
| Shares sold | 3,116,919 | 7,526,464 | $35,647,612 | $106,336,725 |
Reinvestment of distributions | 2,536,657 | 5,195,518 | 28,740,321 | 72,078,630 |
| Shares redeemed | (10,624,928) | (17,080,051) | (121,624,809) | (239,924,268) |
| Net increase (decrease). | (4,971,352) | (4,358,069) | $(57,236,876) | $(61,508,913) |
| Class Z | | | | |
| Shares sold | 2,451,480 | 2,041,666 | $27,878,631 | $27,606,558 |
Reinvestment of distributions | 285,265 | 375,167 | 3,200,671 | 5,155,807 |
| Shares redeemed | (895,629) | (1,007,552) | (10,255,749) | (13,906,577) |
| Net increase (decrease). | 1,841,116 | 1,409,281 | $20,823,553 | $18,855,788 |
| Class Z6 | | | | |
| Shares sold | 2,146,090 | 3,780,110 | $23,790,372 | $52,563,161 |
Reinvestment of distributions | 495,287 | 774,842 | 5,576,934 | 10,680,609 |
| Shares redeemed | (1,190,728) | (2,429,057) | (13,521,477) | (34,267,030) |
| Net increase (decrease). | 1,450,649 | 2,125,895 | $15,845,829 | $28,976,740 |
| Fidelity Advisor Freedom 2025 Fund | | | | |
| Class A | | | | |
| Shares sold | 6,708,291 | 14,843,699 | $78,883,243 | $215,764,470 |
Reinvestment of distributions | 4,941,758 | 7,769,145 | 57,522,066 | 111,559,984 |
| Shares redeemed | (13,784,125) | (23,534,135) | (161,131,773) | (341,456,717) |
| Net increase (decrease). | (2,134,076) | (921,291) | $(24,726,464) | $(14,132,263) |
| Class M | | | | |
| Shares sold | 2,278,713 | 4,555,410 | $27,270,850 | $66,179,579 |
Reinvestment of distributions | 1,751,714 | 2,639,497 | 20,424,982 | 37,970,526 |
| Shares redeemed | (3,272,375) | (6,565,927) | (38,299,456) | (94,946,463) |
| Net increase (decrease). | 758,052 | 628,980 | $9,396,376 | $9,203,642 |
| Class C | | | | |
| Shares sold | 246,568 | 507,178 | $2,855,930 | $7,204,340 |
Reinvestment of distributions | 199,983 | 329,374 | 2,271,811 | 4,630,357 |
| Shares redeemed | (534,112) | (1,508,874) | (6,102,858) | (21,383,347) |
| Net increase (decrease). | (87,561) | (672,322) | $(975,117) | $(9,548,650) |
| Class I | | | | |
| Shares sold | 6,260,019 | 15,111,463 | $74,811,942 | $221,898,507 |
Reinvestment of distributions | 4,296,059 | 7,011,786 | 50,650,537 | 101,838,140 |
| Shares redeemed | (14,328,942) | (24,576,851) | (169,998,065) | (358,685,175) |
| Net increase (decrease). | (3,772,864) | (2,453,602) | $(44,535,586) | $(34,948,528) |
| Class Z | | | | |
| Shares sold | 3,787,551 | 3,493,164 | $45,324,016 | $50,262,837 |
Reinvestment of distributions | 464,025 | 489,000 | 5,415,176 | 7,032,045 |
| Shares redeemed | (1,295,072) | (1,157,440) | (15,439,410) | (16,635,267) |
| Net increase (decrease). | 2,956,504 | 2,824,724 | $35,299,782 | $40,659,615 |
| Class Z6 | | | | |
| Shares sold | 3,888,737 | 7,056,042 | $45,868,656 | $101,842,347 |
Reinvestment of distributions | 846,769 | 1,025,564 | 9,932,606 | 14,821,433 |
| Shares redeemed | (1,918,301) | (3,538,893) | (22,666,823) | (52,148,192) |
| Net increase (decrease). | 2,817,205 | 4,542,713 | $33,134,439 | $64,515,588 |
| Fidelity Advisor Freedom 2030 Fund | | | | |
| Class A | | | | |
| Shares sold | 7,276,402 | 13,822,101 | $93,623,521 | $220,104,948 |
Reinvestment of distributions | 5,194,180 | 7,599,964 | 65,810,366 | 119,751,540 |
| Shares redeemed | (10,612,247) | (19,306,197) | (135,150,105) | (307,169,091) |
| Net increase (decrease). | 1,858,335 | 2,115,868 | $24,283,782 | $32,687,397 |
| Class M | | | | |
| Shares sold | 2,180,426 | 4,848,926 | $27,912,781 | $76,673,190 |
Reinvestment of distributions | 2,013,249 | 2,931,924 | 25,286,411 | 45,831,859 |
| Shares redeemed | (3,329,825) | (6,748,400) | (42,332,027) | (106,326,732) |
| Net increase (decrease). | 863,850 | 1,032,450 | $10,867,165 | $16,178,317 |
| Class C | | | | |
| Shares sold | 320,818 | 667,794 | $4,017,171 | $10,424,536 |
Reinvestment of distributions | 256,361 | 390,019 | 3,148,108 | 5,981,415 |
| Shares redeemed | (446,635) | (1,431,321) | (5,577,463) | (22,099,836) |
| Net increase (decrease). | 130,544 | (373,508) | $1,587,816 | $(5,693,885) |
| Class I | | | | |
| Shares sold | 7,578,214 | 16,865,921 | $97,685,953 | $270,400,901 |
Reinvestment of distributions | 5,115,182 | 7,638,759 | 65,320,879 | 121,228,263 |
| Shares redeemed | (14,802,036) | (23,245,186) | (190,173,709) | (371,389,658) |
| Net increase (decrease). | (2,108,640) | 1,259,494 | $(27,166,877) | $20,239,506 |
| Class Z | | | | |
| Shares sold | 3,780,400 | 3,243,909 | $48,730,809 | $50,713,338 |
Reinvestment of distributions | 458,892 | 477,841 | 5,800,398 | 7,515,038 |
| Shares redeemed | (881,797) | (750,032) | (11,754,446) | (11,709,511) |
| Net increase (decrease). | 3,357,495 | 2,971,718 | $42,776,761 | $46,518,865 |
| Class Z6 | | | | |
| Shares sold | 4,456,428 | 7,111,192 | $57,005,865 | $112,484,451 |
Reinvestment of distributions | 975,608 | 1,186,411 | 12,390,222 | 18,733,705 |
| Shares redeemed | (1,646,982) | (3,853,356) | (21,236,695) | (61,820,231) |
| Net increase (decrease). | 3,785,054 | 4,444,247 | $48,159,392 | $69,397,925 |
| Fidelity Advisor Freedom 2035 Fund | | | | |
| Class A | | | | |
| Shares sold | 6,428,704 | 12,639,290 | $82,228,847 | $203,032,281 |
Reinvestment of distributions | 5,266,857 | 6,550,338 | 65,941,072 | 104,192,772 |
| Shares redeemed | (8,932,992) | (17,587,270) | (113,166,896) | (281,137,226) |
| Net increase (decrease). | 2,762,569 | 1,602,358 | $35,003,023 | $26,087,827 |
| Class M | | | | |
| Shares sold | 2,184,635 | 4,595,080 | $27,415,002 | $72,829,152 |
Reinvestment of distributions | 2,095,228 | 2,525,083 | 25,792,259 | 39,570,181 |
| Shares redeemed | (2,553,216) | (6,159,903) | (31,920,117) | (97,066,919) |
| Net increase (decrease). | 1,726,647 | 960,260 | $21,287,144 | $15,332,414 |
| Class C | | | | |
| Shares sold | 219,258 | 571,508 | $2,662,337 | $8,781,884 |
Reinvestment of distributions | 245,138 | 299,156 | 2,924,501 | 4,564,782 |
| Shares redeemed | (403,736) | (1,100,176) | (4,933,321) | (16,947,905) |
| Net increase (decrease). | 60,660 | (229,512) | $ 653,517 | $(3,601,239) |
| Class I | | | | |
| Shares sold | 7,144,639 | 15,108,021 | $92,022,320 | $244,137,633 |
Reinvestment of distributions | 5,332,777 | 6,659,932 | 67,512,952 | 107,042,090 |
| Shares redeemed | (12,617,558) | (20,486,686) | (161,532,332) | (330,105,610) |
| Net increase (decrease). | (140,142) | 1,281,267 | $(1,997,060) | $21,074,113 |
| Class Z | | | | |
| Shares sold | 3,216,931 | 3,430,032 | $41,267,660 | $53,716,746 |
Reinvestment of distributions | 508,168 | 415,251 | 6,367,341 | 6,614,577 |
| Shares redeemed | (1,023,362) | (644,670) | (13,489,973) | (10,016,750) |
| Net increase (decrease). | 2,701,737 | 3,200,613 | $34,145,028 | $50,314,573 |
| Class Z6 | | | | |
| Shares sold | 4,187,869 | 7,378,883 | $53,088,266 | $117,971,579 |
Reinvestment of distributions | 1,110,241 | 1,064,523 | 14,022,346 | 17,079,175 |
| Shares redeemed | (1,484,388) | (2,982,246) | (18,900,532) | (48,333,157) |
| Net increase (decrease). | 3,813,722 | 5,461,160 | $48,210,080 | $86,717,597 |
| Fidelity Advisor Freedom 2040 Fund | | | | |
| Class A | | | | |
| Shares sold | 5,698,361 | 9,666,804 | $78,268,415 | $170,336,699 |
Reinvestment of distributions | 5,052,495 | 5,530,248 | 68,057,105 | 96,572,949 |
| Shares redeemed | (7,188,072) | (13,417,705) | (97,779,366) | (236,121,655) |
| Net increase (decrease). | 3,562,784 | 1,779,347 | $48,546,154 | $30,787,993 |
| Class M | | | | |
| Shares sold | 1,871,605 | 3,504,478 | $25,588,073 | $61,132,334 |
Reinvestment of distributions | 2,062,548 | 2,242,880 | 27,514,396 | 38,815,134 |
| Shares redeemed | (2,332,831) | (5,055,734) | (31,827,650) | (88,129,523) |
| Net increase (decrease). | 1,601,322 | 691,624 | $21,274,819 | $11,817,945 |
| Class C | | | | |
| Shares sold | 194,715 | 342,532 | $2,572,756 | $5,785,079 |
Reinvestment of distributions | 238,723 | 286,356 | 3,077,153 | 4,806,804 |
| Shares redeemed | (300,375) | (1,280,882) | (3,946,468) | (21,705,622) |
| Net increase (decrease). | 133,063 | (651,994) | $1,703,441 | $(11,113,739) |
| Class I | | | | |
| Shares sold | 6,645,189 | 12,901,795 | $92,446,200 | $229,290,722 |
Reinvestment of distributions | 5,130,598 | 5,806,370 | 69,827,442 | 102,366,066 |
| Shares redeemed | (11,419,012) | (17,314,005) | (157,372,436) | (304,667,629) |
| Net increase (decrease). | 356,775 | 1,394,160 | $4,901,206 | $26,989,159 |
| Class Z | | | | |
| Shares sold | 2,559,314 | 2,517,597 | $35,761,642 | $43,143,811 |
Reinvestment of distributions | 466,206 | 325,175 | 6,275,134 | 5,683,696 |
| Shares redeemed | (758,184) | (425,531) | (10,816,298) | (7,272,198) |
| Net increase (decrease). | 2,267,336 | 2,417,241 | $31,220,478 | $41,555,309 |
| Class Z6 | | | | |
| Shares sold | 3,754,463 | 5,901,761 | $51,338,440 | $102,603,778 |
Reinvestment of distributions | 1,078,312 | 918,701 | 14,632,687 | 16,155,135 |
| Shares redeemed | (1,126,060) | (2,607,021) | (15,614,582) | (46,192,189) |
| Net increase (decrease). | 3,706,715 | 4,213,441 | $50,356,545 | $72,566,724 |
| Fidelity Advisor Freedom 2045 Fund | | | | |
| Class A | | | | |
| Shares sold | 5,615,574 | 9,649,837 | $60,748,978 | $133,898,979 |
Reinvestment of distributions | 3,983,087 | 4,387,075 | 42,300,385 | 60,377,531 |
| Shares redeemed | (6,770,333) | (13,879,621) | (73,210,022) | (191,796,789) |
Net increase (decrease) | 2,828,328 | 157,291 | $29,839,341 | $2,479,721 |
| Class M | | | | |
| Shares sold | 1,838,248 | 3,881,450 | $19,691,793 | $53,085,927 |
Reinvestment of distributions | 1,700,124 | 1,812,474 | 17,800,301 | 24,625,600 |
| Shares redeemed | (2,129,397) | (4,953,325) | (22,636,429) | (67,551,694) |
Net increase (decrease) | 1,408,975 | 740,599 | $14,855,665 | $10,159,833 |
| Class C | | | | |
| Shares sold | 166,432 | 338,793 | $1,735,047 | $4,539,630 |
Reinvestment of distributions | 202,781 | 221,870 | 2,070,397 | 2,947,984 |
| Shares redeemed | (288,283) | (748,315) | (2,980,828) | (10,031,652) |
Net increase (decrease) | 80,930 | (187,652) | $ 824,616 | $(2,544,038) |
| Class I | | | | |
| Shares sold | 7,348,645 | 14,731,521 | $80,509,109 | $205,890,352 |
Reinvestment of distributions | 4,838,256 | 5,338,558 | 51,962,865 | 74,182,170 |
| Shares redeemed | (10,873,211) | (18,238,078) | (118,234,483) | (251,890,540) |
Net increase (decrease) | 1,313,690 | 1,832,001 | $14,237,491 | $28,181,982 |
| Class Z | | | | |
| Shares sold | 2,456,685 | 2,892,354 | $27,154,546 | $38,467,997 |
Reinvestment of distributions | 483,733 | 308,832 | 5,108,216 | 4,253,210 |
| Shares redeemed | (1,102,800) | (680,322) | (12,506,270) | (9,060,906) |
Net increase (decrease) | 1,837,618 | 2,520,864 | $19,756,492 | $33,660,301 |
| Class Z6 | | | | |
| Shares sold | 4,707,239 | 7,025,548 | $50,875,522 | $96,049,813 |
Reinvestment of distributions | 1,134,461 | 930,148 | 12,172,765 | 12,905,402 |
| Shares redeemed | (1,265,773) | (2,962,249) | (13,762,824) | (41,556,813) |
Net increase (decrease) | 4,575,927 | 4,993,447 | $49,285,463 | $67,398,402 |
| Fidelity Advisor Freedom 2050 Fund | | | | |
| Class A | | | | |
| Shares sold | 5,634,478 | 9,176,782 | $61,015,161 | $127,260,936 |
Reinvestment of distributions | 3,264,846 | 3,461,784 | 34,770,613 | 47,682,530 |
| Shares redeemed | (5,489,856) | (11,390,502) | (59,047,039) | (158,037,343) |
Net increase (decrease) | 3,409,468 | 1,248,064 | $36,738,735 | $16,906,123 |
| Class M | | | | |
| Shares sold | 1,810,699 | 3,255,783 | $19,505,143 | $44,677,606 |
Reinvestment of distributions | 1,336,613 | 1,394,626 | 14,087,905 | 19,025,895 |
| Shares redeemed | (1,899,365) | (3,939,776) | (20,229,307) | (54,171,513) |
Net increase (decrease) | 1,247,947 | 710,633 | $13,363,741 | $9,531,988 |
| Class C | | | | |
| Shares sold | 186,540 | 397,166 | $1,961,934 | $5,355,491 |
Reinvestment of distributions | 205,258 | 213,969 | 2,112,110 | 2,861,315 |
| Shares redeemed | (302,038) | (693,023) | (3,139,275) | (9,354,142) |
Net increase (decrease) | 89,760 | (81,888) | $ 934,769 | $(1,137,336) |
| Class I | | | | |
| Shares sold | 6,997,087 | 13,837,779 | $77,033,429 | $193,954,871 |
Reinvestment of distributions | 4,201,378 | 4,642,288 | 45,206,826 | 64,556,686 |
| Shares redeemed | (9,861,908) | (16,287,591) | (107,547,574) | (225,297,053) |
Net increase (decrease) | 1,336,557 | 2,192,476 | $14,692,681 | $33,214,504 |
| Class Z | | | | |
| Shares sold | 2,214,445 | 2,176,883 | $24,452,116 | $29,147,980 |
Reinvestment of distributions | 343,109 | 231,494 | 3,657,546 | 3,194,274 |
| Shares redeemed | (812,239) | (499,554) | (9,265,462) | (6,776,658) |
Net increase (decrease) | 1,745,315 | 1,908,823 | $18,844,200 | $25,565,596 |
| Class Z6 | | | | |
| Shares sold | 4,506,983 | 5,666,290 | $48,699,104 | $77,356,949 |
Reinvestment of distributions | 978,707 | 784,936 | 10,511,315 | 10,898,640 |
| Shares redeemed | (1,137,409) | (2,354,156) | (12,416,861) | (32,888,925) |
Net increase (decrease) | 4,348,281 | 4,097,070 | $46,793,558 | $55,366,664 |
| Fidelity Advisor Freedom 2055 Fund | | | | |
| Class A | | | | |
| Shares sold | 3,534,348 | 6,047,361 | $43,175,675 | $94,061,450 |
Reinvestment of distributions | 1,634,382 | 1,699,532 | 19,596,239 | 26,282,591 |
| Shares redeemed | (2,984,625) | (7,410,663) | (35,942,595) | (116,078,823) |
Net increase (decrease) | 2,184,105 | 336,230 | $26,829,319 | $4,265,218 |
| Class M | | | | |
| Shares sold | 1,247,885 | 2,048,088 | $15,139,815 | $31,591,967 |
Reinvestment of distributions | 677,596 | 695,148 | 8,043,061 | 10,655,831 |
| Shares redeemed | (1,004,231) | (2,164,034) | (12,089,832) | (33,226,040) |
Net increase (decrease) | 921,250 | 579,202 | $11,093,044 | $9,021,758 |
| Class C | | | | |
| Shares sold | 105,006 | 184,863 | $1,244,668 | $2,822,609 |
Reinvestment of distributions | 93,339 | 95,560 | 1,092,070 | 1,447,609 |
| Shares redeemed | (100,711) | (257,433) | (1,203,942) | (3,936,635) |
Net increase (decrease) | 97,634 | 22,990 | $1,132,796 | $ 333,583 |
| Class I | | | | |
| Shares sold | 5,159,657 | 9,748,871 | $63,414,618 | $152,891,293 |
Reinvestment of distributions | 2,361,450 | 2,604,091 | 28,502,704 | 40,542,999 |
| Shares redeemed | (6,198,074) | (10,867,107) | (76,025,150) | (167,636,529) |
Net increase (decrease) | 1,323,033 | 1,485,855 | $15,892,172 | $25,797,763 |
| Class Z | | | | |
| Shares sold | 1,465,894 | 1,329,081 | $18,296,687 | $19,938,182 |
Reinvestment of distributions | 208,344 | 126,627 | 2,487,629 | 1,954,101 |
| Shares redeemed | (436,018) | (344,080) | (5,515,878) | (5,261,472) |
Net increase (decrease) | 1,238,220 | 1,111,628 | $15,268,438 | $16,630,811 |
| Class Z6 | | | | |
| Shares sold | 3,035,403 | 4,125,096 | $36,901,638 | $62,937,893 |
Reinvestment of distributions | 617,830 | 445,662 | 7,444,847 | 6,930,540 |
| Shares redeemed | (693,496) | (1,386,778) | (8,421,893) | (21,734,644) |
Net increase (decrease) | 2,959,737 | 3,183,980 | $35,924,592 | $48,133,789 |
| Fidelity Advisor Freedom 2060 Fund | | | | |
| Class A | | | | |
| Shares sold | 2,383,070 | 3,681,057 | $26,695,892 | $52,208,260 |
Reinvestment of distributions | 705,265 | 681,702 | 7,764,860 | 9,625,475 |
| Shares redeemed | (1,631,426) | (3,466,895) | (18,008,887) | (49,556,224) |
Net increase (decrease) | 1,456,909 | 895,864 | $16,451,865 | $12,277,511 |
| Class M | | | | |
| Shares sold | 836,012 | 1,402,238 | $9,341,593 | $19,821,893 |
Reinvestment of distributions | 288,540 | 261,610 | 3,162,395 | 3,681,352 |
| Shares redeemed | (469,024) | (976,114) | (5,242,145) | (13,806,821) |
Net increase (decrease) | 655,528 | 687,734 | $7,261,843 | $9,696,424 |
| Class C | | | | |
| Shares sold | 100,728 | 174,681 | $1,131,630 | $2,453,258 |
Reinvestment of distributions | 49,711 | 44,344 | 540,860 | 621,155 |
| Shares redeemed | (53,773) | (94,288) | (601,315) | (1,303,013) |
Net increase (decrease) | 96,666 | 124,737 | $1,071,175 | $1,771,400 |
| Class I | | | | |
| Shares sold | 3,451,276 | 6,265,081 | $38,935,389 | $89,508,673 |
Reinvestment of distributions | 1,004,099 | 1,051,695 | 11,125,413 | 14,928,853 |
| Shares redeemed | (3,183,985) | (5,396,444) | (35,869,517) | (75,963,700) |
Net increase (decrease) | 1,271,390 | 1,920,332 | $14,191,285 | $28,473,826 |
| Class Z | | | | |
| Shares sold | 907,687 | 761,337 | $10,306,297 | $10,453,007 |
Reinvestment of distributions | 96,696 | 53,093 | 1,062,685 | 748,976 |
| Shares redeemed | (189,053) | (147,840) | (2,159,253) | (2,048,091) |
Net increase (decrease) | 815,330 | 666,590 | $9,209,729 | $9,153,892 |
| Class Z6 | | | | |
| Shares sold | 1,879,591 | 2,215,217 | $20,959,925 | $30,863,126 |
Reinvestment of distributions | 273,192 | 183,640 | 3,024,231 | 2,605,912 |
| Shares redeemed | (385,104) | (556,195) | (4,326,247) | (7,915,287) |
Net increase (decrease) | 1,767,679 | 1,842,662 | $19,657,909 | $25,553,751 |
| Fidelity Advisor Freedom 2065 Fund | | | | |
| Class A | | | | |
| Shares sold | 729,462 | 1,118,899 | $7,677,333 | $14,612,128 |
Reinvestment of distributions | 95,286 | 69,461 | 987,167 | 910,391 |
| Shares redeemed | (307,988) | (466,915) | (3,235,742) | (6,116,986) |
Net increase (decrease) | 516,760 | 721,445 | $5,428,758 | $9,405,533 |
| Class M | | | | |
| Shares sold | 215,251 | 450,420 | $2,252,933 | $5,901,108 |
Reinvestment of distributions | 23,878 | 12,880 | 246,902 | 168,886 |
| Shares redeemed | (63,948) | (201,021) | (663,268) | (2,580,427) |
Net increase (decrease) | 175,181 | 262,279 | $1,836,567 | $3,489,567 |
| Class C | | | | |
| Shares sold | 22,866 | 35,879 | $ 237,658 | $ 465,084 |
Reinvestment of distributions | 4,008 | 2,656 | 41,322 | 34,691 |
| Shares redeemed | (5,163) | (9,375) | (52,366) | (120,185) |
Net increase (decrease) | 21,711 | 29,160 | $ 226,614 | $ 379,590 |
| Class I | | | | |
| Shares sold | 1,189,398 | 1,387,882 | $12,512,787 | $18,214,568 |
Reinvestment of distributions | 111,617 | 89,922 | 1,160,818 | 1,182,012 |
| Shares redeemed | (538,794) | (654,012) | (5,650,942) | (8,493,003) |
Net increase (decrease) | 762,221 | 823,792 | $8,022,663 | $10,903,577 |
| Class Z | | | | |
| Shares sold | 206,519 | 134,242 | $2,187,949 | $1,725,588 |
Reinvestment of distributions | 10,952 | 5,032 | 114,119 | 66,373 |
| Shares redeemed | (34,929) | (27,985) | (381,316) | (363,025) |
Net increase (decrease) | 182,542 | 111,289 | $1,920,752 | $1,428,936 |
| Class Z6 | | | | |
| Shares sold | 480,520 | 543,282 | $5,073,224 | $7,084,877 |
Reinvestment of distributions | 41,308 | 23,040 | 430,847 | 304,205 |
| Shares redeemed | (114,415) | (157,667) | (1,202,635) | (2,075,129) |
Net increase (decrease) | 407,413 | 408,655 | $4,301,436 | $5,313,953 |
10. Other.
A fund's organizational documents provide former and current trustees and officers with a limited indemnification against liabilities arising in connection with the performance of their duties to the fund. In the normal course of business, a fund may also enter into contracts that provide general indemnifications. A fund's maximum exposure under these arrangements is unknown as this would be dependent on future claims that may be made against a fund. The risk of material loss from such claims is considered remote.
Funds do not invest in underlying mutual funds for the purpose of exercising management or control; however, investments by funds within their principal investment strategies may represent a significant portion of the underlying mutual fund's net assets. At the end of the period, certain Funds were the owners of record of 10% or more of the total outstanding shares of the following underlying mutual funds as shown below.
| Fund | Fidelity Advisor Freedom 2030 Fund | Fidelity Advisor Freedom 2035 Fund | Fidelity Advisor Freedom 2040 Fund | Fidelity Advisor Freedom 2045 Fund |
| Fidelity Advisor Series Equity Growth Fund | 13% | 14% | 15% | 11% |
| Fidelity Advisor Series Growth Opportunities Fund | 13% | 14% | 15% | 11% |
| Fidelity Advisor Series Small Cap Fund | 13% | 14% | 15% | 11% |
The Funds, in aggregate, were the owners of record of more than 20% of the total outstanding shares of the following underlying mutual funds.
| Fund | % of shares held |
| Fidelity Advisor Series Equity Growth Fund | 90% |
| Fidelity Advisor Series Growth Opportunities Fund | 90% |
| Fidelity Advisor Series Small Cap Fund | 90% |
| |
11. Risk and Uncertainties.
Many factors affect a fund's performance. Developments that disrupt global economies and financial markets, such as pandemics, epidemics, outbreaks of infectious diseases, war, terrorism, and environmental disasters, may significantly affect a fund's investment performance. The effects of these developments to a fund will be impacted by the types of securities in which a fund invests, the financial condition, industry, economic sector, and geographic location of an issuer, and a fund's level of investment in the securities of that issuer.
As a shareholder, you incur two types of costs: (1) transaction costs, which may include sales charges (loads) on purchase payments or redemption proceeds, as applicable and (2) ongoing costs, which generally include management fees, distribution and/or service (12b-1) fees and other Fund expenses. This Example is intended to help you understand your ongoing costs (in dollars) of investing in a fund and to compare these costs with the ongoing costs of investing in other mutual funds.
| The Example is based on an investment of $1,000 invested at the beginning of the period and held for the entire period (April 1, 2022 to September 30, 2022). |
Actual Expenses
The first line of the accompanying table provides information about actual account values and actual expenses. You may use the information in this line, together with the amount you invested, to estimate the expenses that you paid over the period. Simply divide your account value by $1,000.00 (for example, an $8,600 account value divided by $1,000.00 = 8.6), then multiply the result by the number in the first line for a class/Fund under the heading entitled "Expenses Paid During Period" to estimate the expenses you paid on your account during this period. If any fund is a shareholder of any underlying mutual funds or exchange-traded funds (ETFs) (the Underlying Funds), such fund indirectly bears its proportional share of the expenses of the Underlying Funds in addition to the direct expenses incurred presented in the table. These fees and expenses are not included in the annualized expense ratio used to calculate the expense estimate in the table below.
Hypothetical Example for Comparison Purposes
The second line of the accompanying table provides information about hypothetical account values and hypothetical expenses based on the actual expense ratio and an assumed rate of return of 5% per year before expenses, which is not the actual return. The hypothetical account values and expenses may not be used to estimate the actual ending account balance or expenses you paid for the period. You may use this information to compare the ongoing costs of investing in the Fund and other funds. To do so, compare this 5% hypothetical example with the 5% hypothetical examples that appear in the shareholder reports of the other funds. If any fund is a shareholder of any Underlying Funds, such fund indirectly bears its proportional share of the expenses of the Underlying Funds in addition to the direct expenses as presented in the table. These fees and expenses are not included in the annualized expense ratio used to calculate the expense estimate in the table below.
Please note that the expenses shown in the table are meant to highlight your ongoing costs only and do not reflect any transaction costs. Therefore, the second line of the table is useful in comparing ongoing costs only, and will not help you determine the relative total costs of owning different funds. In addition, if these transactional costs were included, your costs would have been higher.
| | | | | Annualized Expense Ratio- A | | Beginning Account Value April 1, 2022 | | Ending Account Value September 30, 2022 | | Expenses Paid During Period- C April 1, 2022 to September 30, 2022 |
| Fidelity Advisor Freedom® Income Fund | | | | | | | | | | |
| Class A | | | | .72% | | | | | | |
| Actual | | | | | | $ 1,000 | | $ 893.60 | | $ 3.42 |
Hypothetical- B | | | | | | $ 1,000 | | $ 1,021.46 | | $ 3.65 |
| Class M | | | | .97% | | | | | | |
| Actual | | | | | | $ 1,000 | | $ 893.20 | | $ 4.60 |
Hypothetical- B | | | | | | $ 1,000 | | $ 1,020.21 | | $ 4.91 |
| Class C | | | | 1.47% | | | | | | |
| Actual | | | | | | $ 1,000 | | $ 890.90 | | $ 6.97 |
Hypothetical- B | | | | | | $ 1,000 | | $ 1,017.70 | | $ 7.44 |
| Class I | | | | .47% | | | | | | |
| Actual | | | | | | $ 1,000 | | $ 895.20 | | $ 2.23 |
Hypothetical- B | | | | | | $ 1,000 | | $ 1,022.71 | | $ 2.38 |
| Class Z | | | | .41% | | | | | | |
| Actual | | | | | | $ 1,000 | | $ 895.60 | | $ 1.95 |
Hypothetical- B | | | | | | $ 1,000 | | $ 1,023.01 | | $ 2.08 |
| Class Z6 | | | | .37% | | | | | | |
| Actual | | | | | | $ 1,000 | | $ 895.60 | | $ 1.76 |
Hypothetical- B | | | | | | $ 1,000 | | $ 1,023.21 | | $ 1.88 |
| Fidelity Advisor Freedom® 2005 Fund | | | | | | | | | | |
| Class A | | | | .72% | | | | | | |
| Actual | | | | | | $ 1,000 | | $ 890.40 | | $ 3.41 |
Hypothetical- B | | | | | | $ 1,000 | | $ 1,021.46 | | $ 3.65 |
| Class M | | | | .97% | | | | | | |
| Actual | | | | | | $ 1,000 | | $ 888.90 | | $ 4.59 |
Hypothetical- B | | | | | | $ 1,000 | | $ 1,020.21 | | $ 4.91 |
| Class C | | | | 1.47% | | | | | | |
| Actual | | | | | | $ 1,000 | | $ 886.60 | | $ 6.95 |
Hypothetical- B | | | | | | $ 1,000 | | $ 1,017.70 | | $ 7.44 |
| Class I | | | | .47% | | | | | | |
| Actual | | | | | | $ 1,000 | | $ 891.10 | | $ 2.23 |
Hypothetical- B | | | | | | $ 1,000 | | $ 1,022.71 | | $ 2.38 |
| Class Z | | | | .41% | | | | | | |
| Actual | | | | | | $ 1,000 | | $ 890.60 | | $ 1.94 |
Hypothetical- B | | | | | | $ 1,000 | | $ 1,023.01 | | $ 2.08 |
| Class Z6 | | | | .36% | | | | | | |
| Actual | | | | | | $ 1,000 | | $ 891.80 | | $ 1.71 |
Hypothetical- B | | | | | | $ 1,000 | | $ 1,023.26 | | $ 1.83 |
| Fidelity Advisor Freedom® 2010 Fund | | | | | | | | | | |
| Class A | | | | .74% | | | | | | |
| Actual | | | | | | $ 1,000 | | $ 872.10 | | $ 3.47 |
Hypothetical- B | | | | | | $ 1,000 | | $ 1,021.36 | | $ 3.75 |
| Class M | | | | .99% | | | | | | |
| Actual | | | | | | $ 1,000 | | $ 870.70 | | $ 4.64 |
Hypothetical- B | | | | | | $ 1,000 | | $ 1,020.10 | | $ 5.01 |
| Class C | | | | 1.50% | | | | | | |
| Actual | | | | | | $ 1,000 | | $ 868.60 | | $ 7.03 |
Hypothetical- B | | | | | | $ 1,000 | | $ 1,017.55 | | $ 7.59 |
| Class I | | | | .49% | | | | | | |
| Actual | | | | | | $ 1,000 | | $ 873.20 | | $ 2.30 |
Hypothetical- B | | | | | | $ 1,000 | | $ 1,022.61 | | $ 2.48 |
| Class Z | | | | .43% | | | | | | |
| Actual | | | | | | $ 1,000 | | $ 873.50 | | $ 2.02 |
Hypothetical- B | | | | | | $ 1,000 | | $ 1,022.91 | | $ 2.18 |
| Class Z6 | | | | .38% | | | | | | |
| Actual | | | | | | $ 1,000 | | $ 873.90 | | $ 1.79 |
Hypothetical- B | | | | | | $ 1,000 | | $ 1,023.16 | | $ 1.93 |
| Fidelity Advisor Freedom® 2015 Fund | | | | | | | | | | |
| Class A | | | | .78% | | | | | | |
| Actual | | | | | | $ 1,000 | | $ 853.90 | | $ 3.63 |
Hypothetical- B | | | | | | $ 1,000 | | $ 1,021.16 | | $ 3.95 |
| Class M | | | | 1.03% | | | | | | |
| Actual | | | | | | $ 1,000 | | $ 852.90 | | $ 4.78 |
Hypothetical- B | | | | | | $ 1,000 | | $ 1,019.90 | | $ 5.22 |
| Class C | | | | 1.53% | | | | | | |
| Actual | | | | | | $ 1,000 | | $ 851.10 | | $ 7.10 |
Hypothetical- B | | | | | | $ 1,000 | | $ 1,017.40 | | $ 7.74 |
| Class I | | | | .53% | | | | | | |
| Actual | | | | | | $ 1,000 | | $ 855.30 | | $ 2.47 |
Hypothetical- B | | | | | | $ 1,000 | | $ 1,022.41 | | $ 2.69 |
| Class Z | | | | .47% | | | | | | |
| Actual | | | | | | $ 1,000 | | $ 855.10 | | $ 2.19 |
Hypothetical- B | | | | | | $ 1,000 | | $ 1,022.71 | | $ 2.38 |
| Class Z6 | | | | .40% | | | | | | |
| Actual | | | | | | $ 1,000 | | $ 856.60 | | $ 1.86 |
Hypothetical- B | | | | | | $ 1,000 | | $ 1,023.06 | | $ 2.03 |
| Fidelity Advisor Freedom® 2020 Fund | | | | | | | | | | |
| Class A | | | | .83% | | | | | | |
| Actual | | | | | | $ 1,000 | | $ 836.70 | | $ 3.82 |
Hypothetical- B | | | | | | $ 1,000 | | $ 1,020.91 | | $ 4.20 |
| Class M | | | | 1.08% | | | | | | |
| Actual | | | | | | $ 1,000 | | $ 835.60 | | $ 4.97 |
Hypothetical- B | | | | | | $ 1,000 | | $ 1,019.65 | | $ 5.47 |
| Class C | | | | 1.58% | | | | | | |
| Actual | | | | | | $ 1,000 | | $ 833.50 | | $ 7.26 |
Hypothetical- B | | | | | | $ 1,000 | | $ 1,017.15 | | $ 7.99 |
| Class I | | | | .58% | | | | | | |
| Actual | | | | | | $ 1,000 | | $ 837.20 | | $ 2.67 |
Hypothetical- B | | | | | | $ 1,000 | | $ 1,022.16 | | $ 2.94 |
| Class Z | | | | .50% | | | | | | |
| Actual | | | | | | $ 1,000 | | $ 837.80 | | $ 2.30 |
Hypothetical- B | | | | | | $ 1,000 | | $ 1,022.56 | | $ 2.54 |
| Class Z6 | | | | .42% | | | | | | |
| Actual | | | | | | $ 1,000 | | $ 838.50 | | $ 1.94 |
Hypothetical- B | | | | | | $ 1,000 | | $ 1,022.96 | | $ 2.13 |
| Fidelity Advisor Freedom® 2025 Fund | | | | | | | | | | |
| Class A | | | | .87% | | | | | | |
| Actual | | | | | | $ 1,000 | | $ 827.30 | | $ 3.99 |
Hypothetical- B | | | | | | $ 1,000 | | $ 1,020.71 | | $ 4.41 |
| Class M | | | | 1.12% | | | | | | |
| Actual | | | | | | $ 1,000 | | $ 826.00 | | $ 5.13 |
Hypothetical- B | | | | | | $ 1,000 | | $ 1,019.45 | | $ 5.67 |
| Class C | | | | 1.62% | | | | | | |
| Actual | | | | | | $ 1,000 | | $ 823.90 | | $ 7.41 |
Hypothetical- B | | | | | | $ 1,000 | | $ 1,016.95 | | $ 8.19 |
| Class I | | | | .62% | | | | | | |
| Actual | | | | | | $ 1,000 | | $ 828.40 | | $ 2.84 |
Hypothetical- B | | | | | | $ 1,000 | | $ 1,021.96 | | $ 3.14 |
| Class Z | | | | .54% | | | | | | |
| Actual | | | | | | $ 1,000 | | $ 828.70 | | $ 2.48 |
Hypothetical- B | | | | | | $ 1,000 | | $ 1,022.36 | | $ 2.74 |
| Class Z6 | | | | .43% | | | | | | |
| Actual | | | | | | $ 1,000 | | $ 829.00 | | $ 1.97 |
Hypothetical- B | | | | | | $ 1,000 | | $ 1,022.91 | | $ 2.18 |
| Fidelity Advisor Freedom® 2030 Fund | | | | | | | | | | |
| Class A | | | | .91% | | | | | | |
| Actual | | | | | | $ 1,000 | | $ 821.80 | | $ 4.16 |
Hypothetical- B | | | | | | $ 1,000 | | $ 1,020.51 | | $ 4.61 |
| Class M | | | | 1.16% | | | | | | |
| Actual | | | | | | $ 1,000 | | $ 821.00 | | $ 5.30 |
Hypothetical- B | | | | | | $ 1,000 | | $ 1,019.25 | | $ 5.87 |
| Class C | | | | 1.66% | | | | | | |
| Actual | | | | | | $ 1,000 | | $ 818.90 | | $ 7.57 |
Hypothetical- B | | | | | | $ 1,000 | | $ 1,016.75 | | $ 8.39 |
| Class I | | | | .66% | | | | | | |
| Actual | | | | | | $ 1,000 | | $ 822.50 | | $ 3.02 |
Hypothetical- B | | | | | | $ 1,000 | | $ 1,021.76 | | $ 3.35 |
| Class Z | | | | .57% | | | | | | |
| Actual | | | | | | $ 1,000 | | $ 823.30 | | $ 2.61 |
Hypothetical- B | | | | | | $ 1,000 | | $ 1,022.21 | | $ 2.89 |
| Class Z6 | | | | .45% | | | | | | |
| Actual | | | | | | $ 1,000 | | $ 823.60 | | $ 2.06 |
Hypothetical- B | | | | | | $ 1,000 | | $ 1,022.81 | | $ 2.28 |
| Fidelity Advisor Freedom® 2035 Fund | | | | | | | | | | |
| Class A | | | | .95% | | | | | | |
| Actual | | | | | | $ 1,000 | | $ 807.50 | | $ 4.30 |
Hypothetical- B | | | | | | $ 1,000 | | $ 1,020.31 | | $ 4.81 |
| Class M | | | | 1.20% | | | | | | |
| Actual | | | | | | $ 1,000 | | $ 806.30 | | $ 5.43 |
Hypothetical- B | | | | | | $ 1,000 | | $ 1,019.05 | | $ 6.07 |
| Class C | | | | 1.70% | | | | | | |
| Actual | | | | | | $ 1,000 | | $ 804.10 | | $ 7.69 |
Hypothetical- B | | | | | | $ 1,000 | | $ 1,016.55 | | $ 8.59 |
| Class I | | | | .70% | | | | | | |
| Actual | | | | | | $ 1,000 | | $ 808.20 | | $ 3.17 |
Hypothetical- B | | | | | | $ 1,000 | | $ 1,021.56 | | $ 3.55 |
| Class Z | | | | .61% | | | | | | |
| Actual | | | | | | $ 1,000 | | $ 808.30 | | $ 2.77 |
Hypothetical- B | | | | | | $ 1,000 | | $ 1,022.01 | | $ 3.09 |
| Class Z6 | | | | .47% | | | | | | |
| Actual | | | | | | $ 1,000 | | $ 809.30 | | $ 2.13 |
Hypothetical- B | | | | | | $ 1,000 | | $ 1,022.71 | | $ 2.38 |
| Fidelity Advisor Freedom® 2040 Fund | | | | | | | | | | |
| Class A | | | | 1.00% | | | | | | |
| Actual | | | | | | $ 1,000 | | $ 793.30 | | $ 4.50 |
Hypothetical- B | | | | | | $ 1,000 | �� | $ 1,020.05 | | $ 5.06 |
| Class M | | | | 1.25% | | | | | | |
| Actual | | | | | | $ 1,000 | | $ 792.00 | | $ 5.62 |
Hypothetical- B | | | | | | $ 1,000 | | $ 1,018.80 | | $ 6.33 |
| Class C | | | | 1.75% | | | | | | |
| Actual | | | | | | $ 1,000 | | $ 790.50 | | $ 7.85 |
Hypothetical- B | | | | | | $ 1,000 | | $ 1,016.29 | | $ 8.85 |
| Class I | | | | .75% | | | | | | |
| Actual | | | | | | $ 1,000 | | $ 794.20 | | $ 3.37 |
Hypothetical- B | | | | | | $ 1,000 | | $ 1,021.31 | | $ 3.80 |
| Class Z | | | | .64% | | | | | | |
| Actual | | | | | | $ 1,000 | | $ 794.70 | | $ 2.88 |
Hypothetical- B | | | | | | $ 1,000 | | $ 1,021.86 | | $ 3.24 |
| Class Z6 | | | | .49% | | | | | | |
| Actual | | | | | | $ 1,000 | | $ 795.20 | | $ 2.21 |
Hypothetical- B | | | | | | $ 1,000 | | $ 1,022.61 | | $ 2.48 |
| Fidelity Advisor Freedom® 2045 Fund | | | | | | | | | | |
| Class A | | | | 1.00% | | | | | | |
| Actual | | | | | | $ 1,000 | | $ 791.30 | | $ 4.49 |
Hypothetical- B | | | | | | $ 1,000 | | $ 1,020.05 | | $ 5.06 |
| Class M | | | | 1.25% | | | | | | |
| Actual | | | | | | $ 1,000 | | $ 790.90 | | $ 5.61 |
Hypothetical- B | | | | | | $ 1,000 | | $ 1,018.80 | | $ 6.33 |
| Class C | | | | 1.75% | | | | | | |
| Actual | | | | | | $ 1,000 | | $ 788.70 | | $ 7.85 |
Hypothetical- B | | | | | | $ 1,000 | | $ 1,016.29 | | $ 8.85 |
| Class I | | | | .75% | | | | | | |
| Actual | | | | | | $ 1,000 | | $ 793.20 | | $ 3.37 |
Hypothetical- B | | | | | | $ 1,000 | | $ 1,021.31 | | $ 3.80 |
| Class Z | | | | .64% | | | | | | |
| Actual | | | | | | $ 1,000 | | $ 794.00 | | $ 2.88 |
Hypothetical- B | | | | | | $ 1,000 | | $ 1,021.86 | | $ 3.24 |
| Class Z6 | | | | .49% | | | | | | |
| Actual | | | | | | $ 1,000 | | $ 793.80 | | $ 2.20 |
Hypothetical- B | | | | | | $ 1,000 | | $ 1,022.61 | | $ 2.48 |
| Fidelity Advisor Freedom® 2050 Fund | | | | | | | | | | |
| Class A | | | | 1.00% | | | | | | |
| Actual | | | | | | $ 1,000 | | $ 792.10 | | $ 4.49 |
Hypothetical- B | | | | | | $ 1,000 | | $ 1,020.05 | | $ 5.06 |
| Class M | | | | 1.25% | | | | | | |
| Actual | | | | | | $ 1,000 | | $ 790.90 | | $ 5.61 |
Hypothetical- B | | | | | | $ 1,000 | | $ 1,018.80 | | $ 6.33 |
| Class C | | | | 1.75% | | | | | | |
| Actual | | | | | | $ 1,000 | | $ 789.40 | | $ 7.85 |
Hypothetical- B | | | | | | $ 1,000 | | $ 1,016.29 | | $ 8.85 |
| Class I | | | | .75% | | | | | | |
| Actual | | | | | | $ 1,000 | | $ 793.10 | | $ 3.37 |
Hypothetical- B | | | | | | $ 1,000 | | $ 1,021.31 | | $ 3.80 |
| Class Z | | | | .64% | | | | | | |
| Actual | | | | | | $ 1,000 | | $ 793.50 | | $ 2.88 |
Hypothetical- B | | | | | | $ 1,000 | | $ 1,021.86 | | $ 3.24 |
| Class Z6 | | | | .49% | | | | | | |
| Actual | | | | | | $ 1,000 | | $ 793.60 | | $ 2.20 |
Hypothetical- B | | | | | | $ 1,000 | | $ 1,022.61 | | $ 2.48 |
| Fidelity Advisor Freedom® 2055 Fund | | | | | | | | | | |
| Class A | | | | 1.00% | | | | | | |
| Actual | | | | | | $ 1,000 | | $ 792.10 | | $ 4.49 |
Hypothetical- B | | | | | | $ 1,000 | | $ 1,020.05 | | $ 5.06 |
| Class M | | | | 1.25% | | | | | | |
| Actual | | | | | | $ 1,000 | | $ 791.00 | | $ 5.61 |
Hypothetical- B | | | | | | $ 1,000 | | $ 1,018.80 | | $ 6.33 |
| Class C | | | | 1.75% | | | | | | |
| Actual | | | | | | $ 1,000 | | $ 789.00 | | $ 7.85 |
Hypothetical- B | | | | | | $ 1,000 | | $ 1,016.29 | | $ 8.85 |
| Class I | | | | .75% | | | | | | |
| Actual | | | | | | $ 1,000 | | $ 793.10 | | $ 3.37 |
Hypothetical- B | | | | | | $ 1,000 | | $ 1,021.31 | | $ 3.80 |
| Class Z | | | | .64% | | | | | | |
| Actual | | | | | | $ 1,000 | | $ 793.90 | | $ 2.88 |
Hypothetical- B | | | | | | $ 1,000 | | $ 1,021.86 | | $ 3.24 |
| Class Z6 | | | | .49% | | | | | | |
| Actual | | | | | | $ 1,000 | | $ 793.90 | | $ 2.20 |
Hypothetical- B | | | | | | $ 1,000 | | $ 1,022.61 | | $ 2.48 |
| Fidelity Advisor Freedom® 2060 Fund | | | | | | | | | | |
| Class A | | | | 1.00% | | | | | | |
| Actual | | | | | | $ 1,000 | | $ 792.30 | | $ 4.49 |
Hypothetical- B | | | | | | $ 1,000 | | $ 1,020.05 | | $ 5.06 |
| Class M | | | | 1.25% | | | | | | |
| Actual | | | | | | $ 1,000 | | $ 790.60 | | $ 5.61 |
Hypothetical- B | | | | | | $ 1,000 | | $ 1,018.80 | | $ 6.33 |
| Class C | | | | 1.75% | | | | | | |
| Actual | | | | | | $ 1,000 | | $ 789.30 | | $ 7.85 |
Hypothetical- B | | | | | | $ 1,000 | | $ 1,016.29 | | $ 8.85 |
| Class I | | | | .75% | | | | | | |
| Actual | | | | | | $ 1,000 | | $ 792.80 | | $ 3.37 |
Hypothetical- B | | | | | | $ 1,000 | | $ 1,021.31 | | $ 3.80 |
| Class Z | | | | .64% | | | | | | |
| Actual | | | | | | $ 1,000 | | $ 793.40 | | $ 2.88 |
Hypothetical- B | | | | | | $ 1,000 | | $ 1,021.86 | | $ 3.24 |
| Class Z6 | | | | .49% | | | | | | |
| Actual | | | | | | $ 1,000 | | $ 794.10 | | $ 2.20 |
Hypothetical- B | | | | | | $ 1,000 | | $ 1,022.61 | | $ 2.48 |
| Fidelity Advisor Freedom® 2065 Fund | | | | | | | | | | |
| Class A | | | | 1.00% | | | | | | |
| Actual | | | | | | $ 1,000 | | $ 792.50 | | $ 4.49 |
Hypothetical- B | | | | | | $ 1,000 | | $ 1,020.05 | | $ 5.06 |
| Class M | | | | 1.24% | | | | | | |
| Actual | | | | | | $ 1,000 | | $ 791.40 | | $ 5.57 |
Hypothetical- B | | | | | | $ 1,000 | | $ 1,018.85 | | $ 6.28 |
| Class C | | | | 1.74% | | | | | | |
| Actual | | | | | | $ 1,000 | | $ 789.60 | | $ 7.81 |
Hypothetical- B | | | | | | $ 1,000 | | $ 1,016.34 | | $ 8.80 |
| Class I | | | | .75% | | | | | | |
| Actual | | | | | | $ 1,000 | | $ 793.60 | | $ 3.37 |
Hypothetical- B | | | | | | $ 1,000 | | $ 1,021.31 | | $ 3.80 |
| Class Z | | | | .64% | | | | | | |
| Actual | | | | | | $ 1,000 | | $ 793.80 | | $ 2.88 |
Hypothetical- B | | | | | | $ 1,000 | | $ 1,021.86 | | $ 3.24 |
| Class Z6 | | | | .49% | | | | | | |
| Actual | | | | | | $ 1,000 | | $ 794.40 | | $ 2.20 |
Hypothetical- B | | | | | | $ 1,000 | | $ 1,022.61 | | $ 2.48 |
| |
A Annualized expense ratio reflects expenses net of applicable fee waivers.
B 5% return per year before expenses
C Expenses are equal to the annualized expense ratio, multiplied by the average account value over the period, multiplied by 183/ 365 (to reflect the one-half year period). The fees and expenses of any Underlying Funds are not included in each annualized expense ratio.
Fidelity Advisor Freedom Funds
Each year, the Board of Trustees, including the Independent Trustees (together, the Board), votes on the renewal of the management contract with Fidelity Management & Research Company LLC (FMR) (the Advisory Contract) for each fund. The Board, assisted by the advice of fund counsel and Independent Trustees' counsel, requests and considers a broad range of information relevant to the renewal of the Advisory Contracts throughout the year.
The Board meets regularly and, at each of its meetings, covers an extensive agenda of topics and materials and considers factors that are relevant to its annual consideration of the renewal of each fund's Advisory Contract, including the services and support provided to each fund and its shareholders. The Board has established four standing committees (Committees) - Operations, Audit, Fair Valuation, and Governance and Nominating - each composed of and chaired by Independent Trustees with varying backgrounds, to which the Board has assigned specific subject matter responsibilities in order to enhance effective decision-making by the Board. The Operations Committee, of which all the Independent Trustees are members, meets regularly throughout the year and requests, receives and considers, among other matters, information related to the annual consideration of the renewal of each fund's Advisory Contracts before making its recommendation to the Board. The Board, acting directly and through its Committees, requests and receives information concerning the annual consideration of the renewal of each fund's Advisory Contract. The Board also meets as needed to review matters specifically related to the Board's annual consideration of the renewal of the Advisory Contracts. Members of the Board may also meet from time to time with trustees of other Fidelity funds through joint ad hoc committees to discuss certain matters relevant to all of the Fidelity funds.
At its September 2022 meeting, the Board unanimously determined to renew each fund's Advisory Contract. In reaching its determination, the Board considered all factors it believed relevant, including (i) the nature, extent, and quality of the services provided to each fund and its shareholders (including the investment performance of each fund); (ii) the competitiveness relative to peer funds of each fund's management fee and the total expense ratio of a representative class (Class I); (iii) the total costs of the services provided by and the profits realized by Fidelity from its relationships with each fund; and (iv) the extent to which, if any, economies of scale exist and are realized as each fund grows, and whether any economies of scale are appropriately shared with fund shareholders. The Board also considered that each fund pays an all-inclusive management fee that covers all operating expenses of the fund, subject to certain exceptions, and varies by class (unitary fee), and the underlying Fidelity funds in which the fund invests (Series Funds) do not pay expenses, with certain limited exceptions. The Board and the board of other funds that invest their assets in Series Funds and the boards of the Series Funds previously formed a joint ad hoc committee to review the responsibilities of each board related to the consideration of the renewal of the Advisory Contracts for the funds, other funds that invest substantially all of their assets in Series Funds, and the Series Funds. The Board's deliberations were informed by the conclusions of such committee.
In considering whether to renew the Advisory Contract for each fund, the Board reached a determination, with the assistance of fund counsel and Independent Trustees' counsel and through the exercise of its business judgment, that the renewal of the Advisory Contract was in the best interests of each fund and its shareholders and that the compensation payable under the Advisory Contract was fair and reasonable. The Board's decision to renew the Advisory Contracts was not based on any single factor, but rather was based on a comprehensive consideration of all the information provided to the Board at its meetings throughout the year. The Board, in reaching its determination to renew the Advisory Contracts, was aware that shareholders of each fund have a broad range of investment choices available to them, including a wide choice among funds offered by Fidelity's competitors, and that each fund's shareholders, who have the opportunity to review and weigh the disclosure provided by the fund in its prospectus and other public disclosures, have chosen to invest in that fund, which is part of the Fidelity family of funds.
Nature, Extent, and Quality of Services Provided. The Board considered Fidelity's staffing as it relates to the funds, including the backgrounds of investment personnel of FMR, and also considered the funds' investment objectives, strategies, and related investment philosophies. The Independent Trustees also had discussions with senior management of Fidelity's investment operations and investment groups with responsibility for the Series Funds. The Board considered the structure of the investment personnel compensation program and whether this structure provides appropriate incentives to act in the best interests of each fund. Additionally, the Board considered the portfolio managers' investments, if any, in the funds that they manage. The Board also considered the steps Fidelity had taken to ensure the continued provision of high quality services to the Fidelity funds throughout the COVID-19 pandemic, including the expansion of staff in client facing positions to maintain service levels in periods of high volumes and volatility.
Resources Dedicated to Investment Management and Support Services . The Board reviewed the general qualifications and capabilities of Fidelity's investment staff, including its size, education, experience, and resources, as well as Fidelity's approach to recruiting, training, managing, and compensating investment personnel. The Board noted the resources devoted to Fidelity's global investment organization, and that Fidelity's analysts have extensive resources, tools, and capabilities that allow them to conduct quantitative and fundamental analysis, as well as credit analysis of issuers, counterparties, and guarantors. Further, the Board considered that Fidelity's investment professionals have sufficient access to global information and data so as to provide competitive investment results over time, and that those professionals also have access to sophisticated tools that permit them to assess portfolio construction and risk and performance attribution characteristics continuously, as well as to transmit new information and research conclusions rapidly around the world. Additionally, in its deliberations, the Board considered Fidelity's risk management, compliance, cybersecurity, and technology and operations capabilities and resources, which are integral parts of the investment management process.
Shareholder and Administrative Services. The Board considered (i) the nature, extent, quality, and cost of advisory, administrative, and shareholder services performed by Fidelity under the Advisory Contract and under separate agreements covering transfer agency and pricing and bookkeeping services for each fund; (ii) the nature and extent of the supervision of third party service providers, principally custodians, subcustodians, and pricing vendors; and (iii) the resources devoted to, and the record of compliance with, each fund's compliance policies and procedures.
The Board noted that the growth of fund assets over time across the complex allows Fidelity to reinvest in the development of services designed to enhance the value and convenience of the Fidelity funds as investment vehicles. These services include 24-hour access to account information and market information over the Internet and through telephone representatives, investor education materials and asset allocation tools. The Board also considered that it reviews customer service metrics such as telephone response times, continuity of services on the website and metrics addressing services at Fidelity Investor Centers.
Investment in a Large Fund Family. The Board considered the benefits to shareholders of investing in a Fidelity fund, including the benefits of investing in a fund that is part of a large family of funds offering a variety of investment disciplines and providing a large variety of mutual fund investor services. The Board noted that Fidelity had taken, or had made recommendations to the Board that resulted in the Fidelity funds taking, a number of actions over the previous year that benefited particular funds, including: (i) continuing to dedicate additional resources to Fidelity's investment research process, which includes meetings with management of issuers of securities in which the funds invest; (ii) continuing efforts to enhance Fidelity's global research capabilities; (iii) launching new funds, ETFs, and share classes with innovative structures, strategies and pricing and making other enhancements to meet investor needs; (iv) broadening eligibility requirements for certain funds and share classes; (v) reducing management fees and total expenses for certain funds and classes; (vi) lowering expenses for certain existing funds and classes by implementing or lowering expense caps; (vii) rationalizing product lines and gaining increased efficiencies from fund mergers and liquidations; (viii) continuing to develop, acquire and implement systems and technology to improve services to the funds and shareholders, strengthen information security, and increase efficiency; and (ix) continuing to implement enhancements to further strengthen Fidelity's product line to increase investors' probability of success in achieving their investment goals, including their retirement income goals.
Investment Performance. The Board considered whether each fund has operated in accordance with its investment objective, as well as its record of compliance with its investment restrictions and its performance history.
The Board took into account discussions that occur at Board meetings throughout the year with representatives of the investment adviser about fund investment performance. In this regard the Board noted that as part of regularly scheduled fund reviews and other reports to the Board on fund performance, the Board considers annualized return information for each fund for different time periods, measured against one or more appropriate securities market indices, including a customized blended index that reflects the respective weights of the fund's asset classes (each a benchmark index). The Board also receives and considers information about performance attribution. In its evaluation of fund investment performance at meetings throughout the year, the Board gave particular attention to information indicating underperformance of certain Fidelity funds for specific time periods and discussed with the investment adviser the reasons for such underperformance.
In addition to reviewing absolute and relative fund performance, the Independent Trustees periodically consider the appropriateness of fund performance metrics in evaluating the results achieved. In general, the Independent Trustees believe that fund performance should be evaluated based on gross performance (before fees and expenses, including acquired fund fees and expenses, but after transaction costs, if any) compared to appropriate benchmark indices, over appropriate time periods that may include full market cycles, taking into account relevant factors including the following: general market conditions; the extent to which particular underlying funds affected performance; and fund cash flows and other factors. The Independent Trustees generally give greater weight to fund performance over longer time periods than over shorter time periods. Depending on the circumstances, the Independent Trustees may be satisfied with a fund's performance notwithstanding that it lags its benchmark index for certain periods.
The Independent Trustees recognize that shareholders evaluate performance on a net basis over their own holding periods, for which one-, three-, and five-year periods are often used as a proxy. For this reason, the performance information reviewed by the Board also included net cumulative calendar year total return information for the representative class (Class I) of each fund and an appropriate benchmark index for the most recent one-, three-, and five-year periods (for Freedom Advisor Freedom 2065 Fund, the most recent one-year period). No performance peer group information was considered by the Board as Fidelity advised the Board that competitor funds differ significantly in their asset allocation strategy, degree of active management and glidepath construction. The Independent Trustees recognize that shareholders who are not investing through a tax-advantaged retirement account also consider tax consequences in evaluating performance.
Based on its review, the Board concluded that the nature, extent, and quality of services provided to each fund under the Advisory Contracts should continue to benefit the shareholders of each fund.
Competitiveness of Management Fee and Total Expense Ratio. The Board considered each fund's management fee and total expense ratio compared to selected groups of competitive funds and classes (referred to as "mapped groups" below) for the purpose of facilitating the Trustees' competitive analysis of management fees and total expenses. Fidelity creates "mapped groups" by combining similar investment objective categories (as classified by Lipper) that have comparable investment mandates. Combining funds with similar Lipper investment objective categories aids the Board's comparisons of management fees and total expense ratios by broadening the competitive group used for such comparisons.
Management Fee. The Board considered two proprietary management fee comparisons. The group of Lipper funds used by the Board for management fee comparisons is referred to as the "Total Mapped Group." The Total Mapped Group comparison focuses on a fund's standing in terms of gross management fees before expense reimbursements or caps relative to the total universe of funds with comparable investment mandates, regardless of whether their management fee structures also are comparable. Funds with comparable investment mandates offer exposure to similar types of securities. Funds with comparable management fee structures have similar management fee contractual arrangements (e.g., flat rate charged for advisory services, all-inclusive fee rate, etc.). The "Asset-Sized Peer Group" (ASPG) comparison focuses on a fund's standing relative to a subset of non-Fidelity funds within the Total Mapped Group that are similar in size and management fee structure. For example, if a fund is in the first quartile of the ASPG, the fund's management fee ranks in the least expensive or lowest 25% of funds in the ASPG. The ASPG represents at least 15% of the funds in the Total Mapped Group with comparable asset size and management fee structures, subject to a minimum of 50 funds (or all funds in the Total Mapped Group if fewer than 50). Additional information, such as the ASPG quartile in which a fund's management fee rate ranked, also was considered by the Board.
The Board noted that a different unitary (subject to certain limited exceptions) management fee rate is applicable to each class of each fund. The Board considered that the difference in management fee rates between classes is the result of separate arrangements for class-level services and/or waivers of certain expenses and not the result of any difference in advisory or custodial fees or other expenses related to the management of a fund's assets.
The Board compared each fund's class-level management fee rates for the current fiscal year relative to the median of its competitor funds in the applicable Total Mapped Group based on competitive data for 2021. The Board noted that each fund's class-level management fee rates rank above the median of its competitor funds in the applicable Total Mapped Group based on competitive data for 2021. The Board noted that each fund's unitary fee arrangement covers all operating expenses of the fund, subject to certain exceptions, and that the fee structures of the majority of peer funds do not include top-level management fees. The Board noted that for this reason, Fidelity believes that a comparison of total expense ratios (including acquired fund fees and expenses) is more useful than comparisons of the unitary advisory fee paid by each class and the advisory fee paid by most competitor funds. The Board also noted that the primary comparisons for the funds are against competitor target date funds with holdings that are actively managed, but that there is still wide dispersion in the strategic and active allocation among competitors, regardless of whether the funds have similar vintages.
Based on its review, the Board concluded that each fund's management fee is fair and reasonable in light of the services that the fund receives and the other factors considered.
Total Expense Ratio. In its review of the total expense ratio of the representative class (Class I) of each fund, the Board considered the fund's class-level management fee rate under the Advisory Contract. The Board also considered other expenses, such as transfer agent fees, pricing and bookkeeping fees, and custodial, legal, and audit fees, paid by FMR under the unitary fee arrangement. The Board also noted that Fidelity may agree to waive fees or reimburse expenses from time to time, and the extent to which, if any, it has done so for each fund. Each fund's representative class is compared to those funds and classes in the Total Mapped Group (used by the Board for management fee comparisons) that have a similar sales load structure. The Board also considered a total expense (including acquired fund fees and expenses) ASPG comparison, which focuses on the total expenses of the representative class relative to a subset of non-Fidelity funds within the similar sales load structure group that are similar in size and management fee structure. The total expense ASPG is limited to 15 larger and 15 smaller classes of different funds, where possible. The total expense ASPG comparison excludes performance adjustments and fund-paid 12b-1 fees to eliminate variability in expenses relating to these items.
The Board noted that each fund offers multiple classes, each of which has a different sales load and 12b-1 fee structure than the others, and that the multiple structures are intended to offer a range of pricing options for the intermediary market. The Board also noted that the total expense ratios of the classes of each fund vary primarily by the level of their 12b-1 fees.
The Board noted that the total net expense ratio, which includes the expenses of the Series Funds, of Class I (i) ranked below the similar sales load structure group competitive median for 2021 for Fidelity Advisor Freedom Income Fund, Fidelity Advisor Freedom 2005 Fund, Fidelity Advisor Freedom 2010 Fund, Fidelity Advisor Freedom 2015 Fund, and Fidelity Advisor Freedom 2020 Fund; and (ii) ranked above the similar sales load structure group competitive median for 2021 for Fidelity Advisor Freedom 2025 Fund, Fidelity Advisor Freedom 2030 Fund, Fidelity Advisor Freedom 2035 Fund, Fidelity Advisor Freedom 2040 Fund, Fidelity Advisor Freedom 2045 Fund, Fidelity Advisor Freedom 2050 Fund, Fidelity Advisor Freedom 2055 Fund, Fidelity Advisor Freedom 2060 Fund, and Fidelity Advisor Freedom 2065 Fund.
The Board noted that, although Class I is categorized by Lipper as an institutional class, Class I has no investment minimum, unlike most other funds and classes categorized as institutional. As a result, FMR believes Class I is generally more comparable to retail funds and classes. The Board considered that, when compared to retail classes of competitor target date funds of a similar vintage, Class I of each fund would be at or below the competitive median of the similar sales load structure group for 2021.
The Board noted that the total net expense ratio, which includes the expenses of the Series Funds, of Class I (i) ranked below the ASPG competitive median for 2021 for Fidelity Advisor Freedom Income Fund, Fidelity Advisor Freedom 2005 Fund, Fidelity Advisor Freedom 2010 Fund, and Fidelity Advisor Freedom 2015 Fund; and (ii) ranked above the ASPG competitive median for 2021 for Fidelity Advisor Freedom 2020 Fund, Fidelity Advisor Freedom 2025 Fund, Fidelity Advisor Freedom 2030 Fund, Fidelity Advisor Freedom 2035 Fund, Fidelity Advisor Freedom 2040 Fund, Fidelity Advisor Freedom 2045 Fund, Fidelity Advisor Freedom 2050 Fund, Fidelity Advisor Freedom 2055 Fund, Fidelity Advisor Freedom 2060 Fund, and Fidelity Advisor Freedom 2065 Fund. The Board noted Fidelity's explanation that these funds were above their respective ASPG medians because of higher equity and/or international allocations relative to competitors.
The Board considered that current contractual arrangements for the fund oblige FMR to pay all "class-level" expenses of Class Z6 of each fund to the extent necessary to limit total operating expenses, with certain exceptions, to an amount specified in the applicable expense contract. These contractual arrangements may not be amended to increase the fees or expenses payable by Class Z6 of a fund except by a vote of a majority of the Board of Trustees (for each fund) and by a vote of a majority of the outstanding voting securities of Class Z6 of the applicable fund (for each fund, except Fidelity Advisor Freedom 2065 Fund).
Fees Charged to Other Fidelity Clients. The Board also considered Fidelity fee structures and other information with respect to clients of Fidelity, such as other funds advised or subadvised by Fidelity, pension plan clients, and other institutional clients with similar mandates. The Board noted that a joint ad hoc committee created by it and the boards of other Fidelity funds periodically reviews and compares Fidelity's institutional investment advisory business with its business of providing services to the Fidelity funds and also noted the most recent findings of the committee. The Board noted that the committee's review included a consideration of the differences in services provided, fees charged, and costs incurred, as well as competition in the markets serving the different categories of clients.
Based on its review of total expense ratios and fees charged to other Fidelity clients, the Board concluded that the total expense ratio of each class of each fund was reasonable in light of the services that the fund and its shareholders receive and the other factors considered.
Costs of the Services and Profitability . The Board considered the revenues earned and the expenses incurred by Fidelity in conducting the business of developing, marketing, distributing, managing, administering and servicing each fund and the Series Funds in which each fund invests and in servicing each fund's shareholders. The Board also considered the level of Fidelity's profits in respect of all the Fidelity funds.
On an annual basis, Fidelity presents to the Board information about the profitability of its relationships with each fund. Fidelity calculates profitability information for each fund, as well as aggregate profitability information for groups of Fidelity funds and all Fidelity funds, using a series of detailed revenue and cost allocation methodologies which originate with the books and records of Fidelity on which Fidelity's audited financial statements are based. The Audit Committee of the Board reviews any significant changes from the prior year's methodologies and the full Board approves such changes.
A public accounting firm has been engaged annually by the Board as part of the Board's assessment of Fidelity's profitability analysis. The engagement includes the review and assessment of the methodologies used by Fidelity in determining the revenues and expenses attributable to Fidelity's mutual fund business, and completion of agreed-upon procedures in respect of the mathematical accuracy of certain fund profitability information and its conformity to established allocation methodologies. After considering the reports issued under the engagement and information provided by Fidelity, the Board concluded that while other allocation methods may also be reasonable, Fidelity's profitability methodologies are reasonable in all material respects.
The Board also reviewed Fidelity's non-fund businesses and potential indirect benefits such businesses may have received as a result of their association with Fidelity's mutual fund business (i.e., fall-out benefits) as well as cases where Fidelity's affiliates may benefit from the funds' business. The Board considered areas where potential indirect benefits to the Fidelity funds from their relationships with Fidelity may exist. The Board's consideration of these matters was informed by the findings of a joint ad hoc committee created by it and the boards of other Fidelity funds to evaluate potential fall-out benefits.
The Board considered the costs of the services provided by and the profits realized by Fidelity in connection with the operation of each fund and was satisfied that the profitability was not excessive.
Economies of Scale . The Board considered whether there have been economies of scale in respect of the management of the Fidelity funds, whether the Fidelity funds (including each fund) have appropriately benefited from any such economies of scale, and whether there is potential for realization of any further economies of scale. The Board considered the extent to which each fund will benefit from economies of scale as assets grow through increased services to the fund, through waivers or reimbursements, or through fee or expense ratio reductions. The Board recognized that, due to each fund's current contractual arrangements, its expense ratio will not decline if the fund's operating costs decrease as assets grow, or rise as assets decrease. The Board also noted that a committee (the Economies of Scale Committee) created by it and the boards of other Fidelity funds periodically analyzes whether Fidelity attains economies of scale in respect of the management and servicing of the Fidelity funds, whether the Fidelity funds have appropriately benefited from such economies of scale, and whether there is potential for realization of any further economies of scale.
The Board concluded, taking into account the analysis of the Economies of Scale Committee, that economies of scale, if any, are being appropriately shared between fund shareholders and Fidelity.
Additional Information Requested by the Board . In order to develop fully the factual basis for consideration of the Fidelity funds' advisory contracts, the Board requested and received additional information on certain topics, including: (i) Fidelity's fund profitability methodology, profitability trends for certain funds, the allocation of various costs to different funds, and the impact of certain factors on fund profitability results; (ii) portfolio manager changes that have occurred during the past year and the amount of the investment that each portfolio manager has made in the Fidelity fund(s) that he or she manages; (iii) the extent to which current market conditions have affected retention and recruitment of personnel; (iv) the arrangements with and compensation paid to certain fund sub-advisers on behalf of the Fidelity funds and the treatment of such compensation within Fidelity's fund profitability methodology; (v) the terms of the funds' various management fee structures, including the basic group fee and the terms of Fidelity's voluntary expense limitation arrangements; (vi) Fidelity's transfer agent, pricing and bookkeeping fees, expense and service structures for different funds and classes relative to competitive trends; (vii) the impact on fund profitability of recent industry trends, such as the growth in passively managed funds and the changes in flows for different types of funds; (viii) the types of management fee and total expense comparisons provided, and the challenges and limitations associated with such information; and (ix) explanations regarding the relative total expense ratios and management fees of certain funds and classes, total expense and management fee competitive trends, and methodologies for total expense and management fee competitive comparisons. In addition, the Board considered its discussions with Fidelity regarding Fidelity's efforts to maintain the continuous investment and shareholder services necessary for the funds during the current pandemic and economic circumstances.
Based on its evaluation of all of the conclusions noted above, and after considering all factors it believed relevant, the Board concluded that the advisory fee arrangements are fair and reasonable and that each fund's Advisory Contract should be renewed.
1.792138.119
AFF-SANN-1122
Fidelity Freedom® Funds
Fidelity Freedom® Income Fund
Fidelity Freedom® 2005 Fund
Fidelity Freedom® 2010 Fund
Fidelity Freedom® 2015 Fund
Fidelity Freedom® 2020 Fund
Fidelity Freedom® 2025 Fund
Fidelity Freedom® 2030 Fund
Fidelity Freedom® 2035 Fund
Fidelity Freedom® 2040 Fund
Fidelity Freedom® 2045 Fund
Fidelity Freedom® 2050 Fund
Fidelity Freedom® 2055 Fund
Fidelity Freedom® 2060 Fund
Fidelity Freedom® 2065 Fund
Semi-Annual Report
September 30, 2022
Contents
To view a fund's proxy voting guidelines and proxy voting record for the 12-month period ended June 30, visit http://www.fidelity.com/proxyvotingresults or visit the Securities and Exchange Commission's (SEC) web site at http://www.sec.gov.
You may also call 1-800-544-8544 if you're an individual investing directly with Fidelity, call 1-800-835-5092 if you're a plan sponsor or participant with Fidelity as your recordkeeper or call 1-877-208-0098 on institutional accounts or if you're an advisor or invest through one to request a free copy of the proxy voting guidelines.
Standard & Poor's, S&P and S&P 500 are registered service marks of The McGraw-Hill Companies, Inc. and have been licensed for use by Fidelity Distributors Corporation.
Other third-party marks appearing herein are the property of their respective owners.
All other marks appearing herein are registered or unregistered trademarks or service marks of FMR LLC or an affiliated company. © 2022 FMR LLC. All rights reserved.
This report and the financial statements contained herein are submitted for the general information of the shareholders of the Fund. This report is not authorized for distribution to prospective investors in the Fund unless preceded or accompanied by an effective prospectus.
A fund files its complete schedule of portfolio holdings with the SEC for the first and third quarters of each fiscal year on Form N-PORT. Forms N-PORT are available on the SEC's web site at http://www.sec.gov. A fund's Forms N-PORT may be reviewed and copied at the SEC's Public Reference Room in Washington, DC. Information regarding the operation of the SEC's Public Reference Room may be obtained by calling 1-800-SEC-0330.
For a complete list of a fund's portfolio holdings, view the most recent holdings listing, semiannual report, or annual report on Fidelity's web site at http://www.fidelity.com, http://www.institutional.fidelity.com, or http://www.401k.com, as applicable.
NOT FDIC INSURED •MAY LOSE VALUE •NO BANK GUARANTEE
Neither the Fund nor Fidelity Distributors Corporation is a bank.
The information in the following table is based on the direct Investments of the Fund.
Top Holdings (% of Fund's net assets) |
| |
| Fidelity Series Investment Grade Bond Fund | 39.1 | |
| Fidelity Series 0-5 Year Inflation-Protected Bond Index Fund | 20.0 | |
| Fidelity Series Government Money Market Fund 3.00% | 8.6 | |
| Fidelity Series Emerging Markets Opportunities Fund | 5.6 | |
| Fidelity Series International Developed Markets Bond Index Fund | 4.0 | |
| Fidelity Series Long-Term Treasury Bond Index Fund | 3.6 | |
| Fidelity Series Short-Term Credit Fund | 2.1 | |
| Fidelity Series Overseas Fund | 2.0 | |
| Fidelity Series International Value Fund | 2.0 | |
| Fidelity Series International Growth Fund | 1.9 | |
| | 88.9 | |
| |
Asset Allocation (% of Fund's net assets) |
|
Percentages shown as 0.0% may reflect amounts less than 0.05%. |
|
Domestic Equity Funds category includes Fidelity Series Commodity Strategy Fund which invests in commodity-related investments.
Fidelity Freedom® Income Fund
Showing Percentage of Net Assets
| U.S. Treasury Obligations - 0.1% |
| | | Principal Amount (a) | Value ($) |
U.S. Treasury Bills, yield at date of purchase 3.15% to 3.29% 12/15/22 to 12/29/22 (b) (Cost $1,359,721) | | 1,370,000 | 1,360,400 |
| | | | |
| Domestic Equity Funds - 7.4% |
| | | Shares | Value ($) |
| Fidelity Series All-Sector Equity Fund (c) | | 665,180 | 5,707,244 |
| Fidelity Series Blue Chip Growth Fund (c) | | 1,359,256 | 13,646,931 |
| Fidelity Series Commodity Strategy Fund (c) | | 13,758,905 | 28,756,112 |
| Fidelity Series Growth Company Fund (c) | | 1,994,154 | 26,761,551 |
| Fidelity Series Intrinsic Opportunities Fund (c) | | 842,213 | 11,083,527 |
| Fidelity Series Large Cap Stock Fund (c) | | 1,719,115 | 25,391,335 |
| Fidelity Series Large Cap Value Index Fund (c) | | 654,982 | 8,331,375 |
| Fidelity Series Opportunistic Insights Fund (c) | | 1,091,730 | 15,513,477 |
| Fidelity Series Small Cap Discovery Fund (c) | | 277,888 | 2,606,587 |
| Fidelity Series Small Cap Opportunities Fund (c) | | 805,475 | 8,683,026 |
| Fidelity Series Stock Selector Large Cap Value Fund (c) | | 1,650,537 | 18,436,502 |
| Fidelity Series Value Discovery Fund (c) | | 1,040,327 | 14,325,303 |
| TOTAL DOMESTIC EQUITY FUNDS (Cost $172,656,596) | | | 179,242,970 |
| | | | |
| International Equity Funds - 13.4% |
| | | Shares | Value ($) |
| Fidelity Series Canada Fund (c) | | 1,645,318 | 20,401,942 |
| Fidelity Series Emerging Markets Fund (c) | | 1,955,361 | 14,156,815 |
| Fidelity Series Emerging Markets Opportunities Fund (c) | | 9,252,454 | 134,345,636 |
| Fidelity Series International Growth Fund (c) | | 3,685,138 | 47,243,467 |
| Fidelity Series International Small Cap Fund (c) | | 898,947 | 12,297,596 |
| Fidelity Series International Value Fund (c) | | 5,520,341 | 47,419,731 |
| Fidelity Series Overseas Fund (c) | | 5,003,421 | 47,682,598 |
| TOTAL INTERNATIONAL EQUITY FUNDS (Cost $339,764,975) | | | 323,547,785 |
| | | | |
| Bond Funds - 68.4% |
| | | Shares | Value ($) |
| Fidelity Series 0-5 Year Inflation-Protected Bond Index Fund (c) | | 49,780,281 | 480,379,707 |
| Fidelity Series 5+ Year Inflation-Protected Bond Index Fund (c) | | 274,333 | 2,191,918 |
| Fidelity Series Emerging Markets Debt Fund (c) | | 1,778,702 | 12,201,899 |
| Fidelity Series Emerging Markets Debt Local Currency Fund (c) | | 500,765 | 3,991,096 |
| Fidelity Series Floating Rate High Income Fund (c) | | 279,630 | 2,432,778 |
| Fidelity Series High Income Fund (c) | | 1,650,639 | 13,007,034 |
| Fidelity Series International Credit Fund (c) | | 234,651 | 1,846,704 |
| Fidelity Series International Developed Markets Bond Index Fund (c) | | 11,245,893 | 95,815,008 |
| Fidelity Series Investment Grade Bond Fund (c) | | 96,302,972 | 939,917,008 |
| Fidelity Series Long-Term Treasury Bond Index Fund (c) | | 14,588,007 | 87,090,404 |
| Fidelity Series Real Estate Income Fund (c) | | 647,809 | 6,167,144 |
| TOTAL BOND FUNDS (Cost $1,816,753,789) | | | 1,645,040,700 |
| | | | |
| Short-Term Funds - 10.7% |
| | | Shares | Value ($) |
| Fidelity Cash Central Fund 3.10% (d) | | 1,080,788 | 1,081,004 |
| Fidelity Series Government Money Market Fund 3.00% (c)(e) | | 205,648,701 | 205,648,701 |
| Fidelity Series Short-Term Credit Fund (c) | | 5,289,050 | 50,140,189 |
| TOTAL SHORT-TERM FUNDS (Cost $259,243,448) | | | 256,869,894 |
| | | | |
| TOTAL INVESTMENT IN SECURITIES - 100.0% (Cost $2,589,778,529) | 2,406,061,749 |
NET OTHER ASSETS (LIABILITIES) - 0.0% | (551,139) |
| NET ASSETS - 100.0% | 2,405,510,610 |
| | |
| Futures Contracts |
| | Number of contracts | Expiration Date | Notional Amount ($) | Value ($) | Unrealized Appreciation/ (Depreciation) ($) |
| Purchased | | | | | |
| | | | | | |
| Treasury Contracts | | | | | |
| CBOT 10-Year U.S. Treasury Note Contracts (United States) | 391 | Dec 2022 | 43,816,438 | (2,678,756) | (2,678,756) |
| CBOT Ultra Long Term U.S. Treasury Bond Contracts (United States) | 37 | Dec 2022 | 5,069,000 | (63,543) | (63,543) |
| | | | | | |
| TOTAL PURCHASED | | | | | (2,742,299) |
| | | | | | |
| Sold | | | | | |
| | | | | | |
| Equity Index Contracts | | | | | |
| CME E-mini S&P 500 Index Contracts (United States) | 57 | Dec 2022 | 10,264,275 | 289,226 | 289,226 |
| ICE E-mini MSCI EAFE Index Contracts (United States) | 93 | Dec 2022 | 7,721,790 | 777,716 | 777,716 |
| ICE E-mini MSCI Emerging Markets Index Contracts (United States) | 69 | Dec 2022 | 3,006,675 | 1,617 | 1,617 |
| | | | | | |
| TOTAL SOLD | | | | | 1,068,559 |
| | | | | | |
| TOTAL FUTURES CONTRACTS | | | | | (1,673,740) |
| The notional amount of futures purchased as a percentage of Net Assets is 2.0% |
| The notional amount of futures sold as a percentage of Net Assets is 0.8% |
Legend
| (a) | Amount is stated in United States dollars unless otherwise noted. |
| (b) | Security or a portion of the security was pledged to cover margin requirements for futures contracts. At period end, the value of securities pledged amounted to $1,360,400. |
| (d) | Affiliated fund that is generally available only to investment companies and other accounts managed by Fidelity Investments. The rate quoted is the annualized seven-day yield of the fund at period end. A complete unaudited listing of the fund's holdings as of its most recent quarter end is available upon request. In addition, each Fidelity Central Fund's financial statements are available on the SEC's website or upon request. |
| (e) | The rate quoted is the annualized seven-day yield of the fund at period end. |
Affiliated Central Funds
Fiscal year to date information regarding the Fund's investments in Fidelity Central Funds, including the ownership percentage, is presented below.
| Affiliate | Value, beginning of period ($) | Purchases ($) | Sales Proceeds ($) | Dividend Income ($) | Realized Gain (loss) ($) | Change in Unrealized appreciation (depreciation) ($) | Value, end of period ($) | %ownership, end of period |
| Fidelity Cash Central Fund 3.10% | 939,165 | 14,736,355 | 14,594,515 | 18,508 | - | (1) | 1,081,004 | 0.0% |
| Total | 939,165 | 14,736,355 | 14,594,515 | 18,508 | - | (1) | 1,081,004 | |
| | | | | | | | | |
Amounts in the income column in the above table include any capital gain distributions from underlying funds, which are presented in the corresponding line item in the Statement of Operations, if applicable.
Affiliated Underlying Funds
Fiscal year to date information regarding the Fund's investments in affiliated Underlying Funds is presented below. Exchanges between classes of the same affiliated Underlying Funds may occur. If an Underlying Funds changes its name, the name presented below is the name in effect at period end.
| Affiliate | Value, beginning of period ($) | Purchases ($) | Sales Proceeds ($) | Dividend Income ($) | Realized Gain (loss) ($) | Change in Unrealized appreciation (depreciation) ($) | Value, end of period ($) |
| Fidelity Series 0-5 Year Inflation-Protected Bond Index Fund | 462,073,693 | 101,884,164 | 63,707,803 | - | (1,242,984) | (18,627,363) | 480,379,707 |
| Fidelity Series 5+ Year Inflation-Protected Bond Index Fund | 2,870,052 | 22,622,712 | 22,803,960 | - | (225,404) | (271,482) | 2,191,918 |
| Fidelity Series All-Sector Equity Fund | 7,338,669 | 593,827 | 777,007 | - | (98,469) | (1,349,776) | 5,707,244 |
| Fidelity Series Blue Chip Growth Fund | 12,051,981 | 7,877,050 | 2,138,053 | 449,654 | (404,558) | (3,739,489) | 13,646,931 |
| Fidelity Series Canada Fund | 25,019,580 | 2,042,787 | 1,651,853 | - | 2,527 | (5,011,099) | 20,401,942 |
| Fidelity Series Commodity Strategy Fund | 42,901,796 | 23,034,268 | 13,366,181 | 20,335,928 | (3,170,005) | (20,643,766) | 28,756,112 |
| Fidelity Series Emerging Markets Debt Fund | 14,799,181 | 927,171 | 1,067,267 | 370,854 | (204,465) | (2,252,721) | 12,201,899 |
| Fidelity Series Emerging Markets Debt Local Currency Fund | 4,902,152 | 8,401 | 372,690 | - | (73,190) | (473,577) | 3,991,096 |
| Fidelity Series Emerging Markets Fund | 17,581,404 | 1,715,045 | 1,213,248 | - | (61,360) | (3,865,026) | 14,156,815 |
| Fidelity Series Emerging Markets Opportunities Fund | 158,392,451 | 20,878,933 | 10,890,378 | - | (769,071) | (33,266,299) | 134,345,636 |
| Fidelity Series Floating Rate High Income Fund | 2,937,579 | 76,350 | 434,832 | 71,406 | (46,285) | (100,034) | 2,432,778 |
| Fidelity Series Government Money Market Fund 3.00% | 291,427,485 | 8,173,668 | 93,952,452 | 1,475,137 | - | - | 205,648,701 |
| Fidelity Series Growth Company Fund | 30,038,017 | 8,539,412 | 3,633,077 | - | (527,974) | (7,654,827) | 26,761,551 |
| Fidelity Series High Income Fund | 17,400,076 | 435,681 | 2,692,410 | 408,687 | (252,685) | (1,883,628) | 13,007,034 |
| Fidelity Series Inflation-Protected Bond Index Fund | 57,837,687 | 290,770 | 57,095,867 | 275,981 | 1,481,680 | (2,514,270) | - |
| Fidelity Series International Credit Fund | 2,143,327 | 29,264 | 1,520 | 29,263 | (34) | (324,333) | 1,846,704 |
| Fidelity Series International Developed Markets Bond Index Fund | 88,940,411 | 23,447,198 | 7,883,613 | 146,283 | (486,271) | (8,202,717) | 95,815,008 |
| Fidelity Series International Growth Fund | 57,358,305 | 8,800,412 | 5,781,325 | - | (878,745) | (12,255,180) | 47,243,467 |
| Fidelity Series International Small Cap Fund | 15,838,374 | 1,305,214 | 1,145,892 | - | (363,687) | (3,336,413) | 12,297,596 |
| Fidelity Series International Value Fund | 57,937,817 | 7,312,427 | 5,140,203 | - | (406,910) | (12,283,400) | 47,419,731 |
| Fidelity Series Intrinsic Opportunities Fund | 29,549,224 | 3,396,808 | 15,978,651 | 3,310,651 | 5,738,224 | (11,622,078) | 11,083,527 |
| Fidelity Series Investment Grade Bond Fund | 1,151,658,480 | 21,236,281 | 116,949,172 | 15,020,642 | (7,881,416) | (108,147,165) | 939,917,008 |
| Fidelity Series Large Cap Stock Fund | 26,715,585 | 9,320,966 | 4,204,577 | 1,458,159 | (15,565) | (6,425,074) | 25,391,335 |
| Fidelity Series Large Cap Value Index Fund | 10,054,443 | 1,171,848 | 1,223,318 | - | 67,917 | (1,739,515) | 8,331,375 |
| Fidelity Series Long-Term Treasury Bond Index Fund | 106,361,810 | 11,983,365 | 7,784,048 | 1,243,912 | (703,496) | (22,767,227) | 87,090,404 |
| Fidelity Series Opportunistic Insights Fund | 15,387,331 | 5,912,274 | 2,160,691 | - | (306,557) | (3,318,880) | 15,513,477 |
| Fidelity Series Overseas Fund | 57,677,833 | 9,317,031 | 4,845,598 | - | (507,855) | (13,958,813) | 47,682,598 |
| Fidelity Series Real Estate Income Fund | 10,588,308 | 484,535 | 3,510,352 | 468,491 | 182,907 | (1,578,254) | 6,167,144 |
| Fidelity Series Short-Term Credit Fund | 72,994,989 | 893,905 | 22,147,656 | 458,708 | (587,256) | (1,013,793) | 50,140,189 |
| Fidelity Series Small Cap Discovery Fund | 3,313,051 | 740,763 | 450,749 | 368,332 | (6,469) | (990,009) | 2,606,587 |
| Fidelity Series Small Cap Opportunities Fund | 10,869,932 | 1,399,006 | 1,373,116 | 397,462 | (206,875) | (2,005,921) | 8,683,026 |
| Fidelity Series Stock Selector Large Cap Value Fund | 22,498,045 | 2,923,504 | 3,218,731 | - | (17,036) | (3,749,280) | 18,436,502 |
| Fidelity Series Value Discovery Fund | 17,114,908 | 1,624,288 | 2,141,422 | - | 238,708 | (2,511,179) | 14,325,303 |
| | 2,904,573,976 | 310,399,328 | 481,737,712 | 46,289,550 | (11,732,659) | (317,882,588) | 2,403,620,345 |
Amounts in the income column in the above table include any capital gain distributions from underlying funds, which are presented in the corresponding line item in the Statement of Operations, if applicable.
Purchases and Sales Proceeds in the table above include the value of shares purchased or redeemed through in-kind transactions, if applicable.
Investment Valuation
The following is a summary of the inputs used, as of September 30, 2022, involving the Fund's assets and liabilities carried at fair value. The inputs or methodology used for valuing securities may not be an indication of the risk associated with investing in those securities. For more information on valuation inputs, and their aggregation into the levels used below, please refer to the Investment Valuation section in the accompanying Notes to Financial Statements.
| Valuation Inputs at Reporting Date: |
| Description | Total ($) | Level 1 ($) | Level 2 ($) | Level 3 ($) |
Investments in Securities: | | | | |
|
| Other Short-Term Investments | 1,360,400 | - | 1,360,400 | - |
|
| Domestic Equity Funds | 179,242,970 | 179,242,970 | - | - |
|
| International Equity Funds | 323,547,785 | 323,547,785 | - | - |
|
| Bond Funds | 1,645,040,700 | 1,645,040,700 | - | - |
|
| Short-Term Funds | 256,869,894 | 256,869,894 | - | - |
| Total Investments in Securities: | 2,406,061,749 | 2,404,701,349 | 1,360,400 | - |
Derivative Instruments: | | | | |
|
| Assets | | | | |
Futures Contracts | 1,068,559 | 1,068,559 | - | - |
| Total Assets | 1,068,559 | 1,068,559 | - | - |
|
| Liabilities | | | | |
Futures Contracts | (2,742,299) | (2,742,299) | - | - |
| Total Liabilities | (2,742,299) | (2,742,299) | - | - |
| Total Derivative Instruments: | (1,673,740) | (1,673,740) | - | - |
Value of Derivative Instruments
The following table is a summary of the Fund's value of derivative instruments by primary risk exposure as of September 30, 2022. For additional information on derivative instruments, please refer to the Derivative Instruments section in the accompanying Notes to Financial Statements.
Primary Risk Exposure / Derivative Type | Value |
| Asset ($) | Liability ($) |
| Equity Risk | | |
Futures Contracts (a) | 1,068,559 | 0 |
| Total Equity Risk | 1,068,559 | 0 |
| Interest Rate Risk | | |
Futures Contracts (a) | 0 | (2,742,299) |
| Total Interest Rate Risk | 0 | (2,742,299) |
| Total Value of Derivatives | 1,068,559 | (2,742,299) |
(a)Reflects gross cumulative appreciation (depreciation) on futures contracts as presented in the Schedule of Investments. In the Statement of Assets and Liabilities, the period end daily variation margin is included in receivable or payable for daily variation margin on futures contracts, and the net cumulative appreciation (depreciation) is included in Total accumulated earnings (loss).
Fidelity Freedom® Income Fund
| Statement of Assets and Liabilities |
| | | | September 30, 2022 (Unaudited) |
| | | | | |
| Assets | | | | |
| Investment in securities, at value - See accompanying schedule: | $ | | | |
Unaffiliated issuers (cost $1,359,721) | | $1,360,400 | | |
Fidelity Central Funds (cost $1,080,998) | | 1,081,004 | | |
Other affiliated issuers (cost $2,587,337,810) | | 2,403,620,345 | | |
| | | | | |
| Total Investment in Securities (cost $2,589,778,529) | | | $ | 2,406,061,749 |
| Receivable for investments sold | | | | 26,051,830 |
| Receivable for fund shares sold | | | | 972,737 |
| Distributions receivable from Fidelity Central Funds | | | | 4,221 |
Total assets | | | | 2,433,090,537 |
| Liabilities | | | | |
| Payable for investments purchased | | $18,865,954 | | |
| Payable for fund shares redeemed | | 7,753,188 | | |
| Accrued management fee | | 920,662 | | |
| Payable for daily variation margin on futures contracts | | 40,123 | | |
| Total Liabilities | | | | 27,579,927 |
| Net Assets | | | $ | 2,405,510,610 |
| Net Assets consist of: | | | | |
| Paid in capital | | | $ | 2,580,543,244 |
| Total accumulated earnings (loss) | | | | (175,032,634) |
| Net Assets | | | $ | 2,405,510,610 |
| | | | | |
| Net Asset Value and Maximum Offering Price | | | | |
| Fidelity Freedom Income Fund : | | | | |
Net Asset Value , offering price and redemption price per share ($1,537,126,731 ÷ 155,237,719 shares) | | | $ | 9.90 |
| Class K : | | | | |
Net Asset Value , offering price and redemption price per share ($610,943,559 ÷ 61,803,317 shares) | | | $ | 9.89 |
| Class K6 : | | | | |
Net Asset Value , offering price and redemption price per share ($257,440,320 ÷ 26,067,524 shares) | | | $ | 9.88 |
| Statement of Operations |
| | | | Six months ended September 30, 2022 (Unaudited) |
| Investment Income | | | | |
| Dividends: | | | | |
| Affiliated issuers | | | $ | 40,580,199 |
| Interest | | | | 11,618 |
| Income from Fidelity Central Funds | | | | 18,508 |
| Total Income | | | | 40,610,325 |
| Expenses | | | | |
| Management fee | $ | 5,859,948 | | |
| Independent trustees' fees and expenses | | 4,604 | | |
| Total expenses before reductions | | 5,864,552 | | |
| Expense reductions | | (54) | | |
| Total expenses after reductions | | | | 5,864,498 |
| Net Investment income (loss) | | | | 34,745,827 |
| Realized and Unrealized Gain (Loss) | | | | |
| Net realized gain (loss) on: | | | | |
| Investment Securities: | | | | |
| Unaffiliated issuers | | 60 | | |
| Affiliated issuers | | (11,732,659) | | |
| Futures contracts | | (467,316) | | |
| Capital gain distributions from underlying funds: | | | | |
| Affiliated issuers | | 5,709,351 | | |
| Total net realized gain (loss) | | | | (6,490,564) |
| Change in net unrealized appreciation (depreciation) on: | | | | |
| Investment Securities: | | | | |
| Unaffiliated issuers | | 693 | | |
| Fidelity Central Funds | | (1) | | |
| Other affiliated issuers | | (317,882,588) | | |
| Futures contracts | | (2,331,500) | | |
| Total change in net unrealized appreciation (depreciation) | | | | (320,213,396) |
| Net gain (loss) | | | | (326,703,960) |
| Net increase (decrease) in net assets resulting from operations | | | $ | (291,958,133) |
| Statement of Changes in Net Assets |
| |
| | Six months ended September 30, 2022 (Unaudited) | | Year ended March 31, 2022 |
| Increase (Decrease) in Net Assets | | | | |
| Operations | | | | |
| Net investment income (loss) | $ | 34,745,827 | $ | 75,116,031 |
| Net realized gain (loss) | | (6,490,564) | | 113,588,385 |
| Change in net unrealized appreciation (depreciation) | | (320,213,396) | | (201,907,191) |
| Net increase (decrease) in net assets resulting from operations | | (291,958,133) | | (13,202,775) |
| Distributions to shareholders | | (74,138,194) | | (189,462,492) |
| Share transactions - net increase (decrease) | | (134,780,272) | | (209,118,449) |
| Total increase (decrease) in net assets | | (500,876,599) | | (411,783,716) |
| | | | | |
| Net Assets | | | | |
| Beginning of period | | 2,906,387,209 | | 3,318,170,925 |
| End of period | $ | 2,405,510,610 | $ | 2,906,387,209 |
| | | | | |
| | | | | |
Financial Highlights
| Fidelity Freedom® Income Fund |
| |
| | Six months ended (Unaudited) September 30, 2022 | | Years ended March 31, 2022 | | 2021 | | 2020 | | 2019 | | 2018 |
Selected Per-Share Data | | | | | | | | | | | | |
| Net asset value, beginning of period | $ | 11.37 | $ | 12.16 | $ | 11.15 | $ | 11.44 | $ | 11.69 | $ | 11.57 |
| Income from Investment Operations | | | | | | | | | | | | |
Net investment income (loss) A,B | | .14 | | .28 | | .13 | | .22 | | .23 | | .18 |
| Net realized and unrealized gain (loss) | | (1.32) | | (.35) | | 1.40 | | (.09) | | .11 | | .38 |
| Total from investment operations | | (1.18) | | (.07) | | 1.53 | | .13 | | .34 | | .56 |
| Distributions from net investment income | | (.05) | | (.29) | | (.13) | | (.23) | | (.23) | | (.19) |
| Distributions from net realized gain | | (.24) | | (.44) | | (.39) | | (.20) | | (.36) | | (.25) |
| Total distributions | | (.29) | | (.72) C | | (.52) | | (.42) C | | (.59) | | (.44) |
| Net asset value, end of period | $ | 9.90 | $ | 11.37 | $ | 12.16 | $ | 11.15 | $ | 11.44 | $ | 11.69 |
Total Return D,E | | (10.50)% | | (.76)% | | 13.92% | | 1.05% | | 3.08% | | 4.86% |
Ratios to Average Net Assets B,F,G | | | | | | | | | | | | |
| Expenses before reductions | | .46% H,I | | .46% I | | .47% | | .47% | | .46% I | | .39% |
| Expenses net of fee waivers, if any | | .46% H,I | | .46% I | | .47% | | .47% | | .46% I | | .39% |
| Expenses net of all reductions | | .46% H,I | | .46% I | | .47% | | .47% | | .46% I | | .39% |
| Net investment income (loss) | | 2.59% H | | 2.34% | | 1.05% | | 1.90% | | 2.02% | | 1.57% |
| Supplemental Data | | | | | | | | | | | | |
| Net assets, end of period (000 omitted) | $ | 1,537,127 | $ | 1,851,042 | $ | 2,031,257 | $ | 1,839,153 | $ | 1,978,263 | $ | 2,111,741 |
Portfolio turnover rate J | | 23% H,K | | 36% | | 21% | | 17% | | 22% | | 17% L |
A Calculated based on average shares outstanding during the period.
B Net investment income (loss) is affected by the timing of the declaration of dividends by any underlying mutual funds or exchange-traded funds (ETFs). Net investment income (loss) of any such underlying funds is not included in the Fund's net investment income (loss) ratio.
C Total distributions per share do not sum due to rounding.
D Total returns for periods of less than one year are not annualized.
E Total returns would have been lower if certain expenses had not been reduced during the applicable periods shown.
F Fees and expenses of any underlying mutual funds or exchange-traded funds (ETFs) are not included in the Fund's expense ratio. The Fund indirectly bears its proportionate share of these expenses. For additional expense information related to investments in Fidelity Central Funds, please refer to the "Investments in Fidelity Central Funds" note found in the Notes to Financial Statements section of the most recent Annual or Semi-Annual report.
G Expense ratios reflect operating expenses of the class. Expenses before reductions do not reflect amounts reimbursed, waived, or reduced through arrangements with the investment adviser, brokerage services, or other offset arrangements, if applicable, and do not represent the amount paid by the class during periods when reimbursements, waivers or reductions occur.
H Annualized
I On certain classes, the size and fluctuation of net assets and expense amounts may cause ratios to differ from contractual rates.
J Amount does not include the portfolio activity of any underlying mutual funds or exchange-traded funds (ETFs).
K Portfolio turnover rate excludes securities received or delivered in-kind.
L The portfolio turnover rate does not include the assets acquired in the merger.
| Fidelity Freedom® Income Fund Class K |
| |
| | Six months ended (Unaudited) September 30, 2022 | | Years ended March 31, 2022 | | 2021 | | 2020 | | 2019 | | 2018 A |
Selected Per-Share Data | | | | | | | | | | | | |
| Net asset value, beginning of period | $ | 11.35 | $ | 12.14 | $ | 11.13 | $ | 11.42 | $ | 11.68 | $ | 11.76 |
| Income from Investment Operations | | | | | | | | | | | | |
Net investment income (loss) B,C | | .14 | | .29 | | .13 | | .23 | | .24 | | .19 |
| Net realized and unrealized gain (loss) | | (1.30) | | (.35) | | 1.41 | | (.09) | | .09 | | .05 |
| Total from investment operations | | (1.16) | | (.06) | | 1.54 | | .14 | | .33 | | .24 |
| Distributions from net investment income | | (.05) | | (.29) | | (.14) | | (.23) | | (.24) | | (.16) |
| Distributions from net realized gain | | (.24) | | (.44) | | (.39) | | (.20) | | (.36) | | (.17) |
| Total distributions | | (.30) D | | (.73) | | (.53) | | (.43) | | (.59) D | | (.32) D |
| Net asset value, end of period | $ | 9.89 | $ | 11.35 | $ | 12.14 | $ | 11.13 | $ | 11.42 | $ | 11.68 |
Total Return E,F | | (10.42)% | | (.72)% | | 14.02% | | 1.12% | | 3.04% | | 2.06% |
Ratios to Average Net Assets C,G,H | | | | | | | | | | | | |
| Expenses before reductions | | .41% I,J | | .41% J | | .41% | | .41% | | .41% J | | .42% I |
| Expenses net of fee waivers, if any | | .41% I,J | | .41% J | | .41% | | .41% | | .41% J | | .42% I |
| Expenses net of all reductions | | .41% I,J | | .41% J | | .41% | | .41% | | .41% J | | .42% I |
| Net investment income (loss) | | 2.64% I | | 2.39% | | 1.10% | | 1.95% | | 2.07% | | 2.32% I |
| Supplemental Data | | | | | | | | | | | | |
| Net assets, end of period (000 omitted) | $ | 610,944 | $ | 780,949 | $ | 1,043,133 | $ | 1,048,404 | $ | 1,236,535 | $ | 1,568,576 |
Portfolio turnover rate K | | 23% I,L | | 36% | | 21% | | 17% | | 22% | | 17% M |
A For the period July 20, 2017 (commencement of sale of shares) through March 31, 2018.
B Calculated based on average shares outstanding during the period.
C Net investment income (loss) is affected by the timing of the declaration of dividends by any underlying mutual funds or exchange-traded funds (ETFs). Net investment income (loss) of any such underlying funds is not included in the Fund's net investment income (loss) ratio.
D Total distributions per share do not sum due to rounding.
E Total returns for periods of less than one year are not annualized.
F Total returns would have been lower if certain expenses had not been reduced during the applicable periods shown.
G Fees and expenses of any underlying mutual funds or exchange-traded funds (ETFs) are not included in the Fund's expense ratio. The Fund indirectly bears its proportionate share of these expenses. For additional expense information related to investments in Fidelity Central Funds, please refer to the "Investments in Fidelity Central Funds" note found in the Notes to Financial Statements section of the most recent Annual or Semi-Annual report.
H Expense ratios reflect operating expenses of the class. Expenses before reductions do not reflect amounts reimbursed, waived, or reduced through arrangements with the investment adviser, brokerage services, or other offset arrangements, if applicable, and do not represent the amount paid by the class during periods when reimbursements, waivers or reductions occur.
I Annualized
J On certain classes, the size and fluctuation of net assets and expense amounts may cause ratios to differ from contractual rates.
K Amount does not include the portfolio activity of any underlying mutual funds or exchange-traded funds (ETFs).
L Portfolio turnover rate excludes securities received or delivered in-kind.
M The portfolio turnover rate does not include the assets acquired in the merger.
| Fidelity Freedom® Income Fund Class K6 |
| |
| | Six months ended (Unaudited) September 30, 2022 | | Years ended March 31, 2022 | | 2021 | | 2020 | | 2019 | | 2018 A |
Selected Per-Share Data | | | | | | | | | | | | |
| Net asset value, beginning of period | $ | 11.34 | $ | 12.13 | $ | 11.13 | $ | 11.42 | $ | 11.68 | $ | 11.68 |
| Income from Investment Operations | | | | | | | | | | | | |
Net investment income (loss) B,C | | .14 | | .29 | | .14 | | .23 | | .24 | | .18 |
| Net realized and unrealized gain (loss) | | (1.30) | | (.34) | | 1.40 | | (.08) | | .11 | | .15 |
| Total from investment operations | | (1.16) | | (.05) | | 1.54 | | .15 | | .35 | | .33 |
| Distributions from net investment income | | (.06) | | (.30) | | (.15) | | (.24) | | (.25) | | (.17) |
| Distributions from net realized gain | | (.24) | | (.44) | | (.39) | | (.20) | | (.36) | | (.17) |
| Total distributions | | (.30) | | (.74) | | (.54) | | (.44) | | (.61) | | (.33) D |
| Net asset value, end of period | $ | 9.88 | $ | 11.34 | $ | 12.13 | $ | 11.13 | $ | 11.42 | $ | 11.68 |
Total Return E,F | | (10.39)% | | (.64)% | | 13.97% | | 1.18% | | 3.16% | | 2.86% |
Ratios to Average Net Assets C,G,H | | | | | | | | | | | | |
| Expenses before reductions | | .36% I,J | | .37% | | .37% | | .37% | | .37% | | .37% I |
| Expenses net of fee waivers, if any | | .36% I,J | | .37% | | .37% | | .37% | | .37% | | .37% I |
| Expenses net of all reductions | | .36% I,J | | .37% | | .37% | | .37% | | .37% | | .37% I |
| Net investment income (loss) | | 2.69% I | | 2.44% | | 1.15% | | 2.00% | | 2.12% | | 1.91% I |
| Supplemental Data | | | | | | | | | | | | |
| Net assets, end of period (000 omitted) | $ | 257,440 | $ | 274,397 | $ | 243,781 | $ | 199,750 | $ | 167,422 | $ | 39,253 |
Portfolio turnover rate K | | 23% I,L | | 36% | | 21% | | 17% | | 22% | | 17% M |
A For the period June 7, 2017 (commencement of sale of shares) through March 31, 2018.
B Calculated based on average shares outstanding during the period.
C Net investment income (loss) is affected by the timing of the declaration of dividends by any underlying mutual funds or exchange-traded funds (ETFs). Net investment income (loss) of any such underlying funds is not included in the Fund's net investment income (loss) ratio.
D Total distributions per share do not sum due to rounding.
E Total returns for periods of less than one year are not annualized.
F Total returns would have been lower if certain expenses had not been reduced during the applicable periods shown.
G Fees and expenses of any underlying mutual funds or exchange-traded funds (ETFs) are not included in the Fund's expense ratio. The Fund indirectly bears its proportionate share of these expenses. For additional expense information related to investments in Fidelity Central Funds, please refer to the "Investments in Fidelity Central Funds" note found in the Notes to Financial Statements section of the most recent Annual or Semi-Annual report.
H Expense ratios reflect operating expenses of the class. Expenses before reductions do not reflect amounts reimbursed, waived, or reduced through arrangements with the investment adviser, brokerage services, or other offset arrangements, if applicable, and do not represent the amount paid by the class during periods when reimbursements, waivers or reductions occur.
I Annualized
J On certain classes, the size and fluctuation of net assets and expense amounts may cause ratios to differ from contractual rates.
K Amount does not include the portfolio activity of any underlying mutual funds or exchange-traded funds (ETFs).
L Portfolio turnover rate excludes securities received or delivered in-kind.
M The portfolio turnover rate does not include the assets acquired in the merger.
The information in the following table is based on the direct Investments of the Fund.
Top Holdings (% of Fund's net assets) |
| |
| Fidelity Series Investment Grade Bond Fund | 38.4 | |
| Fidelity Series 0-5 Year Inflation-Protected Bond Index Fund | 18.8 | |
| Fidelity Series Government Money Market Fund 3.00% | 8.2 | |
| Fidelity Series Emerging Markets Opportunities Fund | 5.8 | |
| Fidelity Series International Developed Markets Bond Index Fund | 4.0 | |
| Fidelity Series Long-Term Treasury Bond Index Fund | 3.7 | |
| Fidelity Series Overseas Fund | 2.1 | |
| Fidelity Series International Value Fund | 2.1 | |
| Fidelity Series International Growth Fund | 2.1 | |
| Fidelity Series Short-Term Credit Fund | 2.0 | |
| | 87.2 | |
| |
Domestic Equity Funds category includes Fidelity Series Commodity Strategy Fund which invests in commodity-related investments.
Asset Allocation (% of Fund's net assets) |
|
Percentages shown as 0.0% may reflect amounts less than 0.05%. |
|
Fidelity Freedom® 2005 Fund
Showing Percentage of Net Assets
| U.S. Treasury Obligations - 0.1% |
| | | Principal Amount (a) | Value ($) |
U.S. Treasury Bills, yield at date of purchase 3.15% to 3.29% 12/15/22 to 12/29/22 (b) (Cost $426,786) | | 430,000 | 427,004 |
| | | | |
| Domestic Equity Funds - 8.5% |
| | | Shares | Value ($) |
| Fidelity Series All-Sector Equity Fund (c) | | 243,493 | 2,089,166 |
| Fidelity Series Blue Chip Growth Fund (c) | | 497,481 | 4,994,713 |
| Fidelity Series Commodity Strategy Fund (c) | | 4,367,468 | 9,128,009 |
| Fidelity Series Growth Company Fund (c) | | 729,859 | 9,794,712 |
| Fidelity Series Intrinsic Opportunities Fund (c) | | 317,864 | 4,183,086 |
| Fidelity Series Large Cap Stock Fund (c) | | 629,200 | 9,293,290 |
| Fidelity Series Large Cap Value Index Fund (c) | | 239,736 | 3,049,442 |
| Fidelity Series Opportunistic Insights Fund (c) | | 399,593 | 5,678,218 |
| Fidelity Series Small Cap Discovery Fund (c) | | 101,704 | 953,980 |
| Fidelity Series Small Cap Opportunities Fund (c) | | 294,844 | 3,178,417 |
| Fidelity Series Stock Selector Large Cap Value Fund (c) | | 604,159 | 6,748,455 |
| Fidelity Series Value Discovery Fund (c) | | 380,806 | 5,243,705 |
| TOTAL DOMESTIC EQUITY FUNDS (Cost $61,250,295) | | | 64,335,193 |
| | | | |
| International Equity Funds - 14.1% |
| | | Shares | Value ($) |
| Fidelity Series Canada Fund (c) | | 555,401 | 6,886,968 |
| Fidelity Series Emerging Markets Fund (c) | | 641,960 | 4,647,787 |
| Fidelity Series Emerging Markets Opportunities Fund (c) | | 3,021,279 | 43,868,973 |
| Fidelity Series International Growth Fund (c) | | 1,242,304 | 15,926,336 |
| Fidelity Series International Small Cap Fund (c) | | 303,492 | 4,151,764 |
| Fidelity Series International Value Fund (c) | | 1,860,989 | 15,985,892 |
| Fidelity Series Overseas Fund (c) | | 1,686,784 | 16,075,055 |
| TOTAL INTERNATIONAL EQUITY FUNDS (Cost $110,713,780) | | | 107,542,775 |
| | | | |
| Bond Funds - 67.1% |
| | | Shares | Value ($) |
| Fidelity Series 0-5 Year Inflation-Protected Bond Index Fund (c) | | 14,859,820 | 143,397,262 |
| Fidelity Series 5+ Year Inflation-Protected Bond Index Fund (c) | | 581,377 | 4,645,202 |
| Fidelity Series Emerging Markets Debt Fund (c) | | 564,984 | 3,875,788 |
| Fidelity Series Emerging Markets Debt Local Currency Fund (c) | | 159,089 | 1,267,942 |
| Fidelity Series Floating Rate High Income Fund (c) | | 90,887 | 790,719 |
| Fidelity Series High Income Fund (c) | | 521,926 | 4,112,777 |
| Fidelity Series International Credit Fund (c) | | 63,925 | 503,091 |
| Fidelity Series International Developed Markets Bond Index Fund (c) | | 3,572,946 | 30,441,496 |
| Fidelity Series Investment Grade Bond Fund (c) | | 29,897,937 | 291,803,863 |
| Fidelity Series Long-Term Treasury Bond Index Fund (c) | | 4,682,561 | 27,954,891 |
| Fidelity Series Real Estate Income Fund (c) | | 204,814 | 1,949,827 |
| TOTAL BOND FUNDS (Cost $580,250,298) | | | 510,742,858 |
| | | | |
| Short-Term Funds - 10.2% |
| | | Shares | Value ($) |
| Fidelity Cash Central Fund 3.10% (d) | | 227,705 | 227,750 |
| Fidelity Series Government Money Market Fund 3.00% (c)(e) | | 62,214,809 | 62,214,809 |
| Fidelity Series Short-Term Credit Fund (c) | | 1,598,088 | 15,149,870 |
| TOTAL SHORT-TERM FUNDS (Cost $78,315,188) | | | 77,592,429 |
| | | | |
| TOTAL INVESTMENT IN SECURITIES - 100.0% (Cost $830,956,347) | 760,640,259 |
NET OTHER ASSETS (LIABILITIES) - 0.0% | (25,688) |
| NET ASSETS - 100.0% | 760,614,571 |
| | |
| Futures Contracts |
| | Number of contracts | Expiration Date | Notional Amount ($) | Value ($) | Unrealized Appreciation/ (Depreciation) ($) |
| Purchased | | | | | |
| | | | | | |
| Treasury Contracts | | | | | |
| CBOT 10-Year U.S. Treasury Note Contracts (United States) | 124 | Dec 2022 | 13,895,750 | (851,146) | (851,146) |
| CBOT Ultra Long Term U.S. Treasury Bond Contracts (United States) | 12 | Dec 2022 | 1,644,000 | (20,331) | (20,331) |
| | | | | | |
| TOTAL PURCHASED | | | | | (871,477) |
| | | | | | |
| Sold | | | | | |
| | | | | | |
| Equity Index Contracts | | | | | |
| CME E-mini S&P 500 Index Contracts (United States) | 18 | Dec 2022 | 3,241,350 | 82,700 | 82,700 |
| ICE E-mini MSCI EAFE Index Contracts (United States) | 30 | Dec 2022 | 2,490,900 | 257,805 | 257,805 |
| ICE E-mini MSCI Emerging Markets Index Contracts (United States) | 23 | Dec 2022 | 1,002,225 | 539 | 539 |
| | | | | | |
| TOTAL SOLD | | | | | 341,044 |
| | | | | | |
| TOTAL FUTURES CONTRACTS | | | | | (530,433) |
| The notional amount of futures purchased as a percentage of Net Assets is 2.0% |
| The notional amount of futures sold as a percentage of Net Assets is 0.8% |
Legend
| (a) | Amount is stated in United States dollars unless otherwise noted. |
| (b) | Security or a portion of the security was pledged to cover margin requirements for futures contracts. At period end, the value of securities pledged amounted to $427,004. |
| (d) | Affiliated fund that is generally available only to investment companies and other accounts managed by Fidelity Investments. The rate quoted is the annualized seven-day yield of the fund at period end. A complete unaudited listing of the fund's holdings as of its most recent quarter end is available upon request. In addition, each Fidelity Central Fund's financial statements are available on the SEC's website or upon request. |
| (e) | The rate quoted is the annualized seven-day yield of the fund at period end. |
Affiliated Central Funds
Fiscal year to date information regarding the Fund's investments in Fidelity Central Funds, including the ownership percentage, is presented below.
| Affiliate | Value, beginning of period ($) | Purchases ($) | Sales Proceeds ($) | Dividend Income ($) | Realized Gain (loss) ($) | Change in Unrealized appreciation (depreciation) ($) | Value, end of period ($) | %ownership, end of period |
| Fidelity Cash Central Fund 3.10% | 363,706 | 4,227,102 | 4,363,058 | 5,034 | - | - | 227,750 | 0.0% |
| Total | 363,706 | 4,227,102 | 4,363,058 | 5,034 | - | - | 227,750 | |
| | | | | | | | | |
Amounts in the income column in the above table include any capital gain distributions from underlying funds, which are presented in the corresponding line item in the Statement of Operations, if applicable.
Affiliated Underlying Funds
Fiscal year to date information regarding the Fund's investments in affiliated Underlying Funds is presented below. Exchanges between classes of the same affiliated Underlying Funds may occur. If an Underlying Funds changes its name, the name presented below is the name in effect at period end.
| Affiliate | Value, beginning of period ($) | Purchases ($) | Sales Proceeds ($) | Dividend Income ($) | Realized Gain (loss) ($) | Change in Unrealized appreciation (depreciation) ($) | Value, end of period ($) |
| Fidelity Series 0-5 Year Inflation-Protected Bond Index Fund | 135,536,804 | 32,564,092 | 18,798,261 | - | (318,451) | (5,586,922) | 143,397,262 |
| Fidelity Series 5+ Year Inflation-Protected Bond Index Fund | 6,690,790 | 6,916,018 | 7,897,883 | - | (467,623) | (596,100) | 4,645,202 |
| Fidelity Series All-Sector Equity Fund | 2,915,792 | 126,239 | 391,243 | - | (37,095) | (524,527) | 2,089,166 |
| Fidelity Series Blue Chip Growth Fund | 4,789,252 | 2,735,313 | 938,261 | 166,831 | (138,043) | (1,453,548) | 4,994,713 |
| Fidelity Series Canada Fund | 8,837,313 | 507,356 | 729,768 | - | 4,733 | (1,732,666) | 6,886,968 |
| Fidelity Series Commodity Strategy Fund | 13,741,976 | 7,413,792 | 4,491,007 | 6,438,831 | (898,575) | (6,638,177) | 9,128,009 |
| Fidelity Series Emerging Markets Debt Fund | 4,719,375 | 353,808 | 417,918 | 117,765 | (98,539) | (680,938) | 3,875,788 |
| Fidelity Series Emerging Markets Debt Local Currency Fund | 1,568,618 | 11,603 | 138,097 | - | (25,582) | (148,600) | 1,267,942 |
| Fidelity Series Emerging Markets Fund | 5,896,823 | 553,542 | 501,161 | - | (32,323) | (1,269,094) | 4,647,787 |
| Fidelity Series Emerging Markets Opportunities Fund | 53,126,445 | 6,513,014 | 4,508,607 | - | (348,490) | (10,913,389) | 43,868,973 |
| Fidelity Series Floating Rate High Income Fund | 940,974 | 29,519 | 133,402 | 22,692 | (13,130) | (33,242) | 790,719 |
| Fidelity Series Government Money Market Fund 3.00% | 87,525,442 | 3,140,839 | 28,451,472 | 443,425 | - | - | 62,214,809 |
| Fidelity Series Growth Company Fund | 11,934,245 | 2,698,309 | 1,659,089 | - | (208,507) | (2,970,246) | 9,794,712 |
| Fidelity Series High Income Fund | 5,573,379 | 165,413 | 946,463 | 129,942 | (72,220) | (607,332) | 4,112,777 |
| Fidelity Series Inflation-Protected Bond Index Fund | 17,694,190 | 105,393 | 17,480,525 | 87,571 | 453,771 | (772,829) | - |
| Fidelity Series International Credit Fund | 583,824 | 7,972 | 348 | 7,971 | (8) | (88,349) | 503,091 |
| Fidelity Series International Developed Markets Bond Index Fund | 28,580,774 | 7,592,062 | 2,962,006 | 46,753 | (165,572) | (2,603,762) | 30,441,496 |
| Fidelity Series International Growth Fund | 20,171,385 | 2,705,217 | 2,423,639 | - | (281,833) | (4,244,794) | 15,926,336 |
| Fidelity Series International Small Cap Fund | 5,530,790 | 431,694 | 535,736 | - | (130,721) | (1,144,263) | 4,151,764 |
| Fidelity Series International Value Fund | 20,376,457 | 2,215,028 | 2,233,877 | - | (166,348) | (4,205,368) | 15,985,892 |
| Fidelity Series Intrinsic Opportunities Fund | 11,613,800 | 1,291,641 | 6,521,196 | 1,232,654 | 2,384,909 | (4,586,068) | 4,183,086 |
| Fidelity Series Investment Grade Bond Fund | 359,246,365 | 10,036,495 | 41,400,532 | 4,658,898 | (3,812,938) | (32,265,527) | 291,803,863 |
| Fidelity Series Large Cap Stock Fund | 10,613,894 | 3,068,655 | 1,931,747 | 548,232 | 31,576 | (2,489,088) | 9,293,290 |
| Fidelity Series Large Cap Value Index Fund | 3,994,232 | 290,554 | 596,325 | - | 113,076 | (752,095) | 3,049,442 |
| Fidelity Series Long-Term Treasury Bond Index Fund | 34,621,461 | 4,099,628 | 3,183,845 | 401,109 | (288,476) | (7,293,877) | 27,954,891 |
| Fidelity Series Opportunistic Insights Fund | 6,113,361 | 1,951,753 | 984,953 | - | (146,568) | (1,255,375) | 5,678,218 |
| Fidelity Series Overseas Fund | 20,284,401 | 2,881,570 | 2,102,677 | - | (209,832) | (4,778,407) | 16,075,055 |
| Fidelity Series Real Estate Income Fund | 3,394,488 | 169,531 | 1,168,943 | 148,483 | 59,486 | (504,735) | 1,949,827 |
| Fidelity Series Short-Term Credit Fund | 21,922,817 | 473,299 | 6,764,079 | 137,612 | (220,601) | (261,566) | 15,149,870 |
| Fidelity Series Small Cap Discovery Fund | 1,316,515 | 229,590 | 208,668 | 142,009 | 13,367 | (396,824) | 953,980 |
| Fidelity Series Small Cap Opportunities Fund | 4,319,120 | 391,239 | 681,738 | 147,251 | (64,406) | (785,798) | 3,178,417 |
| Fidelity Series Stock Selector Large Cap Value Fund | 8,939,336 | 744,991 | 1,482,745 | - | 149,241 | (1,602,368) | 6,748,455 |
| Fidelity Series Value Discovery Fund | 6,800,190 | 377,959 | 1,056,805 | - | 243,205 | (1,120,844) | 5,243,705 |
| | 929,914,628 | 102,793,128 | 163,723,016 | 14,878,029 | (4,692,517) | (104,306,718) | 759,985,505 |
Amounts in the income column in the above table include any capital gain distributions from underlying funds, which are presented in the corresponding line item in the Statement of Operations, if applicable.
Purchases and Sales Proceeds in the table above include the value of shares purchased or redeemed through in-kind transactions, if applicable.
Investment Valuation
The following is a summary of the inputs used, as of September 30, 2022, involving the Fund's assets and liabilities carried at fair value. The inputs or methodology used for valuing securities may not be an indication of the risk associated with investing in those securities. For more information on valuation inputs, and their aggregation into the levels used below, please refer to the Investment Valuation section in the accompanying Notes to Financial Statements.
| Valuation Inputs at Reporting Date: |
| Description | Total ($) | Level 1 ($) | Level 2 ($) | Level 3 ($) |
Investments in Securities: | | | | |
|
| Other Short-Term Investments | 427,004 | - | 427,004 | - |
|
| Domestic Equity Funds | 64,335,193 | 64,335,193 | - | - |
|
| International Equity Funds | 107,542,775 | 107,542,775 | - | - |
|
| Bond Funds | 510,742,858 | 510,742,858 | - | - |
|
| Short-Term Funds | 77,592,429 | 77,592,429 | - | - |
| Total Investments in Securities: | 760,640,259 | 760,213,255 | 427,004 | - |
Derivative Instruments: | | | | |
|
| Assets | | | | |
Futures Contracts | 341,044 | 341,044 | - | - |
| Total Assets | 341,044 | 341,044 | - | - |
|
| Liabilities | | | | |
Futures Contracts | (871,477) | (871,477) | - | - |
| Total Liabilities | (871,477) | (871,477) | - | - |
| Total Derivative Instruments: | (530,433) | (530,433) | - | - |
Value of Derivative Instruments
The following table is a summary of the Fund's value of derivative instruments by primary risk exposure as of September 30, 2022. For additional information on derivative instruments, please refer to the Derivative Instruments section in the accompanying Notes to Financial Statements.
Primary Risk Exposure / Derivative Type | Value |
| Asset ($) | Liability ($) |
| Equity Risk | | |
Futures Contracts (a) | 341,044 | 0 |
| Total Equity Risk | 341,044 | 0 |
| Interest Rate Risk | | |
Futures Contracts (a) | 0 | (871,477) |
| Total Interest Rate Risk | 0 | (871,477) |
| Total Value of Derivatives | 341,044 | (871,477) |
(a)Reflects gross cumulative appreciation (depreciation) on futures contracts as presented in the Schedule of Investments. In the Statement of Assets and Liabilities, the period end daily variation margin is included in receivable or payable for daily variation margin on futures contracts, and the net cumulative appreciation (depreciation) is included in Total accumulated earnings (loss).
Fidelity Freedom® 2005 Fund
| Statement of Assets and Liabilities |
| | | | September 30, 2022 (Unaudited) |
| | | | | |
| Assets | | | | |
| Investment in securities, at value - See accompanying schedule: | $ | | | |
Unaffiliated issuers (cost $426,786) | | $427,004 | | |
Fidelity Central Funds (cost $227,750) | | 227,750 | | |
Other affiliated issuers (cost $830,301,811) | | 759,985,505 | | |
| | | | | |
| Total Investment in Securities (cost $830,956,347) | | | $ | 760,640,259 |
| Receivable for investments sold | | | | 6,976,522 |
| Receivable for fund shares sold | | | | 1,157,582 |
| Distributions receivable from Fidelity Central Funds | | | | 1,084 |
Total assets | | | | 768,775,447 |
| Liabilities | | | | |
| Payable for investments purchased | | 5,452,655 | | |
| Payable for fund shares redeemed | | 2,405,692 | | |
| Accrued management fee | | 289,546 | | |
| Payable for daily variation margin on futures contracts | | 12,983 | | |
| Total Liabilities | | | | 8,160,876 |
| Net Assets | | | $ | 760,614,571 |
| Net Assets consist of: | | | | |
| Paid in capital | | | $ | 826,894,228 |
| Total accumulated earnings (loss) | | | | (66,279,657) |
| Net Assets | | | $ | 760,614,571 |
| | | | | |
| Net Asset Value and Maximum Offering Price | | | | |
| Fidelity Freedom 2005 Fund : | | | | |
Net Asset Value , offering price and redemption price per share ($448,637,143 ÷ 42,917,689 shares) | | | $ | 10.45 |
| Class K : | | | | |
Net Asset Value , offering price and redemption price per share ($221,341,342 ÷ 21,208,120 shares) | | | $ | 10.44 |
| Class K6 : | | | | |
Net Asset Value , offering price and redemption price per share ($90,636,086 ÷ 8,710,674 shares) | | | $ | 10.41 |
| Statement of Operations |
| | | | Six months ended September 30, 2022 (Unaudited) |
| Investment Income | | | | |
| Dividends: | | | | |
| Affiliated issuers | | | $ | 12,755,791 |
| Interest | | | | 3,645 |
| Income from Fidelity Central Funds | | | | 5,034 |
| Total Income | | | | 12,764,470 |
| Expenses | | | | |
| Management fee | $ | 1,846,904 | | |
| Independent trustees' fees and expenses | | 1,464 | | |
| Total expenses before reductions | | 1,848,368 | | |
| Expense reductions | | (70) | | |
| Total expenses after reductions | | | | 1,848,298 |
| Net Investment income (loss) | | | | 10,916,172 |
| Realized and Unrealized Gain (Loss) | | | | |
| Net realized gain (loss) on: | | | | |
| Investment Securities: | | | | |
| Affiliated issuers | | (4,692,517) | | |
| Futures contracts | | (200,910) | | |
| Capital gain distributions from underlying funds: | | | | |
| Affiliated issuers | | 2,122,238 | | |
| Total net realized gain (loss) | | | | (2,771,189) |
| Change in net unrealized appreciation (depreciation) on: | | | | |
| Investment Securities: | | | | |
| Unaffiliated issuers | | 220 | | |
| Affiliated issuers | | (104,306,718) | | |
| Futures contracts | | (742,715) | | |
| Total change in net unrealized appreciation (depreciation) | | | | (105,049,213) |
| Net gain (loss) | | | | (107,820,402) |
| Net increase (decrease) in net assets resulting from operations | | | $ | (96,904,230) |
| Statement of Changes in Net Assets |
| |
| | Six months ended September 30, 2022 (Unaudited) | | Year ended March 31, 2022 |
| Increase (Decrease) in Net Assets | | | | |
| Operations | | | | |
| Net investment income (loss) | $ | 10,916,172 | $ | 23,826,349 |
| Net realized gain (loss) | | (2,771,189) | | 45,652,007 |
| Change in net unrealized appreciation (depreciation) | | (105,049,213) | | (70,735,304) |
| Net increase (decrease) in net assets resulting from operations | | (96,904,230) | | (1,256,948) |
| Distributions to shareholders | | (24,015,311) | | (73,429,776) |
| Share transactions - net increase (decrease) | | (49,033,677) | | (73,013,845) |
| Total increase (decrease) in net assets | | (169,953,218) | | (147,700,569) |
| | | | | |
| Net Assets | | | | |
| Beginning of period | | 930,567,789 | | 1,078,268,358 |
| End of period | $ | 760,614,571 | $ | 930,567,789 |
| | | | | |
| | | | | |
Financial Highlights
| Fidelity Freedom® 2005 Fund |
| |
| | Six months ended (Unaudited) September 30, 2022 | | Years ended March 31, 2022 | | 2021 | | 2020 | | 2019 | | 2018 |
Selected Per-Share Data | | | | | | | | | | | | |
| Net asset value, beginning of period | $ | 12.07 | $ | 13.06 | $ | 11.68 | $ | 12.20 | $ | 12.50 | $ | 12.20 |
| Income from Investment Operations | | | | | | | | | | | | |
Net investment income (loss) A,B | | .14 | | .30 | | .14 | | .23 | | .24 | | .19 |
| Net realized and unrealized gain (loss) | | (1.44) | | (.33) | | 1.81 | | (.19) | | .11 | | .59 |
| Total from investment operations | | (1.30) | | (.03) | | 1.95 | | .04 | | .35 | | .78 |
| Distributions from net investment income | | (.02) | | (.31) | | (.15) | | (.24) | | (.24) | | (.18) |
| Distributions from net realized gain | | (.30) | | (.64) | | (.42) | | (.31) | | (.41) | | (.30) |
| Total distributions | | (.32) | | (.96) C | | (.57) | | (.56) C | | (.65) | | (.48) |
| Net asset value, end of period | $ | 10.45 | $ | 12.07 | $ | 13.06 | $ | 11.68 | $ | 12.20 | $ | 12.50 |
Total Return D,E | | (10.96)% | | (.53)% | | 16.89% | | .12% | | 3.03% | | 6.43% |
Ratios to Average Net Assets B,F,G | | | | | | | | | | | | |
| Expenses before reductions | | .47% H | | .47% | | .47% | | .47% | | .48% | | .41% |
| Expenses net of fee waivers, if any | | .47% H | | .47% | | .47% | | .47% | | .48% | | .41% |
| Expenses net of all reductions | | .47% H | | .47% | | .47% | | .47% | | .48% | | .41% |
| Net investment income (loss) | | 2.57% H | | 2.33% | | 1.07% | | 1.89% | | 1.98% | | 1.52% |
| Supplemental Data | | | | | | | | | | | | |
| Net assets, end of period (000 omitted) | $ | 448,637 | $ | 549,383 | $ | 629,098 | $ | 530,872 | $ | 563,036 | $ | 590,056 |
Portfolio turnover rate I | | 24% H,J | | 38% | | 27% | | 24% | | 26% | | 23% K |
A Calculated based on average shares outstanding during the period.
B Net investment income (loss) is affected by the timing of the declaration of dividends by any underlying mutual funds or exchange-traded funds (ETFs). Net investment income (loss) of any such underlying funds is not included in the Fund's net investment income (loss) ratio.
C Total distributions per share do not sum due to rounding.
D Total returns for periods of less than one year are not annualized.
E Total returns would have been lower if certain expenses had not been reduced during the applicable periods shown.
F Fees and expenses of any underlying mutual funds or exchange-traded funds (ETFs) are not included in the Fund's expense ratio. The Fund indirectly bears its proportionate share of these expenses. For additional expense information related to investments in Fidelity Central Funds, please refer to the "Investments in Fidelity Central Funds" note found in the Notes to Financial Statements section of the most recent Annual or Semi-Annual report.
G Expense ratios reflect operating expenses of the class. Expenses before reductions do not reflect amounts reimbursed, waived, or reduced through arrangements with the investment adviser, brokerage services, or other offset arrangements, if applicable, and do not represent the amount paid by the class during periods when reimbursements, waivers or reductions occur.
H Annualized
I Amount does not include the portfolio activity of any underlying mutual funds or exchange-traded funds (ETFs).
J Portfolio turnover rate excludes securities received or delivered in-kind.
K The portfolio turnover rate does not include the assets acquired in the merger.
| Fidelity Freedom® 2005 Fund Class K |
| |
| | Six months ended (Unaudited) September 30, 2022 | | Years ended March 31, 2022 | | 2021 | | 2020 | | 2019 | | 2018 A |
Selected Per-Share Data | | | | | | | | | | | | |
| Net asset value, beginning of period | $ | 12.05 | $ | 13.04 | $ | 11.66 | $ | 12.18 | $ | 12.49 | $ | 12.48 |
| Income from Investment Operations | | | | | | | | | | | | |
Net investment income (loss) B,C | | .15 | | .31 | | .14 | | .24 | | .25 | | .21 |
| Net realized and unrealized gain (loss) | | (1.44) | | (.34) | | 1.82 | | (.19) | | .10 | | .15 |
| Total from investment operations | | (1.29) | | (.03) | | 1.96 | | .05 | | .35 | | .36 |
| Distributions from net investment income | | (.02) | | (.32) | | (.16) | | (.25) | | (.24) | | (.16) |
| Distributions from net realized gain | | (.30) | | (.64) | | (.42) | | (.31) | | (.41) | | (.19) |
| Total distributions | | (.32) | | (.96) | | (.58) | | (.57) D | | (.66) D | | (.35) |
| Net asset value, end of period | $ | 10.44 | $ | 12.05 | $ | 13.04 | $ | 11.66 | $ | 12.18 | $ | 12.49 |
Total Return E,F | | (10.87)% | | (.49)% | | 16.99% | | .18% | | 3.00% | | 2.89% |
Ratios to Average Net Assets C,G,H | | | | | | | | | | | | |
| Expenses before reductions | | .42% I | | .41% | | .42% | | .42% | | .43% | | .44% I |
| Expenses net of fee waivers, if any | | .42% I | | .41% | | .42% | | .42% | | .43% | | .44% I |
| Expenses net of all reductions | | .42% I | | .41% | | .42% | | .42% | | .43% | | .44% I |
| Net investment income (loss) | | 2.62% I | | 2.38% | | 1.12% | | 1.94% | | 2.03% | | 2.37% I |
| Supplemental Data | | | | | | | | | | | | |
| Net assets, end of period (000 omitted) | $ | 221,341 | $ | 283,366 | $ | 356,835 | $ | 338,902 | $ | 357,174 | $ | 422,622 |
Portfolio turnover rate J | | 24% I,K | | 38% | | 27% | | 24% | | 26% | | 23% L |
A For the period July 20, 2017 (commencement of sale of shares) through March 31, 2018.
B Calculated based on average shares outstanding during the period.
C Net investment income (loss) is affected by the timing of the declaration of dividends by any underlying mutual funds or exchange-traded funds (ETFs). Net investment income (loss) of any such underlying funds is not included in the Fund's net investment income (loss) ratio.
D Total distributions per share do not sum due to rounding.
E Total returns for periods of less than one year are not annualized.
F Total returns would have been lower if certain expenses had not been reduced during the applicable periods shown.
G Fees and expenses of any underlying mutual funds or exchange-traded funds (ETFs) are not included in the Fund's expense ratio. The Fund indirectly bears its proportionate share of these expenses. For additional expense information related to investments in Fidelity Central Funds, please refer to the "Investments in Fidelity Central Funds" note found in the Notes to Financial Statements section of the most recent Annual or Semi-Annual report.
H Expense ratios reflect operating expenses of the class. Expenses before reductions do not reflect amounts reimbursed, waived, or reduced through arrangements with the investment adviser, brokerage services, or other offset arrangements, if applicable, and do not represent the amount paid by the class during periods when reimbursements, waivers or reductions occur.
I Annualized
J Amount does not include the portfolio activity of any underlying mutual funds or exchange-traded funds (ETFs).
K Portfolio turnover rate excludes securities received or delivered in-kind.
L The portfolio turnover rate does not include the assets acquired in the merger.
| Fidelity Freedom® 2005 Fund Class K6 |
| |
| | Six months ended (Unaudited) September 30, 2022 | | Years ended March 31, 2022 | | 2021 | | 2020 | | 2019 | | 2018 A |
Selected Per-Share Data | | | | | | | | | | | | |
| Net asset value, beginning of period | $ | 12.01 | $ | 13.01 | $ | 11.64 | $ | 12.17 | $ | 12.49 | $ | 12.36 |
| Income from Investment Operations | | | | | | | | | | | | |
Net investment income (loss) B,C | | .15 | | .31 | | .15 | | .25 | | .25 | | .20 |
| Net realized and unrealized gain (loss) | | (1.43) | | (.34) | | 1.81 | | (.20) | | .11 | | .29 |
| Total from investment operations | | (1.28) | | (.03) | | 1.96 | | .05 | | .36 | | .49 |
| Distributions from net investment income | | (.02) | | (.33) | | (.17) | | (.27) | | (.27) | | (.16) |
| Distributions from net realized gain | | (.30) | | (.64) | | (.42) | | (.31) | | (.41) | | (.19) |
| Total distributions | | (.32) | | (.97) | | (.59) | | (.58) | | (.68) | | (.36) D |
| Net asset value, end of period | $ | 10.41 | $ | 12.01 | $ | 13.01 | $ | 11.64 | $ | 12.17 | $ | 12.49 |
Total Return E,F | | (10.81)% | | (.48)% | | 17.02% | | .22% | | 3.15% | | 3.92% |
Ratios to Average Net Assets C,G,H | | | | | | | | | | | | |
| Expenses before reductions | | .37% I | | .37% | | .37% | | .37% | | .38% J | | .38% I |
| Expenses net of fee waivers, if any | | .37% I | | .37% | | .37% | | .37% | | .38% J | | .38% I |
| Expenses net of all reductions | | .37% I | | .37% | | .37% | | .37% | | .38% J | | .38% I |
| Net investment income (loss) | | 2.67% I | | 2.43% | | 1.17% | | 1.99% | | 2.08% | | 1.93% I |
| Supplemental Data | | | | | | | | | | | | |
| Net assets, end of period (000 omitted) | $ | 90,636 | $ | 97,818 | $ | 92,336 | $ | 68,546 | $ | 41,670 | $ | 9,983 |
Portfolio turnover rate K | | 24% I,L | | 38% | | 27% | | 24% | | 26% | | 23% M |
A For the period June 7, 2017 (commencement of sale of shares) through March 31, 2018.
B Calculated based on average shares outstanding during the period.
C Net investment income (loss) is affected by the timing of the declaration of dividends by any underlying mutual funds or exchange-traded funds (ETFs). Net investment income (loss) of any such underlying funds is not included in the Fund's net investment income (loss) ratio.
D Total distributions per share do not sum due to rounding.
E Total returns for periods of less than one year are not annualized.
F Total returns would have been lower if certain expenses had not been reduced during the applicable periods shown.
G Fees and expenses of any underlying mutual funds or exchange-traded funds (ETFs) are not included in the Fund's expense ratio. The Fund indirectly bears its proportionate share of these expenses. For additional expense information related to investments in Fidelity Central Funds, please refer to the "Investments in Fidelity Central Funds" note found in the Notes to Financial Statements section of the most recent Annual or Semi-Annual report.
H Expense ratios reflect operating expenses of the class. Expenses before reductions do not reflect amounts reimbursed, waived, or reduced through arrangements with the investment adviser, brokerage services, or other offset arrangements, if applicable, and do not represent the amount paid by the class during periods when reimbursements, waivers or reductions occur.
I Annualized
J On certain classes, the size and fluctuation of net assets and expense amounts may cause ratios to differ from contractual rates.
K Amount does not include the portfolio activity of any underlying mutual funds or exchange-traded funds (ETFs).
L Portfolio turnover rate excludes securities received or delivered in-kind.
M The portfolio turnover rate does not include the assets acquired in the merger.
The information in the following table is based on the direct Investments of the Fund.
Top Holdings (% of Fund's net assets) |
| |
| Fidelity Series Investment Grade Bond Fund | 34.8 | |
| Fidelity Series 0-5 Year Inflation-Protected Bond Index Fund | 13.3 | |
| Fidelity Series Emerging Markets Opportunities Fund | 6.7 | |
| Fidelity Series Government Money Market Fund 3.00% | 6.1 | |
| Fidelity Series International Developed Markets Bond Index Fund | 4.0 | |
| Fidelity Series Long-Term Treasury Bond Index Fund | 3.9 | |
| Fidelity Series 5+ Year Inflation-Protected Bond Index Fund | 3.1 | |
| Fidelity Series Overseas Fund | 2.8 | |
| Fidelity Series International Value Fund | 2.8 | |
| Fidelity Series International Growth Fund | 2.8 | |
| | 80.3 | |
| |
Domestic Equity Funds category includes Fidelity Series Commodity Strategy Fund which invests in commodity-related investments.
Asset Allocation (% of Fund's net assets) |
|
Percentages shown as 0.0% may reflect amounts less than 0.05%. |
|
Fidelity Freedom® 2010 Fund
Showing Percentage of Net Assets
| U.S. Treasury Obligations - 0.1% |
| | | Principal Amount (a) | Value ($) |
U.S. Treasury Bills, yield at date of purchase 2.32% to 3.29% 10/13/22 to 12/29/22 (b) (Cost $2,154,970) | | 2,170,000 | 2,155,966 |
| | | | |
| Domestic Equity Funds - 13.8% |
| | | Shares | Value ($) |
| Fidelity Series All-Sector Equity Fund (c) | | 2,143,808 | 18,393,876 |
| Fidelity Series Blue Chip Growth Fund (c) | | 4,379,683 | 43,972,016 |
| Fidelity Series Commodity Strategy Fund (c) | | 22,431,986 | 46,882,851 |
| Fidelity Series Growth Company Fund (c) | | 6,425,786 | 86,234,046 |
| Fidelity Series Intrinsic Opportunities Fund (c) | | 2,963,047 | 38,993,703 |
| Fidelity Series Large Cap Stock Fund (c) | | 5,539,647 | 81,820,592 |
| Fidelity Series Large Cap Value Index Fund (c) | | 2,110,864 | 26,850,191 |
| Fidelity Series Opportunistic Insights Fund (c) | | 3,518,166 | 49,993,132 |
| Fidelity Series Small Cap Discovery Fund (c) | | 895,511 | 8,399,890 |
| Fidelity Series Small Cap Opportunities Fund (c) | | 2,596,089 | 27,985,840 |
| Fidelity Series Stock Selector Large Cap Value Fund (c) | | 5,319,359 | 59,417,237 |
| Fidelity Series Value Discovery Fund (c) | | 3,352,817 | 46,168,288 |
| TOTAL DOMESTIC EQUITY FUNDS (Cost $492,349,355) | | | 535,111,662 |
| | | | |
| International Equity Funds - 17.7% |
| | | Shares | Value ($) |
| Fidelity Series Canada Fund (c) | | 3,768,399 | 46,728,148 |
| Fidelity Series Emerging Markets Fund (c) | | 3,862,629 | 27,965,437 |
| Fidelity Series Emerging Markets Opportunities Fund (c) | | 17,980,746 | 261,080,430 |
| Fidelity Series International Growth Fund (c) | | 8,403,765 | 107,736,270 |
| Fidelity Series International Small Cap Fund (c) | | 2,055,306 | 28,116,592 |
| Fidelity Series International Value Fund (c) | | 12,589,201 | 108,141,239 |
| Fidelity Series Overseas Fund (c) | | 11,410,993 | 108,746,764 |
| TOTAL INTERNATIONAL EQUITY FUNDS (Cost $685,452,766) | | | 688,514,880 |
| | | | |
| Bond Funds - 60.8% |
| | | Shares | Value ($) |
| Fidelity Series 0-5 Year Inflation-Protected Bond Index Fund (c) | | 53,364,721 | 514,969,553 |
| Fidelity Series 5+ Year Inflation-Protected Bond Index Fund (c) | | 15,190,559 | 121,372,569 |
| Fidelity Series Emerging Markets Debt Fund (c) | | 2,878,957 | 19,749,642 |
| Fidelity Series Emerging Markets Debt Local Currency Fund (c) | | 827,629 | 6,596,205 |
| Fidelity Series Floating Rate High Income Fund (c) | | 467,896 | 4,070,695 |
| Fidelity Series High Income Fund (c) | | 2,666,715 | 21,013,716 |
| Fidelity Series International Credit Fund (c) | �� | 429,755 | 3,382,174 |
| Fidelity Series International Developed Markets Bond Index Fund (c) | | 18,345,641 | 156,304,861 |
| Fidelity Series Investment Grade Bond Fund (c) | | 138,560,678 | 1,352,352,214 |
| Fidelity Series Long-Term Treasury Bond Index Fund (c) | | 25,451,932 | 151,948,031 |
| Fidelity Series Real Estate Income Fund (c) | | 1,046,215 | 9,959,962 |
| TOTAL BOND FUNDS (Cost $2,713,217,044) | | | 2,361,719,622 |
| | | | |
| Short-Term Funds - 7.6% |
| | | Shares | Value ($) |
| Fidelity Cash Central Fund 3.10% (d) | | 1,820,879 | 1,821,244 |
| Fidelity Series Government Money Market Fund 3.00% (c)(e) | | 236,198,981 | 236,198,981 |
| Fidelity Series Short-Term Credit Fund (c) | | 5,967,415 | 56,571,092 |
| TOTAL SHORT-TERM FUNDS (Cost $297,321,180) | | | 294,591,317 |
| | | | |
| TOTAL INVESTMENT IN SECURITIES - 100.0% (Cost $4,190,495,315) | 3,882,093,447 |
NET OTHER ASSETS (LIABILITIES) - 0.0% | (155,374) |
| NET ASSETS - 100.0% | 3,881,938,073 |
| | |
| Futures Contracts |
| | Number of contracts | Expiration Date | Notional Amount ($) | Value ($) | Unrealized Appreciation/ (Depreciation) ($) |
| Purchased | | | | | |
| | | | | | |
| Treasury Contracts | | | | | |
| CBOT 10-Year U.S. Treasury Note Contracts (United States) | 631 | Dec 2022 | 70,711,438 | (4,325,891) | (4,325,891) |
| CBOT Ultra Long Term U.S. Treasury Bond Contracts (United States) | 59 | Dec 2022 | 8,083,000 | (101,956) | (101,956) |
| | | | | | |
| TOTAL PURCHASED | | | | | (4,427,847) |
| | | | | | |
| Sold | | | | | |
| | | | | | |
| Equity Index Contracts | | | | | |
| CME E-mini S&P 500 Index Contracts (United States) | 83 | Dec 2022 | 14,946,225 | 371,705 | 371,705 |
| ICE E-mini MSCI EAFE Index Contracts (United States) | 166 | Dec 2022 | 13,782,980 | 1,508,030 | 1,508,030 |
| ICE E-mini MSCI Emerging Markets Index Contracts (United States) | 133 | Dec 2022 | 5,795,475 | 3,117 | 3,117 |
| | | | | | |
| TOTAL SOLD | | | | | 1,882,852 |
| | | | | | |
| TOTAL FUTURES CONTRACTS | | | | | (2,544,995) |
| The notional amount of futures purchased as a percentage of Net Assets is 2.0% |
| The notional amount of futures sold as a percentage of Net Assets is 0.9% |
Legend
| (a) | Amount is stated in United States dollars unless otherwise noted. |
| (b) | Security or a portion of the security was pledged to cover margin requirements for futures contracts. At period end, the value of securities pledged amounted to $2,155,966. |
| (d) | Affiliated fund that is generally available only to investment companies and other accounts managed by Fidelity Investments. The rate quoted is the annualized seven-day yield of the fund at period end. A complete unaudited listing of the fund's holdings as of its most recent quarter end is available upon request. In addition, each Fidelity Central Fund's financial statements are available on the SEC's website or upon request. |
| (e) | The rate quoted is the annualized seven-day yield of the fund at period end. |
Affiliated Central Funds
Fiscal year to date information regarding the Fund's investments in Fidelity Central Funds, including the ownership percentage, is presented below.
| Affiliate | Value, beginning of period ($) | Purchases ($) | Sales Proceeds ($) | Dividend Income ($) | Realized Gain (loss) ($) | Change in Unrealized appreciation (depreciation) ($) | Value, end of period ($) | %ownership, end of period |
| Fidelity Cash Central Fund 3.10% | 2,322,409 | 23,816,353 | 24,317,518 | 28,585 | - | - | 1,821,244 | 0.0% |
| Total | 2,322,409 | 23,816,353 | 24,317,518 | 28,585 | - | - | 1,821,244 | |
| | | | | | | | | |
Amounts in the income column in the above table include any capital gain distributions from underlying funds, which are presented in the corresponding line item in the Statement of Operations, if applicable.
Affiliated Underlying Funds
Fiscal year to date information regarding the Fund's investments in affiliated Underlying Funds is presented below. Exchanges between classes of the same affiliated Underlying Funds may occur. If an Underlying Funds changes its name, the name presented below is the name in effect at period end.
| Affiliate | Value, beginning of period ($) | Purchases ($) | Sales Proceeds ($) | Dividend Income ($) | Realized Gain (loss) ($) | Change in Unrealized appreciation (depreciation) ($) | Value, end of period ($) |
| Fidelity Series 0-5 Year Inflation-Protected Bond Index Fund | 486,049,066 | 116,519,622 | 66,265,241 | - | (1,296,111) | (20,037,783) | 514,969,553 |
| Fidelity Series 5+ Year Inflation-Protected Bond Index Fund | 136,039,987 | 30,269,006 | 20,587,653 | - | (1,938,342) | (22,410,429) | 121,372,569 |
| Fidelity Series All-Sector Equity Fund | 25,379,563 | 827,619 | 2,885,187 | - | (332,874) | (4,595,245) | 18,393,876 |
| Fidelity Series Blue Chip Growth Fund | 41,686,587 | 22,877,906 | 6,488,796 | 1,470,782 | (1,041,319) | (13,062,362) | 43,972,016 |
| Fidelity Series Canada Fund | 59,943,474 | 2,502,056 | 3,932,928 | - | 24,374 | (11,808,828) | 46,728,148 |
| Fidelity Series Commodity Strategy Fund | 71,231,816 | 37,097,640 | 22,615,733 | 33,144,791 | (5,341,604) | (33,489,268) | 46,882,851 |
| Fidelity Series Emerging Markets Debt Fund | 24,342,875 | 1,146,015 | 1,703,940 | 604,079 | (333,429) | (3,701,879) | 19,749,642 |
| Fidelity Series Emerging Markets Debt Local Currency Fund | 8,112,120 | 5,994 | 617,111 | - | (121,123) | (783,675) | 6,596,205 |
| Fidelity Series Emerging Markets Fund | 35,409,926 | 2,747,733 | 2,402,757 | - | (92,177) | (7,697,288) | 27,965,437 |
| Fidelity Series Emerging Markets Opportunities Fund | 319,040,360 | 31,980,513 | 22,412,410 | - | (2,560,353) | (64,967,680) | 261,080,430 |
| Fidelity Series Floating Rate High Income Fund | 4,877,760 | 121,140 | 687,363 | 117,611 | (69,479) | (171,363) | 4,070,695 |
| Fidelity Series Government Money Market Fund 3.00% | 339,130,442 | 15,420,542 | 118,352,003 | 1,659,936 | - | - | 236,198,981 |
| Fidelity Series Growth Company Fund | 103,861,204 | 22,173,987 | 11,652,255 | - | (1,468,235) | (26,680,655) | 86,234,046 |
| Fidelity Series High Income Fund | 28,892,048 | 694,136 | 5,047,270 | 675,074 | (512,465) | (3,012,733) | 21,013,716 |
| Fidelity Series Inflation-Protected Bond Index Fund | 77,340,890 | 459,345 | 76,340,878 | 449,738 | 1,969,307 | (3,428,664) | - |
| Fidelity Series International Credit Fund | 3,928,718 | 53,639 | 5,694 | 53,640 | (127) | (594,362) | 3,382,174 |
| Fidelity Series International Developed Markets Bond Index Fund | 147,234,284 | 37,029,672 | 13,695,788 | 240,994 | (854,986) | (13,408,321) | 156,304,861 |
| Fidelity Series International Growth Fund | 137,563,466 | 14,388,064 | 13,281,595 | - | (1,718,512) | (29,215,153) | 107,736,270 |
| Fidelity Series International Small Cap Fund | 38,045,891 | 1,688,772 | 2,841,862 | - | (774,804) | (8,001,405) | 28,116,592 |
| Fidelity Series International Value Fund | 138,952,756 | 12,267,088 | 13,221,851 | - | (668,289) | (29,188,465) | 108,141,239 |
| Fidelity Series Intrinsic Opportunities Fund | 99,326,020 | 10,993,095 | 51,680,971 | 10,969,207 | 20,094,017 | (39,738,458) | 38,993,703 |
| Fidelity Series Investment Grade Bond Fund | 1,690,965,140 | 42,562,812 | 211,846,712 | 21,853,814 | (19,368,321) | (149,960,705) | 1,352,352,214 |
| Fidelity Series Large Cap Stock Fund | 92,367,449 | 24,399,188 | 13,296,101 | 4,826,809 | 78,478 | (21,728,422) | 81,820,592 |
| Fidelity Series Large Cap Value Index Fund | 34,766,933 | 1,726,625 | 4,002,304 | - | 839,070 | (6,480,133) | 26,850,191 |
| Fidelity Series Long-Term Treasury Bond Index Fund | 188,692,115 | 20,566,180 | 15,798,784 | 2,200,551 | (1,562,651) | (39,948,829) | 151,948,031 |
| Fidelity Series Opportunistic Insights Fund | 53,214,540 | 15,824,387 | 6,667,839 | - | (968,427) | (11,409,529) | 49,993,132 |
| Fidelity Series Overseas Fund | 138,329,304 | 15,602,997 | 11,105,448 | - | (916,084) | (33,164,005) | 108,746,764 |
| Fidelity Series Real Estate Income Fund | 17,530,411 | 788,285 | 6,071,527 | 775,607 | 315,166 | (2,602,373) | 9,959,962 |
| Fidelity Series Short-Term Credit Fund | 84,944,631 | 1,881,952 | 28,433,976 | 518,689 | (847,965) | (973,550) | 56,571,092 |
| Fidelity Series Small Cap Discovery Fund | 11,457,958 | 1,807,932 | 1,490,505 | 1,247,578 | 82,302 | (3,457,797) | 8,399,890 |
| Fidelity Series Small Cap Opportunities Fund | 37,592,192 | 3,067,976 | 5,215,133 | 1,293,142 | (603,723) | (6,855,472) | 27,985,840 |
| Fidelity Series Stock Selector Large Cap Value Fund | 77,806,062 | 4,637,293 | 10,232,145 | - | 1,163,512 | (13,957,485) | 59,417,237 |
| Fidelity Series Value Discovery Fund | 59,188,328 | 2,078,291 | 7,365,832 | - | 1,887,319 | (9,619,818) | 46,168,288 |
| | 4,813,244,316 | 496,207,502 | 778,245,592 | 82,102,042 | (16,937,855) | (636,152,134) | 3,878,116,237 |
Amounts in the income column in the above table include any capital gain distributions from underlying funds, which are presented in the corresponding line item in the Statement of Operations, if applicable.
Purchases and Sales Proceeds in the table above include the value of shares purchased or redeemed through in-kind transactions, if applicable.
Investment Valuation
The following is a summary of the inputs used, as of September 30, 2022, involving the Fund's assets and liabilities carried at fair value. The inputs or methodology used for valuing securities may not be an indication of the risk associated with investing in those securities. For more information on valuation inputs, and their aggregation into the levels used below, please refer to the Investment Valuation section in the accompanying Notes to Financial Statements.
| Valuation Inputs at Reporting Date: |
| Description | Total ($) | Level 1 ($) | Level 2 ($) | Level 3 ($) |
Investments in Securities: | | | | |
|
| Other Short-Term Investments | 2,155,966 | - | 2,155,966 | - |
|
| Domestic Equity Funds | 535,111,662 | 535,111,662 | - | - |
|
| International Equity Funds | 688,514,880 | 688,514,880 | - | - |
|
| Bond Funds | 2,361,719,622 | 2,361,719,622 | - | - |
|
| Short-Term Funds | 294,591,317 | 294,591,317 | - | - |
| Total Investments in Securities: | 3,882,093,447 | 3,879,937,481 | 2,155,966 | - |
Derivative Instruments: | | | | |
|
| Assets | | | | |
Futures Contracts | 1,882,852 | 1,882,852 | - | - |
| Total Assets | 1,882,852 | 1,882,852 | - | - |
|
| Liabilities | | | | |
Futures Contracts | (4,427,847) | (4,427,847) | - | - |
| Total Liabilities | (4,427,847) | (4,427,847) | - | - |
| Total Derivative Instruments: | (2,544,995) | (2,544,995) | - | - |
Value of Derivative Instruments
The following table is a summary of the Fund's value of derivative instruments by primary risk exposure as of September 30, 2022. For additional information on derivative instruments, please refer to the Derivative Instruments section in the accompanying Notes to Financial Statements.
Primary Risk Exposure / Derivative Type | Value |
| Asset ($) | Liability ($) |
| Equity Risk | | |
Futures Contracts (a) | 1,882,852 | 0 |
| Total Equity Risk | 1,882,852 | 0 |
| Interest Rate Risk | | |
Futures Contracts (a) | 0 | (4,427,847) |
| Total Interest Rate Risk | 0 | (4,427,847) |
| Total Value of Derivatives | 1,882,852 | (4,427,847) |
(a)Reflects gross cumulative appreciation (depreciation) on futures contracts as presented in the Schedule of Investments. In the Statement of Assets and Liabilities, the period end daily variation margin is included in receivable or payable for daily variation margin on futures contracts, and the net cumulative appreciation (depreciation) is included in Total accumulated earnings (loss).
Fidelity Freedom® 2010 Fund
| Statement of Assets and Liabilities |
| | | | September 30, 2022 (Unaudited) |
| | | | | |
| Assets | | | | |
| Investment in securities, at value - See accompanying schedule: | $ | | | |
Unaffiliated issuers (cost $2,154,970) | | $2,155,966 | | |
Fidelity Central Funds (cost $1,821,128) | | 1,821,244 | | |
Other affiliated issuers (cost $4,186,519,217) | | 3,878,116,237 | | |
| | | | | |
| Total Investment in Securities (cost $4,190,495,315) | | | $ | 3,882,093,447 |
| Receivable for investments sold | | | | 40,351,132 |
| Receivable for fund shares sold | | | | 1,711,761 |
| Distributions receivable from Fidelity Central Funds | | | | 6,640 |
Total assets | | | | 3,924,162,980 |
| Liabilities | | | | |
| Payable for investments purchased | | 34,038,264 | | |
| Payable for fund shares redeemed | | 6,520,855 | | |
| Accrued management fee | | 1,593,375 | | |
| Payable for daily variation margin on futures contracts | | 72,413 | | |
| Total Liabilities | | | | 42,224,907 |
| Net Assets | | | $ | 3,881,938,073 |
| Net Assets consist of: | | | | |
| Paid in capital | | | $ | 4,155,725,854 |
| Total accumulated earnings (loss) | | | | (273,787,781) |
| Net Assets | | | $ | 3,881,938,073 |
| | | | | |
| Net Asset Value and Maximum Offering Price | | | | |
| Fidelity Freedom 2010 Fund : | | | | |
Net Asset Value , offering price and redemption price per share ($2,766,302,596 ÷ 219,370,635 shares) | | | $ | 12.61 |
| Class K : | | | | |
Net Asset Value , offering price and redemption price per share ($826,013,994 ÷ 65,512,662 shares) | | | $ | 12.61 |
| Class K6 : | | | | |
Net Asset Value , offering price and redemption price per share ($289,621,483 ÷ 23,080,568 shares) | | | $ | 12.55 |
| Statement of Operations |
| | | | Six months ended September 30, 2022 (Unaudited) |
| Investment Income | | | | |
| Dividends: | | | | |
| Affiliated issuers | | | $ | 63,561,054 |
| Interest | | | | 18,288 |
| Income from Fidelity Central Funds | | | | 28,585 |
| Total Income | | | | 63,607,927 |
| Expenses | | | | |
| Management fee | $ | 10,227,815 | | |
| Independent trustees' fees and expenses | | 7,580 | | |
| Total expenses before reductions | | 10,235,395 | | |
| Expense reductions | | (42) | | |
| Total expenses after reductions | | | | 10,235,353 |
| Net Investment income (loss) | | | | 53,372,574 |
| Realized and Unrealized Gain (Loss) | | | | |
| Net realized gain (loss) on: | | | | |
| Investment Securities: | | | | |
| Unaffiliated issuers | | 359 | | |
| Affiliated issuers | | (16,937,855) | | |
| Futures contracts | | (755,657) | | |
| Capital gain distributions from underlying funds: | | | | |
| Affiliated issuers | | 18,540,988 | | |
| Total net realized gain (loss) | | | | 847,835 |
| Change in net unrealized appreciation (depreciation) on: | | | | |
| Investment Securities: | | | | |
| Unaffiliated issuers | | 998 | | |
| Affiliated issuers | | (636,152,134) | | |
| Futures contracts | | (3,865,948) | | |
| Total change in net unrealized appreciation (depreciation) | | | | (640,017,084) |
| Net gain (loss) | | | | (639,169,249) |
| Net increase (decrease) in net assets resulting from operations | | | $ | (585,796,675) |
| Statement of Changes in Net Assets |
| |
| | Six months ended September 30, 2022 (Unaudited) | | Year ended March 31, 2022 |
| Increase (Decrease) in Net Assets | | | | |
| Operations | | | | |
| Net investment income (loss) | $ | 53,372,574 | $ | 124,926,533 |
| Net realized gain (loss) | | 847,835 | | 308,444,511 |
| Change in net unrealized appreciation (depreciation) | | (640,017,084) | | (416,399,783) |
| Net increase (decrease) in net assets resulting from operations | | (585,796,675) | | 16,971,261 |
| Distributions to shareholders | | (162,752,830) | | (472,366,663) |
| Share transactions - net increase (decrease) | | (186,434,434) | | (306,895,879) |
| Total increase (decrease) in net assets | | (934,983,939) | | (762,291,281) |
| | | | | |
| Net Assets | | | | |
| Beginning of period | | 4,816,922,012 | | 5,579,213,293 |
| End of period | $ | 3,881,938,073 | $ | 4,816,922,012 |
| | | | | |
| | | | | |
Financial Highlights
| Fidelity Freedom® 2010 Fund |
| |
| | Six months ended (Unaudited) September 30, 2022 | | Years ended March 31, 2022 | | 2021 | | 2020 | | 2019 | | 2018 |
Selected Per-Share Data | | | | | | | | | | | | |
| Net asset value, beginning of period | $ | 14.98 | $ | 16.42 | $ | 14.31 | $ | 15.35 | $ | 15.98 | $ | 15.56 |
| Income from Investment Operations | | | | | | | | | | | | |
Net investment income (loss) A,B | | .17 | | .38 | | .17 | | .29 | | .29 | | .24 |
| Net realized and unrealized gain (loss) | | (2.03) | | (.35) | | 2.92 | | (.43) | | .12 | | .95 |
| Total from investment operations | | (1.86) | | .03 | | 3.09 | | (.14) | | .41 | | 1.19 |
| Distributions from net investment income | | (.02) | | (.39) | | (.20) | | (.31) | | (.30) | | (.23) |
| Distributions from net realized gain | | (.50) | | (1.07) | | (.78) | | (.60) | | (.74) | | (.54) |
| Total distributions | | (.51) C | | (1.47) C | | (.98) | | (.90) C | | (1.04) | | (.77) |
| Net asset value, end of period | $ | 12.61 | $ | 14.98 | $ | 16.42 | $ | 14.31 | $ | 15.35 | $ | 15.98 |
Total Return D,E | | (12.65)% | | (.17)% | | 22.04% | | (1.25)% | | 2.89% | | 7.74% |
Ratios to Average Net Assets B,F,G | | | | | | | | | | | | |
| Expenses before reductions | | .49% H | | .50% | | .51% | | .52% | | .52% I | | .44% |
| Expenses net of fee waivers, if any | | .49% H | | .50% | | .51% | | .52% | | .52% I | | .44% |
| Expenses net of all reductions | | .49% H | | .50% | | .51% | | .52% | | .52% I | | .44% |
| Net investment income (loss) | | 2.44% H | | 2.32% | | 1.08% | | 1.84% | | 1.90% | | 1.47% |
| Supplemental Data | | | | | | | | | | | | |
| Net assets, end of period (000 omitted) | $ | 2,766,303 | $ | 3,401,089 | $ | 3,814,845 | $ | 3,284,758 | $ | 3,724,077 | $ | 4,038,370 |
Portfolio turnover rate J | | 23% H,K | | 34% | | 24% | | 18% | | 20% | | 19% L |
A Calculated based on average shares outstanding during the period.
B Net investment income (loss) is affected by the timing of the declaration of dividends by any underlying mutual funds or exchange-traded funds (ETFs). Net investment income (loss) of any such underlying funds is not included in the Fund's net investment income (loss) ratio.
C Total distributions per share do not sum due to rounding.
D Total returns for periods of less than one year are not annualized.
E Total returns would have been lower if certain expenses had not been reduced during the applicable periods shown.
F Fees and expenses of any underlying mutual funds or exchange-traded funds (ETFs) are not included in the Fund's expense ratio. The Fund indirectly bears its proportionate share of these expenses. For additional expense information related to investments in Fidelity Central Funds, please refer to the "Investments in Fidelity Central Funds" note found in the Notes to Financial Statements section of the most recent Annual or Semi-Annual report.
G Expense ratios reflect operating expenses of the class. Expenses before reductions do not reflect amounts reimbursed, waived, or reduced through arrangements with the investment adviser, brokerage services, or other offset arrangements, if applicable, and do not represent the amount paid by the class during periods when reimbursements, waivers or reductions occur.
H Annualized
I On certain classes, the size and fluctuation of net assets and expense amounts may cause ratios to differ from contractual rates.
J Amount does not include the portfolio activity of any underlying mutual funds or exchange-traded funds (ETFs).
K Portfolio turnover rate excludes securities received or delivered in-kind.
L The portfolio turnover rate does not include the assets acquired in the merger.
| Fidelity Freedom® 2010 Fund Class K |
| |
| | Six months ended (Unaudited) September 30, 2022 | | Years ended March 31, 2022 | | 2021 | | 2020 | | 2019 | | 2018 A |
Selected Per-Share Data | | | | | | | | | | | | |
| Net asset value, beginning of period | $ | 14.98 | $ | 16.41 | $ | 14.30 | $ | 15.34 | $ | 15.97 | $ | 15.96 |
| Income from Investment Operations | | | | | | | | | | | | |
Net investment income (loss) B,C | | .17 | | .39 | | .18 | | .30 | | .30 | | .27 |
| Net realized and unrealized gain (loss) | | (2.02) | | (.35) | | 2.92 | | (.43) | | .12 | | .31 |
| Total from investment operations | | (1.85) | | .04 | | 3.10 | | (.13) | | .42 | | .58 |
| Distributions from net investment income | | (.02) | | (.40) | | (.20) | | (.31) | | (.31) | | (.22) |
| Distributions from net realized gain | | (.50) | | (1.07) | | (.78) | | (.60) | | (.74) | | (.35) |
| Total distributions | | (.52) | | (1.47) | | (.99) D | | (.91) | | (1.05) | | (.57) |
| Net asset value, end of period | $ | 12.61 | $ | 14.98 | $ | 16.41 | $ | 14.30 | $ | 15.34 | $ | 15.97 |
Total Return E,F | | (12.64)% | | (.07)% | | 22.11% | | (1.21)% | | 2.95% | | 3.59% |
Ratios to Average Net Assets C,G,H | | | | | | | | | | | | |
| Expenses before reductions | | .44% I | | .44% | | .45% | | .45% | | .46% | | .47% I |
| Expenses net of fee waivers, if any | | .44% I | | .44% | | .45% | | .45% | | .46% | | .47% I |
| Expenses net of all reductions | | .44% I | | .44% | | .45% | | .45% | | .46% | | .47% I |
| Net investment income (loss) | | 2.49% I | | 2.38% | | 1.14% | | 1.91% | | 1.96% | | 2.42% I |
| Supplemental Data | | | | | | | | | | | | |
| Net assets, end of period (000 omitted) | $ | 826,014 | $ | 1,085,375 | $ | 1,444,009 | $ | 1,431,597 | $ | 1,909,779 | $ | 2,396,182 |
Portfolio turnover rate J | | 23% I,K | | 34% | | 24% | | 18% | | 20% | | 19% L |
A For the period July 20, 2017 (commencement of sale of shares) through March 31, 2018.
B Calculated based on average shares outstanding during the period.
C Net investment income (loss) is affected by the timing of the declaration of dividends by any underlying mutual funds or exchange-traded funds (ETFs). Net investment income (loss) of any such underlying funds is not included in the Fund's net investment income (loss) ratio.
D Total distributions per share do not sum due to rounding.
E Total returns for periods of less than one year are not annualized.
F Total returns would have been lower if certain expenses had not been reduced during the applicable periods shown.
G Fees and expenses of any underlying mutual funds or exchange-traded funds (ETFs) are not included in the Fund's expense ratio. The Fund indirectly bears its proportionate share of these expenses. For additional expense information related to investments in Fidelity Central Funds, please refer to the "Investments in Fidelity Central Funds" note found in the Notes to Financial Statements section of the most recent Annual or Semi-Annual report.
H Expense ratios reflect operating expenses of the class. Expenses before reductions do not reflect amounts reimbursed, waived, or reduced through arrangements with the investment adviser, brokerage services, or other offset arrangements, if applicable, and do not represent the amount paid by the class during periods when reimbursements, waivers or reductions occur.
I Annualized
J Amount does not include the portfolio activity of any underlying mutual funds or exchange-traded funds (ETFs).
K Portfolio turnover rate excludes securities received or delivered in-kind.
L The portfolio turnover rate does not include the assets acquired in the merger.
| Fidelity Freedom® 2010 Fund Class K6 |
| |
| | Six months ended (Unaudited) September 30, 2022 | | Years ended March 31, 2022 | | 2021 | | 2020 | | 2019 | | 2018 A |
Selected Per-Share Data | | | | | | | | | | | | |
| Net asset value, beginning of period | $ | 14.91 | $ | 16.35 | $ | 14.25 | $ | 15.30 | $ | 15.97 | $ | 15.77 |
| Income from Investment Operations | | | | | | | | | | | | |
Net investment income (loss) B,C | | .17 | | .39 | | .19 | | .30 | | .31 | | .27 |
| Net realized and unrealized gain (loss) | | (2.01) | | (.34) | | 2.91 | | (.42) | | .11 | | .50 |
| Total from investment operations | | (1.84) | | .05 | | 3.10 | | (.12) | | .42 | | .77 |
| Distributions from net investment income | | (.02) | | (.42) | | (.22) | | (.34) | | (.35) | | (.22) |
| Distributions from net realized gain | | (.50) | | (1.07) | | (.78) | | (.60) | | (.74) | | (.35) |
| Total distributions | | (.52) | | (1.49) | | (1.00) | | (.93) D | | (1.09) | | (.57) |
| Net asset value, end of period | $ | 12.55 | $ | 14.91 | $ | 16.35 | $ | 14.25 | $ | 15.30 | $ | 15.97 |
Total Return E,F | | (12.61)% | | (.02)% | | 22.23% | | (1.14)% | | 2.96% | | 4.89% |
Ratios to Average Net Assets C,G,H | | | | | | | | | | | | |
| Expenses before reductions | | .38% I | | .38% | | .38% | | .39% | | .39% | | .40% I |
| Expenses net of fee waivers, if any | | .38% I | | .38% | | .38% | | .39% | | .39% | | .40% I |
| Expenses net of all reductions | | .38% I | | .38% | | .38% | | .39% | | .39% | | .40% I |
| Net investment income (loss) | | 2.55% I | | 2.44% | | 1.20% | | 1.97% | | 2.03% | | 2.07% I |
| Supplemental Data | | | | | | | | | | | | |
| Net assets, end of period (000 omitted) | $ | 289,621 | $ | 330,459 | $ | 320,359 | $ | 257,400 | $ | 213,620 | $ | 59,797 |
Portfolio turnover rate J | | 23% I,K | | 34% | | 24% | | 18% | | 20% | | 19% L |
A For the period June 7, 2017 (commencement of sale of shares) through March 31, 2018.
B Calculated based on average shares outstanding during the period.
C Net investment income (loss) is affected by the timing of the declaration of dividends by any underlying mutual funds or exchange-traded funds (ETFs). Net investment income (loss) of any such underlying funds is not included in the Fund's net investment income (loss) ratio.
D Total distributions per share do not sum due to rounding.
E Total returns for periods of less than one year are not annualized.
F Total returns would have been lower if certain expenses had not been reduced during the applicable periods shown.
G Fees and expenses of any underlying mutual funds or exchange-traded funds (ETFs) are not included in the Fund's expense ratio. The Fund indirectly bears its proportionate share of these expenses. For additional expense information related to investments in Fidelity Central Funds, please refer to the "Investments in Fidelity Central Funds" note found in the Notes to Financial Statements section of the most recent Annual or Semi-Annual report.
H Expense ratios reflect operating expenses of the class. Expenses before reductions do not reflect amounts reimbursed, waived, or reduced through arrangements with the investment adviser, brokerage services, or other offset arrangements, if applicable, and do not represent the amount paid by the class during periods when reimbursements, waivers or reductions occur.
I Annualized
J Amount does not include the portfolio activity of any underlying mutual funds or exchange-traded funds (ETFs).
K Portfolio turnover rate excludes securities received or delivered in-kind.
L The portfolio turnover rate does not include the assets acquired in the merger.
The information in the following table is based on the direct Investments of the Fund.
Top Holdings (% of Fund's net assets) |
| |
| Fidelity Series Investment Grade Bond Fund | 31.3 | |
| Fidelity Series Emerging Markets Opportunities Fund | 7.7 | |
| Fidelity Series 0-5 Year Inflation-Protected Bond Index Fund | 7.7 | |
| Fidelity Series 5+ Year Inflation-Protected Bond Index Fund | 5.7 | |
| Fidelity Series Long-Term Treasury Bond Index Fund | 4.1 | |
| Fidelity Series International Developed Markets Bond Index Fund | 4.0 | |
| Fidelity Series Government Money Market Fund 3.00% | 3.8 | |
| Fidelity Series Overseas Fund | 3.5 | |
| Fidelity Series International Value Fund | 3.5 | |
| Fidelity Series International Growth Fund | 3.5 | |
| | 74.8 | |
| |
Domestic Equity Funds category includes Fidelity Series Commodity Strategy Fund which invests in commodity-related investments.
Asset Allocation (% of Fund's net assets) |
|
Percentages shown as 0.0% may reflect amounts less than 0.05%. |
|
Fidelity Freedom® 2015 Fund
Showing Percentage of Net Assets
| U.S. Treasury Obligations - 0.1% |
| | | Principal Amount (a) | Value ($) |
U.S. Treasury Bills, yield at date of purchase 2.32% to 3.29% 10/13/22 to 12/29/22 (b) (Cost $3,083,909) | | 3,100,000 | 3,084,890 |
| | | | |
| Domestic Equity Funds - 19.3% |
| | | Shares | Value ($) |
| Fidelity Series All-Sector Equity Fund (c) | | 4,414,442 | 37,875,908 |
| Fidelity Series Blue Chip Growth Fund (c) | | 9,017,863 | 90,539,346 |
| Fidelity Series Commodity Strategy Fund (c) | | 32,178,335 | 67,252,721 |
| Fidelity Series Growth Company Fund (c) | | 13,231,047 | 177,560,647 |
| Fidelity Series Intrinsic Opportunities Fund (c) | | 6,198,966 | 81,578,396 |
| Fidelity Series Large Cap Stock Fund (c) | | 11,406,855 | 168,479,244 |
| Fidelity Series Large Cap Value Index Fund (c) | | 4,346,579 | 55,288,491 |
| Fidelity Series Opportunistic Insights Fund (c) | | 7,244,340 | 102,942,078 |
| Fidelity Series Small Cap Discovery Fund (c) | | 1,843,995 | 17,296,677 |
| Fidelity Series Small Cap Opportunities Fund (c) | | 5,345,942 | 57,629,251 |
| Fidelity Series Stock Selector Large Cap Value Fund (c) | | 10,953,394 | 122,349,408 |
| Fidelity Series Value Discovery Fund (c) | | 6,904,054 | 95,068,819 |
| TOTAL DOMESTIC EQUITY FUNDS (Cost $973,866,343) | | | 1,073,860,986 |
| | | | |
| International Equity Funds - 21.4% |
| | | Shares | Value ($) |
| Fidelity Series Canada Fund (c) | | 6,793,180 | 84,235,427 |
| Fidelity Series Emerging Markets Fund (c) | | 6,371,756 | 46,131,515 |
| Fidelity Series Emerging Markets Opportunities Fund (c) | | 29,577,888 | 429,470,941 |
| Fidelity Series International Growth Fund (c) | | 15,132,917 | 194,003,995 |
| Fidelity Series International Small Cap Fund (c) | | 3,697,650 | 50,583,857 |
| Fidelity Series International Value Fund (c) | | 22,670,386 | 194,738,615 |
| Fidelity Series Overseas Fund (c) | | 20,549,404 | 195,835,816 |
| TOTAL INTERNATIONAL EQUITY FUNDS (Cost $1,173,369,427) | | | 1,195,000,166 |
| | | | |
| Bond Funds - 54.5% |
| | | Shares | Value ($) |
| Fidelity Series 0-5 Year Inflation-Protected Bond Index Fund (c) | | 44,315,172 | 427,641,407 |
| Fidelity Series 5+ Year Inflation-Protected Bond Index Fund (c) | | 39,902,050 | 318,817,380 |
| Fidelity Series Emerging Markets Debt Fund (c) | | 4,174,143 | 28,634,621 |
| Fidelity Series Emerging Markets Debt Local Currency Fund (c) | | 1,208,283 | 9,630,012 |
| Fidelity Series Floating Rate High Income Fund (c) | | 678,536 | 5,903,260 |
| Fidelity Series High Income Fund (c) | | 3,836,444 | 30,231,176 |
| Fidelity Series International Credit Fund (c) | | 654,120 | 5,147,925 |
| Fidelity Series International Developed Markets Bond Index Fund (c) | | 26,393,244 | 224,870,438 |
| Fidelity Series Investment Grade Bond Fund (c) | | 178,845,115 | 1,745,528,324 |
| Fidelity Series Long-Term Treasury Bond Index Fund (c) | | 38,810,523 | 231,698,821 |
| Fidelity Series Real Estate Income Fund (c) | | 1,505,581 | 14,333,129 |
| TOTAL BOND FUNDS (Cost $3,515,627,820) | | | 3,042,436,493 |
| | | | |
| Short-Term Funds - 4.7% |
| | | Shares | Value ($) |
| Fidelity Cash Central Fund 3.10% (d) | | 3,362,288 | 3,362,961 |
| Fidelity Series Government Money Market Fund 3.00% (c)(e) | | 213,089,402 | 213,089,402 |
| Fidelity Series Short-Term Credit Fund (c) | | 5,003,180 | 47,430,147 |
| TOTAL SHORT-TERM FUNDS (Cost $266,244,789) | | | 263,882,510 |
| | | | |
| TOTAL INVESTMENT IN SECURITIES - 100.0% (Cost $5,932,192,288) | 5,578,265,045 |
NET OTHER ASSETS (LIABILITIES) - 0.0% | (223,447) |
| NET ASSETS - 100.0% | 5,578,041,598 |
| | |
| Futures Contracts |
| | Number of contracts | Expiration Date | Notional Amount ($) | Value ($) | Unrealized Appreciation/ (Depreciation) ($) |
| Purchased | | | | | |
| | | | | | |
| Treasury Contracts | | | | | |
| CBOT 10-Year U.S. Treasury Note Contracts (United States) | 908 | Dec 2022 | 101,752,750 | (6,231,912) | (6,231,912) |
| CBOT Ultra Long Term U.S. Treasury Bond Contracts (United States) | 85 | Dec 2022 | 11,645,000 | (147,332) | (147,332) |
| | | | | | |
| TOTAL PURCHASED | | | | | (6,379,244) |
| | | | | | |
| Sold | | | | | |
| | | | | | |
| Equity Index Contracts | | | | | |
| CME E-mini S&P 500 Index Contracts (United States) | 121 | Dec 2022 | 21,789,075 | 448,328 | 448,328 |
| ICE E-mini MSCI EAFE Index Contracts (United States) | 279 | Dec 2022 | 23,165,370 | 2,659,270 | 2,659,270 |
| ICE E-mini MSCI Emerging Markets Index Contracts (United States) | 177 | Dec 2022 | 7,712,775 | 4,148 | 4,148 |
| | | | | | |
| TOTAL SOLD | | | | | 3,111,746 |
| | | | | | |
| TOTAL FUTURES CONTRACTS | | | | | (3,267,498) |
| The notional amount of futures purchased as a percentage of Net Assets is 2.0% |
| The notional amount of futures sold as a percentage of Net Assets is 0.9% |
Legend
| (a) | Amount is stated in United States dollars unless otherwise noted. |
| (b) | Security or a portion of the security was pledged to cover margin requirements for futures contracts. At period end, the value of securities pledged amounted to $3,084,890. |
| (d) | Affiliated fund that is generally available only to investment companies and other accounts managed by Fidelity Investments. The rate quoted is the annualized seven-day yield of the fund at period end. A complete unaudited listing of the fund's holdings as of its most recent quarter end is available upon request. In addition, each Fidelity Central Fund's financial statements are available on the SEC's website or upon request. |
| (e) | The rate quoted is the annualized seven-day yield of the fund at period end. |
Affiliated Central Funds
Fiscal year to date information regarding the Fund's investments in Fidelity Central Funds, including the ownership percentage, is presented below.
| Affiliate | Value, beginning of period ($) | Purchases ($) | Sales Proceeds ($) | Dividend Income ($) | Realized Gain (loss) ($) | Change in Unrealized appreciation (depreciation) ($) | Value, end of period ($) | %ownership, end of period |
| Fidelity Cash Central Fund 3.10% | 3,775,940 | 35,127,584 | 35,540,564 | 44,355 | - | 1 | 3,362,961 | 0.0% |
| Total | 3,775,940 | 35,127,584 | 35,540,564 | 44,355 | - | 1 | 3,362,961 | |
| | | | | | | | | |
Amounts in the income column in the above table include any capital gain distributions from underlying funds, which are presented in the corresponding line item in the Statement of Operations, if applicable.
Affiliated Underlying Funds
Fiscal year to date information regarding the Fund's investments in affiliated Underlying Funds is presented below. Exchanges between classes of the same affiliated Underlying Funds may occur. If an Underlying Funds changes its name, the name presented below is the name in effect at period end.
| Affiliate | Value, beginning of period ($) | Purchases ($) | Sales Proceeds ($) | Dividend Income ($) | Realized Gain (loss) ($) | Change in Unrealized appreciation (depreciation) ($) | Value, end of period ($) |
| Fidelity Series 0-5 Year Inflation-Protected Bond Index Fund | 403,622,833 | 103,272,101 | 61,508,740 | - | (1,149,841) | (16,594,946) | 427,641,407 |
| Fidelity Series 5+ Year Inflation-Protected Bond Index Fund | 348,333,155 | 81,950,716 | 48,334,466 | - | (4,789,831) | (58,342,194) | 318,817,380 |
| Fidelity Series All-Sector Equity Fund | 53,591,604 | 976,458 | 6,351,351 | - | (832,991) | (9,507,812) | 37,875,908 |
| Fidelity Series Blue Chip Growth Fund | 88,009,589 | 45,328,168 | 13,057,960 | 3,049,943 | (2,223,203) | (27,517,248) | 90,539,346 |
| Fidelity Series Canada Fund | 111,413,681 | 4,117,407 | 9,649,023 | - | 448,540 | (22,095,178) | 84,235,427 |
| Fidelity Series Commodity Strategy Fund | 106,409,323 | 53,160,538 | 35,956,500 | 48,097,023 | (7,745,813) | (48,614,827) | 67,252,721 |
| Fidelity Series Emerging Markets Debt Fund | 36,236,031 | 1,565,326 | 3,225,856 | 886,109 | (732,604) | (5,208,276) | 28,634,621 |
| Fidelity Series Emerging Markets Debt Local Currency Fund | 12,084,433 | 2,473 | 1,117,910 | - | (218,344) | (1,120,640) | 9,630,012 |
| Fidelity Series Emerging Markets Fund | 60,275,531 | 4,313,762 | 5,309,608 | - | (370,046) | (12,778,124) | 46,131,515 |
| Fidelity Series Emerging Markets Opportunities Fund | 543,107,325 | 45,043,628 | 45,477,331 | - | (5,704,675) | (107,498,006) | 429,470,941 |
| Fidelity Series Floating Rate High Income Fund | 7,286,212 | 173,698 | 1,200,209 | 172,239 | (127,592) | (228,849) | 5,903,260 |
| Fidelity Series Government Money Market Fund 3.00% | 326,177,576 | 26,592,966 | 139,681,140 | 1,427,487 | - | - | 213,089,402 |
| Fidelity Series Growth Company Fund | 219,311,620 | 41,247,831 | 23,723,775 | - | (2,498,602) | (56,776,427) | 177,560,647 |
| Fidelity Series High Income Fund | 43,519,997 | 1,005,493 | 9,081,369 | 997,574 | (972,790) | (4,240,155) | 30,231,176 |
| Fidelity Series Inflation-Protected Bond Index Fund | 96,196,107 | 678,396 | 94,953,717 | 673,176 | 2,424,195 | (4,344,981) | - |
| Fidelity Series International Credit Fund | 5,973,826 | 81,562 | 3,373 | 81,562 | (75) | (904,015) | 5,147,925 |
| Fidelity Series International Developed Markets Bond Index Fund | 220,849,536 | 51,123,778 | 26,112,105 | 356,118 | (1,858,624) | (19,132,147) | 224,870,438 |
| Fidelity Series International Growth Fund | 255,759,481 | 21,601,490 | 26,505,436 | - | (4,582,765) | (52,268,775) | 194,003,995 |
| Fidelity Series International Small Cap Fund | 70,761,452 | 1,600,569 | 5,603,036 | - | (1,673,121) | (14,502,007) | 50,583,857 |
| Fidelity Series International Value Fund | 258,333,603 | 18,520,627 | 27,379,799 | - | 42,810 | (54,778,626) | 194,738,615 |
| Fidelity Series Intrinsic Opportunities Fund | 209,183,146 | 22,870,360 | 109,267,597 | 22,820,942 | 42,008,482 | (83,215,995) | 81,578,396 |
| Fidelity Series Investment Grade Bond Fund | 2,268,373,481 | 64,591,242 | 363,627,874 | 28,741,966 | (35,844,456) | (187,964,069) | 1,745,528,324 |
| Fidelity Series Large Cap Stock Fund | 195,039,129 | 45,791,521 | 27,006,937 | 10,019,987 | 273,470 | (45,617,939) | 168,479,244 |
| Fidelity Series Large Cap Value Index Fund | 73,414,879 | 1,922,906 | 8,224,680 | - | 2,080,090 | (13,904,704) | 55,288,491 |
| Fidelity Series Long-Term Treasury Bond Index Fund | 295,971,520 | 30,622,512 | 30,434,127 | 3,408,807 | (3,113,371) | (61,347,713) | 231,698,821 |
| Fidelity Series Opportunistic Insights Fund | 112,370,035 | 30,199,247 | 13,569,309 | - | (1,977,961) | (24,079,934) | 102,942,078 |
| Fidelity Series Overseas Fund | 257,182,773 | 23,023,954 | 21,748,900 | - | (2,447,184) | (60,174,827) | 195,835,816 |
| Fidelity Series Real Estate Income Fund | 26,108,428 | 1,157,565 | 9,533,446 | 1,151,664 | 450,702 | (3,850,120) | 14,333,129 |
| Fidelity Series Short-Term Credit Fund | 81,709,941 | 1,644,756 | 34,321,570 | 454,616 | (1,073,934) | (529,046) | 47,430,147 |
| Fidelity Series Small Cap Discovery Fund | 24,194,354 | 3,383,996 | 3,214,907 | 2,608,265 | 205,450 | (7,272,216) | 17,296,677 |
| Fidelity Series Small Cap Opportunities Fund | 79,379,204 | 5,141,626 | 11,246,125 | 2,677,810 | (1,436,447) | (14,209,007) | 57,629,251 |
| Fidelity Series Stock Selector Large Cap Value Fund | 164,294,684 | 6,662,236 | 21,814,339 | - | 2,614,376 | (29,407,549) | 122,349,408 |
| Fidelity Series Value Discovery Fund | 124,984,516 | 3,182,567 | 16,894,451 | - | 4,635,541 | (20,839,354) | 95,068,819 |
| | 7,179,459,005 | 742,551,475 | 1,255,136,966 | 127,625,288 | (26,190,614) | (1,068,865,706) | 5,571,817,194 |
Amounts in the income column in the above table include any capital gain distributions from underlying funds, which are presented in the corresponding line item in the Statement of Operations, if applicable.
Purchases and Sales Proceeds in the table above include the value of shares purchased or redeemed through in-kind transactions, if applicable.
Investment Valuation
The following is a summary of the inputs used, as of September 30, 2022, involving the Fund's assets and liabilities carried at fair value. The inputs or methodology used for valuing securities may not be an indication of the risk associated with investing in those securities. For more information on valuation inputs, and their aggregation into the levels used below, please refer to the Investment Valuation section in the accompanying Notes to Financial Statements.
| Valuation Inputs at Reporting Date: |
| Description | Total ($) | Level 1 ($) | Level 2 ($) | Level 3 ($) |
Investments in Securities: | | | | |
|
| Other Short-Term Investments | 3,084,890 | - | 3,084,890 | - |
|
| Domestic Equity Funds | 1,073,860,986 | 1,073,860,986 | - | - |
|
| International Equity Funds | 1,195,000,166 | 1,195,000,166 | - | - |
|
| Bond Funds | 3,042,436,493 | 3,042,436,493 | - | - |
|
| Short-Term Funds | 263,882,510 | 263,882,510 | - | - |
| Total Investments in Securities: | 5,578,265,045 | 5,575,180,155 | 3,084,890 | - |
Derivative Instruments: | | | | |
|
| Assets | | | | |
Futures Contracts | 3,111,746 | 3,111,746 | - | - |
| Total Assets | 3,111,746 | 3,111,746 | - | - |
|
| Liabilities | | | | |
Futures Contracts | (6,379,244) | (6,379,244) | - | - |
| Total Liabilities | (6,379,244) | (6,379,244) | - | - |
| Total Derivative Instruments: | (3,267,498) | (3,267,498) | - | - |
Value of Derivative Instruments
The following table is a summary of the Fund's value of derivative instruments by primary risk exposure as of September 30, 2022. For additional information on derivative instruments, please refer to the Derivative Instruments section in the accompanying Notes to Financial Statements.
Primary Risk Exposure / Derivative Type | Value |
| Asset ($) | Liability ($) |
| Equity Risk | | |
Futures Contracts (a) | 3,111,746 | 0 |
| Total Equity Risk | 3,111,746 | 0 |
| Interest Rate Risk | | |
Futures Contracts (a) | 0 | (6,379,244) |
| Total Interest Rate Risk | 0 | (6,379,244) |
| Total Value of Derivatives | 3,111,746 | (6,379,244) |
(a)Reflects gross cumulative appreciation (depreciation) on futures contracts as presented in the Schedule of Investments. In the Statement of Assets and Liabilities, the period end daily variation margin is included in receivable or payable for daily variation margin on futures contracts, and the net cumulative appreciation (depreciation) is included in Total accumulated earnings (loss).
Fidelity Freedom® 2015 Fund
| Statement of Assets and Liabilities |
| | | | September 30, 2022 (Unaudited) |
| | | | | |
| Assets | | | | |
| Investment in securities, at value - See accompanying schedule: | $ | | | |
Unaffiliated issuers (cost $3,083,909) | | $3,084,890 | | |
Fidelity Central Funds (cost $3,362,770) | | 3,362,961 | | |
Other affiliated issuers (cost $5,925,745,609) | | 5,571,817,194 | | |
| | | | | |
| Total Investment in Securities (cost $5,932,192,288) | | | $ | 5,578,265,045 |
| Receivable for investments sold | | | | 66,334,540 |
| Receivable for fund shares sold | | | | 1,607,891 |
| Distributions receivable from Fidelity Central Funds | | | | 10,111 |
| Other receivables | | | | 12,170 |
Total assets | | | | 5,646,229,757 |
| Liabilities | | | | |
| Payable for investments purchased | | 55,177,415 | | |
| Payable for fund shares redeemed | | 10,421,970 | | |
| Accrued management fee | | 2,460,041 | | |
| Payable for daily variation margin on futures contracts | | 116,563 | | |
| Other payables and accrued expenses | | 12,170 | | |
| Total Liabilities | | | | 68,188,159 |
| Net Assets | | | $ | 5,578,041,598 |
| Net Assets consist of: | | | | |
| Paid in capital | | | $ | 5,879,477,482 |
| Total accumulated earnings (loss) | | | | (301,435,884) |
| Net Assets | | | $ | 5,578,041,598 |
| | | | | |
| Net Asset Value and Maximum Offering Price | | | | |
| Fidelity Freedom 2015 Fund : | | | | |
Net Asset Value , offering price and redemption price per share ($3,558,462,065 ÷ 351,904,231 shares) | | | $ | 10.11 |
| Class K : | | | | |
Net Asset Value , offering price and redemption price per share ($1,440,260,114 ÷ 142,563,895 shares) | | | $ | 10.10 |
| Class K6 : | | | | |
Net Asset Value , offering price and redemption price per share ($579,319,419 ÷ 57,570,192 shares) | | | $ | 10.06 |
| Statement of Operations |
| | | | Six months ended September 30, 2022 (Unaudited) |
| Investment Income | | | | |
| Dividends: | | | | |
| Affiliated issuers | | | $ | 89,290,529 |
| Interest | | | | 28,164 |
| Income from Fidelity Central Funds | | | | 44,355 |
| Total Income | | | | 89,363,048 |
| Expenses | | | | |
| Management fee | $ | 15,977,357 | | |
| Independent trustees' fees and expenses | | 11,171 | | |
| Total expenses before reductions | | 15,988,528 | | |
| Expense reductions | | (51) | | |
| Total expenses after reductions | | | | 15,988,477 |
| Net Investment income (loss) | | | | 73,374,571 |
| Realized and Unrealized Gain (Loss) | | | | |
| Net realized gain (loss) on: | | | | |
| Investment Securities: | | | | |
| Unaffiliated issuers | | 501 | | |
| Affiliated issuers | | (26,190,614) | | |
| Futures contracts | | (1,406,305) | | |
| Capital gain distributions from underlying funds: | | | | |
| Affiliated issuers | | 38,334,759 | | |
| Total net realized gain (loss) | | | | 10,738,341 |
| Change in net unrealized appreciation (depreciation) on: | | | | |
| Investment Securities: | | | | |
| Unaffiliated issuers | | 989 | | |
| Fidelity Central Funds | | 1 | | |
| Other affiliated issuers | | (1,068,865,706) | | |
| Futures contracts | | (5,239,126) | | |
| Total change in net unrealized appreciation (depreciation) | | | | (1,074,103,842) |
| Net gain (loss) | | | | (1,063,365,501) |
| Net increase (decrease) in net assets resulting from operations | | | $ | (989,990,930) |
| Statement of Changes in Net Assets |
| |
| | Six months ended September 30, 2022 (Unaudited) | | Year ended March 31, 2022 |
| Increase (Decrease) in Net Assets | | | | |
| Operations | | | | |
| Net investment income (loss) | $ | 73,374,571 | $ | 186,401,970 |
| Net realized gain (loss) | | 10,738,341 | | 566,777,927 |
| Change in net unrealized appreciation (depreciation) | | (1,074,103,842) | | (692,499,072) |
| Net increase (decrease) in net assets resulting from operations | | (989,990,930) | | 60,680,825 |
| Distributions to shareholders | | (296,561,571) | | (808,778,100) |
| Share transactions - net increase (decrease) | | (320,836,605) | | (434,660,945) |
| Total increase (decrease) in net assets | | (1,607,389,106) | | (1,182,758,220) |
| | | | | |
| Net Assets | | | | |
| Beginning of period | | 7,185,430,704 | | 8,368,188,924 |
| End of period | $ | 5,578,041,598 | $ | 7,185,430,704 |
| | | | | |
| | | | | |
Financial Highlights
| Fidelity Freedom® 2015 Fund |
| |
| | Six months ended (Unaudited) September 30, 2022 | | Years ended March 31, 2022 | | 2021 | | 2020 | | 2019 | | 2018 |
Selected Per-Share Data | | | | | | | | | | | | |
| Net asset value, beginning of period | $ | 12.37 | $ | 13.69 | $ | 11.53 | $ | 12.68 | $ | 13.33 | $ | 12.82 |
| Income from Investment Operations | | | | | | | | | | | | |
Net investment income (loss) A,B | | .13 | | .31 | | .14 | | .23 | | .23 | | .19 |
| Net realized and unrealized gain (loss) | | (1.87) | | (.23) | | 2.94 | | (.52) | | .08 | | .97 |
| Total from investment operations | | (1.74) | | .08 | | 3.08 | | (.29) | | .31 | | 1.16 |
| Distributions from net investment income | | (.01) | | (.33) | | (.16) | | (.24) | | (.24) | | (.19) |
| Distributions from net realized gain | | (.51) | | (1.08) | | (.76) | | (.62) | | (.73) | | (.46) |
| Total distributions | | (.52) | | (1.40) C | | (.92) | | (.86) | | (.96) C | | (.65) |
| Net asset value, end of period | $ | 10.11 | $ | 12.37 | $ | 13.69 | $ | 11.53 | $ | 12.68 | $ | 13.33 |
Total Return D,E | | (14.44)% | | .19% | | 27.45% | | (2.80)% | | 2.74% | | 9.15% |
Ratios to Average Net Assets B,F,G | | | | | | | | | | | | |
| Expenses before reductions | | .53% H | | .54% | | .55% | | .56% | | .57% | | .48% |
| Expenses net of fee waivers, if any | | .53% H | | .54% | | .55% | | .56% | | .57% | | .48% |
| Expenses net of all reductions | | .53% H | | .54% | | .55% | | .56% | | .57% | | .48% |
| Net investment income (loss) | | 2.28% H | | 2.31% | | 1.07% | | 1.80% | | 1.82% | | 1.40% |
| Supplemental Data | | | | | | | | | | | | |
| Net assets, end of period (000 omitted) | $ | 3,558,462 | $ | 4,530,090 | $ | 5,028,435 | $ | 4,174,065 | $ | 4,946,449 | $ | 5,380,580 |
Portfolio turnover rate I | | 23% H,J | | 34% | | 26% | | 21% | | 19% | | 23% K |
A Calculated based on average shares outstanding during the period.
B Net investment income (loss) is affected by the timing of the declaration of dividends by any underlying mutual funds or exchange-traded funds (ETFs). Net investment income (loss) of any such underlying funds is not included in the Fund's net investment income (loss) ratio.
C Total distributions per share do not sum due to rounding.
D Total returns for periods of less than one year are not annualized.
E Total returns would have been lower if certain expenses had not been reduced during the applicable periods shown.
F Fees and expenses of any underlying mutual funds or exchange-traded funds (ETFs) are not included in the Fund's expense ratio. The Fund indirectly bears its proportionate share of these expenses. For additional expense information related to investments in Fidelity Central Funds, please refer to the "Investments in Fidelity Central Funds" note found in the Notes to Financial Statements section of the most recent Annual or Semi-Annual report.
G Expense ratios reflect operating expenses of the class. Expenses before reductions do not reflect amounts reimbursed, waived, or reduced through arrangements with the investment adviser, brokerage services, or other offset arrangements, if applicable, and do not represent the amount paid by the class during periods when reimbursements, waivers or reductions occur.
H Annualized
I Amount does not include the portfolio activity of any underlying mutual funds or exchange-traded funds (ETFs).
J Portfolio turnover rate excludes securities received or delivered in-kind.
K The portfolio turnover rate does not include the assets acquired in the merger.
| Fidelity Freedom® 2015 Fund Class K |
| |
| | Six months ended (Unaudited) September 30, 2022 | | Years ended March 31, 2022 | | 2021 | | 2020 | | 2019 | | 2018 A |
Selected Per-Share Data | | | | | | | | | | | | |
| Net asset value, beginning of period | $ | 12.36 | $ | 13.67 | $ | 11.52 | $ | 12.66 | $ | 13.31 | $ | 13.21 |
| Income from Investment Operations | | | | | | | | | | | | |
Net investment income (loss) B,C | | .13 | | .32 | | .15 | | .24 | | .24 | | .22 |
| Net realized and unrealized gain (loss) | | (1.87) | | (.22) | | 2.93 | | (.51) | | .08 | | .34 |
| Total from investment operations | | (1.74) | | .10 | | 3.08 | | (.27) | | .32 | | .56 |
| Distributions from net investment income | | (.01) | | (.33) | | (.17) | | (.25) | | (.25) | | (.18) |
| Distributions from net realized gain | | (.51) | | (1.08) | | (.76) | | (.62) | | (.73) | | (.29) |
| Total distributions | | (.52) | | (1.41) | | (.93) | | (.87) | | (.97) D | | (.46) D |
| Net asset value, end of period | $ | 10.10 | $ | 12.36 | $ | 13.67 | $ | 11.52 | $ | 12.66 | $ | 13.31 |
Total Return E,F | | (14.43)% | | .31% | | 27.45% | | (2.67)% | | 2.80% | | 4.25% |
Ratios to Average Net Assets C,G,H | | | | | | | | | | | | |
| Expenses before reductions | | .47% I | | .48% | | .48% | | .49% | | .50% | | .51% I,J |
| Expenses net of fee waivers, if any | | .47% I | | .48% | | .48% | | .49% | | .50% | | .51% I,J |
| Expenses net of all reductions | | .47% I | | .48% | | .48% | | .49% | | .50% | | .51% I,J |
| Net investment income (loss) | | 2.34% I | | 2.37% | | 1.14% | | 1.87% | | 1.89% | | 2.39% I |
| Supplemental Data | | | | | | | | | | | | |
| Net assets, end of period (000 omitted) | $ | 1,440,260 | $ | 1,988,710 | $ | 2,592,940 | $ | 2,524,326 | $ | 3,471,921 | $ | 4,624,065 |
Portfolio turnover rate K | | 23% I,L | | 34% | | 26% | | 21% | | 19% | | 23% M |
A For the period July 20, 2017 (commencement of sale of shares) through March 31, 2018.
B Calculated based on average shares outstanding during the period.
C Net investment income (loss) is affected by the timing of the declaration of dividends by any underlying mutual funds or exchange-traded funds (ETFs). Net investment income (loss) of any such underlying funds is not included in the Fund's net investment income (loss) ratio.
D Total distributions per share do not sum due to rounding.
E Total returns for periods of less than one year are not annualized.
F Total returns would have been lower if certain expenses had not been reduced during the applicable periods shown.
G Fees and expenses of any underlying mutual funds or exchange-traded funds (ETFs) are not included in the Fund's expense ratio. The Fund indirectly bears its proportionate share of these expenses. For additional expense information related to investments in Fidelity Central Funds, please refer to the "Investments in Fidelity Central Funds" note found in the Notes to Financial Statements section of the most recent Annual or Semi-Annual report.
H Expense ratios reflect operating expenses of the class. Expenses before reductions do not reflect amounts reimbursed, waived, or reduced through arrangements with the investment adviser, brokerage services, or other offset arrangements, if applicable, and do not represent the amount paid by the class during periods when reimbursements, waivers or reductions occur.
I Annualized
J On certain classes, the size and fluctuation of net assets and expense amounts may cause ratios to differ from contractual rates.
K Amount does not include the portfolio activity of any underlying mutual funds or exchange-traded funds (ETFs).
L Portfolio turnover rate excludes securities received or delivered in-kind.
M The portfolio turnover rate does not include the assets acquired in the merger.
| Fidelity Freedom® 2015 Fund Class K6 |
| |
| | Six months ended (Unaudited) September 30, 2022 | | Years ended March 31, 2022 | | 2021 | | 2020 | | 2019 | | 2018 A |
Selected Per-Share Data | | | | | | | | | | | | |
| Net asset value, beginning of period | $ | 12.32 | $ | 13.63 | $ | 11.49 | $ | 12.64 | $ | 13.32 | $ | 13.03 |
| Income from Investment Operations | | | | | | | | | | | | |
Net investment income (loss) B,C | | .13 | | .33 | | .16 | | .25 | | .25 | | .21 |
| Net realized and unrealized gain (loss) | | (1.86) | | (.22) | | 2.92 | | (.51) | | .08 | | .55 |
| Total from investment operations | | (1.73) | | .11 | | 3.08 | | (.26) | | .33 | | .76 |
| Distributions from net investment income | | (.02) | | (.35) | | (.18) | | (.27) | | (.28) | | (.18) |
| Distributions from net realized gain | | (.51) | | (1.08) | | (.76) | | (.62) | | (.73) | | (.29) |
| Total distributions | | (.53) | | (1.42) D | | (.94) | | (.89) | | (1.01) | | (.47) |
| Net asset value, end of period | $ | 10.06 | $ | 12.32 | $ | 13.63 | $ | 11.49 | $ | 12.64 | $ | 13.32 |
Total Return E,F | | (14.45)% | | .43% | | 27.58% | | (2.61)% | | 2.87% | | 5.80% |
Ratios to Average Net Assets C,G,H | | | | | | | | | | | | |
| Expenses before reductions | | .40% I | | .40% | | .40% | | .41% | | .41% | | .42% I |
| Expenses net of fee waivers, if any | | .40% I | | .40% | | .40% | | .41% | | .41% | | .42% I |
| Expenses net of all reductions | | .40% I | | .40% | | .40% | | .41% | | .41% | | .42% I |
| Net investment income (loss) | | 2.41% I | | 2.45% | | 1.22% | | 1.95% | | 1.97% | | 1.88% I |
| Supplemental Data | | | | | | | | | | | | |
| Net assets, end of period (000 omitted) | $ | 579,319 | $ | 666,631 | $ | 746,814 | $ | 561,675 | $ | 488,156 | $ | 114,268 |
Portfolio turnover rate J | | 23% I,K | | 34% | | 26% | | 21% | | 19% | | 23% L |
A For the period June 7, 2017 (commencement of sale of shares) through March 31, 2018.
B Calculated based on average shares outstanding during the period.
C Net investment income (loss) is affected by the timing of the declaration of dividends by any underlying mutual funds or exchange-traded funds (ETFs). Net investment income (loss) of any such underlying funds is not included in the Fund's net investment income (loss) ratio.
D Total distributions per share do not sum due to rounding.
E Total returns for periods of less than one year are not annualized.
F Total returns would have been lower if certain expenses had not been reduced during the applicable periods shown.
G Fees and expenses of any underlying mutual funds or exchange-traded funds (ETFs) are not included in the Fund's expense ratio. The Fund indirectly bears its proportionate share of these expenses. For additional expense information related to investments in Fidelity Central Funds, please refer to the "Investments in Fidelity Central Funds" note found in the Notes to Financial Statements section of the most recent Annual or Semi-Annual report.
H Expense ratios reflect operating expenses of the class. Expenses before reductions do not reflect amounts reimbursed, waived, or reduced through arrangements with the investment adviser, brokerage services, or other offset arrangements, if applicable, and do not represent the amount paid by the class during periods when reimbursements, waivers or reductions occur.
I Annualized
J Amount does not include the portfolio activity of any underlying mutual funds or exchange-traded funds (ETFs).
K Portfolio turnover rate excludes securities received or delivered in-kind.
L The portfolio turnover rate does not include the assets acquired in the merger.
The information in the following table is based on the direct Investments of the Fund.
Top Holdings (% of Fund's net assets) |
| |
| Fidelity Series Investment Grade Bond Fund | 27.8 | |
| Fidelity Series Emerging Markets Opportunities Fund | 8.7 | |
| Fidelity Series 5+ Year Inflation-Protected Bond Index Fund | 8.3 | |
| Fidelity Series Long-Term Treasury Bond Index Fund | 4.4 | |
| Fidelity Series Overseas Fund | 4.2 | |
| Fidelity Series International Value Fund | 4.2 | |
| Fidelity Series International Growth Fund | 4.2 | |
| Fidelity Series Growth Company Fund | 4.2 | |
| Fidelity Series International Developed Markets Bond Index Fund | 4.0 | |
| Fidelity Series Large Cap Stock Fund | 3.9 | |
| | 73.9 | |
| |
Domestic Equity Funds category includes Fidelity Series Commodity Strategy Fund which invests in commodity-related investments.
Asset Allocation (% of Fund's net assets) |
|
Percentages shown as 0.0% may reflect amounts less than 0.05%. |
|
Fidelity Freedom® 2020 Fund
Showing Percentage of Net Assets
| U.S. Treasury Obligations - 0.1% |
| | | Principal Amount (a) | Value ($) |
U.S. Treasury Bills, yield at date of purchase 2.13% to 3.29% 10/13/22 to 12/29/22 (b) (Cost $9,371,171) | | 9,410,000 | 9,373,550 |
| | | | |
| Domestic Equity Funds - 24.8% |
| | | Shares | Value ($) |
| Fidelity Series All-Sector Equity Fund (c) | | 17,323,155 | 148,632,672 |
| Fidelity Series Blue Chip Growth Fund (c) | | 35,385,755 | 355,272,981 |
| Fidelity Series Commodity Strategy Fund (c) | | 96,453,055 | 201,586,884 |
| Fidelity Series Growth Company Fund (c) | | 51,919,111 | 696,754,466 |
| Fidelity Series Intrinsic Opportunities Fund (c) | | 24,343,602 | 320,361,805 |
| Fidelity Series Large Cap Stock Fund (c) | | 44,761,709 | 661,130,448 |
| Fidelity Series Large Cap Value Index Fund (c) | | 17,056,725 | 216,961,547 |
| Fidelity Series Opportunistic Insights Fund (c) | | 28,489,020 | 404,828,975 |
| Fidelity Series Small Cap Discovery Fund (c) | | 7,170,899 | 67,263,036 |
| Fidelity Series Small Cap Opportunities Fund (c) | | 20,979,243 | 226,156,245 |
| Fidelity Series Stock Selector Large Cap Value Fund (c) | | 42,982,854 | 480,118,476 |
| Fidelity Series Value Discovery Fund (c) | | 27,235,398 | 375,031,437 |
| TOTAL DOMESTIC EQUITY FUNDS (Cost $3,763,755,326) | | | 4,154,098,972 |
| | | | |
| International Equity Funds - 25.1% |
| | | Shares | Value ($) |
| Fidelity Series Canada Fund (c) | | 24,590,674 | 304,924,353 |
| Fidelity Series Emerging Markets Fund (c) | | 21,662,896 | 156,839,368 |
| Fidelity Series Emerging Markets Opportunities Fund (c) | | 100,413,424 | 1,458,002,918 |
| Fidelity Series International Growth Fund (c) | | 54,747,109 | 701,857,932 |
| Fidelity Series International Small Cap Fund (c) | | 13,366,499 | 182,853,702 |
| Fidelity Series International Value Fund (c) | | 82,018,855 | 704,541,968 |
| Fidelity Series Overseas Fund (c) | | 74,348,097 | 708,537,367 |
| TOTAL INTERNATIONAL EQUITY FUNDS (Cost $4,154,262,449) | | | 4,217,557,608 |
| | | | |
| Bond Funds - 48.2% |
| | | Shares | Value ($) |
| Fidelity Series 0-5 Year Inflation-Protected Bond Index Fund (c) | | 35,042,752 | 338,162,561 |
| Fidelity Series 5+ Year Inflation-Protected Bond Index Fund (c) | | 173,580,267 | 1,386,906,336 |
| Fidelity Series Emerging Markets Debt Fund (c) | | 12,845,540 | 88,120,407 |
| Fidelity Series Emerging Markets Debt Local Currency Fund (c) | | 3,637,351 | 28,989,690 |
| Fidelity Series Floating Rate High Income Fund (c) | | 1,990,014 | 17,313,125 |
| Fidelity Series High Income Fund (c) | | 11,549,562 | 91,010,550 |
| Fidelity Series International Credit Fund (c) | | 2,220,212 | 17,473,068 |
| Fidelity Series International Developed Markets Bond Index Fund (c) | | 79,458,339 | 676,985,045 |
| Fidelity Series Investment Grade Bond Fund (c) | | 477,077,113 | 4,656,272,616 |
| Fidelity Series Long-Term Treasury Bond Index Fund (c) | | 124,372,023 | 742,500,976 |
| Fidelity Series Real Estate Income Fund (c) | | 4,534,659 | 43,169,952 |
| TOTAL BOND FUNDS (Cost $9,556,613,824) | | | 8,086,904,326 |
| | | | |
| Short-Term Funds - 1.8% |
| | | Shares | Value ($) |
| Fidelity Cash Central Fund 3.10% (d) | | 8,420,038 | 8,421,722 |
| Fidelity Series Government Money Market Fund 3.00% (c)(e) | | 255,743,327 | 255,743,327 |
| Fidelity Series Short-Term Credit Fund (c) | | 4,352,986 | 41,266,309 |
| TOTAL SHORT-TERM FUNDS (Cost $307,414,769) | | | 305,431,358 |
| | | | |
| TOTAL INVESTMENT IN SECURITIES - 100.0% (Cost $17,791,417,539) | 16,773,365,814 |
NET OTHER ASSETS (LIABILITIES) - 0.0% | (1,380,962) |
| NET ASSETS - 100.0% | 16,771,984,852 |
| | |
| Futures Contracts |
| | Number of contracts | Expiration Date | Notional Amount ($) | Value ($) | Unrealized Appreciation/ (Depreciation) ($) |
| Purchased | | | | | |
| | | | | | |
| Treasury Contracts | | | | | |
| CBOT 10-Year U.S. Treasury Note Contracts (United States) | 2,732 | Dec 2022 | 306,154,750 | (18,752,787) | (18,752,787) |
| CBOT Ultra Long Term U.S. Treasury Bond Contracts (United States) | 257 | Dec 2022 | 35,209,000 | (449,030) | (449,030) |
| | | | | | |
| TOTAL PURCHASED | | | | | (19,201,817) |
| | | | | | |
| Sold | | | | | |
| | | | | | |
| Equity Index Contracts | | | | | |
| CME E-mini S&P 500 Index Contracts (United States) | 367 | Dec 2022 | 66,087,525 | 1,084,878 | 1,084,878 |
| ICE E-mini MSCI EAFE Index Contracts (United States) | 969 | Dec 2022 | 80,456,070 | 9,294,210 | 9,294,210 |
| ICE E-mini MSCI Emerging Markets Index Contracts (United States) | 565 | Dec 2022 | 24,619,875 | 25,408 | 25,408 |
| | | | | | |
| TOTAL SOLD | | | | | 10,404,496 |
| | | | | | |
| TOTAL FUTURES CONTRACTS | | | | | (8,797,321) |
| The notional amount of futures purchased as a percentage of Net Assets is 2.0% |
| The notional amount of futures sold as a percentage of Net Assets is 1.0% |
Legend
| (a) | Amount is stated in United States dollars unless otherwise noted. |
| (b) | Security or a portion of the security was pledged to cover margin requirements for futures contracts. At period end, the value of securities pledged amounted to $9,373,550. |
| (d) | Affiliated fund that is generally available only to investment companies and other accounts managed by Fidelity Investments. The rate quoted is the annualized seven-day yield of the fund at period end. A complete unaudited listing of the fund's holdings as of its most recent quarter end is available upon request. In addition, each Fidelity Central Fund's financial statements are available on the SEC's website or upon request. |
| (e) | The rate quoted is the annualized seven-day yield of the fund at period end. |
Affiliated Central Funds
Fiscal year to date information regarding the Fund's investments in Fidelity Central Funds, including the ownership percentage, is presented below.
| Affiliate | Value, beginning of period ($) | Purchases ($) | Sales Proceeds ($) | Dividend Income ($) | Realized Gain (loss) ($) | Change in Unrealized appreciation (depreciation) ($) | Value, end of period ($) | %ownership, end of period |
| Fidelity Cash Central Fund 3.10% | 15,447,040 | 103,234,844 | 110,260,162 | 122,306 | 54 | (54) | 8,421,722 | 0.0% |
| Total | 15,447,040 | 103,234,844 | 110,260,162 | 122,306 | 54 | (54) | 8,421,722 | |
| | | | | | | | | |
Amounts in the income column in the above table include any capital gain distributions from underlying funds, which are presented in the corresponding line item in the Statement of Operations, if applicable.
Affiliated Underlying Funds
Fiscal year to date information regarding the Fund's investments in affiliated Underlying Funds is presented below. Exchanges between classes of the same affiliated Underlying Funds may occur. If an Underlying Funds changes its name, the name presented below is the name in effect at period end.
| Affiliate | Value, beginning of period ($) | Purchases ($) | Sales Proceeds ($) | Dividend Income ($) | Realized Gain (loss) ($) | Change in Unrealized appreciation (depreciation) ($) | Value, end of period ($) |
| Fidelity Series 0-5 Year Inflation-Protected Bond Index Fund | 243,378,266 | 170,970,290 | 62,888,969 | - | (145,022) | (13,152,004) | 338,162,561 |
| Fidelity Series 5+ Year Inflation-Protected Bond Index Fund | 1,520,224,548 | 348,716,902 | 205,982,531 | 1 | (18,604,689) | (257,447,894) | 1,386,906,336 |
| Fidelity Series All-Sector Equity Fund | 212,784,609 | 1,878,879 | 24,967,476 | - | (3,324,484) | (37,738,856) | 148,632,672 |
| Fidelity Series Blue Chip Growth Fund | 349,393,472 | 171,699,295 | 47,371,450 | 12,044,547 | (8,795,687) | (109,652,649) | 355,272,981 |
| Fidelity Series Canada Fund | 410,925,140 | 12,398,169 | 39,127,428 | - | 4,876,993 | (84,148,521) | 304,924,353 |
| Fidelity Series Commodity Strategy Fund | 326,346,227 | 162,069,137 | 115,904,183 | 145,955,976 | (22,354,404) | (148,569,893) | 201,586,884 |
| Fidelity Series Emerging Markets Debt Fund | 112,454,792 | 3,471,212 | 9,430,684 | 2,744,448 | (2,521,654) | (15,853,259) | 88,120,407 |
| Fidelity Series Emerging Markets Debt Local Currency Fund | 36,954,064 | 1,075 | 3,863,104 | - | (794,078) | (3,308,267) | 28,989,690 |
| Fidelity Series Emerging Markets Fund | 207,713,565 | 11,712,781 | 17,425,972 | - | (1,525,885) | (43,635,121) | 156,839,368 |
| Fidelity Series Emerging Markets Opportunities Fund | 1,871,499,618 | 135,091,011 | 160,285,991 | - | (20,784,875) | (367,516,845) | 1,458,002,918 |
| Fidelity Series Floating Rate High Income Fund | 22,285,625 | 524,378 | 4,406,586 | 523,734 | (498,123) | (592,169) | 17,313,125 |
| Fidelity Series Government Money Market Fund 3.00% | 448,766,444 | 100,691,874 | 293,714,991 | 1,317,772 | - | - | 255,743,327 |
| Fidelity Series Growth Company Fund | 870,783,396 | 150,044,039 | 88,572,902 | - | (7,631,217) | (227,868,850) | 696,754,466 |
| Fidelity Series High Income Fund | 133,191,371 | 3,047,415 | 29,346,348 | 3,043,753 | (3,021,010) | (12,860,878) | 91,010,550 |
| Fidelity Series Inflation-Protected Bond Index Fund | 240,085,881 | 2,070,161 | 236,995,396 | 2,051,034 | 5,571,878 | (10,732,524) | - |
| Fidelity Series International Credit Fund | 20,287,275 | 276,988 | 21,132 | 276,987 | (471) | (3,069,592) | 17,473,068 |
| Fidelity Series International Developed Markets Bond Index Fund | 673,916,940 | 148,259,450 | 81,535,350 | 1,084,292 | (6,257,257) | (57,398,738) | 676,985,045 |
| Fidelity Series International Growth Fund | 938,022,383 | 69,055,204 | 96,936,663 | - | (16,117,285) | (192,165,707) | 701,857,932 |
| Fidelity Series International Small Cap Fund | 259,047,128 | 2,158,688 | 19,118,795 | - | (5,122,063) | (54,111,256) | 182,853,702 |
| Fidelity Series International Value Fund | 949,103,204 | 54,473,676 | 98,719,214 | - | 6,063,975 | (206,379,673) | 704,541,968 |
| Fidelity Series Intrinsic Opportunities Fund | 824,875,443 | 90,350,284 | 431,317,282 | 90,273,710 | 160,685,280 | (324,231,920) | 320,361,805 |
| Fidelity Series Investment Grade Bond Fund | 6,150,485,142 | 197,890,216 | 1,087,477,354 | 77,405,593 | (104,909,079) | (499,716,309) | 4,656,272,616 |
| Fidelity Series Large Cap Stock Fund | 774,403,850 | 167,728,196 | 101,031,185 | 39,641,855 | 136,060 | (180,106,473) | 661,130,448 |
| Fidelity Series Large Cap Value Index Fund | 291,496,998 | 5,178,208 | 32,676,323 | - | 8,281,179 | (55,318,515) | 216,961,547 |
| Fidelity Series Long-Term Treasury Bond Index Fund | 948,599,599 | 99,647,530 | 99,132,498 | 10,917,695 | (9,106,517) | (197,507,138) | 742,500,976 |
| Fidelity Series Opportunistic Insights Fund | 446,183,157 | 113,338,141 | 51,017,105 | - | (7,560,732) | (96,114,486) | 404,828,975 |
| Fidelity Series Overseas Fund | 944,892,935 | 67,924,275 | 74,790,632 | - | (9,637,831) | (219,851,380) | 708,537,367 |
| Fidelity Series Real Estate Income Fund | 80,981,409 | 3,515,484 | 30,954,303 | 3,511,786 | 1,501,384 | (11,874,022) | 43,169,952 |
| Fidelity Series Short-Term Credit Fund | 112,438,631 | 2,856,491 | 72,377,489 | 457,061 | (2,095,385) | 444,061 | 41,266,309 |
| Fidelity Series Small Cap Discovery Fund | 96,063,424 | 11,918,350 | 12,739,606 | 10,298,629 | 883,556 | (28,862,688) | 67,263,036 |
| Fidelity Series Small Cap Opportunities Fund | 315,172,162 | 16,051,387 | 43,005,219 | 10,568,307 | (5,824,311) | (56,237,774) | 226,156,245 |
| Fidelity Series Stock Selector Large Cap Value Fund | 652,335,617 | 21,690,805 | 87,876,874 | - | 11,581,952 | (117,613,024) | 480,118,476 |
| Fidelity Series Value Discovery Fund | 496,259,993 | 12,475,206 | 69,620,533 | - | 19,333,313 | (83,416,542) | 375,031,437 |
| | 21,981,352,308 | 2,359,175,197 | 3,830,631,568 | 412,117,180 | (37,716,489) | (3,716,608,906) | 16,755,570,542 |
Amounts in the income column in the above table include any capital gain distributions from underlying funds, which are presented in the corresponding line item in the Statement of Operations, if applicable.
Purchases and Sales Proceeds in the table above include the value of shares purchased or redeemed through in-kind transactions, if applicable.
Investment Valuation
The following is a summary of the inputs used, as of September 30, 2022, involving the Fund's assets and liabilities carried at fair value. The inputs or methodology used for valuing securities may not be an indication of the risk associated with investing in those securities. For more information on valuation inputs, and their aggregation into the levels used below, please refer to the Investment Valuation section in the accompanying Notes to Financial Statements.
| Valuation Inputs at Reporting Date: |
| Description | Total ($) | Level 1 ($) | Level 2 ($) | Level 3 ($) |
Investments in Securities: | | | | |
|
| Other Short-Term Investments | 9,373,550 | - | 9,373,550 | - |
|
| Domestic Equity Funds | 4,154,098,972 | 4,154,098,972 | - | - |
|
| International Equity Funds | 4,217,557,608 | 4,217,557,608 | - | - |
|
| Bond Funds | 8,086,904,326 | 8,086,904,326 | - | - |
|
| Short-Term Funds | 305,431,358 | 305,431,358 | - | - |
| Total Investments in Securities: | 16,773,365,814 | 16,763,992,264 | 9,373,550 | - |
Derivative Instruments: | | | | |
|
| Assets | | | | |
Futures Contracts | 10,404,496 | 10,404,496 | - | - |
| Total Assets | 10,404,496 | 10,404,496 | - | - |
|
| Liabilities | | | | |
Futures Contracts | (19,201,817) | (19,201,817) | - | - |
| Total Liabilities | (19,201,817) | (19,201,817) | - | - |
| Total Derivative Instruments: | (8,797,321) | (8,797,321) | - | - |
Value of Derivative Instruments
The following table is a summary of the Fund's value of derivative instruments by primary risk exposure as of September 30, 2022. For additional information on derivative instruments, please refer to the Derivative Instruments section in the accompanying Notes to Financial Statements.
Primary Risk Exposure / Derivative Type | Value |
| Asset ($) | Liability ($) |
| Equity Risk | | |
Futures Contracts (a) | 10,404,496 | 0 |
| Total Equity Risk | 10,404,496 | 0 |
| Interest Rate Risk | | |
Futures Contracts (a) | 0 | (19,201,817) |
| Total Interest Rate Risk | 0 | (19,201,817) |
| Total Value of Derivatives | 10,404,496 | (19,201,817) |
(a)Reflects gross cumulative appreciation (depreciation) on futures contracts as presented in the Schedule of Investments. In the Statement of Assets and Liabilities, the period end daily variation margin is included in receivable or payable for daily variation margin on futures contracts, and the net cumulative appreciation (depreciation) is included in Total accumulated earnings (loss).
Fidelity Freedom® 2020 Fund
| Statement of Assets and Liabilities |
| | | | September 30, 2022 (Unaudited) |
| | | | | |
| Assets | | | | |
| Investment in securities, at value - See accompanying schedule: | $ | | | |
Unaffiliated issuers (cost $9,371,171) | | $9,373,550 | | |
Fidelity Central Funds (cost $8,420,914) | | 8,421,722 | | |
Other affiliated issuers (cost $17,773,625,454) | | 16,755,570,542 | | |
| | | | | |
| Total Investment in Securities (cost $17,791,417,539) | | | $ | 16,773,365,814 |
| Receivable for investments sold | | | | 199,093,287 |
| Receivable for fund shares sold | | | | 7,707,108 |
| Distributions receivable from Fidelity Central Funds | | | | 25,437 |
| Other receivables | | | | 315,673 |
Total assets | | | | 16,980,507,319 |
| Liabilities | | | | |
| Payable for investments purchased | | 167,328,134 | | |
| Payable for fund shares redeemed | | 32,600,852 | | |
| Accrued management fee | | 7,894,755 | | |
| Payable for daily variation margin on futures contracts | | 383,053 | | |
| Other payables and accrued expenses | | 315,673 | | |
| Total Liabilities | | | | 208,522,467 |
| Net Assets | | | $ | 16,771,984,852 |
| Net Assets consist of: | | | | |
| Paid in capital | | | $ | 17,569,742,761 |
| Total accumulated earnings (loss) | | | | (797,757,909) |
| Net Assets | | | $ | 16,771,984,852 |
| | | | | |
| Net Asset Value and Maximum Offering Price | | | | |
| Fidelity Freedom 2020 Fund : | | | | |
Net Asset Value , offering price and redemption price per share ($9,308,570,357 ÷ 747,486,964 shares) | | | $ | 12.45 |
| Class K : | | | | |
Net Asset Value , offering price and redemption price per share ($5,367,207,351 ÷ 431,057,419 shares) | | | $ | 12.45 |
| Class K6 : | | | | |
Net Asset Value , offering price and redemption price per share ($2,096,207,144 ÷ 169,003,613 shares) | | | $ | 12.40 |
| Statement of Operations |
| | | | Six months ended September 30, 2022 (Unaudited) |
| Investment Income | | | | |
| Dividends: | | | | |
| Affiliated issuers | | | $ | 260,975,140 |
| Interest | | | | 84,839 |
| Income from Fidelity Central Funds | | | | 122,306 |
| Total Income | | | | 261,182,285 |
| Expenses | | | | |
| Management fee | $ | 51,503,082 | | |
| Independent trustees' fees and expenses | | 34,052 | | |
| Total expenses before reductions | | 51,537,134 | | |
| Expense reductions | | (60) | | |
| Total expenses after reductions | | | | 51,537,074 |
| Net Investment income (loss) | | | | 209,645,211 |
| Realized and Unrealized Gain (Loss) | | | | |
| Net realized gain (loss) on: | | | | |
| Investment Securities: | | | | |
| Unaffiliated issuers | | 2,841 | | |
| Fidelity Central Funds | | 54 | | |
| Other affiliated issuers | | (37,716,489) | | |
| Futures contracts | | (5,314,105) | | |
| Capital gain distributions from underlying funds: | | | | |
| Affiliated issuers | | 151,142,040 | | |
| Total net realized gain (loss) | | | | 108,114,341 |
| Change in net unrealized appreciation (depreciation) on: | | | | |
| Investment Securities: | | | | |
| Unaffiliated issuers | | 2,398 | | |
| Fidelity Central Funds | | (54) | | |
| Other affiliated issuers | | (3,716,608,906) | | |
| Futures contracts | | (14,738,934) | | |
| Total change in net unrealized appreciation (depreciation) | | | | (3,731,345,496) |
| Net gain (loss) | | | | (3,623,231,155) |
| Net increase (decrease) in net assets resulting from operations | | | $ | (3,413,585,944) |
| Statement of Changes in Net Assets |
| |
| | Six months ended September 30, 2022 (Unaudited) | | Year ended March 31, 2022 |
| Increase (Decrease) in Net Assets | | | | |
| Operations | | | | |
| Net investment income (loss) | $ | 209,645,211 | $ | 576,321,543 |
| Net realized gain (loss) | | 108,114,341 | | 2,092,561,777 |
| Change in net unrealized appreciation (depreciation) | | (3,731,345,496) | | (2,352,709,765) |
| Net increase (decrease) in net assets resulting from operations | | (3,413,585,944) | | 316,173,555 |
| Distributions to shareholders | | (1,086,491,598) | | (2,804,931,957) |
| Share transactions - net increase (decrease) | | (731,712,014) | | (1,799,559,611) |
| Total increase (decrease) in net assets | | (5,231,789,556) | | (4,288,318,013) |
| | | | | |
| Net Assets | | | | |
| Beginning of period | | 22,003,774,408 | | 26,292,092,421 |
| End of period | $ | 16,771,984,852 | $ | 22,003,774,408 |
| | | | | |
| | | | | |
Financial Highlights
| Fidelity Freedom® 2020 Fund |
| |
| | Six months ended (Unaudited) September 30, 2022 | | Years ended March 31, 2022 | | 2021 | | 2020 | | 2019 | | 2018 |
Selected Per-Share Data | | | | | | | | | | | | |
| Net asset value, beginning of period | $ | 15.72 | $ | 17.53 | $ | 14.21 | $ | 15.83 | $ | 16.51 | $ | 15.70 |
| Income from Investment Operations | | | | | | | | | | | | |
Net investment income (loss) A,B | | .15 | | .39 | | .18 | | .28 | | .28 | | .22 |
| Net realized and unrealized gain (loss) | | (2.63) | | (.19) | | 4.32 | | (.84) | | .10 | | 1.34 |
| Total from investment operations | | (2.48) | | .20 | | 4.50 | | (.56) | | .38 | | 1.56 |
| Distributions from net investment income | | (.01) | | (.42) | | (.20) | | (.30) | | (.28) | | (.22) |
| Distributions from net realized gain | | (.78) | | (1.59) | | (.98) | | (.76) | | (.78) | | (.52) |
| Total distributions | | (.79) | | (2.01) | | (1.18) | | (1.06) | | (1.06) | | (.75) C |
| Net asset value, end of period | $ | 12.45 | $ | 15.72 | $ | 17.53 | $ | 14.21 | $ | 15.83 | $ | 16.51 |
Total Return D,E | | (16.28)% | | .66% | | 32.56% | | (4.15)% | | 2.66% | | 10.01% |
Ratios to Average Net Assets B,F,G | | | | | | | | | | | | |
| Expenses before reductions | | .58% H | | .58% I | | .59% | | .60% | | .61% | | .52% |
| Expenses net of fee waivers, if any | | .58% H | | .58% I | | .59% | | .60% | | .61% | | .52% |
| Expenses net of all reductions | | .58% H | | .58% I | | .59% | | .60% | | .61% | | .52% |
| Net investment income (loss) | | 2.13% H | | 2.29% | | 1.07% | | 1.76% | | 1.76% | | 1.34% |
| Supplemental Data | | | | | | | | | | | | |
| Net assets, end of period (000 omitted) | $ | 9,308,570 | $ | 12,039,706 | $ | 13,282,370 | $ | 10,620,621 | $ | 12,395,049 | $ | 12,916,078 |
Portfolio turnover rate J | | 24% H,K | | 34% | | 26% | | 23% | | 19% | | 21% L |
A Calculated based on average shares outstanding during the period.
B Net investment income (loss) is affected by the timing of the declaration of dividends by any underlying mutual funds or exchange-traded funds (ETFs). Net investment income (loss) of any such underlying funds is not included in the Fund's net investment income (loss) ratio.
C Total distributions per share do not sum due to rounding.
D Total returns for periods of less than one year are not annualized.
E Total returns would have been lower if certain expenses had not been reduced during the applicable periods shown.
F Fees and expenses of any underlying mutual funds or exchange-traded funds (ETFs) are not included in the Fund's expense ratio. The Fund indirectly bears its proportionate share of these expenses. For additional expense information related to investments in Fidelity Central Funds, please refer to the "Investments in Fidelity Central Funds" note found in the Notes to Financial Statements section of the most recent Annual or Semi-Annual report.
G Expense ratios reflect operating expenses of the class. Expenses before reductions do not reflect amounts reimbursed, waived, or reduced through arrangements with the investment adviser, brokerage services, or other offset arrangements, if applicable, and do not represent the amount paid by the class during periods when reimbursements, waivers or reductions occur.
H Annualized
I On certain classes, the size and fluctuation of net assets and expense amounts may cause ratios to differ from contractual rates.
J Amount does not include the portfolio activity of any underlying mutual funds or exchange-traded funds (ETFs).
K Portfolio turnover rate excludes securities received or delivered in-kind.
L The portfolio turnover rate does not include the assets acquired in the merger.
| Fidelity Freedom® 2020 Fund Class K |
| |
| | Six months ended (Unaudited) September 30, 2022 | | Years ended March 31, 2022 | | 2021 | | 2020 | | 2019 | | 2018 A |
Selected Per-Share Data | | | | | | | | | | | | |
| Net asset value, beginning of period | $ | 15.71 | $ | 17.52 | $ | 14.20 | $ | 15.81 | $ | 16.49 | $ | 16.24 |
| Income from Investment Operations | | | | | | | | | | | | |
Net investment income (loss) B,C | | .15 | | .41 | | .19 | | .29 | | .29 | | .27 |
| Net realized and unrealized gain (loss) | | (2.62) | | (.20) | | 4.32 | | (.83) | | .10 | | .50 |
| Total from investment operations | | (2.47) | | .21 | | 4.51 | | (.54) | | .39 | | .77 |
| Distributions from net investment income | | (.01) | | (.42) | | (.21) | | (.31) | | (.29) | | (.21) |
| Distributions from net realized gain | | (.78) | | (1.59) | | (.98) | | (.76) | | (.78) | | (.31) |
| Total distributions | | (.79) | | (2.02) D | | (1.19) | | (1.07) | | (1.07) | | (.52) |
| Net asset value, end of period | $ | 12.45 | $ | 15.71 | $ | 17.52 | $ | 14.20 | $ | 15.81 | $ | 16.49 |
Total Return E,F | | (16.22)% | | .70% | | 32.66% | | (4.04)% | | 2.73% | | 4.73% |
Ratios to Average Net Assets C,G,H | | | | | | | | | | | | |
| Expenses before reductions | | .50% I | | .51% | | .52% | | .52% | | .53% | | .54% I |
| Expenses net of fee waivers, if any | | .50% I | | .51% | | .52% | | .52% | | .53% | | .54% I |
| Expenses net of all reductions | | .50% I | | .51% | | .52% | | .52% | | .53% | | .54% I |
| Net investment income (loss) | | 2.20% I | | 2.36% | | 1.15% | | 1.84% | | 1.84% | | 2.34% I |
| Supplemental Data | | | | | | | | | | | | |
| Net assets, end of period (000 omitted) | $ | 5,367,207 | $ | 7,535,845 | $ | 10,341,455 | $ | 9,840,293 | $ | 13,509,101 | $ | 16,611,072 |
Portfolio turnover rate J | | 24% I,K | | 34% | | 26% | | 23% | | 19% | | 21% L |
A For the period July 20, 2017 (commencement of sale of shares) through March 31, 2018.
B Calculated based on average shares outstanding during the period.
C Net investment income (loss) is affected by the timing of the declaration of dividends by any underlying mutual funds or exchange-traded funds (ETFs). Net investment income (loss) of any such underlying funds is not included in the Fund's net investment income (loss) ratio.
D Total distributions per share do not sum due to rounding.
E Total returns for periods of less than one year are not annualized.
F Total returns would have been lower if certain expenses had not been reduced during the applicable periods shown.
G Fees and expenses of any underlying mutual funds or exchange-traded funds (ETFs) are not included in the Fund's expense ratio. The Fund indirectly bears its proportionate share of these expenses. For additional expense information related to investments in Fidelity Central Funds, please refer to the "Investments in Fidelity Central Funds" note found in the Notes to Financial Statements section of the most recent Annual or Semi-Annual report.
H Expense ratios reflect operating expenses of the class. Expenses before reductions do not reflect amounts reimbursed, waived, or reduced through arrangements with the investment adviser, brokerage services, or other offset arrangements, if applicable, and do not represent the amount paid by the class during periods when reimbursements, waivers or reductions occur.
I Annualized
J Amount does not include the portfolio activity of any underlying mutual funds or exchange-traded funds (ETFs).
K Portfolio turnover rate excludes securities received or delivered in-kind.
L The portfolio turnover rate does not include the assets acquired in the merger.
| Fidelity Freedom® 2020 Fund Class K6 |
| |
| | Six months ended (Unaudited) September 30, 2022 | | Years ended March 31, 2022 | | 2021 | | 2020 | | 2019 | | 2018 A |
Selected Per-Share Data | | | | | | | | | | | | |
| Net asset value, beginning of period | $ | 15.65 | $ | 17.47 | $ | 14.16 | $ | 15.78 | $ | 16.50 | $ | 16.00 |
| Income from Investment Operations | | | | | | | | | | | | |
Net investment income (loss) B,C | | .16 | | .42 | | .20 | | .31 | | .30 | | .24 |
| Net realized and unrealized gain (loss) | | (2.61) | | (.20) | | 4.32 | | (.83) | | .10 | | .79 |
| Total from investment operations | | (2.45) | | .22 | | 4.52 | | (.52) | | .40 | | 1.03 |
| Distributions from net investment income | | (.01) | | (.45) | | (.23) | | (.34) | | (.34) | | (.22) |
| Distributions from net realized gain | | (.78) | | (1.59) | | (.98) | | (.76) | | (.78) | | (.31) |
| Total distributions | | (.80) D | | (2.04) | | (1.21) | | (1.10) | | (1.12) | | (.53) |
| Net asset value, end of period | $ | 12.40 | $ | 15.65 | $ | 17.47 | $ | 14.16 | $ | 15.78 | $ | 16.50 |
Total Return E,F | | (16.18)% | | .77% | | 32.85% | | (3.96)% | | 2.80% | | 6.40% |
Ratios to Average Net Assets C,G,H | | | | | | | | | | | | |
| Expenses before reductions | | .42% I | | .42% | | .42% | | .43% | | .43% | | .44% I |
| Expenses net of fee waivers, if any | | .42% I | | .42% | | .42% | | .43% | | .43% | | .44% I |
| Expenses net of all reductions | | .42% I | | .42% | | .42% | | .43% | | .43% | | .44% I |
| Net investment income (loss) | | 2.29% I | | 2.46% | | 1.24% | | 1.93% | | 1.94% | | 1.79% I |
| Supplemental Data | | | | | | | | | | | | |
| Net assets, end of period (000 omitted) | $ | 2,096,207 | $ | 2,428,224 | $ | 2,668,267 | $ | 2,087,924 | $ | 1,831,743 | $ | 474,981 |
Portfolio turnover rate J | | 24% I,K | | 34% | | 26% | | 23% | | 19% | | 21% L |
A For the period June 7, 2017 (commencement of sale of shares) through March 31, 2018.
B Calculated based on average shares outstanding during the period.
C Net investment income (loss) is affected by the timing of the declaration of dividends by any underlying mutual funds or exchange-traded funds (ETFs). Net investment income (loss) of any such underlying funds is not included in the Fund's net investment income (loss) ratio.
D Total distributions per share do not sum due to rounding.
E Total returns for periods of less than one year are not annualized.
F Total returns would have been lower if certain expenses had not been reduced during the applicable periods shown.
G Fees and expenses of any underlying mutual funds or exchange-traded funds (ETFs) are not included in the Fund's expense ratio. The Fund indirectly bears its proportionate share of these expenses. For additional expense information related to investments in Fidelity Central Funds, please refer to the "Investments in Fidelity Central Funds" note found in the Notes to Financial Statements section of the most recent Annual or Semi-Annual report.
H Expense ratios reflect operating expenses of the class. Expenses before reductions do not reflect amounts reimbursed, waived, or reduced through arrangements with the investment adviser, brokerage services, or other offset arrangements, if applicable, and do not represent the amount paid by the class during periods when reimbursements, waivers or reductions occur.
I Annualized
J Amount does not include the portfolio activity of any underlying mutual funds or exchange-traded funds (ETFs).
K Portfolio turnover rate excludes securities received or delivered in-kind.
L The portfolio turnover rate does not include the assets acquired in the merger.
The information in the following table is based on the direct Investments of the Fund.
Top Holdings (% of Fund's net assets) |
| |
| Fidelity Series Investment Grade Bond Fund | 24.2 | |
| Fidelity Series Emerging Markets Opportunities Fund | 9.5 | |
| Fidelity Series 5+ Year Inflation-Protected Bond Index Fund | 7.7 | |
| Fidelity Series Long-Term Treasury Bond Index Fund | 4.9 | |
| Fidelity Series Growth Company Fund | 4.9 | |
| Fidelity Series Overseas Fund | 4.8 | |
| Fidelity Series International Value Fund | 4.7 | |
| Fidelity Series International Growth Fund | 4.7 | |
| Fidelity Series Large Cap Stock Fund | 4.6 | |
| Fidelity Series International Developed Markets Bond Index Fund | 4.0 | |
| | 74.0 | |
| |
Domestic Equity Funds category includes Fidelity Series Commodity Strategy Fund which invests in commodity-related investments.
Asset Allocation (% of Fund's net assets) |
|
Percentages shown as 0.0% may reflect amounts less than 0.05%. |
|
Fidelity Freedom® 2025 Fund
Showing Percentage of Net Assets
| U.S. Treasury Obligations - 0.0% |
| | | Principal Amount (a) | Value ($) |
U.S. Treasury Bills, yield at date of purchase 2.13% to 3.29% 10/13/22 to 12/29/22 (b) (Cost $12,562,457) | | 12,610,000 | 12,564,884 |
| | | | |
| Domestic Equity Funds - 28.9% |
| | | Shares | Value ($) |
| Fidelity Series All-Sector Equity Fund (c) | | 27,107,032 | 232,578,338 |
| Fidelity Series Blue Chip Growth Fund (c) | | 55,370,268 | 555,917,493 |
| Fidelity Series Commodity Strategy Fund (c) | | 128,255,978 | 268,054,993 |
| Fidelity Series Growth Company Fund (c) | | 81,241,367 | 1,090,259,149 |
| Fidelity Series Intrinsic Opportunities Fund (c) | | 38,122,420 | 501,691,044 |
| Fidelity Series Large Cap Stock Fund (c) | | 70,042,441 | 1,034,526,858 |
| Fidelity Series Large Cap Value Index Fund (c) | | 26,690,255 | 339,500,042 |
| Fidelity Series Opportunistic Insights Fund (c) | | 44,684,990 | 634,973,708 |
| Fidelity Series Small Cap Discovery Fund (c) | | 11,186,641 | 104,930,693 |
| Fidelity Series Small Cap Opportunities Fund (c) | | 32,828,458 | 353,890,776 |
| Fidelity Series Stock Selector Large Cap Value Fund (c) | | 67,259,315 | 751,286,553 |
| Fidelity Series Value Discovery Fund (c) | | 42,693,649 | 587,891,551 |
| TOTAL DOMESTIC EQUITY FUNDS (Cost $6,030,584,442) | | | 6,455,501,198 |
| | | | |
| International Equity Funds - 28.0% |
| | | Shares | Value ($) |
| Fidelity Series Canada Fund (c) | | 36,896,705 | 457,519,145 |
| Fidelity Series Emerging Markets Fund (c) | | 31,362,559 | 227,064,929 |
| Fidelity Series Emerging Markets Opportunities Fund (c) | | 145,037,523 | 2,105,944,834 |
| Fidelity Series International Growth Fund (c) | | 82,101,513 | 1,052,541,402 |
| Fidelity Series International Small Cap Fund (c) | | 20,043,036 | 274,188,726 |
| Fidelity Series International Value Fund (c) | | 123,000,248 | 1,056,572,134 |
| Fidelity Series Overseas Fund (c) | | 111,498,370 | 1,062,579,462 |
| TOTAL INTERNATIONAL EQUITY FUNDS (Cost $6,455,568,185) | | | 6,236,410,632 |
| | | | |
| Bond Funds - 42.5% |
| | | Shares | Value ($) |
| Fidelity Series 5+ Year Inflation-Protected Bond Index Fund (c) | | 213,894,150 | 1,709,014,256 |
| Fidelity Series Emerging Markets Debt Fund (c) | | 17,095,707 | 117,276,551 |
| Fidelity Series Emerging Markets Debt Local Currency Fund (c) | | 4,840,561 | 38,579,274 |
| Fidelity Series Floating Rate High Income Fund (c) | | 2,627,688 | 22,860,884 |
| Fidelity Series High Income Fund (c) | | 15,369,815 | 121,114,142 |
| Fidelity Series International Credit Fund (c) | | 1,906,722 | 15,005,904 |
| Fidelity Series International Developed Markets Bond Index Fund (c) | | 103,899,317 | 885,222,181 |
| Fidelity Series Investment Grade Bond Fund (c) | | 554,194,116 | 5,408,934,569 |
| Fidelity Series Long-Term Treasury Bond Index Fund (c) | | 184,032,965 | 1,098,676,803 |
| Fidelity Series Real Estate Income Fund (c) | | 6,035,729 | 57,460,137 |
| TOTAL BOND FUNDS (Cost $11,336,884,741) | | | 9,474,144,701 |
| | | | |
| Short-Term Funds - 0.6% |
| | | Shares | Value ($) |
| Fidelity Cash Central Fund 3.10% (d) | | 12,746,543 | 12,749,092 |
| Fidelity Series Government Money Market Fund 3.00% (c)(e) | | 118,636,730 | 118,636,730 |
| TOTAL SHORT-TERM FUNDS (Cost $131,384,726) | | | 131,385,822 |
| | | | |
| TOTAL INVESTMENT IN SECURITIES - 100.0% (Cost $23,966,984,551) | 22,310,007,237 |
NET OTHER ASSETS (LIABILITIES) - 0.0% | (3,355,098) |
| NET ASSETS - 100.0% | 22,306,652,139 |
| | |
| Futures Contracts |
| | Number of contracts | Expiration Date | Notional Amount ($) | Value ($) | Unrealized Appreciation/ (Depreciation) ($) |
| Purchased | | | | | |
| | | | | | |
| Treasury Contracts | | | | | |
| CBOT 10-Year U.S. Treasury Note Contracts (United States) | 3,633 | Dec 2022 | 407,123,063 | (24,913,722) | (24,913,722) |
| CBOT Ultra Long Term U.S. Treasury Bond Contracts (United States) | 341 | Dec 2022 | 46,717,000 | (594,807) | (594,807) |
| | | | | | |
| TOTAL PURCHASED | | | | | (25,508,529) |
| | | | | | |
| Sold | | | | | |
| | | | | | |
| Equity Index Contracts | | | | | |
| CME E-mini S&P 500 Index Contracts (United States) | 491 | Dec 2022 | 88,416,825 | 1,208,323 | 1,208,323 |
| ICE E-mini MSCI EAFE Index Contracts (United States) | 1,190 | Dec 2022 | 98,805,700 | 13,308,759 | 13,308,759 |
| ICE E-mini MSCI Emerging Markets Index Contracts (United States) | 751 | Dec 2022 | 32,724,825 | 47,745 | 47,745 |
| | | | | | |
| TOTAL SOLD | | | | | 14,564,827 |
| | | | | | |
| TOTAL FUTURES CONTRACTS | | | | | (10,943,702) |
| The notional amount of futures purchased as a percentage of Net Assets is 2.0% |
| The notional amount of futures sold as a percentage of Net Assets is 0.9% |
Legend
| (a) | Amount is stated in United States dollars unless otherwise noted. |
| (b) | Security or a portion of the security was pledged to cover margin requirements for futures contracts. At period end, the value of securities pledged amounted to $12,564,884. |
| (d) | Affiliated fund that is generally available only to investment companies and other accounts managed by Fidelity Investments. The rate quoted is the annualized seven-day yield of the fund at period end. A complete unaudited listing of the fund's holdings as of its most recent quarter end is available upon request. In addition, each Fidelity Central Fund's financial statements are available on the SEC's website or upon request. |
| (e) | The rate quoted is the annualized seven-day yield of the fund at period end. |
Affiliated Central Funds
Fiscal year to date information regarding the Fund's investments in Fidelity Central Funds, including the ownership percentage, is presented below.
| Affiliate | Value, beginning of period ($) | Purchases ($) | Sales Proceeds ($) | Dividend Income ($) | Realized Gain (loss) ($) | Change in Unrealized appreciation (depreciation) ($) | Value, end of period ($) | %ownership, end of period |
| Fidelity Cash Central Fund 3.10% | 21,155,238 | 135,007,460 | 143,413,607 | 166,552 | - | 1 | 12,749,092 | 0.0% |
| Total | 21,155,238 | 135,007,460 | 143,413,607 | 166,552 | - | 1 | 12,749,092 | |
| | | | | | | | | |
Amounts in the income column in the above table include any capital gain distributions from underlying funds, which are presented in the corresponding line item in the Statement of Operations, if applicable.
Affiliated Underlying Funds
Fiscal year to date information regarding the Fund's investments in affiliated Underlying Funds is presented below. Exchanges between classes of the same affiliated Underlying Funds may occur. If an Underlying Funds changes its name, the name presented below is the name in effect at period end.
| Affiliate | Value, beginning of period ($) | Purchases ($) | Sales Proceeds ($) | Dividend Income ($) | Realized Gain (loss) ($) | Change in Unrealized appreciation (depreciation) ($) | Value, end of period ($) |
| Fidelity Series 0-5 Year Inflation-Protected Bond Index Fund | - | 137,636,698 | 138,014,660 | - | 377,962 | - | - |
| Fidelity Series 5+ Year Inflation-Protected Bond Index Fund | 1,680,339,392 | 468,560,085 | 115,964,652 | - | (9,502,561) | (314,418,008) | 1,709,014,256 |
| Fidelity Series All-Sector Equity Fund | 322,378,969 | 2,607,508 | 29,377,051 | - | (5,492,496) | (57,538,592) | 232,578,338 |
| Fidelity Series Blue Chip Growth Fund | 529,314,920 | 266,297,047 | 57,156,853 | 18,793,152 | (13,503,331) | (169,034,290) | 555,917,493 |
| Fidelity Series Canada Fund | 592,526,886 | 21,306,250 | 39,187,455 | - | (194,724) | (116,931,812) | 457,519,145 |
| Fidelity Series Commodity Strategy Fund | 424,469,766 | 216,298,742 | 145,012,222 | 194,089,793 | (33,748,455) | (193,952,838) | 268,054,993 |
| Fidelity Series Emerging Markets Debt Fund | 146,332,253 | 3,938,198 | 8,731,316 | 3,631,641 | (2,537,306) | (21,725,278) | 117,276,551 |
| Fidelity Series Emerging Markets Debt Local Currency Fund | 47,940,358 | 110,815 | 4,084,136 | - | (758,617) | (4,629,146) | 38,579,274 |
| Fidelity Series Emerging Markets Fund | 291,628,611 | 16,506,578 | 16,705,219 | - | (1,469,754) | (62,895,287) | 227,064,929 |
| Fidelity Series Emerging Markets Opportunities Fund | 2,627,897,710 | 194,503,930 | 162,874,511 | - | (35,335,415) | (518,246,880) | 2,105,944,834 |
| Fidelity Series Floating Rate High Income Fund | 28,922,765 | 748,832 | 5,375,969 | 689,880 | (613,187) | (821,557) | 22,860,884 |
| Fidelity Series Government Money Market Fund 3.00% | 265,311,330 | 118,803,565 | 265,478,165 | 158,399 | - | - | 118,636,730 |
| Fidelity Series Growth Company Fund | 1,319,291,184 | 232,927,723 | 101,150,780 | - | (8,763,424) | (352,045,554) | 1,090,259,149 |
| Fidelity Series High Income Fund | 172,533,708 | 4,322,699 | 34,867,603 | 4,003,050 | (3,767,517) | (17,107,145) | 121,114,142 |
| Fidelity Series Inflation-Protected Bond Index Fund | 255,849,564 | 2,743,171 | 252,572,724 | 2,722,846 | 5,669,239 | (11,689,250) | - |
| Fidelity Series International Credit Fund | 17,436,644 | 238,066 | 30,447 | 238,067 | (678) | (2,637,681) | 15,005,904 |
| Fidelity Series International Developed Markets Bond Index Fund | 867,338,660 | 195,764,887 | 95,167,554 | 1,409,624 | (8,961,642) | (73,752,170) | 885,222,181 |
| Fidelity Series International Growth Fund | 1,362,401,445 | 104,280,273 | 106,749,654 | - | (15,342,432) | (292,048,230) | 1,052,541,402 |
| Fidelity Series International Small Cap Fund | 373,880,732 | 4,777,892 | 17,411,656 | - | (4,666,239) | (82,392,003) | 274,188,726 |
| Fidelity Series International Value Fund | 1,382,192,947 | 79,724,476 | 108,773,108 | - | (3,705,947) | (292,866,234) | 1,056,572,134 |
| Fidelity Series Intrinsic Opportunities Fund | 1,246,164,372 | 142,940,383 | 633,324,156 | 141,002,218 | 175,533,011 | (429,622,566) | 501,691,044 |
| Fidelity Series Investment Grade Bond Fund | 7,053,019,265 | 253,392,872 | 1,199,331,350 | 89,326,196 | (116,649,749) | (581,496,469) | 5,408,934,569 |
| Fidelity Series Large Cap Stock Fund | 1,173,264,400 | 260,090,571 | 120,502,265 | 61,593,592 | (653,123) | (277,672,725) | 1,034,526,858 |
| Fidelity Series Large Cap Value Index Fund | 441,651,298 | 9,600,249 | 39,094,385 | - | 4,645,426 | (77,302,546) | 339,500,042 |
| Fidelity Series Long-Term Treasury Bond Index Fund | 1,348,794,911 | 164,950,111 | 115,963,686 | 15,877,942 | (13,556,301) | (285,548,232) | 1,098,676,803 |
| Fidelity Series Opportunistic Insights Fund | 675,968,695 | 176,679,630 | 58,264,125 | - | (7,204,289) | (152,206,203) | 634,973,708 |
| Fidelity Series Overseas Fund | 1,375,432,600 | 95,520,836 | 69,046,990 | - | (10,560,544) | (328,766,440) | 1,062,579,462 |
| Fidelity Series Real Estate Income Fund | 105,031,277 | 4,846,762 | 38,700,056 | 4,645,478 | (661,505) | (13,056,341) | 57,460,137 |
| Fidelity Series Short-Term Credit Fund | 66,496,221 | 118,469 | 66,168,113 | 115,183 | (1,764,603) | 1,318,026 | - |
| Fidelity Series Small Cap Discovery Fund | 145,539,018 | 18,343,459 | 15,889,230 | 15,825,582 | 9,893 | (43,072,447) | 104,930,693 |
| Fidelity Series Small Cap Opportunities Fund | 477,492,105 | 24,682,576 | 52,806,153 | 16,483,374 | (7,295,105) | (88,182,647) | 353,890,776 |
| Fidelity Series Stock Selector Large Cap Value Fund | 988,313,245 | 35,197,777 | 108,604,408 | - | 1,355,629 | (164,975,690) | 751,286,553 |
| Fidelity Series Value Discovery Fund | 751,859,102 | 21,191,054 | 86,197,894 | - | 21,062,079 | (120,022,790) | 587,891,551 |
| | 28,557,014,353 | 3,279,652,184 | 4,308,578,546 | 570,606,017 | (98,055,705) | (5,145,339,025) | 22,284,693,261 |
Amounts in the income column in the above table include any capital gain distributions from underlying funds, which are presented in the corresponding line item in the Statement of Operations, if applicable.
Purchases and Sales Proceeds in the table above include the value of shares purchased or redeemed through in-kind transactions, if applicable.
Investment Valuation
The following is a summary of the inputs used, as of September 30, 2022, involving the Fund's assets and liabilities carried at fair value. The inputs or methodology used for valuing securities may not be an indication of the risk associated with investing in those securities. For more information on valuation inputs, and their aggregation into the levels used below, please refer to the Investment Valuation section in the accompanying Notes to Financial Statements.
| Valuation Inputs at Reporting Date: |
| Description | Total ($) | Level 1 ($) | Level 2 ($) | Level 3 ($) |
Investments in Securities: | | | | |
|
| Other Short-Term Investments | 12,564,884 | - | 12,564,884 | - |
|
| Domestic Equity Funds | 6,455,501,198 | 6,455,501,198 | - | - |
|
| International Equity Funds | 6,236,410,632 | 6,236,410,632 | - | - |
|
| Bond Funds | 9,474,144,701 | 9,474,144,701 | - | - |
|
| Short-Term Funds | 131,385,822 | 131,385,822 | - | - |
| Total Investments in Securities: | 22,310,007,237 | 22,297,442,353 | 12,564,884 | - |
Derivative Instruments: | | | | |
|
| Assets | | | | |
Futures Contracts | 14,564,827 | 14,564,827 | - | - |
| Total Assets | 14,564,827 | 14,564,827 | - | - |
|
| Liabilities | | | | |
Futures Contracts | (25,508,529) | (25,508,529) | - | - |
| Total Liabilities | (25,508,529) | (25,508,529) | - | - |
| Total Derivative Instruments: | (10,943,702) | (10,943,702) | - | - |
Value of Derivative Instruments
The following table is a summary of the Fund's value of derivative instruments by primary risk exposure as of September 30, 2022. For additional information on derivative instruments, please refer to the Derivative Instruments section in the accompanying Notes to Financial Statements.
Primary Risk Exposure / Derivative Type | Value |
| Asset ($) | Liability ($) |
| Equity Risk | | |
Futures Contracts (a) | 14,564,827 | 0 |
| Total Equity Risk | 14,564,827 | 0 |
| Interest Rate Risk | | |
Futures Contracts (a) | 0 | (25,508,529) |
| Total Interest Rate Risk | 0 | (25,508,529) |
| Total Value of Derivatives | 14,564,827 | (25,508,529) |
(a)Reflects gross cumulative appreciation (depreciation) on futures contracts as presented in the Schedule of Investments. In the Statement of Assets and Liabilities, the period end daily variation margin is included in receivable or payable for daily variation margin on futures contracts, and the net cumulative appreciation (depreciation) is included in Total accumulated earnings (loss).
Fidelity Freedom® 2025 Fund
| Statement of Assets and Liabilities |
| | | | September 30, 2022 (Unaudited) |
| | | | | |
| Assets | | | | |
| Investment in securities, at value - See accompanying schedule: | $ | | | |
Unaffiliated issuers (cost $12,562,457) | | $12,564,884 | | |
Fidelity Central Funds (cost $12,747,996) | | 12,749,092 | | |
Other affiliated issuers (cost $23,941,674,098) | | 22,284,693,261 | | |
| | | | | |
| Total Investment in Securities (cost $23,966,984,551) | | | $ | 22,310,007,237 |
| Receivable for investments sold | | | | 273,574,917 |
| Receivable for fund shares sold | | | | 20,391,740 |
| Distributions receivable from Fidelity Central Funds | | | | 33,881 |
| Other receivables | | | | 321,261 |
Total assets | | | | 22,604,329,036 |
| Liabilities | | | | |
| Payable for investments purchased | | 247,792,215 | | |
| Payable for fund shares redeemed | | 37,983,083 | | |
| Accrued management fee | | 11,006,328 | | |
| Payable for daily variation margin on futures contracts | | 574,010 | | |
| Other payables and accrued expenses | | 321,261 | | |
| Total Liabilities | | | | 297,676,897 |
| Net Assets | | | $ | 22,306,652,139 |
| Net Assets consist of: | | | | |
| Paid in capital | | | $ | 23,695,811,537 |
| Total accumulated earnings (loss) | | | | (1,389,159,398) |
| Net Assets | | | $ | 22,306,652,139 |
| | | | | |
| Net Asset Value and Maximum Offering Price | | | | |
| Fidelity Freedom 2025 Fund : | | | | |
Net Asset Value , offering price and redemption price per share ($10,407,347,726 ÷ 915,896,424 shares) | | | $ | 11.36 |
| Class K : | | | | |
Net Asset Value , offering price and redemption price per share ($8,208,821,473 ÷ 723,219,959 shares) | | | $ | 11.35 |
| Class K6 : | | | | |
Net Asset Value , offering price and redemption price per share ($3,690,482,940 ÷ 325,967,880 shares) | | | $ | 11.32 |
| Statement of Operations |
| | | | Six months ended September 30, 2022 (Unaudited) |
| Investment Income | | | | |
| Dividends: | | | | |
| Affiliated issuers | | | $ | 335,449,548 |
| Interest | | | | 117,785 |
| Income from Fidelity Central Funds | | | | 166,552 |
| Total Income | | | | 335,733,885 |
| Expenses | | | | |
| Management fee | $ | 71,055,449 | | |
| Independent trustees' fees and expenses | | 44,421 | | |
| Total expenses before reductions | | 71,099,870 | | |
| Expense reductions | | (72) | | |
| Total expenses after reductions | | | | 71,099,798 |
| Net Investment income (loss) | | | | 264,634,087 |
| Realized and Unrealized Gain (Loss) | | | | |
| Net realized gain (loss) on: | | | | |
| Investment Securities: | | | | |
| Unaffiliated issuers | | 2,974 | | |
| Affiliated issuers | | (98,055,705) | | |
| Futures contracts | | (7,853,486) | | |
| Capital gain distributions from underlying funds: | | | | |
| Affiliated issuers | | 235,156,469 | | |
| Total net realized gain (loss) | | | | 129,250,252 |
| Change in net unrealized appreciation (depreciation) on: | | | | |
| Investment Securities: | | | | |
| Unaffiliated issuers | | 2,418 | | |
| Fidelity Central Funds | | 1 | | |
| Other affiliated issuers | | (5,145,339,025) | | |
| Futures contracts | | (19,019,950) | | |
| Total change in net unrealized appreciation (depreciation) | | | | (5,164,356,556) |
| Net gain (loss) | | | | (5,035,106,304) |
| Net increase (decrease) in net assets resulting from operations | | | $ | (4,770,472,217) |
| Statement of Changes in Net Assets |
| |
| | Six months ended September 30, 2022 (Unaudited) | | Year ended March 31, 2022 |
| Increase (Decrease) in Net Assets | | | | |
| Operations | | | | |
| Net investment income (loss) | $ | 264,634,087 | $ | 720,634,141 |
| Net realized gain (loss) | | 129,250,252 | | 2,490,511,189 |
| Change in net unrealized appreciation (depreciation) | | (5,164,356,556) | | (2,774,264,092) |
| Net increase (decrease) in net assets resulting from operations | | (4,770,472,217) | | 436,881,238 |
| Distributions to shareholders | | (1,396,652,226) | | (3,056,045,161) |
| Share transactions - net increase (decrease) | | (113,289,941) | | (652,205,596) |
| Total increase (decrease) in net assets | | (6,280,414,384) | | (3,271,369,519) |
| | | | | |
| Net Assets | | | | |
| Beginning of period | | 28,587,066,523 | | 31,858,436,042 |
| End of period | $ | 22,306,652,139 | $ | 28,587,066,523 |
| | | | | |
| | | | | |
Financial Highlights
| Fidelity Freedom® 2025 Fund |
| |
| | Six months ended (Unaudited) September 30, 2022 | | Years ended March 31, 2022 | | 2021 | | 2020 | | 2019 | | 2018 |
Selected Per-Share Data | | | | | | | | | | | | |
| Net asset value, beginning of period | $ | 14.49 | $ | 15.86 | $ | 12.34 | $ | 13.84 | $ | 14.35 | $ | 13.50 |
| Income from Investment Operations | | | | | | | | | | | | |
Net investment income (loss) A,B | | .13 | | .36 | | .16 | | .24 | | .24 | | .18 |
| Net realized and unrealized gain (loss) | | (2.55) | | (.13) | | 4.25 | | (.87) | | .08 | | 1.26 |
| Total from investment operations | | (2.42) | | .23 | | 4.41 | | (.63) | | .32 | | 1.44 |
| Distributions from net investment income | | - C | | (.37) | | (.17) | | (.25) | | (.23) | | (.18) |
| Distributions from net realized gain | | (.71) | | (1.22) | | (.72) | | (.63) | | (.59) | | (.41) |
| Total distributions | | (.71) | | (1.60) D | | (.89) | | (.87) D | | (.83) D | | (.59) |
| Net asset value, end of period | $ | 11.36 | $ | 14.49 | $ | 15.86 | $ | 12.34 | $ | 13.84 | $ | 14.35 |
Total Return E,F | | (17.20)% | | .99% | | 36.58% | | (5.17)% | | 2.53% | | 10.81% |
Ratios to Average Net Assets B,G,H | | | | | | | | | | | | |
| Expenses before reductions | | .62% I | | .63% | | .64% | | .64% | | .65% | | .56% J |
| Expenses net of fee waivers, if any | | .62% I | | .63% | | .64% | | .64% | | .65% | | .56% J |
| Expenses net of all reductions | | .62% I | | .63% | | .64% | | .64% | | .65% | | .56% J |
| Net investment income (loss) | | 2.02% I | | 2.28% | | 1.07% | | 1.72% | | 1.70% | | 1.28% |
| Supplemental Data | | | | | | | | | | | | |
| Net assets, end of period (000 omitted) | $ | 10,407,348 | $ | 13,230,186 | $ | 13,719,791 | $ | 9,905,175 | $ | 10,953,002 | $ | 10,923,217 |
Portfolio turnover rate K | | 26% I,L | | 35% | | 26% | | 29% | | 19% | | 18% M |
A Calculated based on average shares outstanding during the period.
B Net investment income (loss) is affected by the timing of the declaration of dividends by any underlying mutual funds or exchange-traded funds (ETFs). Net investment income (loss) of any such underlying funds is not included in the Fund's net investment income (loss) ratio.
C Amount represents less than $.005 per share.
D Total distributions per share do not sum due to rounding.
E Total returns for periods of less than one year are not annualized.
F Total returns would have been lower if certain expenses had not been reduced during the applicable periods shown.
G Fees and expenses of any underlying mutual funds or exchange-traded funds (ETFs) are not included in the Fund's expense ratio. The Fund indirectly bears its proportionate share of these expenses. For additional expense information related to investments in Fidelity Central Funds, please refer to the "Investments in Fidelity Central Funds" note found in the Notes to Financial Statements section of the most recent Annual or Semi-Annual report.
H Expense ratios reflect operating expenses of the class. Expenses before reductions do not reflect amounts reimbursed, waived, or reduced through arrangements with the investment adviser, brokerage services, or other offset arrangements, if applicable, and do not represent the amount paid by the class during periods when reimbursements, waivers or reductions occur.
I Annualized
J On certain classes, the size and fluctuation of net assets and expense amounts may cause ratios to differ from contractual rates.
K Amount does not include the portfolio activity of any underlying mutual funds or exchange-traded funds (ETFs).
L Portfolio turnover rate excludes securities received or delivered in-kind.
M The portfolio turnover rate does not include the assets acquired in the merger.
| Fidelity Freedom® 2025 Fund Class K |
| |
| | Six months ended (Unaudited) September 30, 2022 | | Years ended March 31, 2022 | | 2021 | | 2020 | | 2019 | | 2018 A |
Selected Per-Share Data | | | | | | | | | | | | |
| Net asset value, beginning of period | $ | 14.47 | $ | 15.84 | $ | 12.32 | $ | 13.82 | $ | 14.33 | $ | 14.02 |
| Income from Investment Operations | | | | | | | | | | | | |
Net investment income (loss) B,C | | .13 | | .37 | | .17 | | .25 | | .25 | | .23 |
| Net realized and unrealized gain (loss) | | (2.53) | | (.14) | | 4.25 | | (.87) | | .08 | | .50 |
| Total from investment operations | | (2.40) | | .23 | | 4.42 | | (.62) | | .33 | | .73 |
| Distributions from net investment income | | (.01) | | (.38) | | (.18) | | (.26) | | (.24) | | (.18) |
| Distributions from net realized gain | | (.71) | | (1.22) | | (.72) | | (.63) | | (.59) | | (.24) |
| Total distributions | | (.72) | | (1.60) | | (.90) | | (.88) D | | (.84) D | | (.42) |
| Net asset value, end of period | $ | 11.35 | $ | 14.47 | $ | 15.84 | $ | 12.32 | $ | 13.82 | $ | 14.33 |
Total Return E,F | | (17.13)% | | 1.04% | | 36.74% | | (5.11)% | | 2.61% | | 5.18% |
Ratios to Average Net Assets C,G,H | | | | | | | | | | | | |
| Expenses before reductions | | .54% I | | .55% | | .55% | | .56% | | .57% | | .58% I,J |
| Expenses net of fee waivers, if any | | .54% I | | .55% | | .55% | | .56% | | .57% | | .58% I,J |
| Expenses net of all reductions | | .54% I | | .55% | | .55% | | .56% | | .57% | | .58% I,J |
| Net investment income (loss) | | 2.10% I | | 2.36% | | 1.15% | | 1.81% | | 1.79% | | 2.28% I |
| Supplemental Data | | | | | | | | | | | | |
| Net assets, end of period (000 omitted) | $ | 8,208,821 | $ | 11,140,241 | $ | 13,839,951 | $ | 11,470,984 | $ | 13,768,298 | $ | 15,743,238 |
Portfolio turnover rate K | | 26% I,L | | 35% | | 26% | | 29% | | 19% | | 18% M |
A For the period July 20, 2017 (commencement of sale of shares) through March 31, 2018.
B Calculated based on average shares outstanding during the period.
C Net investment income (loss) is affected by the timing of the declaration of dividends by any underlying mutual funds or exchange-traded funds (ETFs). Net investment income (loss) of any such underlying funds is not included in the Fund's net investment income (loss) ratio.
D Total distributions per share do not sum due to rounding.
E Total returns for periods of less than one year are not annualized.
F Total returns would have been lower if certain expenses had not been reduced during the applicable periods shown.
G Fees and expenses of any underlying mutual funds or exchange-traded funds (ETFs) are not included in the Fund's expense ratio. The Fund indirectly bears its proportionate share of these expenses. For additional expense information related to investments in Fidelity Central Funds, please refer to the "Investments in Fidelity Central Funds" note found in the Notes to Financial Statements section of the most recent Annual or Semi-Annual report.
H Expense ratios reflect operating expenses of the class. Expenses before reductions do not reflect amounts reimbursed, waived, or reduced through arrangements with the investment adviser, brokerage services, or other offset arrangements, if applicable, and do not represent the amount paid by the class during periods when reimbursements, waivers or reductions occur.
I Annualized
J On certain classes, the size and fluctuation of net assets and expense amounts may cause ratios to differ from contractual rates.
K Amount does not include the portfolio activity of any underlying mutual funds or exchange-traded funds (ETFs).
L Portfolio turnover rate excludes securities received or delivered in-kind.
M The portfolio turnover rate does not include the assets acquired in the merger.
| Fidelity Freedom® 2025 Fund Class K6 |
| |
| | Six months ended (Unaudited) September 30, 2022 | | Years ended March 31, 2022 | | 2021 | | 2020 | | 2019 | | 2018 A |
Selected Per-Share Data | | | | | | | | | | | | |
| Net asset value, beginning of period | $ | 14.44 | $ | 15.81 | $ | 12.30 | $ | 13.81 | $ | 14.35 | $ | 13.80 |
| Income from Investment Operations | | | | | | | | | | | | |
Net investment income (loss) B,C | | .14 | | .39 | | .18 | | .27 | | .26 | | .21 |
| Net realized and unrealized gain (loss) | | (2.54) | | (.13) | | 4.25 | | (.87) | | .08 | | .76 |
| Total from investment operations | | (2.40) | | .26 | | 4.43 | | (.60) | | .34 | | .97 |
| Distributions from net investment income | | (.01) | | (.40) | | (.20) | | (.28) | | (.29) | | (.19) |
| Distributions from net realized gain | | (.71) | | (1.22) | | (.72) | | (.63) | | (.59) | | (.24) |
| Total distributions | | (.72) | | (1.63) D | | (.92) | | (.91) | | (.88) | | (.42) D |
| Net asset value, end of period | $ | 11.32 | $ | 14.44 | $ | 15.81 | $ | 12.30 | $ | 13.81 | $ | 14.35 |
Total Return E,F | | (17.14)% | | 1.19% | | 36.91% | | (5.02)% | | 2.73% | | 7.02% |
Ratios to Average Net Assets C,G,H | | | | | | | | | | | | |
| Expenses before reductions | | .44% I | | .44% | | .44% | | .45% | | .45% | | .46% I,J |
| Expenses net of fee waivers, if any | | .44% I | | .44% | | .44% | | .45% | | .45% | | .46% I,J |
| Expenses net of all reductions | | .44% I | | .44% | | .44% | | .45% | | .45% | | .46% I,J |
| Net investment income (loss) | | 2.21% I | | 2.46% | | 1.26% | | 1.92% | | 1.90% | | 1.78% I |
| Supplemental Data | | | | | | | | | | | | |
| Net assets, end of period (000 omitted) | $ | 3,690,483 | $ | 4,216,639 | $ | 4,298,694 | $ | 2,897,146 | $ | 2,419,859 | $ | 625,475 |
Portfolio turnover rate K | | 26% I,L | | 35% | | 26% | | 29% | | 19% | | 18% M |
A For the period June 7, 2017 (commencement of sale of shares) through March 31, 2018.
B Calculated based on average shares outstanding during the period.
C Net investment income (loss) is affected by the timing of the declaration of dividends by any underlying mutual funds or exchange-traded funds (ETFs). Net investment income (loss) of any such underlying funds is not included in the Fund's net investment income (loss) ratio.
D Total distributions per share do not sum due to rounding.
E Total returns for periods of less than one year are not annualized.
F Total returns would have been lower if certain expenses had not been reduced during the applicable periods shown.
G Fees and expenses of any underlying mutual funds or exchange-traded funds (ETFs) are not included in the Fund's expense ratio. The Fund indirectly bears its proportionate share of these expenses. For additional expense information related to investments in Fidelity Central Funds, please refer to the "Investments in Fidelity Central Funds" note found in the Notes to Financial Statements section of the most recent Annual or Semi-Annual report.
H Expense ratios reflect operating expenses of the class. Expenses before reductions do not reflect amounts reimbursed, waived, or reduced through arrangements with the investment adviser, brokerage services, or other offset arrangements, if applicable, and do not represent the amount paid by the class during periods when reimbursements, waivers or reductions occur.
I Annualized
J On certain classes, the size and fluctuation of net assets and expense amounts may cause ratios to differ from contractual rates.
K Amount does not include the portfolio activity of any underlying mutual funds or exchange-traded funds (ETFs).
L Portfolio turnover rate excludes securities received or delivered in-kind.
M The portfolio turnover rate does not include the assets acquired in the merger.
The information in the following table is based on the direct Investments of the Fund.
Top Holdings (% of Fund's net assets) |
| |
| Fidelity Series Investment Grade Bond Fund | 21.5 | |
| Fidelity Series Emerging Markets Opportunities Fund | 10.1 | |
| Fidelity Series Growth Company Fund | 5.6 | |
| Fidelity Series Long-Term Treasury Bond Index Fund | 5.3 | |
| Fidelity Series Large Cap Stock Fund | 5.3 | |
| Fidelity Series Overseas Fund | 5.3 | |
| Fidelity Series International Value Fund | 5.2 | |
| Fidelity Series International Growth Fund | 5.2 | |
| Fidelity Series International Developed Markets Bond Index Fund | 3.9 | |
| Fidelity Series Stock Selector Large Cap Value Fund | 3.8 | |
| | 71.2 | |
| |
Domestic Equity Funds category includes Fidelity Series Commodity Strategy Fund which invests in commodity-related investments.
Asset Allocation (% of Fund's net assets) |
|
Percentages shown as 0.0% may reflect amounts less than 0.05%. |
|
Fidelity Freedom® 2030 Fund
Showing Percentage of Net Assets
| U.S. Treasury Obligations - 0.0% |
| | | Principal Amount (a) | Value ($) |
U.S. Treasury Bills, yield at date of purchase 2.13% to 3.29% 10/13/22 to 12/29/22 (b) (Cost $16,341,265) | | 16,380,000 | 16,342,849 |
| | | | |
| Domestic Equity Funds - 32.9% |
| | | Shares | Value ($) |
| Fidelity Series All-Sector Equity Fund (c) | | 40,508,129 | 347,559,743 |
| Fidelity Series Blue Chip Growth Fund (c) | | 82,742,970 | 830,739,423 |
| Fidelity Series Commodity Strategy Fund (c) | | 168,485,563 | 352,134,826 |
| Fidelity Series Growth Company Fund (c) | | 121,404,366 | 1,629,246,590 |
| Fidelity Series Intrinsic Opportunities Fund (c) | | 57,075,887 | 751,118,679 |
| Fidelity Series Large Cap Stock Fund (c) | | 104,669,351 | 1,545,966,317 |
| Fidelity Series Large Cap Value Index Fund (c) | | 39,885,256 | 507,340,457 |
| Fidelity Series Opportunistic Insights Fund (c) | | 66,877,282 | 950,326,171 |
| Fidelity Series Small Cap Discovery Fund (c) | | 16,731,038 | 156,937,133 |
| Fidelity Series Small Cap Opportunities Fund (c) | | 49,058,435 | 528,849,927 |
| Fidelity Series Stock Selector Large Cap Value Fund (c) | | 100,510,607 | 1,122,703,478 |
| Fidelity Series Value Discovery Fund (c) | | 63,869,457 | 879,482,419 |
| TOTAL DOMESTIC EQUITY FUNDS (Cost $9,032,831,583) | | | 9,602,405,163 |
| | | | |
| International Equity Funds - 30.6% |
| | | Shares | Value ($) |
| Fidelity Series Canada Fund (c) | | 53,521,245 | 663,663,440 |
| Fidelity Series Emerging Markets Fund (c) | | 44,287,595 | 320,642,190 |
| Fidelity Series Emerging Markets Opportunities Fund (c) | | 204,095,056 | 2,963,460,214 |
| Fidelity Series International Growth Fund (c) | | 119,021,077 | 1,525,850,210 |
| Fidelity Series International Small Cap Fund (c) | | 29,066,330 | 397,627,401 |
| Fidelity Series International Value Fund (c) | | 178,310,552 | 1,531,687,640 |
| Fidelity Series Overseas Fund (c) | | 161,636,507 | 1,540,395,908 |
| TOTAL INTERNATIONAL EQUITY FUNDS (Cost $9,443,124,135) | | | 8,943,327,003 |
| | | | |
| Bond Funds - 35.9% |
| | | Shares | Value ($) |
| Fidelity Series 5+ Year Inflation-Protected Bond Index Fund (c) | | 129,364,968 | 1,033,626,096 |
| Fidelity Series Emerging Markets Debt Fund (c) | | 22,397,706 | 153,648,262 |
| Fidelity Series Emerging Markets Debt Local Currency Fund (c) | | 6,341,810 | 50,544,229 |
| Fidelity Series Floating Rate High Income Fund (c) | | 3,553,549 | 30,915,877 |
| Fidelity Series High Income Fund (c) | | 20,136,418 | 158,674,976 |
| Fidelity Series International Credit Fund (c) | | 1,867,321 | 14,695,816 |
| Fidelity Series International Developed Markets Bond Index Fund (c) | | 134,745,258 | 1,148,029,594 |
| Fidelity Series Investment Grade Bond Fund (c) | | 642,329,356 | 6,269,134,513 |
| Fidelity Series Long-Term Treasury Bond Index Fund (c) | | 261,441,490 | 1,560,805,695 |
| Fidelity Series Real Estate Income Fund (c) | | 7,908,745 | 75,291,251 |
| TOTAL BOND FUNDS (Cost $12,585,508,288) | | | 10,495,366,309 |
| | | | |
| Short-Term Funds - 0.6% |
| | | Shares | Value ($) |
| Fidelity Cash Central Fund 3.10% (d) | | 15,643,697 | 15,646,826 |
| Fidelity Series Government Money Market Fund 3.00% (c)(e) | | 156,388,633 | 156,388,633 |
| TOTAL SHORT-TERM FUNDS (Cost $172,034,669) | | | 172,035,459 |
| | | | |
| TOTAL INVESTMENT IN SECURITIES - 100.0% (Cost $31,249,839,940) | 29,229,476,783 |
NET OTHER ASSETS (LIABILITIES) - 0.0% | (3,927,880) |
| NET ASSETS - 100.0% | 29,225,548,903 |
| | |
| Futures Contracts |
| | Number of contracts | Expiration Date | Notional Amount ($) | Value ($) | Unrealized Appreciation/ (Depreciation) ($) |
| Purchased | | | | | |
| | | | | | |
| Treasury Contracts | | | | | |
| CBOT 10-Year U.S. Treasury Note Contracts (United States) | 4,759 | Dec 2022 | 533,305,438 | (32,576,729) | (32,576,729) |
| CBOT Ultra Long Term U.S. Treasury Bond Contracts (United States) | 447 | Dec 2022 | 61,239,000 | (777,221) | (777,221) |
| | | | | | |
| TOTAL PURCHASED | | | | | (33,353,950) |
| | | | | | |
| Sold | | | | | |
| | | | | | |
| Equity Index Contracts | | | | | |
| CME E-mini S&P 500 Index Contracts (United States) | 637 | Dec 2022 | 114,707,775 | 1,326,197 | 1,326,197 |
| ICE E-mini MSCI EAFE Index Contracts (United States) | 1,535 | Dec 2022 | 127,451,050 | 17,239,865 | 17,239,865 |
| ICE E-mini MSCI Emerging Markets Index Contracts (United States) | 986 | Dec 2022 | 42,964,950 | 72,712 | 72,712 |
| | | | | | |
| TOTAL SOLD | | | | | 18,638,774 |
| | | | | | |
| TOTAL FUTURES CONTRACTS | | | | | (14,715,176) |
| The notional amount of futures purchased as a percentage of Net Assets is 2.0% |
| The notional amount of futures sold as a percentage of Net Assets is 0.9% |
Legend
| (a) | Amount is stated in United States dollars unless otherwise noted. |
| (b) | Security or a portion of the security was pledged to cover margin requirements for futures contracts. At period end, the value of securities pledged amounted to $16,342,849. |
| (d) | Affiliated fund that is generally available only to investment companies and other accounts managed by Fidelity Investments. The rate quoted is the annualized seven-day yield of the fund at period end. A complete unaudited listing of the fund's holdings as of its most recent quarter end is available upon request. In addition, each Fidelity Central Fund's financial statements are available on the SEC's website or upon request. |
| (e) | The rate quoted is the annualized seven-day yield of the fund at period end. |
Affiliated Central Funds
Fiscal year to date information regarding the Fund's investments in Fidelity Central Funds, including the ownership percentage, is presented below.
| Affiliate | Value, beginning of period ($) | Purchases ($) | Sales Proceeds ($) | Dividend Income ($) | Realized Gain (loss) ($) | Change in Unrealized appreciation (depreciation) ($) | Value, end of period ($) | %ownership, end of period |
| Fidelity Cash Central Fund 3.10% | 32,227,303 | 165,586,093 | 182,166,571 | 205,152 | 316 | (315) | 15,646,826 | 0.0% |
| Total | 32,227,303 | 165,586,093 | 182,166,571 | 205,152 | 316 | (315) | 15,646,826 | |
| | | | | | | | | |
Amounts in the income column in the above table include any capital gain distributions from underlying funds, which are presented in the corresponding line item in the Statement of Operations, if applicable.
Affiliated Underlying Funds
Fiscal year to date information regarding the Fund's investments in affiliated Underlying Funds is presented below. Exchanges between classes of the same affiliated Underlying Funds may occur. If an Underlying Funds changes its name, the name presented below is the name in effect at period end.
| Affiliate | Value, beginning of period ($) | Purchases ($) | Sales Proceeds ($) | Dividend Income ($) | Realized Gain (loss) ($) | Change in Unrealized appreciation (depreciation) ($) | Value, end of period ($) |
| Fidelity Series 0-5 Year Inflation-Protected Bond Index Fund | - | 129,217,515 | 129,621,762 | - | 404,247 | - | - |
| Fidelity Series 5+ Year Inflation-Protected Bond Index Fund | 954,278,596 | 296,964,636 | 27,542,865 | - | (926,568) | (189,147,703) | 1,033,626,096 |
| Fidelity Series All-Sector Equity Fund | 468,820,867 | 3,477,155 | 31,963,970 | - | (6,469,415) | (86,304,894) | 347,559,743 |
| Fidelity Series Blue Chip Growth Fund | 769,724,642 | 394,170,307 | 63,415,055 | 28,008,161 | (19,216,899) | (250,523,572) | 830,739,423 |
| Fidelity Series Canada Fund | 838,514,271 | 34,166,124 | 41,219,627 | - | (955,874) | (166,841,454) | 663,663,440 |
| Fidelity Series Commodity Strategy Fund | 541,975,807 | 284,353,316 | 176,625,360 | 253,643,450 | (44,676,323) | (252,892,614) | 352,134,826 |
| Fidelity Series Emerging Markets Debt Fund | 186,960,349 | 6,655,080 | 8,556,074 | 4,704,085 | (614,319) | (30,796,774) | 153,648,262 |
| Fidelity Series Emerging Markets Debt Local Currency Fund | 61,034,033 | 1,076,800 | 4,590,899 | - | (690,157) | (6,285,548) | 50,544,229 |
| Fidelity Series Emerging Markets Fund | 399,058,446 | 23,227,283 | 12,223,949 | - | (1,782,721) | (87,636,869) | 320,642,190 |
| Fidelity Series Emerging Markets Opportunities Fund | 3,595,901,366 | 267,344,859 | 130,763,814 | - | (30,609,624) | (738,412,573) | 2,963,460,214 |
| Fidelity Series Floating Rate High Income Fund | 36,849,698 | 1,075,008 | 5,155,071 | 892,568 | (541,555) | (1,312,203) | 30,915,877 |
| Fidelity Series Government Money Market Fund 3.00% | 147,269,053 | 156,645,665 | 147,526,085 | 93,120 | - | - | 156,388,633 |
| Fidelity Series Growth Company Fund | 1,918,589,106 | 345,207,621 | 103,755,741 | - | (14,363,259) | (516,431,137) | 1,629,246,590 |
| Fidelity Series High Income Fund | 220,946,180 | 6,200,093 | 41,447,435 | 5,182,513 | (4,232,752) | (22,791,110) | 158,674,976 |
| Fidelity Series Inflation-Protected Bond Index Fund | 243,555,639 | 3,871,446 | 240,664,952 | 3,536,107 | 5,189,947 | (11,952,080) | - |
| Fidelity Series International Credit Fund | 17,072,710 | 233,098 | 26,617 | 233,098 | (593) | (2,582,782) | 14,695,816 |
| Fidelity Series International Developed Markets Bond Index Fund | 1,101,969,074 | 257,109,635 | 104,401,067 | 1,802,336 | (10,084,621) | (96,563,427) | 1,148,029,594 |
| Fidelity Series International Growth Fund | 1,921,789,584 | 150,023,912 | 106,403,997 | - | (18,964,723) | (420,594,566) | 1,525,850,210 |
| Fidelity Series International Small Cap Fund | 528,272,673 | 6,465,624 | 12,183,184 | - | (2,573,806) | (122,353,906) | 397,627,401 |
| Fidelity Series International Value Fund | 1,945,562,363 | 117,877,474 | 106,554,347 | - | (4,656,019) | (420,541,831) | 1,531,687,640 |
| Fidelity Series Intrinsic Opportunities Fund | 1,810,514,645 | 217,876,988 | 899,732,555 | 210,407,406 | 235,107,328 | (612,647,727) | 751,118,679 |
| Fidelity Series Investment Grade Bond Fund | 7,989,906,197 | 331,806,106 | 1,252,304,361 | 102,233,223 | (112,844,669) | (687,428,760) | 6,269,134,513 |
| Fidelity Series Large Cap Stock Fund | 1,706,251,208 | 386,026,380 | 134,370,933 | 91,279,996 | (3,663,892) | (408,276,446) | 1,545,966,317 |
| Fidelity Series Large Cap Value Index Fund | 642,254,176 | 16,364,498 | 43,794,881 | - | 4,479,114 | (111,962,450) | 507,340,457 |
| Fidelity Series Long-Term Treasury Bond Index Fund | 1,844,800,860 | 253,985,606 | 120,999,550 | 22,206,669 | (18,254,782) | (398,726,439) | 1,560,805,695 |
| Fidelity Series Opportunistic Insights Fund | 983,018,276 | 263,972,565 | 61,497,266 | - | (9,813,986) | (225,353,418) | 950,326,171 |
| Fidelity Series Overseas Fund | 1,933,452,952 | 142,945,382 | 51,451,293 | - | (6,260,320) | (478,290,813) | 1,540,395,908 |
| Fidelity Series Real Estate Income Fund | 133,804,664 | 6,472,591 | 47,337,029 | 6,040,731 | (985,123) | (16,663,852) | 75,291,251 |
| Fidelity Series Short-Term Credit Fund | 36,910,085 | 108,280 | 36,771,632 | 64,814 | (622,471) | 375,738 | - |
| Fidelity Series Small Cap Discovery Fund | 211,127,819 | 27,548,598 | 18,326,379 | 23,241,592 | (1,326,456) | (62,086,449) | 156,937,133 |
| Fidelity Series Small Cap Opportunities Fund | 694,385,560 | 36,445,839 | 61,105,303 | 24,553,104 | (7,817,708) | (133,058,461) | 528,849,927 |
| Fidelity Series Stock Selector Large Cap Value Fund | 1,437,250,323 | 55,976,932 | 128,649,666 | - | (5,430,187) | (236,443,924) | 1,122,703,478 |
| Fidelity Series Value Discovery Fund | 1,093,397,839 | 34,566,479 | 102,118,442 | - | 18,785,200 | (165,148,657) | 879,482,419 |
| | 36,415,219,061 | 4,259,458,895 | 4,453,101,161 | 778,122,973 | (64,412,986) | (6,959,676,701) | 29,197,487,108 |
Amounts in the income column in the above table include any capital gain distributions from underlying funds, which are presented in the corresponding line item in the Statement of Operations, if applicable.
Purchases and Sales Proceeds in the table above include the value of shares purchased or redeemed through in-kind transactions, if applicable.
Investment Valuation
The following is a summary of the inputs used, as of September 30, 2022, involving the Fund's assets and liabilities carried at fair value. The inputs or methodology used for valuing securities may not be an indication of the risk associated with investing in those securities. For more information on valuation inputs, and their aggregation into the levels used below, please refer to the Investment Valuation section in the accompanying Notes to Financial Statements.
| Valuation Inputs at Reporting Date: |
| Description | Total ($) | Level 1 ($) | Level 2 ($) | Level 3 ($) |
Investments in Securities: | | | | |
|
| Other Short-Term Investments | 16,342,849 | - | 16,342,849 | - |
|
| Domestic Equity Funds | 9,602,405,163 | 9,602,405,163 | - | - |
|
| International Equity Funds | 8,943,327,003 | 8,943,327,003 | - | - |
|
| Bond Funds | 10,495,366,309 | 10,495,366,309 | - | - |
|
| Short-Term Funds | 172,035,459 | 172,035,459 | - | - |
| Total Investments in Securities: | 29,229,476,783 | 29,213,133,934 | 16,342,849 | - |
Derivative Instruments: | | | | |
|
| Assets | | | | |
Futures Contracts | 18,638,774 | 18,638,774 | - | - |
| Total Assets | 18,638,774 | 18,638,774 | - | - |
|
| Liabilities | | | | |
Futures Contracts | (33,353,950) | (33,353,950) | - | - |
| Total Liabilities | (33,353,950) | (33,353,950) | - | - |
| Total Derivative Instruments: | (14,715,176) | (14,715,176) | - | - |
Value of Derivative Instruments
The following table is a summary of the Fund's value of derivative instruments by primary risk exposure as of September 30, 2022. For additional information on derivative instruments, please refer to the Derivative Instruments section in the accompanying Notes to Financial Statements.
Primary Risk Exposure / Derivative Type | Value |
| Asset ($) | Liability ($) |
| Equity Risk | | |
Futures Contracts (a) | 18,638,774 | 0 |
| Total Equity Risk | 18,638,774 | 0 |
| Interest Rate Risk | | |
Futures Contracts (a) | 0 | (33,353,950) |
| Total Interest Rate Risk | 0 | (33,353,950) |
| Total Value of Derivatives | 18,638,774 | (33,353,950) |
(a)Reflects gross cumulative appreciation (depreciation) on futures contracts as presented in the Schedule of Investments. In the Statement of Assets and Liabilities, the period end daily variation margin is included in receivable or payable for daily variation margin on futures contracts, and the net cumulative appreciation (depreciation) is included in Total accumulated earnings (loss).
Fidelity Freedom® 2030 Fund
| Statement of Assets and Liabilities |
| | | | September 30, 2022 (Unaudited) |
| | | | | |
| Assets | | | | |
| Investment in securities, at value - See accompanying schedule: | $ | | | |
Unaffiliated issuers (cost $16,341,265) | | $16,342,849 | | |
Fidelity Central Funds (cost $15,646,036) | | 15,646,826 | | |
Other affiliated issuers (cost $31,217,852,639) | | 29,197,487,108 | | |
| | | | | |
| Total Investment in Securities (cost $31,249,839,940) | | | $ | 29,229,476,783 |
| Receivable for investments sold | | | | 341,744,720 |
| Receivable for fund shares sold | | | | 26,289,281 |
| Distributions receivable from Fidelity Central Funds | | | | 34,537 |
| Other receivables | | | | 323,053 |
Total assets | | | | 29,597,868,374 |
| Liabilities | | | | |
| Payable for investments purchased | | 320,456,438 | | |
| Payable for fund shares redeemed | | 35,362,762 | | |
| Accrued management fee | | 15,297,407 | | |
| Payable for daily variation margin on futures contracts | | 879,811 | | |
| Other payables and accrued expenses | | 323,053 | | |
| Total Liabilities | | | | 372,319,471 |
| Net Assets | | | $ | 29,225,548,903 |
| Net Assets consist of: | | | | |
| Paid in capital | | | $ | 30,797,534,933 |
| Total accumulated earnings (loss) | | | | (1,571,986,030) |
| Net Assets | | | $ | 29,225,548,903 |
| | | | | |
| Net Asset Value and Maximum Offering Price | | | | |
| Fidelity Freedom 2030 Fund : | | | | |
Net Asset Value , offering price and redemption price per share ($13,342,608,561 ÷ 944,179,507 shares) | | | $ | 14.13 |
| Class K : | | | | |
Net Asset Value , offering price and redemption price per share ($10,933,047,191 ÷ 773,986,878 shares) | | | $ | 14.13 |
| Class K6 : | | | | |
Net Asset Value , offering price and redemption price per share ($4,949,893,151 ÷ 351,461,961 shares) | | | $ | 14.08 |
| Statement of Operations |
| | | | Six months ended September 30, 2022 (Unaudited) |
| Investment Income | | | | |
| Dividends: | | | | |
| Affiliated issuers | | | $ | 428,539,186 |
| Interest | | | | 162,955 |
| Income from Fidelity Central Funds | | | | 205,152 |
| Total Income | | | | 428,907,293 |
| Expenses | | | | |
| Management fee | $ | 97,592,007 | | |
| Independent trustees' fees and expenses | | 57,007 | | |
| Total expenses before reductions | | 97,649,014 | | |
| Expense reductions | | (71) | | |
| Total expenses after reductions | | | | 97,648,943 |
| Net Investment income (loss) | | | | 331,258,350 |
| Realized and Unrealized Gain (Loss) | | | | |
| Net realized gain (loss) on: | | | | |
| Investment Securities: | | | | |
| Unaffiliated issuers | | 4,484 | | |
| Fidelity Central Funds | | 316 | | |
| Other affiliated issuers | | (64,412,986) | | |
| Futures contracts | | (11,604,580) | | |
| Capital gain distributions from underlying funds: | | | | |
| Affiliated issuers | | 349,583,787 | | |
| Total net realized gain (loss) | | | | 273,571,021 |
| Change in net unrealized appreciation (depreciation) on: | | | | |
| Investment Securities: | | | | |
| Unaffiliated issuers | | 1,496 | | |
| Fidelity Central Funds | | (315) | | |
| Other affiliated issuers | | (6,959,676,701) | | |
| Futures contracts | | (24,127,145) | | |
| Total change in net unrealized appreciation (depreciation) | | | | (6,983,802,665) |
| Net gain (loss) | | | | (6,710,231,644) |
| Net increase (decrease) in net assets resulting from operations | | | $ | (6,378,973,294) |
| Statement of Changes in Net Assets |
| |
| | Six months ended September 30, 2022 (Unaudited) | | Year ended March 31, 2022 |
| Increase (Decrease) in Net Assets | | | | |
| Operations | | | | |
| Net investment income (loss) | $ | 331,258,350 | $ | 898,465,474 |
| Net realized gain (loss) | | 273,571,021 | | 3,328,156,548 |
| Change in net unrealized appreciation (depreciation) | | (6,983,802,665) | | (3,546,839,721) |
| Net increase (decrease) in net assets resulting from operations | | (6,378,973,294) | | 679,782,301 |
| Distributions to shareholders | | (1,871,319,671) | | (4,024,014,410) |
| Share transactions - net increase (decrease) | | 1,016,795,456 | | 832,976,200 |
| Total increase (decrease) in net assets | | (7,233,497,509) | | (2,511,255,909) |
| | | | | |
| Net Assets | | | | |
| Beginning of period | | 36,459,046,412 | | 38,970,302,321 |
| End of period | $ | 29,225,548,903 | $ | 36,459,046,412 |
| | | | | |
| | | | | |
Financial Highlights
| Fidelity Freedom® 2030 Fund |
| |
| | Six months ended (Unaudited) September 30, 2022 | | Years ended March 31, 2022 | | 2021 | | 2020 | | 2019 | | 2018 |
Selected Per-Share Data | | | | | | | | | | | | |
| Net asset value, beginning of period | $ | 18.18 | $ | 19.92 | $ | 14.98 | $ | 17.20 | $ | 18.00 | $ | 16.72 |
| Income from Investment Operations | | | | | | | | | | | | |
Net investment income (loss) A,B | | .15 | | .45 | | .19 | | .29 | | .28 | | .21 |
| Net realized and unrealized gain (loss) | | (3.27) | | (.08) | | 5.95 | | (1.30) | | .07 | | 1.90 |
| Total from investment operations | | (3.12) | | .37 | | 6.14 | | (1.01) | | .35 | | 2.11 |
| Distributions from net investment income | | - | | (.46) | | (.21) | | (.30) | | (.28) | | (.22) |
| Distributions from net realized gain | | (.93) | | (1.65) | | (1.00) | | (.92) | | (.87) | | (.61) |
| Total distributions | | (.93) | | (2.11) | | (1.20) C | | (1.21) C | | (1.15) | | (.83) |
| Net asset value, end of period | $ | 14.13 | $ | 18.18 | $ | 19.92 | $ | 14.98 | $ | 17.20 | $ | 18.00 |
Total Return D,E | | (17.70)% | | 1.41% | | 42.14% | | (6.69)% | | 2.32% | | 12.78% |
Ratios to Average Net Assets B,F,G | | | | | | | | | | | | |
| Expenses before reductions | | .66% H | | .67% | | .68% | | .69% | | .69% I | | .59% |
| Expenses net of fee waivers, if any | | .66% H | | .67% | | .68% | | .69% | | .69% I | | .59% |
| Expenses net of all reductions | | .66% H | | .67% | | .68% | | .69% | | .69% I | | .59% |
| Net investment income (loss) | | 1.95% H | | 2.26% | | 1.06% | | 1.68% | | 1.61% | | 1.20% |
| Supplemental Data | | | | | | | | | | | | |
| Net assets, end of period (000 omitted) | $ | 13,342,609 | $ | 16,667,165 | $ | 16,799,087 | $ | 11,724,021 | $ | 12,905,055 | $ | 12,684,794 |
Portfolio turnover rate J | | 26% H,K | | 33% | | 26% | | 31% | | 18% | | 18% L |
A Calculated based on average shares outstanding during the period.
B Net investment income (loss) is affected by the timing of the declaration of dividends by any underlying mutual funds or exchange-traded funds (ETFs). Net investment income (loss) of any such underlying funds is not included in the Fund's net investment income (loss) ratio.
C Total distributions per share do not sum due to rounding.
D Total returns for periods of less than one year are not annualized.
E Total returns would have been lower if certain expenses had not been reduced during the applicable periods shown.
F Fees and expenses of any underlying mutual funds or exchange-traded funds (ETFs) are not included in the Fund's expense ratio. The Fund indirectly bears its proportionate share of these expenses. For additional expense information related to investments in Fidelity Central Funds, please refer to the "Investments in Fidelity Central Funds" note found in the Notes to Financial Statements section of the most recent Annual or Semi-Annual report.
G Expense ratios reflect operating expenses of the class. Expenses before reductions do not reflect amounts reimbursed, waived, or reduced through arrangements with the investment adviser, brokerage services, or other offset arrangements, if applicable, and do not represent the amount paid by the class during periods when reimbursements, waivers or reductions occur.
H Annualized
I On certain classes, the size and fluctuation of net assets and expense amounts may cause ratios to differ from contractual rates.
J Amount does not include the portfolio activity of any underlying mutual funds or exchange-traded funds (ETFs).
K Portfolio turnover rate excludes securities received or delivered in-kind.
L The portfolio turnover rate does not include the assets acquired in the merger.
| Fidelity Freedom® 2030 Fund Class K |
| |
| | Six months ended (Unaudited) September 30, 2022 | | Years ended March 31, 2022 | | 2021 | | 2020 | | 2019 | | 2018 A |
Selected Per-Share Data | | | | | | | | | | | | |
| Net asset value, beginning of period | $ | 18.17 | $ | 19.90 | $ | 14.97 | $ | 17.18 | $ | 17.98 | $ | 17.47 |
| Income from Investment Operations | | | | | | | | | | | | |
Net investment income (loss) B,C | | .16 | | .47 | | .21 | | .30 | | .30 | | .28 |
| Net realized and unrealized gain (loss) | | (3.26) | | (.08) | | 5.94 | | (1.29) | | .06 | | .81 |
| Total from investment operations | | (3.10) | | .39 | | 6.15 | | (.99) | | .36 | | 1.09 |
| Distributions from net investment income | | - D | | (.47) | | (.22) | | (.31) | | (.29) | | (.24) |
| Distributions from net realized gain | | (.93) | | (1.65) | | (1.00) | | (.92) | | (.87) | | (.35) |
| Total distributions | | (.94) E | | (2.12) | | (1.22) | | (1.22) E | | (1.16) | | (.58) E |
| Net asset value, end of period | $ | 14.13 | $ | 18.17 | $ | 19.90 | $ | 14.97 | $ | 17.18 | $ | 17.98 |
Total Return F,G | | (17.63)% | | 1.52% | | 42.20% | | (6.57)% | | 2.40% | | 6.24% |
Ratios to Average Net Assets C,H,I | | | | | | | | | | | | |
| Expenses before reductions | | .57% J | | .58% | | .59% | | .59% | | .60% | | .62% J,K |
| Expenses net of fee waivers, if any | | .57% J | | .58% | | .59% | | .59% | | .60% | | .62% J,K |
| Expenses net of all reductions | | .57% J | | .58% | | .59% | | .59% | | .60% | | .62% J,K |
| Net investment income (loss) | | 2.04% J | | 2.35% | | 1.15% | | 1.77% | | 1.70% | | 2.23% J |
| Supplemental Data | | | | | | | | | | | | |
| Net assets, end of period (000 omitted) | $ | 10,933,047 | $ | 14,350,456 | $ | 17,173,513 | $ | 13,601,568 | $ | 16,527,856 | $ | 18,414,961 |
Portfolio turnover rate L | | 26% J,M | | 33% | | 26% | | 31% | | 18% | | 18% N |
A For the period July 20, 2017 (commencement of sale of shares) through March 31, 2018.
B Calculated based on average shares outstanding during the period.
C Net investment income (loss) is affected by the timing of the declaration of dividends by any underlying mutual funds or exchange-traded funds (ETFs). Net investment income (loss) of any such underlying funds is not included in the Fund's net investment income (loss) ratio.
D Amount represents less than $.005 per share.
E Total distributions per share do not sum due to rounding.
F Total returns for periods of less than one year are not annualized.
G Total returns would have been lower if certain expenses had not been reduced during the applicable periods shown.
H Fees and expenses of any underlying mutual funds or exchange-traded funds (ETFs) are not included in the Fund's expense ratio. The Fund indirectly bears its proportionate share of these expenses. For additional expense information related to investments in Fidelity Central Funds, please refer to the "Investments in Fidelity Central Funds" note found in the Notes to Financial Statements section of the most recent Annual or Semi-Annual report.
I Expense ratios reflect operating expenses of the class. Expenses before reductions do not reflect amounts reimbursed, waived, or reduced through arrangements with the investment adviser, brokerage services, or other offset arrangements, if applicable, and do not represent the amount paid by the class during periods when reimbursements, waivers or reductions occur.
J Annualized
K On certain classes, the size and fluctuation of net assets and expense amounts may cause ratios to differ from contractual rates.
L Amount does not include the portfolio activity of any underlying mutual funds or exchange-traded funds (ETFs).
M Portfolio turnover rate excludes securities received or delivered in-kind.
N The portfolio turnover rate does not include the assets acquired in the merger.
| Fidelity Freedom® 2030 Fund Class K6 |
| |
| | Six months ended (Unaudited) September 30, 2022 | | Years ended March 31, 2022 | | 2021 | | 2020 | | 2019 | | 2018 A |
Selected Per-Share Data | | | | | | | | | | | | |
| Net asset value, beginning of period | $ | 18.12 | $ | 19.86 | $ | 14.94 | $ | 17.17 | $ | 18.00 | $ | 17.15 |
| Income from Investment Operations | | | | | | | | | | | | |
Net investment income (loss) B,C | | .17 | | .49 | | .23 | | .33 | | .31 | | .26 |
| Net realized and unrealized gain (loss) | | (3.27) | | (.07) | | 5.94 | | (1.30) | | .08 | | 1.18 |
| Total from investment operations | | (3.10) | | .42 | | 6.17 | | (.97) | | .39 | | 1.44 |
| Distributions from net investment income | | (.01) | | (.50) | | (.25) | | (.34) | | (.33) | | (.24) |
| Distributions from net realized gain | | (.93) | | (1.66) | | (1.00) | | (.92) | | (.89) | | (.35) |
| Total distributions | | (.94) | | (2.16) | | (1.25) | | (1.26) | | (1.22) | | (.59) |
| Net asset value, end of period | $ | 14.08 | $ | 18.12 | $ | 19.86 | $ | 14.94 | $ | 17.17 | $ | 18.00 |
Total Return D,E | | (17.65)% | | 1.64% | | 42.45% | | (6.52)% | | 2.57% | | 8.35% |
Ratios to Average Net Assets C,F,G | | | | | | | | | | | | |
| Expenses before reductions | | .45% H | | .46% | | .46% | | .47% | | .47% | | .48% H,I |
| Expenses net of fee waivers, if any | | .45% H | | .46% | | .46% | | .47% | | .47% | | .48% H,I |
| Expenses net of all reductions | | .45% H | | .46% | | .46% | | .47% | | .47% | | .48% H,I |
| Net investment income (loss) | | 2.16% H | | 2.47% | | 1.28% | | 1.90% | | 1.83% | | 1.76% H |
| Supplemental Data | | | | | | | | | | | | |
| Net assets, end of period (000 omitted) | $ | 4,949,893 | $ | 5,441,425 | $ | 4,997,702 | $ | 3,208,497 | $ | 2,637,856 | $ | 821,874 |
Portfolio turnover rate J | | 26% H,K | | 33% | | 26% | | 31% | | 18% | | 18% L |
A For the period June 7, 2017 (commencement of sale of shares) through March 31, 2018.
B Calculated based on average shares outstanding during the period.
C Net investment income (loss) is affected by the timing of the declaration of dividends by any underlying mutual funds or exchange-traded funds (ETFs). Net investment income (loss) of any such underlying funds is not included in the Fund's net investment income (loss) ratio.
D Total returns for periods of less than one year are not annualized.
E Total returns would have been lower if certain expenses had not been reduced during the applicable periods shown.
F Fees and expenses of any underlying mutual funds or exchange-traded funds (ETFs) are not included in the Fund's expense ratio. The Fund indirectly bears its proportionate share of these expenses. For additional expense information related to investments in Fidelity Central Funds, please refer to the "Investments in Fidelity Central Funds" note found in the Notes to Financial Statements section of the most recent Annual or Semi-Annual report.
G Expense ratios reflect operating expenses of the class. Expenses before reductions do not reflect amounts reimbursed, waived, or reduced through arrangements with the investment adviser, brokerage services, or other offset arrangements, if applicable, and do not represent the amount paid by the class during periods when reimbursements, waivers or reductions occur.
H Annualized
I On certain classes, the size and fluctuation of net assets and expense amounts may cause ratios to differ from contractual rates.
J Amount does not include the portfolio activity of any underlying mutual funds or exchange-traded funds (ETFs).
K Portfolio turnover rate excludes securities received or delivered in-kind.
L The portfolio turnover rate does not include the assets acquired in the merger.
The information in the following table is based on the direct Investments of the Fund.
Top Holdings (% of Fund's net assets) |
| |
| Fidelity Series Investment Grade Bond Fund | 12.2 | |
| Fidelity Series Emerging Markets Opportunities Fund | 11.6 | |
| Fidelity Series Growth Company Fund | 7.0 | |
| Fidelity Series Large Cap Stock Fund | 6.7 | |
| Fidelity Series Overseas Fund | 6.3 | |
| Fidelity Series International Value Fund | 6.3 | |
| Fidelity Series International Growth Fund | 6.3 | |
| Fidelity Series Long-Term Treasury Bond Index Fund | 5.7 | |
| Fidelity Series Stock Selector Large Cap Value Fund | 4.9 | |
| Fidelity Series Opportunistic Insights Fund | 4.1 | |
| | 71.1 | |
| |
Domestic Equity Funds category includes Fidelity Series Commodity Strategy Fund which invests in commodity-related investments.
Asset Allocation (% of Fund's net assets) |
|
Percentages shown as 0.0% may reflect amounts less than 0.05%. |
|
Fidelity Freedom® 2035 Fund
Showing Percentage of Net Assets
| U.S. Treasury Obligations - 0.1% |
| | | Principal Amount (a) | Value ($) |
U.S. Treasury Bills, yield at date of purchase 2.13% to 2.42% 10/13/22 to 10/20/22 (b) (Cost $13,185,004) | | 13,200,000 | 13,185,690 |
| | | | |
| Domestic Equity Funds - 41.2% |
| | | Shares | Value ($) |
| Fidelity Series All-Sector Equity Fund (c) | | 38,806,926 | 332,963,426 |
| Fidelity Series Blue Chip Growth Fund (c) | | 78,940,819 | 792,565,819 |
| Fidelity Series Commodity Strategy Fund (c) | | 123,579,211 | 258,280,551 |
| Fidelity Series Growth Company Fund (c) | | 115,825,154 | 1,554,373,563 |
| Fidelity Series Intrinsic Opportunities Fund (c) | | 54,461,665 | 716,715,509 |
| Fidelity Series Large Cap Stock Fund (c) | | 100,084,893 | 1,478,253,868 |
| Fidelity Series Large Cap Value Index Fund (c) | | 38,226,279 | 486,238,264 |
| Fidelity Series Opportunistic Insights Fund (c) | | 64,169,027 | 911,841,870 |
| Fidelity Series Small Cap Discovery Fund (c) | | 16,066,907 | 150,707,591 |
| Fidelity Series Small Cap Opportunities Fund (c) | | 46,994,289 | 506,598,434 |
| Fidelity Series Stock Selector Large Cap Value Fund (c) | | 95,893,677 | 1,071,132,373 |
| Fidelity Series Value Discovery Fund (c) | | 61,214,137 | 842,918,662 |
| TOTAL DOMESTIC EQUITY FUNDS (Cost $8,694,164,215) | | | 9,102,589,930 |
| | | | |
| International Equity Funds - 36.1% |
| | | Shares | Value ($) |
| Fidelity Series Canada Fund (c) | | 48,833,455 | 605,534,848 |
| Fidelity Series Emerging Markets Fund (c) | | 38,525,518 | 278,924,750 |
| Fidelity Series Emerging Markets Opportunities Fund (c) | | 176,409,302 | 2,561,463,059 |
| Fidelity Series International Growth Fund (c) | | 108,008,048 | 1,384,663,175 |
| Fidelity Series International Small Cap Fund (c) | | 26,512,343 | 362,688,856 |
| Fidelity Series International Value Fund (c) | | 162,057,258 | 1,392,071,850 |
| Fidelity Series Overseas Fund (c) | | 146,692,517 | 1,397,979,689 |
| TOTAL INTERNATIONAL EQUITY FUNDS (Cost $8,606,813,570) | | | 7,983,326,227 |
| | | | |
| Bond Funds - 22.1% |
| | | Shares | Value ($) |
| Fidelity Series 5+ Year Inflation-Protected Bond Index Fund (c) | | 2,711,484 | 21,664,754 |
| Fidelity Series Emerging Markets Debt Fund (c) | | 16,952,308 | 116,292,833 |
| Fidelity Series Emerging Markets Debt Local Currency Fund (c) | | 4,799,814 | 38,254,515 |
| Fidelity Series Floating Rate High Income Fund (c) | | 2,582,879 | 22,471,049 |
| Fidelity Series High Income Fund (c) | | 15,240,114 | 120,092,102 |
| Fidelity Series International Credit Fund (c) | | 1,243,073 | 9,782,988 |
| Fidelity Series International Developed Markets Bond Index Fund (c) | | 64,487,653 | 549,434,804 |
| Fidelity Series Investment Grade Bond Fund (c) | | 275,000,976 | 2,684,009,522 |
| Fidelity Series Long-Term Treasury Bond Index Fund (c) | | 211,238,461 | 1,261,093,614 |
| Fidelity Series Real Estate Income Fund (c) | | 5,986,030 | 56,987,007 |
| TOTAL BOND FUNDS (Cost $5,945,019,864) | | | 4,880,083,188 |
| | | | |
| Short-Term Funds - 0.5% |
| | | Shares | Value ($) |
| Fidelity Cash Central Fund 3.10% (d) | | 11,268,637 | 11,270,891 |
| Fidelity Series Government Money Market Fund 3.00% (c)(e) | | 110,101,808 | 110,101,808 |
| TOTAL SHORT-TERM FUNDS (Cost $121,372,699) | | | 121,372,699 |
| | | | |
| TOTAL INVESTMENT IN SECURITIES - 100.0% (Cost $23,380,555,352) | 22,100,557,734 |
NET OTHER ASSETS (LIABILITIES) - 0.0% | (2,092,694) |
| NET ASSETS - 100.0% | 22,098,465,040 |
| | |
| Futures Contracts |
| | Number of contracts | Expiration Date | Notional Amount ($) | Value ($) | Unrealized Appreciation/ (Depreciation) ($) |
| Purchased | | | | | |
| | | | | | |
| Treasury Contracts | | | | | |
| CBOT 10-Year U.S. Treasury Note Contracts (United States) | 3,600 | Dec 2022 | 403,425,000 | (24,621,842) | (24,621,842) |
| CBOT Ultra Long Term U.S. Treasury Bond Contracts (United States) | 338 | Dec 2022 | 46,306,000 | (588,173) | (588,173) |
| | | | | | |
| TOTAL PURCHASED | | | | | (25,210,015) |
| | | | | | |
| Sold | | | | | |
| | | | | | |
| Equity Index Contracts | | | | | |
| CME E-mini S&P 500 Index Contracts (United States) | 570 | Dec 2022 | 102,642,750 | 517,749 | 517,749 |
| ICE E-mini MSCI EAFE Index Contracts (United States) | 1,012 | Dec 2022 | 84,026,360 | 11,393,665 | 11,393,665 |
| ICE E-mini MSCI Emerging Markets Index Contracts (United States) | 552 | Dec 2022 | 24,053,400 | 64,568 | 64,568 |
| | | | | | |
| TOTAL SOLD | | | | | 11,975,982 |
| | | | | | |
| TOTAL FUTURES CONTRACTS | | | | | (13,234,033) |
| The notional amount of futures purchased as a percentage of Net Assets is 2.0% |
| The notional amount of futures sold as a percentage of Net Assets is 1.0% |
Legend
| (a) | Amount is stated in United States dollars unless otherwise noted. |
| (b) | Security or a portion of the security was pledged to cover margin requirements for futures contracts. At period end, the value of securities pledged amounted to $12,659,172. |
| (d) | Affiliated fund that is generally available only to investment companies and other accounts managed by Fidelity Investments. The rate quoted is the annualized seven-day yield of the fund at period end. A complete unaudited listing of the fund's holdings as of its most recent quarter end is available upon request. In addition, each Fidelity Central Fund's financial statements are available on the SEC's website or upon request. |
| (e) | The rate quoted is the annualized seven-day yield of the fund at period end. |
Affiliated Central Funds
Fiscal year to date information regarding the Fund's investments in Fidelity Central Funds, including the ownership percentage, is presented below.
| Affiliate | Value, beginning of period ($) | Purchases ($) | Sales Proceeds ($) | Dividend Income ($) | Realized Gain (loss) ($) | Change in Unrealized appreciation (depreciation) ($) | Value, end of period ($) | %ownership, end of period |
| Fidelity Cash Central Fund 3.10% | 26,072,237 | 120,952,384 | 135,753,730 | 154,613 | 363 | (363) | 11,270,891 | 0.0% |
| Total | 26,072,237 | 120,952,384 | 135,753,730 | 154,613 | 363 | (363) | 11,270,891 | |
| | | | | | | | | |
Amounts in the income column in the above table include any capital gain distributions from underlying funds, which are presented in the corresponding line item in the Statement of Operations, if applicable.
Affiliated Underlying Funds
Fiscal year to date information regarding the Fund's investments in affiliated Underlying Funds is presented below. Exchanges between classes of the same affiliated Underlying Funds may occur. If an Underlying Funds changes its name, the name presented below is the name in effect at period end.
| Affiliate | Value, beginning of period ($) | Purchases ($) | Sales Proceeds ($) | Dividend Income ($) | Realized Gain (loss) ($) | Change in Unrealized appreciation (depreciation) ($) | Value, end of period ($) |
| Fidelity Series 5+ Year Inflation-Protected Bond Index Fund | 27,471,764 | 428,764 | 1,778,511 | - | (138,030) | (4,319,233) | 21,664,754 |
| Fidelity Series All-Sector Equity Fund | 452,644,898 | 6,686,435 | 36,602,833 | - | (7,519,804) | (82,245,270) | 332,963,426 |
| Fidelity Series Blue Chip Growth Fund | 743,116,631 | 363,030,680 | 53,239,211 | 26,743,643 | (15,811,310) | (244,530,971) | 792,565,819 |
| Fidelity Series Canada Fund | 772,535,919 | 36,476,444 | 49,555,955 | - | (1,285,116) | (152,636,444) | 605,534,848 |
| Fidelity Series Commodity Strategy Fund | 411,257,876 | 219,948,316 | 147,347,606 | 192,234,048 | (43,615,836) | (181,962,199) | 258,280,551 |
| Fidelity Series Emerging Markets Debt Fund | 141,087,586 | 6,486,120 | 7,493,513 | 3,553,561 | (842,208) | (22,945,152) | 116,292,833 |
| Fidelity Series Emerging Markets Debt Local Currency Fund | 45,864,369 | 1,798,202 | 4,140,428 | - | (617,505) | (4,650,123) | 38,254,515 |
| Fidelity Series Emerging Markets Fund | 348,177,997 | 18,767,516 | 10,316,024 | - | (1,718,609) | (75,986,130) | 278,924,750 |
| Fidelity Series Emerging Markets Opportunities Fund | 3,137,701,639 | 207,200,647 | 114,839,790 | - | (30,130,445) | (638,468,992) | 2,561,463,059 |
| Fidelity Series Floating Rate High Income Fund | 27,718,837 | 1,103,330 | 4,945,290 | 674,017 | (540,547) | (865,281) | 22,471,049 |
| Fidelity Series Government Money Market Fund 3.00% | - | 110,103,833 | 2,025 | 4,823 | - | - | 110,101,808 |
| Fidelity Series Growth Company Fund | 1,852,349,334 | 302,724,076 | 89,356,903 | - | (15,679,660) | (495,663,284) | 1,554,373,563 |
| Fidelity Series High Income Fund | 166,483,874 | 6,279,697 | 32,224,572 | 3,906,796 | (3,924,074) | (16,522,823) | 120,092,102 |
| Fidelity Series International Credit Fund | 11,369,458 | 155,230 | 21,415 | 155,230 | (477) | (1,719,808) | 9,782,988 |
| Fidelity Series International Developed Markets Bond Index Fund | 456,531,592 | 159,064,166 | 18,927,658 | 777,549 | (1,403,942) | (45,829,354) | 549,434,804 |
| Fidelity Series International Growth Fund | 1,768,739,893 | 121,051,228 | 102,462,817 | - | (10,689,708) | (391,975,421) | 1,384,663,175 |
| Fidelity Series International Small Cap Fund | 485,600,878 | 7,558,347 | 15,749,116 | - | (3,067,205) | (111,654,048) | 362,688,856 |
| Fidelity Series International Value Fund | 1,786,347,865 | 101,679,878 | 106,459,937 | - | (2,641,175) | (386,854,781) | 1,392,071,850 |
| Fidelity Series Intrinsic Opportunities Fund | 1,739,928,680 | 222,556,596 | 883,164,346 | 201,669,231 | 134,848,236 | (497,453,657) | 716,715,509 |
| Fidelity Series Investment Grade Bond Fund | 3,256,685,331 | 272,888,813 | 514,964,554 | 41,793,360 | (40,960,561) | (289,639,507) | 2,684,009,522 |
| Fidelity Series Large Cap Stock Fund | 1,647,354,196 | 345,049,671 | 117,836,911 | 87,286,084 | (2,845,232) | (393,467,856) | 1,478,253,868 |
| Fidelity Series Large Cap Value Index Fund | 620,080,218 | 20,973,511 | 51,373,118 | - | 4,526,384 | (107,968,731) | 486,238,264 |
| Fidelity Series Long-Term Treasury Bond Index Fund | 1,462,678,682 | 232,538,758 | 101,022,911 | 17,750,279 | (16,345,299) | (316,755,616) | 1,261,093,614 |
| Fidelity Series Opportunistic Insights Fund | 949,033,246 | 241,895,830 | 52,235,792 | - | (8,082,703) | (218,768,711) | 911,841,870 |
| Fidelity Series Overseas Fund | 1,778,495,495 | 115,305,047 | 52,280,474 | - | (5,031,402) | (438,508,977) | 1,397,979,689 |
| Fidelity Series Real Estate Income Fund | 100,745,186 | 5,567,807 | 35,748,200 | 4,496,125 | (2,258,140) | (11,319,646) | 56,987,007 |
| Fidelity Series Small Cap Discovery Fund | 203,152,679 | 25,370,796 | 16,858,885 | 22,297,824 | (1,844,696) | (59,112,303) | 150,707,591 |
| Fidelity Series Small Cap Opportunities Fund | 670,406,240 | 33,980,202 | 60,781,092 | 23,852,174 | (7,411,827) | (129,595,089) | 506,598,434 |
| Fidelity Series Stock Selector Large Cap Value Fund | 1,387,609,440 | 50,174,018 | 134,034,174 | - | (4,473,824) | (228,143,087) | 1,071,132,373 |
| Fidelity Series Value Discovery Fund | 1,055,646,397 | 40,504,030 | 112,595,030 | - | 12,112,554 | (152,749,289) | 842,918,662 |
| | 27,506,816,200 | 3,277,347,988 | 2,928,359,091 | 627,194,744 | (77,392,161) | (5,702,311,783) | 22,076,101,153 |
Amounts in the income column in the above table include any capital gain distributions from underlying funds, which are presented in the corresponding line item in the Statement of Operations, if applicable.
Purchases and Sales Proceeds in the table above include the value of shares purchased or redeemed through in-kind transactions, if applicable.
Investment Valuation
The following is a summary of the inputs used, as of September 30, 2022, involving the Fund's assets and liabilities carried at fair value. The inputs or methodology used for valuing securities may not be an indication of the risk associated with investing in those securities. For more information on valuation inputs, and their aggregation into the levels used below, please refer to the Investment Valuation section in the accompanying Notes to Financial Statements.
| Valuation Inputs at Reporting Date: |
| Description | Total ($) | Level 1 ($) | Level 2 ($) | Level 3 ($) |
Investments in Securities: | | | | |
|
| Other Short-Term Investments | 13,185,690 | - | 13,185,690 | - |
|
| Domestic Equity Funds | 9,102,589,930 | 9,102,589,930 | - | - |
|
| International Equity Funds | 7,983,326,227 | 7,983,326,227 | - | - |
|
| Bond Funds | 4,880,083,188 | 4,880,083,188 | - | - |
|
| Short-Term Funds | 121,372,699 | 121,372,699 | - | - |
| Total Investments in Securities: | 22,100,557,734 | 22,087,372,044 | 13,185,690 | - |
Derivative Instruments: | | | | |
|
| Assets | | | | |
Futures Contracts | 11,975,982 | 11,975,982 | - | - |
| Total Assets | 11,975,982 | 11,975,982 | - | - |
|
| Liabilities | | | | |
Futures Contracts | (25,210,015) | (25,210,015) | - | - |
| Total Liabilities | (25,210,015) | (25,210,015) | - | - |
| Total Derivative Instruments: | (13,234,033) | (13,234,033) | - | - |
Value of Derivative Instruments
The following table is a summary of the Fund's value of derivative instruments by primary risk exposure as of September 30, 2022. For additional information on derivative instruments, please refer to the Derivative Instruments section in the accompanying Notes to Financial Statements.
Primary Risk Exposure / Derivative Type | Value |
| Asset ($) | Liability ($) |
| Equity Risk | | |
Futures Contracts (a) | 11,975,982 | 0 |
| Total Equity Risk | 11,975,982 | 0 |
| Interest Rate Risk | | |
Futures Contracts (a) | 0 | (25,210,015) |
| Total Interest Rate Risk | 0 | (25,210,015) |
| Total Value of Derivatives | 11,975,982 | (25,210,015) |
(a)Reflects gross cumulative appreciation (depreciation) on futures contracts as presented in the Schedule of Investments. In the Statement of Assets and Liabilities, the period end daily variation margin is included in receivable or payable for daily variation margin on futures contracts, and the net cumulative appreciation (depreciation) is included in Total accumulated earnings (loss).
Fidelity Freedom® 2035 Fund
| Statement of Assets and Liabilities |
| | | | September 30, 2022 (Unaudited) |
| | | | | |
| Assets | | | | |
| Investment in securities, at value - See accompanying schedule: | $ | | | |
Unaffiliated issuers (cost $13,185,004) | | $13,185,690 | | |
Fidelity Central Funds (cost $11,270,891) | | 11,270,891 | | |
Other affiliated issuers (cost $23,356,099,457) | | 22,076,101,153 | | |
| | | | | |
| Total Investment in Securities (cost $23,380,555,352) | | | $ | 22,100,557,734 |
| Receivable for investments sold | | | | 154,859,971 |
| Receivable for fund shares sold | | | | 29,212,341 |
| Distributions receivable from Fidelity Central Funds | | | | 20,702 |
| Other receivables | | | | 166,577 |
Total assets | | | | 22,284,817,325 |
| Liabilities | | | | |
| Payable for investments purchased | | 153,225,277 | | |
| Payable for fund shares redeemed | | 19,904,453 | | |
| Accrued management fee | | 12,171,747 | | |
| Payable for daily variation margin on futures contracts | | 884,231 | | |
| Other payables and accrued expenses | | 166,577 | | |
| Total Liabilities | | | | 186,352,285 |
| Net Assets | | | $ | 22,098,465,040 |
| Net Assets consist of: | | | | |
| Paid in capital | | | $ | 23,052,755,324 |
| Total accumulated earnings (loss) | | | | (954,290,284) |
| Net Assets | | | $ | 22,098,465,040 |
| | | | | |
| Net Asset Value and Maximum Offering Price | | | | |
| Fidelity Freedom 2035 Fund : | | | | |
Net Asset Value , offering price and redemption price per share ($9,374,088,495 ÷ 779,879,386 shares) | | | $ | 12.02 |
| Class K : | | | | |
Net Asset Value , offering price and redemption price per share ($8,474,907,934 ÷ 705,526,320 shares) | | | $ | 12.01 |
| Class K6 : | | | | |
Net Asset Value , offering price and redemption price per share ($4,249,468,611 ÷ 354,511,708 shares) | | | $ | 11.99 |
| Statement of Operations |
| | | | Six months ended September 30, 2022 (Unaudited) |
| Investment Income | | | | |
| Dividends: | | | | |
| Affiliated issuers | | | $ | 292,638,525 |
| Interest | | | | 128,646 |
| Income from Fidelity Central Funds | | | | 154,613 |
| Total Income | | | | 292,921,784 |
| Expenses | | | | |
| Management fee | $ | 77,309,715 | | |
| Independent trustees' fees and expenses | | 42,917 | | |
| Total expenses before reductions | | 77,352,632 | | |
| Expense reductions | | (77) | | |
| Total expenses after reductions | | | | 77,352,555 |
| Net Investment income (loss) | | | | 215,569,229 |
| Realized and Unrealized Gain (Loss) | | | | |
| Net realized gain (loss) on: | | | | |
| Investment Securities: | | | | |
| Unaffiliated issuers | | 8,504 | | |
| Fidelity Central Funds | | 363 | | |
| Other affiliated issuers | | (77,392,161) | | |
| Futures contracts | | (12,001,107) | | |
| Capital gain distributions from underlying funds: | | | | |
| Affiliated issuers | | 334,556,219 | | |
| Total net realized gain (loss) | | | | 245,171,818 |
| Change in net unrealized appreciation (depreciation) on: | | | | |
| Investment Securities: | | | | |
| Unaffiliated issuers | | 461 | | |
| Fidelity Central Funds | | (363) | | |
| Other affiliated issuers | | (5,702,311,783) | | |
| Futures contracts | | (17,229,105) | | |
| Total change in net unrealized appreciation (depreciation) | | | | (5,719,540,790) |
| Net gain (loss) | | | | (5,474,368,972) |
| Net increase (decrease) in net assets resulting from operations | | | $ | (5,258,799,743) |
| Statement of Changes in Net Assets |
| |
| | Six months ended September 30, 2022 (Unaudited) | | Year ended March 31, 2022 |
| Increase (Decrease) in Net Assets | | | | |
| Operations | | | | |
| Net investment income (loss) | $ | 215,569,229 | $ | 638,952,383 |
| Net realized gain (loss) | | 245,171,818 | | 2,846,867,362 |
| Change in net unrealized appreciation (depreciation) | | (5,719,540,790) | | (2,709,931,792) |
| Net increase (decrease) in net assets resulting from operations | | (5,258,799,743) | | 775,887,953 |
| Distributions to shareholders | | (1,617,186,684) | | (3,186,981,326) |
| Share transactions - net increase (decrease) | | 1,434,228,980 | | 1,059,713,495 |
| Total increase (decrease) in net assets | | (5,441,757,447) | | (1,351,379,878) |
| | | | | |
| Net Assets | | | | |
| Beginning of period | | 27,540,222,487 | | 28,891,602,365 |
| End of period | $ | 22,098,465,040 | $ | 27,540,222,487 |
| | | | | |
| | | | | |
Financial Highlights
| Fidelity Freedom® 2035 Fund |
| |
| | Six months ended (Unaudited) September 30, 2022 | | Years ended March 31, 2022 | | 2021 | | 2020 | | 2019 | | 2018 |
Selected Per-Share Data | | | | | | | | | | | | |
| Net asset value, beginning of period | $ | 15.89 | $ | 17.36 | $ | 12.21 | $ | 14.42 | $ | 15.20 | $ | 13.88 |
| Income from Investment Operations | | | | | | | | | | | | |
Net investment income (loss) A,B | | .11 | | .37 | | .16 | | .23 | | .21 | | .16 |
| Net realized and unrealized gain (loss) | | (3.05) | | .13 | | 5.97 | | (1.42) | | .01 | | 1.81 |
| Total from investment operations | | (2.94) | | .50 | | 6.13 | | (1.19) | | .22 | | 1.97 |
| Distributions from net investment income | | - | | (.39) | | (.18) | | (.23) | | (.22) | | (.17) |
| Distributions from net realized gain | | (.93) | | (1.58) | | (.81) | | (.79) | | (.78) | | (.47) |
| Total distributions | | (.93) | | (1.97) | | (.98) C | | (1.02) | | (1.00) | | (.65) C |
| Net asset value, end of period | $ | 12.02 | $ | 15.89 | $ | 17.36 | $ | 12.21 | $ | 14.42 | $ | 15.20 |
Total Return D,E | | (19.19)% | | 2.38% | | 51.68% | | (9.25)% | | 1.85% | | 14.32% |
Ratios to Average Net Assets B,F,G | | | | | | | | | | | | |
| Expenses before reductions | | .70% H | | .71% I | | .72% | | .73% | | .74% | | .63% I |
| Expenses net of fee waivers, if any | | .70% H | | .71% I | | .72% | | .73% | | .74% | | .63% I |
| Expenses net of all reductions | | .70% H | | .71% I | | .72% | | .73% | | .74% | | .63% I |
| Net investment income (loss) | | 1.66% H | | 2.14% | | 1.02% | | 1.57% | | 1.41% | | 1.06% |
| Supplemental Data | | | | | | | | | | | | |
| Net assets, end of period (000 omitted) | $ | 9,374,088 | $ | 11,630,509 | $ | 11,467,913 | $ | 7,408,043 | $ | 8,247,886 | $ | 8,050,659 |
Portfolio turnover rate J | | 23% H,K | | 30% | | 24% | | 31% | | 18% | | 17% L |
A Calculated based on average shares outstanding during the period.
B Net investment income (loss) is affected by the timing of the declaration of dividends by any underlying mutual funds or exchange-traded funds (ETFs). Net investment income (loss) of any such underlying funds is not included in the Fund's net investment income (loss) ratio.
C Total distributions per share do not sum due to rounding.
D Total returns for periods of less than one year are not annualized.
E Total returns would have been lower if certain expenses had not been reduced during the applicable periods shown.
F Fees and expenses of any underlying mutual funds or exchange-traded funds (ETFs) are not included in the Fund's expense ratio. The Fund indirectly bears its proportionate share of these expenses. For additional expense information related to investments in Fidelity Central Funds, please refer to the "Investments in Fidelity Central Funds" note found in the Notes to Financial Statements section of the most recent Annual or Semi-Annual report.
G Expense ratios reflect operating expenses of the class. Expenses before reductions do not reflect amounts reimbursed, waived, or reduced through arrangements with the investment adviser, brokerage services, or other offset arrangements, if applicable, and do not represent the amount paid by the class during periods when reimbursements, waivers or reductions occur.
H Annualized
I On certain classes, the size and fluctuation of net assets and expense amounts may cause ratios to differ from contractual rates.
J Amount does not include the portfolio activity of any underlying mutual funds or exchange-traded funds (ETFs).
K Portfolio turnover rate excludes securities received or delivered in-kind.
L The portfolio turnover rate does not include the assets acquired in the merger.
| Fidelity Freedom® 2035 Fund Class K |
| |
| | Six months ended (Unaudited) September 30, 2022 | | Years ended March 31, 2022 | | 2021 | | 2020 | | 2019 | | 2018 A |
Selected Per-Share Data | | | | | | | | | | | | |
| Net asset value, beginning of period | $ | 15.87 | $ | 17.33 | $ | 12.19 | $ | 14.40 | $ | 15.18 | $ | 14.60 |
| Income from Investment Operations | | | | | | | | | | | | |
Net investment income (loss) B,C | | .12 | | .39 | | .17 | | .24 | | .22 | | .22 |
| Net realized and unrealized gain (loss) | | (3.05) | | .13 | | 5.96 | | (1.42) | | .01 | | .82 |
| Total from investment operations | | (2.93) | | .52 | | 6.13 | | (1.18) | | .23 | | 1.04 |
| Distributions from net investment income | | - | | (.40) | | (.19) | | (.24) | | (.23) | | (.19) |
| Distributions from net realized gain | | (.93) | | (1.58) | | (.81) | | (.79) | | (.78) | | (.26) |
| Total distributions | | (.93) | | (1.98) | | (.99) D | | (1.03) | | (1.01) | | (.46) D |
| Net asset value, end of period | $ | 12.01 | $ | 15.87 | $ | 17.33 | $ | 12.19 | $ | 14.40 | $ | 15.18 |
Total Return E,F | | (19.13)% | | 2.49% | | 51.80% | | (9.19)% | | 1.95% | | 7.09% |
Ratios to Average Net Assets C,G,H | | | | | | | | | | | | |
| Expenses before reductions | | .61% I | | .61% J | | .62% | | .63% | | .64% | | .65% I,J |
| Expenses net of fee waivers, if any | | .61% I | | .61% J | | .62% | | .63% | | .64% | | .65% I,J |
| Expenses net of all reductions | | .61% I | | .61% J | | .62% | | .63% | | .64% | | .65% I,J |
| Net investment income (loss) | | 1.75% I | | 2.23% | | 1.12% | | 1.67% | | 1.51% | | 2.07% I |
| Supplemental Data | | | | | | | | | | | | |
| Net assets, end of period (000 omitted) | $ | 8,474,908 | $ | 11,216,392 | $ | 13,070,819 | $ | 9,620,448 | $ | 11,661,819 | $ | 12,979,898 |
Portfolio turnover rate K | | 23% I,L | | 30% | | 24% | | 31% | | 18% | | 17% M |
A For the period July 20, 2017 (commencement of sale of shares) through March 31, 2018.
B Calculated based on average shares outstanding during the period.
C Net investment income (loss) is affected by the timing of the declaration of dividends by any underlying mutual funds or exchange-traded funds (ETFs). Net investment income (loss) of any such underlying funds is not included in the Fund's net investment income (loss) ratio.
D Total distributions per share do not sum due to rounding.
E Total returns for periods of less than one year are not annualized.
F Total returns would have been lower if certain expenses had not been reduced during the applicable periods shown.
G Fees and expenses of any underlying mutual funds or exchange-traded funds (ETFs) are not included in the Fund's expense ratio. The Fund indirectly bears its proportionate share of these expenses. For additional expense information related to investments in Fidelity Central Funds, please refer to the "Investments in Fidelity Central Funds" note found in the Notes to Financial Statements section of the most recent Annual or Semi-Annual report.
H Expense ratios reflect operating expenses of the class. Expenses before reductions do not reflect amounts reimbursed, waived, or reduced through arrangements with the investment adviser, brokerage services, or other offset arrangements, if applicable, and do not represent the amount paid by the class during periods when reimbursements, waivers or reductions occur.
I Annualized
J On certain classes, the size and fluctuation of net assets and expense amounts may cause ratios to differ from contractual rates.
K Amount does not include the portfolio activity of any underlying mutual funds or exchange-traded funds (ETFs).
L Portfolio turnover rate excludes securities received or delivered in-kind.
M The portfolio turnover rate does not include the assets acquired in the merger.
| Fidelity Freedom® 2035 Fund Class K6 |
| |
| | Six months ended (Unaudited) September 30, 2022 | | Years ended March 31, 2022 | | 2021 | | 2020 | | 2019 | | 2018 A |
Selected Per-Share Data | | | | | | | | | | | | |
| Net asset value, beginning of period | $ | 15.84 | $ | 17.31 | $ | 12.17 | $ | 14.39 | $ | 15.20 | $ | 14.30 |
| Income from Investment Operations | | | | | | | | | | | | |
Net investment income (loss) B,C | | .13 | | .41 | | .19 | | .26 | | .24 | | .20 |
| Net realized and unrealized gain (loss) | | (3.04) | | .12 | | 5.97 | | (1.42) | | .01 | | 1.16 |
| Total from investment operations | | (2.91) | | .53 | | 6.16 | | (1.16) | | .25 | | 1.36 |
| Distributions from net investment income | | - | | (.43) | | (.21) | | (.26) | | (.27) | | (.20) |
| Distributions from net realized gain | | (.94) | | (1.58) | | (.82) | | (.80) | | (.79) | | (.26) |
| Total distributions | | (.94) | | (2.00) D | | (1.02) D | | (1.06) | | (1.06) | | (.46) |
| Net asset value, end of period | $ | 11.99 | $ | 15.84 | $ | 17.31 | $ | 12.17 | $ | 14.39 | $ | 15.20 |
Total Return E,F | | (19.06)% | | 2.60% | | 52.14% | | (9.08)% | | 2.10% | | 9.50% |
Ratios to Average Net Assets C,G,H | | | | | | | | | | | | |
| Expenses before reductions | | .47% I | | .48% | | .48% | | .49% | | .49% | | .50% I,J |
| Expenses net of fee waivers, if any | | .47% I | | .48% | | .48% | | .49% | | .49% | | .50% I,J |
| Expenses net of all reductions | | .47% I | | .48% | | .48% | | .49% | | .49% | | .50% I,J |
| Net investment income (loss) | | 1.89% I | | 2.37% | | 1.26% | | 1.82% | | 1.65% | | 1.61% I |
| Supplemental Data | | | | | | | | | | | | |
| Net assets, end of period (000 omitted) | $ | 4,249,469 | $ | 4,693,321 | $ | 4,352,870 | $ | 2,606,617 | $ | 2,217,206 | $ | 712,276 |
Portfolio turnover rate K | | 23% I,L | | 30% | | 24% | | 31% | | 18% | | 17% M |
A For the period June 7, 2017 (commencement of sale of shares) through March 31, 2018.
B Calculated based on average shares outstanding during the period.
C Net investment income (loss) is affected by the timing of the declaration of dividends by any underlying mutual funds or exchange-traded funds (ETFs). Net investment income (loss) of any such underlying funds is not included in the Fund's net investment income (loss) ratio.
D Total distributions per share do not sum due to rounding.
E Total returns for periods of less than one year are not annualized.
F Total returns would have been lower if certain expenses had not been reduced during the applicable periods shown.
G Fees and expenses of any underlying mutual funds or exchange-traded funds (ETFs) are not included in the Fund's expense ratio. The Fund indirectly bears its proportionate share of these expenses. For additional expense information related to investments in Fidelity Central Funds, please refer to the "Investments in Fidelity Central Funds" note found in the Notes to Financial Statements section of the most recent Annual or Semi-Annual report.
H Expense ratios reflect operating expenses of the class. Expenses before reductions do not reflect amounts reimbursed, waived, or reduced through arrangements with the investment adviser, brokerage services, or other offset arrangements, if applicable, and do not represent the amount paid by the class during periods when reimbursements, waivers or reductions occur.
I Annualized
J On certain classes, the size and fluctuation of net assets and expense amounts may cause ratios to differ from contractual rates.
K Amount does not include the portfolio activity of any underlying mutual funds or exchange-traded funds (ETFs).
L Portfolio turnover rate excludes securities received or delivered in-kind.
M The portfolio turnover rate does not include the assets acquired in the merger.
The information in the following table is based on the direct Investments of the Fund.
Top Holdings (% of Fund's net assets) |
| |
| Fidelity Series Emerging Markets Opportunities Fund | 13.0 | |
| Fidelity Series Growth Company Fund | 8.4 | |
| Fidelity Series Large Cap Stock Fund | 8.0 | |
| Fidelity Series Overseas Fund | 7.3 | |
| Fidelity Series International Value Fund | 7.3 | |
| Fidelity Series International Growth Fund | 7.3 | |
| Fidelity Series Stock Selector Large Cap Value Fund | 5.8 | |
| Fidelity Series Long-Term Treasury Bond Index Fund | 5.7 | |
| Fidelity Series Opportunistic Insights Fund | 4.9 | |
| Fidelity Series Value Discovery Fund | 4.5 | |
| | 72.2 | |
| |
Domestic Equity Funds category includes Fidelity Series Commodity Strategy Fund which invests in commodity-related investments.
Asset Allocation (% of Fund's net assets) |
|
Percentages shown as 0.0% may reflect amounts less than 0.05%. |
|
Fidelity Freedom® 2040 Fund
Showing Percentage of Net Assets
| U.S. Treasury Obligations - 0.1% |
| | | Principal Amount (a) | Value ($) |
U.S. Treasury Bills, yield at date of purchase 1.89% to 2.42% 10/6/22 to 10/20/22 (b) (Cost $20,167,965) | | 20,190,000 | 20,168,998 |
| | | | |
| Domestic Equity Funds - 48.9% |
| | | Shares | Value ($) |
| Fidelity Series All-Sector Equity Fund (c) | | 46,294,760 | 397,209,042 |
| Fidelity Series Blue Chip Growth Fund (c) | | 93,766,779 | 941,418,456 |
| Fidelity Series Commodity Strategy Fund (c) | | 127,199,927 | 265,847,848 |
| Fidelity Series Growth Company Fund (c) | | 138,035,481 | 1,852,436,155 |
| Fidelity Series Intrinsic Opportunities Fund (c) | | 64,776,479 | 852,458,460 |
| Fidelity Series Large Cap Stock Fund (c) | | 119,033,823 | 1,758,129,566 |
| Fidelity Series Large Cap Value Index Fund (c) | | 45,602,556 | 580,064,509 |
| Fidelity Series Opportunistic Insights Fund (c) | | 75,765,899 | 1,076,633,430 |
| Fidelity Series Small Cap Discovery Fund (c) | | 19,165,810 | 179,775,298 |
| Fidelity Series Small Cap Opportunities Fund (c) | | 55,595,127 | 599,315,467 |
| Fidelity Series Stock Selector Large Cap Value Fund (c) | | 114,024,186 | 1,273,650,159 |
| Fidelity Series Value Discovery Fund (c) | | 72,240,896 | 994,757,139 |
| TOTAL DOMESTIC EQUITY FUNDS (Cost $10,387,031,832) | | | 10,771,695,529 |
| | | | |
| International Equity Funds - 41.4% |
| | | Shares | Value ($) |
| Fidelity Series Canada Fund (c) | | 56,530,394 | 700,976,885 |
| Fidelity Series Emerging Markets Fund (c) | | 43,182,722 | 312,642,910 |
| Fidelity Series Emerging Markets Opportunities Fund (c) | | 197,093,872 | 2,861,803,028 |
| Fidelity Series International Growth Fund (c) | | 124,658,213 | 1,598,118,290 |
| Fidelity Series International Small Cap Fund (c) | | 30,570,796 | 418,208,483 |
| Fidelity Series International Value Fund (c) | | 187,516,065 | 1,610,762,997 |
| Fidelity Series Overseas Fund (c) | | 169,312,356 | 1,613,546,753 |
| TOTAL INTERNATIONAL EQUITY FUNDS (Cost $9,903,599,162) | | | 9,116,059,346 |
| | | | |
| Bond Funds - 9.1% |
| | | Shares | Value ($) |
| Fidelity Series 5+ Year Inflation-Protected Bond Index Fund (c) | | 2,723,735 | 21,762,640 |
| Fidelity Series Emerging Markets Debt Fund (c) | | 16,922,484 | 116,088,238 |
| Fidelity Series Emerging Markets Debt Local Currency Fund (c) | | 4,791,005 | 38,184,314 |
| Fidelity Series Floating Rate High Income Fund (c) | | 2,666,834 | 23,201,453 |
| Fidelity Series High Income Fund (c) | | 15,212,279 | 119,872,755 |
| Fidelity Series International Credit Fund (c) | | 1,208,529 | 9,511,122 |
| Fidelity Series International Developed Markets Bond Index Fund (c) | | 6,331,904 | 53,947,818 |
| Fidelity Series Investment Grade Bond Fund (c) | | 30,994,472 | 302,506,050 |
| Fidelity Series Long-Term Treasury Bond Index Fund (c) | | 210,839,521 | 1,258,711,942 |
| Fidelity Series Real Estate Income Fund (c) | | 5,975,436 | 56,886,154 |
| TOTAL BOND FUNDS (Cost $2,579,273,270) | | | 2,000,672,486 |
| | | | |
| Short-Term Funds - 0.5% |
| | | Shares | Value ($) |
| Fidelity Cash Central Fund 3.10% (d) | | 6,065,391 | 6,066,604 |
| Fidelity Series Government Money Market Fund 3.00% (c)(e) | | 117,955,309 | 117,955,309 |
| TOTAL SHORT-TERM FUNDS (Cost $124,021,894) | | | 124,021,913 |
| | | | |
| TOTAL INVESTMENT IN SECURITIES - 100.0% (Cost $23,014,094,123) | 22,032,618,272 |
NET OTHER ASSETS (LIABILITIES) - 0.0% | (1,813,843) |
| NET ASSETS - 100.0% | 22,030,804,429 |
| | |
| Futures Contracts |
| | Number of contracts | Expiration Date | Notional Amount ($) | Value ($) | Unrealized Appreciation/ (Depreciation) ($) |
| Purchased | | | | | |
| | | | | | |
| Treasury Contracts | | | | | |
| CBOT 10-Year U.S. Treasury Note Contracts (United States) | 3,594 | Dec 2022 | 402,752,625 | (24,578,581) | (24,578,581) |
| CBOT Ultra Long Term U.S. Treasury Bond Contracts (United States) | 338 | Dec 2022 | 46,306,000 | (590,613) | (590,613) |
| | | | | | |
| TOTAL PURCHASED | | | | | (25,169,194) |
| | | | | | |
| Sold | | | | | |
| | | | | | |
| Equity Index Contracts | | | | | |
| CME E-mini S&P 500 Index Contracts (United States) | 583 | Dec 2022 | 104,983,725 | 170,969 | 170,969 |
| ICE E-mini MSCI EAFE Index Contracts (United States) | 1,123 | Dec 2022 | 93,242,690 | 12,644,497 | 12,644,497 |
| ICE E-mini MSCI Emerging Markets Index Contracts (United States) | 758 | Dec 2022 | 33,029,850 | 168,533 | 168,533 |
| | | | | | |
| TOTAL SOLD | | | | | 12,983,999 |
| | | | | | |
| TOTAL FUTURES CONTRACTS | | | | | (12,185,195) |
| The notional amount of futures purchased as a percentage of Net Assets is 2.0% |
| The notional amount of futures sold as a percentage of Net Assets is 1.0% |
Legend
| (a) | Amount is stated in United States dollars unless otherwise noted. |
| (b) | Security or a portion of the security was pledged to cover margin requirements for futures contracts. At period end, the value of securities pledged amounted to $15,956,221. |
| (d) | Affiliated fund that is generally available only to investment companies and other accounts managed by Fidelity Investments. The rate quoted is the annualized seven-day yield of the fund at period end. A complete unaudited listing of the fund's holdings as of its most recent quarter end is available upon request. In addition, each Fidelity Central Fund's financial statements are available on the SEC's website or upon request. |
| (e) | The rate quoted is the annualized seven-day yield of the fund at period end. |
Affiliated Central Funds
Fiscal year to date information regarding the Fund's investments in Fidelity Central Funds, including the ownership percentage, is presented below.
| Affiliate | Value, beginning of period ($) | Purchases ($) | Sales Proceeds ($) | Dividend Income ($) | Realized Gain (loss) ($) | Change in Unrealized appreciation (depreciation) ($) | Value, end of period ($) | %ownership, end of period |
| Fidelity Cash Central Fund 3.10% | 22,630,988 | 122,404,840 | 138,969,224 | 173,054 | 398 | (398) | 6,066,604 | 0.0% |
| Total | 22,630,988 | 122,404,840 | 138,969,224 | 173,054 | 398 | (398) | 6,066,604 | |
| | | | | | | | | |
Amounts in the income column in the above table include any capital gain distributions from underlying funds, which are presented in the corresponding line item in the Statement of Operations, if applicable.
Affiliated Underlying Funds
Fiscal year to date information regarding the Fund's investments in affiliated Underlying Funds is presented below. Exchanges between classes of the same affiliated Underlying Funds may occur. If an Underlying Funds changes its name, the name presented below is the name in effect at period end.
| Affiliate | Value, beginning of period ($) | Purchases ($) | Sales Proceeds ($) | Dividend Income ($) | Realized Gain (loss) ($) | Change in Unrealized appreciation (depreciation) ($) | Value, end of period ($) |
| Fidelity Series 5+ Year Inflation-Protected Bond Index Fund | 27,909,039 | 376,751 | 2,018,578 | - | (178,725) | (4,325,847) | 21,762,640 |
| Fidelity Series All-Sector Equity Fund | 540,184,615 | 6,966,189 | 42,716,198 | - | (9,200,313) | (98,025,251) | 397,209,042 |
| Fidelity Series Blue Chip Growth Fund | 886,782,833 | 419,492,813 | 52,528,010 | 31,962,664 | (16,185,419) | (296,143,761) | 941,418,456 |
| Fidelity Series Canada Fund | 899,320,097 | 45,682,385 | 65,307,429 | - | (2,560,160) | (176,158,008) | 700,976,885 |
| Fidelity Series Commodity Strategy Fund | 413,203,908 | 217,946,610 | 138,710,137 | 192,979,714 | (36,384,625) | (190,207,908) | 265,847,848 |
| Fidelity Series Emerging Markets Debt Fund | 140,236,608 | 6,244,146 | 6,588,277 | 3,558,132 | (796,844) | (23,007,395) | 116,088,238 |
| Fidelity Series Emerging Markets Debt Local Currency Fund | 46,225,110 | 757,173 | 3,511,535 | - | (499,490) | (4,786,944) | 38,184,314 |
| Fidelity Series Emerging Markets Fund | 381,053,128 | 30,665,432 | 12,540,455 | - | (2,754,425) | (83,780,770) | 312,642,910 |
| Fidelity Series Emerging Markets Opportunities Fund | 3,517,024,138 | 237,768,797 | 143,422,096 | - | (45,852,932) | (703,714,879) | 2,861,803,028 |
| Fidelity Series Floating Rate High Income Fund | 27,935,687 | 1,055,749 | 4,366,525 | 678,139 | (469,214) | (954,244) | 23,201,453 |
| Fidelity Series Government Money Market Fund 3.00% | - | 117,955,318 | 9 | 4,975 | - | - | 117,955,309 |
| Fidelity Series Growth Company Fund | 2,210,529,456 | 342,335,766 | 88,561,379 | - | (18,335,509) | (593,532,179) | 1,852,436,155 |
| Fidelity Series High Income Fund | 170,145,746 | 6,025,407 | 35,576,240 | 3,923,773 | (3,409,711) | (17,312,447) | 119,872,755 |
| Fidelity Series International Credit Fund | 11,052,520 | 150,902 | 19,948 | 150,903 | (444) | (1,671,908) | 9,511,122 |
| Fidelity Series International Developed Markets Bond Index Fund | 4,569,771 | 53,293,720 | 959,151 | 35,922 | (35,879) | (2,920,643) | 53,947,818 |
| Fidelity Series International Growth Fund | 2,056,215,468 | 124,207,961 | 114,001,513 | - | (19,098,252) | (449,205,374) | 1,598,118,290 |
| Fidelity Series International Small Cap Fund | 563,281,544 | 9,174,383 | 21,013,668 | - | (4,608,537) | (128,625,239) | 418,208,483 |
| Fidelity Series International Value Fund | 2,076,542,702 | 121,918,418 | 136,141,381 | - | (5,243,500) | (446,313,242) | 1,610,762,997 |
| Fidelity Series Intrinsic Opportunities Fund | 2,080,567,734 | 262,430,955 | 1,056,951,168 | 240,548,084 | 126,354,081 | (559,943,142) | 852,458,460 |
| Fidelity Series Investment Grade Bond Fund | 356,319,055 | 88,788,231 | 107,240,146 | 4,226,106 | (9,682,302) | (25,678,788) | 302,506,050 |
| Fidelity Series Large Cap Stock Fund | 1,965,894,214 | 391,253,661 | 125,003,148 | 103,905,112 | (7,052,536) | (466,962,625) | 1,758,129,566 |
| Fidelity Series Large Cap Value Index Fund | 740,029,020 | 22,425,046 | 58,636,792 | - | 3,571,275 | (127,324,040) | 580,064,509 |
| Fidelity Series Long-Term Treasury Bond Index Fund | 1,489,600,593 | 221,989,005 | 115,934,981 | 17,881,142 | (21,106,154) | (315,836,521) | 1,258,711,942 |
| Fidelity Series Opportunistic Insights Fund | 1,132,490,794 | 277,366,829 | 61,247,325 | - | (11,034,134) | (260,942,734) | 1,076,633,430 |
| Fidelity Series Overseas Fund | 2,067,384,156 | 116,792,583 | 55,757,098 | - | (7,964,656) | (506,908,232) | 1,613,546,753 |
| Fidelity Series Real Estate Income Fund | 101,841,659 | 5,435,536 | 37,047,154 | 4,494,815 | (1,922,304) | (11,421,583) | 56,886,154 |
| Fidelity Series Small Cap Discovery Fund | 240,675,419 | 29,726,790 | 18,032,593 | 26,537,030 | (3,437,994) | (69,156,324) | 179,775,298 |
| Fidelity Series Small Cap Opportunities Fund | 800,028,623 | 38,371,130 | 76,300,455 | 27,999,652 | (10,242,244) | (152,541,587) | 599,315,467 |
| Fidelity Series Stock Selector Large Cap Value Fund | 1,655,878,341 | 43,623,276 | 148,135,049 | - | (5,657,289) | (272,059,120) | 1,273,650,159 |
| Fidelity Series Value Discovery Fund | 1,259,776,239 | 44,644,085 | 141,648,828 | - | 10,958,201 | (178,972,558) | 994,757,139 |
| | 27,862,698,217 | 3,284,865,047 | 2,869,917,266 | 658,886,163 | (102,830,035) | (6,168,433,293) | 22,006,382,670 |
Amounts in the income column in the above table include any capital gain distributions from underlying funds, which are presented in the corresponding line item in the Statement of Operations, if applicable.
Purchases and Sales Proceeds in the table above include the value of shares purchased or redeemed through in-kind transactions, if applicable.
Investment Valuation
The following is a summary of the inputs used, as of September 30, 2022, involving the Fund's assets and liabilities carried at fair value. The inputs or methodology used for valuing securities may not be an indication of the risk associated with investing in those securities. For more information on valuation inputs, and their aggregation into the levels used below, please refer to the Investment Valuation section in the accompanying Notes to Financial Statements.
| Valuation Inputs at Reporting Date: |
| Description | Total ($) | Level 1 ($) | Level 2 ($) | Level 3 ($) |
Investments in Securities: | | | | |
|
| Other Short-Term Investments | 20,168,998 | - | 20,168,998 | - |
|
| Domestic Equity Funds | 10,771,695,529 | 10,771,695,529 | - | - |
|
| International Equity Funds | 9,116,059,346 | 9,116,059,346 | - | - |
|
| Bond Funds | 2,000,672,486 | 2,000,672,486 | - | - |
|
| Short-Term Funds | 124,021,913 | 124,021,913 | - | - |
| Total Investments in Securities: | 22,032,618,272 | 22,012,449,274 | 20,168,998 | - |
Derivative Instruments: | | | | |
|
| Assets | | | | |
Futures Contracts | 12,983,999 | 12,983,999 | - | - |
| Total Assets | 12,983,999 | 12,983,999 | - | - |
|
| Liabilities | | | | |
Futures Contracts | (25,169,194) | (25,169,194) | - | - |
| Total Liabilities | (25,169,194) | (25,169,194) | - | - |
| Total Derivative Instruments: | (12,185,195) | (12,185,195) | - | - |
Value of Derivative Instruments
The following table is a summary of the Fund's value of derivative instruments by primary risk exposure as of September 30, 2022. For additional information on derivative instruments, please refer to the Derivative Instruments section in the accompanying Notes to Financial Statements.
Primary Risk Exposure / Derivative Type | Value |
| Asset ($) | Liability ($) |
| Equity Risk | | |
Futures Contracts (a) | 12,983,999 | 0 |
| Total Equity Risk | 12,983,999 | 0 |
| Interest Rate Risk | | |
Futures Contracts (a) | 0 | (25,169,194) |
| Total Interest Rate Risk | 0 | (25,169,194) |
| Total Value of Derivatives | 12,983,999 | (25,169,194) |
(a)Reflects gross cumulative appreciation (depreciation) on futures contracts as presented in the Schedule of Investments. In the Statement of Assets and Liabilities, the period end daily variation margin is included in receivable or payable for daily variation margin on futures contracts, and the net cumulative appreciation (depreciation) is included in Total accumulated earnings (loss).
Fidelity Freedom® 2040 Fund
| Statement of Assets and Liabilities |
| | | | September 30, 2022 (Unaudited) |
| | | | | |
| Assets | | | | |
| Investment in securities, at value - See accompanying schedule: | $ | | | |
Unaffiliated issuers (cost $20,167,965) | | $20,168,998 | | |
Fidelity Central Funds (cost $6,066,585) | | 6,066,604 | | |
Other affiliated issuers (cost $22,987,859,573) | | 22,006,382,670 | | |
| | | | | |
| Total Investment in Securities (cost $23,014,094,123) | | | $ | 22,032,618,272 |
| Receivable for investments sold | | | | 145,751,633 |
| Receivable for fund shares sold | | | | 26,621,810 |
| Distributions receivable from Fidelity Central Funds | | | | 23,411 |
| Other receivables | | | | 145,598 |
Total assets | | | | 22,205,160,724 |
| Liabilities | | | | |
| Payable for investments purchased | | 139,951,971 | | |
| Payable for fund shares redeemed | | 20,311,948 | | |
| Accrued management fee | | 12,893,760 | | |
| Payable for daily variation margin on futures contracts | | 1,053,018 | | |
| Other payables and accrued expenses | | 145,598 | | |
| Total Liabilities | | | | 174,356,295 |
| Net Assets | | | $ | 22,030,804,429 |
| Net Assets consist of: | | | | |
| Paid in capital | | | $ | 22,702,330,420 |
| Total accumulated earnings (loss) | | | | (671,525,991) |
| Net Assets | | | $ | 22,030,804,429 |
| | | | | |
| Net Asset Value and Maximum Offering Price | | | | |
| Fidelity Freedom 2040 Fund : | | | | |
Net Asset Value , offering price and redemption price per share ($9,336,182,693 ÷ 1,110,713,536 shares) | | | $ | 8.41 |
| Class K : | | | | |
Net Asset Value , offering price and redemption price per share ($8,476,838,958 ÷ 1,007,859,405 shares) | | | $ | 8.41 |
| Class K6 : | | | | |
Net Asset Value , offering price and redemption price per share ($4,217,782,778 ÷ 503,508,928 shares) | | | $ | 8.38 |
| Statement of Operations |
| | | | Six months ended September 30, 2022 (Unaudited) |
| Investment Income | | | | |
| Dividends: | | | | |
| Affiliated issuers | | | $ | 260,787,893 |
| Interest | | | | 136,857 |
| Income from Fidelity Central Funds | | | | 173,054 |
| Total Income | | | | 261,097,804 |
| Expenses | | | | |
| Management fee | $ | 82,230,668 | | |
| Independent trustees' fees and expenses | | 43,268 | | |
| Total expenses before reductions | | 82,273,936 | | |
| Expense reductions | | (79) | | |
| Total expenses after reductions | | | | 82,273,857 |
| Net Investment income (loss) | | | | 178,823,947 |
| Realized and Unrealized Gain (Loss) | | | | |
| Net realized gain (loss) on: | | | | |
| Investment Securities: | | | | |
| Unaffiliated issuers | | 9,098 | | |
| Fidelity Central Funds | | 398 | | |
| Other affiliated issuers | | (102,830,035) | | |
| Futures contracts | | (16,147,483) | | |
| Capital gain distributions from underlying funds: | | | | |
| Affiliated issuers | | 398,098,270 | | |
| Total net realized gain (loss) | | | | 279,130,248 |
| Change in net unrealized appreciation (depreciation) on: | | | | |
| Investment Securities: | | | | |
| Unaffiliated issuers | | 751 | | |
| Fidelity Central Funds | | (398) | | |
| Other affiliated issuers | | (6,168,433,293) | | |
| Futures contracts | | (14,003,972) | | |
| Total change in net unrealized appreciation (depreciation) | | | | (6,182,436,912) |
| Net gain (loss) | | | | (5,903,306,664) |
| Net increase (decrease) in net assets resulting from operations | | | $ | (5,724,482,717) |
| Statement of Changes in Net Assets |
| |
| | Six months ended September 30, 2022 (Unaudited) | | Year ended March 31, 2022 |
| Increase (Decrease) in Net Assets | | | | |
| Operations | | | | |
| Net investment income (loss) | $ | 178,823,947 | $ | 636,346,942 |
| Net realized gain (loss) | | 279,130,248 | | 3,177,426,054 |
| Change in net unrealized appreciation (depreciation) | | (6,182,436,912) | | (2,792,390,095) |
| Net increase (decrease) in net assets resulting from operations | | (5,724,482,717) | | 1,021,382,901 |
| Distributions to shareholders | | (1,856,674,047) | | (3,362,328,295) |
| Share transactions - net increase (decrease) | | 1,714,140,258 | | 1,097,523,194 |
| Total increase (decrease) in net assets | | (5,867,016,506) | | (1,243,422,200) |
| | | | | |
| Net Assets | | | | |
| Beginning of period | | 27,897,820,935 | | 29,141,243,135 |
| End of period | $ | 22,030,804,429 | $ | 27,897,820,935 |
| | | | | |
| | | | | |
Financial Highlights
| Fidelity Freedom® 2040 Fund |
| |
| | Six months ended (Unaudited) September 30, 2022 | | Years ended March 31, 2022 | | 2021 | | 2020 | | 2019 | | 2018 |
Selected Per-Share Data | | | | | | | | | | | | |
| Net asset value, beginning of period | $ | 11.41 | $ | 12.43 | $ | 8.40 | $ | 10.09 | $ | 10.67 | $ | 9.74 |
| Income from Investment Operations | | | | | | | | | | | | |
Net investment income (loss) A,B | | .06 | | .26 | | .10 | | .15 | | .14 | | .11 |
| Net realized and unrealized gain (loss) | | (2.30) | | .19 | | 4.60 | | (1.13) | | - C | | 1.29 |
| Total from investment operations | | (2.24) | | .45 | | 4.70 | | (.98) | | .14 | | 1.40 |
| Distributions from net investment income | | - | | (.28) | | (.12) | | (.16) | | (.15) | | (.12) |
| Distributions from net realized gain | | (.76) | | (1.20) | | (.54) | | (.55) | | (.57) | | (.35) |
| Total distributions | | (.76) | | (1.47) D | | (.67) D | | (.71) | | (.72) | | (.47) |
| Net asset value, end of period | $ | 8.41 | $ | 11.41 | $ | 12.43 | $ | 8.40 | $ | 10.09 | $ | 10.67 |
Total Return E,F | | (20.51)% | | 3.14% | | 57.59% | | (10.80)% | | 1.79% | | 14.52% |
Ratios to Average Net Assets B,G,H | | | | | | | | | | | | |
| Expenses before reductions | | .75% I | | .75% | | .75% | | .75% | | .75% | | .63% J |
| Expenses net of fee waivers, if any | | .75% I | | .75% | | .75% | | .75% | | .75% | | .63% J |
| Expenses net of all reductions | | .75% I | | .75% | | .75% | | .75% | | .75% | | .63% J |
| Net investment income (loss) | | 1.35% I | | 2.09% | | .95% | | 1.52% | | 1.36% | | 1.04% |
| Supplemental Data | | | | | | | | | | | | |
| Net assets, end of period (000 omitted) | $ | 9,336,183 | $ | 11,819,799 | $ | 11,610,621 | $ | 7,378,482 | $ | 8,404,848 | $ | 8,285,660 |
Portfolio turnover rate K | | 23% I,L | | 29% | | 22% | | 28% | | 17% | | 16% M |
A Calculated based on average shares outstanding during the period.
B Net investment income (loss) is affected by the timing of the declaration of dividends by any underlying mutual funds or exchange-traded funds (ETFs). Net investment income (loss) of any such underlying funds is not included in the Fund's net investment income (loss) ratio.
C Amount represents less than $.005 per share.
D Total distributions per share do not sum due to rounding.
E Total returns for periods of less than one year are not annualized.
F Total returns would have been lower if certain expenses had not been reduced during the applicable periods shown.
G Fees and expenses of any underlying mutual funds or exchange-traded funds (ETFs) are not included in the Fund's expense ratio. The Fund indirectly bears its proportionate share of these expenses. For additional expense information related to investments in Fidelity Central Funds, please refer to the "Investments in Fidelity Central Funds" note found in the Notes to Financial Statements section of the most recent Annual or Semi-Annual report.
H Expense ratios reflect operating expenses of the class. Expenses before reductions do not reflect amounts reimbursed, waived, or reduced through arrangements with the investment adviser, brokerage services, or other offset arrangements, if applicable, and do not represent the amount paid by the class during periods when reimbursements, waivers or reductions occur.
I Annualized
J On certain classes, the size and fluctuation of net assets and expense amounts may cause ratios to differ from contractual rates.
K Amount does not include the portfolio activity of any underlying mutual funds or exchange-traded funds (ETFs).
L Portfolio turnover rate excludes securities received or delivered in-kind.
M The portfolio turnover rate does not include the assets acquired in the merger.
| Fidelity Freedom® 2040 Fund Class K |
| |
| | Six months ended (Unaudited) September 30, 2022 | | Years ended March 31, 2022 | | 2021 | | 2020 | | 2019 | | 2018 A |
Selected Per-Share Data | | | | | | | | | | | | |
| Net asset value, beginning of period | $ | 11.42 | $ | 12.42 | $ | 8.39 | $ | 10.08 | $ | 10.66 | $ | 10.25 |
| Income from Investment Operations | | | | | | | | | | | | |
Net investment income (loss) B,C | | .07 | | .27 | | .11 | | .16 | | .15 | | .15 |
| Net realized and unrealized gain (loss) | | (2.32) | | .21 | | 4.59 | | (1.13) | | - D | | .59 |
| Total from investment operations | | (2.25) | | .48 | | 4.70 | | (.97) | | .15 | | .74 |
| Distributions from net investment income | | - | | (.28) | | (.13) | | (.17) | | (.16) | | (.14) |
| Distributions from net realized gain | | (.76) | | (1.20) | | (.54) | | (.55) | | (.57) | | (.19) |
| Total distributions | | (.76) | | (1.48) | | (.67) | | (.72) | | (.73) | | (.33) |
| Net asset value, end of period | $ | 8.41 | $ | 11.42 | $ | 12.42 | $ | 8.39 | $ | 10.08 | $ | 10.66 |
Total Return E,F | | (20.55)% | | 3.36% | | 57.77% | | (10.76)% | | 1.87% | | 7.21% |
Ratios to Average Net Assets C,G,H | | | | | | | | | | | | |
| Expenses before reductions | | .64% I | | .64% J | | .64% | | .64% | | .64% | | .65% I,J |
| Expenses net of fee waivers, if any | | .64% I | | .64% | | .64% | | .64% | | .64% | | .65% I,J |
| Expenses net of all reductions | | .64% I | | .64% J | | .64% | | .64% | | .64% | | .65% I,J |
| Net investment income (loss) | | 1.45% I | | 2.20% | | 1.05% | | 1.62% | | 1.46% | | 2.06% I |
| Supplemental Data | | | | | | | | | | | | |
| Net assets, end of period (000 omitted) | $ | 8,476,839 | $ | 11,362,816 | $ | 13,396,654 | $ | 9,581,184 | $ | 11,994,623 | $ | 13,434,642 |
Portfolio turnover rate K | | 23% I,L | | 29% | | 22% | | 28% | | 17% | | 16% M |
A For the period July 20, 2017 (commencement of sale of shares) through March 31, 2018.
B Calculated based on average shares outstanding during the period.
C Net investment income (loss) is affected by the timing of the declaration of dividends by any underlying mutual funds or exchange-traded funds (ETFs). Net investment income (loss) of any such underlying funds is not included in the Fund's net investment income (loss) ratio.
D Amount represents less than $.005 per share.
E Total returns for periods of less than one year are not annualized.
F Total returns would have been lower if certain expenses had not been reduced during the applicable periods shown.
G Fees and expenses of any underlying mutual funds or exchange-traded funds (ETFs) are not included in the Fund's expense ratio. The Fund indirectly bears its proportionate share of these expenses. For additional expense information related to investments in Fidelity Central Funds, please refer to the "Investments in Fidelity Central Funds" note found in the Notes to Financial Statements section of the most recent Annual or Semi-Annual report.
H Expense ratios reflect operating expenses of the class. Expenses before reductions do not reflect amounts reimbursed, waived, or reduced through arrangements with the investment adviser, brokerage services, or other offset arrangements, if applicable, and do not represent the amount paid by the class during periods when reimbursements, waivers or reductions occur.
I Annualized
J On certain classes, the size and fluctuation of net assets and expense amounts may cause ratios to differ from contractual rates.
K Amount does not include the portfolio activity of any underlying mutual funds or exchange-traded funds (ETFs).
L Portfolio turnover rate excludes securities received or delivered in-kind.
M The portfolio turnover rate does not include the assets acquired in the merger.
| Fidelity Freedom® 2040 Fund Class K6 |
| |
| | Six months ended (Unaudited) September 30, 2022 | | Years ended March 31, 2022 | | 2021 | | 2020 | | 2019 | | 2018 A |
Selected Per-Share Data | | | | | | | | | | | | |
| Net asset value, beginning of period | $ | 11.37 | $ | 12.38 | $ | 8.37 | $ | 10.06 | $ | 10.66 | $ | 10.03 |
| Income from Investment Operations | | | | | | | | | | | | |
Net investment income (loss) B,C | | .08 | | .29 | | .13 | | .18 | | .16 | | .13 |
| Net realized and unrealized gain (loss) | | (2.31) | | .20 | | 4.57 | | (1.13) | | .01 | | .83 |
| Total from investment operations | | (2.23) | | .49 | | 4.70 | | (.95) | | .17 | | .96 |
| Distributions from net investment income | | - | | (.31) | | (.15) | | (.18) | | (.19) | | (.14) |
| Distributions from net realized gain | | (.76) | | (1.20) | | (.55) | | (.56) | | (.58) | | (.19) |
| Total distributions | | (.76) | | (1.50) D | | (.69) D | | (.74) | | (.77) | | (.33) |
| Net asset value, end of period | $ | 8.38 | $ | 11.37 | $ | 12.38 | $ | 8.37 | $ | 10.06 | $ | 10.66 |
Total Return E,F | | (20.43)% | | 3.47% | | 57.95% | | (10.58)% | | 2.06% | | 9.60% |
Ratios to Average Net Assets C,G,H | | | | | | | | | | | | |
| Expenses before reductions | | .49% I | | .49% J | | .49% | | .49% | | .50% J | | .50% I,J |
| Expenses net of fee waivers, if any | | .49% I | | .49% J | | .49% | | .49% | | .50% J | | .50% I,J |
| Expenses net of all reductions | | .49% I | | .49% J | | .49% | | .49% | | .50% J | | .50% I,J |
| Net investment income (loss) | | 1.60% I | | 2.35% | | 1.20% | | 1.77% | | 1.61% | | 1.55% I |
| Supplemental Data | | | | | | | | | | | | |
| Net assets, end of period (000 omitted) | $ | 4,217,783 | $ | 4,715,207 | $ | 4,133,969 | $ | 2,393,289 | $ | 2,035,487 | $ | 652,451 |
Portfolio turnover rate K | | 23% I,L | | 29% | | 22% | | 28% | | 17% | | 16% M |
A For the period June 7, 2017 (commencement of sale of shares) through March 31, 2018.
B Calculated based on average shares outstanding during the period.
C Net investment income (loss) is affected by the timing of the declaration of dividends by any underlying mutual funds or exchange-traded funds (ETFs). Net investment income (loss) of any such underlying funds is not included in the Fund's net investment income (loss) ratio.
D Total distributions per share do not sum due to rounding.
E Total returns for periods of less than one year are not annualized.
F Total returns would have been lower if certain expenses had not been reduced during the applicable periods shown.
G Fees and expenses of any underlying mutual funds or exchange-traded funds (ETFs) are not included in the Fund's expense ratio. The Fund indirectly bears its proportionate share of these expenses. For additional expense information related to investments in Fidelity Central Funds, please refer to the "Investments in Fidelity Central Funds" note found in the Notes to Financial Statements section of the most recent Annual or Semi-Annual report.
H Expense ratios reflect operating expenses of the class. Expenses before reductions do not reflect amounts reimbursed, waived, or reduced through arrangements with the investment adviser, brokerage services, or other offset arrangements, if applicable, and do not represent the amount paid by the class during periods when reimbursements, waivers or reductions occur.
I Annualized
J On certain classes, the size and fluctuation of net assets and expense amounts may cause ratios to differ from contractual rates.
K Amount does not include the portfolio activity of any underlying mutual funds or exchange-traded funds (ETFs).
L Portfolio turnover rate excludes securities received or delivered in-kind.
M The portfolio turnover rate does not include the assets acquired in the merger.
The information in the following table is based on the direct Investments of the Fund.
Top Holdings (% of Fund's net assets) |
| |
| Fidelity Series Emerging Markets Opportunities Fund | 13.2 | |
| Fidelity Series Growth Company Fund | 8.6 | |
| Fidelity Series Large Cap Stock Fund | 8.1 | |
| Fidelity Series Overseas Fund | 7.5 | |
| Fidelity Series International Value Fund | 7.4 | |
| Fidelity Series International Growth Fund | 7.4 | |
| Fidelity Series Stock Selector Large Cap Value Fund | 5.9 | |
| Fidelity Series Long-Term Treasury Bond Index Fund | 5.7 | |
| Fidelity Series Opportunistic Insights Fund | 5.0 | |
| Fidelity Series Value Discovery Fund | 4.6 | |
| | 73.4 | |
| |
Domestic Equity Funds category includes Fidelity Series Commodity Strategy Fund which invests in commodity-related investments.
Asset Allocation (% of Fund's net assets) |
|
Percentages shown as 0.0% may reflect amounts less than 0.05%. |
|
Fidelity Freedom® 2045 Fund
Showing Percentage of Net Assets
| U.S. Treasury Obligations - 0.1% |
| | | Principal Amount (a) | Value ($) |
U.S. Treasury Bills, yield at date of purchase 2.13% to 2.42% 10/13/22 to 10/20/22 (b) (Cost $12,655,360) | | 12,670,000 | 12,656,020 |
| | | | |
| Domestic Equity Funds - 49.9% |
| | | Shares | Value ($) |
| Fidelity Series All-Sector Equity Fund (c) | | 31,767,738 | 272,567,192 |
| Fidelity Series Blue Chip Growth Fund (c) | | 64,421,337 | 646,790,219 |
| Fidelity Series Commodity Strategy Fund (c) | | 83,163,584 | 173,811,891 |
| Fidelity Series Growth Company Fund (c) | | 94,765,129 | 1,271,748,035 |
| Fidelity Series Intrinsic Opportunities Fund (c) | | 44,588,929 | 586,790,303 |
| Fidelity Series Large Cap Stock Fund (c) | | 81,814,563 | 1,208,401,095 |
| Fidelity Series Large Cap Value Index Fund (c) | | 31,292,723 | 398,043,435 |
| Fidelity Series Opportunistic Insights Fund (c) | | 52,089,784 | 740,195,826 |
| Fidelity Series Small Cap Discovery Fund (c) | | 13,151,583 | 123,361,850 |
| Fidelity Series Small Cap Opportunities Fund (c) | | 38,195,836 | 411,751,115 |
| Fidelity Series Stock Selector Large Cap Value Fund (c) | | 78,258,001 | 874,141,875 |
| Fidelity Series Value Discovery Fund (c) | | 49,669,275 | 683,945,914 |
| TOTAL DOMESTIC EQUITY FUNDS (Cost $7,342,382,721) | | | 7,391,548,750 |
| | | | |
| International Equity Funds - 42.0% |
| | | Shares | Value ($) |
| Fidelity Series Canada Fund (c) | | 38,668,524 | 479,489,694 |
| Fidelity Series Emerging Markets Fund (c) | | 29,284,716 | 212,021,346 |
| Fidelity Series Emerging Markets Opportunities Fund (c) | | 134,198,055 | 1,948,555,754 |
| Fidelity Series International Growth Fund (c) | | 85,211,243 | 1,092,408,138 |
| Fidelity Series International Small Cap Fund (c) | | 20,925,508 | 286,260,944 |
| Fidelity Series International Value Fund (c) | | 128,200,341 | 1,101,240,928 |
| Fidelity Series Overseas Fund (c) | | 115,734,546 | 1,102,950,222 |
| TOTAL INTERNATIONAL EQUITY FUNDS (Cost $6,869,974,285) | | | 6,222,927,026 |
| | | | |
| Bond Funds - 7.5% |
| | | Shares | Value ($) |
| Fidelity Series 5+ Year Inflation-Protected Bond Index Fund (c) | | 1,832,497 | 14,641,653 |
| Fidelity Series Emerging Markets Debt Fund (c) | | 11,375,113 | 78,033,273 |
| Fidelity Series Emerging Markets Debt Local Currency Fund (c) | | 3,220,886 | 25,670,461 |
| Fidelity Series Floating Rate High Income Fund (c) | | 1,733,338 | 15,080,041 |
| Fidelity Series High Income Fund (c) | | 10,226,648 | 80,585,988 |
| Fidelity Series International Credit Fund (c) | | 719,156 | 5,659,760 |
| Fidelity Series Long-Term Treasury Bond Index Fund (c) | | 141,746,163 | 846,224,593 |
| Fidelity Series Real Estate Income Fund (c) | | 4,011,840 | 38,192,720 |
| TOTAL BOND FUNDS (Cost $1,460,965,107) | | | 1,104,088,489 |
| | | | |
| Short-Term Funds - 0.5% |
| | | Shares | Value ($) |
| Fidelity Cash Central Fund 3.10% (d) | | 2,870,997 | 2,871,571 |
| Fidelity Series Government Money Market Fund 3.00% (c)(e) | | 74,384,509 | 74,384,509 |
| Fidelity Series Short-Term Credit Fund (c) | | 445 | 4,218 |
| TOTAL SHORT-TERM FUNDS (Cost $77,260,298) | | | 77,260,298 |
| | | | |
| TOTAL INVESTMENT IN SECURITIES - 100.0% (Cost $15,763,237,771) | 14,808,480,583 |
NET OTHER ASSETS (LIABILITIES) - 0.0% | (1,477,644) |
| NET ASSETS - 100.0% | 14,807,002,939 |
| | |
| Futures Contracts |
| | Number of contracts | Expiration Date | Notional Amount ($) | Value ($) | Unrealized Appreciation/ (Depreciation) ($) |
| Purchased | | | | | |
| | | | | | |
| Treasury Contracts | | | | | |
| CBOT 10-Year U.S. Treasury Note Contracts (United States) | 2,415 | Dec 2022 | 270,630,938 | (16,502,837) | (16,502,837) |
| CBOT Ultra Long Term U.S. Treasury Bond Contracts (United States) | 227 | Dec 2022 | 31,099,000 | (395,453) | (395,453) |
| | | | | | |
| TOTAL PURCHASED | | | | | (16,898,290) |
| | | | | | |
| Sold | | | | | |
| | | | | | |
| Equity Index Contracts | | | | | |
| CME E-mini S&P 500 Index Contracts (United States) | 397 | Dec 2022 | 71,489,775 | 81,767 | 81,767 |
| ICE E-mini MSCI EAFE Index Contracts (United States) | 699 | Dec 2022 | 58,037,970 | 7,873,864 | 7,873,864 |
| ICE E-mini MSCI Emerging Markets Index Contracts (United States) | 481 | Dec 2022 | 20,959,575 | 83,233 | 83,233 |
| | | | | | |
| TOTAL SOLD | | | | | 8,038,864 |
| | | | | | |
| TOTAL FUTURES CONTRACTS | | | | | (8,859,426) |
| The notional amount of futures purchased as a percentage of Net Assets is 2.0% |
| The notional amount of futures sold as a percentage of Net Assets is 1.0% |
Legend
| (a) | Amount is stated in United States dollars unless otherwise noted. |
| (b) | Security or a portion of the security was pledged to cover margin requirements for futures contracts. At period end, the value of securities pledged amounted to $10,486,761. |
| (d) | Affiliated fund that is generally available only to investment companies and other accounts managed by Fidelity Investments. The rate quoted is the annualized seven-day yield of the fund at period end. A complete unaudited listing of the fund's holdings as of its most recent quarter end is available upon request. In addition, each Fidelity Central Fund's financial statements are available on the SEC's website or upon request. |
| (e) | The rate quoted is the annualized seven-day yield of the fund at period end. |
Affiliated Central Funds
Fiscal year to date information regarding the Fund's investments in Fidelity Central Funds, including the ownership percentage, is presented below.
| Affiliate | Value, beginning of period ($) | Purchases ($) | Sales Proceeds ($) | Dividend Income ($) | Realized Gain (loss) ($) | Change in Unrealized appreciation (depreciation) ($) | Value, end of period ($) | %ownership, end of period |
| Fidelity Cash Central Fund 3.10% | 13,840,771 | 81,917,423 | 92,886,624 | 108,218 | 279 | (278) | 2,871,571 | 0.0% |
| Total | 13,840,771 | 81,917,423 | 92,886,624 | 108,218 | 279 | (278) | 2,871,571 | |
| | | | | | | | | |
Amounts in the income column in the above table include any capital gain distributions from underlying funds, which are presented in the corresponding line item in the Statement of Operations, if applicable.
Affiliated Underlying Funds
Fiscal year to date information regarding the Fund's investments in affiliated Underlying Funds is presented below. Exchanges between classes of the same affiliated Underlying Funds may occur. If an Underlying Funds changes its name, the name presented below is the name in effect at period end.
| Affiliate | Value, beginning of period ($) | Purchases ($) | Sales Proceeds ($) | Dividend Income ($) | Realized Gain (loss) ($) | Change in Unrealized appreciation (depreciation) ($) | Value, end of period ($) |
| Fidelity Series 5+ Year Inflation-Protected Bond Index Fund | 18,542,547 | 455,366 | 1,346,353 | - | (100,415) | (2,909,492) | 14,641,653 |
| Fidelity Series All-Sector Equity Fund | 362,751,926 | 8,537,032 | 26,234,317 | - | (4,760,623) | (67,726,826) | 272,567,192 |
| Fidelity Series Blue Chip Growth Fund | 595,525,642 | 294,616,797 | 31,871,817 | 21,839,786 | (9,204,825) | (202,275,578) | 646,790,219 |
| Fidelity Series Canada Fund | 602,415,414 | 38,737,300 | 40,869,183 | - | (1,857,554) | (118,936,283) | 479,489,694 |
| Fidelity Series Commodity Strategy Fund | 274,421,918 | 147,241,349 | 95,686,684 | 129,561,533 | (30,202,081) | (121,962,611) | 173,811,891 |
| Fidelity Series Emerging Markets Debt Fund | 90,593,819 | 4,913,305 | 1,951,858 | 2,332,467 | (135,158) | (15,386,835) | 78,033,273 |
| Fidelity Series Emerging Markets Debt Local Currency Fund | 30,698,280 | 789,120 | 2,298,647 | - | (291,040) | (3,227,252) | 25,670,461 |
| Fidelity Series Emerging Markets Fund | 253,055,079 | 25,314,486 | 8,214,947 | - | (1,596,780) | (56,536,492) | 212,021,346 |
| Fidelity Series Emerging Markets Opportunities Fund | 2,350,573,070 | 194,339,851 | 90,900,109 | - | (23,761,967) | (481,695,091) | 1,948,555,754 |
| Fidelity Series Floating Rate High Income Fund | 18,551,441 | 904,942 | 3,427,298 | 452,868 | (352,252) | (596,792) | 15,080,041 |
| Fidelity Series Government Money Market Fund 3.00% | - | 74,384,530 | 21 | 3,358 | - | - | 74,384,509 |
| Fidelity Series Growth Company Fund | 1,484,462,815 | 255,018,627 | 54,543,485 | - | (10,405,891) | (402,784,031) | 1,271,748,035 |
| Fidelity Series High Income Fund | 110,811,348 | 5,093,588 | 21,613,748 | 2,598,192 | (2,360,990) | (11,344,210) | 80,585,988 |
| Fidelity Series International Credit Fund | 6,575,960 | 89,783 | 10,953 | 89,783 | (244) | (994,786) | 5,659,760 |
| Fidelity Series International Growth Fund | 1,378,046,548 | 105,269,112 | 74,298,592 | - | (11,883,808) | (304,725,122) | 1,092,408,138 |
| Fidelity Series International Small Cap Fund | 377,652,063 | 11,205,678 | 12,672,500 | - | (2,362,523) | (87,561,774) | 286,260,944 |
| Fidelity Series International Value Fund | 1,391,639,810 | 101,293,250 | 86,116,570 | - | (2,766,766) | (302,808,796) | 1,101,240,928 |
| Fidelity Series Intrinsic Opportunities Fund | 1,395,079,324 | 190,257,712 | 703,025,018 | 164,718,211 | 56,678,505 | (352,200,220) | 586,790,303 |
| Fidelity Series Investment Grade Bond Fund | 95,086,811 | 1,055,262 | 92,478,607 | 346,436 | (3,991,330) | 327,864 | - |
| Fidelity Series Large Cap Stock Fund | 1,320,165,861 | 282,854,997 | 72,650,445 | 70,815,308 | (4,229,292) | (317,740,026) | 1,208,401,095 |
| Fidelity Series Large Cap Value Index Fund | 496,960,975 | 20,373,825 | 35,301,504 | - | (246,312) | (83,743,549) | 398,043,435 |
| Fidelity Series Long-Term Treasury Bond Index Fund | 987,471,120 | 153,584,877 | 70,881,192 | 11,902,968 | (12,937,110) | (211,013,102) | 846,224,593 |
| Fidelity Series Opportunistic Insights Fund | 760,501,976 | 196,699,441 | 33,077,595 | - | (4,939,053) | (178,988,943) | 740,195,826 |
| Fidelity Series Overseas Fund | 1,385,546,342 | 100,648,504 | 35,394,098 | - | (5,277,157) | (342,573,369) | 1,102,950,222 |
| Fidelity Series Real Estate Income Fund | 66,263,976 | 5,196,655 | 24,575,094 | 2,833,299 | (1,147,599) | (7,545,218) | 38,192,720 |
| Fidelity Series Short-Term Credit Fund | - | 4,218 | - | - | - | - | 4,218 |
| Fidelity Series Small Cap Discovery Fund | 161,385,604 | 21,816,679 | 10,640,649 | 17,910,604 | (1,754,399) | (47,445,385) | 123,361,850 |
| Fidelity Series Small Cap Opportunities Fund | 537,240,371 | 32,256,434 | 46,895,249 | 19,426,462 | (5,250,907) | (105,599,534) | 411,751,115 |
| Fidelity Series Stock Selector Large Cap Value Fund | 1,111,969,263 | 42,506,874 | 91,773,489 | - | (3,733,966) | (184,826,807) | 874,141,875 |
| Fidelity Series Value Discovery Fund | 845,977,580 | 40,043,912 | 88,016,053 | - | 1,616,176 | (115,675,701) | 683,945,914 |
| | 18,509,966,883 | 2,355,503,506 | 1,856,766,075 | 444,831,275 | (87,255,361) | (4,128,495,961) | 14,792,952,992 |
Amounts in the income column in the above table include any capital gain distributions from underlying funds, which are presented in the corresponding line item in the Statement of Operations, if applicable.
Purchases and Sales Proceeds in the table above include the value of shares purchased or redeemed through in-kind transactions, if applicable.
Investment Valuation
The following is a summary of the inputs used, as of September 30, 2022, involving the Fund's assets and liabilities carried at fair value. The inputs or methodology used for valuing securities may not be an indication of the risk associated with investing in those securities. For more information on valuation inputs, and their aggregation into the levels used below, please refer to the Investment Valuation section in the accompanying Notes to Financial Statements.
| Valuation Inputs at Reporting Date: |
| Description | Total ($) | Level 1 ($) | Level 2 ($) | Level 3 ($) |
Investments in Securities: | | | | |
|
| Other Short-Term Investments | 12,656,020 | - | 12,656,020 | - |
|
| Domestic Equity Funds | 7,391,548,750 | 7,391,548,750 | - | - |
|
| International Equity Funds | 6,222,927,026 | 6,222,927,026 | - | - |
|
| Bond Funds | 1,104,088,489 | 1,104,088,489 | - | - |
|
| Short-Term Funds | 77,260,298 | 77,260,298 | - | - |
| Total Investments in Securities: | 14,808,480,583 | 14,795,824,563 | 12,656,020 | - |
Derivative Instruments: | | | | |
|
| Assets | | | | |
Futures Contracts | 8,038,864 | 8,038,864 | - | - |
| Total Assets | 8,038,864 | 8,038,864 | - | - |
|
| Liabilities | | | | |
Futures Contracts | (16,898,290) | (16,898,290) | - | - |
| Total Liabilities | (16,898,290) | (16,898,290) | - | - |
| Total Derivative Instruments: | (8,859,426) | (8,859,426) | - | - |
Value of Derivative Instruments
The following table is a summary of the Fund's value of derivative instruments by primary risk exposure as of September 30, 2022. For additional information on derivative instruments, please refer to the Derivative Instruments section in the accompanying Notes to Financial Statements.
Primary Risk Exposure / Derivative Type | Value |
| Asset ($) | Liability ($) |
| Equity Risk | | |
Futures Contracts (a) | 8,038,864 | 0 |
| Total Equity Risk | 8,038,864 | 0 |
| Interest Rate Risk | | |
Futures Contracts (a) | 0 | (16,898,290) |
| Total Interest Rate Risk | 0 | (16,898,290) |
| Total Value of Derivatives | 8,038,864 | (16,898,290) |
(a)Reflects gross cumulative appreciation (depreciation) on futures contracts as presented in the Schedule of Investments. In the Statement of Assets and Liabilities, the period end daily variation margin is included in receivable or payable for daily variation margin on futures contracts, and the net cumulative appreciation (depreciation) is included in Total accumulated earnings (loss).
Fidelity Freedom® 2045 Fund
| Statement of Assets and Liabilities |
| | | | September 30, 2022 (Unaudited) |
| | | | | |
| Assets | | | | |
| Investment in securities, at value - See accompanying schedule: | $ | | | |
Unaffiliated issuers (cost $12,655,360) | | $12,656,020 | | |
Fidelity Central Funds (cost $2,871,571) | | 2,871,571 | | |
Other affiliated issuers (cost $15,747,710,840) | | 14,792,952,992 | | |
| | | | | |
| Total Investment in Securities (cost $15,763,237,771) | | | $ | 14,808,480,583 |
| Receivable for investments sold | | | | 88,554,579 |
| Receivable for fund shares sold | | | | 24,816,257 |
| Distributions receivable from Fidelity Central Funds | | | | 13,634 |
| Other receivables | | | | 128,710 |
Total assets | | | | 14,921,993,763 |
| Liabilities | | | | |
| Payable for investments purchased | | 92,286,636 | | |
| Payable for fund shares redeemed | | 13,302,899 | | |
| Accrued management fee | | 8,522,193 | | |
| Payable for daily variation margin on futures contracts | | 750,386 | | |
| Other payables and accrued expenses | | 128,710 | | |
| Total Liabilities | | | | 114,990,824 |
| Net Assets | | | $ | 14,807,002,939 |
| Net Assets consist of: | | | | |
| Paid in capital | | | $ | 15,570,663,287 |
| Total accumulated earnings (loss) | | | | (763,660,348) |
| Net Assets | | | $ | 14,807,002,939 |
| | | | | |
| Net Asset Value and Maximum Offering Price | | | | |
| Fidelity Freedom 2045 Fund : | | | | |
Net Asset Value , offering price and redemption price per share ($5,368,197,173 ÷ 557,792,788 shares) | | | $ | 9.62 |
| Class K : | | | | |
Net Asset Value , offering price and redemption price per share ($6,195,458,497 ÷ 644,009,730 shares) | | | $ | 9.62 |
| Class K6 : | | | | |
Net Asset Value , offering price and redemption price per share ($3,243,347,269 ÷ 338,308,464 shares) | | | $ | 9.59 |
| Statement of Operations |
| | | | Six months ended September 30, 2022 (Unaudited) |
| Investment Income | | | | |
| Dividends: | | | | |
| Affiliated issuers | | | $ | 172,678,750 |
| Interest | | | | 88,448 |
| Income from Fidelity Central Funds | | | | 108,218 |
| Total Income | | | | 172,875,416 |
| Expenses | | | | |
| Management fee | $ | 54,025,051 | | |
| Independent trustees' fees and expenses | | 28,790 | | |
| Total expenses before reductions | | 54,053,841 | | |
| Expense reductions | | (119) | | |
| Total expenses after reductions | | | | 54,053,722 |
| Net Investment income (loss) | | | | 118,821,694 |
| Realized and Unrealized Gain (Loss) | | | | |
| Net realized gain (loss) on: | | | | |
| Investment Securities: | | | | |
| Unaffiliated issuers | | 5,426 | | |
| Fidelity Central Funds | | 279 | | |
| Other affiliated issuers | | (87,255,361) | | |
| Futures contracts | | (10,499,427) | | |
| Capital gain distributions from underlying funds: | | | | |
| Affiliated issuers | | 272,152,525 | | |
| Total net realized gain (loss) | | | | 174,403,442 |
| Change in net unrealized appreciation (depreciation) on: | | | | |
| Investment Securities: | | | | |
| Unaffiliated issuers | | 477 | | |
| Fidelity Central Funds | | (278) | | |
| Other affiliated issuers | | (4,128,495,961) | | |
| Futures contracts | | (10,514,400) | | |
| Total change in net unrealized appreciation (depreciation) | | | | (4,139,010,162) |
| Net gain (loss) | | | | (3,964,606,720) |
| Net increase (decrease) in net assets resulting from operations | | | $ | (3,845,785,026) |
| Statement of Changes in Net Assets |
| |
| | Six months ended September 30, 2022 (Unaudited) | | Year ended March 31, 2022 |
| Increase (Decrease) in Net Assets | | | | |
| Operations | | | | |
| Net investment income (loss) | $ | 118,821,694 | $ | 421,094,865 |
| Net realized gain (loss) | | 174,403,442 | | 2,083,956,613 |
| Change in net unrealized appreciation (depreciation) | | (4,139,010,162) | | (1,827,826,798) |
| Net increase (decrease) in net assets resulting from operations | | (3,845,785,026) | | 677,224,680 |
| Distributions to shareholders | | (1,214,022,294) | | (2,197,883,066) |
| Share transactions - net increase (decrease) | | 1,334,323,013 | | 823,160,733 |
| Total increase (decrease) in net assets | | (3,725,484,307) | | (697,497,653) |
| | | | | |
| Net Assets | | | | |
| Beginning of period | | 18,532,487,246 | | 19,229,984,899 |
| End of period | $ | 14,807,002,939 | $ | 18,532,487,246 |
| | | | | |
| | | | | |
Financial Highlights
| Fidelity Freedom® 2045 Fund |
| |
| | Six months ended (Unaudited) September 30, 2022 | | Years ended March 31, 2022 | | 2021 | | 2020 | | 2019 | | 2018 |
Selected Per-Share Data | | | | | | | | | | | | |
| Net asset value, beginning of period | $ | 13.07 | $ | 14.22 | $ | 9.54 | $ | 11.44 | $ | 12.09 | $ | 11.00 |
| Income from Investment Operations | | | | | | | | | | | | |
Net investment income (loss) A,B | | .07 | | .30 | | .12 | | .17 | | .16 | | .12 |
| Net realized and unrealized gain (loss) | | (2.67) | | .22 | | 5.23 | | (1.29) | | (.01) | | 1.46 |
| Total from investment operations | | (2.60) | | .52 | | 5.35 | | (1.12) | | .15 | | 1.58 |
| Distributions from net investment income | | - | | (.32) | | (.14) | | (.18) | | (.17) | | (.13) |
| Distributions from net realized gain | | (.85) | | (1.36) | | (.53) | | (.61) | | (.63) | | (.35) |
| Total distributions | | (.85) | | (1.67) C | | (.67) | | (.78) C | | (.80) | | (.49) C |
| Net asset value, end of period | $ | 9.62 | $ | 13.07 | $ | 14.22 | $ | 9.54 | $ | 11.44 | $ | 12.09 |
Total Return D,E | | (20.72)% | | 3.19% | | 57.65% | | (10.80)% | | 1.72% | | 14.48% |
Ratios to Average Net Assets B,F,G | | | | | | | | | | | | |
| Expenses before reductions | | .75% H | | .75% | | .75% | | .75% | | .75% | | .63% I |
| Expenses net of fee waivers, if any | | .75% H | | .75% | | .75% | | .75% | | .75% | | .63% I |
| Expenses net of all reductions | | .75% H | | .75% | | .75% | | .75% | | .75% | | .63% I |
| Net investment income (loss) | | 1.33% H | | 2.10% | | .96% | | 1.52% | | 1.37% | | 1.04% |
| Supplemental Data | | | | | | | | | | | | |
| Net assets, end of period (000 omitted) | $ | 5,368,197 | $ | 6,683,617 | $ | 6,499,049 | $ | 3,945,874 | $ | 4,345,914 | $ | 4,144,152 |
Portfolio turnover rate J | | 22% H,K | | 30% | | 21% | | 28% | | 18% | | 17% L |
A Calculated based on average shares outstanding during the period.
B Net investment income (loss) is affected by the timing of the declaration of dividends by any underlying mutual funds or exchange-traded funds (ETFs). Net investment income (loss) of any such underlying funds is not included in the Fund's net investment income (loss) ratio.
C Total distributions per share do not sum due to rounding.
D Total returns for periods of less than one year are not annualized.
E Total returns would have been lower if certain expenses had not been reduced during the applicable periods shown.
F Fees and expenses of any underlying mutual funds or exchange-traded funds (ETFs) are not included in the Fund's expense ratio. The Fund indirectly bears its proportionate share of these expenses. For additional expense information related to investments in Fidelity Central Funds, please refer to the "Investments in Fidelity Central Funds" note found in the Notes to Financial Statements section of the most recent Annual or Semi-Annual report.
G Expense ratios reflect operating expenses of the class. Expenses before reductions do not reflect amounts reimbursed, waived, or reduced through arrangements with the investment adviser, brokerage services, or other offset arrangements, if applicable, and do not represent the amount paid by the class during periods when reimbursements, waivers or reductions occur.
H Annualized
I On certain classes, the size and fluctuation of net assets and expense amounts may cause ratios to differ from contractual rates.
J Amount does not include the portfolio activity of any underlying mutual funds or exchange-traded funds (ETFs).
K Portfolio turnover rate excludes securities received or delivered in-kind.
L The portfolio turnover rate does not include the assets acquired in the merger.
| Fidelity Freedom® 2045 Fund Class K |
| |
| | Six months ended (Unaudited) September 30, 2022 | | Years ended March 31, 2022 | | 2021 | | 2020 | | 2019 | | 2018 A |
Selected Per-Share Data | | | | | | | | | | | | |
| Net asset value, beginning of period | $ | 13.07 | $ | 14.21 | $ | 9.53 | $ | 11.43 | $ | 12.08 | $ | 11.59 |
| Income from Investment Operations | | | | | | | | | | | | |
Net investment income (loss) B,C | | .08 | | .31 | | .13 | | .18 | | .17 | | .17 |
| Net realized and unrealized gain (loss) | | (2.68) | | .23 | | 5.23 | | (1.29) | | (.01) | | .67 |
| Total from investment operations | | (2.60) | | .54 | | 5.36 | | (1.11) | | .16 | | .84 |
| Distributions from net investment income | | - | | (.32) | | (.15) | | (.19) | | (.18) | | (.15) |
| Distributions from net realized gain | | (.85) | | (1.36) | | (.53) | | (.61) | | (.63) | | (.19) |
| Total distributions | | (.85) | | (1.68) | | (.68) | | (.79) D | | (.81) | | (.35) D |
| Net asset value, end of period | $ | 9.62 | $ | 13.07 | $ | 14.21 | $ | 9.53 | $ | 11.43 | $ | 12.08 |
Total Return E,F | | (20.70)% | | 3.32% | | 57.85% | | (10.74)% | | 1.83% | | 7.21% |
Ratios to Average Net Assets C,G,H | | | | | | | | | | | | |
| Expenses before reductions | | .64% I | | .64% J | | .64% | | .64% | | .64% | | .65% I,J |
| Expenses net of fee waivers, if any | | .64% I | | .64% J | | .64% | | .64% | | .64% | | .65% I,J |
| Expenses net of all reductions | | .64% I | | .64% J | | .64% | | .64% | | .64% | | .65% I,J |
| Net investment income (loss) | | 1.43% I | | 2.20% | | 1.06% | | 1.62% | | 1.47% | | 2.05% I |
| Supplemental Data | | | | | | | | | | | | |
| Net assets, end of period (000 omitted) | $ | 6,195,458 | $ | 8,267,190 | $ | 9,496,661 | $ | 6,636,812 | $ | 7,982,073 | $ | 8,748,416 |
Portfolio turnover rate K | | 22% I,L | | 30% | | 21% | | 28% | | 18% | | 17% M |
A For the period July 20, 2017 (commencement of sale of shares) through March 31, 2018.
B Calculated based on average shares outstanding during the period.
C Net investment income (loss) is affected by the timing of the declaration of dividends by any underlying mutual funds or exchange-traded funds (ETFs). Net investment income (loss) of any such underlying funds is not included in the Fund's net investment income (loss) ratio.
D Total distributions per share do not sum due to rounding.
E Total returns for periods of less than one year are not annualized.
F Total returns would have been lower if certain expenses had not been reduced during the applicable periods shown.
G Fees and expenses of any underlying mutual funds or exchange-traded funds (ETFs) are not included in the Fund's expense ratio. The Fund indirectly bears its proportionate share of these expenses. For additional expense information related to investments in Fidelity Central Funds, please refer to the "Investments in Fidelity Central Funds" note found in the Notes to Financial Statements section of the most recent Annual or Semi-Annual report.
H Expense ratios reflect operating expenses of the class. Expenses before reductions do not reflect amounts reimbursed, waived, or reduced through arrangements with the investment adviser, brokerage services, or other offset arrangements, if applicable, and do not represent the amount paid by the class during periods when reimbursements, waivers or reductions occur.
I Annualized
J On certain classes, the size and fluctuation of net assets and expense amounts may cause ratios to differ from contractual rates.
K Amount does not include the portfolio activity of any underlying mutual funds or exchange-traded funds (ETFs).
L Portfolio turnover rate excludes securities received or delivered in-kind.
M The portfolio turnover rate does not include the assets acquired in the merger.
| Fidelity Freedom® 2045 Fund Class K6 |
| |
| | Six months ended (Unaudited) September 30, 2022 | | Years ended March 31, 2022 | | 2021 | | 2020 | | 2019 | | 2018 A |
Selected Per-Share Data | | | | | | | | | | | | |
| Net asset value, beginning of period | $ | 13.02 | $ | 14.17 | $ | 9.51 | $ | 11.41 | $ | 12.09 | $ | 11.34 |
| Income from Investment Operations | | | | | | | | | | | | |
Net investment income (loss) B,C | | .09 | | .33 | | .15 | | .20 | | .18 | | .14 |
| Net realized and unrealized gain (loss) | | (2.66) | | .23 | | 5.22 | | (1.28) | | (.01) | | .96 |
| Total from investment operations | | (2.57) | | .56 | | 5.37 | | (1.08) | | .17 | | 1.10 |
| Distributions from net investment income | | - | | (.35) | | (.17) | | (.20) | | (.21) | | (.16) |
| Distributions from net realized gain | | (.86) | | (1.36) | | (.54) | | (.61) | | (.64) | | (.19) |
| Total distributions | | (.86) | | (1.71) | | (.71) | | (.82) D | | (.85) | | (.35) |
| Net asset value, end of period | $ | 9.59 | $ | 13.02 | $ | 14.17 | $ | 9.51 | $ | 11.41 | $ | 12.09 |
Total Return E,F | | (20.58)% | | 3.44% | | 58.05% | | (10.57)% | | 1.95% | | 9.70% |
Ratios to Average Net Assets C,G,H | | | | | | | | | | | | |
| Expenses before reductions | | .49% I | | .49% J | | .49% | | .49% | | .50% | | .50% I,J |
| Expenses net of fee waivers, if any | | .49% I | | .49% J | | .49% | | .49% | | .50% | | .50% I,J |
| Expenses net of all reductions | | .49% I | | .49% J | | .49% | | .49% | | .50% | | .50% I,J |
| Net investment income (loss) | | 1.58% I | | 2.35% | | 1.21% | | 1.77% | | 1.62% | | 1.45% I |
| Supplemental Data | | | | | | | | | | | | |
| Net assets, end of period (000 omitted) | $ | 3,243,347 | $ | 3,581,681 | $ | 3,234,275 | $ | 1,819,682 | $ | 1,485,505 | $ | 412,758 |
Portfolio turnover rate K | | 22% I,L | | 30% | | 21% | | 28% | | 18% | | 17% M |
A For the period June 7, 2017 (commencement of sale of shares) through March 31, 2018.
B Calculated based on average shares outstanding during the period.
C Net investment income (loss) is affected by the timing of the declaration of dividends by any underlying mutual funds or exchange-traded funds (ETFs). Net investment income (loss) of any such underlying funds is not included in the Fund's net investment income (loss) ratio.
D Total distributions per share do not sum due to rounding.
E Total returns for periods of less than one year are not annualized.
F Total returns would have been lower if certain expenses had not been reduced during the applicable periods shown.
G Fees and expenses of any underlying mutual funds or exchange-traded funds (ETFs) are not included in the Fund's expense ratio. The Fund indirectly bears its proportionate share of these expenses. For additional expense information related to investments in Fidelity Central Funds, please refer to the "Investments in Fidelity Central Funds" note found in the Notes to Financial Statements section of the most recent Annual or Semi-Annual report.
H Expense ratios reflect operating expenses of the class. Expenses before reductions do not reflect amounts reimbursed, waived, or reduced through arrangements with the investment adviser, brokerage services, or other offset arrangements, if applicable, and do not represent the amount paid by the class during periods when reimbursements, waivers or reductions occur.
I Annualized
J On certain classes, the size and fluctuation of net assets and expense amounts may cause ratios to differ from contractual rates.
K Amount does not include the portfolio activity of any underlying mutual funds or exchange-traded funds (ETFs).
L Portfolio turnover rate excludes securities received or delivered in-kind.
M The portfolio turnover rate does not include the assets acquired in the merger.
The information in the following table is based on the direct Investments of the Fund.
Top Holdings (% of Fund's net assets) |
| |
| Fidelity Series Emerging Markets Opportunities Fund | 13.2 | |
| Fidelity Series Growth Company Fund | 8.6 | |
| Fidelity Series Large Cap Stock Fund | 8.1 | |
| Fidelity Series Overseas Fund | 7.5 | |
| Fidelity Series International Value Fund | 7.4 | |
| Fidelity Series International Growth Fund | 7.4 | |
| Fidelity Series Stock Selector Large Cap Value Fund | 5.9 | |
| Fidelity Series Long-Term Treasury Bond Index Fund | 5.7 | |
| Fidelity Series Opportunistic Insights Fund | 5.0 | |
| Fidelity Series Value Discovery Fund | 4.6 | |
| | 73.4 | |
| |
Domestic Equity Funds category includes Fidelity Series Commodity Strategy Fund which invests in commodity-related investments.
Asset Allocation (% of Fund's net assets) |
|
Percentages shown as 0.0% may reflect amounts less than 0.05%. |
|
Fidelity Freedom® 2050 Fund
Showing Percentage of Net Assets
| U.S. Treasury Obligations - 0.1% |
| | | Principal Amount (a) | Value ($) |
U.S. Treasury Bills, yield at date of purchase 1.89% to 2.42% 10/6/22 to 10/20/22 (b) (Cost $11,406,904) | | 11,420,000 | 11,407,501 |
| | | | |
| Domestic Equity Funds - 49.9% |
| | | Shares | Value ($) |
| Fidelity Series All-Sector Equity Fund (c) | | 28,815,059 | 247,233,207 |
| Fidelity Series Blue Chip Growth Fund (c) | | 58,433,809 | 586,675,443 |
| Fidelity Series Commodity Strategy Fund (c) | | 75,485,508 | 157,764,712 |
| Fidelity Series Growth Company Fund (c) | | 86,021,172 | 1,154,404,129 |
| Fidelity Series Intrinsic Opportunities Fund (c) | | 40,439,150 | 532,179,213 |
| Fidelity Series Large Cap Stock Fund (c) | | 74,205,738 | 1,096,018,750 |
| Fidelity Series Large Cap Value Index Fund (c) | | 28,383,867 | 361,042,786 |
| Fidelity Series Opportunistic Insights Fund (c) | | 47,242,699 | 671,318,755 |
| Fidelity Series Small Cap Discovery Fund (c) | | 11,929,386 | 111,897,643 |
| Fidelity Series Small Cap Opportunities Fund (c) | | 34,605,574 | 373,048,088 |
| Fidelity Series Stock Selector Large Cap Value Fund (c) | | 70,986,230 | 792,916,190 |
| Fidelity Series Value Discovery Fund (c) | | 45,046,954 | 620,296,558 |
| TOTAL DOMESTIC EQUITY FUNDS (Cost $6,748,135,315) | | | 6,704,795,474 |
| | | | |
| International Equity Funds - 42.0% |
| | | Shares | Value ($) |
| Fidelity Series Canada Fund (c) | | 35,075,036 | 434,930,449 |
| Fidelity Series Emerging Markets Fund (c) | | 26,573,303 | 192,390,717 |
| Fidelity Series Emerging Markets Opportunities Fund (c) | | 121,730,183 | 1,767,522,253 |
| Fidelity Series International Growth Fund (c) | | 77,297,029 | 990,947,915 |
| Fidelity Series International Small Cap Fund (c) | | 18,980,995 | 259,660,005 |
| Fidelity Series International Value Fund (c) | | 116,288,230 | 998,915,894 |
| Fidelity Series Overseas Fund (c) | | 104,985,120 | 1,000,508,195 |
| TOTAL INTERNATIONAL EQUITY FUNDS (Cost $6,281,201,788) | | | 5,644,875,428 |
| | | | |
| Bond Funds - 7.5% |
| | | Shares | Value ($) |
| Fidelity Series 5+ Year Inflation-Protected Bond Index Fund (c) | | 1,662,266 | 13,281,505 |
| Fidelity Series Emerging Markets Debt Fund (c) | | 10,318,010 | 70,781,550 |
| Fidelity Series Emerging Markets Debt Local Currency Fund (c) | | 2,921,575 | 23,284,956 |
| Fidelity Series Floating Rate High Income Fund (c) | | 1,572,256 | 13,678,628 |
| Fidelity Series High Income Fund (c) | | 9,276,241 | 73,096,781 |
| Fidelity Series International Credit Fund (c) | | 607,867 | 4,783,915 |
| Fidelity Series Long-Term Treasury Bond Index Fund (c) | | 128,574,453 | 767,589,485 |
| Fidelity Series Real Estate Income Fund (c) | | 3,639,532 | 34,648,345 |
| TOTAL BOND FUNDS (Cost $1,322,063,242) | | | 1,001,145,165 |
| | | | |
| Short-Term Funds - 0.5% |
| | | Shares | Value ($) |
| Fidelity Cash Central Fund 3.10% (d) | | 2,428,886 | 2,429,371 |
| Fidelity Series Government Money Market Fund 3.00% (c)(e) | | 67,568,029 | 67,568,029 |
| Fidelity Series Short-Term Credit Fund (c) | | 714 | 6,769 |
| TOTAL SHORT-TERM FUNDS (Cost $70,004,169) | | | 70,004,169 |
| | | | |
| TOTAL INVESTMENT IN SECURITIES - 100.0% (Cost $14,432,811,418) | 13,432,227,737 |
NET OTHER ASSETS (LIABILITIES) - 0.0% | (1,221,894) |
| NET ASSETS - 100.0% | 13,431,005,843 |
| | |
| Futures Contracts |
| | Number of contracts | Expiration Date | Notional Amount ($) | Value ($) | Unrealized Appreciation/ (Depreciation) ($) |
| Purchased | | | | | |
| | | | | | |
| Treasury Contracts | | | | | |
| CBOT 10-Year U.S. Treasury Note Contracts (United States) | 2,190 | Dec 2022 | 245,416,875 | (14,957,228) | (14,957,228) |
| CBOT Ultra Long Term U.S. Treasury Bond Contracts (United States) | 206 | Dec 2022 | 28,222,000 | (359,033) | (359,033) |
| | | | | | |
| TOTAL PURCHASED | | | | | (15,316,261) |
| | | | | | |
| Sold | | | | | |
| | | | | | |
| Equity Index Contracts | | | | | |
| CME E-mini S&P 500 Index Contracts (United States) | 360 | Dec 2022 | 64,827,000 | 71,422 | 71,422 |
| ICE E-mini MSCI EAFE Index Contracts (United States) | 636 | Dec 2022 | 52,807,080 | 7,163,952 | 7,163,952 |
| ICE E-mini MSCI Emerging Markets Index Contracts (United States) | 439 | Dec 2022 | 19,129,425 | 79,303 | 79,303 |
| | | | | | |
| TOTAL SOLD | | | | | 7,314,677 |
| | | | | | |
| TOTAL FUTURES CONTRACTS | | | | | (8,001,584) |
| The notional amount of futures purchased as a percentage of Net Assets is 2.0% |
| The notional amount of futures sold as a percentage of Net Assets is 1.0% |
Legend
| (a) | Amount is stated in United States dollars unless otherwise noted. |
| (b) | Security or a portion of the security was pledged to cover margin requirements for futures contracts. At period end, the value of securities pledged amounted to $9,505,426. |
| (d) | Affiliated fund that is generally available only to investment companies and other accounts managed by Fidelity Investments. The rate quoted is the annualized seven-day yield of the fund at period end. A complete unaudited listing of the fund's holdings as of its most recent quarter end is available upon request. In addition, each Fidelity Central Fund's financial statements are available on the SEC's website or upon request. |
| (e) | The rate quoted is the annualized seven-day yield of the fund at period end. |
Affiliated Central Funds
Fiscal year to date information regarding the Fund's investments in Fidelity Central Funds, including the ownership percentage, is presented below.
| Affiliate | Value, beginning of period ($) | Purchases ($) | Sales Proceeds ($) | Dividend Income ($) | Realized Gain (loss) ($) | Change in Unrealized appreciation (depreciation) ($) | Value, end of period ($) | %ownership, end of period |
| Fidelity Cash Central Fund 3.10% | 12,448,858 | 73,932,886 | 83,952,373 | 96,886 | 242 | (242) | 2,429,371 | 0.0% |
| Total | 12,448,858 | 73,932,886 | 83,952,373 | 96,886 | 242 | (242) | 2,429,371 | |
| | | | | | | | | |
Amounts in the income column in the above table include any capital gain distributions from underlying funds, which are presented in the corresponding line item in the Statement of Operations, if applicable.
Affiliated Underlying Funds
Fiscal year to date information regarding the Fund's investments in affiliated Underlying Funds is presented below. Exchanges between classes of the same affiliated Underlying Funds may occur. If an Underlying Funds changes its name, the name presented below is the name in effect at period end.
| Affiliate | Value, beginning of period ($) | Purchases ($) | Sales Proceeds ($) | Dividend Income ($) | Realized Gain (loss) ($) | Change in Unrealized appreciation (depreciation) ($) | Value, end of period ($) |
| Fidelity Series 5+ Year Inflation-Protected Bond Index Fund | 16,610,435 | 511,402 | 1,122,717 | - | (76,231) | (2,641,384) | 13,281,505 |
| Fidelity Series All-Sector Equity Fund | 324,955,142 | 9,578,406 | 21,941,791 | - | (3,866,274) | (61,492,276) | 247,233,207 |
| Fidelity Series Blue Chip Growth Fund | 533,480,569 | 270,132,417 | 26,078,257 | 19,824,358 | (7,820,467) | (183,038,819) | 586,675,443 |
| Fidelity Series Canada Fund | 539,659,919 | 38,367,206 | 34,116,843 | - | (1,885,834) | (107,093,999) | 434,930,449 |
| Fidelity Series Commodity Strategy Fund | 245,874,752 | 134,893,211 | 85,172,285 | 117,359,394 | (27,767,400) | (110,063,566) | 157,764,712 |
| Fidelity Series Emerging Markets Debt Fund | 81,164,497 | 5,020,584 | 1,398,411 | 2,104,500 | (140,829) | (13,864,291) | 70,781,550 |
| Fidelity Series Emerging Markets Debt Local Currency Fund | 27,500,274 | 890,623 | 1,933,389 | - | (268,220) | (2,904,332) | 23,284,956 |
| Fidelity Series Emerging Markets Fund | 226,731,802 | 24,348,790 | 6,208,802 | - | (1,206,512) | (51,274,561) | 192,390,717 |
| Fidelity Series Emerging Markets Opportunities Fund | 2,105,667,175 | 189,161,359 | 71,035,990 | - | (20,362,447) | (435,907,844) | 1,767,522,253 |
| Fidelity Series Floating Rate High Income Fund | 16,618,111 | 918,168 | 3,002,594 | 408,541 | (268,707) | (586,350) | 13,678,628 |
| Fidelity Series Government Money Market Fund 3.00% | - | 67,568,029 | - | 3,045 | - | - | 67,568,029 |
| Fidelity Series Growth Company Fund | 1,329,794,891 | 239,990,709 | 42,972,354 | - | (8,278,896) | (364,130,221) | 1,154,404,129 |
| Fidelity Series High Income Fund | 99,312,874 | 5,143,689 | 18,999,469 | 2,342,906 | (1,887,227) | (10,473,086) | 73,096,781 |
| Fidelity Series International Credit Fund | 5,559,641 | 75,907 | 10,416 | 75,907 | (232) | (840,985) | 4,783,915 |
| Fidelity Series International Growth Fund | 1,234,475,425 | 102,575,211 | 60,388,082 | - | (11,720,509) | (273,994,130) | 990,947,915 |
| Fidelity Series International Small Cap Fund | 338,301,784 | 12,294,666 | 9,800,972 | - | (2,106,101) | (79,029,372) | 259,660,005 |
| Fidelity Series International Value Fund | 1,246,651,570 | 99,289,129 | 71,194,858 | - | (2,628,426) | (273,201,521) | 998,915,894 |
| Fidelity Series Intrinsic Opportunities Fund | 1,249,720,181 | 177,403,154 | 627,665,333 | 149,207,988 | 45,590,532 | (312,869,321) | 532,179,213 |
| Fidelity Series Investment Grade Bond Fund | 85,231,051 | 1,070,680 | 83,007,517 | 311,479 | (3,587,248) | 293,034 | - |
| Fidelity Series Large Cap Stock Fund | 1,182,612,530 | 264,693,961 | 60,470,398 | 64,009,853 | (4,004,632) | (286,812,711) | 1,096,018,750 |
| Fidelity Series Large Cap Value Index Fund | 445,175,347 | 21,074,374 | 29,375,035 | - | (804,980) | (75,026,920) | 361,042,786 |
| Fidelity Series Long-Term Treasury Bond Index Fund | 884,634,166 | 144,502,248 | 59,500,697 | 10,736,016 | (11,972,723) | (190,073,509) | 767,589,485 |
| Fidelity Series Opportunistic Insights Fund | 681,262,909 | 183,271,841 | 27,353,979 | - | (4,365,191) | (161,496,825) | 671,318,755 |
| Fidelity Series Overseas Fund | 1,241,192,630 | 98,763,219 | 25,646,919 | - | (3,987,912) | (309,812,823) | 1,000,508,195 |
| Fidelity Series Real Estate Income Fund | 59,359,102 | 4,865,098 | 21,715,962 | 2,570,849 | (1,032,319) | (6,827,574) | 34,648,345 |
| Fidelity Series Short-Term Credit Fund | - | 6,769 | - | - | - | - | 6,769 |
| Fidelity Series Small Cap Discovery Fund | 144,625,544 | 20,511,022 | 8,866,338 | 16,128,363 | (1,383,718) | (42,988,867) | 111,897,643 |
| Fidelity Series Small Cap Opportunities Fund | 481,262,957 | 31,898,823 | 40,661,760 | 17,366,560 | (4,237,356) | (95,214,576) | 373,048,088 |
| Fidelity Series Stock Selector Large Cap Value Fund | 996,108,623 | 44,730,433 | 77,644,030 | - | (2,834,330) | (167,444,506) | 792,916,190 |
| Fidelity Series Value Discovery Fund | 757,827,406 | 41,598,646 | 76,032,199 | - | (220,673) | (102,876,622) | 620,296,558 |
| | 16,581,371,307 | 2,235,149,774 | 1,593,317,397 | 402,449,759 | (83,124,862) | (3,721,687,957) | 13,418,390,865 |
Amounts in the income column in the above table include any capital gain distributions from underlying funds, which are presented in the corresponding line item in the Statement of Operations, if applicable.
Purchases and Sales Proceeds in the table above include the value of shares purchased or redeemed through in-kind transactions, if applicable.
Investment Valuation
The following is a summary of the inputs used, as of September 30, 2022, involving the Fund's assets and liabilities carried at fair value. The inputs or methodology used for valuing securities may not be an indication of the risk associated with investing in those securities. For more information on valuation inputs, and their aggregation into the levels used below, please refer to the Investment Valuation section in the accompanying Notes to Financial Statements.
| Valuation Inputs at Reporting Date: |
| Description | Total ($) | Level 1 ($) | Level 2 ($) | Level 3 ($) |
Investments in Securities: | | | | |
|
| Other Short-Term Investments | 11,407,501 | - | 11,407,501 | - |
|
| Domestic Equity Funds | 6,704,795,474 | 6,704,795,474 | - | - |
|
| International Equity Funds | 5,644,875,428 | 5,644,875,428 | - | - |
|
| Bond Funds | 1,001,145,165 | 1,001,145,165 | - | - |
|
| Short-Term Funds | 70,004,169 | 70,004,169 | - | - |
| Total Investments in Securities: | 13,432,227,737 | 13,420,820,236 | 11,407,501 | - |
Derivative Instruments: | | | | |
|
| Assets | | | | |
Futures Contracts | 7,314,677 | 7,314,677 | - | - |
| Total Assets | 7,314,677 | 7,314,677 | - | - |
|
| Liabilities | | | | |
Futures Contracts | (15,316,261) | (15,316,261) | - | - |
| Total Liabilities | (15,316,261) | (15,316,261) | - | - |
| Total Derivative Instruments: | (8,001,584) | (8,001,584) | - | - |
Value of Derivative Instruments
The following table is a summary of the Fund's value of derivative instruments by primary risk exposure as of September 30, 2022. For additional information on derivative instruments, please refer to the Derivative Instruments section in the accompanying Notes to Financial Statements.
Primary Risk Exposure / Derivative Type | Value |
| Asset ($) | Liability ($) |
| Equity Risk | | |
Futures Contracts (a) | 7,314,677 | 0 |
| Total Equity Risk | 7,314,677 | 0 |
| Interest Rate Risk | | |
Futures Contracts (a) | 0 | (15,316,261) |
| Total Interest Rate Risk | 0 | (15,316,261) |
| Total Value of Derivatives | 7,314,677 | (15,316,261) |
(a)Reflects gross cumulative appreciation (depreciation) on futures contracts as presented in the Schedule of Investments. In the Statement of Assets and Liabilities, the period end daily variation margin is included in receivable or payable for daily variation margin on futures contracts, and the net cumulative appreciation (depreciation) is included in Total accumulated earnings (loss).
Fidelity Freedom® 2050 Fund
| Statement of Assets and Liabilities |
| | | | September 30, 2022 (Unaudited) |
| | | | | |
| Assets | | | | |
| Investment in securities, at value - See accompanying schedule: | $ | | | |
Unaffiliated issuers (cost $11,406,904) | | $11,407,501 | | |
Fidelity Central Funds (cost $2,429,371) | | 2,429,371 | | |
Other affiliated issuers (cost $14,418,975,143) | | 13,418,390,865 | | |
| | | | | |
| Total Investment in Securities (cost $14,432,811,418) | | | $ | 13,432,227,737 |
| Receivable for investments sold | | | | 78,770,858 |
| Receivable for fund shares sold | | | | 26,181,972 |
| Distributions receivable from Fidelity Central Funds | | | | 12,080 |
| Other receivables | | | | 81,342 |
Total assets | | | | 13,537,273,989 |
| Liabilities | | | | |
| Payable for investments purchased | | 84,921,281 | | |
| Payable for fund shares redeemed | | 12,880,814 | | |
| Accrued management fee | | 7,701,895 | | |
| Payable for daily variation margin on futures contracts | | 682,814 | | |
| Other payables and accrued expenses | | 81,342 | | |
| Total Liabilities | | | | 106,268,146 |
| Net Assets | | | $ | 13,431,005,843 |
| Net Assets consist of: | | | | |
| Paid in capital | | | $ | 14,266,236,317 |
| Total accumulated earnings (loss) | | | | (835,230,474) |
| Net Assets | | | $ | 13,431,005,843 |
| | | | | |
| Net Asset Value and Maximum Offering Price | | | | |
| Fidelity Freedom 2050 Fund : | | | | |
Net Asset Value , offering price and redemption price per share ($4,611,698,237 ÷ 473,897,933 shares) | | | $ | 9.73 |
| Class K : | | | | |
Net Asset Value , offering price and redemption price per share ($5,896,814,134 ÷ 606,216,177 shares) | | | $ | 9.73 |
| Class K6 : | | | | |
Net Asset Value , offering price and redemption price per share ($2,922,493,472 ÷ 300,897,778 shares) | | | $ | 9.71 |
| Statement of Operations |
| | | | Six months ended September 30, 2022 (Unaudited) |
| Investment Income | | | | |
| Dividends: | | | | |
| Affiliated issuers | | | $ | 156,291,952 |
| Interest | | | | 79,486 |
| Income from Fidelity Central Funds | | | | 96,886 |
| Total Income | | | | 156,468,324 |
| Expenses | | | | |
| Management fee | $ | 48,599,072 | | |
| Independent trustees' fees and expenses | | 25,884 | | |
| Total expenses before reductions | | 48,624,956 | | |
| Expense reductions | | (103) | | |
| Total expenses after reductions | | | | 48,624,853 |
| Net Investment income (loss) | | | | 107,843,471 |
| Realized and Unrealized Gain (Loss) | | | | |
| Net realized gain (loss) on: | | | | |
| Investment Securities: | | | | |
| Unaffiliated issuers | | 4,629 | | |
| Fidelity Central Funds | | 242 | | |
| Other affiliated issuers | | (83,124,862) | | |
| Futures contracts | | (9,549,432) | | |
| Capital gain distributions from underlying funds: | | | | |
| Affiliated issuers | | 246,157,807 | | |
| Total net realized gain (loss) | | | | 153,488,384 |
| Change in net unrealized appreciation (depreciation) on: | | | | |
| Investment Securities: | | | | |
| Unaffiliated issuers | | 436 | | |
| Fidelity Central Funds | | (242) | | |
| Other affiliated issuers | | (3,721,687,957) | | |
| Futures contracts | | (9,461,456) | | |
| Total change in net unrealized appreciation (depreciation) | | | | (3,731,149,219) |
| Net gain (loss) | | | | (3,577,660,835) |
| Net increase (decrease) in net assets resulting from operations | | | $ | (3,469,817,364) |
| Statement of Changes in Net Assets |
| |
| | Six months ended September 30, 2022 (Unaudited) | | Year ended March 31, 2022 |
| Increase (Decrease) in Net Assets | | | | |
| Operations | | | | |
| Net investment income (loss) | $ | 107,843,471 | $ | 374,434,768 |
| Net realized gain (loss) | | 153,488,384 | | 1,827,866,798 |
| Change in net unrealized appreciation (depreciation) | | (3,731,149,219) | | (1,616,052,763) |
| Net increase (decrease) in net assets resulting from operations | | (3,469,817,364) | | 586,248,803 |
| Distributions to shareholders | | (1,070,907,319) | | (1,916,924,784) |
| Share transactions - net increase (decrease) | | 1,370,214,226 | | 999,220,120 |
| Total increase (decrease) in net assets | | (3,170,510,457) | | (331,455,861) |
| | | | | |
| Net Assets | | | | |
| Beginning of period | | 16,601,516,300 | | 16,932,972,161 |
| End of period | $ | 13,431,005,843 | $ | 16,601,516,300 |
| | | | | |
| | | | | |
Financial Highlights
| Fidelity Freedom® 2050 Fund |
| |
| | Six months ended (Unaudited) September 30, 2022 | | Years ended March 31, 2022 | | 2021 | | 2020 | | 2019 | | 2018 |
Selected Per-Share Data | | | | | | | | | | | | |
| Net asset value, beginning of period | $ | 13.20 | $ | 14.33 | $ | 9.61 | $ | 11.52 | $ | 12.16 | $ | 11.05 |
| Income from Investment Operations | | | | | | | | | | | | |
Net investment income (loss) A,B | | .07 | | .30 | | .12 | | .18 | | .16 | | .12 |
| Net realized and unrealized gain (loss) | | (2.70) | | .23 | | 5.27 | | (1.30) | | - C | | 1.48 |
| Total from investment operations | | (2.63) | | .53 | | 5.39 | | (1.12) | | .16 | | 1.60 |
| Distributions from net investment income | | - | | (.32) | | (.14) | | (.18) | | (.17) | | (.14) |
| Distributions from net realized gain | | (.84) | | (1.34) | | (.53) | | (.60) | | (.63) | | (.35) |
| Total distributions | | (.84) | | (1.66) | | (.67) | | (.79) D | | (.80) | | (.49) |
| Net asset value, end of period | $ | 9.73 | $ | 13.20 | $ | 14.33 | $ | 9.61 | $ | 11.52 | $ | 12.16 |
Total Return E,F | | (20.71)% | | 3.20% | | 57.62% | | (10.80)% | | 1.73% | | 14.59% |
Ratios to Average Net Assets B,G,H | | | | | | | | | | | | |
| Expenses before reductions | | .75% I | | .75% | | .75% | | .75% | | .75% | | .63% J |
| Expenses net of fee waivers, if any | | .75% I | | .75% | | .75% | | .75% | | .75% | | .63% J |
| Expenses net of all reductions | | .75% I | | .75% | | .75% | | .75% | | .75% | | .63% J |
| Net investment income (loss) | | 1.34% I | | 2.10% | | .96% | | 1.53% | | 1.37% | | 1.04% |
| Supplemental Data | | | | | | | | | | | | |
| Net assets, end of period (000 omitted) | $ | 4,611,698 | $ | 5,676,102 | $ | 5,495,177 | $ | 3,373,190 | $ | 3,679,538 | $ | 3,452,997 |
Portfolio turnover rate K | | 21% I,L | | 29% | | 21% | | 27% | | 18% | | 16% M |
A Calculated based on average shares outstanding during the period.
B Net investment income (loss) is affected by the timing of the declaration of dividends by any underlying mutual funds or exchange-traded funds (ETFs). Net investment income (loss) of any such underlying funds is not included in the Fund's net investment income (loss) ratio.
C Amount represents less than $.005 per share.
D Total distributions per share do not sum due to rounding.
E Total returns for periods of less than one year are not annualized.
F Total returns would have been lower if certain expenses had not been reduced during the applicable periods shown.
G Fees and expenses of any underlying mutual funds or exchange-traded funds (ETFs) are not included in the Fund's expense ratio. The Fund indirectly bears its proportionate share of these expenses. For additional expense information related to investments in Fidelity Central Funds, please refer to the "Investments in Fidelity Central Funds" note found in the Notes to Financial Statements section of the most recent Annual or Semi-Annual report.
H Expense ratios reflect operating expenses of the class. Expenses before reductions do not reflect amounts reimbursed, waived, or reduced through arrangements with the investment adviser, brokerage services, or other offset arrangements, if applicable, and do not represent the amount paid by the class during periods when reimbursements, waivers or reductions occur.
I Annualized
J On certain classes, the size and fluctuation of net assets and expense amounts may cause ratios to differ from contractual rates.
K Amount does not include the portfolio activity of any underlying mutual funds or exchange-traded funds (ETFs).
L Portfolio turnover rate excludes securities received or delivered in-kind.
M The portfolio turnover rate does not include the assets acquired in the merger.
| Fidelity Freedom® 2050 Fund Class K |
| |
| | Six months ended (Unaudited) September 30, 2022 | | Years ended March 31, 2022 | | 2021 | | 2020 | | 2019 | | 2018 A |
Selected Per-Share Data | | | | | | | | | | | | |
| Net asset value, beginning of period | $ | 13.19 | $ | 14.32 | $ | 9.60 | $ | 11.50 | $ | 12.14 | $ | 11.65 |
| Income from Investment Operations | | | | | | | | | | | | |
Net investment income (loss) B,C | | .08 | | .32 | | .13 | | .19 | | .17 | | .17 |
| Net realized and unrealized gain (loss) | | (2.69) | | .22 | | 5.27 | | (1.29) | | - D | | .67 |
| Total from investment operations | | (2.61) | | .54 | | 5.40 | | (1.10) | | .17 | | .84 |
| Distributions from net investment income | | - | | (.33) | | (.15) | | (.19) | | (.18) | | (.15) |
| Distributions from net realized gain | | (.85) | | (1.34) | | (.53) | | (.61) | | (.63) | | (.19) |
| Total distributions | | (.85) | | (1.67) | | (.68) | | (.80) | | (.81) | | (.35) E |
| Net asset value, end of period | $ | 9.73 | $ | 13.19 | $ | 14.32 | $ | 9.60 | $ | 11.50 | $ | 12.14 |
Total Return F,G | | (20.63)% | | 3.26% | | 57.78% | | (10.66)% | | 1.82% | | 7.18% |
Ratios to Average Net Assets C,H,I | | | | | | | | | | | | |
| Expenses before reductions | | .64% J | | .64% K | | .64% | | .64% | | .64% | | .65% J,K |
| Expenses net of fee waivers, if any | | .64% J | | .64% K | | .64% | | .64% | | .64% | | .65% J,K |
| Expenses net of all reductions | | .64% J | | .64% K | | .64% | | .64% | | .64% | | .65% J,K |
| Net investment income (loss) | | 1.44% J | | 2.20% | | 1.06% | | 1.63% | | 1.48% | | 2.04% J |
| Supplemental Data | | | | | | | | | | | | |
| Net assets, end of period (000 omitted) | $ | 5,896,814 | $ | 7,763,505 | $ | 8,727,043 | $ | 5,952,708 | $ | 6,982,416 | $ | 7,475,339 |
Portfolio turnover rate L | | 21% J,M | | 29% | | 21% | | 27% | | 18% | | 16% N |
A For the period July 20, 2017 (commencement of sale of shares) through March 31, 2018.
B Calculated based on average shares outstanding during the period.
C Net investment income (loss) is affected by the timing of the declaration of dividends by any underlying mutual funds or exchange-traded funds (ETFs). Net investment income (loss) of any such underlying funds is not included in the Fund's net investment income (loss) ratio.
D Amount represents less than $.005 per share.
E Total distributions per share do not sum due to rounding.
F Total returns for periods of less than one year are not annualized.
G Total returns would have been lower if certain expenses had not been reduced during the applicable periods shown.
H Fees and expenses of any underlying mutual funds or exchange-traded funds (ETFs) are not included in the Fund's expense ratio. The Fund indirectly bears its proportionate share of these expenses. For additional expense information related to investments in Fidelity Central Funds, please refer to the "Investments in Fidelity Central Funds" note found in the Notes to Financial Statements section of the most recent Annual or Semi-Annual report.
I Expense ratios reflect operating expenses of the class. Expenses before reductions do not reflect amounts reimbursed, waived, or reduced through arrangements with the investment adviser, brokerage services, or other offset arrangements, if applicable, and do not represent the amount paid by the class during periods when reimbursements, waivers or reductions occur.
J Annualized
K On certain classes, the size and fluctuation of net assets and expense amounts may cause ratios to differ from contractual rates.
L Amount does not include the portfolio activity of any underlying mutual funds or exchange-traded funds (ETFs).
M Portfolio turnover rate excludes securities received or delivered in-kind.
N The portfolio turnover rate does not include the assets acquired in the merger.
| Fidelity Freedom® 2050 Fund Class K6 |
| |
| | Six months ended (Unaudited) September 30, 2022 | | Years ended March 31, 2022 | | 2021 | | 2020 | | 2019 | | 2018 A |
Selected Per-Share Data | | | | | | | | | | | | |
| Net asset value, beginning of period | $ | 13.17 | $ | 14.30 | $ | 9.59 | $ | 11.49 | $ | 12.15 | $ | 11.40 |
| Income from Investment Operations | | | | | | | | | | | | |
Net investment income (loss) B,C | | .09 | | .34 | | .15 | | .20 | | .19 | | .14 |
| Net realized and unrealized gain (loss) | | (2.70) | | .22 | | 5.26 | | (1.28) | | (.01) | | .96 |
| Total from investment operations | | (2.61) | | .56 | | 5.41 | | (1.08) | | .18 | | 1.10 |
| Distributions from net investment income | | - | | (.35) | | (.17) | | (.21) | | (.21) | | (.16) |
| Distributions from net realized gain | | (.85) | | (1.34) | | (.53) | | (.61) | | (.63) | | (.19) |
| Total distributions | | (.85) | | (1.69) | | (.70) | | (.82) | | (.84) | | (.35) |
| Net asset value, end of period | $ | 9.71 | $ | 13.17 | $ | 14.30 | $ | 9.59 | $ | 11.49 | $ | 12.15 |
Total Return D,E | | (20.61)% | | 3.43% | | 57.97% | | (10.49)% | | 1.96% | | 9.65% |
Ratios to Average Net Assets C,F,G | | | | | | | | | | | | |
| Expenses before reductions | | .49% H | | .49% I | | .49% | | .49% | | .50% I | | .50% H,I |
| Expenses net of fee waivers, if any | | .49% H | | .49% I | | .49% | | .49% | | .50% I | | .50% H,I |
| Expenses net of all reductions | | .49% H | | .49% I | | .49% | | .49% | | .50% I | | .50% H,I |
| Net investment income (loss) | | 1.59% H | | 2.35% | | 1.21% | | 1.78% | | 1.62% | | 1.42% H |
| Supplemental Data | | | | | | | | | | | | |
| Net assets, end of period (000 omitted) | $ | 2,922,493 | $ | 3,161,910 | $ | 2,710,752 | $ | 1,486,348 | $ | 1,184,606 | $ | 327,591 |
Portfolio turnover rate J | | 21% H,K | | 29% | | 21% | | 27% | | 18% | | 16% L |
A For the period June 7, 2017 (commencement of sale of shares) through March 31, 2018.
B Calculated based on average shares outstanding during the period.
C Net investment income (loss) is affected by the timing of the declaration of dividends by any underlying mutual funds or exchange-traded funds (ETFs). Net investment income (loss) of any such underlying funds is not included in the Fund's net investment income (loss) ratio.
D Total returns for periods of less than one year are not annualized.
E Total returns would have been lower if certain expenses had not been reduced during the applicable periods shown.
F Fees and expenses of any underlying mutual funds or exchange-traded funds (ETFs) are not included in the Fund's expense ratio. The Fund indirectly bears its proportionate share of these expenses. For additional expense information related to investments in Fidelity Central Funds, please refer to the "Investments in Fidelity Central Funds" note found in the Notes to Financial Statements section of the most recent Annual or Semi-Annual report.
G Expense ratios reflect operating expenses of the class. Expenses before reductions do not reflect amounts reimbursed, waived, or reduced through arrangements with the investment adviser, brokerage services, or other offset arrangements, if applicable, and do not represent the amount paid by the class during periods when reimbursements, waivers or reductions occur.
H Annualized
I On certain classes, the size and fluctuation of net assets and expense amounts may cause ratios to differ from contractual rates.
J Amount does not include the portfolio activity of any underlying mutual funds or exchange-traded funds (ETFs).
K Portfolio turnover rate excludes securities received or delivered in-kind.
L The portfolio turnover rate does not include the assets acquired in the merger.
The information in the following table is based on the direct Investments of the Fund.
Top Holdings (% of Fund's net assets) |
| |
| Fidelity Series Emerging Markets Opportunities Fund | 13.2 | |
| Fidelity Series Growth Company Fund | 8.6 | |
| Fidelity Series Large Cap Stock Fund | 8.1 | |
| Fidelity Series Overseas Fund | 7.5 | |
| Fidelity Series International Value Fund | 7.4 | |
| Fidelity Series International Growth Fund | 7.4 | |
| Fidelity Series Stock Selector Large Cap Value Fund | 5.9 | |
| Fidelity Series Long-Term Treasury Bond Index Fund | 5.7 | |
| Fidelity Series Opportunistic Insights Fund | 5.0 | |
| Fidelity Series Value Discovery Fund | 4.6 | |
| | 73.4 | |
| |
Domestic Equity Funds category includes Fidelity Series Commodity Strategy Fund which invests in commodity-related investments.
Asset Allocation (% of Fund's net assets) |
|
Percentages shown as 0.0% may reflect amounts less than 0.05%. |
|
Fidelity Freedom® 2055 Fund
Showing Percentage of Net Assets
| U.S. Treasury Obligations - 0.1% |
| | | Principal Amount (a) | Value ($) |
U.S. Treasury Bills, yield at date of purchase 1.89% to 2.42% 10/6/22 to 10/20/22 (b) (Cost $6,173,112) | | 6,180,000 | 6,173,430 |
| | | | |
| Domestic Equity Funds - 49.9% |
| | | Shares | Value ($) |
| Fidelity Series All-Sector Equity Fund (c) | | 15,823,585 | 135,766,361 |
| Fidelity Series Blue Chip Growth Fund (c) | | 32,086,974 | 322,153,218 |
| Fidelity Series Commodity Strategy Fund (c) | | 41,578,255 | 86,898,553 |
| Fidelity Series Growth Company Fund (c) | | 47,239,235 | 633,950,528 |
| Fidelity Series Intrinsic Opportunities Fund (c) | | 22,205,627 | 292,226,046 |
| Fidelity Series Large Cap Stock Fund (c) | | 40,745,939 | 601,817,526 |
| Fidelity Series Large Cap Value Index Fund (c) | | 15,586,298 | 198,257,713 |
| Fidelity Series Opportunistic Insights Fund (c) | | 25,939,852 | 368,605,294 |
| Fidelity Series Small Cap Discovery Fund (c) | | 6,551,241 | 61,450,639 |
| Fidelity Series Small Cap Opportunities Fund (c) | | 19,004,304 | 204,866,399 |
| Fidelity Series Stock Selector Large Cap Value Fund (c) | | 38,979,726 | 435,403,542 |
| Fidelity Series Value Discovery Fund (c) | | 24,734,153 | 340,589,291 |
| TOTAL DOMESTIC EQUITY FUNDS (Cost $4,024,479,289) | | | 3,681,985,110 |
| | | | |
| International Equity Funds - 42.0% |
| | | Shares | Value ($) |
| Fidelity Series Canada Fund (c) | | 19,260,882 | 238,834,942 |
| Fidelity Series Emerging Markets Fund (c) | | 14,601,929 | 105,717,967 |
| Fidelity Series Emerging Markets Opportunities Fund (c) | | 66,856,432 | 970,755,396 |
| Fidelity Series International Growth Fund (c) | | 42,453,010 | 544,247,589 |
| Fidelity Series International Small Cap Fund (c) | | 10,422,482 | 142,579,556 |
| Fidelity Series International Value Fund (c) | | 63,859,401 | 548,552,251 |
| Fidelity Series Overseas Fund (c) | | 57,659,112 | 549,491,342 |
| TOTAL INTERNATIONAL EQUITY FUNDS (Cost $3,600,205,428) | | | 3,100,179,043 |
| | | | |
| Bond Funds - 7.5% |
| | | Shares | Value ($) |
| Fidelity Series 5+ Year Inflation-Protected Bond Index Fund (c) | | 912,930 | 7,294,309 |
| Fidelity Series Emerging Markets Debt Fund (c) | | 5,665,381 | 38,864,513 |
| Fidelity Series Emerging Markets Debt Local Currency Fund (c) | | 1,604,222 | 12,785,652 |
| Fidelity Series Floating Rate High Income Fund (c) | | 863,306 | 7,510,759 |
| Fidelity Series High Income Fund (c) | | 5,093,366 | 40,135,726 |
| Fidelity Series International Credit Fund (c) | | 205,395 | 1,616,457 |
| Fidelity Series Long-Term Treasury Bond Index Fund (c) | | 70,601,454 | 421,490,683 |
| Fidelity Series Real Estate Income Fund (c) | | 1,999,073 | 19,031,179 |
| TOTAL BOND FUNDS (Cost $720,084,314) | | | 548,729,278 |
| | | | |
| Short-Term Funds - 0.5% |
| | | Shares | Value ($) |
| Fidelity Cash Central Fund 3.10% (d) | | 1,970,496 | 1,970,890 |
| Fidelity Series Government Money Market Fund 3.00% (c)(e) | | 37,353,382 | 37,353,382 |
| Fidelity Series Short-Term Credit Fund (c) | | 1,297 | 12,299 |
| TOTAL SHORT-TERM FUNDS (Cost $39,336,571) | | | 39,336,571 |
| | | | |
| TOTAL INVESTMENT IN SECURITIES - 100.0% (Cost $8,390,278,714) | 7,376,403,432 |
NET OTHER ASSETS (LIABILITIES) - 0.0% | (655,063) |
| NET ASSETS - 100.0% | 7,375,748,369 |
| | |
| Futures Contracts |
| | Number of contracts | Expiration Date | Notional Amount ($) | Value ($) | Unrealized Appreciation/ (Depreciation) ($) |
| Purchased | | | | | |
| | | | | | |
| Treasury Contracts | | | | | |
| CBOT 10-Year U.S. Treasury Note Contracts (United States) | 1,201 | Dec 2022 | 134,587,063 | (8,191,460) | (8,191,460) |
| CBOT Ultra Long Term U.S. Treasury Bond Contracts (United States) | 113 | Dec 2022 | 15,481,000 | (196,466) | (196,466) |
| | | | | | |
| TOTAL PURCHASED | | | | | (8,387,926) |
| | | | | | |
| Sold | | | | | |
| | | | | | |
| Equity Index Contracts | | | | | |
| CME E-mini S&P 500 Index Contracts (United States) | 196 | Dec 2022 | 35,294,700 | 43,586 | 43,586 |
| ICE E-mini MSCI EAFE Index Contracts (United States) | 350 | Dec 2022 | 29,060,500 | 3,942,300 | 3,942,300 |
| ICE E-mini MSCI Emerging Markets Index Contracts (United States) | 246 | Dec 2022 | 10,719,450 | 48,559 | 48,559 |
| | | | | | |
| TOTAL SOLD | | | | | 4,034,445 |
| | | | | | |
| TOTAL FUTURES CONTRACTS | | | | | (4,353,481) |
| The notional amount of futures purchased as a percentage of Net Assets is 2.0% |
| The notional amount of futures sold as a percentage of Net Assets is 1.0% |
Legend
| (a) | Amount is stated in United States dollars unless otherwise noted. |
| (b) | Security or a portion of the security was pledged to cover margin requirements for futures contracts. At period end, the value of securities pledged amounted to $5,234,160. |
| (d) | Affiliated fund that is generally available only to investment companies and other accounts managed by Fidelity Investments. The rate quoted is the annualized seven-day yield of the fund at period end. A complete unaudited listing of the fund's holdings as of its most recent quarter end is available upon request. In addition, each Fidelity Central Fund's financial statements are available on the SEC's website or upon request. |
| (e) | The rate quoted is the annualized seven-day yield of the fund at period end. |
Affiliated Central Funds
Fiscal year to date information regarding the Fund's investments in Fidelity Central Funds, including the ownership percentage, is presented below.
| Affiliate | Value, beginning of period ($) | Purchases ($) | Sales Proceeds ($) | Dividend Income ($) | Realized Gain (loss) ($) | Change in Unrealized appreciation (depreciation) ($) | Value, end of period ($) | %ownership, end of period |
| Fidelity Cash Central Fund 3.10% | 6,693,870 | 41,085,246 | 45,808,226 | 56,644 | 119 | (119) | 1,970,890 | 0.0% |
| Total | 6,693,870 | 41,085,246 | 45,808,226 | 56,644 | 119 | (119) | 1,970,890 | |
| | | | | | | | | |
Amounts in the income column in the above table include any capital gain distributions from underlying funds, which are presented in the corresponding line item in the Statement of Operations, if applicable.
Affiliated Underlying Funds
Fiscal year to date information regarding the Fund's investments in affiliated Underlying Funds is presented below. Exchanges between classes of the same affiliated Underlying Funds may occur. If an Underlying Funds changes its name, the name presented below is the name in effect at period end.
| Affiliate | Value, beginning of period ($) | Purchases ($) | Sales Proceeds ($) | Dividend Income ($) | Realized Gain (loss) ($) | Change in Unrealized appreciation (depreciation) ($) | Value, end of period ($) |
| Fidelity Series 5+ Year Inflation-Protected Bond Index Fund | 8,851,170 | 492,664 | 578,323 | - | (34,284) | (1,436,918) | 7,294,309 |
| Fidelity Series All-Sector Equity Fund | 173,164,572 | 9,210,418 | 11,375,240 | - | (1,591,497) | (33,641,892) | 135,766,361 |
| Fidelity Series Blue Chip Growth Fund | 284,292,395 | 154,523,389 | 13,648,912 | 10,824,666 | (3,828,004) | (99,185,650) | 322,153,218 |
| Fidelity Series Canada Fund | 287,620,378 | 27,896,659 | 17,786,687 | - | (1,207,018) | (57,688,390) | 238,834,942 |
| Fidelity Series Commodity Strategy Fund | 131,149,026 | 76,753,763 | 45,697,012 | 64,083,369 | (15,385,203) | (59,922,021) | 86,898,553 |
| Fidelity Series Emerging Markets Debt Fund | 43,271,340 | 3,896,070 | 733,691 | 1,137,594 | (65,437) | (7,503,769) | 38,864,513 |
| Fidelity Series Emerging Markets Debt Local Currency Fund | 14,654,728 | 861,815 | 1,019,983 | - | (137,339) | (1,573,569) | 12,785,652 |
| Fidelity Series Emerging Markets Fund | 120,854,150 | 16,481,122 | 3,234,009 | - | (656,201) | (27,727,095) | 105,717,967 |
| Fidelity Series Emerging Markets Opportunities Fund | 1,122,211,280 | 132,399,998 | 37,063,049 | - | (10,087,263) | (236,705,570) | 970,755,396 |
| Fidelity Series Floating Rate High Income Fund | 8,855,214 | 710,308 | 1,593,642 | 220,810 | (72,249) | (388,872) | 7,510,759 |
| Fidelity Series Government Money Market Fund 3.00% | - | 37,353,402 | 20 | 1,670 | - | - | 37,353,382 |
| Fidelity Series Growth Company Fund | 708,641,226 | 148,158,870 | 22,398,448 | - | (4,063,843) | (196,387,277) | 633,950,528 |
| Fidelity Series High Income Fund | 53,082,250 | 3,929,747 | 10,197,883 | 1,265,453 | (1,055,925) | (5,622,463) | 40,135,726 |
| Fidelity Series International Credit Fund | 1,878,624 | 25,649 | 3,567 | 25,649 | (79) | (284,170) | 1,616,457 |
| Fidelity Series International Growth Fund | 657,878,795 | 72,030,285 | 31,338,888 | - | (7,720,493) | (146,602,110) | 544,247,589 |
| Fidelity Series International Small Cap Fund | 180,275,889 | 11,186,412 | 5,055,038 | - | (1,134,713) | (42,692,994) | 142,579,556 |
| Fidelity Series International Value Fund | 664,366,166 | 70,263,431 | 36,851,836 | - | (1,302,127) | (147,923,383) | 548,552,251 |
| Fidelity Series Intrinsic Opportunities Fund | 666,042,808 | 107,952,837 | 336,488,986 | 81,474,809 | 12,421,743 | (157,702,356) | 292,226,046 |
| Fidelity Series Investment Grade Bond Fund | 45,582,996 | 850,382 | 44,671,511 | 166,814 | (1,916,771) | 154,904 | - |
| Fidelity Series Large Cap Stock Fund | 630,205,870 | 160,125,088 | 31,037,491 | 34,755,019 | (2,275,179) | (155,200,762) | 601,817,526 |
| Fidelity Series Large Cap Value Index Fund | 237,217,869 | 17,099,517 | 15,016,259 | - | (254,848) | (40,788,566) | 198,257,713 |
| Fidelity Series Long-Term Treasury Bond Index Fund | 471,573,334 | 90,766,306 | 31,795,161 | 5,800,855 | (7,474,320) | (101,579,476) | 421,490,683 |
| Fidelity Series Opportunistic Insights Fund | 363,042,115 | 108,765,018 | 13,815,593 | - | (1,678,635) | (87,707,611) | 368,605,294 |
| Fidelity Series Overseas Fund | 661,456,379 | 70,354,611 | 12,874,425 | - | (2,003,467) | (167,441,756) | 549,491,342 |
| Fidelity Series Real Estate Income Fund | 31,629,782 | 3,129,447 | 11,449,342 | 1,407,536 | (596,204) | (3,682,504) | 19,031,179 |
| Fidelity Series Short-Term Credit Fund | - | 12,299 | - | - | - | - | 12,299 |
| Fidelity Series Small Cap Discovery Fund | 77,159,153 | 12,895,145 | 4,656,245 | 8,677,147 | (731,909) | (23,215,505) | 61,450,639 |
| Fidelity Series Small Cap Opportunities Fund | 256,458,904 | 23,574,677 | 21,445,523 | 9,482,725 | (1,828,514) | (51,893,145) | 204,866,399 |
| Fidelity Series Stock Selector Large Cap Value Fund | 530,806,532 | 37,027,364 | 40,220,312 | - | (1,356,877) | (90,853,165) | 435,403,542 |
| Fidelity Series Value Discovery Fund | 403,830,059 | 32,128,505 | 39,506,272 | - | (1,289,550) | (54,573,451) | 340,589,291 |
| | 8,836,053,004 | 1,430,855,198 | 841,553,348 | 219,324,116 | (57,326,206) | (1,999,769,536) | 7,368,259,112 |
Amounts in the income column in the above table include any capital gain distributions from underlying funds, which are presented in the corresponding line item in the Statement of Operations, if applicable.
Purchases and Sales Proceeds in the table above include the value of shares purchased or redeemed through in-kind transactions, if applicable.
Investment Valuation
The following is a summary of the inputs used, as of September 30, 2022, involving the Fund's assets and liabilities carried at fair value. The inputs or methodology used for valuing securities may not be an indication of the risk associated with investing in those securities. For more information on valuation inputs, and their aggregation into the levels used below, please refer to the Investment Valuation section in the accompanying Notes to Financial Statements.
| Valuation Inputs at Reporting Date: |
| Description | Total ($) | Level 1 ($) | Level 2 ($) | Level 3 ($) |
Investments in Securities: | | | | |
|
| Other Short-Term Investments | 6,173,430 | - | 6,173,430 | - |
|
| Domestic Equity Funds | 3,681,985,110 | 3,681,985,110 | - | - |
|
| International Equity Funds | 3,100,179,043 | 3,100,179,043 | - | - |
|
| Bond Funds | 548,729,278 | 548,729,278 | - | - |
|
| Short-Term Funds | 39,336,571 | 39,336,571 | - | - |
| Total Investments in Securities: | 7,376,403,432 | 7,370,230,002 | 6,173,430 | - |
Derivative Instruments: | | | | |
|
| Assets | | | | |
Futures Contracts | 4,034,445 | 4,034,445 | - | - |
| Total Assets | 4,034,445 | 4,034,445 | - | - |
|
| Liabilities | | | | |
Futures Contracts | (8,387,926) | (8,387,926) | - | - |
| Total Liabilities | (8,387,926) | (8,387,926) | - | - |
| Total Derivative Instruments: | (4,353,481) | (4,353,481) | - | - |
Value of Derivative Instruments
The following table is a summary of the Fund's value of derivative instruments by primary risk exposure as of September 30, 2022. For additional information on derivative instruments, please refer to the Derivative Instruments section in the accompanying Notes to Financial Statements.
Primary Risk Exposure / Derivative Type | Value |
| Asset ($) | Liability ($) |
| Equity Risk | | |
Futures Contracts (a) | 4,034,445 | 0 |
| Total Equity Risk | 4,034,445 | 0 |
| Interest Rate Risk | | |
Futures Contracts (a) | 0 | (8,387,926) |
| Total Interest Rate Risk | 0 | (8,387,926) |
| Total Value of Derivatives | 4,034,445 | (8,387,926) |
(a)Reflects gross cumulative appreciation (depreciation) on futures contracts as presented in the Schedule of Investments. In the Statement of Assets and Liabilities, the period end daily variation margin is included in receivable or payable for daily variation margin on futures contracts, and the net cumulative appreciation (depreciation) is included in Total accumulated earnings (loss).
Fidelity Freedom® 2055 Fund
| Statement of Assets and Liabilities |
| | | | September 30, 2022 (Unaudited) |
| | | | | |
| Assets | | | | |
| Investment in securities, at value - See accompanying schedule: | $ | | | |
Unaffiliated issuers (cost $6,173,112) | | $6,173,430 | | |
Fidelity Central Funds (cost $1,970,890) | | 1,970,890 | | |
Other affiliated issuers (cost $8,382,134,712) | | 7,368,259,112 | | |
| | | | | |
| Total Investment in Securities (cost $8,390,278,714) | | | $ | 7,376,403,432 |
| Receivable for investments sold | | | | 41,000,164 |
| Receivable for fund shares sold | | | | 22,173,304 |
| Distributions receivable from Fidelity Central Funds | | | | 7,785 |
Total assets | | | | 7,439,584,685 |
| Liabilities | | | | |
| Payable for investments purchased | | 52,177,117 | | |
| Payable for fund shares redeemed | | 7,106,456 | | |
| Accrued management fee | | 4,183,076 | | |
| Payable for daily variation margin on futures contracts | | 369,667 | | |
| Total Liabilities | | | | 63,836,316 |
| Net Assets | | | $ | 7,375,748,369 |
| Net Assets consist of: | | | | |
| Paid in capital | | | $ | 8,323,655,992 |
| Total accumulated earnings (loss) | | | | (947,907,623) |
| Net Assets | | | $ | 7,375,748,369 |
| | | | | |
| Net Asset Value and Maximum Offering Price | | | | |
| Fidelity Freedom 2055 Fund : | | | | |
Net Asset Value , offering price and redemption price per share ($2,318,271,251 ÷ 205,918,133 shares) | | | $ | 11.26 |
| Class K : | | | | |
Net Asset Value , offering price and redemption price per share ($3,380,741,765 ÷ 300,186,702 shares) | | | $ | 11.26 |
| Class K6 : | | | | |
Net Asset Value , offering price and redemption price per share ($1,676,735,353 ÷ 149,093,004 shares) | | | $ | 11.25 |
| Statement of Operations |
| | | | Six months ended September 30, 2022 (Unaudited) |
| Investment Income | | | | |
| Dividends: | | | | |
| Affiliated issuers | | | $ | 85,195,103 |
| Interest | | | | 42,625 |
| Income from Fidelity Central Funds | | | | 56,644 |
| Total Income | | | | 85,294,372 |
| Expenses | | | | |
| Management fee | $ | 26,065,440 | | |
| Independent trustees' fees and expenses | | 13,879 | | |
| Total expenses before reductions | | 26,079,319 | | |
| Expense reductions | | (129) | | |
| Total expenses after reductions | | | | 26,079,190 |
| Net Investment income (loss) | | | | 59,215,182 |
| Realized and Unrealized Gain (Loss) | | | | |
| Net realized gain (loss) on: | | | | |
| Investment Securities: | | | | |
| Unaffiliated issuers | | 1,899 | | |
| Fidelity Central Funds | | 119 | | |
| Other affiliated issuers | | (57,326,206) | | |
| Futures contracts | | (5,161,949) | | |
| Capital gain distributions from underlying funds: | | | | |
| Affiliated issuers | | 134,129,013 | | |
| Total net realized gain (loss) | | | | 71,642,876 |
| Change in net unrealized appreciation (depreciation) on: | | | | |
| Investment Securities: | | | | |
| Unaffiliated issuers | | 232 | | |
| Fidelity Central Funds | | (119) | | |
| Other affiliated issuers | | (1,999,769,536) | | |
| Futures contracts | | (5,089,371) | | |
| Total change in net unrealized appreciation (depreciation) | | | | (2,004,858,794) |
| Net gain (loss) | | | | (1,933,215,918) |
| Net increase (decrease) in net assets resulting from operations | | | $ | (1,874,000,736) |
| Statement of Changes in Net Assets |
| |
| | Six months ended September 30, 2022 (Unaudited) | | Year ended March 31, 2022 |
| Increase (Decrease) in Net Assets | | | | |
| Operations | | | | |
| Net investment income (loss) | $ | 59,215,182 | $ | 196,008,639 |
| Net realized gain (loss) | | 71,642,876 | | 922,029,347 |
| Change in net unrealized appreciation (depreciation) | | (2,004,858,794) | | (831,677,509) |
| Net increase (decrease) in net assets resulting from operations | | (1,874,000,736) | | 286,360,477 |
| Distributions to shareholders | | (556,525,888) | | (951,977,956) |
| Share transactions - net increase (decrease) | | 959,532,334 | | 909,068,394 |
| Total increase (decrease) in net assets | | (1,470,994,290) | | 243,450,915 |
| | | | | |
| Net Assets | | | | |
| Beginning of period | | 8,846,742,659 | | 8,603,291,744 |
| End of period | $ | 7,375,748,369 | $ | 8,846,742,659 |
| | | | | |
| | | | | |
Financial Highlights
| Fidelity Freedom® 2055 Fund |
| |
| | Six months ended (Unaudited) September 30, 2022 | | Years ended March 31, 2022 | | 2021 | | 2020 | | 2019 | | 2018 |
Selected Per-Share Data | | | | | | | | | | | | |
| Net asset value, beginning of period | $ | 15.24 | $ | 16.46 | $ | 10.95 | $ | 13.10 | $ | 13.70 | $ | 12.41 |
| Income from Investment Operations | | | | | | | | | | | | |
Net investment income (loss) A,B | | .09 | | .35 | | .14 | | .20 | | .19 | | .14 |
| Net realized and unrealized gain (loss) | | (3.12) | | .25 | | 6.02 | | (1.49) | | - C | | 1.64 |
| Total from investment operations | | (3.03) | | .60 | | 6.16 | | (1.29) | | .19 | | 1.78 |
| Distributions from net investment income | | - | | (.37) | | (.16) | | (.20) | | (.19) | | (.15) |
| Distributions from net realized gain | | (.95) | | (1.46) | | (.50) | | (.66) | | (.60) | | (.34) |
| Total distributions | | (.95) | | (1.82) D | | (.65) D | | (.86) | | (.79) | | (.49) |
| Net asset value, end of period | $ | 11.26 | $ | 15.24 | $ | 16.46 | $ | 10.95 | $ | 13.10 | $ | 13.70 |
Total Return E,F | | (20.70)% | | 3.21% | | 57.70% | | (10.85)% | | 1.73% | | 14.49% |
Ratios to Average Net Assets B,G,H | | | | | | | | | | | | |
| Expenses before reductions | | .75% I | | .75% | | .75% | | .75% | | .75% | | .64% J |
| Expenses net of fee waivers, if any | | .75% I | | .75% | | .75% | | .75% | | .75% | | .64% J |
| Expenses net of all reductions | | .75% I | | .75% | | .75% | | .75% | | .75% | | .64% J |
| Net investment income (loss) | | 1.36% I | | 2.12% | | .97% | | 1.54% | | 1.40% | | 1.06% |
| Supplemental Data | | | | | | | | | | | | |
| Net assets, end of period (000 omitted) | $ | 2,318,271 | $ | 2,747,697 | $ | 2,561,622 | $ | 1,500,450 | $ | 1,490,393 | $ | 1,265,311 |
Portfolio turnover rate K | | 20% I,L | | 29% | | 21% | | 25% | | 18% | | 15% M |
A Calculated based on average shares outstanding during the period.
B Net investment income (loss) is affected by the timing of the declaration of dividends by any underlying mutual funds or exchange-traded funds (ETFs). Net investment income (loss) of any such underlying funds is not included in the Fund's net investment income (loss) ratio.
C Amount represents less than $.005 per share.
D Total distributions per share do not sum due to rounding.
E Total returns for periods of less than one year are not annualized.
F Total returns would have been lower if certain expenses had not been reduced during the applicable periods shown.
G Fees and expenses of any underlying mutual funds or exchange-traded funds (ETFs) are not included in the Fund's expense ratio. The Fund indirectly bears its proportionate share of these expenses. For additional expense information related to investments in Fidelity Central Funds, please refer to the "Investments in Fidelity Central Funds" note found in the Notes to Financial Statements section of the most recent Annual or Semi-Annual report.
H Expense ratios reflect operating expenses of the class. Expenses before reductions do not reflect amounts reimbursed, waived, or reduced through arrangements with the investment adviser, brokerage services, or other offset arrangements, if applicable, and do not represent the amount paid by the class during periods when reimbursements, waivers or reductions occur.
I Annualized
J On certain classes, the size and fluctuation of net assets and expense amounts may cause ratios to differ from contractual rates.
K Amount does not include the portfolio activity of any underlying mutual funds or exchange-traded funds (ETFs).
L Portfolio turnover rate excludes securities received or delivered in-kind.
M The portfolio turnover rate does not include the assets acquired in the merger.
| Fidelity Freedom® 2055 Fund Class K |
| |
| | Six months ended (Unaudited) September 30, 2022 | | Years ended March 31, 2022 | | 2021 | | 2020 | | 2019 | | 2018 A |
Selected Per-Share Data | | | | | | | | | | | | |
| Net asset value, beginning of period | $ | 15.24 | $ | 16.45 | $ | 10.95 | $ | 13.09 | $ | 13.69 | $ | 13.11 |
| Income from Investment Operations | | | | | | | | | | | | |
Net investment income (loss) B,C | | .09 | | .37 | | .15 | | .21 | | .20 | | .19 |
| Net realized and unrealized gain (loss) | | (3.12) | | .25 | | 6.01 | | (1.48) | | - D | | .76 |
| Total from investment operations | | (3.03) | | .62 | | 6.16 | | (1.27) | | .20 | | .95 |
| Distributions from net investment income | | - | | (.38) | | (.17) | | (.21) | | (.20) | | (.17) |
| Distributions from net realized gain | | (.95) | | (1.46) | | (.50) | | (.66) | | (.60) | | (.20) |
| Total distributions | | (.95) | | (1.83) E | | (.66) E | | (.87) | | (.80) | | (.37) |
| Net asset value, end of period | $ | 11.26 | $ | 15.24 | $ | 16.45 | $ | 10.95 | $ | 13.09 | $ | 13.69 |
Total Return F,G | | (20.68)% | | 3.33% | | 57.70% | | (10.70)% | | 1.84% | | 7.26% |
Ratios to Average Net Assets C,H,I | | | | | | | | | | | | |
| Expenses before reductions | | .64% J | | .64% K | | .64% | | .64% | | .64% | | .65% J,K |
| Expenses net of fee waivers, if any | | .64% J | | .64% K | | .64% | | .64% | | .64% | | .65% J,K |
| Expenses net of all reductions | | .64% J | | .64% K | | .64% | | .64% | | .64% | | .65% J,K |
| Net investment income (loss) | | 1.46% J | | 2.22% | | 1.07% | | 1.64% | | 1.50% | | 2.01% J |
| Supplemental Data | | | | | | | | | | | | |
| Net assets, end of period (000 omitted) | $ | 3,380,742 | $ | 4,350,522 | $ | 4,567,253 | $ | 2,984,272 | $ | 3,138,528 | $ | 2,992,599 |
Portfolio turnover rate L | | 20% J,M | | 29% | | 21% | | 25% | | 18% | | 15% N |
A For the period July 20, 2017 (commencement of sale of shares) through March 31, 2018.
B Calculated based on average shares outstanding during the period.
C Net investment income (loss) is affected by the timing of the declaration of dividends by any underlying mutual funds or exchange-traded funds (ETFs). Net investment income (loss) of any such underlying funds is not included in the Fund's net investment income (loss) ratio.
D Amount represents less than $.005 per share.
E Total distributions per share do not sum due to rounding.
F Total returns for periods of less than one year are not annualized.
G Total returns would have been lower if certain expenses had not been reduced during the applicable periods shown.
H Fees and expenses of any underlying mutual funds or exchange-traded funds (ETFs) are not included in the Fund's expense ratio. The Fund indirectly bears its proportionate share of these expenses. For additional expense information related to investments in Fidelity Central Funds, please refer to the "Investments in Fidelity Central Funds" note found in the Notes to Financial Statements section of the most recent Annual or Semi-Annual report.
I Expense ratios reflect operating expenses of the class. Expenses before reductions do not reflect amounts reimbursed, waived, or reduced through arrangements with the investment adviser, brokerage services, or other offset arrangements, if applicable, and do not represent the amount paid by the class during periods when reimbursements, waivers or reductions occur.
J Annualized
K On certain classes, the size and fluctuation of net assets and expense amounts may cause ratios to differ from contractual rates.
L Amount does not include the portfolio activity of any underlying mutual funds or exchange-traded funds (ETFs).
M Portfolio turnover rate excludes securities received or delivered in-kind.
N The portfolio turnover rate does not include the assets acquired in the merger.
| Fidelity Freedom® 2055 Fund Class K6 |
| |
| | Six months ended (Unaudited) September 30, 2022 | | Years ended March 31, 2022 | | 2021 | | 2020 | | 2019 | | 2018 A |
Selected Per-Share Data | | | | | | | | | | | | |
| Net asset value, beginning of period | $ | 15.22 | $ | 16.43 | $ | 10.93 | $ | 13.08 | $ | 13.70 | $ | 12.83 |
| Income from Investment Operations | | | | | | | | | | | | |
Net investment income (loss) B,C | | .10 | | .39 | | .17 | | .23 | | .21 | | .16 |
| Net realized and unrealized gain (loss) | | (3.11) | | .26 | | 6.01 | | (1.48) | | - D | | 1.09 |
| Total from investment operations | | (3.01) | | .65 | | 6.18 | | (1.25) | | .21 | | 1.25 |
| Distributions from net investment income | | - | | (.40) | | (.19) | | (.23) | | (.23) | | (.17) |
| Distributions from net realized gain | | (.96) | | (1.46) | | (.50) | | (.67) | | (.60) | | (.20) |
| Total distributions | | (.96) | | (1.86) | | (.68) E | | (.90) | | (.83) | | (.38) E |
| Net asset value, end of period | $ | 11.25 | $ | 15.22 | $ | 16.43 | $ | 10.93 | $ | 13.08 | $ | 13.70 |
Total Return F,G | | (20.60)% | | 3.51% | | 58.01% | | (10.61)% | | 1.97% | | 9.70% |
Ratios to Average Net Assets C,H,I | | | | | | | | | | | | |
| Expenses before reductions | | .49% J | | .49% K | | .49% | | .49% | | .50% K | | .50% J,K |
| Expenses net of fee waivers, if any | | .49% J | | .49% K | | .49% | | .49% | | .50% K | | .50% J,K |
| Expenses net of all reductions | | .49% J | | .49% K | | .49% | | .49% | | .50% K | | .50% J,K |
| Net investment income (loss) | | 1.61% J | | 2.37% | | 1.22% | | 1.79% | | 1.65% | | 1.43% J |
| Supplemental Data | | | | | | | | | | | | |
| Net assets, end of period (000 omitted) | $ | 1,676,735 | $ | 1,748,523 | $ | 1,474,416 | $ | 745,795 | $ | 541,624 | $ | 135,481 |
Portfolio turnover rate L | | 20% J,M | | 29% | | 21% | | 25% | | 18% | | 15% N |
A For the period June 7, 2017 (commencement of sale of shares) through March 31, 2018.
B Calculated based on average shares outstanding during the period.
C Net investment income (loss) is affected by the timing of the declaration of dividends by any underlying mutual funds or exchange-traded funds (ETFs). Net investment income (loss) of any such underlying funds is not included in the Fund's net investment income (loss) ratio.
D Amount represents less than $.005 per share.
E Total distributions per share do not sum due to rounding.
F Total returns for periods of less than one year are not annualized.
G Total returns would have been lower if certain expenses had not been reduced during the applicable periods shown.
H Fees and expenses of any underlying mutual funds or exchange-traded funds (ETFs) are not included in the Fund's expense ratio. The Fund indirectly bears its proportionate share of these expenses. For additional expense information related to investments in Fidelity Central Funds, please refer to the "Investments in Fidelity Central Funds" note found in the Notes to Financial Statements section of the most recent Annual or Semi-Annual report.
I Expense ratios reflect operating expenses of the class. Expenses before reductions do not reflect amounts reimbursed, waived, or reduced through arrangements with the investment adviser, brokerage services, or other offset arrangements, if applicable, and do not represent the amount paid by the class during periods when reimbursements, waivers or reductions occur.
J Annualized
K On certain classes, the size and fluctuation of net assets and expense amounts may cause ratios to differ from contractual rates.
L Amount does not include the portfolio activity of any underlying mutual funds or exchange-traded funds (ETFs).
M Portfolio turnover rate excludes securities received or delivered in-kind.
N The portfolio turnover rate does not include the assets acquired in the merger.
The information in the following table is based on the direct Investments of the Fund.
Top Holdings (% of Fund's net assets) |
| |
| Fidelity Series Emerging Markets Opportunities Fund | 13.2 | |
| Fidelity Series Growth Company Fund | 8.6 | |
| Fidelity Series Large Cap Stock Fund | 8.1 | |
| Fidelity Series Overseas Fund | 7.5 | |
| Fidelity Series International Value Fund | 7.4 | |
| Fidelity Series International Growth Fund | 7.4 | |
| Fidelity Series Stock Selector Large Cap Value Fund | 5.9 | |
| Fidelity Series Long-Term Treasury Bond Index Fund | 5.7 | |
| Fidelity Series Opportunistic Insights Fund | 5.0 | |
| Fidelity Series Value Discovery Fund | 4.6 | |
| | 73.4 | |
| |
Domestic Equity Funds category includes Fidelity Series Commodity Strategy Fund which invests in commodity-related investments.
Asset Allocation (% of Fund's net assets) |
|
Percentages shown as 0.0% may reflect amounts less than 0.05%. |
|
Fidelity Freedom® 2060 Fund
Showing Percentage of Net Assets
| U.S. Treasury Obligations - 0.1% |
| | | Principal Amount (a) | Value ($) |
U.S. Treasury Bills, yield at date of purchase 2.13% to 2.42% 10/13/22 to 10/20/22 (b) (Cost $2,646,971) | | 2,650,000 | 2,647,113 |
| | | | |
| Domestic Equity Funds - 49.9% |
| | | Shares | Value ($) |
| Fidelity Series All-Sector Equity Fund (c) | | 6,980,972 | 59,896,737 |
| Fidelity Series Blue Chip Growth Fund (c) | | 14,157,481 | 142,141,110 |
| Fidelity Series Commodity Strategy Fund (c) | | 18,407,888 | 38,472,487 |
| Fidelity Series Growth Company Fund (c) | | 20,841,472 | 279,692,557 |
| Fidelity Series Intrinsic Opportunities Fund (c) | | 9,799,207 | 128,957,562 |
| Fidelity Series Large Cap Stock Fund (c) | | 17,978,564 | 265,543,396 |
| Fidelity Series Large Cap Value Index Fund (c) | | 6,875,973 | 87,462,377 |
| Fidelity Series Opportunistic Insights Fund (c) | | 11,445,734 | 162,643,885 |
| Fidelity Series Small Cap Discovery Fund (c) | | 2,890,427 | 27,112,205 |
| Fidelity Series Small Cap Opportunities Fund (c) | | 8,384,668 | 90,386,725 |
| Fidelity Series Stock Selector Large Cap Value Fund (c) | | 17,198,668 | 192,109,127 |
| Fidelity Series Value Discovery Fund (c) | | 10,913,809 | 150,283,144 |
| TOTAL DOMESTIC EQUITY FUNDS (Cost $1,888,227,395) | | | 1,624,701,312 |
| | | | |
| International Equity Funds - 42.1% |
| | | Shares | Value ($) |
| Fidelity Series Canada Fund (c) | | 8,499,047 | 105,388,186 |
| Fidelity Series Emerging Markets Fund (c) | | 6,454,447 | 46,730,194 |
| Fidelity Series Emerging Markets Opportunities Fund (c) | | 29,500,854 | 428,352,395 |
| Fidelity Series International Growth Fund (c) | | 18,735,175 | 240,184,944 |
| Fidelity Series International Small Cap Fund (c) | | 4,598,410 | 62,906,255 |
| Fidelity Series International Value Fund (c) | | 28,176,536 | 242,036,447 |
| Fidelity Series Overseas Fund (c) | | 25,445,411 | 242,494,763 |
| TOTAL INTERNATIONAL EQUITY FUNDS (Cost $1,661,886,265) | | | 1,368,093,184 |
| | | | |
| Bond Funds - 7.4% |
| | | Shares | Value ($) |
| Fidelity Series 5+ Year Inflation-Protected Bond Index Fund (c) | | 402,842 | 3,218,708 |
| Fidelity Series Emerging Markets Debt Fund (c) | | 2,499,448 | 17,146,214 |
| Fidelity Series Emerging Markets Debt Local Currency Fund (c) | | 707,776 | 5,640,973 |
| Fidelity Series Floating Rate High Income Fund (c) | | 380,879 | 3,313,650 |
| Fidelity Series High Income Fund (c) | | 2,247,061 | 17,706,840 |
| Fidelity Series International Credit Fund (c) | | 30,119 | 237,034 |
| Fidelity Series Long-Term Treasury Bond Index Fund (c) | | 31,150,133 | 185,966,294 |
| Fidelity Series Real Estate Income Fund (c) | | 882,544 | 8,401,821 |
| TOTAL BOND FUNDS (Cost $313,448,144) | | | 241,631,534 |
| | | | |
| Short-Term Funds - 0.5% |
| | | Shares | Value ($) |
| Fidelity Cash Central Fund 3.10% (d) | | 701,183 | 701,323 |
| Fidelity Series Government Money Market Fund 3.00% (c)(e) | | 16,606,652 | 16,606,652 |
| Fidelity Series Short-Term Credit Fund (c) | | 1,159 | 10,985 |
| TOTAL SHORT-TERM FUNDS (Cost $17,318,960) | | | 17,318,960 |
| | | | |
| TOTAL INVESTMENT IN SECURITIES - 100.0% (Cost $3,883,527,735) | 3,254,392,103 |
NET OTHER ASSETS (LIABILITIES) - 0.0% | (316,729) |
| NET ASSETS - 100.0% | 3,254,075,374 |
| | |
| Futures Contracts |
| | Number of contracts | Expiration Date | Notional Amount ($) | Value ($) | Unrealized Appreciation/ (Depreciation) ($) |
| Purchased | | | | | |
| | | | | | |
| Treasury Contracts | | | | | |
| CBOT 10-Year U.S. Treasury Note Contracts (United States) | 529 | Dec 2022 | 59,281,063 | (3,596,140) | (3,596,140) |
| CBOT Ultra Long Term U.S. Treasury Bond Contracts (United States) | 50 | Dec 2022 | 6,850,000 | (85,984) | (85,984) |
| | | | | | |
| TOTAL PURCHASED | | | | | (3,682,124) |
| | | | | | |
| Sold | | | | | |
| | | | | | |
| Equity Index Contracts | | | | | |
| CME E-mini S&P 500 Index Contracts (United States) | 87 | Dec 2022 | 15,666,525 | 15,207 | 15,207 |
| ICE E-mini MSCI EAFE Index Contracts (United States) | 156 | Dec 2022 | 12,952,680 | 1,757,100 | 1,757,100 |
| ICE E-mini MSCI Emerging Markets Index Contracts (United States) | 113 | Dec 2022 | 4,923,975 | 26,707 | 26,707 |
| | | | | | |
| TOTAL SOLD | | | | | 1,799,014 |
| | | | | | |
| TOTAL FUTURES CONTRACTS | | | | | (1,883,110) |
| The notional amount of futures purchased as a percentage of Net Assets is 2.0% |
| The notional amount of futures sold as a percentage of Net Assets is 1.1% |
Legend
| (a) | Amount is stated in United States dollars unless otherwise noted. |
| (b) | Security or a portion of the security was pledged to cover margin requirements for futures contracts. At period end, the value of securities pledged amounted to $2,305,477. |
| (d) | Affiliated fund that is generally available only to investment companies and other accounts managed by Fidelity Investments. The rate quoted is the annualized seven-day yield of the fund at period end. A complete unaudited listing of the fund's holdings as of its most recent quarter end is available upon request. In addition, each Fidelity Central Fund's financial statements are available on the SEC's website or upon request. |
| (e) | The rate quoted is the annualized seven-day yield of the fund at period end. |
Affiliated Central Funds
Fiscal year to date information regarding the Fund's investments in Fidelity Central Funds, including the ownership percentage, is presented below.
| Affiliate | Value, beginning of period ($) | Purchases ($) | Sales Proceeds ($) | Dividend Income ($) | Realized Gain (loss) ($) | Change in Unrealized appreciation (depreciation) ($) | Value, end of period ($) | %ownership, end of period |
| Fidelity Cash Central Fund 3.10% | 2,437,712 | 17,107,514 | 18,843,903 | 23,422 | 37 | (37) | 701,323 | 0.0% |
| Total | 2,437,712 | 17,107,514 | 18,843,903 | 23,422 | 37 | (37) | 701,323 | |
| | | | | | | | | |
Amounts in the income column in the above table include any capital gain distributions from underlying funds, which are presented in the corresponding line item in the Statement of Operations, if applicable.
Affiliated Underlying Funds
Fiscal year to date information regarding the Fund's investments in affiliated Underlying Funds is presented below. Exchanges between classes of the same affiliated Underlying Funds may occur. If an Underlying Funds changes its name, the name presented below is the name in effect at period end.
| Affiliate | Value, beginning of period ($) | Purchases ($) | Sales Proceeds ($) | Dividend Income ($) | Realized Gain (loss) ($) | Change in Unrealized appreciation (depreciation) ($) | Value, end of period ($) |
| Fidelity Series 5+ Year Inflation-Protected Bond Index Fund | 3,661,274 | 398,485 | 209,262 | - | (13,112) | (618,677) | 3,218,708 |
| Fidelity Series All-Sector Equity Fund | 71,632,070 | 7,443,860 | 4,169,345 | - | (375,300) | (14,634,548) | 59,896,737 |
| Fidelity Series Blue Chip Growth Fund | 117,609,421 | 73,627,922 | 5,104,591 | 4,739,507 | (1,604,878) | (42,386,764) | 142,141,110 |
| Fidelity Series Canada Fund | 119,001,508 | 18,118,147 | 6,510,371 | - | (559,499) | (24,661,599) | 105,388,186 |
| Fidelity Series Commodity Strategy Fund | 54,307,455 | 36,306,265 | 19,140,523 | 28,059,968 | (6,964,815) | (26,035,895) | 38,472,487 |
| Fidelity Series Emerging Markets Debt Fund | 17,919,154 | 2,713,950 | 245,051 | 487,550 | (39,317) | (3,202,522) | 17,146,214 |
| Fidelity Series Emerging Markets Debt Local Currency Fund | 6,062,490 | 698,805 | 391,010 | - | (72,236) | (657,076) | 5,640,973 |
| Fidelity Series Emerging Markets Fund | 50,024,818 | 9,884,258 | 995,428 | - | (222,701) | (11,960,753) | 46,730,194 |
| Fidelity Series Emerging Markets Opportunities Fund | 464,274,981 | 81,988,336 | 11,996,361 | - | (3,086,663) | (102,827,898) | 428,352,395 |
| Fidelity Series Floating Rate High Income Fund | 3,663,182 | 491,105 | 644,333 | 94,563 | (25,618) | (170,686) | 3,313,650 |
| Fidelity Series Government Money Market Fund 3.00% | - | 16,606,983 | 331 | 736 | - | - | 16,606,652 |
| Fidelity Series Growth Company Fund | 293,150,735 | 79,508,479 | 7,853,657 | - | (1,468,487) | (83,644,513) | 279,692,557 |
| Fidelity Series High Income Fund | 22,042,135 | 2,685,639 | 4,167,278 | 540,817 | (278,233) | (2,575,423) | 17,706,840 |
| Fidelity Series International Credit Fund | 275,559 | 3,762 | 595 | 3,762 | (13) | (41,679) | 237,034 |
| Fidelity Series International Growth Fund | 272,164,209 | 44,910,665 | 10,812,618 | - | (2,438,776) | (63,638,536) | 240,184,944 |
| Fidelity Series International Small Cap Fund | 74,571,934 | 8,704,452 | 1,616,598 | - | (691,933) | (18,061,600) | 62,906,255 |
| Fidelity Series International Value Fund | 274,846,826 | 44,314,834 | 13,089,128 | - | (529,004) | (63,507,081) | 242,036,447 |
| Fidelity Series Intrinsic Opportunities Fund | 275,535,074 | 56,871,087 | 140,459,440 | 35,676,834 | (1,917,045) | (61,072,114) | 128,957,562 |
| Fidelity Series Investment Grade Bond Fund | 18,943,784 | 608,933 | 18,816,991 | 69,936 | (798,649) | 62,923 | - |
| Fidelity Series Large Cap Stock Fund | 260,700,664 | 83,983,582 | 11,422,634 | 15,041,748 | (990,087) | (66,728,129) | 265,543,396 |
| Fidelity Series Large Cap Value Index Fund | 98,124,897 | 12,260,795 | 5,293,088 | - | (179,426) | (17,450,801) | 87,462,377 |
| Fidelity Series Long-Term Treasury Bond Index Fund | 195,158,968 | 49,569,471 | 12,201,581 | 2,482,349 | (3,141,391) | (43,419,173) | 185,966,294 |
| Fidelity Series Opportunistic Insights Fund | 150,170,612 | 55,201,658 | 4,675,976 | - | (747,824) | (37,304,585) | 162,643,885 |
| Fidelity Series Overseas Fund | 273,642,751 | 44,911,608 | 3,628,655 | - | (612,719) | (71,818,222) | 242,494,763 |
| Fidelity Series Real Estate Income Fund | 13,087,241 | 1,676,294 | 4,507,359 | 621,173 | (252,339) | (1,602,016) | 8,401,821 |
| Fidelity Series Short-Term Credit Fund | - | 10,985 | - | - | - | - | 10,985 |
| Fidelity Series Small Cap Discovery Fund | 31,997,569 | 7,085,316 | 1,754,516 | 3,674,905 | (304,540) | (9,911,624) | 27,112,205 |
| Fidelity Series Small Cap Opportunities Fund | 106,087,853 | 15,569,967 | 8,286,152 | 4,152,037 | (771,791) | (22,213,152) | 90,386,725 |
| Fidelity Series Stock Selector Large Cap Value Fund | 219,569,592 | 27,231,723 | 15,044,571 | - | (338,038) | (39,309,579) | 192,109,127 |
| Fidelity Series Value Discovery Fund | 167,044,439 | 22,170,209 | 14,877,171 | - | (511,419) | (23,542,914) | 150,283,144 |
| | 3,655,271,195 | 805,557,575 | 327,914,614 | 95,645,885 | (28,935,853) | (852,934,636) | 3,251,043,667 |
Amounts in the income column in the above table include any capital gain distributions from underlying funds, which are presented in the corresponding line item in the Statement of Operations, if applicable.
Purchases and Sales Proceeds in the table above include the value of shares purchased or redeemed through in-kind transactions, if applicable.
Investment Valuation
The following is a summary of the inputs used, as of September 30, 2022, involving the Fund's assets and liabilities carried at fair value. The inputs or methodology used for valuing securities may not be an indication of the risk associated with investing in those securities. For more information on valuation inputs, and their aggregation into the levels used below, please refer to the Investment Valuation section in the accompanying Notes to Financial Statements.
| Valuation Inputs at Reporting Date: |
| Description | Total ($) | Level 1 ($) | Level 2 ($) | Level 3 ($) |
Investments in Securities: | | | | |
|
| Other Short-Term Investments | 2,647,113 | - | 2,647,113 | - |
|
| Domestic Equity Funds | 1,624,701,312 | 1,624,701,312 | - | - |
|
| International Equity Funds | 1,368,093,184 | 1,368,093,184 | - | - |
|
| Bond Funds | 241,631,534 | 241,631,534 | - | - |
|
| Short-Term Funds | 17,318,960 | 17,318,960 | - | - |
| Total Investments in Securities: | 3,254,392,103 | 3,251,744,990 | 2,647,113 | - |
Derivative Instruments: | | | | |
|
| Assets | | | | |
Futures Contracts | 1,799,014 | 1,799,014 | - | - |
| Total Assets | 1,799,014 | 1,799,014 | - | - |
|
| Liabilities | | | | |
Futures Contracts | (3,682,124) | (3,682,124) | - | - |
| Total Liabilities | (3,682,124) | (3,682,124) | - | - |
| Total Derivative Instruments: | (1,883,110) | (1,883,110) | - | - |
Value of Derivative Instruments
The following table is a summary of the Fund's value of derivative instruments by primary risk exposure as of September 30, 2022. For additional information on derivative instruments, please refer to the Derivative Instruments section in the accompanying Notes to Financial Statements.
Primary Risk Exposure / Derivative Type | Value |
| Asset ($) | Liability ($) |
| Equity Risk | | |
Futures Contracts (a) | 1,799,014 | 0 |
| Total Equity Risk | 1,799,014 | 0 |
| Interest Rate Risk | | |
Futures Contracts (a) | 0 | (3,682,124) |
| Total Interest Rate Risk | 0 | (3,682,124) |
| Total Value of Derivatives | 1,799,014 | (3,682,124) |
(a)Reflects gross cumulative appreciation (depreciation) on futures contracts as presented in the Schedule of Investments. In the Statement of Assets and Liabilities, the period end daily variation margin is included in receivable or payable for daily variation margin on futures contracts, and the net cumulative appreciation (depreciation) is included in Total accumulated earnings (loss).
Fidelity Freedom® 2060 Fund
| Statement of Assets and Liabilities |
| | | | September 30, 2022 (Unaudited) |
| | | | | |
| Assets | | | | |
| Investment in securities, at value - See accompanying schedule: | $ | | | |
Unaffiliated issuers (cost $2,646,971) | | $2,647,113 | | |
Fidelity Central Funds (cost $701,323) | | 701,323 | | |
Other affiliated issuers (cost $3,880,179,441) | | 3,251,043,667 | | |
| | | | | |
| Total Investment in Securities (cost $3,883,527,735) | | | $ | 3,254,392,103 |
| Receivable for investments sold | | | | 16,898,279 |
| Receivable for fund shares sold | | | | 14,635,559 |
| Distributions receivable from Fidelity Central Funds | | | | 3,052 |
Total assets | | | | 3,285,928,993 |
| Liabilities | | | | |
| Payable for investments purchased | | 26,826,239 | | |
| Payable for fund shares redeemed | | 3,037,879 | | |
| Accrued management fee | | 1,823,379 | | |
| Payable for daily variation margin on futures contracts | | 166,122 | | |
| Total Liabilities | | | | 31,853,619 |
| Net Assets | | | $ | 3,254,075,374 |
| Net Assets consist of: | | | | |
| Paid in capital | | | $ | 3,862,476,004 |
| Total accumulated earnings (loss) | | | | (608,400,630) |
| Net Assets | | | $ | 3,254,075,374 |
| | | | | |
| Net Asset Value and Maximum Offering Price | | | | |
| Fidelity Freedom 2060 Fund : | | | | |
Net Asset Value , offering price and redemption price per share ($955,560,450 ÷ 92,510,774 shares) | | | $ | 10.33 |
| Class K : | | | | |
Net Asset Value , offering price and redemption price per share ($1,511,459,235 ÷ 146,298,016 shares) | | | $ | 10.33 |
| Class K6 : | | | | |
Net Asset Value , offering price and redemption price per share ($787,055,689 ÷ 76,174,591 shares) | | | $ | 10.33 |
| Statement of Operations |
| | | | Six months ended September 30, 2022 (Unaudited) |
| Investment Income | | | | |
| Dividends: | | | | |
| Affiliated issuers | | | $ | 37,174,217 |
| Interest | | | | 18,396 |
| Income from Fidelity Central Funds | | | | 23,422 |
| Total Income | | | | 37,216,035 |
| Expenses | | | | |
| Management fee | $ | 11,068,130 | | |
| Independent trustees' fees and expenses | | 5,837 | | |
| Total expenses before reductions | | 11,073,967 | | |
| Expense reductions | | (132) | | |
| Total expenses after reductions | | | | 11,073,835 |
| Net Investment income (loss) | | | | 26,142,200 |
| Realized and Unrealized Gain (Loss) | | | | |
| Net realized gain (loss) on: | | | | |
| Investment Securities: | | | | |
| Unaffiliated issuers | | 395 | | |
| Fidelity Central Funds | | 37 | | |
| Other affiliated issuers | | (28,935,853) | | |
| Futures contracts | | (2,328,154) | | |
| Capital gain distributions from underlying funds: | | | | |
| Affiliated issuers | | 58,471,668 | | |
| Total net realized gain (loss) | | | | 27,208,093 |
| Change in net unrealized appreciation (depreciation) on: | | | | |
| Investment Securities: | | | | |
| Unaffiliated issuers | | 111 | | |
| Fidelity Central Funds | | (37) | | |
| Other affiliated issuers | | (852,934,636) | | |
| Futures contracts | | (2,074,732) | | |
| Total change in net unrealized appreciation (depreciation) | | | | (855,009,294) |
| Net gain (loss) | | | | (827,801,201) |
| Net increase (decrease) in net assets resulting from operations | | | $ | (801,659,001) |
| Statement of Changes in Net Assets |
| |
| | Six months ended September 30, 2022 (Unaudited) | | Year ended March 31, 2022 |
| Increase (Decrease) in Net Assets | | | | |
| Operations | | | | |
| Net investment income (loss) | $ | 26,142,200 | $ | 77,243,903 |
| Net realized gain (loss) | | 27,208,093 | | 343,282,727 |
| Change in net unrealized appreciation (depreciation) | | (855,009,294) | | (326,994,681) |
| Net increase (decrease) in net assets resulting from operations | | (801,659,001) | | 93,531,949 |
| Distributions to shareholders | | (218,018,204) | | (338,468,682) |
| Share transactions - net increase (decrease) | | 614,159,357 | | 759,476,755 |
| Total increase (decrease) in net assets | | (405,517,848) | | 514,540,022 |
| | | | | |
| Net Assets | | | | |
| Beginning of period | | 3,659,593,222 | | 3,145,053,200 |
| End of period | $ | 3,254,075,374 | $ | 3,659,593,222 |
| | | | | |
| | | | | |
Financial Highlights
| Fidelity Freedom® 2060 Fund |
| |
| | Six months ended (Unaudited) September 30, 2022 | | Years ended March 31, 2022 | | 2021 | | 2020 | | 2019 | | 2018 |
Selected Per-Share Data | | | | | | | | | | | | |
| Net asset value, beginning of period | $ | 13.92 | $ | 14.89 | $ | 9.87 | $ | 11.76 | $ | 12.20 | $ | 11.01 |
| Income from Investment Operations | | | | | | | | | | | | |
Net investment income (loss) A,B | | .08 | | .32 | | .13 | | .19 | | .17 | | .13 |
| Net realized and unrealized gain (loss) | | (2.86) | | .22 | | 5.43 | | (1.34) | | .01 | | 1.46 |
| Total from investment operations | | (2.78) | | .54 | | 5.56 | | (1.15) | | .18 | | 1.59 |
| Distributions from net investment income | | - | | (.33) | | (.15) | | (.19) | | (.16) | | (.13) |
| Distributions from net realized gain | | (.81) | | (1.18) | | (.39) | | (.55) | | (.45) | | (.26) |
| Total distributions | | (.81) | | (1.51) | | (.54) | | (.74) | | (.62) C | | (.40) C |
| Net asset value, end of period | $ | 10.33 | $ | 13.92 | $ | 14.89 | $ | 9.87 | $ | 11.76 | $ | 12.20 |
Total Return D,E | | (20.71)% | | 3.21% | | 57.57% | | (10.80)% | | 1.78% | | 14.50% |
Ratios to Average Net Assets B,F,G | | | | | | | | | | | | |
| Expenses before reductions | | .75% H | | .75% | | .75% | | .75% | | .75% | | .66% I |
| Expenses net of fee waivers, if any | | .75% H | | .75% | | .75% | | .75% | | .75% | | .66% I |
| Expenses net of all reductions | | .75% H | | .75% | | .75% | | .75% | | .75% | | .66% I |
| Net investment income (loss) | | 1.40% H | | 2.14% | | .99% | | 1.59% | | 1.46% | | 1.09% |
| Supplemental Data | | | | | | | | | | | | |
| Net assets, end of period (000 omitted) | $ | 955,560 | $ | 1,070,581 | $ | 891,301 | $ | 451,002 | $ | 367,472 | $ | 241,896 |
Portfolio turnover rate J | | 18% H,K | | 28% | | 18% | | 25% | | 16% | | 11% L |
A Calculated based on average shares outstanding during the period.
B Net investment income (loss) is affected by the timing of the declaration of dividends by any underlying mutual funds or exchange-traded funds (ETFs). Net investment income (loss) of any such underlying funds is not included in the Fund's net investment income (loss) ratio.
C Total distributions per share do not sum due to rounding.
D Total returns for periods of less than one year are not annualized.
E Total returns would have been lower if certain expenses had not been reduced during the applicable periods shown.
F Fees and expenses of any underlying mutual funds or exchange-traded funds (ETFs) are not included in the Fund's expense ratio. The Fund indirectly bears its proportionate share of these expenses. For additional expense information related to investments in Fidelity Central Funds, please refer to the "Investments in Fidelity Central Funds" note found in the Notes to Financial Statements section of the most recent Annual or Semi-Annual report.
G Expense ratios reflect operating expenses of the class. Expenses before reductions do not reflect amounts reimbursed, waived, or reduced through arrangements with the investment adviser, brokerage services, or other offset arrangements, if applicable, and do not represent the amount paid by the class during periods when reimbursements, waivers or reductions occur.
H Annualized
I On certain classes, the size and fluctuation of net assets and expense amounts may cause ratios to differ from contractual rates.
J Amount does not include the portfolio activity of any underlying mutual funds or exchange-traded funds (ETFs).
K Portfolio turnover rate excludes securities received or delivered in-kind.
L The portfolio turnover rate does not include the assets acquired in the merger.
| Fidelity Freedom® 2060 Fund Class K |
| |
| | Six months ended (Unaudited) September 30, 2022 | | Years ended March 31, 2022 | | 2021 | | 2020 | | 2019 | | 2018 A |
Selected Per-Share Data | | | | | | | | | | | | |
| Net asset value, beginning of period | $ | 13.92 | $ | 14.88 | $ | 9.86 | $ | 11.74 | $ | 12.19 | $ | 11.65 |
| Income from Investment Operations | | | | | | | | | | | | |
Net investment income (loss) B,C | | .09 | | .34 | | .14 | | .20 | | .19 | | .16 |
| Net realized and unrealized gain (loss) | | (2.87) | | .22 | | 5.43 | | (1.34) | | (.01) | | .68 |
| Total from investment operations | | (2.78) | | .56 | | 5.57 | | (1.14) | | .18 | | .84 |
| Distributions from net investment income | | - | | (.34) | | (.15) | | (.19) | | (.17) | | (.15) |
| Distributions from net realized gain | | (.81) | | (1.18) | | (.39) | | (.55) | | (.45) | | (.15) |
| Total distributions | | (.81) | | (1.52) | | (.55) D | | (.74) | | (.63) D | | (.30) |
| Net asset value, end of period | $ | 10.33 | $ | 13.92 | $ | 14.88 | $ | 9.86 | $ | 11.74 | $ | 12.19 |
Total Return E,F | | (20.71)% | | 3.35% | | 57.77% | | (10.66)% | | 1.80% | | 7.19% |
Ratios to Average Net Assets C,G,H | | | | | | | | | | | | |
| Expenses before reductions | | .64% I | | .64% J | | .64% | | .64% | | .64% | | .65% I,J |
| Expenses net of fee waivers, if any | | .64% I | | .64% J | | .64% | | .64% | | .64% | | .65% I,J |
| Expenses net of all reductions | | .64% I | | .64% J | | .64% | | .64% | | .64% | | .65% I,J |
| Net investment income (loss) | | 1.50% I | | 2.24% | | 1.09% | | 1.69% | | 1.57% | | 1.92% I |
| Supplemental Data | | | | | | | | | | | | |
| Net assets, end of period (000 omitted) | $ | 1,511,459 | $ | 1,829,608 | $ | 1,714,287 | $ | 933,551 | $ | 784,848 | $ | 549,158 |
Portfolio turnover rate K | | 18% I,L | | 28% | | 18% | | 25% | | 16% | | 11% M |
A For the period July 20, 2017 (commencement of sale of shares) through March 31, 2018.
B Calculated based on average shares outstanding during the period.
C Net investment income (loss) is affected by the timing of the declaration of dividends by any underlying mutual funds or exchange-traded funds (ETFs). Net investment income (loss) of any such underlying funds is not included in the Fund's net investment income (loss) ratio.
D Total distributions per share do not sum due to rounding.
E Total returns for periods of less than one year are not annualized.
F Total returns would have been lower if certain expenses had not been reduced during the applicable periods shown.
G Fees and expenses of any underlying mutual funds or exchange-traded funds (ETFs) are not included in the Fund's expense ratio. The Fund indirectly bears its proportionate share of these expenses. For additional expense information related to investments in Fidelity Central Funds, please refer to the "Investments in Fidelity Central Funds" note found in the Notes to Financial Statements section of the most recent Annual or Semi-Annual report.
H Expense ratios reflect operating expenses of the class. Expenses before reductions do not reflect amounts reimbursed, waived, or reduced through arrangements with the investment adviser, brokerage services, or other offset arrangements, if applicable, and do not represent the amount paid by the class during periods when reimbursements, waivers or reductions occur.
I Annualized
J On certain classes, the size and fluctuation of net assets and expense amounts may cause ratios to differ from contractual rates.
K Amount does not include the portfolio activity of any underlying mutual funds or exchange-traded funds (ETFs).
L Portfolio turnover rate excludes securities received or delivered in-kind.
M The portfolio turnover rate does not include the assets acquired in the merger.
| Fidelity Freedom® 2060 Fund Class K6 |
| |
| | Six months ended (Unaudited) September 30, 2022 | | Years ended March 31, 2022 | | 2021 | | 2020 | | 2019 | | 2018 A |
Selected Per-Share Data | | | | | | | | | | | | |
| Net asset value, beginning of period | $ | 13.91 | $ | 14.87 | $ | 9.85 | $ | 11.75 | $ | 12.20 | $ | 11.40 |
| Income from Investment Operations | | | | | | | | | | | | |
Net investment income (loss) B,C | | .10 | | .36 | | .16 | | .22 | | .20 | | .14 |
| Net realized and unrealized gain (loss) | | (2.87) | | .22 | | 5.43 | | (1.35) | | - D | | .96 |
| Total from investment operations | | (2.77) | | .58 | | 5.59 | | (1.13) | | .20 | | 1.10 |
| Distributions from net investment income | | - | | (.36) | | (.17) | | (.21) | | (.20) | | (.15) |
| Distributions from net realized gain | | (.81) | | (1.18) | | (.40) | | (.56) | | (.45) | | (.15) |
| Total distributions | | (.81) | | (1.54) | | (.57) | | (.77) | | (.65) | | (.30) |
| Net asset value, end of period | $ | 10.33 | $ | 13.91 | $ | 14.87 | $ | 9.85 | $ | 11.75 | $ | 12.20 |
Total Return E,F | | (20.65)% | | 3.51% | | 58.07% | | (10.65)% | | 2.05% | | 9.65% |
Ratios to Average Net Assets C,G,H | | | | | | | | | | | | |
| Expenses before reductions | | .49% I | | .49% J | | .49% | | .49% | | .50% J | | .50% I,J |
| Expenses net of fee waivers, if any | | .49% I | | .49% J | | .49% | | .49% | | .50% J | | .50% I,J |
| Expenses net of all reductions | | .49% I | | .49% J | | .49% | | .49% | | .50% J | | .50% I,J |
| Net investment income (loss) | | 1.66% I | | 2.39% | | 1.24% | | 1.84% | | 1.71% | | 1.44% I |
| Supplemental Data | | | | | | | | | | | | |
| Net assets, end of period (000 omitted) | $ | 787,056 | $ | 759,404 | $ | 539,465 | $ | 230,693 | $ | 136,574 | $ | 26,888 |
Portfolio turnover rate K | | 18% I,L | | 28% | | 18% | | 25% | | 16% | | 11% M |
A For the period June 7, 2017 (commencement of sale of shares) through March 31, 2018.
B Calculated based on average shares outstanding during the period.
C Net investment income (loss) is affected by the timing of the declaration of dividends by any underlying mutual funds or exchange-traded funds (ETFs). Net investment income (loss) of any such underlying funds is not included in the Fund's net investment income (loss) ratio.
D Amount represents less than $.005 per share.
E Total returns for periods of less than one year are not annualized.
F Total returns would have been lower if certain expenses had not been reduced during the applicable periods shown.
G Fees and expenses of any underlying mutual funds or exchange-traded funds (ETFs) are not included in the Fund's expense ratio. The Fund indirectly bears its proportionate share of these expenses. For additional expense information related to investments in Fidelity Central Funds, please refer to the "Investments in Fidelity Central Funds" note found in the Notes to Financial Statements section of the most recent Annual or Semi-Annual report.
H Expense ratios reflect operating expenses of the class. Expenses before reductions do not reflect amounts reimbursed, waived, or reduced through arrangements with the investment adviser, brokerage services, or other offset arrangements, if applicable, and do not represent the amount paid by the class during periods when reimbursements, waivers or reductions occur.
I Annualized
J On certain classes, the size and fluctuation of net assets and expense amounts may cause ratios to differ from contractual rates.
K Amount does not include the portfolio activity of any underlying mutual funds or exchange-traded funds (ETFs).
L Portfolio turnover rate excludes securities received or delivered in-kind.
M The portfolio turnover rate does not include the assets acquired in the merger.
The information in the following table is based on the direct Investments of the Fund.
Top Holdings (% of Fund's net assets) |
| |
| Fidelity Series Emerging Markets Opportunities Fund | 13.2 | |
| Fidelity Series Growth Company Fund | 8.6 | |
| Fidelity Series Large Cap Stock Fund | 8.1 | |
| Fidelity Series Overseas Fund | 7.5 | |
| Fidelity Series International Value Fund | 7.4 | |
| Fidelity Series International Growth Fund | 7.4 | |
| Fidelity Series Stock Selector Large Cap Value Fund | 5.9 | |
| Fidelity Series Long-Term Treasury Bond Index Fund | 5.7 | |
| Fidelity Series Opportunistic Insights Fund | 5.0 | |
| Fidelity Series Value Discovery Fund | 4.6 | |
| | 73.4 | |
| |
Domestic Equity Funds category includes Fidelity Series Commodity Strategy Fund which invests in commodity-related investments.
Asset Allocation (% of Fund's net assets) |
|
Percentages shown as 0.0% may reflect amounts less than 0.05%. |
|
Fidelity Freedom® 2065 Fund
Showing Percentage of Net Assets
| U.S. Treasury Obligations - 0.1% |
| | | Principal Amount (a) | Value ($) |
U.S. Treasury Bills, yield at date of purchase 1.87% to 2.42% 10/6/22 to 10/20/22 (b) (Cost $369,644) | | 370,000 | 369,663 |
| | | | |
| Domestic Equity Funds - 49.9% |
| | | Shares | Value ($) |
| Fidelity Series All-Sector Equity Fund (c) | | 1,092,877 | 9,376,886 |
| Fidelity Series Blue Chip Growth Fund (c) | | 2,216,771 | 22,256,384 |
| Fidelity Series Commodity Strategy Fund (c) | | 2,880,206 | 6,019,630 |
| Fidelity Series Growth Company Fund (c) | | 3,263,002 | 43,789,491 |
| Fidelity Series Intrinsic Opportunities Fund (c) | | 1,534,654 | 20,196,049 |
| Fidelity Series Large Cap Stock Fund (c) | | 2,814,955 | 41,576,884 |
| Fidelity Series Large Cap Value Index Fund (c) | | 1,076,325 | 13,690,853 |
| Fidelity Series Opportunistic Insights Fund (c) | | 1,792,084 | 25,465,520 |
| Fidelity Series Small Cap Discovery Fund (c) | | 452,547 | 4,244,887 |
| Fidelity Series Small Cap Opportunities Fund (c) | | 1,313,055 | 14,154,731 |
| Fidelity Series Stock Selector Large Cap Value Fund (c) | | 2,692,839 | 30,079,011 |
| Fidelity Series Value Discovery Fund (c) | | 1,708,769 | 23,529,746 |
| TOTAL DOMESTIC EQUITY FUNDS (Cost $315,793,000) | | | 254,380,072 |
| | | | |
| International Equity Funds - 42.1% |
| | | Shares | Value ($) |
| Fidelity Series Canada Fund (c) | | 1,330,092 | 16,493,143 |
| Fidelity Series Emerging Markets Fund (c) | | 1,013,344 | 7,336,607 |
| Fidelity Series Emerging Markets Opportunities Fund (c) | | 4,616,469 | 67,031,137 |
| Fidelity Series International Growth Fund (c) | | 2,934,693 | 37,622,769 |
| Fidelity Series International Small Cap Fund (c) | | 719,751 | 9,846,197 |
| Fidelity Series International Value Fund (c) | | 4,406,678 | 37,853,366 |
| Fidelity Series Overseas Fund (c) | | 3,985,524 | 37,982,039 |
| TOTAL INTERNATIONAL EQUITY FUNDS (Cost $276,446,232) | | | 214,165,258 |
| | | | |
| Bond Funds - 7.4% |
| | | Shares | Value ($) |
| Fidelity Series 5+ Year Inflation-Protected Bond Index Fund (c) | | 63,079 | 503,997 |
| Fidelity Series Emerging Markets Debt Fund (c) | | 391,187 | 2,683,540 |
| Fidelity Series Emerging Markets Debt Local Currency Fund (c) | | 110,808 | 883,141 |
| Fidelity Series Floating Rate High Income Fund (c) | | 59,614 | 518,645 |
| Fidelity Series High Income Fund (c) | | 351,710 | 2,771,472 |
| Fidelity Series International Credit Fund (c) | | 4,816 | 37,900 |
| Fidelity Series Long-Term Treasury Bond Index Fund (c) | | 4,877,047 | 29,115,968 |
| Fidelity Series Real Estate Income Fund (c) | | 138,157 | 1,315,250 |
| TOTAL BOND FUNDS (Cost $47,491,885) | | | 37,829,913 |
| | | | |
| Short-Term Funds - 0.5% |
| | | Shares | Value ($) |
| Fidelity Series Government Money Market Fund 3.00% (c)(d) | | 2,602,568 | 2,602,568 |
| Fidelity Series Short-Term Credit Fund (c) | | 486 | 4,605 |
| TOTAL SHORT-TERM FUNDS (Cost $2,607,173) | | | 2,607,173 |
| | | | |
| TOTAL INVESTMENT IN SECURITIES - 100.0% (Cost $642,707,934) | 509,352,079 |
NET OTHER ASSETS (LIABILITIES) - 0.0% | (62,007) |
| NET ASSETS - 100.0% | 509,290,072 |
| | |
| Futures Contracts |
| | Number of contracts | Expiration Date | Notional Amount ($) | Value ($) | Unrealized Appreciation/ (Depreciation) ($) |
| Purchased | | | | | |
| | | | | | |
| Treasury Contracts | | | | | |
| CBOT 10-Year U.S. Treasury Note Contracts (United States) | 82 | Dec 2022 | 9,189,125 | (550,215) | (550,215) |
| CBOT Ultra Long Term U.S. Treasury Bond Contracts (United States) | 7 | Dec 2022 | 959,000 | (12,721) | (12,721) |
| | | | | | |
| TOTAL PURCHASED | | | | | (562,936) |
| | | | | | |
| Sold | | | | | |
| | | | | | |
| Equity Index Contracts | | | | | |
| CME E-mini S&P 500 Index Contracts (United States) | 14 | Dec 2022 | 2,521,050 | 2,540 | 2,540 |
| ICE E-mini MSCI EAFE Index Contracts (United States) | 25 | Dec 2022 | 2,075,750 | 281,515 | 281,515 |
| ICE E-mini MSCI Emerging Markets Index Contracts (United States) | 19 | Dec 2022 | 827,925 | 5,400 | 5,400 |
| | | | | | |
| TOTAL SOLD | | | | | 289,455 |
| | | | | | |
| TOTAL FUTURES CONTRACTS | | | | | (273,481) |
| The notional amount of futures purchased as a percentage of Net Assets is 2.0% |
| The notional amount of futures sold as a percentage of Net Assets is 1.1% |
Legend
| (a) | Amount is stated in United States dollars unless otherwise noted. |
| (b) | Security or a portion of the security was pledged to cover margin requirements for futures contracts. At period end, the value of securities pledged amounted to $369,663. |
| (d) | The rate quoted is the annualized seven-day yield of the fund at period end. |
Affiliated Central Funds
Fiscal year to date information regarding the Fund's investments in Fidelity Central Funds, including the ownership percentage, is presented below.
| Affiliate | Value, beginning of period ($) | Purchases ($) | Sales Proceeds ($) | Dividend Income ($) | Realized Gain (loss) ($) | Change in Unrealized appreciation (depreciation) ($) | Value, end of period ($) | %ownership, end of period |
| Fidelity Cash Central Fund 3.10% | 322,925 | 1,617,332 | 1,940,257 | 2,605 | - | - | - | 0.0% |
| Total | 322,925 | 1,617,332 | 1,940,257 | 2,605 | - | - | - | |
| | | | | | | | | |
Amounts in the income column in the above table include any capital gain distributions from underlying funds, which are presented in the corresponding line item in the Statement of Operations, if applicable.
Affiliated Underlying Funds
Fiscal year to date information regarding the Fund's investments in affiliated Underlying Funds is presented below. Exchanges between classes of the same affiliated Underlying Funds may occur. If an Underlying Funds changes its name, the name presented below is the name in effect at period end.
| Affiliate | Value, beginning of period ($) | Purchases ($) | Sales Proceeds ($) | Dividend Income ($) | Realized Gain (loss) ($) | Change in Unrealized appreciation (depreciation) ($) | Value, end of period ($) |
| Fidelity Series 5+ Year Inflation-Protected Bond Index Fund | 462,794 | 154,313 | 22,408 | - | (779) | (89,923) | 503,997 |
| Fidelity Series All-Sector Equity Fund | 9,057,923 | 2,884,393 | 465,461 | - | (65,923) | (2,034,046) | 9,376,886 |
| Fidelity Series Blue Chip Growth Fund | 14,870,729 | 14,242,955 | 646,909 | 721,817 | (227,121) | (5,983,270) | 22,256,384 |
| Fidelity Series Canada Fund | 15,050,020 | 5,762,773 | 739,382 | - | (71,858) | (3,508,410) | 16,493,143 |
| Fidelity Series Commodity Strategy Fund | 6,885,317 | 6,847,752 | 2,678,875 | 4,273,709 | (1,203,175) | (3,831,389) | 6,019,630 |
| Fidelity Series Emerging Markets Debt Fund | 2,271,793 | 897,931 | 27,114 | 68,923 | (6,197) | (452,873) | 2,683,540 |
| Fidelity Series Emerging Markets Debt Local Currency Fund | 765,966 | 267,942 | 48,842 | - | (11,476) | (90,449) | 883,141 |
| Fidelity Series Emerging Markets Fund | 6,338,766 | 2,840,793 | 102,583 | - | (34,996) | (1,705,373) | 7,336,607 |
| Fidelity Series Emerging Markets Opportunities Fund | 58,709,094 | 24,634,973 | 1,177,617 | - | (546,612) | (14,588,701) | 67,031,137 |
| Fidelity Series Floating Rate High Income Fund | 462,515 | 165,262 | 81,709 | 13,384 | (3,000) | (24,423) | 518,645 |
| Fidelity Series Government Money Market Fund 3.00% | - | 2,602,568 | - | 115 | - | - | 2,602,568 |
| Fidelity Series Growth Company Fund | 37,068,741 | 19,435,803 | 930,389 | - | (343,082) | (11,441,582) | 43,789,491 |
| Fidelity Series High Income Fund | 2,794,343 | 899,628 | 521,375 | 75,808 | (45,703) | (355,421) | 2,771,472 |
| Fidelity Series International Credit Fund | 44,051 | 601 | 87 | 601 | (2) | (6,663) | 37,900 |
| Fidelity Series International Growth Fund | 34,418,337 | 13,735,345 | 1,148,637 | - | (265,522) | (9,116,754) | 37,622,769 |
| Fidelity Series International Small Cap Fund | 9,429,169 | 3,245,663 | 176,402 | - | (82,395) | (2,569,838) | 9,846,197 |
| Fidelity Series International Value Fund | 34,754,122 | 13,642,328 | 1,410,955 | - | (57,807) | (9,074,322) | 37,853,366 |
| Fidelity Series Intrinsic Opportunities Fund | 34,864,497 | 13,114,705 | 18,469,628 | 5,432,130 | (1,781,965) | (7,531,560) | 20,196,049 |
| Fidelity Series Investment Grade Bond Fund | 2,406,991 | 259,611 | 2,572,025 | 9,208 | (102,206) | 7,629 | - |
| Fidelity Series Large Cap Stock Fund | 32,965,244 | 19,753,033 | 1,399,204 | 2,189,784 | (151,358) | (9,590,831) | 41,576,884 |
| Fidelity Series Large Cap Value Index Fund | 12,409,062 | 4,315,116 | 499,395 | - | (23,086) | (2,510,844) | 13,690,853 |
| Fidelity Series Long-Term Treasury Bond Index Fund | 24,674,029 | 12,424,927 | 1,449,014 | 349,656 | (339,473) | (6,194,501) | 29,115,968 |
| Fidelity Series Opportunistic Insights Fund | 18,989,860 | 12,184,973 | 400,970 | - | (116,990) | (5,191,353) | 25,465,520 |
| Fidelity Series Overseas Fund | 34,603,934 | 13,920,891 | 323,310 | - | (46,456) | (10,173,020) | 37,982,039 |
| Fidelity Series Real Estate Income Fund | 1,627,039 | 508,424 | 552,465 | 93,590 | (46,094) | (221,654) | 1,315,250 |
| Fidelity Series Short-Term Credit Fund | - | 4,605 | - | - | - | - | 4,605 |
| Fidelity Series Small Cap Discovery Fund | 4,025,885 | 1,827,511 | 178,609 | 501,403 | (53,336) | (1,376,564) | 4,244,887 |
| Fidelity Series Small Cap Opportunities Fund | 13,414,400 | 5,008,519 | 1,003,736 | 632,364 | (171,251) | (3,093,201) | 14,154,731 |
| Fidelity Series Stock Selector Large Cap Value Fund | 27,765,681 | 9,663,406 | 1,633,636 | - | (125,236) | (5,591,204) | 30,079,011 |
| Fidelity Series Value Discovery Fund | 21,124,962 | 7,480,569 | 1,590,759 | - | (91,492) | (3,393,534) | 23,529,746 |
| | 462,255,264 | 212,727,313 | 40,251,496 | 14,362,492 | (6,014,591) | (119,734,074) | 508,982,416 |
Amounts in the income column in the above table include any capital gain distributions from underlying funds, which are presented in the corresponding line item in the Statement of Operations, if applicable.
Purchases and Sales Proceeds in the table above include the value of shares purchased or redeemed through in-kind transactions, if applicable.
Investment Valuation
The following is a summary of the inputs used, as of September 30, 2022, involving the Fund's assets and liabilities carried at fair value. The inputs or methodology used for valuing securities may not be an indication of the risk associated with investing in those securities. For more information on valuation inputs, and their aggregation into the levels used below, please refer to the Investment Valuation section in the accompanying Notes to Financial Statements.
| Valuation Inputs at Reporting Date: |
| Description | Total ($) | Level 1 ($) | Level 2 ($) | Level 3 ($) |
Investments in Securities: | | | | |
|
| Other Short-Term Investments | 369,663 | - | 369,663 | - |
|
| Domestic Equity Funds | 254,380,072 | 254,380,072 | - | - |
|
| International Equity Funds | 214,165,258 | 214,165,258 | - | - |
|
| Bond Funds | 37,829,913 | 37,829,913 | - | - |
|
| Short-Term Funds | 2,607,173 | 2,607,173 | - | - |
| Total Investments in Securities: | 509,352,079 | 508,982,416 | 369,663 | - |
Derivative Instruments: | | | | |
|
| Assets | | | | |
Futures Contracts | 289,455 | 289,455 | - | - |
| Total Assets | 289,455 | 289,455 | - | - |
|
| Liabilities | | | | |
Futures Contracts | (562,936) | (562,936) | - | - |
| Total Liabilities | (562,936) | (562,936) | - | - |
| Total Derivative Instruments: | (273,481) | (273,481) | - | - |
Value of Derivative Instruments
The following table is a summary of the Fund's value of derivative instruments by primary risk exposure as of September 30, 2022. For additional information on derivative instruments, please refer to the Derivative Instruments section in the accompanying Notes to Financial Statements.
Primary Risk Exposure / Derivative Type | Value |
| Asset ($) | Liability ($) |
| Equity Risk | | |
Futures Contracts (a) | 289,455 | 0 |
| Total Equity Risk | 289,455 | 0 |
| Interest Rate Risk | | |
Futures Contracts (a) | 0 | (562,936) |
| Total Interest Rate Risk | 0 | (562,936) |
| Total Value of Derivatives | 289,455 | (562,936) |
(a)Reflects gross cumulative appreciation (depreciation) on futures contracts as presented in the Schedule of Investments. In the Statement of Assets and Liabilities, the period end daily variation margin is included in receivable or payable for daily variation margin on futures contracts, and the net cumulative appreciation (depreciation) is included in Total accumulated earnings (loss).
Fidelity Freedom® 2065 Fund
| Statement of Assets and Liabilities |
| | | | September 30, 2022 (Unaudited) |
| | | | | |
| Assets | | | | |
| Investment in securities, at value - See accompanying schedule: | $ | | | |
Unaffiliated issuers (cost $369,644) | | $369,663 | | |
Affiliated issuers (cost $642,338,290) | | 508,982,416 | | |
| | | | | |
| Total Investment in Securities (cost $642,707,934) | | | $ | 509,352,079 |
| Receivable for investments sold | | | | 2,103,594 |
| Receivable for fund shares sold | | | | 4,843,888 |
| Distributions receivable from Fidelity Central Funds | | | | 221 |
Total assets | | | | 516,299,782 |
| Liabilities | | | | |
| Payable to custodian bank | | 20,994 | | |
| Payable for investments purchased | | 6,289,288 | | |
| Payable for fund shares redeemed | | 395,694 | | |
| Accrued management fee | | 278,723 | | |
| Payable for daily variation margin on futures contracts | | 25,011 | | |
| Total Liabilities | | | | 7,009,710 |
| Net Assets | | | $ | 509,290,072 |
| Net Assets consist of: | | | | |
| Paid in capital | | | $ | 640,010,140 |
| Total accumulated earnings (loss) | | | | (130,720,068) |
| Net Assets | | | $ | 509,290,072 |
| | | | | |
| Net Asset Value and Maximum Offering Price | | | | |
| Fidelity Freedom 2065 Fund : | | | | |
Net Asset Value , offering price and redemption price per share ($156,939,476 ÷ 16,663,990 shares) | | | $ | 9.42 |
| Class K : | | | | |
Net Asset Value , offering price and redemption price per share ($217,741,347 ÷ 23,088,904 shares) | | | $ | 9.43 |
| Class K6 : | | | | |
Net Asset Value , offering price and redemption price per share ($134,609,249 ÷ 14,242,998 shares) | | | $ | 9.45 |
| Statement of Operations |
| | | | Six months ended September 30, 2022 (Unaudited) |
| Investment Income | | | | |
| Dividends: | | | | |
| Affiliated issuers | | | $ | 5,596,856 |
| Interest | | | | 2,489 |
| Income from Fidelity Central Funds | | | | 2,605 |
| Total Income | | | | 5,601,950 |
| Expenses | | | | |
| Management fee | $ | 1,550,661 | | |
| Independent trustees' fees and expenses | | 777 | | |
| Total expenses before reductions | | 1,551,438 | | |
| Expense reductions | | (153) | | |
| Total expenses after reductions | | | | 1,551,285 |
| Net Investment income (loss) | | | | 4,050,665 |
| Realized and Unrealized Gain (Loss) | | | | |
| Net realized gain (loss) on: | | | | |
| Investment Securities: | | | | |
| Affiliated issuers | | (6,014,591) | | |
| Futures contracts | | (339,219) | | |
| Capital gain distributions from underlying funds: | | | | |
| Affiliated issuers | | 8,765,636 | | |
| Total net realized gain (loss) | | | | 2,411,826 |
| Change in net unrealized appreciation (depreciation) on: | | | | |
| Investment Securities: | | | | |
| Unaffiliated issuers | | 16 | | |
| Affiliated issuers | | (119,734,074) | | |
| Futures contracts | | (296,409) | | |
| Total change in net unrealized appreciation (depreciation) | | | | (120,030,467) |
| Net gain (loss) | | | | (117,618,641) |
| Net increase (decrease) in net assets resulting from operations | | | $ | (113,567,976) |
| Statement of Changes in Net Assets |
| |
| | Six months ended September 30, 2022 (Unaudited) | | Year ended March 31, 2022 |
| Increase (Decrease) in Net Assets | | | | |
| Operations | | | | |
| Net investment income (loss) | $ | 4,050,665 | $ | 7,901,429 |
| Net realized gain (loss) | | 2,411,826 | | 32,881,502 |
| Change in net unrealized appreciation (depreciation) | | (120,030,467) | | (39,412,824) |
| Net increase (decrease) in net assets resulting from operations | | (113,567,976) | | 1,370,107 |
| Distributions to shareholders | | (23,433,117) | | (26,514,383) |
| Share transactions - net increase (decrease) | | 183,544,230 | | 262,447,810 |
| Total increase (decrease) in net assets | | 46,543,137 | | 237,303,534 |
| | | | | |
| Net Assets | | | | |
| Beginning of period | | 462,746,935 | | 225,443,401 |
| End of period | $ | 509,290,072 | $ | 462,746,935 |
| | | | | |
| | | | | |
Financial Highlights
| Fidelity Freedom® 2065 Fund |
| |
| | Six months ended (Unaudited) September 30, 2022 | | Years ended March 31, 2022 | | 2021 | | 2020 A |
Selected Per-Share Data | | | | | | | | |
| Net asset value, beginning of period | $ | 12.53 | $ | 13.10 | $ | 8.52 | $ | 10.00 |
| Income from Investment Operations | | | | | | | | |
Net investment income (loss) B,C | | .08 | | .30 | | .12 | | .13 |
| Net realized and unrealized gain (loss) | | (2.60) | | .17 D | | 4.74 | | (1.46) |
| Total from investment operations | | (2.52) | | .47 | | 4.86 | | (1.33) |
| Distributions from net investment income | | - | | (.28) | | (.13) | | (.12) |
| Distributions from net realized gain | | (.59) | | (.76) | | (.15) | | (.03) |
| Total distributions | | (.59) | | (1.04) | | (.28) | | (.15) |
| Net asset value, end of period | $ | 9.42 | $ | 12.53 | $ | 13.10 | $ | 8.52 |
Total Return E,F | | (20.70)% | | 3.25% | | 57.49% | | (13.60)% |
Ratios to Average Net Assets C,G,H | | | | | | | | |
| Expenses before reductions | | .75% I | | .75% | | .75% | | .76% I,J |
| Expenses net of fee waivers, if any | | .75% I | | .75% | | .75% | | .76% I,J |
| Expenses net of all reductions | | .75% I | | .75% | | .75% | | .76% I,J |
| Net investment income (loss) | | 1.55% I | | 2.24% | | 1.07% | | 1.71% I |
| Supplemental Data | | | | | | | | |
| Net assets, end of period (000 omitted) | $ | 156,939 | $ | 143,463 | $ | 68,876 | $ | 13,332 |
Portfolio turnover rate K | | 16% I,L | | 23% | | 13% | | 33% I |
A For the period June 28, 2019 (commencement of operations) through March 31, 2020
B Calculated based on average shares outstanding during the period.
C Net investment income (loss) is affected by the timing of the declaration of dividends by any underlying mutual funds or exchange-traded funds (ETFs). Net investment income (loss) of any such underlying funds is not included in the Fund's net investment income (loss) ratio.
D The amount shown for a share outstanding does not correspond with the aggregate net gain (loss) on investments for the period due to the timing of sales and repurchases of shares in relation to fluctuating market values of the investments of the Fund.
E Total returns for periods of less than one year are not annualized.
F Total returns would have been lower if certain expenses had not been reduced during the applicable periods shown.
G Fees and expenses of any underlying mutual funds or exchange-traded funds (ETFs) are not included in the Fund's expense ratio. The Fund indirectly bears its proportionate share of these expenses. For additional expense information related to investments in Fidelity Central Funds, please refer to the "Investments in Fidelity Central Funds" note found in the Notes to Financial Statements section of the most recent Annual or Semi-Annual report.
H Expense ratios reflect operating expenses of the class. Expenses before reductions do not reflect amounts reimbursed, waived, or reduced through arrangements with the investment adviser, brokerage services, or other offset arrangements, if applicable, and do not represent the amount paid by the class during periods when reimbursements, waivers or reductions occur.
I Annualized
J On certain classes, the size and fluctuation of net assets and expense amounts may cause ratios to differ from contractual rates.
K Amount does not include the portfolio activity of any underlying mutual funds or exchange-traded funds (ETFs).
L Portfolio turnover rate excludes securities received or delivered in-kind.
| Fidelity Freedom® 2065 Fund Class K |
| |
| | Six months ended (Unaudited) September 30, 2022 | | Years ended March 31, 2022 | | 2021 | | 2020 A |
Selected Per-Share Data | | | | | | | | |
| Net asset value, beginning of period | $ | 12.54 | $ | 13.11 | $ | 8.52 | $ | 10.00 |
| Income from Investment Operations | | | | | | | | |
Net investment income (loss) B,C | | .09 | | .31 | | .14 | | .13 |
| Net realized and unrealized gain (loss) | | (2.60) | | .17 D | | 4.74 | | (1.45) |
| Total from investment operations | | (2.51) | | .48 | | 4.88 | | (1.32) |
| Distributions from net investment income | | - | | (.29) | | (.13) | | (.13) |
| Distributions from net realized gain | | (.60) | | (.76) | | (.16) | | (.03) |
| Total distributions | | (.60) | | (1.05) | | (.29) | | (.16) |
| Net asset value, end of period | $ | 9.43 | $ | 12.54 | $ | 13.11 | $ | 8.52 |
Total Return E,F | | (20.66)% | | 3.30% | | 57.72% | | (13.55)% |
Ratios to Average Net Assets C,G,H | | | | | | | | |
| Expenses before reductions | | .64% I | | .64% J | | .64% | | .65% I,J |
| Expenses net of fee waivers, if any | | .64% I | | .64% J | | .64% | | .65% I,J |
| Expenses net of all reductions | | .64% I | | .64% J | | .64% | | .65% I,J |
| Net investment income (loss) | | 1.66% I | | 2.34% | | 1.18% | | 1.81% I |
| Supplemental Data | | | | | | | | |
| Net assets, end of period (000 omitted) | $ | 217,741 | $ | 213,091 | $ | 113,107 | $ | 20,387 |
Portfolio turnover rate K | | 16% I,L | | 23% | | 13% | | 33% I |
A For the period June 28, 2019 (commencement of operations) through March 31, 2020
B Calculated based on average shares outstanding during the period.
C Net investment income (loss) is affected by the timing of the declaration of dividends by any underlying mutual funds or exchange-traded funds (ETFs). Net investment income (loss) of any such underlying funds is not included in the Fund's net investment income (loss) ratio.
D The amount shown for a share outstanding does not correspond with the aggregate net gain (loss) on investments for the period due to the timing of sales and repurchases of shares in relation to fluctuating market values of the investments of the Fund.
E Total returns for periods of less than one year are not annualized.
F Total returns would have been lower if certain expenses had not been reduced during the applicable periods shown.
G Fees and expenses of any underlying mutual funds or exchange-traded funds (ETFs) are not included in the Fund's expense ratio. The Fund indirectly bears its proportionate share of these expenses. For additional expense information related to investments in Fidelity Central Funds, please refer to the "Investments in Fidelity Central Funds" note found in the Notes to Financial Statements section of the most recent Annual or Semi-Annual report.
H Expense ratios reflect operating expenses of the class. Expenses before reductions do not reflect amounts reimbursed, waived, or reduced through arrangements with the investment adviser, brokerage services, or other offset arrangements, if applicable, and do not represent the amount paid by the class during periods when reimbursements, waivers or reductions occur.
I Annualized
J On certain classes, the size and fluctuation of net assets and expense amounts may cause ratios to differ from contractual rates.
K Amount does not include the portfolio activity of any underlying mutual funds or exchange-traded funds (ETFs).
L Portfolio turnover rate excludes securities received or delivered in-kind.
| Fidelity Freedom® 2065 Fund Class K6 |
| |
| | Six months ended (Unaudited) September 30, 2022 | | Years ended March 31, 2022 | | 2021 | | 2020 A |
Selected Per-Share Data | | | | | | | | |
| Net asset value, beginning of period | $ | 12.56 | $ | 13.13 | $ | 8.53 | $ | 10.00 |
| Income from Investment Operations | | | | | | | | |
Net investment income (loss) B,C | | .10 | | .33 | | .15 | | .15 |
| Net realized and unrealized gain (loss) | | (2.61) | | .17 D | | 4.75 | | (1.46) |
| Total from investment operations | | (2.51) | | .50 | | 4.90 | | (1.31) |
| Distributions from net investment income | | - | | (.31) | | (.14) | | (.13) |
| Distributions from net realized gain | | (.60) | | (.76) | | (.16) | | (.03) |
| Total distributions | | (.60) | | (1.07) | | (.30) | | (.16) |
| Net asset value, end of period | $ | 9.45 | $ | 12.56 | $ | 13.13 | $ | 8.53 |
Total Return E,F | | (20.59)% | | 3.43% | | 57.93% | | (13.43)% |
Ratios to Average Net Assets C,G,H | | | | | | | | |
| Expenses before reductions | | .49% I | | .49% J | | .49% | | .50% I,J |
| Expenses net of fee waivers, if any | | .49% I | | .49% J | | .49% | | .50% I,J |
| Expenses net of all reductions | | .49% I | | .49% J | | .49% | | .50% I,J |
| Net investment income (loss) | | 1.81% I | | 2.49% | | 1.33% | | 1.97% I |
| Supplemental Data | | | | | | | | |
| Net assets, end of period (000 omitted) | $ | 134,609 | $ | 106,193 | $ | 43,461 | $ | 6,094 |
Portfolio turnover rate K | | 16% I,L | | 23% | | 13% | | 33% I |
A For the period June 28, 2019 (commencement of operations) through March 31, 2020
B Calculated based on average shares outstanding during the period.
C Net investment income (loss) is affected by the timing of the declaration of dividends by any underlying mutual funds or exchange-traded funds (ETFs). Net investment income (loss) of any such underlying funds is not included in the Fund's net investment income (loss) ratio.
D The amount shown for a share outstanding does not correspond with the aggregate net gain (loss) on investments for the period due to the timing of sales and repurchases of shares in relation to fluctuating market values of the investments of the Fund.
E Total returns for periods of less than one year are not annualized.
F Total returns would have been lower if certain expenses had not been reduced during the applicable periods shown.
G Fees and expenses of any underlying mutual funds or exchange-traded funds (ETFs) are not included in the Fund's expense ratio. The Fund indirectly bears its proportionate share of these expenses. For additional expense information related to investments in Fidelity Central Funds, please refer to the "Investments in Fidelity Central Funds" note found in the Notes to Financial Statements section of the most recent Annual or Semi-Annual report.
H Expense ratios reflect operating expenses of the class. Expenses before reductions do not reflect amounts reimbursed, waived, or reduced through arrangements with the investment adviser, brokerage services, or other offset arrangements, if applicable, and do not represent the amount paid by the class during periods when reimbursements, waivers or reductions occur.
I Annualized
J On certain classes, the size and fluctuation of net assets and expense amounts may cause ratios to differ from contractual rates.
K Amount does not include the portfolio activity of any underlying mutual funds or exchange-traded funds (ETFs).
L Portfolio turnover rate excludes securities received or delivered in-kind.
For the period ended September 30, 2022
1. Organization.
Fidelity Freedom Income Fund, Fidelity Freedom 2005 Fund, Fidelity Freedom 2010 Fund, Fidelity Freedom 2015 Fund, Fidelity Freedom 2020 Fund, Fidelity Freedom 2025 Fund, Fidelity Freedom 2030 Fund, Fidelity Freedom 2035 Fund, Fidelity Freedom 2040 Fund, Fidelity Freedom 2045 Fund, Fidelity Freedom 2050 Fund, Fidelity Freedom 2055 Fund, Fidelity Freedom 2060 Fund and Fidelity Freedom 2065 Fund (the Funds) are funds of Fidelity Aberdeen Street Trust (the Trust). The Trust is registered under the Investment Company Act of 1940, as amended (the 1940 Act), as an open-end management investment company organized as a Delaware statutory trust. Each Fund is authorized to issue an unlimited number of shares. Each Fund offers Fidelity Freedom, Class K and Class K6 shares, each of which has equal rights as to assets and voting privileges. Each class has exclusive voting rights with respect to matters that affect that class.
2. Investments in Fidelity Central Funds.
Funds may invest in Fidelity Central Funds, which are open-end investment companies generally available only to other investment companies and accounts managed by the investment adviser and its affiliates. The Schedule of Investments lists any Fidelity Central Funds held as an investment as of period end, but does not include the underlying holdings of each Fidelity Central Fund. An investing fund indirectly bears its proportionate share of the expenses of the underlying Fidelity Central Funds.
Based on its investment objective, each Fidelity Central Fund may invest or participate in various investment vehicles or strategies that are similar to those of the investing fund. These strategies are consistent with the investment objectives of the investing fund and may involve certain economic risks which may cause a decline in value of each of the Fidelity Central Funds and thus a decline in the value of the investing fund.
| Fidelity Central Fund | Investment Manager | Investment Objective | Investment Practices | Expense Ratio A |
| Fidelity Money Market Central Funds | Fidelity Management & Research Company LLC (FMR) | Each fund seeks to obtain a high level of current income consistent with the preservation of capital and liquidity. | Short-term Investments | Less than .005% |
A Expenses expressed as a percentage of average net assets and are as of each underlying Central Fund's most recent annual or semi-annual shareholder report.
A complete unaudited list of holdings for each Fidelity Central Fund is available upon request or at the Securities and Exchange Commission website at www.sec.gov. In addition, the financial statements of the Fidelity Central Funds which contain the significant accounting policies (including investment valuation policies) of those funds, and are not covered by the Report of Independent Registered Public Accounting Firm, are available on the Securities and Exchange Commission website or upon request.
3. Significant Accounting Policies.
Each Fund is an investment company and applies the accounting and reporting guidance of the Financial Accounting Standards Board (FASB) Accounting Standards Codification Topic 946 Financial Services - Investment Companies . The financial statements have been prepared in conformity with accounting principles generally accepted in the United States of America (GAAP), which require management to make certain estimates and assumptions at the date of the financial statements. Actual results could differ from those estimates. Subsequent events, if any, through the date that the financial statements were issued have been evaluated in the preparation of the financial statements. Each Fund's Schedule of Investments lists any underlying mutual funds or exchange-traded funds (ETFs) but does not include the underlying holdings of these funds. The following summarizes the significant accounting policies of each Fund:
Investment Valuation. Investments are valued as of 4:00 p.m. Eastern time on the last calendar day of the period. The Board of Trustees (the Board) has designated each Fund's investment adviser as the valuation designee responsible for the fair valuation function and performing fair value determinations as needed. The investment adviser has established a Fair Value Committee (the Committee) to carry out the day-to-day fair valuation responsibilities and has adopted policies and procedures to govern the fair valuation process and the activities of the Committee. In accordance with these fair valuation policies and procedures, which have been approved by the Board, each Fund attempts to obtain prices from one or more third party pricing services or brokers to value its investments. When current market prices, quotations or currency exchange rates are not readily available or reliable, investments will be fair valued in good faith by the Committee, in accordance with the policies and procedures. Factors used in determining fair value vary by investment type and may include market or investment specific events, transaction data, estimated cash flows, and market observations of comparable investments. The frequency that the fair valuation procedures are used cannot be predicted and they may be utilized to a significant extent. The Committee manages each Fund's fair valuation practices and maintains the fair valuation policies and procedures. Each Fund's investment adviser reports to the Board information regarding the fair valuation process and related material matters. Each Fund categorizes the inputs to valuation techniques used to value its investments into a disclosure hierarchy consisting of three levels as shown below:
Level 1 - unadjusted quoted prices in active markets for identical investments
Level 2 - other significant observable inputs (including quoted prices for similar investments, interest rates, prepayment speeds, etc.)
Level 3 - unobservable inputs (including the Fund's own assumptions based on the best information available)
Valuation techniques used to value each Fund's investments by major category are as follows. Investments in open-end mutual funds are valued at their closing net asset value (NAV) each business day and are categorized as Level 1 in the hierarchy. Debt securities, including restricted securities, are valued based on evaluated prices received from third party pricing services or from brokers who make markets in such securities. U.S. government and government agency obligations are valued by pricing services who utilize matrix pricing which considers yield or price of bonds of comparable quality, coupon, maturity and type or by broker-supplied prices. When independent prices are unavailable or unreliable, debt securities may be valued utilizing pricing methodologies which consider similar factors that would be used by third party pricing services. Debt securities are generally categorized as Level 2 in the hierarchy but may be Level 3 depending on the circumstances. The aggregate value of investments by input level as of September 30, 2022 is included at the end of each Fund's Schedule of Investments.
Futures contracts are valued at the settlement price established each day by the board of trade or exchange on which they are traded and are categorized as Level 1 in the hierarchy.
Investment Transactions and Income. For financial reporting purposes, the Funds' investment holdings and NAV include trades executed through the end of the last business day of the period. The NAV per share for processing shareholder transactions is calculated as of the close of business of the New York Stock Exchange (NYSE), normally 4:00 p.m. Eastern time and includes trades executed through the end of the prior business day. Gains and losses on securities sold are determined on the basis of identified cost. Income and capital gain distributions from any underlying mutual funds or exchange-traded funds (ETFs) are recorded on the ex-dividend date. Distributions from any underlying mutual funds or exchange-traded funds (ETFs) that are deemed to be return of capital are recorded as a reduction of cost of investments. Interest income is accrued as earned. Interest income includes coupon interest and amortization of premium and accretion of discount on debt securities as applicable.
Class Allocations and Expenses. Investment income, realized and unrealized capital gains and losses, common expenses of a fund, and certain fund-level expense reductions, if any, are allocated daily on a pro-rata basis to each class based on the relative net assets of each class to the total net assets of a fund. Each class differs with respect to transfer agent and distribution and service plan fees incurred, as applicable. Certain expense reductions may also differ by class, if applicable. For the reporting period, the allocated portion of income and expenses to each class as a percent of its average net assets may vary due to the timing of recording these transactions in relation to fluctuating net assets of the classes. Expenses directly attributable to a fund are charged to that fund. Expenses attributable to more than one fund are allocated among the respective funds on the basis of relative net assets or other appropriate methods. Expenses included in the accompanying financial statements reflect the expenses of that fund and do not include any expenses associated with any underlying mutual funds or exchange-traded funds. Although not included in a fund's expenses, a fund indirectly bears its proportionate share of these expenses through the net asset value of each underlying mutual fund or exchange-traded fund. Expense estimates are accrued in the period to which they relate and adjustments are made when actual amounts are known.
Deferred Trustee Compensation. Under a Deferred Compensation Plan (the Plan) for certain Funds, certain independent Trustees have elected to defer receipt of a portion of their annual compensation. Deferred amounts are invested in affiliated mutual funds, are marked-to-market and remain in a fund until distributed in accordance with the Plan. The investment of deferred amounts and the offsetting payable to the Trustees presented below are included in the accompanying Statement of Assets and Liabilities in other receivables and other payables and accrued expenses, as applicable.
| Fidelity Freedom 2015 Fund | $12,170 |
| Fidelity Freedom 2020 Fund | 315,673 |
| Fidelity Freedom 2025 Fund | 321,261 |
| Fidelity Freedom 2030 Fund | 323,053 |
| Fidelity Freedom 2035 Fund | 166,577 |
| Fidelity Freedom 2040 Fund | 145,598 |
| Fidelity Freedom 2045 Fund | 128,710 |
| Fidelity Freedom 2050 Fund | 81,342 |
Income Tax Information and Distributions to Shareholders. Each year, each Fund intends to qualify as a regulated investment company under Subchapter M of the Internal Revenue Code, including distributing substantially all of its taxable income and realized gains. As a result, no provision for U.S. Federal income taxes is required. Each Fund files a U.S. federal tax return, in addition to state and local tax returns as required. Each Fund's federal income tax returns are subject to examination by the Internal Revenue Service (IRS) for a period of three fiscal years after they are filed. State and local tax returns may be subject to examination for an additional fiscal year depending on the jurisdiction.
Distributions are declared and recorded on the ex-dividend date. Income and capital gain distributions are declared separately for each class. Income and capital gain distributions are determined in accordance with income tax regulations, which may differ from GAAP.
Capital accounts within the financial statements are adjusted for permanent book-tax differences. These adjustments have no impact on net assets or the results of operations. Capital accounts are not adjusted for temporary book-tax differences which will reverse in a subsequent period.
Book-tax differences are primarily due to the short-term gain distributions from the Underlying Funds, futures contracts, deferred trustees compensation and losses deferred due to wash sales and excise tax regulations.
As of period end, the cost and unrealized appreciation (depreciation) in securities, and derivatives if applicable, for federal income tax purposes were as follows for each Fund:
| | Tax cost | Gross unrealized appreciation | Gross unrealized depreciation | Net unrealized appreciation (depreciation) |
| Fidelity Freedom Income Fund | $2,598,041,661 | $ 44,092,545 | $(237,746,197) | $(193,653,652) |
| Fidelity Freedom 2005 Fund | 834,750,370 | 15,463,976 | (90,104,520) | (74,640,544) |
| Fidelity Freedom 2010 Fund | 4,205,997,014 | 133,109,437 | (459,557,999) | (326,448,562) |
| Fidelity Freedom 2015 Fund | 5,954,083,606 | 260,938,345 | (640,024,404) | (379,086,059) |
| Fidelity Freedom 2020 Fund | 17,860,552,609 | 956,031,776 | (2,052,015,892) | (1,095,984,116) |
| Fidelity Freedom 2025 Fund | 24,110,668,278 | 1,247,463,052 | (3,059,067,795) | (1,811,604,743) |
| Fidelity Freedom 2030 Fund | 31,448,756,129 | 1,736,717,675 | (3,970,712,197) | (2,233,994,522) |
| Fidelity Freedom 2035 Fund | 23,583,550,198 | 1,461,966,988 | (2,958,193,485) | (1,496,226,497) |
| Fidelity Freedom 2040 Fund | 23,220,995,849 | 1,648,726,711 | (2,849,289,483) | (1,200,562,772) |
| Fidelity Freedom 2045 Fund | 15,911,419,306 | 922,982,564 | (2,034,780,713) | (1,111,798,149) |
| Fidelity Freedom 2050 Fund | 14,572,801,088 | 773,888,800 | (1,922,463,735) | (1,148,574,935) |
| Fidelity Freedom 2055 Fund | 8,482,971,163 | 190,593,029 | (1,301,514,241) | (1,110,921,212) |
| Fidelity Freedom 2060 Fund | 3,926,508,366 | 43,212,465 | (717,211,838) | (673,999,373) |
| Fidelity Freedom 2065 Fund | 648,895,193 | 3,084,261 | (142,900,856) | (139,816,595) |
4. Derivative Instruments.
Risk Exposures and the Use of Derivative Instruments. Each Fund's investment objectives allow for various types of derivative instruments, including futures contracts. Derivatives are investments whose value is primarily derived from underlying assets, indices or reference rates and may be transacted on an exchange or over-the-counter (OTC). Derivatives may involve a future commitment to buy or sell a specified asset based on specified terms, to exchange future cash flows at periodic intervals based on a notional principal amount, or for one party to make one or more payments upon the occurrence of specified events in exchange for periodic payments from the other party.
Derivatives were used to increase returns and to manage exposure to certain risks as defined below. The success of any strategy involving derivatives depends on analysis of numerous economic factors, and if the strategies for investment do not work as intended, the objectives may not be achieved.
Derivatives were used to increase or decrease exposure to the following risk(s):
| | |
| Equity Risk | Equity risk relates to the fluctuations in the value of financial instruments as a result of changes in market prices (other than those arising from interest rate risk or foreign exchange risk), whether caused by factors specific to an individual investment, its issuer, or all factors affecting all instruments traded in a market or market segment. |
| Interest Rate Risk | Interest rate risk relates to the fluctuations in the value of interest-bearing securities due to changes in the prevailing levels of market interest rates. |
Funds are also exposed to additional risks from investing in derivatives, such as liquidity risk and counterparty credit risk. Liquidity risk is the risk that a fund will be unable to close out the derivative in the open market in a timely manner. Counterparty credit risk is the risk that the counterparty will not be able to fulfill its obligation to a fund. Counterparty credit risk related to exchange-traded contracts may be mitigated by the protection provided by the exchange on which they trade.
Investing in derivatives may involve greater risks than investing in the underlying assets directly and, to varying degrees, may involve risk of loss in excess of any initial investment and collateral received and amounts recognized in the Statement of Assets and Liabilities. In addition, there may be the risk that the change in value of the derivative contract does not correspond to the change in value of the underlying instrument.
Net Realized Gain (Loss) and Change in Net Unrealized Appreciation (Depreciation) on Derivatives. The table below, which reflects the impacts of derivatives on the financial performance, summarizes the net realized gain (loss) and change in net unrealized appreciation (depreciation) for derivatives during the period as presented in the Statement of Operations.
| Primary Risk Exposure / Derivative Type | Net Realized Gain (Loss) | Change in Net Unrealized Appreciation (Depreciation) |
| Fidelity Freedom Income Fund | | |
| Equity Risk | | |
| Futures Contracts | (202,423) | 410,799 |
| Total Equity Risk | (202,423) | 410,799 |
| Interest Rate Risk | | |
| Futures Contracts | (264,893) | (2,742,299) |
| Total Interest Rate Risk | (264,893) | (2,742,299) |
| Totals | $ (467,316) | $ (2,331,500) |
| Fidelity Freedom 2005 Fund | | |
| Equity Risk | | |
| Futures Contracts | (113,869) | 128,762 |
| Total Equity Risk | (113,869) | 128,762 |
| Interest Rate Risk | | |
| Futures Contracts | (87,041) | (871,477) |
| Total Interest Rate Risk | (87,041) | (871,477) |
| Totals | $ (200,910) | $ (742,715) |
| Fidelity Freedom 2010 Fund | | |
| Equity Risk | | |
| Futures Contracts | (276,677) | 561,899 |
| Total Equity Risk | (276,677) | 561,899 |
| Interest Rate Risk | | |
| Futures Contracts | (478,980) | (4,427,847) |
| Total Interest Rate Risk | (478,980) | (4,427,847) |
| Totals | $ (755,657) | $ (3,865,948) |
| Fidelity Freedom 2015 Fund | | |
| Equity Risk | | |
| Futures Contracts | (660,182) | 1,140,118 |
| Total Equity Risk | (660,182) | 1,140,118 |
| Interest Rate Risk | | |
| Futures Contracts | (746,123) | (6,379,244) |
| Total Interest Rate Risk | (746,123) | (6,379,244) |
| Totals | $ (1,406,305) | $ (5,239,126) |
| Fidelity Freedom 2020 Fund | | |
| Equity Risk | | |
| Futures Contracts | (2,880,903) | 4,462,883 |
| Total Equity Risk | (2,880,903) | 4,462,883 |
| Interest Rate Risk | | |
| Futures Contracts | (2,433,202) | (19,201,817) |
| Total Interest Rate Risk | (2,433,202) | (19,201,817) |
| Totals | $ (5,314,105) | $ (14,738,934) |
| Fidelity Freedom 2025 Fund | | |
| Equity Risk | | |
| Futures Contracts | (4,575,472) | 6,488,579 |
| Total Equity Risk | (4,575,472) | 6,488,579 |
| Interest Rate Risk | | |
| Futures Contracts | (3,278,014) | (25,508,529) |
| Total Interest Rate Risk | (3,278,014) | (25,508,529) |
| Totals | $ (7,853,486) | $ (19,019,950) |
| Fidelity Freedom 2030 Fund | | |
| Equity Risk | | |
| Futures Contracts | (7,248,067) | 9,226,805 |
| Total Equity Risk | (7,248,067) | 9,226,805 |
| Interest Rate Risk | | |
| Futures Contracts | (4,356,513) | (33,353,950) |
| Total Interest Rate Risk | (4,356,513) | (33,353,950) |
| Totals | $ (11,604,580) | $ (24,127,145) |
| Fidelity Freedom 2035 Fund | | |
| Equity Risk | | |
| Futures Contracts | (8,511,168) | 7,980,910 |
| Total Equity Risk | (8,511,168) | 7,980,910 |
| Interest Rate Risk | | |
| Futures Contracts | (3,489,939) | (25,210,015) |
| Total Interest Rate Risk | (3,489,939) | (25,210,015) |
| Totals | $ (12,001,107) | $ (17,229,105) |
| Fidelity Freedom 2040 Fund | | |
| Equity Risk | | |
| Futures Contracts | (12,333,252) | 11,165,222 |
| Total Equity Risk | (12,333,252) | 11,165,222 |
| Interest Rate Risk | | |
| Futures Contracts | (3,814,231) | (25,169,194) |
| Total Interest Rate Risk | (3,814,231) | (25,169,194) |
| Totals | $ (16,147,483) | $ (14,003,972) |
| Fidelity Freedom 2045 Fund | | |
| Equity Risk | | |
| Futures Contracts | (7,977,422) | 6,383,890 |
| Total Equity Risk | (7,977,422) | 6,383,890 |
| Interest Rate Risk | | |
| Futures Contracts | (2,522,005) | (16,898,290) |
| Total Interest Rate Risk | (2,522,005) | (16,898,290) |
| Totals | $ (10,499,427) | $ (10,514,400) |
| Fidelity Freedom 2050 Fund | | |
| Equity Risk | | |
| Futures Contracts | (7,283,701) | 5,854,804 |
| Total Equity Risk | (7,283,701) | 5,854,804 |
| Interest Rate Risk | | |
| Futures Contracts | (2,265,731) | (15,316,260) |
| Total Interest Rate Risk | (2,265,731) | (15,316,260) |
| Totals | $ (9,549,432) | $ (9,461,456) |
| Fidelity Freedom 2055 Fund | | |
| Equity Risk | | |
| Futures Contracts | (3,960,272) | 3,298,556 |
| Total Equity Risk | (3,960,272) | 3,298,556 |
| Interest Rate Risk | | |
| Futures Contracts | (1,201,677) | (8,387,927) |
| Total Interest Rate Risk | (1,201,677) | (8,387,927) |
| Totals | $ (5,161,949) | $ (5,089,371) |
| Fidelity Freedom 2060 Fund | | |
| Equity Risk | | |
| Futures Contracts | (1,819,136) | 1,607,392 |
| Total Equity Risk | (1,819,136) | 1,607,392 |
| Interest Rate Risk | | |
| Futures Contracts | (509,018) | (3,682,124) |
| Total Interest Rate Risk | (509,018) | (3,682,124) |
| Totals | $ (2,328,154) | $ (2,074,732) |
| Fidelity Freedom 2065 Fund | | |
| Equity Risk | | |
| Futures Contracts | (269,532) | 266,527 |
| Total Equity Risk | (269,532) | 266,527 |
| Interest Rate Risk | | |
| Futures Contracts | (69,687) | (562,936) |
| Total Interest Rate Risk | (69,687) | (562,936) |
| Totals | $ (339,219) | $ (296,409) |
If there are any open positions at period end, a summary of the value of derivatives by primary risk exposure is included at the end of the Schedule of Investments.
Futures Contracts. A futures contract is an agreement between two parties to buy or sell a specified underlying instrument for a fixed price at a specified future date. Futures contracts were used to manage exposure to the stock market bond market and fluctuations in interest rates.
Upon entering into a futures contract, a fund is required to deposit either cash or securities (initial margin) with a clearing broker in an amount equal to a certain percentage of the face value of the contract. Futures contracts are marked-to-market daily and subsequent daily payments are made or received by a fund depending on the daily fluctuations in the value of the futures contracts and are recorded as unrealized appreciation or (depreciation). This receivable and/or payable, if any, is included in daily variation margin on futures contracts in the Statement of Assets and Liabilities. Realized gain or (loss) is recorded upon the expiration or closing of a futures contract. The net realized gain (loss) and change in net unrealized appreciation (depreciation) on futures contracts during the period is presented in the Statement of Operations.
Any open futures contracts at period end are presented in the Schedule of Investments under the caption "Futures Contracts". The notional amount at value reflects each contract's exposure to the underlying instrument or index at period end, and is representative of volume of activity during the period unless an average notional amount is presented. Any securities deposited to meet initial margin requirements are identified in the Schedule of Investments. Any cash deposited to meet initial margin requirements is presented as segregated cash with brokers for derivative instruments in the Statement of Assets and Liabilities.
5. Purchases and Sales of Investments.
Purchases and sales of securities, other than short-term securities, U.S. government securities and in-kind transactions, as applicable, are noted in the table below.
| | Purchases ($) | Sales ($) |
| Fidelity Freedom Income Fund | 310,399,328 | 481,737,712 |
| Fidelity Freedom 2005 Fund | 102,793,128 | 163,723,016 |
| Fidelity Freedom 2010 Fund | 496,207,502 | 778,245,592 |
| Fidelity Freedom 2015 Fund | 742,551,475 | 1,255,136,966 |
| Fidelity Freedom 2020 Fund | 2,359,175,197 | 3,830,631,568 |
| Fidelity Freedom 2025 Fund | 3,279,652,184 | 4,308,578,546 |
| Fidelity Freedom 2030 Fund | 4,259,458,895 | 4,453,101,161 |
| Fidelity Freedom 2035 Fund | 3,277,347,988 | 2,928,359,091 |
| Fidelity Freedom 2040 Fund | 3,284,865,047 | 2,869,917,266 |
| Fidelity Freedom 2045 Fund | 2,355,503,506 | 1,856,766,075 |
| Fidelity Freedom 2050 Fund | 2,235,149,774 | 1,593,317,397 |
| Fidelity Freedom 2055 Fund | 1,430,855,198 | 841,553,348 |
| Fidelity Freedom 2060 Fund | 805,557,575 | 327,914,614 |
| Fidelity Freedom 2065 Fund | 212,727,313 | 40,251,496 |
Unaffiliated Redemptions In-Kind. Shares that were redeemed in-kind for investments, including accrued interest and cash, if any, are shown in the table below. The net realized gain or loss on investments delivered through in-kind redemptions is included in the accompanying Statement of Operations. The amount of the in-kind redemptions is included in share transactions in the accompanying Statement of Changes in Net Assets. There was no gain or loss for federal income tax purposes.
| | Shares | Total net realized gain or loss ($) | Total Proceeds ($) | Participating classes |
| Fidelity Freedom Income Fund | 196,495 | 29,923 | 1,963,293 | Class K, Class K6 |
| Fidelity Freedom 2005 Fund | 49,493 | (591) | 521,167 | Class K6 |
| Fidelity Freedom 2010 Fund | 508,976 | 71,958 | 6,478,519 | Class K, Class K6 |
| Fidelity Freedom 2015 Fund | 354,493 | 160,987 | 3,633,402 | Class K, Class K6 |
| Fidelity Freedom 2020 Fund | 1,599,183 | 1,397,183 | 20,213,185 | Class K, Class K6 |
| Fidelity Freedom 2025 Fund | 3,899,217 | 4,061,068 | 45,019,757 | Class K, Class K6 |
| Fidelity Freedom 2030 Fund | 3,674,447 | 6,332,573 | 52,724,322 | Class K, Class K6 |
| Fidelity Freedom 2035 Fund | 3,923,638 | 7,847,196 | 47,917,847 | Class K, Class K6 |
| Fidelity Freedom 2040 Fund | 5,356,804 | 8,981,075 | 45,804,215 | Class K, Class K6 |
| Fidelity Freedom 2045 Fund | 2,902,620 | 6,535,670 | 28,406,310 | Class K, Class K6 |
| Fidelity Freedom 2050 Fund | 2,926,508 | 6,866,481 | 28,980,791 | Class K, Class K6 |
| Fidelity Freedom 2055 Fund | 1,403,975 | 3,472,974 | 16,093,718 | Class K, Class K6 |
| Fidelity Freedom 2060 Fund | 765,123 | 1,409,900 | 8,049,091 | Class K, Class K6 |
| Fidelity Freedom 2065 Fund | 118,946 | 176,669 | 1,143,299 | Class K, Class K6 |
6. Fees and Other Transactions with Affiliates.
Management Fee and Expense Contract. Fidelity Management & Research Company LLC (the investment adviser) and its affiliates provide the Funds with investment management related services. Under the management contract, each Class of each Fund pays a monthly management fee that is set at an annual rate by referring to each Fund's target date, indicated by its name, such that the management fee rate applicable to each Class of each Fund is reduced as the fund approaches, and then passes, its target date. In addition, under the management contract, the investment adviser pays all ordinary operating expenses of each Fund, except fees and expenses of the independent Trustees, and certain miscellaneous expenses such as proxy and shareholder meeting expenses. For each Fund, with the exception of Fidelity Freedom 2065 Fund, the management fee is reduced by an amount equal to the fees and expenses paid by each Fund to the independent Trustees. For the reporting period, the total annual management fee rate for each Class of each Fund was as follows:
| | Annual % of Class-Level Average Net Assets (Fidelity Freedom Class) | Annual % of Class-Level Average Net Assets (Classes K, K6) |
| Fidelity Freedom Income Fund | .465% | .415% |
| Fidelity Freedom 2005 Fund | .465% | .415% |
| Fidelity Freedom 2010 Fund | .491% | .435% |
| Fidelity Freedom 2015 Fund | .533% | .468% |
| Fidelity Freedom 2020 Fund | .576% | .503% |
| Fidelity Freedom 2025 Fund | .618% | .538% |
| Fidelity Freedom 2030 Fund | .661% | .573% |
| Fidelity Freedom 2035 Fund | .703% | .608% |
| Fidelity Freedom 2040 Fund | .746% | .643% |
| Fidelity Freedom 2045 Fund | .746% | .643% |
| Fidelity Freedom 2050 Fund | .746% | .643% |
| Fidelity Freedom 2055 Fund | .746% | .643% |
| Fidelity Freedom 2060 Fund | .746% | .643% |
| Fidelity Freedom 2065 Fund | .746% | .643% |
Under the expense contract, the investment adviser pays class-level expenses for Class K6 of each Fund as necessary so that Class K6 total expenses do not exceed certain amounts of Class K6 average net assets on an annual basis with certain exceptions, as noted in the following table:
| | Annual % of Class-Level Average Net Assets (Class K6) |
| Fidelity Freedom Income Fund | .365% |
| Fidelity Freedom 2005 Fund | .365% |
| Fidelity Freedom 2010 Fund | .377% |
| Fidelity Freedom 2015 Fund | .396% |
| Fidelity Freedom 2020 Fund | .415% |
| Fidelity Freedom 2025 Fund | .435% |
| Fidelity Freedom 2030 Fund | .454% |
| Fidelity Freedom 2035 Fund | .474% |
| Fidelity Freedom 2040 Fund | .493% |
| Fidelity Freedom 2045 Fund | .493% |
| Fidelity Freedom 2050 Fund | .493% |
| Fidelity Freedom 2055 Fund | .493% |
| Fidelity Freedom 2060 Fund | .493% |
| Fidelity Freedom 2065 Fund | .493% |
Interfund Trades. Funds may purchase from or sell securities to other Fidelity Funds under procedures adopted by the Board. The procedures have been designed to ensure these interfund trades are executed in accordance with Rule 17a-7 of the 1940 Act. Any interfund trades are included within the respective purchases and sales amounts shown in the Purchases and Sales of Investments note. During the period, there were no interfund trades.
Reallocation of Underlying Fund Investments. During the period, the investment adviser reallocated investments of the Funds. This involved taxable redemptions of the Funds' interest in Fidelity Series Inflation-Protected Bond Index Fund, ("Underlying Fund") for investments and cash and non-taxable exchanges of those investments and cash for shares of Fidelity Series 0-5 Year Inflation-Protected Bond Index Fund and Fidelity Series 5+ Year Inflation-Protected Bond Index Fund which are affiliated investment companies managed by FMR. Net realized gain (loss) on the redemptions of the Underlying Fund in connection with the reallocation is included in the accompanying Statements of Operations as "Net realized gain (loss) on Affiliated issuers."
Details of these transactions with the net related gain (loss) for the Funds are presented in the accompanying table:
| | Value of Investments and Cash reallocated ($) | Net realized Gain (Loss) on redemptions of Underlying Fund ($) |
| Fidelity Freedom Income Fund | 54,530,724 | 1,668,436 |
| Fidelity Freedom 2005 Fund | 16,551,420 | 508,469 |
| Fidelity Freedom 2010 Fund | 72,531,100 | 2,283,284 |
| Fidelity Freedom 2015 Fund | 89,345,554 | 2,894,801 |
| Fidelity Freedom 2020 Fund | 221,369,551 | 7,067,489 |
| Fidelity Freedom 2025 Fund | 235,123,384 | 7,726,440 |
| Fidelity Freedom 2030 Fund | 220,978,796 | 7,962,148 |
Prior Fiscal Year Reallocation of Underlying Fund Investments. During the prior period, the investment adviser reallocated investments of the Funds. This involved taxable redemptions of the Funds' interest in Fidelity Series Inflation-Protected Bond Index Fund, ("Underlying Fund") for investments and cash and non-taxable exchanges of those investments and cash for shares of Fidelity Series 0-5 Year Inflation-Protected Bond Index Fund and Fidelity Series 5+ Year Inflation-Protected Bond Index Fund which are affiliated investment companies managed by FMR. Net realized gain (loss) on the redemptions of the Underlying Fund in connection with the reallocation is included in the accompanying Statements of Net Assets.
Details of these transactions with the net related gain (loss) for the Funds are presented in the accompanying table:
| | Value of Investments and Cash reallocated ($) | Net realized Gain (Loss) on redemptions of Underlying Fund ($) |
| Fidelity Freedom Income Fund | 250,821,171 | 24,603,804 |
| Fidelity Freedom 2005 Fund | 74,082,513 | 6,544,098 |
| Fidelity Freedom 2010 Fund | 335,213,796 | 31,210,825 |
| Fidelity Freedom 2015 Fund | 427,651,235 | 38,619,356 |
| Fidelity Freedom 2020 Fund | 1,099,689,093 | 96,828,036 |
| Fidelity Freedom 2025 Fund | 1,205,199,986 | 86,145,299 |
| Fidelity Freedom 2030 Fund | 1,200,095,146 | 71,446,057 |
| Fidelity Freedom 2035 Fund | 248,686,136 | 16,792,714 |
| Fidelity Freedom 2040 Fund | 309,932,637 | 22,435,835 |
| Fidelity Freedom 2045 Fund | 203,889,206 | 14,311,889 |
| Fidelity Freedom 2050 Fund | 181,324,282 | 12,387,316 |
| Fidelity Freedom 2055 Fund | 94,965,361 | 5,715,892 |
| Fidelity Freedom 2060 Fund | 37,533,221 | 1,930,411 |
| Fidelity Freedom 2065 Fund | 3,812,883 | 95,641 |
7. Expense Reductions.
Through arrangements with each applicable Fund's custodian and each class' transfer agent, credits realized as a result of certain uninvested cash balances were used to reduce each applicable Fund's or class' expenses. All of the applicable expense reductions are noted in the table below.
| | Custodian credits | Transfer Agent credits |
| Fidelity Freedom Income Fund | $ 6 | |
| Class K | | $34 |
| Class K6 | | 14 |
| Fidelity Freedom 2005 Fund | 15 | |
| Class K | | 39 |
| Class K6 | | 16 |
| Fidelity Freedom 2010 Fund | 4 | |
| Class K | | 28 |
| Class K6 | | 10 |
| Fidelity Freedom 2015 Fund | 3 | |
| Class K | | 34 |
| Class K6 | | 14 |
| Fidelity Freedom 2020 Fund | 2 | |
| Class K | | 42 |
| Class K6 | | 16 |
| Fidelity Freedom 2025 Fund | 1 | |
| Class K | | 49 |
| Class K6 | | 22 |
| Fidelity Freedom 2030 Fund | - | |
| Class K | | 49 |
| Class K6 | | 22 |
| Fidelity Freedom 2035 Fund | 1 | |
| Class K | | 50 |
| Class K6 | | 26 |
| Fidelity Freedom 2040 Fund | 3 | |
| Class K | | 51 |
| Class K6 | | 25 |
| Fidelity Freedom 2045 Fund | 2 | |
| Fidelity Freedom 2045 Fund | | 33 |
| Class K | | 55 |
| Class K6 | | 29 |
| Fidelity Freedom 2050 Fund | 2 | |
| Fidelity Freedom 2050 Fund | | 14 |
| Class K | | 58 |
| Class K6 | | 29 |
| Fidelity Freedom 2055 Fund | 3 | |
| Fidelity Freedom 2055 Fund | | 35 |
| Class K | | 61 |
| Class K6 | | 30 |
| Fidelity Freedom 2060 Fund | 3 | |
| Fidelity Freedom 2060 Fund | | 35 |
| Class K | | 62 |
| Class K6 | | 32 |
| Fidelity Freedom 2065 Fund | 20 | |
| Fidelity Freedom 2065 Fund | | 40 |
| Class K | | 58 |
| Class K6 | | 35 |
8. Distributions to Shareholders.
Distributions to shareholders of each class were as follows:
| | Six months ended September 30, 2022 | Year ended March 31, 2022 |
| Fidelity Freedom Income Fund | | |
| Distributions to shareholders | | |
| Fidelity Freedom Income Fund | $ 47,123,364 | $118,991,291 |
| Class K | 19,663,673 | 53,741,112 |
| Class K6 | 7,351,157 | 16,730,089 |
Total | $ 74,138,194 | $ 189,462,492 |
| Fidelity Freedom 2005 Fund | | |
| Distributions to shareholders | | |
| Fidelity Freedom 2005 Fund | $ 14,091,842 | $ 43,610,827 |
| Class K | 7,256,852 | 22,894,594 |
| Class K6 | 2,666,617 | 6,924,355 |
Total | $ 24,015,311 | $ 73,429,776 |
| Fidelity Freedom 2010 Fund | | |
| Distributions to shareholders | | |
| Fidelity Freedom 2010 Fund | $ 114,926,543 | $ 330,780,379 |
| Class K | 36,255,422 | 111,484,456 |
| Class K6 | 11,570,865 | 30,101,828 |
Total | $ 162,752,830 | $ 472,366,663 |
| Fidelity Freedom 2015 Fund | | |
| Distributions to shareholders | | |
| Fidelity Freedom 2015 Fund | $ 186,845,898 | $ 503,185,276 |
| Class K | 80,776,036 | 233,539,531 |
| Class K6 | 28,939,637 | 72,053,293 |
Total | $ 296,561,571 | $ 808,778,100 |
| Fidelity Freedom 2020 Fund | | |
| Distributions to shareholders | | |
| Fidelity Freedom 2020 Fund | $ 594,158,401 | $1,497,733,718 |
| Class K | 365,411,734 | 1,021,296,577 |
| Class K6 | 126,921,463 | 285,901,662 |
Total | $1,086,491,598 | $2,804,931,957 |
| Fidelity Freedom 2025 Fund | | |
| Distributions to shareholders | | |
| Fidelity Freedom 2025 Fund | $ 644,524,569 | $1,390,020,443 |
| Class K | 537,793,340 | 1,249,727,943 |
| Class K6 | 214,334,317 | 416,296,775 |
Total | $1,396,652,226 | $3,056,045,161 |
| Fidelity Freedom 2030 Fund | | |
| Distributions to shareholders | | |
| Fidelity Freedom 2030 Fund | $ 850,192,243 | $1,815,146,825 |
| Class K | 727,862,642 | 1,663,191,130 |
| Class K6 | 293,264,786 | 545,676,455 |
Total | $1,871,319,671 | $4,024,014,410 |
| Fidelity Freedom 2035 Fund | | |
| Distributions to shareholders | | |
| Fidelity Freedom 2035 Fund | $ 682,153,383 | $1,330,916,494 |
| Class K | 648,549,602 | 1,359,767,518 |
| Class K6 | 286,483,699 | 496,297,314 |
Total | $1,617,186,684 | $3,186,981,326 |
| Fidelity Freedom 2040 Fund | | |
| Distributions to shareholders | | |
| Fidelity Freedom 2040 Fund | $ 782,478,583 | $1,408,661,493 |
| Class K | 745,946,852 | 1,440,225,207 |
| Class K6 | 328,248,612 | 513,441,595 |
Total | $1,856,674,047 | $3,362,328,295 |
| Fidelity Freedom 2045 Fund | | |
| Distributions to shareholders | | |
| Fidelity Freedom 2045 Fund | $ 436,595,416 | $ 784,616,906 |
| Class K | 532,714,598 | 1,029,356,352 |
| Class K6 | 244,712,280 | 383,909,808 |
Total | $1,214,022,294 | $2,197,883,066 |
| Fidelity Freedom 2050 Fund | | |
| Distributions to shareholders | | |
| Fidelity Freedom 2050 Fund | $ 365,264,151 | $ 652,636,167 |
| Class K | 492,618,131 | 942,334,414 |
| Class K6 | 213,025,037 | 321,954,203 |
Total | $1,070,907,319 | $1,916,924,784 |
| Fidelity Freedom 2055 Fund | | |
| Distributions to shareholders | | |
| Fidelity Freedom 2055 Fund | $ 173,068,983 | $ 296,345,760 |
| Class K | 269,164,840 | 491,336,374 |
| Class K6 | 114,292,065 | 164,295,822 |
Total | $ 556,525,888 | $ 951,977,956 |
| Fidelity Freedom 2060 Fund | | |
| Distributions to shareholders | | |
| Fidelity Freedom 2060 Fund | $ 63,891,453 | $ 99,642,740 |
| Class K | 107,256,385 | 178,794,880 |
| Class K6 | 46,870,366 | 60,031,062 |
Total | $ 218,018,204 | $ 338,468,682 |
| Fidelity Freedom 2065 Fund | | |
| Distributions to shareholders | | |
| Fidelity Freedom 2065 Fund | $ 7,266,663 | $ 8,437,371 |
| Class K | 10,578,027 | 12,631,428 |
| Class K6 | 5,588,427 | 5,445,584 |
Total | $ 23,433,117 | $ 26,514,383 |
9. Share Transactions.
Share transactions for each class were as follows and may contain in-kind transactions, automatic conversions between classes or exchanges between affiliated funds:
| | Shares | Shares | Dollars | Dollars |
| | Six months ended September 30, 2022 | Year ended March 31, 2022 | Six months ended September 30, 2022 | Year ended March 31, 2022 |
| Fidelity Freedom Income Fund | | | | |
| Fidelity Freedom Income Fund | | | | |
| Shares sold | 6,233,233 | 22,119,285 | $ 66,143,590 | $ 267,213,144 |
| Reinvestment of distributions | 4,317,204 | 9,637,846 | 45,763,195 | 115,877,879 |
| Shares redeemed | (18,153,253) | (35,979,473) | (192,261,746) | (433,357,462) |
| Net increase (decrease) | (7,602,816) | (4,222,342) | $(80,354,961) | $(50,266,439) |
| Class K | | | | |
| Shares sold | 5,635,907 | 16,680,046 | $ 59,648,724 | $ 200,717,690 |
| Reinvestment of distributions | 1,857,147 | 4,472,952 | 19,650,000 | 53,703,106 |
| Shares redeemed | (14,513,760) | (38,281,310) | (153,584,087) | (462,940,655) |
| Net increase (decrease) | (7,020,706) | (17,128,312) | $(74,285,363) | $(208,519,859) |
| Class K6 | | | | |
| Shares sold | 5,419,044 | 13,137,196 | $ 57,167,194 | $ 158,945,851 |
| Reinvestment of distributions | 695,417 | 1,395,523 | 7,351,157 | 16,730,089 |
| Shares redeemed | (4,246,093) | (10,427,151) | (44,658,299) | (126,008,091) |
| Net increase (decrease) | 1,868,368 | 4,105,568 | $ 19,860,052 | $ 49,667,849 |
| Fidelity Freedom 2005 Fund | | | | |
| Fidelity Freedom 2005 Fund | | | | |
| Shares sold | 1,955,343 | 4,884,825 | $ 21,888,065 | $ 63,417,362 |
| Reinvestment of distributions | 1,236,327 | 3,373,635 | 13,809,781 | 42,938,081 |
| Shares redeemed | (5,803,519) | (10,902,120) | (65,108,386) | (141,393,321) |
| Net increase (decrease) | (2,611,849) | (2,643,660) | $(29,410,540) | $(35,037,878) |
| Class K | | | | |
| Shares sold | 2,472,525 | 7,655,725 | $ 27,688,363 | $ 98,017,800 |
| Reinvestment of distributions | 650,839 | 1,801,026 | 7,256,852 | 22,894,594 |
| Shares redeemed | (5,437,411) | (13,304,194) | (61,089,800) | (172,074,021) |
| Net increase (decrease) | (2,314,047) | (3,847,443) | $(26,144,585) | $(51,161,627) |
| Class K6 | | | | |
| Shares sold | 2,431,739 | 4,791,804 | $ 27,229,305 | $ 61,935,555 |
| Reinvestment of distributions | 240,020 | 547,203 | 2,666,617 | 6,924,355 |
| Shares redeemed | (2,105,283) | (4,293,740) | (23,374,474) | (55,674,250) |
| Net increase (decrease) | 566,476 | 1,045,267 | $ 6,521,448 | $ 13,185,660 |
| Fidelity Freedom 2010 Fund | | | | |
| Fidelity Freedom 2010 Fund | | | | |
| Shares sold | 4,790,903 | 11,443,611 | $ 65,559,036 | $ 185,302,616 |
| Reinvestment of distributions | 8,226,583 | 20,338,393 | 112,128,327 | 323,454,735 |
| Shares redeemed | (20,669,305) | (37,100,208) | (281,657,104) | (599,475,508) |
| Net increase (decrease) | (7,651,819) | (5,318,204) | $(103,969,741) | $(90,718,157) |
| Class K | | | | |
| Shares sold | 4,091,171 | 12,207,765 | $ 55,913,170 | $ 196,166,118 |
| Reinvestment of distributions | 2,659,972 | 7,009,249 | 36,255,422 | 111,484,456 |
| Shares redeemed | (13,706,720) | (34,740,922) | (187,675,931) | (564,437,012) |
| Net increase (decrease) | (6,955,577) | (15,523,908) | $(95,507,339) | $(256,786,438) |
| Class K6 | | | | |
| Shares sold | 4,169,515 | 9,752,068 | $ 56,820,392 | $ 156,988,522 |
| Reinvestment of distributions | 853,309 | 1,904,870 | 11,570,865 | 30,101,828 |
| Shares redeemed | (4,109,726) | (9,083,534) | (55,348,611) | (146,481,634) |
| Net increase (decrease) | 913,098 | 2,573,404 | $ 13,042,646 | $ 40,608,716 |
| Fidelity Freedom 2015 Fund | | | | |
| Fidelity Freedom 2015 Fund | | | | |
| Shares sold | 9,948,914 | 31,636,405 | $ 110,743,352 | $ 426,444,682 |
| Reinvestment of distributions | 16,467,878 | 37,389,668 | 182,299,149 | 493,791,207 |
| Shares redeemed | (40,593,848) | (70,309,859) | (450,270,092) | (943,909,675) |
| Net increase (decrease) | (14,177,056) | (1,283,786) | $(157,227,591) | $(23,673,786) |
| Class K | | | | |
| Shares sold | 8,699,064 | 28,366,240 | $ 96,564,847 | $ 378,836,651 |
| Reinvestment of distributions | 7,310,049 | 17,696,986 | 80,776,036 | 233,539,531 |
| Shares redeemed | (34,322,982) | (74,854,158) | (380,938,636) | (1,011,157,920) |
| Net increase (decrease) | (18,313,869) | (28,790,932) | $(203,597,753) | $(398,781,738) |
| Class K6 | | | | |
| Shares sold | 11,175,417 | 21,362,273 | $ 123,840,889 | $ 288,820,573 |
| Reinvestment of distributions | 2,628,487 | 5,487,844 | 28,939,637 | 72,053,293 |
| Shares redeemed | (10,363,552) | (27,510,463) | (112,791,787) | (373,079,287) |
| Net increase (decrease) | 3,440,352 | (660,346) | $ 39,988,739 | $(12,205,421) |
| Fidelity Freedom 2020 Fund | | | | |
| Fidelity Freedom 2020 Fund | | | | |
| Shares sold | 34,119,682 | 100,889,192 | $ 475,083,896 | $1,740,420,595 |
| Reinvestment of distributions | 41,553,244 | 86,630,804 | 573,434,750 | 1,460,883,797 |
| Shares redeemed | (94,298,124) | (179,040,643) | (1,305,378,149) | (3,071,539,860) |
| Net increase (decrease) | (18,625,198) | 8,479,353 | $(256,859,503) | $ 129,764,532 |
| Class K | | | | |
| Shares sold | 25,201,308 | 79,327,683 | $ 350,047,917 | $1,358,428,900 |
| Reinvestment of distributions | 26,476,036 | 60,534,219 | 365,369,302 | 1,021,184,649 |
| Shares redeemed | (100,359,726) | (250,445,089) | (1,390,867,637) | (4,330,562,063) |
| Net increase (decrease) | (48,682,382) | (110,583,187) | $(675,450,418) | $(1,950,948,514) |
| Class K6 | | | | |
| Shares sold | 33,858,904 | 65,420,870 | $ 471,482,600 | $1,127,778,622 |
| Reinvestment of distributions | 9,237,370 | 17,045,976 | 126,921,463 | 285,901,662 |
| Shares redeemed | (29,239,724) | (80,065,800) | (397,806,156) | (1,392,055,913) |
| Net increase (decrease) | 13,856,550 | 2,401,046 | $ 200,597,907 | $ 21,624,371 |
| Fidelity Freedom 2025 Fund | | | | |
| Fidelity Freedom 2025 Fund | | | | |
| Shares sold | 57,516,418 | 165,275,251 | $ 732,776,393 | $2,610,131,603 |
| Reinvestment of distributions | 49,492,653 | 88,008,649 | 627,566,833 | 1,365,336,639 |
| Shares redeemed | (104,141,665) | (205,066,644) | (1,322,776,416) | (3,225,566,161) |
| Net increase (decrease) | 2,867,406 | 48,217,256 | $ 37,566,810 | $ 749,902,081 |
| Class K | | | | |
| Shares sold | 55,846,046 | 159,149,482 | $ 710,453,391 | $2,498,462,611 |
| Reinvestment of distributions | 42,468,622 | 80,648,053 | 537,652,752 | 1,249,414,473 |
| Shares redeemed | (144,831,699) | (343,733,044) | (1,838,258,986) | (5,441,416,390) |
| Net increase (decrease) | (46,517,031) | (103,935,509) | $(590,152,843) | $(1,693,539,306) |
| Class K6 | | | | |
| Shares sold | 62,721,596 | 113,877,509 | $ 796,384,034 | $1,791,545,487 |
| Reinvestment of distributions | 16,970,255 | 26,968,555 | 214,334,317 | 416,296,775 |
| Shares redeemed | (45,804,996) | (120,631,642) | (571,422,259) | (1,916,410,633) |
| Net increase (decrease) | 33,886,855 | 20,214,422 | $ 439,296,092 | $ 291,431,629 |
| Fidelity Freedom 2030 Fund | | | | |
| Fidelity Freedom 2030 Fund | | | | |
| Shares sold | 51,899,027 | 133,595,046 | $ 827,049,712 | $2,654,181,525 |
| Reinvestment of distributions | 52,637,032 | 91,762,119 | 832,717,851 | 1,788,110,990 |
| Shares redeemed | (77,018,432) | (152,007,544) | (1,219,025,063) | (3,008,304,048) |
| Net increase (decrease) | 27,517,627 | 73,349,621 | $ 440,742,500 | $1,433,988,467 |
| Class K | | | | |
| Shares sold | 58,150,840 | 142,180,700 | $ 923,331,427 | $2,805,538,559 |
| Reinvestment of distributions | 46,028,613 | 85,379,317 | 727,712,374 | 1,662,884,419 |
| Shares redeemed | (119,848,675) | (300,736,782) | (1,899,461,477) | (5,999,095,370) |
| Net increase (decrease) | (15,669,222) | (73,176,765) | $(248,417,676) | $(1,530,672,392) |
| Class K6 | | | | |
| Shares sold | 66,192,525 | 118,508,960 | $1,053,128,377 | $2,343,787,146 |
| Reinvestment of distributions | 18,608,172 | 28,137,244 | 293,264,786 | 545,676,455 |
| Shares redeemed | (33,644,176) | (97,990,956) | (521,922,531) | (1,959,803,476) |
| Net increase (decrease) | 51,156,521 | 48,655,248 | $ 824,470,632 | $ 929,660,125 |
| Fidelity Freedom 2035 Fund | | | | |
| Fidelity Freedom 2035 Fund | | | | |
| Shares sold | 52,175,687 | 113,455,720 | $ 712,599,515 | $1,968,630,651 |
| Reinvestment of distributions | 49,215,159 | 77,128,510 | 669,818,320 | 1,315,370,749 |
| Shares redeemed | (53,540,206) | (119,246,911) | (729,036,851) | (2,068,492,213) |
| Net increase (decrease) | 47,850,640 | 71,337,319 | $ 653,380,984 | $1,215,509,187 |
| Class K | | | | |
| Shares sold | 61,854,218 | 138,509,224 | $ 844,658,912 | $2,391,096,357 |
| Reinvestment of distributions | 47,684,036 | 79,808,534 | 648,502,850 | 1,359,680,905 |
| Shares redeemed | (110,576,854) | (265,777,119) | (1,513,900,355) | (4,649,995,558) |
| Net increase (decrease) | (1,038,600) | (47,459,361) | $(20,738,593) | $(899,218,296) |
| Class K6 | | | | |
| Shares sold | 67,928,719 | 108,871,298 | $ 924,976,905 | $1,885,798,374 |
| Reinvestment of distributions | 21,127,116 | 29,216,531 | 286,483,699 | 496,297,314 |
| Shares redeemed | (30,823,530) | (93,333,642) | (409,874,015) | (1,638,673,084) |
| Net increase (decrease) | 58,232,305 | 44,754,187 | $ 801,586,589 | $ 743,422,604 |
| Fidelity Freedom 2040 Fund | | | | |
| Fidelity Freedom 2040 Fund | | | | |
| Shares sold | 65,868,064 | 144,914,050 | $ 634,685,710 | $1,808,070,884 |
| Reinvestment of distributions | 79,717,572 | 113,389,482 | 767,680,220 | 1,388,923,509 |
| Shares redeemed | (70,405,127) | (157,003,598) | (678,550,066) | (1,957,034,768) |
| Net increase (decrease) | 75,180,509 | 101,299,934 | $ 723,815,864 | $1,239,959,625 |
| Class K | | | | |
| Shares sold | 81,993,320 | 177,104,925 | $ 792,406,813 | $2,197,442,572 |
| Reinvestment of distributions | 77,459,334 | 117,577,057 | 745,933,382 | 1,440,201,658 |
| Shares redeemed | (146,719,648) | (377,794,576) | (1,416,155,181) | (4,755,909,005) |
| Net increase (decrease) | 12,733,006 | (83,112,594) | $ 122,185,014 | $(1,118,264,775) |
| Class K6 | | | | |
| Shares sold | 95,695,517 | 163,741,876 | $ 924,049,135 | $2,038,251,213 |
| Reinvestment of distributions | 34,228,218 | 42,115,101 | 328,248,612 | 513,441,595 |
| Shares redeemed | (41,003,113) | (125,083,975) | (384,158,367) | (1,575,864,464) |
| Net increase (decrease) | 88,920,622 | 80,773,002 | $ 868,139,380 | $ 975,828,344 |
| Fidelity Freedom 2045 Fund | | | | |
| Fidelity Freedom 2045 Fund | | | | |
| Shares sold | 45,860,108 | 91,104,445 | $ 506,766,550 | $1,299,799,946 |
| Reinvestment of distributions | 38,802,853 | 55,188,275 | 428,383,490 | 774,085,743 |
| Shares redeemed | (38,076,334) | (92,060,326) | (421,445,298) | (1,316,821,262) |
| Net increase (decrease) | 46,586,627 | 54,232,394 | $ 513,704,742 | $ 757,064,427 |
| Class K | | | | |
| Shares sold | 62,486,582 | 129,603,483 | $ 690,599,704 | $1,839,866,004 |
| Reinvestment of distributions | 48,294,367 | 73,437,119 | 532,686,864 | 1,029,308,656 |
| Shares redeemed | (99,481,292) | (238,834,004) | (1,105,716,962) | (3,442,233,635) |
| Net increase (decrease) | 11,299,657 | (35,793,402) | $ 117,569,606 | $ (573,058,975) |
| Class K6 | | | | |
| Shares sold | 68,231,072 | 109,099,983 | $ 751,824,195 | $1,553,372,462 |
| Reinvestment of distributions | 22,266,813 | 27,517,155 | 244,712,280 | 383,909,808 |
| Shares redeemed | (27,240,811) | (89,870,054) | (293,487,810) | (1,298,126,989) |
| Net increase (decrease) | 63,257,074 | 46,747,084 | $ 703,048,665 | $ 639,155,281 |
| Fidelity Freedom 2050 Fund | | | | |
| Fidelity Freedom 2050 Fund | | | | |
| Shares sold | 45,676,991 | 83,090,795 | $ 510,434,340 | $1,195,087,164 |
| Reinvestment of distributions | 32,045,815 | 45,388,770 | 357,631,298 | 642,458,392 |
| Shares redeemed | (33,758,371) | (82,022,643) | (376,897,939) | (1,182,000,294) |
| Net increase (decrease) | 43,964,435 | 46,456,922 | $ 491,167,699 | $ 655,545,262 |
| Class K | | | | |
| Shares sold | 62,837,590 | 125,609,161 | $ 700,876,374 | $1,799,974,225 |
| Reinvestment of distributions | 44,179,914 | 66,634,241 | 492,606,037 | 942,315,016 |
| Shares redeemed | (89,219,078) | (213,468,368) | (998,974,573) | (3,096,075,637) |
| Net increase (decrease) | 17,798,426 | (21,224,966) | $ 194,507,838 | $(353,786,396) |
| Class K6 | | | | |
| Shares sold | 65,843,762 | 103,765,008 | $ 734,073,143 | $1,488,418,420 |
| Reinvestment of distributions | 19,139,716 | 22,812,162 | 213,025,037 | 321,954,203 |
| Shares redeemed | (24,100,710) | (76,162,066) | (262,559,491) | (1,112,911,369) |
| Net increase (decrease) | 60,882,768 | 50,415,104 | $ 684,538,689 | $ 697,461,254 |
| Fidelity Freedom 2055 Fund | | | | |
| Fidelity Freedom 2055 Fund | | | | |
| Shares sold | 29,092,846 | 48,944,593 | $ 375,820,750 | $ 809,607,355 |
| Reinvestment of distributions | 13,066,534 | 17,819,643 | 168,688,945 | 290,755,908 |
| Shares redeemed | (16,538,663) | (42,105,665) | (213,502,862) | (698,242,837) |
| Net increase (decrease) | 25,620,717 | 24,658,571 | $ 331,006,833 | $ 402,120,426 |
| Class K | | | | |
| Shares sold | 42,477,958 | 78,791,763 | $ 547,525,126 | $1,300,207,031 |
| Reinvestment of distributions | 20,848,786 | 30,116,057 | 269,157,830 | 491,325,051 |
| Shares redeemed | (48,575,567) | (101,055,238) | (630,024,804) | (1,685,810,073) |
| Net increase (decrease) | 14,751,177 | 7,852,582 | $ 186,658,152 | $ 105,722,009 |
| Class K6 | | | | |
| Shares sold | 38,381,677 | 53,056,696 | $ 492,980,639 | $ 875,120,349 |
| Reinvestment of distributions | 8,866,723 | 10,089,839 | 114,292,065 | 164,295,821 |
| Shares redeemed | (13,049,477) | (37,974,925) | (165,405,355) | (638,190,211) |
| Net increase (decrease) | 34,198,923 | 25,171,610 | $ 441,867,349 | $ 401,225,959 |
| Fidelity Freedom 2060 Fund | | | | |
| Fidelity Freedom 2060 Fund | | | | |
| Shares sold | 18,907,344 | 30,895,112 | $ 223,478,826 | $ 464,438,162 |
| Reinvestment of distributions | 5,246,482 | 6,541,056 | 62,170,814 | 97,295,738 |
| Shares redeemed | (8,557,084) | (20,384,158) | (101,346,277) | (307,750,600) |
| Net increase (decrease) | 15,596,742 | 17,052,010 | $ 184,303,363 | $ 253,983,300 |
| Class K | | | | |
| Shares sold | 30,532,574 | 52,258,699 | $ 360,143,497 | $ 783,831,053 |
| Reinvestment of distributions | 9,050,821 | 12,027,251 | 107,252,227 | 178,787,491 |
| Shares redeemed | (24,768,579) | (48,018,862) | (292,852,997) | (726,660,382) |
| Net increase (decrease) | 14,814,816 | 16,267,088 | $ 174,542,727 | $ 235,958,162 |
| Class K6 | | | | |
| Shares sold | 24,235,537 | 31,341,471 | $ 285,703,570 | $ 469,274,638 |
| Reinvestment of distributions | 3,958,646 | 4,041,952 | 46,870,366 | 60,031,061 |
| Shares redeemed | (6,627,653) | (17,051,658) | (77,260,669) | (259,770,406) |
| Net increase (decrease) | 21,566,530 | 18,331,765 | $ 255,313,267 | $ 269,535,293 |
| Fidelity Freedom 2065 Fund | | | | |
| Fidelity Freedom 2065 Fund | | | | |
| Shares sold | 6,254,127 | 8,615,473 | $ 67,041,362 | $ 115,509,722 |
| Reinvestment of distributions | 648,604 | 613,946 | 7,004,921 | 8,202,794 |
| Shares redeemed | (1,688,849) | (3,035,183) | (18,072,850) | (40,814,756) |
| Net increase (decrease) | 5,213,882 | 6,194,236 | $ 55,973,433 | $ 82,897,760 |
| Class K | | | | |
| Shares sold | 9,774,705 | 14,515,549 | $ 104,733,345 | $ 194,247,222 |
| Reinvestment of distributions | 978,541 | 944,722 | 10,578,027 | 12,631,427 |
| Shares redeemed | (4,653,847) | (7,097,895) | (50,063,071) | (95,900,283) |
| Net increase (decrease) | 6,099,399 | 8,362,376 | $ 65,248,301 | $ 110,978,366 |
| Class K6 | | | | |
| Shares sold | 6,838,691 | 7,203,870 | $ 73,411,722 | $ 96,427,860 |
| Reinvestment of distributions | 516,014 | 406,566 | 5,588,427 | 5,445,584 |
| Shares redeemed | (1,563,403) | (2,468,943) | (16,677,653) | (33,301,760) |
| Net increase (decrease) | 5,791,302 | 5,141,493 | $ 62,322,496 | $ 68,571,684 |
10. Other.
A fund's organizational documents provide former and current trustees and officers with a limited indemnification against liabilities arising in connection with the performance of their duties to the fund. In the normal course of business, a fund may also enter into contracts that provide general indemnifications. A fund's maximum exposure under these arrangements is unknown as this would be dependent on future claims that may be made against a fund. The risk of material loss from such claims is considered remote.
Funds do not invest in underlying mutual funds for the purpose of exercising management or control; however, investments by funds within their principal investment strategies may represent a significant portion of the underlying mutual fund's net assets. At the end of the period, certain Funds were the owners of record of 10% or more of the total outstanding shares of the following underlying mutual funds as shown below.
| Fund | Fidelity Freedom 2020 Fund | Fidelity Freedom 2025 Fund | Fidelity Freedom 2030 Fund | Fidelity Freedom 2035 Fund | Fidelity Freedom 2040 Fund | Fidelity Freedom 2045 Fund | Fidelity Freedom 2050 Fund |
| Fidelity Series 5+ Year Inflation-Protected Bond Index Fund | 17% | 21% | 13% | -% | -% | -% | -% |
| Fidelity Series All-Sector Equity Fund | -% | -% | 13% | 12% | 15% | 10% | -% |
| Fidelity Series Blue Chip Growth Fund | -% | -% | 13% | 12% | 14% | -% | -% |
| Fidelity Series Canada Fund | -% | -% | 13% | 12% | 14% | -% | -% |
| Fidelity Series Commodity Strategy Fund | -% | 11% | 14% | 10% | 11% | -% | -% |
| Fidelity Series Emerging Markets Debt Fund | -% | 11% | 14% | 11% | 11% | -% | -% |
| Fidelity Series Emerging Markets Debt Local Currency Fund | -% | 11% | 14% | 11% | 11% | -% | -% |
| Fidelity Series Emerging Markets Fund | -% | -% | 13% | 11% | 13% | -% | -% |
| Fidelity Series Emerging Markets Opportunities Fund | -% | -% | 13% | 11% | 13% | -% | -% |
| Fidelity Series Floating Rate High Income Fund | -% | 11% | 14% | 10% | 11% | -% | -% |
| Fidelity Series Growth Company Fund | -% | -% | 15% | 14% | 17% | 12% | 11% |
| Fidelity Series High Income Fund | -% | 11% | 14% | 11% | 11% | -% | -% |
| Fidelity Series International Credit Fund | 18% | 15% | 15% | -% | -% | -% | -% |
| Fidelity Series International Developed Markets Bond Index Fund | -% | 11% | 14% | -% | -% | -% | -% |
| Fidelity Series International Growth Fund | -% | -% | 13% | 12% | 14% | -% | -% |
| Fidelity Series International Small Cap Fund | -% | -% | 13% | 12% | 14% | -% | -% |
| Fidelity Series International Value Fund | -% | -% | 13% | 12% | 14% | -% | -% |
| Fidelity Series Intrinsic Opportunities Fund | -% | 10% | 15% | 14% | 17% | 12% | 11% |
| Fidelity Series Investment Grade Bond Fund | 15% | 18% | 21% | -% | -% | -% | -% |
| Fidelity Series Large Cap Stock Fund | -% | -% | 13% | 12% | 14% | -% | -% |
| Fidelity Series Large Cap Value Index Fund | -% | -% | 10% | -% | 12% | -% | -% |
| Fidelity Series Long-Term Treasury Bond Index Fund | -% | -% | 10% | -% | -% | -% | -% |
| Fidelity Series Opportunistic Insights Fund | -% | -% | 13% | 13% | 15% | 10% | -% |
| Fidelity Series Overseas Fund | -% | -% | 13% | 12% | 14% | -% | -% |
| Fidelity Series Real Estate Income Fund | -% | 11% | 14% | 10% | 10% | -% | -% |
| Fidelity Series Small Cap Discovery Fund | -% | -% | 15% | 14% | 17% | 12% | 11% |
| Fidelity Series Small Cap Opportunities Fund | -% | -% | 12% | 12% | 14% | -% | -% |
| Fidelity Series Stock Selector Large Cap Value Fund | -% | -% | 13% | 13% | 15% | 10% | -% |
| Fidelity Series Value Discovery Fund | -% | -% | 12% | 12% | 14% | -% | -% |
The Funds, in aggregate, were the owners of record of more than 20% of the total outstanding shares of the following underlying mutual funds.
| Fund | % of shares held |
| Fidelity Series 0-5 Year Inflation-Protected Bond Index Fund | 30% |
| Fidelity Series 5+ Year Inflation-Protected Bond Index Fund | 58% |
| Fidelity Series All-Sector Equity Fund | 84% |
| Fidelity Series Blue Chip Growth Fund | 82% |
| Fidelity Series Canada Fund | 81% |
| Fidelity Series Commodity Strategy Fund | 80% |
| Fidelity Series Emerging Markets Debt Fund | 79% |
| Fidelity Series Emerging Markets Debt Local Currency Fund | 79% |
| Fidelity Series Emerging Markets Fund | 80% |
| Fidelity Series Emerging Markets Opportunities Fund | 81% |
| Fidelity Series Floating Rate High Income Fund | 78% |
| Fidelity Series Government Money Market Fund | 49% |
| Fidelity Series Growth Company Fund | 96% |
| Fidelity Series High Income Fund | 79% |
| Fidelity Series International Credit Fund | 91% |
| Fidelity Series International Developed Markets Bond Index Fund | 47% |
| Fidelity Series International Growth Fund | 82% |
| Fidelity Series International Small Cap Fund | 81% |
| Fidelity Series International Value Fund | 82% |
| Fidelity Series Intrinsic Opportunities Fund | 97% |
| Fidelity Series Investment Grade Bond Fund | 78% |
| Fidelity Series Large Cap Stock Fund | 81% |
| Fidelity Series Large Cap Value Index Fund | 67% |
| Fidelity Series Long-Term Treasury Bond Index Fund | 56% |
| Fidelity Series Opportunistic Insights Fund | 86% |
| Fidelity Series Overseas Fund | 82% |
| Fidelity Series Real Estate Income Fund | 78% |
| Fidelity Series Short-Term Credit Fund | 36% |
| Fidelity Series Small Cap Discovery Fund | 96% |
| Fidelity Series Small Cap Opportunities Fund | 79% |
| Fidelity Series Stock Selector Large Cap Value Fund | 87% |
| Fidelity Series Value Discovery Fund | 78% |
11. Risk and Uncertainties.
Many factors affect a fund's performance. Developments that disrupt global economies and financial markets, such as pandemics, epidemics, outbreaks of infectious diseases, war, terrorism, and environmental disasters, may significantly affect a fund's investment performance. The effects of these developments to a fund will be impacted by the types of securities in which a fund invests, the financial condition, industry, economic sector, and geographic location of an issuer, and a fund's level of investment in the securities of that issuer.
As a shareholder, you incur two types of costs: (1) transaction costs, which may include sales charges (loads) on purchase payments or redemption proceeds, as applicable and (2) ongoing costs, which generally include management fees, distribution and/or service (12b-1) fees and other Fund expenses. This Example is intended to help you understand your ongoing costs (in dollars) of investing in a fund and to compare these costs with the ongoing costs of investing in other mutual funds.
| The Example is based on an investment of $1,000 invested at the beginning of the period and held for the entire period (April 1, 2022 to September 30, 2022). |
Actual Expenses
The first line of the accompanying table provides information about actual account values and actual expenses. You may use the information in this line, together with the amount you invested, to estimate the expenses that you paid over the period. Simply divide your account value by $1,000.00 (for example, an $8,600 account value divided by $1,000.00 = 8.6), then multiply the result by the number in the first line for a class/Fund under the heading entitled "Expenses Paid During Period" to estimate the expenses you paid on your account during this period. If any fund is a shareholder of any underlying mutual funds or exchange-traded funds (ETFs) (the Underlying Funds), such fund indirectly bears its proportional share of the expenses of the Underlying Funds in addition to the direct expenses incurred presented in the table. These fees and expenses are not included in the annualized expense ratio used to calculate the expense estimate in the table below.
Hypothetical Example for Comparison Purposes
The second line of the accompanying table provides information about hypothetical account values and hypothetical expenses based on the actual expense ratio and an assumed rate of return of 5% per year before expenses, which is not the actual return. The hypothetical account values and expenses may not be used to estimate the actual ending account balance or expenses you paid for the period. You may use this information to compare the ongoing costs of investing in the Fund and other funds. To do so, compare this 5% hypothetical example with the 5% hypothetical examples that appear in the shareholder reports of the other funds. If any fund is a shareholder of any Underlying Funds, such fund indirectly bears its proportional share of the expenses of the Underlying Funds in addition to the direct expenses as presented in the table. These fees and expenses are not included in the annualized expense ratio used to calculate the expense estimate in the table below.
Please note that the expenses shown in the table are meant to highlight your ongoing costs only and do not reflect any transaction costs. Therefore, the second line of the table is useful in comparing ongoing costs only, and will not help you determine the relative total costs of owning different funds. In addition, if these transactional costs were included, your costs would have been higher.
| | | | | Annualized Expense Ratio- A | | Beginning Account Value April 1, 2022 | | Ending Account Value September 30, 2022 | | Expenses Paid During Period- C April 1, 2022 to September 30, 2022 |
| Fidelity Freedom® Income Fund | | | | | | | | | | |
| Fidelity Freedom® Income Fund | | | | .46% | | | | | | |
| Actual | | | | | | $ 1,000 | | $ 895.00 | | $ 2.19 |
Hypothetical- B | | | | | | $ 1,000 | | $ 1,022.76 | | $ 2.33 |
| Class K | | | | .41% | | | | | | |
| Actual | | | | | | $ 1,000 | | $ 895.80 | | $ 1.95 |
Hypothetical- B | | | | | | $ 1,000 | | $ 1,023.01 | | $ 2.08 |
| Class K6 | | | | .36% | | | | | | |
| Actual | | | | | | $ 1,000 | | $ 896.10 | | $ 1.71 |
Hypothetical- B | | | | | | $ 1,000 | | $ 1,023.26 | | $ 1.83 |
| Fidelity Freedom® 2005 Fund | | | | | | | | | | |
| Fidelity Freedom® 2005 Fund | | | | .47% | | | | | | |
| Actual | | | | | | $ 1,000 | | $ 890.40 | | $ 2.23 |
Hypothetical- B | | | | | | $ 1,000 | | $ 1,022.71 | | $ 2.38 |
| Class K | | | | .42% | | | | | | |
| Actual | | | | | | $ 1,000 | | $ 891.30 | | $ 1.99 |
Hypothetical- B | | | | | | $ 1,000 | | $ 1,022.96 | | $ 2.13 |
| Class K6 | | | | .37% | | | | | | |
| Actual | | | | | | $ 1,000 | | $ 891.90 | | $ 1.75 |
Hypothetical- B | | | | | | $ 1,000 | | $ 1,023.21 | | $ 1.88 |
| Fidelity Freedom® 2010 Fund | | | | | | | | | | |
| Fidelity Freedom® 2010 Fund | | | | .49% | | | | | | |
| Actual | | | | | | $ 1,000 | | $ 873.50 | | $ 2.30 |
Hypothetical- B | | | | | | $ 1,000 | | $ 1,022.61 | | $ 2.48 |
| Class K | | | | .44% | | | | | | |
| Actual | | | | | | $ 1,000 | | $ 873.60 | | $ 2.07 |
Hypothetical- B | | | | | | $ 1,000 | | $ 1,022.86 | | $ 2.23 |
| Class K6 | | | | .38% | | | | | | |
| Actual | | | | | | $ 1,000 | | $ 873.90 | | $ 1.79 |
Hypothetical- B | | | | | | $ 1,000 | | $ 1,023.16 | | $ 1.93 |
| Fidelity Freedom® 2015 Fund | | | | | | | | | | |
| Fidelity Freedom® 2015 Fund | | | | .53% | | | | | | |
| Actual | | | | | | $ 1,000 | | $ 855.60 | | $ 2.47 |
Hypothetical- B | | | | | | $ 1,000 | | $ 1,022.41 | | $ 2.69 |
| Class K | | | | .47% | | | | | | |
| Actual | | | | | | $ 1,000 | | $ 855.70 | | $ 2.19 |
Hypothetical- B | | | | | | $ 1,000 | | $ 1,022.71 | | $ 2.38 |
| Class K6 | | | | .40% | | | | | | |
| Actual | | | | | | $ 1,000 | | $ 855.50 | | $ 1.86 |
Hypothetical- B | | | | | | $ 1,000 | | $ 1,023.06 | | $ 2.03 |
| Fidelity Freedom® 2020 Fund | | | | | | | | | | |
| Fidelity Freedom® 2020 Fund | | | | .58% | | | | | | |
| Actual | | | | | | $ 1,000 | | $ 837.20 | | $ 2.67 |
Hypothetical- B | | | | | | $ 1,000 | | $ 1,022.16 | | $ 2.94 |
| Class K | | | | .50% | | | | | | |
| Actual | | | | | | $ 1,000 | | $ 837.80 | | $ 2.30 |
Hypothetical- B | | | | | | $ 1,000 | | $ 1,022.56 | | $ 2.54 |
| Class K6 | | | | .42% | | | | | | |
| Actual | | | | | | $ 1,000 | | $ 838.20 | | $ 1.94 |
Hypothetical- B | | | | | | $ 1,000 | | $ 1,022.96 | | $ 2.13 |
| Fidelity Freedom® 2025 Fund | | | | | | | | | | |
| Fidelity Freedom® 2025 Fund | | | | .62% | | | | | | |
| Actual | | | | | | $ 1,000 | | $ 828.00 | | $ 2.84 |
Hypothetical- B | | | | | | $ 1,000 | | $ 1,021.96 | | $ 3.14 |
| Class K | | | | .54% | | | | | | |
| Actual | | | | | | $ 1,000 | | $ 828.70 | | $ 2.48 |
Hypothetical- B | | | | | | $ 1,000 | | $ 1,022.36 | | $ 2.74 |
| Class K6 | | | | .44% | | | | | | |
| Actual | | | | | | $ 1,000 | | $ 828.60 | | $ 2.02 |
Hypothetical- B | | | | | | $ 1,000 | | $ 1,022.86 | | $ 2.23 |
| Fidelity Freedom® 2030 Fund | | | | | | | | | | |
| Fidelity Freedom® 2030 Fund | | | | .66% | | | | | | |
| Actual | | | | | | $ 1,000 | | $ 823.00 | | $ 3.02 |
Hypothetical- B | | | | | | $ 1,000 | | $ 1,021.76 | | $ 3.35 |
| Class K | | | | .57% | | | | | | |
| Actual | | | | | | $ 1,000 | | $ 823.70 | | $ 2.61 |
Hypothetical- B | | | | | | $ 1,000 | | $ 1,022.21 | | $ 2.89 |
| Class K6 | | | | .45% | | | | | | |
| Actual | | | | | | $ 1,000 | | $ 823.50 | | $ 2.06 |
Hypothetical- B | | | | | | $ 1,000 | | $ 1,022.81 | | $ 2.28 |
| Fidelity Freedom® 2035 Fund | | | | | | | | | | |
| Fidelity Freedom® 2035 Fund | | | | .70% | | | | | | |
| Actual | | | | | | $ 1,000 | | $ 808.10 | | $ 3.17 |
Hypothetical- B | | | | | | $ 1,000 | | $ 1,021.56 | | $ 3.55 |
| Class K | | | | .61% | | | | | | |
| Actual | | | | | | $ 1,000 | | $ 808.70 | | $ 2.77 |
Hypothetical- B | | | | | | $ 1,000 | | $ 1,022.01 | | $ 3.09 |
| Class K6 | | | | .47% | | | | | | |
| Actual | | | | | | $ 1,000 | | $ 809.40 | | $ 2.13 |
Hypothetical- B | | | | | | $ 1,000 | | $ 1,022.71 | | $ 2.38 |
| Fidelity Freedom® 2040 Fund | | | | | | | | | | |
| Fidelity Freedom® 2040 Fund | | | | .75% | | | | | | |
| Actual | | | | | | $ 1,000 | | $ 794.90 | | $ 3.37 |
Hypothetical- B | | | | | | $ 1,000 | | $ 1,021.31 | | $ 3.80 |
| Class K | | | | .64% | | | | | | |
| Actual | | | | | | $ 1,000 | | $ 794.50 | | $ 2.88 |
Hypothetical- B | | | | | | $ 1,000 | | $ 1,021.86 | | $ 3.24 |
| Class K6 | | | | .49% | | | | | | |
| Actual | | | | | | $ 1,000 | | $ 795.70 | | $ 2.21 |
Hypothetical- B | | | | | | $ 1,000 | | $ 1,022.61 | | $ 2.48 |
| Fidelity Freedom® 2045 Fund | | | | | | | | | | |
| Fidelity Freedom® 2045 Fund | | | | .75% | | | | | | |
| Actual | | | | | | $ 1,000 | | $ 792.80 | | $ 3.37 |
Hypothetical- B | | | | | | $ 1,000 | | $ 1,021.31 | | $ 3.80 |
| Class K | | | | .64% | | | | | | |
| Actual | | | | | | $ 1,000 | | $ 793.00 | | $ 2.88 |
Hypothetical- B | | | | | | $ 1,000 | | $ 1,021.86 | | $ 3.24 |
| Class K6 | | | | .49% | | | | | | |
| Actual | | | | | | $ 1,000 | | $ 794.20 | | $ 2.20 |
Hypothetical- B | | | | | | $ 1,000 | | $ 1,022.61 | | $ 2.48 |
| Fidelity Freedom® 2050 Fund | | | | | | | | | | |
| Fidelity Freedom® 2050 Fund | | | | .75% | | | | | | |
| Actual | | | | | | $ 1,000 | | $ 792.90 | | $ 3.37 |
Hypothetical- B | | | | | | $ 1,000 | | $ 1,021.31 | | $ 3.80 |
| Class K | | | | .64% | | | | | | |
| Actual | | | | | | $ 1,000 | | $ 793.70 | | $ 2.88 |
Hypothetical- B | | | | | | $ 1,000 | | $ 1,021.86 | | $ 3.24 |
| Class K6 | | | | .49% | | | | | | |
| Actual | | | | | | $ 1,000 | | $ 793.90 | | $ 2.20 |
Hypothetical- B | | | | | | $ 1,000 | | $ 1,022.61 | | $ 2.48 |
| Fidelity Freedom® 2055 Fund | | | | | | | | | | |
| Fidelity Freedom® 2055 Fund | | | | .75% | | | | | | |
| Actual | | | | | | $ 1,000 | | $ 793.00 | | $ 3.37 |
Hypothetical- B | | | | | | $ 1,000 | | $ 1,021.31 | | $ 3.80 |
| Class K | | | | .64% | | | | | | |
| Actual | | | | | | $ 1,000 | | $ 793.20 | | $ 2.88 |
Hypothetical- B | | | | | | $ 1,000 | | $ 1,021.86 | | $ 3.24 |
| Class K6 | | | | .49% | | | | | | |
| Actual | | | | | | $ 1,000 | | $ 794.00 | | $ 2.20 |
Hypothetical- B | | | | | | $ 1,000 | | $ 1,022.61 | | $ 2.48 |
| Fidelity Freedom® 2060 Fund | | | | | | | | | | |
| Fidelity Freedom® 2060 Fund | | | | .75% | | | | | | |
| Actual | | | | | | $ 1,000 | | $ 792.90 | | $ 3.37 |
Hypothetical- B | | | | | | $ 1,000 | | $ 1,021.31 | | $ 3.80 |
| Class K | | | | .64% | | | | | | |
| Actual | | | | | | $ 1,000 | | $ 792.90 | | $ 2.88 |
Hypothetical- B | | | | | | $ 1,000 | | $ 1,021.86 | | $ 3.24 |
| Class K6 | | | | .49% | | | | | | |
| Actual | | | | | | $ 1,000 | | $ 793.50 | | $ 2.20 |
Hypothetical- B | | | | | | $ 1,000 | | $ 1,022.61 | | $ 2.48 |
| Fidelity Freedom® 2065 Fund | | | | | | | | | | |
| Fidelity Freedom® 2065 Fund | | | | .75% | | | | | | |
| Actual | | | | | | $ 1,000 | | $ 793.00 | | $ 3.37 |
Hypothetical- B | | | | | | $ 1,000 | | $ 1,021.31 | | $ 3.80 |
| Class K | | | | .64% | | | | | | |
| Actual | | | | | | $ 1,000 | | $ 793.40 | | $ 2.88 |
Hypothetical- B | | | | | | $ 1,000 | | $ 1,021.86 | | $ 3.24 |
| Class K6 | | | | .49% | | | | | | |
| Actual | | | | | | $ 1,000 | | $ 794.10 | | $ 2.20 |
Hypothetical- B | | | | | | $ 1,000 | | $ 1,022.61 | | $ 2.48 |
| |
A Annualized expense ratio reflects expenses net of applicable fee waivers.
B 5% return per year before expenses
C Expenses are equal to the annualized expense ratio, multiplied by the average account value over the period, multiplied by 183/ 365 (to reflect the one-half year period). The fees and expenses of any Underlying Funds are not included in each annualized expense ratio.
Fidelity Freedom Funds
Each year, the Board of Trustees, including the Independent Trustees (together, the Board), votes on the renewal of the management contract with Fidelity Management & Research Company LLC (FMR) (the Advisory Contract) for each fund. The Board, assisted by the advice of fund counsel and Independent Trustees' counsel, requests and considers a broad range of information relevant to the renewal of the Advisory Contracts throughout the year.
The Board meets regularly and, at each of its meetings, covers an extensive agenda of topics and materials and considers factors that are relevant to its annual consideration of the renewal of each fund's Advisory Contract, including the services and support provided to each fund and its shareholders. The Board has established four standing committees (Committees) - Operations, Audit, Fair Valuation, and Governance and Nominating - each composed of and chaired by Independent Trustees with varying backgrounds, to which the Board has assigned specific subject matter responsibilities in order to enhance effective decision-making by the Board. The Operations Committee, of which all the Independent Trustees are members, meets regularly throughout the year and requests, receives and considers, among other matters, information related to the annual consideration of the renewal of each fund's Advisory Contracts before making its recommendation to the Board. The Board also meets as needed to review matters specifically related to the Board's annual consideration of the renewal of the Advisory Contracts. Members of the Board may also meet from time to time with trustees of other Fidelity funds through joint ad hoc committees to discuss certain matters relevant to all of the Fidelity funds.
At its September 2022 meeting, the Board unanimously determined to renew each fund's Advisory Contract. In reaching its determination, the Board considered all factors it believed relevant, including (i) the nature, extent, and quality of the services provided to each fund and its shareholders (including the investment performance of each fund); (ii) the competitiveness relative to peer funds of each fund's management fee and the total expense ratio of a representative class (the retail class); (iii) the total costs of the services provided by and the profits realized by Fidelity from its relationships with each fund; and (iv) the extent to which, if any, economies of scale exist and are realized as each fund grows, and whether any economies of scale are appropriately shared with fund shareholders. The Board also considered that each fund pays an all-inclusive management fee that covers all operating expenses of the fund, subject to certain exceptions, and varies by class (unitary fee) and the underlying Fidelity funds in which the fund invests (Series Funds) do not pay expenses, with certain limited exceptions. The Board and the board of other funds that invest their assets in Series Funds and the boards of the Series Funds previously formed a joint ad hoc committee to review the responsibilities of each board related to the consideration of the renewal of the Advisory Contracts for the funds, other funds that invest substantially all of their assets in Series Funds, and the Series Funds. The Board's deliberations were informed by the conclusions of such committee.
In considering whether to renew the Advisory Contract for each fund, the Board reached a determination, with the assistance of fund counsel and Independent Trustees' counsel and through the exercise of its business judgment, that the renewal of the Advisory Contract was in the best interests of each fund and its shareholders and that the compensation payable under the Advisory Contract was fair and reasonable. The Board's decision to renew the Advisory Contracts was not based on any single factor, but rather was based on a comprehensive consideration of all the information provided to the Board at its meetings throughout the year. The Board, in reaching its determination to renew the Advisory Contracts, was aware that shareholders of each fund have a broad range of investment choices available to them, including a wide choice among funds offered by Fidelity's competitors, and that each fund's shareholders, who have the opportunity to review and weigh the disclosure provided by the fund in its prospectus and other public disclosures, have chosen to invest in that fund, which is part of the Fidelity family of funds.
Nature, Extent, and Quality of Services Provided. The Board considered Fidelity's staffing as it relates to the funds, including the backgrounds of investment personnel of FMR, and also considered the funds' investment objectives, strategies, and related investment philosophies. The Independent Trustees also had discussions with senior management of Fidelity's investment operations and investment groups with responsibility for the Series Funds. The Board considered the structure of the investment personnel compensation program and whether this structure provides appropriate incentives to act in the best interests of each fund. Additionally, the Board considered the portfolio managers' investments, if any, in the funds that they manage. The Board also considered the steps Fidelity had taken to ensure the continued provision of high quality services to the Fidelity funds throughout the COVID-19 pandemic, including the expansion of staff in client facing positions to maintain service levels in periods of high volumes and volatility.
Resources Dedicated to Investment Management and Support Services . The Board reviewed the general qualifications and capabilities of Fidelity's investment staff, including its size, education, experience, and resources, as well as Fidelity's approach to recruiting, training, managing, and compensating investment personnel. The Board noted the resources devoted to Fidelity's global investment organization, and that Fidelity's analysts have extensive resources, tools, and capabilities that allow them to conduct quantitative and fundamental analysis, as well as credit analysis of issuers, counterparties, and guarantors. Further, the Board considered that Fidelity's investment professionals have sufficient access to global information and data so as to provide competitive investment results over time, and that those professionals also have access to sophisticated tools that permit them to assess portfolio construction and risk and performance attribution characteristics continuously, as well as to transmit new information and research conclusions rapidly around the world. Additionally, in its deliberations, the Board considered Fidelity's risk management, compliance, cybersecurity, and technology and operations capabilities and resources, which are integral parts of the investment management process.
Shareholder and Administrative Services. The Board considered (i) the nature, extent, quality, and cost of advisory, administrative, and shareholder services performed by Fidelity under the Advisory Contract and under separate agreements covering transfer agency and pricing and bookkeeping services for each fund; (ii) the nature and extent of the supervision of third party service providers, principally custodians, subcustodians, and pricing vendors; and (iii) the resources devoted to, and the record of compliance with, each fund's compliance policies and procedures.
The Board noted that the growth of fund assets over time across the complex allows Fidelity to reinvest in the development of services designed to enhance the value and convenience of the Fidelity funds as investment vehicles. These services include 24-hour access to account information and market information over the Internet and through telephone representatives, investor education materials and asset allocation tools. The Board also considered that it reviews customer service metrics such as telephone response times, continuity of services on the website and metrics addressing services at Fidelity Investor Centers.
Investment in a Large Fund Family. The Board considered the benefits to shareholders of investing in a Fidelity fund, including the benefits of investing in a fund that is part of a large family of funds offering a variety of investment disciplines and providing a large variety of mutual fund investor services. The Board noted that Fidelity had taken, or had made recommendations to the Board that resulted in the Fidelity funds taking, a number of actions over the previous year that benefited particular funds, including: (i) continuing to dedicate additional resources to Fidelity's investment research process, which includes meetings with management of issuers of securities in which the funds invest; (ii) continuing efforts to enhance Fidelity's global research capabilities; (iii) launching new funds, ETFs, and share classes with innovative structures, strategies and pricing and making other enhancements to meet investor needs; (iv) broadening eligibility requirements for certain funds and share classes; (v) reducing management fees and total expenses for certain funds and classes; (vi) lowering expenses for certain existing funds and classes by implementing or lowering expense caps; (vii) rationalizing product lines and gaining increased efficiencies from fund mergers and liquidations; (viii) continuing to develop, acquire and implement systems and technology to improve services to the funds and shareholders, strengthen information security, and increase efficiency; and (ix) continuing to implement enhancements to further strengthen Fidelity's product line to increase investors' probability of success in achieving their investment goals, including their retirement income goals.
Investment Performance. The Board considered whether each fund has operated in accordance with its investment objective, as well as its record of compliance with its investment restrictions and its performance history.
The Board took into account discussions that occur at Board meetings throughout the year with representatives of the investment adviser about fund investment performance. In this regard the Board noted that as part of regularly scheduled fund reviews and other reports to the Board on fund performance, the Board considers annualized return information for each fund for different time periods, measured against one or more appropriate securities market indices, including a customized blended index that reflects the respective weights of the fund's asset classes (each a benchmark index). The Board also receives and considers information about performance attribution. In its evaluation of fund investment performance at meetings throughout the year, the Board gave particular attention to information indicating underperformance of certain Fidelity funds for specific time periods and discussed with the investment adviser the reasons for such underperformance.
In addition to reviewing absolute and relative fund performance, the Independent Trustees periodically consider the appropriateness of fund performance metrics in evaluating the results achieved. In general, the Independent Trustees believe that fund performance should be evaluated based on gross performance (before fees and expenses, including acquired fund fees and expenses, but after transaction costs, if any) compared to appropriate benchmark indices, over appropriate time periods that may include full market cycles, taking into account relevant factors including the following: general market conditions; the extent to which particular underlying funds affected performance; and fund cash flows and other factors. The Independent Trustees generally give greater weight to fund performance over longer time periods than over shorter time periods. Depending on the circumstances, the Independent Trustees may be satisfied with a fund's performance notwithstanding that it lags its benchmark index for certain periods.
The Independent Trustees recognize that shareholders evaluate performance on a net basis over their own holding periods, for which one-, three-, and five-year periods are often used as a proxy. For this reason, the performance information reviewed by the Board also included net cumulative calendar year total return information for the representative class (the retail class) of each fund and an appropriate benchmark index for the most recent one-, three-, and five-year periods (for Freedom 2065 Fund, the most recent one-year period). No performance peer group information was considered by the Board as Fidelity advised the Board that competitor funds differ significantly in their asset allocation strategy, degree of active management and glidepath construction. The Independent Trustees recognize that shareholders who are not investing through a tax-advantaged retirement account also consider tax consequences in evaluating performance.
Based on its review, the Board concluded that the nature, extent, and quality of services provided to each fund under the Advisory Contracts should continue to benefit the shareholders of each fund.
Competitiveness of Management Fee and Total Expense Ratio . The Board considered each fund's management fee and total expense ratio compared to selected groups of competitive funds and classes (referred to as "mapped groups" below) for the purpose of facilitating the Trustees' competitive analysis of management fees and total expenses. Fidelity creates "mapped groups" by combining similar investment objective categories (as classified by Lipper) that have comparable investment mandates. Combining funds with similar investment objective categories aids the Board's comparisons of management fees and total expense ratios by broadening the competitive group used for such comparisons.
Management Fee . The Board considered two proprietary management fee comparisons. The group of Lipper funds used by the Board for management fee comparisons is referred to as the "Total Mapped Group." The Total Mapped Group comparison focuses on a fund's standing in terms of gross management fees before expense reimbursements or caps relative to the total universe of funds with comparable investment mandates, regardless of whether their management fee structures also are comparable. Funds with comparable investment mandates offer exposure to similar types of securities. Funds with comparable management fee structures have similar management fee contractual arrangements (e.g., flat rate charged for advisory services, all-inclusive fee rate, etc.). The "Asset-Sized Peer Group" (ASPG) comparison focuses on a fund's standing relative to a subset of non-Fidelity funds within the Total Mapped Group that are similar in size and management fee structure. For example, if a fund is in the first quartile of the ASPG, the fund's management fee ranks in the least expensive or lowest 25% of funds in the ASPG. The ASPG represents at least 15% of the funds in the Total Mapped Group with comparable asset size and management fee structures, subject to a minimum of 50 funds (or all funds in the Total Mapped Group if fewer than 50). Additional information, such as the ASPG quartile in which a fund's management fee rate ranked, also was considered by the Board.
The Board noted that a different unitary (subject to certain limited exceptions) management fee rate is applicable to each class of each fund. The Board considered that the difference in management fee rates between classes is the result of separate arrangements for class-level services and/or waivers of certain expenses and not the result of any difference in advisory or custodial fees or other expenses related to the management of a fund's assets.
The Board compared each fund's class-level management fee rates for the current fiscal year relative to the median of its competitor funds in the applicable Total Mapped Group based on competitive data for 2021. The Board noted that each fund's class-level management fee rates rank above the median of its competitor funds in the applicable Total Mapped Group based on competitive data for 2021. The Board noted that each fund's unitary fee arrangement covers all operating expenses of the fund, subject to certain exceptions, and that the fee structures of the majority of peer funds do not include top-level management fees. The Board noted that for this reason, Fidelity believes that a comparison of total expense ratios (including acquired fund fees and expenses) is more useful than comparisons of the unitary advisory fee paid by each class and the advisory fee paid by most competitor funds. The Board also noted that the primary comparisons for the funds are against competitor target date funds with holdings that are actively managed, but that there is still wide dispersion in the strategic and active allocation among competitors, regardless of whether the funds have similar vintages.
Based on its review, the Board concluded that each fund's management fee is fair and reasonable in light of the services that the fund receives and the other factors considered.
Total Expense Ratio. In its review of the total expense ratio of the representative class (the retail class) of each fund, the Board considered the fund's class-level management fee rate under the Advisory Contract. The Board also considered other expenses, such as transfer agent fees, pricing and bookkeeping fees, and custodial, legal, and audit fees, paid by FMR under the unitary fee arrangement. The Board also noted that Fidelity may agree to waive fees or reimburse expenses from time to time, and the extent to which, if any, it has done so for each fund. Each fund's representative class is compared to those funds and classes in the Total Mapped Group (used by the Board for management fee comparisons) that have a similar sales load structure. The Board also considered a total expense (including acquired fund fees and expenses) ASPG comparison, which focuses on the total expenses of the representative class relative to a subset of non-Fidelity funds within the similar sales load structure group that are similar in size and management fee structure. The total expense ASPG is limited to 15 larger and 15 smaller classes of different funds, where possible. The total expense ASPG comparison excludes performance adjustments and fund-paid 12b-1 fees to eliminate variability in expenses relating to these items.
The Board noted that each fund offers multiple classes and that the multiple structures are intended to offer pricing options for the intermediary market. The Board also noted that the total expense ratios of the classes of each fund vary primarily due to differences in transfer agent fees.
The Board noted that the total net expense ratio, which includes the expenses of the Series Funds, of the retail class: (i) ranked below the similar sales load structure group competitive median for 2021 for Freedom 2005 Fund, Freedom 2010 Fund, Freedom 2015 Fund, Freedom 2025 Fund, Freedom 2030 Fund, Freedom 2035 Fund, Freedom 2040 Fund, Freedom 2045 Fund, Freedom 2050 Fund, Freedom 2055 Fund, Freedom 2060 Fund, Freedom 2065 Fund, and Freedom Income Fund; and (ii) ranked above the similar sales load structure group competitive median for 2021 for Freedom 2020 Fund.
The Board noted that the total net expense ratio, which includes the expenses of the Series Funds, of the retail class (i) ranked below the ASPG competitive median for 2021 for Freedom 2005 Fund, Freedom 2010 Fund, Freedom 2015 Fund, Freedom 2025 Fund, Freedom 2030 Fund, and Freedom Income Fund; and (ii) ranked above the ASPG competitive median for 2021 for Freedom 2020 Fund, Freedom 2035 Fund, Freedom 2040 Fund, Freedom 2045 Fund, Freedom 2050 Fund, Freedom 2055 Fund, Freedom 2060 Fund, and Freedom 2065 Fund. The Board noted Fidelity's explanation that these funds were above their respective ASPG medians because of higher equity and/or international allocations relative to competitors.
The Board considered that current contractual arrangements for the fund oblige FMR to pay all "class-level" expenses of Class K6 of each fund to the extent necessary to limit total operating expenses, with certain exceptions, to an amount specified in the applicable expense contract. These contractual arrangements may not be amended to increase the fees or expenses payable by Class K6 of a fund except by a vote of a majority of the Board of Trustees and by a vote of a majority of the outstanding voting securities of Class K6 of the applicable fund.
Fees Charged to Other Fidelity Clients. The Board also considered Fidelity fee structures and other information with respect to clients of Fidelity, such as other funds advised or subadvised by Fidelity, pension plan clients, and other institutional clients with similar mandates. The Board noted that a joint ad hoc committee created by it and the boards of other Fidelity funds periodically reviews and compares Fidelity's institutional investment advisory business with its business of providing services to the Fidelity funds and also noted the most recent findings of the committee. The Board noted that the committee's review included a consideration of the differences in services provided, fees charged, and costs incurred, as well as competition in the markets serving the different categories of clients.
Based on its review of total expense ratios and fees charged to other Fidelity clients, the Board concluded that the total expense ratio of each class of each fund was reasonable in light of the services that the fund and its shareholders receive and the other factors considered.
Costs of the Services and Profitability . The Board considered the revenues earned and the expenses incurred by Fidelity in conducting the business of developing, marketing, distributing, managing, administering and servicing each fund and the Series Funds in which each fund invests and in servicing each fund's shareholders. The Board also considered the level of Fidelity's profits in respect of all the Fidelity funds.
On an annual basis, Fidelity presents to the Board information about the profitability of its relationships with each fund. Fidelity calculates profitability information for each fund, as well as aggregate profitability information for groups of Fidelity funds and all Fidelity funds, using a series of detailed revenue and cost allocation methodologies which originate with the books and records of Fidelity on which Fidelity's audited financial statements are based. The Audit Committee of the Board reviews any significant changes from the prior year's methodologies and the full Board approves such changes.
A public accounting firm has been engaged annually by the Board as part of the Board's assessment of Fidelity's profitability analysis. The engagement includes the review and assessment of the methodologies used by Fidelity in determining the revenues and expenses attributable to Fidelity's mutual fund business, and completion of agreed-upon procedures in respect of the mathematical accuracy of certain fund profitability information and its conformity to established allocation methodologies. After considering the reports issued under the engagement and information provided by Fidelity, the Board concluded that while other allocation methods may also be reasonable, Fidelity's profitability methodologies are reasonable in all material respects.
The Board also reviewed Fidelity's non-fund businesses and potential indirect benefits such businesses may have received as a result of their association with Fidelity's mutual fund business (i.e., fall-out benefits) as well as cases where Fidelity's affiliates may benefit from the funds' business. The Board considered areas where potential indirect benefits to the Fidelity funds from their relationships with Fidelity may exist. The Board's consideration of these matters was informed by the findings of a joint ad hoc committee created by it and the boards of other Fidelity funds to evaluate potential fall-out benefits.
The Board considered the costs of the services provided by and the profits realized by Fidelity in connection with the operation of each fund and was satisfied that the profitability was not excessive.
Economies of Scale . The Board considered whether there have been economies of scale in respect of the management of the Fidelity funds, whether the Fidelity funds (including each fund) have appropriately benefited from any such economies of scale, and whether there is potential for realization of any further economies of scale. The Board considered the extent to which each fund will benefit from economies of scale as assets grow through increased services to the fund, through waivers or reimbursements, or through fee or expense ratio reductions. The Board recognized that, due to each fund's current contractual arrangements, its expense ratio will not decline if the fund's operating costs decrease as assets grow, or rise as assets decrease. The Board also noted that a committee (the Economies of Scale Committee) created by it and the boards of other Fidelity funds periodically analyzes whether Fidelity attains economies of scale in respect of the management and servicing of the Fidelity funds, whether the Fidelity funds have appropriately benefited from such economies of scale, and whether there is potential for realization of any further economies of scale.
The Board concluded, taking into account the analysis of the Economies of Scale Committee, that economies of scale, if any, are being appropriately shared between fund shareholders and Fidelity.
Additional Information Requested by the Board . In order to develop fully the factual basis for consideration of the Fidelity funds' advisory contracts, the Board requested and received additional information on certain topics, including: (i) Fidelity's fund profitability methodology, profitability trends for certain funds, the allocation of various costs to different funds, and the impact of certain factors on fund profitability results; (ii) portfolio manager changes that have occurred during the past year and the amount of the investment that each portfolio manager has made in the Fidelity fund(s) that he or she manages; (iii) the extent to which current market conditions have affected retention and recruitment of personnel; (iv) the arrangements with and compensation paid to certain fund sub-advisers on behalf of the Fidelity funds and the treatment of such compensation within Fidelity's fund profitability methodology; (v) the terms of the funds' various management fee structures, including the basic group fee and the terms of Fidelity's voluntary expense limitation arrangements; (vi) Fidelity's transfer agent, pricing and bookkeeping fees, expense and service structures for different funds and classes relative to competitive trends; (vii) the impact on fund profitability of recent industry trends, such as the growth in passively managed funds and the changes in flows for different types of funds; (viii) the types of management fee and total expense comparisons provided, and the challenges and limitations associated with such information; and (ix) explanations regarding the relative total expense ratios and management fees of certain funds and classes, total expense and management fee competitive trends, and methodologies for total expense and management fee competitive comparisons. In addition, the Board considered its discussions with Fidelity regarding Fidelity's efforts to maintain the continuous investment and shareholder services necessary for the funds during the current pandemic and economic circumstances.
Based on its evaluation of all of the conclusions noted above, and after considering all factors it believed relevant, the Board concluded that the advisory fee arrangements are fair and reasonable and that each fund's Advisory Contract should be renewed.
1.537284.125
FF-SANN-1122
Item 2.
Code of Ethics
Not applicable.
Item 3.
Audit Committee Financial Expert
Not applicable.
Item 4.
Principal Accountant Fees and Services
Not applicable.
Item 5.
Audit Committee of Listed Registrants
Not applicable.
Item 6.
Investments
(a)
Not applicable.
(b)
Not applicable
Item 7.
Disclosure of Proxy Voting Policies and Procedures for Closed-End Management Investment Companies
Not applicable.
Item 8.
Portfolio Managers of Closed-End Management Investment Companies
Not applicable.
Item 9.
Purchase of Equity Securities by Closed-End Management Investment Company and Affiliated Purchasers
Not applicable.
Item 10.
Submission of Matters to a Vote of Security Holders
There were no material changes to the procedures by which shareholders may recommend nominees to the Fidelity Aberdeen Street Trust’s Board of Trustees.
Item 11.
Controls and Procedures
(a)(i) The President and Treasurer and the Chief Financial Officer have concluded that the Fidelity Aberdeen Street Trust’s (the “Trust”) disclosure controls and procedures (as
defined in Rule 30a-3(c) under the Investment Company Act) provide reasonable assurances that material information relating to the Trust is made known to them by the appropriate persons, based on their evaluation of these controls and procedures as of a date within 90 days of the filing date of this report.
(a)(ii) There was no change in the Trust’s internal control over financial reporting (as defined in Rule 30a-3(d) under the Investment Company Act) that occurred during the period covered by this report that has materially affected, or is reasonably likely to materially affect, the Trust’s internal control over financial reporting.
Item 12.
Disclosure of Securities Lending Activities for Closed-End Management
Investment Companies
Not applicable.
Item 13.
Exhibits
SIGNATURES
Pursuant to the requirements of the Securities Exchange Act of 1934 and the Investment Company Act of 1940, the registrant has duly caused this report to be signed on its behalf by the undersigned, thereunto duly authorized.
Fidelity Aberdeen Street Trust
| |
By: | /s/Laura M. Del Prato |
| Laura M. Del Prato |
| President and Treasurer |
|
|
Date: | November 18, 2022 |
Pursuant to the requirements of the Securities Exchange Act of 1934 and the Investment Company Act of 1940, this report has been signed below by the following persons on behalf of the registrant and in the capacities and on the dates indicated.
| |
By: | /s/Laura M. Del Prato |
| Laura M. Del Prato |
| President and Treasurer |
|
|
Date: | November 18, 2022 |
| |
By: | /s/John J. Burke III |
| John J. Burke III |
| Chief Financial Officer |
|
|
Date: | November 18, 2022 |