UNITED STATES
SECURITIES AND EXCHANGE COMMISSION
Washington, D.C. 20549
FORM N-CSR
CERTIFIED SHAREHOLDER REPORT OF REGISTERED
MANAGEMENT INVESTMENT COMPANIES
Investment Company Act file number 811-6440
Fidelity Aberdeen Street Trust
(Exact name of registrant as specified in charter)
245 Summer St., Boston, MA 02210
(Address of principal executive offices) (Zip code)
Marc Bryant, Secretary
245 Summer St.
Boston, Massachusetts 02210
(Name and address of agent for service)
Registrant's telephone number, including area code:
617-563-7000
| |
Date of fiscal year end: | March 31 |
|
|
Date of reporting period: | September 30, 2016 |
Item 1.
Reports to Stockholders
Fidelity Freedom® Funds - Income, 2005, 2010, 2015, 2020, 2025, 2030, 2035, 2040, 2045, 2050, 2055, 2060
Semi-Annual Report September 30, 2016 |
 |
Contents
To view a fund's proxy voting guidelines and proxy voting record for the 12-month period ended June 30, visit http://www.fidelity.com/proxyvotingresults or visit the Securities and Exchange Commission's (SEC) web site at http://www.sec.gov.
You may also call 1-800-544-8544 to request a free copy of the proxy voting guidelines.
Standard & Poor's, S&P and S&P 500 are registered service marks of The McGraw-Hill Companies, Inc. and have been licensed for use by Fidelity Distributors Corporation.
Other third-party marks appearing herein are the property of their respective owners.
All other marks appearing herein are registered or unregistered trademarks or service marks of FMR LLC or an affiliated company. © 2016 FMR LLC. All rights reserved.
This report and the financial statements contained herein are submitted for the general information of the shareholders of the Funds. This report is not authorized for distribution to prospective investors in the Funds unless preceded or accompanied by an effective prospectus.
A fund files its complete schedule of portfolio holdings with the SEC for the first and third quarters of each fiscal year on Form N-Q. Forms N-Q are available on the SEC’s web site at http://www.sec.gov. A fund's Forms N-Q may be reviewed and copied at the SEC’s Public Reference Room in Washington, DC. Information regarding the operation of the SEC's Public Reference Room may be obtained by calling 1-800-SEC-0330.
For a complete list of a fund's portfolio holdings, view the most recent holdings listing, semiannual report, or annual report on Fidelity's web site at http://www.fidelity.com, http://www.institutional.fidelity.com, or http://www.401k.com, as applicable.
NOT FDIC INSURED •MAY LOSE VALUE •NO BANK GUARANTEE
Neither the Funds nor Fidelity Distributors Corporation is a bank.
Note to Shareholders
In July 2016, the Board of Trustees approved a new pricing structure for the Freedom Funds. Fund shareholders of record on August 29, 2016 have been asked to vote on the proposal. If approved by shareholders, the proposal will reduce the overall expenses that Freedom Fund shareholders pay (relative to the funds’ expenses as of March 31, 2016), and provide for less fluctuation in fund expenses. Under the new structure, each Freedom Fund will charge shareholders for all of its operating expenses directly, and most expenses that are currently charged by the underlying funds in which the Freedom Funds invest will be eliminated.
The note above is not a solicitation of any proxy. More detailed information is contained in the proxy statement.
Fidelity Freedom® Income Fund
Investment Summary (Unaudited)
The information in the following tables is based on the direct investments of the Fund.
Top Holdings as of September 30, 2016
| | % of fund's net assets | % of fund's net assets 6 months ago |
| Fidelity Series Investment Grade Bond Fund | 37.5 | 38.8 |
| Fidelity Series Government Money Market Fund 0.29% | 17.2 | 0.0 |
| Fidelity Series Short-Term Credit Fund | 9.1 | 8.9 |
| Fidelity Series Emerging Markets Fund | 4.8 | 4.4 |
| Fidelity Series Inflation-Protected Bond Index Fund | 3.9 | 3.8 |
| Fidelity Series High Income Fund | 3.2 | 3.0 |
| Fidelity Series Equity-Income Fund | 2.5 | 2.6 |
| Fidelity Series International Value Fund | 2.5 | 2.0 |
| Fidelity Series International Growth Fund | 2.4 | 2.1 |
| Fidelity Series Growth Company Fund | 2.1 | 2.4 |
| | 85.2 | 68.0 |
Asset Allocation (% of fund's net assets)
| Period end |
| | Domestic Equity Funds | 17.4% |
| | International Equity Funds | 10.3% |
| | Bond Funds | 46.0% |
| | Short-Term Funds | 26.3% |

| Six months ago |
| | Domestic Equity Funds | 18.5% |
| | International Equity Funds | 9.0% |
| | Bond Funds | 47.0% |
| | Short-Term Funds | 25.5% |

Domestic Equity Funds category includes Fidelity Series Commodity Strategy Fund which invests in commodity-related investments.
Percentages shown as 0.0% may reflect amounts less than 0.05%.
Fidelity Freedom® Income Fund
Investments September 30, 2016 (Unaudited)
Showing Percentage of Net Assets
| Domestic Equity Funds - 17.4% | | | |
| | | Shares | Value |
| Fidelity Series 100 Index Fund (a) | | 846,121 | $12,082,606 |
| Fidelity Series 1000 Value Index Fund (a) | | 681,367 | 7,610,867 |
| Fidelity Series All-Sector Equity Fund (a) | | 1,789,340 | 24,030,830 |
| Fidelity Series Blue Chip Growth Fund (a) | | 2,382,441 | 27,946,030 |
| Fidelity Series Commodity Strategy Fund (a)(b) | | 6,415,224 | 33,936,536 |
| Fidelity Series Equity-Income Fund (a) | | 4,485,229 | 55,482,281 |
| Fidelity Series Growth & Income Fund (a) | | 3,051,706 | 40,862,349 |
| Fidelity Series Growth Company Fund (a) | | 3,481,476 | 46,686,594 |
| Fidelity Series Intrinsic Opportunities Fund (a) | | 2,280,111 | 34,270,073 |
| Fidelity Series Opportunistic Insights Fund (a) | | 1,764,985 | 27,004,278 |
| Fidelity Series Real Estate Equity Fund (a) | | 354,657 | 4,883,620 |
| Fidelity Series Small Cap Discovery Fund (a) | | 698,638 | 7,363,648 |
| Fidelity Series Small Cap Opportunities Fund (a) | | 1,678,113 | 22,067,188 |
| Fidelity Series Stock Selector Large Cap Value Fund (a) | | 3,050,167 | 35,961,463 |
| TOTAL DOMESTIC EQUITY FUNDS | | | |
| (Cost $313,059,784) | | | 380,188,363 |
|
| International Equity Funds - 10.3% | | | |
| Fidelity Series Emerging Markets Fund (a) | | 6,298,799 | 105,945,793 |
| Fidelity Series International Growth Fund (a) | | 3,824,145 | 53,538,025 |
| Fidelity Series International Small Cap Fund (a) | | 790,112 | 12,302,041 |
| Fidelity Series International Value Fund (a) | | 5,670,213 | 53,753,616 |
| TOTAL INTERNATIONAL EQUITY FUNDS | | | |
| (Cost $198,343,517) | | | 225,539,475 |
|
| Bond Funds - 46.0% | | | |
| Fidelity Series Emerging Markets Debt Fund (a) | | 1,426,938 | 14,783,075 |
| Fidelity Series Floating Rate High Income Fund (a) | | 587,729 | 5,536,405 |
| Fidelity Series High Income Fund (a) | | 7,476,533 | 69,980,350 |
| Fidelity Series Inflation-Protected Bond Index Fund (a) | | 8,406,675 | 84,655,220 |
| Fidelity Series Investment Grade Bond Fund (a) | | 70,651,345 | 819,555,605 |
| Fidelity Series Long-Term Treasury Bond Index Fund (a) | | 86,863 | 838,225 |
| Fidelity Series Real Estate Income Fund (a) | | 968,335 | 10,864,714 |
| TOTAL BOND FUNDS | | | |
| (Cost $943,238,585) | | | 1,006,213,594 |
|
| Short-Term Funds - 26.3% | | | |
| Fidelity Series Government Money Market Fund 0.29% (a)(c) | | 374,652,989 | 374,652,989 |
| Fidelity Series Short-Term Credit Fund (a) | | 19,833,261 | 198,927,607 |
| TOTAL SHORT-TERM FUNDS | | | |
| (Cost $572,693,224) | | | 573,580,596 |
| TOTAL INVESTMENT PORTFOLIO - 100.0% | | | |
| (Cost $2,027,335,110) | | | 2,185,522,028 |
| NET OTHER ASSETS (LIABILITIES) - 0.0% | | | 263 |
| NET ASSETS - 100% | | | $2,185,522,291 |
(a) Affiliated Fund
(b) Non-income producing
(c) The rate quoted is the annualized seven-day yield of the fund at period end.
Affiliated Underlying Funds
Information regarding the Fund's fiscal year to date purchases and sales of the affiliated Underlying Funds and income earned by the Fund from investments in affiliated Underlying Funds is as follows:
| Affiliate | Value, beginning of period | Purchases | Sales Proceeds | Dividend Income | Value, end of period |
| Fidelity Investments Money Market Portfolio Institutional Class 0.59% | $361,804,933 | $7,185,854 | $368,990,787 | $158,724 | $-- |
| Fidelity Series 100 Index Fund | 13,381,328 | 113,850 | 2,185,001 | -- | 12,082,606 |
| Fidelity Series 1000 Value Index Fund | 7,536,729 | 209,431 | 723,009 | -- | 7,610,867 |
| Fidelity Series All-Sector Equity Fund | 42,190,365 | 308,197 | 21,023,130 | -- | 24,030,830 |
| Fidelity Series Blue Chip Growth Fund | 29,248,682 | 282,386 | 3,797,852 | 51,949 | 27,946,030 |
| Fidelity Series Commodity Strategy Fund | 26,814,515 | 6,536,489 | 1,426,463 | -- | 33,936,536 |
| Fidelity Series Emerging Markets Debt Fund | 13,717,841 | 491,337 | 670,145 | 391,561 | 14,783,075 |
| Fidelity Series Emerging Markets Fund | 96,622,467 | 977,568 | 3,954,499 | -- | 105,945,793 |
| Fidelity Series Equity-Income Fund | 56,664,913 | 992,514 | 6,362,799 | 488,734 | 55,482,281 |
| Fidelity Series Floating Rate High Income Fund | 5,418,638 | 161,164 | 305,189 | 119,628 | 5,536,405 |
| Fidelity Series Government Money Market Fund 0.29% | -- | 385,610,736 | 10,957,747 | 349,448 | 374,652,989 |
| Fidelity Series Growth & Income Fund | 43,465,994 | 749,462 | 6,517,150 | 353,001 | 40,862,349 |
| Fidelity Series Growth Company Fund | 52,047,879 | -- | 9,944,055 | -- | 46,686,594 |
| Fidelity Series High Income Fund | 66,012,169 | 1,905,266 | 3,124,879 | 1,905,285 | 69,980,350 |
| Fidelity Series Inflation-Protected Bond Index Fund | 82,864,420 | 4,257,198 | 4,051,054 | 35,468 | 84,655,220 |
| Fidelity Series International Growth Fund | 44,489,196 | 10,546,374 | 3,940,899 | -- | 53,538,025 |
| Fidelity Series International Small Cap Fund | 11,162,200 | 2,298,765 | 1,533,661 | -- | 12,302,041 |
| Fidelity Series International Value Fund | 44,139,893 | 11,889,360 | 4,240,410 | -- | 53,753,616 |
| Fidelity Series Intrinsic Opportunities Fund | 33,163,750 | 491,364 | 1,408,201 | 233,071 | 34,270,073 |
| Fidelity Series Investment Grade Bond Fund | 847,712,225 | 17,540,282 | 67,658,660 | 10,260,149 | 819,555,605 |
| Fidelity Series Long-Term Treasury Bond Index Fund | -- | 909,559 | 40,458 | 3,667 | 838,225 |
| Fidelity Series Opportunistic Insights Fund | 28,245,045 | 220,467 | 2,830,280 | -- | 27,004,278 |
| Fidelity Series Real Estate Equity Fund | 5,209,839 | 298,999 | 517,435 | 44,105 | 4,883,620 |
| Fidelity Series Real Estate Income Fund | 10,578,572 | 746,915 | 792,441 | 265,313 | 10,864,714 |
| Fidelity Series Short-Term Credit Fund | 194,899,180 | 13,024,263 | 9,785,336 | 962,106 | 198,927,607 |
| Fidelity Series Small Cap Discovery Fund | 7,366,759 | 69,195 | 477,300 | 9,354 | 7,363,648 |
| Fidelity Series Small Cap Opportunities Fund | 22,720,796 | 234,692 | 2,750,922 | 56,209 | 22,067,188 |
| Fidelity Series Stock Selector Large Cap Value Fund | 37,527,034 | 487,034 | 4,476,536 | -- | 35,961,463 |
| Total | $2,185,005,362 | $468,538,721 | $544,486,298 | $15,687,772 | $2,185,522,028 |
Investment Valuation
All investments are categorized as Level 1 under the Fair Value Hierarchy. The inputs or methodology used for valuing securities may not be an indication of the risk associated with investing in those securities. For more information on valuation inputs please refer to the Investment Valuation section in the accompanying Notes to Financial Statements.
See accompanying notes which are an integral part of the financial statements.
Fidelity Freedom® Income Fund
Financial Statements
Statement of Assets and Liabilities
| | | September 30, 2016 (Unaudited) |
| Assets | | |
| Investment in securities, at value (cost $2,027,335,110) — See accompanying schedule | | $2,185,522,028 |
| Cash | | 15 |
| Receivable for investments sold | | 5,544,518 |
| Receivable for fund shares sold | | 1,357,590 |
| Total assets | | 2,192,424,151 |
| Liabilities | | |
| Payable for investments purchased | $4,858,567 | |
| Payable for fund shares redeemed | 2,043,293 | |
| Total liabilities | | 6,901,860 |
| Net Assets | | $2,185,522,291 |
| Net Assets consist of: | | |
| Paid in capital | | $2,018,052,689 |
| Undistributed net investment income | | 2,928,323 |
| Accumulated undistributed net realized gain (loss) on investments | | 6,354,361 |
| Net unrealized appreciation (depreciation) on investments | | 158,186,918 |
| Net Assets, for 188,648,052 shares outstanding | | $2,185,522,291 |
| Net Asset Value, offering price and redemption price per share ($2,185,522,291 ÷ 188,648,052 shares) | | $11.59 |
See accompanying notes which are an integral part of the financial statements.
Statement of Operations
| | | Six months ended September 30, 2016 (Unaudited) |
| Investment Income | | |
| Income distributions from underlying funds | | $15,687,772 |
| Expenses | | |
| Independent trustees' fees and expenses | $4,913 | |
| Total expenses before reductions | 4,913 | |
| Expense reductions | (4,913) | – |
| Net investment income (loss) | | 15,687,772 |
| Realized and Unrealized Gain (Loss) | | |
| Realized gain (loss) on sale of underlying fund shares | 10,122,878 | |
| Capital gain distributions from underlying funds | 407,124 | |
| Total net realized gain (loss) | | 10,530,002 |
| Change in net unrealized appreciation (depreciation) on underlying funds | | 66,341,359 |
| Net gain (loss) | | 76,871,361 |
| Net increase (decrease) in net assets resulting from operations | | $92,559,133 |
See accompanying notes which are an integral part of the financial statements.
Statement of Changes in Net Assets
| | Six months ended September 30, 2016 (Unaudited) | Year ended March 31, 2016 |
| Increase (Decrease) in Net Assets | | |
| Operations | | |
| Net investment income (loss) | $15,687,772 | $42,955,658 |
| Net realized gain (loss) | 10,530,002 | 34,989,521 |
| Change in net unrealized appreciation (depreciation) | 66,341,359 | (91,022,412) |
| Net increase (decrease) in net assets resulting from operations | 92,559,133 | (13,077,233) |
| Distributions to shareholders from net investment income | (15,863,903) | (43,111,926) |
| Distributions to shareholders from net realized gain | (14,926,030) | (44,541,931) |
| Total distributions | (30,789,933) | (87,653,857) |
| Share transactions | | |
| Proceeds from sales of shares | 143,994,860 | 340,518,385 |
| Reinvestment of distributions | 30,170,562 | 86,153,088 |
| Cost of shares redeemed | (235,406,179) | (624,794,718) |
| Net increase (decrease) in net assets resulting from share transactions | (61,240,757) | (198,123,245) |
| Total increase (decrease) in net assets | 528,443 | (298,854,335) |
| Net Assets | | |
| Beginning of period | 2,184,993,848 | 2,483,848,183 |
| End of period | $2,185,522,291 | $2,184,993,848 |
| Other Information | | |
| Undistributed net investment income end of period | $2,928,323 | $3,104,454 |
| Shares | | |
| Sold | 12,615,456 | 29,980,171 |
| Issued in reinvestment of distributions | 2,670,990 | 7,584,354 |
| Redeemed | (20,642,373) | (54,997,625) |
| Net increase (decrease) | (5,355,927) | (17,433,100) |
See accompanying notes which are an integral part of the financial statements.
Financial Highlights — Fidelity Freedom Income Fund
| | Six months ended (Unaudited) September 30, | Years ended March 31, | | | | |
| | 2016 | 2016 | 2015 | 2014 | 2013 | 2012 |
| Selected Per–Share Data | | | | | | |
| Net asset value, beginning of period | $11.26 | $11.75 | $11.86 | $11.91 | $11.60 | $11.48 |
| Income from Investment Operations | | | | | | |
| Net investment income (loss)A | .08 | .21 | .21 | .16 | .15 | .18 |
| Net realized and unrealized gain (loss) | .41 | (.27) | .28 | .30 | .40 | .21 |
| Total from investment operations | .49 | (.06) | .49 | .46 | .55 | .39 |
| Distributions from net investment income | (.08) | (.21) | (.20) | (.16) | (.16) | (.19) |
| Distributions from net realized gain | (.08) | (.22) | (.40) | (.35) | (.08) | (.08) |
| Total distributions | (.16) | (.43) | (.60) | (.51) | (.24) | (.27) |
| Net asset value, end of period | $11.59 | $11.26 | $11.75 | $11.86 | $11.91 | $11.60 |
| Total ReturnB,C | 4.40% | (.45)% | 4.31% | 3.95% | 4.79% | 3.47% |
| Ratios to Average Net AssetsD,E | | | | | | |
| Expenses before reductionsF | - %G | -% | -% | -% | -% | -% |
| Expenses net of fee waivers, if any | - %G | -% | -% | -% | -% | -% |
| Expenses net of all reductions | - %G | -% | -% | -% | -% | -% |
| Net investment income (loss) | 1.44%G | 1.86% | 1.77% | 1.37% | 1.32% | 1.58% |
| Supplemental Data | | | | | | |
| Net assets, end of period (000 omitted) | $2,185,522 | $2,184,994 | $2,483,848 | $1,935,210 | $2,191,666 | $2,383,705 |
| Portfolio turnover rateD | 43%G | 20% | 26%H | 31% | 14% | 20% |
A Calculated based on average shares outstanding during the period.
B Total returns for periods of less than one year are not annualized.
C Total returns would have been lower if certain expenses had not been reduced during the applicable periods shown.
D Amounts do not include the activity of the Underlying Funds.
E Expense ratios reflect operating expenses of the Fund. Expenses before reductions do not reflect amounts reimbursed by the investment adviser or reductions from expense offset arrangements and do not represent the amount paid by the Fund during periods when reimbursements or reductions occur. Expenses net of fee waivers reflect expenses after reimbursement by the investment adviser but prior to reductions from expense offset arrangements. Expenses net of all reductions represent the net expenses paid by the Fund but do not include expenses of the underlying funds in which the Fund invests.
F Amount represents less than .005%.
G Annualized
H The portfolio turnover rate does not include the assets acquired in the merger.
See accompanying notes which are an integral part of the financial statements.
Fidelity Freedom® 2005 Fund
Investment Summary (Unaudited)
The information in the following tables is based on the direct investments of the Fund.
Top Holdings as of September 30, 2016
| | % of fund's net assets | % of fund's net assets 6 months ago |
| Fidelity Series Investment Grade Bond Fund | 33.3 | 34.5 |
| Fidelity Series Government Money Market Fund 0.29% | 12.4 | 0.0 |
| Fidelity Series Short-Term Credit Fund | 6.6 | 6.1 |
| Fidelity Series Emerging Markets Fund | 6.0 | 5.5 |
| Fidelity Series Equity-Income Fund | 3.9 | 3.9 |
| Fidelity Series International Value Fund | 3.7 | 3.3 |
| Fidelity Series International Growth Fund | 3.7 | 3.4 |
| Fidelity Series Inflation-Protected Bond Index Fund | 3.4 | 3.3 |
| Fidelity Series Growth Company Fund | 3.3 | 3.6 |
| Fidelity Series High Income Fund | 3.1 | 3.0 |
| | 79.4 | 66.6 |
Asset Allocation (% of fund's net assets)
| Period end |
| | Domestic Equity Funds | 25.6% |
| | International Equity Funds | 14.2% |
| | Bond Funds | 41.2% |
| | Short-Term Funds | 19.0% |

| Six months ago |
| | Domestic Equity Funds | 27.4% |
| | International Equity Funds | 13.0% |
| | Bond Funds | 42.1% |
| | Short-Term Funds | 17.5% |

Domestic Equity Funds category includes Fidelity Series Commodity Strategy Fund which invests in commodity-related investments.
Percentages shown as 0.0% may reflect amounts less than 0.05%.
Fidelity Freedom® 2005 Fund
Investments September 30, 2016 (Unaudited)
Showing Percentage of Net Assets
| Domestic Equity Funds - 25.6% | | | |
| | | Shares | Value |
| Fidelity Series 100 Index Fund (a) | | 350,242 | $5,001,451 |
| Fidelity Series 1000 Value Index Fund (a) | | 283,212 | 3,163,479 |
| Fidelity Series All-Sector Equity Fund (a) | | 702,319 | 9,432,143 |
| Fidelity Series Blue Chip Growth Fund (a) | | 983,505 | 11,536,519 |
| Fidelity Series Commodity Strategy Fund (a)(b) | | 1,806,460 | 9,556,173 |
| Fidelity Series Equity-Income Fund (a) | | 1,856,606 | 22,966,212 |
| Fidelity Series Growth & Income Fund (a) | | 1,259,345 | 16,862,626 |
| Fidelity Series Growth Company Fund (a) | | 1,463,053 | 19,619,539 |
| Fidelity Series Intrinsic Opportunities Fund (a) | | 943,299 | 14,177,789 |
| Fidelity Series Opportunistic Insights Fund (a) | | 728,643 | 11,148,241 |
| Fidelity Series Real Estate Equity Fund (a) | | 142,170 | 1,957,686 |
| Fidelity Series Small Cap Discovery Fund (a) | | 284,706 | 3,000,804 |
| Fidelity Series Small Cap Opportunities Fund (a) | | 692,943 | 9,112,196 |
| Fidelity Series Stock Selector Large Cap Value Fund (a) | | 1,253,893 | 14,783,397 |
| TOTAL DOMESTIC EQUITY FUNDS | | | |
| (Cost $134,340,584) | | | 152,318,255 |
|
| International Equity Funds - 14.2% | | | |
| Fidelity Series Emerging Markets Fund (a) | | 2,122,883 | 35,706,886 |
| Fidelity Series International Growth Fund (a) | | 1,547,242 | 21,661,388 |
| Fidelity Series International Small Cap Fund (a) | | 319,691 | 4,977,584 |
| Fidelity Series International Value Fund (a) | | 2,294,179 | 21,748,818 |
| TOTAL INTERNATIONAL EQUITY FUNDS | | | |
| (Cost $79,069,455) | | | 84,094,676 |
|
| Bond Funds - 41.2% | | | |
| Fidelity Series Emerging Markets Debt Fund (a) | | 386,595 | 4,005,121 |
| Fidelity Series Floating Rate High Income Fund (a) | | 159,018 | 1,497,949 |
| Fidelity Series High Income Fund (a) | | 1,951,104 | 18,262,330 |
| Fidelity Series Inflation-Protected Bond Index Fund (a) | | 2,010,027 | 20,240,973 |
| Fidelity Series Investment Grade Bond Fund (a) | | 17,035,867 | 197,616,056 |
| Fidelity Series Long-Term Treasury Bond Index Fund (a) | | 21,062 | 203,252 |
| Fidelity Series Real Estate Income Fund (a) | | 263,820 | 2,960,062 |
| TOTAL BOND FUNDS | | | |
| (Cost $243,524,729) | | | 244,785,743 |
|
| Short-Term Funds - 19.0% | | | |
| Fidelity Series Government Money Market Fund 0.29% (a)(c) | | 73,724,410 | 73,724,410 |
| Fidelity Series Short-Term Credit Fund (a) | | 3,885,794 | 38,974,515 |
| TOTAL SHORT-TERM FUNDS | | | |
| (Cost $112,535,774) | | | 112,698,925 |
| TOTAL INVESTMENT PORTFOLIO - 100.0% | | | |
| (Cost $569,470,542) | | | 593,897,599 |
| NET OTHER ASSETS (LIABILITIES) - 0.0% | | | (2) |
| NET ASSETS - 100% | | | $593,897,597 |
(a) Affiliated Fund
(b) Non-income producing
(c) The rate quoted is the annualized seven-day yield of the fund at period end.
Affiliated Underlying Funds
Information regarding the Fund's fiscal year to date purchases and sales of the affiliated Underlying Funds and income earned by the Fund from investments in affiliated Underlying Funds is as follows:
| Affiliate | Value, beginning of period | Purchases | Sales Proceeds | Dividend Income | Value, end of period |
| Fidelity Investments Money Market Portfolio Institutional Class 0.59% | $65,892,539 | $2,322,591 | $68,215,130 | $29,256 | $-- |
| Fidelity Series 100 Index Fund | 5,365,127 | 199,331 | 881,814 | -- | 5,001,451 |
| Fidelity Series 1000 Value Index Fund | 3,021,695 | 235,251 | 334,340 | -- | 3,163,479 |
| Fidelity Series All-Sector Equity Fund | 16,915,125 | 481,996 | 9,015,282 | -- | 9,432,143 |
| Fidelity Series Blue Chip Growth Fund | 11,726,340 | 444,586 | 1,555,764 | 21,372 | 11,536,519 |
| Fidelity Series Commodity Strategy Fund | 7,120,211 | 2,401,168 | 510,212 | -- | 9,556,173 |
| Fidelity Series Emerging Markets Debt Fund | 3,664,088 | 227,930 | 223,519 | 105,847 | 4,005,121 |
| Fidelity Series Emerging Markets Fund | 31,847,587 | 1,469,157 | 1,783,057 | -- | 35,706,886 |
| Fidelity Series Equity-Income Fund | 22,718,658 | 1,039,788 | 2,506,219 | 198,722 | 22,966,212 |
| Fidelity Series Floating Rate High Income Fund | 1,436,893 | 82,744 | 91,806 | 32,203 | 1,497,949 |
| Fidelity Series Government Money Market Fund 0.29% | -- | 76,751,764 | 3,027,354 | 67,260 | 73,724,410 |
| Fidelity Series Growth & Income Fund | 17,427,013 | 786,853 | 2,652,393 | 142,783 | 16,862,626 |
| Fidelity Series Growth Company Fund | 20,895,964 | 30,787 | 3,204,227 | -- | 19,619,539 |
| Fidelity Series High Income Fund | 17,336,181 | 585,403 | 1,025,344 | 501,301 | 18,262,330 |
| Fidelity Series Inflation-Protected Bond Index Fund | 19,260,452 | 1,839,033 | 1,235,192 | 8,406 | 20,240,973 |
| Fidelity Series International Growth Fund | 19,580,892 | 3,044,302 | 2,000,627 | -- | 21,661,388 |
| Fidelity Series International Small Cap Fund | 4,823,384 | 616,683 | 625,720 | -- | 4,977,584 |
| Fidelity Series International Value Fund | 19,429,842 | 3,631,081 | 2,134,641 | -- | 21,748,818 |
| Fidelity Series Intrinsic Opportunities Fund | 13,249,891 | 569,647 | 471,041 | 96,197 | 14,177,789 |
| Fidelity Series Investment Grade Bond Fund | 200,158,154 | 9,577,312 | 17,356,087 | 2,449,721 | 197,616,055 |
| Fidelity Series Long-Term Treasury Bond Index Fund | -- | 222,723 | 11,988 | 886 | 203,252 |
| Fidelity Series Opportunistic Insights Fund | 11,324,594 | 403,569 | 1,146,687 | -- | 11,148,241 |
| Fidelity Series Real Estate Equity Fund | 2,088,673 | 200,939 | 291,882 | 17,913 | 1,957,686 |
| Fidelity Series Real Estate Income Fund | 2,839,983 | 277,083 | 247,570 | 72,028 | 2,960,062 |
| Fidelity Series Short-Term Credit Fund | 35,463,434 | 5,743,030 | 2,379,688 | 182,804 | 38,974,515 |
| Fidelity Series Small Cap Discovery Fund | 2,985,525 | 113,909 | 264,697 | 3,801 | 3,000,804 |
| Fidelity Series Small Cap Opportunities Fund | 9,109,662 | 344,047 | 1,110,348 | 23,155 | 9,112,196 |
| Fidelity Series Stock Selector Large Cap Value Fund | 15,046,600 | 565,378 | 1,819,548 | -- | 14,783,398 |
| Total | $580,728,507 | $114,208,085 | $126,122,177 | $3,953,655 | $593,897,599 |
Investment Valuation
All investments are categorized as Level 1 under the Fair Value Hierarchy. The inputs or methodology used for valuing securities may not be an indication of the risk associated with investing in those securities. For more information on valuation inputs please refer to the Investment Valuation section in the accompanying Notes to Financial Statements.
See accompanying notes which are an integral part of the financial statements.
Fidelity Freedom® 2005 Fund
Financial Statements
Statement of Assets and Liabilities
| | | September 30, 2016 (Unaudited) |
| Assets | | |
| Investment in securities, at value (cost $569,470,542) — See accompanying schedule | | $593,897,599 |
| Receivable for investments sold | | 2,130,650 |
| Receivable for fund shares sold | | 430,897 |
| Total assets | | 596,459,146 |
| Liabilities | | |
| Payable for investments purchased | $2,328,870 | |
| Payable for fund shares redeemed | 232,679 | |
| Total liabilities | | 2,561,549 |
| Net Assets | | $593,897,597 |
| Net Assets consist of: | | |
| Paid in capital | | $567,361,653 |
| Undistributed net investment income | | 3,934,624 |
| Accumulated undistributed net realized gain (loss) on investments | | (1,825,737) |
| Net unrealized appreciation (depreciation) on investments | | 24,427,057 |
| Net Assets, for 49,032,225 shares outstanding | | $593,897,597 |
| Net Asset Value, offering price and redemption price per share ($593,897,597 ÷ 49,032,225 shares) | | $12.11 |
See accompanying notes which are an integral part of the financial statements.
Statement of Operations
| | | Six months ended September 30, 2016 (Unaudited) |
| Investment Income | | |
| Income distributions from underlying funds | | $3,953,655 |
| Expenses | | |
| Independent trustees' fees and expenses | $1,321 | |
| Total expenses before reductions | 1,321 | |
| Expense reductions | (1,321) | – |
| Net investment income (loss) | | 3,953,655 |
| Realized and Unrealized Gain (Loss) | | |
| Realized gain (loss) on sale of underlying fund shares | 638,825 | |
| Capital gain distributions from underlying funds | 147,656 | |
| Total net realized gain (loss) | | 786,481 |
| Change in net unrealized appreciation (depreciation) on underlying funds | | 24,444,350 |
| Net gain (loss) | | 25,230,831 |
| Net increase (decrease) in net assets resulting from operations | | $29,184,486 |
See accompanying notes which are an integral part of the financial statements.
Statement of Changes in Net Assets
| | Six months ended September 30, 2016 (Unaudited) | Year ended March 31, 2016 |
| Increase (Decrease) in Net Assets | | |
| Operations | | |
| Net investment income (loss) | $3,953,655 | $11,270,613 |
| Net realized gain (loss) | 786,481 | 9,014,948 |
| Change in net unrealized appreciation (depreciation) | 24,444,350 | (27,042,171) |
| Net increase (decrease) in net assets resulting from operations | 29,184,486 | (6,756,610) |
| Distributions to shareholders from net investment income | (1,877,895) | (11,241,531) |
| Distributions to shareholders from net realized gain | (4,695,326) | (11,940,080) |
| Total distributions | (6,573,221) | (23,181,611) |
| Share transactions | | |
| Proceeds from sales of shares | 51,122,505 | 93,826,166 |
| Reinvestment of distributions | 6,519,990 | 23,010,988 |
| Cost of shares redeemed | (67,082,632) | (145,895,309) |
| Net increase (decrease) in net assets resulting from share transactions | (9,440,137) | (29,058,155) |
| Total increase (decrease) in net assets | 13,171,128 | (58,996,376) |
| Net Assets | | |
| Beginning of period | 580,726,469 | 639,722,845 |
| End of period | $593,897,597 | $580,726,469 |
| Other Information | | |
| Undistributed net investment income end of period | $3,934,624 | $1,858,864 |
| Shares | | |
| Sold | 4,316,875 | 7,967,595 |
| Issued in reinvestment of distributions | 563,527 | 1,953,066 |
| Redeemed | (5,649,555) | (12,384,046) |
| Net increase (decrease) | (769,153) | (2,463,385) |
See accompanying notes which are an integral part of the financial statements.
Financial Highlights — Fidelity Freedom 2005 Fund
| | Six months ended (Unaudited) September 30, | Years ended March 31, | | | | |
| | 2016 | 2016 | 2015 | 2014 | 2013 | 2012 |
| Selected Per–Share Data | | | | | | |
| Net asset value, beginning of period | $11.66 | $12.24 | $12.01 | $11.53 | $11.11 | $11.13 |
| Income from Investment Operations | | | | | | |
| Net investment income (loss)A | .08 | .22 | .22 | .16 | .15 | .17 |
| Net realized and unrealized gain (loss) | .50 | (.34) | .40 | .58 | .51 | .12 |
| Total from investment operations | .58 | (.12) | .62 | .74 | .66 | .29 |
| Distributions from net investment income | (.04) | (.22) | (.23) | (.15) | (.17) | (.18) |
| Distributions from net realized gain | (.10) | (.23) | (.17) | (.10) | (.07) | (.13) |
| Total distributions | (.13)B | (.46)C | (.39)D | (.26)E | (.24) | (.31) |
| Net asset value, end of period | $12.11 | $11.66 | $12.24 | $12.01 | $11.53 | $11.11 |
| Total ReturnF,G | 5.05% | (1.01)% | 5.26% | 6.43% | 5.99% | 2.76% |
| Ratios to Average Net AssetsH,I | | | | | | |
| Expenses before reductionsJ | - %K | -% | -% | -% | -% | -% |
| Expenses net of fee waivers, if any | - %K | -% | -% | -% | -% | -% |
| Expenses net of all reductions | - %K | -% | -% | -% | -% | -% |
| Net investment income (loss) | 1.34%K | 1.87% | 1.79% | 1.38% | 1.38% | 1.58% |
| Supplemental Data | | | | | | |
| Net assets, end of period (000 omitted) | $593,898 | $580,726 | $639,723 | $668,987 | $704,183 | $797,849 |
| Portfolio turnover rateH | 39%K | 22% | 23% | 44% | 22% | 29% |
A Calculated based on average shares outstanding during the period.
B Total distributions of $.13 per share is comprised of distributions from net investment income of $.038 and distributions from net realized gain of $.095 per share.
C Total distributions of $.46 per share is comprised of distributions from net investment income of $.223 and distributions from net realized gain of $.234 per share.
D Total distributions of $.39 per share is comprised of distributions from net investment income of $.225 and distributions from net realized gain of $.168 per share.
E Total distributions of $.26 per share is comprised of distributions from net investment income of $.153 and distributions from net realized gain of $.103 per share.
F Total returns for periods of less than one year are not annualized.
G Total returns would have been lower if certain expenses had not been reduced during the applicable periods shown.
H Amounts do not include the activity of the Underlying Funds.
I Expense ratios reflect operating expenses of the Fund. Expenses before reductions do not reflect amounts reimbursed by the investment adviser or reductions from expense offset arrangements and do not represent the amount paid by the Fund during periods when reimbursements or reductions occur. Expenses net of fee waivers reflect expenses after reimbursement by the investment adviser but prior to reductions from expense offset arrangements. Expenses net of all reductions represent the net expenses paid by the Fund but do not include expenses of the underlying funds in which the Fund invests.
J Amount represents less than .005%.
K Annualized
See accompanying notes which are an integral part of the financial statements.
Fidelity Freedom® 2010 Fund
Investment Summary (Unaudited)
The information in the following tables is based on the direct investments of the Fund.
Top Holdings as of September 30, 2016
| | % of fund's net assets | % of fund's net assets 6 months ago |
| Fidelity Series Investment Grade Bond Fund | 29.8 | 31.4 |
| Fidelity Series Government Money Market Fund 0.29% | 9.1 | 0.0 |
| Fidelity Series Emerging Markets Fund | 6.9 | 6.3 |
| Fidelity Series Equity-Income Fund | 4.8 | 4.8 |
| Fidelity Series Short-Term Credit Fund | 4.8 | 4.2 |
| Fidelity Series International Value Fund | 4.6 | 4.3 |
| Fidelity Series International Growth Fund | 4.6 | 4.3 |
| Fidelity Series Growth Company Fund | 4.2 | 4.5 |
| Fidelity Series Growth & Income Fund | 3.6 | 3.7 |
| Fidelity Series High Income Fund | 3.1 | 3.0 |
| | 75.5 | 66.5 |
Asset Allocation (% of fund's net assets)
| Period end |
| | Domestic Equity Funds | 31.8% |
| | International Equity Funds | 17.1% |
| | Bond Funds | 37.2% |
| | Short-Term Funds | 13.9% |
| Six months ago |
| | Domestic Equity Funds | 33.6% |
| | International Equity Funds | 16.0% |
| | Bond Funds | 38.4% |
| | Short-Term Funds | 12.0% |

Domestic Equity Funds category includes Fidelity Series Commodity Strategy Fund which invests in commodity-related investments.
Percentages shown as 0.0% may reflect amounts less than 0.05%.
Fidelity Freedom® 2010 Fund
Investments September 30, 2016 (Unaudited)
Showing Percentage of Net Assets
| Domestic Equity Funds - 31.8% | | | |
| | | Shares | Value |
| Fidelity Series 100 Index Fund (a) | | 3,140,558 | $44,847,164 |
| Fidelity Series 1000 Value Index Fund (a) | | 2,843,785 | 31,765,080 |
| Fidelity Series All-Sector Equity Fund (a) | | 6,297,538 | 84,575,933 |
| Fidelity Series Blue Chip Growth Fund (a) | | 8,933,175 | 104,786,143 |
| Fidelity Series Commodity Strategy Fund (a)(b) | | 12,892,270 | 68,200,106 |
| Fidelity Series Equity-Income Fund (a) | | 16,551,799 | 204,745,749 |
| Fidelity Series Growth & Income Fund (a) | | 11,397,770 | 152,616,139 |
| Fidelity Series Growth Company Fund (a) | | 13,236,587 | 177,502,629 |
| Fidelity Series Intrinsic Opportunities Fund (a) | | 8,357,415 | 125,611,954 |
| Fidelity Series Opportunistic Insights Fund (a) | | 6,470,768 | 99,002,751 |
| Fidelity Series Real Estate Equity Fund (a) | | 1,265,344 | 17,423,786 |
| Fidelity Series Small Cap Discovery Fund (a) | | 2,489,852 | 26,243,042 |
| Fidelity Series Small Cap Opportunities Fund (a) | | 6,194,113 | 81,452,591 |
| Fidelity Series Stock Selector Large Cap Value Fund (a) | | 11,189,431 | 131,923,386 |
| TOTAL DOMESTIC EQUITY FUNDS | | | |
| (Cost $1,129,553,935) | | | 1,350,696,453 |
|
| International Equity Funds - 17.1% | | | |
| Fidelity Series Emerging Markets Fund (a) | | 17,356,756 | 291,940,636 |
| Fidelity Series International Growth Fund (a) | | 13,808,144 | 193,314,020 |
| Fidelity Series International Small Cap Fund (a) | | 2,853,347 | 44,426,620 |
| Fidelity Series International Value Fund (a) | | 20,474,192 | 194,095,341 |
| TOTAL INTERNATIONAL EQUITY FUNDS | | | |
| (Cost $666,831,587) | | | 723,776,617 |
|
| Bond Funds - 37.2% | | | |
| Fidelity Series Emerging Markets Debt Fund (a) | | 2,784,974 | 28,852,329 |
| Fidelity Series Floating Rate High Income Fund (a) | | 1,135,487 | 10,696,288 |
| Fidelity Series High Income Fund (a) | | 14,255,745 | 133,433,772 |
| Fidelity Series Inflation-Protected Bond Index Fund (a) | | 11,671,379 | 117,530,782 |
| Fidelity Series Investment Grade Bond Fund (a) | | 109,032,190 | 1,264,773,400 |
| Fidelity Series Long-Term Treasury Bond Index Fund (a) | | 133,389 | 1,287,201 |
| Fidelity Series Real Estate Income Fund (a) | | 1,894,899 | 21,260,770 |
| TOTAL BOND FUNDS | | | |
| (Cost $1,566,220,300) | | | 1,577,834,542 |
|
| Short-Term Funds - 13.9% | | | |
| Fidelity Series Government Money Market Fund 0.29% (a)(c) | | 387,627,563 | 387,627,563 |
| Fidelity Series Short-Term Credit Fund (a) | | 20,221,537 | 202,822,019 |
| TOTAL SHORT-TERM FUNDS | | | |
| (Cost $589,643,683) | | | 590,449,582 |
| TOTAL INVESTMENT PORTFOLIO - 100.0% | | | |
| (Cost $3,952,249,505) | | | 4,242,757,194 |
| NET OTHER ASSETS (LIABILITIES) - 0.0% | | | (2,119) |
| NET ASSETS - 100% | | | $4,242,755,075 |
(a) Affiliated Fund
(b) Non-income producing
(c) The rate quoted is the annualized seven-day yield of the fund at period end.
Affiliated Underlying Funds
Information regarding the Fund's fiscal year to date purchases and sales of the affiliated Underlying Funds and income earned by the Fund from investments in affiliated Underlying Funds is as follows:
| Affiliate | Value, beginning of period | Purchases | Sales Proceeds | Dividend Income | Value, end of period |
| Fidelity Investments Money Market Portfolio Institutional Class 0.59% | $333,794,019 | $27,558,867 | $361,352,886 | $152,237 | $-- |
| Fidelity Series 100 Index Fund | 48,848,820 | 205,061 | 7,046,382 | -- | 44,847,164 |
| Fidelity Series 1000 Value Index Fund | 27,512,386 | 5,092,628 | 2,971,514 | -- | 31,765,080 |
| Fidelity Series All-Sector Equity Fund | 154,011,522 | 659,638 | 79,497,471 | -- | 84,575,933 |
| Fidelity Series Blue Chip Growth Fund | 106,766,081 | 502,181 | 10,641,011 | 189,795 | 104,786,143 |
| Fidelity Series Commodity Strategy Fund | 52,237,192 | 15,821,129 | 3,869,356 | -- | 68,200,106 |
| Fidelity Series Emerging Markets Debt Fund | 27,178,382 | 838,713 | 1,616,056 | 771,411 | 28,852,329 |
| Fidelity Series Emerging Markets Fund | 269,058,869 | 3,763,849 | 15,097,724 | -- | 291,940,636 |
| Fidelity Series Equity-Income Fund | 206,852,207 | 2,419,372 | 19,850,996 | 1,789,548 | 204,745,749 |
| Fidelity Series Floating Rate High Income Fund | 10,436,653 | 420,120 | 665,739 | 231,361 | 10,696,288 |
| Fidelity Series Government Money Market Fund 0.29% | -- | 404,332,437 | 16,704,874 | 352,904 | 387,627,563 |
| Fidelity Series Growth & Income Fund | 158,669,435 | 1,970,705 | 19,647,327 | 1,292,948 | 152,616,139 |
| Fidelity Series Growth Company Fund | 190,226,232 | -- | 29,884,064 | -- | 177,502,629 |
| Fidelity Series High Income Fund | 127,505,770 | 3,665,614 | 7,724,270 | 3,665,670 | 133,433,772 |
| Fidelity Series Inflation-Protected Bond Index Fund | 114,095,136 | 8,435,317 | 7,189,985 | 49,078 | 117,530,782 |
| Fidelity Series International Growth Fund | 184,198,204 | 17,638,527 | 17,880,479 | -- | 193,314,020 |
| Fidelity Series International Small Cap Fund | 45,080,936 | 3,218,928 | 5,319,448 | -- | 44,426,620 |
| Fidelity Series International Value Fund | 182,795,955 | 23,088,870 | 19,150,946 | -- | 194,095,341 |
| Fidelity Series Intrinsic Opportunities Fund | 119,860,088 | 1,211,880 | 2,877,020 | 854,744 | 125,611,954 |
| Fidelity Series Investment Grade Bond Fund | 1,342,465,122 | 20,777,777 | 132,527,617 | 15,902,683 | 1,264,773,400 |
| Fidelity Series Long-Term Treasury Bond Index Fund | -- | 1,419,265 | 83,997 | 5,601 | 1,287,201 |
| Fidelity Series Opportunistic Insights Fund | 103,110,321 | 302,777 | 9,453,583 | -- | 99,002,751 |
| Fidelity Series Real Estate Equity Fund | 19,018,140 | 1,076,201 | 2,321,997 | 159,267 | 17,423,786 |
| Fidelity Series Real Estate Income Fund | 21,066,095 | 1,371,334 | 1,836,262 | 524,757 | 21,260,770 |
| Fidelity Series Short-Term Credit Fund | 179,323,503 | 35,241,502 | 12,521,000 | 956,573 | 202,822,019 |
| Fidelity Series Small Cap Discovery Fund | 27,125,610 | 177,420 | 2,534,636 | 34,121 | 26,243,042 |
| Fidelity Series Small Cap Opportunities Fund | 82,937,621 | 450,754 | 8,785,300 | 205,591 | 81,452,591 |
| Fidelity Series Stock Selector Large Cap Value Fund | 136,996,500 | 435,100 | 14,395,383 | -- | 131,923,386 |
| Total | $4,271,170,799 | $582,095,966 | $813,447,323 | $27,138,289 | $4,242,757,194 |
Investment Valuation
All investments are categorized as Level 1 under the Fair Value Hierarchy. The inputs or methodology used for valuing securities may not be an indication of the risk associated with investing in those securities. For more information on valuation inputs please refer to the Investment Valuation section in the accompanying Notes to Financial Statements.
See accompanying notes which are an integral part of the financial statements.
Fidelity Freedom® 2010 Fund
Financial Statements
Statement of Assets and Liabilities
| | | September 30, 2016 (Unaudited) |
| Assets | | |
| Investment in securities, at value (cost $3,952,249,505) — See accompanying schedule | | $4,242,757,194 |
| Receivable for investments sold | | 22,572,443 |
| Receivable for fund shares sold | | 1,525,202 |
| Other receivables | | 69,344 |
| Total assets | | 4,266,924,183 |
| Liabilities | | |
| Payable for investments purchased | $13,163,279 | |
| Payable for fund shares redeemed | 10,936,488 | |
| Other payables and accrued expenses | 69,341 | |
| Total liabilities | | 24,169,108 |
| Net Assets | | $4,242,755,075 |
| Net Assets consist of: | | |
| Paid in capital | | $3,924,897,547 |
| Undistributed net investment income | | 26,989,258 |
| Accumulated undistributed net realized gain (loss) on investments | | 360,581 |
| Net unrealized appreciation (depreciation) on investments | | 290,507,689 |
| Net Assets, for 276,331,654 shares outstanding | | $4,242,755,075 |
| Net Asset Value, offering price and redemption price per share ($4,242,755,075 ÷ 276,331,654 shares) | | $15.35 |
See accompanying notes which are an integral part of the financial statements.
Statement of Operations
| | | Six months ended September 30, 2016 (Unaudited) |
| Investment Income | | |
| Income distributions from underlying funds | | $27,138,289 |
| Expenses | | |
| Independent trustees' fees and expenses | $9,593 | |
| Total expenses before reductions | 9,593 | |
| Expense reductions | (9,593) | – |
| Net investment income (loss) | | 27,138,289 |
| Realized and Unrealized Gain (Loss) | | |
| Realized gain (loss) on sale of underlying fund shares | 13,614,116 | |
| Capital gain distributions from underlying funds | 1,244,636 | |
| Total net realized gain (loss) | | 14,858,752 |
| Change in net unrealized appreciation (depreciation) on underlying funds | | 189,323,632 |
| Net gain (loss) | | 204,182,384 |
| Net increase (decrease) in net assets resulting from operations | | $231,320,673 |
See accompanying notes which are an integral part of the financial statements.
Statement of Changes in Net Assets
| | Six months ended September 30, 2016 (Unaudited) | Year ended March 31, 2016 |
| Increase (Decrease) in Net Assets | | |
| Operations | | |
| Net investment income (loss) | $27,138,289 | $84,856,074 |
| Net realized gain (loss) | 14,858,752 | 109,780,832 |
| Change in net unrealized appreciation (depreciation) | 189,323,632 | (268,430,453) |
| Net increase (decrease) in net assets resulting from operations | 231,320,673 | (73,793,547) |
| Distributions to shareholders from net investment income | (12,293,316) | (85,567,414) |
| Distributions to shareholders from net realized gain | (46,600,240) | (148,122,283) |
| Total distributions | (58,893,556) | (233,689,697) |
| Share transactions | | |
| Proceeds from sales of shares | 205,506,809 | 515,188,222 |
| Reinvestment of distributions | 58,128,529 | 230,831,705 |
| Cost of shares redeemed | (464,458,011) | (1,107,976,208) |
| Net increase (decrease) in net assets resulting from share transactions | (200,822,673) | (361,956,281) |
| Total increase (decrease) in net assets | (28,395,556) | (669,439,525) |
| Net Assets | | |
| Beginning of period | 4,271,150,631 | 4,940,590,156 |
| End of period | $4,242,755,075 | $4,271,150,631 |
| Other Information | | |
| Undistributed net investment income end of period | $26,989,258 | $12,144,285 |
| Shares | | |
| Sold | 13,701,842 | 34,147,494 |
| Issued in reinvestment of distributions | 3,986,868 | 15,340,249 |
| Redeemed | (31,000,528) | (73,632,012) |
| Net increase (decrease) | (13,311,818) | (24,144,269) |
See accompanying notes which are an integral part of the financial statements.
Financial Highlights — Fidelity Freedom 2010 Fund
| | Six months ended (Unaudited) September 30, | Years ended March 31, | | | | |
| | 2016 | 2016 | 2015 | 2014 | 2013 | 2012 |
| Selected Per–Share Data | | | | | | |
| Net asset value, beginning of period | $14.75 | $15.75 | $15.51 | $14.67 | $13.99 | $14.05 |
| Income from Investment Operations | | | | | | |
| Net investment income (loss)A | .10 | .28 | .28 | .22 | .22 | .23 |
| Net realized and unrealized gain (loss) | .71 | (.50) | .62 | .99 | .80 | .17 |
| Total from investment operations | .81 | (.22) | .90 | 1.21 | 1.02 | .40 |
| Distributions from net investment income | (.04) | (.29) | (.29) | (.21) | (.24) | (.26) |
| Distributions from net realized gain | (.16) | (.49) | (.36) | (.16) | (.10) | (.20) |
| Total distributions | (.21)B | (.78) | (.66)C | (.37) | (.34) | (.46) |
| Net asset value, end of period | $15.35 | $14.75 | $15.75 | $15.51 | $14.67 | $13.99 |
| Total ReturnD,E | 5.54% | (1.42)% | 5.91% | 8.31% | 7.43% | 3.01% |
| Ratios to Average Net AssetsF,G | | | | | | |
| Expenses before reductionsH | - %I | -% | -% | -% | -% | -% |
| Expenses net of fee waivers, if any | - %I | -% | -% | -% | -% | -% |
| Expenses net of all reductions | - %I | -% | -% | -% | -% | -% |
| Net investment income (loss) | 1.27%I | 1.86% | 1.81% | 1.43% | 1.54% | 1.67% |
| Supplemental Data | | | | | | |
| Net assets, end of period (000 omitted) | $4,242,755 | $4,271,151 | $4,940,590 | $5,419,921 | $5,879,292 | $7,060,086 |
| Portfolio turnover rateF | 27%I | 17% | 18% | 35% | 19% | 18% |
A Calculated based on average shares outstanding during the period.
B Total distributions of $.21 per share is comprised of distributions from net investment income of $.043 and distributions from net realized gain of $.163 per share.
C Total distributions of $.66 per share is comprised of distributions from net investment income of $.294 and distributions from net realized gain of $.361 per share.
D Total returns for periods of less than one year are not annualized.
E Total returns would have been lower if certain expenses had not been reduced during the applicable periods shown.
F Amounts do not include the activity of the Underlying Funds.
G Expense ratios reflect operating expenses of the Fund. Expenses before reductions do not reflect amounts reimbursed by the investment adviser or reductions from expense offset arrangements and do not represent the amount paid by the Fund during periods when reimbursements or reductions occur. Expenses net of fee waivers reflect expenses after reimbursement by the investment adviser but prior to reductions from expense offset arrangements. Expenses net of all reductions represent the net expenses paid by the Fund but do not include expenses of the underlying funds in which the Fund invests.
H Amount represents less than .005%.
I Annualized
See accompanying notes which are an integral part of the financial statements.
Fidelity Freedom® 2015 Fund
Investment Summary (Unaudited)
The information in the following tables is based on the direct investments of the Fund.
Top Holdings as of September 30, 2016
| | % of fund's net assets | % of fund's net assets 6 months ago |
| Fidelity Series Investment Grade Bond Fund | 26.2 | 28.5 |
| Fidelity Series Emerging Markets Fund | 7.5 | 6.9 |
| Fidelity Series Government Money Market Fund 0.29% | 6.1 | 0.0 |
| Fidelity Series Equity-Income Fund | 5.8 | 5.7 |
| Fidelity Series International Value Fund | 5.5 | 5.2 |
| Fidelity Series International Growth Fund | 5.5 | 5.2 |
| Fidelity Series Growth Company Fund | 5.1 | 5.3 |
| Fidelity Series Growth & Income Fund | 4.4 | 4.4 |
| Fidelity Series Stock Selector Large Cap Value Fund | 3.7 | 3.8 |
| Fidelity Series Intrinsic Opportunities Fund | 3.5 | 3.3 |
| | 73.3 | 68.3 |
Asset Allocation (% of fund's net assets)
| Period end |
| | Domestic Equity Funds | 38.3% |
| | International Equity Funds | 19.7% |
| | Bond Funds | 32.7% |
| | Short-Term Funds | 9.3% |

| Six months ago |
| | Domestic Equity Funds | 39.7% |
| | International Equity Funds | 18.6% |
| | Bond Funds | 34.7% |
| | Short-Term Funds | 7.0% |

Domestic Equity Funds category includes Fidelity Series Commodity Strategy Fund which invests in commodity-related investments.
Percentages shown as 0.0% may reflect amounts less than 0.05%.
Fidelity Freedom® 2015 Fund
Investments September 30, 2016 (Unaudited)
Showing Percentage of Net Assets
| Domestic Equity Funds - 38.3% | | | |
| | | Shares | Value |
| Fidelity Series 100 Index Fund (a) | | 4,772,336 | $68,148,952 |
| Fidelity Series 1000 Value Index Fund (a) | | 5,400,505 | 60,323,642 |
| Fidelity Series All-Sector Equity Fund (a) | | 9,569,630 | 128,520,130 |
| Fidelity Series Blue Chip Growth Fund (a) | | 13,522,997 | 158,624,753 |
| Fidelity Series Commodity Strategy Fund (a)(b) | | 16,831,590 | 89,039,110 |
| Fidelity Series Equity-Income Fund (a) | | 24,900,801 | 308,022,905 |
| Fidelity Series Growth & Income Fund (a) | | 17,376,438 | 232,670,498 |
| Fidelity Series Growth Company Fund (a) | | 20,178,651 | 270,595,704 |
| Fidelity Series Intrinsic Opportunities Fund (a) | | 12,535,421 | 188,407,371 |
| Fidelity Series Opportunistic Insights Fund (a) | | 9,739,084 | 149,007,992 |
| Fidelity Series Real Estate Equity Fund (a) | | 1,921,015 | 26,452,374 |
| Fidelity Series Small Cap Discovery Fund (a) | | 3,774,738 | 39,785,742 |
| Fidelity Series Small Cap Opportunities Fund (a) | | 9,303,329 | 122,338,770 |
| Fidelity Series Stock Selector Large Cap Value Fund (a) | | 16,994,191 | 200,361,516 |
| TOTAL DOMESTIC EQUITY FUNDS | | | |
| (Cost $1,685,728,294) | | | 2,042,299,459 |
|
| International Equity Funds - 19.7% | | | |
| Fidelity Series Emerging Markets Fund (a) | | 23,712,514 | 398,844,487 |
| Fidelity Series International Growth Fund (a) | | 20,924,223 | 292,939,125 |
| Fidelity Series International Small Cap Fund (a) | | 4,323,393 | 67,315,226 |
| Fidelity Series International Value Fund (a) | | 31,025,057 | 294,117,540 |
| TOTAL INTERNATIONAL EQUITY FUNDS | | | |
| (Cost $947,391,319) | | | 1,053,216,378 |
|
| Bond Funds - 32.7% | | | |
| Fidelity Series Emerging Markets Debt Fund (a) | | 3,507,684 | 36,339,604 |
| Fidelity Series Floating Rate High Income Fund (a) | | 1,421,535 | 13,390,863 |
| Fidelity Series High Income Fund (a) | | 17,783,684 | 166,455,278 |
| Fidelity Series Inflation-Protected Bond Index Fund (a) | | 10,399,584 | 104,723,814 |
| Fidelity Series Investment Grade Bond Fund (a) | | 120,622,281 | 1,399,218,464 |
| Fidelity Series Long-Term Treasury Bond Index Fund (a) | | 147,093 | 1,419,446 |
| Fidelity Series Real Estate Income Fund (a) | | 2,390,011 | 26,815,924 |
| TOTAL BOND FUNDS | | | |
| (Cost $1,699,758,485) | | | 1,748,363,393 |
|
| Short-Term Funds - 9.3% | | | |
| Fidelity Series Government Money Market Fund 0.29% (a)(c) | | 328,355,414 | 328,355,414 |
| Fidelity Series Short-Term Credit Fund (a) | | 16,903,628 | 169,543,387 |
| TOTAL SHORT-TERM FUNDS | | | |
| (Cost $497,266,680) | | | 497,898,801 |
| TOTAL INVESTMENT PORTFOLIO - 100.0% | | | |
| (Cost $4,830,144,778) | | | 5,341,778,031 |
| NET OTHER ASSETS (LIABILITIES) - 0.0% | | | (21,456) |
| NET ASSETS - 100% | | | $5,341,756,575 |
(a) Affiliated Fund
(b) Non-income producing
(c) The rate quoted is the annualized seven-day yield of the fund at period end.
Affiliated Underlying Funds
Information regarding the Fund's fiscal year to date purchases and sales of the affiliated Underlying Funds and income earned by the Fund from investments in affiliated Underlying Funds is as follows:
| Affiliate | Value, beginning of period | Purchases | Sales Proceeds | Dividend Income | Value, end of period |
| Fidelity Investments Money Market Portfolio Institutional Class 0.59% | $245,979,946 | $53,741,082 | $299,721,029 | $120,016 | $-- |
| Fidelity Series 100 Index Fund | 72,776,140 | 483,683 | 9,362,450 | -- | 68,148,952 |
| Fidelity Series 1000 Value Index Fund | 40,989,673 | 20,434,775 | 4,262,133 | -- | 60,323,642 |
| Fidelity Series All-Sector Equity Fund | 229,453,074 | 1,256,262 | 116,244,903 | -- | 128,520,130 |
| Fidelity Series Blue Chip Growth Fund | 159,061,772 | 1,214,001 | 13,832,772 | 283,919 | 158,624,753 |
| Fidelity Series Commodity Strategy Fund | 65,202,604 | 23,577,004 | 4,762,136 | -- | 89,039,110 |
| Fidelity Series Emerging Markets Debt Fund | 34,297,027 | 1,157,597 | 2,199,637 | 970,554 | 36,339,604 |
| Fidelity Series Emerging Markets Fund | 369,404,058 | 4,253,905 | 21,285,946 | -- | 398,844,487 |
| Fidelity Series Equity-Income Fund | 308,172,259 | 5,724,493 | 28,742,561 | 2,671,743 | 308,022,905 |
| Fidelity Series Floating Rate High Income Fund | 13,192,284 | 460,390 | 896,859 | 290,171 | 13,390,863 |
| Fidelity Series Government Money Market Fund 0.29% | -- | 343,268,254 | 14,912,840 | 294,092 | 328,355,414 |
| Fidelity Series Growth & Income Fund | 236,386,018 | 3,786,307 | 24,870,806 | 1,929,646 | 232,670,498 |
| Fidelity Series Growth Company Fund | 283,355,841 | -- | 38,404,401 | -- | 270,595,704 |
| Fidelity Series High Income Fund | 159,696,787 | 4,569,905 | 10,256,946 | 4,569,961 | 166,455,278 |
| Fidelity Series Inflation-Protected Bond Index Fund | 99,879,116 | 9,606,390 | 6,682,908 | 43,170 | 104,723,814 |
| Fidelity Series International Growth Fund | 280,308,733 | 24,657,851 | 26,089,682 | -- | 292,939,125 |
| Fidelity Series International Small Cap Fund | 67,672,463 | 4,689,802 | 7,247,493 | -- | 67,315,226 |
| Fidelity Series International Value Fund | 278,204,034 | 32,942,593 | 28,059,717 | -- | 294,117,540 |
| Fidelity Series Intrinsic Opportunities Fund | 177,385,315 | 2,324,793 | 2,368,006 | 1,281,056 | 188,407,371 |
| Fidelity Series Investment Grade Bond Fund | 1,524,187,198 | 26,558,304 | 189,370,132 | 17,604,688 | 1,399,218,464 |
| Fidelity Series Long-Term Treasury Bond Index Fund | -- | 1,549,456 | 77,272 | 6,192 | 1,419,446 |
| Fidelity Series Opportunistic Insights Fund | 153,617,375 | 1,395,855 | 13,546,243 | -- | 149,007,992 |
| Fidelity Series Real Estate Equity Fund | 28,331,715 | 2,195,684 | 3,543,327 | 241,017 | 26,452,374 |
| Fidelity Series Real Estate Income Fund | 26,575,418 | 1,803,486 | 2,392,712 | 659,698 | 26,815,924 |
| Fidelity Series Short-Term Credit Fund | 131,636,279 | 48,557,022 | 11,297,835 | 789,891 | 169,543,387 |
| Fidelity Series Small Cap Discovery Fund | 40,740,289 | 608,978 | 3,769,257 | 50,954 | 39,785,742 |
| Fidelity Series Small Cap Opportunities Fund | 123,558,106 | 1,026,145 | 12,469,070 | 307,544 | 122,338,770 |
| Fidelity Series Stock Selector Large Cap Value Fund | 204,102,963 | 2,319,126 | 19,309,615 | -- | 200,361,516 |
| Total | $5,354,166,487 | $624,163,143 | $915,978,688 | $32,114,312 | $5,341,778,031 |
Investment Valuation
All investments are categorized as Level 1 under the Fair Value Hierarchy. The inputs or methodology used for valuing securities may not be an indication of the risk associated with investing in those securities. For more information on valuation inputs please refer to the Investment Valuation section in the accompanying Notes to Financial Statements.
See accompanying notes which are an integral part of the financial statements.
Fidelity Freedom® 2015 Fund
Financial Statements
Statement of Assets and Liabilities
| | | September 30, 2016 (Unaudited) |
| Assets | | |
| Investment in securities, at value (cost $4,830,144,778) — See accompanying schedule | | $5,341,778,031 |
| Cash | | 3 |
| Receivable for investments sold | | 16,653,644 |
| Receivable for fund shares sold | | 4,785,287 |
| Total assets | | 5,363,216,965 |
| Liabilities | | |
| Payable for investments purchased | $14,580,356 | |
| Payable for fund shares redeemed | 6,880,034 | |
| Total liabilities | | 21,460,390 |
| Net Assets | | $5,341,756,575 |
| Net Assets consist of: | | |
| Paid in capital | | $4,792,043,493 |
| Undistributed net investment income | | 31,981,568 |
| Accumulated undistributed net realized gain (loss) on investments | | 6,098,261 |
| Net unrealized appreciation (depreciation) on investments | | 511,633,253 |
| Net Assets, for 425,351,662 shares outstanding | | $5,341,756,575 |
| Net Asset Value, offering price and redemption price per share ($5,341,756,575 ÷ 425,351,662 shares) | | $12.56 |
See accompanying notes which are an integral part of the financial statements.
Statement of Operations
| | | Six months ended September 30, 2016 (Unaudited) |
| Investment Income | | |
| Income distributions from underlying funds | | $32,114,312 |
| Expenses | | |
| Independent trustees' fees and expenses | $12,004 | |
| Total expenses before reductions | 12,004 | |
| Expense reductions | (12,004) | – |
| Net investment income (loss) | | 32,114,312 |
| Realized and Unrealized Gain (Loss) | | |
| Realized gain (loss) on sale of underlying fund shares | 18,044,427 | |
| Capital gain distributions from underlying funds | 1,811,028 | |
| Total net realized gain (loss) | | 19,855,455 |
| Change in net unrealized appreciation (depreciation) on underlying funds | | 261,382,657 |
| Net gain (loss) | | 281,238,112 |
| Net increase (decrease) in net assets resulting from operations | | $313,352,424 |
See accompanying notes which are an integral part of the financial statements.
Statement of Changes in Net Assets
| | Six months ended September 30, 2016 (Unaudited) | Year ended March 31, 2016 |
| Increase (Decrease) in Net Assets | | |
| Operations | | |
| Net investment income (loss) | $32,114,312 | $105,599,449 |
| Net realized gain (loss) | 19,855,455 | 153,430,166 |
| Change in net unrealized appreciation (depreciation) | 261,382,657 | (373,558,088) |
| Net increase (decrease) in net assets resulting from operations | 313,352,424 | (114,528,473) |
| Distributions to shareholders from net investment income | (14,037,447) | (104,668,229) |
| Distributions to shareholders from net realized gain | (71,503,239) | (195,999,556) |
| Total distributions | (85,540,686) | (300,667,785) |
| Share transactions | | |
| Proceeds from sales of shares | 493,661,036 | 1,235,616,612 |
| Reinvestment of distributions | 84,774,349 | 298,488,989 |
| Cost of shares redeemed | (818,632,886) | (1,820,928,056) |
| Net increase (decrease) in net assets resulting from share transactions | (240,197,501) | (286,822,455) |
| Total increase (decrease) in net assets | (12,385,763) | (702,018,713) |
| Net Assets | | |
| Beginning of period | 5,354,142,338 | 6,056,161,051 |
| End of period | $5,341,756,575 | $5,354,142,338 |
| Other Information | | |
| Undistributed net investment income end of period | $31,981,568 | $13,904,703 |
| Shares | | |
| Sold | 40,324,177 | 100,089,645 |
| Issued in reinvestment of distributions | 7,147,922 | 24,174,139 |
| Redeemed | (67,029,096) | (148,066,977) |
| Net increase (decrease) | (19,556,997) | (23,803,193) |
See accompanying notes which are an integral part of the financial statements.
Financial Highlights — Fidelity Freedom 2015 Fund
| | Six months ended (Unaudited) September 30, | Years ended March 31, | | | | |
| | 2016 | 2016 | 2015 | 2014 | 2013 | 2012 |
| Selected Per–Share Data | | | | | | |
| Net asset value, beginning of period | $12.03 | $12.92 | $12.91 | $12.28 | $11.69 | $11.74 |
| Income from Investment Operations | | | | | | |
| Net investment income (loss)A | .07 | .23 | .23 | .18 | .18 | .20 |
| Net realized and unrealized gain (loss) | .66 | (.46) | .57 | .91 | .69 | .12 |
| Total from investment operations | .73 | (.23) | .80 | 1.09 | .87 | .32 |
| Distributions from net investment income | (.03) | (.23) | (.25) | (.18) | (.20) | (.21) |
| Distributions from net realized gain | (.16) | (.43) | (.54) | (.28) | (.08) | (.16) |
| Total distributions | (.20)B | (.66) | (.79) | (.46) | (.28) | (.37) |
| Net asset value, end of period | $12.56 | $12.03 | $12.92 | $12.91 | $12.28 | $11.69 |
| Total ReturnC,D | 6.12% | (1.83)% | 6.42% | 8.95% | 7.60% | 2.95% |
| Ratios to Average Net AssetsE,F | | | | | | |
| Expenses before reductionsG | - %H | -% | -% | -% | -% | -% |
| Expenses net of fee waivers, if any | - %H | -% | -% | -% | -% | -% |
| Expenses net of all reductions | - %H | -% | -% | -% | -% | -% |
| Net investment income (loss) | 1.20%H | 1.87% | 1.83% | 1.47% | 1.57% | 1.71% |
| Supplemental Data | | | | | | |
| Net assets, end of period (000 omitted) | $5,341,757 | $5,354,142 | $6,056,161 | $6,388,485 | $6,507,169 | $7,255,215 |
| Portfolio turnover rateE | 23%H | 17% | 18% | 39% | 23% | 24% |
A Calculated based on average shares outstanding during the period.
B Total distributions of $.20 per share is comprised of distributions from net investment income of $.032 and distributions from net realized gain of $.163 per share.
C Total returns for periods of less than one year are not annualized.
D Total returns would have been lower if certain expenses had not been reduced during the applicable periods shown.
E Amounts do not include the activity of the Underlying Funds.
F Expense ratios reflect operating expenses of the Fund. Expenses before reductions do not reflect amounts reimbursed by the investment adviser or reductions from expense offset arrangements and do not represent the amount paid by the Fund during periods when reimbursements or reductions occur. Expenses net of fee waivers reflect expenses after reimbursement by the investment adviser but prior to reductions from expense offset arrangements. Expenses net of all reductions represent the net expenses paid by the Fund but do not include expenses of the underlying funds in which the Fund invests.
G Amount represents less than .005%.
H Annualized
See accompanying notes which are an integral part of the financial statements.
Fidelity Freedom® 2020 Fund
Investment Summary (Unaudited)
The information in the following tables is based on the direct investments of the Fund.
Top Holdings as of September 30, 2016
| | % of fund's net assets | % of fund's net assets 6 months ago |
| Fidelity Series Investment Grade Bond Fund | 23.8 | 24.9 |
| Fidelity Series Emerging Markets Fund | 7.9 | 7.3 |
| Fidelity Series Equity-Income Fund | 6.4 | 6.4 |
| Fidelity Series International Value Fund | 6.1 | 5.8 |
| Fidelity Series International Growth Fund | 6.1 | 5.9 |
| Fidelity Series Growth Company Fund | 5.6 | 5.9 |
| Fidelity Series Growth & Income Fund | 4.8 | 4.9 |
| Fidelity Series Government Money Market Fund 0.29% | 4.4 | 0.0 |
| Fidelity Series Stock Selector Large Cap Value Fund | 4.3 | 4.2 |
| Fidelity Series Intrinsic Opportunities Fund | 3.8 | 3.6 |
| | 73.2 | 68.9 |
Asset Allocation (% of fund's net assets)
| Period end |
| | Domestic Equity Funds | 42.3% |
| | International Equity Funds | 21.5% |
| | Bond Funds | 29.5% |
| | Short-Term Funds | 6.7% |

| Six months ago |
| | Domestic Equity Funds | 43.9% |
| | International Equity Funds | 20.4% |
| | Bond Funds | 30.3% |
| | Short-Term Funds | 5.4% |

Domestic Equity Funds category includes Fidelity Series Commodity Strategy Fund which invests in commodity-related investments.
Percentages shown as 0.0% may reflect amounts less than 0.05%.
Fidelity Freedom® 2020 Fund
Investments September 30, 2016 (Unaudited)
Showing Percentage of Net Assets
| Domestic Equity Funds - 42.3% | | | |
| | | Shares | Value |
| Fidelity Series 100 Index Fund (a) | | 11,861,435 | $169,381,285 |
| Fidelity Series 1000 Value Index Fund (a) | | 14,660,864 | 163,761,852 |
| Fidelity Series All-Sector Equity Fund (a) | | 23,784,730 | 319,428,920 |
| Fidelity Series Blue Chip Growth Fund (a) | | 33,485,347 | 392,783,125 |
| Fidelity Series Commodity Strategy Fund (a)(b) | | 38,019,952 | 201,125,545 |
| Fidelity Series Equity-Income Fund (a) | | 61,547,816 | 761,346,486 |
| Fidelity Series Growth & Income Fund (a) | | 42,974,719 | 575,431,487 |
| Fidelity Series Growth Company Fund (a) | | 49,943,013 | 669,735,803 |
| Fidelity Series Intrinsic Opportunities Fund (a) | | 30,481,298 | 458,133,916 |
| Fidelity Series Opportunistic Insights Fund (a) | | 24,079,053 | 368,409,517 |
| Fidelity Series Real Estate Equity Fund (a) | | 4,699,988 | 64,718,836 |
| Fidelity Series Small Cap Discovery Fund (a) | | 9,381,764 | 98,883,791 |
| Fidelity Series Small Cap Opportunities Fund (a) | | 22,992,941 | 302,357,168 |
| Fidelity Series Stock Selector Large Cap Value Fund (a) | | 43,416,974 | 511,886,127 |
| TOTAL DOMESTIC EQUITY FUNDS | | | |
| (Cost $4,199,534,253) | | | 5,057,383,858 |
|
| International Equity Funds - 21.5% | | | |
| Fidelity Series Emerging Markets Fund (a) | | 56,177,610 | 944,907,406 |
| Fidelity Series International Growth Fund (a) | | 51,891,291 | 726,478,078 |
| Fidelity Series International Small Cap Fund (a) | | 10,721,383 | 166,931,932 |
| Fidelity Series International Value Fund (a) | | 76,941,272 | 729,403,256 |
| TOTAL INTERNATIONAL EQUITY FUNDS | | | |
| (Cost $2,326,330,114) | | | 2,567,720,672 |
|
| Bond Funds - 29.5% | | | |
| Fidelity Series Emerging Markets Debt Fund (a) | | 7,702,762 | 79,800,611 |
| Fidelity Series Floating Rate High Income Fund (a) | | 3,178,358 | 29,940,128 |
| Fidelity Series High Income Fund (a) | | 39,580,553 | 370,473,975 |
| Fidelity Series Inflation-Protected Bond Index Fund (a) | | 13,739,735 | 138,359,135 |
| Fidelity Series Investment Grade Bond Fund (a) | | 245,554,252 | 2,848,429,322 |
| Fidelity Series Long-Term Treasury Bond Index Fund (a) | | 300,666 | 2,901,423 |
| Fidelity Series Real Estate Income Fund (a) | | 5,367,011 | 60,217,862 |
| TOTAL BOND FUNDS | | | |
| (Cost $3,466,945,523) | | | 3,530,122,456 |
|
| Short-Term Funds - 6.7% | | | |
| Fidelity Series Government Money Market Fund 0.29% (a)(c) | | 529,183,919 | 529,183,919 |
| Fidelity Series Short-Term Credit Fund (a) | | 26,875,146 | 269,557,711 |
| TOTAL SHORT-TERM FUNDS | | | |
| (Cost $797,794,349) | | | 798,741,630 |
| TOTAL INVESTMENT PORTFOLIO - 100.0% | | | |
| (Cost $10,790,604,239) | | | 11,953,968,616 |
| NET OTHER ASSETS (LIABILITIES) - 0.0% | | | (16,820) |
| NET ASSETS - 100% | | | $11,953,951,796 |
(a) Affiliated Fund
(b) Non-income producing
(c) The rate quoted is the annualized seven-day yield of the fund at period end.
Affiliated Underlying Funds
Information regarding the Fund's fiscal year to date purchases and sales of the affiliated Underlying Funds and income earned by the Fund from investments in affiliated Underlying Funds is as follows:
| Affiliate | Value, beginning of period | Purchases | Sales Proceeds | Dividend Income | Value, end of period |
| Fidelity Investments Money Market Portfolio Institutional Class 0.59% | $415,095,932 | $24,670,196 | $439,766,128 | $190,785 | $-- |
| Fidelity Series 100 Index Fund | 177,210,154 | 1,684,458 | 19,930,442 | -- | 169,381,285 |
| Fidelity Series 1000 Value Index Fund | 99,809,298 | 64,404,408 | 8,111,993 | -- | 163,761,852 |
| Fidelity Series All-Sector Equity Fund | 558,728,879 | 3,872,221 | 277,892,435 | -- | 319,428,920 |
| Fidelity Series Blue Chip Growth Fund | 387,327,358 | 4,554,207 | 29,125,275 | 703,248 | 392,783,125 |
| Fidelity Series Commodity Strategy Fund | 145,933,987 | 51,662,853 | 8,064,023 | -- | 201,125,545 |
| Fidelity Series Emerging Markets Debt Fund | 74,033,330 | 2,531,629 | 3,486,196 | 2,116,778 | 79,800,611 |
| Fidelity Series Emerging Markets Fund | 860,935,546 | 11,518,807 | 37,318,128 | -- | 944,907,406 |
| Fidelity Series Equity-Income Fund | 750,401,540 | 12,572,413 | 57,845,074 | 6,540,408 | 761,346,486 |
| Fidelity Series Floating Rate High Income Fund | 29,173,199 | 819,540 | 1,466,906 | 646,825 | 29,940,128 |
| Fidelity Series Government Money Market Fund 0.29% | -- | 544,920,675 | 15,736,755 | 455,018 | 529,183,919 |
| Fidelity Series Growth & Income Fund | 575,593,371 | 9,286,542 | 52,164,593 | 4,713,209 | 575,431,487 |
| Fidelity Series Growth Company Fund | 689,300,452 | -- | 82,750,022 | -- | 669,735,803 |
| Fidelity Series High Income Fund | 349,520,891 | 10,108,589 | 16,661,818 | 10,108,605 | 370,473,975 |
| Fidelity Series Inflation-Protected Bond Index Fund | 124,976,499 | 17,157,691 | 6,230,966 | 54,861 | 138,359,135 |
| Fidelity Series International Growth Fund | 686,291,524 | 55,385,929 | 50,464,923 | -- | 726,478,078 |
| Fidelity Series International Small Cap Fund | 164,486,763 | 9,984,907 | 13,154,425 | -- | 166,931,932 |
| Fidelity Series International Value Fund | 681,178,369 | 76,006,800 | 55,413,129 | -- | 729,403,256 |
| Fidelity Series Intrinsic Opportunities Fund | 423,449,419 | 7,789,901 | -- | 3,114,774 | 458,133,916 |
| Fidelity Series Investment Grade Bond Fund | 2,917,711,290 | 55,441,641 | 200,251,180 | 35,398,567 | 2,848,429,322 |
| Fidelity Series Long-Term Treasury Bond Index Fund | -- | 3,118,417 | 109,861 | 12,642 | 2,901,423 |
| Fidelity Series Opportunistic Insights Fund | 374,057,464 | 5,633,884 | 29,802,429 | -- | 368,409,517 |
| Fidelity Series Real Estate Equity Fund | 68,987,653 | 6,196,423 | 9,217,326 | 594,954 | 64,718,836 |
| Fidelity Series Real Estate Income Fund | 58,650,026 | 4,041,891 | 4,313,218 | 1,475,447 | 60,217,862 |
| Fidelity Series Short-Term Credit Fund | 222,286,289 | 57,888,150 | 11,570,946 | 1,220,303 | 269,557,711 |
| Fidelity Series Small Cap Discovery Fund | 100,013,032 | 884,078 | 7,476,407 | 125,637 | 98,883,791 |
| Fidelity Series Small Cap Opportunities Fund | 300,865,237 | 2,718,190 | 26,408,957 | 761,829 | 302,357,168 |
| Fidelity Series Stock Selector Large Cap Value Fund | 496,984,924 | 19,566,417 | 37,258,798 | -- | 511,886,127 |
| Total | $11,733,002,426 | $1,064,420,857 | $1,501,992,353 | $68,233,890 | $11,953,968,616 |
Investment Valuation
All investments are categorized as Level 1 under the Fair Value Hierarchy. The inputs or methodology used for valuing securities may not be an indication of the risk associated with investing in those securities. For more information on valuation inputs please refer to the Investment Valuation section in the accompanying Notes to Financial Statements.
See accompanying notes which are an integral part of the financial statements.
Fidelity Freedom® 2020 Fund
Financial Statements
Statement of Assets and Liabilities
| | | September 30, 2016 (Unaudited) |
| Assets | | |
| Investment in securities, at value (cost $10,790,604,239) — See accompanying schedule | | $11,953,968,616 |
| Cash | | 2 |
| Receivable for investments sold | | 50,412,831 |
| Receivable for fund shares sold | | 7,972,994 |
| Other receivables | | 132,254 |
| Total assets | | 12,012,486,697 |
| Liabilities | | |
| Payable for investments purchased | $32,878,532 | |
| Payable for fund shares redeemed | 25,524,120 | |
| Other payables and accrued expenses | 132,249 | |
| Total liabilities | | 58,534,901 |
| Net Assets | | $11,953,951,796 |
| Net Assets consist of: | | |
| Paid in capital | | $10,706,945,259 |
| Undistributed net investment income | | 67,422,451 |
| Accumulated undistributed net realized gain (loss) on investments | | 16,219,709 |
| Net unrealized appreciation (depreciation) on investments | | 1,163,364,377 |
| Net Assets, for 781,863,689 shares outstanding | | $11,953,951,796 |
| Net Asset Value, offering price and redemption price per share ($11,953,951,796 ÷ 781,863,689 shares) | | $15.29 |
See accompanying notes which are an integral part of the financial statements.
Statement of Operations
| | | Six months ended September 30, 2016 (Unaudited) |
| Investment Income | | |
| Income distributions from underlying funds | | $68,233,890 |
| Expenses | | |
| Independent trustees' fees and expenses | $26,511 | |
| Total expenses before reductions | 26,511 | |
| Expense reductions | (26,511) | – |
| Net investment income (loss) | | 68,233,890 |
| Realized and Unrealized Gain (Loss) | | |
| Realized gain (loss) on sale of underlying fund shares | 42,734,429 | |
| Capital gain distributions from underlying funds | 4,375,119 | |
| Total net realized gain (loss) | | 47,109,548 |
| Change in net unrealized appreciation (depreciation) on underlying funds | | 615,803,248 |
| Net gain (loss) | | 662,912,796 |
| Net increase (decrease) in net assets resulting from operations | | $731,146,686 |
See accompanying notes which are an integral part of the financial statements.
Statement of Changes in Net Assets
| | Six months ended September 30, 2016 (Unaudited) | Year ended March 31, 2016 |
| Increase (Decrease) in Net Assets | | |
| Operations | | |
| Net investment income (loss) | $68,233,890 | $223,493,732 |
| Net realized gain (loss) | 47,109,548 | 356,954,520 |
| Change in net unrealized appreciation (depreciation) | 615,803,248 | (857,158,495) |
| Net increase (decrease) in net assets resulting from operations | 731,146,686 | (276,710,243) |
| Distributions to shareholders from net investment income | (27,843,955) | (225,452,665) |
| Distributions to shareholders from net realized gain | (182,179,002) | (426,323,183) |
| Total distributions | (210,022,957) | (651,775,848) |
| Share transactions | | |
| Proceeds from sales of shares | 1,048,003,719 | 2,341,926,050 |
| Reinvestment of distributions | 208,033,294 | 646,952,369 |
| Cost of shares redeemed | (1,556,188,815) | (3,196,310,117) |
| Net increase (decrease) in net assets resulting from share transactions | (300,151,802) | (207,431,698) |
| Total increase (decrease) in net assets | 220,971,927 | (1,135,917,789) |
| Net Assets | | |
| Beginning of period | 11,732,979,869 | 12,868,897,658 |
| End of period | $11,953,951,796 | $11,732,979,869 |
| Other Information | | |
| Undistributed net investment income end of period | $67,422,451 | $27,032,518 |
| Shares | | |
| Sold | 70,421,357 | 155,836,068 |
| Issued in reinvestment of distributions | 14,466,849 | 42,910,983 |
| Redeemed | (104,768,337) | (213,344,363) |
| Net increase (decrease) | (19,880,131) | (14,597,312) |
See accompanying notes which are an integral part of the financial statements.
Financial Highlights — Fidelity Freedom 2020 Fund
| | Six months ended (Unaudited) September 30, | Years ended March 31, | | | | |
| | 2016 | 2016 | 2015 | 2014 | 2013 | 2012 |
| Selected Per–Share Data | | | | | | |
| Net asset value, beginning of period | $14.63 | $15.76 | $15.81 | $14.94 | $14.16 | $14.33 |
| Income from Investment Operations | | | | | | |
| Net investment income (loss)A | .09 | .28 | .28 | .23 | .24 | .24 |
| Net realized and unrealized gain (loss) | .83 | (.60) | .73 | 1.22 | .89 | .08 |
| Total from investment operations | .92 | (.32) | 1.01 | 1.45 | 1.13 | .32 |
| Distributions from net investment income | (.04) | (.28) | (.29) | (.23) | (.25) | (.26) |
| Distributions from net realized gain | (.23) | (.53) | (.77) | (.36) | (.10) | (.22) |
| Total distributions | (.26)B | (.81) | (1.06) | (.58)C | (.35) | (.49)D |
| Net asset value, end of period | $15.29 | $14.63 | $15.76 | $15.81 | $14.94 | $14.16 |
| Total ReturnE,F | 6.43% | (2.10)% | 6.71% | 9.83% | 8.12% | 2.45% |
| Ratios to Average Net Assets G,H | | | | | | |
| Expenses before reductionsI | - %J | -% | -% | -% | -% | -% |
| Expenses net of fee waivers, if any | - %J | -% | -% | -% | -% | -% |
| Expenses net of all reductions | - %J | -% | -% | -% | -% | -% |
| Net investment income (loss) | 1.15%J | 1.83% | 1.83% | 1.49% | 1.65% | 1.74% |
| Supplemental Data | | | | | | |
| Net assets, end of period (000 omitted) | $11,953,952 | $11,732,980 | $12,868,898 | $13,343,983 | $13,579,950 | $15,423,976 |
| Portfolio turnover rateG | 18%J | 17% | 17% | 39% | 25% | 24% |
A Calculated based on average shares outstanding during the period.
B Total distributions of $.26 per share is comprised of distributions from net investment income of $.035 and distributions from net realized gain of $.229 per share.
C Total distributions of $.58 per share is comprised of distributions from net investment income of $.228 and distributions from net realized gain of $.356 per share.
D Total distributions of $.49 per share is comprised of distributions from net investment income of $.264 and distributions from net realized gain of $.222 per share.
E Total returns for periods of less than one year are not annualized.
F Total returns would have been lower if certain expenses had not been reduced during the applicable periods shown.
G Amounts do not include the activity of the Underlying Funds.
H Expense ratios reflect operating expenses of the Fund. Expenses before reductions do not reflect amounts reimbursed by the investment adviser or reductions from expense offset arrangements and do not represent the amount paid by the Fund during periods when reimbursements or reductions occur. Expenses net of fee waivers reflect expenses after reimbursement by the investment adviser but prior to reductions from expense offset arrangements. Expenses net of all reductions represent the net expenses paid by the Fund but do not include expenses of the underlying funds in which the Fund invests.
I Amount represents less than .005%.
J Annualized
See accompanying notes which are an integral part of the financial statements.
Fidelity Freedom® 2025 Fund
Investment Summary (Unaudited)
The information in the following tables is based on the direct investments of the Fund.
Top Holdings as of September 30, 2016
| | % of fund's net assets | % of fund's net assets 6 months ago |
| Fidelity Series Investment Grade Bond Fund | 20.3 | 19.9 |
| Fidelity Series Emerging Markets Fund | 8.3 | 7.8 |
| Fidelity Series Equity-Income Fund | 7.1 | 7.1 |
| Fidelity Series International Value Fund | 6.7 | 6.5 |
| Fidelity Series International Growth Fund | 6.7 | 6.5 |
| Fidelity Series Growth Company Fund | 6.2 | 6.5 |
| Fidelity Series Growth & Income Fund | 5.3 | 5.4 |
| Fidelity Series Stock Selector Large Cap Value Fund | 4.7 | 4.7 |
| Fidelity Series Intrinsic Opportunities Fund | 4.2 | 4.0 |
| Fidelity Series Blue Chip Growth Fund | 3.6 | 3.7 |
| | 73.1 | 72.1 |
Asset Allocation (% of fund's net assets)
| Period end |
| | Domestic Equity Funds | 46.6% |
| | International Equity Funds | 23.2% |
| | Bond Funds | 25.4% |
| | Short-Term Funds | 4.8% |

| Six months ago |
| | Domestic Equity Funds | 48.6% |
| | International Equity Funds | 22.4% |
| | Bond Funds | 24.8% |
| | Short-Term Funds | 4.2% |

Domestic Equity Funds category includes Fidelity Series Commodity Strategy Fund which invests in commodity-related investments.
Fidelity Freedom® 2025 Fund
Investments September 30, 2016 (Unaudited)
Showing Percentage of Net Assets
| Domestic Equity Funds - 46.6% | | | |
| | | Shares | Value |
| Fidelity Series 100 Index Fund (a) | | 10,028,751 | $143,210,571 |
| Fidelity Series 1000 Value Index Fund (a) | | 11,887,709 | 132,785,713 |
| Fidelity Series All-Sector Equity Fund (a) | | 20,109,767 | 270,074,172 |
| Fidelity Series Blue Chip Growth Fund (a) | | 28,333,322 | 332,349,866 |
| Fidelity Series Commodity Strategy Fund (a)(b) | | 28,522,075 | 150,881,777 |
| Fidelity Series Equity-Income Fund (a) | | 52,060,588 | 643,989,476 |
| Fidelity Series Growth & Income Fund (a) | | 36,465,516 | 488,273,262 |
| Fidelity Series Growth Company Fund (a) | | 42,442,661 | 569,156,088 |
| Fidelity Series Intrinsic Opportunities Fund (a) | | 25,569,195 | 384,304,998 |
| Fidelity Series Opportunistic Insights Fund (a) | | 20,374,780 | 311,734,133 |
| Fidelity Series Real Estate Equity Fund (a) | | 3,984,656 | 54,868,720 |
| Fidelity Series Small Cap Discovery Fund (a) | | 7,932,101 | 83,604,347 |
| Fidelity Series Small Cap Opportunities Fund (a) | | 19,451,863 | 255,791,993 |
| Fidelity Series Stock Selector Large Cap Value Fund (a) | | 36,232,324 | 427,179,103 |
| TOTAL DOMESTIC EQUITY FUNDS | | | |
| (Cost $3,546,114,862) | | | 4,248,204,219 |
|
| International Equity Funds - 23.2% | | | |
| Fidelity Series Emerging Markets Fund (a) | | 45,086,444 | 758,353,992 |
| Fidelity Series International Growth Fund (a) | | 43,512,036 | 609,168,510 |
| Fidelity Series International Small Cap Fund (a) | | 8,989,798 | 139,971,157 |
| Fidelity Series International Value Fund (a) | | 64,517,196 | 611,623,015 |
| TOTAL INTERNATIONAL EQUITY FUNDS | | | |
| (Cost $1,912,814,311) | | | 2,119,116,674 |
|
| Bond Funds - 25.4% | | | |
| Fidelity Series Emerging Markets Debt Fund (a) | | 5,911,377 | 61,241,862 |
| Fidelity Series Floating Rate High Income Fund (a) | | 2,414,670 | 22,746,195 |
| Fidelity Series High Income Fund (a) | | 29,709,231 | 278,078,406 |
| Fidelity Series Inflation-Protected Bond Index Fund (a) | | 5,393,276 | 54,310,292 |
| Fidelity Series Investment Grade Bond Fund (a) | | 159,302,311 | 1,847,906,806 |
| Fidelity Series Long-Term Treasury Bond Index Fund (a) | | 189,886 | 1,832,401 |
| Fidelity Series Real Estate Income Fund (a) | | 4,087,691 | 45,863,894 |
| TOTAL BOND FUNDS | | | |
| (Cost $2,273,512,784) | | | 2,311,979,856 |
|
| Short-Term Funds - 4.8% | | | |
| Fidelity Series Government Money Market Fund 0.29% (a)(c) | | 290,161,616 | 290,161,616 |
| Fidelity Series Short-Term Credit Fund (a) | | 14,943,734 | 149,885,657 |
| TOTAL SHORT-TERM FUNDS | | | |
| (Cost $439,514,360) | | | 440,047,273 |
| TOTAL INVESTMENT PORTFOLIO - 100.0% | | | |
| (Cost $8,171,956,317) | | | 9,119,348,022 |
| NET OTHER ASSETS (LIABILITIES) - 0.0% | | | 2,139 |
| NET ASSETS - 100% | | | $9,119,350,161 |
(a) Affiliated Fund
(b) Non-income producing
(c) The rate quoted is the annualized seven-day yield of the fund at period end.
Affiliated Underlying Funds
Information regarding the Fund's fiscal year to date purchases and sales of the affiliated Underlying Funds and income earned by the Fund from investments in affiliated Underlying Funds is as follows:
| Affiliate | Value, beginning of period | Purchases | Sales Proceeds | Dividend Income | Value, end of period |
| Fidelity Investments Money Market Portfolio Institutional Class 0.59% | $238,137,551 | $675,035 | $238,812,586 | $108,225 | $-- |
| Fidelity Series 100 Index Fund | 146,188,368 | 3,064,985 | 14,752,348 | -- | 143,210,571 |
| Fidelity Series 1000 Value Index Fund | 82,337,547 | 49,978,169 | 5,935,570 | -- | 132,785,713 |
| Fidelity Series All-Sector Equity Fund | 460,925,445 | 7,947,232 | 227,874,935 | -- | 270,074,172 |
| Fidelity Series Blue Chip Growth Fund | 319,529,991 | 7,457,843 | 19,883,081 | 593,252 | 332,349,866 |
| Fidelity Series Commodity Strategy Fund | 109,096,257 | 36,872,851 | 4,057,441 | -- | 150,881,777 |
| Fidelity Series Emerging Markets Debt Fund | 55,632,589 | 2,545,552 | 2,040,301 | 1,609,075 | 61,241,862 |
| Fidelity Series Emerging Markets Fund | 680,135,524 | 12,313,399 | 21,456,053 | -- | 758,353,992 |
| Fidelity Series Equity-Income Fund | 619,041,557 | 18,206,809 | 40,198,005 | 5,437,886 | 643,989,476 |
| Fidelity Series Floating Rate High Income Fund | 21,632,550 | 891,486 | 836,603 | 485,821 | 22,746,195 |
| Fidelity Series Government Money Market Fund 0.29% | -- | 296,014,365 | 5,852,748 | 252,212 | 290,161,616 |
| Fidelity Series Growth & Income Fund | 474,840,979 | 13,743,543 | 36,064,448 | 3,910,506 | 488,273,262 |
| Fidelity Series Growth Company Fund | 568,362,490 | 26 | 52,009,030 | -- | 569,156,088 |
| Fidelity Series High Income Fund | 259,524,335 | 7,548,869 | 9,519,044 | 7,548,908 | 278,078,406 |
| Fidelity Series Inflation-Protected Bond Index Fund | 44,976,916 | 10,482,382 | 2,077,973 | 19,835 | 54,310,292 |
| Fidelity Series International Growth Fund | 572,051,099 | 42,888,028 | 35,219,624 | -- | 609,168,510 |
| Fidelity Series International Small Cap Fund | 136,919,217 | 7,170,572 | 9,000,238 | -- | 139,971,157 |
| Fidelity Series International Value Fund | 567,793,738 | 60,174,931 | 39,364,434 | -- | 611,623,015 |
| Fidelity Series Intrinsic Opportunities Fund | 351,164,778 | 10,692,586 | -- | 2,608,823 | 384,304,998 |
| Fidelity Series Investment Grade Bond Fund | 1,732,464,364 | 135,208,903 | 65,983,157 | 21,929,323 | 1,847,906,806 |
| Fidelity Series Long-Term Treasury Bond Index Fund | -- | 1,949,690 | 50,559 | 7,961 | 1,832,401 |
| Fidelity Series Opportunistic Insights Fund | 308,578,024 | 8,193,146 | 20,583,325 | -- | 311,734,133 |
| Fidelity Series Real Estate Equity Fund | 56,916,724 | 5,660,076 | 6,635,579 | 496,727 | 54,868,720 |
| Fidelity Series Real Estate Income Fund | 43,692,299 | 3,547,449 | 2,754,289 | 1,113,159 | 45,863,894 |
| Fidelity Series Short-Term Credit Fund | 127,434,820 | 26,286,377 | 4,357,894 | 679,721 | 149,885,657 |
| Fidelity Series Small Cap Discovery Fund | 82,017,994 | 1,656,657 | 4,637,506 | 104,999 | 83,604,347 |
| Fidelity Series Small Cap Opportunities Fund | 248,196,395 | 5,460,655 | 18,950,620 | 642,912 | 255,791,993 |
| Fidelity Series Stock Selector Large Cap Value Fund | 409,985,984 | 15,873,366 | 25,870,462 | -- | 427,179,103 |
| Total | $8,717,577,535 | $792,504,982 | $914,777,853 | $47,549,345 | $9,119,348,022 |
Investment Valuation
All investments are categorized as Level 1 under the Fair Value Hierarchy. The inputs or methodology used for valuing securities may not be an indication of the risk associated with investing in those securities. For more information on valuation inputs please refer to the Investment Valuation section in the accompanying Notes to Financial Statements.
See accompanying notes which are an integral part of the financial statements.
Fidelity Freedom® 2025 Fund
Financial Statements
Statement of Assets and Liabilities
| | | September 30, 2016 (Unaudited) |
| Assets | | |
| Investment in securities, at value (cost $8,171,956,317) — See accompanying schedule | | $9,119,348,022 |
| Cash | | 1 |
| Receivable for investments sold | | 29,892,327 |
| Receivable for fund shares sold | | 7,120,548 |
| Total assets | | 9,156,360,898 |
| Liabilities | | |
| Payable for investments purchased | $22,870,473 | |
| Payable for fund shares redeemed | 14,140,264 | |
| Total liabilities | | 37,010,737 |
| Net Assets | | $9,119,350,161 |
| Net Assets consist of: | | |
| Paid in capital | | $8,115,655,977 |
| Undistributed net investment income | | 46,868,051 |
| Accumulated undistributed net realized gain (loss) on investments | | 9,434,428 |
| Net unrealized appreciation (depreciation) on investments | | 947,391,705 |
| Net Assets, for 698,217,411 shares outstanding | | $9,119,350,161 |
| Net Asset Value, offering price and redemption price per share ($9,119,350,161 ÷ 698,217,411 shares) | | $13.06 |
See accompanying notes which are an integral part of the financial statements.
Statement of Operations
| | | Six months ended September 30, 2016 (Unaudited) |
| Investment Income | | |
| Income distributions from underlying funds | | $47,549,345 |
| Expenses | | |
| Independent trustees' fees and expenses | $19,859 | |
| Total expenses before reductions | 19,859 | |
| Expense reductions | (19,859) | – |
| Net investment income (loss) | | 47,549,345 |
| Realized and Unrealized Gain (Loss) | | |
| Realized gain (loss) on sale of underlying fund shares | 32,206,839 | |
| Capital gain distributions from underlying funds | 3,623,369 | |
| Total net realized gain (loss) | | 35,830,208 |
| Change in net unrealized appreciation (depreciation) on underlying funds | | 491,836,508 |
| Net gain (loss) | | 527,666,716 |
| Net increase (decrease) in net assets resulting from operations | | $575,216,061 |
See accompanying notes which are an integral part of the financial statements.
Statement of Changes in Net Assets
| | Six months ended September 30, 2016 (Unaudited) | Year ended March 31, 2016 |
| Increase (Decrease) in Net Assets | | |
| Operations | | |
| Net investment income (loss) | $47,549,345 | $153,724,283 |
| Net realized gain (loss) | 35,830,208 | 280,425,783 |
| Change in net unrealized appreciation (depreciation) | 491,836,508 | (658,743,904) |
| Net increase (decrease) in net assets resulting from operations | 575,216,061 | (224,593,838) |
| Distributions to shareholders from net investment income | (16,730,998) | (154,307,371) |
| Distributions to shareholders from net realized gain | (155,459,831) | (317,460,022) |
| Total distributions | (172,190,829) | (471,767,393) |
| Share transactions | | |
| Proceeds from sales of shares | 854,120,299 | 1,990,992,008 |
| Reinvestment of distributions | 171,014,077 | 469,960,134 |
| Cost of shares redeemed | (1,026,377,147) | (2,101,703,829) |
| Net increase (decrease) in net assets resulting from share transactions | (1,242,771) | 359,248,313 |
| Total increase (decrease) in net assets | 401,782,461 | (337,112,918) |
| Net Assets | | |
| Beginning of period | 8,717,567,700 | 9,054,680,618 |
| End of period | $9,119,350,161 | $8,717,567,700 |
| Other Information | | |
| Undistributed net investment income end of period | $46,868,051 | $16,049,704 |
| Shares | | |
| Sold | 67,315,224 | 155,101,386 |
| Issued in reinvestment of distributions | 13,971,739 | 36,344,332 |
| Redeemed | (81,051,129) | (163,912,764) |
| Net increase (decrease) | 235,834 | 27,532,954 |
See accompanying notes which are an integral part of the financial statements.
Financial Highlights — Fidelity Freedom 2025 Fund
| | Six months ended (Unaudited) September 30, | Years ended March 31, | | | | |
| | 2016 | 2016 | 2015 | 2014 | 2013 | 2012 |
| Selected Per–Share Data | | | | | | |
| Net asset value, beginning of period | $12.49 | $13.51 | $13.49 | $12.58 | $11.81 | $12.02 |
| Income from Investment Operations | | | | | | |
| Net investment income (loss)A | .07 | .22 | .24 | .20 | .21 | .20 |
| Net realized and unrealized gain (loss) | .75 | (.54) | .69 | 1.30 | .84 | – |
| Total from investment operations | .82 | (.32) | .93 | 1.50 | 1.05 | .20 |
| Distributions from net investment income | (.02) | (.23) | (.25) | (.20) | (.22) | (.22) |
| Distributions from net realized gain | (.22) | (.47) | (.66) | (.39) | (.06) | (.19) |
| Total distributions | (.25)B | (.70) | (.91) | (.59) | (.28) | (.41) |
| Net asset value, end of period | $13.06 | $12.49 | $13.51 | $13.49 | $12.58 | $11.81 |
| Total ReturnC,D | 6.67% | (2.50)% | 7.23% | 12.08% | 9.03% | 1.93% |
| Ratios to Average Net AssetsE,F | | | | | | |
| Expenses before reductionsG | - %H | -% | -% | -% | -% | -% |
| Expenses net of fee waivers, if any | - %H | -% | -% | -% | -% | -% |
| Expenses net of all reductions | - %H | -% | -% | -% | -% | -% |
| Net investment income (loss) | 1.07%H | 1.75% | 1.81% | 1.53% | 1.73% | 1.75% |
| Supplemental Data | | | | | | |
| Net assets, end of period (000 omitted) | $9,119,350 | $8,717,568 | $9,054,681 | $8,865,153 | $8,229,885 | $8,598,936 |
| Portfolio turnover rateE | 18%H | 17% | 19% | 46% | 31% | 28% |
A Calculated based on average shares outstanding during the period.
B Total distributions of $.25 per share is comprised of distributions from net investment income of $.024 and distributions from net realized gain of $.223 per share.
C Total returns for periods of less than one year are not annualized.
D Total returns would have been lower if certain expenses had not been reduced during the applicable periods shown.
E Amounts do not include the activity of the Underlying Funds.
F Expense ratios reflect operating expenses of the Fund. Expenses before reductions do not reflect amounts reimbursed by the investment adviser or reductions from expense offset arrangements and do not represent the amount paid by the Fund during periods when reimbursements or reductions occur. Expenses net of fee waivers reflect expenses after reimbursement by the investment adviser but prior to reductions from expense offset arrangements. Expenses net of all reductions represent the net expenses paid by the Fund but do not include expenses of the underlying funds in which the Fund invests.
G Amount represents less than .005%.
H Annualized
See accompanying notes which are an integral part of the financial statements.
See accompanying notes which are an integral part of the financial statements.
Fidelity Freedom® 2030 Fund
Investment Summary (Unaudited)
The information in the following tables is based on the direct investments of the Fund.
Top Holdings as of September 30, 2016
| | % of fund's net assets | % of fund's net assets 6 months ago |
| Fidelity Series Investment Grade Bond Fund | 10.4 | 9.6 |
| Fidelity Series Emerging Markets Fund | 9.3 | 8.8 |
| Fidelity Series Equity-Income Fund | 8.7 | 8.6 |
| Fidelity Series International Value Fund | 8.2 | 7.9 |
| Fidelity Series International Growth Fund | 8.2 | 8.1 |
| Fidelity Series Growth Company Fund | 7.7 | 7.9 |
| Fidelity Series Growth & Income Fund | 6.5 | 6.6 |
| Fidelity Series Stock Selector Large Cap Value Fund | 6.0 | 5.7 |
| Fidelity Series Intrinsic Opportunities Fund | 5.1 | 4.9 |
| Fidelity Series Blue Chip Growth Fund | 4.4 | 4.5 |
| | 74.5 | 72.6 |
Asset Allocation (% of fund's net assets)
| Period end |
| | Domestic Equity Funds | 56.9% |
| | International Equity Funds | 27.6% |
| | Bond Funds | 15.4% |
| | Short-Term Funds | 0.1% |

| Six months ago |
| | Domestic Equity Funds | 58.7% |
| | International Equity Funds | 26.7% |
| | Bond Funds | 14.5% |
| | Short-Term Funds | 0.1% |

Domestic Equity Funds category includes Fidelity Series Commodity Strategy Fund which invests in commodity-related investments.
Fidelity Freedom® 2030 Fund
Investments September 30, 2016 (Unaudited)
Showing Percentage of Net Assets
| Domestic Equity Funds - 56.9% | | | |
| | | Shares | Value |
| Fidelity Series 100 Index Fund (a) | | 14,296,440 | $204,153,159 |
| Fidelity Series 1000 Value Index Fund (a) | | 19,078,383 | 213,105,536 |
| Fidelity Series All-Sector Equity Fund (a) | | 28,696,995 | 385,400,638 |
| Fidelity Series Blue Chip Growth Fund (a) | | 39,861,698 | 467,577,723 |
| Fidelity Series Commodity Strategy Fund (a)(b) | | 32,558,723 | 172,235,646 |
| Fidelity Series Equity-Income Fund (a) | | 74,371,343 | 919,973,511 |
| Fidelity Series Growth & Income Fund (a) | | 51,194,541 | 685,494,909 |
| Fidelity Series Growth Company Fund (a) | | 60,393,249 | 809,873,470 |
| Fidelity Series Intrinsic Opportunities Fund (a) | | 36,098,269 | 542,556,985 |
| Fidelity Series Opportunistic Insights Fund (a) | | 28,577,431 | 437,234,696 |
| Fidelity Series Real Estate Equity Fund (a) | | 5,583,757 | 76,888,338 |
| Fidelity Series Small Cap Discovery Fund (a) | | 11,168,687 | 117,717,960 |
| Fidelity Series Small Cap Opportunities Fund (a) | | 27,440,164 | 360,838,162 |
| Fidelity Series Stock Selector Large Cap Value Fund (a) | | 53,714,528 | 633,294,288 |
| TOTAL DOMESTIC EQUITY FUNDS | | | |
| (Cost $5,053,255,745) | | | 6,026,345,021 |
|
| International Equity Funds - 27.6% | | | |
| Fidelity Series Emerging Markets Fund (a) | | 58,583,985 | 985,382,628 |
| Fidelity Series International Growth Fund (a) | | 61,942,796 | 867,199,148 |
| Fidelity Series International Small Cap Fund (a) | | 12,796,716 | 199,244,865 |
| Fidelity Series International Value Fund (a) | | 91,843,495 | 870,676,332 |
| TOTAL INTERNATIONAL EQUITY FUNDS | | | |
| (Cost $2,699,109,236) | | | 2,922,502,973 |
|
| Bond Funds - 15.4% | | | |
| Fidelity Series Emerging Markets Debt Fund (a) | | 6,754,809 | 69,979,820 |
| Fidelity Series Floating Rate High Income Fund (a) | | 2,812,214 | 26,491,054 |
| Fidelity Series High Income Fund (a) | | 34,533,276 | 323,231,463 |
| Fidelity Series Inflation-Protected Bond Index Fund (a) | | 5,719,513 | 57,595,501 |
| Fidelity Series Investment Grade Bond Fund (a) | | 95,029,912 | 1,102,346,976 |
| Fidelity Series Long-Term Treasury Bond Index Fund (a) | | 109,246 | 1,054,220 |
| Fidelity Series Real Estate Income Fund (a) | | 4,784,195 | 53,678,668 |
| TOTAL BOND FUNDS | | | |
| (Cost $1,622,771,622) | | | 1,634,377,702 |
|
| Short-Term Funds - 0.1% | | | |
| Fidelity Series Government Money Market Fund 0.29% (a)(c) | | 3,235,836 | 3,235,836 |
| Fidelity Series Short-Term Credit Fund (a) | | 173,586 | 1,741,069 |
| TOTAL SHORT-TERM FUNDS | | | |
| (Cost $4,968,119) | | | 4,976,905 |
| TOTAL INVESTMENT PORTFOLIO - 100.0% | | | |
| (Cost $9,380,104,722) | | | 10,588,202,601 |
| NET OTHER ASSETS (LIABILITIES) - 0.0% | | | 2,780 |
| NET ASSETS - 100% | | | $10,588,205,381 |
(a) Affiliated Fund
(b) Non-income producing
(c) The rate quoted is the annualized seven-day yield of the fund at period end.
Affiliated Underlying Funds
Information regarding the Fund's fiscal year to date purchases and sales of the affiliated Underlying Funds and income earned by the Fund from investments in affiliated Underlying Funds is as follows:
| Affiliate | Value, beginning of period | Purchases | Sales Proceeds | Dividend Income | Value, end of period |
| Fidelity Investments Money Market Portfolio Institutional Class 0.59% | $3,287,171 | $5,535 | $3,292,706 | $1,587 | $-- |
| Fidelity Series 100 Index Fund | 206,666,084 | 3,418,690 | 18,138,883 | -- | 204,153,159 |
| Fidelity Series 1000 Value Index Fund | 116,400,980 | 95,955,371 | 8,155,593 | -- | 213,105,536 |
| Fidelity Series All-Sector Equity Fund | 651,618,742 | 9,037,769 | 316,671,810 | -- | 385,400,638 |
| Fidelity Series Blue Chip Growth Fund | 451,701,527 | 9,628,336 | 29,361,426 | 835,847 | 467,577,723 |
| Fidelity Series Commodity Strategy Fund | 128,483,254 | 38,408,926 | 5,226,696 | -- | 172,235,646 |
| Fidelity Series Emerging Markets Debt Fund | 64,084,312 | 2,478,425 | 2,441,706 | 1,846,184 | 69,979,820 |
| Fidelity Series Emerging Markets Fund | 892,764,259 | 13,736,549 | 34,808,173 | -- | 985,382,628 |
| Fidelity Series Equity-Income Fund | 875,121,040 | 34,599,602 | 55,858,446 | 7,671,989 | 919,973,511 |
| Fidelity Series Floating Rate High Income Fund | 25,555,795 | 822,898 | 1,132,089 | 569,390 | 26,491,054 |
| Fidelity Series Government Money Market Fund 0.29% | -- | 3,380,751 | 144,915 | 3,089 | 3,235,836 |
| Fidelity Series Growth & Income Fund | 671,268,114 | 14,173,097 | 50,281,568 | 5,520,962 | 685,494,909 |
| Fidelity Series Growth Company Fund | 803,430,096 | 58,279 | 68,419,858 | -- | 809,873,470 |
| Fidelity Series High Income Fund | 302,455,925 | 8,792,142 | 11,921,244 | 8,792,136 | 323,231,463 |
| Fidelity Series Inflation-Protected Bond Index Fund | 52,620,545 | 6,473,868 | 2,535,164 | 22,809 | 57,595,501 |
| Fidelity Series International Growth Fund | 820,213,784 | 47,993,137 | 43,045,517 | -- | 867,199,148 |
| Fidelity Series International Small Cap Fund | 193,440,811 | 13,274,887 | 14,762,783 | -- | 199,244,865 |
| Fidelity Series International Value Fund | 808,386,035 | 72,750,835 | 43,091,383 | -- | 870,676,332 |
| Fidelity Series Intrinsic Opportunities Fund | 497,047,981 | 13,722,823 | -- | 3,688,101 | 542,556,985 |
| Fidelity Series Investment Grade Bond Fund | 971,095,770 | 139,314,224 | 34,396,004 | 12,595,746 | 1,102,346,976 |
| Fidelity Series Long-Term Treasury Bond Index Fund | -- | 1,121,379 | 28,620 | 4,589 | 1,054,220 |
| Fidelity Series Opportunistic Insights Fund | 435,289,244 | 11,282,023 | 31,202,726 | -- | 437,234,696 |
| Fidelity Series Real Estate Equity Fund | 80,453,961 | 8,630,555 | 10,649,369 | 700,811 | 76,888,338 |
| Fidelity Series Real Estate Income Fund | 51,552,032 | 3,794,672 | 3,292,742 | 1,307,926 | 53,678,668 |
| Fidelity Series Short-Term Credit Fund | 1,774,399 | 72,262 | 112,848 | 8,650 | 1,741,069 |
| Fidelity Series Small Cap Discovery Fund | 114,969,158 | 1,500,510 | 5,166,690 | 147,876 | 117,717,960 |
| Fidelity Series Small Cap Opportunities Fund | 350,857,738 | 4,966,047 | 24,785,825 | 905,487 | 360,838,162 |
| Fidelity Series Stock Selector Large Cap Value Fund | 579,598,642 | 50,651,627 | 35,148,609 | -- | 633,294,288 |
| Total | $10,150,137,399 | $610,045,219 | $854,073,393 | $44,623,179 | $10,588,202,601 |
Investment Valuation
All investments are categorized as Level 1 under the Fair Value Hierarchy. The inputs or methodology used for valuing securities may not be an indication of the risk associated with investing in those securities. For more information on valuation inputs please refer to the Investment Valuation section in the accompanying Notes to Financial Statements.
See accompanying notes which are an integral part of the financial statements.
Fidelity Freedom® 2030 Fund
Financial Statements
Statement of Assets and Liabilities
| | | September 30, 2016 (Unaudited) |
| Assets | | |
| Investment in securities, at value (cost $9,380,104,722) — See accompanying schedule | | $10,588,202,601 |
| Receivable for investments sold | | 30,488,363 |
| Receivable for fund shares sold | | 8,883,208 |
| Other receivables | | 98,028 |
| Total assets | | 10,627,672,200 |
| Liabilities | | |
| Payable for investments purchased | $20,064,602 | |
| Payable for fund shares redeemed | 19,304,186 | |
| Other payables and accrued expenses | 98,031 | |
| Total liabilities | | 39,466,819 |
| Net Assets | | $10,588,205,381 |
| Net Assets consist of: | | |
| Paid in capital | | $9,335,636,517 |
| Undistributed net investment income | | 44,091,761 |
| Accumulated undistributed net realized gain (loss) on investments | | 379,224 |
| Net unrealized appreciation (depreciation) on investments | | 1,208,097,879 |
| Net Assets, for 663,847,349 shares outstanding | | $10,588,205,381 |
| Net Asset Value, offering price and redemption price per share ($10,588,205,381 ÷ 663,847,349 shares) | | $15.95 |
See accompanying notes which are an integral part of the financial statements.
Statement of Operations
| | | Six months ended September 30, 2016 (Unaudited) |
| Investment Income | | |
| Income distributions from underlying funds | | $44,623,179 |
| Expenses | | |
| Independent trustees' fees and expenses | $23,078 | |
| Total expenses before reductions | 23,078 | |
| Expense reductions | (23,078) | – |
| Net investment income (loss) | | 44,623,179 |
| Realized and Unrealized Gain (Loss) | | |
| Realized gain (loss) on sale of underlying fund shares | 28,853,818 | |
| Capital gain distributions from underlying funds | 4,955,391 | |
| Total net realized gain (loss) | | 33,809,209 |
| Change in net unrealized appreciation (depreciation) on underlying funds | | 653,239,549 |
| Net gain (loss) | | 687,048,758 |
| Net increase (decrease) in net assets resulting from operations | | $731,671,937 |
See accompanying notes which are an integral part of the financial statements.
Statement of Changes in Net Assets
| | Six months ended September 30, 2016 (Unaudited) | Year ended March 31, 2016 |
| Increase (Decrease) in Net Assets | | |
| Operations | | |
| Net investment income (loss) | $44,623,179 | $166,126,784 |
| Net realized gain (loss) | 33,809,209 | 380,469,056 |
| Change in net unrealized appreciation (depreciation) | 653,239,549 | (890,835,659) |
| Net increase (decrease) in net assets resulting from operations | 731,671,937 | (344,239,819) |
| Distributions to shareholders from net investment income | (12,648,036) | (167,988,955) |
| Distributions to shareholders from net realized gain | (213,022,677) | (434,691,308) |
| Total distributions | (225,670,713) | (602,680,263) |
| Share transactions | | |
| Proceeds from sales of shares | 811,040,560 | 1,962,124,614 |
| Reinvestment of distributions | 223,885,589 | 599,353,478 |
| Cost of shares redeemed | (1,102,859,363) | (2,348,078,251) |
| Net increase (decrease) in net assets resulting from share transactions | (67,933,214) | 213,399,841 |
| Total increase (decrease) in net assets | 438,068,010 | (733,520,241) |
| Net Assets | | |
| Beginning of period | 10,150,137,371 | 10,883,657,612 |
| End of period | $10,588,205,381 | $10,150,137,371 |
| Other Information | | |
| Undistributed net investment income end of period | $44,091,761 | $12,116,618 |
| Shares | | |
| Sold | 52,507,416 | 124,740,082 |
| Issued in reinvestment of distributions | 15,106,993 | 37,649,896 |
| Redeemed | (71,602,164) | (149,479,206) |
| Net increase (decrease) | (3,987,755) | 12,910,772 |
See accompanying notes which are an integral part of the financial statements.
Financial Highlights — Fidelity Freedom 2030 Fund
| | Six months ended (Unaudited) September 30, | Years ended March 31, | | | | |
| | 2016 | 2016 | 2015 | 2014 | 2013 | 2012 |
| Selected Per–Share Data | | | | | | |
| Net asset value, beginning of period | $15.20 | $16.62 | $16.47 | $15.02 | $14.07 | $14.40 |
| Income from Investment Operations | | | | | | |
| Net investment income (loss)A | .07 | .25 | .27 | .24 | .25 | .24 |
| Net realized and unrealized gain (loss) | 1.02 | (.75) | .95 | 1.71 | 1.04 | (.07) |
| Total from investment operations | 1.09 | (.50) | 1.22 | 1.95 | 1.29 | .17 |
| Distributions from net investment income | (.02) | (.26) | (.28) | (.25) | (.27) | (.26) |
| Distributions from net realized gain | (.32) | (.67) | (.79) | (.25) | (.07) | (.24) |
| Total distributions | (.34) | (.92)B | (1.07) | (.50) | (.34) | (.50) |
| Net asset value, end of period | $15.95 | $15.20 | $16.62 | $16.47 | $15.02 | $14.07 |
| Total ReturnC,D | 7.33% | (3.17)% | 7.76% | 13.08% | 9.30% | 1.48% |
| Ratios to Average Net AssetsE,F | | | | | | |
| Expenses before reductionsG | - %H | -% | -% | -% | -% | -% |
| Expenses net of fee waivers, if any | - %H | -% | -% | -% | -% | -% |
| Expenses net of all reductions | - %H | -% | -% | -% | -% | -% |
| Net investment income (loss) | .86%H | 1.59% | 1.68% | 1.50% | 1.77% | 1.75% |
| Supplemental Data | | | | | | |
| Net assets, end of period (000 omitted) | $10,588,205 | $10,150,137 | $10,883,658 | $10,933,549 | $10,636,397 | $11,654,912 |
| Portfolio turnover rateE | 12%H | 16% | 17% | 54% | 29% | 26% |
A Calculated based on average shares outstanding during the period.
B Total distributions of $.92 per share is comprised of distributions from net investment income of $.257 and distributions from net realized gain of $.665 per share.
C Total returns for periods of less than one year are not annualized.
D Total returns would have been lower if certain expenses had not been reduced during the applicable periods shown.
E Amounts do not include the activity of the Underlying Funds.
F Expense ratios reflect operating expenses of the Fund. Expenses before reductions do not reflect amounts reimbursed by the investment adviser or reductions from expense offset arrangements and do not represent the amount paid by the Fund during periods when reimbursements or reductions occur. Expenses net of fee waivers reflect expenses after reimbursement by the investment adviser but prior to reductions from expense offset arrangements. Expenses net of all reductions represent the net expenses paid by the Fund but do not include expenses of the underlying funds in which the Fund invests.
G Amount represents less than .005%.
H Annualized
See accompanying notes which are an integral part of the financial statements.
Fidelity Freedom® 2035 Fund
Investment Summary (Unaudited)
The information in the following tables is based on the direct investments of the Fund.
Top Holdings as of September 30, 2016
| | % of fund's net assets | % of fund's net assets 6 months ago |
| Fidelity Series Emerging Markets Fund | 10.0 | 9.4 |
| Fidelity Series Equity-Income Fund | 9.9 | 9.6 |
| Fidelity Series International Value Fund | 9.3 | 8.9 |
| Fidelity Series International Growth Fund | 9.2 | 9.0 |
| Fidelity Series Growth Company Fund | 8.5 | 8.8 |
| Fidelity Series Growth & Income Fund | 7.2 | 7.3 |
| Fidelity Series Stock Selector Large Cap Value Fund | 6.9 | 6.3 |
| Fidelity Series Intrinsic Opportunities Fund | 5.7 | 5.4 |
| Fidelity Series Blue Chip Growth Fund | 4.9 | 4.9 |
| Fidelity Series Opportunistic Insights Fund | 4.6 | 4.8 |
| | 76.2 | 74.4 |
Asset Allocation (% of fund's net assets)
| Period end |
| | Domestic Equity Funds | 63.9% |
| | International Equity Funds | 30.6% |
| | Bond Funds | 5.5% |

| Six months ago |
| | Domestic Equity Funds | 65.1% |
| | International Equity Funds | 29.4% |
| | Bond Funds | 5.4% |
| | Short-Term Funds | 0.1% |

Domestic Equity Funds category includes Fidelity Series Commodity Strategy Fund which invests in commodity-related investments.
Fidelity Freedom® 2035 Fund
Investments September 30, 2016 (Unaudited)
Showing Percentage of Net Assets
| Domestic Equity Funds - 63.9% | | | |
| | | Shares | Value |
| Fidelity Series 100 Index Fund (a) | | 9,584,592 | $136,867,979 |
| Fidelity Series 1000 Value Index Fund (a) | | 13,450,439 | 150,241,401 |
| Fidelity Series All-Sector Equity Fund (a) | | 19,347,280 | 259,833,969 |
| Fidelity Series Blue Chip Growth Fund (a) | | 26,475,296 | 310,555,228 |
| Fidelity Series Commodity Strategy Fund (a)(b) | | 19,639,329 | 103,892,050 |
| Fidelity Series Equity-Income Fund (a) | | 50,347,126 | 622,793,952 |
| Fidelity Series Growth & Income Fund (a) | | 34,031,697 | 455,684,419 |
| Fidelity Series Growth Company Fund (a) | | 40,045,565 | 537,011,024 |
| Fidelity Series Intrinsic Opportunities Fund (a) | | 23,813,279 | 357,913,590 |
| Fidelity Series Opportunistic Insights Fund (a) | | 19,005,113 | 290,778,235 |
| Fidelity Series Real Estate Equity Fund (a) | | 3,712,439 | 51,120,291 |
| Fidelity Series Small Cap Discovery Fund (a) | | 7,473,086 | 78,766,330 |
| Fidelity Series Small Cap Opportunities Fund (a) | | 18,261,468 | 240,138,310 |
| Fidelity Series Stock Selector Large Cap Value Fund (a) | | 36,637,523 | 431,956,393 |
| TOTAL DOMESTIC EQUITY FUNDS | | | |
| (Cost $3,402,223,337) | | | 4,027,553,171 |
|
| International Equity Funds - 30.6% | | | |
| Fidelity Series Emerging Markets Fund (a) | | 37,282,142 | 627,085,630 |
| Fidelity Series International Growth Fund (a) | | 41,600,130 | 582,401,825 |
| Fidelity Series International Small Cap Fund (a) | | 8,593,757 | 133,804,799 |
| Fidelity Series International Value Fund (a) | | 61,679,304 | 584,719,805 |
| TOTAL INTERNATIONAL EQUITY FUNDS | | | |
| (Cost $1,771,435,685) | | | 1,928,012,059 |
|
| Bond Funds - 5.5% | | | |
| Fidelity Series Emerging Markets Debt Fund (a) | | 4,091,103 | 42,383,832 |
| Fidelity Series Floating Rate High Income Fund (a) | | 1,682,996 | 15,853,821 |
| Fidelity Series High Income Fund (a) | | 20,294,807 | 189,959,393 |
| Fidelity Series Inflation-Protected Bond Index Fund (a) | | 3,382,137 | 34,058,117 |
| Fidelity Series Investment Grade Bond Fund (a) | | 2,503,643 | 29,042,259 |
| Fidelity Series Long-Term Treasury Bond Index Fund (a) | | 3,462 | 33,406 |
| Fidelity Series Real Estate Income Fund (a) | | 2,853,379 | 32,014,910 |
| TOTAL BOND FUNDS | | | |
| (Cost $349,669,330) | | | 343,345,738 |
|
| Short-Term Funds - 0.0% | | | |
| Fidelity Series Government Money Market Fund 0.29% (a)(c) | | 1,903,195 | 1,903,195 |
| Fidelity Series Short-Term Credit Fund (a) | | 102,912 | 1,032,203 |
| TOTAL SHORT-TERM FUNDS | | | |
| (Cost $2,929,573) | | | 2,935,398 |
| TOTAL INVESTMENT PORTFOLIO - 100.0% | | | |
| (Cost $5,526,257,925) | | | 6,301,846,366 |
| NET OTHER ASSETS (LIABILITIES) - 0.0% | | | 206 |
| NET ASSETS - 100% | | | $6,301,846,572 |
(a) Affiliated Fund
(b) Non-income producing
(c) The rate quoted is the annualized seven-day yield of the fund at period end.
Affiliated Underlying Funds
Information regarding the Fund's fiscal year to date purchases and sales of the affiliated Underlying Funds and income earned by the Fund from investments in affiliated Underlying Funds is as follows:
| Affiliate | Value, beginning of period | Purchases | Sales Proceeds | Dividend Income | Value, end of period |
| Fidelity Investments Money Market Portfolio Institutional Class 0.59% | $1,930,155 | $4,339 | $1,934,494 | $884 | $-- |
| Fidelity Series 100 Index Fund | 134,851,010 | 3,510,272 | 9,557,637 | -- | 136,867,979 |
| Fidelity Series 1000 Value Index Fund | 76,399,576 | 72,843,392 | 4,824,402 | -- | 150,241,401 |
| Fidelity Series All-Sector Equity Fund | 425,636,049 | 7,346,759 | 200,683,440 | -- | 259,833,969 |
| Fidelity Series Blue Chip Growth Fund | 295,179,097 | 8,754,545 | 16,922,487 | 555,336 | 310,555,228 |
| Fidelity Series Commodity Strategy Fund | 75,534,320 | 24,965,724 | 2,628,454 | -- | 103,892,050 |
| Fidelity Series Emerging Markets Debt Fund | 38,444,221 | 1,779,659 | 1,367,460 | 1,112,113 | 42,383,832 |
| Fidelity Series Emerging Markets Fund | 558,658,181 | 12,920,736 | 16,708,789 | -- | 627,085,630 |
| Fidelity Series Equity-Income Fund | 571,011,361 | 40,819,368 | 32,637,836 | 5,045,726 | 622,793,952 |
| Fidelity Series Floating Rate High Income Fund | 15,081,225 | 612,855 | 578,431 | 338,556 | 15,853,821 |
| Fidelity Series Government Money Market Fund 0.29% | -- | 1,940,600 | 37,405 | 1,791 | 1,903,195 |
| Fidelity Series Growth & Income Fund | 438,444,277 | 13,379,926 | 29,407,019 | 3,623,551 | 455,684,419 |
| Fidelity Series Growth Company Fund | 524,506,883 | 60 | 36,756,682 | -- | 537,011,024 |
| Fidelity Series High Income Fund | 177,223,438 | 5,150,854 | 6,425,526 | 5,150,848 | 189,959,393 |
| Fidelity Series Inflation-Protected Bond Index Fund | 30,441,638 | 4,160,297 | 1,126,023 | 13,228 | 34,058,117 |
| Fidelity Series International Growth Fund | 537,063,287 | 38,296,727 | 20,751,798 | -- | 582,401,825 |
| Fidelity Series International Small Cap Fund | 125,912,507 | 10,048,132 | 7,094,339 | -- | 133,804,799 |
| Fidelity Series International Value Fund | 533,150,816 | 54,042,335 | 24,229,078 | -- | 584,719,805 |
| Fidelity Series Intrinsic Opportunities Fund | 322,160,798 | 14,870,549 | -- | 2,431,622 | 357,913,590 |
| Fidelity Series Investment Grade Bond Fund | 29,823,232 | 4,329,142 | 5,913,464 | 369,306 | 29,042,259 |
| Fidelity Series Long-Term Treasury Bond Index Fund | -- | 35,507 | 887 | 145 | 33,406 |
| Fidelity Series Opportunistic Insights Fund | 284,651,988 | 9,904,151 | 18,231,567 | -- | 290,778,235 |
| Fidelity Series Real Estate Equity Fund | 52,942,465 | 5,233,053 | 5,983,884 | 461,776 | 51,120,291 |
| Fidelity Series Real Estate Income Fund | 30,462,027 | 2,486,387 | 1,893,598 | 776,353 | 32,014,910 |
| Fidelity Series Short-Term Credit Fund | 1,041,816 | 55,915 | 69,816 | 5,108 | 1,032,203 |
| Fidelity Series Small Cap Discovery Fund | 76,103,500 | 2,491,059 | 4,100,647 | 96,938 | 78,766,330 |
| Fidelity Series Small Cap Opportunities Fund | 228,924,297 | 5,379,317 | 13,842,760 | 601,483 | 240,138,310 |
| Fidelity Series Stock Selector Large Cap Value Fund | 375,509,642 | 48,935,763 | 17,557,282 | -- | 431,956,393 |
| Total | $5,961,087,806 | $394,297,423 | $481,265,205 | $20,584,764 | $6,301,846,366 |
Investment Valuation
All investments are categorized as Level 1 under the Fair Value Hierarchy. The inputs or methodology used for valuing securities may not be an indication of the risk associated with investing in those securities. For more information on valuation inputs please refer to the Investment Valuation section in the accompanying Notes to Financial Statements.
See accompanying notes which are an integral part of the financial statements.
Fidelity Freedom® 2035 Fund
Financial Statements
Statement of Assets and Liabilities
| | | September 30, 2016 (Unaudited) |
| Assets | | |
| Investment in securities, at value (cost $5,526,257,925) — See accompanying schedule | | $6,301,846,366 |
| Receivable for investments sold | | 11,105,743 |
| Receivable for fund shares sold | | 5,718,168 |
| Total assets | | 6,318,670,277 |
| Liabilities | | |
| Payable for investments purchased | $4,513,638 | |
| Payable for fund shares redeemed | 12,310,067 | |
| Total liabilities | | 16,823,705 |
| Net Assets | | $6,301,846,572 |
| Net Assets consist of: | | |
| Paid in capital | | $5,506,794,979 |
| Undistributed net investment income | | 20,578,736 |
| Accumulated undistributed net realized gain (loss) on investments | | (1,115,584) |
| Net unrealized appreciation (depreciation) on investments | | 775,588,441 |
| Net Assets, for 481,338,350 shares outstanding | | $6,301,846,572 |
| Net Asset Value, offering price and redemption price per share ($6,301,846,572 ÷ 481,338,350 shares) | | $13.09 |
See accompanying notes which are an integral part of the financial statements.
Statement of Operations
| | | Six months ended September 30, 2016 (Unaudited) |
| Investment Income | | |
| Income distributions from underlying funds | | $20,584,764 |
| Expenses | | |
| Independent trustees' fees and expenses | $13,591 | |
| Total expenses before reductions | 13,591 | |
| Expense reductions | (13,591) | – |
| Net investment income (loss) | | 20,584,764 |
| Realized and Unrealized Gain (Loss) | | |
| Realized gain (loss) on sale of underlying fund shares | 22,731,072 | |
| Capital gain distributions from underlying funds | 3,245,534 | |
| Total net realized gain (loss) | | 25,976,606 |
| Change in net unrealized appreciation (depreciation) on underlying funds | | 404,995,260 |
| Net gain (loss) | | 430,971,866 |
| Net increase (decrease) in net assets resulting from operations | | $451,556,630 |
See accompanying notes which are an integral part of the financial statements.
Statement of Changes in Net Assets
| | Six months ended September 30, 2016 (Unaudited) | Year ended March 31, 2016 |
| Increase (Decrease) in Net Assets | | |
| Operations | | |
| Net investment income (loss) | $20,584,764 | $89,543,831 |
| Net realized gain (loss) | 25,976,606 | 230,624,292 |
| Change in net unrealized appreciation (depreciation) | 404,995,260 | (542,740,379) |
| Net increase (decrease) in net assets resulting from operations | 451,556,630 | (222,572,256) |
| Distributions to shareholders from net investment income | (1,433,143) | (91,646,599) |
| Distributions to shareholders from net realized gain | (140,464,335) | (254,170,239) |
| Total distributions | (141,897,478) | (345,816,838) |
| Share transactions | | |
| Proceeds from sales of shares | 583,758,882 | 1,391,620,967 |
| Reinvestment of distributions | 141,083,673 | 344,791,446 |
| Cost of shares redeemed | (693,742,884) | (1,496,280,333) |
| Net increase (decrease) in net assets resulting from share transactions | 31,099,671 | 240,132,080 |
| Total increase (decrease) in net assets | 340,758,823 | (328,257,014) |
| Net Assets | | |
| Beginning of period | 5,961,087,749 | 6,289,344,763 |
| End of period | $6,301,846,572 | $5,961,087,749 |
| Other Information | | |
| Undistributed net investment income end of period | $20,578,736 | $1,427,115 |
| Shares | | |
| Sold | 46,153,018 | 108,051,819 |
| Issued in reinvestment of distributions | 11,650,183 | 26,289,610 |
| Redeemed | (54,965,313) | (115,780,170) |
| Net increase (decrease) | 2,837,888 | 18,561,259 |
See accompanying notes which are an integral part of the financial statements.
Financial Highlights — Fidelity Freedom 2035 Fund
| | Six months ended (Unaudited) September 30, | Years ended March 31, | | | | |
| | 2016 | 2016 | 2015 | 2014 | 2013 | 2012 |
| Selected Per–Share Data | | | | | | |
| Net asset value, beginning of period | $12.46 | $13.67 | $13.62 | $12.57 | $11.68 | $12.04 |
| Income from Investment Operations | | | | | | |
| Net investment income (loss)A | .04 | .19 | .22 | .18 | .20 | .18 |
| Net realized and unrealized gain (loss) | .89 | (.65) | .80 | 1.63 | .93 | (.14) |
| Total from investment operations | .93 | (.46) | 1.02 | 1.81 | 1.13 | .04 |
| Distributions from net investment income | –B | (.20) | (.23) | (.19) | (.21) | (.19) |
| Distributions from net realized gain | (.29) | (.55) | (.75) | (.57) | (.03) | (.21) |
| Total distributions | (.30)C | (.75) | (.97)D | (.76) | (.24) | (.40) |
| Net asset value, end of period | $13.09 | $12.46 | $13.67 | $13.62 | $12.57 | $11.68 |
| Total ReturnE,F | 7.63% | (3.59)% | 7.90% | 14.76% | 9.85% | .63% |
| Ratios to Average Net AssetsG,H | | | | | | |
| Expenses before reductionsI | - %J | -% | -% | -% | -% | -% |
| Expenses net of fee waivers, if any | - %J | -% | -% | -% | -% | -% |
| Expenses net of all reductions | - %J | -% | -% | -% | -% | -% |
| Net investment income (loss) | .67%J | 1.48% | 1.62% | 1.42% | 1.70% | 1.57% |
| Supplemental Data | | | | | | |
| Net assets, end of period (000 omitted) | $6,301,847 | $5,961,088 | $6,289,345 | $6,183,144 | $5,648,531 | $5,857,392 |
| Portfolio turnover rateG | 13%J | 15% | 18% | 54% | 36% | 30% |
A Calculated based on average shares outstanding during the period.
B Amount represents less than $.005 per share.
C Total distributions of $.30 per share is comprised of distributions from net investment income of $.003 and distributions from net realized gain of $.294 per share.
D Total distributions of $.97 per share is comprised of distributions from net investment income of $.226 and distributions from net realized gain of $.746 per share.
E Total returns for periods of less than one year are not annualized.
F Total returns would have been lower if certain expenses had not been reduced during the applicable periods shown.
G Amounts do not include the activity of the Underlying Funds.
H Expense ratios reflect operating expenses of the Fund. Expenses before reductions do not reflect amounts reimbursed by the investment adviser or reductions from expense offset arrangements and do not represent the amount paid by the Fund during periods when reimbursements or reductions occur. Expenses net of fee waivers reflect expenses after reimbursement by the investment adviser but prior to reductions from expense offset arrangements. Expenses net of all reductions represent the net expenses paid by the Fund but do not include expenses of the underlying funds in which the Fund invests.
I Amount represents less than .005%.
J Annualized
See accompanying notes which are an integral part of the financial statements.
Fidelity Freedom® 2040 Fund
Investment Summary (Unaudited)
The information in the following tables is based on the direct investments of the Fund.
Top Holdings as of September 30, 2016
| | % of fund's net assets | % of fund's net assets 6 months ago |
| Fidelity Series Emerging Markets Fund | 10.0 | 9.4 |
| Fidelity Series Equity-Income Fund | 9.9 | 9.6 |
| Fidelity Series International Value Fund | 9.3 | 8.9 |
| Fidelity Series International Growth Fund | 9.2 | 9.0 |
| Fidelity Series Growth Company Fund | 8.6 | 8.8 |
| Fidelity Series Growth & Income Fund | 7.2 | 7.3 |
| Fidelity Series Stock Selector Large Cap Value Fund | 6.9 | 6.3 |
| Fidelity Series Intrinsic Opportunities Fund | 5.7 | 5.4 |
| Fidelity Series Blue Chip Growth Fund | 4.9 | 4.9 |
| Fidelity Series Opportunistic Insights Fund | 4.6 | 4.8 |
| | 76.3 | 74.4 |
Asset Allocation (% of fund's net assets)
| Period end |
| | Domestic Equity Funds | 63.9% |
| | International Equity Funds | 30.6% |
| | Bond Funds | 5.5% |

| Six months ago |
| | Domestic Equity Funds | 65.1% |
| | International Equity Funds | 29.4% |
| | Bond Funds | 5.4% |
| | Short-Term Funds | 0.1% |

Domestic Equity Funds category includes Fidelity Series Commodity Strategy Fund which invests in commodity-related investments.
Fidelity Freedom® 2040 Fund
Investments September 30, 2016 (Unaudited)
Showing Percentage of Net Assets
| Domestic Equity Funds - 63.9% | | | |
| | | Shares | Value |
| Fidelity Series 100 Index Fund (a) | | 10,255,548 | $146,449,230 |
| Fidelity Series 1000 Value Index Fund (a) | | 14,362,698 | 160,431,335 |
| Fidelity Series All-Sector Equity Fund (a) | | 20,690,295 | 277,870,667 |
| Fidelity Series Blue Chip Growth Fund (a) | | 28,308,233 | 332,055,573 |
| Fidelity Series Commodity Strategy Fund (a)(b) | | 20,980,816 | 110,988,517 |
| Fidelity Series Equity-Income Fund (a) | | 53,844,771 | 666,059,815 |
| Fidelity Series Growth & Income Fund (a) | | 36,393,477 | 487,308,654 |
| Fidelity Series Growth Company Fund (a) | | 43,019,082 | 576,885,896 |
| Fidelity Series Intrinsic Opportunities Fund (a) | | 25,478,534 | 382,942,362 |
| Fidelity Series Opportunistic Insights Fund (a) | | 20,318,681 | 310,875,825 |
| Fidelity Series Real Estate Equity Fund (a) | | 3,972,076 | 54,695,480 |
| Fidelity Series Small Cap Discovery Fund (a) | | 7,983,525 | 84,146,350 |
| Fidelity Series Small Cap Opportunities Fund (a) | | 19,525,540 | 256,760,854 |
| Fidelity Series Stock Selector Large Cap Value Fund (a) | | 39,174,373 | 461,865,861 |
| TOTAL DOMESTIC EQUITY FUNDS | | | |
| (Cost $3,610,743,799) | | | 4,309,336,419 |
|
| International Equity Funds - 30.6% | | | |
| Fidelity Series Emerging Markets Fund (a) | | 39,903,531 | 671,177,388 |
| Fidelity Series International Growth Fund (a) | | 44,512,353 | 623,172,943 |
| Fidelity Series International Small Cap Fund (a) | | 9,195,360 | 143,171,757 |
| Fidelity Series International Value Fund (a) | | 65,997,116 | 625,652,659 |
| TOTAL INTERNATIONAL EQUITY FUNDS | | | |
| (Cost $1,896,859,539) | | | 2,063,174,747 |
|
| Bond Funds - 5.5% | | | |
| Fidelity Series Emerging Markets Debt Fund (a) | | 4,381,546 | 45,392,813 |
| Fidelity Series Floating Rate High Income Fund (a) | | 1,800,803 | 16,963,562 |
| Fidelity Series High Income Fund (a) | | 21,769,559 | 203,763,071 |
| Fidelity Series Inflation-Protected Bond Index Fund (a) | | 3,597,500 | 36,226,826 |
| Fidelity Series Investment Grade Bond Fund (a) | | 2,646,142 | 30,695,243 |
| Fidelity Series Long-Term Treasury Bond Index Fund (a) | | 3,653 | 35,248 |
| Fidelity Series Real Estate Income Fund (a) | | 3,059,305 | 34,325,404 |
| TOTAL BOND FUNDS | | | |
| (Cost $374,779,270) | | | 367,402,167 |
|
| Short-Term Funds - 0.0% | | | |
| Fidelity Series Government Money Market Fund 0.29% (a)(c) | | 1,968,662 | 1,968,662 |
| Fidelity Series Short-Term Credit Fund (a) | | 110,143 | 1,104,732 |
| TOTAL SHORT-TERM FUNDS | | | |
| (Cost $3,067,593) | | | 3,073,394 |
| TOTAL INVESTMENT PORTFOLIO - 100.0% | | | |
| (Cost $5,885,450,201) | | | 6,742,986,727 |
| NET OTHER ASSETS (LIABILITIES) - 0.0% | | | (11) |
| NET ASSETS - 100% | | | $6,742,986,716 |
(a) Affiliated Fund
(b) Non-income producing
(c) The rate quoted is the annualized seven-day yield of the fund at period end.
Affiliated Underlying Funds
Information regarding the Fund's fiscal year to date purchases and sales of the affiliated Underlying Funds and income earned by the Fund from investments in affiliated Underlying Funds is as follows:
| Affiliate | Value, beginning of period | Purchases | Sales Proceeds | Dividend Income | Value, end of period |
| Fidelity Investments Money Market Portfolio Institutional Class 0.59% | $2,041,947 | $4,932 | $2,046,880 | $928 | $-- |
| Fidelity Series 100 Index Fund | 144,528,586 | 3,155,972 | 9,865,145 | -- | 146,449,230 |
| Fidelity Series 1000 Value Index Fund | 81,705,902 | 77,210,239 | 4,714,852 | -- | 160,431,335 |
| Fidelity Series All-Sector Equity Fund | 456,005,832 | 6,729,194 | 214,354,395 | -- | 277,870,667 |
| Fidelity Series Blue Chip Growth Fund | 316,187,504 | 8,309,811 | 17,644,092 | 594,224 | 332,055,573 |
| Fidelity Series Commodity Strategy Fund | 81,044,966 | 26,355,303 | 2,854,346 | -- | 110,988,517 |
| Fidelity Series Emerging Markets Debt Fund | 41,221,070 | 1,751,843 | 1,362,349 | 1,192,445 | 45,392,813 |
| Fidelity Series Emerging Markets Fund | 598,815,169 | 12,315,806 | 17,296,182 | -- | 671,177,388 |
| Fidelity Series Equity-Income Fund | 611,987,622 | 39,691,161 | 32,319,852 | 5,409,390 | 666,059,815 |
| Fidelity Series Floating Rate High Income Fund | 16,226,060 | 595,425 | 651,611 | 363,846 | 16,963,562 |
| Fidelity Series Government Money Market Fund 0.29% | -- | 2,011,098 | 42,437 | 1,856 | 1,968,662 |
| Fidelity Series Growth & Income Fund | 469,727,283 | 12,323,474 | 30,352,283 | 3,882,735 | 487,308,654 |
| Fidelity Series Growth Company Fund | 561,884,413 | 5,777 | 37,932,353 | -- | 576,885,896 |
| Fidelity Series High Income Fund | 189,611,638 | 5,521,793 | 6,387,149 | 5,521,796 | 203,763,071 |
| Fidelity Series Inflation-Protected Bond Index Fund | 32,619,212 | 4,119,487 | 1,135,021 | 14,172 | 36,226,826 |
| Fidelity Series International Growth Fund | 575,590,222 | 38,062,123 | 20,229,548 | -- | 623,172,943 |
| Fidelity Series International Small Cap Fund | 134,985,920 | 10,030,491 | 7,124,325 | -- | 143,171,757 |
| Fidelity Series International Value Fund | 571,397,916 | 54,857,629 | 23,854,131 | -- | 625,652,659 |
| Fidelity Series Intrinsic Opportunities Fund | 346,797,974 | 13,761,493 | -- | 2,603,148 | 382,942,362 |
| Fidelity Series Investment Grade Bond Fund | 31,961,942 | 4,501,053 | 6,630,278 | 394,502 | 30,695,243 |
| Fidelity Series Long-Term Treasury Bond Index Fund | -- | 37,660 | 1,119 | 153 | 35,248 |
| Fidelity Series Opportunistic Insights Fund | 305,079,988 | 9,352,207 | 19,027,687 | -- | 310,875,825 |
| Fidelity Series Real Estate Equity Fund | 56,565,474 | 5,758,310 | 6,489,706 | 494,820 | 54,695,480 |
| Fidelity Series Real Estate Income Fund | 32,690,532 | 2,543,648 | 1,940,910 | 833,241 | 34,325,404 |
| Fidelity Series Short-Term Credit Fund | 1,078,943 | 93,972 | 72,711 | 5,436 | 1,104,732 |
| Fidelity Series Small Cap Discovery Fund | 81,563,395 | 2,016,454 | 4,004,893 | 104,031 | 84,146,350 |
| Fidelity Series Small Cap Opportunities Fund | 245,489,020 | 4,730,337 | 14,526,883 | 643,599 | 256,760,854 |
| Fidelity Series Stock Selector Large Cap Value Fund | 401,757,651 | 50,506,370 | 17,228,031 | -- | 461,865,861 |
| Total | $6,388,566,181 | $396,353,062 | $500,089,169 | $22,060,322 | $6,742,986,727 |
Investment Valuation
All investments are categorized as Level 1 under the Fair Value Hierarchy. The inputs or methodology used for valuing securities may not be an indication of the risk associated with investing in those securities. For more information on valuation inputs please refer to the Investment Valuation section in the accompanying Notes to Financial Statements.
See accompanying notes which are an integral part of the financial statements.
Fidelity Freedom® 2040 Fund
Financial Statements
Statement of Assets and Liabilities
| | | September 30, 2016 (Unaudited) |
| Assets | | |
| Investment in securities, at value (cost $5,885,450,201) — See accompanying schedule | | $6,742,986,727 |
| Receivable for investments sold | | 10,708,276 |
| Receivable for fund shares sold | | 6,089,005 |
| Total assets | | 6,759,784,008 |
| Liabilities | | |
| Payable for investments purchased | $4,983,412 | |
| Payable for fund shares redeemed | 11,813,880 | |
| Total liabilities | | 16,797,292 |
| Net Assets | | $6,742,986,716 |
| Net Assets consist of: | | |
| Paid in capital | | $5,859,343,105 |
| Undistributed net investment income | | 21,971,038 |
| Accumulated undistributed net realized gain (loss) on investments | | 4,136,047 |
| Net unrealized appreciation (depreciation) on investments | | 857,536,526 |
| Net Assets, for 733,397,249 shares outstanding | | $6,742,986,716 |
| Net Asset Value, offering price and redemption price per share ($6,742,986,716 ÷ 733,397,249 shares) | | $9.19 |
See accompanying notes which are an integral part of the financial statements.
Statement of Operations
| | | Six months ended September 30, 2016 (Unaudited) |
| Investment Income | | |
| Income distributions from underlying funds | | $22,060,322 |
| Expenses | | |
| Independent trustees' fees and expenses | $14,565 | |
| Total expenses before reductions | 14,565 | |
| Expense reductions | (14,565) | – |
| Net investment income (loss) | | 22,060,322 |
| Realized and Unrealized Gain (Loss) | | |
| Realized gain (loss) on sale of underlying fund shares | 22,793,525 | |
| Capital gain distributions from underlying funds | 3,472,506 | |
| Total net realized gain (loss) | | 26,266,031 |
| Change in net unrealized appreciation (depreciation) on underlying funds | | 435,363,117 |
| Net gain (loss) | | 461,629,148 |
| Net increase (decrease) in net assets resulting from operations | | $483,689,470 |
See accompanying notes which are an integral part of the financial statements.
Statement of Changes in Net Assets
| | Six months ended September 30, 2016 (Unaudited) | Year ended March 31, 2016 |
| Increase (Decrease) in Net Assets | | |
| Operations | | |
| Net investment income (loss) | $22,060,322 | $96,864,192 |
| Net realized gain (loss) | 26,266,031 | 265,037,432 |
| Change in net unrealized appreciation (depreciation) | 435,363,117 | (605,732,454) |
| Net increase (decrease) in net assets resulting from operations | 483,689,470 | (243,830,830) |
| Distributions to shareholders from net investment income | (3,645,606) | (98,407,460) |
| Distributions to shareholders from net realized gain | (150,928,365) | (295,579,053) |
| Total distributions | (154,573,971) | (393,986,513) |
| Share transactions | | |
| Proceeds from sales of shares | 571,678,747 | 1,349,322,844 |
| Reinvestment of distributions | 153,232,167 | 391,705,825 |
| Cost of shares redeemed | (699,605,806) | (1,615,836,532) |
| Net increase (decrease) in net assets resulting from share transactions | 25,305,108 | 125,192,137 |
| Total increase (decrease) in net assets | 354,420,607 | (512,625,206) |
| Net Assets | | |
| Beginning of period | 6,388,566,109 | 6,901,191,315 |
| End of period | $6,742,986,716 | $6,388,566,109 |
| Other Information | | |
| Undistributed net investment income end of period | $21,971,038 | $3,556,322 |
| Shares | | |
| Sold | 64,382,615 | 148,778,116 |
| Issued in reinvestment of distributions | 18,027,314 | 42,450,532 |
| Redeemed | (78,960,813) | (177,637,217) |
| Net increase (decrease) | 3,449,116 | 13,591,431 |
See accompanying notes which are an integral part of the financial statements.
Financial Highlights — Fidelity Freedom 2040 Fund
| | Six months ended (Unaudited) September 30, | Years ended March 31, | | | | |
| | 2016 | 2016 | 2015 | 2014 | 2013 | 2012 |
| Selected Per–Share Data | | | | | | |
| Net asset value, beginning of period | $8.75 | $9.63 | $9.62 | $8.78 | $8.15 | $8.41 |
| Income from Investment Operations | | | | | | |
| Net investment income (loss)A | .03 | .13 | .15 | .13 | .14 | .12 |
| Net realized and unrealized gain (loss) | .62 | (.46) | .57 | 1.17 | .66 | (.10) |
| Total from investment operations | .65 | (.33) | .72 | 1.30 | .80 | .02 |
| Distributions from net investment income | (.01) | (.14) | (.16) | (.13) | (.15) | (.13) |
| Distributions from net realized gain | (.21) | (.41) | (.55) | (.33) | (.02) | (.15) |
| Total distributions | (.21)B | (.55) | (.71) | (.46) | (.17) | (.28) |
| Net asset value, end of period | $9.19 | $8.75 | $9.63 | $9.62 | $8.78 | $8.15 |
| Total ReturnC,D | 7.65% | (3.62)% | 7.86% | 15.08% | 9.94% | .58% |
| Ratios to Average Net AssetsE,F | | | | | | |
| Expenses before reductionsG | - %H | -% | -% | -% | -% | -% |
| Expenses net of fee waivers, if any | - %H | -% | -% | -% | -% | -% |
| Expenses net of all reductions | - %H | -% | -% | -% | -% | -% |
| Net investment income (loss) | .67%H | 1.47% | 1.61% | 1.40% | 1.70% | 1.55% |
| Supplemental Data | | | | | | |
| Net assets, end of period (000 omitted) | $6,742,987 | $6,388,566 | $6,901,191 | $7,016,128 | $6,758,570 | $7,293,065 |
| Portfolio turnover rateE | 12%H | 16% | 17% | 49% | 33% | 27% |
A Calculated based on average shares outstanding during the period.
B Total distributions of $.21 per share is comprised of distributions from net investment income of $.005 and distributions from net realized gain of $.207 per share.
C Total returns for periods of less than one year are not annualized.
D Total returns would have been lower if certain expenses had not been reduced during the applicable periods shown.
E Amounts do not include the activity of the Underlying Funds.
F Expense ratios reflect operating expenses of the Fund. Expenses before reductions do not reflect amounts reimbursed by the investment adviser or reductions from expense offset arrangements and do not represent the amount paid by the Fund during periods when reimbursements or reductions occur. Expenses net of fee waivers reflect expenses after reimbursement by the investment adviser but prior to reductions from expense offset arrangements. Expenses net of all reductions represent the net expenses paid by the Fund but do not include expenses of the underlying funds in which the Fund invests.
G Amount represents less than .005%.
H Annualized
See accompanying notes which are an integral part of the financial statements.
Fidelity Freedom® 2045 Fund
Investment Summary (Unaudited)
The information in the following tables is based on the direct investments of the Fund.
Top Holdings as of September 30, 2016
| | % of fund's net assets | % of fund's net assets 6 months ago |
| Fidelity Series Emerging Markets Fund | 10.0 | 9.4 |
| Fidelity Series Equity-Income Fund | 9.9 | 9.6 |
| Fidelity Series International Value Fund | 9.3 | 8.9 |
| Fidelity Series International Growth Fund | 9.2 | 9.0 |
| Fidelity Series Growth Company Fund | 8.4 | 8.8 |
| Fidelity Series Growth & Income Fund | 7.2 | 7.3 |
| Fidelity Series Stock Selector Large Cap Value Fund | 6.9 | 6.3 |
| Fidelity Series Intrinsic Opportunities Fund | 5.7 | 5.5 |
| Fidelity Series Blue Chip Growth Fund | 4.9 | 4.9 |
| Fidelity Series Opportunistic Insights Fund | 4.6 | 4.8 |
| | 76.1 | 74.5 |
Asset Allocation (% of fund's net assets)
| Period end |
| | Domestic Equity Funds | 63.9% |
| | International Equity Funds | 30.6% |
| | Bond Funds | 5.4% |
| | Short-Term Funds | 0.1% |

| Six months ago |
| | Domestic Equity Funds | 65.1% |
| | International Equity Funds | 29.4% |
| | Bond Funds | 5.4% |
| | Short-Term Funds | 0.1% |

Domestic Equity Funds category includes Fidelity Series Commodity Strategy Fund which invests in commodity-related investments.
Fidelity Freedom® 2045 Fund
Investments September 30, 2016 (Unaudited)
Showing Percentage of Net Assets
| Domestic Equity Funds - 63.9% | | | |
| | | Shares | Value |
| Fidelity Series 100 Index Fund (a) | | 4,781,341 | $68,277,546 |
| Fidelity Series 1000 Value Index Fund (a) | | 6,729,438 | 75,167,828 |
| Fidelity Series All-Sector Equity Fund (a) | | 9,653,584 | 129,647,629 |
| Fidelity Series Blue Chip Growth Fund (a) | | 13,218,923 | 155,057,972 |
| Fidelity Series Commodity Strategy Fund (a)(b) | | 9,984,280 | 52,816,841 |
| Fidelity Series Equity-Income Fund (a) | | 25,132,322 | 310,886,823 |
| Fidelity Series Growth & Income Fund (a) | | 16,998,823 | 227,614,242 |
| Fidelity Series Growth Company Fund (a) | | 19,739,213 | 264,702,852 |
| Fidelity Series Intrinsic Opportunities Fund (a) | | 11,917,467 | 179,119,528 |
| Fidelity Series Opportunistic Insights Fund (a) | | 9,496,231 | 145,292,332 |
| Fidelity Series Real Estate Equity Fund (a) | | 1,852,791 | 25,512,927 |
| Fidelity Series Small Cap Discovery Fund (a) | | 3,735,291 | 39,369,966 |
| Fidelity Series Small Cap Opportunities Fund (a) | | 9,117,329 | 119,892,881 |
| Fidelity Series Stock Selector Large Cap Value Fund (a) | | 18,295,519 | 215,704,164 |
| TOTAL DOMESTIC EQUITY FUNDS | | | |
| (Cost $1,657,951,032) | | | 2,009,063,531 |
|
| International Equity Funds - 30.6% | | | |
| Fidelity Series Emerging Markets Fund (a) | | 18,612,059 | 313,054,833 |
| Fidelity Series International Growth Fund (a) | | 20,740,231 | 290,363,228 |
| Fidelity Series International Small Cap Fund (a) | | 4,284,542 | 66,710,326 |
| Fidelity Series International Value Fund (a) | | 30,750,938 | 291,518,893 |
| TOTAL INTERNATIONAL EQUITY FUNDS | | | |
| (Cost $867,413,341) | | | 961,647,280 |
|
| Bond Funds - 5.4% | | | |
| Fidelity Series Emerging Markets Debt Fund (a) | | 2,031,123 | 21,042,433 |
| Fidelity Series Floating Rate High Income Fund (a) | | 833,163 | 7,848,392 |
| Fidelity Series High Income Fund (a) | | 9,837,871 | 92,082,476 |
| Fidelity Series Inflation-Protected Bond Index Fund (a) | | 1,785,066 | 17,975,618 |
| Fidelity Series Investment Grade Bond Fund (a) | | 1,276,806 | 14,810,950 |
| Fidelity Series Long-Term Treasury Bond Index Fund (a) | | 1,779 | 17,171 |
| Fidelity Series Real Estate Income Fund (a) | | 1,417,460 | 15,903,905 |
| TOTAL BOND FUNDS | | | |
| (Cost $172,593,195) | | | 169,680,945 |
|
| Short-Term Funds - 0.1% | | | |
| Fidelity Series Government Money Market Fund 0.29% (a)(c) | | 950,733 | 950,733 |
| Fidelity Series Short-Term Credit Fund (a) | | 51,380 | 515,338 |
| TOTAL SHORT-TERM FUNDS | | | |
| (Cost $1,463,135) | | | 1,466,071 |
| TOTAL INVESTMENT PORTFOLIO - 100.0% | | | |
| (Cost $2,699,420,703) | | | 3,141,857,827 |
| NET OTHER ASSETS (LIABILITIES) - 0.0% | | | (7) |
| NET ASSETS - 100% | | | $3,141,857,820 |
(a) Affiliated Fund
(b) Non-income producing
(c) The rate quoted is the annualized seven-day yield of the fund at period end.
Affiliated Underlying Funds
Information regarding the Fund's fiscal year to date purchases and sales of the affiliated Underlying Funds and income earned by the Fund from investments in affiliated Underlying Funds is as follows:
| Affiliate | Value, beginning of period | Purchases | Sales Proceeds | Dividend Income | Value, end of period |
| Fidelity Investments Money Market Portfolio Institutional Class 0.59% | $947,216 | $6,026 | $953,242 | $436 | $-- |
| Fidelity Series 100 Index Fund | 65,803,373 | 3,535,884 | 5,044,148 | -- | 68,277,546 |
| Fidelity Series 1000 Value Index Fund | 37,122,023 | 37,598,704 | 2,422,228 | -- | 75,167,828 |
| Fidelity Series All-Sector Equity Fund | 207,816,099 | 8,305,105 | 100,066,365 | -- | 129,647,629 |
| Fidelity Series Blue Chip Growth Fund | 144,056,686 | 8,435,738 | 9,112,714 | 277,072 | 155,057,972 |
| Fidelity Series Commodity Strategy Fund | 37,065,965 | 14,239,423 | 1,497,969 | -- | 52,816,841 |
| Fidelity Series Emerging Markets Debt Fund | 18,756,472 | 1,302,709 | 752,037 | 548,096 | 21,042,433 |
| Fidelity Series Emerging Markets Fund | 273,148,747 | 12,819,097 | 8,703,676 | -- | 313,054,833 |
| Fidelity Series Equity-Income Fund | 278,917,934 | 27,733,707 | 17,301,125 | 2,484,320 | 310,886,823 |
| Fidelity Series Floating Rate High Income Fund | 7,310,053 | 478,196 | 300,902 | 165,947 | 7,848,392 |
| Fidelity Series Government Money Market Fund 0.29% | -- | 972,036 | 21,303 | 888 | 950,733 |
| Fidelity Series Growth & Income Fund | 214,071,267 | 12,362,656 | 15,284,775 | 1,779,202 | 227,614,242 |
| Fidelity Series Growth Company Fund | 255,698,304 | 23,832 | 15,326,058 | -- | 264,702,852 |
| Fidelity Series High Income Fund | 86,194,805 | 2,500,651 | 3,417,360 | 2,500,633 | 92,082,476 |
| Fidelity Series Inflation-Protected Bond Index Fund | 14,891,762 | 3,312,971 | 519,468 | 6,610 | 17,975,618 |
| Fidelity Series International Growth Fund | 262,537,558 | 25,615,304 | 11,525,352 | -- | 290,363,228 |
| Fidelity Series International Small Cap Fund | 61,553,434 | 6,429,994 | 3,737,003 | -- | 66,710,326 |
| Fidelity Series International Value Fund | 260,624,130 | 33,342,175 | 13,242,044 | -- | 291,518,893 |
| Fidelity Series Intrinsic Opportunities Fund | 159,627,697 | 9,123,619 | -- | 1,215,301 | 179,119,528 |
| Fidelity Series Investment Grade Bond Fund | 14,573,489 | 2,475,153 | 2,632,249 | 183,536 | 14,810,950 |
| Fidelity Series Long-Term Treasury Bond Index Fund | -- | 17,984 | 206 | 74 | 17,171 |
| Fidelity Series Opportunistic Insights Fund | 138,960,626 | 8,747,489 | 9,568,765 | -- | 145,292,332 |
| Fidelity Series Real Estate Equity Fund | 25,657,430 | 3,319,973 | 2,922,838 | 228,134 | 25,512,927 |
| Fidelity Series Real Estate Income Fund | 14,852,237 | 1,562,868 | 981,314 | 382,789 | 15,903,905 |
| Fidelity Series Short-Term Credit Fund | 505,128 | 47,118 | 39,027 | 2,525 | 515,338 |
| Fidelity Series Small Cap Discovery Fund | 37,033,000 | 2,176,835 | 1,951,256 | 47,722 | 39,369,966 |
| Fidelity Series Small Cap Opportunities Fund | 111,722,534 | 5,720,413 | 7,285,544 | 300,075 | 119,892,881 |
| Fidelity Series Stock Selector Large Cap Value Fund | 183,524,487 | 29,244,852 | 9,437,302 | -- | 215,704,164 |
| Total | $2,912,972,456 | $261,450,512 | $244,046,270 | $10,123,360 | $3,141,857,827 |
Investment Valuation
All investments are categorized as Level 1 under the Fair Value Hierarchy. The inputs or methodology used for valuing securities may not be an indication of the risk associated with investing in those securities. For more information on valuation inputs please refer to the Investment Valuation section in the accompanying Notes to Financial Statements.
See accompanying notes which are an integral part of the financial statements.
Fidelity Freedom® 2045 Fund
Financial Statements
Statement of Assets and Liabilities
| | | September 30, 2016 (Unaudited) |
| Assets | | |
| Investment in securities, at value (cost $2,699,420,703) — See accompanying schedule | | $3,141,857,827 |
| Cash | | 3 |
| Receivable for investments sold | | 3,113,121 |
| Receivable for fund shares sold | | 4,747,467 |
| Total assets | | 3,149,718,418 |
| Liabilities | | |
| Payable for investments purchased | $2,867,234 | |
| Payable for fund shares redeemed | 4,993,364 | |
| Total liabilities | | 7,860,598 |
| Net Assets | | $3,141,857,820 |
| Net Assets consist of: | | |
| Paid in capital | | $2,690,240,349 |
| Undistributed net investment income | | 9,983,148 |
| Accumulated undistributed net realized gain (loss) on investments | | (802,801) |
| Net unrealized appreciation (depreciation) on investments | | 442,437,124 |
| Net Assets, for 302,411,868 shares outstanding | | $3,141,857,820 |
| Net Asset Value, offering price and redemption price per share ($3,141,857,820 ÷ 302,411,868 shares) | | $10.39 |
See accompanying notes which are an integral part of the financial statements.
Statement of Operations
| | | Six months ended September 30, 2016 (Unaudited) |
| Investment Income | | |
| Income distributions from underlying funds | | $10,123,360 |
| Expenses | | |
| Independent trustees' fees and expenses | $6,687 | |
| Total expenses before reductions | 6,687 | |
| Expense reductions | (6,687) | – |
| Net investment income (loss) | | 10,123,360 |
| Realized and Unrealized Gain (Loss) | | |
| Realized gain (loss) on sale of underlying fund shares | 14,695,758 | |
| Capital gain distributions from underlying funds | 1,615,279 | |
| Total net realized gain (loss) | | 16,311,037 |
| Change in net unrealized appreciation (depreciation) on underlying funds | | 196,785,360 |
| Net gain (loss) | | 213,096,397 |
| Net increase (decrease) in net assets resulting from operations | | $223,219,757 |
See accompanying notes which are an integral part of the financial statements.
Statement of Changes in Net Assets
| | Six months ended September 30, 2016 (Unaudited) | Year ended March 31, 2016 |
| Increase (Decrease) in Net Assets | | |
| Operations | | |
| Net investment income (loss) | $10,123,360 | $43,106,594 |
| Net realized gain (loss) | 16,311,037 | 109,345,742 |
| Change in net unrealized appreciation (depreciation) | 196,785,360 | (257,102,571) |
| Net increase (decrease) in net assets resulting from operations | 223,219,757 | (104,650,235) |
| Distributions to shareholders from net investment income | (1,776,667) | (44,002,104) |
| Distributions to shareholders from net realized gain | (68,114,125) | (119,597,691) |
| Total distributions | (69,890,792) | (163,599,795) |
| Share transactions | | |
| Proceeds from sales of shares | 405,492,883 | 925,423,144 |
| Reinvestment of distributions | 69,414,074 | 163,254,218 |
| Cost of shares redeemed | (399,350,555) | (901,380,813) |
| Net increase (decrease) in net assets resulting from share transactions | 75,556,402 | 187,296,549 |
| Total increase (decrease) in net assets | 228,885,367 | (80,953,481) |
| Net Assets | | |
| Beginning of period | 2,912,972,453 | 2,993,925,934 |
| End of period | $3,141,857,820 | $2,912,972,453 |
| Other Information | | |
| Undistributed net investment income end of period | $9,983,148 | $1,636,455 |
| Shares | | |
| Sold | 40,395,976 | 90,620,446 |
| Issued in reinvestment of distributions | 7,223,115 | 15,691,158 |
| Redeemed | (39,858,320) | (87,834,689) |
| Net increase (decrease) | 7,760,771 | 18,476,915 |
See accompanying notes which are an integral part of the financial statements.
Financial Highlights — Fidelity Freedom 2045 Fund
| | Six months ended (Unaudited) September 30, | Years ended March 31, | | | | |
| | 2016 | 2016 | 2015 | 2014 | 2013 | 2012 |
| Selected Per–Share Data | | | | | | |
| Net asset value, beginning of period | $9.89 | $10.84 | $11.09 | $10.42 | $9.65 | $9.98 |
| Income from Investment Operations | | | | | | |
| Net investment income (loss)A | .03 | .15 | .17 | .15 | .17 | .15 |
| Net realized and unrealized gain (loss) | .71 | (.52) | .64 | 1.39 | .79 | (.15) |
| Total from investment operations | .74 | (.37) | .81 | 1.54 | .96 | – |
| Distributions from net investment income | (.01) | (.16) | (.18) | (.15) | (.17) | (.15) |
| Distributions from net realized gain | (.23) | (.43) | (.89) | (.72) | (.02) | (.17) |
| Total distributions | (.24) | (.58)B | (1.06)C | (.87) | (.19) | (.33)D |
| Net asset value, end of period | $10.39 | $9.89 | $10.84 | $11.09 | $10.42 | $9.65 |
| Total ReturnE,F | 7.64% | (3.59)% | 7.93% | 15.38% | 10.14% | .29% |
| Ratios to Average Net AssetsG,H | | | | | | |
| Expenses before reductionsI | - %J | -% | -% | -% | -% | -% |
| Expenses net of fee waivers, if any | - %J | -% | -% | -% | -% | -% |
| Expenses net of all reductions | - %J | -% | -% | -% | -% | -% |
| Net investment income (loss) | .67%J | 1.48% | 1.62% | 1.42% | 1.75% | 1.57% |
| Supplemental Data | | | | | | |
| Net assets, end of period (000 omitted) | $3,141,858 | $2,912,972 | $2,993,926 | $2,885,106 | $2,480,465 | $2,432,828 |
| Portfolio turnover rateG | 16%J | 17% | 21% | 53% | 45% | 40% |
A Calculated based on average shares outstanding during the period.
B Total distributions of $.58 per share is comprised of distributions from net investment income of $.155 and distributions from net realized gain of $.427 per share.
C Total distributions of $1.06 per share is comprised of distributions from net investment income of $.178 and distributions from net realized gain of $.886 per share.
D Total distributions of $.33 per share is comprised of distributions from net investment income of $.153 and distributions from net realized gain of $.174 per share.
E Total returns for periods of less than one year are not annualized.
F Total returns would have been lower if certain expenses had not been reduced during the applicable periods shown.
G Amounts do not include the activity of the Underlying Funds.
H Expense ratios reflect operating expenses of the Fund. Expenses before reductions do not reflect amounts reimbursed by the investment adviser or reductions from expense offset arrangements and do not represent the amount paid by the Fund during periods when reimbursements or reductions occur. Expenses net of fee waivers reflect expenses after reimbursement by the investment adviser but prior to reductions from expense offset arrangements. Expenses net of all reductions represent the net expenses paid by the Fund but do not include expenses of the underlying funds in which the Fund invests.
I Amount represents less than .005%.
J Annualized
See accompanying notes which are an integral part of the financial statements.
Fidelity Freedom® 2050 Fund
Investment Summary (Unaudited)
The information in the following tables is based on the direct investments of the Fund.
Top Holdings as of September 30, 2016
| | % of fund's net assets | % of fund's net assets 6 months ago |
| Fidelity Series Emerging Markets Fund | 10.0 | 9.4 |
| Fidelity Series Equity-Income Fund | 9.9 | 9.6 |
| Fidelity Series International Value Fund | 9.3 | 9.0 |
| Fidelity Series International Growth Fund | 9.2 | 9.0 |
| Fidelity Series Growth Company Fund | 8.4 | 8.8 |
| Fidelity Series Growth & Income Fund | 7.3 | 7.3 |
| Fidelity Series Stock Selector Large Cap Value Fund | 6.9 | 6.3 |
| Fidelity Series Intrinsic Opportunities Fund | 5.7 | 5.5 |
| Fidelity Series Blue Chip Growth Fund | 4.9 | 4.9 |
| Fidelity Series Opportunistic Insights Fund | 4.6 | 4.8 |
| | 76.2 | 74.6 |
Asset Allocation (% of fund's net assets)
| Period end |
| | Domestic Equity Funds | 64.0% |
| | International Equity Funds | 30.6% |
| | Bond Funds | 5.4% |

| Six months ago |
| | Domestic Equity Funds | 65.1% |
| | International Equity Funds | 29.5% |
| | Bond Funds | 5.4% |

Domestic Equity Funds category includes Fidelity Series Commodity Strategy Fund which invests in commodity-related investments.
Fidelity Freedom® 2050 Fund
Investments September 30, 2016 (Unaudited)
Showing Percentage of Net Assets
| Domestic Equity Funds - 64.0% | | | |
| | | Shares | Value |
| Fidelity Series 100 Index Fund (a) | | 3,927,125 | $56,079,340 |
| Fidelity Series 1000 Value Index Fund (a) | | 5,538,335 | 61,863,201 |
| Fidelity Series All-Sector Equity Fund (a) | | 7,930,853 | 106,511,359 |
| Fidelity Series Blue Chip Growth Fund (a) | | 10,861,976 | 127,410,983 |
| Fidelity Series Commodity Strategy Fund (a)(b) | | 8,235,101 | 43,563,687 |
| Fidelity Series Equity-Income Fund (a) | | 20,650,863 | 255,451,171 |
| Fidelity Series Growth & Income Fund (a) | | 13,970,598 | 187,066,301 |
| Fidelity Series Growth Company Fund (a) | | 16,129,192 | 216,292,469 |
| Fidelity Series Intrinsic Opportunities Fund (a) | | 9,757,472 | 146,654,804 |
| Fidelity Series Opportunistic Insights Fund (a) | | 7,805,919 | 119,430,560 |
| Fidelity Series Real Estate Equity Fund (a) | | 1,522,751 | 20,968,282 |
| Fidelity Series Small Cap Discovery Fund (a) | | 3,072,431 | 32,383,427 |
| Fidelity Series Small Cap Opportunities Fund (a) | | 7,491,666 | 98,515,412 |
| Fidelity Series Stock Selector Large Cap Value Fund (a) | | 15,037,599 | 177,293,296 |
| TOTAL DOMESTIC EQUITY FUNDS | | | |
| (Cost $1,361,077,940) | | | 1,649,484,292 |
|
| International Equity Funds - 30.6% | | | |
| Fidelity Series Emerging Markets Fund (a) | | 15,291,185 | 257,197,735 |
| Fidelity Series International Growth Fund (a) | | 17,025,931 | 238,363,032 |
| Fidelity Series International Small Cap Fund (a) | | 3,517,236 | 54,763,364 |
| Fidelity Series International Value Fund (a) | | 25,243,814 | 239,311,354 |
| TOTAL INTERNATIONAL EQUITY FUNDS | | | |
| (Cost $709,294,730) | | | 789,635,485 |
|
| Bond Funds - 5.4% | | | |
| Fidelity Series Emerging Markets Debt Fund (a) | | 1,667,410 | 17,274,368 |
| Fidelity Series Floating Rate High Income Fund (a) | | 688,186 | 6,482,708 |
| Fidelity Series High Income Fund (a) | | 7,995,001 | 74,833,208 |
| Fidelity Series Inflation-Protected Bond Index Fund (a) | | 1,480,855 | 14,912,208 |
| Fidelity Series Investment Grade Bond Fund (a) | | 1,061,248 | 12,310,477 |
| Fidelity Series Long-Term Treasury Bond Index Fund (a) | | 1,501 | 14,489 |
| Fidelity Series Real Estate Income Fund (a) | | 1,161,533 | 13,032,397 |
| TOTAL BOND FUNDS | | | |
| (Cost $141,851,736) | | | 138,859,855 |
|
| Short-Term Funds - 0.0% | | | |
| Fidelity Series Government Money Market Fund 0.29% (a)(c) | | 780,708 | 780,708 |
| Fidelity Series Short-Term Credit Fund (a) | | 42,278 | 424,044 |
| TOTAL SHORT-TERM FUNDS | | | |
| (Cost $1,202,151) | | | 1,204,752 |
| TOTAL INVESTMENT PORTFOLIO - 100.0% | | | |
| (Cost $2,213,426,557) | | | 2,579,184,384 |
| NET OTHER ASSETS (LIABILITIES) - 0.0% | | | (21) |
| NET ASSETS - 100% | | | $2,579,184,363 |
(a) Affiliated Fund
(b) Non-income producing
(c) The rate quoted is the annualized seven-day yield of the fund at period end.
Affiliated Underlying Funds
Information regarding the Fund's fiscal year to date purchases and sales of the affiliated Underlying Funds and income earned by the Fund from investments in affiliated Underlying Funds is as follows:
| Affiliate | Value, beginning of period | Purchases | Sales Proceeds | Dividend Income | Value, end of period |
| Fidelity Investments Money Market Portfolio Institutional Class 0.59% | $768,326 | $6,212 | $774,538 | $354 | $-- |
| Fidelity Series 100 Index Fund | 53,463,025 | 3,250,730 | 3,881,632 | -- | 56,079,340 |
| Fidelity Series 1000 Value Index Fund | 30,118,880 | 31,080,099 | 1,675,004 | -- | 61,863,201 |
| Fidelity Series All-Sector Equity Fund | 168,611,304 | 7,782,204 | 80,965,394 | -- | 106,511,359 |
| Fidelity Series Blue Chip Growth Fund | 116,880,898 | 7,888,610 | 6,898,259 | 227,081 | 127,410,983 |
| Fidelity Series Commodity Strategy Fund | 30,135,468 | 12,075,512 | 1,122,993 | -- | 43,563,687 |
| Fidelity Series Emerging Markets Debt Fund | 15,230,843 | 1,172,591 | 543,760 | 446,820 | 17,274,368 |
| Fidelity Series Emerging Markets Fund | 221,677,165 | 12,116,595 | 5,823,646 | -- | 257,197,735 |
| Fidelity Series Equity-Income Fund | 226,287,224 | 24,337,055 | 12,732,543 | 2,022,198 | 255,451,171 |
| Fidelity Series Floating Rate High Income Fund | 5,970,275 | 435,891 | 219,443 | 136,085 | 6,482,708 |
| Fidelity Series Government Money Market Fund 0.29% | -- | 794,559 | 13,852 | 725 | 780,708 |
| Fidelity Series Growth & Income Fund | 173,686,957 | 11,535,201 | 11,592,513 | 1,447,029 | 187,066,301 |
| Fidelity Series Growth Company Fund | 207,316,024 | 409,560 | 11,233,748 | -- | 216,292,469 |
| Fidelity Series High Income Fund | 69,754,881 | 2,025,029 | 2,458,283 | 2,025,009 | 74,833,208 |
| Fidelity Series Inflation-Protected Bond Index Fund | 12,038,210 | 3,024,642 | 388,123 | 5,386 | 14,912,208 |
| Fidelity Series International Growth Fund | 213,030,573 | 22,485,770 | 8,363,622 | -- | 238,363,032 |
| Fidelity Series International Small Cap Fund | 49,948,269 | 5,552,580 | 2,758,921 | -- | 54,763,364 |
| Fidelity Series International Value Fund | 211,476,024 | 28,674,199 | 9,685,270 | -- | 239,311,354 |
| Fidelity Series Intrinsic Opportunities Fund | 129,645,600 | 8,546,782 | -- | 993,716 | 146,654,804 |
| Fidelity Series Investment Grade Bond Fund | 11,823,820 | 2,190,731 | 2,025,045 | 149,704 | 12,310,477 |
| Fidelity Series Long-Term Treasury Bond Index Fund | -- | 15,149 | 159 | 62 | 14,489 |
| Fidelity Series Opportunistic Insights Fund | 112,623,958 | 8,197,017 | 7,232,774 | -- | 119,430,560 |
| Fidelity Series Real Estate Equity Fund | 20,817,173 | 2,848,127 | 2,248,745 | 186,103 | 20,968,282 |
| Fidelity Series Real Estate Income Fund | 12,035,472 | 1,361,488 | 745,917 | 311,835 | 13,032,397 |
| Fidelity Series Short-Term Credit Fund | 410,011 | 41,505 | 29,197 | 2,059 | 424,044 |
| Fidelity Series Small Cap Discovery Fund | 29,925,715 | 2,099,001 | 1,365,380 | 38,802 | 32,383,427 |
| Fidelity Series Small Cap Opportunities Fund | 90,607,109 | 5,428,397 | 5,462,539 | 245,924 | 98,515,412 |
| Fidelity Series Stock Selector Large Cap Value Fund | 149,097,910 | 25,070,634 | 6,965,517 | -- | 177,293,296 |
| Total | $2,363,381,114 | $230,445,870 | $187,206,817 | $8,238,892 | $2,579,184,384 |
Investment Valuation
All investments are categorized as Level 1 under the Fair Value Hierarchy. The inputs or methodology used for valuing securities may not be an indication of the risk associated with investing in those securities. For more information on valuation inputs please refer to the Investment Valuation section in the accompanying Notes to Financial Statements.
See accompanying notes which are an integral part of the financial statements.
Fidelity Freedom® 2050 Fund
Financial Statements
Statement of Assets and Liabilities
| | | September 30, 2016 (Unaudited) |
| Assets | | |
| Investment in securities, at value (cost $2,213,426,557) — See accompanying schedule | | $2,579,184,384 |
| Cash | | 3 |
| Receivable for investments sold | | 2,373,349 |
| Receivable for fund shares sold | | 4,780,035 |
| Total assets | | 2,586,337,771 |
| Liabilities | | |
| Payable for investments purchased | $3,193,213 | |
| Payable for fund shares redeemed | 3,960,195 | |
| Total liabilities | | 7,153,408 |
| Net Assets | | $2,579,184,363 |
| Net Assets consist of: | | |
| Paid in capital | | $2,206,019,045 |
| Undistributed net investment income | | 8,119,948 |
| Accumulated undistributed net realized gain (loss) on investments | | (712,457) |
| Net unrealized appreciation (depreciation) on investments | | 365,757,827 |
| Net Assets, for 247,038,336 shares outstanding | | $2,579,184,363 |
| Net Asset Value, offering price and redemption price per share ($2,579,184,363 ÷ 247,038,336 shares) | | $10.44 |
See accompanying notes which are an integral part of the financial statements.
Statement of Operations
| | | Six months ended September 30, 2016 (Unaudited) |
| Investment Income | | |
| Income distributions from underlying funds | | $8,238,892 |
| Expenses | | |
| Independent trustees' fees and expenses | $5,437 | |
| Total expenses before reductions | 5,437 | |
| Expense reductions | (5,437) | – |
| Net investment income (loss) | | 8,238,892 |
| Realized and Unrealized Gain (Loss) | | |
| Realized gain (loss) on sale of underlying fund shares | 11,539,882 | |
| Capital gain distributions from underlying funds | 1,320,938 | |
| Total net realized gain (loss) | | 12,860,820 |
| Change in net unrealized appreciation (depreciation) on underlying funds | | 161,024,328 |
| Net gain (loss) | | 173,885,148 |
| Net increase (decrease) in net assets resulting from operations | | $182,124,040 |
See accompanying notes which are an integral part of the financial statements.
Statement of Changes in Net Assets
| | Six months ended September 30, 2016 (Unaudited) | Year ended March 31, 2016 |
| Increase (Decrease) in Net Assets | | |
| Operations | | |
| Net investment income (loss) | $8,238,892 | $34,561,605 |
| Net realized gain (loss) | 12,860,820 | 89,011,723 |
| Change in net unrealized appreciation (depreciation) | 161,024,328 | (205,753,358) |
| Net increase (decrease) in net assets resulting from operations | 182,124,040 | (82,180,030) |
| Distributions to shareholders from net investment income | (1,196,979) | (35,426,150) |
| Distributions to shareholders from net realized gain | (55,322,797) | (97,594,012) |
| Total distributions | (56,519,776) | (133,020,162) |
| Share transactions | | |
| Proceeds from sales of shares | 360,159,466 | 795,603,240 |
| Reinvestment of distributions | 55,892,254 | 132,389,605 |
| Cost of shares redeemed | (325,852,764) | (724,719,368) |
| Net increase (decrease) in net assets resulting from share transactions | 90,198,956 | 203,273,477 |
| Total increase (decrease) in net assets | 215,803,220 | (11,926,715) |
| Net Assets | | |
| Beginning of period | 2,363,381,143 | 2,375,307,858 |
| End of period | $2,579,184,363 | $2,363,381,143 |
| Other Information | | |
| Undistributed net investment income end of period | $8,119,948 | $1,078,035 |
| Shares | | |
| Sold | 35,707,793 | 77,551,171 |
| Issued in reinvestment of distributions | 5,791,954 | 12,655,295 |
| Redeemed | (32,376,690) | (70,163,494) |
| Net increase (decrease) | 9,123,057 | 20,042,972 |
See accompanying notes which are an integral part of the financial statements.
Financial Highlights — Fidelity Freedom 2050 Fund
| | Six months ended (Unaudited) September 30, | Years ended March 31, | | | | |
| | 2016 | 2016 | 2015 | 2014 | 2013 | 2012 |
| Selected Per–Share Data | | | | | | |
| Net asset value, beginning of period | $9.93 | $10.90 | $11.15 | $10.28 | $9.51 | $9.88 |
| Income from Investment Operations | | | | | | |
| Net investment income (loss)A | .03 | .15 | .17 | .15 | .16 | .14 |
| Net realized and unrealized gain (loss) | .72 | (.52) | .65 | 1.41 | .79 | (.19) |
| Total from investment operations | .75 | (.37) | .82 | 1.56 | .95 | (.05) |
| Distributions from net investment income | (.01) | (.16) | (.18) | (.15) | (.17) | (.14) |
| Distributions from net realized gain | (.23) | (.44) | (.89) | (.54) | (.02) | (.18) |
| Total distributions | (.24) | (.60) | (1.07) | (.69) | (.18)B | (.32) |
| Net asset value, end of period | $10.44 | $9.93 | $10.90 | $11.15 | $10.28 | $9.51 |
| Total ReturnC,D | 7.71% | (3.65)% | 7.91% | 15.53% | 10.18% | (.17)% |
| Ratios to Average Net AssetsE,F | | | | | | |
| Expenses before reductionsG | - %H | -% | -% | -% | -% | -% |
| Expenses net of fee waivers, if any | - %H | -% | -% | -% | -% | -% |
| Expenses net of all reductions | - %H | -% | -% | -% | -% | -% |
| Net investment income (loss) | .67%H | 1.49% | 1.62% | 1.41% | 1.71% | 1.49% |
| Supplemental Data | | | | | | |
| Net assets, end of period (000 omitted) | $2,579,184 | $2,363,381 | $2,375,308 | $2,297,832 | $2,069,745 | $2,066,305 |
| Portfolio turnover rateE | 15%H | 17% | 23% | 57% | 44% | 41% |
A Calculated based on average shares outstanding during the period.
B Total distributions of $.18 per share is comprised of distributions from net investment income of $.167 and distributions from net realized gain of $.016 per share.
C Total returns for periods of less than one year are not annualized.
D Total returns would have been lower if certain expenses had not been reduced during the applicable periods shown.
E Amounts do not include the activity of the Underlying Funds.
F Expense ratios reflect operating expenses of the Fund. Expenses before reductions do not reflect amounts reimbursed by the investment adviser or reductions from expense offset arrangements and do not represent the amount paid by the Fund during periods when reimbursements or reductions occur. Expenses net of fee waivers reflect expenses after reimbursement by the investment adviser but prior to reductions from expense offset arrangements. Expenses net of all reductions represent the net expenses paid by the Fund but do not include expenses of the underlying funds in which the Fund invests.
G Amount represents less than .005%.
H Annualized
See accompanying notes which are an integral part of the financial statements.
See accompanying notes which are an integral part of the financial statements.
Fidelity Freedom® 2055 Fund
Investment Summary (Unaudited)
The information in the following tables is based on the direct investments of the Fund.
Top Holdings as of September 30, 2016
| | % of fund's net assets | % of fund's net assets 6 months ago |
| Fidelity Series Emerging Markets Fund | 10.0 | 9.4 |
| Fidelity Series Equity-Income Fund | 9.9 | 9.6 |
| Fidelity Series International Value Fund | 9.3 | 9.0 |
| Fidelity Series International Growth Fund | 9.3 | 9.0 |
| Fidelity Series Growth Company Fund | 8.2 | 8.5 |
| Fidelity Series Growth & Income Fund | 7.3 | 7.3 |
| Fidelity Series Stock Selector Large Cap Value Fund | 6.9 | 6.3 |
| Fidelity Series Intrinsic Opportunities Fund | 5.7 | 5.7 |
| Fidelity Series Blue Chip Growth Fund | 5.0 | 4.9 |
| Fidelity Series Opportunistic Insights Fund | 4.7 | 4.8 |
| | 76.3 | 74.5 |
Asset Allocation (% of fund's net assets)
| Period end |
| | Domestic Equity Funds | 64.0% |
| | International Equity Funds | 30.7% |
| | Bond Funds | 5.3% |

| Six months ago |
| | Domestic Equity Funds | 65.1% |
| | International Equity Funds | 29.5% |
| | Bond Funds | 5.3% |
| | Short-Term Funds | 0.1% |

Domestic Equity Funds category includes Fidelity Series Commodity Strategy Fund which invests in commodity-related investments.
Fidelity Freedom® 2055 Fund
Investments September 30, 2016 (Unaudited)
Showing Percentage of Net Assets
| Domestic Equity Funds - 64.0% | | | |
| | | Shares | Value |
| Fidelity Series 100 Index Fund (a) | | 1,180,381 | $16,855,845 |
| Fidelity Series 1000 Value Index Fund (a) | | 1,655,982 | 18,497,323 |
| Fidelity Series All-Sector Equity Fund (a) | | 2,370,725 | 31,838,837 |
| Fidelity Series Blue Chip Growth Fund (a) | | 3,286,376 | 38,549,188 |
| Fidelity Series Commodity Strategy Fund (a)(b) | | 2,536,620 | 13,418,721 |
| Fidelity Series Equity-Income Fund (a) | | 6,207,746 | 76,789,824 |
| Fidelity Series Growth & Income Fund (a) | | 4,228,712 | 56,622,451 |
| Fidelity Series Growth Company Fund (a) | | 4,755,896 | 63,776,570 |
| Fidelity Series Intrinsic Opportunities Fund (a) | | 2,945,100 | 44,264,860 |
| Fidelity Series Opportunistic Insights Fund (a) | | 2,365,512 | 36,192,338 |
| Fidelity Series Real Estate Equity Fund (a) | | 459,933 | 6,333,272 |
| Fidelity Series Small Cap Discovery Fund (a) | | 919,261 | 9,689,008 |
| Fidelity Series Small Cap Opportunities Fund (a) | | 2,258,860 | 29,704,014 |
| Fidelity Series Stock Selector Large Cap Value Fund (a) | | 4,518,289 | 53,270,624 |
| TOTAL DOMESTIC EQUITY FUNDS | | | |
| (Cost $456,102,125) | | | 495,802,875 |
|
| International Equity Funds - 30.7% | | | |
| Fidelity Series Emerging Markets Fund (a) | | 4,607,802 | 77,503,230 |
| Fidelity Series International Growth Fund (a) | | 5,120,514 | 71,687,196 |
| Fidelity Series International Small Cap Fund (a) | | 1,062,411 | 16,541,734 |
| Fidelity Series International Value Fund (a) | | 7,591,999 | 71,972,152 |
| TOTAL INTERNATIONAL EQUITY FUNDS | | | |
| (Cost $230,935,759) | | | 237,704,312 |
|
| Bond Funds - 5.3% | | | |
| Fidelity Series Emerging Markets Debt Fund (a) | | 494,126 | 5,119,141 |
| Fidelity Series Floating Rate High Income Fund (a) | | 204,233 | 1,923,871 |
| Fidelity Series High Income Fund (a) | | 2,280,225 | 21,342,907 |
| Fidelity Series Inflation-Protected Bond Index Fund (a) | | 463,420 | 4,666,642 |
| Fidelity Series Investment Grade Bond Fund (a) | | 334,767 | 3,883,295 |
| Fidelity Series Long-Term Treasury Bond Index Fund (a) | | 511 | 4,927 |
| Fidelity Series Real Estate Income Fund (a) | | 342,335 | 3,840,994 |
| TOTAL BOND FUNDS | | | |
| (Cost $41,390,931) | | | 40,781,777 |
|
| Short-Term Funds - 0.0% | | | |
| Fidelity Series Government Money Market Fund 0.29% (a)(c) | | 252,550 | 252,550 |
| Fidelity Series Short-Term Credit Fund (a) | | 13,570 | 136,110 |
| TOTAL SHORT-TERM FUNDS | | | |
| (Cost $387,845) | | | 388,660 |
| TOTAL INVESTMENT PORTFOLIO - 100.0% | | | |
| (Cost $728,816,660) | | | 774,677,624 |
| NET OTHER ASSETS (LIABILITIES) - 0.0% | | | (78) |
| NET ASSETS - 100% | | | $774,677,546 |
(a) Affiliated Fund
(b) Non-income producing
(c) The rate quoted is the annualized seven-day yield of the fund at period end.
Affiliated Underlying Funds
Information regarding the Fund's fiscal year to date purchases and sales of the affiliated Underlying Funds and income earned by the Fund from investments in affiliated Underlying Funds is as follows:
| Affiliate | Value, beginning of period | Purchases | Sales Proceeds | Dividend Income | Value, end of period |
| Fidelity Investments Money Market Portfolio Institutional Class 0.59% | $210,997 | $4,654 | $215,651 | $100 | $-- |
| Fidelity Series 100 Index Fund | 14,712,348 | 2,485,027 | 1,272,478 | -- | 16,855,845 |
| Fidelity Series 1000 Value Index Fund | 8,286,576 | 10,038,493 | 497,630 | -- | 18,497,323 |
| Fidelity Series All-Sector Equity Fund | 46,395,718 | 5,690,813 | 23,430,927 | -- | 31,838,837 |
| Fidelity Series Blue Chip Growth Fund | 32,164,948 | 5,611,223 | 2,006,430 | 68,269 | 38,549,188 |
| Fidelity Series Commodity Strategy Fund | 8,354,063 | 4,885,334 | 543,748 | -- | 13,418,721 |
| Fidelity Series Emerging Markets Debt Fund | 4,154,621 | 725,218 | 161,263 | 127,106 | 5,119,141 |
| Fidelity Series Emerging Markets Fund | 60,995,120 | 9,800,148 | 1,790,166 | -- | 77,503,230 |
| Fidelity Series Equity-Income Fund | 62,262,981 | 13,572,494 | 4,088,296 | 573,123 | 76,789,824 |
| Fidelity Series Floating Rate High Income Fund | 1,616,113 | 290,006 | 65,388 | 38,610 | 1,923,871 |
| Fidelity Series Government Money Market Fund 0.29% | -- | 256,667 | 4,118 | 211 | 252,550 |
| Fidelity Series Growth & Income Fund | 47,784,000 | 8,421,309 | 3,466,821 | 406,082 | 56,622,451 |
| Fidelity Series Growth Company Fund | 55,485,371 | 5,314,428 | 2,687,502 | -- | 63,776,570 |
| Fidelity Series High Income Fund | 18,935,916 | 1,602,523 | 734,906 | 567,147 | 21,342,907 |
| Fidelity Series Inflation-Protected Bond Index Fund | 3,353,582 | 1,354,066 | 113,591 | 1,567 | 4,666,642 |
| Fidelity Series International Growth Fund | 58,632,856 | 12,285,446 | 2,451,327 | -- | 71,687,196 |
| Fidelity Series International Small Cap Fund | 13,739,803 | 2,854,779 | 655,321 | -- | 16,541,734 |
| Fidelity Series International Value Fund | 58,203,786 | 13,921,115 | 2,734,807 | -- | 71,972,152 |
| Fidelity Series Intrinsic Opportunities Fund | 36,795,620 | 6,193,682 | 1,177,028 | 297,784 | 44,264,860 |
| Fidelity Series Investment Grade Bond Fund | 3,249,947 | 985,854 | 444,226 | 43,153 | 3,883,295 |
| Fidelity Series Long-Term Treasury Bond Index Fund | -- | 5,087 | 5 | 20 | 4,927 |
| Fidelity Series Opportunistic Insights Fund | 31,055,536 | 5,322,416 | 1,875,926 | -- | 36,192,338 |
| Fidelity Series Real Estate Equity Fund | 5,727,324 | 1,322,008 | 567,964 | 53,640 | 6,333,272 |
| Fidelity Series Real Estate Income Fund | 3,259,636 | 696,679 | 219,874 | 88,903 | 3,840,994 |
| Fidelity Series Short-Term Credit Fund | 112,925 | 33,168 | 10,477 | 596 | 136,110 |
| Fidelity Series Small Cap Discovery Fund | 8,227,953 | 1,444,274 | 479,917 | 11,032 | 9,689,008 |
| Fidelity Series Small Cap Opportunities Fund | 24,975,909 | 4,236,539 | 1,805,708 | 73,951 | 29,704,014 |
| Fidelity Series Stock Selector Large Cap Value Fund | 40,927,588 | 11,606,664 | 2,144,117 | -- | 53,270,624 |
| Total | $649,621,237 | $130,960,114 | $55,645,612 | $2,351,294 | $774,677,624 |
Investment Valuation
All investments are categorized as Level 1 under the Fair Value Hierarchy. The inputs or methodology used for valuing securities may not be an indication of the risk associated with investing in those securities. For more information on valuation inputs please refer to the Investment Valuation section in the accompanying Notes to Financial Statements.
See accompanying notes which are an integral part of the financial statements.
Fidelity Freedom® 2055 Fund
Financial Statements
Statement of Assets and Liabilities
| | | September 30, 2016 (Unaudited) |
| Assets | | |
| Investment in securities, at value (cost $728,816,660) — See accompanying schedule | | $774,677,624 |
| Receivable for investments sold | | 606,808 |
| Receivable for fund shares sold | | 2,739,416 |
| Total assets | | 778,023,848 |
| Liabilities | | |
| Payable for investments purchased | $1,370,185 | |
| Payable for fund shares redeemed | 1,976,117 | |
| Total liabilities | | 3,346,302 |
| Net Assets | | $774,677,546 |
| Net Assets consist of: | | |
| Paid in capital | | $732,686,582 |
| Undistributed net investment income | | 2,306,126 |
| Accumulated undistributed net realized gain (loss) on investments | | (6,176,126) |
| Net unrealized appreciation (depreciation) on investments | | 45,860,964 |
| Net Assets, for 66,386,694 shares outstanding | | $774,677,546 |
| Net Asset Value, offering price and redemption price per share ($774,677,546 ÷ 66,386,694 shares) | | $11.67 |
See accompanying notes which are an integral part of the financial statements.
Statement of Operations
| | | Six months ended September 30, 2016 (Unaudited) |
| Investment Income | | |
| Income distributions from underlying funds | | $2,351,294 |
| Expenses | | |
| Independent trustees' fees and expenses | $1,537 | |
| Total expenses before reductions | 1,537 | |
| Expense reductions | (1,537) | – |
| Net investment income (loss) | | 2,351,294 |
| Realized and Unrealized Gain (Loss) | | |
| Realized gain (loss) on sale of underlying fund shares | (1,314,109) | |
| Capital gain distributions from underlying funds | 391,676 | |
| Total net realized gain (loss) | | (922,433) |
| Change in net unrealized appreciation (depreciation) on underlying funds | | 51,055,990 |
| Net gain (loss) | | 50,133,557 |
| Net increase (decrease) in net assets resulting from operations | | $52,484,851 |
See accompanying notes which are an integral part of the financial statements.
Statement of Changes in Net Assets
| | Six months ended September 30, 2016 (Unaudited) | Year ended March 31, 2016 |
| Increase (Decrease) in Net Assets | | |
| Operations | | |
| Net investment income (loss) | $2,351,294 | $8,744,517 |
| Net realized gain (loss) | (922,433) | 19,302,862 |
| Change in net unrealized appreciation (depreciation) | 51,055,990 | (46,375,902) |
| Net increase (decrease) in net assets resulting from operations | 52,484,851 | (18,328,523) |
| Distributions to shareholders from net investment income | (364,159) | (8,846,293) |
| Distributions to shareholders from net realized gain | (14,505,569) | (18,950,018) |
| Total distributions | (14,869,728) | (27,796,311) |
| Share transactions | | |
| Proceeds from sales of shares | 186,850,838 | 380,942,373 |
| Reinvestment of distributions | 14,662,382 | 27,737,877 |
| Cost of shares redeemed | (114,072,064) | (240,165,521) |
| Net increase (decrease) in net assets resulting from share transactions | 87,441,156 | 168,514,729 |
| Total increase (decrease) in net assets | 125,056,279 | 122,389,895 |
| Net Assets | | |
| Beginning of period | 649,621,267 | 527,231,372 |
| End of period | $774,677,546 | $649,621,267 |
| Other Information | | |
| Undistributed net investment income end of period | $2,306,126 | $318,991 |
| Shares | | |
| Sold | 16,572,268 | 33,441,712 |
| Issued in reinvestment of distributions | 1,358,886 | 2,391,611 |
| Redeemed | (10,155,331) | (20,947,202) |
| Net increase (decrease) | 7,775,823 | 14,886,121 |
See accompanying notes which are an integral part of the financial statements.
Financial Highlights — Fidelity Freedom 2055 Fund
| | Six months ended (Unaudited) September 30, | Years ended March 31, | | | | |
| | 2016 | 2016 | 2015 | 2014 | 2013 | 2012 A |
| Selected Per–Share Data | | | | | | |
| Net asset value, beginning of period | $11.08 | $12.06 | $11.73 | $10.56 | $9.77 | $10.00 |
| Income from Investment Operations | | | | | | |
| Net investment income (loss)B | .04 | .17 | .19 | .16 | .20 | .13 |
| Net realized and unrealized gain (loss) | .80 | (.59) | .72 | 1.51 | .80 | (.12) |
| Total from investment operations | .84 | (.42) | .91 | 1.67 | 1.00 | .01 |
| Distributions from net investment income | (.01) | (.17) | (.18) | (.14) | (.14) | (.11) |
| Distributions from net realized gain | (.24) | (.39) | (.39) | (.36) | (.06) | (.13) |
| Total distributions | (.25) | (.56) | (.58)C | (.50) | (.21)D | (.24) |
| Net asset value, end of period | $11.67 | $11.08 | $12.06 | $11.73 | $10.56 | $9.77 |
| Total ReturnE,F | 7.72% | (3.69)% | 7.98% | 16.00% | 10.39% | .32% |
| Ratios to Average Net AssetsG,H | | | | | | |
| Expenses before reductionsI | - %J | -% | -% | -% | -% | - %J |
| Expenses net of fee waivers, if any | - %J | -% | -% | -% | -% | - %J |
| Expenses net of all reductions | - %J | -% | -% | -% | -% | - %J |
| Net investment income (loss) | .66%J | 1.51% | 1.64% | 1.40% | 1.99% | 1.69%J |
| Supplemental Data | | | | | | |
| Net assets, end of period (000 omitted) | $774,678 | $649,621 | $527,231 | $350,647 | $155,142 | $20,978 |
| Portfolio turnover rateG | 16%J | 20% | 21% | 47% | 45% | 8%J |
A For the period June 1, 2011 (commencement of operations) to March 31, 2012.
B Calculated based on average shares outstanding during the period.
C Total distributions of $.58 per share is comprised of distributions from net investment income of $.184 and distributions from net realized gain of $.394 per share.
D Total distributions of $.21 per share is comprised of distributions from net investment income of $.141 and distributions from net realized gain of $.064 per share.
E Total returns for periods of less than one year are not annualized.
F Total returns would have been lower if certain expenses had not been reduced during the applicable periods shown.
G Amounts do not include the activity of the Underlying Funds.
H Expense ratios reflect operating expenses of the Fund. Expenses before reductions do not reflect amounts reimbursed by the investment adviser or reductions from expense offset arrangements and do not represent the amount paid by the Fund during periods when reimbursements or reductions occur. Expenses net of fee waivers reflect expenses after reimbursement by the investment adviser but prior to reductions from expense offset arrangements. Expenses net of all reductions represent the net expenses paid by the Fund but do not include expenses of the underlying funds in which the Fund invests.
I Amount represents less than .005%.
J Annualized
See accompanying notes which are an integral part of the financial statements.
See accompanying notes which are an integral part of the financial statements.
Fidelity Freedom® 2060 Fund
Investment Summary (Unaudited)
The information in the following tables is based on the direct investments of the Fund.
Top Holdings as of September 30, 2016
| | % of fund's net assets | % of fund's net assets 6 months ago |
| Fidelity Series Equity-Income Fund | 10.1 | 9.6 |
| Fidelity Series Emerging Markets Fund | 10.0 | 9.4 |
| Fidelity Series International Value Fund | 9.3 | 9.0 |
| Fidelity Series International Growth Fund | 9.3 | 9.0 |
| Fidelity Series Growth Company Fund | 7.8 | 8.2 |
| Fidelity Series Growth & Income Fund | 7.5 | 7.4 |
| Fidelity Series Stock Selector Large Cap Value Fund | 6.9 | 6.2 |
| Fidelity Series Intrinsic Opportunities Fund | 5.7 | 6.0 |
| Fidelity Series Blue Chip Growth Fund | 5.1 | 4.9 |
| Fidelity Series Opportunistic Insights Fund | 4.8 | 4.8 |
| | 76.5 | 74.5 |
Asset Allocation (% of fund's net assets)
| Period end |
| | Domestic Equity Funds | 64.0% |
| | International Equity Funds | 30.7% |
| | Bond Funds | 5.3% |

| Six months ago |
| | Domestic Equity Funds | 65.1% |
| | International Equity Funds | 29.5% |
| | Bond Funds | 5.3% |
| | Short-Term Funds | 0.1% |

Domestic Equity Funds category includes Fidelity Series Commodity Strategy Fund which invests in commodity-related investments.
Fidelity Freedom® 2060 Fund
Investments September 30, 2016 (Unaudited)
Showing Percentage of Net Assets
| Domestic Equity Funds - 64.0% | | | |
| | | Shares | Value |
| Fidelity Series 100 Index Fund (a) | | 111,821 | $1,596,800 |
| Fidelity Series 1000 Value Index Fund (a) | | 148,748 | 1,661,514 |
| Fidelity Series All-Sector Equity Fund (a) | | 220,273 | 2,958,260 |
| Fidelity Series Blue Chip Growth Fund (a) | | 316,499 | 3,712,539 |
| Fidelity Series Commodity Strategy Fund (a)(b) | | 240,080 | 1,270,022 |
| Fidelity Series Equity-Income Fund (a) | | 595,575 | 7,367,268 |
| Fidelity Series Growth & Income Fund (a) | | 407,184 | 5,452,190 |
| Fidelity Series Growth Company Fund (a) | | 425,766 | 5,709,520 |
| Fidelity Series Intrinsic Opportunities Fund (a) | | 279,678 | 4,203,560 |
| Fidelity Series Opportunistic Insights Fund (a) | | 228,543 | 3,496,711 |
| Fidelity Series Real Estate Equity Fund (a) | | 44,201 | 608,643 |
| Fidelity Series Small Cap Discovery Fund (a) | | 87,689 | 924,245 |
| Fidelity Series Small Cap Opportunities Fund (a) | | 210,130 | 2,763,215 |
| Fidelity Series Stock Selector Large Cap Value Fund (a) | | 429,691 | 5,066,057 |
| TOTAL DOMESTIC EQUITY FUNDS | | | |
| (Cost $44,978,834) | | | 46,790,544 |
|
| International Equity Funds - 30.7% | | | |
| Fidelity Series Emerging Markets Fund (a) | | 434,426 | 7,307,047 |
| Fidelity Series International Growth Fund (a) | | 483,050 | 6,762,694 |
| Fidelity Series International Small Cap Fund (a) | | 100,194 | 1,560,027 |
| Fidelity Series International Value Fund (a) | | 716,182 | 6,789,407 |
| TOTAL INTERNATIONAL EQUITY FUNDS | | | |
| (Cost $21,601,807) | | | 22,419,175 |
|
| Bond Funds - 5.3% | | | |
| Fidelity Series Emerging Markets Debt Fund (a) | | 44,788 | 464,000 |
| Fidelity Series Floating Rate High Income Fund(a) | | 19,503 | 183,715 |
| Fidelity Series High Income Fund (a) | | 217,163 | 2,032,646 |
| Fidelity Series Inflation-Protected Bond Index Fund (a) | | 43,705 | 440,112 |
| Fidelity Series Investment Grade Bond Fund (a) | | 31,575 | 366,275 |
| Fidelity Series Long-Term Treasury Bond Index Fund (a) | | 54 | 522 |
| Fidelity Series Real Estate Income Fund (a) | | 31,251 | 350,639 |
| TOTAL BOND FUNDS | | | |
| (Cost $3,723,114) | | | 3,837,909 |
|
| Short-Term Funds - 0.0% | | | |
| Fidelity Series Government Money Market Fund 0.29% (a)(c) | | 23,805 | 23,805 |
| Fidelity Series Short-Term Credit Fund (a) | | 1,281 | 12,853 |
| TOTAL SHORT-TERM FUNDS | | | |
| (Cost $36,570) | | | 36,658 |
| TOTAL INVESTMENT PORTFOLIO - 100.0% | | | |
| (Cost $70,340,325) | | | 73,084,286 |
| NET OTHER ASSETS (LIABILITIES) - 0.0% | | | (6) |
| NET ASSETS - 100% | | | $73,084,280 |
(a) Affiliated Fund
(b) Non-income producing
(c) The rate quoted is the annualized seven-day yield of the fund at period end.
Affiliated Underlying Funds
Information regarding the Fund's fiscal year to date purchases and sales of the affiliated Underlying Funds and income earned by the Fund from investments in affiliated Underlying Funds is as follows:
| Affiliate | Value, beginning of period | Purchases | Sales Proceeds | Dividend Income | Value, end of period |
| Fidelity Investments Money Market Portfolio Institutional Class 0.59% | $15,226 | $1,084 | $16,310 | $8 | $-- |
| Fidelity Series 100 Index Fund | 1,065,389 | 587,845 | 132,371 | -- | 1,596,800 |
| Fidelity Series 1000 Value Index Fund | 600,067 | 1,052,650 | 46,691 | -- | 1,661,514 |
| Fidelity Series All-Sector Equity Fund | 3,360,238 | 1,242,984 | 1,907,722 | -- | 2,958,260 |
| Fidelity Series Blue Chip Growth Fund | 2,329,980 | 1,309,634 | 167,300 | 6,350 | 3,712,539 |
| Fidelity Series Commodity Strategy Fund | 599,775 | 666,288 | 47,728 | -- | 1,270,022 |
| Fidelity Series Emerging Markets Debt Fund | 291,446 | 152,284 | 11,375 | 10,136 | 464,000 |
| Fidelity Series Emerging Markets Fund | 4,408,339 | 2,296,581 | 122,030 | -- | 7,307,047 |
| Fidelity Series Equity-Income Fund | 4,511,205 | 2,840,553 | 401,308 | 45,696 | 7,367,268 |
| Fidelity Series Floating Rate High Income Fund | 116,942 | 64,746 | 4,682 | 3,204 | 183,715 |
| Fidelity Series Government Money Market Fund 0.29% | -- | 24,030 | 225 | 18 | 23,805 |
| Fidelity Series Growth & Income Fund | 3,460,251 | 1,954,198 | 289,032 | 31,424 | 5,452,190 |
| Fidelity Series Growth Company Fund | 3,844,502 | 1,473,752 | 75,039 | -- | 5,709,520 |
| Fidelity Series High Income Fund | 1,396,867 | 560,921 | 53,090 | 47,805 | 2,032,646 |
| Fidelity Series Inflation-Protected Bond Index Fund | 239,066 | 204,017 | 9,086 | 126 | 440,112 |
| Fidelity Series International Growth Fund | 4,249,514 | 2,415,545 | 169,370 | -- | 6,762,694 |
| Fidelity Series International Small Cap Fund | 987,001 | 558,738 | 40,324 | -- | 1,560,027 |
| Fidelity Series International Value Fund | 4,214,335 | 2,522,456 | 169,485 | -- | 6,789,407 |
| Fidelity Series Intrinsic Opportunities Fund | 2,826,265 | 1,451,687 | 284,718 | 27,367 | 4,203,560 |
| Fidelity Series Investment Grade Bond Fund | 235,123 | 173,124 | 49,236 | 3,572 | 366,275 |
| Fidelity Series Long-Term Treasury Bond Index Fund | -- | 538 | 1 | 2 | 522 |
| Fidelity Series Opportunistic Insights Fund | 2,248,924 | 1,265,618 | 160,833 | -- | 3,496,711 |
| Fidelity Series Real Estate Equity Fund | 414,734 | 262,083 | 52,920 | 4,601 | 608,643 |
| Fidelity Series Real Estate Income Fund | 229,340 | 130,723 | 17,048 | 7,321 | 350,639 |
| Fidelity Series Short-Term Credit Fund | 8,218 | 5,683 | 1,089 | 50 | 12,853 |
| Fidelity Series Small Cap Discovery Fund | 601,342 | 338,555 | 58,136 | 892 | 924,245 |
| Fidelity Series Small Cap Opportunities Fund | 1,808,818 | 1,005,415 | 244,719 | 6,700 | 2,763,215 |
| Fidelity Series Stock Selector Large Cap Value Fund | 2,941,925 | 2,056,130 | 168,284 | -- | 5,066,057 |
| Total | $47,004,832 | $26,617,862 | $4,700,152 | $195,272 | $73,084,286 |
Investment Valuation
All investments are categorized as Level 1 under the Fair Value Hierarchy. The inputs or methodology used for valuing securities may not be an indication of the risk associated with investing in those securities. For more information on valuation inputs please refer to the Investment Valuation section in the accompanying Notes to Financial Statements.
See accompanying notes which are an integral part of the financial statements.
Fidelity Freedom® 2060 Fund
Financial Statements
Statement of Assets and Liabilities
| | | September 30, 2016 (Unaudited) |
| Assets | | |
| Investment in securities, at value (cost $70,340,325) — See accompanying schedule | | $73,084,286 |
| Receivable for fund shares sold | | 506,004 |
| Total assets | | 73,590,290 |
| Liabilities | | |
| Payable for investments purchased | $486,364 | |
| Payable for fund shares redeemed | 19,646 | |
| Total liabilities | | 506,010 |
| Net Assets | | $73,084,280 |
| Net Assets consist of: | | |
| Paid in capital | | $70,704,771 |
| Undistributed net investment income | | 191,132 |
| Accumulated undistributed net realized gain (loss) on investments | | (555,584) |
| Net unrealized appreciation (depreciation) on investments | | 2,743,961 |
| Net Assets, for 7,059,535 shares outstanding | | $73,084,280 |
| Net Asset Value, offering price and redemption price per share ($73,084,280 ÷ 7,059,535 shares) | | $10.35 |
See accompanying notes which are an integral part of the financial statements.
Statement of Operations
| | | Six months ended September 30, 2016 (Unaudited) |
| Investment Income | | |
| Income distributions from underlying funds | | $195,272 |
| Expenses | | |
| Independent trustees' fees and expenses | $121 | |
| Total expenses before reductions | 121 | |
| Expense reductions | (121) | – |
| Net investment income (loss) | | 195,272 |
| Realized and Unrealized Gain (Loss) | | |
| Realized gain (loss) on sale of underlying fund shares | (87,924) | |
| Capital gain distributions from underlying funds | 35,157 | |
| Total net realized gain (loss) | | (52,767) |
| Change in net unrealized appreciation (depreciation) on underlying funds | | 4,249,666 |
| Net gain (loss) | | 4,196,899 |
| Net increase (decrease) in net assets resulting from operations | | $4,392,171 |
See accompanying notes which are an integral part of the financial statements.
Statement of Changes in Net Assets
| | Six months ended September 30, 2016 (Unaudited) | Year ended March 31, 2016 |
| Increase (Decrease) in Net Assets | | |
| Operations | | |
| Net investment income (loss) | $195,272 | $433,385 |
| Net realized gain (loss) | (52,767) | 740,333 |
| Change in net unrealized appreciation (depreciation) | 4,249,666 | (1,590,210) |
| Net increase (decrease) in net assets resulting from operations | 4,392,171 | (416,492) |
| Distributions to shareholders from net investment income | (26,622) | (415,873) |
| Distributions to shareholders from net realized gain | (846,555) | (456,803) |
| Total distributions | (873,177) | (872,676) |
| Share transactions | | |
| Proceeds from sales of shares | 31,661,663 | 53,186,825 |
| Reinvestment of distributions | 845,674 | 871,532 |
| Cost of shares redeemed | (9,960,981) | (14,718,009) |
| Net increase (decrease) in net assets resulting from share transactions | 22,546,356 | 39,340,348 |
| Total increase (decrease) in net assets | 26,065,350 | 38,051,180 |
| Net Assets | | |
| Beginning of period | 47,018,930 | 8,967,750 |
| End of period | $73,084,280 | $47,018,930 |
| Other Information | | |
| Undistributed net investment income end of period | $191,132 | $22,482 |
| Shares | | |
| Sold | 3,165,126 | 5,354,053 |
| Issued in reinvestment of distributions | 88,367 | 87,052 |
| Redeemed | (1,002,394) | (1,491,147) |
| Net increase (decrease) | 2,251,099 | 3,949,958 |
See accompanying notes which are an integral part of the financial statements.
Financial Highlights — Fidelity Freedom 2060 Fund
| | Six months ended (Unaudited) September 30, | Years ended March 31, | |
| | 2016 | 2016 | 2015 A |
| Selected Per–Share Data | | | |
| Net asset value, beginning of period | $9.78 | $10.45 | $10.00 |
| Income from Investment Operations | | | |
| Net investment income (loss)B | .03 | .16 | .10 |
| Net realized and unrealized gain (loss) | .70 | (.53) | .52 |
| Total from investment operations | .73 | (.37) | .62 |
| Distributions from net investment income | (.01) | (.12) | (.10) |
| Distributions from net realized gain | (.16) | (.17) | (.07) |
| Total distributions | (.16)C | (.30)D | (.17) |
| Net asset value, end of period | $10.35 | $9.78 | $10.45 |
| Total ReturnE,F | 7.64% | (3.67)% | 6.22% |
| Ratios to Average Net AssetsG,H | | | |
| Expenses before reductionsI | - %J | -% | - %J |
| Expenses net of fee waivers, if any | - %J | -% | - %J |
| Expenses net of all reductions | - %J | -% | - %J |
| Net investment income (loss) | .67%J | 1.67% | 1.54%J |
| Supplemental Data | | | |
| Net assets, end of period (000 omitted) | $73,084 | $47,019 | $8,968 |
| Portfolio turnover rateG | 16%J | 31% | 28%J |
A For the period August 5, 2014 (commencement of operations) to March 31, 2015.
B Calculated based on average shares outstanding during the period.
C Total distributions of $.16 per share is comprised of distributions from net investment income of $.005 and distributions from net realized gain of $.159 per share.
D Total distributions of $.30 per share is comprised of distributions from net investment income of $.121 and distributions from net realized gain of $.174 per share.
E Total returns for periods of less than one year are not annualized.
F Total returns would have been lower if certain expenses had not been reduced during the applicable periods shown.
G Amounts do not include the activity of the Underlying Funds.
H Expense ratios reflect operating expenses of the Fund. Expenses before reductions do not reflect amounts reimbursed by the investment adviser or reductions from expense offset arrangements and do not represent the amount paid by the Fund during periods when reimbursements or reductions occur. Expenses net of fee waivers reflect expenses after reimbursement by the investment adviser but prior to reductions from expense offset arrangements. Expenses net of all reductions represent the net expenses paid by the Fund but do not include expenses of the underlying funds in which the Fund invests.
I Amount represents less than .005%.
J Annualized
See accompanying notes which are an integral part of the financial statements.
See accompanying notes which are an integral part of the financial statements.
Notes to Financial Statements (Unaudited)
For the period ended September 30, 2016
1. Organization.
Fidelity Freedom Income Fund, Fidelity Freedom 2005 Fund, Fidelity Freedom 2010 Fund, Fidelity Freedom 2015 Fund, Fidelity Freedom 2020 Fund, Fidelity Freedom 2025 Fund, Fidelity Freedom 2030 Fund, Fidelity Freedom 2035 Fund, Fidelity Freedom 2040 Fund, Fidelity Freedom 2045 Fund, Fidelity Freedom 2050 Fund, Fidelity Freedom 2055 Fund and Fidelity Freedom 2060 Fund (the Funds) are funds of Fidelity Aberdeen Street Trust (the Trust). The Trust is registered under the Investment Company Act of 1940, as amended (the 1940 Act), as an open-end management investment company organized as a Delaware statutory trust. Each Fund is authorized to issue an unlimited number of shares. Share transactions on the Statement of Changes in Net Assets may contain exchanges between affiliated funds. The Funds invest primarily in a combination of other Fidelity equity, bond, and short-term funds (the Underlying Funds) managed by Fidelity Management & Research Company (FMR).
2. Significant Accounting Policies.
The financial statements have been prepared in conformity with accounting principles generally accepted in the United States of America (GAAP), which require management to make certain estimates and assumptions at the date of the financial statements. Actual results could differ from those estimates. Subsequent events, if any, through the date that the financial statements were issued have been evaluated in the preparation of the financial statements. The following summarizes the significant accounting policies of the Funds:
Investment Valuation. Investments are valued as of 4:00 p.m. Eastern time on the last calendar day of the period. Each Fund categorizes the inputs to valuation techniques used to value its investments into a disclosure hierarchy consisting of three levels as shown below:
- Level 1 – quoted prices in active markets for identical investments
- Level 2 – other significant observable inputs (including quoted prices for similar investments, interest rates, prepayment speeds, etc.)
- Level 3 – unobservable inputs (including the Fund's own assumptions based on the best information available)
Valuation techniques used to value each Fund's investments by major category are as follows. Investments in the Underlying Funds are valued at their closing net asset value (NAV) each business day and are categorized as Level 1 in the hierarchy.
Investment Transactions and Income. For financial reporting purposes, the Funds' investment holdings and NAV include trades executed through the end of the last business day of the period. The NAV per share for processing shareholder transactions is calculated as of the close of business of the New York Stock Exchange (NYSE), normally 4:00 p.m. Eastern time and includes trades executed through the end of the prior business day. Gains and losses on securities sold are determined on the basis of identified cost. Income and capital gain distributions from the Underlying Funds, if any, are recorded on the ex-dividend date.
Expenses. Expenses directly attributable to a fund are charged to that fund. Expenses attributable to more than one fund are allocated among the respective funds on the basis of relative net assets or other appropriate methods. Expenses included in the accompanying financial statements reflect the expenses of each Fund and do not include any expenses associated with the Underlying Funds. Although not included in each Fund's expenses, each Fund indirectly bears its proportionate share of the Underlying Funds' expenses through the impact of these expenses on each Underlying Fund's NAV. Expense estimates are accrued in the period to which they relate and adjustments are made when actual amounts are known.
Deferred Trustee Compensation. Under a Deferred Compensation Plan (the Plan) for Freedom 2010 Fund, Freedom 2020 Fund and Freedom 2030 Fund, independent Trustees may elect to defer receipt of a portion of their annual compensation. Deferred amounts are invested in a cross-section of Fidelity funds, are marked-to-market and remain in the Fund until distributed in accordance with the Plan. The investment of deferred amounts and the offsetting payable to the Trustees are included in the accompanying Statement of Assets and Liabilities.
Income Tax Information and Distributions to Shareholders. Each year, each Fund intends to qualify as a regulated investment company under Subchapter M of the Internal Revenue Code, including distributing substantially all of its taxable income and realized gains. As a result, no provision for U.S. Federal income taxes is required. Each Fund files a U.S. federal tax return, in addition to state and local tax returns as required. Each Fund's federal income tax returns are subject to examination by the Internal Revenue Service (IRS) for a period of three fiscal years after they are filed. State and local tax returns may be subject to examination for an additional fiscal year depending on the jurisdiction.
Distributions are declared and recorded on the ex-dividend date. Income and capital gain distributions are determined in accordance with income tax regulations, which may differ from GAAP.
Capital accounts within the financial statements are adjusted for permanent book-tax differences. These adjustments have no impact on net assets or the results of operations. Capital accounts are not adjusted for temporary book-tax differences which will reverse in a subsequent period.
Book-tax differences are primarily due to the short-term gain distributions from the Underlying Funds, deferred trustees compensation and losses deferred due to wash sales and excise tax regulations.
The federal tax cost of investment securities and unrealized appreciation (depreciation) as of period end were as follows for each Fund:
| | Tax cost | Gross unrealized appreciation | Gross unrealized depreciation | Net unrealized appreciation (depreciation) on securities |
| Fidelity Freedom Income Fund | $2,030,332,841 | $173,123,361 | $(17,934,174) | $155,189,187 |
| Fidelity Freedom 2005 Fund | 571,803,862 | 32,299,138 | (10,205,401) | 22,093,737 |
| Fidelity Freedom 2010 Fund | 3,963,886,025 | 340,249,739 | (61,378,570) | 278,871,169 |
| Fidelity Freedom 2015 Fund | 4,839,592,757 | 555,168,165 | (52,982,891) | 502,185,274 |
| Fidelity Freedom 2020 Fund | 10,814,738,856 | 1,275,008,090 | (135,778,330) | 1,139,229,760 |
| Fidelity Freedom 2025 Fund | 8,189,092,118 | 1,030,334,479 | (100,078,575) | 930,255,904 |
| Fidelity Freedom 2030 Fund | 9,404,972,359 | 1,318,624,819 | (135,394,577) | 1,183,230,242 |
| Fidelity Freedom 2035 Fund | 5,542,697,422 | 848,876,433 | (89,727,489) | 759,148,944 |
| Fidelity Freedom 2040 Fund | 5,902,544,556 | 926,782,481 | (86,340,310) | 840,442,171 |
| Fidelity Freedom 2045 Fund | 2,713,076,592 | 471,463,254 | (42,682,019) | 428,781,235 |
| Fidelity Freedom 2050 Fund | 2,223,898,128 | 387,667,695 | (32,381,439) | 355,286,256 |
| Fidelity Freedom 2055 Fund | 733,890,982 | 54,224,240 | (13,437,598) | 40,786,642 |
| Fidelity Freedom 2060 Fund | 70,847,425 | 3,339,905 | (1,103,044) | 2,236,861 |
The Fidelity Freedom Income Fund elected to defer to the next fiscal year $394,535 of capital losses recognized during the period November 1, 2015 to March 31, 2016.
3. Purchases and Redemptions of Underlying Fund Shares.
Purchases and redemptions of the Underlying Fund shares are noted in the table below.
| | Purchases ($) | Redemptions ($) |
| Fidelity Freedom Income Fund | 468,538,721 | 544,486,298 |
| Fidelity Freedom 2005 Fund | 114,208,085 | 126,122,177 |
| Fidelity Freedom 2010 Fund | 582,095,966 | 813,447,323 |
| Fidelity Freedom 2015 Fund | 624,163,143 | 915,978,688 |
| Fidelity Freedom 2020 Fund | 1,064,420,857 | 1,501,992,353 |
| Fidelity Freedom 2025 Fund | 792,504,982 | 914,777,853 |
| Fidelity Freedom 2030 Fund | 610,045,219 | 854,073,393 |
| Fidelity Freedom 2035 Fund | 394,297,423 | 481,265,205 |
| Fidelity Freedom 2040 Fund | 396,353,062 | 500,089,169 |
| Fidelity Freedom 2045 Fund | 261,450,512 | 244,046,270 |
| Fidelity Freedom 2050 Fund | 230,445,870 | 187,206,817 |
| Fidelity Freedom 2055 Fund | 130,960,114 | 55,645,612 |
| Fidelity Freedom 2060 Fund | 26,617,862 | 4,700,152 |
4. Fees and Other Transactions with Affiliates.
Management Fee. FMR Co., Inc. (the investment adviser), an affiliate of Fidelity Management & Research Company provides the Funds with investment management related services. The Funds do not pay any fees for these services.
Other Transactions. The investment adviser has entered into an administration agreement with FMR under which FMR provides management and administrative services (other than investment advisory services) necessary for the operation of each Fund. Pursuant to this agreement, FMR pays all expenses of each Fund, excluding compensation of the independent Trustees and certain other expenses such as interest expense. FMR also contracts with other Fidelity companies to perform the services necessary for the operation of each Fund. The Funds do not pay any fees for these services.
5. Expense Reductions.
FMR voluntarily agreed to reimburse each Fund's operating expenses. Some expenses, for example interest expense, are excluded from this reimbursement.
The following Funds were in reimbursement during the period:
| Fidelity Freedom Income Fund | $4,913 |
| Fidelity Freedom 2005 Fund | 1,321 |
| Fidelity Freedom 2010 Fund | 9,593 |
| Fidelity Freedom 2015 Fund | 12,004 |
| Fidelity Freedom 2020 Fund | 26,511 |
| Fidelity Freedom 2025 Fund | 19,859 |
| Fidelity Freedom 2030 Fund | 23,078 |
| Fidelity Freedom 2035 Fund | 13,591 |
| Fidelity Freedom 2040 Fund | 14,565 |
| Fidelity Freedom 2045 Fund | 6,687 |
| Fidelity Freedom 2050 Fund | 5,437 |
| Fidelity Freedom 2055 Fund | 1,537 |
| Fidelity Freedom 2060 Fund | 121 |
6. Other.
The Funds' organizational documents provide former and current trustees and officers with a limited indemnification against liabilities arising in connection with the performance of their duties to the Funds. In the normal course of business, the Funds may also enter into contracts that provide general indemnifications. The Funds' maximum exposure under these arrangements is unknown as this would be dependent on future claims that may be made against the Funds. The risk of material loss from such claims is considered remote.
The Funds do not invest in the Underlying Funds for the purpose of exercising management or control; however, investments by the Funds within their principal investment strategies may represent a significant portion of the Underlying Fund's net assets. At the end of the period, the following Funds were the owners of record of 10% or more of the total outstanding shares of the Underlying Funds.
| Fund | Fidelity Freedom 2020 Fund | |
| Fidelity Series Government Money Market Fund | 11% | |
| Fidelity Series Investment Grade Bond Fund | 12% | |
| Fidelity Series Long-Term Treasury Bond Index Fund | 12% | |
| Fidelity Series Short-Term Credit Fund | 13% | |
The Funds, in aggregate, were the owners of record of more than 20% of the total outstanding shares of the following Underlying Funds.
| Fund | % of shares held |
| Fidelity Series 100 Index Fund | 33% |
| Fidelity Series 1000 Value Index Fund | 36% |
| Fidelity Series All-Sector Equity Fund | 34% |
| Fidelity Series Blue Chip Growth Fund | 39% |
| Fidelity Series Commodity Strategy Fund | 30% |
| Fidelity Series Emerging Markets Debt Fund | 36% |
| Fidelity Series Emerging Markets Fund | 35% |
| Fidelity Series Equity-Income Fund | 39% |
| Fidelity Series Floating Rate High Income Fund | 36% |
| Fidelity Series Government Money Market Fund | 40% |
| Fidelity Series Growth & Income Fund | 39% |
| Fidelity Series Growth Company Fund | 39% |
| Fidelity Series High Income Fund | 37% |
| Fidelity Series Inflation-Protected Bond Index Fund | 36% |
| Fidelity Series International Growth Fund | 35% |
| Fidelity Series International Small Cap Fund | 35% |
| Fidelity Series International Value Fund | 34% |
| Fidelity Series Intrinsic Opportunities Fund | 39% |
| Fidelity Series Investment Grade Bond Fund | 41% |
| Fidelity Series Long-Term Treasury Bond Index Fund | 40% |
| Fidelity Series Opportunistic Insights Fund | 39% |
| Fidelity Series Real Estate Equity Fund | 35% |
| Fidelity Series Real Estate Income Fund | 36% |
| Fidelity Series Short-Term Credit Fund | 49% |
| Fidelity Series Small Cap Discovery Fund | 39% |
| Fidelity Series Small Cap Opportunities Fund | 35% |
| Fidelity Series Stock Selector Large Cap Value Fund | 38% |
Shareholder Expense Example
As a shareholder of a Fund, you incur two types of costs: (1) transaction costs and (2) ongoing costs, including other Fund expenses. This Example is intended to help you understand your ongoing costs (in dollars) of investing in the Funds and to compare these costs with the ongoing costs of investing in other mutual funds.
The Example is based on an investment of $1,000 invested at the beginning of the period and held for the entire period (April 1, 2016 to September 30, 2016).
Actual Expenses
The first line of the accompanying table for each fund provides information about actual account values and actual expenses. You may use the information in this line, together with the amount you invested, to estimate the expenses that you paid over the period. Simply divide your account value by $1,000.00 (for example, an $8,600 account value divided by $1,000.00 = 8.6), then multiply the result by the number in the first line for a fund under the heading entitled "Expenses Paid During Period" to estimate the expenses you paid on your account during this period. A small balance maintenance fee of $12.00 that is charged once a year may apply for certain accounts with a value of less than $2,000. This fee is not included in the table below. If it was, the estimate of expenses you paid during the period would be higher, and your ending account value lower, by this amount. In addition, each Fund, as a shareholder in underlying Fidelity Funds, will indirectly bear its pro-rata share of the fees and expenses incurred by the underlying Fidelity Funds. These fees and expenses are not included in each Fund's annualized expense ratio used to calculate the expense estimates in the table below.
Hypothetical Example for Comparison Purposes
The second line of the accompanying table for each fund provides information about hypothetical account values and hypothetical expenses based on a fund's actual expense ratio and an assumed rate of return of 5% per year before expenses, which is not the Fund's actual return. The hypothetical account values and expenses may not be used to estimate the actual ending account balance or expenses you paid for the period. You may use this information to compare the ongoing costs of investing in the Fund and other funds. To do so, compare this 5% hypothetical example with the 5% hypothetical examples that appear in the shareholder reports of the other funds. A small balance maintenance fee of $12.00 that is charged once a year may apply for certain accounts with a value of less than $2,000. This fee is not included in the table below. If it was, the estimate of expenses you paid during the period would be higher, and your ending account value lower, by this amount. In addition, each Fund, as a shareholder in underlying Fidelity Funds, will indirectly bear its pro-rata share of the fees and expenses incurred by the underlying Fidelity Funds. These fees and expenses are not included in each Fund's annualized expense ratio used to calculate the expense estimates in the table below.
Please note that the expenses shown in the table are meant to highlight your ongoing costs only and do not reflect any transaction costs. Therefore, the second line of the table is useful in comparing ongoing costs only, and will not help you determine the relative total costs of owning different funds.
| | Annualized Expense Ratio-A | Beginning
Account Value
April 1, 2016 | Ending
Account Value
September 30, 2016 | Expenses Paid
During Period-B
April 1, 2016
to September 30, 2016 |
| Fidelity Freedom Income Fund | - % | | | |
| Actual | | $1,000.00 | $1,044.00 | $- |
| Hypothetical-C | | $1,000.00 | $1,025.07 | $- |
| Fidelity Freedom 2005 Fund | - % | | | |
| Actual | | $1,000.00 | $1,050.50 | $- |
| Hypothetical-C | | $1,000.00 | $1,025.07 | $- |
| Fidelity Freedom 2010 Fund | - % | | | |
| Actual | | $1,000.00 | $1,055.40 | $- |
| Hypothetical-C | | $1,000.00 | $1,025.07 | $- |
| Fidelity Freedom 2015 Fund | - % | | | |
| Actual | | $1,000.00 | $1,061.20 | $- |
| Hypothetical-C | | $1,000.00 | $1,025.07�� | $- |
| Fidelity Freedom 2020 Fund | - % | | | |
| Actual | | $1,000.00 | $1,064.30 | $- |
| Hypothetical-C | | $1,000.00 | $1,025.07 | $- |
| Fidelity Freedom 2025 Fund | - % | | | |
| Actual | | $1,000.00 | $1,066.70 | $- |
| Hypothetical-C | | $1,000.00 | $1,025.07 | $- |
| Fidelity Freedom 2030 Fund | - % | | | |
| Actual | | $1,000.00 | $1,073.30 | $- |
| Hypothetical-C | | $1,000.00 | $1,025.07 | $- |
| Fidelity Freedom 2035 Fund | - % | | | |
| Actual | | $1,000.00 | $1,076.30 | $- |
| Hypothetical-C | | $1,000.00 | $1,025.07 | $- |
| Fidelity Freedom 2040 Fund | - % | | | |
| Actual | | $1,000.00 | $1,076.50 | $- |
| Hypothetical-C | | $1,000.00 | $1,025.07 | $- |
| Fidelity Freedom 2045 Fund | - % | | | |
| Actual | | $1,000.00 | $1,076.40 | $- |
| Hypothetical-C | | $1,000.00 | $1,025.07 | $- |
| Fidelity Freedom 2050 Fund | - % | | | |
| Actual | | $1,000.00 | $1,077.10 | $- |
| Hypothetical-C | | $1,000.00 | $1,025.07 | $- |
| Fidelity Freedom 2055 Fund | - % | | | |
| Actual | | $1,000.00 | $1,077.20 | $- |
| Hypothetical-C | | $1,000.00 | $1,025.07 | $- |
| Fidelity Freedom 2060 Fund | - % | | | |
| Actual | | $1,000.00 | $1,076.40 | $- |
| Hypothetical-C | | $1,000.00 | $1,025.07 | $- |
A Annualized expense ratio reflects expenses net of applicable fee waivers.
B Expenses are equal to each Fund's annualized expense ratio, multiplied by the average account value over the period, multiplied by 183/365 (to reflect the one-half year period). The fees and expenses of the underlying Fidelity Funds in which each Fund invests are not included in each Fund's annualized expense ratio.
C 5% return per year before expenses
Board Approval of Investment Advisory Contracts and Management Fees
Fidelity Freedom Funds
Each year, the Board of Trustees, including the Independent Trustees (together, the Board), votes on the renewal of the management contract (the Advisory Contract) with FMR Co., Inc. (FMRC), an affiliate of Fidelity Management & Research Company (FMR), and the administration agreement between FMRC and FMR for each fund. The Board, assisted by the advice of fund counsel and Independent Trustees' counsel, requests and considers a broad range of information relevant to the renewal of the Advisory Contracts and administration agreements throughout the year.
The Board meets regularly and, at each of its meetings, covers an extensive agenda of topics and materials and considers factors that are relevant to its annual consideration of the renewal of each fund's Advisory Contract and administration agreement, including the services and support provided to each fund and its shareholders. The Board has established four standing committees (Committees) — Operations, Audit, Fair Valuation, and Governance and Nominating — each composed of and chaired by Independent Trustees with varying backgrounds, to which the Board has assigned specific subject matter responsibilities in order to enhance effective decision-making by the Board. The Operations Committee, of which all of the Independent Trustees are members, meets regularly throughout the year and considers, among other matters, information specifically related to the annual consideration of the renewal of each fund's Advisory Contract and administration agreement. The Board, acting directly and through its Committees, requests and receives information concerning the annual consideration of the renewal of each fund's Advisory Contract and administration agreement. The Board also meets as needed to consider matters specifically related to the Board's annual consideration of the renewal of the Advisory Contracts and administration agreements. Members of the Board may also meet with trustees of other Fidelity funds through ad hoc joint committees to discuss certain matters relevant to all of the Fidelity funds.
At its September 2016 meeting, the Board unanimously determined to renew each fund's Advisory Contract and administration agreement. In reaching its determination, the Board considered all factors it believed relevant and reached a determination, with the assistance of fund counsel and Independent Trustees' counsel and through the exercise of its business judgment, that the renewal of the Advisory Contract was in the best interests of each fund and its shareholders and that the fact that no fees are payable under the Advisory Contracts was fair and reasonable. The Board's decision to renew the Advisory Contracts was not based on any single factor, but rather was based on a comprehensive consideration of all the information provided to the Board at its meetings throughout the year. In reaching its determination, the Board was aware that shareholders of each fund have a broad range of investment choices available to them, including a wide choice among funds offered by Fidelity's competitors, and that each fund's shareholders, who have the opportunity to review and weigh the disclosure provided by the fund in its prospectus and other public disclosures, have chosen to invest in that fund, which is part of the Fidelity family of funds.
Approval of New Advisory Contracts. The Board noted that at its July 2016 meeting, it had voted to approve an amended and restated management contract (New Advisory Contract) for each fund to add a management fee payable by the fund. The Board considered that each fund's New Advisory Contract will not take effect unless the funds' shareholders approve the New Advisory Contracts and shareholders of certain other Fidelity funds also approve amended and restated management contracts. The Board noted that such approvals are scheduled to be voted on at meetings on October 28, 2016, but that one or more of the meetings may be adjourned to later dates. The Board also noted that, under each fund's current Advisory Contract, the fund does not pay a management fee to FMRC and instead each fund indirectly incurs a portion of the management fee and other expenses of each underlying fund as acquired fund fees and expenses. The Board considered that, under each fund's New Advisory Contract, each fund will pay a monthly management fee to FMRC at an annual rate for the fund. The Board noted that the increase in each fund's management fee under the New Advisory Contract will result in the fund's management fee rate ranking above the median of the management fee rates of its competitor funds based on the competitive mapped group data provided to the Board in July 2016 in connection with its consideration of the annual renewal of the current Advisory Contracts. The Board considered that the increase in each fund's management fee under the New Advisory Contract will be more than offset by a decrease in each fund's acquired fund fees and expenses as a result of fee reductions under new management contracts, sub-advisory agreements, transfer agent agreements, and pricing and bookkeeping agreements for the underlying funds (New Underlying Fund Contracts), which will go into effect if the funds' New Advisory Contracts take effect. The Board noted that, once the New Underlying Fund Contracts take effect, the underlying funds will no longer pay any operating expenses, subject to limited exceptions, and, thus, the funds' acquired fund fees and expenses will be significantly reduced. The Board noted that, as a result, the increased management fee and decreased acquired fund fees and expenses are expected to have the combined effect of reducing the total expenses incurred by shareholders of each fund by at least 0.02%. The Board considered that the approval of the New Advisory Contracts will not result in any changes to (i) the investment process or strategies employed in the management of the funds' assets; (ii) the nature, extent and quality of services provided to each fund; or (iii) the day-to-day management of each fund and the personnel primarily responsible for such management. The Board considered that, like the current Advisory Contracts, the New Advisory Contracts provide that FMRC or an affiliate undertakes to pay all operating expenses of the funds, subject to limited exceptions specified in each contract.
The Board noted that certain of the information it considered in reaching its determination with respect to the current Advisory Contracts would no longer be applicable if the New Advisory Contracts take effect. Based on its evaluation of all of the conclusions noted, and after considering all factors it believed relevant, the Board ultimately concluded that the nature, extent and quality of services provided to each fund should continue to benefit shareholders of each fund, that the management fee structures under the New Advisory Contracts are fair and reasonable, and that each fund's New Advisory Contract should be approved.
Nature, Extent, and Quality of Services Provided. The Board considered Fidelity's staffing as it relates to the funds, including the backgrounds of investment personnel of FMRC, and also considered the funds' investment objectives, strategies, and related investment philosophies. The Independent Trustees also had discussions with senior management of Fidelity's investment operations and investment groups with responsibility for the underlying Fidelity funds in which each fund invests. The Board considered the structure of the investment personnel compensation program and whether this structure provides appropriate incentives to act in the best interests of each fund. Additionally, the Board considered the portfolio managers' investments, if any, in the funds that they manage.
Resources Dedicated to Investment Management and Support Services. The Board reviewed the general qualifications and capabilities of Fidelity's investment staff, including its size, education, experience, and resources, as well as Fidelity's approach to recruiting, managing, and compensating investment personnel. The Board noted that Fidelity has continued to increase the resources devoted to non-U.S. offices, including expansion of Fidelity's global investment organization. The Board also noted that Fidelity's analysts have extensive resources, tools and capabilities that allow them to conduct sophisticated quantitative and fundamental analysis, as well as credit analysis of issuers, counterparties and guarantors. Further, the Board considered that Fidelity's investment professionals have sufficient access to global information and data so as to provide competitive investment results over time, and that those professionals also have access to sophisticated tools that permit them to assess portfolio construction and risk and performance attribution characteristics continuously, as well as to transmit new information and research conclusions rapidly around the world. Additionally, in its deliberations, the Board considered Fidelity's risk management, compliance, and technology and operations capabilities and resources, which are integral parts of the investment management process.
Shareholder and Administrative Services. The Board considered (i) the nature, extent, quality, and cost of advisory, administrative, and shareholder services performed by Fidelity under the Advisory Contract and under separate agreements covering administration, transfer agency, and pricing and bookkeeping services for each fund; (ii) the nature and extent of the supervision of third party service providers, principally custodians, subcustodians, and pricing vendors; and (iii) the resources devoted to, and the record of compliance with, each fund's compliance policies and procedures.
The Board noted that the growth of fund assets over time across the complex allows Fidelity to reinvest in the development of services designed to enhance the value or convenience of the Fidelity funds as investment vehicles. These services include 24-hour access to account information and market information through telephone representatives and over the Internet, investor education materials and asset allocation tools, and the expanded availability of Fidelity Investor Centers.
Investment in a Large Fund Family. The Board considered the benefits to shareholders of investing in a Fidelity fund, including the benefits of investing in a fund that is part of a large family of funds offering a variety of investment disciplines and providing a large variety of mutual fund investor services. The Board noted that Fidelity had taken, or had made recommendations that resulted in the Fidelity funds taking, a number of actions over the previous year that benefited particular funds, including: (i) continuing to dedicate additional resources to investment research and to the support of the senior management team that oversees asset management; (ii) continuing efforts to enhance Fidelity's global research capabilities; (iii) launching new funds and making other enhancements to meet client needs; (iv) broadening eligibility requirements for certain lower-priced share classes of, and streamlining the fee structure for, certain existing equity index funds; (v) lowering expense caps for certain existing funds and classes to reduce expenses paid by shareholders; (vi) eliminating redemption fees for certain variable insurance product funds and classes; (vii) continuing to launch dedicated lower cost underlying funds to meet portfolio construction needs related to expanding underlying fund options for Fidelity funds of funds, specifically for the Freedom Fund product lines; (viii ) launching a lower cost share class for use by the Freedom Index Fund product line; (ix) rationalizing product lines and gaining increased efficiencies through fund mergers and share class consolidations; (x) continuing to develop, acquire and implement systems and technology to improve services to the funds and shareholders, strengthen information security, and increase efficiency;(xi) implementing investment enhancements to further strengthen Fidelity's target date product line to increase investors' probability of success in achieving their goals; (xii) accelerating the conversion of all remaining Class B shares to Class A shares, which have a lower expense structure; and (xiii) implementing changes to Fidelity's money market fund product line in response to recent regulatory reforms.
Investment Performance. The Board considered whether each fund has operated in accordance with its investment objective, as well as its record of compliance with its investment restrictions and its performance history.
The Board took into account discussions with representatives of the investment adviser about fund investment performance that occur at Board meetings throughout the year. In this regard the Board noted that as part of regularly scheduled fund reviews and other reports to the Board on fund performance, the Board considers annualized return information for each fund for different time periods, measured against one or more securities market indices, including a customized blended index representative of the fund's asset classes (each a "benchmark index") and a peer group of funds with similar objectives ("peer group"), if any. In its evaluation of fund investment performance at meetings throughout the year, the Board gave particular attention to information indicating underperformance of certain Fidelity funds for specific time periods and discussed with the investment adviser the reasons for such underperformance.
In addition to reviewing absolute and relative fund performance, the Independent Trustees periodically consider the appropriateness of fund performance metrics in evaluating the results achieved. In general, the Independent Trustees believe that fund performance should be evaluated based on gross performance (before fees and expenses, including acquired fund fees and expenses, but after transaction costs, if any) compared to appropriate benchmark indices, over appropriate time periods that may include full market cycles, and on net performance (after fees and expenses, including acquired fund fees and expenses) compared to peer groups, as applicable, over the same periods, taking into account relevant factors including the following: general market conditions; the extent to which particular underlying funds affected performance; and fund cash flows and other factors. Depending on the circumstances, the Independent Trustees may be satisfied with a fund's performance notwithstanding that it lags its benchmark index or peer group for certain periods.
The Independent Trustees recognize that shareholders evaluate performance on a net basis over their own holding periods, for which one-, three-, and five-year periods are often used as a proxy. For this reason, the performance information reviewed by the Board also included net cumulative calendar year total return information for each fund and an appropriate benchmark index for the most recent one-, three-, and five-year periods (for the most recent one- and three-year periods for Freedom 2055 Fund and for the most recent one-year period for Freedom 2060 Fund).
Based on its review, the Board concluded that the nature, extent, and quality of services provided to each fund under the Advisory Contracts should continue to benefit the shareholders of each fund.
Competitiveness of Management Fee and Total Expense Ratio. The Board noted that the funds currently do not pay FMRC a management fee for investment advisory services, and that each fund bears indirectly the fees and expenses, including the management fees, paid by the underlying Fidelity funds in which it invests. The Board considered each fund's management fee and total expense ratio compared to "mapped groups" of competitive funds and classes created for the purpose of facilitating the Trustees' competitive analysis of management fees and total expenses. Fidelity creates "mapped groups" by combining similar Lipper investment objective categories that have comparable investment mandates. Combining Lipper investment objective categories aids the Board's management fee and total expense ratio comparisons by broadening the competitive group used for comparison.
Management Fee. The Board considered two proprietary management fee comparisons for the 12-month (or shorter) periods shown in basis points (BP) in the charts below. The group of Lipper funds used by the Board for management fee comparisons is referred to below as the "Total Mapped Group." The Total Mapped Group comparison focuses on a fund's standing in terms of gross management fees before expense reimbursements or caps relative to the total universe of funds with comparable investment mandates, regardless of whether their management fee structures also are comparable. Funds with comparable investment mandates offer exposure to similar types of securities. Funds with comparable management fee structures have similar management fee contractual arrangements (
e.g., flat rate charged for advisory services, all-inclusive fee rate,
etc.). "TMG %" represents the percentage of funds in the Total Mapped Group that had management fees that were lower than a fund's. For example, a hypothetical TMG % of 20% would mean that 80% of the funds in the Total Mapped Group had higher, and 20% had lower, management fees than a fund. The funds' actual TMG %s and the number of funds in the Total Mapped Group are in the charts below. The Board also noted that over the past few years, Fidelity has been developing and refining the competitive methodology for the funds to provide a more meaningful competitive comparison. As a result, beginning with the 2014 competitive results, instead of including all funds in one competitive mapped group that includes all funds-of-funds, Fidelity introduced three new Total Mapped Groups that consist of target retirement funds, grouped according to target retirement dates. The Board noted that Fidelity believes that the new Total Mapped Groups provide more meaningful competitive comparisons for the funds because they include target date funds, regardless of whether the fund is a fund of funds, and reflect, among other things, that active target date funds with a higher percentage of assets invested in equities tend to have higher expenses. The "Asset-Size Peer Group" (ASPG) comparison focuses on a fund's standing relative to a subset of non-Fidelity funds within the Total Mapped Group that are similar in size and management fee structure. For example, if a fund is in the first quartile of the ASPG, the fund's management fee ranks in the least expensive or lowest 25% of funds in the ASPG. The ASPG represents at least 15% of the funds in the Total Mapped Group with comparable asset size and management fee structures, subject to a minimum of 50 funds (or all funds in the Total Mapped Group if fewer than 50). Additional information, such as the ASPG quartile in which a fund's management fee rate ranked, is also included in the charts and considered by the Board.
Freedom 2005 Fund
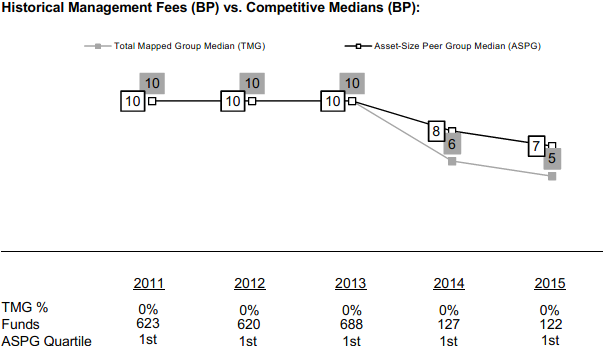
Freedom 2010 Fund
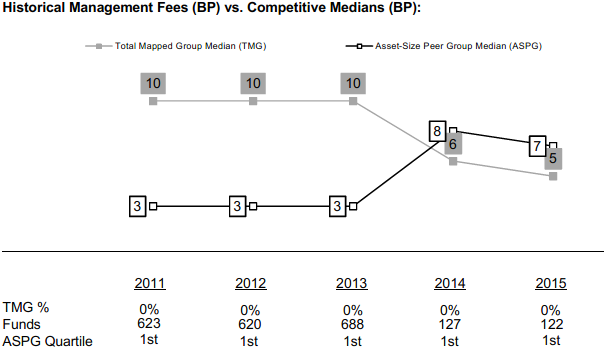
Freedom 2015 Fund

Freedom 2020 Fund
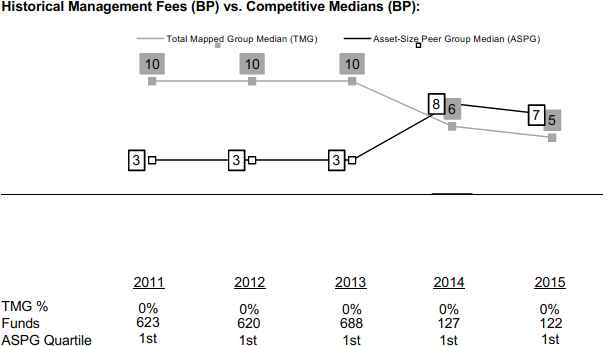
Freedom 2025 Fund

Freedom 2030 Fund

Freedom 2035 Fund
Freedom 2040 Fund
Freedom 2045 Fund
Freedom 2050 Fund

Freedom 2055 Fund
Freedom 2060 Fund
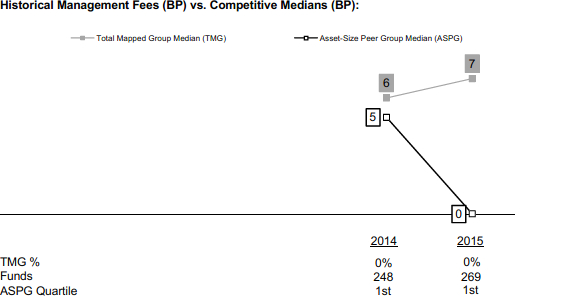
Freedom Income Fund
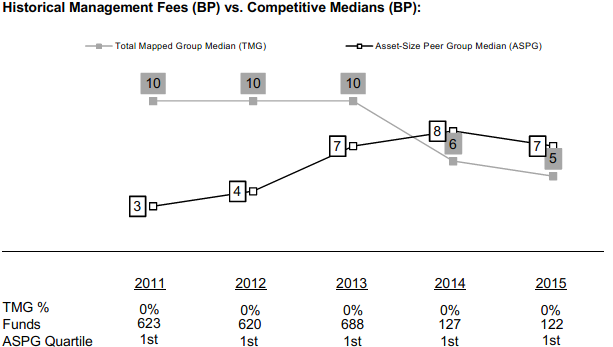
The Board noted that each fund's current management fee rate of 0.00% ranked below the median of its Total Mapped Group and below the median of its ASPG for 2015. The Board further noted that many peer funds pay fund-level expenses, including management fees, to which the funds are not currently subject.
The Board noted that, in 2014, the ad hoc Committee on Group Fee was formed by it and the boards of other Fidelity funds to conduct an in-depth review of the "group fee" component of the management fee of funds with such management fee structures, and that while the funds do not currently pay a management fee, they indirectly bear a portion of the management fees paid by the Fidelity funds in which they invest, some of which are currently subject to the group fee. The Committee's focus included the mechanics of the group fee, the competitive landscape of group fee structures, Fidelity funds with no group fee component (such as the funds) and investment products not included in group fee assets. The Board also considered that, for funds subject to the group fee, FMR agreed to voluntarily waive fees over a specified period of time in amounts designed to account for assets converted from certain funds to certain collective investment trusts.
Based on its review, the Board concluded that each fund's management fee is fair and reasonable in light of the services that the fund receives and the other factors considered.
Total Expense Ratio. In its review of each fund's total expense ratio, the Board considered that the funds do not currently pay transfer agent fees. Instead, the applicable class of each underlying Fidelity fund bears its pro rata portion of each fund's transfer agent fee according to the percentage of each fund's assets invested in that underlying fund. The Board further noted that FMR pays all other expenses of each fund, with limited exceptions, pursuant to the administration agreement between FMRC and FMR with respect to each fund.
The Board noted that Freedom 2005 Fund's, Freedom 2010 Fund's, Freedom 2015 Fund's, Freedom 2020 Fund's, and Freedom Income Fund's total expense ratio of 0.00% (not including expenses of any underlying fund in which each fund invests) ranked below the competitive median for 2015 and each other fund's total expense ratio of 0.00% (not including expenses of any underlying fund in which each fund invests) ranked equal to the competitive median for 2015.
In considering each fund's total expense ratio, the Board also considered an alternative competitive analysis that included both top level (
i.e., direct) fund fees and acquired fund fees and expenses for the fund and the other funds and classes to which it is compared. The Board noted that, under this alternative competitive analysis, each fund's total expense ratio ranked below the competitive median for 2015.
Fees Charged to Other Fidelity Clients. The Board also considered Fidelity fee structures and other information with respect to clients of Fidelity, such as other funds advised or subadvised by Fidelity, pension plan clients, and other institutional clients with similar mandates. The Board noted that an ad hoc joint committee created by it and the boards of other Fidelity funds periodically (most recently in 2013) reviews and compares Fidelity's institutional investment advisory business with its business of providing services to the Fidelity funds, including the differences in services provided, fees charged, and costs incurred, as well as competition in their respective marketplaces.
Based on its review of total expense ratios and fees charged to other Fidelity clients, the Board concluded that each fund's total expense ratio was reasonable in light of the services that the fund and its shareholders receive and the other factors considered.
Costs of the Services and Profitability. The Board considered the level of Fidelity's profits in respect of all the Fidelity funds, including the Fidelity funds in which the funds invest.
PricewaterhouseCoopers LLP (PwC), independent registered public accounting firm and auditor to Fidelity and certain Fidelity funds, has been engaged annually by the Board as part of the Board's assessment of Fidelity's profitability analysis. PwC's engagement includes the review and assessment of the methodologies used by Fidelity in determining the revenues and expenses attributable to Fidelity's mutual fund business, and completion of agreed-upon procedures in respect of the mathematical accuracy of the fund profitability information and its conformity to established allocation methodologies. After considering PwC's reports issued under the engagement and information provided by Fidelity, the Board concluded that while other allocation methods may also be reasonable, Fidelity's profitability methodologies are reasonable in all material respects.
The Board also reviewed Fidelity's non-fund businesses and fall-out benefits related to the mutual fund business as well as cases where Fidelity's affiliates may benefit from or be related to the funds' business.
The Board concluded that the costs of the services provided by and the profits realized by Fidelity in connection with the operation of each fund were not relevant to the renewal of each fund's current Advisory Contract because the funds do not currently pay management fees and FMR pays all other expenses of each fund, with limited exceptions.
Economies of Scale. The Board concluded that because the funds do not currently pay management fees and FMR pays all other expenses of each fund, with limited exceptions, economies of scale cannot currently be realized by the funds, but under the current fee arrangements may be realized by the other Fidelity funds in which each fund invests, many of which may benefit from breakpoints under the group fee arrangement.
Additional Information Requested by the Board. In order to develop fully the factual basis for consideration of the Fidelity funds' advisory contracts, the Board requested and received additional information on certain topics, including: (i) Fidelity's fund profitability methodology, profitability trends for certain funds, and the impact of certain factors on fund profitability results; (ii) portfolio manager changes that have occurred during the past year and the amount of the investment that each portfolio manager has made in the Fidelity fund(s) that he or she manages; (iii) Fidelity's compensation structure for portfolio managers, research analysts, and other key personnel, including its effects on fund profitability, the rationale for the compensation structure, and the extent to which current market conditions have affected retention and recruitment; (iv) the arrangements with and compensation paid to certain fund sub-advisers on behalf of the Fidelity funds; (v) Fidelity's voluntary waiver of its fees to maintain minimum yields for certain money market funds and classes as well as contractual waivers in place for certain funds; (vi) the methodology with respect to competitive fund data and peer group classifications; (vii) Fidelity's transfer agent fee, expense, and service structures for different funds and classes relative to competitive trends, and the impact of the increased use of omnibus accounts; (viii) Fidelity's long-term expectations for its offerings in the workplace investing channel; (ix) new developments in the retail and institutional marketplaces; (x) the approach to considering "fall-out" benefits; and (xi) the impact of money market reform on Fidelity's money market funds, including with respect to costs and profitability. In addition, the Board considered its discussions with Fidelity throughout the year regarding enhanced information security initiatives and the funds' fair valuation policies.
Based on its evaluation of all of the conclusions noted above, and after considering all factors it believed relevant, the Board concluded that the advisory fee structures are fair and reasonable, and that each fund's Advisory Contract should be renewed.

FF-SANN-1116
1.537284.119
Fidelity Freedom K® Funds - Income, 2005, 2010, 2015, 2020, 2025, 2030, 2035, 2040, 2045, 2050, 2055, 2060
Semi-Annual Report September 30, 2016 |
|
Contents
To view a fund's proxy voting guidelines and proxy voting record for the 12-month period ended June 30, visit http://www.fidelity.com/proxyvotingresults or visit the Securities and Exchange Commission's (SEC) web site at http://www.sec.gov.
You may also call 1-800-835-5092 to request a free copy of the proxy voting guidelines.
Standard & Poor's, S&P and S&P 500 are registered service marks of The McGraw-Hill Companies, Inc. and have been licensed for use by Fidelity Distributors Corporation.
Other third-party marks appearing herein are the property of their respective owners.
All other marks appearing herein are registered or unregistered trademarks or service marks of FMR LLC or an affiliated company. © 2016 FMR LLC. All rights reserved.
This report and the financial statements contained herein are submitted for the general information of the shareholders of the Funds. This report is not authorized for distribution to prospective investors in the Funds unless preceded or accompanied by an effective prospectus.
A fund files its complete schedule of portfolio holdings with the SEC for the first and third quarters of each fiscal year on Form N-Q. Forms N-Q are available on the SEC’s web site at http://www.sec.gov. A fund's Forms N-Q may be reviewed and copied at the SEC’s Public Reference Room in Washington, DC. Information regarding the operation of the SEC's Public Reference Room may be obtained by calling 1-800-SEC-0330.
For a complete list of a fund's portfolio holdings, view the most recent holdings listing, semiannual report, or annual report on Fidelity's web site at http://www.fidelity.com, http://www.institutional.fidelity.com, or http://www.401k.com, as applicable.
NOT FDIC INSURED •MAY LOSE VALUE •NO BANK GUARANTEE
Neither the Funds nor Fidelity Distributors Corporation is a bank.
Note to Shareholders
In July 2016, the Board of Trustees approved a new pricing structure for the Freedom Funds. Fund shareholders of record on August 29, 2016 have been asked to vote on the proposal. If approved by shareholders, the proposal will reduce the overall expenses that Freedom Fund shareholders pay (relative to the funds’ expenses as of March 31, 2016), and provide for less fluctuation in fund expenses. Under the new structure, each Freedom Fund will charge shareholders for all of its operating expenses directly, and most expenses that are currently charged by the underlying funds in which the Freedom Funds invest will be eliminated.
The note above is not a solicitation of any proxy. More detailed information is contained in the proxy statement.
Fidelity Freedom K® Income Fund
Investment Summary (Unaudited)
The information in the following tables is based on the direct investments of the Fund.
Top Holdings as of September 30, 2016
| | % of fund's net assets | % of fund's net assets 6 months ago |
| Fidelity Series Investment Grade Bond Fund Class F | 37.5 | 38.8 |
| Fidelity Series Government Money Market Fund Class F 0.29% | 17.2 | 0.0 |
| Fidelity Series Short-Term Credit Fund Class F | 9.1 | 8.9 |
| Fidelity Series Emerging Markets Fund Class F | 4.9 | 4.4 |
| Fidelity Series Inflation-Protected Bond Index Fund Class F | 3.9 | 3.8 |
| Fidelity Series High Income Fund Class F | 3.1 | 3.0 |
| Fidelity Series Equity-Income Fund Class F | 2.5 | 2.6 |
| Fidelity Series International Value Fund Class F | 2.5 | 2.0 |
| Fidelity Series International Growth Fund Class F | 2.4 | 2.1 |
| Fidelity Series Growth Company Fund Class F | 2.2 | 2.4 |
| | 85.3 | 68.0 |
Asset Allocation (% of fund's net assets)
| Period end |
| | Domestic Equity Funds | 17.4% |
| | International Equity Funds | 10.4% |
| | Bond Funds | 45.9% |
| | Short-Term Funds | 26.3% |

| Six months ago |
| | Domestic Equity Funds | 18.6% |
| | International Equity Funds | 9.0% |
| | Bond Funds | 46.9% |
| | Short-Term Funds | 25.5% |

Domestic Equity Funds category includes Fidelity Series Commodity Strategy Fund which invests in commodity-related investments.
Percentages shown as 0.0% may reflect amounts less than 0.05%.
Fidelity Freedom K® Income Fund
Investments September 30, 2016 (Unaudited)
Showing Percentage of Net Assets
| Domestic Equity Funds - 17.4% | | | |
| | | Shares | Value |
| Fidelity Series 100 Index Fund Class F (a) | | 655,585 | $9,361,758 |
| Fidelity Series 1000 Value Index Fund Class F (a) | | 523,534 | 5,853,108 |
| Fidelity Series All-Sector Equity Fund Class F (a) | | 1,314,528 | 17,654,104 |
| Fidelity Series Blue Chip Growth Fund Class F (a) | | 1,848,489 | 21,682,770 |
| Fidelity Series Commodity Strategy Fund Class F (a)(b) | | 5,029,890 | 26,909,909 |
| Fidelity Series Equity-Income Fund Class F (a) | | 3,476,160 | 43,034,856 |
| Fidelity Series Growth & Income Fund Class F (a) | | 2,363,331 | 31,692,270 |
| Fidelity Series Growth Company Fund Class F (a) | | 2,749,117 | 36,920,636 |
| Fidelity Series Intrinsic Opportunities Fund Class F (a) | | 1,782,075 | 26,802,413 |
| Fidelity Series Opportunistic Insights Fund Class F (a) | | 1,365,842 | 20,952,021 |
| Fidelity Series Real Estate Equity Fund Class F (a) | | 266,281 | 3,666,684 |
| Fidelity Series Small Cap Discovery Fund Class F (a) | | 541,235 | 5,710,028 |
| Fidelity Series Small Cap Opportunities Fund Class F (a) | | 1,294,527 | 17,126,593 |
| Fidelity Series Stock Selector Large Cap Value Fund Class F (a) | | 2,371,868 | 28,011,756 |
| TOTAL DOMESTIC EQUITY FUNDS | | | |
| (Cost $247,676,628) | | | 295,378,906 |
|
| International Equity Funds - 10.4% | | | |
| Fidelity Series Emerging Markets Fund Class F (a) | | 4,908,867 | 82,861,669 |
| Fidelity Series International Growth Fund Class F (a) | | 2,961,089 | 41,573,694 |
| Fidelity Series International Small Cap Fund Class F (a) | | 611,894 | 9,551,659 |
| Fidelity Series International Value Fund Class F (a) | | 4,389,211 | 41,741,394 |
| TOTAL INTERNATIONAL EQUITY FUNDS | | | |
| (Cost $154,556,683) | | | 175,728,416 |
|
| Bond Funds - 45.9% | | | |
| Fidelity Series Emerging Markets Debt Fund Class F (a) | | 1,109,264 | 11,491,974 |
| Fidelity Series Floating Rate High Income Fund Class F (a) | | 456,402 | 4,299,307 |
| Fidelity Series High Income Fund Class F (a) | | 5,594,908 | 52,368,340 |
| Fidelity Series Inflation-Protected Bond Index Fund Class F (a) | | 6,553,879 | 66,063,101 |
| Fidelity Series Investment Grade Bond Fund Class F (a) | | 54,846,135 | 636,215,169 |
| Fidelity Series Long-Term Treasury Bond Index Fund Class F (a) | | 72,679 | 701,352 |
| Fidelity Series Real Estate Income Fund Class F (a) | | 750,088 | 8,415,992 |
| TOTAL BOND FUNDS | | | |
| (Cost $764,802,675) | | | 779,555,235 |
|
| Short-Term Funds - 26.3% | | | |
| Fidelity Series Government Money Market Fund Class F 0.29% (a)(c) | | 291,234,948 | 291,234,948 |
| Fidelity Series Short-Term Credit Fund Class F (a) | | 15,430,844 | 154,771,362 |
| TOTAL SHORT-TERM FUNDS | | | |
| (Cost $445,320,419) | | | 446,006,310 |
| TOTAL INVESTMENT PORTFOLIO - 100.0% | | | |
| (Cost $1,612,356,405) | | | 1,696,668,867 |
| NET OTHER ASSETS (LIABILITIES) - 0.0% | | | (66,330) |
| NET ASSETS - 100% | | | $1,696,602,537 |
Legend
(a) Affiliated Fund
(b) Non-income producing
(c) The rate quoted is the annualized seven-day yield of the fund at period end.
Affiliated Underlying Funds
Information regarding the Fund's fiscal year to date purchases and sales of the affiliated Underlying Funds and income earned by the Fund from investments in affiliated Underlying Funds is as follows:
| Affiliate | Value, beginning of period | Purchases | Sales Proceeds | Dividend Income | Value, end of period |
| Fidelity Investments Money Market Portfolio Class F | $276,274,522 | $6,540,150 | $282,814,677 | $120,851 | $-- |
| Fidelity Series 100 Index Fund Class F | 10,218,688 | 494,564 | 1,944,491 | -- | 9,361,758 |
| Fidelity Series 1000 Value Index Fund Class F | 5,755,491 | 364,043 | 723,270 | -- | 5,853,108 |
| Fidelity Series All-Sector Equity Fund Class F | 32,219,875 | 1,397,697 | 17,954,859 | -- | 17,654,104 |
| Fidelity Series Blue Chip Growth Fund Class F | 22,358,615 | 1,129,746 | 3,496,304 | 59,690 | 21,682,770 |
| Fidelity Series Commodity Strategy Fund Class F | 20,547,294 | 6,150,188 | 1,438,767 | -- | 26,909,909 |
| Fidelity Series Emerging Markets Debt Fund Class F | 10,478,636 | 752,205 | 694,215 | 306,666 | 11,491,974 |
| Fidelity Series Emerging Markets Fund Class F | 73,837,094 | 3,292,588 | 3,914,464 | -- | 82,861,669 |
| Fidelity Series Equity-Income Fund Class F | 43,310,394 | 2,320,079 | 5,815,025 | 407,358 | 43,034,856 |
| Fidelity Series Floating Rate High Income Fund Class F | 4,130,496 | 290,465 | 321,954 | 94,313 | 4,299,307 |
| Fidelity Series Government Money Market Fund Class F 0.29% | -- | 303,248,682 | 12,013,734 | 269,642 | 291,234,948 |
| Fidelity Series Growth & Income Fund Class F | 33,192,987 | 1,897,999 | 5,836,238 | 290,875 | 31,692,270 |
| Fidelity Series Growth Company Fund Class F | 39,671,524 | 347,814 | 6,698,640 | -- | 36,920,636 |
| Fidelity Series High Income Fund Class F | 50,114,236 | 1,875,148 | 3,528,536 | 1,461,587 | 52,368,340 |
| Fidelity Series Inflation-Protected Bond Index Fund Class F | 62,930,647 | 5,919,710 | 4,014,496 | 74,508 | 66,063,101 |
| Fidelity Series International Growth Fund Class F | 33,969,127 | 9,479,544 | 3,777,938 | -- | 41,573,694 |
| Fidelity Series International Small Cap Fund Class F | 8,529,848 | 2,245,671 | 1,524,476 | -- | 9,551,659 |
| Fidelity Series International Value Fund Class F | 33,703,165 | 10,470,441 | 3,990,269 | -- | 41,741,394 |
| Fidelity Series Intrinsic Opportunities Fund Class F | 25,731,101 | 1,187,337 | 1,684,266 | 204,589 | 26,802,413 |
| Fidelity Series Investment Grade Bond Fund Class F | 647,884,228 | 32,944,510 | 60,929,588 | 8,196,624 | 636,215,169 |
| Fidelity Series Long-Term Treasury Bond Index Fund Class F | -- | 730,613 | 4,717 | 3,232 | 701,352 |
| Fidelity Series Opportunistic Insights Fund Class F | 21,569,666 | 1,029,324 | 2,712,221 | -- | 20,952,021 |
| Fidelity Series Real Estate Equity Fund Class F | 3,978,373 | 390,095 | 615,240 | 36,975 | 3,666,684 |
| Fidelity Series Real Estate Income Fund Class F | 8,081,761 | 870,841 | 790,200 | 210,796 | 8,415,992 |
| Fidelity Series Short-Term Credit Fund Class F | 148,850,113 | 14,924,968 | 9,612,221 | 817,508 | 154,771,362 |
| Fidelity Series Small Cap Discovery Fund Class F | 5,586,013 | 287,672 | 473,595 | 9,927 | 5,710,028 |
| Fidelity Series Small Cap Opportunities Fund Class F | 17,349,348 | 890,115 | 2,551,277 | 59,271 | 17,126,593 |
| Fidelity Series Stock Selector Large Cap Value Fund Class F | 28,683,670 | 1,385,124 | 3,945,501 | -- | 28,011,756 |
| Total | $1,668,956,912 | $412,857,333 | $443,821,179 | $12,624,412 | $1,696,668,867 |
Investment Valuation
All investments are categorized as Level 1 under the Fair Value Hierarchy. The inputs or methodology used for valuing securities may not be an indication of the risk associated with investing in those securities. For more information on valuation inputs please refer to the Investment Valuation section in the accompanying Notes to Financial Statements.
See accompanying notes which are an integral part of the financial statements.
Fidelity Freedom K® Income Fund
Financial Statements
Statement of Assets and Liabilities
| | | September 30, 2016 (Unaudited) |
| Assets | | |
| Investment in securities, at value (cost $1,612,356,405) — See accompanying schedule | | $1,696,668,867 |
| Receivable for investments sold | | 11,120,472 |
| Receivable for fund shares sold | | 2,699,973 |
| Total assets | | 1,710,489,312 |
| Liabilities | | |
| Payable for investments purchased | $1,868,546 | |
| Payable for fund shares redeemed | 11,951,779 | |
| Transfer agent fees payable | 66,450 | |
| Total liabilities | | 13,886,775 |
| Net Assets | | $1,696,602,537 |
| Net Assets consist of: | | |
| Paid in capital | | $1,611,449,329 |
| Undistributed net investment income | | 2,325,727 |
| Accumulated undistributed net realized gain (loss) on investments | | (1,484,981) |
| Net unrealized appreciation (depreciation) on investments | | 84,312,462 |
| Net Assets, for 142,998,160 shares outstanding | | $1,696,602,537 |
| Net Asset Value, offering price and redemption price per share ($1,696,602,537 ÷ 142,998,160 shares) | | $11.86 |
See accompanying notes which are an integral part of the financial statements.
Statement of Operations
| | | Six months ended September 30, 2016 (Unaudited) |
| Investment Income | | |
| Income distributions from underlying funds | | $12,624,412 |
| Expenses | | |
| Transfer agent fees | $394,688 | |
| Independent trustees' fees and expenses | 3,767 | |
| Total expenses | | 398,455 |
| Net investment income (loss) | | 12,225,957 |
| Realized and Unrealized Gain (Loss) | | |
| Realized gain (loss) on sale of underlying fund shares | 3,877,527 | |
| Capital gain distributions from underlying funds | 313,971 | |
| Total net realized gain (loss) | | 4,191,498 |
| Change in net unrealized appreciation (depreciation) on underlying funds | | 54,798,269 |
| Net gain (loss) | | 58,989,767 |
| Net increase (decrease) in net assets resulting from operations | | $71,215,724 |
See accompanying notes which are an integral part of the financial statements.
Statement of Changes in Net Assets
| | Six months ended September 30, 2016 (Unaudited) | Year ended March 31, 2016 |
| Increase (Decrease) in Net Assets | | |
| Operations | | |
| Net investment income (loss) | $12,225,957 | $34,325,665 |
| Net realized gain (loss) | 4,191,498 | 20,776,931 |
| Change in net unrealized appreciation (depreciation) | 54,798,269 | (64,108,598) |
| Net increase (decrease) in net assets resulting from operations | 71,215,724 | (9,006,002) |
| Distributions to shareholders from net investment income | (12,216,783) | (34,945,993) |
| Distributions to shareholders from net realized gain | (8,046,912) | (36,668,261) |
| Total distributions | (20,263,695) | (71,614,254) |
| Share transactions | | |
| Proceeds from sales of shares | 256,642,321 | 430,129,000 |
| Reinvestment of distributions | 20,263,696 | 71,614,254 |
| Cost of shares redeemed | (300,139,434) | (759,555,039) |
| Net increase (decrease) in net assets resulting from share transactions | (23,233,417) | (257,811,785) |
| Total increase (decrease) in net assets | 27,718,612 | (338,432,041) |
| Net Assets | | |
| Beginning of period | 1,668,883,925 | 2,007,315,966 |
| End of period | $1,696,602,537 | $1,668,883,925 |
| Other Information | | |
| Undistributed net investment income end of period | $2,325,727 | $2,316,553 |
| Shares | | |
| Sold | 22,005,459 | 37,030,344 |
| Issued in reinvestment of distributions | 1,749,663 | 6,161,179 |
| Redeemed | (25,739,533) | (65,298,695) |
| Net increase (decrease) | (1,984,411) | (22,107,172) |
See accompanying notes which are an integral part of the financial statements.
Financial Highlights — Fidelity Freedom K Income Fund
| | Six months ended (Unaudited) September 30, | Years ended March 31, | | | | |
| | 2016 | 2016 | 2015 | 2014 | 2013 | 2012 |
| Selected Per–Share Data | | | | | | |
| Net asset value, beginning of period | $11.51 | $12.01 | $12.09 | $11.88 | $11.66 | $11.64 |
| Income from Investment Operations | | | | | | |
| Net investment income (loss)A | .09 | .22 | .22 | .17 | .16 | .19 |
| Net realized and unrealized gain (loss) | .40 | (.26) | .28 | .31 | .39 | .21 |
| Total from investment operations | .49 | (.04) | .50 | .48 | .55 | .40 |
| Distributions from net investment income | (.09) | (.23) | (.21) | (.16) | (.16) | (.18) |
| Distributions from net realized gain | (.06) | (.23) | (.37) | (.10) | (.17) | (.19) |
| Total distributions | (.14)B | (.46) | (.58) | (.27)C | (.33) | (.38)D |
| Net asset value, end of period | $11.86 | $11.51 | $12.01 | $12.09 | $11.88 | $11.66 |
| Total ReturnE | 4.30% | (.30)% | 4.28% | 4.07% | 4.77% | 3.50% |
| Ratios to Average Net AssetsF,G | | | | | | |
| Expenses before reductions | .05%H | .05% | .05% | .05% | .05% | .05% |
| Expenses net of fee waivers, if any | .05%H | .05% | .05% | .05% | .05% | .05% |
| Expenses net of all reductions | .05%H | .05% | .05% | .05% | .05% | .05% |
| Net investment income (loss) | 1.46%H | 1.92% | 1.83% | 1.41% | 1.37% | 1.67% |
| Supplemental Data | | | | | | |
| Net assets, end of period (000 omitted) | $1,696,603 | $1,668,884 | $2,007,316 | $1,510,603 | $1,565,723 | $1,281,332 |
| Portfolio turnover rateF | 49%H | 23% | 32%I | 40% | 17% | 20% |
A Calculated based on average shares outstanding during the period.
B Total distributions of $.14 per share is comprised of distributions from net investment income of $.085 and distributions from net realized gain of $.056 per share.
C Total distributions of $.27 per share is comprised of distributions from net investment income of $.164 and distributions from net realized gain of $.102 per share.
D Total distributions of $.38 per share is comprised of distributions from net investment income of $.182 and distributions from net realized gain of $.194 per share.
E Total returns for periods of less than one year are not annualized.
F Amounts do not include the activity of the Underlying Funds.
G Expense ratios reflect operating expenses of the Fund. Expenses before reductions do not reflect amounts reimbursed by the investment adviser or reductions from expense offset arrangements and do not represent the amount paid by the Fund during periods when reimbursements or reductions occur. Expenses net of fee waivers reflect expenses after reimbursement by the investment adviser but prior to reductions from expense offset arrangements. Expenses net of all reductions represent the net expenses paid by the Fund but do not include expenses of the underlying funds in which the Fund invests.
H Annualized
I The portfolio turnover rate does not include the assets acquired in the merger.
See accompanying notes which are an integral part of the financial statements.
Fidelity Freedom K® 2005 Fund
Investment Summary (Unaudited)
The information in the following tables is based on the direct investments of the Fund.
Top Holdings as of September 30, 2016
| | % of fund's net assets | % of fund's net assets 6 months ago |
| Fidelity Series Investment Grade Bond Fund Class F | 33.3 | 34.5 |
| Fidelity Series Government Money Market Fund Class F 0.29% | 12.5 | 0.0 |
| Fidelity Series Short-Term Credit Fund Class F | 6.6 | 6.1 |
| Fidelity Series Emerging Markets Fund Class F | 6.0 | 5.5 |
| Fidelity Series Equity-Income Fund Class F | 3.8 | 3.9 |
| Fidelity Series International Value Fund Class F | 3.7 | 3.3 |
| Fidelity Series International Growth Fund Class F | 3.7 | 3.4 |
| Fidelity Series Inflation-Protected Bond Index Fund Class F | 3.5 | 3.3 |
| Fidelity Series Growth Company Fund Class F | 3.3 | 3.6 |
| Fidelity Series High Income Fund Class F | 2.9 | 3.0 |
| | 79.3 | 66.6 |
Asset Allocation (% of fund's net assets)
| Period end |
| | Domestic Equity Funds | 25.6% |
| | International Equity Funds | 14.2% |
| | Bond Funds | 41.1% |
| | Short-Term Funds | 19.1% |

| Six months ago |
| | Domestic Equity Funds | 27.4% |
| | International Equity Funds | 13.0% |
| | Bond Funds | 42.2% |
| | Short-Term Funds | 17.4% |

Domestic Equity Funds category includes Fidelity Series Commodity Strategy Fund which invests in commodity-related investments.
Percentages shown as 0.0% may reflect amounts less than 0.05%.
Fidelity Freedom K® 2005 Fund
Investments September 30, 2016 (Unaudited)
Showing Percentage of Net Assets
| Domestic Equity Funds - 25.6% | | | |
| | | Shares | Value |
| Fidelity Series 100 Index Fund Class F (a) | | 248,238 | $3,544,835 |
| Fidelity Series 1000 Value Index Fund Class F (a) | | 197,188 | 2,204,563 |
| Fidelity Series All-Sector Equity Fund Class F (a) | | 497,887 | 6,686,622 |
| Fidelity Series Blue Chip Growth Fund Class F (a) | | 696,906 | 8,174,704 |
| Fidelity Series Commodity Strategy Fund Class F (a)(b) | | 1,338,238 | 7,159,574 |
| Fidelity Series Equity-Income Fund Class F (a) | | 1,316,534 | 16,298,688 |
| Fidelity Series Growth & Income Fund Class F (a) | | 891,559 | 11,955,807 |
| Fidelity Series Growth Company Fund Class F (a) | | 1,031,468 | 13,852,616 |
| Fidelity Series Intrinsic Opportunities Fund Class F (a) | | 693,897 | 10,436,206 |
| Fidelity Series Opportunistic Insights Fund Class F (a) | | 514,906 | 7,898,662 |
| Fidelity Series Real Estate Equity Fund Class F (a) | | 100,799 | 1,388,000 |
| Fidelity Series Small Cap Discovery Fund Class F (a) | | 203,827 | 2,150,377 |
| Fidelity Series Small Cap Opportunities Fund Class F (a) | | 487,735 | 6,452,733 |
| Fidelity Series Stock Selector Large Cap Value Fund Class F (a) | | 892,753 | 10,543,413 |
| TOTAL DOMESTIC EQUITY FUNDS | | | |
| (Cost $90,248,353) | | | 108,746,800 |
|
| International Equity Funds - 14.2% | | | |
| Fidelity Series Emerging Markets Fund Class F (a) | | 1,514,405 | 25,563,158 |
| Fidelity Series International Growth Fund Class F (a) | | 1,101,896 | 15,470,616 |
| Fidelity Series International Small Cap Fund Class F (a) | | 227,742 | 3,555,060 |
| Fidelity Series International Value Fund Class F (a) | | 1,633,470 | 15,534,300 |
| TOTAL INTERNATIONAL EQUITY FUNDS | | | |
| (Cost $52,048,384) | | | 60,123,134 |
|
| Bond Funds - 41.1% | | | |
| Fidelity Series Emerging Markets Debt Fund Class F (a) | | 278,710 | 2,887,435 |
| Fidelity Series Floating Rate High Income Fund Class F (a) | | 113,910 | 1,073,034 |
| Fidelity Series High Income Fund Class F (a) | | 1,311,653 | 12,277,071 |
| Fidelity Series Inflation-Protected Bond Index Fund Class F (a) | | 1,466,591 | 14,783,233 |
| Fidelity Series Investment Grade Bond Fund Class F (a) | | 12,165,324 | 141,117,758 |
| Fidelity Series Long-Term Treasury Bond Index Fund Class F (a) | | 16,185 | 156,186 |
| Fidelity Series Real Estate Income Fund Class F (a) | | 187,097 | 2,099,228 |
| TOTAL BOND FUNDS | | | |
| (Cost $171,590,929) | | | 174,393,945 |
|
| Short-Term Funds - 19.1% | | | |
| Fidelity Series Government Money Market Fund Class F 0.29% (a)(c) | | 52,853,984 | 52,853,984 |
| Fidelity Series Short-Term Credit Fund Class F (a) | | 2,793,663 | 28,020,438 |
| TOTAL SHORT-TERM FUNDS | | | |
| (Cost $80,758,630) | | | 80,874,422 |
| TOTAL INVESTMENT PORTFOLIO - 100.0% | | | |
| (Cost $394,646,296) | | | 424,138,301 |
| NET OTHER ASSETS (LIABILITIES) - 0.0% | | | (16,786) |
| NET ASSETS - 100% | | | $424,121,515 |
Legend
(a) Affiliated Fund
(b) Non-income producing
(c) The rate quoted is the annualized seven-day yield of the fund at period end.
Affiliated Underlying Funds
Information regarding the Fund's fiscal year to date purchases and sales of the affiliated Underlying Funds and income earned by the Fund from investments in affiliated Underlying Funds is as follows:
| Affiliate | Value, beginning of period | Purchases | Sales Proceeds | Dividend Income | Value, end of period |
| Fidelity Investments Money Market Portfolio Class F | $47,441,367 | $1,314,063 | $48,755,430 | $20,430 | $-- |
| Fidelity Series 100 Index Fund Class F | 3,866,478 | 408,048 | 956,982 | -- | 3,544,835 |
| Fidelity Series 1000 Value Index Fund Class F | 2,177,699 | 350,129 | 496,366 | -- | 2,204,563 |
| Fidelity Series All-Sector Equity Fund Class F | 12,192,115 | 966,441 | 7,230,862 | -- | 6,686,622 |
| Fidelity Series Blue Chip Growth Fund Class F | 8,461,024 | 913,368 | 1,858,846 | 23,382 | 8,174,704 |
| Fidelity Series Commodity Strategy Fund Class F | 5,142,672 | 2,399,656 | 811,401 | -- | 7,159,574 |
| Fidelity Series Emerging Markets Debt Fund Class F | 2,628,093 | 313,364 | 290,383 | 76,373 | 2,887,435 |
| Fidelity Series Emerging Markets Fund Class F | 22,876,423 | 2,235,923 | 2,596,679 | -- | 25,563,158 |
| Fidelity Series Equity-Income Fund Class F | 16,387,413 | 1,939,744 | 3,249,918 | 153,309 | 16,298,688 |
| Fidelity Series Floating Rate High Income Fund Class F | 1,043,112 | 122,119 | 142,195 | 23,763 | 1,073,034 |
| Fidelity Series Government Money Market Fund Class F 0.29% | -- | 55,760,415 | 2,906,430 | 48,167 | 52,853,984 |
| Fidelity Series Growth & Income Fund Class F | 12,558,621 | 1,447,325 | 2,985,114 | 109,003 | 11,955,807 |
| Fidelity Series Growth Company Fund Class F | 14,955,602 | 376,288 | 2,841,461 | -- | 13,852,616 |
| Fidelity Series High Income Fund Class F | 12,459,563 | 499,412 | 1,622,535 | 352,251 | 12,277,071 |
| Fidelity Series Inflation-Protected Bond Index Fund Class F | 13,841,584 | 2,207,452 | 1,536,169 | 16,459 | 14,783,233 |
| Fidelity Series International Growth Fund Class F | 14,098,754 | 3,050,079 | 2,426,419 | -- | 15,470,616 |
| Fidelity Series International Small Cap Fund Class F | 3,474,793 | 705,361 | 747,164 | -- | 3,555,060 |
| Fidelity Series International Value Fund Class F | 13,990,554 | 3,448,638 | 2,505,563 | -- | 15,534,300 |
| Fidelity Series Intrinsic Opportunities Fund Class F | 9,554,408 | 1,061,467 | 783,786 | 79,391 | 10,436,206 |
| Fidelity Series Investment Grade Bond Fund Class F | 144,290,219 | 15,626,329 | 22,361,590 | 1,817,789 | 141,117,758 |
| Fidelity Series Long-Term Treasury Bond Index Fund Class F | -- | 162,535 | 872 | 720 | 156,186 |
| Fidelity Series Opportunistic Insights Fund Class F | 8,161,330 | 860,969 | 1,534,173 | -- | 7,898,662 |
| Fidelity Series Real Estate Equity Fund Class F | 1,505,283 | 235,644 | 320,047 | 14,139 | 1,388,000 |
| Fidelity Series Real Estate Income Fund Class F | 2,045,888 | 319,930 | 328,249 | 53,730 | 2,099,228 |
| Fidelity Series Short-Term Credit Fund Class F | 25,534,104 | 6,216,887 | 3,838,103 | 145,821 | 28,020,438 |
| Fidelity Series Small Cap Discovery Fund Class F | 2,132,879 | 234,389 | 337,139 | 3,788 | 2,150,377 |
| Fidelity Series Small Cap Opportunities Fund Class F | 6,564,448 | 715,937 | 1,385,753 | 23,267 | 6,452,733 |
| Fidelity Series Stock Selector Large Cap Value Fund Class F | 10,852,061 | 1,209,951 | 2,237,205 | -- | 10,543,413 |
| Total | $418,236,487 | $105,101,863 | $117,086,834 | $2,961,782 | $424,138,301 |
Investment Valuation
All investments are categorized as Level 1 under the Fair Value Hierarchy. The inputs or methodology used for valuing securities may not be an indication of the risk associated with investing in those securities. For more information on valuation inputs please refer to the Investment Valuation section in the accompanying Notes to Financial Statements.
See accompanying notes which are an integral part of the financial statements.
Fidelity Freedom K® 2005 Fund
Financial Statements
Statement of Assets and Liabilities
| | | September 30, 2016 (Unaudited) |
| Assets | | |
| Investment in securities, at value (cost $394,646,296) — See accompanying schedule | | $424,138,301 |
| Receivable for investments sold | | 9,709,214 |
| Receivable for fund shares sold | | 562,227 |
| Total assets | | 434,409,742 |
| Liabilities | | |
| Payable for investments purchased | $143,880 | |
| Payable for fund shares redeemed | 10,127,344 | |
| Transfer agent fees payable | 17,003 | |
| Total liabilities | | 10,288,227 |
| Net Assets | | $424,121,515 |
| Net Assets consist of: | | |
| Paid in capital | | $392,176,579 |
| Undistributed net investment income | | 2,856,778 |
| Accumulated undistributed net realized gain (loss) on investments | | (403,847) |
| Net unrealized appreciation (depreciation) on investments | | 29,492,005 |
| Net Assets, for 32,618,496 shares outstanding | | $424,121,515 |
| Net Asset Value, offering price and redemption price per share ($424,121,515 ÷ 32,618,496 shares) | | $13.00 |
See accompanying notes which are an integral part of the financial statements.
Statement of Operations
| | | Six months ended September 30, 2016 (Unaudited) |
| Investment Income | | |
| Income distributions from underlying funds | | $2,961,782 |
| Expenses | | |
| Transfer agent fees | $99,036 | |
| Independent trustees' fees and expenses | 940 | |
| Total expenses | | 99,976 |
| Net investment income (loss) | | 2,861,806 |
| Realized and Unrealized Gain (Loss) | | |
| Realized gain (loss) on sale of underlying fund shares | 1,357,046 | |
| Capital gain distributions from underlying funds | 107,359 | |
| Total net realized gain (loss) | | 1,464,405 |
| Change in net unrealized appreciation (depreciation) on underlying funds | | 16,529,733 |
| Net gain (loss) | | 17,994,138 |
| Net increase (decrease) in net assets resulting from operations | | $20,855,944 |
See accompanying notes which are an integral part of the financial statements.
Statement of Changes in Net Assets
| | Six months ended September 30, 2016 (Unaudited) | Year ended March 31, 2016 |
| Increase (Decrease) in Net Assets | | |
| Operations | | |
| Net investment income (loss) | $2,861,806 | $8,453,948 |
| Net realized gain (loss) | 1,464,405 | 7,865,184 |
| Change in net unrealized appreciation (depreciation) | 16,529,733 | (21,012,911) |
| Net increase (decrease) in net assets resulting from operations | 20,855,944 | (4,693,779) |
| Distributions to shareholders from net investment income | (1,704,109) | (8,122,380) |
| Distributions to shareholders from net realized gain | (3,761,461) | (11,743,720) |
| Total distributions | (5,465,570) | (19,866,100) |
| Share transactions | | |
| Proceeds from sales of shares | 81,779,998 | 132,374,912 |
| Reinvestment of distributions | 5,465,569 | 19,866,100 |
| Cost of shares redeemed | (96,733,477) | (180,036,215) |
| Net increase (decrease) in net assets resulting from share transactions | (9,487,910) | (27,795,203) |
| Total increase (decrease) in net assets | 5,902,464 | (52,355,082) |
| Net Assets | | |
| Beginning of period | 418,219,051 | 470,574,133 |
| End of period | $424,121,515 | $418,219,051 |
| Other Information | | |
| Undistributed net investment income end of period | $2,856,778 | $1,699,081 |
| Shares | | |
| Sold | 6,450,049 | 10,374,456 |
| Issued in reinvestment of distributions | 440,061 | 1,559,466 |
| Redeemed | (7,610,621) | (14,132,251) |
| Net increase (decrease) | (720,511) | (2,198,329) |
See accompanying notes which are an integral part of the financial statements.
Financial Highlights — Fidelity Freedom K 2005 Fund
| | Six months ended (Unaudited) September 30, | Years ended March 31, | | | | |
| | 2016 | 2016 | 2015 | 2014 | 2013 | 2012 |
| Selected Per–Share Data | | | | | | |
| Net asset value, beginning of period | $12.54 | $13.24 | $13.62 | $13.00 | $12.65 | $12.82 |
| Income from Investment Operations | | | | | | |
| Net investment income (loss)A | .09 | .25 | .24 | .19 | .19 | .21 |
| Net realized and unrealized gain (loss) | .54 | (.37) | .44 | .64 | .56 | .13 |
| Total from investment operations | .63 | (.12) | .68 | .83 | .75 | .34 |
| Distributions from net investment income | (.05) | (.24) | (.41) | (.03) | (.18) | (.18) |
| Distributions from net realized gain | (.12) | (.34) | (.66) | (.19) | (.21) | (.33) |
| Total distributions | (.17) | (.58) | (1.06)B | (.21)C | (.40)D | (.51) |
| Net asset value, end of period | $13.00 | $12.54 | $13.24 | $13.62 | $13.00 | $12.65 |
| Total ReturnE | 5.09% | (.94)% | 5.33% | 6.48% | 6.03% | 2.83% |
| Ratios to Average Net AssetsF,G | | | | | | |
| Expenses before reductions | .05%H | .05% | .05% | .05% | .05% | .05% |
| Expenses net of fee waivers, if any | .05%H | .05% | .05% | .05% | .05% | .05% |
| Expenses net of all reductions | .05%H | .05% | .05% | .05% | .05% | .05% |
| Net investment income (loss) | 1.36%H | 1.93% | 1.85% | 1.42% | 1.46% | 1.66% |
| Supplemental Data | | | | | | |
| Net assets, end of period (000 omitted) | $424,122 | $418,219 | $470,574 | $486,980 | $496,064 | $388,009 |
| Portfolio turnover rateF | 50%H | 27% | 34% | 55% | 29% | 37% |
A Calculated based on average shares outstanding during the period.
B Total distributions of $1.06 per share is comprised of distributions from net investment income of $.406 and distributions from net realized gain of $.658 per share.
C Total distributions of $.21 per share is comprised of distributions from net investment income of $.026 and distributions from net realized gain of $.185 per share.
D Total distributions of $.40 per share is comprised of distributions from net investment income of $.182 and distributions from net realized gain of $.213 per share.
E Total returns for periods of less than one year are not annualized.
F Amounts do not include the activity of the Underlying Funds.
G Expense ratios reflect operating expenses of the Fund. Expenses before reductions do not reflect amounts reimbursed by the investment adviser or reductions from expense offset arrangements and do not represent the amount paid by the Fund during periods when reimbursements or reductions occur. Expenses net of fee waivers reflect expenses after reimbursement by the investment adviser but prior to reductions from expense offset arrangements. Expenses net of all reductions represent the net expenses paid by the Fund but do not include expenses of the underlying funds in which the Fund invests.
H Annualized
See accompanying notes which are an integral part of the financial statements.
Fidelity Freedom K® 2010 Fund
Investment Summary (Unaudited)
The information in the following tables is based on the direct investments of the Fund.
Top Holdings as of September 30, 2016
| | % of fund's net assets | % of fund's net assets 6 months ago |
| Fidelity Series Investment Grade Bond Fund Class F | 29.8 | 31.5 |
| Fidelity Series Government Money Market Fund Class F 0.29% | 9.1 | 0.0 |
| Fidelity Series Emerging Markets Fund Class F | 6.9 | 6.3 |
| Fidelity Series Equity-Income Fund Class F | 4.8 | 4.9 |
| Fidelity Series Short-Term Credit Fund Class F | 4.8 | 4.2 |
| Fidelity Series International Value Fund Class F | 4.6 | 4.3 |
| Fidelity Series International Growth Fund Class F | 4.6 | 4.3 |
| Fidelity Series Growth Company Fund Class F | 4.2 | 4.4 |
| Fidelity Series Growth & Income Fund Class F | 3.6 | 3.7 |
| Fidelity Series Stock Selector Large Cap Value Fund Class F | 3.1 | 3.2 |
| | 75.5 | 66.8 |
Asset Allocation (% of fund's net assets)
| Period end |
| | Domestic Equity Funds | 31.9% |
| | International Equity Funds | 17.1% |
| | Bond Funds | 37.1% |
| | Short-Term Funds | 13.9% |

| Six months ago |
| | Domestic Equity Funds | 33.6% |
| | International Equity Funds | 15.9% |
| | Bond Funds | 38.5% |
| | Short-Term Funds | 12.0% |

Domestic Equity Funds category includes Fidelity Series Commodity Strategy Fund which invests in commodity-related investments.
Percentages shown as 0.0% may reflect amounts less than 0.05%.
Fidelity Freedom K® 2010 Fund
Investments September 30, 2016 (Unaudited)
Showing Percentage of Net Assets
| Domestic Equity Funds - 31.9% | | | |
| | | Shares | Value |
| Fidelity Series 100 Index Fund Class F (a) | | 2,090,086 | $29,846,430 |
| Fidelity Series 1000 Value Index Fund Class F (a) | | 1,864,214 | 20,841,917 |
| Fidelity Series All-Sector Equity Fund Class F (a) | | 4,191,202 | 56,287,837 |
| Fidelity Series Blue Chip Growth Fund Class F (a) | | 5,935,148 | 69,619,286 |
| Fidelity Series Commodity Strategy Fund Class F (a)(b) | | 8,543,698 | 45,708,787 |
| Fidelity Series Equity-Income Fund Class F (a) | | 11,013,164 | 136,342,968 |
| Fidelity Series Growth & Income Fund Class F (a) | | 7,566,530 | 101,467,172 |
| Fidelity Series Growth Company Fund Class F (a) | | 8,795,792 | 118,127,489 |
| Fidelity Series Intrinsic Opportunities Fund Class F (a) | | 5,633,621 | 84,729,657 |
| Fidelity Series Opportunistic Insights Fund Class F (a) | | 4,297,840 | 65,928,872 |
| Fidelity Series Real Estate Equity Fund Class F (a) | | 844,755 | 11,632,276 |
| Fidelity Series Small Cap Discovery Fund Class F (a) | | 1,655,962 | 17,470,402 |
| Fidelity Series Small Cap Opportunities Fund Class F (a) | | 4,102,164 | 54,271,630 |
| Fidelity Series Stock Selector Large Cap Value Fund Class F (a) | | 7,439,834 | 87,864,442 |
| TOTAL DOMESTIC EQUITY FUNDS | | | |
| (Cost $726,508,765) | | | 900,139,165 |
|
| International Equity Funds - 17.1% | | | |
| Fidelity Series Emerging Markets Fund Class F (a) | | 11,606,793 | 195,922,667 |
| Fidelity Series International Growth Fund Class F (a) | | 9,178,699 | 128,868,933 |
| Fidelity Series International Small Cap Fund Class F (a) | | 1,897,221 | 29,615,626 |
| Fidelity Series International Value Fund Class F (a) | | 13,605,781 | 129,390,974 |
| TOTAL INTERNATIONAL EQUITY FUNDS | | | |
| (Cost $408,928,661) | | | 483,798,200 |
|
| Bond Funds - 37.1% | | | |
| Fidelity Series Emerging Markets Debt Fund Class F (a) | | 1,833,496 | 18,995,017 |
| Fidelity Series Floating Rate High Income Fund Class F (a) | | 752,997 | 7,093,235 |
| Fidelity Series High Income Fund Class F (a) | | 9,323,082 | 87,264,043 |
| Fidelity Series Inflation-Protected Bond Index Fund Class F (a) | | 7,811,949 | 78,744,441 |
| Fidelity Series Investment Grade Bond Fund Class F (a) | | 72,668,565 | 842,955,355 |
| Fidelity Series Long-Term Treasury Bond Index Fund Class F (a) | | 89,758 | 866,164 |
| Fidelity Series Real Estate Income Fund Class F (a) | | 1,252,442 | 14,052,395 |
| TOTAL BOND FUNDS | | | |
| (Cost $1,032,613,462) | | | 1,049,970,650 |
|
| Short-Term Funds - 13.9% | | | |
| Fidelity Series Government Money Market Fund Class F 0.29% (a)(c) | | 258,560,310 | 258,560,310 |
| Fidelity Series Short-Term Credit Fund Class F (a) | | 13,493,415 | 135,338,951 |
| TOTAL SHORT-TERM FUNDS | | | |
| (Cost $393,348,280) | | | 393,899,261 |
| TOTAL INVESTMENT PORTFOLIO - 100.0% | | | |
| (Cost $2,561,399,168) | | | 2,827,807,276 |
| NET OTHER ASSETS (LIABILITIES) - 0.0% | | | (111,430) |
| NET ASSETS - 100% | | | $2,827,695,846 |
Legend
(a) Affiliated Fund
(b) Non-income producing
(c) The rate quoted is the annualized seven-day yield of the fund at period end.
Affiliated Underlying Funds
Information regarding the Fund's fiscal year to date purchases and sales of the affiliated Underlying Funds and income earned by the Fund from investments in affiliated Underlying Funds is as follows:
| Affiliate | Value, beginning of period | Purchases | Sales Proceeds | Dividend Income | Value, end of period |
| Fidelity Investments Money Market Portfolio Class F | $229,786,383 | $17,582,697 | $247,369,080 | $102,712 | $-- |
| Fidelity Series 100 Index Fund Class F | 33,618,144 | 611,027 | 6,302,958 | -- | 29,846,430 |
| Fidelity Series 1000 Value Index Fund Class F | 18,934,382 | 3,471,501 | 3,021,138 | -- | 20,841,917 |
| Fidelity Series All-Sector Equity Fund Class F | 105,999,010 | 1,978,966 | 58,121,604 | -- | 56,287,837 |
| Fidelity Series Blue Chip Growth Fund Class F | 73,553,572 | 1,494,193 | 10,885,424 | 187,855 | 69,619,286 |
| Fidelity Series Commodity Strategy Fund Class F | 36,321,322 | 10,057,582 | 3,542,506 | -- | 45,708,787 |
| Fidelity Series Emerging Markets Debt Fund Class F | 18,470,330 | 779,632 | 1,877,402 | 520,192 | 18,995,017 |
| Fidelity Series Emerging Markets Fund Class F | 184,968,826 | 2,747,209 | 15,142,801 | -- | 195,922,667 |
| Fidelity Series Equity-Income Fund Class F | 142,482,732 | 3,811,182 | 20,259,592 | 1,316,361 | 136,342,968 |
| Fidelity Series Floating Rate High Income Fund Class F | 7,207,962 | 350,269 | 805,478 | 159,707 | 7,093,235 |
| Fidelity Series Government Money Market Fund Class F 0.29% | -- | 272,974,866 | 14,414,558 | 236,407 | 258,560,310 |
| Fidelity Series Growth & Income Fund Class F | 109,195,299 | 2,892,747 | 18,452,037 | 944,419 | 101,467,172 |
| Fidelity Series Growth Company Fund Class F | 130,493,734 | 679,214 | 24,716,891 | -- | 118,127,489 |
| Fidelity Series High Income Fund Class F | 87,513,420 | 2,475,479 | 9,370,657 | 2,475,480 | 87,264,043 |
| Fidelity Series Inflation-Protected Bond Index Fund Class F | 77,812,927 | 7,235,369 | 7,770,148 | 90,229 | 78,744,441 |
| Fidelity Series International Growth Fund Class F | 126,709,751 | 13,580,170 | 17,827,721 | -- | 128,868,933 |
| Fidelity Series International Small Cap Fund Class F | 30,968,099 | 2,498,989 | 4,841,743 | -- | 29,615,626 |
| Fidelity Series International Value Fund Class F | 125,747,577 | 17,102,857 | 18,550,510 | -- | 129,390,974 |
| Fidelity Series Intrinsic Opportunities Fund Class F | 82,994,777 | 1,956,302 | 5,234,389 | 648,108 | 84,729,657 |
| Fidelity Series Investment Grade Bond Fund Class F | 924,392,787 | 25,106,787 | 128,704,494 | 11,102,375 | 842,955,355 |
| Fidelity Series Long-Term Treasury Bond Index Fund Class F | -- | 951,299 | 52,870 | 4,069 | 866,164 |
| Fidelity Series Opportunistic Insights Fund Class F | 70,962,150 | 1,176,071 | 9,660,232 | -- | 65,928,872 |
| Fidelity Series Real Estate Equity Fund Class F | 13,087,907 | 986,231 | 2,208,872 | 115,938 | 11,632,276 |
| Fidelity Series Real Estate Income Fund Class F | 14,436,232 | 1,094,142 | 1,920,601 | 359,988 | 14,052,395 |
| Fidelity Series Short-Term Credit Fund Class F | 123,549,028 | 24,692,974 | 13,428,440 | 711,011 | 135,338,951 |
| Fidelity Series Small Cap Discovery Fund Class F | 18,393,553 | 598,776 | 2,512,613 | 31,369 | 17,470,402 |
| Fidelity Series Small Cap Opportunities Fund Class F | 57,074,428 | 1,107,017 | 8,547,088 | 186,739 | 54,271,630 |
| Fidelity Series Stock Selector Large Cap Value Fund Class F | 94,364,309 | 1,695,122 | 14,270,752 | -- | 87,864,442 |
| Total | $2,939,038,641 | $421,688,670 | $669,812,599 | $19,192,959 | $2,827,807,276 |
Investment Valuation
All investments are categorized as Level 1 under the Fair Value Hierarchy. The inputs or methodology used for valuing securities may not be an indication of the risk associated with investing in those securities. For more information on valuation inputs please refer to the Investment Valuation section in the accompanying Notes to Financial Statements.
See accompanying notes which are an integral part of the financial statements.
Fidelity Freedom K® 2010 Fund
Financial Statements
Statement of Assets and Liabilities
| | | September 30, 2016 (Unaudited) |
| Assets | | |
| Investment in securities, at value (cost $2,561,399,168) — See accompanying schedule | | $2,827,807,276 |
| Receivable for investments sold | | 26,658,938 |
| Receivable for fund shares sold | | 2,470,966 |
| Total assets | | 2,856,937,180 |
| Liabilities | | |
| Payable for investments purchased | $6,829,759 | |
| Payable for fund shares redeemed | 22,300,111 | |
| Transfer agent fees payable | 111,464 | |
| Total liabilities | | 29,241,334 |
| Net Assets | | $2,827,695,846 |
| Net Assets consist of: | | |
| Paid in capital | | $2,530,688,187 |
| Undistributed net investment income | | 18,494,914 |
| Accumulated undistributed net realized gain (loss) on investments | | 12,104,637 |
| Net unrealized appreciation (depreciation) on investments | | 266,408,108 |
| Net Assets, for 217,956,935 shares outstanding | | $2,827,695,846 |
| Net Asset Value, offering price and redemption price per share ($2,827,695,846 ÷ 217,956,935 shares) | | $12.97 |
See accompanying notes which are an integral part of the financial statements.
Statement of Operations
| | | Six months ended September 30, 2016 (Unaudited) |
| Investment Income | | |
| Income distributions from underlying funds | | $19,192,959 |
| Expenses | | |
| Transfer agent fees | $673,231 | |
| Independent trustees' fees and expenses | 6,481 | |
| Total expenses | | 679,712 |
| Net investment income (loss) | | 18,513,247 |
| Realized and Unrealized Gain (Loss) | | |
| Realized gain (loss) on sale of underlying fund shares | 19,139,466 | |
| Capital gain distributions from underlying funds | 830,015 | |
| Total net realized gain (loss) | | 19,969,481 |
| Change in net unrealized appreciation (depreciation) on underlying funds | | 117,753,097 |
| Net gain (loss) | | 137,722,578 |
| Net increase (decrease) in net assets resulting from operations | | $156,235,825 |
See accompanying notes which are an integral part of the financial statements.
Statement of Changes in Net Assets
| | Six months ended September 30, 2016 (Unaudited) | Year ended March 31, 2016 |
| Increase (Decrease) in Net Assets | | |
| Operations | | |
| Net investment income (loss) | $18,513,247 | $62,252,779 |
| Net realized gain (loss) | 19,969,481 | 101,354,667 |
| Change in net unrealized appreciation (depreciation) | 117,753,097 | (211,727,331) |
| Net increase (decrease) in net assets resulting from operations | 156,235,825 | (48,119,885) |
| Distributions to shareholders from net investment income | (10,666,845) | (59,172,738) |
| Distributions to shareholders from net realized gain | (35,404,844) | (151,787,996) |
| Total distributions | (46,071,689) | (210,960,734) |
| Share transactions | | |
| Proceeds from sales of shares | 248,324,547 | 562,306,715 |
| Reinvestment of distributions | 46,071,688 | 210,960,734 |
| Cost of shares redeemed | (515,782,709) | (1,244,830,841) |
| Net increase (decrease) in net assets resulting from share transactions | (221,386,474) | (471,563,392) |
| Total increase (decrease) in net assets | (111,222,338) | (730,644,011) |
| Net Assets | | |
| Beginning of period | 2,938,918,184 | 3,669,562,195 |
| End of period | $2,827,695,846 | $2,938,918,184 |
| Other Information | | |
| Undistributed net investment income end of period | $18,494,914 | $10,648,512 |
| Shares | | |
| Sold | 19,657,517 | 43,796,122 |
| Issued in reinvestment of distributions | 3,739,585 | 16,459,688 |
| Redeemed | (40,780,491) | (96,636,322) |
| Net increase (decrease) | (17,383,389) | (36,380,512) |
See accompanying notes which are an integral part of the financial statements.
Financial Highlights — Fidelity Freedom K 2010 Fund
| | Six months ended (Unaudited) September 30, | Years ended March 31, | | | | |
| | 2016 | 2016 | 2015 | 2014 | 2013 | 2012 |
| Selected Per–Share Data | | | | | | |
| Net asset value, beginning of period | $12.49 | $13.50 | $14.21 | $13.39 | $12.93 | $13.12 |
| Income from Investment Operations | | | | | | |
| Net investment income (loss)A | .08 | .25 | .25 | .20 | .21 | .23 |
| Net realized and unrealized gain (loss) | .60 | (.41) | .53 | .90 | .74 | .14 |
| Total from investment operations | .68 | (.16) | .78 | 1.10 | .95 | .37 |
| Distributions from net investment income | (.05) | (.24) | (.46) | (.03) | (.22) | (.20) |
| Distributions from net realized gain | (.16) | (.60) | (1.03) | (.25) | (.27) | (.36) |
| Total distributions | (.20)B | (.85)C | (1.49) | (.28) | (.49) | (.56) |
| Net asset value, end of period | $12.97 | $12.49 | $13.50 | $14.21 | $13.39 | $12.93 |
| Total ReturnD | 5.55% | (1.26)% | 5.96% | 8.34% | 7.53% | 3.08% |
| Ratios to Average Net AssetsE,F | | | | | | |
| Expenses before reductions | .05%G | .05% | .05% | .05% | .05% | .05% |
| Expenses net of fee waivers, if any | .05%G | .05% | .05% | .05% | .05% | .05% |
| Expenses net of all reductions | .05%G | .05% | .05% | .05% | .05% | .05% |
| Net investment income (loss) | 1.29%G | 1.93% | 1.88% | 1.48% | 1.65% | 1.85% |
| Supplemental Data | | | | | | |
| Net assets, end of period (000 omitted) | $2,827,696 | $2,938,918 | $3,669,562 | $4,337,964 | $4,699,784 | $4,130,786 |
| Portfolio turnover rateE | 29%G | 19% | 20% | 39% | 30% | 28% |
A Calculated based on average shares outstanding during the period.
B Total distributions of $.20 per share is comprised of distributions from net investment income of $.047 and distributions from net realized gain of $.156 per share.
C Total distributions of $.85 per share is comprised of distributions from net investment income of $.244 and distributions from net realized gain of $.603 per share.
D Total returns for periods of less than one year are not annualized.
E Amounts do not include the activity of the Underlying Funds.
F Expense ratios reflect operating expenses of the Fund. Expenses before reductions do not reflect amounts reimbursed by the investment adviser or reductions from expense offset arrangements and do not represent the amount paid by the Fund during periods when reimbursements or reductions occur. Expenses net of fee waivers reflect expenses after reimbursement by the investment adviser but prior to reductions from expense offset arrangements. Expenses net of all reductions represent the net expenses paid by the Fund but do not include expenses of the underlying funds in which the Fund invests.
G Annualized
See accompanying notes which are an integral part of the financial statements.
Fidelity Freedom K® 2015 Fund
Investment Summary (Unaudited)
The information in the following tables is based on the direct investments of the Fund.
Top Holdings as of September 30, 2016
| | % of fund's net assets | % of fund's net assets 6 months ago |
| Fidelity Series Investment Grade Bond Fund Class F | 26.2 | 28.5 |
| Fidelity Series Emerging Markets Fund Class F | 7.5 | 6.9 |
| Fidelity Series Government Money Market Fund Class F 0.29% | 6.1 | 0.0 |
| Fidelity Series Equity-Income Fund Class F | 5.7 | 5.8 |
| Fidelity Series International Value Fund Class F | 5.5 | 5.2 |
| Fidelity Series International Growth Fund Class F | 5.5 | 5.2 |
| Fidelity Series Growth Company Fund Class F | 5.1 | 5.3 |
| Fidelity Series Growth & Income Fund Class F | 4.3 | 4.4 |
| Fidelity Series Stock Selector Large Cap Value Fund Class F | 3.7 | 3.8 |
| Fidelity Series Intrinsic Opportunities Fund Class F | 3.6 | 3.3 |
| | 73.2 | 68.4 |
Asset Allocation (% of fund's net assets)
| Period end |
| | Domestic Equity Funds | 38.2% |
| | International Equity Funds | 19.8% |
| | Bond Funds | 32.7% |
| | Short-Term Funds | 9.3% |

| Six months ago |
| | Domestic Equity Funds | 39.7% |
| | International Equity Funds | 18.6% |
| | Bond Funds | 34.7% |
| | Short-Term Funds | 7.0% |

Domestic Equity Funds category includes Fidelity Series Commodity Strategy Fund which invests in commodity-related investments.
Percentages shown as 0.0% may reflect amounts less than 0.05%.
Fidelity Freedom K® 2015 Fund
Investments September 30, 2016 (Unaudited)
Showing Percentage of Net Assets
| Domestic Equity Funds - 38.2% | | | |
| | | Shares | Value |
| Fidelity Series 100 Index Fund Class F (a) | | 4,770,732 | $68,126,050 |
| Fidelity Series 1000 Value Index Fund Class F (a) | | 5,325,789 | 59,542,323 |
| Fidelity Series All-Sector Equity Fund Class F (a) | | 9,567,210 | 128,487,633 |
| Fidelity Series Blue Chip Growth Fund Class F (a) | | 13,529,205 | 158,697,572 |
| Fidelity Series Commodity Strategy Fund Class F (a)(b) | | 16,783,778 | 89,793,211 |
| Fidelity Series Equity-Income Fund Class F (a) | | 24,884,304 | 308,067,686 |
| Fidelity Series Growth & Income Fund Class F (a) | | 17,341,819 | 232,553,794 |
| Fidelity Series Growth Company Fund Class F (a) | | 20,154,822 | 270,679,263 |
| Fidelity Series Intrinsic Opportunities Fund Class F (a) | | 12,808,260 | 192,636,228 |
| Fidelity Series Opportunistic Insights Fund Class F (a) | | 9,710,849 | 148,964,418 |
| Fidelity Series Real Estate Equity Fund Class F (a) | | 1,927,870 | 26,546,766 |
| Fidelity Series Small Cap Discovery Fund Class F (a) | | 3,771,012 | 39,784,174 |
| Fidelity Series Small Cap Opportunities Fund Class F (a) | | 9,229,644 | 122,108,190 |
| Fidelity Series Stock Selector Large Cap Value Fund Class F (a) | | 16,919,281 | 199,816,704 |
| TOTAL DOMESTIC EQUITY FUNDS | | | |
| (Cost $1,680,523,346) | | | 2,045,804,012 |
|
| International Equity Funds - 19.8% | | | |
| Fidelity Series Emerging Markets Fund Class F (a) | | 23,911,207 | 403,621,169 |
| Fidelity Series International Growth Fund Class F (a) | | 20,908,881 | 293,560,688 |
| Fidelity Series International Small Cap Fund Class F (a) | | 4,321,709 | 67,461,880 |
| Fidelity Series International Value Fund Class F (a) | | 30,993,765 | 294,750,702 |
| TOTAL INTERNATIONAL EQUITY FUNDS | | | |
| (Cost $915,955,921) | | | 1,059,394,439 |
|
| Bond Funds - 32.7% | | | |
| Fidelity Series Emerging Markets Debt Fund Class F (a) | | 3,380,840 | 35,025,505 |
| Fidelity Series Floating Rate High Income Fund Class F (a) | | 1,421,910 | 13,394,388 |
| Fidelity Series High Income Fund Class F (a) | | 17,570,102 | 164,456,157 |
| Fidelity Series Inflation-Protected Bond Index Fund Class F (a) | | 10,518,547 | 106,026,950 |
| Fidelity Series Investment Grade Bond Fund Class F (a) | | 120,859,133 | 1,401,965,945 |
| Fidelity Series Long-Term Treasury Bond Index Fund Class F (a) | | 149,682 | 1,444,429 |
| Fidelity Series Real Estate Income Fund Class F (a) | | 2,287,613 | 25,667,022 |
| TOTAL BOND FUNDS | | | |
| (Cost $1,730,995,693) | | | 1,747,980,396 |
|
| Short-Term Funds - 9.3% | | | |
| Fidelity Series Government Money Market Fund Class F 0.29% (a)(c) | | 329,264,085 | 329,264,085 |
| Fidelity Series Short-Term Credit Fund Class F (a) | | 16,951,966 | 170,028,223 |
| TOTAL SHORT-TERM FUNDS | | | |
| (Cost $498,656,055) | | | 499,292,308 |
| TOTAL INVESTMENT PORTFOLIO - 100.0% | | | |
| (Cost $4,826,131,015) | | | 5,352,471,155 |
| NET OTHER ASSETS (LIABILITIES) - 0.0% | | | (211,360) |
| NET ASSETS - 100% | | | $5,352,259,795 |
Legend
(a) Affiliated Fund
(b) Non-income producing
(c) The rate quoted is the annualized seven-day yield of the fund at period end.
Affiliated Underlying Funds
Information regarding the Fund's fiscal year to date purchases and sales of the affiliated Underlying Funds and income earned by the Fund from investments in affiliated Underlying Funds is as follows:
| Affiliate | Value, beginning of period | Purchases | Sales Proceeds | Dividend Income | Value, end of period |
| Fidelity Investments Money Market Portfolio Class F | $254,876,955 | $52,343,724 | $307,220,679 | $122,099 | $-- |
| Fidelity Series 100 Index Fund Class F | 75,295,664 | 1,540,097 | 13,056,088 | -- | 68,126,050 |
| Fidelity Series 1000 Value Index Fund Class F | 42,408,639 | 20,778,130 | 6,922,584 | -- | 59,542,323 |
| Fidelity Series All-Sector Equity Fund Class F | 237,413,523 | 4,726,857 | 128,178,045 | -- | 128,487,633 |
| Fidelity Series Blue Chip Growth Fund Class F | 164,740,280 | 4,258,019 | 22,568,332 | 424,758 | 158,697,572 |
| Fidelity Series Commodity Strategy Fund Class F | 68,626,204 | 22,793,693 | 7,128,427 | -- | 89,793,211 |
| Fidelity Series Emerging Markets Debt Fund Class F | 33,967,677 | 1,524,691 | 3,462,918 | 958,926 | 35,025,505 |
| Fidelity Series Emerging Markets Fund Class F | 381,109,352 | 6,592,118 | 32,290,048 | -- | 403,621,169 |
| Fidelity Series Equity-Income Fund Class F | 319,118,331 | 10,556,154 | 44,892,686 | 2,962,762 | 308,067,686 |
| Fidelity Series Floating Rate High Income Fund Class F | 13,671,101 | 638,742 | 1,561,378 | 302,850 | 13,394,388 |
| Fidelity Series Government Money Market Fund Class F 0.29% | -- | 348,006,261 | 18,742,172 | 298,076 | 329,264,085 |
| Fidelity Series Growth & Income Fund Class F | 244,567,148 | 7,184,418 | 36,884,297 | 2,122,865 | 232,553,794 |
| Fidelity Series Growth Company Fund Class F | 292,169,579 | 2,022,578 | 49,915,305 | -- | 270,679,263 |
| Fidelity Series High Income Fund Class F | 165,258,200 | 4,688,037 | 18,057,314 | 4,687,972 | 164,456,157 |
| Fidelity Series Inflation-Protected Bond Index Fund Class F | 102,736,543 | 11,076,943 | 9,741,207 | 120,322 | 106,026,950 |
| Fidelity Series International Growth Fund Class F | 289,869,678 | 28,586,195 | 39,457,946 | -- | 293,560,688 |
| Fidelity Series International Small Cap Fund Class F | 70,100,053 | 4,942,915 | 9,856,804 | -- | 67,461,880 |
| Fidelity Series International Value Fund Class F | 287,697,295 | 36,701,438 | 41,162,708 | -- | 294,750,702 |
| Fidelity Series Intrinsic Opportunities Fund Class F | 185,844,082 | 5,051,128 | 9,591,502 | 1,473,578 | 192,636,228 |
| Fidelity Series Investment Grade Bond Fund Class F | 1,577,777,099 | 44,053,412 | 257,154,573 | 18,579,687 | 1,401,965,945 |
| Fidelity Series Long-Term Treasury Bond Index Fund Class F | -- | 1,566,462 | 68,318 | 6,779 | 1,444,429 |
| Fidelity Series Opportunistic Insights Fund Class F | 158,937,341 | 3,637,949 | 21,397,554 | -- | 148,964,418 |
| Fidelity Series Real Estate Equity Fund Class F | 29,313,264 | 2,615,990 | 4,850,659 | 266,300 | 26,546,766 |
| Fidelity Series Real Estate Income Fund Class F | 26,401,984 | 2,074,844 | 3,622,706 | 660,690 | 25,667,022 |
| Fidelity Series Short-Term Credit Fund Class F | 136,694,630 | 49,920,404 | 17,252,590 | 887,685 | 170,028,223 |
| Fidelity Series Small Cap Discovery Fund Class F | 41,247,007 | 1,718,770 | 5,420,977 | 71,092 | 39,784,174 |
| Fidelity Series Small Cap Opportunities Fund Class F | 127,829,044 | 2,902,282 | 19,081,028 | 422,226 | 122,108,190 |
| Fidelity Series Stock Selector Large Cap Value Fund Class F | 210,704,484 | 4,593,141 | 29,173,820 | -- | 199,816,704 |
| Total | $5,538,375,157 | $687,095,392 | $1,158,712,665 | $34,368,667 | $5,352,471,155 |
Investment Valuation
All investments are categorized as Level 1 under the Fair Value Hierarchy. The inputs or methodology used for valuing securities may not be an indication of the risk associated with investing in those securities. For more information on valuation inputs please refer to the Investment Valuation section in the accompanying Notes to Financial Statements.
See accompanying notes which are an integral part of the financial statements.
Fidelity Freedom K® 2015 Fund
Financial Statements
Statement of Assets and Liabilities
| | | September 30, 2016 (Unaudited) |
| Assets | | |
| Investment in securities, at value (cost $4,826,131,015) — See accompanying schedule | | $5,352,471,155 |
| Receivable for investments sold | | 64,713,656 |
| Receivable for fund shares sold | | 8,372,407 |
| Total assets | | 5,425,557,218 |
| Liabilities | | |
| Payable for investments purchased | $9,099,523 | |
| Payable for fund shares redeemed | 63,986,479 | |
| Transfer agent fees payable | 211,421 | |
| Total liabilities | | 73,297,423 |
| Net Assets | | $5,352,259,795 |
| Net Assets consist of: | | |
| Paid in capital | | $4,784,613,052 |
| Undistributed net investment income | | 33,117,289 |
| Accumulated undistributed net realized gain (loss) on investments | | 8,189,314 |
| Net unrealized appreciation (depreciation) on investments | | 526,340,140 |
| Net Assets, for 397,203,446 shares outstanding | | $5,352,259,795 |
| Net Asset Value, offering price and redemption price per share ($5,352,259,795 ÷ 397,203,446 shares) | | $13.47 |
See accompanying notes which are an integral part of the financial statements.
Statement of Operations
| | | Six months ended September 30, 2016 (Unaudited) |
| Investment Income | | |
| Income distributions from underlying funds | | $34,368,667 |
| Expenses | | |
| Transfer agent fees | $1,274,230 | |
| Independent trustees' fees and expenses | 12,247 | |
| Total expenses | | 1,286,477 |
| Net investment income (loss) | | 33,082,190 |
| Realized and Unrealized Gain (Loss) | | |
| Realized gain (loss) on sale of underlying fund shares | 23,179,931 | |
| Capital gain distributions from underlying funds | 1,812,822 | |
| Total net realized gain (loss) | | 24,992,753 |
| Change in net unrealized appreciation (depreciation) on underlying funds | | 262,533,337 |
| Net gain (loss) | | 287,526,090 |
| Net increase (decrease) in net assets resulting from operations | | $320,608,280 |
See accompanying notes which are an integral part of the financial statements.
Statement of Changes in Net Assets
| | Six months ended September 30, 2016 (Unaudited) | Year ended March 31, 2016 |
| Increase (Decrease) in Net Assets | | |
| Operations | | |
| Net investment income (loss) | $33,082,190 | $116,865,773 |
| Net realized gain (loss) | 24,992,753 | 184,418,968 |
| Change in net unrealized appreciation (depreciation) | 262,533,337 | (414,123,102) |
| Net increase (decrease) in net assets resulting from operations | 320,608,280 | (112,838,361) |
| Distributions to shareholders from net investment income | (18,207,491) | (112,180,726) |
| Distributions to shareholders from net realized gain | (74,485,177) | (242,398,223) |
| Total distributions | (92,692,668) | (354,578,949) |
| Share transactions | | |
| Proceeds from sales of shares | 617,451,328 | 1,469,640,544 |
| Reinvestment of distributions | 92,692,668 | 354,578,949 |
| Cost of shares redeemed | (1,123,954,276) | (2,539,546,279) |
| Net increase (decrease) in net assets resulting from share transactions | (413,810,280) | (715,326,786) |
| Total increase (decrease) in net assets | (185,894,668) | (1,182,744,096) |
| Net Assets | | |
| Beginning of period | 5,538,154,463 | 6,720,898,559 |
| End of period | $5,352,259,795 | $5,538,154,463 |
| Other Information | | |
| Undistributed net investment income end of period | $33,117,289 | $18,242,590 |
| Shares | | |
| Sold | 47,188,116 | 110,628,308 |
| Issued in reinvestment of distributions | 7,287,159 | 26,687,088 |
| Redeemed | (85,751,496) | (191,038,021) |
| Net increase (decrease) | (31,276,221) | (53,722,625) |
See accompanying notes which are an integral part of the financial statements.
Financial Highlights — Fidelity Freedom K 2015 Fund
| | Six months ended (Unaudited) September 30, | Years ended March 31, | | | | |
| | 2016 | 2016 | 2015 | 2014 | 2013 | 2012 |
| Selected Per–Share Data | | | | | | |
| Net asset value, beginning of period | $12.93 | $13.94 | $14.42 | $13.48 | $12.98 | $13.17 |
| Income from Investment Operations | | | | | | |
| Net investment income (loss)A | .08 | .26 | .27 | .21 | .22 | .24 |
| Net realized and unrealized gain (loss) | .68 | (.48) | .60 | .99 | .75 | .13 |
| Total from investment operations | .76 | (.22) | .87 | 1.20 | .97 | .37 |
| Distributions from net investment income | (.04) | (.25) | (.47) | (.03) | (.21) | (.20) |
| Distributions from net realized gain | (.18) | (.53) | (.89) | (.23) | (.26) | (.36) |
| Total distributions | (.22) | (.79)B | (1.35)C | (.26) | (.47) | (.56) |
| Net asset value, end of period | $13.47 | $12.93 | $13.94 | $14.42 | $13.48 | $12.98 |
| Total ReturnD | 6.01% | (1.67)% | 6.54% | 9.00% | 7.70% | 3.00% |
| Ratios to Average Net AssetsE,F | | | | | | |
| Expenses before reductions | .05%G | .05% | .05% | .05% | .05% | .05% |
| Expenses net of fee waivers, if any | .05%G | .05% | .05% | .05% | .05% | .05% |
| Expenses net of all reductions | .05%G | .05% | .05% | .05% | .05% | .05% |
| Net investment income (loss) | 1.22%G | 1.95% | 1.91% | 1.52% | 1.68% | 1.86% |
| Supplemental Data | | | | | | |
| Net assets, end of period (000 omitted) | $5,352,260 | $5,538,154 | $6,720,899 | $7,225,857 | $7,138,645 | $5,466,181 |
| Portfolio turnover rateE | 25%G | 18% | 22% | 43% | 21% | 23% |
A Calculated based on average shares outstanding during the period.
B Total distributions of $.79 per share is comprised of distributions from net investment income of $.254 and distributions from net realized gain of $.533 per share.
C Total distributions of $1.35 per share is comprised of distributions from net investment income of $.465 and distributions from net realized gain of $.889 per share.
D Total returns for periods of less than one year are not annualized.
E Amounts do not include the activity of the Underlying Funds.
F Expense ratios reflect operating expenses of the Fund. Expenses before reductions do not reflect amounts reimbursed by the investment adviser or reductions from expense offset arrangements and do not represent the amount paid by the Fund during periods when reimbursements or reductions occur. Expenses net of fee waivers reflect expenses after reimbursement by the investment adviser but prior to reductions from expense offset arrangements. Expenses net of all reductions represent the net expenses paid by the Fund but do not include expenses of the underlying funds in which the Fund invests.
G Annualized
See accompanying notes which are an integral part of the financial statements.
Fidelity Freedom K® 2020 Fund
Investment Summary (Unaudited)
The information in the following tables is based on the direct investments of the Fund.
Top Holdings as of September 30, 2016
| | % of fund's net assets | % of fund's net assets 6 months ago |
| Fidelity Series Investment Grade Bond Fund Class F | 23.8 | 24.9 |
| Fidelity Series Emerging Markets Fund Class F | 7.9 | 7.3 |
| Fidelity Series Equity-Income Fund Class F | 6.4 | 6.4 |
| Fidelity Series International Value Fund Class F | 6.1 | 5.8 |
| Fidelity Series International Growth Fund Class F | 6.1 | 5.9 |
| Fidelity Series Growth Company Fund Class F | 5.6 | 5.9 |
| Fidelity Series Growth & Income Fund Class F | 4.8 | 4.9 |
| Fidelity Series Government Money Market Fund Class F 0.29% | 4.4 | 0.0 |
| Fidelity Series Stock Selector Large Cap Value Fund Class F | 4.3 | 4.2 |
| Fidelity Series Intrinsic Opportunities Fund Class F | 3.8 | 3.6 |
| | 73.2 | 68.9 |
Asset Allocation (% of fund's net assets)
| Period end |
| | Domestic Equity Funds | 42.3% |
| | International Equity Funds | 21.5% |
| | Bond Funds | 29.5% |
| | Short-Term Funds | 6.7% |

| Six months ago |
| | Domestic Equity Funds | 43.9% |
| | International Equity Funds | 20.4% |
| | Bond Funds | 30.3% |
| | Short-Term Funds | 5.4% |

Domestic Equity Funds category includes Fidelity Series Commodity Strategy Fund which invests in commodity-related investments.
Percentages shown as 0.0% may reflect amounts less than 0.05%.
Fidelity Freedom K® 2020 Fund
Investments September 30, 2016 (Unaudited)
Showing Percentage of Net Assets
| Domestic Equity Funds - 42.3% | | | |
| | | Shares | Value |
| Fidelity Series 100 Index Fund Class F (a) | | 16,431,683 | $234,644,430 |
| Fidelity Series 1000 Value Index Fund Class F (a) | | 20,254,837 | 226,449,082 |
| Fidelity Series All-Sector Equity Fund Class F (a) | | 32,989,321 | 443,046,583 |
| Fidelity Series Blue Chip Growth Fund Class F (a) | | 46,492,119 | 545,352,554 |
| Fidelity Series Commodity Strategy Fund Class F (a)(b) | | 52,615,533 | 281,493,101 |
| Fidelity Series Equity-Income Fund Class F (a) | | 85,422,022 | 1,057,524,634 |
| Fidelity Series Growth & Income Fund Class F (a) | | 59,537,216 | 798,394,061 |
| Fidelity Series Growth Company Fund Class F (a) | | 69,243,687 | 929,942,717 |
| Fidelity Series Intrinsic Opportunities Fund Class F (a) | | 42,578,480 | 640,380,342 |
| Fidelity Series Opportunistic Insights Fund Class F (a) | | 33,362,344 | 511,778,359 |
| Fidelity Series Real Estate Equity Fund Class F (a) | | 6,490,437 | 89,373,324 |
| Fidelity Series Small Cap Discovery Fund Class F (a) | | 13,001,923 | 137,170,292 |
| Fidelity Series Small Cap Opportunities Fund Class F (a) | | 31,665,551 | 418,935,238 |
| Fidelity Series Stock Selector Large Cap Value Fund Class F (a) | | 60,136,789 | 710,215,481 |
| TOTAL DOMESTIC EQUITY FUNDS | | | |
| (Cost $5,910,871,095) | | | 7,024,700,198 |
|
| International Equity Funds - 21.5% | | | |
| Fidelity Series Emerging Markets Fund Class F (a) | | 78,339,490 | 1,322,370,596 |
| Fidelity Series International Growth Fund Class F (a) | | 71,868,960 | 1,009,040,192 |
| Fidelity Series International Small Cap Fund Class F (a) | | 14,853,466 | 231,862,598 |
| Fidelity Series International Value Fund Class F (a) | | 106,531,767 | 1,013,117,107 |
| TOTAL INTERNATIONAL EQUITY FUNDS | | | |
| (Cost $3,168,630,494) | | | 3,576,390,493 |
|
| Bond Funds - 29.5% | | | |
| Fidelity Series Emerging Markets Debt Fund Class F (a) | | 10,753,939 | 111,410,809 |
| Fidelity Series Floating Rate High Income Fund Class F (a) | | 4,381,203 | 41,270,929 |
| Fidelity Series High Income Fund Class F (a) | | 53,717,197 | 502,792,967 |
| Fidelity Series Inflation-Protected Bond Index Fund Class F (a) | | 19,176,931 | 193,303,462 |
| Fidelity Series Investment Grade Bond Fund Class F (a) | | 341,010,979 | 3,955,727,354 |
| Fidelity Series Long-Term Treasury Bond Index Fund Class F (a) | | 427,483 | 4,125,214 |
| Fidelity Series Real Estate Income Fund Class F (a) | | 7,387,967 | 82,892,985 |
| TOTAL BOND FUNDS | | | |
| (Cost $4,872,358,392) | | | 4,891,523,720 |
|
| Short-Term Funds - 6.7% | | | |
| Fidelity Series Government Money Market Fund Class F 0.29% (a)(c) | | 734,599,639 | 734,599,639 |
| Fidelity Series Short-Term Credit Fund Class F (a) | | 37,272,716 | 373,845,337 |
| TOTAL SHORT-TERM FUNDS | | | |
| (Cost $1,107,145,077) | | | 1,108,444,976 |
| TOTAL INVESTMENT PORTFOLIO - 100.0% | | | |
| (Cost $15,059,005,058) | | | 16,601,059,387 |
| NET OTHER ASSETS (LIABILITIES) - 0.0% | | | (651,068) |
| NET ASSETS - 100% | | | $16,600,408,319 |
Legend
(a) Affiliated Fund
(b) Non-income producing
(c) The rate quoted is the annualized seven-day yield of the fund at period end.
Affiliated Underlying Funds
Information regarding the Fund's fiscal year to date purchases and sales of the affiliated Underlying Funds and income earned by the Fund from investments in affiliated Underlying Funds is as follows:
| Affiliate | Value, beginning of period | Purchases | Sales Proceeds | Dividend Income | Value, end of period |
| Fidelity Investments Money Market Portfolio Class F | $571,701,080 | $31,161,217 | $602,862,297 | $260,006 | $-- |
| Fidelity Series 100 Index Fund Class F | 244,660,959 | 6,459,936 | 30,928,186 | -- | 234,644,430 |
| Fidelity Series 1000 Value Index Fund Class F | 137,955,491 | 91,597,998 | 13,910,488 | -- | 226,449,082 |
| Fidelity Series All-Sector Equity Fund Class F | 770,680,737 | 19,820,051 | 396,180,812 | -- | 443,046,583 |
| Fidelity Series Blue Chip Growth Fund Class F | 534,911,997 | 15,779,214 | 46,687,233 | 1,451,337 | 545,352,554 |
| Fidelity Series Commodity Strategy Fund Class F | 201,002,871 | 74,515,690 | 10,630,185 | -- | 281,493,101 |
| Fidelity Series Emerging Markets Debt Fund Class F | 102,504,167 | 5,278,841 | 5,684,010 | 2,987,900 | 111,410,809 |
| Fidelity Series Emerging Markets Fund Class F | 1,186,962,515 | 28,175,414 | 48,019,646 | -- | 1,322,370,596 |
| Fidelity Series Equity-Income Fund Class F | 1,035,760,821 | 37,509,174 | 93,631,093 | 9,810,232 | 1,057,524,634 |
| Fidelity Series Floating Rate High Income Fund Class F | 40,034,702 | 1,859,886 | 2,559,437 | 912,652 | 41,270,929 |
| Fidelity Series Government Money Market Fund Class F 0.29% | -- | 753,341,796 | 18,742,157 | 631,132 | 734,599,639 |
| Fidelity Series Growth & Income Fund Class F | 793,857,980 | 28,910,516 | 83,619,713 | 6,983,196 | 798,394,061 |
| Fidelity Series Growth Company Fund Class F | 947,110,437 | 1,209,922 | 106,930,455 | -- | 929,942,717 |
| Fidelity Series High Income Fund Class F | 481,432,267 | 14,026,429 | 30,153,121 | 14,026,333 | 502,792,967 |
| Fidelity Series Inflation-Protected Bond Index Fund Class F | 170,785,381 | 28,136,046 | 9,035,089 | 208,391 | 193,303,462 |
| Fidelity Series International Growth Fund Class F | 945,668,345 | 95,038,409 | 81,230,368 | -- | 1,009,040,192 |
| Fidelity Series International Small Cap Fund Class F | 227,006,807 | 18,140,634 | 21,212,086 | -- | 231,862,598 |
| Fidelity Series International Value Fund Class F | 938,635,502 | 122,242,525 | 87,171,806 | -- | 1,013,117,107 |
| Fidelity Series Intrinsic Opportunities Fund Class F | 582,740,130 | 20,198,074 | -- | 4,898,351 | 640,380,342 |
| Fidelity Series Investment Grade Bond Fund Class F | 4,024,998,184 | 146,300,823 | 316,589,286 | 50,819,820 | 3,955,727,354 |
| Fidelity Series Long-Term Treasury Bond Index Fund Class F | -- | 4,390,826 | 116,074 | 19,258 | 4,125,214 |
| Fidelity Series Opportunistic Insights Fund Class F | 516,039,013 | 14,518,185 | 44,856,327 | -- | 511,778,359 |
| Fidelity Series Real Estate Equity Fund Class F | 95,469,402 | 8,656,128 | 12,988,887 | 889,121 | 89,373,324 |
| Fidelity Series Real Estate Income Fund Class F | 80,513,965 | 7,006,648 | 7,142,752 | 2,093,054 | 82,892,985 |
| Fidelity Series Short-Term Credit Fund Class F | 306,142,393 | 82,410,623 | 16,030,947 | 1,865,171 | 373,845,337 |
| Fidelity Series Small Cap Discovery Fund Class F | 138,240,859 | 3,922,693 | 12,588,565 | 240,495 | 137,170,292 |
| Fidelity Series Small Cap Opportunities Fund Class F | 415,106,633 | 12,360,140 | 43,601,767 | 1,442,602 | 418,935,238 |
| Fidelity Series Stock Selector Large Cap Value Fund Class F | 681,764,492 | 39,918,683 | 57,155,676 | -- | 710,215,481 |
| Total | $16,171,687,130 | $1,712,886,521 | $2,200,258,463 | $99,539,051 | $16,601,059,387 |
Investment Valuation
All investments are categorized as Level 1 under the Fair Value Hierarchy. The inputs or methodology used for valuing securities may not be an indication of the risk associated with investing in those securities. For more information on valuation inputs please refer to the Investment Valuation section in the accompanying Notes to Financial Statements.
See accompanying notes which are an integral part of the financial statements.
Fidelity Freedom K® 2020 Fund
Financial Statements
Statement of Assets and Liabilities
| | | September 30, 2016 (Unaudited) |
| Assets | | |
| Investment in securities, at value (cost $15,059,005,058) — See accompanying schedule | | $16,601,059,387 |
| Receivable for investments sold | | 164,377,156 |
| Receivable for fund shares sold | | 26,771,127 |
| Total assets | | 16,792,207,670 |
| Liabilities | | |
| Payable for investments purchased | $37,532,195 | |
| Payable for fund shares redeemed | 153,614,573 | |
| Transfer agent fees payable | 652,583 | |
| Total liabilities | | 191,799,351 |
| Net Assets | | $16,600,408,319 |
| Net Assets consist of: | | |
| Paid in capital | | $14,962,268,269 |
| Undistributed net investment income | | 95,359,719 |
| Accumulated undistributed net realized gain (loss) on investments | | 726,002 |
| Net unrealized appreciation (depreciation) on investments | | 1,542,054,329 |
| Net Assets, for 1,167,066,024 shares outstanding | | $16,600,408,319 |
| Net Asset Value, offering price and redemption price per share ($16,600,408,319 ÷ 1,167,066,024 shares) | | $14.22 |
See accompanying notes which are an integral part of the financial statements.
Statement of Operations
| | | Six months ended September 30, 2016 (Unaudited) |
| Investment Income | | |
| Income distributions from underlying funds | | $99,539,051 |
| Expenses | | |
| Transfer agent fees | $3,846,978 | |
| Independent trustees' fees and expenses | 36,551 | |
| Total expenses | | 3,883,529 |
| Net investment income (loss) | | 95,655,522 |
| Realized and Unrealized Gain (Loss) | | |
| Realized gain (loss) on sale of underlying fund shares | 50,688,513 | |
| Capital gain distributions from underlying funds | 6,041,737 | |
| Total net realized gain (loss) | | 56,730,250 |
| Change in net unrealized appreciation (depreciation) on underlying funds | | 866,055,677 |
| Net gain (loss) | | 922,785,927 |
| Net increase (decrease) in net assets resulting from operations | | $1,018,441,449 |
See accompanying notes which are an integral part of the financial statements.
Statement of Changes in Net Assets
| | Six months ended September 30, 2016 (Unaudited) | Year ended March 31, 2016 |
| Increase (Decrease) in Net Assets | | |
| Operations | | |
| Net investment income (loss) | $95,655,522 | $317,930,107 |
| Net realized gain (loss) | 56,730,250 | 465,604,383 |
| Change in net unrealized appreciation (depreciation) | 866,055,677 | (1,119,523,298) |
| Net increase (decrease) in net assets resulting from operations | 1,018,441,449 | (335,988,808) |
| Distributions to shareholders from net investment income | (45,687,335) | (290,459,152) |
| Distributions to shareholders from net realized gain | (254,208,919) | (553,517,566) |
| Total distributions | (299,896,254) | (843,976,718) |
| Share transactions | | |
| Proceeds from sales of shares | 1,863,820,707 | 4,100,202,428 |
| Reinvestment of distributions | 299,896,255 | 843,976,718 |
| Cost of shares redeemed | (2,452,907,469) | (5,083,614,184) |
| Net increase (decrease) in net assets resulting from share transactions | (289,190,507) | (139,435,038) |
| Total increase (decrease) in net assets | 429,354,688 | (1,319,400,564) |
| Net Assets | | |
| Beginning of period | 16,171,053,631 | 17,490,454,195 |
| End of period | $16,600,408,319 | $16,171,053,631 |
| Other Information | | |
| Undistributed net investment income end of period | $95,359,719 | $45,391,532 |
| Shares | | |
| Sold | 135,007,594 | 294,203,195 |
| Issued in reinvestment of distributions | 22,413,771 | 60,184,292 |
| Redeemed | (177,454,755) | (363,822,608) |
| Net increase (decrease) | (20,033,390) | (9,435,121) |
See accompanying notes which are an integral part of the financial statements.
Financial Highlights — Fidelity Freedom K 2020 Fund
| | Six months ended (Unaudited) September 30, | Years ended March 31, | | | | |
| | 2016 | 2016 | 2015 | 2014 | 2013 | 2012 |
| Selected Per–Share Data | | | | | | |
| Net asset value, beginning of period | $13.62 | $14.62 | $15.07 | $13.98 | $13.42 | $13.72 |
| Income from Investment Operations | | | | | | |
| Net investment income (loss)A | .08 | .27 | .28 | .22 | .24 | .25 |
| Net realized and unrealized gain (loss) | .78 | (.55) | .68 | 1.15 | .82 | .06 |
| Total from investment operations | .86 | (.28) | .96 | 1.37 | 1.06 | .31 |
| Distributions from net investment income | (.04) | (.25) | (.49) | (.03) | (.23) | (.21) |
| Distributions from net realized gain | (.22) | (.47) | (.91) | (.25) | (.27) | (.40) |
| Total distributions | (.26) | (.72) | (1.41)B | (.28) | (.50) | (.61) |
| Net asset value, end of period | $14.22 | $13.62 | $14.62 | $15.07 | $13.98 | $13.42 |
| Total ReturnC | 6.40% | (2.01)% | 6.84% | 9.95% | 8.17% | 2.50% |
| Ratios to Average Net AssetsD,E | | | | | | |
| Expenses before reductions | .05%F | .05% | .05% | .05% | .05% | .05% |
| Expenses net of fee waivers, if any | .05%F | .05% | .05% | .05% | .05% | .05% |
| Expenses net of all reductions | .05%F | .05% | .05% | .05% | .05% | .05% |
| Net investment income (loss) | 1.17%F | 1.93% | 1.92% | 1.56% | 1.78% | 1.94% |
| Supplemental Data | | | | | | |
| Net assets, end of period (000 omitted) | $16,600,408 | $16,171,054 | $17,490,454 | $17,321,924 | $16,051,941 | $12,054,451 |
| Portfolio turnover rateD | 21%F | 21% | 21% | 43% | 23% | 21% |
A Calculated based on average shares outstanding during the period.
B Total distributions of $1.41 per share is comprised of distributions from net investment income of $.492 and distributions from net realized gain of $.914 per share.
C Total returns for periods of less than one year are not annualized.
D Amounts do not include the activity of the Underlying Funds.
E Expense ratios reflect operating expenses of the Fund. Expenses before reductions do not reflect amounts reimbursed by the investment adviser or reductions from expense offset arrangements and do not represent the amount paid by the Fund during periods when reimbursements or reductions occur. Expenses net of fee waivers reflect expenses after reimbursement by the investment adviser but prior to reductions from expense offset arrangements. Expenses net of all reductions represent the net expenses paid by the Fund but do not include expenses of the underlying funds in which the Fund invests.
F Annualized
See accompanying notes which are an integral part of the financial statements.
Fidelity Freedom K® 2025 Fund
Investment Summary (Unaudited)
The information in the following tables is based on the direct investments of the Fund.
Top Holdings as of September 30, 2016
| | % of fund's net assets | % of fund's net assets 6 months ago |
| Fidelity Series Investment Grade Bond Fund Class F | 20.3 | 19.9 |
| Fidelity Series Emerging Markets Fund Class F | 8.4 | 7.8 |
| Fidelity Series Equity-Income Fund Class F | 7.1 | 7.1 |
| Fidelity Series International Value Fund Class F | 6.7 | 6.5 |
| Fidelity Series International Growth Fund Class F | 6.7 | 6.6 |
| Fidelity Series Growth Company Fund Class F | 6.2 | 6.5 |
| Fidelity Series Growth & Income Fund Class F | 5.3 | 5.5 |
| Fidelity Series Stock Selector Large Cap Value Fund Class F | 4.7 | 4.7 |
| Fidelity Series Intrinsic Opportunities Fund Class F | 4.3 | 4.0 |
| Fidelity Series Blue Chip Growth Fund Class F | 3.6 | 3.7 |
| | 73.3 | 72.3 |
Asset Allocation (% of fund's net assets)
| Period end |
| | Domestic Equity Funds | 46.6% |
| | International Equity Funds | 23.3% |
| | Bond Funds | 25.2% |
| | Short-Term Funds | 4.9% |

| Six months ago |
| | Domestic Equity Funds | 48.6% |
| | International Equity Funds | 22.5% |
| | Bond Funds | 24.7% |
| | Short-Term Funds | 4.2% |

Domestic Equity Funds category includes Fidelity Series Commodity Strategy Fund which invests in commodity-related investments.
Fidelity Freedom K® 2025 Fund
Investments September 30, 2016 (Unaudited)
Showing Percentage of Net Assets
| Domestic Equity Funds - 46.6% | | | |
| | | Shares | Value |
| Fidelity Series 100 Index Fund Class F (a) | | 15,059,323 | $215,047,135 |
| Fidelity Series 1000 Value Index Fund Class F (a) | | 18,053,578 | 201,838,998 |
| Fidelity Series All-Sector Equity Fund Class F (a) | | 30,183,916 | 405,369,998 |
| Fidelity Series Blue Chip Growth Fund Class F (a) | | 42,489,352 | 498,400,105 |
| Fidelity Series Commodity Strategy Fund Class F (a)(b) | | 43,068,061 | 230,414,126 |
| Fidelity Series Equity-Income Fund Class F (a) | | 78,395,357 | 970,534,523 |
| Fidelity Series Growth & Income Fund Class F (a) | | 54,279,518 | 727,888,333 |
| Fidelity Series Growth Company Fund Class F (a) | | 63,081,662 | 847,186,714 |
| Fidelity Series Intrinsic Opportunities Fund Class F (a) | | 38,890,069 | 584,906,641 |
| Fidelity Series Opportunistic Insights Fund Class F (a) | | 30,597,949 | 469,372,535 |
| Fidelity Series Real Estate Equity Fund Class F (a) | | 5,996,497 | 82,571,757 |
| Fidelity Series Small Cap Discovery Fund Class F (a) | | 11,910,256 | 125,653,199 |
| Fidelity Series Small Cap Opportunities Fund Class F (a) | | 29,077,572 | 384,696,272 |
| Fidelity Series Stock Selector Large Cap Value Fund Class F (a) | | 54,639,418 | 645,291,524 |
| TOTAL DOMESTIC EQUITY FUNDS | | | |
| (Cost $5,447,910,902) | | | 6,389,171,860 |
|
| International Equity Funds - 23.3% | | | |
| Fidelity Series Emerging Markets Fund Class F (a) | | 68,272,290 | 1,152,436,259 |
| Fidelity Series International Growth Fund Class F (a) | | 65,235,404 | 915,905,065 |
| Fidelity Series International Small Cap Fund Class F (a) | | 13,482,608 | 210,463,509 |
| Fidelity Series International Value Fund Class F (a) | | 96,701,185 | 919,628,270 |
| TOTAL INTERNATIONAL EQUITY FUNDS | | | |
| (Cost $2,901,194,292) | | | 3,198,433,103 |
|
| Bond Funds - 25.2% | | | |
| Fidelity Series Emerging Markets Debt Fund Class F (a) | | 8,842,623 | 91,609,572 |
| Fidelity Series Floating Rate High Income Fund Class F (a) | | 3,629,883 | 34,193,502 |
| Fidelity Series High Income Fund Class F (a) | | 42,695,031 | 399,625,489 |
| Fidelity Series Inflation-Protected Bond Index Fund Class F (a) | | 8,221,709 | 82,874,829 |
| Fidelity Series Investment Grade Bond Fund Class F (a) | | 239,547,655 | 2,778,752,799 |
| Fidelity Series Long-Term Treasury Bond Index Fund Class F (a) | | 299,802 | 2,893,086 |
| Fidelity Series Real Estate Income Fund Class F (a) | | 6,102,792 | 68,473,325 |
| TOTAL BOND FUNDS | | | |
| (Cost $3,442,939,269) | | | 3,458,422,602 |
|
| Short-Term Funds - 4.9% | | | |
| Fidelity Series Government Money Market Fund Class F 0.29% (a)(c) | | 437,614,687 | 437,614,687 |
| Fidelity Series Short-Term Credit Fund Class F (a) | | 22,587,644 | 226,554,072 |
| TOTAL SHORT-TERM FUNDS | | | |
| (Cost $663,385,529) | | | 664,168,759 |
| TOTAL INVESTMENT PORTFOLIO - 100.0% | | | |
| (Cost $12,455,429,992) | | | 13,710,196,324 |
| NET OTHER ASSETS (LIABILITIES) - 0.0% | | | (536,182) |
| NET ASSETS - 100% | | | $13,709,660,142 |
Legend
(a) Affiliated Fund
(b) Non-income producing
(c) The rate quoted is the annualized seven-day yield of the fund at period end.
Affiliated Underlying Funds
Information regarding the Fund's fiscal year to date purchases and sales of the affiliated Underlying Funds and income earned by the Fund from investments in affiliated Underlying Funds is as follows:
| Affiliate | Value, beginning of period | Purchases | Sales Proceeds | Dividend Income | Value, end of period |
| Fidelity Investments Money Market Portfolio Class F | $350,185,339 | $3,003,310 | $353,188,649 | $157,965 | $-- |
| Fidelity Series 100 Index Fund Class F | 215,287,551 | 13,455,495 | 26,641,560 | -- | 215,047,135 |
| Fidelity Series 1000 Value Index Fund Class F | 121,256,266 | 83,218,366 | 12,303,030 | -- | 201,838,998 |
| Fidelity Series All-Sector Equity Fund Class F | 678,850,088 | 34,231,190 | 351,406,561 | -- | 405,369,998 |
| Fidelity Series Blue Chip Growth Fund Class F | 471,088,834 | 31,396,193 | 41,460,142 | 1,332,120 | 498,400,105 |
| Fidelity Series Commodity Strategy Fund Class F | 159,950,785 | 66,395,137 | 9,824,925 | -- | 230,414,126 |
| Fidelity Series Emerging Markets Debt Fund Class F | 81,072,431 | 6,762,736 | 3,699,467 | 2,402,125 | 91,609,572 |
| Fidelity Series Emerging Markets Fund Class F | 1,002,514,471 | 56,914,428 | 40,054,435 | -- | 1,152,436,259 |
| Fidelity Series Equity-Income Fund Class F | 912,438,301 | 67,653,200 | 79,319,527 | 8,738,955 | 970,534,523 |
| Fidelity Series Floating Rate High Income Fund Class F | 31,903,937 | 2,595,926 | 1,872,984 | 740,745 | 34,193,502 |
| Fidelity Series Government Money Market Fund Class F 0.29% | -- | 445,936,784 | 8,322,097 | 375,964 | 437,614,687 |
| Fidelity Series Growth & Income Fund Class F | 699,257,536 | 50,775,234 | 75,421,448 | 6,204,302 | 727,888,333 |
| Fidelity Series Growth Company Fund Class F | 833,281,469 | 2,056,323 | 67,487,752 | -- | 847,186,714 |
| Fidelity Series High Income Fund Class F | 380,589,324 | 11,131,577 | 21,840,371 | 11,131,427 | 399,625,489 |
| Fidelity Series Inflation-Protected Bond Index Fund Class F | 66,215,403 | 19,257,764 | 4,007,639 | 80,942 | 82,874,829 |
| Fidelity Series International Growth Fund Class F | 841,946,599 | 97,191,064 | 67,675,497 | -- | 915,905,065 |
| Fidelity Series International Small Cap Fund Class F | 201,876,828 | 17,391,647 | 16,254,817 | -- | 210,463,509 |
| Fidelity Series International Value Fund Class F | 835,693,916 | 121,589,756 | 73,048,037 | -- | 919,628,270 |
| Fidelity Series Intrinsic Opportunities Fund Class F | 517,100,433 | 36,766,207 | 2,615,944 | 4,461,454 | 584,906,641 |
| Fidelity Series Investment Grade Bond Fund Class F | 2,552,081,699 | 274,369,900 | 113,843,856 | 33,839,120 | 2,778,752,799 |
| Fidelity Series Long-Term Treasury Bond Index Fund Class F | -- | 2,995,958 | 1,146 | 13,323 | 2,893,086 |
| Fidelity Series Opportunistic Insights Fund Class F | 454,435,001 | 29,841,742 | 38,392,470 | -- | 469,372,535 |
| Fidelity Series Real Estate Equity Fund Class F | 83,816,486 | 11,726,155 | 11,264,933 | 804,689 | 82,571,757 |
| Fidelity Series Real Estate Income Fund Class F | 64,222,731 | 7,683,677 | 5,445,675 | 1,702,475 | 68,473,325 |
| Fidelity Series Short-Term Credit Fund Class F | 187,259,264 | 45,943,888 | 7,428,503 | 1,114,556 | 226,554,072 |
| Fidelity Series Small Cap Discovery Fund Class F | 121,500,829 | 7,771,140 | 10,458,070 | 214,545 | 125,653,199 |
| Fidelity Series Small Cap Opportunities Fund Class F | 365,500,545 | 23,963,128 | 36,300,594 | 1,324,684 | 384,696,272 |
| Fidelity Series Stock Selector Large Cap Value Fund Class F | 603,916,949 | 51,162,957 | 50,752,894 | -- | 645,291,524 |
| Total | $12,833,243,015 | $1,623,180,882 | $1,530,333,023 | $74,639,391 | $13,710,196,324 |
Investment Valuation
All investments are categorized as Level 1 under the Fair Value Hierarchy. The inputs or methodology used for valuing securities may not be an indication of the risk associated with investing in those securities. For more information on valuation inputs please refer to the Investment Valuation section in the accompanying Notes to Financial Statements.
See accompanying notes which are an integral part of the financial statements.
Fidelity Freedom K® 2025 Fund
Financial Statements
Statement of Assets and Liabilities
| | | September 30, 2016 (Unaudited) |
| Assets | | |
| Investment in securities, at value (cost $12,455,429,992) — See accompanying schedule | | $13,710,196,324 |
| Receivable for investments sold | | 182,720,515 |
| Receivable for fund shares sold | | 26,514,518 |
| Total assets | | 13,919,431,357 |
| Liabilities | | |
| Payable for investments purchased | $16,909,493 | |
| Payable for fund shares redeemed | 192,323,499 | |
| Transfer agent fees payable | 538,223 | |
| Total liabilities | | 209,771,215 |
| Net Assets | | $13,709,660,142 |
| Net Assets consist of: | | |
| Paid in capital | | $12,406,902,731 |
| Undistributed net investment income | | 71,249,657 |
| Accumulated undistributed net realized gain (loss) on investments | | (23,258,578) |
| Net unrealized appreciation (depreciation) on investments | | 1,254,766,332 |
| Net Assets, for 924,842,731 shares outstanding | | $13,709,660,142 |
| Net Asset Value, offering price and redemption price per share ($13,709,660,142 ÷ 924,842,731 shares) | | $14.82 |
See accompanying notes which are an integral part of the financial statements.
Statement of Operations
| | | Six months ended September 30, 2016 (Unaudited) |
| Investment Income | | |
| Income distributions from underlying funds | | $74,639,391 |
| Expenses | | |
| Transfer agent fees | $3,110,142 | |
| Independent trustees' fees and expenses | 29,316 | |
| Total expenses | | 3,139,458 |
| Net investment income (loss) | | 71,499,933 |
| Realized and Unrealized Gain (Loss) | | |
| Realized gain (loss) on sale of underlying fund shares | 32,615,568 | |
| Capital gain distributions from underlying funds | 5,433,872 | |
| Total net realized gain (loss) | | 38,049,440 |
| Change in net unrealized appreciation (depreciation) on underlying funds | | 751,489,875 |
| Net gain (loss) | | 789,539,315 |
| Net increase (decrease) in net assets resulting from operations | | $861,039,248 |
See accompanying notes which are an integral part of the financial statements.
Statement of Changes in Net Assets
| | Six months ended September 30, 2016 (Unaudited) | Year ended March 31, 2016 |
| Increase (Decrease) in Net Assets | | |
| Operations | | |
| Net investment income (loss) | $71,499,933 | $233,820,032 |
| Net realized gain (loss) | 38,049,440 | 376,066,732 |
| Change in net unrealized appreciation (depreciation) | 751,489,875 | (904,522,206) |
| Net increase (decrease) in net assets resulting from operations | 861,039,248 | (294,635,442) |
| Distributions to shareholders from net investment income | (29,757,534) | (226,661,881) |
| Distributions to shareholders from net realized gain | (220,021,230) | (429,736,740) |
| Total distributions | (249,778,764) | (656,398,621) |
| Share transactions | | |
| Proceeds from sales of shares | 1,816,629,291 | 3,618,354,428 |
| Reinvestment of distributions | 249,778,764 | 656,398,621 |
| Cost of shares redeemed | (1,800,752,957) | (3,422,255,929) |
| Net increase (decrease) in net assets resulting from share transactions | 265,655,098 | 852,497,120 |
| Total increase (decrease) in net assets | 876,915,582 | (98,536,943) |
| Net Assets | | |
| Beginning of period | 12,832,744,560 | 12,931,281,503 |
| End of period | $13,709,660,142 | $12,832,744,560 |
| Other Information | | |
| Undistributed net investment income end of period | $71,249,657 | $29,507,258 |
| Shares | | |
| Sold | 126,395,032 | 249,119,303 |
| Issued in reinvestment of distributions | 17,982,630 | 44,749,807 |
| Redeemed | (125,265,035) | (235,009,004) |
| Net increase (decrease) | 19,112,627 | 58,860,106 |
See accompanying notes which are an integral part of the financial statements.
Financial Highlights — Fidelity Freedom K 2025 Fund
| | Six months ended (Unaudited) September 30, | Years ended March 31, | | | | |
| | 2016 | 2016 | 2015 | 2014 | 2013 | 2012 |
| Selected Per–Share Data | | | | | | |
| Net asset value, beginning of period | $14.17 | $15.27 | $15.70 | $14.30 | $13.59 | $13.99 |
| Income from Investment Operations | | | | | | |
| Net investment income (loss)A | .08 | .27 | .29 | .24 | .26 | .26 |
| Net realized and unrealized gain (loss) | .85 | (.61) | .78 | 1.47 | .95 | (.02) |
| Total from investment operations | .93 | (.34) | 1.07 | 1.71 | 1.21 | .24 |
| Distributions from net investment income | (.03) | (.26) | (.49) | (.03) | (.24) | (.21) |
| Distributions from net realized gain | (.24) | (.50) | (1.01) | (.28) | (.26) | (.43) |
| Total distributions | (.28)B | (.76) | (1.50) | (.31) | (.50) | (.64) |
| Net asset value, end of period | $14.82 | $14.17 | $15.27 | $15.70 | $14.30 | $13.59 |
| Total ReturnC | 6.67% | (2.35)% | 7.35% | 12.13% | 9.17% | 2.02% |
| Ratios to Average Net AssetsD,E | | | | | | |
| Expenses before reductions | .05%F | .05% | .05% | .05% | .05% | .05% |
| Expenses net of fee waivers, if any | .05%F | .05% | .05% | .05% | .05% | .05% |
| Expenses net of all reductions | .05%F | .05% | .05% | .05% | .05% | .05% |
| Net investment income (loss) | 1.08%F | 1.85% | 1.91% | 1.60% | 1.89% | 1.95% |
| Supplemental Data | | | | | | |
| Net assets, end of period (000 omitted) | $13,709,660 | $12,832,745 | $12,931,282 | $11,797,380 | $9,887,703 | $6,678,966 |
| Portfolio turnover rateD | 23%F | 19% | 20% | 44% | 23% | 20% |
A Calculated based on average shares outstanding during the period.
B Total distributions of $.28 per share is comprised of distributions from net investment income of $.033 and distributions from net realized gain of $.244 per share.
C Total returns for periods of less than one year are not annualized.
D Amounts do not include the activity of the Underlying Funds.
E Expense ratios reflect operating expenses of the Fund. Expenses before reductions do not reflect amounts reimbursed by the investment adviser or reductions from expense offset arrangements and do not represent the amount paid by the Fund during periods when reimbursements or reductions occur. Expenses net of fee waivers reflect expenses after reimbursement by the investment adviser but prior to reductions from expense offset arrangements. Expenses net of all reductions represent the net expenses paid by the Fund but do not include expenses of the underlying funds in which the Fund invests.
F Annualized
See accompanying notes which are an integral part of the financial statements.
Fidelity Freedom K® 2030 Fund
Investment Summary (Unaudited)
The information in the following tables is based on the direct investments of the Fund.
Top Holdings as of September 30, 2016
| | % of fund's net assets | % of fund's net assets 6 months ago |
| Fidelity Series Investment Grade Bond Fund Class F | 10.4 | 9.6 |
| Fidelity Series Emerging Markets Fund Class F | 9.4 | 8.8 |
| Fidelity Series Equity-Income Fund Class F | 8.7 | 8.6 |
| Fidelity Series International Value Fund Class F | 8.2 | 7.9 |
| Fidelity Series International Growth Fund Class F | 8.2 | 8.1 |
| Fidelity Series Growth Company Fund Class F | 7.6 | 7.9 |
| Fidelity Series Growth & Income Fund Class F | 6.5 | 6.6 |
| Fidelity Series Stock Selector Large Cap Value Fund Class F | 6.0 | 5.7 |
| Fidelity Series Intrinsic Opportunities Fund Class F | 5.2 | 4.9 |
| Fidelity Series Blue Chip Growth Fund Class F | 4.4 | 4.5 |
| | 74.6 | 72.6 |
Asset Allocation (% of fund's net assets)
| Period end |
| | Domestic Equity Funds | 56.9% |
| | International Equity Funds | 27.7% |
| | Bond Funds | 15.3% |
| | Short-Term Funds | 0.1% |

| Six months ago |
| | Domestic Equity Funds | 58.7% |
| | International Equity Funds | 26.7% |
| | Bond Funds | 14.5% |
| | Short-Term Funds | 0.1% |

Domestic Equity Funds category includes Fidelity Series Commodity Strategy Fund which invests in commodity-related investments.
Fidelity Freedom K® 2030 Fund
Investments September 30, 2016 (Unaudited)
Showing Percentage of Net Assets
| Domestic Equity Funds - 56.9% | | | |
| | | Shares | Value |
| Fidelity Series 100 Index Fund Class F (a) | | 22,058,419 | $314,994,218 |
| Fidelity Series 1000 Value Index Fund Class F (a) | | 29,655,147 | 331,544,549 |
| Fidelity Series All-Sector Equity Fund Class F (a) | | 44,255,098 | 594,345,968 |
| Fidelity Series Blue Chip Growth Fund Class F (a) | | 61,638,765 | 723,022,713 |
| Fidelity Series Commodity Strategy Fund Class F (a)(b) | | 50,431,272 | 269,807,306 |
| Fidelity Series Equity-Income Fund Class F (a) | | 114,928,865 | 1,422,819,350 |
| Fidelity Series Growth & Income Fund Class F (a) | | 79,044,177 | 1,059,982,407 |
| Fidelity Series Growth Company Fund Class F (a) | | 92,170,786 | 1,237,853,654 |
| Fidelity Series Intrinsic Opportunities Fund Class F (a) | | 55,969,557 | 841,782,138 |
| Fidelity Series Opportunistic Insights Fund Class F (a) | | 44,062,009 | 675,911,219 |
| Fidelity Series Real Estate Equity Fund Class F (a) | | 8,496,975 | 117,003,347 |
| Fidelity Series Small Cap Discovery Fund Class F (a) | | 17,312,131 | 182,642,987 |
| Fidelity Series Small Cap Opportunities Fund Class F (a) | | 41,975,514 | 555,336,051 |
| Fidelity Series Stock Selector Large Cap Value Fund Class F (a) | | 83,076,066 | 981,128,344 |
| TOTAL DOMESTIC EQUITY FUNDS | | | |
| (Cost $7,974,991,719) | | | 9,308,174,251 |
|
| International Equity Funds - 27.7% | | | |
| Fidelity Series Emerging Markets Fund Class F (a) | | 90,888,439 | 1,534,196,847 |
| Fidelity Series International Growth Fund Class F (a) | | 95,371,166 | 1,339,011,166 |
| Fidelity Series International Small Cap Fund Class F (a) | | 19,708,484 | 307,649,441 |
| Fidelity Series International Value Fund Class F (a) | | 141,368,319 | 1,344,412,718 |
| TOTAL INTERNATIONAL EQUITY FUNDS | | | |
| (Cost $4,156,835,274) | | | 4,525,270,172 |
|
| Bond Funds - 15.3% | | | |
| Fidelity Series Emerging Markets Debt Fund Class F (a) | | 10,637,356 | 110,203,011 |
| Fidelity Series Floating Rate High Income Fund Class F (a) | | 4,314,966 | 40,646,980 |
| Fidelity Series High Income Fund Class F (a) | | 51,755,361 | 484,430,183 |
| Fidelity Series Inflation-Protected Bond Index Fund Class F (a) | | 8,829,896 | 89,005,356 |
| Fidelity Series Investment Grade Bond Fund Class F (a) | | 146,494,931 | 1,699,341,199 |
| Fidelity Series Long-Term Treasury Bond Index Fund Class F (a) | | 176,637 | 1,704,548 |
| Fidelity Series Real Estate Income Fund Class F (a) | | 7,330,296 | 82,245,923 |
| TOTAL BOND FUNDS | | | |
| (Cost $2,476,232,109) | | | 2,507,577,200 |
|
| Short-Term Funds - 0.1% | | | |
| Fidelity Series Government Money Market Fund Class F 0.29% (a)(c) | | 4,991,884 | 4,991,884 |
| Fidelity Series Short-Term Credit Fund Class F (a) | | 268,385 | 2,691,906 |
| TOTAL SHORT-TERM FUNDS | | | |
| (Cost $7,670,229) | | | 7,683,790 |
| TOTAL INVESTMENT PORTFOLIO - 100.0% | | | |
| (Cost $14,615,729,331) | | | 16,348,705,413 |
| NET OTHER ASSETS (LIABILITIES) - 0.0% | | | (640,623) |
| NET ASSETS - 100% | | | $16,348,064,790 |
Legend
(a) Affiliated Fund
(b) Non-income producing
(c) The rate quoted is the annualized seven-day yield of the fund at period end.
Affiliated Underlying Funds
Information regarding the Fund's fiscal year to date purchases and sales of the affiliated Underlying Funds and income earned by the Fund from investments in affiliated Underlying Funds is as follows:
| Affiliate | Value, beginning of period | Purchases | Sales Proceeds | Dividend Income | Value, end of period |
| Fidelity Investments Money Market Portfolio Class F | $4,970,874 | $27,841 | $4,998,715 | $2,378 | $-- |
| Fidelity Series 100 Index Fund Class F | 312,979,593 | 14,802,425 | 31,452,345 | -- | 314,994,218 |
| Fidelity Series 1000 Value Index Fund Class F | 176,385,655 | 157,567,655 | 16,226,561 | -- | 331,544,549 |
| Fidelity Series All-Sector Equity Fund Class F | 986,382,823 | 38,027,616 | 494,137,096 | -- | 594,345,968 |
| Fidelity Series Blue Chip Growth Fund Class F | 684,519,159 | 34,385,230 | 50,209,786 | 1,921,407 | 723,022,713 |
| Fidelity Series Commodity Strategy Fund Class F | 193,432,176 | 70,866,273 | 11,229,939 | -- | 269,807,306 |
| Fidelity Series Emerging Markets Debt Fund Class F | 98,649,179 | 6,688,383 | 4,197,040 | 2,912,652 | 110,203,011 |
| Fidelity Series Emerging Markets Fund Class F | 1,349,270,426 | 55,889,479 | 48,935,519 | -- | 1,534,196,847 |
| Fidelity Series Equity-Income Fund Class F | 1,325,670,482 | 101,075,216 | 104,984,984 | 12,689,032 | 1,422,819,350 |
| Fidelity Series Floating Rate High Income Fund Class F | 38,664,940 | 2,371,288 | 2,275,346 | 889,451 | 40,646,980 |
| Fidelity Series Government Money Market Fund Class F 0.29% | -- | 5,219,629 | 227,745 | 4,742 | 4,991,884 |
| Fidelity Series Growth & Income Fund Class F | 1,016,008,775 | 56,410,712 | 89,619,907 | 9,003,436 | 1,059,982,407 |
| Fidelity Series Growth Company Fund Class F | 1,211,016,994 | 3,464,944 | 92,499,969 | -- | 1,237,853,654 |
| Fidelity Series High Income Fund Class F | 459,010,009 | 13,459,881 | 23,995,568 | 13,459,738 | 484,430,183 |
| Fidelity Series Inflation-Protected Bond Index Fund Class F | 79,551,481 | 11,601,883 | 3,738,406 | 95,379 | 89,005,356 |
| Fidelity Series International Growth Fund Class F | 1,240,588,009 | 111,111,127 | 77,869,626 | -- | 1,339,011,166 |
| Fidelity Series International Small Cap Fund Class F | 293,175,718 | 27,580,865 | 24,669,827 | -- | 307,649,441 |
| Fidelity Series International Value Fund Class F | 1,222,125,805 | 152,401,382 | 81,817,402 | -- | 1,344,412,718 |
| Fidelity Series Intrinsic Opportunities Fund Class F | 752,036,235 | 41,011,694 | -- | 6,423,703 | 841,782,138 |
| Fidelity Series Investment Grade Bond Fund Class F | 1,469,877,688 | 236,319,966 | 45,498,203 | 19,959,322 | 1,699,341,199 |
| Fidelity Series Long-Term Treasury Bond Index Fund Class F | -- | 1,766,905 | 1,911 | 7,873 | 1,704,548 |
| Fidelity Series Opportunistic Insights Fund Class F | 660,386,035 | 36,085,499 | 54,569,306 | -- | 675,911,219 |
| Fidelity Series Real Estate Equity Fund Class F | 121,989,565 | 15,394,846 | 18,002,890 | 1,158,188 | 117,003,347 |
| Fidelity Series Real Estate Income Fund Class F | 77,863,871 | 8,098,585 | 6,159,239 | 2,054,299 | 82,245,923 |
| Fidelity Series Short-Term Credit Fund Class F | 2,687,488 | 205,714 | 212,448 | 14,628 | 2,691,906 |
| Fidelity Series Small Cap Discovery Fund Class F | 176,500,908 | 8,332,228 | 12,123,947 | 313,418 | 182,642,987 |
| Fidelity Series Small Cap Opportunities Fund Class F | 531,149,221 | 25,730,335 | 47,363,078 | 1,910,155 | 555,336,051 |
| Fidelity Series Stock Selector Large Cap Value Fund Class F | 869,587,973 | 110,690,512 | 58,085,273 | -- | 981,128,344 |
| Total | $15,354,481,082 | $1,346,588,113 | $1,405,102,076 | $72,819,801 | $16,348,705,413 |
Investment Valuation
All investments are categorized as Level 1 under the Fair Value Hierarchy. The inputs or methodology used for valuing securities may not be an indication of the risk associated with investing in those securities. For more information on valuation inputs please refer to the Investment Valuation section in the accompanying Notes to Financial Statements.
See accompanying notes which are an integral part of the financial statements.
Fidelity Freedom K® 2030 Fund
Financial Statements
Statement of Assets and Liabilities
| | | September 30, 2016 (Unaudited) |
| Assets | | |
| Investment in securities, at value (cost $14,615,729,331) — See accompanying schedule | | $16,348,705,413 |
| Receivable for investments sold | | 176,047,918 |
| Receivable for fund shares sold | | 28,447,827 |
| Total assets | | 16,553,201,158 |
| Liabilities | | |
| Payable for investments purchased | $14,669,627 | |
| Payable for fund shares redeemed | 189,825,483 | |
| Transfer agent fees payable | 641,258 | |
| Total liabilities | | 205,136,368 |
| Net Assets | | $16,348,064,790 |
| Net Assets consist of: | | |
| Paid in capital | | $14,574,371,779 |
| Undistributed net investment income | | 68,646,783 |
| Accumulated undistributed net realized gain (loss) on investments | | (27,929,854) |
| Net unrealized appreciation (depreciation) on investments | | 1,732,976,082 |
| Net Assets, for 1,087,299,231 shares outstanding | | $16,348,064,790 |
| Net Asset Value, offering price and redemption price per share ($16,348,064,790 ÷ 1,087,299,231 shares) | | $15.04 |
See accompanying notes which are an integral part of the financial statements.
Statement of Operations
| | | Six months ended September 30, 2016 (Unaudited) |
| Investment Income | | |
| Income distributions from underlying funds | | $72,819,801 |
| Expenses | | |
| Transfer agent fees | $3,716,644 | |
| Independent trustees' fees and expenses | 35,055 | |
| Total expenses | | 3,751,699 |
| Net investment income (loss) | | 69,068,102 |
| Realized and Unrealized Gain (Loss) | | |
| Realized gain (loss) on sale of underlying fund shares | 42,215,638 | |
| Capital gain distributions from underlying funds | 7,562,381 | |
| Total net realized gain (loss) | | 49,778,019 |
| Change in net unrealized appreciation (depreciation) on underlying funds | | 1,010,522,646 |
| Net gain (loss) | | 1,060,300,665 |
| Net increase (decrease) in net assets resulting from operations | | $1,129,368,767 |
See accompanying notes which are an integral part of the financial statements.
Statement of Changes in Net Assets
| | Six months ended September 30, 2016 (Unaudited) | Year ended March 31, 2016 |
| Increase (Decrease) in Net Assets | | |
| Operations | | |
| Net investment income (loss) | $69,068,102 | $262,101,261 |
| Net realized gain (loss) | 49,778,019 | 549,397,372 |
| Change in net unrealized appreciation (depreciation) | 1,010,522,646 | (1,275,614,667) |
| Net increase (decrease) in net assets resulting from operations | 1,129,368,767 | (464,116,034) |
| Distributions to shareholders from net investment income | (22,411,162) | (259,661,343) |
| Distributions to shareholders from net realized gain | (325,492,531) | (611,213,149) |
| Total distributions | (347,903,693) | (870,874,492) |
| Share transactions | | |
| Proceeds from sales of shares | 1,814,485,527 | 3,965,188,689 |
| Reinvestment of distributions | 347,903,693 | 870,874,492 |
| Cost of shares redeemed | (1,949,685,681) | (4,145,551,424) |
| Net increase (decrease) in net assets resulting from share transactions | 212,703,539 | 690,511,757 |
| Total increase (decrease) in net assets | 994,168,613 | (644,478,769) |
| Net Assets | | |
| Beginning of period | 15,353,896,177 | 15,998,374,946 |
| End of period | $16,348,064,790 | $15,353,896,177 |
| Other Information | | |
| Undistributed net investment income end of period | $68,646,783 | $21,989,843 |
| Shares | | |
| Sold | 124,898,871 | 269,091,066 |
| Issued in reinvestment of distributions | 24,921,465 | 58,025,180 |
| Redeemed | (134,123,627) | (279,432,249) |
| Net increase (decrease) | 15,696,709 | 47,683,997 |
See accompanying notes which are an integral part of the financial statements.
Financial Highlights — Fidelity Freedom K 2030 Fund
| | Six months ended (Unaudited) September 30, | Years ended March 31, | | | | |
| | 2016 | 2016 | 2015 | 2014 | 2013 | 2012 |
| Selected Per–Share Data | | | | | | |
| Net asset value, beginning of period | $14.33 | $15.62 | $16.04 | $14.49 | $13.75 | $14.22 |
| Income from Investment Operations | | | | | | |
| Net investment income (loss)A | .06 | .25 | .28 | .24 | .27 | .26 |
| Net realized and unrealized gain (loss) | .98 | (.69) | .87 | 1.64 | .99 | (.07) |
| Total from investment operations | 1.04 | (.44) | 1.15 | 1.88 | 1.26 | .19 |
| Distributions from net investment income | (.02) | (.25) | (.50) | (.03) | (.25) | (.22) |
| Distributions from net realized gain | (.31) | (.60) | (1.07) | (.30) | (.26) | (.44) |
| Total distributions | (.33) | (.85) | (1.57) | (.33) | (.52)B | (.66) |
| Net asset value, end of period | $15.04 | $14.33 | $15.62 | $16.04 | $14.49 | $13.75 |
| Total ReturnC | 7.41% | (3.01)% | 7.78% | 13.20% | 9.46% | 1.62% |
| Ratios to Average Net AssetsD,E | | | | | | |
| Expenses before reductions | .05%F | .05% | .05% | .05% | .05% | .05% |
| Expenses net of fee waivers, if any | .05%F | .05% | .05% | .05% | .05% | .05% |
| Expenses net of all reductions | .05%F | .05% | .05% | .05% | .05% | .05% |
| Net investment income (loss) | .87%F | 1.71% | 1.80% | 1.58% | 1.94% | 1.99% |
| Supplemental Data | | | | | | |
| Net assets, end of period (000 omitted) | $16,348,065 | $15,353,896 | $15,998,375 | $14,926,240 | $12,937,662 | $9,206,764 |
| Portfolio turnover rateD | 17%F | 19% | 19% | 56% | 25% | 19% |
A Calculated based on average shares outstanding during the period.
B Total distributions of $.52 per share is comprised of distributions from net investment income of $.252 and distributions from net realized gain of $.264 per share.
C Total returns for periods of less than one year are not annualized.
D Amounts do not include the activity of the Underlying Funds.
E Expense ratios reflect operating expenses of the Fund. Expenses before reductions do not reflect amounts reimbursed by the investment adviser or reductions from expense offset arrangements and do not represent the amount paid by the Fund during periods when reimbursements or reductions occur. Expenses net of fee waivers reflect expenses after reimbursement by the investment adviser but prior to reductions from expense offset arrangements. Expenses net of all reductions represent the net expenses paid by the Fund but do not include expenses of the underlying funds in which the Fund invests.
F Annualized
See accompanying notes which are an integral part of the financial statements.
Fidelity Freedom K® 2035 Fund
Investment Summary (Unaudited)
The information in the following tables is based on the direct investments of the Fund.
Top Holdings as of September 30, 2016
| | % of fund's net assets | % of fund's net assets 6 months ago |
| Fidelity Series Emerging Markets Fund Class F | 10.0 | 9.4 |
| Fidelity Series Equity-Income Fund Class F | 9.9 | 9.6 |
| Fidelity Series International Value Fund Class F | 9.3 | 8.9 |
| Fidelity Series International Growth Fund Class F | 9.3 | 9.0 |
| Fidelity Series Growth Company Fund Class F | 8.4 | 8.8 |
| Fidelity Series Growth & Income Fund Class F | 7.2 | 7.3 |
| Fidelity Series Stock Selector Large Cap Value Fund Class F | 6.9 | 6.3 |
| Fidelity Series Intrinsic Opportunities Fund Class F | 5.7 | 5.4 |
| Fidelity Series Blue Chip Growth Fund Class F | 4.9 | 4.9 |
| Fidelity Series Opportunistic Insights Fund Class F | 4.6 | 4.8 |
| | 76.2 | 74.4 |
Asset Allocation (% of fund's net assets)
| Period end |
| | Domestic Equity Funds | 63.9% |
| | International Equity Funds | 30.7% |
| | Bond Funds | 5.4% |

| Six months ago |
| | Domestic Equity Funds | 65.1% |
| | International Equity Funds | 29.4% |
| | Bond Funds | 5.4% |
| | Short-Term Funds | 0.1% |

Domestic Equity Funds category includes Fidelity Series Commodity Strategy Fund which invests in commodity-related investments.
Fidelity Freedom K® 2035 Fund
Investments September 30, 2016 (Unaudited)
Showing Percentage of Net Assets
| Domestic Equity Funds - 63.9% | | | |
| | | Shares | Value |
| Fidelity Series 100 Index Fund Class F (a) | | 16,491,110 | $235,493,047 |
| Fidelity Series 1000 Value Index Fund Class F (a) | | 23,257,506 | 260,018,919 |
| Fidelity Series All-Sector Equity Fund Class F (a) | | 33,295,969 | 447,164,857 |
| Fidelity Series Blue Chip Growth Fund Class F (a) | | 45,672,032 | 535,732,937 |
| Fidelity Series Commodity Strategy Fund Class F (a)(b) | | 34,146,192 | 182,682,127 |
| Fidelity Series Equity-Income Fund Class F (a) | | 86,771,544 | 1,074,231,709 |
| Fidelity Series Growth & Income Fund Class F (a) | | 58,660,272 | 786,634,250 |
| Fidelity Series Growth Company Fund Class F (a) | | 67,496,494 | 906,477,921 |
| Fidelity Series Intrinsic Opportunities Fund Class F (a) | | 41,361,293 | 622,073,843 |
| Fidelity Series Opportunistic Insights Fund Class F (a) | | 32,730,878 | 502,091,673 |
| Fidelity Series Real Estate Equity Fund Class F (a) | | 6,401,823 | 88,153,101 |
| Fidelity Series Small Cap Discovery Fund Class F (a) | | 12,875,612 | 135,837,711 |
| Fidelity Series Small Cap Opportunities Fund Class F (a) | | 31,299,370 | 414,090,671 |
| Fidelity Series Stock Selector Large Cap Value Fund Class F (a) | | 63,175,302 | 746,100,312 |
| TOTAL DOMESTIC EQUITY FUNDS | | | |
| (Cost $6,025,910,141) | | | 6,936,783,078 |
|
| International Equity Funds - 30.7% | | | |
| Fidelity Series Emerging Markets Fund Class F (a) | | 64,295,827 | 1,085,313,568 |
| Fidelity Series International Growth Fund Class F (a) | | 71,403,636 | 1,002,507,053 |
| Fidelity Series International Small Cap Fund Class F (a) | | 14,755,234 | 230,329,209 |
| Fidelity Series International Value Fund Class F (a) | | 105,838,556 | 1,006,524,667 |
| TOTAL INTERNATIONAL EQUITY FUNDS | | | |
| (Cost $3,084,116,629) | | | 3,324,674,497 |
|
| Bond Funds - 5.4% | | | |
| Fidelity Series Emerging Markets Debt Fund Class F (a) | | 7,060,064 | 73,142,263 |
| Fidelity Series Floating Rate High Income Fund Class F (a) | | 2,887,942 | 27,204,413 |
| Fidelity Series High Income Fund Class F (a) | | 33,399,534 | 312,619,641 |
| Fidelity Series Inflation-Protected Bond Index Fund Class F (a) | | 6,244,381 | 62,943,364 |
| Fidelity Series Investment Grade Bond Fund Class F (a) | | 4,425,971 | 51,341,259 |
| Fidelity Series Long-Term Treasury Bond Index Fund Class F (a) | | 6,386 | 61,622 |
| Fidelity Series Real Estate Income Fund Class F (a) | | 4,866,365 | 54,600,619 |
| TOTAL BOND FUNDS | | | |
| (Cost $587,100,389) | | | 581,913,181 |
|
| Short-Term Funds - 0.0% | | | |
| Fidelity Series Government Money Market Fund Class F 0.29% (a)(c) | | 3,166,123 | 3,166,123 |
| Fidelity Series Short-Term Credit Fund Class F (a) | | 177,478 | 1,780,107 |
| TOTAL SHORT-TERM FUNDS | | | |
| (Cost $4,934,078) | | | 4,946,230 |
| TOTAL INVESTMENT PORTFOLIO - 100.0% | | | |
| (Cost $9,702,061,237) | | | 10,848,316,986 |
| NET OTHER ASSETS (LIABILITIES) - 0.0% | | | (425,647) |
| NET ASSETS - 100% | | | $10,847,891,339 |
Legend
(a) Affiliated Fund
(b) Non-income producing
(c) The rate quoted is the annualized seven-day yield of the fund at period end.
Affiliated Underlying Funds
Information regarding the Fund's fiscal year to date purchases and sales of the affiliated Underlying Funds and income earned by the Fund from investments in affiliated Underlying Funds is as follows:
| Affiliate | Value, beginning of period | Purchases | Sales Proceeds | Dividend Income | Value, end of period |
| Fidelity Investments Money Market Portfolio Class F | $3,199,657 | $31,444 | $3,231,101 | $1,449 | $-- |
| Fidelity Series 100 Index Fund Class F | 226,990,439 | 15,742,333 | 20,966,826 | -- | 235,493,047 |
| Fidelity Series 1000 Value Index Fund Class F | 128,250,613 | 133,220,593 | 11,521,235 | -- | 260,018,919 |
| Fidelity Series All-Sector Equity Fund Class F | 715,396,000 | 34,885,221 | 350,387,533 | -- | 447,164,857 |
| Fidelity Series Blue Chip Growth Fund Class F | 496,572,828 | 35,981,322 | 36,664,086 | 1,424,594 | 535,732,937 |
| Fidelity Series Commodity Strategy Fund Class F | 126,919,928 | 51,156,464 | 6,320,944 | -- | 182,682,127 |
| Fidelity Series Emerging Markets Debt Fund Class F | 64,663,326 | 5,666,323 | 3,158,406 | 1,918,545 | 73,142,263 |
| Fidelity Series Emerging Markets Fund Class F | 938,510,058 | 59,269,686 | 37,450,274 | -- | 1,085,313,568 |
| Fidelity Series Equity-Income Fund Class F | 960,724,075 | 115,906,065 | 76,520,150 | 9,273,229 | 1,074,231,709 |
| Fidelity Series Floating Rate High Income Fund Class F | 25,324,613 | 2,133,778 | 1,500,018 | 589,071 | 27,204,413 |
| Fidelity Series Government Money Market Fund Class F 0.29% | -- | 3,294,723 | 128,600 | 2,961 | 3,166,123 |
| Fidelity Series Growth & Income Fund Class F | 736,846,410 | 59,041,060 | 65,888,025 | 6,574,092 | 786,634,250 |
| Fidelity Series Growth Company Fund Class F | 877,202,090 | 3,655,682 | 59,201,105 | -- | 906,477,921 |
| Fidelity Series High Income Fund Class F | 298,058,138 | 8,708,215 | 17,423,643 | 8,708,078 | 312,619,641 |
| Fidelity Series Inflation-Protected Bond Index Fund Class F | 50,431,341 | 13,880,422 | 2,368,361 | 61,818 | 62,943,364 |
| Fidelity Series International Growth Fund Class F | 904,618,302 | 105,848,610 | 55,919,074 | -- | 1,002,507,053 |
| Fidelity Series International Small Cap Fund Class F | 212,127,506 | 24,130,600 | 14,485,548 | -- | 230,329,209 |
| Fidelity Series International Value Fund Class F | 893,431,027 | 133,355,513 | 58,419,776 | -- | 1,006,524,667 |
| Fidelity Series Intrinsic Opportunities Fund Class F | 543,051,816 | 43,364,376 | -- | 4,742,453 | 622,073,843 |
| Fidelity Series Investment Grade Bond Fund Class F | 50,159,195 | 7,963,596 | 8,097,977 | 657,204 | 51,341,259 |
| Fidelity Series Long-Term Treasury Bond Index Fund Class F | -- | 63,913 | 148 | 282 | 61,622 |
| Fidelity Series Opportunistic Insights Fund Class F | 478,517,555 | 38,099,970 | 39,494,620 | -- | 502,091,673 |
| Fidelity Series Real Estate Equity Fund Class F | 88,817,470 | 12,295,238 | 11,067,911 | 856,274 | 88,153,101 |
| Fidelity Series Real Estate Income Fund Class F | 51,050,080 | 6,330,835 | 4,383,066 | 1,355,924 | 54,600,619 |
| Fidelity Series Short-Term Credit Fund Class F | 1,692,662 | 242,274 | 162,178 | 9,560 | 1,780,107 |
| Fidelity Series Small Cap Discovery Fund Class F | 127,937,209 | 10,138,777 | 9,543,179 | 228,157 | 135,837,711 |
| Fidelity Series Small Cap Opportunities Fund Class F | 384,821,942 | 28,377,443 | 32,781,126 | 1,416,213 | 414,090,671 |
| Fidelity Series Stock Selector Large Cap Value Fund Class F | 630,786,506 | 115,045,920 | 42,937,062 | -- | 746,100,312 |
| Total | $10,016,100,786 | $1,067,830,396 | $970,021,972 | $37,819,904 | $10,848,316,986 |
Investment Valuation
All investments are categorized as Level 1 under the Fair Value Hierarchy. The inputs or methodology used for valuing securities may not be an indication of the risk associated with investing in those securities. For more information on valuation inputs please refer to the Investment Valuation section in the accompanying Notes to Financial Statements.
See accompanying notes which are an integral part of the financial statements.
Fidelity Freedom K® 2035 Fund
Financial Statements
Statement of Assets and Liabilities
| | | September 30, 2016 (Unaudited) |
| Assets | | |
| Investment in securities, at value (cost $9,702,061,237) — See accompanying schedule | | $10,848,316,986 |
| Cash | | 5 |
| Receivable for investments sold | | 115,116,104 |
| Receivable for fund shares sold | | 24,933,202 |
| Total assets | | 10,988,366,297 |
| Liabilities | | |
| Payable for investments purchased | $7,537,909 | |
| Payable for fund shares redeemed | 132,512,241 | |
| Transfer agent fees payable | 424,808 | |
| Total liabilities | | 140,474,958 |
| Net Assets | | $10,847,891,339 |
| Net Assets consist of: | | |
| Paid in capital | | $9,712,174,187 |
| Undistributed net investment income | | 35,331,235 |
| Accumulated undistributed net realized gain (loss) on investments | | (45,869,832) |
| Net unrealized appreciation (depreciation) on investments | | 1,146,255,749 |
| Net Assets, for 701,642,754 shares outstanding | | $10,847,891,339 |
| Net Asset Value, offering price and redemption price per share ($10,847,891,339 ÷ 701,642,754 shares) | | $15.46 |
See accompanying notes which are an integral part of the financial statements.
Statement of Operations
| | | Six months ended September 30, 2016 (Unaudited) |
| Investment Income | | |
| Income distributions from underlying funds | | $37,819,904 |
| Expenses | | |
| Transfer agent fees | $2,442,066 | |
| Independent trustees' fees and expenses | 22,953 | |
| Total expenses | | 2,465,019 |
| Net investment income (loss) | | 35,354,885 |
| Realized and Unrealized Gain (Loss) | | |
| Realized gain (loss) on sale of underlying fund shares | 12,738,257 | |
| Capital gain distributions from underlying funds | 5,566,187 | |
| Total net realized gain (loss) | | 18,304,444 |
| Change in net unrealized appreciation (depreciation) on underlying funds | | 721,669,518 |
| Net gain (loss) | | 739,973,962 |
| Net increase (decrease) in net assets resulting from operations | | $775,328,847 |
See accompanying notes which are an integral part of the financial statements.
Statement of Changes in Net Assets
| | Six months ended September 30, 2016 (Unaudited) | Year ended March 31, 2016 |
| Increase (Decrease) in Net Assets | | |
| Operations | | |
| Net investment income (loss) | $35,354,885 | $158,099,951 |
| Net realized gain (loss) | 18,304,444 | 361,799,361 |
| Change in net unrealized appreciation (depreciation) | 721,669,518 | (866,304,472) |
| Net increase (decrease) in net assets resulting from operations | 775,328,847 | (346,405,160) |
| Distributions to shareholders from net investment income | (5,452,976) | (160,712,475) |
| Distributions to shareholders from net realized gain | (233,791,213) | (392,483,815) |
| Total distributions | (239,244,189) | (553,196,290) |
| Share transactions | | |
| Proceeds from sales of shares | 1,442,633,070 | 2,926,014,268 |
| Reinvestment of distributions | 239,244,189 | 553,196,290 |
| Cost of shares redeemed | (1,385,790,732) | (2,689,359,298) |
| Net increase (decrease) in net assets resulting from share transactions | 296,086,527 | 789,851,260 |
| Total increase (decrease) in net assets | 832,171,185 | (109,750,190) |
| Net Assets | | |
| Beginning of period | 10,015,720,154 | 10,125,470,344 |
| End of period | $10,847,891,339 | $10,015,720,154 |
| Other Information | | |
| Undistributed net investment income end of period | $35,331,235 | $5,429,326 |
| Shares | | |
| Sold | 96,786,467 | 192,872,466 |
| Issued in reinvestment of distributions | 16,742,070 | 35,692,536 |
| Redeemed | (93,022,523) | (176,412,802) |
| Net increase (decrease) | 20,506,014 | 52,152,200 |
See accompanying notes which are an integral part of the financial statements.
Financial Highlights — Fidelity Freedom K 2035 Fund
| | Six months ended (Unaudited) September 30, | Years ended March 31, | | | | |
| | 2016 | 2016 | 2015 | 2014 | 2013 | 2012 |
| Selected Per–Share Data | | | | | | |
| Net asset value, beginning of period | $14.70 | $16.10 | $16.55 | $14.75 | $13.88 | $14.46 |
| Income from Investment Operations | | | | | | |
| Net investment income (loss)A | .05 | .24 | .28 | .23 | .26 | .24 |
| Net realized and unrealized gain (loss) | 1.06 | (.78) | .95 | 1.92 | 1.09 | (.17) |
| Total from investment operations | 1.11 | (.54) | 1.23 | 2.15 | 1.35 | .07 |
| Distributions from net investment income | (.01) | (.25) | (.48) | (.02) | (.24) | (.20) |
| Distributions from net realized gain | (.34) | (.61) | (1.19) | (.32) | (.23) | (.45) |
| Total distributions | (.35) | (.86) | (1.68)B | (.35)C | (.48)D | (.65) |
| Net asset value, end of period | $15.46 | $14.70 | $16.10 | $16.55 | $14.75 | $13.88 |
| Total ReturnE | 7.75% | (3.57)% | 8.08% | 14.83% | 10.01% | .78% |
| Ratios to Average Net AssetsF,G | | | | | | |
| Expenses before reductions | .05%H | .05% | .05% | .05% | .05% | .05% |
| Expenses net of fee waivers, if any | .05%H | .05% | .05% | .05% | .05% | .05% |
| Expenses net of all reductions | .05%H | .05% | .05% | .05% | .05% | .05% |
| Net investment income (loss) | .68%H | 1.60% | 1.75% | 1.50% | 1.90% | 1.81% |
| Supplemental Data | | | | | | |
| Net assets, end of period (000 omitted) | $10,847,891 | $10,015,720 | $10,125,470 | $9,083,080 | $7,329,244 | $4,783,034 |
| Portfolio turnover rateF | 19%H | 17% | 19% | 50% | 26% | 17% |
A Calculated based on average shares outstanding during the period.
B Total distributions of $1.68 per share is comprised of distributions from net investment income of $.484 and distributions from net realized gain of $1.191 per share.
C Total distributions of $.35 per share is comprised of distributions from net investment income of $.022 and distributions from net realized gain of $.323 per share.
D Total distributions of $.48 per share is comprised of distributions from net investment income of $.243 and distributions from net realized gain of $.232 per share.
E Total returns for periods of less than one year are not annualized.
F Amounts do not include the activity of the Underlying Funds.
G Expense ratios reflect operating expenses of the Fund. Expenses before reductions do not reflect amounts reimbursed by the investment adviser or reductions from expense offset arrangements and do not represent the amount paid by the Fund during periods when reimbursements or reductions occur. Expenses net of fee waivers reflect expenses after reimbursement by the investment adviser but prior to reductions from expense offset arrangements. Expenses net of all reductions represent the net expenses paid by the Fund but do not include expenses of the underlying funds in which the Fund invests.
H Annualized
See accompanying notes which are an integral part of the financial statements.
Fidelity Freedom K® 2040 Fund
Investment Summary (Unaudited)
The information in the following tables is based on the direct investments of the Fund.
Top Holdings as of September 30, 2016
| | % of fund's net assets | % of fund's net assets 6 months ago |
| Fidelity Series Emerging Markets Fund Class F | 10.0 | 9.4 |
| Fidelity Series Equity-Income Fund Class F | 9.9 | 9.6 |
| Fidelity Series International Value Fund Class F | 9.3 | 8.9 |
| Fidelity Series International Growth Fund Class F | 9.2 | 9.0 |
| Fidelity Series Growth Company Fund Class F | 8.4 | 8.7 |
| Fidelity Series Growth & Income Fund Class F | 7.2 | 7.3 |
| Fidelity Series Stock Selector Large Cap Value Fund Class F | 6.9 | 6.3 |
| Fidelity Series Intrinsic Opportunities Fund Class F | 5.7 | 5.4 |
| Fidelity Series Blue Chip Growth Fund Class F | 4.9 | 5.0 |
| Fidelity Series Opportunistic Insights Fund Class F | 4.6 | 4.8 |
| | 76.1 | 74.4 |
Asset Allocation (% of fund's net assets)
| Period end |
| | Domestic Equity Funds | 63.9% |
| | International Equity Funds | 30.6% |
| | Bond Funds | 5.4% |
| | Short-Term Funds | 0.1% |

| Six months ago |
| | Domestic Equity Funds | 65.1% |
| | International Equity Funds | 29.4% |
| | Bond Funds | 5.4% |
| | Short-Term Funds | 0.1% |

Domestic Equity Funds category includes Fidelity Series Commodity Strategy Fund which invests in commodity-related investments.
Fidelity Freedom K® 2040 Fund
Investments September 30, 2016 (Unaudited)
Showing Percentage of Net Assets
| Domestic Equity Funds - 63.9% | | | |
| | | Shares | Value |
| Fidelity Series 100 Index Fund Class F (a) | | 17,633,315 | $251,803,738 |
| Fidelity Series 1000 Value Index Fund Class F (a) | | 24,856,893 | 277,900,066 |
| Fidelity Series All-Sector Equity Fund Class F (a) | | 35,612,924 | 478,281,573 |
| Fidelity Series Blue Chip Growth Fund Class F (a) | | 48,795,990 | 572,376,963 |
| Fidelity Series Commodity Strategy Fund Class F (a)(b) | | 36,207,955 | 193,712,558 |
| Fidelity Series Equity-Income Fund Class F (a) | | 92,708,665 | 1,147,733,274 |
| Fidelity Series Growth & Income Fund Class F (a) | | 62,662,178 | 840,299,801 |
| Fidelity Series Growth Company Fund Class F (a) | | 72,596,181 | 974,966,707 |
| Fidelity Series Intrinsic Opportunities Fund Class F (a) | | 43,876,726 | 659,905,962 |
| Fidelity Series Opportunistic Insights Fund Class F (a) | | 34,959,692 | 536,281,683 |
| Fidelity Series Real Estate Equity Fund Class F (a) | | 6,837,472 | 94,151,985 |
| Fidelity Series Small Cap Discovery Fund Class F (a) | | 13,780,892 | 145,388,414 |
| Fidelity Series Small Cap Opportunities Fund Class F (a) | | 33,439,639 | 442,406,424 |
| Fidelity Series Stock Selector Large Cap Value Fund Class F (a) | | 67,499,387 | 797,167,765 |
| TOTAL DOMESTIC EQUITY FUNDS | | | |
| (Cost $6,407,184,936) | | | 7,412,376,913 |
|
| International Equity Funds - 30.6% | | | |
| Fidelity Series Emerging Markets Fund Class F (a) | | 68,649,210 | 1,158,798,671 |
| Fidelity Series International Growth Fund Class F (a) | | 76,312,195 | 1,071,423,218 |
| Fidelity Series International Small Cap Fund Class F (a) | | 15,769,253 | 246,158,034 |
| Fidelity Series International Value Fund Class F (a) | | 113,112,449 | 1,075,699,389 |
| TOTAL INTERNATIONAL EQUITY FUNDS | | | |
| (Cost $3,279,885,920) | | | 3,552,079,312 |
|
| Bond Funds - 5.4% | | | |
| Fidelity Series Emerging Markets Debt Fund Class F (a) | | 7,516,595 | 77,871,925 |
| Fidelity Series Floating Rate High Income Fund Class F (a) | | 3,091,374 | 29,120,744 |
| Fidelity Series High Income Fund Class F (a) | | 36,139,782 | 338,268,357 |
| Fidelity Series Inflation-Protected Bond Index Fund Class F (a) | | 6,497,217 | 65,491,947 |
| Fidelity Series Investment Grade Bond Fund Class F (a) | | 4,726,701 | 54,829,737 |
| Fidelity Series Long-Term Treasury Bond Index Fund Class F (a) | | 6,884 | 66,429 |
| Fidelity Series Real Estate Income Fund Class F (a) | | 5,206,438 | 58,416,233 |
| TOTAL BOND FUNDS | | | |
| (Cost $629,669,712) | | | 624,065,372 |
|
| Short-Term Funds - 0.1% | | | |
| Fidelity Series Government Money Market Fund Class F 0.29% (a)(c) | | 3,355,254 | 3,355,254 |
| Fidelity Series Short-Term Credit Fund Class F (a) | | 189,692 | 1,902,615 |
| TOTAL SHORT-TERM FUNDS | | | |
| (Cost $5,244,543) | | | 5,257,869 |
| TOTAL INVESTMENT PORTFOLIO - 100.0% | | | |
| (Cost $10,321,985,111) | | | 11,593,779,466 |
| NET OTHER ASSETS (LIABILITIES) - 0.0% | | | (453,190) |
| NET ASSETS - 100% | | | $11,593,326,276 |
Legend
(a) Affiliated Fund
(b) Non-income producing
(c) The rate quoted is the annualized seven-day yield of the fund at period end.
Affiliated Underlying Funds
Information regarding the Fund's fiscal year to date purchases and sales of the affiliated Underlying Funds and income earned by the Fund from investments in affiliated Underlying Funds is as follows:
| Affiliate | Value, beginning of period | Purchases | Sales Proceeds | Dividend Income | Value, end of period |
| Fidelity Investments Money Market Portfolio Class F | $3,420,877 | $26,872 | $3,447,749 | $1,548 | $-- |
| Fidelity Series 100 Index Fund Class F | 242,337,354 | 14,112,524 | 19,294,388 | -- | 251,803,738 |
| Fidelity Series 1000 Value Index Fund Class F | 137,301,925 | 139,966,018 | 10,105,068 | -- | 277,900,066 |
| Fidelity Series All-Sector Equity Fund Class F | 764,964,074 | 32,420,560 | 369,555,185 | -- | 478,281,573 |
| Fidelity Series Blue Chip Growth Fund Class F | 531,046,100 | 32,292,462 | 33,479,138 | 1,514,277 | 572,376,963 |
| Fidelity Series Commodity Strategy Fund Class F | 135,495,436 | 51,435,142 | 4,671,077 | -- | 193,712,558 |
| Fidelity Series Emerging Markets Debt Fund Class F | 69,041,094 | 5,351,505 | 2,895,499 | 2,048,905 | 77,871,925 |
| Fidelity Series Emerging Markets Fund Class F | 1,003,106,049 | 52,239,022 | 29,924,659 | -- | 1,158,798,671 |
| Fidelity Series Equity-Income Fund Class F | 1,027,845,961 | 110,936,436 | 70,166,804 | 9,926,007 | 1,147,733,274 |
| Fidelity Series Floating Rate High Income Fund Class F | 27,114,810 | 1,994,005 | 1,321,670 | 630,352 | 29,120,744 |
| Fidelity Series Government Money Market Fund Class F 0.29% | -- | 3,454,940 | 99,686 | 3,134 | 3,355,254 |
| Fidelity Series Growth & Income Fund Class F | 787,900,729 | 53,283,299 | 61,332,544 | 7,034,072 | 840,299,801 |
| Fidelity Series Growth Company Fund Class F | 937,793,949 | 2,145,883 | 55,720,186 | -- | 974,966,707 |
| Fidelity Series High Income Fund Class F | 319,182,435 | 9,365,207 | 15,305,415 | 9,365,070 | 338,268,357 |
| Fidelity Series Inflation-Protected Bond Index Fund Class F | 54,004,545 | 12,620,276 | 2,196,508 | 65,866 | 65,491,947 |
| Fidelity Series International Growth Fund Class F | 966,576,058 | 102,381,607 | 48,697,633 | -- | 1,071,423,218 |
| Fidelity Series International Small Cap Fund Class F | 226,686,525 | 23,612,413 | 13,291,108 | -- | 246,158,034 |
| Fidelity Series International Value Fund Class F | 955,450,851 | 130,948,340 | 51,420,516 | -- | 1,075,699,389 |
| Fidelity Series Intrinsic Opportunities Fund Class F | 578,016,747 | 43,912,076 | -- | 5,031,128 | 659,905,962 |
| Fidelity Series Investment Grade Bond Fund Class F | 53,621,689 | 9,054,377 | 9,247,516 | 700,819 | 54,829,737 |
| Fidelity Series Long-Term Treasury Bond Index Fund Class F | -- | 69,104 | 380 | 304 | 66,429 |
| Fidelity Series Opportunistic Insights Fund Class F | 511,538,043 | 34,558,196 | 36,451,179 | -- | 536,281,683 |
| Fidelity Series Real Estate Equity Fund Class F | 95,153,630 | 11,911,726 | 10,881,795 | 914,396 | 94,151,985 |
| Fidelity Series Real Estate Income Fund Class F | 54,570,903 | 6,220,834 | 4,090,168 | 1,449,462 | 58,416,233 |
| Fidelity Series Short-Term Credit Fund Class F | 1,799,192 | 243,249 | 147,508 | 10,172 | 1,902,615 |
| Fidelity Series Small Cap Discovery Fund Class F | 136,770,800 | 9,452,168 | 8,618,488 | 243,755 | 145,388,414 |
| Fidelity Series Small Cap Opportunities Fund Class F | 412,195,705 | 25,167,715 | 30,873,613 | 1,505,241 | 442,406,424 |
| Fidelity Series Stock Selector Large Cap Value Fund Class F | 674,519,863 | 114,105,800 | 37,538,537 | -- | 797,167,765 |
| Total | $10,707,455,344 | $1,033,281,756 | $930,774,017 | $40,444,508 | $11,593,779,466 |
Investment Valuation
All investments are categorized as Level 1 under the Fair Value Hierarchy. The inputs or methodology used for valuing securities may not be an indication of the risk associated with investing in those securities. For more information on valuation inputs please refer to the Investment Valuation section in the accompanying Notes to Financial Statements.
See accompanying notes which are an integral part of the financial statements.
Fidelity Freedom K® 2040 Fund
Financial Statements
Statement of Assets and Liabilities
| | | September 30, 2016 (Unaudited) |
| Assets | | |
| Investment in securities, at value (cost $10,321,985,111) — See accompanying schedule | | $11,593,779,466 |
| Receivable for investments sold | | 79,266,141 |
| Receivable for fund shares sold | | 26,077,625 |
| Total assets | | 11,699,123,232 |
| Liabilities | | |
| Payable for investments purchased | $6,940,345 | |
| Payable for fund shares redeemed | 98,403,942 | |
| Transfer agent fees payable | 452,669 | |
| Total liabilities | | 105,796,956 |
| Net Assets | | $11,593,326,276 |
| Net Assets consist of: | | |
| Paid in capital | | $10,321,675,490 |
| Undistributed net investment income | | 37,254,800 |
| Accumulated undistributed net realized gain (loss) on investments | | (37,398,369) |
| Net unrealized appreciation (depreciation) on investments | | 1,271,794,355 |
| Net Assets, for 748,258,593 shares outstanding | | $11,593,326,276 |
| Net Asset Value, offering price and redemption price per share ($11,593,326,276 ÷ 748,258,593 shares) | | $15.49 |
See accompanying notes which are an integral part of the financial statements.
Statement of Operations
| | | Six months ended September 30, 2016 (Unaudited) |
| Investment Income | | |
| Income distributions from underlying funds | | $40,444,508 |
| Expenses | | |
| Transfer agent fees | $2,608,915 | |
| Independent trustees' fees and expenses | 24,542 | |
| Total expenses | | 2,633,457 |
| Net investment income (loss) | | 37,811,051 |
| Realized and Unrealized Gain (Loss) | | |
| Realized gain (loss) on sale of underlying fund shares | 19,772,346 | |
| Capital gain distributions from underlying funds | 5,941,735 | |
| Total net realized gain (loss) | | 25,714,081 |
| Change in net unrealized appreciation (depreciation) on underlying funds | | 764,044,029 |
| Net gain (loss) | | 789,758,110 |
| Net increase (decrease) in net assets resulting from operations | | $827,569,161 |
See accompanying notes which are an integral part of the financial statements.
Statement of Changes in Net Assets
| | Six months ended September 30, 2016 (Unaudited) | Year ended March 31, 2016 |
| Increase (Decrease) in Net Assets | | |
| Operations | | |
| Net investment income (loss) | $37,811,051 | $168,721,917 |
| Net realized gain (loss) | 25,714,081 | 394,347,635 |
| Change in net unrealized appreciation (depreciation) | 764,044,029 | (932,691,107) |
| Net increase (decrease) in net assets resulting from operations | 827,569,161 | (369,621,555) |
| Distributions to shareholders from net investment income | (6,535,411) | (171,478,017) |
| Distributions to shareholders from net realized gain | (249,795,741) | (426,027,288) |
| Total distributions | (256,331,152) | (597,505,305) |
| Share transactions | | |
| Proceeds from sales of shares | 1,420,075,553 | 3,092,013,184 |
| Reinvestment of distributions | 256,331,152 | 597,505,305 |
| Cost of shares redeemed | (1,361,366,299) | (2,935,427,884) |
| Net increase (decrease) in net assets resulting from share transactions | 315,040,406 | 754,090,605 |
| Total increase (decrease) in net assets | 886,278,415 | (213,036,255) |
| Net Assets | | |
| Beginning of period | 10,707,047,861 | 10,920,084,116 |
| End of period | $11,593,326,276 | $10,707,047,861 |
| Other Information | | |
| Undistributed net investment income end of period | $37,254,800 | $5,979,160 |
| Shares | | |
| Sold | 95,048,156 | 203,617,289 |
| Issued in reinvestment of distributions | 17,900,220 | 38,462,739 |
| Redeemed | (91,228,852) | (192,015,904) |
| Net increase (decrease) | 21,719,524 | 50,064,124 |
See accompanying notes which are an integral part of the financial statements.
Financial Highlights — Fidelity Freedom K 2040 Fund
| | Six months ended (Unaudited) September 30, | Years ended March 31, | | | | |
| September 30, February 28, | 2016 | 2016 | 2015 | 2014 | 2013 | 2012 |
| Selected Per–Share Data | | | | | | |
| Net asset value, beginning of period | $14.74 | $16.14 | $16.65 | $14.80 | $13.93 | $14.55 |
| Income from Investment Operations | | | | | | |
| Net investment income (loss)A | .05 | .24 | .28 | .23 | .26 | .24 |
| Net realized and unrealized gain (loss) | 1.05 | (.77) | .94 | 1.98 | 1.09 | (.19) |
| Total from investment operations | 1.10 | (.53) | 1.22 | 2.21 | 1.35 | .05 |
| Distributions from net investment income | (.01) | (.25) | (.49) | (.02) | (.25) | (.20) |
| Distributions from net realized gain | (.34) | (.63) | (1.24) | (.33) | (.24) | (.47) |
| Total distributions | (.35) | (.87)B | (1.73) | (.36)C | (.48)D | (.67) |
| Net asset value, end of period | $15.49 | $14.74 | $16.14 | $16.65 | $14.80 | $13.93 |
| Total ReturnE | 7.68% | (3.48)% | 8.01% | 15.20% | 10.04% | .67% |
| Ratios to Average Net AssetsF,G | | | | | | |
| Expenses before reductions | .05%H | .05% | .05% | .05% | .05% | .05% |
| Expenses net of fee waivers, if any | .05%H | .05% | .05% | .05% | .05% | .05% |
| Expenses net of all reductions | .05%H | .05% | .05% | .05% | .05% | .05% |
| Net investment income (loss) | .68%H | 1.60% | 1.74% | 1.47% | 1.90% | 1.82% |
| Supplemental Data | | | | | | |
| Net assets, end of period (000 omitted) | $11,593,326 | $10,707,048 | $10,920,084 | $9,893,027 | $8,210,196 | $5,609,633 |
| Portfolio turnover rateF | 17%H | 17% | 19% | 50% | 27% | 18% |
A Calculated based on average shares outstanding during the period.
B Total distributions of $.87 per share is comprised of distributions from net investment income of $.247 and distributions from net realized gain of $.625 per share.
C Total distributions of $.36 per share is comprised of distributions from net investment income of $.022 and distributions from net realized gain of $.334 per share.
D Total distributions of $.48 per share is comprised of distributions from net investment income of $.245 and distributions from net realized gain of $.237 per share.
E Total returns for periods of less than one year are not annualized.
F Amounts do not include the activity of the Underlying Funds.
G Expense ratios reflect operating expenses of the Fund. Expenses before reductions do not reflect amounts reimbursed by the investment adviser or reductions from expense offset arrangements and do not represent the amount paid by the Fund during periods when reimbursements or reductions occur. Expenses net of fee waivers reflect expenses after reimbursement by the investment adviser but prior to reductions from expense offset arrangements. Expenses net of all reductions represent the net expenses paid by the Fund but do not include expenses of the underlying funds in which the Fund invests.
H Annualized
See accompanying notes which are an integral part of the financial statements.
Fidelity Freedom K® 2045 Fund
Investment Summary (Unaudited)
The information in the following tables is based on the direct investments of the Fund.
Top Holdings as of September 30, 2016
| | % of fund's net assets | % of fund's net assets 6 months ago |
| Fidelity Series Emerging Markets Fund Class F | 10.0 | 9.4 |
| Fidelity Series Equity-Income Fund Class F | 9.9 | 9.6 |
| Fidelity Series International Value Fund Class F | 9.3 | 8.9 |
| Fidelity Series International Growth Fund Class F | 9.3 | 9.1 |
| Fidelity Series Growth Company Fund Class F | 8.3 | 8.7 |
| Fidelity Series Growth & Income Fund Class F | 7.3 | 7.3 |
| Fidelity Series Stock Selector Large Cap Value Fund Class F | 6.9 | 6.3 |
| Fidelity Series Intrinsic Opportunities Fund Class F | 5.7 | 5.4 |
| Fidelity Series Blue Chip Growth Fund Class F | 5.0 | 5.0 |
| Fidelity Series Opportunistic Insights Fund Class F | 4.6 | 4.8 |
| | 76.3 | 74.5 |
Asset Allocation (% of fund's net assets)
| Period end |
| | Domestic Equity Funds | 64.0% |
| | International Equity Funds | 30.7% |
| | Bond Funds | 5.3% |

| Six months ago |
| | Domestic Equity Funds | 65.1% |
| | International Equity Funds | 29.5% |
| | Bond Funds | 5.4% |

Domestic Equity Funds category includes Fidelity Series Commodity Strategy Fund which invests in commodity-related investments.
Fidelity Freedom K® 2045 Fund
Investments September 30, 2016 (Unaudited)
Showing Percentage of Net Assets
| Domestic Equity Funds - 64.0% | | | |
| | | Shares | Value |
| Fidelity Series 100 Index Fund Class F (a) | | 10,682,126 | $152,540,753 |
| Fidelity Series 1000 Value Index Fund Class F (a) | | 15,128,048 | 169,131,578 |
| Fidelity Series All-Sector Equity Fund Class F (a) | | 21,523,943 | 289,066,549 |
| Fidelity Series Blue Chip Growth Fund Class F (a) | | 29,646,374 | 347,751,970 |
| Fidelity Series Commodity Strategy Fund Class F (a)(b) | | 22,472,299 | 120,226,799 |
| Fidelity Series Equity-Income Fund Class F (a) | | 56,289,770 | 696,867,353 |
| Fidelity Series Growth & Income Fund Class F (a) | | 38,084,550 | 510,713,819 |
| Fidelity Series Growth Company Fund Class F (a) | | 43,229,390 | 580,570,713 |
| Fidelity Series Intrinsic Opportunities Fund Class F (a) | | 26,620,722 | 400,375,660 |
| Fidelity Series Opportunistic Insights Fund Class F (a) | | 21,262,496 | 326,166,681 |
| Fidelity Series Real Estate Equity Fund Class F (a) | | 4,170,558 | 57,428,588 |
| Fidelity Series Small Cap Discovery Fund Class F (a) | | 8,324,937 | 87,828,089 |
| Fidelity Series Small Cap Opportunities Fund Class F (a) | | 20,314,703 | 268,763,517 |
| Fidelity Series Stock Selector Large Cap Value Fund Class F (a) | | 41,005,750 | 484,277,907 |
| TOTAL DOMESTIC EQUITY FUNDS | | | |
| (Cost $3,966,904,023) | | | 4,491,709,976 |
|
| International Equity Funds - 30.7% | | | |
| Fidelity Series Emerging Markets Fund Class F (a) | | 41,616,381 | 702,484,504 |
| Fidelity Series International Growth Fund Class F (a) | | 46,210,567 | 648,796,365 |
| Fidelity Series International Small Cap Fund Class F (a) | | 9,548,998 | 149,059,853 |
| Fidelity Series International Value Fund Class F (a) | | 68,494,462 | 651,382,332 |
| TOTAL INTERNATIONAL EQUITY FUNDS | | | |
| (Cost $2,017,811,795) | | | 2,151,723,054 |
|
| Bond Funds - 5.3% | | | |
| Fidelity Series Emerging Markets Debt Fund Class F (a) | | 4,523,773 | 46,866,291 |
| Fidelity Series Floating Rate High Income Fund Class F (a) | | 1,869,405 | 17,609,791 |
| Fidelity Series High Income Fund Class F (a) | | 21,024,017 | 196,784,797 |
| Fidelity Series Inflation-Protected Bond Index Fund Class F (a) | | 4,191,084 | 42,246,124 |
| Fidelity Series Investment Grade Bond Fund Class F (a) | | 3,015,437 | 34,979,064 |
| Fidelity Series Long-Term Treasury Bond Index Fund Class F (a) | | 4,228 | 40,799 |
| Fidelity Series Real Estate Income Fund Class F (a) | | 3,138,016 | 35,208,539 |
| TOTAL BOND FUNDS | | | |
| (Cost $375,934,988) | | | 373,735,405 |
|
| Short-Term Funds - 0.0% | | | |
| Fidelity Series Government Money Market Fund Class F 0.29% (a)(c) | | 2,173,961 | 2,173,961 |
| Fidelity Series Short-Term Credit Fund Class F (a) | | 115,624 | 1,159,708 |
| TOTAL SHORT-TERM FUNDS | | | |
| (Cost $3,325,939) | | | 3,333,669 |
| TOTAL INVESTMENT PORTFOLIO - 100.0% | | | |
| (Cost $6,363,976,745) | | | 7,020,502,104 |
| NET OTHER ASSETS (LIABILITIES) - 0.0% | | | (273,291) |
| NET ASSETS - 100% | | | $7,020,228,813 |
Legend
(a) Affiliated Fund
(b) Non-income producing
(c) The rate quoted is the annualized seven-day yield of the fund at period end.
Affiliated Underlying Funds
Information regarding the Fund's fiscal year to date purchases and sales of the affiliated Underlying Funds and income earned by the Fund from investments in affiliated Underlying Funds is as follows:
| Affiliate | Value, beginning of period | Purchases | Sales Proceeds | Dividend Income | Value, end of period |
| Fidelity Investments Money Market Portfolio Class F | $2,005,037 | $23,636 | $2,028,673 | $909 | $-- |
| Fidelity Series 100 Index Fund Class F | 142,424,732 | 13,712,217 | 12,302,774 | -- | 152,540,753 |
| Fidelity Series 1000 Value Index Fund Class F | 80,358,723 | 88,181,970 | 5,798,872 | -- | 169,131,578 |
| Fidelity Series All-Sector Equity Fund Class F | 448,423,167 | 29,550,479 | 218,873,747 | -- | 289,066,549 |
| Fidelity Series Blue Chip Growth Fund Class F | 311,263,739 | 31,476,875 | 20,417,099 | 916,526 | 347,751,970 |
| Fidelity Series Commodity Strategy Fund Class F | 79,791,952 | 37,627,083 | 4,145,780 | -- | 120,226,799 |
| Fidelity Series Emerging Markets Debt Fund Class F | 40,451,314 | 4,528,938 | 1,884,639 | 1,213,190 | 46,866,291 |
| Fidelity Series Emerging Markets Fund Class F | 588,462,875 | 52,565,182 | 18,100,718 | -- | 702,484,504 |
| Fidelity Series Equity-Income Fund Class F | 602,562,989 | 89,770,450 | 42,502,895 | 5,859,158 | 696,867,353 |
| Fidelity Series Floating Rate High Income Fund Class F | 15,889,446 | 1,741,799 | 810,104 | 373,788 | 17,609,791 |
| Fidelity Series Government Money Market Fund Class F 0.29% | -- | 2,229,854 | 55,894 | 1,889 | 2,173,961 |
| Fidelity Series Growth & Income Fund Class F | 461,863,178 | 50,139,305 | 37,287,361 | 4,141,691 | 510,713,819 |
| Fidelity Series Growth Company Fund Class F | 549,265,039 | 7,175,768 | 29,585,823 | -- | 580,570,713 |
| Fidelity Series High Income Fund Class F | 186,024,267 | 5,443,157 | 9,231,821 | 5,443,039 | 196,784,797 |
| Fidelity Series Inflation-Protected Bond Index Fund Class F | 31,631,863 | 11,423,365 | 1,453,650 | 39,727 | 42,246,124 |
| Fidelity Series International Growth Fund Class F | 567,357,027 | 81,538,486 | 30,538,528 | -- | 648,796,365 |
| Fidelity Series International Small Cap Fund Class F | 133,025,622 | 18,835,045 | 8,318,817 | -- | 149,059,853 |
| Fidelity Series International Value Fund Class F | 559,945,688 | 99,115,361 | 32,024,970 | -- | 651,382,332 |
| Fidelity Series Intrinsic Opportunities Fund Class F | 339,500,858 | 38,223,574 | -- | 3,045,873 | 400,375,660 |
| Fidelity Series Investment Grade Bond Fund Class F | 31,437,872 | 6,640,422 | 3,932,225 | 418,349 | 34,979,064 |
| Fidelity Series Long-Term Treasury Bond Index Fund Class F | -- | 42,410 | 230 | 185 | 40,799 |
| Fidelity Series Opportunistic Insights Fund Class F | 299,959,801 | 32,585,166 | 22,264,041 | -- | 326,166,681 |
| Fidelity Series Real Estate Equity Fund Class F | 55,649,234 | 9,507,677 | 6,476,152 | 546,098 | 57,428,588 |
| Fidelity Series Real Estate Income Fund Class F | 31,926,007 | 4,758,070 | 2,480,622 | 859,354 | 35,208,539 |
| Fidelity Series Short-Term Credit Fund Class F | 1,065,357 | 181,368 | 91,670 | 6,075 | 1,159,708 |
| Fidelity Series Small Cap Discovery Fund Class F | 80,524,197 | 8,248,178 | 5,585,970 | 144,142 | 87,828,089 |
| Fidelity Series Small Cap Opportunities Fund Class F | 241,558,521 | 24,613,030 | 18,814,355 | 911,211 | 268,763,517 |
| Fidelity Series Stock Selector Large Cap Value Fund Class F | 395,372,623 | 84,239,926 | 22,704,750 | -- | 484,277,907 |
| Total | $6,277,741,128 | $834,118,791 | $557,712,180 | $23,921,204 | $7,020,502,104 |
Investment Valuation
All investments are categorized as Level 1 under the Fair Value Hierarchy. The inputs or methodology used for valuing securities may not be an indication of the risk associated with investing in those securities. For more information on valuation inputs please refer to the Investment Valuation section in the accompanying Notes to Financial Statements.
See accompanying notes which are an integral part of the financial statements.
Fidelity Freedom K® 2045 Fund
Financial Statements
Statement of Assets and Liabilities
| | | September 30, 2016 (Unaudited) |
| Assets | | |
| Investment in securities, at value (cost $6,363,976,745) — See accompanying schedule | | $7,020,502,104 |
| Receivable for investments sold | | 32,736,077 |
| Receivable for fund shares sold | | 23,380,212 |
| Total assets | | 7,076,618,393 |
| Liabilities | | |
| Payable for investments purchased | $7,094,130 | |
| Payable for fund shares redeemed | 49,022,909 | |
| Transfer agent fees payable | 272,541 | |
| Total liabilities | | 56,389,580 |
| Net Assets | | $7,020,228,813 |
| Net Assets consist of: | | |
| Paid in capital | | $6,376,101,690 |
| Undistributed net investment income | | 22,265,758 |
| Accumulated undistributed net realized gain (loss) on investments | | (34,663,994) |
| Net unrealized appreciation (depreciation) on investments | | 656,525,359 |
| Net Assets, for 440,318,675 shares outstanding | | $7,020,228,813 |
| Net Asset Value, offering price and redemption price per share ($7,020,228,813 ÷ 440,318,675 shares) | | $15.94 |
See accompanying notes which are an integral part of the financial statements.
Statement of Operations
| | | Six months ended September 30, 2016 (Unaudited) |
| Investment Income | | |
| Income distributions from underlying funds | | $23,921,204 |
| Expenses | | |
| Transfer agent fees | $1,548,728 | |
| Independent trustees' fees and expenses | 14,486 | |
| Total expenses | | 1,563,214 |
| Net investment income (loss) | | 22,357,990 |
| Realized and Unrealized Gain (Loss) | | |
| Realized gain (loss) on sale of underlying fund shares | 881,405 | |
| Capital gain distributions from underlying funds | 3,572,251 | |
| Total net realized gain (loss) | | 4,453,656 |
| Change in net unrealized appreciation (depreciation) on underlying funds | | 465,472,955 |
| Net gain (loss) | | 469,926,611 |
| Net increase (decrease) in net assets resulting from operations | | $492,284,601 |
See accompanying notes which are an integral part of the financial statements.
Statement of Changes in Net Assets
| | Six months ended September 30, 2016 (Unaudited) | Year ended March 31, 2016 |
| Increase (Decrease) in Net Assets | | |
| Operations | | |
| Net investment income (loss) | $22,357,990 | $96,142,497 |
| Net realized gain (loss) | 4,453,656 | 216,364,451 |
| Change in net unrealized appreciation (depreciation) | 465,472,955 | (519,505,539) |
| Net increase (decrease) in net assets resulting from operations | 492,284,601 | (206,998,591) |
| Distributions to shareholders from net investment income | (3,749,288) | (97,337,840) |
| Distributions to shareholders from net realized gain | (144,547,327) | (226,831,217) |
| Total distributions | (148,296,615) | (324,169,057) |
| Share transactions | | |
| Proceeds from sales of shares | 1,110,218,386 | 2,190,827,467 |
| Reinvestment of distributions | 148,296,615 | 324,169,057 |
| Cost of shares redeemed | (859,777,513) | (1,672,699,231) |
| Net increase (decrease) in net assets resulting from share transactions | 398,737,488 | 842,297,293 |
| Total increase (decrease) in net assets | 742,725,474 | 311,129,645 |
| Net Assets | | |
| Beginning of period | 6,277,503,339 | 5,966,373,694 |
| End of period | $7,020,228,813 | $6,277,503,339 |
| Other Information | | |
| Undistributed net investment income end of period | $22,265,758 | $3,657,056 |
| Shares | | |
| Sold | 72,130,185 | 140,364,566 |
| Issued in reinvestment of distributions | 10,060,825 | 20,313,535 |
| Redeemed | (56,023,692) | (106,684,756) |
| Net increase (decrease) | 26,167,318 | 53,993,345 |
See accompanying notes which are an integral part of the financial statements.
Financial Highlights — Fidelity Freedom K 2045 Fund
| | Six months ended (Unaudited) September 30, | Years ended March 31, | | | | |
| | 2016 | 2016 | 2015 | 2014 | 2013 | 2012 |
| Selected Per–Share Data | | | | | | |
| Net asset value, beginning of period | $15.16 | $16.57 | $16.98 | $15.02 | $14.07 | $14.68 |
| Income from Investment Operations | | | | | | |
| Net investment income (loss)A | .05 | .25 | .28 | .24 | .28 | .25 |
| Net realized and unrealized gain (loss) | 1.09 | (.80) | .98 | 2.05 | 1.12 | (.22) |
| Total from investment operations | 1.14 | (.55) | 1.26 | 2.29 | 1.40 | .03 |
| Distributions from net investment income | (.01) | (.25) | (.48) | (.02) | (.25) | (.20) |
| Distributions from net realized gain | (.35) | (.61) | (1.19) | (.31) | (.20) | (.44) |
| Total distributions | (.36) | (.86) | (1.67) | (.33) | (.45) | (.64) |
| Net asset value, end of period | $15.94 | $15.16 | $16.57 | $16.98 | $15.02 | $14.07 |
| Total ReturnB | 7.68% | (3.53)% | 8.10% | 15.52% | 10.27% | .45% |
| Ratios to Average Net AssetsC,D | | | | | | |
| Expenses before reductions | .05%E | .05% | .05% | .05% | .05% | .05% |
| Expenses net of fee waivers, if any | .05%E | .05% | .05% | .05% | .05% | .05% |
| Expenses net of all reductions | .05%E | .05% | .05% | .05% | .05% | .05% |
| Net investment income (loss) | .68%E | 1.61% | 1.74% | 1.49% | 1.96% | 1.85% |
| Supplemental Data | | | | | | |
| Net assets, end of period (000 omitted) | $7,020,229 | $6,277,503 | $5,966,374 | $5,059,904 | $3,814,236 | $2,254,813 |
| Portfolio turnover rateC | 17%E | 16% | 18% | 47% | 27% | 14% |
A Calculated based on average shares outstanding during the period.
B Total returns for periods of less than one year are not annualized.
C Amounts do not include the activity of the Underlying Funds.
D Expense ratios reflect operating expenses of the Fund. Expenses before reductions do not reflect amounts reimbursed by the investment adviser or reductions from expense offset arrangements and do not represent the amount paid by the Fund during periods when reimbursements or reductions occur. Expenses net of fee waivers reflect expenses after reimbursement by the investment adviser but prior to reductions from expense offset arrangements. Expenses net of all reductions represent the net expenses paid by the Fund but do not include expenses of the underlying funds in which the Fund invests.
E Annualized
See accompanying notes which are an integral part of the financial statements.
Fidelity Freedom K® 2050 Fund
Investment Summary (Unaudited)
The information in the following tables is based on the direct investments of the Fund.
Top Holdings as of September 30, 2016
| | % of fund's net assets | % of fund's net assets 6 months ago |
| Fidelity Series Emerging Markets Fund Class F | 10.0 | 9.4 |
| Fidelity Series Equity-Income Fund Class F | 9.9 | 9.6 |
| Fidelity Series International Value Fund Class F | 9.3 | 8.9 |
| Fidelity Series International Growth Fund Class F | 9.3 | 9.1 |
| Fidelity Series Growth Company Fund Class F | 8.3 | 8.7 |
| Fidelity Series Growth & Income Fund Class F | 7.3 | 7.3 |
| Fidelity Series Stock Selector Large Cap Value Fund Class F | 6.9 | 6.3 |
| Fidelity Series Intrinsic Opportunities Fund Class F | 5.7 | 5.4 |
| Fidelity Series Blue Chip Growth Fund Class F | 5.0 | 5.0 |
| Fidelity Series Opportunistic Insights Fund Class F | 4.6 | 4.8 |
| | 76.3 | 74.5 |
Asset Allocation (% of fund's net assets)
| Period end |
| | Domestic Equity Funds | 64.0% |
| | International Equity Funds | 30.7% |
| | Bond Funds | 5.3% |

| Six months ago |
| | Domestic Equity Funds | 65.1% |
| | International Equity Funds | 29.5% |
| | Bond Funds | 5.4% |

Domestic Equity Funds category includes Fidelity Series Commodity Strategy Fund which invests in commodity-related investments.
Fidelity Freedom K® 2050 Fund
Investments September 30, 2016 (Unaudited)
Showing Percentage of Net Assets
| Domestic Equity Funds - 64.0% | | | |
| | | Shares | Value |
| Fidelity Series 100 Index Fund Class F (a) | | 9,049,362 | $129,224,883 |
| Fidelity Series 1000 Value Index Fund Class F (a) | | 12,877,379 | 143,969,099 |
| Fidelity Series All-Sector Equity Fund Class F (a) | | 18,133,051 | 243,526,870 |
| Fidelity Series Blue Chip Growth Fund Class F (a) | | 25,112,363 | 294,568,022 |
| Fidelity Series Commodity Strategy Fund Class F (a)(b) | | 19,032,432 | 101,823,512 |
| Fidelity Series Equity-Income Fund Class F (a) | | 47,713,950 | 590,698,706 |
| Fidelity Series Growth & Income Fund Class F (a) | | 32,266,769 | 432,697,370 |
| Fidelity Series Growth Company Fund Class F (a) | | 36,733,977 | 493,337,307 |
| Fidelity Series Intrinsic Opportunities Fund Class F (a) | | 22,546,659 | 339,101,751 |
| Fidelity Series Opportunistic Insights Fund Class F (a) | | 18,015,793 | 276,362,269 |
| Fidelity Series Real Estate Equity Fund Class F (a) | | 3,539,788 | 48,742,884 |
| Fidelity Series Small Cap Discovery Fund Class F (a) | | 7,049,322 | 74,370,352 |
| Fidelity Series Small Cap Opportunities Fund Class F (a) | | 17,107,257 | 226,329,016 |
| Fidelity Series Stock Selector Large Cap Value Fund Class F (a) | | 34,775,962 | 410,704,114 |
| TOTAL DOMESTIC EQUITY FUNDS | | | |
| (Cost $3,385,111,252) | | | 3,805,456,155 |
|
| International Equity Funds - 30.7% | | | |
| Fidelity Series Emerging Markets Fund Class F (a) | | 35,347,233 | 596,661,292 |
| Fidelity Series International Growth Fund Class F (a) | | 39,151,701 | 549,689,878 |
| Fidelity Series International Small Cap Fund Class F (a) | | 8,090,509 | 126,292,842 |
| Fidelity Series International Value Fund Class F (a) | | 58,031,994 | 551,884,266 |
| TOTAL INTERNATIONAL EQUITY FUNDS | | | |
| (Cost $1,720,584,004) | | | 1,824,528,278 |
|
| Bond Funds - 5.3% | | | |
| Fidelity Series Emerging Markets Debt Fund Class F (a) | | 3,830,994 | 39,689,095 |
| Fidelity Series Floating Rate High Income Fund Class F (a) | | 1,582,284 | 14,905,112 |
| Fidelity Series High Income Fund Class F (a) | | 17,716,630 | 165,827,659 |
| Fidelity Series Inflation-Protected Bond Index Fund Class F (a) | | 3,542,266 | 35,706,046 |
| Fidelity Series Investment Grade Bond Fund Class F (a) | | 2,542,877 | 29,497,375 |
| Fidelity Series Long-Term Treasury Bond Index Fund Class F (a) | | 3,711 | 35,813 |
| Fidelity Series Real Estate Income Fund Class F (a) | | 2,653,437 | 29,771,563 |
| TOTAL BOND FUNDS | | | |
| (Cost $317,416,082) | | | 315,432,663 |
|
| Short-Term Funds - 0.0% | | | |
| Fidelity Series Government Money Market Fund Class F 0.29% (a)(c) | | 1,730,883 | 1,730,883 |
| Fidelity Series Short-Term Credit Fund Class F (a) | | 97,936 | 982,295 |
| TOTAL SHORT-TERM FUNDS | | | |
| (Cost $2,706,560) | | | 2,713,178 |
| TOTAL INVESTMENT PORTFOLIO - 100.0% | | | |
| (Cost $5,425,817,898) | | | 5,948,130,274 |
| NET OTHER ASSETS (LIABILITIES) - 0.0% | | | (231,580) |
| NET ASSETS - 100% | | | $5,947,898,694 |
Legend
(a) Affiliated Fund
(b) Non-income producing
(c) The rate quoted is the annualized seven-day yield of the fund at period end.
Affiliated Underlying Funds
Information regarding the Fund's fiscal year to date purchases and sales of the affiliated Underlying Funds and income earned by the Fund from investments in affiliated Underlying Funds is as follows:
| Affiliate | Value, beginning of period | Purchases | Sales Proceeds | Dividend Income | Value, end of period |
| Fidelity Investments Money Market Portfolio Class F | $1,693,060 | $22,479 | $1,715,539 | $767 | $-- |
| Fidelity Series 100 Index Fund Class F | 120,322,368 | 12,365,055 | 10,848,168 | -- | 129,224,883 |
| Fidelity Series 1000 Value Index Fund Class F | 67,909,464 | 75,733,068 | 5,073,514 | -- | 143,969,099 |
| Fidelity Series All-Sector Equity Fund Class F | 378,727,830 | 29,537,569 | 190,166,470 | -- | 243,526,870 |
| Fidelity Series Blue Chip Growth Fund Class F | 262,908,796 | 28,657,453 | 18,594,753 | 776,718 | 294,568,022 |
| Fidelity Series Commodity Strategy Fund Class F | 67,450,509 | 31,919,577 | 3,395,285 | -- | 101,823,512 |
| Fidelity Series Emerging Markets Debt Fund Class F | 34,123,688 | 3,938,129 | 1,563,067 | 1,027,693 | 39,689,095 |
| Fidelity Series Emerging Markets Fund Class F | 496,999,487 | 46,121,923 | 14,214,919 | -- | 596,661,292 |
| Fidelity Series Equity-Income Fund Class F | 508,891,743 | 78,263,078 | 36,323,959 | 4,958,286 | 590,698,706 |
| Fidelity Series Floating Rate High Income Fund Class F | 13,406,769 | 1,519,066 | 687,379 | 316,710 | 14,905,112 |
| Fidelity Series Government Money Market Fund Class F 0.29% | -- | 1,782,232 | 51,349 | 1,591 | 1,730,883 |
| Fidelity Series Growth & Income Fund Class F | 390,075,609 | 43,689,306 | 31,591,566 | 3,498,082 | 432,697,370 |
| Fidelity Series Growth Company Fund Class F | 463,703,528 | 7,656,507 | 23,588,917 | -- | 493,337,307 |
| Fidelity Series High Income Fund Class F | 156,896,487 | 4,587,990 | 7,910,463 | 4,587,881 | 165,827,659 |
| Fidelity Series Inflation-Protected Bond Index Fund Class F | 26,730,468 | 9,651,855 | 1,222,595 | 33,729 | 35,706,046 |
| Fidelity Series International Growth Fund Class F | 479,097,382 | 71,214,442 | 26,377,330 | -- | 549,689,878 |
| Fidelity Series International Small Cap Fund Class F | 112,334,536 | 15,979,561 | 6,681,747 | -- | 126,292,842 |
| Fidelity Series International Value Fund Class F | 472,935,988 | 86,093,602 | 27,748,401 | -- | 551,884,266 |
| Fidelity Series Intrinsic Opportunities Fund Class F | 286,187,905 | 33,708,689 | -- | 2,579,343 | 339,101,751 |
| Fidelity Series Investment Grade Bond Fund Class F | 26,547,086 | 5,355,275 | 3,110,657 | 355,313 | 29,497,375 |
| Fidelity Series Long-Term Treasury Bond Index Fund Class F | -- | 37,239 | 238 | 162 | 35,813 |
| Fidelity Series Opportunistic Insights Fund Class F | 253,304,138 | 29,125,435 | 19,539,737 | -- | 276,362,269 |
| Fidelity Series Real Estate Equity Fund Class F | 47,043,723 | 8,314,229 | 5,531,692 | 464,926 | 48,742,884 |
| Fidelity Series Real Estate Income Fund Class F | 26,924,542 | 4,115,730 | 2,116,221 | 728,789 | 29,771,563 |
| Fidelity Series Short-Term Credit Fund Class F | 897,336 | 162,797 | 81,702 | 5,141 | 982,295 |
| Fidelity Series Small Cap Discovery Fund Class F | 68,050,543 | 7,203,671 | 4,808,291 | 122,455 | 74,370,352 |
| Fidelity Series Small Cap Opportunities Fund Class F | 204,035,803 | 21,326,168 | 17,161,350 | 772,139 | 226,329,016 |
| Fidelity Series Stock Selector Large Cap Value Fund Class F | 333,925,656 | 73,227,298 | 19,608,158 | -- | 410,704,114 |
| Total | $5,301,124,444 | $731,309,423 | $479,713,467 | $20,229,725 | $5,948,130,274 |
Investment Valuation
All investments are categorized as Level 1 under the Fair Value Hierarchy. The inputs or methodology used for valuing securities may not be an indication of the risk associated with investing in those securities. For more information on valuation inputs please refer to the Investment Valuation section in the accompanying Notes to Financial Statements.
See accompanying notes which are an integral part of the financial statements.
Fidelity Freedom K® 2050 Fund
Financial Statements
Statement of Assets and Liabilities
| | | September 30, 2016 (Unaudited) |
| Assets | | |
| Investment in securities, at value (cost $5,425,817,898) — See accompanying schedule | | $5,948,130,274 |
| Receivable for investments sold | | 35,602,598 |
| Receivable for fund shares sold | | 22,090,528 |
| Total assets | | 6,005,823,400 |
| Liabilities | | |
| Payable for investments purchased | $5,481,233 | |
| Payable for fund shares redeemed | 52,212,033 | |
| Transfer agent fees payable | 231,440 | |
| Total liabilities | | 57,924,706 |
| Net Assets | | $5,947,898,694 |
| Net Assets consist of: | | |
| Paid in capital | | $5,433,825,203 |
| Undistributed net investment income | | 18,625,660 |
| Accumulated undistributed net realized gain (loss) on investments | | (26,864,545) |
| Net unrealized appreciation (depreciation) on investments | | 522,312,376 |
| Net Assets, for 370,124,923 shares outstanding | | $5,947,898,694 |
| Net Asset Value, offering price and redemption price per share ($5,947,898,694 ÷ 370,124,923 shares) | | $16.07 |
See accompanying notes which are an integral part of the financial statements.
Statement of Operations
| | | Six months ended September 30, 2016 (Unaudited) |
| Investment Income | | |
| Income distributions from underlying funds | | $20,229,725 |
| Expenses | | |
| Transfer agent fees | $1,313,830 | |
| Independent trustees' fees and expenses | 12,275 | |
| Total expenses | | 1,326,105 |
| Net investment income (loss) | | 18,903,620 |
| Realized and Unrealized Gain (Loss) | | |
| Realized gain (loss) on sale of underlying fund shares | (315,854) | |
| Capital gain distributions from underlying funds | 3,044,873 | |
| Total net realized gain (loss) | | 2,729,019 |
| Change in net unrealized appreciation (depreciation) on underlying funds | | 395,725,720 |
| Net gain (loss) | | 398,454,739 |
| Net increase (decrease) in net assets resulting from operations | | $417,358,359 |
See accompanying notes which are an integral part of the financial statements.
Statement of Changes in Net Assets
| | Six months ended September 30, 2016 (Unaudited) | Year ended March 31, 2016 |
| Increase (Decrease) in Net Assets | | |
| Operations | | |
| Net investment income (loss) | $18,903,620 | $79,634,715 |
| Net realized gain (loss) | 2,729,019 | 180,792,475 |
| Change in net unrealized appreciation (depreciation) | 395,725,720 | (429,117,950) |
| Net increase (decrease) in net assets resulting from operations | 417,358,359 | (168,690,760) |
| Distributions to shareholders from net investment income | (3,500,074) | (80,071,316) |
| Distributions to shareholders from net realized gain | (120,034,496) | (182,049,358) |
| Total distributions | (123,534,570) | (262,120,674) |
| Share transactions | | |
| Proceeds from sales of shares | 1,002,698,697 | 2,044,349,172 |
| Reinvestment of distributions | 123,534,570 | 262,120,674 |
| Cost of shares redeemed | (773,082,155) | (1,429,888,301) |
| Net increase (decrease) in net assets resulting from share transactions | 353,151,112 | 876,581,545 |
| Total increase (decrease) in net assets | 646,974,901 | 445,770,111 |
| Net Assets | | |
| Beginning of period | 5,300,923,793 | 4,855,153,682 |
| End of period | $5,947,898,694 | $5,300,923,793 |
| Other Information | | |
| Undistributed net investment income end of period | $18,625,660 | $3,222,114 |
| Shares | | |
| Sold | 64,639,165 | 130,157,193 |
| Issued in reinvestment of distributions | 8,318,820 | 16,318,539 |
| Redeemed | (49,939,016) | (90,608,508) |
| Net increase (decrease) | 23,018,969 | 55,867,224 |
See accompanying notes which are an integral part of the financial statements.
Financial Highlights — Fidelity Freedom K 2050 Fund
| | Six months ended (Unaudited) September 30, | Years ended March 31, | | | | |
| | 2016 | 2016 | 2015 | 2014 | 2013 | 2012 |
| Selected Per–Share Data | | | | | | |
| Net asset value, beginning of period | $15.27 | $16.67 | $17.05 | $15.07 | $14.11 | $14.77 |
| Income from Investment Operations | | | | | | |
| Net investment income (loss)A | .05 | .25 | .29 | .24 | .27 | .24 |
| Net realized and unrealized gain (loss) | 1.10 | (.80) | .98 | 2.07 | 1.13 | (.27) |
| Total from investment operations | 1.15 | (.55) | 1.27 | 2.31 | 1.40 | (.03) |
| Distributions from net investment income | (.01) | (.25) | (.48) | (.02) | (.25) | (.19) |
| Distributions from net realized gain | (.34) | (.60) | (1.17) | (.31) | (.20) | (.44) |
| Total distributions | (.35) | (.85) | (1.65) | (.33) | (.44)B | (.63) |
| Net asset value, end of period | $16.07 | $15.27 | $16.67 | $17.05 | $15.07 | $14.11 |
| Total ReturnC | 7.74% | (3.52)% | 8.09% | 15.60% | 10.26% | .06% |
| Ratios to Average Net AssetsD,E | | | | | | |
| Expenses before reductions | .05%F | .05% | .05% | .05% | .05% | .05% |
| Expenses net of fee waivers, if any | .05%F | .05% | .05% | .05% | .05% | .05% |
| Expenses net of all reductions | .05%F | .05% | .05% | .05% | .05% | .05% |
| Net investment income (loss) | .68%F | 1.61% | 1.75% | 1.49% | 1.94% | 1.78% |
| Supplemental Data | | | | | | |
| Net assets, end of period (000 omitted) | $5,947,899 | $5,300,924 | $4,855,154 | $3,950,241 | $2,918,045 | $1,705,495 |
| Portfolio turnover rateD | 17%F | 15% | 17% | 48% | 29% | 14% |
A Calculated based on average shares outstanding during the period.
B Total distributions of $.44 per share is comprised of distributions from net investment income of $.245 and distributions from net realized gain of $.198 per share.
C Total returns for periods of less than one year are not annualized.
D Amounts do not include the activity of the Underlying Funds.
E Expense ratios reflect operating expenses of the Fund. Expenses before reductions do not reflect amounts reimbursed by the investment adviser or reductions from expense offset arrangements and do not represent the amount paid by the Fund during periods when reimbursements or reductions occur. Expenses net of fee waivers reflect expenses after reimbursement by the investment adviser but prior to reductions from expense offset arrangements. Expenses net of all reductions represent the net expenses paid by the Fund but do not include expenses of the underlying funds in which the Fund invests.
F Annualized
See accompanying notes which are an integral part of the financial statements.
Fidelity Freedom K® 2055 Fund
Investment Summary (Unaudited)
The information in the following tables is based on the direct investments of the Fund.
Top Holdings as of September 30, 2016
| | % of fund's net assets | % of fund's net assets 6 months ago |
| Fidelity Series Emerging Markets Fund Class F | 10.0 | 9.4 |
| Fidelity Series Equity-Income Fund Class F | 9.9 | 9.6 |
| Fidelity Series International Value Fund Class F | 9.3 | 8.9 |
| Fidelity Series International Growth Fund Class F | 9.3 | 9.1 |
| Fidelity Series Growth Company Fund Class F | 8.2 | 8.7 |
| Fidelity Series Growth & Income Fund Class F | 7.3 | 7.4 |
| Fidelity Series Stock Selector Large Cap Value Fund Class F | 6.9 | 6.3 |
| Fidelity Series Intrinsic Opportunities Fund Class F | 5.8 | 5.4 |
| Fidelity Series Blue Chip Growth Fund Class F | 5.0 | 5.0 |
| Fidelity Series Opportunistic Insights Fund Class F | 4.7 | 4.8 |
| | 76.4 | 74.6 |
Asset Allocation (% of fund's net assets)
| Period end |
| | Domestic Equity Funds | 64.0% |
| | International Equity Funds | 30.7% |
| | Bond Funds | 5.2% |
| | Short-Term Funds | 0.1% |

| Six months ago |
| | Domestic Equity Funds | 65.2% |
| | International Equity Funds | 29.5% |
| | Bond Funds | 5.3% |

Domestic Equity Funds category includes Fidelity Series Commodity Strategy Fund which invests in commodity-related investments.
Fidelity Freedom K® 2055 Fund
Investments September 30, 2016 (Unaudited)
Showing Percentage of Net Assets
| Domestic Equity Funds - 64.0% | | | |
| | | Shares | Value |
| Fidelity Series 100 Index Fund Class F (a) | | 2,649,481 | $37,834,595 |
| Fidelity Series 1000 Value Index Fund Class F (a) | | 3,714,847 | 41,531,995 |
| Fidelity Series All-Sector Equity Fund Class F (a) | | 5,295,962 | 71,124,768 |
| Fidelity Series Blue Chip Growth Fund Class F (a) | | 7,411,992 | 86,942,669 |
| Fidelity Series Commodity Strategy Fund Class F (a)(b) | | 5,637,006 | 30,157,981 |
| Fidelity Series Equity-Income Fund Class F (a) | | 13,943,423 | 172,619,581 |
| Fidelity Series Growth & Income Fund Class F (a) | | 9,512,325 | 127,560,281 |
| Fidelity Series Growth Company Fund Class F (a) | | 10,665,683 | 143,240,120 |
| Fidelity Series Intrinsic Opportunities Fund Class F (a) | | 6,667,705 | 100,282,287 |
| Fidelity Series Opportunistic Insights Fund Class F (a) | | 5,315,723 | 81,543,194 |
| Fidelity Series Real Estate Equity Fund Class F (a) | | 1,034,938 | 14,251,100 |
| Fidelity Series Small Cap Discovery Fund Class F (a) | | 2,064,306 | 21,778,431 |
| Fidelity Series Small Cap Opportunities Fund Class F (a) | | 4,954,136 | 65,543,219 |
| Fidelity Series Stock Selector Large Cap Value Fund Class F (a) | | 10,146,524 | 119,830,445 |
| TOTAL DOMESTIC EQUITY FUNDS | | | |
| (Cost $1,044,716,881) | | | 1,114,240,666 |
|
| International Equity Funds - 30.7% | | | |
| Fidelity Series Emerging Markets Fund Class F (a) | | 10,338,049 | 174,506,275 |
| Fidelity Series International Growth Fund Class F (a) | | 11,481,191 | 161,195,928 |
| Fidelity Series International Small Cap Fund Class F (a) | | 2,384,709 | 37,225,306 |
| Fidelity Series International Value Fund Class F (a) | | 17,017,815 | 161,839,422 |
| TOTAL INTERNATIONAL EQUITY FUNDS | | | |
| (Cost $522,096,448) | | | 534,766,931 |
|
| Bond Funds - 5.2% | | | |
| Fidelity Series Emerging Markets Debt Fund Class F (a) | | 1,111,170 | 11,511,718 |
| Fidelity Series Floating Rate High Income Fund Class F (a) | | 461,311 | 4,345,552 |
| Fidelity Series High Income Fund Class F (a) | | 5,064,429 | 47,403,053 |
| Fidelity Series Inflation-Protected Bond Index Fund Class F (a) | | 1,046,600 | 10,549,729 |
| Fidelity Series Investment Grade Bond Fund Class F (a) | | 751,731 | 8,720,077 |
| Fidelity Series Long-Term Treasury Bond Index Fund Class F (a) | | 1,207 | 11,643 |
| Fidelity Series Real Estate Income Fund Class F (a) | | 764,195 | 8,574,264 |
| TOTAL BOND FUNDS | | | |
| (Cost $91,951,821) | | | 91,116,036 |
|
| Short-Term Funds - 0.1% | | | |
| Fidelity Series Government Money Market Fund Class F 0.29% (a)(c) | | 567,725 | 567,725 |
| Fidelity Series Short-Term Credit Fund Class F (a) | | 30,467 | 305,586 |
| TOTAL SHORT-TERM FUNDS | | | |
| (Cost $871,170) | | | 873,311 |
| TOTAL INVESTMENT PORTFOLIO - 100.0% | | | |
| (Cost $1,659,636,320) | | | 1,740,996,944 |
| NET OTHER ASSETS (LIABILITIES) - 0.0% | | | (67,445) |
| NET ASSETS - 100% | | | $1,740,929,499 |
Legend
(a) Affiliated Fund
(b) Non-income producing
(c) The rate quoted is the annualized seven-day yield of the fund at period end.
Affiliated Underlying Funds
Information regarding the Fund's fiscal year to date purchases and sales of the affiliated Underlying Funds and income earned by the Fund from investments in affiliated Underlying Funds is as follows:
| Affiliate | Value, beginning of period | Purchases | Sales Proceeds | Dividend Income | Value, end of period |
| Fidelity Investments Money Market Portfolio Class F | $455,531 | $10,676 | $466,207 | $211 | $-- |
| Fidelity Series 100 Index Fund Class F | 31,840,693 | 6,951,161 | 3,016,078 | -- | 37,834,595 |
| Fidelity Series 1000 Value Index Fund Class F | 17,957,432 | 23,388,608 | 1,326,748 | -- | 41,531,995 |
| Fidelity Series All-Sector Equity Fund Class F | 100,298,308 | 15,089,531 | 51,348,930 | -- | 71,124,768 |
| Fidelity Series Blue Chip Growth Fund Class F | 69,568,514 | 15,854,612 | 4,627,862 | 228,537 | 86,942,669 |
| Fidelity Series Commodity Strategy Fund Class F | 18,119,907 | 12,450,739 | 2,018,621 | -- | 30,157,981 |
| Fidelity Series Emerging Markets Debt Fund Class F | 8,977,559 | 1,973,356 | 322,458 | 285,681 | 11,511,718 |
| Fidelity Series Emerging Markets Fund Class F | 131,834,459 | 27,228,846 | 3,785,318 | -- | 174,506,275 |
| Fidelity Series Equity-Income Fund Class F | 134,711,174 | 36,711,747 | 9,953,161 | 1,362,717 | 172,619,581 |
| Fidelity Series Floating Rate High Income Fund Class F | 3,529,277 | 785,689 | 152,995 | 88,375 | 4,345,552 |
| Fidelity Series Government Money Market Fund Class F 0.29% | -- | 580,758 | 13,033 | 469 | 567,725 |
| Fidelity Series Growth & Income Fund Class F | 103,294,695 | 23,701,587 | 8,030,508 | 950,475 | 127,560,281 |
| Fidelity Series Growth Company Fund Class F | 122,398,793 | 14,068,444 | 5,932,532 | -- | 143,240,120 |
| Fidelity Series High Income Fund Class F | 40,725,138 | 5,039,442 | 1,729,277 | 1,266,728 | 47,403,053 |
| Fidelity Series Inflation-Protected Bond Index Fund Class F | 7,134,800 | 3,514,013 | 259,384 | 9,515 | 10,549,729 |
| Fidelity Series International Growth Fund Class F | 127,082,347 | 33,043,157 | 6,147,926 | -- | 161,195,928 |
| Fidelity Series International Small Cap Fund Class F | 29,763,064 | 7,672,001 | 1,582,662 | -- | 37,225,306 |
| Fidelity Series International Value Fund Class F | 125,354,254 | 37,112,810 | 6,480,930 | -- | 161,839,422 |
| Fidelity Series Intrinsic Opportunities Fund Class F | 75,785,277 | 19,057,279 | -- | 758,119 | 100,282,287 |
| Fidelity Series Investment Grade Bond Fund Class F | 7,028,055 | 2,551,554 | 1,054,275 | 99,372 | 8,720,077 |
| Fidelity Series Long-Term Treasury Bond Index Fund Class F | -- | 12,110 | 114 | 51 | 11,643 |
| Fidelity Series Opportunistic Insights Fund Class F | 67,151,661 | 15,369,504 | 4,769,043 | -- | 81,543,194 |
| Fidelity Series Real Estate Equity Fund Class F | 12,374,986 | 3,767,101 | 1,560,241 | 131,920 | 14,251,100 |
| Fidelity Series Real Estate Income Fund Class F | 7,024,423 | 1,839,235 | 514,191 | 203,760 | 8,574,264 |
| Fidelity Series Short-Term Credit Fund Class F | 244,180 | 84,604 | 24,308 | 1,459 | 305,586 |
| Fidelity Series Small Cap Discovery Fund Class F | 17,994,303 | 4,036,221 | 1,357,839 | 34,092 | 21,778,431 |
| Fidelity Series Small Cap Opportunities Fund Class F | 54,016,664 | 12,123,871 | 5,700,977 | 225,401 | 65,543,219 |
| Fidelity Series Stock Selector Large Cap Value Fund Class F | 88,836,599 | 29,617,423 | 5,087,834 | -- | 119,830,445 |
| Total | $1,403,502,093 | $353,636,079 | $127,263,452 | $5,646,882 | $1,740,996,944 |
Investment Valuation
All investments are categorized as Level 1 under the Fair Value Hierarchy. The inputs or methodology used for valuing securities may not be an indication of the risk associated with investing in those securities. For more information on valuation inputs please refer to the Investment Valuation section in the accompanying Notes to Financial Statements.
See accompanying notes which are an integral part of the financial statements.
Fidelity Freedom K® 2055 Fund
Financial Statements
Statement of Assets and Liabilities
| | | September 30, 2016 (Unaudited) |
| Assets | | |
| Investment in securities, at value (cost $1,659,636,320) — See accompanying schedule | | $1,740,996,944 |
| Receivable for investments sold | | 11,830,237 |
| Receivable for fund shares sold | | 12,350,816 |
| Total assets | | 1,765,177,997 |
| Liabilities | | |
| Payable for investments purchased | $1,232,047 | |
| Payable for fund shares redeemed | 22,948,960 | |
| Transfer agent fees payable | 67,491 | |
| Total liabilities | | 24,248,498 |
| Net Assets | | $1,740,929,499 |
| Net Assets consist of: | | |
| Paid in capital | | $1,663,741,021 |
| Undistributed net investment income | | 5,247,890 |
| Accumulated undistributed net realized gain (loss) on investments | | (9,420,036) |
| Net unrealized appreciation (depreciation) on investments | | 81,360,624 |
| Net Assets, for 145,911,255 shares outstanding | | $1,740,929,499 |
| Net Asset Value, offering price and redemption price per share ($1,740,929,499 ÷ 145,911,255 shares) | | $11.93 |
See accompanying notes which are an integral part of the financial statements.
Statement of Operations
| | | Six months ended September 30, 2016 (Unaudited) |
| Investment Income | | |
| Income distributions from underlying funds | | $5,646,882 |
| Expenses | | |
| Transfer agent fees | $368,005 | |
| Independent trustees' fees and expenses | 3,369 | |
| Total expenses | | 371,374 |
| Net investment income (loss) | | 5,275,508 |
| Realized and Unrealized Gain (Loss) | | |
| Realized gain (loss) on sale of underlying fund shares | (3,427,343) | |
| Capital gain distributions from underlying funds | 879,971 | |
| Total net realized gain (loss) | | (2,547,372) |
| Change in net unrealized appreciation (depreciation) on underlying funds | | 114,549,564 |
| Net gain (loss) | | 112,002,192 |
| Net increase (decrease) in net assets resulting from operations | | $117,277,700 |
See accompanying notes which are an integral part of the financial statements.
Statement of Changes in Net Assets
| | Six months ended September 30, 2016 (Unaudited) | Year ended March 31, 2016 |
| Increase (Decrease) in Net Assets | | |
| Operations | | |
| Net investment income (loss) | $5,275,508 | $18,459,428 |
| Net realized gain (loss) | (2,547,372) | 40,771,386 |
| Change in net unrealized appreciation (depreciation) | 114,549,564 | (92,514,314) |
| Net increase (decrease) in net assets resulting from operations | 117,277,700 | (33,283,500) |
| Distributions to shareholders from net investment income | (771,012) | (18,415,927) |
| Distributions to shareholders from net realized gain | (29,169,809) | (34,769,994) |
| Total distributions | (29,940,821) | (53,185,921) |
| Share transactions | | |
| Proceeds from sales of shares | 461,336,103 | 827,659,879 |
| Reinvestment of distributions | 29,940,821 | 53,185,921 |
| Cost of shares redeemed | (241,134,106) | (364,187,946) |
| Net increase (decrease) in net assets resulting from share transactions | 250,142,818 | 516,657,854 |
| Total increase (decrease) in net assets | 337,479,697 | 430,188,433 |
| Net Assets | | |
| Beginning of period | 1,403,449,802 | 973,261,369 |
| End of period | $1,740,929,499 | $1,403,449,802 |
| Other Information | | |
| Undistributed net investment income end of period | $5,247,890 | $743,394 |
| Shares | | |
| Sold | 40,046,719 | 71,572,505 |
| Issued in reinvestment of distributions | 2,714,490 | 4,493,278 |
| Redeemed | (20,945,621) | (31,260,290) |
| Net increase (decrease) | 21,815,588 | 44,805,493 |
See accompanying notes which are an integral part of the financial statements.
Financial Highlights — Fidelity Freedom K 2055 Fund
| | Six months ended (Unaudited) September 30, | Years ended March 31, | | | | |
| | 2016 | 2016 | 2015 | 2014 | 2013 | 2012 A |
| Selected Per–Share Data | | | | | | |
| Net asset value, beginning of period | $11.31 | $12.27 | $12.21 | $10.64 | $9.84 | $10.00 |
| Income from Investment Operations | | | | | | |
| Net investment income (loss)B | .04 | .19 | .21 | .17 | .22 | .14 |
| Net realized and unrealized gain (loss) | .81 | (.59) | .72 | 1.53 | .79 | (.11) |
| Total from investment operations | .85 | (.40) | .93 | 1.70 | 1.01 | .03 |
| Distributions from net investment income | (.01) | (.18) | (.30) | (.01) | (.15) | (.10) |
| Distributions from net realized gain | (.23) | (.38) | (.57) | (.12) | (.06) | (.08) |
| Total distributions | (.23)C | (.56) | (.87) | (.13) | (.21) | (.19)D |
| Net asset value, end of period | $11.93 | $11.31 | $12.27 | $12.21 | $10.64 | $9.84 |
| Total ReturnE | 7.71% | (3.47)% | 8.03% | 16.15% | 10.48% | .47% |
| Ratios to Average Net AssetsF,G | | | | | | |
| Expenses before reductions | .05%H | .05% | .05% | .05% | .05% | .05%H |
| Expenses net of fee waivers, if any | .05%H | .05% | .05% | .05% | .05% | .05%H |
| Expenses net of all reductions | .05%H | .05% | .05% | .05% | .05% | .05%H |
| Net investment income (loss) | .67%H | 1.63% | 1.78% | 1.50% | 2.17% | 1.78%H |
| Supplemental Data | | | | | | |
| Net assets, end of period (000 omitted) | $1,740,929 | $1,403,450 | $973,261 | $549,301 | $208,573 | $24,870 |
| Portfolio turnover rateF | 16%H | 13% | 16% | 45% | 27% | 7%H |
A For the period June 1, 2011 (commencement of operations) to March 31, 2012.
B Calculated based on average shares outstanding during the period.
C Total distributions of $.23 per share is comprised of distributions from net investment income of $.006 and distributions from net realized gain of $.227 per share.
D Total distributions of $.19 per share is comprised of distributions from net investment income of $.104 and distributions from net realized gain of $.081 per share.
E Total returns for periods of less than one year are not annualized.
F Amounts do not include the activity of the Underlying Funds.
G Expense ratios reflect operating expenses of the Fund. Expenses before reductions do not reflect amounts reimbursed by the investment adviser or reductions from expense offset arrangements and do not represent the amount paid by the Fund during periods when reimbursements or reductions occur. Expenses net of fee waivers reflect expenses after reimbursement by the investment adviser but prior to reductions from expense offset arrangements. Expenses net of all reductions represent the net expenses paid by the Fund but do not include expenses of the underlying funds in which the Fund invests.
H Annualized
See accompanying notes which are an integral part of the financial statements.
Fidelity Freedom K® 2060 Fund
Investment Summary (Unaudited)
The information in the following tables is based on the direct investments of the Fund.
Top Holdings as of September 30, 2016
| | % of fund's net assets | % of fund's net assets 6 months ago |
| Fidelity Series Equity-Income Fund Class F | 10.1 | 9.6 |
| Fidelity Series Emerging Markets Fund Class F | 10.0 | 9.4 |
| Fidelity Series International Value Fund Class F | 9.3 | 9.0 |
| Fidelity Series International Growth Fund Class F | 9.3 | 9.0 |
| Fidelity Series Growth Company Fund Class F | 7.7 | 8.6 |
| Fidelity Series Growth & Income Fund Class F | 7.5 | 7.3 |
| Fidelity Series Stock Selector Large Cap Value Fund Class F | 7.0 | 6.3 |
| Fidelity Series Intrinsic Opportunities Fund Class F | 5.8 | 5.6 |
| Fidelity Series Blue Chip Growth Fund Class F | 5.1 | 4.9 |
| Fidelity Series Opportunistic Insights Fund Class F | 4.8 | 4.8 |
| | 76.6 | 74.5 |
Asset Allocation (% of fund's net assets)
| Period end |
| | Domestic Equity Funds | 64.0% |
| | International Equity Funds | 30.7% |
| | Bond Funds | 5.2% |
| | Short-Term Funds | 0.1% |

| Six months ago |
| | Domestic Equity Funds | 65.1% |
| | International Equity Funds | 29.5% |
| | Bond Funds | 5.3% |
| | Short-Term Funds | 0.1% |

Domestic Equity Funds category includes Fidelity Series Commodity Strategy Fund which invests in commodity-related investments.
Fidelity Freedom K® 2060 Fund
Investments September 30, 2016 (Unaudited)
Showing Percentage of Net Assets
| Domestic Equity Funds - 64.0% | | | |
| | | Shares | Value |
| Fidelity Series 100 Index Fund Class F (a) | | 234,304 | $3,345,861 |
| Fidelity Series 1000 Value Index Fund Class F (a) | | 301,291 | 3,368,429 |
| Fidelity Series All-Sector Equity Fund Class F (a) | | 462,582 | 6,212,479 |
| Fidelity Series Blue Chip Growth Fund Class F (a) | | 667,546 | 7,830,317 |
| Fidelity Series Commodity Strategy Fund Class F (a)(b) | | 496,045 | 2,653,842 |
| Fidelity Series Equity-Income Fund Class F (a) | | 1,247,953 | 15,449,655 |
| Fidelity Series Growth & Income Fund Class F (a) | | 856,752 | 11,489,041 |
| Fidelity Series Growth Company Fund Class F (a) | | 879,149 | 11,806,976 |
| Fidelity Series Intrinsic Opportunities Fund Class F (a) | | 591,642 | 8,898,297 |
| Fidelity Series Opportunistic Insights Fund Class F (a) | | 480,222 | 7,366,600 |
| Fidelity Series Real Estate Equity Fund Class F (a) | | 92,875 | 1,278,890 |
| Fidelity Series Small Cap Discovery Fund Class F (a) | | 183,635 | 1,937,354 |
| Fidelity Series Small Cap Opportunities Fund Class F (a) | | 437,932 | 5,793,839 |
| Fidelity Series Stock Selector Large Cap Value Fund Class F (a) | | 904,534 | 10,682,541 |
| TOTAL DOMESTIC EQUITY FUNDS | | | |
| (Cost $93,988,627) | | | 98,114,121 |
|
| International Equity Funds - 30.7% | | | |
| Fidelity Series Emerging Markets Fund Class F (a) | | 911,587 | 15,387,583 |
| Fidelity Series International Growth Fund Class F (a) | | 1,009,003 | 14,166,404 |
| Fidelity Series International Small Cap Fund Class F (a) | | 208,647 | 3,256,978 |
| Fidelity Series International Value Fund Class F (a) | | 1,495,525 | 14,222,443 |
| TOTAL INTERNATIONAL EQUITY FUNDS | | | |
| (Cost $45,061,048) | | | 47,033,408 |
|
| Bond Funds - 5.2% | | | |
| Fidelity Series Emerging Markets Debt Fund Class F (a) | | 93,104 | 964,553 |
| Fidelity Series Floating Rate High Income Fund Class F (a) | | 40,412 | 380,684 |
| Fidelity Series High Income Fund Class F (a) | | 455,703 | 4,265,377 |
| Fidelity Series Inflation-Protected Bond Index Fund Class F (a) | | 91,565 | 922,972 |
| Fidelity Series Investment Grade Bond Fund Class F (a) | | 66,133 | 767,147 |
| Fidelity Series Long-Term Treasury Bond Index Fund Class F (a) | | 143 | 1,378 |
| Fidelity Series Real Estate Income Fund Class F (a) | | 64,908 | 728,263 |
| TOTAL BOND FUNDS | | | |
| (Cost $7,753,511) | | | 8,030,374 |
|
| Short-Term Funds - 0.1% | | | |
| Fidelity Series Government Money Market Fund Class F 0.29% (a)(c) | | 49,925 | 49,925 |
| Fidelity Series Short-Term Credit Fund Class F (a) | | 2,686 | 26,944 |
| TOTAL SHORT-TERM FUNDS | | | |
| (Cost $76,693) | | | 76,869 |
| TOTAL INVESTMENT PORTFOLIO - 100.0% | | | |
| (Cost $146,879,879) | | | 153,254,772 |
| NET OTHER ASSETS (LIABILITIES) - 0.0% | | | (5,734) |
| NET ASSETS - 100% | | | $153,249,038 |
Legend
(a) Affiliated Fund
(b) Non-income producing
(c) The rate quoted is the annualized seven-day yield of the fund at period end.
Affiliated Underlying Funds
Information regarding the Fund's fiscal year to date purchases and sales of the affiliated Underlying Funds and income earned by the Fund from investments in affiliated Underlying Funds is as follows:
| Affiliate | Value, beginning of period | Purchases | Sales Proceeds | Dividend Income | Value, end of period |
| Fidelity Investments Money Market Portfolio Class F | $28,941 | $1,712 | $30,653 | $14 | $-- |
| Fidelity Series 100 Index Fund Class F | 2,024,736 | 1,388,380 | 219,306 | -- | 3,345,861 |
| Fidelity Series 1000 Value Index Fund Class F | 1,140,384 | 2,160,218 | 45,775 | -- | 3,368,429 |
| Fidelity Series All-Sector Equity Fund Class F | 6,385,886 | 2,923,650 | 3,619,417 | -- | 6,212,479 |
| Fidelity Series Blue Chip Growth Fund Class F | 4,432,129 | 3,164,325 | 250,197 | 19,806 | 7,830,317 |
| Fidelity Series Commodity Strategy Fund Class F | 1,149,762 | 1,432,084 | 27,227 | -- | 2,653,842 |
| Fidelity Series Emerging Markets Debt Fund Class F | 552,919 | 364,214 | 14,882 | 20,486 | 964,553 |
| Fidelity Series Emerging Markets Fund Class F | 8,387,755 | 5,557,974 | 59,017 | -- | 15,387,583 |
| Fidelity Series Equity-Income Fund Class F | 8,580,542 | 6,586,363 | 544,435 | 96,076 | 15,449,655 |
| Fidelity Series Floating Rate High Income Fund Class F | 222,236 | 151,444 | 6,075 | 6,560 | 380,684 |
| Fidelity Series Government Money Market Fund Class F 0.29% | -- | 50,156 | 231 | 36 | 49,925 |
| Fidelity Series Growth & Income Fund Class F | 6,575,813 | 4,638,285 | 380,068 | 64,480 | 11,489,041 |
| Fidelity Series Growth Company Fund Class F | 7,666,635 | 3,271,291 | 60,465 | -- | 11,806,976 |
| Fidelity Series High Income Fund Class F | 2,651,390 | 1,434,461 | 70,554 | 96,453 | 4,265,377 |
| Fidelity Series Inflation-Protected Bond Index Fund Class F | 454,250 | 468,906 | 12,505 | 699 | 922,972 |
| Fidelity Series International Growth Fund Class F | 8,062,474 | 5,788,127 | 219,619 | -- | 14,166,404 |
| Fidelity Series International Small Cap Fund Class F | 1,881,464 | 1,313,731 | 52,648 | -- | 3,256,978 |
| Fidelity Series International Value Fund Class F | 8,003,809 | 6,016,141 | 257,411 | -- | 14,222,443 |
| Fidelity Series Intrinsic Opportunities Fund Class F | 4,982,637 | 3,556,548 | 61,341 | 65,202 | 8,898,297 |
| Fidelity Series Investment Grade Bond Fund Class F | 447,320 | 399,728 | 93,708 | 7,276 | 767,147 |
| Fidelity Series Long-Term Treasury Bond Index Fund Class F | -- | 1,412 | -- | 6 | 1,378 |
| Fidelity Series Opportunistic Insights Fund Class F | 4,273,907 | 2,997,669 | 194,582 | -- | 7,366,600 |
| Fidelity Series Real Estate Equity Fund Class F | 788,241 | 620,785 | 93,752 | 10,226 | 1,278,890 |
| Fidelity Series Real Estate Income Fund Class F | 433,286 | 309,881 | 28,749 | 15,247 | 728,263 |
| Fidelity Series Short-Term Credit Fund Class F | 15,606 | 13,591 | 2,332 | 111 | 26,944 |
| Fidelity Series Small Cap Discovery Fund Class F | 1,142,780 | 799,659 | 89,597 | 2,446 | 1,937,354 |
| Fidelity Series Small Cap Opportunities Fund Class F | 3,437,265 | 2,399,386 | 431,560 | 19,068 | 5,793,839 |
| Fidelity Series Stock Selector Large Cap Value Fund Class F | 5,621,011 | 4,848,819 | 260,268 | -- | 10,682,541 |
| Total | $89,343,178 | $62,658,940 | $7,126,374 | $424,192 | $153,254,772 |
Investment Valuation
All investments are categorized as Level 1 under the Fair Value Hierarchy. The inputs or methodology used for valuing securities may not be an indication of the risk associated with investing in those securities. For more information on valuation inputs please refer to the Investment Valuation section in the accompanying Notes to Financial Statements.
See accompanying notes which are an integral part of the financial statements.
Fidelity Freedom K® 2060 Fund
Financial Statements
Statement of Assets and Liabilities
| | | September 30, 2016 (Unaudited) |
| Assets | | |
| Investment in securities, at value (cost $146,879,879) — See accompanying schedule | | $153,254,772 |
| Cash | | 4 |
| Receivable for investments sold | | 40,914 |
| Receivable for fund shares sold | | 2,410,969 |
| Total assets | | 155,706,659 |
| Liabilities | | |
| Payable for investments purchased | $773,497 | |
| Payable for fund shares redeemed | 1,678,386 | |
| Transfer agent fees payable | 5,738 | |
| Total liabilities | | 2,457,621 |
| Net Assets | | $153,249,038 |
| Net Assets consist of: | | |
| Paid in capital | | $147,049,636 |
| Undistributed net investment income | | 390,737 |
| Accumulated undistributed net realized gain (loss) on investments | | (566,228) |
| Net unrealized appreciation (depreciation) on investments | | 6,374,893 |
| Net Assets, for 14,689,656 shares outstanding | | $153,249,038 |
| Net Asset Value, offering price and redemption price per share ($153,249,038 ÷ 14,689,656 shares) | | $10.43 |
See accompanying notes which are an integral part of the financial statements.
Statement of Operations
| | | Six months ended September 30, 2016 (Unaudited) |
| Investment Income | | |
| Income distributions from underlying funds | | $424,192 |
| Expenses | | |
| Transfer agent fees | $27,517 | |
| Independent trustees' fees and expenses | 238 | |
| Total expenses | | 27,755 |
| Net investment income (loss) | | 396,437 |
| Realized and Unrealized Gain (Loss) | | |
| Realized gain (loss) on sale of underlying fund shares | (177,477) | |
| Capital gain distributions from underlying funds | 73,683 | |
| Total net realized gain (loss) | | (103,794) |
| Change in net unrealized appreciation (depreciation) on underlying funds | | 8,556,507 |
| Net gain (loss) | | 8,452,713 |
| Net increase (decrease) in net assets resulting from operations | | $8,849,150 |
See accompanying notes which are an integral part of the financial statements.
Statement of Changes in Net Assets
| | Six months ended September 30, 2016 (Unaudited) | Year ended March 31, 2016 |
| Increase (Decrease) in Net Assets | | |
| Operations | | |
| Net investment income (loss) | $396,437 | $741,111 |
| Net realized gain (loss) | (103,794) | 1,556,506 |
| Change in net unrealized appreciation (depreciation) | 8,556,507 | (2,186,118) |
| Net increase (decrease) in net assets resulting from operations | 8,849,150 | 111,499 |
| Distributions to shareholders from net investment income | (49,557) | (699,611) |
| Distributions to shareholders from net realized gain | (1,447,358) | (595,478) |
| Total distributions | (1,496,915) | (1,295,089) |
| Share transactions | | |
| Proceeds from sales of shares | 78,670,359 | 102,207,896 |
| Reinvestment of distributions | 1,496,915 | 1,295,089 |
| Cost of shares redeemed | (23,610,445) | (21,094,836) |
| Net increase (decrease) in net assets resulting from share transactions | 56,556,829 | 82,408,149 |
| Total increase (decrease) in net assets | 63,909,064 | 81,224,559 |
| Net Assets | | |
| Beginning of period | 89,339,974 | 8,115,415 |
| End of period | $153,249,038 | $89,339,974 |
| Other Information | | |
| Undistributed net investment income end of period | $390,737 | $43,857 |
| Shares | | |
| Sold | 7,797,857 | 10,315,507 |
| Issued in reinvestment of distributions | 155,282 | 129,296 |
| Redeemed | (2,346,589) | (2,139,479) |
| Net increase (decrease) | 5,606,550 | 8,305,324 |
See accompanying notes which are an integral part of the financial statements.
Financial Highlights — Fidelity Freedom K 2060 Fund
| | Six months ended (Unaudited) September 30, | Years ended March 31, | |
| | 2016 | 2016 | 2015 A |
| Selected Per–Share Data | | | |
| Net asset value, beginning of period | $9.84 | $10.43 | $10.00 |
| Income from Investment Operations | | | |
| Net investment income (loss)B | .03 | .17 | .05 |
| Net realized and unrealized gain (loss) | .71 | (.52) | .55 |
| Total from investment operations | .74 | (.35) | .60 |
| Distributions from net investment income | (.01) | (.12) | (.09) |
| Distributions from net realized gain | (.15) | (.12) | (.07) |
| Total distributions | (.15)C | (.24) | (.17)D |
| Net asset value, end of period | $10.43 | $9.84 | $10.43 |
| Total ReturnE | 7.66% | (3.42)% | 5.99% |
| Ratios to Average Net AssetsF,G | | | |
| Expenses before reductions | .05%H | .05% | .05%H |
| Expenses net of fee waivers, if any | .05%H | .05% | .05%H |
| Expenses net of all reductions | .05%H | .05% | .05%H |
| Net investment income (loss) | .68%H | 1.78% | .71%H |
| Supplemental Data | | | |
| Net assets, end of period (000 omitted) | $153,249 | $89,340 | $8,115 |
| Portfolio turnover rateF | 12%H | 18% | 15%H |
A For the period August 5, 2014 (commencement of operations) to March 31, 2015.
B Calculated based on average shares outstanding during the period.
C Total distributions of $.15 per share is comprised of distributions from net investment income of $.005 and distributions from net realized gain of $.146 per share.
D Total distributions of $.17 per share is comprised of distributions from net investment income of $.093 and distributions from net realized gain of $.073 per share.
E Total returns for periods of less than one year are not annualized.
F Amounts do not include the activity of the Underlying Funds.
G Expense ratios reflect operating expenses of the Fund. Expenses before reductions do not reflect amounts reimbursed by the investment adviser or reductions from expense offset arrangements and do not represent the amount paid by the Fund during periods when reimbursements or reductions occur. Expenses net of fee waivers reflect expenses after reimbursement by the investment adviser but prior to reductions from expense offset arrangements. Expenses net of all reductions represent the net expenses paid by the Fund but do not include expenses of the underlying funds in which the Fund invests.
H Annualized
See accompanying notes which are an integral part of the financial statements.
Notes to Financial Statements (Unaudited)
For the period ended September 30, 2016
1. Organization.
Fidelity Freedom K Income Fund, Fidelity Freedom K 2005 Fund, Fidelity Freedom K 2010 Fund, Fidelity Freedom K 2015 Fund, Fidelity Freedom K 2020 Fund, Fidelity Freedom K 2025 Fund, Fidelity Freedom K 2030 Fund, Fidelity Freedom K 2035 Fund, Fidelity Freedom K 2040 Fund, Fidelity Freedom K 2045 Fund, Fidelity Freedom K 2050 Fund, Fidelity Freedom K 2055 Fund and Fidelity Freedom K 2060 Fund (the Funds) are funds of Fidelity Aberdeen Street Trust (the Trust). The Trust is registered under the Investment Company Act of 1940, as amended (the 1940 Act), as an open-end management investment company organized as a Delaware statutory trust. Each Fund is authorized to issue an unlimited number of shares. Share transactions on the Statement of Changes in Net Assets may contain exchanges between affiliated funds. The Funds invest primarily in a combination of other Fidelity equity, bond, and short-term funds (the Underlying Funds) managed by Fidelity Management & Research Company (FMR).
2. Significant Accounting Policies.
The financial statements have been prepared in conformity with accounting principles generally accepted in the United States of America (GAAP), which require management to make certain estimates and assumptions at the date of the financial statements. Actual results could differ from those estimates. Subsequent events, if any, through the date that the financial statements were issued have been evaluated in the preparation of the financial statements. The following summarizes the significant accounting policies of the Funds:
Investment Valuation. Investments are valued as of 4:00 p.m. Eastern time on the last calendar day of the period. Each Fund categorizes the inputs to valuation techniques used to value its investments into a disclosure hierarchy consisting of three levels as shown below:
- Level 1 – quoted prices in active markets for identical investments
- Level 2 – other significant observable inputs (including quoted prices for similar investments, interest rates, prepayment speeds, etc.)
- Level 3 – unobservable inputs (including the Fund's own assumptions based on the best information available)
Valuation techniques used to value each Fund's investments by major category are as follows. Investments in the Underlying Funds are valued at their closing net asset value (NAV) each business day and are categorized as Level 1 in the hierarchy.
Investment Transactions and Income. For financial reporting purposes, the Funds' investment holdings and NAV include trades executed through the end of the last business day of the period. The NAV per share for processing shareholder transactions is calculated as of the close of business of the New York Stock Exchange (NYSE), normally 4:00 p.m. Eastern time and includes trades executed through the end of the prior business day. Gains and losses on securities sold are determined on the basis of identified cost. Income and capital gain distributions from the Underlying Funds, if any, are recorded on the ex-dividend date.
Expenses. Expenses directly attributable to a fund are charged to that fund. Expenses attributable to more than one fund are allocated among the respective funds on the basis of relative net assets or other appropriate methods. Expenses included in the accompanying financial statements reflect the expenses of each Fund and do not include any expenses associated with the Underlying Funds. Although not included in each Fund's expenses, each Fund indirectly bears its proportionate share of the Underlying Funds' expenses through the impact of these expenses on each Underlying Fund's NAV. Expense estimates are accrued in the period to which they relate and adjustments are made when actual amounts are known.
Income Tax Information and Distributions to Shareholders. Each year, each Fund intends to qualify as a regulated investment company under Subchapter M of the Internal Revenue Code, including distributing substantially all of its taxable income and realized gains. As a result, no provision for U.S. Federal income taxes is required. Each Fund files a U.S. federal tax return, in addition to state and local tax returns as required. Each Fund's federal income tax returns are subject to examination by the Internal Revenue Service (IRS) for a period of three fiscal years after they are filed. State and local tax returns may be subject to examination for an additional fiscal year depending on the jurisdiction.
Distributions are declared and recorded on the ex-dividend date. Income and capital gain distributions are determined in accordance with income tax regulations, which may differ from GAAP.
Capital accounts within the financial statements are adjusted for permanent book-tax differences. These adjustments have no impact on net assets or the results of operations. Capital accounts are not adjusted for temporary book-tax differences which will reverse in a subsequent period.
Book-tax differences are primarily due to the short-term gain distributions from the Underlying Funds and losses deferred due to wash sales and excise tax regulations.
The federal tax cost of investment securities and unrealized appreciation (depreciation) as of period end were as follows for each Fund:
| | Tax cost | Gross unrealized appreciation | Gross unrealized depreciation | Net unrealized appreciation (depreciation) on securities |
| Fidelity Freedom K Income Fund | $1,616,524,315 | $92,882,253 | $(12,737,701) | $80,144,552 |
| Fidelity Freedom K 2005 Fund | 396,039,392 | 31,263,255 | (3,164,346) | 28,098,909 |
| Fidelity Freedom K 2010 Fund | 2,566,749,326 | 280,951,544 | (19,893,594) | 261,057,950 |
| Fidelity Freedom K 2015 Fund | 4,839,218,479 | 554,096,032 | (40,843,356) | 513,252,676 |
| Fidelity Freedom K 2020 Fund | 15,090,657,836 | 1,663,379,757 | (152,978,206) | 1,510,401,551 |
| Fidelity Freedom K 2025 Fund | 12,491,498,974 | 1,359,255,461 | (140,558,111) | 1,218,697,350 |
| Fidelity Freedom K 2030 Fund | 14,658,057,142 | 1,884,007,499 | (193,359,228) | 1,690,648,271 |
| Fidelity Freedom K 2035 Fund | 9,736,873,178 | 1,254,787,385 | (143,343,577) | 1,111,443,808 |
| Fidelity Freedom K 2040 Fund | 10,358,505,729 | 1,386,361,739 | (151,088,002) | 1,235,273,737 |
| Fidelity Freedom K 2045 Fund | 6,388,869,367 | 726,073,003 | (94,440,266) | 631,632,737 |
| Fidelity Freedom K 2050 Fund | 5,442,560,395 | 586,054,415 | (80,484,536) | 505,569,879 |
| Fidelity Freedom K 2055 Fund | 1,664,883,312 | 104,139,896 | (28,026,264) | 76,113,632 |
| Fidelity Freedom K 2060 Fund | 147,373,083 | 7,396,403 | (1,514,714) | 5,881,689 |
3. Purchases and Redemptions of Underlying Fund Shares.
Purchases and redemptions of the Underlying Fund shares are noted in the table below.
| | Purchases ($) | Redemptions ($) |
| Fidelity Freedom K Income Fund | 412,857,333 | 443,821,179 |
| Fidelity Freedom K 2005 Fund | 105,101,863 | 117,086,834 |
| Fidelity Freedom K 2010 Fund | 421,688,670 | 669,812,599 |
| Fidelity Freedom K 2015 Fund | 687,095,392 | 1,158,712,665 |
| Fidelity Freedom K 2020 Fund | 1,712,886,521 | 2,200,258,463 |
| Fidelity Freedom K 2025 Fund | 1,623,180,882 | 1,530,333,023 |
| Fidelity Freedom K 2030 Fund | 1,346,588,113 | 1,405,102,076 |
| Fidelity Freedom K 2035 Fund | 1,067,830,396 | 970,021,972 |
| Fidelity Freedom K 2040 Fund | 1,033,281,756 | 930,774,017 |
| Fidelity Freedom K 2045 Fund | 834,118,791 | 557,712,180 |
| Fidelity Freedom K 2050 Fund | 731,309,423 | 479,713,467 |
| Fidelity Freedom K 2055 Fund | 353,636,079 | 127,263,452 |
| Fidelity Freedom K 2060 Fund | 62,658,940 | 7,126,374 |
4. Fees and Other Transactions with Affiliates.
Management Fee. FMR Co., Inc. (the investment adviser), an affiliate of FMR, provides the Funds with investment management related services. The Funds do not pay any fees for these services.
Other Transactions. The investment adviser has entered into an administration agreement with FMR under which FMR provides management and administrative services (other than investment advisory services) necessary for the operation of each Fund. Pursuant to this agreement, FMR pays all expenses of each Fund, excluding transfer agent fees, compensation of the independent Trustees and certain other expenses such as interest expense. FMR also contracts with other Fidelity companies to perform the services necessary for the operation of each Fund. The Funds do not pay any fees for these services.
Transfer Agent Fees. Fidelity Investments Institutional Operations Company, Inc. (FIIOC), an affiliate of the investment adviser, is the Funds' transfer, dividend disbursing and shareholder servicing agent. FIIOC receives an asset-based fee of .05% based on each Fund's average net assets. FIIOC pays for typesetting, printing and mailing of shareholder reports, except proxy statements.
5. Other.
The Funds' organizational documents provide former and current trustees and officers with a limited indemnification against liabilities arising in connection with the performance of their duties to the Funds. In the normal course of business, the Funds may also enter into contracts that provide general indemnifications. The Funds' maximum exposure under these arrangements is unknown as this would be dependent on future claims that may be made against the Funds. The risk of material loss from such claims is considered remote.
The Funds do not invest in the Underlying Funds for the purpose of exercising management or control; however, investments by the Funds within their principal investment strategies may represent a significant portion of the Underlying Fund's net assets. At the end of the period, the following Funds were the owners of record of 10% or more of the total outstanding shares of the Underlying Funds.
| Fund | Fidelity Freedom K 2020 Fund | Fidelity Freedom K 2025 Fund | Fidelity Freedom K 2030 Fund |
| Fidelity Series 1000 Value Index Fund | –% | –% | 11% |
| Fidelity Series All-Sector Equity Fund | –% | –% | 10% |
| Fidelity Series Blue Chip Growth Fund | –% | –% | 11% |
| Fidelity Series Equity-Income Fund | –% | –% | 11% |
| Fidelity Series Government Money Market Fund | 15% | –% | –% |
| Fidelity Series Growth & Income Fund | –% | –% | 11% |
| Fidelity Series Growth Company Fund | –% | –% | 11% |
| Fidelity Series Inflation-Protected Bond Index Fund | 10% | –% | –% |
| Fidelity Series International Growth Fund | –% | –% | 10% |
| Fidelity Series International Small Cap Fund | –% | –% | 10% |
| Fidelity Series International Value Fund | –% | –% | 10% |
| Fidelity Series Intrinsic Opportunities Fund | –% | –% | 11% |
| Fidelity Series Investment Grade Bond Fund | 17% | 12% | –% |
| Fidelity Series Long-Term Treasury Bond Index Fund | 17% | 12% | –% |
| Fidelity Series Opportunistic Insights Fund | –% | –% | 11% |
| Fidelity Series Real Estate Equity Fund | –% | –% | 10% |
| Fidelity Series Short-Term Credit Fund | 18% | 11% | –% |
| Fidelity Series Small Cap Discovery Fund | –% | –% | 11% |
| Fidelity Series Small Cap Opportunities Fund | –% | –% | 10% |
| Fidelity Series Stock Selector Large Cap Value Fund | –% | –% | 11% |
The Funds, in aggregate, were the owners of record of more than 20% of the total outstanding shares of the following Underlying Funds.
| Fund | % of shares held |
| Fidelity Series 100 Index Fund | 52% |
| Fidelity Series 1000 Value Index Fund | 58% |
| Fidelity Series All-Sector Equity Fund | 54% |
| Fidelity Series Blue Chip Growth Fund | 61% |
| Fidelity Series Commodity Strategy Fund | 45% |
| Fidelity Series Emerging Markets Debt Fund | 54% |
| Fidelity Series Emerging Markets Fund | 54% |
| Fidelity Series Equity-Income Fund | 61% |
| Fidelity Series Floating Rate High Income Fund | 54% |
| Fidelity Series Government Money Market Fund | 42% |
| Fidelity Series Growth & Income Fund | 61% |
| Fidelity Series Growth Company Fund | 60% |
| Fidelity Series High Income Fund | 53% |
| Fidelity Series Inflation-Protected Bond Index Fund | 45% |
| Fidelity Series International Growth Fund | 54% |
| Fidelity Series International Small Cap Fund | 54% |
| Fidelity Series International Value Fund | 54% |
| Fidelity Series Intrinsic Opportunities Fund | 61% |
| Fidelity Series Investment Grade Bond Fund | 50% |
| Fidelity Series Long-Term Treasury Bond Index Fund | 50% |
| Fidelity Series Opportunistic Insights Fund | 61% |
| Fidelity Series Real Estate Equity Fund | 55% |
| Fidelity Series Real Estate Income Fund | 53% |
| Fidelity Series Short-Term Credit Fund | 52% |
| Fidelity Series Small Cap Discovery Fund | 61% |
| Fidelity Series Small Cap Opportunities Fund | 54% |
| Fidelity Series Stock Selector Large Cap Value Fund | 61% |
Shareholder Expense Example
As a shareholder of a Fund, you incur two types of costs: (1) transaction costs and (2) ongoing costs, including other Fund expenses. This Example is intended to help you understand your ongoing costs (in dollars) of investing in the Funds and to compare these costs with the ongoing costs of investing in other mutual funds.
The Example is based on an investment of $1,000 invested at the beginning of the period and held for the entire period (April 1, 2016 to September 30, 2016).
Actual Expenses
The first line of the accompanying table for each fund provides information about actual account values and actual expenses. You may use the information in this line, together with the amount you invested, to estimate the expenses that you paid over the period. Simply divide your account value by $1,000.00 (for example, an $8,600 account value divided by $1,000.00 = 8.6), then multiply the result by the number in the first line for a fund under the heading entitled "Expenses Paid During Period" to estimate the expenses you paid on your account during this period. In addition, each Fund, as a shareholder in underlying Fidelity Funds, will indirectly bear its pro-rata share of the fees and expenses incurred by the underlying Fidelity Funds. These fees and expenses are not included in each Fund's annualized expense ratio used to calculate the expense estimates in the table below.
Hypothetical Example for Comparison Purposes
The second line of the accompanying table for each fund provides information about hypothetical account values and hypothetical expenses based on a fund's actual expense ratio and an assumed rate of return of 5% per year before expenses, which is not the Fund's actual return. The hypothetical account values and expenses may not be used to estimate the actual ending account balance or expenses you paid for the period. You may use this information to compare the ongoing costs of investing in the Fund and other funds. To do so, compare this 5% hypothetical example with the 5% hypothetical examples that appear in the shareholder reports of the other funds. In addition, each Fund, as a shareholder in underlying Fidelity Funds, will indirectly bear its pro-rata share of the fees and expenses incurred by the underlying Fidelity Funds. These fees and expenses are not included in each Fund's annualized expense ratio used to calculate the expense estimates in the table below.
Please note that the expenses shown in the table are meant to highlight your ongoing costs only and do not reflect any transaction costs. Therefore, the second line of the table is useful in comparing ongoing costs only, and will not help you determine the relative total costs of owning different funds.
| | Annualized Expense Ratio-A | Beginning
Account Value
April 1, 2016 | Ending
Account Value
September 30, 2016 | Expenses Paid
During Period-B
April 1, 2016
to September 30, 2016 |
| Fidelity Freedom K Income Fund | .05% | | | |
| Actual | | $1,000.00 | $1,043.00 | $.26 |
| Hypothetical-C | | $1,000.00 | $1,024.82 | $.25 |
| Fidelity Freedom K 2005 Fund | .05% | | | |
| Actual | | $1,000.00 | $1,050.90 | $.26 |
| Hypothetical-C | | $1,000.00 | $1,024.82 | $.25 |
| Fidelity Freedom K 2010 Fund | .05% | | | |
| Actual | | $1,000.00 | $1,055.50 | $.26 |
| Hypothetical-C | | $1,000.00 | $1,024.82 | $.25 |
| Fidelity Freedom K 2015 Fund | .05% | | | |
| Actual | | $1,000.00 | $1,060.10 | $.26 |
| Hypothetical-C | | $1,000.00 | $1,024.82 | $.25 |
| Fidelity Freedom K 2020 Fund | .05% | | | |
| Actual | | $1,000.00 | $1,064.00 | $.26 |
| Hypothetical-C | | $1,000.00 | $1,024.82 | $.25 |
| Fidelity Freedom K 2025 Fund | .05% | | | |
| Actual | | $1,000.00 | $1,066.70 | $.26 |
| Hypothetical-C | | $1,000.00 | $1,024.82 | $.25 |
| Fidelity Freedom K 2030 Fund | .05% | | | |
| Actual | | $1,000.00 | $1,074.10 | $.26 |
| Hypothetical-C | | $1,000.00 | $1,024.82 | $.25 |
| Fidelity Freedom K 2035 Fund | .05% | | | |
| Actual | | $1,000.00 | $1,077.50 | $.26 |
| Hypothetical-C | | $1,000.00 | $1,024.82 | $.25 |
| Fidelity Freedom K 2040 Fund | .05% | | | |
| Actual | | $1,000.00 | $1,076.80 | $.26 |
| Hypothetical-C | | $1,000.00 | $1,024.82 | $.25 |
| Fidelity Freedom K 2045 Fund | .05% | | | |
| Actual | | $1,000.00 | $1,076.80 | $.26 |
| Hypothetical-C | | $1,000.00 | $1,024.82 | $.25 |
| Fidelity Freedom K 2050 Fund | .05% | | | |
| Actual | | $1,000.00 | $1,077.40 | $.26 |
| Hypothetical-C | | $1,000.00 | $1,024.82 | $.25 |
| Fidelity Freedom K 2055 Fund | .05% | | | |
| Actual | | $1,000.00 | $1,077.10 | $.26 |
| Hypothetical-C | | $1,000.00 | $1,024.82 | $.25 |
| Fidelity Freedom K 2060 Fund | .05% | | | |
| Actual | | $1,000.00 | $1,076.60 | $.26 |
| Hypothetical-C | | $1,000.00 | $1,024.82 | $.25 |
A Annualized expense ratio reflects expenses net of applicable fee waivers.
B Expenses are equal to each Fund's annualized expense ratio, multiplied by the average account value over the period, multiplied by 183/365 (to reflect the one-half year period). The fees and expenses of the underlying Fidelity Funds in which each Fund invests are not included in each Fund's annualized expense ratio.
C 5% return per year before expenses
Board Approval of Investment Advisory Contracts and Management Fees
Fidelity Freedom K® Funds
Each year, the Board of Trustees, including the Independent Trustees (together, the Board), votes on the renewal of the management contract (the Advisory Contract) with FMR Co., Inc. (FMRC), an affiliate of Fidelity Management & Research Company (FMR), and the administration agreement between FMRC and FMR for each fund. The Board, assisted by the advice of fund counsel and Independent Trustees' counsel, requests and considers a broad range of information relevant to the renewal of the Advisory Contracts and administration agreements throughout the year.
The Board meets regularly and, at each of its meetings, covers an extensive agenda of topics and materials and considers factors that are relevant to its annual consideration of the renewal of each fund's Advisory Contract and administration agreement, including the services and support provided to each fund and its shareholders. The Board has established four standing committees (Committees) — Operations, Audit, Fair Valuation, and Governance and Nominating — each composed of and chaired by Independent Trustees with varying backgrounds, to which the Board has assigned specific subject matter responsibilities in order to enhance effective decision-making by the Board. The Operations Committee, of which all of the Independent Trustees are members, meets regularly throughout the year and considers, among other matters, information specifically related to the annual consideration of the renewal of each fund's Advisory Contract and administration agreement. The Board, acting directly and through its Committees, requests and receives information concerning the annual consideration of the renewal of each fund's Advisory Contract and administration agreement. The Board also meets as needed to consider matters specifically related to the Board's annual consideration of the renewal of the Advisory Contracts and administration agreements. Members of the Board may also meet with trustees of other Fidelity funds through ad hoc joint committees to discuss certain matters relevant to all of the Fidelity funds.
At its September 2016 meeting, the Board unanimously determined to renew each fund's Advisory Contract and administration agreement. In reaching its determination, the Board considered all factors it believed relevant and reached a determination, with the assistance of fund counsel and Independent Trustees' counsel and through the exercise of its business judgment, that the renewal of the Advisory Contract was in the best interests of each fund and its shareholders and that the fact that no fees are payable under the Advisory Contracts was fair and reasonable. The Board's decision to renew the Advisory Contracts was not based on any single factor, but rather was based on a comprehensive consideration of all the information provided to the Board at its meetings throughout the year. In reaching its determination, the Board was aware that shareholders of each fund have a broad range of investment choices available to them, including a wide choice among funds offered by Fidelity's competitors, and that each fund's shareholders, who have the opportunity to review and weigh the disclosure provided by the fund in its prospectus and other public disclosures, have chosen to invest in that fund, which is part of the Fidelity family of funds.
Approval of New Advisory Contracts. The Board noted that at its July 2016 meeting, it had voted to approve an amended and restated management contract (New Advisory Contract) for each fund to add a management fee payable by the fund. The Board considered that each fund’s New Advisory Contract will not take effect unless the funds’ shareholders approve the New Advisory Contracts and shareholders of certain other Fidelity funds also approve amended and restated management contracts. The Board noted that such approvals are scheduled to be voted on at meetings on October 28, 2016, but that one or more of the meetings may be adjourned to later dates. The Board also noted that, under each fund’s current Advisory Contract, the fund does not pay a management fee to FMRC and instead each fund indirectly incurs a portion of the management fee and other expenses of each underlying fund as acquired fund fees and expenses. The Board considered that, under each fund’s New Advisory Contract, each fund will pay a monthly management fee to FMRC at an annual rate for the fund. The Board noted that the increase in each fund’s management fee under the New Advisory Contract will result in the fund’s management fee rate ranking above the median of the management fee rates of its competitor funds based on the competitive mapped group data provided to the Board in July 2016 in connection with its consideration of the annual renewal of the current Advisory Contracts. The Board considered that the increase in each fund’s management fee under the New Advisory Contract will be more than offset by a decrease in each fund’s acquired fund fees and expenses as a result of fee reductions under new management contracts, sub-advisory agreements, transfer agent agreements, and pricing and bookkeeping agreements for the underlying funds (New Underlying Fund Contracts), which will go into effect if the funds’ New Advisory Contracts take effect. The Board noted that, once the New Underlying Fund Contracts take effect, the underlying funds will no longer pay any operating expenses, subject to limited exceptions, and, thus, the funds’ acquired fund fees and expenses will be significantly reduced. The Board noted that, as a result, the increased management fee and decreased acquired fund fees and expenses are expected to have the combined effect of reducing the total expenses incurred by shareholders of each fund by at least 0.02%. The Board considered that the approval of the New Advisory Contracts will not result in any changes to (i) the investment process or strategies employed in the management of the funds’ assets; (ii) the nature, extent and quality of services provided to each fund; or (iii) the day-to-day management of each fund and the personnel primarily responsible for such management. The Board considered that, like the current Advisory Contracts, the New Advisory Contracts provide that FMRC or an affiliate undertakes to pay all operating expenses of the funds, subject to limited exceptions specified in each contract.
The Board noted that certain of the information it considered in reaching its determination with respect to the current Advisory Contracts would no longer be applicable if the New Advisory Contracts take effect. Based on its evaluation of all of the conclusions noted, and after considering all factors it believed relevant, the Board ultimately concluded that the nature, extent and quality of services provided to each fund should continue to benefit shareholders of each fund, that the management fee structures under the New Advisory Contracts are fair and reasonable, and that each fund's New Advisory Contract should be approved.
Nature, Extent, and Quality of Services Provided. The Board considered Fidelity's staffing as it relates to the funds, including the backgrounds of investment personnel of FMRC, and also considered the funds' investment objectives, strategies, and related investment philosophies. The Independent Trustees also had discussions with senior management of Fidelity's investment operations and investment groups with responsibility for the underlying Fidelity funds in which each fund invests. The Board considered the structure of the investment personnel compensation program and whether this structure provides appropriate incentives to act in the best interests of each fund. Additionally, the Board considered the portfolio managers' investments, if any, in the funds that they manage.
Resources Dedicated to Investment Management and Support Services. The Board reviewed the general qualifications and capabilities of Fidelity's investment staff, including its size, education, experience, and resources, as well as Fidelity's approach to recruiting, managing, and compensating investment personnel. The Board noted that Fidelity has continued to increase the resources devoted to non-U.S. offices, including expansion of Fidelity's global investment organization. The Board also noted that Fidelity's analysts have extensive resources, tools and capabilities that allow them to conduct sophisticated quantitative and fundamental analysis, as well as credit analysis of issuers, counterparties and guarantors. Further, the Board considered that Fidelity's investment professionals have sufficient access to global information and data so as to provide competitive investment results over time, and that those professionals also have access to sophisticated tools that permit them to assess portfolio construction and risk and performance attribution characteristics continuously, as well as to transmit new information and research conclusions rapidly around the world. Additionally, in its deliberations, the Board considered Fidelity's risk management, compliance, and technology and operations capabilities and resources, which are integral parts of the investment management process.
Shareholder and Administrative Services. The Board considered (i) the nature, extent, quality, and cost of advisory, administrative, and shareholder services performed by Fidelity under the Advisory Contract and under separate agreements covering administration, transfer agency, and pricing and bookkeeping services for each fund; (ii) the nature and extent of the supervision of third party service providers, principally custodians, subcustodians, and pricing vendors; and (iii) the resources devoted to, and the record of compliance with, each fund's compliance policies and procedures.
The Board noted that the growth of fund assets over time across the complex allows Fidelity to reinvest in the development of services designed to enhance the value or convenience of the Fidelity funds as investment vehicles. These services include 24-hour access to account information and market information through telephone representatives and over the Internet, investor education materials and asset allocation tools, and the expanded availability of Fidelity Investor Centers.
Investment in a Large Fund Family. The Board considered the benefits to shareholders of investing in a Fidelity fund, including the benefits of investing in a fund that is part of a large family of funds offering a variety of investment disciplines and providing a large variety of mutual fund investor services. The Board noted that Fidelity had taken, or had made recommendations that resulted in the Fidelity funds taking, a number of actions over the previous year that benefited particular funds, including: (i) continuing to dedicate additional resources to investment research and to the support of the senior management team that oversees asset management; (ii) continuing efforts to enhance Fidelity's global research capabilities; (iii) launching new funds and making other enhancements to meet client needs; (iv) broadening eligibility requirements for certain lower-priced share classes of, and streamlining the fee structure for, certain existing equity index funds; (v) lowering expense caps for certain existing funds and classes to reduce expenses paid by shareholders; (vi) eliminating redemption fees for certain variable insurance product funds and classes; (vii) continuing to launch dedicated lower cost underlying funds to meet portfolio construction needs related to expanding underlying fund options for Fidelity funds of funds, specifically for the Freedom Fund product lines; (viii) launching a lower cost share class for use by the Freedom Index Fund product line; (ix) rationalizing product lines and gaining increased efficiencies through fund mergers and share class consolidations; (x) continuing to develop, acquire and implement systems and technology to improve services to the funds and shareholders, strengthen information security, and increase efficiency; (xi) implementing investment enhancements to further strengthen Fidelity's target date product line to increase investors' probability of success in achieving their goals; (xii) accelerating the conversion of all remaining Class B shares to Class A shares, which have a lower expense structure; and (xiii) implementing changes to Fidelity's money market fund product line in response to recent regulatory reforms.
Investment Performance. The Board considered whether each fund has operated in accordance with its investment objective, as well as its record of compliance with its investment restrictions and its performance history.
The Board took into account discussions with representatives of the investment adviser about fund investment performance that occur at Board meetings throughout the year. In this regard the Board noted that as part of regularly scheduled fund reviews and other reports to the Board on fund performance, the Board considers annualized return information for each fund for different time periods, measured against one or more securities market indices, including a customized blended index representative of the fund's asset classes (each a "benchmark index") and a peer group of funds with similar objectives ("peer group"), if any. In its evaluation of fund investment performance at meetings throughout the year, the Board gave particular attention to information indicating underperformance of certain Fidelity funds for specific time periods and discussed with the investment adviser the reasons for such underperformance.
In addition to reviewing absolute and relative fund performance, the Independent Trustees periodically consider the appropriateness of fund performance metrics in evaluating the results achieved. In general, the Independent Trustees believe that fund performance should be evaluated based on gross performance (before fees and expenses, including acquired fund fees and expenses, but after transaction costs, if any) compared to appropriate benchmark indices, over appropriate time periods that may include full market cycles, and on net performance (after fees and expenses, including acquired fund fees and expenses) compared to peer groups, as applicable, over the same periods, taking into account relevant factors including the following: general market conditions; the extent to which particular underlying funds affected performance; and fund cash flows and other factors. Depending on the circumstances, the Independent Trustees may be satisfied with a fund's performance notwithstanding that it lags its benchmark index or peer group for certain periods.
The Independent Trustees recognize that shareholders evaluate performance on a net basis over their own holding periods, for which one-, three-, and five-year periods are often used as a proxy. For this reason, the performance information reviewed by the Board also included net cumulative calendar year total return information for each fund and an appropriate benchmark index for the most recent one-, three-, and five-year periods (for the most recent one- and three-year periods for Freedom K 2055 Fund and for the most recent one-year period for Freedom K 2060 Fund).
Based on its review, the Board concluded that the nature, extent, and quality of services provided to each fund under the Advisory Contracts should continue to benefit the shareholders of each fund.
Competitiveness of Management Fee and Total Expense Ratio. The Board noted that the funds currently do not pay FMRC a management fee for investment advisory services, and that each fund bears indirectly the fees and expenses, including the management fees, paid by the underlying Fidelity funds in which it invests. The Board considered each fund's management fee and total expense ratio compared to "mapped groups" of competitive funds and classes created for the purpose of facilitating the Trustees' competitive analysis of management fees and total expenses. Fidelity creates "mapped groups" by combining similar Lipper investment objective categories that have comparable investment mandates. Combining Lipper investment objective categories aids the Board's management fee and total expense ratio comparisons by broadening the competitive group used for comparison.
Management Fee. The Board considered two proprietary management fee comparisons for the 12-month (or shorter) periods shown in basis points (BP) in the charts below. The group of Lipper funds used by the Board for management fee comparisons is referred to below as the "Total Mapped Group." The Total Mapped Group comparison focuses on a fund's standing in terms of gross management fees before expense reimbursements or caps relative to the total universe of funds with comparable investment mandates, regardless of whether their management fee structures also are comparable. Funds with comparable investment mandates offer exposure to similar types of securities. Funds with comparable management fee structures have similar management fee contractual arrangements (
e.g., flat rate charged for advisory services, all-inclusive fee rate,
etc.). "TMG %" represents the percentage of funds in the Total Mapped Group that had management fees that were lower than a fund's. For example, a hypothetical TMG % of 20% would mean that 80% of the funds in the Total Mapped Group had higher, and 20% had lower, management fees than a fund. The funds' actual TMG %s and the number of funds in the Total Mapped Group are in the charts below. The Board also noted that over the past few years, Fidelity has been developing and refining the competitive methodology for the funds to provide a more meaningful competitive comparison. As a result, beginning with the 2014 competitive results, instead of including all funds in one competitive mapped group that includes all funds-of-funds, Fidelity introduced three new Total Mapped Groups that consist of target retirement funds, grouped according to target retirement dates. The Board noted that Fidelity believes that the new Total Mapped Groups provide more meaningful competitive comparisons for the funds because they include target date funds, regardless of whether the fund is a fund of funds, and reflect, among other things, that active target date funds with a higher percentage of assets invested in equities tend to have higher expenses. The "Asset-Size Peer Group" (ASPG) comparison focuses on a fund's standing relative to a subset of non-Fidelity funds within the Total Mapped Group that are similar in size and management fee structure. For example, if a fund is in the first quartile of the ASPG, the fund's management fee ranks in the least expensive or lowest 25% of funds in the ASPG. The ASPG represents at least 15% of the funds in the Total Mapped Group with comparable asset size and management fee structures, subject to a minimum of 50 funds (or all funds in the Total Mapped Group if fewer than 50). Additional information, such as the ASPG quartile in which a fund's management fee rate ranked, is also included in the charts and considered by the Board.
Freedom K® 2005 Fund
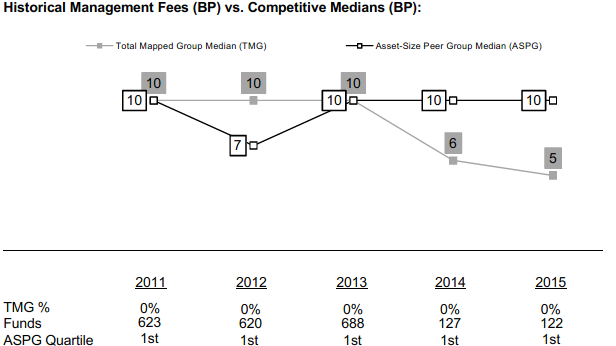
Freedom K® 2010 Fund
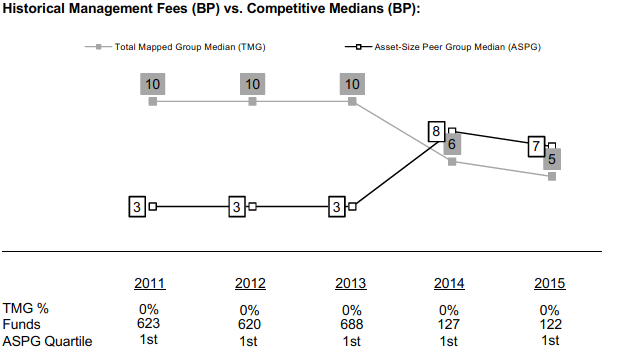
Freedom K® 2015 Fund
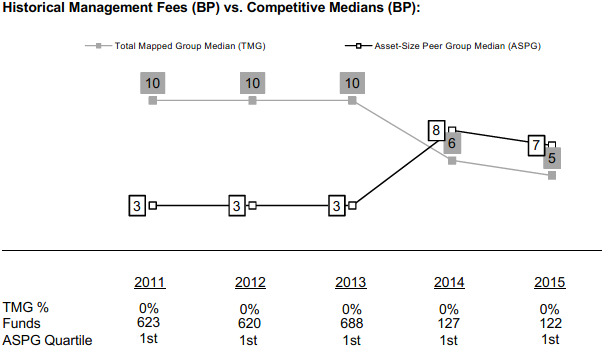
Freedom K® 2020 Fund
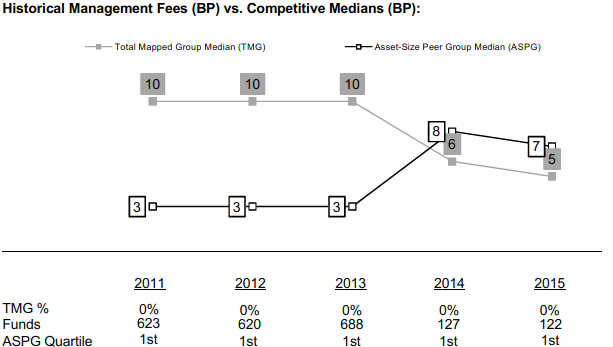
Freedom K® 2025 Fund
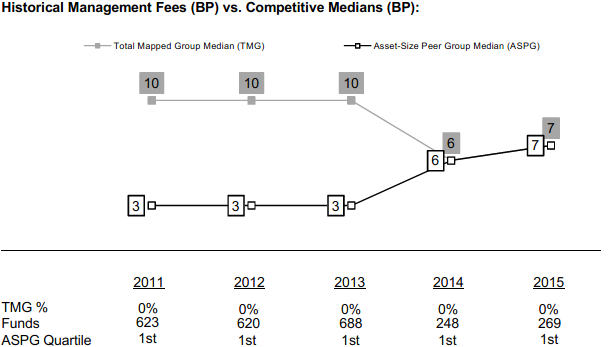
Freedom K® 2030 Fund
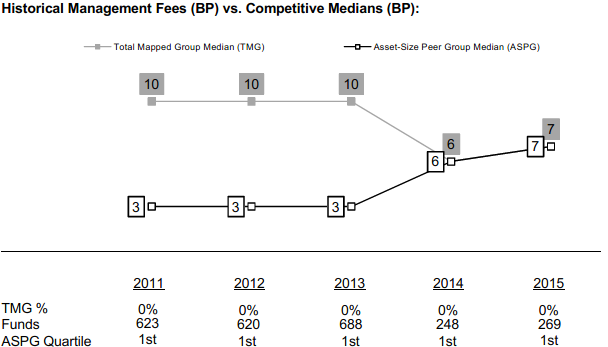
Freedom K® 2035 Fund
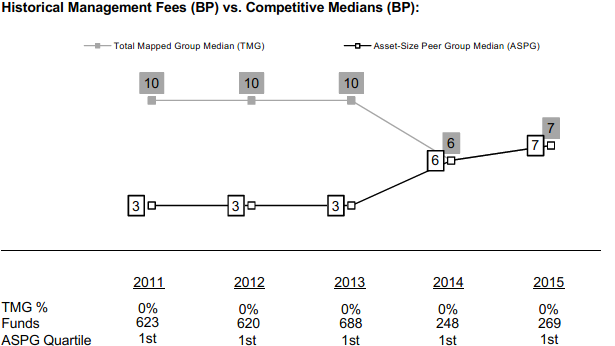
Freedom K® 2040 Fund
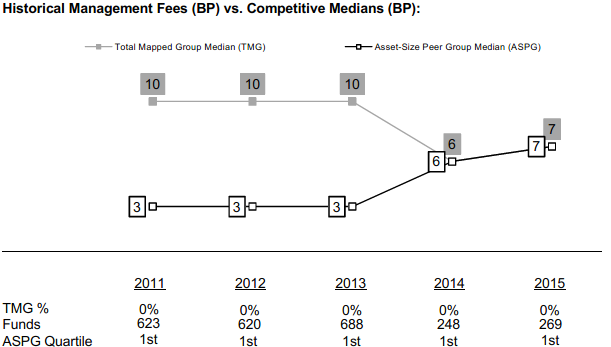
Freedom K® 2045 Fund
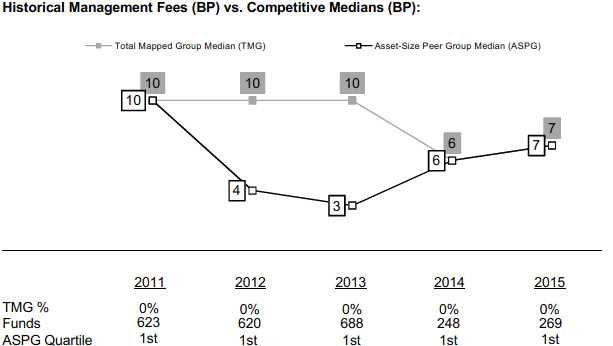
Freedom K® 2050 Fund
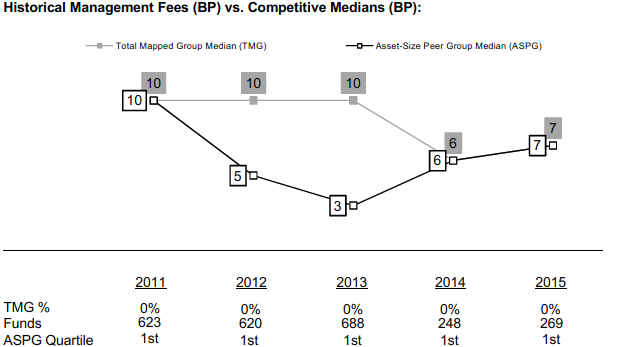
Freedom K® 2055 Fund
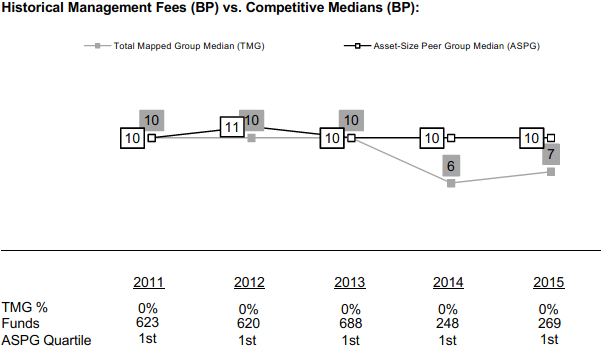
Freedom K® 2060 Fund
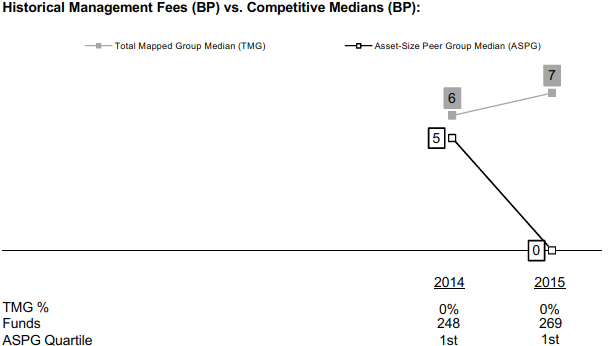
Freedom K® Income Fund
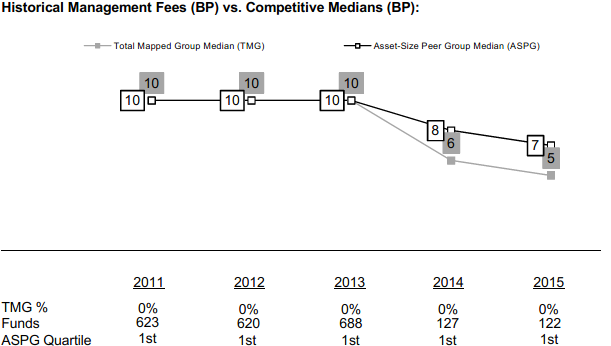
The Board noted that each fund's current management fee rate of 0.00% ranked below the median of its Total Mapped Group and below the median of its ASPG for 2015. The Board further noted that many peer funds pay fund-level expenses, including management fees, to which the funds are not currently subject.
The Board noted that, in 2014, the ad hoc Committee on Group Fee was formed by it and the boards of other Fidelity funds to conduct an in-depth review of the "group fee" component of the management fee of funds with such management fee structures, and that while the funds do not currently pay a management fee, they indirectly bear a portion of the management fees paid by the Fidelity funds in which they invest, some of which are currently subject to the group fee. The Committee's focus included the mechanics of the group fee, the competitive landscape of group fee structures, Fidelity funds with no group fee component (such as the funds) and investment products not included in group fee assets. The Board also considered that, for funds subject to the group fee, FMR agreed to voluntarily waive fees over a specified period of time in amounts designed to account for assets converted from certain funds to certain collective investment trusts.
Based on its review, the Board concluded that each fund's management fee is fair and reasonable in light of the services that the fund receives and the other factors considered.
Total Expense Ratio. In its review of each fund's total expense ratio, the Board considered that the funds pay transfer agent fees. The Board further noted that FMR pays all other expenses of each fund, with limited exceptions, pursuant to the administration agreement between FMRC and FMR with respect to each fund.
The Board noted that each fund's total expense ratio ranked below the competitive median for 2015.
In considering each fund's total expense ratio, the Board also considered an alternative competitive analysis that included both top level (
i.e., direct) fund fees and acquired fund fees and expenses for the fund and the other funds and classes to which it is compared. The Board noted that, under this alternative competitive analysis, each fund's total expense ratio ranked below the competitive median for 2015.
Fees Charged to Other Fidelity Clients. The Board also considered Fidelity fee structures and other information with respect to clients of Fidelity, such as other funds advised or subadvised by Fidelity, pension plan clients, and other institutional clients with similar mandates. The Board noted that an ad hoc joint committee created by it and the boards of other Fidelity funds periodically (most recently in 2013) reviews and compares Fidelity's institutional investment advisory business with its business of providing services to the Fidelity funds, including the differences in services provided, fees charged, and costs incurred, as well as competition in their respective marketplaces.
Based on its review of total expense ratios and fees charged to other Fidelity clients, the Board concluded that each fund's total expense ratio was reasonable in light of the services that the fund and its shareholders receive and the other factors considered.
Costs of the Services and Profitability. The Board considered the level of Fidelity's profits in respect of all the Fidelity funds, including the Fidelity funds in which the funds invest.
PricewaterhouseCoopers LLP (PwC), independent registered public accounting firm and auditor to Fidelity and certain Fidelity funds, has been engaged annually by the Board as part of the Board's assessment of Fidelity's profitability analysis. PwC's engagement includes the review and assessment of the methodologies used by Fidelity in determining the revenues and expenses attributable to Fidelity's mutual fund business, and completion of agreed-upon procedures in respect of the mathematical accuracy of the fund profitability information and its conformity to established allocation methodologies. After considering PwC's reports issued under the engagement and information provided by Fidelity, the Board concluded that while other allocation methods may also be reasonable, Fidelity's profitability methodologies are reasonable in all material respects.
The Board also reviewed Fidelity's non-fund businesses and fall-out benefits related to the mutual fund business as well as cases where Fidelity's affiliates may benefit from or be related to the funds' business.
The Board concluded that the costs of the services provided by and the profits realized by Fidelity in connection with the operation of each fund were not relevant to the renewal of each fund's current Advisory Contract because the funds do not currently pay management fees and FMR pays all other expenses of each fund, with limited exceptions.
Economies of Scale. The Board concluded that because the funds do not currently pay management fees and FMR pays all other expenses of each fund, with limited exceptions, economies of scale cannot currently be realized by the funds, but under the current fee arrangements may be realized by the other Fidelity funds in which each fund invests, many of which may benefit from breakpoints under the group fee arrangement.
Additional Information Requested by the Board. In order to develop fully the factual basis for consideration of the Fidelity funds' advisory contracts, the Board requested and received additional information on certain topics, including: (i) Fidelity's fund profitability methodology, profitability trends for certain funds, and the impact of certain factors on fund profitability results; (ii) portfolio manager changes that have occurred during the past year and the amount of the investment that each portfolio manager has made in the Fidelity fund(s) that he or she manages; (iii) Fidelity's compensation structure for portfolio managers, research analysts, and other key personnel, including its effects on fund profitability, the rationale for the compensation structure, and the extent to which current market conditions have affected retention and recruitment; (iv) the arrangements with and compensation paid to certain fund sub-advisers on behalf of the Fidelity funds; (v) Fidelity's voluntary waiver of its fees to maintain minimum yields for certain money market funds and classes as well as contractual waivers in place for certain funds; (vi) the methodology with respect to competitive fund data and peer group classifications; (vii) Fidelity's transfer agent fee, expense, and service structures for different funds and classes relative to competitive trends, and the impact of the increased use of omnibus accounts; (viii) Fidelity's long-term expectations for its offerings in the workplace investing channel; (ix) new developments in the retail and institutional marketplaces; (x) the approach to considering "fall-out" benefits; and (xi) the impact of money market reform on Fidelity's money market funds, including with respect to costs and profitability. In addition, the Board considered its discussions with Fidelity throughout the year regarding enhanced information security initiatives and the funds' fair valuation policies.
Based on its evaluation of all of the conclusions noted above, and after considering all factors it believed relevant, the Board concluded that the advisory fee structures are fair and reasonable, and that each fund's Advisory Contract should be renewed.
FF-K-SANN-1116
1.892601.107
Fidelity Advisor Freedom® Funds - Income, 2005, 2010, 2015, 2020, 2025, 2030, 2035, 2040, 2045, 2050, 2055, 2060 - Class A, Class T, Class C and Class I
Semi-Annual Report September 30, 2016 |
|
Contents
To view a fund's proxy voting guidelines and proxy voting record for the 12-month period ended June 30, visit http://www.fidelity.com/proxyvotingresults or visit the Securities and Exchange Commission's (SEC) web site at http://www.sec.gov.
You may also call 1-877-208-0098 to request a free copy of the proxy voting guidelines.
Standard & Poor's, S&P and S&P 500 are registered service marks of The McGraw-Hill Companies, Inc. and have been licensed for use by Fidelity Distributors Corporation.
Other third-party marks appearing herein are the property of their respective owners.
All other marks appearing herein are registered or unregistered trademarks or service marks of FMR LLC or an affiliated company. © 2016 FMR LLC. All rights reserved.
This report and the financial statements contained herein are submitted for the general information of the shareholders of the Funds. This report is not authorized for distribution to prospective investors in the Funds unless preceded or accompanied by an effective prospectus.
A fund files its complete schedule of portfolio holdings with the SEC for the first and third quarters of each fiscal year on Form N-Q. Forms N-Q are available on the SEC’s web site at http://www.sec.gov. A fund's Forms N-Q may be reviewed and copied at the SEC’s Public Reference Room in Washington, DC. Information regarding the operation of the SEC's Public Reference Room may be obtained by calling 1-800-SEC-0330.
For a complete list of a fund's portfolio holdings, view the most recent holdings listing, semiannual report, or annual report on Fidelity's web site at http://www.fidelity.com, http://www.institutional.fidelity.com, or http://www.401k.com, as applicable.
NOT FDIC INSURED •MAY LOSE VALUE •NO BANK GUARANTEE
Neither the Funds nor Fidelity Distributors Corporation is a bank.
Note to Shareholders
In July 2016, the Board of Trustees approved a new pricing structure for the Freedom Funds. Fund shareholders of record on August 29, 2016 have been asked to vote on the proposal. If approved by shareholders, the proposal will reduce the overall expenses that Freedom Fund shareholders pay (relative to the funds’ expenses as of March 31, 2016), and provide for less fluctuation in fund expenses. Under the new structure, each Freedom Fund will charge shareholders for all of its operating expenses directly, and most expenses that are currently charged by the underlying funds in which the Freedom Funds invest will be eliminated.
The note above is not a solicitation of any proxy. More detailed information is contained in the proxy statement.
Fidelity Advisor Freedom® Income Fund
Investment Summary (Unaudited)
The information in the following tables is based on the direct investments of the Fund.
Top Holdings as of September 30, 2016
| | % of fund's net assets | % of fund's net assets 6 months ago |
| Fidelity Series Investment Grade Bond Fund | 37.5 | 38.7 |
| Fidelity Series Government Money Market Fund 0.29% | 17.2 | 0.0 |
| Fidelity Advisor Series Short-Term Credit Fund | 9.1 | 9.0 |
| Fidelity Series Emerging Markets Fund | 4.8 | 4.5 |
| Fidelity Series Inflation-Protected Bond Index Fund | 3.9 | 3.8 |
| Fidelity Series High Income Fund | 3.1 | 3.0 |
| Fidelity Advisor Series Equity-Income Fund | 3.0 | 3.1 |
| Fidelity Series International Value Fund | 2.5 | 2.0 |
| Fidelity Series International Growth Fund | 2.4 | 2.1 |
| Fidelity Advisor Series Growth & Income Fund | 2.1 | 2.2 |
| | 85.6 | 68.4 |
Asset Allocation (% of fund's net assets)
| Period end |
| | Domestic Equity Funds | 17.4% |
| | International Equity Funds | 10.3% |
| | Bond Funds | 46.0% |
| | Short-Term Funds | 26.3% |

| Six months ago |
| | Domestic Equity Funds | 18.5% |
| | International Equity Funds | 9.1% |
| | Bond Funds | 46.9% |
| | Short-Term Funds | 25.5% |

Percentages shown as 0.0% may reflect amounts less than 0.05%.
Domestic Equity Funds category includes Fidelity Series Commodity Strategy Fund which invests in commodity-related investments.
Fidelity Advisor Freedom® Income Fund
Investments September 30, 2016 (Unaudited)
Showing Percentage of Net Assets
| Domestic Equity Funds - 17.4% | | | |
| | | Shares | Value |
| Fidelity Advisor Series Equity Growth Fund (a) | | 343,902 | $3,941,112 |
| Fidelity Advisor Series Equity-Income Fund (a) | | 572,734 | 7,078,995 |
| Fidelity Advisor Series Growth & Income Fund (a) | | 370,917 | 4,910,946 |
| Fidelity Advisor Series Growth Opportunities Fund (a) | | 239,044 | 2,600,802 |
| Fidelity Advisor Series Opportunistic Insights Fund (a) | | 240,076 | 3,680,360 |
| Fidelity Advisor Series Small Cap Fund (a) | | 186,069 | 1,972,335 |
| Fidelity Advisor Series Stock Selector Large Cap Value Fund (a) | | 395,780 | 4,721,658 |
| Fidelity Series 100 Index Fund (a) | | 141,922 | 2,026,643 |
| Fidelity Series 1000 Value Index Fund (a) | | 70,188 | 784,004 |
| Fidelity Series All-Sector Equity Fund (a) | | 207,453 | 2,786,090 |
| Fidelity Series Commodity Strategy Fund (a)(b) | | 723,834 | 3,829,081 |
| Fidelity Series Real Estate Equity Fund (a) | | 35,252 | 485,425 |
| Fidelity Series Small Cap Opportunities Fund (a) | | 181,906 | 2,392,068 |
| TOTAL DOMESTIC EQUITY FUNDS | | | |
| (Cost $34,818,665) | | | 41,209,519 |
|
| International Equity Funds - 10.3% | | | |
| Fidelity Series Emerging Markets Fund (a) | | 681,358 | 11,460,439 |
| Fidelity Series International Growth Fund (a) | | 413,048 | 5,782,673 |
| Fidelity Series International Small Cap Fund (a) | | 85,334 | 1,328,643 |
| Fidelity Series International Value Fund (a) | | 612,445 | 5,805,977 |
| TOTAL INTERNATIONAL EQUITY FUNDS | | | |
| (Cost $21,154,045) | | | 24,377,732 |
|
| Bond Funds - 46.0% | | | |
| Fidelity Series Emerging Markets Debt Fund (a) | | 154,618 | 1,601,841 |
| Fidelity Series Floating Rate High Income Fund (a) | | 63,508 | 598,241 |
| Fidelity Series High Income Fund (a) | | 783,330 | 7,331,971 |
| Fidelity Series Inflation-Protected Bond Index Fund (a) | | 909,003 | 9,153,662 |
| Fidelity Series Investment Grade Bond Fund (a) | | 7,631,342 | 88,523,572 |
| Fidelity Series Long-Term Treasury Bond Index Fund (a) | | 9,319 | 89,925 |
| Fidelity Series Real Estate Income Fund (a) | | 104,718 | 1,174,939 |
| TOTAL BOND FUNDS | | | |
| (Cost $103,580,176) | | | 108,474,151 |
|
| Short-Term Funds - 26.3% | | | |
| Fidelity Advisor Series Short-Term Credit Fund (a) | | 2,141,900 | 21,504,675 |
| Fidelity Series Government Money Market Fund 0.29% (a)(c) | | 40,486,604 | 40,486,604 |
| TOTAL SHORT-TERM FUNDS | | | |
| (Cost $61,871,645) | | | 61,991,279 |
| TOTAL INVESTMENT PORTFOLIO - 100.0% | | | |
| (Cost $221,424,531) | | | 236,052,681 |
| NET OTHER ASSETS (LIABILITIES) - 0.0% | | | (52,858) |
| NET ASSETS - 100% | | | $235,999,823 |
Legend
(a) Affiliated Fund
(b) Non-income producing
(c) The rate quoted is the annualized seven-day yield of the fund at period end.
Affiliated Underlying Funds
Information regarding the Fund's fiscal year to date purchases and sales of the affiliated Underlying Funds and income earned by the Fund from investments in affiliated Underlying Funds is as follows:
| Affiliate | Value, beginning of period | Purchases | Sales Proceeds | Dividend Income | Value, end of period |
| Fidelity Advisor Series Equity Growth Fund | $4,170,532 | $157,008 | $660,591 | - | $3,941,112 |
| Fidelity Advisor Series Equity-Income Fund | 7,499,856 | 356,582 | 1,313,299 | 70,736 | 7,078,995 |
| Fidelity Advisor Series Growth & Income Fund | 5,181,817 | 239,324 | 889,113 | 40,687 | 4,910,946 |
| Fidelity Advisor Series Growth Opportunities Fund | 2,708,485 | 102,847 | 360,496 | - | 2,600,802 |
| Fidelity Advisor Series Opportunistic Insights Fund | 3,870,818 | 146,024 | 562,274 | - | 3,680,360 |
| Fidelity Advisor Series Short-Term Credit Fund | 21,641,283 | 2,002,538 | 2,223,928 | 112,213 | 21,504,675 |
| Fidelity Advisor Series Small Cap Fund | 2,074,093 | 78,368 | 279,188 | - | 1,972,335 |
| Fidelity Advisor Series Stock Selector Large Cap Value Fund | 4,986,947 | 201,909 | 784,995 | - | 4,721,658 |
| Fidelity Investments Money Market Portfolio Institutional Class 0.59% | 39,911,216 | 938,602 | 40,849,817 | 17,636 | - |
| Fidelity Series 100 Index Fund | 2,263,782 | 83,852 | 451,752 | - | 2,026,643 |
| Fidelity Series 1000 Value Index Fund | 830,427 | 39,972 | 149,683 | - | 784,004 |
| Fidelity Series All-Sector Equity Fund | 4,980,957 | 117,366 | 2,615,643 | - | 2,786,090 |
| Fidelity Series Commodity Strategy Fund | 3,039,129 | 908,759 | 355,436 | - | 3,829,081 |
| Fidelity Series Emerging Markets Debt Fund | 1,514,889 | 99,513 | 148,484 | 42,879 | 1,601,841 |
| Fidelity Series Emerging Markets Fund | 10,817,005 | 425,835 | 1,112,261 | - | 11,460,439 |
| Fidelity Series Floating Rate High Income Fund | 576,369 | 51,039 | 57,239 | 12,855 | 598,241 |
| Fidelity Series Government Money Market Fund 0.29% | - | 43,418,201 | 2,931,597 | 38,002 | 40,486,604 |
| Fidelity Series High Income Fund | 7,250,104 | 219,643 | 697,475 | 204,920 | 7,331,971 |
| Fidelity Series Inflation-Protected Bond Index Fund | 9,178,161 | 726,433 | 921,555 | 3,887 | 9,153,662 |
| Fidelity Series International Growth Fund | 4,908,680 | 1,309,059 | 701,777 | - | 5,782,673 |
| Fidelity Series International Small Cap Fund | 1,235,333 | 309,143 | 257,097 | - | 1,328,643 |
| Fidelity Series International Value Fund | 4,868,843 | 1,454,639 | 732,834 | - | 5,805,977 |
| Fidelity Series Investment Grade Bond Fund | 93,313,492 | 4,653,642 | 11,829,623 | 1,121,703 | 88,523,572 |
| Fidelity Series Long-Term Treasury Bond Index Fund | - | 99,724 | 6,425 | 392 | 89,925 |
| Fidelity Series Real Estate Equity Fund | 519,656 | 58,503 | 81,863 | 4,479 | 485,425 |
| Fidelity Series Real Estate Income Fund | 1,166,856 | 116,901 | 145,301 | 28,864 | 1,174,939 |
| Fidelity Series Small Cap Opportunities Fund | 2,504,141 | 100,311 | 415,932 | 6,129 | 2,392,068 |
| Total | $241,012,871 | $58,415,737 | $71,535,678 | $1,705,382 | $236,052,681 |
Investment Valuation
All investments are categorized as Level 1 under the Fair Value Hierarchy. The inputs or methodology used for valuing securities may not be an indication of the risk associated with investing in those securities. For more information on valuation inputs please refer to the Investment Valuation section in the accompanying Notes to Financial Statements.
See accompanying notes which are an integral part of the financial statements.
Fidelity Advisor Freedom® Income Fund
Financial Statements
Statement of Assets and Liabilities
| | | September 30, 2016 (Unaudited) |
| Assets | | |
| Investment in securities, at value (cost $221,424,531) — See accompanying schedule | | $236,052,681 |
| Receivable for investments sold | | 685,582 |
| Receivable for fund shares sold | | 157,405 |
| Total assets | | 236,895,668 |
| Liabilities | | |
| Payable for investments purchased | $469,697 | |
| Payable for fund shares redeemed | 375,510 | |
| Distribution and service plan fees payable | 50,638 | |
| Total liabilities | | 895,845 |
| Net Assets | | $235,999,823 |
| Net Assets consist of: | | |
| Paid in capital | | $221,365,468 |
| Undistributed net investment income | | 245,538 |
| Accumulated undistributed net realized gain (loss) on investments | | (239,333) |
| Net unrealized appreciation (depreciation) on investments | | 14,628,150 |
| Net Assets | | $235,999,823 |
| Calculation of Maximum Offering Price | | |
| Class A: | | |
| Net Asset Value and redemption price per share ($96,588,326 ÷ 8,841,914 shares) | | $10.92 |
| Maximum offering price per share (100/94.25 of $10.92) | | $11.59 |
| Class T: | | |
| Net Asset Value and redemption price per share ($42,452,320 ÷ 3,890,048 shares) | | $10.91 |
| Maximum offering price per share (100/96.50 of $10.91) | | $11.31 |
| Class C: | | |
| Net Asset Value and offering price per share ($15,272,956 ÷ 1,401,986 shares)(a) | | $10.89 |
| Class I: | | |
| Net Asset Value, offering price and redemption price per share ($81,686,221 ÷ 7,455,683 shares) | | $10.96 |
(a) Redemption price per share is equal to net asset value less any applicable contingent deferred sales charge.
See accompanying notes which are an integral part of the financial statements.
Statement of Operations
| | | Six months ended September 30, 2016 (Unaudited) |
| Investment Income | | |
| Income distributions from underlying funds | | $1,705,382 |
| Expenses | | |
| Distribution and service plan fees | $305,758 | |
| Independent trustees' fees and expenses | 542 | |
| Total expenses before reductions | 306,300 | |
| Expense reductions | (542) | 305,758 |
| Net investment income (loss) | | 1,399,624 |
| Realized and Unrealized Gain (Loss) | | |
| Realized gain (loss) on sale of underlying fund shares | 468,487 | |
| Capital gain distributions from underlying funds | 46,522 | |
| Total net realized gain (loss) | | 515,009 |
| Change in net unrealized appreciation (depreciation) on underlying funds | | 7,691,256 |
| Net gain (loss) | | 8,206,265 |
| Net increase (decrease) in net assets resulting from operations | | $9,605,889 |
See accompanying notes which are an integral part of the financial statements.
Statement of Changes in Net Assets
| | Six months ended September 30, 2016 (Unaudited) | Year ended March 31, 2016 |
| Increase (Decrease) in Net Assets | | |
| Operations | | |
| Net investment income (loss) | $1,399,624 | $4,154,175 |
| Net realized gain (loss) | 515,009 | 3,508,389 |
| Change in net unrealized appreciation (depreciation) | 7,691,256 | (9,566,078) |
| Net increase (decrease) in net assets resulting from operations | 9,605,889 | (1,903,514) |
| Distributions to shareholders from net investment income | (1,338,863) | (4,164,603) |
| Distributions to shareholders from net realized gain | (1,970,150) | (4,540,387) |
| Total distributions | (3,309,013) | (8,704,990) |
| Share transactions - net increase (decrease) | (11,245,760) | (21,181,266) |
| Total increase (decrease) in net assets | (4,948,884) | (31,789,770) |
| Net Assets | | |
| Beginning of period | 240,948,707 | 272,738,477 |
| End of period | $235,999,823 | $240,948,707 |
| Other Information | | |
| Undistributed net investment income end of period | $245,538 | $184,777 |
See accompanying notes which are an integral part of the financial statements.
Financial Highlights — Fidelity Advisor Freedom Income Fund Class A
| | Six months ended (Unaudited) September 30, | Years ended March 31, | | | | |
| | 2016 | 2016 | 2015 | 2014 | 2013 | 2012 |
| Selected Per–Share Data | | | | | | |
| Net asset value, beginning of period | $10.64 | $11.07 | $11.20 | $11.21 | $10.98 | $10.85 |
| Income from Investment Operations | | | | | | |
| Net investment income (loss)A | .06 | .18 | .16 | .12 | .12 | .15 |
| Net realized and unrealized gain (loss) | .37 | (.25) | .24 | .28 | .37 | .21 |
| Total from investment operations | .43 | (.07) | .40 | .40 | .49 | .36 |
| Distributions from net investment income | (.06) | (.18) | (.17) | (.12) | (.12) | (.15) |
| Distributions from net realized gain | (.09) | (.19) | (.36) | (.29) | (.14) | (.08) |
| Total distributions | (.15) | (.36)B | (.53) | (.41) | (.26) | (.23) |
| Net asset value, end of period | $10.92 | $10.64 | $11.07 | $11.20 | $11.21 | $10.98 |
| Total ReturnC,D,E | 4.06% | (.59)% | 3.65% | 3.65% | 4.53% | 3.34% |
| Ratios to Average Net AssetsF,G | | | | | | |
| Expenses before reductions | .25%H | .25% | .25% | .25% | .25% | .25% |
| Expenses net of fee waivers, if any | .25%H | .25% | .25% | .25% | .25% | .25% |
| Expenses net of all reductions | .25%H | .25% | .25% | .25% | .25% | .25% |
| Net investment income (loss) | 1.18%H | 1.63% | 1.48% | 1.10% | 1.08% | 1.37% |
| Supplemental Data | | | | | | |
| Net assets, end of period (000 omitted) | $96,588 | $99,211 | $124,755 | $147,818 | $176,876 | $166,658 |
| Portfolio turnover rateF | 49%H | 30% | 38% | 36% | 17% | 24% |
A Calculated based on average shares outstanding during the period.
B Total distributions of $.36 per share is comprised of distributions from net investment income of $.176 and distributions from net realized gain of $.187 per share.
C Total returns for periods of less than one year are not annualized.
D Total returns would have been lower if certain expenses had not been reduced during the applicable periods shown.
E Total returns do not include the effect of the sales charges.
F Amounts do not include the activity of the Underlying Funds.
G Expense ratios reflect operating expenses of the class. Expenses before reductions do not reflect amounts reimbursed by the investment adviser or reductions from expense offset arrangements and do not represent the amount paid by the class during periods when reimbursements or reductions occur. Expenses net of fee waivers reflect expenses after reimbursement by the investment adviser but prior to reductions from expense offset arrangements. Expenses net of all reductions represent the net expenses paid by the class but do not include expenses of the underlying funds in which the Fund invests.
H Annualized
See accompanying notes which are an integral part of the financial statements.
Financial Highlights — Fidelity Advisor Freedom Income Fund Class T
| | Six months ended (Unaudited) September 30, | Years ended March 31, | | | | |
| | 2016 | 2016 | 2015 | 2014 | 2013 | 2012 |
| Selected Per–Share Data | | | | | | |
| Net asset value, beginning of period | $10.62 | $11.06 | $11.19 | $11.20 | $10.96 | $10.84 |
| Income from Investment Operations | | | | | | |
| Net investment income (loss)A | .05 | .15 | .14 | .09 | .09 | .12 |
| Net realized and unrealized gain (loss) | .37 | (.25) | .23 | .28 | .38 | .20 |
| Total from investment operations | .42 | (.10) | .37 | .37 | .47 | .32 |
| Distributions from net investment income | (.05) | (.15) | (.14) | (.09) | (.09) | (.12) |
| Distributions from net realized gain | (.09) | (.19) | (.36) | (.29) | (.14) | (.08) |
| Total distributions | (.13)B | (.34) | (.50) | (.38) | (.23) | (.20) |
| Net asset value, end of period | $10.91 | $10.62 | $11.06 | $11.19 | $11.20 | $10.96 |
| Total ReturnC,D,E | 4.03% | (.93)% | 3.39% | 3.40% | 4.35% | 3.01% |
| Ratios to Average Net AssetsF,G | | | | | | |
| Expenses before reductions | .50%H | .50% | .50% | .50% | .50% | .50% |
| Expenses net of fee waivers, if any | .50%H | .50% | .50% | .50% | .50% | .50% |
| Expenses net of all reductions | .50%H | .50% | .50% | .50% | .50% | .50% |
| Net investment income (loss) | .93%H | 1.38% | 1.23% | .85% | .83% | 1.12% |
| Supplemental Data | | | | | | |
| Net assets, end of period (000 omitted) | $42,452 | $42,887 | $47,804 | $53,019 | $53,734 | $56,246 |
| Portfolio turnover rateF | 49%H | 30% | 38% | 36% | 17% | 24% |
A Calculated based on average shares outstanding during the period.
B Total distributions of $.13 per share is comprised of distributions from net investment income of $.047 and distributions from net realized gain of $.087 per share.
C Total returns for periods of less than one year are not annualized.
D Total returns would have been lower if certain expenses had not been reduced during the applicable periods shown.
E Total returns do not include the effect of the sales charges.
F Amounts do not include the activity of the Underlying Funds.
G Expense ratios reflect operating expenses of the class. Expenses before reductions do not reflect amounts reimbursed by the investment adviser or reductions from expense offset arrangements and do not represent the amount paid by the class during periods when reimbursements or reductions occur. Expenses net of fee waivers reflect expenses after reimbursement by the investment adviser but prior to reductions from expense offset arrangements. Expenses net of all reductions represent the net expenses paid by the class but do not include expenses of the underlying funds in which the Fund invests.
H Annualized
See accompanying notes which are an integral part of the financial statements.
Financial Highlights — Fidelity Advisor Freedom Income Fund Class C
| | Six months ended (Unaudited) September 30, | Years ended March 31, | | | | |
| | 2016 | 2016 | 2015 | 2014 | 2013 | 2012 |
| Selected Per–Share Data | | | | | | |
| Net asset value, beginning of period | $10.61 | $11.04 | $11.17 | $11.18 | $10.96 | $10.84 |
| Income from Investment Operations | | | | | | |
| Net investment income (loss)A | .02 | .09 | .08 | .04 | .04 | .07 |
| Net realized and unrealized gain (loss) | .37 | (.24) | .24 | .28 | .36 | .20 |
| Total from investment operations | .39 | (.15) | .32 | .32 | .40 | .27 |
| Distributions from net investment income | (.02) | (.10) | (.09) | (.04) | (.04) | (.07) |
| Distributions from net realized gain | (.09) | (.19) | (.36) | (.29) | (.14) | (.08) |
| Total distributions | (.11) | (.28)B | (.45) | (.33) | (.18) | (.15) |
| Net asset value, end of period | $10.89 | $10.61 | $11.04 | $11.17 | $11.18 | $10.96 |
| Total ReturnC,D,E | 3.70% | (1.35)% | 2.90% | 2.89% | 3.70% | 2.50% |
| Ratios to Average Net AssetsF,G | | | | | | |
| Expenses before reductions | 1.00%H | 1.00% | 1.00% | 1.00% | 1.00% | 1.00% |
| Expenses net of fee waivers, if any | 1.00%H | 1.00% | 1.00% | 1.00% | 1.00% | 1.00% |
| Expenses net of all reductions | 1.00%H | 1.00% | 1.00% | 1.00% | 1.00% | 1.00% |
| Net investment income (loss) | .43%H | .88% | .73% | .35% | .33% | .62% |
| Supplemental Data | | | | | | |
| Net assets, end of period (000 omitted) | $15,273 | $14,712 | $15,780 | $15,735 | $16,606 | $17,170 |
| Portfolio turnover rateF | 49%H | 30% | 38% | 36% | 17% | 24% |
A Calculated based on average shares outstanding during the period.
B Total distributions of $.28 per share is comprised of distributions from net investment income of $.095 and distributions from net realized gain of $.187 per share.
C Total returns for periods of less than one year are not annualized.
D Total returns would have been lower if certain expenses had not been reduced during the applicable periods shown.
E Total returns do not include the effect of the contingent deferred sales charge.
F Amounts do not include the activity of the Underlying Funds.
G Expense ratios reflect operating expenses of the class. Expenses before reductions do not reflect amounts reimbursed by the investment adviser or reductions from expense offset arrangements and do not represent the amount paid by the class during periods when reimbursements or reductions occur. Expenses net of fee waivers reflect expenses after reimbursement by the investment adviser but prior to reductions from expense offset arrangements. Expenses net of all reductions represent the net expenses paid by the class but do not include expenses of the underlying funds in which the Fund invests.
H Annualized
See accompanying notes which are an integral part of the financial statements.
Financial Highlights — Fidelity Advisor Freedom Income Fund Class I
| | Six months ended (Unaudited) September 30, | Years ended March 31, | | | | |
| | 2016 | 2016 | 2015 | 2014 | 2013 | 2012 |
| Selected Per–Share Data | | | | | | |
| Net asset value, beginning of period | $10.67 | $11.10 | $11.23 | $11.23 | $11.00 | $10.87 |
| Income from Investment Operations | | | | | | |
| Net investment income (loss)A | .08 | .20 | .19 | .15 | .15 | .18 |
| Net realized and unrealized gain (loss) | .37 | (.24) | .24 | .29 | .37 | .20 |
| Total from investment operations | .45 | (.04) | .43 | .44 | .52 | .38 |
| Distributions from net investment income | (.07) | (.20) | (.19) | (.15) | (.14) | (.17) |
| Distributions from net realized gain | (.09) | (.19) | (.36) | (.29) | (.14) | (.08) |
| Total distributions | (.16) | (.39) | (.56)B | (.44) | (.29)C | (.25) |
| Net asset value, end of period | $10.96 | $10.67 | $11.10 | $11.23 | $11.23 | $11.00 |
| Total ReturnD,E | 4.27% | (.34)% | 3.89% | 3.98% | 4.75% | 3.58% |
| Ratios to Average Net AssetsF,G | | | | | | |
| Expenses before reductionsH | -%I | -% | -% | -% | -% | -% |
| Expenses net of fee waivers, if any | -%I | -% | -% | -% | -% | -% |
| Expenses net of all reductions | -%I | -% | -% | -% | -% | -% |
| Net investment income (loss) | 1.43%I | 1.88% | 1.73% | 1.35% | 1.33% | 1.62% |
| Supplemental Data | | | | | | |
| Net assets, end of period (000 omitted) | $81,686 | $83,497 | $83,253 | $71,933 | $77,976 | $60,248 |
| Portfolio turnover rateF | 49%I | 30% | 38% | 36% | 17% | 24% |
A Calculated based on average shares outstanding during the period.
B Total distributions of $.56 per share is comprised of distributions from net investment income of $.194 and distributions from net realized gain of $.361 per share.
C Total distributions of $.29 per share is comprised of distributions from net investment income of $.144 and distributions from net realized gain of $.141 per share.
D Total returns for periods of less than one year are not annualized.
E Total returns would have been lower if certain expenses had not been reduced during the applicable periods shown.
F Amounts do not include the activity of the Underlying Funds.
G Expense ratios reflect operating expenses of the class. Expenses before reductions do not reflect amounts reimbursed by the investment adviser or reductions from expense offset arrangements and do not represent the amount paid by the class during periods when reimbursements or reductions occur. Expenses net of fee waivers reflect expenses after reimbursement by the investment adviser but prior to reductions from expense offset arrangements. Expenses net of all reductions represent the net expenses paid by the class but do not include expenses of the underlying funds in which the Fund invests.
H Amount represents less than .005%.
I Annualized
See accompanying notes which are an integral part of the financial statements.
Fidelity Advisor Freedom® 2005 Fund
Investment Summary (Unaudited)
The information in the following tables is based on the direct investments of the Fund.
Top Holdings as of September 30, 2016
| | % of fund's net assets | % of fund's net assets 6 months ago |
| Fidelity Series Investment Grade Bond Fund | 33.3 | 34.5 |
| Fidelity Series Government Money Market Fund 0.29% | 12.4 | 0.0 |
| Fidelity Advisor Series Short-Term Credit Fund | 6.5 | 6.1 |
| Fidelity Series Emerging Markets Fund | 6.1 | 5.5 |
| Fidelity Advisor Series Equity-Income Fund | 4.6 | 4.7 |
| Fidelity Series International Value Fund | 3.7 | 3.3 |
| Fidelity Series International Growth Fund | 3.6 | 3.4 |
| Fidelity Series Inflation-Protected Bond Index Fund | 3.4 | 3.3 |
| Fidelity Advisor Series Growth & Income Fund | 3.2 | 3.3 |
| Fidelity Series High Income Fund | 3.1 | 3.0 |
| | 79.9 | 67.1 |
Asset Allocation (% of fund's net assets)
| Period end |
| | Domestic Equity Funds | 25.7% |
| | International Equity Funds | 14.2% |
| | Bond Funds | 41.2% |
| | Short-Term Funds | 18.9% |

| Six months ago |
| | Domestic Equity Funds | 27.3% |
| | International Equity Funds | 13.0% |
| | Bond Funds | 42.2% |
| | Short-Term Funds | 17.5% |

Percentages shown as 0.0% may reflect amounts less than 0.05%.
Domestic Equity Funds category includes Fidelity Series Commodity Strategy Fund which invests in commodity-related investments.
Fidelity Advisor Freedom® 2005 Fund
Investments September 30, 2016 (Unaudited)
Showing Percentage of Net Assets
| Domestic Equity Funds - 25.7% | | | |
| | | Shares | Value |
| Fidelity Advisor Series Equity Growth Fund (a) | | 502,033 | $5,753,295 |
| Fidelity Advisor Series Equity-Income Fund (a) | | 836,030 | 10,333,331 |
| Fidelity Advisor Series Growth & Income Fund (a) | | 541,787 | 7,173,253 |
| Fidelity Advisor Series Growth Opportunities Fund (a) | | 348,979 | 3,796,887 |
| Fidelity Advisor Series Opportunistic Insights Fund (a) | | 350,475 | 5,372,789 |
| Fidelity Advisor Series Small Cap Fund (a) | | 263,915 | 2,797,498 |
| Fidelity Advisor Series Stock Selector Large Cap Value Fund (a) | | 560,927 | 6,691,854 |
| Fidelity Series 100 Index Fund (a) | | 207,199 | 2,958,805 |
| Fidelity Series 1000 Value Index Fund (a) | | 102,445 | 1,144,312 |
| Fidelity Series All-Sector Equity Fund (a) | | 306,972 | 4,122,635 |
| Fidelity Series Commodity Strategy Fund (a)(b) | | 709,732 | 3,754,481 |
| Fidelity Series Real Estate Equity Fund (a) | | 51,695 | 711,838 |
| Fidelity Series Small Cap Opportunities Fund (a) | | 268,853 | 3,535,423 |
| TOTAL DOMESTIC EQUITY FUNDS | | | |
| (Cost $48,879,320) | | | 58,146,401 |
|
| International Equity Funds - 14.2% | | | |
| Fidelity Series Emerging Markets Fund (a) | | 816,565 | 13,734,628 |
| Fidelity Series International Growth Fund (a) | | 590,179 | 8,262,501 |
| Fidelity Series International Small Cap Fund (a) | | 121,962 | 1,898,943 |
| Fidelity Series International Value Fund (a) | | 875,112 | 8,296,064 |
| TOTAL INTERNATIONAL EQUITY FUNDS | | | |
| (Cost $27,578,967) | | | 32,192,136 |
|
| Bond Funds - 41.2% | | | |
| Fidelity Series Emerging Markets Debt Fund (a) | | 148,646 | 1,539,971 |
| Fidelity Series Floating Rate High Income Fund (a) | | 60,698 | 571,776 |
| Fidelity Series High Income Fund (a) | | 742,616 | 6,950,883 |
| Fidelity Series Inflation-Protected Bond Index Fund (a) | | 771,450 | 7,768,504 |
| Fidelity Series Investment Grade Bond Fund (a) | | 6,498,775 | 75,385,787 |
| Fidelity Series Long-Term Treasury Bond Index Fund (a) | | 8,057 | 77,747 |
| Fidelity Series Real Estate Income Fund (a) | | 100,932 | 1,132,458 |
| TOTAL BOND FUNDS | | | |
| (Cost $89,744,075) | | | 93,427,126 |
|
| Short-Term Funds - 18.9% | | | |
| Fidelity Advisor Series Short-Term Credit Fund (a) | | 1,469,797 | 14,756,765 |
| Fidelity Series Government Money Market Fund 0.29% (a)(c) | | 28,014,186 | 28,014,186 |
| TOTAL SHORT-TERM FUNDS | | | |
| (Cost $42,694,425) | | | 42,770,951 |
| TOTAL INVESTMENT PORTFOLIO - 100.0% | | | |
| (Cost $208,896,787) | | | 226,536,614 |
| NET OTHER ASSETS (LIABILITIES) - 0.0% | | | (44,700) |
| NET ASSETS - 100% | | | $226,491,914 |
Legend
(a) Affiliated Fund
(b) Non-income producing
(c) The rate quoted is the annualized seven-day yield of the fund at period end.
Affiliated Underlying Funds
Information regarding the Fund's fiscal year to date purchases and sales of the affiliated Underlying Funds and income earned by the Fund from investments in affiliated Underlying Funds is as follows:
| Affiliate | Value, beginning of period | Purchases | Sales Proceeds | Dividend Income | Value, end of period |
| Fidelity Advisor Series Equity Growth Fund | $6,035,727 | $225,946 | $915,927 | $- | $5,753,295 |
| Fidelity Advisor Series Equity-Income Fund | 10,892,754 | 515,534 | 1,861,883 | 103,555 | 10,333,331 |
| Fidelity Advisor Series Growth & Income Fund | 7,525,437 | 355,372 | 1,264,288 | 59,602 | 7,173,253 |
| Fidelity Advisor Series Growth Opportunities Fund | 3,976,232 | 148,150 | 551,018 | - | 3,796,887 |
| Fidelity Advisor Series Opportunistic Insights Fund | 5,601,464 | 222,441 | 786,687 | - | 5,372,789 |
| Fidelity Advisor Series Short-Term Credit Fund | 14,151,615 | 2,135,629 | 1,588,827 | 76,612 | 14,756,765 |
| Fidelity Advisor Series Small Cap Fund | 3,012,540 | 112,962 | 474,332 | - | 2,797,498 |
| Fidelity Advisor Series Stock Selector Large Cap Value Fund | 7,242,910 | 274,606 | 1,290,693 | - | 6,691,854 |
| Fidelity Investments Money Market Portfolio Institutional Class 0.59% | 26,306,963 | 1,173,257 | 27,480,219 | 11,709 | - |
| Fidelity Series 100 Index Fund | 3,287,789 | 120,619 | 642,342 | - | 2,958,805 |
| Fidelity Series 1000 Value Index Fund | 1,206,197 | 45,750 | 200,557 | - | 1,144,312 |
| Fidelity Series All-Sector Equity Fund | 7,234,534 | 171,256 | 3,730,196 | - | 4,122,635 |
| Fidelity Series Commodity Strategy Fund | 2,876,059 | 1,026,539 | 372,323 | - | 3,754,481 |
| Fidelity Series Emerging Markets Debt Fund | 1,460,587 | 95,248 | 147,779 | 41,601 | 1,539,971 |
| Fidelity Series Emerging Markets Fund | 12,738,180 | 666,400 | 1,297,538 | - | 13,734,628 |
| Fidelity Series Floating Rate High Income Fund | 570,016 | 37,049 | 62,883 | 12,593 | 571,776 |
| Fidelity Series Government Money Market Fund 0.29% | - | 30,332,323 | 2,318,136 | 26,229 | 28,014,186 |
| Fidelity Series High Income Fund | 6,933,712 | 197,557 | 717,608 | 196,480 | 6,950,883 |
| Fidelity Series Inflation-Protected Bond Index Fund | 7,712,280 | 711,289 | 801,421 | 3,314 | 7,768,504 |
| Fidelity Series International Growth Fund | 7,811,896 | 1,231,386 | 1,186,019 | - | 8,262,501 |
| Fidelity Series International Small Cap Fund | 1,923,710 | 242,950 | 329,891 | - | 1,898,943 |
| Fidelity Series International Value Fund | 7,751,721 | 1,463,766 | 1,238,819 | - | 8,296,064 |
| Fidelity Series Investment Grade Bond Fund | 79,854,043 | 3,982,444 | 10,507,072 | 962,945 | 75,385,787 |
| Fidelity Series Long-Term Treasury Bond Index Fund | - | 87,634 | 6,996 | 339 | 77,747 |
| Fidelity Series Real Estate Equity Fund | 755,379 | 82,898 | 112,007 | 6,537 | 711,838 |
| Fidelity Series Real Estate Income Fund | 1,132,996 | 115,158 | 151,618 | 28,238 | 1,132,458 |
| Fidelity Series Small Cap Opportunities Fund | 3,636,430 | 144,507 | 546,202 | 8,941 | 3,535,423 |
| Total | $231,631,171 | $45,918,670 | $60,583,281 | $1,538,695 | $226,536,614 |
Investment Valuation
All investments are categorized as Level 1 under the Fair Value Hierarchy. The inputs or methodology used for valuing securities may not be an indication of the risk associated with investing in those securities. For more information on valuation inputs please refer to the Investment Valuation section in the accompanying Notes to Financial Statements.
See accompanying notes which are an integral part of the financial statements.
Fidelity Advisor Freedom® 2005 Fund
Financial Statements
Statement of Assets and Liabilities
| | | September 30, 2016 (Unaudited) |
| Assets | | |
| Investment in securities, at value (cost $208,896,787) — See accompanying schedule | | $226,536,614 |
| Cash | | 10 |
| Receivable for investments sold | | 1,455,973 |
| Receivable for fund shares sold | | 188,331 |
| Total assets | | 228,180,928 |
| Liabilities | | |
| Payable for investments purchased | $492,909 | |
| Payable for fund shares redeemed | 1,151,452 | |
| Distribution and service plan fees payable | 44,653 | |
| Total liabilities | | 1,689,014 |
| Net Assets | | $226,491,914 |
| Net Assets consist of: | | |
| Paid in capital | | $207,455,996 |
| Undistributed net investment income | | 1,270,902 |
| Accumulated undistributed net realized gain (loss) on investments | | 125,189 |
| Net unrealized appreciation (depreciation) on investments | | 17,639,827 |
| Net Assets | | $226,491,914 |
| Calculation of Maximum Offering Price | | |
| Class A: | | |
| Net Asset Value and redemption price per share ($129,816,797 ÷ 11,020,259 shares) | | $11.78 |
| Maximum offering price per share (100/94.25 of $11.78) | | $12.50 |
| Class T: | | |
| Net Asset Value and redemption price per share ($28,705,214 ÷ 2,440,783 shares) | | $11.76 |
| Maximum offering price per share (100/96.50 of $11.76) | | $12.19 |
| Class C: | | |
| Net Asset Value and offering price per share ($6,351,746 ÷ 541,412 shares)(a) | | $11.73 |
| Class I: | | |
| Net Asset Value, offering price and redemption price per share ($61,618,157 ÷ 5,193,401 shares) | | $11.86 |
(a) Redemption price per share is equal to net asset value less any applicable contingent deferred sales charge.
See accompanying notes which are an integral part of the financial statements.
Statement of Operations
| | | Six months ended September 30, 2016 (Unaudited) |
| Investment Income | | |
| Income distributions from underlying funds | | $1,538,695 |
| Expenses | | |
| Distribution and service plan fees | $272,035 | |
| Independent trustees' fees and expenses | 521 | |
| Total expenses before reductions | 272,556 | |
| Expense reductions | (521) | 272,035 |
| Net investment income (loss) | | 1,266,660 |
| Realized and Unrealized Gain (Loss) | | |
| Realized gain (loss) on sale of underlying fund shares | 975,754 | |
| Capital gain distributions from underlying funds | 60,583 | |
| Total net realized gain (loss) | | 1,036,337 |
| Change in net unrealized appreciation (depreciation) on underlying funds | | 8,594,289 |
| Net gain (loss) | | 9,630,626 |
| Net increase (decrease) in net assets resulting from operations | | $10,897,286 |
See accompanying notes which are an integral part of the financial statements.
Statement of Changes in Net Assets
| | Six months ended September 30, 2016 (Unaudited) | Year ended March 31, 2016 |
| Increase (Decrease) in Net Assets | | |
| Operations | | |
| Net investment income (loss) | $1,266,660 | $3,957,985 |
| Net realized gain (loss) | 1,036,337 | 5,931,257 |
| Change in net unrealized appreciation (depreciation) | 8,594,289 | (13,077,935) |
| Net increase (decrease) in net assets resulting from operations | 10,897,286 | (3,188,693) |
| Distributions to shareholders from net investment income | (657,557) | (4,007,125) |
| Distributions to shareholders from net realized gain | (3,436,892) | (6,638,092) |
| Total distributions | (4,094,449) | (10,645,217) |
| Share transactions - net increase (decrease) | (11,895,143) | (20,184,963) |
| Total increase (decrease) in net assets | (5,092,306) | (34,018,873) |
| Net Assets | | |
| Beginning of period | 231,584,220 | 265,603,093 |
| End of period | $226,491,914 | $231,584,220 |
| Other Information | | |
| Undistributed net investment income end of period | $1,270,902 | $661,799 |
See accompanying notes which are an integral part of the financial statements.
Financial Highlights — Fidelity Advisor Freedom 2005 Fund Class A
| | Six months ended (Unaudited) September 30, | Years ended March 31, | | | | |
| | 2016 | 2016 | 2015 | 2014 | 2013 | 2012 |
| Selected Per–Share Data | | | | | | |
| Net asset value, beginning of period | $11.44 | $12.10 | $12.17 | $11.90 | $11.45 | $11.45 |
| Income from Investment Operations | | | | | | |
| Net investment income (loss)A | .06 | .19 | .19 | .13 | .13 | .15 |
| Net realized and unrealized gain (loss) | .48 | (.34) | .36 | .57 | .53 | .13 |
| Total from investment operations | .54 | (.15) | .55 | .70 | .66 | .28 |
| Distributions from net investment income | (.03) | (.20) | (.19) | (.12) | (.13) | (.15) |
| Distributions from net realized gain | (.17) | (.32) | (.42) | (.31) | (.07) | (.13) |
| Total distributions | (.20) | (.51)B | (.62)C | (.43) | (.21)D | (.28) |
| Net asset value, end of period | $11.78 | $11.44 | $12.10 | $12.17 | $11.90 | $11.45 |
| Total ReturnE,F,G | 4.81% | (1.23)% | 4.60% | 5.98% | 5.79% | 2.53% |
| Ratios to Average Net AssetsH,I | | | | | | |
| Expenses before reductions | .25%J | .25% | .25% | .25% | .25% | .25% |
| Expenses net of fee waivers, if any | .25%J | .25% | .25% | .25% | .25% | .25% |
| Expenses net of all reductions | .25%J | .25% | .25% | .25% | .25% | .25% |
| Net investment income (loss) | 1.08%J | 1.62% | 1.54% | 1.10% | 1.16% | 1.37% |
| Supplemental Data | | | | | | |
| Net assets, end of period (000 omitted) | $129,817 | $134,262 | $162,069 | $187,224 | $204,418 | $193,977 |
| Portfolio turnover rateH | 40%J | 30% | 29% | 49% | 23% | 28% |
A Calculated based on average shares outstanding during the period.
B Total distributions of $.51 per share is comprised of distributions from net investment income of $.196 and distributions from net realized gain of $.317 per share.
C Total distributions of $.62 per share is comprised of distributions from net investment income of $.193 and distributions from net realized gain of $.423 per share.
D Total distributions of $.21 per share is comprised of distributions from net investment income of $.134 and distributions from net realized gain of $.071 per share.
E Total returns for periods of less than one year are not annualized.
F Total returns would have been lower if certain expenses had not been reduced during the applicable periods shown.
G Total returns do not include the effect of the sales charges.
H Amounts do not include the activity of the Underlying Funds.
I Expense ratios reflect operating expenses of the class. Expenses before reductions do not reflect amounts reimbursed by the investment adviser or reductions from expense offset arrangements and do not represent the amount paid by the class during periods when reimbursements or reductions occur. Expenses net of fee waivers reflect expenses after reimbursement by the investment adviser but prior to reductions from expense offset arrangements. Expenses net of all reductions represent the net expenses paid by the class but do not include expenses of the underlying funds in which the Fund invests.
J Annualized
See accompanying notes which are an integral part of the financial statements.
Financial Highlights — Fidelity Advisor Freedom 2005 Fund Class T
| | Six months ended (Unaudited) September 30, | Years ended March 31, | | | | |
| | 2016 | 2016 | 2015 | 2014 | 2013 | 2012 |
| Selected Per–Share Data | | | | | | |
| Net asset value, beginning of period | $11.43 | $12.09 | $12.16 | $11.90 | $11.45 | $11.45 |
| Income from Investment Operations | | | | | | |
| Net investment income (loss)A | .05 | .16 | .16 | .10 | .11 | .13 |
| Net realized and unrealized gain (loss) | .48 | (.33) | .35 | .57 | .52 | .12 |
| Total from investment operations | .53 | (.17) | .51 | .67 | .63 | .25 |
| Distributions from net investment income | (.03) | (.17) | (.16) | (.10) | (.11) | (.12) |
| Distributions from net realized gain | (.17) | (.32) | (.42) | (.31) | (.07) | (.13) |
| Total distributions | (.20) | (.49) | (.58) | (.41) | (.18) | (.25) |
| Net asset value, end of period | $11.76 | $11.43 | $12.09 | $12.16 | $11.90 | $11.45 |
| Total ReturnB,C,D | 4.67% | (1.45)% | 4.33% | 5.68% | 5.56% | 2.25% |
| Ratios to Average Net AssetsE,F | | | | | | |
| Expenses before reductions | .50%G | .50% | .50% | .50% | .50% | .50% |
| Expenses net of fee waivers, if any | .50%G | .50% | .50% | .50% | .50% | .50% |
| Expenses net of all reductions | .50%G | .50% | .50% | .50% | .50% | .50% |
| Net investment income (loss) | .83%G | 1.37% | 1.29% | .85% | .91% | 1.12% |
| Supplemental Data | | | | | | |
| Net assets, end of period (000 omitted) | $28,705 | $29,347 | $29,246 | $29,912 | $26,201 | $22,316 |
| Portfolio turnover rateE | 40%G | 30% | 29% | 49% | 23% | 28% |
A Calculated based on average shares outstanding during the period.
B Total returns for periods of less than one year are not annualized.
C Total returns would have been lower if certain expenses had not been reduced during the applicable periods shown.
D Total returns do not include the effect of the sales charges.
E Amounts do not include the activity of the Underlying Funds.
F Expense ratios reflect operating expenses of the class. Expenses before reductions do not reflect amounts reimbursed by the investment adviser or reductions from expense offset arrangements and do not represent the amount paid by the class during periods when reimbursements or reductions occur. Expenses net of fee waivers reflect expenses after reimbursement by the investment adviser but prior to reductions from expense offset arrangements. Expenses net of all reductions represent the net expenses paid by the class but do not include expenses of the underlying funds in which the Fund invests.
G Annualized
See accompanying notes which are an integral part of the financial statements.
Financial Highlights — Fidelity Advisor Freedom 2005 Fund Class C
| | Six months ended (Unaudited) September 30, | Years ended March 31, | | | | |
| | 2016 | 2016 | 2015 | 2014 | 2013 | 2012 |
| Selected Per–Share Data | | | | | | |
| Net asset value, beginning of period | $11.41 | $12.06 | $12.14 | $11.87 | $11.42 | $11.42 |
| Income from Investment Operations | | | | | | |
| Net investment income (loss)A | .02 | .10 | .10 | .04 | .05 | .07 |
| Net realized and unrealized gain (loss) | .48 | (.33) | .34 | .58 | .52 | .11 |
| Total from investment operations | .50 | (.23) | .44 | .62 | .57 | .18 |
| Distributions from net investment income | (.01) | (.10) | (.10) | (.04) | (.05) | (.07) |
| Distributions from net realized gain | (.17) | (.32) | (.42) | (.31) | (.07) | (.12) |
| Total distributions | (.18) | (.42) | (.52) | (.35) | (.12) | (.18)B |
| Net asset value, end of period | $11.73 | $11.41 | $12.06 | $12.14 | $11.87 | $11.42 |
| Total ReturnC,D,E | 4.46% | (1.98)% | 3.73% | 5.28% | 5.01% | 1.66% |
| Ratios to Average Net AssetsF,G | | | | | | |
| Expenses before reductions | 1.00%H | 1.00% | 1.00% | 1.00% | 1.00% | 1.00% |
| Expenses net of fee waivers, if any | 1.00%H | 1.00% | 1.00% | 1.00% | 1.00% | 1.00% |
| Expenses net of all reductions | 1.00%H | 1.00% | 1.00% | 1.00% | 1.00% | 1.00% |
| Net investment income (loss) | .33%H | .87% | .79% | .35% | .41% | .62% |
| Supplemental Data | | | | | | |
| Net assets, end of period (000 omitted) | $6,352 | $6,200 | $7,410 | $8,910 | $8,118 | $8,053 |
| Portfolio turnover rateF | 40%H | 30% | 29% | 49% | 23% | 28% |
A Calculated based on average shares outstanding during the period.
B Total distributions of $.18 per share is comprised of distributions from net investment income of $.065 and distributions from net realized gain of $.115 per share.
C Total returns for periods of less than one year are not annualized.
D Total returns would have been lower if certain expenses had not been reduced during the applicable periods shown.
E Total returns do not include the effect of the contingent deferred sales charge.
F Amounts do not include the activity of the Underlying Funds.
G Expense ratios reflect operating expenses of the class. Expenses before reductions do not reflect amounts reimbursed by the investment adviser or reductions from expense offset arrangements and do not represent the amount paid by the class during periods when reimbursements or reductions occur. Expenses net of fee waivers reflect expenses after reimbursement by the investment adviser but prior to reductions from expense offset arrangements. Expenses net of all reductions represent the net expenses paid by the class but do not include expenses of the underlying funds in which the Fund invests.
H Annualized
See accompanying notes which are an integral part of the financial statements.
Financial Highlights — Fidelity Advisor Freedom 2005 Fund Class I
| | Six months ended (Unaudited) September 30, | Years ended March 31, | | | | |
| | 2016 | 2016 | 2015 | 2014 | 2013 | 2012 |
| Selected Per–Share Data | | | | | | |
| Net asset value, beginning of period | $11.51 | $12.18 | $12.25 | $11.97 | $11.51 | $11.52 |
| Income from Investment Operations | | | | | | |
| Net investment income (loss)A | .08 | .22 | .22 | .16 | .16 | .18 |
| Net realized and unrealized gain (loss) | .48 | (.34) | .36 | .58 | .53 | .11 |
| Total from investment operations | .56 | (.12) | .58 | .74 | .69 | .29 |
| Distributions from net investment income | (.04) | (.23) | (.23) | (.15) | (.16) | (.18) |
| Distributions from net realized gain | (.17) | (.32) | (.42) | (.31) | (.07) | (.13) |
| Total distributions | (.21) | (.55) | (.65) | (.46) | (.23) | (.30)B |
| Net asset value, end of period | $11.86 | $11.51 | $12.18 | $12.25 | $11.97 | $11.51 |
| Total ReturnC,D | 4.94% | (1.04)% | 4.85% | 6.29% | 6.11% | 2.67% |
| Ratios to Average Net AssetsE,F | | | | | | |
| Expenses before reductionsG | -%H | -% | -% | -% | -% | -% |
| Expenses net of fee waivers, if any | -%H | -% | -% | -% | -% | -% |
| Expenses net of all reductions | -%H | -% | -% | -% | -% | -% |
| Net investment income (loss) | 1.33%H | 1.87% | 1.79% | 1.35% | 1.41% | 1.62% |
| Supplemental Data | | | | | | |
| Net assets, end of period (000 omitted) | $61,618 | $61,440 | $66,255 | $67,435 | $70,364 | $46,935 |
| Portfolio turnover rateE | 40%H | 30% | 29% | 49% | 23% | 28% |
A Calculated based on average shares outstanding during the period.
B Total distributions of $.30 per share is comprised of distributions from net investment income of $.175 and distributions from net realized gain of $.128 per share.
C Total returns for periods of less than one year are not annualized.
D Total returns would have been lower if certain expenses had not been reduced during the applicable periods shown.
E Amounts do not include the activity of the Underlying Funds.
F Expense ratios reflect operating expenses of the class. Expenses before reductions do not reflect amounts reimbursed by the investment adviser or reductions from expense offset arrangements and do not represent the amount paid by the class during periods when reimbursements or reductions occur. Expenses net of fee waivers reflect expenses after reimbursement by the investment adviser but prior to reductions from expense offset arrangements. Expenses net of all reductions represent the net expenses paid by the class but do not include expenses of the underlying funds in which the Fund invests.
G Amount represents less than .005%.
H Annualized
See accompanying notes which are an integral part of the financial statements.
Fidelity Advisor Freedom® 2010 Fund
Investment Summary (Unaudited)
The information in the following tables is based on the direct investments of the Fund.
Top Holdings as of September 30, 2016
| | % of fund's net assets | % of fund's net assets 6 months ago |
| Fidelity Series Investment Grade Bond Fund | 29.8 | 31.4 |
| Fidelity Series Government Money Market Fund 0.29% | 9.1 | 0.0 |
| Fidelity Series Emerging Markets Fund | 6.9 | 6.3 |
| Fidelity Advisor Series Equity-Income Fund | 5.7 | 5.8 |
| Fidelity Advisor Series Short-Term Credit Fund | 4.7 | 4.2 |
| Fidelity Series International Value Fund | 4.6 | 4.3 |
| Fidelity Series International Growth Fund | 4.6 | 4.3 |
| Fidelity Advisor Series Growth & Income Fund | 4.0 | 4.0 |
| Fidelity Advisor Series Stock Selector Large Cap Value Fund | 3.7 | 3.9 |
| Fidelity Advisor Series Equity Growth Fund | 3.2 | 3.2 |
| | 76.3 | 67.4 |
Asset Allocation (% of fund's net assets)
| Period end |
| | Domestic Equity Funds | 31.9% |
| | International Equity Funds | 17.1% |
| | Bond Funds | 37.2% |
| | Short-Term Funds | 13.8% |

| Six months ago |
| | Domestic Equity Funds | 33.5% |
| | International Equity Funds | 16.0% |
| | Bond Funds | 38.5% |
| | Short-Term Funds | 12.0% |

Percentages shown as 0.0% may reflect amounts less than 0.05%.
Domestic Equity Funds category includes Fidelity Series Commodity Strategy Fund which invests in commodity-related investments.
Fidelity Advisor Freedom® 2010 Fund
Investments September 30, 2016 (Unaudited)
Showing Percentage of Net Assets
| Domestic Equity Funds - 31.9% | | | |
| | | Shares | Value |
| Fidelity Advisor Series Equity Growth Fund (a) | | 1,582,757 | $18,138,400 |
| Fidelity Advisor Series Equity-Income Fund (a) | | 2,629,169 | 32,496,527 |
| Fidelity Advisor Series Growth & Income Fund (a) | | 1,708,742 | 22,623,742 |
| Fidelity Advisor Series Growth Opportunities Fund (a) | | 1,095,649 | 11,920,664 |
| Fidelity Advisor Series Opportunistic Insights Fund (a) | | 1,102,334 | 16,898,778 |
| Fidelity Advisor Series Small Cap Fund (a) | | 841,675 | 8,921,750 |
| Fidelity Advisor Series Stock Selector Large Cap Value Fund (a) | | 1,777,399 | 21,204,374 |
| Fidelity Series 100 Index Fund (a) | | 653,142 | 9,326,862 |
| Fidelity Series 1000 Value Index Fund (a) | | 322,512 | 3,602,462 |
| Fidelity Series All-Sector Equity Fund (a) | | 990,327 | 13,300,095 |
| Fidelity Series Commodity Strategy Fund (a)(b) | | 1,799,259 | 9,518,082 |
| Fidelity Series Real Estate Equity Fund (a) | | 156,909 | 2,160,632 |
| Fidelity Series Small Cap Opportunities Fund (a) | | 840,134 | 11,047,759 |
| TOTAL DOMESTIC EQUITY FUNDS | | | |
| (Cost $151,366,926) | | | 181,160,127 |
|
| International Equity Funds - 17.1% | | | |
| Fidelity Series Emerging Markets Fund (a) | | 2,345,136 | 39,445,195 |
| Fidelity Series International Growth Fund (a) | | 1,848,645 | 25,881,033 |
| Fidelity Series International Small Cap Fund (a) | | 382,009 | 5,947,878 |
| Fidelity Series International Value Fund (a) | | 2,741,126 | 25,985,871 |
| TOTAL INTERNATIONAL EQUITY FUNDS | | | |
| (Cost $83,419,373) | | | 97,259,977 |
|
| Bond Funds - 37.2% | | | |
| Fidelity Series Emerging Markets Debt Fund (a) | | 374,770 | 3,882,620 |
| Fidelity Series Floating Rate High Income Fund (a) | | 152,694 | 1,438,382 |
| Fidelity Series High Income Fund (a) | | 1,885,502 | 17,648,297 |
| Fidelity Series Inflation-Protected Bond Index Fund (a) | | 1,565,148 | 15,761,039 |
| Fidelity Series Investment Grade Bond Fund (a) | | 14,599,641 | 169,355,835 |
| Fidelity Series Long-Term Treasury Bond Index Fund (a) | | 18,232 | 175,941 |
| Fidelity Series Real Estate Income Fund (a) | | 254,696 | 2,857,689 |
| TOTAL BOND FUNDS | | | |
| (Cost $202,584,701) | | | 211,119,803 |
|
| Short-Term Funds - 13.8% | | | |
| Fidelity Advisor Series Short-Term Credit Fund (a) | | 2,674,419 | 26,851,167 |
| Fidelity Series Government Money Market Fund 0.29% (a)(c) | | 51,597,834 | 51,597,834 |
| TOTAL SHORT-TERM FUNDS | | | |
| (Cost $78,318,926) | | | 78,449,001 |
| TOTAL INVESTMENT PORTFOLIO - 100.0% | | | |
| (Cost $515,689,926) | | | 567,988,908 |
| NET OTHER ASSETS (LIABILITIES) - 0.0% | | | (135,613) |
| NET ASSETS - 100% | | | $567,853,295 |
Legend
(a) Affiliated Fund
(b) Non-income producing
(c) The rate quoted is the annualized seven-day yield of the fund at period end.
Affiliated Underlying Funds
Information regarding the Fund's fiscal year to date purchases and sales of the affiliated Underlying Funds and income earned by the Fund from investments in affiliated Underlying Funds is as follows:
| Affiliate | Value, beginning of period | Purchases | Sales Proceeds | Dividend Income | Value, end of period |
| Fidelity Advisor Series Equity Growth Fund | $19,223,571 | $448,478 | $2,810,181 | - | $18,138,400 |
| Fidelity Advisor Series Equity-Income Fund | 34,692,643 | 1,139,945 | 5,809,359 | 326,098 | 32,496,527 |
| Fidelity Advisor Series Growth & Income Fund | 23,968,262 | 817,844 | 3,913,492 | 187,613 | 22,623,742 |
| Fidelity Advisor Series Growth Opportunities Fund | 12,663,650 | 294,077 | 1,738,669 | - | 11,920,664 |
| Fidelity Advisor Series Opportunistic Insights Fund | 17,840,714 | 557,320 | 2,553,471 | - | 16,898,778 |
| Fidelity Advisor Series Short-Term Credit Fund | 24,946,264 | 5,123,889 | 3,326,280 | 139,625 | 26,851,167 |
| Fidelity Advisor Series Small Cap Fund | 9,595,026 | 224,005 | 1,358,493 | - | 8,921,750 |
| Fidelity Advisor Series Stock Selector Large Cap Value Fund | 23,068,709 | 680,392 | 4,011,926 | - | 21,204,374 |
| Fidelity Investments Money Market Portfolio Institutional Class 0.59% | 46,496,787 | 3,870,812 | 50,367,598 | 21,096 | - |
| Fidelity Series 100 Index Fund | 10,471,663 | 240,069 | 1,990,362 | - | 9,326,862 |
| Fidelity Series 1000 Value Index Fund | 3,841,614 | 90,417 | 621,844 | - | 3,602,462 |
| Fidelity Series All-Sector Equity Fund | 23,042,034 | 362,670 | 11,508,555 | - | 13,300,095 |
| Fidelity Series Commodity Strategy Fund | 7,283,256 | 2,730,810 | 1,055,364 | - | 9,518,082 |
| Fidelity Series Emerging Markets Debt Fund | 3,796,091 | 192,875 | 443,169 | 105,798 | 3,882,620 |
| Fidelity Series Emerging Markets Fund | 37,818,521 | 1,323,035 | 4,408,155 | - | 39,445,195 |
| Fidelity Series Floating Rate High Income Fund | 1,485,738 | 68,108 | 186,000 | 32,045 | 1,438,382 |
| Fidelity Series Government Money Market Fund 0.29% | - | 56,166,545 | 4,568,712 | 48,026 | 51,597,834 |
| Fidelity Series High Income Fund | 17,860,306 | 511,729 | 2,094,217 | 500,295 | 17,648,297 |
| Fidelity Series Inflation-Protected Bond Index Fund | 16,052,693 | 1,322,155 | 1,910,482 | 6,749 | 15,761,039 |
| Fidelity Series International Growth Fund | 25,703,990 | 2,987,763 | 4,100,901 | - | 25,881,033 |
| Fidelity Series International Small Cap Fund | 6,291,737 | 585,022 | 1,125,963 | - | 5,947,878 |
| Fidelity Series International Value Fund | 25,507,981 | 3,736,636 | 4,272,286 | - | 25,985,871 |
| Fidelity Series Investment Grade Bond Fund | 187,331,407 | 6,806,672 | 29,467,600 | 2,177,683 | 169,355,835 |
| Fidelity Series Long-Term Treasury Bond Index Fund | - | 201,024 | 18,554 | 769 | 175,941 |
| Fidelity Series Real Estate Equity Fund | 2,405,962 | 234,911 | 441,705 | 20,045 | 2,160,632 |
| Fidelity Series Real Estate Income Fund | 2,943,588 | 246,533 | 424,828 | 71,315 | 2,857,689 |
| Fidelity Series Small Cap Opportunities Fund | 11,581,740 | 345,223 | 1,821,119 | 27,753 | 11,047,759 |
| Total | $595,913,947 | $91,308,959 | $146,349,285 | $3,664,910 | $567,988,908 |
Investment Valuation
All investments are categorized as Level 1 under the Fair Value Hierarchy. The inputs or methodology used for valuing securities may not be an indication of the risk associated with investing in those securities. For more information on valuation inputs please refer to the Investment Valuation section in the accompanying Notes to Financial Statements.
See accompanying notes which are an integral part of the financial statements.
Fidelity Advisor Freedom® 2010 Fund
Financial Statements
Statement of Assets and Liabilities
| | | September 30, 2016 (Unaudited) |
| Assets | | |
| Investment in securities, at value (cost $515,689,926) — See accompanying schedule | | $567,988,908 |
| Cash | | 1 |
| Receivable for investments sold | | 2,896,196 |
| Receivable for fund shares sold | | 233,440 |
| Total assets | | 571,118,545 |
| Liabilities | | |
| Payable for investments purchased | $1,214,326 | |
| Payable for fund shares redeemed | 1,923,037 | |
| Distribution and service plan fees payable | 127,887 | |
| Total liabilities | | 3,265,250 |
| Net Assets | | $567,853,295 |
| Net Assets consist of: | | |
| Paid in capital | | $510,334,614 |
| Undistributed net investment income | | 2,896,736 |
| Accumulated undistributed net realized gain (loss) on investments | | 2,322,963 |
| Net unrealized appreciation (depreciation) on investments | | 52,298,982 |
| Net Assets | | $567,853,295 |
| Calculation of Maximum Offering Price | | |
| Class A: | | |
| Net Asset Value and redemption price per share ($308,540,732 ÷ 25,198,079 shares) | | $12.24 |
| Maximum offering price per share (100/94.25 of $12.24) | | $12.99 |
| Class T: | | |
| Net Asset Value and redemption price per share ($91,684,454 ÷ 7,517,354 shares) | | $12.20 |
| Maximum offering price per share (100/96.50 of $12.20) | | $12.64 |
| Class C: | | |
| Net Asset Value and offering price per share ($30,349,303 ÷ 2,506,990 shares)(a) | | $12.11 |
| Class I: | | |
| Net Asset Value, offering price and redemption price per share ($137,278,806 ÷ 11,154,270 shares) | | $12.31 |
(a) Redemption price per share is equal to net asset value less any applicable contingent deferred sales charge.
See accompanying notes which are an integral part of the financial statements.
Statement of Operations
| | | Six months ended September 30, 2016 (Unaudited) |
| Investment Income | | |
| Income distributions from underlying funds | | $3,664,910 |
| Expenses | | |
| Distribution and service plan fees | $782,889 | |
| Independent trustees' fees and expenses | 1,323 | |
| Total expenses before reductions | 784,212 | |
| Expense reductions | (1,323) | 782,889 |
| Net investment income (loss) | | 2,882,021 |
| Realized and Unrealized Gain (Loss) | | |
| Realized gain (loss) on sale of underlying fund shares | 3,869,745 | |
| Capital gain distributions from underlying funds | 176,670 | |
| Total net realized gain (loss) | | 4,046,415 |
| Change in net unrealized appreciation (depreciation) on underlying funds | | 23,245,535 |
| Net gain (loss) | | 27,291,950 |
| Net increase (decrease) in net assets resulting from operations | | $30,173,971 |
See accompanying notes which are an integral part of the financial statements.
Statement of Changes in Net Assets
| | Six months ended September 30, 2016 (Unaudited) | Year ended March 31, 2016 |
| Increase (Decrease) in Net Assets | | |
| Operations | | |
| Net investment income (loss) | $2,882,021 | $10,524,844 |
| Net realized gain (loss) | 4,046,415 | 20,231,038 |
| Change in net unrealized appreciation (depreciation) | 23,245,535 | (43,340,325) |
| Net increase (decrease) in net assets resulting from operations | 30,173,971 | (12,584,443) |
| Distributions to shareholders from net investment income | (1,454,291) | (10,584,608) |
| Distributions to shareholders from net realized gain | (10,533,781) | (23,587,615) |
| Total distributions | (11,988,072) | (34,172,223) |
| Share transactions - net increase (decrease) | (46,109,255) | (90,382,450) |
| Total increase (decrease) in net assets | (27,923,356) | (137,139,116) |
| Net Assets | | |
| Beginning of period | 595,776,651 | 732,915,767 |
| End of period | $567,853,295 | $595,776,651 |
| Other Information | | |
| Undistributed net investment income end of period | $2,896,736 | $1,469,006 |
See accompanying notes which are an integral part of the financial statements.
Financial Highlights — Fidelity Advisor Freedom 2010 Fund Class A
| | Six months ended (Unaudited) September 30, | Years ended March 31, | | | | |
| | 2016 | 2016 | 2015 | 2014 | 2013 | 2012 |
| Selected Per–Share Data | | | | | | |
| Net asset value, beginning of period | $11.87 | $12.72 | $12.91 | $12.50 | $11.89 | $11.92 |
| Income from Investment Operations | | | | | | |
| Net investment income (loss)A | .06 | .20 | .20 | .15 | .16 | .17 |
| Net realized and unrealized gain (loss) | .56 | (.41) | .44 | .82 | .70 | .12 |
| Total from investment operations | .62 | (.21) | .64 | .97 | .86 | .29 |
| Distributions from net investment income | (.03) | (.21) | (.22) | (.14) | (.16) | (.17) |
| Distributions from net realized gain | (.22) | (.44) | (.61) | (.42) | (.09) | (.16) |
| Total distributions | (.25) | (.64)B | (.83) | (.56) | (.25) | (.32)C |
| Net asset value, end of period | $12.24 | $11.87 | $12.72 | $12.91 | $12.50 | $11.89 |
| Total ReturnD,E,F | 5.28% | (1.67)% | 5.08% | 7.86% | 7.33% | 2.63% |
| Ratios to Average Net AssetsG,H | | | | | | |
| Expenses before reductions | .25%I | .25% | .25% | .25% | .25% | .25% |
| Expenses net of fee waivers, if any | .25%I | .25% | .25% | .25% | .25% | .25% |
| Expenses net of all reductions | .25%I | .25% | .25% | .25% | .25% | .25% |
| Net investment income (loss) | 1.01%I | 1.63% | 1.55% | 1.15% | 1.33% | 1.48% |
| Supplemental Data | | | | | | |
| Net assets, end of period (000 omitted) | $308,541 | $328,232 | $431,498 | $502,834 | $540,980 | $552,770 |
| Portfolio turnover rateG | 31%I | 21% | 22% | 39% | 26% | 25% |
A Calculated based on average shares outstanding during the period.
B Total distributions of $.64 per share is comprised of distributions from net investment income of $.206 and distributions from net realized gain of $.437 per share.
C Total distributions of $.32 per share is comprised of distributions from net investment income of $.169 and distributions from net realized gain of $.155 per share.
D Total returns for periods of less than one year are not annualized.
E Total returns would have been lower if certain expenses had not been reduced during the applicable periods shown.
F Total returns do not include the effect of the sales charges.
G Amounts do not include the activity of the Underlying Funds.
H Expense ratios reflect operating expenses of the class. Expenses before reductions do not reflect amounts reimbursed by the investment adviser or reductions from expense offset arrangements and do not represent the amount paid by the class during periods when reimbursements or reductions occur. Expenses net of fee waivers reflect expenses after reimbursement by the investment adviser but prior to reductions from expense offset arrangements. Expenses net of all reductions represent the net expenses paid by the class but do not include expenses of the underlying funds in which the Fund invests.
I Annualized
See accompanying notes which are an integral part of the financial statements.
Financial Highlights — Fidelity Advisor Freedom 2010 Fund Class T
| | Six months ended (Unaudited) September 30, | Years ended March 31, | | | | |
| | 2016 | 2016 | 2015 | 2014 | 2013 | 2012 |
| Selected Per–Share Data | | | | | | |
| Net asset value, beginning of period | $11.83 | $12.68 | $12.87 | $12.46 | $11.86 | $11.88 |
| Income from Investment Operations | | | | | | |
| Net investment income (loss)A | .05 | .17 | .17 | .11 | .13 | .14 |
| Net realized and unrealized gain (loss) | .56 | (.41) | .43 | .83 | .69 | .13 |
| Total from investment operations | .61 | (.24) | .60 | .94 | .82 | .27 |
| Distributions from net investment income | (.02) | (.18) | (.18) | (.11) | (.13) | (.14) |
| Distributions from net realized gain | (.22) | (.44) | (.61) | (.42) | (.09) | (.16) |
| Total distributions | (.24) | (.61)B | (.79) | (.53) | (.22) | (.29)C |
| Net asset value, end of period | $12.20 | $11.83 | $12.68 | $12.87 | $12.46 | $11.86 |
| Total ReturnD,E,F | 5.24% | (1.92)% | 4.81% | 7.62% | 6.98% | 2.43% |
| Ratios to Average Net AssetsG,H | | | | | | |
| Expenses before reductions | .50%I | .50% | .50% | .50% | .50% | .50% |
| Expenses net of fee waivers, if any | .50%I | .50% | .50% | .50% | .50% | .50% |
| Expenses net of all reductions | .50%I | .50% | .50% | .50% | .50% | .50% |
| Net investment income (loss) | .76%I | 1.38% | 1.30% | .90% | 1.08% | 1.23% |
| Supplemental Data | | | | | | |
| Net assets, end of period (000 omitted) | $91,684 | $92,543 | $106,189 | $124,997 | $127,353 | $132,044 |
| Portfolio turnover rateG | 31%I | 21% | 22% | 39% | 26% | 25% |
A Calculated based on average shares outstanding during the period.
B Total distributions of $.61 per share is comprised of distributions from net investment income of $.176 and distributions from net realized gain of $.437 per share.
C Total distributions of $.29 per share is comprised of distributions from net investment income of $.137 and distributions from net realized gain of $.155 per share.
D Total returns for periods of less than one year are not annualized.
E Total returns would have been lower if certain expenses had not been reduced during the applicable periods shown.
F Total returns do not include the effect of the sales charges.
G Amounts do not include the activity of the Underlying Funds.
H Expense ratios reflect operating expenses of the class. Expenses before reductions do not reflect amounts reimbursed by the investment adviser or reductions from expense offset arrangements and do not represent the amount paid by the class during periods when reimbursements or reductions occur. Expenses net of fee waivers reflect expenses after reimbursement by the investment adviser but prior to reductions from expense offset arrangements. Expenses net of all reductions represent the net expenses paid by the class but do not include expenses of the underlying funds in which the Fund invests.
I Annualized
See accompanying notes which are an integral part of the financial statements.
Financial Highlights — Fidelity Advisor Freedom 2010 Fund Class C
| | Six months ended (Unaudited) September 30, | Years ended March 31, | | | | |
| | 2016 | 2016 | 2015 | 2014 | 2013 | 2012 |
| Selected Per–Share Data | | | | | | |
| Net asset value, beginning of period | $11.76 | $12.60 | $12.79 | $12.39 | $11.79 | $11.81 |
| Income from Investment Operations | | | | | | |
| Net investment income (loss)A | .02 | .11 | .10 | .05 | .07 | .08 |
| Net realized and unrealized gain (loss) | .55 | (.40) | .44 | .81 | .69 | .13 |
| Total from investment operations | .57 | (.29) | .54 | .86 | .76 | .21 |
| Distributions from net investment income | (.01) | (.11) | (.12) | (.05) | (.07) | (.08) |
| Distributions from net realized gain | (.22) | (.44) | (.61) | (.41) | (.09) | (.15) |
| Total distributions | (.22)B | (.55) | (.73) | (.46) | (.16) | (.23) |
| Net asset value, end of period | $12.11 | $11.76 | $12.60 | $12.79 | $12.39 | $11.79 |
| Total ReturnC,D,E | 4.97% | (2.39)% | 4.33% | 7.04% | 6.49% | 1.90% |
| Ratios to Average Net AssetsF,G | | | | | | |
| Expenses before reductions | 1.00%H | 1.00% | 1.00% | 1.00% | 1.00% | 1.00% |
| Expenses net of fee waivers, if any | 1.00%H | 1.00% | 1.00% | 1.00% | 1.00% | 1.00% |
| Expenses net of all reductions | 1.00%H | 1.00% | 1.00% | 1.00% | 1.00% | 1.00% |
| Net investment income (loss) | .26%H | .88% | .80% | .40% | .58% | .73% |
| Supplemental Data | | | | | | |
| Net assets, end of period (000 omitted) | $30,349 | $30,150 | $34,839 | $36,622 | $38,562 | $38,423 |
| Portfolio turnover rateF | 31%H | 21% | 22% | 39% | 26% | 25% |
A Calculated based on average shares outstanding during the period.
B Total distributions of $.22 per share is comprised of distributions from net investment income of $.009 and distributions from net realized gain of $.215 per share.
C Total returns for periods of less than one year are not annualized.
D Total returns would have been lower if certain expenses had not been reduced during the applicable periods shown.
E Total returns do not include the effect of the contingent deferred sales charge.
F Amounts do not include the activity of the Underlying Funds.
G Expense ratios reflect operating expenses of the class. Expenses before reductions do not reflect amounts reimbursed by the investment adviser or reductions from expense offset arrangements and do not represent the amount paid by the class during periods when reimbursements or reductions occur. Expenses net of fee waivers reflect expenses after reimbursement by the investment adviser but prior to reductions from expense offset arrangements. Expenses net of all reductions represent the net expenses paid by the class but do not include expenses of the underlying funds in which the Fund invests.
H Annualized
See accompanying notes which are an integral part of the financial statements.
Financial Highlights — Fidelity Advisor Freedom 2010 Fund Class I
| | Six months ended (Unaudited) September 30, | Years ended March 31, | | | | |
| | 2016 | 2016 | 2015 | 2014 | 2013 | 2012 |
| Selected Per–Share Data | | | | | | |
| Net asset value, beginning of period | $11.92 | $12.77 | $12.96 | $12.55 | $11.94 | $11.96 |
| Income from Investment Operations | | | | | | |
| Net investment income (loss)A | .08 | .23 | .23 | .18 | .19 | .20 |
| Net realized and unrealized gain (loss) | .56 | (.40) | .44 | .82 | .70 | .13 |
| Total from investment operations | .64 | (.17) | .67 | 1.00 | .89 | .33 |
| Distributions from net investment income | (.04) | (.24) | (.25) | (.17) | (.19) | (.20) |
| Distributions from net realized gain | (.22) | (.44) | (.61) | (.42) | (.09) | (.16) |
| Total distributions | (.25)B | (.68) | (.86) | (.59) | (.28) | (.35)C |
| Net asset value, end of period | $12.31 | $11.92 | $12.77 | $12.96 | $12.55 | $11.94 |
| Total ReturnD,E | 5.50% | (1.40)% | 5.34% | 8.10% | 7.56% | 2.97% |
| Ratios to Average Net AssetsF,G | | | | | | |
| Expenses before reductionsH | -%I | -% | -% | -% | -% | -% |
| Expenses net of fee waivers, if any | -%I | -% | -% | -% | -% | -% |
| Expenses net of all reductions | -%I | -% | -% | -% | -% | -% |
| Net investment income (loss) | 1.26%I | 1.88% | 1.80% | 1.40% | 1.58% | 1.73% |
| Supplemental Data | | | | | | |
| Net assets, end of period (000 omitted) | $137,279 | $143,715 | $158,071 | $191,276 | $197,152 | $156,459 |
| Portfolio turnover rateF | 31%I | 21% | 22% | 39% | 26% | 25% |
A Calculated based on average shares outstanding during the period.
B Total distributions of $.25 per share is comprised of distributions from net investment income of $.038 and distributions from net realized gain of $.215 per share.
C Total distributions of $.35 per share is comprised of distributions from net investment income of $.199 and distributions from net realized gain of $.155 per share.
D Total returns for periods of less than one year are not annualized.
E Total returns would have been lower if certain expenses had not been reduced during the applicable periods shown.
F Amounts do not include the activity of the Underlying Funds.
G Expense ratios reflect operating expenses of the class. Expenses before reductions do not reflect amounts reimbursed by the investment adviser or reductions from expense offset arrangements and do not represent the amount paid by the class during periods when reimbursements or reductions occur. Expenses net of fee waivers reflect expenses after reimbursement by the investment adviser but prior to reductions from expense offset arrangements. Expenses net of all reductions represent the net expenses paid by the class but do not include expenses of the underlying funds in which the Fund invests.
H Amount represents less than .005%.
I Annualized
See accompanying notes which are an integral part of the financial statements.
Fidelity Advisor Freedom® 2015 Fund
Investment Summary (Unaudited)
The information in the following tables is based on the direct investments of the Fund.
Top Holdings as of September 30, 2016
| | % of fund's net assets | % of fund's net assets 6 months ago |
| Fidelity Series Investment Grade Bond Fund | 26.2 | 28.5 |
| Fidelity Series Emerging Markets Fund | 7.5 | 6.9 |
| Fidelity Advisor Series Equity-Income Fund | 6.9 | 6.9 |
| Fidelity Series Government Money Market Fund 0.29% | 6.1 | 0.0 |
| Fidelity Series International Value Fund | 5.5 | 5.2 |
| Fidelity Series International Growth Fund | 5.5 | 5.2 |
| Fidelity Advisor Series Growth & Income Fund | 4.8 | 4.8 |
| Fidelity Advisor Series Stock Selector Large Cap Value Fund | 4.6 | 4.6 |
| Fidelity Advisor Series Equity Growth Fund | 3.8 | 3.8 |
| Fidelity Advisor Series Opportunistic Insights Fund | 3.6 | 3.6 |
| | 74.5 | 69.5 |
Asset Allocation (% of fund's net assets)
| Period end |
| | Domestic Equity Funds | 38.2% |
| | International Equity Funds | 19.8% |
| | Bond Funds | 32.8% |
| | Short-Term Funds | 9.2% |

| Six months ago |
| | Domestic Equity Funds | 39.6% |
| | International Equity Funds | 18.6% |
| | Bond Funds | 34.8% |
| | Short-Term Funds | 7.0% |

Percentages shown as 0.0% may reflect amounts less than 0.05%.
Domestic Equity Funds category includes Fidelity Series Commodity Strategy Fund which invests in commodity-related investments.
Fidelity Advisor Freedom® 2015 Fund
Investments September 30, 2016 (Unaudited)
Showing Percentage of Net Assets
| Domestic Equity Funds - 38.2% | | | |
| | | Shares | Value |
| Fidelity Advisor Series Equity Growth Fund (a) | | 4,371,808 | $50,100,914 |
| Fidelity Advisor Series Equity-Income Fund (a) | | 7,302,521 | 90,259,155 |
| Fidelity Advisor Series Growth & Income Fund (a) | | 4,729,520 | 62,618,848 |
| Fidelity Advisor Series Growth Opportunities Fund (a) | | 3,017,978 | 32,835,598 |
| Fidelity Advisor Series Opportunistic Insights Fund (a) | | 3,061,381 | 46,930,978 |
| Fidelity Advisor Series Small Cap Fund (a) | | 2,372,624 | 25,149,816 |
| Fidelity Advisor Series Stock Selector Large Cap Value Fund (a) | | 5,040,707 | 60,135,631 |
| Fidelity Series 100 Index Fund (a) | | 1,809,391 | 25,838,111 |
| Fidelity Series 1000 Value Index Fund (a) | | 882,247 | 9,854,696 |
| Fidelity Series All-Sector Equity Fund (a) | | 2,728,038 | 36,637,556 |
| Fidelity Series Commodity Strategy Fund (a)(b) | | 4,127,763 | 21,835,868 |
| Fidelity Series Real Estate Equity Fund (a) | | 425,498 | 5,859,111 |
| Fidelity Series Small Cap Opportunities Fund (a) | | 2,314,168 | 30,431,304 |
| TOTAL DOMESTIC EQUITY FUNDS | | | |
| (Cost $415,499,409) | | | 498,487,586 |
|
| International Equity Funds - 19.8% | | | |
| Fidelity Series Emerging Markets Fund (a) | | 5,859,433 | 98,555,670 |
| Fidelity Series International Growth Fund (a) | | 5,108,096 | 71,513,347 |
| Fidelity Series International Small Cap Fund (a) | | 1,055,498 | 16,434,097 |
| Fidelity Series International Value Fund (a) | | 7,574,035 | 71,801,848 |
| TOTAL INTERNATIONAL EQUITY FUNDS | | | |
| (Cost $218,429,347) | | | 258,304,962 |
|
| Bond Funds - 32.8% | | | |
| Fidelity Series Emerging Markets Debt Fund (a) | | 853,713 | 8,844,463 |
| Fidelity Series Floating Rate High Income Fund (a) | | 349,158 | 3,289,066 |
| Fidelity Series High Income Fund (a) | | 4,350,668 | 40,722,257 |
| Fidelity Series Inflation-Protected Bond Index Fund (a) | | 2,547,263 | 25,650,934 |
| Fidelity Series Investment Grade Bond Fund (a) | | 29,466,951 | 341,816,630 |
| Fidelity Series Long-Term Treasury Bond Index Fund (a) | | 34,774 | 335,567 |
| Fidelity Series Real Estate Income Fund (a) | | 586,893 | 6,584,938 |
| TOTAL BOND FUNDS | | | |
| (Cost $409,936,367) | | | 427,243,855 |
|
| Short-Term Funds - 9.2% | | | |
| Fidelity Advisor Series Short-Term Credit Fund (a) | | 4,041,458 | 40,576,242 |
| Fidelity Series Government Money Market Fund 0.29% (a)(c) | | 79,325,803 | 79,325,803 |
| TOTAL SHORT-TERM FUNDS | | | |
| (Cost $119,721,777) | | | 119,902,045 |
| TOTAL INVESTMENT PORTFOLIO - 100.0% | | | |
| (Cost $1,163,586,900) | | | 1,303,938,448 |
| NET OTHER ASSETS (LIABILITIES) - 0.0% | | | (256,617) |
| NET ASSETS - 100% | | | $1,303,681,831 |
Legend
(a) Affiliated Fund
(b) Non-income producing
(c) The rate quoted is the annualized seven-day yield of the fund at period end.
Affiliated Underlying Funds
Information regarding the Fund's fiscal year to date purchases and sales of the affiliated Underlying Funds and income earned by the Fund from investments in affiliated Underlying Funds is as follows:
| Affiliate | Value, beginning of period | Purchases | Sales Proceeds | Dividend Income | Value, end of period |
| Fidelity Advisor Series Equity Growth Fund | $52,081,217 | $1,473,083 | $6,949,729 | - | $50,100,914 |
| Fidelity Advisor Series Equity-Income Fund | 93,989,623 | 3,371,901 | 13,866,575 | 892,576 | 90,259,155 |
| Fidelity Advisor Series Growth & Income Fund | 64,935,573 | 1,666,075 | 8,769,305 | 513,393 | 62,618,848 |
| Fidelity Advisor Series Growth Opportunities Fund | 34,307,299 | 759,149 | 4,148,501 | - | 32,835,598 |
| Fidelity Advisor Series Opportunistic Insights Fund | 48,335,419 | 2,059,697 | 6,345,144 | - | 46,930,978 |
| Fidelity Advisor Series Short-Term Credit Fund | 33,225,405 | 11,825,651 | 4,638,004 | 210,705 | 40,576,242 |
| Fidelity Advisor Series Small Cap Fund | 25,995,222 | 1,177,943 | 3,283,737 | - | 25,149,816 |
| Fidelity Advisor Series Stock Selector Large Cap Value Fund | 62,498,286 | 2,533,665 | 8,906,268 | - | 60,135,631 |
| Fidelity Investments Money Market Portfolio Institutional Class 0.59% | 62,275,115 | 13,818,614 | 76,093,729 | 30,367 | - |
| Fidelity Series 100 Index Fund | 28,370,577 | 409,504 | 4,603,304 | - | 25,838,111 |
| Fidelity Series 1000 Value Index Fund | 10,408,089 | 154,178 | 1,504,915 | - | 9,854,696 |
| Fidelity Series All-Sector Equity Fund | 62,426,562 | 547,276 | 30,180,182 | - | 36,637,556 |
| Fidelity Series Commodity Strategy Fund | 16,485,920 | 6,310,326 | 2,213,917 | - | 21,835,868 |
| Fidelity Series Emerging Markets Debt Fund | 8,622,195 | 361,606 | 907,039 | 241,375 | 8,844,463 |
| Fidelity Series Emerging Markets Fund | 94,280,441 | 2,419,239 | 9,888,375 | - | 98,555,670 |
| Fidelity Series Floating Rate High Income Fund | 3,384,803 | 123,292 | 380,294 | 73,331 | 3,289,066 |
| Fidelity Series Government Money Market Fund 0.29% | - | 86,366,499 | 7,040,695 | 73,297 | 79,325,803 |
| Fidelity Series High Income Fund | 40,726,263 | 1,152,144 | 4,299,635 | 1,150,207 | 40,722,257 |
| Fidelity Series Inflation-Protected Bond Index Fund | 25,834,217 | 2,255,571 | 2,916,721 | 10,863 | 25,650,934 |
| Fidelity Series International Growth Fund | 71,134,041 | 6,748,093 | 9,912,050 | - | 71,513,347 |
| Fidelity Series International Small Cap Fund | 17,182,157 | 1,327,804 | 2,619,490 | - | 16,434,097 |
| Fidelity Series International Value Fund | 70,598,819 | 8,837,599 | 10,399,884 | - | 71,801,848 |
| Fidelity Series Investment Grade Bond Fund | 386,774,484 | 9,733,118 | 64,214,556 | 4,417,034 | 341,816,630 |
| Fidelity Series Long-Term Treasury Bond Index Fund | - | 399,653 | 51,057 | 1,484 | 335,567 |
| Fidelity Series Real Estate Equity Fund | 6,517,993 | 592,935 | 1,146,105 | 54,853 | 5,859,111 |
| Fidelity Series Real Estate Income Fund | 6,756,603 | 506,314 | 890,264 | 164,972 | 6,584,938 |
| Fidelity Series Small Cap Opportunities Fund | 31,376,947 | 856,370 | 4,377,247 | 76,206 | 30,431,304 |
| Total | $1,358,523,270 | $167,787,299 | $290,546,722 | $7,910,663 | $1,303,938,448 |
Investment Valuation
All investments are categorized as Level 1 under the Fair Value Hierarchy. The inputs or methodology used for valuing securities may not be an indication of the risk associated with investing in those securities. For more information on valuation inputs please refer to the Investment Valuation section in the accompanying Notes to Financial Statements.
See accompanying notes which are an integral part of the financial statements.
Fidelity Advisor Freedom® 2015 Fund
Financial Statements
Statement of Assets and Liabilities
| | | September 30, 2016 (Unaudited) |
| Assets | | |
| Investment in securities, at value (cost $1,163,586,900) — See accompanying schedule | | $1,303,938,448 |
| Receivable for investments sold | | 4,636,120 |
| Receivable for fund shares sold | | 1,035,247 |
| Total assets | | 1,309,609,815 |
| Liabilities | | |
| Payable for investments purchased | $2,521,121 | |
| Payable for fund shares redeemed | 3,126,999 | |
| Distribution and service plan fees payable | 279,864 | |
| Total liabilities | | 5,927,984 |
| Net Assets | | $1,303,681,831 |
| Net Assets consist of: | | |
| Paid in capital | | $1,151,649,940 |
| Undistributed net investment income | | 5,961,562 |
| Accumulated undistributed net realized gain (loss) on investments | | 5,718,781 |
| Net unrealized appreciation (depreciation) on investments | | 140,351,548 |
| Net Assets | | $1,303,681,831 |
| Calculation of Maximum Offering Price | | |
| Class A: | | |
| Net Asset Value and redemption price per share ($709,745,608 ÷ 58,146,130 shares) | | $12.21 |
| Maximum offering price per share (100/94.25 of $12.21) | | $12.95 |
| Class T: | | |
| Net Asset Value and redemption price per share ($189,874,453 ÷ 15,593,230 shares) | | $12.18 |
| Maximum offering price per share (100/96.50 of $12.18) | | $12.62 |
| Class C: | | |
| Net Asset Value and offering price per share ($62,048,505 ÷ 5,136,373 shares)(a) | | $12.08 |
| Class I: | | |
| Net Asset Value, offering price and redemption price per share ($342,013,265 ÷ 27,783,994 shares) | | $12.31 |
(a) Redemption price per share is equal to net asset value less any applicable contingent deferred sales charge.
See accompanying notes which are an integral part of the financial statements.
Statement of Operations
| | | Six months ended September 30, 2016 (Unaudited) |
| Investment Income | | |
| Income distributions from underlying funds | | $7,910,663 |
| Expenses | | |
| Distribution and service plan fees | $1,702,107 | |
| Independent trustees' fees and expenses | 3,029 | |
| Total expenses before reductions | 1,705,136 | |
| Expense reductions | (3,029) | 1,702,107 |
| Net investment income (loss) | | 6,208,556 |
| Realized and Unrealized Gain (Loss) | | |
| Realized gain (loss) on sale of underlying fund shares | 8,432,360 | |
| Capital gain distributions from underlying funds | 468,333 | |
| Total net realized gain (loss) | | 8,900,693 |
| Change in net unrealized appreciation (depreciation) on underlying funds | | 59,742,233 |
| Net gain (loss) | | 68,642,926 |
| Net increase (decrease) in net assets resulting from operations | | $74,851,482 |
See accompanying notes which are an integral part of the financial statements.
Statement of Changes in Net Assets
| | Six months ended September 30, 2016 (Unaudited) | Year ended March 31, 2016 |
| Increase (Decrease) in Net Assets | | |
| Operations | | |
| Net investment income (loss) | $6,208,556 | $24,541,951 |
| Net realized gain (loss) | 8,900,693 | 50,267,939 |
| Change in net unrealized appreciation (depreciation) | 59,742,233 | (109,109,140) |
| Net increase (decrease) in net assets resulting from operations | 74,851,482 | (34,299,250) |
| Distributions to shareholders from net investment income | (3,067,012) | (24,608,645) |
| Distributions to shareholders from net realized gain | (27,841,308) | (53,287,893) |
| Total distributions | (30,908,320) | (77,896,538) |
| Share transactions - net increase (decrease) | (98,494,077) | (210,704,885) |
| Total increase (decrease) in net assets | (54,550,915) | (322,900,673) |
| Net Assets | | |
| Beginning of period | 1,358,232,746 | 1,681,133,419 |
| End of period | $1,303,681,831 | $1,358,232,746 |
| Other Information | | |
| Undistributed net investment income end of period | $5,961,562 | $2,820,018 |
See accompanying notes which are an integral part of the financial statements.
Financial Highlights — Fidelity Advisor Freedom 2015 Fund Class A
| | Six months ended (Unaudited) September 30, | Years ended March 31, | | | | |
| | 2016 | 2016 | 2015 | 2014 | 2013 | 2012 |
| Selected Per–Share Data | | | | | | |
| Net asset value, beginning of period | $11.81 | $12.70 | $12.87 | $12.47 | $11.85 | $11.87 |
| Income from Investment Operations | | | | | | |
| Net investment income (loss)A | .06 | .20 | .20 | .15 | .16 | .17 |
| Net realized and unrealized gain (loss) | .61 | (.45) | .49 | .89 | .71 | .13 |
| Total from investment operations | .67 | (.25) | .69 | 1.04 | .87 | .30 |
| Distributions from net investment income | (.03) | (.21) | (.21) | (.15) | (.16) | (.17) |
| Distributions from net realized gain | (.25) | (.43) | (.64) | (.50) | (.09) | (.15) |
| Total distributions | (.27)B | (.64) | (.86)C | (.64)D | (.25) | (.32) |
| Net asset value, end of period | $12.21 | $11.81 | $12.70 | $12.87 | $12.47 | $11.85 |
| Total ReturnE,F,G | 5.83% | (2.07)% | 5.51% | 8.54% | 7.45% | 2.71% |
| Ratios to Average Net AssetsH,I | | | | | | |
| Expenses before reductions | .25%J | .25% | .25% | .25% | .25% | .25% |
| Expenses net of fee waivers, if any | .25%J | .25% | .25% | .25% | .25% | .25% |
| Expenses net of all reductions | .25%J | .25% | .25% | .25% | .25% | .25% |
| Net investment income (loss) | .93%J | 1.64% | 1.58% | 1.19% | 1.36% | 1.50% |
| Supplemental Data | | | | | | |
| Net assets, end of period (000 omitted) | $709,746 | $739,929 | $967,164 | $1,086,606 | $1,181,020 | $1,101,302 |
| Portfolio turnover rateH | 25%J | 20% | 21% | 37% | 20% | 19% |
A Calculated based on average shares outstanding during the period.
B Total distributions of $.27 per share is comprised of distributions from net investment income of $.027 and distributions from net realized gain of $.246 per share.
C Total distributions of $.86 per share is comprised of distributions from net investment income of $.214 and distributions from net realized gain of $.642 per share.
D Total distributions of $.64 per share is comprised of distributions from net investment income of $.146 and distributions from net realized gain of $.498 per share.
E Total returns for periods of less than one year are not annualized.
F Total returns would have been lower if certain expenses had not been reduced during the applicable periods shown.
G Total returns do not include the effect of the sales charges.
H Amounts do not include the activity of the Underlying Funds.
I Expense ratios reflect operating expenses of the class. Expenses before reductions do not reflect amounts reimbursed by the investment adviser or reductions from expense offset arrangements and do not represent the amount paid by the class during periods when reimbursements or reductions occur. Expenses net of fee waivers reflect expenses after reimbursement by the investment adviser but prior to reductions from expense offset arrangements. Expenses net of all reductions represent the net expenses paid by the class but do not include expenses of the underlying funds in which the Fund invests.
J Annualized
See accompanying notes which are an integral part of the financial statements.
Financial Highlights — Fidelity Advisor Freedom 2015 Fund Class T
| | Six months ended (Unaudited) September 30, | Years ended March 31, | | | | |
| | 2016 | 2016 | 2015 | 2014 | 2013 | 2012 |
| Selected Per–Share Data | | | | | | |
| Net asset value, beginning of period | $11.79 | $12.68 | $12.85 | $12.46 | $11.83 | $11.85 |
| Income from Investment Operations | | | | | | |
| Net investment income (loss)A | .04 | .17 | .17 | .12 | .13 | .14 |
| Net realized and unrealized gain (loss) | .62 | (.45) | .48 | .88 | .72 | .13 |
| Total from investment operations | .66 | (.28) | .65 | 1.00 | .85 | .27 |
| Distributions from net investment income | (.02) | (.18) | (.18) | (.11) | (.13) | (.14) |
| Distributions from net realized gain | (.25) | (.43) | (.64) | (.50) | (.09) | (.15) |
| Total distributions | (.27) | (.61) | (.82) | (.61) | (.22) | (.29) |
| Net asset value, end of period | $12.18 | $11.79 | $12.68 | $12.85 | $12.46 | $11.83 |
| Total ReturnB,C,D | 5.69% | (2.32)% | 5.26% | 8.20% | 7.28% | 2.44% |
| Ratios to Average Net AssetsE,F | | | | | | |
| Expenses before reductions | .50%G | .50% | .50% | .50% | .50% | .50% |
| Expenses net of fee waivers, if any | .50%G | .50% | .50% | .50% | .50% | .50% |
| Expenses net of all reductions | .50%G | .50% | .50% | .50% | .50% | .50% |
| Net investment income (loss) | .68%G | 1.39% | 1.33% | .94% | 1.11% | 1.25% |
| Supplemental Data | | | | | | |
| Net assets, end of period (000 omitted) | $189,874 | $190,018 | $208,468 | $226,663 | $227,022 | $213,366 |
| Portfolio turnover rateE | 25%G | 20% | 21% | 37% | 20% | 19% |
A Calculated based on average shares outstanding during the period.
B Total returns for periods of less than one year are not annualized.
C Total returns would have been lower if certain expenses had not been reduced during the applicable periods shown.
D Total returns do not include the effect of the sales charges.
E Amounts do not include the activity of the Underlying Funds.
F Expense ratios reflect operating expenses of the class. Expenses before reductions do not reflect amounts reimbursed by the investment adviser or reductions from expense offset arrangements and do not represent the amount paid by the class during periods when reimbursements or reductions occur. Expenses net of fee waivers reflect expenses after reimbursement by the investment adviser but prior to reductions from expense offset arrangements. Expenses net of all reductions represent the net expenses paid by the class but do not include expenses of the underlying funds in which the Fund invests.
G Annualized
See accompanying notes which are an integral part of the financial statements.
Financial Highlights — Fidelity Advisor Freedom 2015 Fund Class C
| | Six months ended (Unaudited) September 30, | Years ended March 31, | | | | |
| | 2016 | 2016 | 2015 | 2014 | 2013 | 2012 |
| Selected Per–Share Data | | | | | | |
| Net asset value, beginning of period | $11.72 | $12.60 | $12.77 | $12.39 | $11.77 | $11.79 |
| Income from Investment Operations | | | | | | |
| Net investment income (loss)A | .01 | .11 | .11 | .05 | .07 | .09 |
| Net realized and unrealized gain (loss) | .60 | (.45) | .48 | .88 | .71 | .13 |
| Total from investment operations | .61 | (.34) | .59 | .93 | .78 | .22 |
| Distributions from net investment income | (.01) | (.11) | (.12) | (.06) | (.07) | (.09) |
| Distributions from net realized gain | (.25) | (.43) | (.64) | (.49) | (.09) | (.15) |
| Total distributions | (.25)B | (.54) | (.76) | (.55) | (.16) | (.24) |
| Net asset value, end of period | $12.08 | $11.72 | $12.60 | $12.77 | $12.39 | $11.77 |
| Total ReturnC,D,E | 5.33% | (2.76)% | 4.75% | 7.65% | 6.70% | 1.98% |
| Ratios to Average Net AssetsF,G | | | | | | |
| Expenses before reductions | 1.00%H | 1.00% | 1.00% | 1.00% | 1.00% | 1.00% |
| Expenses net of fee waivers, if any | 1.00%H | 1.00% | 1.00% | 1.00% | 1.00% | 1.00% |
| Expenses net of all reductions | 1.00%H | 1.00% | 1.00% | 1.00% | 1.00% | 1.00% |
| Net investment income (loss) | .18%H | .89% | .83% | .44% | .61% | .75% |
| Supplemental Data | | | | | | |
| Net assets, end of period (000 omitted) | $62,049 | $63,443 | $72,725 | $75,682 | $72,115 | $70,220 |
| Portfolio turnover rateF | 25%H | 20% | 21% | 37% | 20% | 19% |
A Calculated based on average shares outstanding during the period.
B Total distributions of $.25 per share is comprised of distributions from net investment income of $.006 and distributions from net realized gain of $.246 per share.
C Total returns for periods of less than one year are not annualized.
D Total returns would have been lower if certain expenses had not been reduced during the applicable periods shown.
E Total returns do not include the effect of the contingent deferred sales charge.
F Amounts do not include the activity of the Underlying Funds.
G Expense ratios reflect operating expenses of the class. Expenses before reductions do not reflect amounts reimbursed by the investment adviser or reductions from expense offset arrangements and do not represent the amount paid by the class during periods when reimbursements or reductions occur. Expenses net of fee waivers reflect expenses after reimbursement by the investment adviser but prior to reductions from expense offset arrangements. Expenses net of all reductions represent the net expenses paid by the class but do not include expenses of the underlying funds in which the Fund invests.
H Annualized
See accompanying notes which are an integral part of the financial statements.
Financial Highlights — Fidelity Advisor Freedom 2015 Fund Class I
| | Six months ended (Unaudited) September 30, | Years ended March 31, | | | | |
| | 2016 | 2016 | 2015 | 2014 | 2013 | 2012 |
| Selected Per–Share Data | | | | | | |
| Net asset value, beginning of period | $11.90 | $12.79 | $12.96 | $12.56 | $11.93 | $11.94 |
| Income from Investment Operations | | | | | | |
| Net investment income (loss)A | .07 | .23 | .24 | .18 | .19 | .20 |
| Net realized and unrealized gain (loss) | .62 | (.45) | .48 | .90 | .72 | .14 |
| Total from investment operations | .69 | (.22) | .72 | 1.08 | .91 | .34 |
| Distributions from net investment income | (.04) | (.24) | (.25) | (.18) | (.19) | (.19) |
| Distributions from net realized gain | (.25) | (.43) | (.64) | (.50) | (.09) | (.15) |
| Total distributions | (.28)B | (.67) | (.89) | (.68) | (.28) | (.35)C |
| Net asset value, end of period | $12.31 | $11.90 | $12.79 | $12.96 | $12.56 | $11.93 |
| Total ReturnD,E | 5.94% | (1.80)% | 5.74% | 8.75% | 7.74% | 3.01% |
| Ratios to Average Net AssetsF,G | | | | | | |
| Expenses before reductionsH | -%I | -% | -% | -% | -% | -% |
| Expenses net of fee waivers, if any | -%I | -% | -% | -% | -% | -% |
| Expenses net of all reductions | -%I | -% | -% | -% | -% | -% |
| Net investment income (loss) | 1.18%I | 1.89% | 1.83% | 1.44% | 1.61% | 1.75% |
| Supplemental Data | | | | | | |
| Net assets, end of period (000 omitted) | $342,013 | $361,722 | $425,176 | $488,611 | $467,604 | $348,068 |
| Portfolio turnover rateF | 25%I | 20% | 21% | 37% | 20% | 19% |
A Calculated based on average shares outstanding during the period.
B Total distributions of $.28 per share is comprised of distributions from net investment income of $.035 and distributions from net realized gain of $.246 per share.
C Total distributions of $.35 per share is comprised of distributions from net investment income of $.194 and distributions from net realized gain of $.154 per share.
D Total returns for periods of less than one year are not annualized.
E Total returns would have been lower if certain expenses had not been reduced during the applicable periods shown.
F Amounts do not include the activity of the Underlying Funds.
G Expense ratios reflect operating expenses of the class. Expenses before reductions do not reflect amounts reimbursed by the investment adviser or reductions from expense offset arrangements and do not represent the amount paid by the class during periods when reimbursements or reductions occur. Expenses net of fee waivers reflect expenses after reimbursement by the investment adviser but prior to reductions from expense offset arrangements. Expenses net of all reductions represent the net expenses paid by the class but do not include expenses of the underlying funds in which the Fund invests.
H Amount represents less than .005%.
I Annualized
See accompanying notes which are an integral part of the financial statements.
Fidelity Advisor Freedom® 2020 Fund
Investment Summary (Unaudited)
The information in the following tables is based on the direct investments of the Fund.
Top Holdings as of September 30, 2016
| | % of fund's net assets | % of fund's net assets 6 months ago |
| Fidelity Series Investment Grade Bond Fund | 23.9 | 24.9 |
| Fidelity Series Emerging Markets Fund | 8.0 | 7.4 |
| Fidelity Advisor Series Equity-Income Fund | 7.7 | 7.7 |
| Fidelity Series International Value Fund | 6.1 | 5.8 |
| Fidelity Series International Growth Fund | 6.1 | 5.8 |
| Fidelity Advisor Series Growth & Income Fund | 5.3 | 5.3 |
| Fidelity Advisor Series Stock Selector Large Cap Value Fund | 5.1 | 5.1 |
| Fidelity Series Government Money Market Fund 0.29% | 4.3 | 0.0 |
| Fidelity Advisor Series Equity Growth Fund | 4.3 | 4.3 |
| Fidelity Advisor Series Opportunistic Insights Fund | 4.0 | 4.0 |
| | 74.8 | 70.3 |
Asset Allocation (% of fund's net assets)
| Period end |
| | Domestic Equity Funds | 42.3% |
| | International Equity Funds | 21.6% |
| | Bond Funds | 29.6% |
| | Short-Term Funds | 6.5% |

| Six months ago |
| | Domestic Equity Funds | 43.9% |
| | International Equity Funds | 20.4% |
| | Bond Funds | 30.3% |
| | Short-Term Funds | 5.4% |

Percentages shown as 0.0% may reflect amounts less than 0.05%.
Domestic Equity Funds category includes Fidelity Series Commodity Strategy Fund which invests in commodity-related investments.
Fidelity Advisor Freedom® 2020 Fund
Investments September 30, 2016 (Unaudited)
Showing Percentage of Net Assets
| Domestic Equity Funds - 42.3% | | | |
| | | Shares | Value |
| Fidelity Advisor Series Equity Growth Fund (a) | | 9,997,350 | $114,569,633 |
| Fidelity Advisor Series Equity-Income Fund (a) | | 16,648,388 | 205,774,078 |
| Fidelity Advisor Series Growth & Income Fund (a) | | 10,735,195 | 142,133,976 |
| Fidelity Advisor Series Growth Opportunities Fund (a) | | 6,948,897 | 75,603,998 |
| Fidelity Advisor Series Opportunistic Insights Fund (a) | | 6,979,218 | 106,991,417 |
| Fidelity Advisor Series Small Cap Fund (a) | | 5,408,923 | 57,334,583 |
| Fidelity Advisor Series Stock Selector Large Cap Value Fund (a) | | 11,491,693 | 137,095,892 |
| Fidelity Series 100 Index Fund (a) | | 4,125,160 | 58,907,284 |
| Fidelity Series 1000 Value Index Fund (a) | | 2,001,099 | 22,352,279 |
| Fidelity Series All-Sector Equity Fund (a) | | 6,208,848 | 83,384,832 |
| Fidelity Series Commodity Strategy Fund (a)(b) | | 8,480,524 | 44,861,973 |
| Fidelity Series Real Estate Equity Fund (a) | | 969,598 | 13,351,366 |
| Fidelity Series Small Cap Opportunities Fund (a) | | 5,274,917 | 69,365,158 |
| TOTAL DOMESTIC EQUITY FUNDS | | | |
| (Cost $959,755,249) | | | 1,131,726,469 |
|
| International Equity Funds - 21.6% | | | |
| Fidelity Series Emerging Markets Fund (a) | | 12,741,223 | 214,307,365 |
| Fidelity Series International Growth Fund (a) | | 11,616,717 | 162,634,039 |
| Fidelity Series International Small Cap Fund (a) | | 2,400,261 | 37,372,058 |
| Fidelity Series International Value Fund (a) | | 17,224,654 | 163,289,719 |
| TOTAL INTERNATIONAL EQUITY FUNDS | | | |
| (Cost $499,149,744) | | | 577,603,181 |
|
| Bond Funds - 29.6% | | | |
| Fidelity Series Emerging Markets Debt Fund (a) | | 1,743,199 | 18,059,541 |
| Fidelity Series Floating Rate High Income Fund (a) | | 712,622 | 6,712,902 |
| Fidelity Series High Income Fund (a) | | 8,833,547 | 82,682,004 |
| Fidelity Series Inflation-Protected Bond Index Fund (a) | | 3,080,067 | 31,016,277 |
| Fidelity Series Investment Grade Bond Fund (a) | | 55,029,171 | 638,338,381 |
| Fidelity Series Long-Term Treasury Bond Index Fund (a) | | 68,349 | 659,572 |
| Fidelity Series Real Estate Income Fund (a) | | 1,207,258 | 13,545,439 |
| TOTAL BOND FUNDS | | | |
| (Cost $772,911,661) | | | 791,014,116 |
|
| Short-Term Funds - 6.5% | | | |
| Fidelity Advisor Series Short-Term Credit Fund (a) | | 5,843,942 | 58,673,173 |
| Fidelity Series Government Money Market Fund 0.29% (a)(c) | | 116,798,092 | 116,798,092 |
| TOTAL SHORT-TERM FUNDS | | | |
| (Cost $175,215,300) | | | 175,471,265 |
| TOTAL INVESTMENT PORTFOLIO - 100.0% | | | |
| (Cost $2,407,031,954) | | | 2,675,815,031 |
| NET OTHER ASSETS (LIABILITIES) - 0.0% | | | (559,782) |
| NET ASSETS - 100% | | | $2,675,255,249 |
Legend
(a) Affiliated Fund
(b) Non-income producing
(c) The rate quoted is the annualized seven-day yield of the fund at period end.
Affiliated Underlying Funds
Information regarding the Fund's fiscal year to date purchases and sales of the affiliated Underlying Funds and income earned by the Fund from investments in affiliated Underlying Funds is as follows:
| Affiliate | Value, beginning of period | Purchases | Sales Proceeds | Dividend Income | Value, end of period |
| Fidelity Advisor Series Equity Growth Fund | $115,799,462 | $4,956,427 | $14,034,464 | - | $114,569,633 |
| Fidelity Advisor Series Equity-Income Fund | 208,978,797 | 9,961,986 | 28,349,590 | 1,993,713 | 205,774,078 |
| Fidelity Advisor Series Growth & Income Fund | 144,377,200 | 4,256,924 | 17,258,167 | 1,148,239 | 142,133,976 |
| Fidelity Advisor Series Growth Opportunities Fund | 76,278,340 | 3,234,131 | 8,216,513 | - | 75,603,998 |
| Fidelity Advisor Series Opportunistic Insights Fund | 107,469,917 | 5,768,043 | 12,721,904 | - | 106,991,417 |
| Fidelity Advisor Series Short-Term Credit Fund | 51,085,323 | 12,769,442 | 5,401,255 | 298,632 | 58,673,173 |
| Fidelity Advisor Series Small Cap Fund | 57,798,864 | 3,217,659 | 6,517,666 | - | 57,334,583 |
| Fidelity Advisor Series Stock Selector Large Cap Value Fund | 138,959,744 | 7,568,467 | 18,417,432 | - | 137,095,892 |
| Fidelity Investments Money Market Portfolio Institutional Class 0.59% | 95,816,471 | 6,178,647 | 101,995,118 | 44,012 | - |
| Fidelity Series 100 Index Fund | 63,079,196 | 1,215,436 | 9,099,673 | - | 58,907,284 |
| Fidelity Series 1000 Value Index Fund | 23,142,211 | 455,131 | 3,033,832 | - | 22,352,279 |
| Fidelity Series All-Sector Equity Fund | 138,800,525 | 1,889,990 | 65,954,546 | - | 83,384,832 |
| Fidelity Series Commodity Strategy Fund | 32,984,928 | 13,002,989 | 3,733,207 | - | 44,861,973 |
| Fidelity Series Emerging Markets Debt Fund | 17,275,432 | 807,236 | 1,577,745 | 489,496 | 18,059,541 |
| Fidelity Series Emerging Markets Fund | 200,255,462 | 6,193,638 | 17,526,159 | - | 214,307,365 |
| Fidelity Series Floating Rate High Income Fund | 6,758,527 | 279,559 | 650,394 | 148,381 | 6,712,902 |
| Fidelity Series Government Money Market Fund 0.29% | - | 125,031,308 | 8,233,215 | 103,776 | 116,798,092 |
| Fidelity Series High Income Fund | 81,452,654 | 2,328,290 | 7,421,285 | 2,317,077 | 82,682,004 |
| Fidelity Series Inflation-Protected Bond Index Fund | 29,379,906 | 4,017,691 | 2,941,940 | 12,618 | 31,016,277 |
| Fidelity Series International Growth Fund | 159,060,118 | 14,787,348 | 19,327,347 | - | 162,634,039 |
| Fidelity Series International Small Cap Fund | 38,139,374 | 2,899,844 | 4,930,302 | - | 37,372,058 |
| Fidelity Series International Value Fund | 157,872,541 | 19,539,789 | 20,451,673 | - | 163,289,719 |
| Fidelity Series Investment Grade Bond Fund | 676,203,688 | 21,109,947 | 76,355,140 | 8,126,896 | 638,338,381 |
| Fidelity Series Long-Term Treasury Bond Index Fund | - | 744,159 | 60,043 | 2,870 | 659,572 |
| Fidelity Series Real Estate Equity Fund | 14,492,629 | 1,417,576 | 2,304,436 | 124,346 | 13,351,366 |
| Fidelity Series Real Estate Income Fund | 13,615,994 | 1,095,226 | 1,594,574 | 337,957 | 13,545,439 |
| Fidelity Series Small Cap Opportunities Fund | 69,761,956 | 2,658,300 | 8,857,109 | 171,795 | 69,365,158 |
| Total | $2,718,839,259 | $277,385,183 | $466,964,729 | $15,319,808 | $2,675,815,031 |
Investment Valuation
All investments are categorized as Level 1 under the Fair Value Hierarchy. The inputs or methodology used for valuing securities may not be an indication of the risk associated with investing in those securities. For more information on valuation inputs please refer to the Investment Valuation section in the accompanying Notes to Financial Statements.
See accompanying notes which are an integral part of the financial statements.
Fidelity Advisor Freedom® 2020 Fund
Financial Statements
Statement of Assets and Liabilities
| | | September 30, 2016 (Unaudited) |
| Assets | | |
| Investment in securities, at value (cost $2,407,031,954) — See accompanying schedule | | $2,675,815,031 |
| Cash | | 2 |
| Receivable for investments sold | | 10,060,394 |
| Receivable for fund shares sold | | 1,582,185 |
| Total assets | | 2,687,457,612 |
| Liabilities | | |
| Payable for investments purchased | $5,007,355 | |
| Payable for fund shares redeemed | 6,644,871 | |
| Distribution and service plan fees payable | 550,137 | |
| Total liabilities | | 12,202,363 |
| Net Assets | | $2,675,255,249 |
| Net Assets consist of: | | |
| Paid in capital | | $2,391,879,284 |
| Undistributed net investment income | | 11,590,107 |
| Accumulated undistributed net realized gain (loss) on investments | | 3,002,781 |
| Net unrealized appreciation (depreciation) on investments | | 268,783,077 |
| Net Assets | | $2,675,255,249 |
| Calculation of Maximum Offering Price | | |
| Class A: | | |
| Net Asset Value and redemption price per share ($1,404,150,630 ÷ 108,427,562 shares) | | $12.95 |
| Maximum offering price per share (100/94.25 of $12.95) | | $13.74 |
| Class T: | | |
| Net Asset Value and redemption price per share ($404,785,392 ÷ 31,286,086 shares) | | $12.94 |
| Maximum offering price per share (100/96.50 of $12.94) | | $13.41 |
| Class C: | | |
| Net Asset Value and offering price per share ($105,433,286 ÷ 8,219,329 shares)(a) | | $12.83 |
| Class I: | | |
| Net Asset Value, offering price and redemption price per share ($760,885,941 ÷ 58,272,711 shares) | | $13.06 |
(a) Redemption price per share is equal to net asset value less any applicable contingent deferred sales charge.
See accompanying notes which are an integral part of the financial statements.
Statement of Operations
| | | Six months ended September 30, 2016 (Unaudited) |
| Investment Income | | |
| Income distributions from underlying funds | | $15,319,808 |
| Expenses | | |
| Distribution and service plan fees | $3,329,048 | |
| Independent trustees' fees and expenses | 6,119 | |
| Total expenses before reductions | 3,335,167 | |
| Expense reductions | (6,119) | 3,329,048 |
| Net investment income (loss) | | 11,990,760 |
| Realized and Unrealized Gain (Loss) | | |
| Realized gain (loss) on sale of underlying fund shares | 10,413,237 | |
| Capital gain distributions from underlying funds | 1,047,517 | |
| Total net realized gain (loss) | | 11,460,754 |
| Change in net unrealized appreciation (depreciation) on underlying funds | | 136,142,072 |
| Net gain (loss) | | 147,602,826 |
| Net increase (decrease) in net assets resulting from operations | | $159,593,586 |
See accompanying notes which are an integral part of the financial statements.
Statement of Changes in Net Assets
| | Six months ended September 30, 2016 (Unaudited) | Year ended March 31, 2016 |
| Increase (Decrease) in Net Assets | | |
| Operations | | |
| Net investment income (loss) | $11,990,760 | $47,110,097 |
| Net realized gain (loss) | 11,460,754 | 94,876,471 |
| Change in net unrealized appreciation (depreciation) | 136,142,072 | (213,772,148) |
| Net increase (decrease) in net assets resulting from operations | 159,593,586 | (71,785,580) |
| Distributions to shareholders from net investment income | (4,524,769) | (47,618,996) |
| Distributions to shareholders from net realized gain | (61,288,956) | (93,543,927) |
| Total distributions | (65,813,725) | (141,162,923) |
| Share transactions - net increase (decrease) | (136,801,093) | (250,269,433) |
| Total increase (decrease) in net assets | (43,021,232) | (463,217,936) |
| Net Assets | | |
| Beginning of period | 2,718,276,481 | 3,181,494,417 |
| End of period | $2,675,255,249 | $2,718,276,481 |
| Other Information | | |
| Undistributed net investment income end of period | $11,590,107 | $4,124,116 |
See accompanying notes which are an integral part of the financial statements.
Financial Highlights — Fidelity Advisor Freedom 2020 Fund Class A
| | Six months ended (Unaudited) September 30, | Years ended March 31, | | | | |
| | 2016 | 2016 | 2015 | 2014 | 2013 | 2012 |
| Selected Per–Share Data | | | | | | |
| Net asset value, beginning of period | $12.51 | $13.44 | $13.54 | $13.05 | $12.35 | $12.45 |
| Income from Investment Operations | | | | | | |
| Net investment income (loss)A | .06 | .21 | .22 | .16 | .18 | .19 |
| Net realized and unrealized gain (loss) | .69 | (.51) | .55 | 1.04 | .78 | .06 |
| Total from investment operations | .75 | (.30) | .77 | 1.20 | .96 | .25 |
| Distributions from net investment income | (.02) | (.21) | (.23) | (.16) | (.18) | (.18) |
| Distributions from net realized gain | (.28) | (.41) | (.64) | (.55) | (.08) | (.18) |
| Total distributions | (.31)B | (.63)C | (.87) | (.71) | (.26) | (.35)D |
| Net asset value, end of period | $12.95 | $12.51 | $13.44 | $13.54 | $13.05 | $12.35 |
| Total ReturnE,F,G | 6.10% | (2.35)% | 5.82% | 9.38% | 7.91% | 2.23% |
| Ratios to Average Net AssetsH,I | | | | | | |
| Expenses before reductions | .25%J | .25% | .25% | .25% | .25% | .25% |
| Expenses net of fee waivers, if any | .25%J | .25% | .25% | .25% | .25% | .25% |
| Expenses net of all reductions | .25%J | .25% | .25% | .25% | .25% | .25% |
| Net investment income (loss) | .88%J | 1.62% | 1.59% | 1.22% | 1.44% | 1.55% |
| Supplemental Data | | | | | | |
| Net assets, end of period (000 omitted) | $1,404,151 | $1,442,826 | $1,775,399 | $1,910,164 | $1,944,691 | $1,740,500 |
| Portfolio turnover rateH | 20%J | 20% | 21% | 40% | 21% | 18% |
A Calculated based on average shares outstanding during the period.
B Total distributions of $.31 per share is comprised of distributions from net investment income of $.021 and distributions from net realized gain of $.284 per share.
C Total distributions of $.63 per share is comprised of distributions from net investment income of $.214 and distributions from net realized gain of $.411 per share.
D Total distributions of $.35 per share is comprised of distributions from net investment income of $.178 and distributions from net realized gain of $.175 per share.
E Total returns for periods of less than one year are not annualized.
F Total returns would have been lower if certain expenses had not been reduced during the applicable periods shown.
G Total returns do not include the effect of the sales charges.
H Amounts do not include the activity of the Underlying Funds.
I Expense ratios reflect operating expenses of the class. Expenses before reductions do not reflect amounts reimbursed by the investment adviser or reductions from expense offset arrangements and do not represent the amount paid by the class during periods when reimbursements or reductions occur. Expenses net of fee waivers reflect expenses after reimbursement by the investment adviser but prior to reductions from expense offset arrangements. Expenses net of all reductions represent the net expenses paid by the class but do not include expenses of the underlying funds in which the Fund invests.
J Annualized
See accompanying notes which are an integral part of the financial statements.
Financial Highlights — Fidelity Advisor Freedom 2020 Fund Class T
| | Six months ended (Unaudited) September 30, | Years ended March 31, | | | | |
| | 2016 | 2016 | 2015 | 2014 | 2013 | 2012 |
| Selected Per–Share Data | | | | | | |
| Net asset value, beginning of period | $12.51 | $13.44 | $13.54 | $13.05 | $12.34 | $12.45 |
| Income from Investment Operations | | | | | | |
| Net investment income (loss)A | .04 | .18 | .18 | .13 | .15 | .16 |
| Net realized and unrealized gain (loss) | .69 | (.52) | .55 | 1.03 | .79 | .05 |
| Total from investment operations | .73 | (.34) | .73 | 1.16 | .94 | .21 |
| Distributions from net investment income | (.01) | (.18) | (.19) | (.13) | (.15) | (.15) |
| Distributions from net realized gain | (.28) | (.41) | (.64) | (.55) | (.08) | (.18) |
| Total distributions | (.30)B | (.59) | (.83) | (.67)C | (.23) | (.32)D |
| Net asset value, end of period | $12.94 | $12.51 | $13.44 | $13.54 | $13.05 | $12.34 |
| Total ReturnE,F,G | 5.95% | (2.59)% | 5.56% | 9.11% | 7.72% | 1.86% |
| Ratios to Average Net AssetsH,I | | | | | | |
| Expenses before reductions | .50%J | .50% | .50% | .50% | .50% | .50% |
| Expenses net of fee waivers, if any | .50%J | .50% | .50% | .50% | .50% | .50% |
| Expenses net of all reductions | .50%J | .50% | .50% | .50% | .50% | .50% |
| Net investment income (loss) | .63%J | 1.37% | 1.34% | .97% | 1.19% | 1.30% |
| Supplemental Data | | | | | | |
| Net assets, end of period (000 omitted) | $404,785 | $394,406 | $440,674 | $465,828 | $430,153 | $386,416 |
| Portfolio turnover rateH | 20%J | 20% | 21% | 40% | 21% | 18% |
A Calculated based on average shares outstanding during the period.
B Total distributions of $.30 per share is comprised of distributions from net investment income of $.013 and distributions from net realized gain of $.284 per share.
C Total distributions of $.67 per share is comprised of distributions from net investment income of $.125 and distributions from net realized gain of $.549 per share.
D Total distributions of $.32 per share is comprised of distributions from net investment income of $.145 and distributions from net realized gain of $.175 per share.
E Total returns for periods of less than one year are not annualized.
F Total returns would have been lower if certain expenses had not been reduced during the applicable periods shown.
G Total returns do not include the effect of the sales charges.
H Amounts do not include the activity of the Underlying Funds.
I Expense ratios reflect operating expenses of the class. Expenses before reductions do not reflect amounts reimbursed by the investment adviser or reductions from expense offset arrangements and do not represent the amount paid by the class during periods when reimbursements or reductions occur. Expenses net of fee waivers reflect expenses after reimbursement by the investment adviser but prior to reductions from expense offset arrangements. Expenses net of all reductions represent the net expenses paid by the class but do not include expenses of the underlying funds in which the Fund invests.
J Annualized
See accompanying notes which are an integral part of the financial statements.
Financial Highlights — Fidelity Advisor Freedom 2020 Fund Class C
| | Six months ended (Unaudited) September 30, | Years ended March 31, | | | | |
| | 2016 | 2016 | 2015 | 2014 | 2013 | 2012 |
| Selected Per–Share Data | | | | | | |
| Net asset value, beginning of period | $12.42 | $13.35 | $13.45 | $12.97 | $12.27 | $12.37 |
| Income from Investment Operations | | | | | | |
| Net investment income (loss)A | .01 | .11 | .11 | .06 | .09 | .10 |
| Net realized and unrealized gain (loss) | .68 | (.51) | .55 | 1.03 | .78 | .06 |
| Total from investment operations | .69 | (.40) | .66 | 1.09 | .87 | .16 |
| Distributions from net investment income | – | (.12) | (.12) | (.07) | (.08) | (.09) |
| Distributions from net realized gain | (.28) | (.41) | (.64) | (.54) | (.08) | (.17) |
| Total distributions | (.28) | (.53) | (.76) | (.61) | (.17)B | (.26) |
| Net asset value, end of period | $12.83 | $12.42 | $13.35 | $13.45 | $12.97 | $12.27 |
| Total ReturnC,D,E | 5.72% | (3.11)% | 5.07% | 8.57% | 7.13% | 1.43% |
| Ratios to Average Net AssetsF,G | | | | | | |
| Expenses before reductions | 1.00%H | 1.00% | 1.00% | 1.00% | 1.00% | 1.00% |
| Expenses net of fee waivers, if any | 1.00%H | 1.00% | 1.00% | 1.00% | 1.00% | 1.00% |
| Expenses net of all reductions | 1.00%H | 1.00% | 1.00% | 1.00% | 1.00% | 1.00% |
| Net investment income (loss) | .13%H | .87% | .84% | .47% | .69% | .80% |
| Supplemental Data | | | | | | |
| Net assets, end of period (000 omitted) | $105,433 | $105,128 | $112,535 | $113,194 | $102,576 | $97,550 |
| Portfolio turnover rateF | 20%H | 20% | 21% | 40% | 21% | 18% |
A Calculated based on average shares outstanding during the period.
B Total distributions of $.17 per share is comprised of distributions from net investment income of $.084 and distributions from net realized gain of $.083 per share.
C Total returns for periods of less than one year are not annualized.
D Total returns would have been lower if certain expenses had not been reduced during the applicable periods shown.
E Total returns do not include the effect of the contingent deferred sales charge.
F Amounts do not include the activity of the Underlying Funds.
G Expense ratios reflect operating expenses of the class. Expenses before reductions do not reflect amounts reimbursed by the investment adviser or reductions from expense offset arrangements and do not represent the amount paid by the class during periods when reimbursements or reductions occur. Expenses net of fee waivers reflect expenses after reimbursement by the investment adviser but prior to reductions from expense offset arrangements. Expenses net of all reductions represent the net expenses paid by the class but do not include expenses of the underlying funds in which the Fund invests.
H Annualized
See accompanying notes which are an integral part of the financial statements.
Financial Highlights — Fidelity Advisor Freedom 2020 Fund Class I
| | Six months ended (Unaudited) September 30, | Years ended March 31, | | | | |
| | 2016 | 2016 | 2015 | 2014 | 2013 | 2012 |
| Selected Per–Share Data | | | | | | |
| Net asset value, beginning of period | $12.61 | $13.54 | $13.63 | $13.14 | $12.42 | $12.53 |
| Income from Investment Operations | | | | | | |
| Net investment income (loss)A | .07 | .24 | .25 | .20 | .21 | .22 |
| Net realized and unrealized gain (loss) | .69 | (.51) | .56 | 1.03 | .80 | .05 |
| Total from investment operations | .76 | (.27) | .81 | 1.23 | 1.01 | .27 |
| Distributions from net investment income | (.03) | (.25) | (.26) | (.19) | (.21) | (.21) |
| Distributions from net realized gain | (.28) | (.41) | (.64) | (.55) | (.08) | (.18) |
| Total distributions | (.31) | (.66) | (.90) | (.74) | (.29) | (.38)B |
| Net asset value, end of period | $13.06 | $12.61 | $13.54 | $13.63 | $13.14 | $12.42 |
| Total ReturnC,D | 6.19% | (2.07)% | 6.13% | 9.58% | 8.28% | 2.39% |
| Ratios to Average Net AssetsE,F | | | | | | |
| Expenses before reductionsG | -%H | -% | -% | -% | -% | -% |
| Expenses net of fee waivers, if any | -%H | -% | -% | -% | -% | -% |
| Expenses net of all reductions | -%H | -% | -% | -% | -% | -% |
| Net investment income (loss) | 1.13%H | 1.87% | 1.84% | 1.47% | 1.69% | 1.80% |
| Supplemental Data | | | | | | |
| Net assets, end of period (000 omitted) | $760,886 | $767,908 | $836,880 | $875,979 | $777,288 | $555,462 |
| Portfolio turnover rateE | 20%H | 20% | 21% | 40% | 21% | 18% |
A Calculated based on average shares outstanding during the period.
B Total distributions of $.38 per share is comprised of distributions from net investment income of $.208 and distributions from net realized gain of $.175 per share.
C Total returns for periods of less than one year are not annualized.
D Total returns would have been lower if certain expenses had not been reduced during the applicable periods shown.
E Amounts do not include the activity of the Underlying Funds.
F Expense ratios reflect operating expenses of the class. Expenses before reductions do not reflect amounts reimbursed by the investment adviser or reductions from expense offset arrangements and do not represent the amount paid by the class during periods when reimbursements or reductions occur. Expenses net of fee waivers reflect expenses after reimbursement by the investment adviser but prior to reductions from expense offset arrangements. Expenses net of all reductions represent the net expenses paid by the class but do not include expenses of the underlying funds in which the Fund invests.
G Amount represents less than .005%.
H Annualized
See accompanying notes which are an integral part of the financial statements.
Fidelity Advisor Freedom® 2025 Fund
Investment Summary (Unaudited)
The information in the following tables is based on the direct investments of the Fund.
Top Holdings as of September 30, 2016
| | % of fund's net assets | % of fund's net assets 6 months ago |
| Fidelity Series Investment Grade Bond Fund | 20.3 | 19.9 |
| Fidelity Advisor Series Equity-Income Fund | 8.5 | 8.5 |
| Fidelity Series Emerging Markets Fund | 8.4 | 7.8 |
| Fidelity Series International Value Fund | 6.7 | 6.5 |
| Fidelity Series International Growth Fund | 6.7 | 6.6 |
| Fidelity Advisor Series Growth & Income Fund | 5.9 | 5.9 |
| Fidelity Advisor Series Stock Selector Large Cap Value Fund | 5.7 | 5.7 |
| Fidelity Advisor Series Equity Growth Fund | 4.7 | 4.7 |
| Fidelity Advisor Series Opportunistic Insights Fund | 4.4 | 4.4 |
| Fidelity Series All-Sector Equity Fund | 3.4 | 5.7 |
| | 74.7 | 75.7 |
Asset Allocation (% of fund's net assets)
| Period end |
| | Domestic Equity Funds | 46.6% |
| | International Equity Funds | 23.3% |
| | Bond Funds | 25.3% |
| | Short-Term Funds | 4.8% |

| Six months ago |
| | Domestic Equity Funds | 48.6% |
| | International Equity Funds | 22.5% |
| | Bond Funds | 24.7% |
| | Short-Term Funds | 4.2% |

Domestic Equity Funds category includes Fidelity Series Commodity Strategy Fund which invests in commodity-related investments.
Fidelity Advisor Freedom® 2025 Fund
Investments September 30, 2016 (Unaudited)
Showing Percentage of Net Assets
| Domestic Equity Funds - 46.6% | | | |
| | | Shares | Value |
| Fidelity Advisor Series Equity Growth Fund (a) | | 12,149,752 | $139,236,154 |
| Fidelity Advisor Series Equity-Income Fund (a) | | 20,265,202 | 250,477,893 |
| Fidelity Advisor Series Growth & Income Fund (a) | | 13,064,095 | 172,968,612 |
| Fidelity Advisor Series Growth Opportunities Fund (a) | | 8,453,178 | 91,970,578 |
| Fidelity Advisor Series Opportunistic Insights Fund (a) | | 8,485,008 | 130,075,175 |
| Fidelity Advisor Series Small Cap Fund (a) | | 6,583,875 | 69,789,074 |
| Fidelity Advisor Series Stock Selector Large Cap Value Fund (a) | | 13,988,782 | 166,886,174 |
| Fidelity Series 100 Index Fund (a) | | 5,021,314 | 71,704,364 |
| Fidelity Series 1000 Value Index Fund (a) | | 2,431,052 | 27,154,852 |
| Fidelity Series All-Sector Equity Fund (a) | | 7,362,667 | 98,880,614 |
| Fidelity Series Commodity Strategy Fund (a)(b) | | 9,167,380 | 48,495,438 |
| Fidelity Series Real Estate Equity Fund (a) | | 1,180,140 | 16,250,521 |
| Fidelity Series Small Cap Opportunities Fund (a) | | 6,420,474 | 84,429,228 |
| TOTAL DOMESTIC EQUITY FUNDS | | | |
| (Cost $1,161,375,235) | | | 1,368,318,677 |
|
| International Equity Funds - 23.3% | | | |
| Fidelity Series Emerging Markets Fund (a) | | 14,634,111 | 246,145,744 |
| Fidelity Series International Growth Fund (a) | | 14,027,850 | 196,389,894 |
| Fidelity Series International Small Cap Fund (a) | | 2,898,339 | 45,127,143 |
| Fidelity Series International Value Fund (a) | | 20,799,917 | 197,183,213 |
| TOTAL INTERNATIONAL EQUITY FUNDS | | | |
| (Cost $598,394,089) | | | 684,845,994 |
|
| Bond Funds - 25.3% | | | |
| Fidelity Series Emerging Markets Debt Fund (a) | | 1,921,860 | 19,910,467 |
| Fidelity Series Floating Rate High Income Fund (a) | | 782,267 | 7,368,959 |
| Fidelity Series High Income Fund (a) | | 9,565,930 | 89,537,108 |
| Fidelity Series Inflation-Protected Bond Index Fund (a) | | 1,711,658 | 17,236,400 |
| Fidelity Series Investment Grade Bond Fund (a) | | 51,331,125 | 595,441,048 |
| Fidelity Series Long-Term Treasury Bond Index Fund (a) | | 62,832 | 606,329 |
| Fidelity Series Real Estate Income Fund (a) | | 1,325,514 | 14,872,262 |
| TOTAL BOND FUNDS | | | |
| (Cost $732,564,009) | | | 744,972,573 |
|
| Short-Term Funds - 4.8% | | | |
| Fidelity Advisor Series Short-Term Credit Fund (a) | | 4,797,418 | 48,166,076 |
| Fidelity Series Government Money Market Fund 0.29% (a)(c) | | 93,390,469 | 93,390,469 |
| TOTAL SHORT-TERM FUNDS | | | |
| (Cost $141,346,387) | | | 141,556,545 |
| TOTAL INVESTMENT PORTFOLIO - 100.0% | | | |
| (Cost $2,633,679,720) | | | 2,939,693,789 |
| NET OTHER ASSETS (LIABILITIES) - 0.0% | | | (574,997) |
| NET ASSETS - 100% | | | $2,939,118,792 |
Legend
(a) Affiliated Fund
(b) Non-income producing
(c) The rate quoted is the annualized seven-day yield of the fund at period end.
Affiliated Underlying Funds
Information regarding the Fund's fiscal year to date purchases and sales of the affiliated Underlying Funds and income earned by the Fund from investments in affiliated Underlying Funds is as follows:
| Affiliate | Value, beginning of period | Purchases | Sales Proceeds | Dividend Income | Value, end of period |
| Fidelity Advisor Series Equity Growth Fund | $137,707,630 | $6,912,469 | $14,849,927 | - | $139,236,154 |
| Fidelity Advisor Series Equity-Income Fund | 248,516,697 | 13,614,489 | 29,913,949 | 2,388,851 | 250,477,893 |
| Fidelity Advisor Series Growth & Income Fund | 171,691,621 | 6,182,511 | 17,877,562 | 1,376,475 | 172,968,612 |
| Fidelity Advisor Series Growth Opportunities Fund | 90,709,153 | 4,485,601 | 8,426,313 | - | 91,970,578 |
| Fidelity Advisor Series Opportunistic Insights Fund | 127,802,313 | 7,807,444 | 13,356,111 | - | 130,075,175 |
| Fidelity Advisor Series Short-Term Credit Fund | 42,517,011 | 9,095,567 | 3,619,403 | 239,445 | 48,166,076 |
| Fidelity Advisor Series Small Cap Fund | 68,733,085 | 4,297,104 | 6,666,704 | - | 69,789,074 |
| Fidelity Advisor Series Stock Selector Large Cap Value Fund | 165,249,648 | 10,069,401 | 19,231,746 | - | 166,886,174 |
| Fidelity Investments Money Market Portfolio Institutional Class 0.59% | 79,546,299 | 556,508 | 80,102,807 | 36,058 | - |
| Fidelity Series 100 Index Fund | 75,012,557 | 1,928,525 | 9,706,368 | - | 71,704,364 |
| Fidelity Series 1000 Value Index Fund | 27,519,283 | 723,629 | 3,237,170 | - | 27,154,852 |
| Fidelity Series All-Sector Equity Fund | 165,059,094 | 3,362,812 | 79,960,523 | - | 98,880,614 |
| Fidelity Series Commodity Strategy Fund | 36,396,483 | 12,552,290 | 3,416,115 | - | 48,495,438 |
| Fidelity Series Emerging Markets Debt Fund | 18,635,514 | 1,000,664 | 1,418,222 | 533,771 | 19,910,467 |
| Fidelity Series Emerging Markets Fund | 228,047,458 | 6,013,312 | 16,848,214 | - | 246,145,744 |
| Fidelity Series Floating Rate High Income Fund | 7,253,136 | 352,387 | 588,658 | 161,082 | 7,368,959 |
| Fidelity Series Government Money Market Fund 0.29% | - | 98,974,432 | 5,583,964 | 83,097 | 93,390,469 |
| Fidelity Series High Income Fund | 86,805,502 | 2,644,250 | 6,693,690 | 2,487,702 | 89,537,108 |
| Fidelity Series Inflation-Protected Bond Index Fund | 14,683,385 | 3,481,958 | 1,228,574 | 6,522 | 17,236,400 |
| Fidelity Series International Growth Fund | 191,131,613 | 15,602,379 | 20,107,566 | - | 196,389,894 |
| Fidelity Series International Small Cap Fund | 45,765,205 | 2,609,732 | 4,841,968 | - | 45,127,143 |
| Fidelity Series International Value Fund | 189,706,229 | 21,326,629 | 21,463,258 | - | 197,183,213 |
| Fidelity Series Investment Grade Bond Fund | 578,801,411 | 49,289,463 | 47,973,166 | 7,257,819 | 595,441,048 |
| Fidelity Series Long-Term Treasury Bond Index Fund | - | 658,539 | 30,222 | 2,639 | 606,329 |
| Fidelity Series Real Estate Equity Fund | 17,233,328 | 1,811,239 | 2,474,240 | 149,377 | 16,250,521 |
| Fidelity Series Real Estate Income Fund | 14,628,008 | 1,290,213 | 1,507,378 | 368,003 | 14,872,262 |
| Fidelity Series Small Cap Opportunities Fund | 82,959,715 | 3,794,648 | 9,323,296 | 208,769 | 84,429,228 |
| Total | $2,912,111,378 | $290,438,195 | $430,447,114 | $15,299,610 | $2,939,693,789 |
Investment Valuation
All investments are categorized as Level 1 under the Fair Value Hierarchy. The inputs or methodology used for valuing securities may not be an indication of the risk associated with investing in those securities. For more information on valuation inputs please refer to the Investment Valuation section in the accompanying Notes to Financial Statements.
See accompanying notes which are an integral part of the financial statements.
Fidelity Advisor Freedom® 2025 Fund
Financial Statements
Statement of Assets and Liabilities
| | | September 30, 2016 (Unaudited) |
| Assets | | |
| Investment in securities, at value (cost $2,633,679,720) — See accompanying schedule | | $2,939,693,789 |
| Cash | | 8 |
| Receivable for investments sold | | 10,527,450 |
| Receivable for fund shares sold | | 2,598,779 |
| Total assets | | 2,952,820,026 |
| Liabilities | | |
| Payable for investments purchased | $5,731,547 | |
| Payable for fund shares redeemed | 7,392,451 | |
| Distribution and service plan fees payable | 577,236 | |
| Total liabilities | | 13,701,234 |
| Net Assets | | $2,939,118,792 |
| Net Assets consist of: | | |
| Paid in capital | | $2,622,922,604 |
| Undistributed net investment income | | 11,426,250 |
| Accumulated undistributed net realized gain (loss) on investments | | (1,244,131) |
| Net unrealized appreciation (depreciation) on investments | | 306,014,069 |
| Net Assets | | $2,939,118,792 |
| Calculation of Maximum Offering Price | | |
| Class A: | | |
| Net Asset Value and redemption price per share ($1,546,444,912 ÷ 121,608,794 shares) | | $12.72 |
| Maximum offering price per share (100/94.25 of $12.72) | | $13.50 |
| Class T: | | |
| Net Asset Value and redemption price per share ($417,416,696 ÷ 32,785,671 shares) | | $12.73 |
| Maximum offering price per share (100/96.50 of $12.73) | | $13.19 |
| Class C: | | |
| Net Asset Value and offering price per share ($98,047,474 ÷ 7,828,346 shares)(a) | | $12.52 |
| Class I: | | |
| Net Asset Value, offering price and redemption price per share ($877,209,710 ÷ 68,354,212 shares) | | $12.83 |
(a) Redemption price per share is equal to net asset value less any applicable contingent deferred sales charge.
See accompanying notes which are an integral part of the financial statements.
Statement of Operations
| | | Six months ended September 30, 2016 (Unaudited) |
| Investment Income | | |
| Income distributions from underlying funds | | $15,299,610 |
| Expenses | | |
| Distribution and service plan fees | $3,446,431 | |
| Independent trustees' fees and expenses | 6,603 | |
| Total expenses before reductions | 3,453,034 | |
| Expense reductions | (6,603) | 3,446,431 |
| Net investment income (loss) | | 11,853,179 |
| Realized and Unrealized Gain (Loss) | | |
| Realized gain (loss) on sale of underlying fund shares | 8,696,990 | |
| Capital gain distributions from underlying funds | 1,252,355 | |
| Total net realized gain (loss) | | 9,949,345 |
| Change in net unrealized appreciation (depreciation) on underlying funds | | 158,894,332 |
| Net gain (loss) | | 168,843,677 |
| Net increase (decrease) in net assets resulting from operations | | $180,696,856 |
See accompanying notes which are an integral part of the financial statements.
Statement of Changes in Net Assets
| | Six months ended September 30, 2016 (Unaudited) | Year ended March 31, 2016 |
| Increase (Decrease) in Net Assets | | |
| Operations | | |
| Net investment income (loss) | $11,853,179 | $46,639,333 |
| Net realized gain (loss) | 9,949,345 | 107,137,381 |
| Change in net unrealized appreciation (depreciation) | 158,894,332 | (237,602,638) |
| Net increase (decrease) in net assets resulting from operations | 180,696,856 | (83,825,924) |
| Distributions to shareholders from net investment income | (3,913,722) | (46,581,381) |
| Distributions to shareholders from net realized gain | (74,038,538) | (99,971,356) |
| Total distributions | (77,952,260) | (146,552,737) |
| Share transactions - net increase (decrease) | (75,162,664) | (61,140,430) |
| Total increase (decrease) in net assets | 27,581,932 | (291,519,091) |
| Net Assets | | |
| Beginning of period | 2,911,536,860 | 3,203,055,951 |
| End of period | $2,939,118,792 | $2,911,536,860 |
| Other Information | | |
| Undistributed net investment income end of period | $11,426,250 | $3,486,793 |
See accompanying notes which are an integral part of the financial statements.
Financial Highlights — Fidelity Advisor Freedom 2025 Fund Class A
| | Six months ended (Unaudited) September 30, | Years ended March 31, | | | | |
| | 2016 | 2016 | 2015 | 2014 | 2013 | 2012 |
| Selected Per–Share Data | | | | | | |
| Net asset value, beginning of period | $12.29 | $13.25 | $13.33 | $12.72 | $11.91 | $12.09 |
| Income from Investment Operations | | | | | | |
| Net investment income (loss)A | .05 | .19 | .21 | .16 | .18 | .18 |
| Net realized and unrealized gain (loss) | .71 | (.54) | .60 | 1.26 | .88 | (.01) |
| Total from investment operations | .76 | (.35) | .81 | 1.42 | 1.06 | .17 |
| Distributions from net investment income | (.02) | (.20) | (.22) | (.16) | (.18) | (.17) |
| Distributions from net realized gain | (.31) | (.42) | (.67) | (.66) | (.07) | (.18) |
| Total distributions | (.33) | (.61)B | (.89) | (.81)C | (.25) | (.35) |
| Net asset value, end of period | $12.72 | $12.29 | $13.25 | $13.33 | $12.72 | $11.91 |
| Total ReturnD,E,F | 6.35% | (2.72)% | 6.26% | 11.54% | 9.00% | 1.61% |
| Ratios to Average Net AssetsG,H | | | | | | |
| Expenses before reductions | .25%I | .25% | .25% | .25% | .25% | .25% |
| Expenses net of fee waivers, if any | .25%I | .25% | .25% | .25% | .25% | .25% |
| Expenses net of all reductions | .25%I | .25% | .25% | .25% | .25% | .25% |
| Net investment income (loss) | .79%I | 1.53% | 1.55% | 1.25% | 1.54% | 1.56% |
| Supplemental Data | | | | | | |
| Net assets, end of period (000 omitted) | $1,546,445 | $1,543,665 | $1,853,121 | $1,907,797 | $1,806,028 | $1,539,333 |
| Portfolio turnover rateG | 20%I | 24% | 23% | 41% | 22% | 14% |
A Calculated based on average shares outstanding during the period.
B Total distributions of $.61 per share is comprised of distributions from net investment income of $.195 and distributions from net realized gain of $.419 per share.
C Total distributions of $.81 per share is comprised of distributions from net investment income of $.157 and distributions from net realized gain of $.657 per share.
D Total returns for periods of less than one year are not annualized.
E Total returns would have been lower if certain expenses had not been reduced during the applicable periods shown.
F Total returns do not include the effect of the sales charges.
G Amounts do not include the activity of the Underlying Funds.
H Expense ratios reflect operating expenses of the class. Expenses before reductions do not reflect amounts reimbursed by the investment adviser or reductions from expense offset arrangements and do not represent the amount paid by the class during periods when reimbursements or reductions occur. Expenses net of fee waivers reflect expenses after reimbursement by the investment adviser but prior to reductions from expense offset arrangements. Expenses net of all reductions represent the net expenses paid by the class but do not include expenses of the underlying funds in which the Fund invests.
I Annualized
See accompanying notes which are an integral part of the financial statements.
Financial Highlights — Fidelity Advisor Freedom 2025 Fund Class T
| | Six months ended (Unaudited) September 30, | Years ended March 31, | | | | |
| | 2016 | 2016 | 2015 | 2014 | 2013 | 2012 |
| Selected Per–Share Data | | | | | | |
| Net asset value, beginning of period | $12.31 | $13.27 | $13.35 | $12.74 | $11.93 | $12.11 |
| Income from Investment Operations | | | | | | |
| Net investment income (loss)A | .03 | .16 | .17 | .13 | .15 | .15 |
| Net realized and unrealized gain (loss) | .71 | (.54) | .61 | 1.26 | .88 | (.01) |
| Total from investment operations | .74 | (.38) | .78 | 1.39 | 1.03 | .14 |
| Distributions from net investment income | (.01) | (.16) | (.19) | (.13) | (.15) | (.14) |
| Distributions from net realized gain | (.31) | (.42) | (.67) | (.66) | (.07) | (.18) |
| Total distributions | (.32) | (.58) | (.86) | (.78)B | (.22) | (.32) |
| Net asset value, end of period | $12.73 | $12.31 | $13.27 | $13.35 | $12.74 | $11.93 |
| Total ReturnC,D,E | 6.20% | (2.95)% | 6.00% | 11.27% | 8.74% | 1.33% |
| Ratios to Average Net AssetsF,G | | | | | | |
| Expenses before reductions | .50%H | .50% | .50% | .50% | .50% | .50% |
| Expenses net of fee waivers, if any | .50%H | .50% | .50% | .50% | .50% | .50% |
| Expenses net of all reductions | .50%H | .50% | .50% | .50% | .50% | .50% |
| Net investment income (loss) | .54%H | 1.28% | 1.30% | 1.00% | 1.29% | 1.31% |
| Supplemental Data | | | | | | |
| Net assets, end of period (000 omitted) | $417,417 | $399,088 | $405,224 | $387,919 | $324,352 | $257,594 |
| Portfolio turnover rateF | 20%H | 24% | 23% | 41% | 22% | 14% |
A Calculated based on average shares outstanding during the period.
B Total distributions of $.78 per share is comprised of distributions from net investment income of $.127 and distributions from net realized gain of $.657 per share.
C Total returns for periods of less than one year are not annualized.
D Total returns would have been lower if certain expenses had not been reduced during the applicable periods shown.
E Total returns do not include the effect of the sales charges.
F Amounts do not include the activity of the Underlying Funds.
G Expense ratios reflect operating expenses of the class. Expenses before reductions do not reflect amounts reimbursed by the investment adviser or reductions from expense offset arrangements and do not represent the amount paid by the class during periods when reimbursements or reductions occur. Expenses net of fee waivers reflect expenses after reimbursement by the investment adviser but prior to reductions from expense offset arrangements. Expenses net of all reductions represent the net expenses paid by the class but do not include expenses of the underlying funds in which the Fund invests.
H Annualized
See accompanying notes which are an integral part of the financial statements.
Financial Highlights — Fidelity Advisor Freedom 2025 Fund Class C
| | Six months ended (Unaudited) September 30, | Years ended March 31, | | | | |
| | 2016 | 2016 | 2015 | 2014 | 2013 | 2012 |
| Selected Per–Share Data | | | | | | |
| Net asset value, beginning of period | $12.14 | $13.09 | $13.19 | $12.60 | $11.80 | $11.98 |
| Income from Investment Operations | | | | | | |
| Net investment income (loss)A | – | .10 | .11 | .06 | .09 | .09 |
| Net realized and unrealized gain (loss) | .69 | (.53) | .59 | 1.25 | .87 | (.01) |
| Total from investment operations | .69 | (.43) | .70 | 1.31 | .96 | .08 |
| Distributions from net investment income | – | (.11) | (.12) | (.07) | (.10) | (.09) |
| Distributions from net realized gain | (.31) | (.41) | (.67) | (.65) | (.07) | (.17) |
| Total distributions | (.31) | (.52) | (.80)B | (.72) | (.16)C | (.26) |
| Net asset value, end of period | $12.52 | $12.14 | $13.09 | $13.19 | $12.60 | $11.80 |
| Total ReturnD,E,F | 5.87% | (3.40)% | 5.42% | 10.71% | 8.23% | .86% |
| Ratios to Average Net AssetsG,H | | | | | | |
| Expenses before reductions | 1.00%I | 1.00% | 1.00% | 1.00% | 1.00% | 1.00% |
| Expenses net of fee waivers, if any | 1.00%I | 1.00% | 1.00% | 1.00% | 1.00% | 1.00% |
| Expenses net of all reductions | 1.00%I | 1.00% | 1.00% | 1.00% | 1.00% | 1.00% |
| Net investment income (loss) | .04%I | .78% | .80% | .50% | .79% | .81% |
| Supplemental Data | | | | | | |
| Net assets, end of period (000 omitted) | $98,047 | $91,941 | $94,878 | $89,402 | $74,415 | $66,126 |
| Portfolio turnover rateG | 20%I | 24% | 23% | 41% | 22% | 14% |
A Calculated based on average shares outstanding during the period.
B Total distributions of $.80 per share is comprised of distributions from net investment income of $.124 and distributions from net realized gain of $.672 per share.
C Total distributions of $.16 per share is comprised of distributions from net investment income of $.096 and distributions from net realized gain of $.066 per share.
D Total returns for periods of less than one year are not annualized.
E Total returns would have been lower if certain expenses had not been reduced during the applicable periods shown.
F Total returns do not include the effect of the contingent deferred sales charge.
G Amounts do not include the activity of the Underlying Funds.
H Expense ratios reflect operating expenses of the class. Expenses before reductions do not reflect amounts reimbursed by the investment adviser or reductions from expense offset arrangements and do not represent the amount paid by the class during periods when reimbursements or reductions occur. Expenses net of fee waivers reflect expenses after reimbursement by the investment adviser but prior to reductions from expense offset arrangements. Expenses net of all reductions represent the net expenses paid by the class but do not include expenses of the underlying funds in which the Fund invests.
I Annualized
See accompanying notes which are an integral part of the financial statements.
Financial Highlights — Fidelity Advisor Freedom 2025 Fund Class I
| | Six months ended (Unaudited) September 30, | Years ended March 31, | | | | |
| | 2016 | 2016 | 2015 | 2014 | 2013 | 2012 |
| Selected Per–Share Data | | | | | | |
| Net asset value, beginning of period | $12.39 | $13.35 | $13.43 | $12.81 | $11.99 | $12.17 |
| Income from Investment Operations | | | | | | |
| Net investment income (loss)A | .07 | .23 | .24 | .19 | .22 | .21 |
| Net realized and unrealized gain (loss) | .71 | (.54) | .60 | 1.28 | .88 | (.02) |
| Total from investment operations | .78 | (.31) | .84 | 1.47 | 1.10 | .19 |
| Distributions from net investment income | (.02) | (.23) | (.25) | (.19) | (.21) | (.20) |
| Distributions from net realized gain | (.31) | (.42) | (.67) | (.66) | (.07) | (.18) |
| Total distributions | (.34)B | (.65) | (.92) | (.85) | (.28) | (.37)C |
| Net asset value, end of period | $12.83 | $12.39 | $13.35 | $13.43 | $12.81 | $11.99 |
| Total ReturnD,E | 6.44% | (2.44)% | 6.48% | 11.81% | 9.29% | 1.84% |
| Ratios to Average Net AssetsF,G | | | | | | |
| Expenses before reductionsH | -%I | -% | -% | -% | -% | -% |
| Expenses net of fee waivers, if any | -%I | -% | -% | -% | -% | -% |
| Expenses net of all reductions | -%I | -% | -% | -% | -% | -% |
| Net investment income (loss) | 1.04%I | 1.78% | 1.80% | 1.50% | 1.79% | 1.81% |
| Supplemental Data | | | | | | |
| Net assets, end of period (000 omitted) | $877,210 | $870,772 | $838,616 | $846,372 | $686,540 | $470,704 |
| Portfolio turnover rateF | 20%I | 24% | 23% | 41% | 22% | 14% |
A Calculated based on average shares outstanding during the period.
B Total distributions of $.34 per share is comprised of distributions from net investment income of $.023 and distributions from net realized gain of $.314 per share.
C Total distributions of $.37 per share is comprised of distributions from net investment income of $.195 and distributions from net realized gain of $.179 per share.
D Total returns for periods of less than one year are not annualized.
E Total returns would have been lower if certain expenses had not been reduced during the applicable periods shown.
F Amounts do not include the activity of the Underlying Funds.
G Expense ratios reflect operating expenses of the class. Expenses before reductions do not reflect amounts reimbursed by the investment adviser or reductions from expense offset arrangements and do not represent the amount paid by the class during periods when reimbursements or reductions occur. Expenses net of fee waivers reflect expenses after reimbursement by the investment adviser but prior to reductions from expense offset arrangements. Expenses net of all reductions represent the net expenses paid by the class but do not include expenses of the underlying funds in which the Fund invests.
H Amount represents less than .005%.
I Annualized
See accompanying notes which are an integral part of the financial statements.
Fidelity Advisor Freedom® 2030 Fund
Investment Summary (Unaudited)
The information in the following tables is based on the direct investments of the Fund.
Top Holdings as of September 30, 2016
| | % of fund's net assets | % of fund's net assets 6 months ago |
| Fidelity Advisor Series Equity-Income Fund | 10.5 | 10.4 |
| Fidelity Series Investment Grade Bond Fund | 10.4 | 9.6 |
| Fidelity Series Emerging Markets Fund | 9.3 | 8.8 |
| Fidelity Series International Value Fund | 8.2 | 8.0 |
| Fidelity Series International Growth Fund | 8.2 | 8.1 |
| Fidelity Advisor Series Growth & Income Fund | 7.3 | 7.2 |
| Fidelity Advisor Series Stock Selector Large Cap Value Fund | 7.0 | 6.9 |
| Fidelity Advisor Series Equity Growth Fund | 5.8 | 5.7 |
| Fidelity Advisor Series Opportunistic Insights Fund | 5.4 | 5.3 |
| Fidelity Series All-Sector Equity Fund | 4.2 | 6.9 |
| | 76.3 | 76.9 |
Asset Allocation (% of fund's net assets)
| Period end |
| | Domestic Equity Funds | 56.9% |
| | International Equity Funds | 27.6% |
| | Bond Funds | 15.5% |

| Six months ago |
| | Domestic Equity Funds | 58.7% |
| | International Equity Funds | 26.8% |
| | Bond Funds | 14.5% |

Domestic Equity Funds category includes Fidelity Series Commodity Strategy Fund which invests in commodity-related investments.
Fidelity Advisor Freedom® 2030 Fund
Investments September 30, 2016 (Unaudited)
Showing Percentage of Net Assets
| Domestic Equity Funds - 56.9% | | | |
| | | Shares | Value |
| Fidelity Advisor Series Equity Growth Fund (a) | | 14,362,798 | $164,597,667 |
| Fidelity Advisor Series Equity-Income Fund (a) | | 23,952,080 | 296,047,707 |
| Fidelity Advisor Series Growth & Income Fund (a) | | 15,499,138 | 205,208,586 |
| Fidelity Advisor Series Growth Opportunities Fund (a) | | 9,961,433 | 108,380,386 |
| Fidelity Advisor Series Opportunistic Insights Fund (a) | | 10,031,317 | 153,780,089 |
| Fidelity Advisor Series Small Cap Fund (a) | | 7,739,643 | 82,040,218 |
| Fidelity Advisor Series Stock Selector Large Cap Value Fund (a) | | 16,515,816 | 197,033,684 |
| Fidelity Series 100 Index Fund (a) | | 5,947,785 | 84,934,376 |
| Fidelity Series 1000 Value Index Fund (a) | | 2,885,930 | 32,235,833 |
| Fidelity Series All-Sector Equity Fund (a) | | 8,922,840 | 119,833,745 |
| Fidelity Series Commodity Strategy Fund (a)(b) | | 8,744,387 | 46,257,806 |
| Fidelity Series Real Estate Equity Fund (a) | | 1,393,768 | 19,192,192 |
| Fidelity Series Small Cap Opportunities Fund (a) | | 7,600,972 | 99,952,780 |
| TOTAL DOMESTIC EQUITY FUNDS | | | |
| (Cost $1,382,168,969) | | | 1,609,495,069 |
|
| International Equity Funds - 27.6% | | | |
| Fidelity Series Emerging Markets Fund (a) | | 15,726,599 | 264,521,395 |
| Fidelity Series International Growth Fund (a) | | 16,565,935 | 231,923,096 |
| Fidelity Series International Small Cap Fund (a) | | 3,422,350 | 53,285,983 |
| Fidelity Series International Value Fund (a) | | 24,562,701 | 232,854,402 |
| TOTAL INTERNATIONAL EQUITY FUNDS | | | |
| (Cost $692,727,405) | | | 782,584,876 |
|
| Bond Funds - 15.5% | | | |
| Fidelity Series Emerging Markets Debt Fund (a) | | 1,852,460 | 19,191,481 |
| Fidelity Series Floating Rate High Income Fund (a) | | 757,448 | 7,135,163 |
| Fidelity Series High Income Fund (a) | | 9,208,612 | 86,192,610 |
| Fidelity Series Inflation-Protected Bond Index Fund (a) | | 1,510,360 | 15,209,330 |
| Fidelity Series Investment Grade Bond Fund (a) | | 25,469,258 | 295,443,389 |
| Fidelity Series Long-Term Treasury Bond Index Fund (a) | | 29,524 | 284,905 |
| Fidelity Series Real Estate Income Fund (a) | | 1,285,834 | 14,427,063 |
| TOTAL BOND FUNDS | | | |
| (Cost $430,448,291) | | | 437,883,941 |
|
| Short-Term Funds - 0.0% | | | |
| Fidelity Advisor Series Short-Term Credit Fund (a) | | 46,399 | 465,846 |
| Fidelity Series Government Money Market Fund 0.29% (a)(c) | | 866,321 | 866,321 |
| TOTAL SHORT-TERM FUNDS | | | |
| (Cost $1,328,654) | | | 1,332,167 |
| TOTAL INVESTMENT PORTFOLIO - 100.0% | | | |
| (Cost $2,506,673,319) | | | 2,831,296,053 |
| NET OTHER ASSETS (LIABILITIES) - 0.0% | | | (557,563) |
| NET ASSETS - 100% | | | $2,830,738,490 |
Legend
(a) Affiliated Fund
(b) Non-income producing
(c) The rate quoted is the annualized seven-day yield of the fund at period end.
Affiliated Underlying Funds
Information regarding the Fund's fiscal year to date purchases and sales of the affiliated Underlying Funds and income earned by the Fund from investments in affiliated Underlying Funds is as follows:
| Affiliate | Value, beginning of period | Purchases | Sales Proceeds | Dividend Income | Value, end of period |
| Fidelity Advisor Series Equity Growth Fund | $160,167,630 | $10,366,330 | $16,986,917 | - | $164,597,667 |
| Fidelity Advisor Series Equity-Income Fund | 289,044,495 | 19,374,629 | 33,565,558 | 2,776,120 | 296,047,707 |
| Fidelity Advisor Series Growth & Income Fund | 199,691,420 | 10,334,808 | 19,932,024 | 1,599,663 | 205,208,586 |
| Fidelity Advisor Series Growth Opportunities Fund | 105,499,133 | 5,908,164 | 9,105,880 | - | 108,380,386 |
| Fidelity Advisor Series Opportunistic Insights Fund | 148,649,058 | 11,078,496 | 15,088,322 | - | 153,780,089 |
| Fidelity Advisor Series Short-Term Credit Fund | 488,102 | 28,906 | 53,118 | 2,517 | 465,846 |
| Fidelity Advisor Series Small Cap Fund | 79,945,409 | 5,557,284 | 7,461,305 | - | 82,040,218 |
| Fidelity Advisor Series Stock Selector Large Cap Value Fund | 192,201,930 | 13,869,089 | 21,569,842 | - | 197,033,684 |
| Fidelity Investments Money Market Portfolio Institutional Class 0.59% | 903,894 | 5,074 | 908,968 | 440 | - |
| Fidelity Series 100 Index Fund | 87,247,727 | 2,559,921 | 10,062,331 | - | 84,934,376 |
| Fidelity Series 1000 Value Index Fund | 32,008,863 | 1,281,690 | 3,560,643 | - | 32,235,833 |
| Fidelity Series All-Sector Equity Fund | 191,983,304 | 3,830,283 | 88,197,581 | - | 119,833,745 |
| Fidelity Series Commodity Strategy Fund | 35,115,001 | 11,487,338 | 3,241,442 | - | 46,257,806 |
| Fidelity Series Emerging Markets Debt Fund | 17,985,957 | 931,099 | 1,354,804 | 514,198 | 19,191,481 |
| Fidelity Series Emerging Markets Fund | 245,258,717 | 6,156,035 | 17,852,970 | - | 264,521,395 |
| Fidelity Series Floating Rate High Income Fund | 7,025,796 | 325,915 | 557,383 | 155,775 | 7,135,163 |
| Fidelity Series Government Money Market Fund 0.29% | - | 939,099 | 72,778 | 839 | 866,321 |
| Fidelity Series High Income Fund | 83,614,598 | 2,436,538 | 6,379,624 | 2,392,433 | 86,192,610 |
| Fidelity Series Inflation-Protected Bond Index Fund | 14,442,236 | 1,722,295 | 1,232,278 | 6,221 | 15,209,330 |
| Fidelity Series International Growth Fund | 225,481,971 | 15,944,610 | 21,011,368 | - | 231,923,096 |
| Fidelity Series International Small Cap Fund | 53,186,989 | 4,464,618 | 6,371,295 | - | 53,285,983 |
| Fidelity Series International Value Fund | 222,218,496 | 22,680,658 | 20,959,491 | - | 232,854,402 |
| Fidelity Series Investment Grade Bond Fund | 266,769,854 | 42,538,960 | 21,047,431 | 3,438,166 | 295,443,389 |
| Fidelity Series Long-Term Treasury Bond Index Fund | - | 309,770 | 14,382 | 1,242 | 284,905 |
| Fidelity Series Real Estate Equity Fund | 20,044,910 | 2,350,741 | 2,824,613 | 174,302 | 19,192,192 |
| Fidelity Series Real Estate Income Fund | 14,201,521 | 1,221,848 | 1,444,204 | 356,203 | 14,427,063 |
| Fidelity Series Small Cap Opportunities Fund | 96,486,755 | 5,454,215 | 10,181,817 | 243,204 | 99,952,780 |
| Total | $2,789,663,766 | $203,158,413 | $341,038,369 | $11,661,323 | $2,831,296,053 |
Investment Valuation
All investments are categorized as Level 1 under the Fair Value Hierarchy. The inputs or methodology used for valuing securities may not be an indication of the risk associated with investing in those securities. For more information on valuation inputs please refer to the Investment Valuation section in the accompanying Notes to Financial Statements.
See accompanying notes which are an integral part of the financial statements.
Fidelity Advisor Freedom® 2030 Fund
Financial Statements
Statement of Assets and Liabilities
| | | September 30, 2016 (Unaudited) |
| Assets | | |
| Investment in securities, at value (cost $2,506,673,319) — See accompanying schedule | | $2,831,296,053 |
| Cash | | 5 |
| Receivable for investments sold | | 9,799,289 |
| Receivable for fund shares sold | | 2,491,534 |
| Receivable from investment adviser for expense reductions | | 39 |
| Total assets | | 2,843,586,920 |
| Liabilities | | |
| Payable for investments purchased | $5,837,187 | |
| Payable for fund shares redeemed | 6,451,822 | |
| Distribution and service plan fees payable | 559,421 | |
| Total liabilities | | 12,848,430 |
| Net Assets | | $2,830,738,490 |
| Net Assets consist of: | | |
| Paid in capital | | $2,504,735,487 |
| Undistributed net investment income | | 8,168,159 |
| Accumulated undistributed net realized gain (loss) on investments | | (6,787,890) |
| Net unrealized appreciation (depreciation) on investments | | 324,622,734 |
| Net Assets | | $2,830,738,490 |
| Calculation of Maximum Offering Price | | |
| Class A: | | |
| Net Asset Value and redemption price per share ($1,427,099,356 ÷ 106,045,411 shares) | | $13.46 |
| Maximum offering price per share (100/94.25 of $13.46) | | $14.28 |
| Class T: | | |
| Net Asset Value and redemption price per share ($443,538,428 ÷ 33,118,967 shares) | | $13.39 |
| Maximum offering price per share (100/96.50 of $13.39) | | $13.88 |
| Class C: | | |
| Net Asset Value and offering price per share ($94,229,028 ÷ 7,115,765 shares)(a) | | $13.24 |
| Class I: | | |
| Net Asset Value, offering price and redemption price per share ($865,871,678 ÷ 63,933,308 shares) | | $13.54 |
(a) Redemption price per share is equal to net asset value less any applicable contingent deferred sales charge.
See accompanying notes which are an integral part of the financial statements.
Statement of Operations
| | | Six months ended September 30, 2016 (Unaudited) |
| Investment Income | | |
| Income distributions from underlying funds | | $11,661,323 |
| Expenses | | |
| Distribution and service plan fees | $3,327,428 | |
| Independent trustees' fees and expenses | 6,323 | |
| Total expenses before reductions | 3,333,751 | |
| Expense reductions | (6,323) | 3,327,428 |
| Net investment income (loss) | | 8,333,895 |
| Realized and Unrealized Gain (Loss) | | |
| Realized gain (loss) on sale of underlying fund shares | 8,044,389 | |
| Capital gain distributions from underlying funds | 1,420,906 | |
| Total net realized gain (loss) | | 9,465,295 |
| Change in net unrealized appreciation (depreciation) on underlying funds | | 171,467,841 |
| Net gain (loss) | | 180,933,136 |
| Net increase (decrease) in net assets resulting from operations | | $189,267,031 |
See accompanying notes which are an integral part of the financial statements.
Statement of Changes in Net Assets
| | Six months ended September 30, 2016 (Unaudited) | Year ended March 31, 2016 |
| Increase (Decrease) in Net Assets | | |
| Operations | | |
| Net investment income (loss) | $8,333,895 | $41,235,626 |
| Net realized gain (loss) | 9,465,295 | 113,952,023 |
| Change in net unrealized appreciation (depreciation) | 171,467,841 | (257,671,232) |
| Net increase (decrease) in net assets resulting from operations | 189,267,031 | (102,483,583) |
| Distributions to shareholders from net investment income | (1,238,858) | (41,389,842) |
| Distributions to shareholders from net realized gain | (85,836,450) | (109,557,266) |
| Total distributions | (87,075,308) | (150,947,108) |
| Share transactions - net increase (decrease) | (60,574,774) | (139,278,763) |
| Total increase (decrease) in net assets | 41,616,949 | (392,709,454) |
| Net Assets | | |
| Beginning of period | 2,789,121,541 | 3,181,830,995 |
| End of period | $2,830,738,490 | $2,789,121,541 |
| Other Information | | |
| Undistributed net investment income end of period | $8,168,159 | $1,073,122 |
See accompanying notes which are an integral part of the financial statements.
Financial Highlights — Fidelity Advisor Freedom 2030 Fund Class A
| | Six months ended (Unaudited) September 30, | Years ended March 31, | | | | |
| | 2016 | 2016 | 2015 | 2014 | 2013 | 2012 |
| Selected Per–Share Data | | | | | | |
| Net asset value, beginning of period | $12.99 | $14.13 | $14.15 | $13.36 | $12.48 | $12.72 |
| Income from Investment Operations | | | | | | |
| Net investment income (loss)A | .04 | .19 | .20 | .17 | .20 | .19 |
| Net realized and unrealized gain (loss) | .83 | (.64) | .70 | 1.47 | .94 | (.06) |
| Total from investment operations | .87 | (.45) | .90 | 1.64 | 1.14 | .13 |
| Distributions from net investment income | –B | (.19) | (.21) | (.18) | (.20) | (.18) |
| Distributions from net realized gain | (.40) | (.50) | (.71) | (.67) | (.06) | (.19) |
| Total distributions | (.40)C | (.69) | (.92) | (.85) | (.26) | (.37) |
| Net asset value, end of period | $13.46 | $12.99 | $14.13 | $14.15 | $13.36 | $12.48 |
| Total ReturnD,E,F | 6.94% | (3.36)% | 6.54% | 12.60% | 9.25% | 1.25% |
| Ratios to Average Net AssetsG,H | | | | | | |
| Expenses before reductions | .25%I | .25% | .25% | .25% | .25% | .25% |
| Expenses net of fee waivers, if any | .25%I | .25% | .25% | .25% | .25% | .25% |
| Expenses net of all reductions | .25%I | .25% | .25% | .25% | .25% | .25% |
| Net investment income (loss) | .58%I | 1.39% | 1.42% | 1.24% | 1.58% | 1.57% |
| Supplemental Data | | | | | | |
| Net assets, end of period (000 omitted) | $1,427,099 | $1,409,909 | $1,704,036 | $1,777,132 | $1,747,549 | $1,506,827 |
| Portfolio turnover rateG | 14%I | 22% | 24% | 53% | 23% | 16% |
A Calculated based on average shares outstanding during the period.
B Amount represents less than $.005 per share.
C Total distributions of $.40 per share is comprised of distributions from net investment income of $.004 and distributions from net realized gain of $.399 per share.
D Total returns for periods of less than one year are not annualized.
E Total returns would have been lower if certain expenses had not been reduced during the applicable periods shown.
F Total returns do not include the effect of the sales charges.
G Amounts do not include the activity of the Underlying Funds.
H Expense ratios reflect operating expenses of the class. Expenses before reductions do not reflect amounts reimbursed by the investment adviser or reductions from expense offset arrangements and do not represent the amount paid by the class during periods when reimbursements or reductions occur. Expenses net of fee waivers reflect expenses after reimbursement by the investment adviser but prior to reductions from expense offset arrangements. Expenses net of all reductions represent the net expenses paid by the class but do not include expenses of the underlying funds in which the Fund invests.
I Annualized
See accompanying notes which are an integral part of the financial statements.
Financial Highlights — Fidelity Advisor Freedom 2030 Fund Class T
| | Six months ended (Unaudited) September 30, | Years ended March 31, | | | | |
| | 2016 | 2016 | 2015 | 2014 | 2013 | 2012 |
| Selected Per–Share Data | | | | | | |
| Net asset value, beginning of period | $12.94 | $14.09 | $14.10 | $13.32 | $12.44 | $12.68 |
| Income from Investment Operations | | | | | | |
| Net investment income (loss)A | .02 | .15 | .17 | .14 | .17 | .16 |
| Net realized and unrealized gain (loss) | .83 | (.64) | .71 | 1.46 | .94 | (.06) |
| Total from investment operations | .85 | (.49) | .88 | 1.60 | 1.11 | .10 |
| Distributions from net investment income | – | (.16) | (.18) | (.15) | (.17) | (.15) |
| Distributions from net realized gain | (.40) | (.50) | (.71) | (.67) | (.06) | (.19) |
| Total distributions | (.40) | (.66) | (.89) | (.82) | (.23) | (.34) |
| Net asset value, end of period | $13.39 | $12.94 | $14.09 | $14.10 | $13.32 | $12.44 |
| Total ReturnB,C,D | 6.78% | (3.67)% | 6.37% | 12.29% | 9.02% | .98% |
| Ratios to Average Net AssetsE,F | | | | | | |
| Expenses before reductions | .50%G | .50% | .50% | .50% | .50% | .50% |
| Expenses net of fee waivers, if any | .50%G | .50% | .50% | .50% | .50% | .50% |
| Expenses net of all reductions | .50%G | .50% | .50% | .50% | .50% | .50% |
| Net investment income (loss) | .33%G | 1.14% | 1.17% | .99% | 1.33% | 1.32% |
| Supplemental Data | | | | | | |
| Net assets, end of period (000 omitted) | $443,538 | $423,312 | $453,137 | $453,944 | $387,102 | $335,407 |
| Portfolio turnover rateE | 14%G | 22% | 24% | 53% | 23% | 16% |
A Calculated based on average shares outstanding during the period.
B Total returns for periods of less than one year are not annualized.
C Total returns would have been lower if certain expenses had not been reduced during the applicable periods shown.
D Total returns do not include the effect of the sales charges.
E Amounts do not include the activity of the Underlying Funds.
F Expense ratios reflect operating expenses of the class. Expenses before reductions do not reflect amounts reimbursed by the investment adviser or reductions from expense offset arrangements and do not represent the amount paid by the class during periods when reimbursements or reductions occur. Expenses net of fee waivers reflect expenses after reimbursement by the investment adviser but prior to reductions from expense offset arrangements. Expenses net of all reductions represent the net expenses paid by the class but do not include expenses of the underlying funds in which the Fund invests.
G Annualized
See accompanying notes which are an integral part of the financial statements.
See accompanying notes which are an integral part of the financial statements.
Financial Highlights — Fidelity Advisor Freedom 2030 Fund Class C
| | Six months ended (Unaudited) September 30, | Years ended March 31, | | | | |
| | 2016 | 2016 | 2015 | 2014 | 2013 | 2012 |
| Selected Per–Share Data | | | | | | |
| Net asset value, beginning of period | $12.83 | $13.97 | $14.00 | $13.23 | $12.37 | $12.60 |
| Income from Investment Operations | | | | | | |
| Net investment income (loss)A | (.01) | .08 | .09 | .07 | .10 | .10 |
| Net realized and unrealized gain (loss) | .82 | (.63) | .70 | 1.45 | .93 | (.05) |
| Total from investment operations | .81 | (.55) | .79 | 1.52 | 1.03 | .05 |
| Distributions from net investment income | – | (.11) | (.12) | (.09) | (.11) | (.09) |
| Distributions from net realized gain | (.40) | (.48) | (.70) | (.66) | (.06) | (.18) |
| Total distributions | (.40) | (.59) | (.82) | (.75) | (.17) | (.28)B |
| Net asset value, end of period | $13.24 | $12.83 | $13.97 | $14.00 | $13.23 | $12.37 |
| Total ReturnC,D,E | 6.52% | (4.10)% | 5.76% | 11.77% | 8.39% | .55% |
| Ratios to Average Net AssetsF,G | | | | | | |
| Expenses before reductions | 1.00%H | 1.00% | 1.00% | 1.00% | 1.00% | 1.00% |
| Expenses net of fee waivers, if any | 1.00%H | 1.00% | 1.00% | 1.00% | 1.00% | 1.00% |
| Expenses net of all reductions | 1.00%H | 1.00% | 1.00% | 1.00% | 1.00% | 1.00% |
| Net investment income (loss) | (.17)%H | .64% | .67% | .49% | .83% | .82% |
| Supplemental Data | | | | | | |
| Net assets, end of period (000 omitted) | $94,229 | $87,691 | $91,154 | $87,867 | $75,384 | $66,418 |
| Portfolio turnover rateF | 14%H | 22% | 24% | 53% | 23% | 16% |
A Calculated based on average shares outstanding during the period.
B Total distributions of $.28 per share is comprised of distributions from net investment income of $.094 and distributions from net realized gain of $.182 per share.
C Total returns for periods of less than one year are not annualized.
D Total returns would have been lower if certain expenses had not been reduced during the applicable periods shown.
E Total returns do not include the effect of the contingent deferred sales charge.
F Amounts do not include the activity of the Underlying Funds.
G Expense ratios reflect operating expenses of the class. Expenses before reductions do not reflect amounts reimbursed by the investment adviser or reductions from expense offset arrangements and do not represent the amount paid by the class during periods when reimbursements or reductions occur. Expenses net of fee waivers reflect expenses after reimbursement by the investment adviser but prior to reductions from expense offset arrangements. Expenses net of all reductions represent the net expenses paid by the class but do not include expenses of the underlying funds in which the Fund invests.
H Annualized
See accompanying notes which are an integral part of the financial statements.
Financial Highlights — Fidelity Advisor Freedom 2030 Fund Class I
| | Six months ended (Unaudited) September 30, | Years ended March 31, | | | | |
| | 2016 | 2016 | 2015 | 2014 | 2013 | 2012 |
| Selected Per–Share Data | | | | | | |
| Net asset value, beginning of period | $13.06 | $14.21 | $14.22 | $13.42 | $12.54 | $12.77 |
| Income from Investment Operations | | | | | | |
| Net investment income (loss)A | .05 | .22 | .24 | .20 | .23 | .22 |
| Net realized and unrealized gain (loss) | .84 | (.65) | .71 | 1.48 | .94 | (.05) |
| Total from investment operations | .89 | (.43) | .95 | 1.68 | 1.17 | .17 |
| Distributions from net investment income | (.01) | (.23) | (.25) | (.21) | (.23) | (.21) |
| Distributions from net realized gain | (.40) | (.50) | (.71) | (.67) | (.06) | (.19) |
| Total distributions | (.41) | (.72)B | (.96) | (.88) | (.29) | (.40) |
| Net asset value, end of period | $13.54 | $13.06 | $14.21 | $14.22 | $13.42 | $12.54 |
| Total ReturnC,D | 7.05% | (3.16)% | 6.85% | 12.89% | 9.47% | 1.57% |
| Ratios to Average Net AssetsE,F | | | | | | |
| Expenses before reductionsG | -%H | -% | -% | -% | -% | -% |
| Expenses net of fee waivers, if any | -%H | -% | -% | -% | -% | -% |
| Expenses net of all reductions | -%H | -% | -% | -% | -% | -% |
| Net investment income (loss) | .83%H | 1.64% | 1.67% | 1.49% | 1.83% | 1.82% |
| Supplemental Data | | | | | | |
| Net assets, end of period (000 omitted) | $865,872 | $861,408 | $919,561 | $897,398 | $716,715 | $505,761 |
| Portfolio turnover rateE | 14%H | 22% | 24% | 53% | 23% | 16% |
A Calculated based on average shares outstanding during the period.
B Total distributions of $.72 per share is comprised of distributions from net investment income of $.225 and distributions from net realized gain of $.499 per share.
C Total returns for periods of less than one year are not annualized.
D Total returns would have been lower if certain expenses had not been reduced during the applicable periods shown.
E Amounts do not include the activity of the Underlying Funds.
F Expense ratios reflect operating expenses of the class. Expenses before reductions do not reflect amounts reimbursed by the investment adviser or reductions from expense offset arrangements and do not represent the amount paid by the class during periods when reimbursements or reductions occur. Expenses net of fee waivers reflect expenses after reimbursement by the investment adviser but prior to reductions from expense offset arrangements. Expenses net of all reductions represent the net expenses paid by the class but do not include expenses of the underlying funds in which the Fund invests.
G Amount represents less than .005%.
H Annualized
See accompanying notes which are an integral part of the financial statements.
Fidelity Advisor Freedom® 2035 Fund
Investment Summary (Unaudited)
The information in the following tables is based on the direct investments of the Fund.
Top Holdings as of September 30, 2016
| | % of fund's net assets | % of fund's net assets 6 months ago |
| Fidelity Advisor Series Equity-Income Fund | 11.8 | 11.5 |
| Fidelity Series Emerging Markets Fund | 10.0 | 9.4 |
| Fidelity Series International Value Fund | 9.3 | 8.9 |
| Fidelity Series International Growth Fund | 9.3 | 9.0 |
| Fidelity Advisor Series Growth & Income Fund | 8.2 | 7.9 |
| Fidelity Advisor Series Stock Selector Large Cap Value Fund | 7.9 | 7.7 |
| Fidelity Advisor Series Equity Growth Fund | 6.6 | 6.4 |
| Fidelity Advisor Series Opportunistic Insights Fund | 6.1 | 5.9 |
| Fidelity Series All-Sector Equity Fund | 4.6 | 7.6 |
| Fidelity Advisor Series Growth Opportunities Fund | 4.3 | 4.2 |
| | 78.1 | 78.5 |
Asset Allocation (% of fund's net assets)
| Period end |
| | Domestic Equity Funds | 63.8% |
| | International Equity Funds | 30.7% |
| | Bond Funds | 5.5% |

| Six months ago |
| | Domestic Equity Funds | 65.1% |
| | International Equity Funds | 29.4% |
| | Bond Funds | 5.4% |
| | Short-Term Funds | 0.1% |

Domestic Equity Funds category includes Fidelity Series Commodity Strategy Fund which invests in commodity-related investments.
Fidelity Advisor Freedom® 2035 Fund
Investments September 30, 2016 (Unaudited)
Showing Percentage of Net Assets
| Domestic Equity Funds - 63.8% | | | |
| | | Shares | Value |
| Fidelity Advisor Series Equity Growth Fund (a) | | 12,562,302 | $143,963,983 |
| Fidelity Advisor Series Equity-Income Fund (a) | | 20,930,229 | 258,697,625 |
| Fidelity Advisor Series Growth & Income Fund (a) | | 13,556,403 | 179,486,775 |
| Fidelity Advisor Series Growth Opportunities Fund (a) | | 8,730,784 | 94,990,933 |
| Fidelity Advisor Series Opportunistic Insights Fund (a) | | 8,774,562 | 134,514,034 |
| Fidelity Advisor Series Small Cap Fund (a) | | 6,800,219 | 72,082,319 |
| Fidelity Advisor Series Stock Selector Large Cap Value Fund (a) | | 14,447,132 | 172,354,280 |
| Fidelity Series 100 Index Fund (a) | | 5,186,738 | 74,066,623 |
| Fidelity Series 1000 Value Index Fund (a) | | 2,456,947 | 27,444,101 |
| Fidelity Series All-Sector Equity Fund (a) | | 7,589,975 | 101,933,359 |
| Fidelity Series Commodity Strategy Fund (a)(b) | | 6,782,488 | 35,879,363 |
| Fidelity Series Real Estate Equity Fund (a) | | 1,194,771 | 16,451,994 |
| Fidelity Series Small Cap Opportunities Fund (a) | | 6,625,909 | 87,130,705 |
| TOTAL DOMESTIC EQUITY FUNDS | | | |
| (Cost $1,209,549,392) | | | 1,398,996,094 |
|
| International Equity Funds - 30.7% | | | |
| Fidelity Series Emerging Markets Fund (a) | | 13,033,231 | 219,218,946 |
| Fidelity Series International Growth Fund (a) | | 14,471,365 | 202,599,110 |
| Fidelity Series International Small Cap Fund (a) | | 2,989,423 | 46,545,318 |
| Fidelity Series International Value Fund (a) | | 21,456,192 | 203,404,696 |
| TOTAL INTERNATIONAL EQUITY FUNDS | | | |
| (Cost $600,350,072) | | | 671,768,070 |
|
| Bond Funds - 5.5% | | | |
| Fidelity Series Emerging Markets Debt Fund (a) | | 1,426,827 | 14,781,926 |
| Fidelity Series Floating Rate High Income Fund (a) | | 586,198 | 5,521,987 |
| Fidelity Series High Income Fund (a) | | 7,084,526 | 66,311,168 |
| Fidelity Series Inflation-Protected Bond Index Fund (a) | | 1,151,450 | 11,595,100 |
| Fidelity Series Investment Grade Bond Fund (a) | | 911,873 | 10,577,727 |
| Fidelity Series Long-Term Treasury Bond Index Fund (a) | | 1,171 | 11,305 |
| Fidelity Series Real Estate Income Fund (a) | | 999,316 | 11,212,327 |
| TOTAL BOND FUNDS | | | |
| (Cost $121,431,256) | | | 120,011,540 |
|
| Short-Term Funds - 0.0% | | | |
| Fidelity Advisor Series Short-Term Credit Fund (a) | | 35,818 | 359,611 |
| Fidelity Series Government Money Market Fund 0.29% (a)(c) | | 660,469 | 660,469 |
| TOTAL SHORT-TERM FUNDS | | | |
| (Cost $1,017,328) | | | 1,020,080 |
| TOTAL INVESTMENT PORTFOLIO - 100.0% | | | |
| (Cost $1,932,348,048) | | | 2,191,795,784 |
| NET OTHER ASSETS (LIABILITIES) - 0.0% | | | (417,487) |
| NET ASSETS - 100% | | | $2,191,378,297 |
Legend
(a) Affiliated Fund
(b) Non-income producing
(c) The rate quoted is the annualized seven-day yield of the fund at period end.
Affiliated Underlying Funds
Information regarding the Fund's fiscal year to date purchases and sales of the affiliated Underlying Funds and income earned by the Fund from investments in affiliated Underlying Funds is as follows:
| Affiliate | Value, beginning of period | Purchases | Sales Proceeds | Dividend Income | Value, end of period |
| Fidelity Advisor Series Equity Growth Fund | $136,452,426 | $11,926,847 | $13,903,933 | - | $143,963,983 |
| Fidelity Advisor Series Equity-Income Fund | 246,239,392 | 21,576,953 | 27,313,832 | 2,375,259 | 258,697,625 |
| Fidelity Advisor Series Growth & Income Fund | 170,120,907 | 12,658,932 | 16,295,544 | 1,369,356 | 179,486,775 |
| Fidelity Advisor Series Growth Opportunities Fund | 89,875,129 | 7,303,279 | 7,440,618 | - | 94,990,933 |
| Fidelity Advisor Series Opportunistic Insights Fund | 126,641,706 | 12,465,104 | 12,437,689 | - | 134,514,034 |
| Fidelity Advisor Series Short-Term Credit Fund | 373,538 | 27,486 | 42,916 | 1,934 | 359,611 |
| Fidelity Advisor Series Small Cap Fund | 68,109,059 | 6,510,980 | 5,975,616 | - | 72,082,319 |
| Fidelity Advisor Series Stock Selector Large Cap Value Fund | 163,743,859 | 15,388,038 | 17,522,184 | - | 172,354,280 |
| Fidelity Investments Money Market Portfolio Institutional Class 0.59% | 692,866 | 3,504 | 696,370 | 318 | - |
| Fidelity Series 100 Index Fund | 74,302,711 | 2,732,575 | 7,426,246 | - | 74,066,623 |
| Fidelity Series 1000 Value Index Fund | 27,269,591 | 908,567 | 2,881,577 | - | 27,444,101 |
| Fidelity Series All-Sector Equity Fund | 163,558,642 | 4,336,428 | 76,527,366 | - | 101,933,359 |
| Fidelity Series Commodity Strategy Fund | 26,916,854 | 9,322,163 | 2,498,768 | - | 35,879,363 |
| Fidelity Series Emerging Markets Debt Fund | 13,775,876 | 817,844 | 1,061,587 | 394,503 | 14,781,926 |
| Fidelity Series Emerging Markets Fund | 200,352,082 | 8,327,728 | 15,069,100 | - | 219,218,946 |
| Fidelity Series Floating Rate High Income Fund | 5,403,701 | 294,650 | 438,896 | 120,019 | 5,521,987 |
| Fidelity Series Government Money Market Fund 0.29% | - | 704,097 | 43,628 | 631 | 660,469 |
| Fidelity Series High Income Fund | 64,411,139 | 1,930,870 | 5,053,180 | 1,841,423 | 66,311,168 |
| Fidelity Series Inflation-Protected Bond Index Fund | 10,719,074 | 1,524,808 | 849,219 | 4,624 | 11,595,100 |
| Fidelity Series International Growth Fund | 192,686,846 | 15,493,431 | 15,490,473 | - | 202,599,110 |
| Fidelity Series International Small Cap Fund | 45,179,649 | 4,295,891 | 4,696,879 | - | 46,545,318 |
| Fidelity Series International Value Fund | 191,280,936 | 21,055,473 | 16,659,296 | - | 203,404,696 |
| Fidelity Series Investment Grade Bond Fund | 10,704,351 | 1,244,149 | 1,657,072 | 133,359 | 10,577,727 |
| Fidelity Series Long-Term Treasury Bond Index Fund | - | 12,899 | 1,173 | 50 | 11,305 |
| Fidelity Series Real Estate Equity Fund | 17,075,429 | 1,751,650 | 2,031,757 | 148,800 | 16,451,994 |
| Fidelity Series Real Estate Income Fund | 10,970,564 | 1,025,127 | 1,129,574 | 275,557 | 11,212,327 |
| Fidelity Series Small Cap Opportunities Fund | 82,223,574 | 6,228,097 | 8,377,942 | 209,884 | 87,130,705 |
| Total | $2,139,079,901 | $169,867,570 | $263,522,435 | $6,875,717 | $2,191,795,784 |
Investment Valuation
All investments are categorized as Level 1 under the Fair Value Hierarchy. The inputs or methodology used for valuing securities may not be an indication of the risk associated with investing in those securities. For more information on valuation inputs please refer to the Investment Valuation section in the accompanying Notes to Financial Statements.
See accompanying notes which are an integral part of the financial statements.
Fidelity Advisor Freedom® 2035 Fund
Financial Statements
Statement of Assets and Liabilities
| | | September 30, 2016 (Unaudited) |
| Assets | | |
| Investment in securities, at value (cost $1,932,348,048) — See accompanying schedule | | $2,191,795,784 |
| Cash | | 608 |
| Receivable for investments sold | | 5,017,431 |
| Receivable for fund shares sold | | 2,230,445 |
| Receivable from investment adviser for expense reductions | | 111 |
| Total assets | | 2,199,044,379 |
| Liabilities | | |
| Payable for investments purchased | $1,067,856 | |
| Payable for fund shares redeemed | 6,180,667 | |
| Distribution and service plan fees payable | 417,559 | |
| Total liabilities | | 7,666,082 |
| Net Assets | | $2,191,378,297 |
| Net Assets consist of: | | |
| Paid in capital | | $1,932,818,963 |
| Undistributed net investment income | | 4,413,360 |
| Accumulated undistributed net realized gain (loss) on investments | | (5,301,762) |
| Net unrealized appreciation (depreciation) on investments | | 259,447,736 |
| Net Assets | | $2,191,378,297 |
| Calculation of Maximum Offering Price | | |
| Class A: | | |
| Net Asset Value and redemption price per share ($1,122,360,067 ÷ 87,604,168 shares) | | $12.81 |
| Maximum offering price per share (100/94.25 of $12.81) | | $13.59 |
| Class T: | | |
| Net Asset Value and redemption price per share ($328,547,083 ÷ 25,854,091 shares) | | $12.71 |
| Maximum offering price per share (100/96.50 of $12.71) | | $13.17 |
| Class C: | | |
| Net Asset Value and offering price per share ($57,853,257 ÷ 4,621,885 shares)(a) | | $12.52 |
| Class I: | | |
| Net Asset Value, offering price and redemption price per share ($682,617,722 ÷ 52,884,621 shares) | | $12.91 |
(a) Redemption price per share is equal to net asset value less any applicable contingent deferred sales charge.
See accompanying notes which are an integral part of the financial statements.
Statement of Operations
| | | Six months ended September 30, 2016 (Unaudited) |
| Investment Income | | |
| Income distributions from underlying funds | | $6,875,717 |
| Expenses | | |
| Distribution and service plan fees | $2,462,357 | |
| Independent trustees' fees and expenses | 4,855 | |
| Total expenses before reductions | 2,467,212 | |
| Expense reductions | (4,855) | 2,462,357 |
| Net investment income (loss) | | 4,413,360 |
| Realized and Unrealized Gain (Loss) | | |
| Realized gain (loss) on sale of underlying fund shares | 4,418,134 | |
| Capital gain distributions from underlying funds | 1,211,493 | |
| Total net realized gain (loss) | | 5,629,627 |
| Change in net unrealized appreciation (depreciation) on underlying funds | | 141,952,603 |
| Net gain (loss) | | 147,582,230 |
| Net increase (decrease) in net assets resulting from operations | | $151,995,590 |
See accompanying notes which are an integral part of the financial statements.
Statement of Changes in Net Assets
| | Six months ended September 30, 2016 (Unaudited) | Year ended March 31, 2016 |
| Increase (Decrease) in Net Assets | | |
| Operations | | |
| Net investment income (loss) | $4,413,360 | $29,052,732 |
| Net realized gain (loss) | 5,629,627 | 94,086,174 |
| Change in net unrealized appreciation (depreciation) | 141,952,603 | (211,289,701) |
| Net increase (decrease) in net assets resulting from operations | 151,995,590 | (88,150,795) |
| Distributions to shareholders from net investment income | – | (29,643,292) |
| Distributions to shareholders from net realized gain | (73,158,576) | (81,803,583) |
| Total distributions | (73,158,576) | (111,446,875) |
| Share transactions - net increase (decrease) | (26,141,496) | (55,427,155) |
| Total increase (decrease) in net assets | 52,695,518 | (255,024,825) |
| Net Assets | | |
| Beginning of period | 2,138,682,779 | 2,393,707,604 |
| End of period | $2,191,378,297 | $2,138,682,779 |
| Other Information | | |
| Undistributed net investment income end of period | $4,413,360 | $– |
See accompanying notes which are an integral part of the financial statements.
Financial Highlights — Fidelity Advisor Freedom 2035 Fund Class A
| | Six months ended (Unaudited) September 30, | Years ended March 31, | | | | |
| | 2016 | 2016 | 2015 | 2014 | 2013 | 2012 |
| Selected Per–Share Data | | | | | | |
| Net asset value, beginning of period | $12.37 | $13.51 | $13.54 | $12.74 | $11.80 | $12.11 |
| Income from Investment Operations | | | | | | |
| Net investment income (loss)A | .02 | .16 | .19 | .15 | .18 | .16 |
| Net realized and unrealized gain (loss) | .84 | (.66) | .71 | 1.59 | .97 | (.13) |
| Total from investment operations | .86 | (.50) | .90 | 1.74 | 1.15 | .03 |
| Distributions from net investment income | – | (.17) | (.19) | (.15) | (.18) | (.15) |
| Distributions from net realized gain | (.42) | (.47) | (.73) | (.79) | (.04) | (.19) |
| Total distributions | (.42) | (.64) | (.93)B | (.94) | (.21)C | (.34) |
| Net asset value, end of period | $12.81 | $12.37 | $13.51 | $13.54 | $12.74 | $11.80 |
| Total ReturnD,E,F | 7.23% | (3.92)% | 6.81% | 14.15% | 9.89% | .47% |
| Ratios to Average Net AssetsG,H | | | | | | |
| Expenses before reductions | .25%I | .25% | .25% | .25% | .25% | .25% |
| Expenses net of fee waivers, if any | .25%I | .25% | .25% | .25% | .25% | .25% |
| Expenses net of all reductions | .25%I | .25% | .25% | .25% | .25% | .25% |
| Net investment income (loss) | .38%I | 1.28% | 1.36% | 1.13% | 1.54% | 1.39% |
| Supplemental Data | | | | | | |
| Net assets, end of period (000 omitted) | $1,122,360 | $1,094,459 | $1,313,452 | $1,348,500 | $1,258,797 | $1,057,102 |
| Portfolio turnover rateG | 16%I | 22% | 25% | 48% | 25% | 13% |
A Calculated based on average shares outstanding during the period.
B Total distributions of $.93 per share is comprised of distributions from net investment income of $.194 and distributions from net realized gain of $.733 per share.
C Total distributions of $.21 per share is comprised of distributions from net investment income of $.175 and distributions from net realized gain of $.036 per share.
D Total returns for periods of less than one year are not annualized.
E Total returns would have been lower if certain expenses had not been reduced during the applicable periods shown.
F Total returns do not include the effect of the sales charges.
G Amounts do not include the activity of the Underlying Funds.
H Expense ratios reflect operating expenses of the class. Expenses before reductions do not reflect amounts reimbursed by the investment adviser or reductions from expense offset arrangements and do not represent the amount paid by the class during periods when reimbursements or reductions occur. Expenses net of fee waivers reflect expenses after reimbursement by the investment adviser but prior to reductions from expense offset arrangements. Expenses net of all reductions represent the net expenses paid by the class but do not include expenses of the underlying funds in which the Fund invests.
I Annualized
See accompanying notes which are an integral part of the financial statements.
Financial Highlights — Fidelity Advisor Freedom 2035 Fund Class T
| | Six months ended (Unaudited) September 30, | Years ended March 31, | | | | |
| | 2016 | 2016 | 2015 | 2014 | 2013 | 2012 |
| Selected Per–Share Data | | | | | | |
| Net asset value, beginning of period | $12.29 | $13.42 | $13.46 | $12.68 | $11.74 | $12.05 |
| Income from Investment Operations | | | | | | |
| Net investment income (loss)A | .01 | .13 | .15 | .11 | .15 | .13 |
| Net realized and unrealized gain (loss) | .83 | (.65) | .71 | 1.58 | .97 | (.13) |
| Total from investment operations | .84 | (.52) | .86 | 1.69 | 1.12 | – |
| Distributions from net investment income | – | (.14) | (.16) | (.12) | (.15) | (.12) |
| Distributions from net realized gain | (.42) | (.46) | (.73) | (.79) | (.04) | (.19) |
| Total distributions | (.42) | (.61)B | (.90)C | (.91) | (.18)D | (.31) |
| Net asset value, end of period | $12.71 | $12.29 | $13.42 | $13.46 | $12.68 | $11.74 |
| Total ReturnE,F,G | 7.12% | (4.08)% | 6.52% | 13.81% | 9.69% | .19% |
| Ratios to Average Net AssetsH,I | | | | | | |
| Expenses before reductions | .50%J | .50% | .50% | .50% | .50% | .50% |
| Expenses net of fee waivers, if any | .50%J | .50% | .50% | .50% | .50% | .50% |
| Expenses net of all reductions | .50%J | .50% | .50% | .50% | .50% | .50% |
| Net investment income (loss) | .13%J | 1.03% | 1.11% | .88% | 1.29% | 1.14% |
| Supplemental Data | | | | | | |
| Net assets, end of period (000 omitted) | $328,547 | $299,952 | $303,711 | $276,113 | $216,701 | $166,843 |
| Portfolio turnover rateH | 16%J | 22% | 25% | 48% | 25% | 13% |
A Calculated based on average shares outstanding during the period.
B Total distributions of $.61 per share is comprised of distributions from net investment income of $.143 and distributions from net realized gain of $.464 per share.
C Total distributions of $.90 per share is comprised of distributions from net investment income of $.162 and distributions from net realized gain of $.733 per share.
D Total distributions of $.18 per share is comprised of distributions from net investment income of $.148 and distributions from net realized gain of $.036 per share.
E Total returns for periods of less than one year are not annualized.
F Total returns would have been lower if certain expenses had not been reduced during the applicable periods shown.
G Total returns do not include the effect of the sales charges.
H Amounts do not include the activity of the Underlying Funds.
I Expense ratios reflect operating expenses of the class. Expenses before reductions do not reflect amounts reimbursed by the investment adviser or reductions from expense offset arrangements and do not represent the amount paid by the class during periods when reimbursements or reductions occur. Expenses net of fee waivers reflect expenses after reimbursement by the investment adviser but prior to reductions from expense offset arrangements. Expenses net of all reductions represent the net expenses paid by the class but do not include expenses of the underlying funds in which the Fund invests.
J Annualized
See accompanying notes which are an integral part of the financial statements.
Financial Highlights — Fidelity Advisor Freedom 2035 Fund Class C
| | Six months ended (Unaudited) September 30, | Years ended March 31, | | | | |
| | 2016 | 2016 | 2015 | 2014 | 2013 | 2012 |
| Selected Per–Share Data | | | | | | |
| Net asset value, beginning of period | $12.14 | $13.27 | $13.32 | $12.56 | $11.65 | $11.96 |
| Income from Investment Operations | | | | | | |
| Net investment income (loss)A | (.02) | .07 | .08 | .05 | .09 | .07 |
| Net realized and unrealized gain (loss) | .82 | (.65) | .70 | 1.56 | .95 | (.13) |
| Total from investment operations | .80 | (.58) | .78 | 1.61 | 1.04 | (.06) |
| Distributions from net investment income | – | (.10) | (.11) | (.07) | (.10) | (.08) |
| Distributions from net realized gain | (.42) | (.45) | (.72) | (.78) | (.04) | (.18) |
| Total distributions | (.42) | (.55) | (.83) | (.85) | (.13)B | (.25)C |
| Net asset value, end of period | $12.52 | $12.14 | $13.27 | $13.32 | $12.56 | $11.65 |
| Total ReturnD,E,F | 6.87% | (4.58)% | 6.01% | 13.27% | 9.04% | (.29)% |
| Ratios to Average Net AssetsG,H | | | | | | |
| Expenses before reductions | 1.00%I | 1.00% | 1.00% | 1.00% | 1.00% | 1.00% |
| Expenses net of fee waivers, if any | 1.00%I | 1.00% | 1.00% | 1.00% | 1.00% | 1.00% |
| Expenses net of all reductions | 1.00%I | 1.00% | 1.00% | 1.00% | 1.00% | 1.00% |
| Net investment income (loss) | (.37)%I | .53% | .61% | .38% | .79% | .64% |
| Supplemental Data | | | | | | |
| Net assets, end of period (000 omitted) | $57,853 | $54,813 | $56,318 | $51,931 | $43,447 | $38,614 |
| Portfolio turnover rateG | 16%I | 22% | 25% | 48% | 25% | 13% |
A Calculated based on average shares outstanding during the period.
B Total distributions of $.13 per share is comprised of distributions from net investment income of $.098 and distributions from net realized gain of $.036 per share.
C Total distributions of $.25 per share is comprised of distributions from net investment income of $.076 and distributions from net realized gain of $.176 per share.
D Total returns for periods of less than one year are not annualized.
E Total returns would have been lower if certain expenses had not been reduced during the applicable periods shown.
F Total returns do not include the effect of the contingent deferred sales charge.
G Amounts do not include the activity of the Underlying Funds.
H Expense ratios reflect operating expenses of the class. Expenses before reductions do not reflect amounts reimbursed by the investment adviser or reductions from expense offset arrangements and do not represent the amount paid by the class during periods when reimbursements or reductions occur. Expenses net of fee waivers reflect expenses after reimbursement by the investment adviser but prior to reductions from expense offset arrangements. Expenses net of all reductions represent the net expenses paid by the class but do not include expenses of the underlying funds in which the Fund invests.
I Annualized
See accompanying notes which are an integral part of the financial statements.
Financial Highlights — Fidelity Advisor Freedom 2035 Fund Class I
| | Six months ended (Unaudited) September 30, | Years ended March 31, | | | | |
| | 2016 | 2016 | 2015 | 2014 | 2013 | 2012 |
| Selected Per–Share Data | | | | | | |
| Net asset value, beginning of period | $12.45 | $13.59 | $13.61 | $12.80 | $11.86 | $12.17 |
| Income from Investment Operations | | | | | | |
| Net investment income (loss)A | .04 | .20 | .22 | .18 | .21 | .19 |
| Net realized and unrealized gain (loss) | .84 | (.67) | .72 | 1.60 | .97 | (.14) |
| Total from investment operations | .88 | (.47) | .94 | 1.78 | 1.18 | .05 |
| Distributions from net investment income | – | (.20) | (.23) | (.18) | (.20) | (.17) |
| Distributions from net realized gain | (.42) | (.47) | (.73) | (.79) | (.04) | (.19) |
| Total distributions | (.42) | (.67) | (.96) | (.97) | (.24) | (.36) |
| Net asset value, end of period | $12.91 | $12.45 | $13.59 | $13.61 | $12.80 | $11.86 |
| Total ReturnB,C | 7.35% | (3.63)% | 7.11% | 14.44% | 10.10% | .71% |
| Ratios to Average Net AssetsD,E | | | | | | |
| Expenses before reductionsF | -%G | -% | -% | -% | -% | -% |
| Expenses net of fee waivers, if any | -%G | -% | -% | -% | -% | -% |
| Expenses net of all reductions | -%G | -% | -% | -% | -% | -% |
| Net investment income (loss) | .63%G | 1.53% | 1.61% | 1.38% | 1.79% | 1.64% |
| Supplemental Data | | | | | | |
| Net assets, end of period (000 omitted) | $682,618 | $684,976 | $710,667 | $695,092 | $547,049 | $360,580 |
| Portfolio turnover rateD | 16%G | 22% | 25% | 48% | 25% | 13% |
A Calculated based on average shares outstanding during the period.
B Total returns for periods of less than one year are not annualized.
C Total returns would have been lower if certain expenses had not been reduced during the applicable periods shown.
D Amounts do not include the activity of the Underlying Funds.
E Expense ratios reflect operating expenses of the class. Expenses before reductions do not reflect amounts reimbursed by the investment adviser or reductions from expense offset arrangements and do not represent the amount paid by the class during periods when reimbursements or reductions occur. Expenses net of fee waivers reflect expenses after reimbursement by the investment adviser but prior to reductions from expense offset arrangements. Expenses net of all reductions represent the net expenses paid by the class but do not include expenses of the underlying funds in which the Fund invests.
F Amount represents less than .005%.
G Annualized
See accompanying notes which are an integral part of the financial statements.
Fidelity Advisor Freedom® 2040 Fund
Investment Summary (Unaudited)
The information in the following tables is based on the direct investments of the Fund.
Top Holdings as of September 30, 2016
| | % of fund's net assets | % of fund's net assets 6 months ago |
| Fidelity Advisor Series Equity-Income Fund | 11.8 | 11.5 |
| Fidelity Series Emerging Markets Fund | 10.0 | 9.4 |
| Fidelity Series International Value Fund | 9.3 | 8.9 |
| Fidelity Series International Growth Fund | 9.2 | 9.0 |
| Fidelity Advisor Series Growth & Income Fund | 8.2 | 7.9 |
| Fidelity Advisor Series Stock Selector Large Cap Value Fund | 7.9 | 7.7 |
| Fidelity Advisor Series Equity Growth Fund | 6.6 | 6.4 |
| Fidelity Advisor Series Opportunistic Insights Fund | 6.1 | 5.9 |
| Fidelity Series All-Sector Equity Fund | 4.7 | 7.6 |
| Fidelity Advisor Series Growth Opportunities Fund | 4.3 | 4.2 |
| | 78.1 | 78.5 |
Asset Allocation (% of fund's net assets)
| Period end |
| | Domestic Equity Funds | 63.9% |
| | International Equity Funds | 30.6% |
| | Bond Funds | 5.5% |

| Six months ago |
| | Domestic Equity Funds | 65.1% |
| | International Equity Funds | 29.4% |
| | Bond Funds | 5.4% |
| | Short-Term Funds | 0.1% |

Domestic Equity Funds category includes Fidelity Series Commodity Strategy Fund which invests in commodity-related investments.
Fidelity Advisor Freedom® 2040 Fund
Investments September 30, 2016 (Unaudited)
Showing Percentage of Net Assets
| Domestic Equity Funds - 63.9% | | | |
| | | Shares | Value |
| Fidelity Advisor Series Equity Growth Fund (a) | | 11,578,459 | $132,689,143 |
| Fidelity Advisor Series Equity-Income Fund (a) | | 19,287,318 | 238,391,255 |
| Fidelity Advisor Series Growth & Income Fund (a) | | 12,492,103 | 165,395,447 |
| Fidelity Advisor Series Growth Opportunities Fund (a) | | 8,047,444 | 87,556,190 |
| Fidelity Advisor Series Opportunistic Insights Fund (a) | | 8,085,618 | 123,952,517 |
| Fidelity Advisor Series Small Cap Fund (a) | | 6,266,403 | 66,423,868 |
| Fidelity Advisor Series Stock Selector Large Cap Value Fund (a) | | 13,313,239 | 158,826,938 |
| Fidelity Series 100 Index Fund (a) | | 4,779,585 | 68,252,470 |
| Fidelity Series 1000 Value Index Fund (a) | | 2,264,240 | 25,291,561 |
| Fidelity Series All-Sector Equity Fund (a) | | 6,995,626 | 93,951,261 |
| Fidelity Series Commodity Strategy Fund (a)(b) | | 6,297,428 | 33,313,392 |
| Fidelity Series Real Estate Equity Fund (a) | | 1,101,117 | 15,162,377 |
| Fidelity Series Small Cap Opportunities Fund (a) | | 6,105,910 | 80,292,710 |
| TOTAL DOMESTIC EQUITY FUNDS | | | |
| (Cost $1,115,607,414) | | | 1,289,499,129 |
|
| International Equity Funds - 30.6% | | | |
| Fidelity Series Emerging Markets Fund (a) | | 12,008,561 | 201,984,002 |
| Fidelity Series International Growth Fund (a) | | 13,336,267 | 186,707,737 |
| Fidelity Series International Small Cap Fund (a) | | 2,754,906 | 42,893,888 |
| Fidelity Series International Value Fund (a) | | 19,772,906 | 187,447,145 |
| TOTAL INTERNATIONAL EQUITY FUNDS | | | |
| (Cost $547,736,629) | | | 619,032,772 |
|
| Bond Funds - 5.5% | | | |
| Fidelity Series Emerging Markets Debt Fund (a) | | 1,314,395 | 13,617,134 |
| Fidelity Series Floating Rate High Income Fund (a) | | 540,176 | 5,088,461 |
| Fidelity Series High Income Fund (a) | | 6,505,454 | 60,891,051 |
| Fidelity Series Inflation-Protected Bond Index Fund (a) | | 1,060,052 | 10,674,726 |
| Fidelity Series Investment Grade Bond Fund (a) | | 839,039 | 9,732,856 |
| Fidelity Series Long-Term Treasury Bond Index Fund (a) | | 1,107 | 10,678 |
| Fidelity Series Real Estate Income Fund (a) | | 921,483 | 10,339,042 |
| TOTAL BOND FUNDS | | | |
| (Cost $112,157,437) | | | 110,353,948 |
|
| Short-Term Funds - 0.0% | | | |
| Fidelity Advisor Series Short-Term Credit Fund (a) | | 33,145 | 332,771 |
| Fidelity Series Government Money Market Fund 0.29% (a)(c) | | 605,514 | 605,514 |
| TOTAL SHORT-TERM FUNDS | | | |
| (Cost $935,725) | | | 938,285 |
| TOTAL INVESTMENT PORTFOLIO - 100.0% | | | |
| (Cost $1,776,437,205) | | | 2,019,824,134 |
| NET OTHER ASSETS (LIABILITIES) - 0.0% | | | (400,118) |
| NET ASSETS - 100% | | | $2,019,424,016 |
Legend
(a) Affiliated Fund
(b) Non-income producing
(c) The rate quoted is the annualized seven-day yield of the fund at period end.
Affiliated Underlying Funds
Information regarding the Fund's fiscal year to date purchases and sales of the affiliated Underlying Funds and income earned by the Fund from investments in affiliated Underlying Funds is as follows:
| Affiliate | Value, beginning of period | Purchases | Sales Proceeds | Dividend Income | Value, end of period |
| Fidelity Advisor Series Equity Growth Fund | $125,636,822 | $11,412,385 | $13,074,545 | - | $132,689,143 |
| Fidelity Advisor Series Equity-Income Fund | 226,721,793 | 20,663,498 | 25,702,573 | 2,183,919 | 238,391,255 |
| Fidelity Advisor Series Growth & Income Fund | 156,637,067 | 12,200,190 | 15,386,542 | 1,258,833 | 165,395,447 |
| Fidelity Advisor Series Growth Opportunities Fund | 82,751,267 | 7,006,018 | 7,026,285 | - | 87,556,190 |
| Fidelity Advisor Series Opportunistic Insights Fund | 116,603,988 | 11,873,034 | 11,730,213 | - | 123,952,517 |
| Fidelity Advisor Series Short-Term Credit Fund | 343,943 | 26,238 | 38,783 | 1,776 | 332,771 |
| Fidelity Advisor Series Small Cap Fund | 62,710,603 | 6,207,299 | 5,651,996 | - | 66,423,868 |
| Fidelity Advisor Series Stock Selector Large Cap Value Fund | 150,765,280 | 14,689,682 | 16,503,716 | - | 158,826,938 |
| Fidelity Investments Money Market Portfolio Institutional Class 0.59% | 637,976 | 4,044 | 642,020 | 293 | - |
| Fidelity Series 100 Index Fund | 68,412,543 | 2,749,306 | 7,002,561 | - | 68,252,470 |
| Fidelity Series 1000 Value Index Fund | 25,108,173 | 924,083 | 2,713,817 | - | 25,291,561 |
| Fidelity Series All-Sector Equity Fund | 150,620,273 | 4,608,348 | 70,982,159 | - | 93,951,261 |
| Fidelity Series Commodity Strategy Fund | 24,782,917 | 8,887,351 | 2,336,291 | - | 33,313,392 |
| Fidelity Series Emerging Markets Debt Fund | 12,674,931 | 793,954 | 998,064 | 362,004 | 13,617,134 |
| Fidelity Series Emerging Markets Fund | 184,469,900 | 8,006,995 | 13,959,833 | - | 201,984,002 |
| Fidelity Series Floating Rate High Income Fund | 4,976,765 | 288,857 | 418,627 | 110,212 | 5,088,461 |
| Fidelity Series Government Money Market Fund 0.29% | - | 646,664 | 41,150 | 579 | 605,514 |
| Fidelity Series High Income Fund | 59,336,074 | 1,767,365 | 4,827,270 | 1,691,151 | 60,891,051 |
| Fidelity Series Inflation-Protected Bond Index Fund | 9,869,433 | 1,414,464 | 793,019 | 4,248 | 10,674,726 |
| Fidelity Series International Growth Fund | 177,401,409 | 14,885,037 | 14,681,911 | - | 186,707,737 |
| Fidelity Series International Small Cap Fund | 41,596,824 | 4,091,068 | 4,415,204 | - | 42,893,888 |
| Fidelity Series International Value Fund | 176,107,756 | 20,000,925 | 15,767,671 | - | 187,447,145 |
| Fidelity Series Investment Grade Bond Fund | 9,855,886 | 1,179,650 | 1,565,368 | 122,384 | 9,732,856 |
| Fidelity Series Long-Term Treasury Bond Index Fund | - | 12,018 | 951 | 47 | 10,678 |
| Fidelity Series Real Estate Equity Fund | 15,721,138 | 1,670,300 | 1,914,880 | 136,359 | 15,162,377 |
| Fidelity Series Real Estate Income Fund | 10,107,601 | 974,947 | 1,062,236 | 252,699 | 10,339,042 |
| Fidelity Series Small Cap Opportunities Fund | 75,681,434 | 5,971,717 | 7,840,671 | 192,615 | 80,292,710 |
| Total | $1,969,531,796 | $162,955,437 | $247,078,356 | $6,317,119 | $2,019,824,134 |
Investment Valuation
All investments are categorized as Level 1 under the Fair Value Hierarchy. The inputs or methodology used for valuing securities may not be an indication of the risk associated with investing in those securities. For more information on valuation inputs please refer to the Investment Valuation section in the accompanying Notes to Financial Statements.
See accompanying notes which are an integral part of the financial statements.
Fidelity Advisor Freedom® 2040 Fund
Financial Statements
Statement of Assets and Liabilities
| | | September 30, 2016 (Unaudited) |
| Assets | | |
| Investment in securities, at value (cost $1,776,437,205) — See accompanying schedule | | $2,019,824,134 |
| Cash | | 6 |
| Receivable for investments sold | | 6,090,526 |
| Receivable for fund shares sold | | 11,553,297 |
| Receivable from investment adviser for expense reductions | | 25 |
| Total assets | | 2,037,467,988 |
| Liabilities | | |
| Payable for investments purchased | $10,433,911 | |
| Payable for fund shares redeemed | 7,207,093 | |
| Distribution and service plan fees payable | 402,968 | |
| Total liabilities | | 18,043,972 |
| Net Assets | | $2,019,424,016 |
| Net Assets consist of: | | |
| Paid in capital | | $1,775,791,766 |
| Undistributed net investment income | | 3,914,175 |
| Accumulated undistributed net realized gain (loss) on investments | | (3,668,854) |
| Net unrealized appreciation (depreciation) on investments | | 243,386,929 |
| Net Assets | | $2,019,424,016 |
| Calculation of Maximum Offering Price | | |
| Class A: | | |
| Net Asset Value and redemption price per share ($976,632,012 ÷ 71,185,071 shares) | | $13.72 |
| Maximum offering price per share (100/94.25 of $13.72) | | $14.56 |
| Class T: | | |
| Net Asset Value and redemption price per share ($335,314,602 ÷ 24,541,707 shares) | | $13.66 |
| Maximum offering price per share (100/96.50 of $13.66) | | $14.16 |
| Class C: | | |
| Net Asset Value and offering price per share ($77,333,880 ÷ 5,758,396 shares)(a) | | $13.43 |
| Class I: | | |
| Net Asset Value, offering price and redemption price per share ($630,143,522 ÷ 45,632,872 shares) | | $13.81 |
(a) Redemption price per share is equal to net asset value less any applicable contingent deferred sales charge.
See accompanying notes which are an integral part of the financial statements.
Statement of Operations
| | | Six months ended September 30, 2016 (Unaudited) |
| Investment Income | | |
| Income distributions from underlying funds | | $6,317,119 |
| Expenses | | |
| Distribution and service plan fees | $2,389,045 | |
| Independent trustees' fees and expenses | 4,460 | |
| Total expenses before reductions | 2,393,505 | |
| Expense reductions | (4,460) | 2,389,045 |
| Net investment income (loss) | | 3,928,074 |
| Realized and Unrealized Gain (Loss) | | |
| Realized gain (loss) on sale of underlying fund shares | 4,659,397 | |
| Capital gain distributions from underlying funds | 1,110,404 | |
| Total net realized gain (loss) | | 5,769,801 |
| Change in net unrealized appreciation (depreciation) on underlying funds | | 129,755,851 |
| Net gain (loss) | | 135,525,652 |
| Net increase (decrease) in net assets resulting from operations | | $139,453,726 |
See accompanying notes which are an integral part of the financial statements.
Statement of Changes in Net Assets
| | Six months ended September 30, 2016 (Unaudited) | Year ended March 31, 2016 |
| Increase (Decrease) in Net Assets | | |
| Operations | | |
| Net investment income (loss) | $3,928,074 | $26,685,727 |
| Net realized gain (loss) | 5,769,801 | 89,965,972 |
| Change in net unrealized appreciation (depreciation) | 129,755,851 | (198,753,543) |
| Net increase (decrease) in net assets resulting from operations | 139,453,726 | (82,101,844) |
| Distributions to shareholders from net investment income | (144,081) | (27,258,668) |
| Distributions to shareholders from net realized gain | (67,260,562) | (81,269,199) |
| Total distributions | (67,404,643) | (108,527,867) |
| Share transactions - net increase (decrease) | (21,770,098) | (104,582,015) |
| Total increase (decrease) in net assets | 50,278,985 | (295,211,726) |
| Net Assets | | |
| Beginning of period | 1,969,145,031 | 2,264,356,757 |
| End of period | $2,019,424,016 | $1,969,145,031 |
| Other Information | | |
| Undistributed net investment income end of period | $3,914,175 | $130,182 |
See accompanying notes which are an integral part of the financial statements.
Financial Highlights — Fidelity Advisor Freedom 2040 Fund Class A
| | Six months ended (Unaudited) September 30, | Years ended March 31, | | | | |
| | 2016 | 2016 | 2015 | 2014 | 2013 | 2012 |
| Selected Per–Share Data | | | | | | |
| Net asset value, beginning of period | $13.25 | $14.49 | $14.51 | $13.61 | $12.60 | $12.95 |
| Income from Investment Operations | | | | | | |
| Net investment income (loss)A | .03 | .17 | .20 | .15 | .19 | .17 |
| Net realized and unrealized gain (loss) | .89 | (.69) | .76 | 1.74 | 1.05 | (.15) |
| Total from investment operations | .92 | (.52) | .96 | 1.89 | 1.24 | .02 |
| Distributions from net investment income | – | (.18) | (.21) | (.16) | (.19) | (.16) |
| Distributions from net realized gain | (.45) | (.54) | (.77) | (.83) | (.04) | (.21) |
| Total distributions | (.45) | (.72) | (.98) | (.99) | (.23) | (.37) |
| Net asset value, end of period | $13.72 | $13.25 | $14.49 | $14.51 | $13.61 | $12.60 |
| Total ReturnB,C,D | 7.21% | (3.82)% | 6.76% | 14.37% | 9.94% | .38% |
| Ratios to Average Net AssetsE,F | | | | | | |
| Expenses before reductions | .25%G | .25% | .25% | .25% | .25% | .25% |
| Expenses net of fee waivers, if any | .25%G | .25% | .25% | .25% | .25% | .25% |
| Expenses net of all reductions | .25%G | .25% | .25% | .25% | .25% | .25% |
| Net investment income (loss) | .38%G | 1.27% | 1.35% | 1.10% | 1.53% | 1.38% |
| Supplemental Data | | | | | | |
| Net assets, end of period (000 omitted) | $976,632 | $950,816 | $1,154,277 | $1,195,641 | $1,133,722 | $967,348 |
| Portfolio turnover rateE | 16%G | 21% | 24% | 47% | 26% | 14% |
A Calculated based on average shares outstanding during the period.
B Total returns for periods of less than one year are not annualized.
C Total returns would have been lower if certain expenses had not been reduced during the applicable periods shown.
D Total returns do not include the effect of the sales charges.
E Amounts do not include the activity of the Underlying Funds.
F Expense ratios reflect operating expenses of the class. Expenses before reductions do not reflect amounts reimbursed by the investment adviser or reductions from expense offset arrangements and do not represent the amount paid by the class during periods when reimbursements or reductions occur. Expenses net of fee waivers reflect expenses after reimbursement by the investment adviser but prior to reductions from expense offset arrangements. Expenses net of all reductions represent the net expenses paid by the class but do not include expenses of the underlying funds in which the Fund invests.
G Annualized
See accompanying notes which are an integral part of the financial statements.
Financial Highlights — Fidelity Advisor Freedom 2040 Fund Class T
| | Six months ended (Unaudited) September 30, | Years ended March 31, | | | | |
| | 2016 | 2016 | 2015 | 2014 | 2013 | 2012 |
| Selected Per–Share Data | | | | | | |
| Net asset value, beginning of period | $13.21 | $14.45 | $14.47 | $13.58 | $12.57 | $12.92 |
| Income from Investment Operations | | | | | | |
| Net investment income (loss)A | .01 | .14 | .16 | .12 | .16 | .14 |
| Net realized and unrealized gain (loss) | .89 | (.70) | .76 | 1.73 | 1.04 | (.16) |
| Total from investment operations | .90 | (.56) | .92 | 1.85 | 1.20 | (.02) |
| Distributions from net investment income | – | (.15) | (.17) | (.13) | (.16) | (.13) |
| Distributions from net realized gain | (.45) | (.53) | (.77) | (.83) | (.04) | (.21) |
| Total distributions | (.45) | (.68) | (.94) | (.96) | (.19)B | (.33)C |
| Net asset value, end of period | $13.66 | $13.21 | $14.45 | $14.47 | $13.58 | $12.57 |
| Total ReturnD,E,F | 7.06% | (4.07)% | 6.51% | 14.06% | 9.69% | .12% |
| Ratios to Average Net AssetsG,H | | | | | | |
| Expenses before reductions | .50%I | .50% | .50% | .50% | .50% | .50% |
| Expenses net of fee waivers, if any | .50%I | .50% | .50% | .50% | .50% | .50% |
| Expenses net of all reductions | .50%I | .50% | .50% | .50% | .50% | .50% |
| Net investment income (loss) | .13%I | 1.02% | 1.10% | .85% | 1.28% | 1.13% |
| Supplemental Data | | | | | | |
| Net assets, end of period (000 omitted) | $335,315 | $310,107 | $333,069 | $341,608 | $288,886 | $262,944 |
| Portfolio turnover rateG | 16%I | 21% | 24% | 47% | 26% | 14% |
A Calculated based on average shares outstanding during the period.
B Total distributions of $.19 per share is comprised of distributions from net investment income of $.156 and distributions from net realized gain of $.037 per share.
C Total distributions of $.33 per share is comprised of distributions from net investment income of $.127 and distributions from net realized gain of $.207 per share.
D Total returns for periods of less than one year are not annualized.
E Total returns would have been lower if certain expenses had not been reduced during the applicable periods shown.
F Total returns do not include the effect of the sales charges.
G Amounts do not include the activity of the Underlying Funds.
H Expense ratios reflect operating expenses of the class. Expenses before reductions do not reflect amounts reimbursed by the investment adviser or reductions from expense offset arrangements and do not represent the amount paid by the class during periods when reimbursements or reductions occur. Expenses net of fee waivers reflect expenses after reimbursement by the investment adviser but prior to reductions from expense offset arrangements. Expenses net of all reductions represent the net expenses paid by the class but do not include expenses of the underlying funds in which the Fund invests.
I Annualized
See accompanying notes which are an integral part of the financial statements.
Financial Highlights — Fidelity Advisor Freedom 2040 Fund Class C
| | Six months ended (Unaudited) September 30, | Years ended March 31, | | | | |
| | 2016 | 2016 | 2015 | 2014 | 2013 | 2012 |
| Selected Per–Share Data | | | | | | |
| Net asset value, beginning of period | $13.02 | $14.27 | $14.30 | $13.43 | $12.45 | $12.80 |
| Income from Investment Operations | | | | | | |
| Net investment income (loss)A | (.02) | .07 | .09 | .05 | .10 | .08 |
| Net realized and unrealized gain (loss) | .88 | (.70) | .75 | 1.71 | 1.02 | (.15) |
| Total from investment operations | .86 | (.63) | .84 | 1.76 | 1.12 | (.07) |
| Distributions from net investment income | – | (.10) | (.12) | (.07) | (.11) | (.08) |
| Distributions from net realized gain | (.45) | (.52) | (.75) | (.82) | (.04) | (.20) |
| Total distributions | (.45) | (.62) | (.87) | (.89) | (.14)B | (.28) |
| Net asset value, end of period | $13.43 | $13.02 | $14.27 | $14.30 | $13.43 | $12.45 |
| Total ReturnC,D,E | 6.85% | (4.63)% | 6.01% | 13.57% | 9.09% | (.35)% |
| Ratios to Average Net AssetsF,G | | | | | | |
| Expenses before reductions | 1.00%H | 1.00% | 1.00% | 1.00% | 1.00% | 1.00% |
| Expenses net of fee waivers, if any | 1.00%H | 1.00% | 1.00% | 1.00% | 1.00% | 1.00% |
| Expenses net of all reductions | 1.00%H | 1.00% | 1.00% | 1.00% | 1.00% | 1.00% |
| Net investment income (loss) | (.37)%H | .52% | .60% | .35% | .78% | .63% |
| Supplemental Data | | | | | | |
| Net assets, end of period (000 omitted) | $77,334 | $73,036 | $77,130 | $72,247 | $62,893 | $56,910 |
| Portfolio turnover rateF | 16%H | 21% | 24% | 47% | 26% | 14% |
A Calculated based on average shares outstanding during the period.
B Total distributions of $.14 per share is comprised of distributions from net investment income of $.105 and distributions from net realized gain of $.037 per share.
C Total returns for periods of less than one year are not annualized.
D Total returns would have been lower if certain expenses had not been reduced during the applicable periods shown.
E Total returns do not include the effect of the contingent deferred sales charge.
F Amounts do not include the activity of the Underlying Funds.
G Expense ratios reflect operating expenses of the class. Expenses before reductions do not reflect amounts reimbursed by the investment adviser or reductions from expense offset arrangements and do not represent the amount paid by the class during periods when reimbursements or reductions occur. Expenses net of fee waivers reflect expenses after reimbursement by the investment adviser but prior to reductions from expense offset arrangements. Expenses net of all reductions represent the net expenses paid by the class but do not include expenses of the underlying funds in which the Fund invests.
H Annualized
See accompanying notes which are an integral part of the financial statements.
Financial Highlights — Fidelity Advisor Freedom 2040 Fund Class I
| | Six months ended (Unaudited) September 30, | Years ended March 31, | | | | |
| | 2016 | 2016 | 2015 | 2014 | 2013 | 2012 |
| Selected Per–Share Data | | | | | | |
| Net asset value, beginning of period | $13.32 | $14.57 | $14.59 | $13.67 | $12.65 | $13.00 |
| Income from Investment Operations | | | | | | |
| Net investment income (loss)A | .04 | .21 | .23 | .19 | .23 | .20 |
| Net realized and unrealized gain (loss) | .91 | (.71) | .76 | 1.75 | 1.05 | (.16) |
| Total from investment operations | .95 | (.50) | .99 | 1.94 | 1.28 | .04 |
| Distributions from net investment income | –B | (.22) | (.24) | (.19) | (.22) | (.19) |
| Distributions from net realized gain | (.46) | (.54) | (.77) | (.83) | (.04) | (.21) |
| Total distributions | (.46) | (.75)C | (1.01) | (1.02) | (.26) | (.39)D |
| Net asset value, end of period | $13.81 | $13.32 | $14.57 | $14.59 | $13.67 | $12.65 |
| Total ReturnE,F | 7.40% | (3.62)% | 6.99% | 14.73% | 10.24% | .61% |
| Ratios to Average Net AssetsG,H | | | | | | |
| Expenses before reductionsB | -%I | -% | -% | -% | -% | -% |
| Expenses net of fee waivers, if any | -%I | -% | -% | -% | -% | -% |
| Expenses net of all reductions | -%I | -% | -% | -% | -% | -% |
| Net investment income (loss) | .63%I | 1.52% | 1.60% | 1.35% | 1.78% | 1.63% |
| Supplemental Data | | | | | | |
| Net assets, end of period (000 omitted) | $630,144 | $629,599 | $688,278 | $664,689 | $508,363 | $352,751 |
| Portfolio turnover rateG | 16%I | 21% | 24% | 47% | 26% | 14% |
A Calculated based on average shares outstanding during the period.
B Amount represents less than $.005 per share.
C Total distributions of $.75 per share is comprised of distributions from net investment income of $.216 and distributions from net realized gain of $.535 per share.
D Total distributions of $.39 per share is comprised of distributions from net investment income of $.186 and distributions from net realized gain of $.207 per share.
E Total returns for periods of less than one year are not annualized.
F Total returns would have been lower if certain expenses had not been reduced during the applicable periods shown.
G Amounts do not include the activity of the Underlying Funds.
H Expense ratios reflect operating expenses of the class. Expenses before reductions do not reflect amounts reimbursed by the investment adviser or reductions from expense offset arrangements and do not represent the amount paid by the class during periods when reimbursements or reductions occur. Expenses net of fee waivers reflect expenses after reimbursement by the investment adviser but prior to reductions from expense offset arrangements. Expenses net of all reductions represent the net expenses paid by the class but do not include expenses of the underlying funds in which the Fund invests.
I Annualized
See accompanying notes which are an integral part of the financial statements.
Fidelity Advisor Freedom® 2045 Fund
Investment Summary (Unaudited)
The information in the following tables is based on the direct investments of the Fund.
Top Holdings as of September 30, 2016
| | % of fund's net assets | % of fund's net assets 6 months ago |
| Fidelity Advisor Series Equity-Income Fund | 11.8 | 11.5 |
| Fidelity Series Emerging Markets Fund | 10.0 | 9.4 |
| Fidelity Series International Value Fund | 9.3 | 8.9 |
| Fidelity Series International Growth Fund | 9.3 | 9.0 |
| Fidelity Advisor Series Growth & Income Fund | 8.2 | 7.9 |
| Fidelity Advisor Series Stock Selector Large Cap Value Fund | 7.9 | 7.7 |
| Fidelity Advisor Series Equity Growth Fund | 6.6 | 6.4 |
| Fidelity Advisor Series Opportunistic Insights Fund | 6.1 | 5.9 |
| Fidelity Series All-Sector Equity Fund | 4.6 | 7.6 |
| Fidelity Advisor Series Growth Opportunities Fund | 4.3 | 4.2 |
| | 78.1 | 78.5 |
Asset Allocation (% of fund's net assets)
| Period end |
| | Domestic Equity Funds | 63.9% |
| | International Equity Funds | 30.7% |
| | Bond Funds | 5.4% |

| Six months ago |
| | Domestic Equity Funds | 65.1% |
| | International Equity Funds | 29.4% |
| | Bond Funds | 5.4% |
| | Short-Term Funds | 0.1% |

Domestic Equity Funds category includes Fidelity Series Commodity Strategy Fund which invests in commodity-related investments.
Fidelity Advisor Freedom® 2045 Fund
Investments September 30, 2016 (Unaudited)
Showing Percentage of Net Assets
| Domestic Equity Funds - 63.9% | | | |
| | | Shares | Value |
| Fidelity Advisor Series Equity Growth Fund (a) | | 6,647,222 | $76,177,161 |
| Fidelity Advisor Series Equity-Income Fund (a) | | 11,076,098 | 136,900,576 |
| Fidelity Advisor Series Growth & Income Fund (a) | | 7,173,796 | 94,981,059 |
| Fidelity Advisor Series Growth Opportunities Fund (a) | | 4,619,654 | 50,261,840 |
| Fidelity Advisor Series Opportunistic Insights Fund (a) | | 4,643,000 | 71,177,188 |
| Fidelity Advisor Series Small Cap Fund (a) | | 3,598,600 | 38,145,160 |
| Fidelity Advisor Series Stock Selector Large Cap Value Fund (a) | | 7,645,284 | 91,208,234 |
| Fidelity Series 100 Index Fund (a) | | 2,744,773 | 39,195,361 |
| Fidelity Series 1000 Value Index Fund (a) | | 1,300,398 | 14,525,441 |
| Fidelity Series All-Sector Equity Fund (a) | | 4,016,037 | 53,935,380 |
| Fidelity Series Commodity Strategy Fund (a)(b) | | 3,668,482 | 19,406,269 |
| Fidelity Series Real Estate Equity Fund (a) | | 633,856 | 8,728,197 |
| Fidelity Series Small Cap Opportunities Fund (a) | | 3,506,206 | 46,106,609 |
| TOTAL DOMESTIC EQUITY FUNDS | | | |
| (Cost $645,472,419) | | | 740,748,475 |
|
| International Equity Funds - 30.7% | | | |
| Fidelity Series Emerging Markets Fund (a) | | 6,903,888 | 116,123,392 |
| Fidelity Series International Growth Fund (a) | | 7,657,781 | 107,208,941 |
| Fidelity Series International Small Cap Fund (a) | | 1,581,923 | 24,630,546 |
| Fidelity Series International Value Fund (a) | | 11,353,974 | 107,635,673 |
| TOTAL INTERNATIONAL EQUITY FUNDS | | | |
| (Cost $322,003,395) | | | 355,598,552 |
|
| Bond Funds - 5.4% | | | |
| Fidelity Series Emerging Markets Debt Fund (a) | | 752,273 | 7,793,543 |
| Fidelity Series Floating Rate High Income Fund (a) | | 310,170 | 2,921,800 |
| Fidelity Series High Income Fund (a) | | 3,651,188 | 34,175,119 |
| Fidelity Series Inflation-Protected Bond Index Fund (a) | | 648,838 | 6,533,801 |
| Fidelity Series Investment Grade Bond Fund (a) | | 483,138 | 5,604,398 |
| Fidelity Series Long-Term Treasury Bond Index Fund (a) | | 660 | 6,371 |
| Fidelity Series Real Estate Income Fund (a) | | 526,387 | 5,906,057 |
| TOTAL BOND FUNDS | | | |
| (Cost $63,514,971) | | | 62,941,089 |
|
| Short-Term Funds - 0.0% | | | |
| Fidelity Advisor Series Short-Term Credit Fund (a) | | 19,103 | 191,798 |
| Fidelity Series Government Money Market Fund 0.29% (a)(c) | | 349,988 | 349,988 |
| TOTAL SHORT-TERM FUNDS | | | |
| (Cost $540,297) | | | 541,786 |
| TOTAL INVESTMENT PORTFOLIO - 100.0% | | | |
| (Cost $1,031,531,082) | | | 1,159,829,902 |
| NET OTHER ASSETS (LIABILITIES) - 0.0% | | | (209,657) |
| NET ASSETS - 100% | | | $1,159,620,245 |
Legend
(a) Affiliated Fund
(b) Non-income producing
(c) The rate quoted is the annualized seven-day yield of the fund at period end.
Affiliated Underlying Funds
Information regarding the Fund's fiscal year to date purchases and sales of the affiliated Underlying Funds and income earned by the Fund from investments in affiliated Underlying Funds is as follows:
| Affiliate | Value, beginning of period | Purchases | Sales Proceeds | Dividend Income | Value, end of period |
| Fidelity Advisor Series Equity Growth Fund | $70,529,106 | $7,734,661 | $7,075,794 | - | $76,177,161 |
| Fidelity Advisor Series Equity-Income Fund | 127,274,993 | 13,824,417 | 13,752,616 | 1,240,467 | 136,900,576 |
| Fidelity Advisor Series Growth & Income Fund | 87,931,477 | 8,469,620 | 8,259,087 | 715,477 | 94,981,059 |
| Fidelity Advisor Series Growth Opportunities Fund | 46,454,280 | 4,791,269 | 3,750,772 | - | 50,261,840 |
| Fidelity Advisor Series Opportunistic Insights Fund | 65,458,404 | 7,914,600 | 6,325,012 | - | 71,177,188 |
| Fidelity Advisor Series Short-Term Credit Fund | 191,797 | 20,402 | 21,183 | 1,014 | 191,798 |
| Fidelity Advisor Series Small Cap Fund | 35,204,033 | 4,171,721 | 3,044,074 | - | 38,145,160 |
| Fidelity Advisor Series Stock Selector Large Cap Value Fund | 84,635,390 | 9,741,741 | 8,804,992 | - | 91,208,234 |
| Fidelity Investments Money Market Portfolio Institutional Class 0.59% | 359,444 | 3,265 | 362,709 | 167 | - |
| Fidelity Series 100 Index Fund | 38,406,456 | 2,235,388 | 3,787,454 | - | 39,195,361 |
| Fidelity Series 1000 Value Index Fund | 14,095,055 | 768,194 | 1,463,116 | - | 14,525,441 |
| Fidelity Series All-Sector Equity Fund | 84,552,674 | 3,762,889 | 39,928,796 | - | 53,935,380 |
| Fidelity Series Commodity Strategy Fund | 13,989,987 | 5,548,755 | 1,269,701 | - | 19,406,269 |
| Fidelity Series Emerging Markets Debt Fund | 7,108,174 | 566,932 | 534,051 | 206,173 | 7,793,543 |
| Fidelity Series Emerging Markets Fund | 103,631,453 | 6,806,456 | 7,812,728 | - | 116,123,392 |
| Fidelity Series Floating Rate High Income Fund | 2,790,663 | 212,015 | 218,033 | 62,874 | 2,921,800 |
| Fidelity Series Government Money Market Fund 0.29% | - | 372,649 | 22,660 | 332 | 349,988 |
| Fidelity Series High Income Fund | 33,096,448 | 986,344 | 2,497,858 | 948,969 | 34,175,119 |
| Fidelity Series Inflation-Protected Bond Index Fund | 5,540,326 | 1,318,392 | 430,726 | 2,451 | 6,533,801 |
| Fidelity Series International Growth Fund | 99,675,360 | 10,212,519 | 7,891,710 | - | 107,208,941 |
| Fidelity Series International Small Cap Fund | 23,364,477 | 2,766,187 | 2,440,711 | - | 24,630,546 |
| Fidelity Series International Value Fund | 98,848,932 | 13,198,300 | 8,500,210 | - | 107,635,673 |
| Fidelity Series Investment Grade Bond Fund | 5,532,670 | 767,538 | 845,347 | 69,885 | 5,604,398 |
| Fidelity Series Long-Term Treasury Bond Index Fund | - | 7,221 | 626 | 28 | 6,371 |
| Fidelity Series Real Estate Equity Fund | 8,825,852 | 1,128,702 | 1,042,511 | 78,214 | 8,728,197 |
| Fidelity Series Real Estate Income Fund | 5,654,015 | 646,031 | 574,091 | 143,862 | 5,906,057 |
| Fidelity Series Small Cap Opportunities Fund | 42,485,373 | 4,148,179 | 4,240,810 | 110,867 | 46,106,609 |
| Total | $1,105,636,839 | $112,124,387 | $134,897,378 | $3,580,780 | $1,159,829,902 |
Investment Valuation
All investments are categorized as Level 1 under the Fair Value Hierarchy. The inputs or methodology used for valuing securities may not be an indication of the risk associated with investing in those securities. For more information on valuation inputs please refer to the Investment Valuation section in the accompanying Notes to Financial Statements.
See accompanying notes which are an integral part of the financial statements.
Fidelity Advisor Freedom® 2045 Fund
Financial Statements
Statement of Assets and Liabilities
| | | September 30, 2016 (Unaudited) |
| Assets | | |
| Investment in securities, at value (cost $1,031,531,082) — See accompanying schedule | | $1,159,829,902 |
| Cash | | 4 |
| Receivable for investments sold | | 2,915,727 |
| Receivable for fund shares sold | | 1,807,427 |
| Receivable from investment adviser for expense reductions | | 49 |
| Total assets | | 1,164,553,109 |
| Liabilities | | |
| Payable for investments purchased | $891,884 | |
| Payable for fund shares redeemed | 3,831,256 | |
| Distribution and service plan fees payable | 209,724 | |
| Total liabilities | | 4,932,864 |
| Net Assets | | $1,159,620,245 |
| Net Assets consist of: | | |
| Paid in capital | | $1,034,585,532 |
| Undistributed net investment income | | 2,354,853 |
| Accumulated undistributed net realized gain (loss) on investments | | (5,618,960) |
| Net unrealized appreciation (depreciation) on investments | | 128,298,820 |
| Net Assets | | $1,159,620,245 |
| Calculation of Maximum Offering Price | | |
| Class A: | | |
| Net Asset Value and redemption price per share ($552,862,334 ÷ 52,176,651 shares) | | $10.60 |
| Maximum offering price per share (100/94.25 of $10.60) | | $11.25 |
| Class T: | | |
| Net Asset Value and redemption price per share ($178,729,058 ÷ 16,987,232 shares) | | $10.52 |
| Maximum offering price per share (100/96.50 of $10.52) | | $10.90 |
| Class C: | | |
| Net Asset Value and offering price per share ($25,354,276 ÷ 2,435,871 shares)(a) | | $10.41 |
| Class I: | | |
| Net Asset Value, offering price and redemption price per share ($402,674,577 ÷ 37,750,431 shares) | | $10.67 |
(a) Redemption price per share is equal to net asset value less any applicable contingent deferred sales charge.
See accompanying notes which are an integral part of the financial statements.
Statement of Operations
| | | Six months ended September 30, 2016 (Unaudited) |
| Investment Income | | |
| Income distributions from underlying funds | | $3,580,780 |
| Expenses | | |
| Distribution and service plan fees | $1,225,909 | |
| Independent trustees' fees and expenses | 2,531 | |
| Total expenses before reductions | 1,228,440 | |
| Expense reductions | (2,531) | 1,225,909 |
| Net investment income (loss) | | 2,354,871 |
| Realized and Unrealized Gain (Loss) | | |
| Realized gain (loss) on sale of underlying fund shares | 1,274,123 | |
| Capital gain distributions from underlying funds | 639,371 | |
| Total net realized gain (loss) | | 1,913,494 |
| Change in net unrealized appreciation (depreciation) on underlying funds | | 75,691,922 |
| Net gain (loss) | | 77,605,416 |
| Net increase (decrease) in net assets resulting from operations | | $79,960,287 |
See accompanying notes which are an integral part of the financial statements.
Statement of Changes in Net Assets
| | Six months ended September 30, 2016 (Unaudited) | Year ended March 31, 2016 |
| Increase (Decrease) in Net Assets | | |
| Operations | | |
| Net investment income (loss) | $2,354,871 | $14,832,884 |
| Net realized gain (loss) | 1,913,494 | 46,390,041 |
| Change in net unrealized appreciation (depreciation) | 75,691,922 | (104,373,890) |
| Net increase (decrease) in net assets resulting from operations | 79,960,287 | (43,150,965) |
| Distributions to shareholders from net investment income | (18) | (15,159,655) |
| Distributions to shareholders from net realized gain | (37,749,417) | (39,737,449) |
| Total distributions | (37,749,435) | (54,897,104) |
| Share transactions - net increase (decrease) | 11,965,798 | 295,212 |
| Total increase (decrease) in net assets | 54,176,650 | (97,752,857) |
| Net Assets | | |
| Beginning of period | 1,105,443,595 | 1,203,196,452 |
| End of period | $1,159,620,245 | $1,105,443,595 |
| Other Information | | |
| Undistributed net investment income end of period | $2,354,853 | $– |
See accompanying notes which are an integral part of the financial statements.
Financial Highlights — Fidelity Advisor Freedom 2045 Fund Class A
| | Six months ended (Unaudited) September 30, | Years ended March 31, | | | | |
| | 2016 | 2016 | 2015 | 2014 | 2013 | 2012 |
| Selected Per–Share Data | | | | | | |
| Net asset value, beginning of period | $10.23 | $11.15 | $11.31 | $10.46 | $9.79 | $10.08 |
| Income from Investment Operations | | | | | | |
| Net investment income (loss)A | .02 | .13 | .15 | .12 | .16 | .13 |
| Net realized and unrealized gain (loss) | .70 | (.54) | .59 | 1.39 | .81 | (.14) |
| Total from investment operations | .72 | (.41) | .74 | 1.51 | .97 | (.01) |
| Distributions from net investment income | – | (.14) | (.16) | (.12) | (.15) | (.12) |
| Distributions from net realized gain | (.35) | (.37) | (.74) | (.54) | (.15) | (.16) |
| Total distributions | (.35) | (.51) | (.90) | (.66) | (.30) | (.28) |
| Net asset value, end of period | $10.60 | $10.23 | $11.15 | $11.31 | $10.46 | $9.79 |
| Total ReturnB,C,D | 7.27% | (3.85)% | 6.80% | 14.74% | 10.21% | .12% |
| Ratios to Average Net AssetsE,F | | | | | | |
| Expenses before reductions | .25%G | .25% | .25% | .25% | .25% | .25% |
| Expenses net of fee waivers, if any | .25%G | .25% | .25% | .25% | .25% | .25% |
| Expenses net of all reductions | .25%G | .25% | .25% | .25% | .25% | .25% |
| Net investment income (loss) | .38%G | 1.27% | 1.37% | 1.12% | 1.59% | 1.41% |
| Supplemental Data | | | | | | |
| Net assets, end of period (000 omitted) | $552,862 | $531,510 | $623,734 | $612,735 | $527,525 | $403,850 |
| Portfolio turnover rateE | 20%G | 26% | 27% | 46% | 25% | 11% |
A Calculated based on average shares outstanding during the period.
B Total returns for periods of less than one year are not annualized.
C Total returns would have been lower if certain expenses had not been reduced during the applicable periods shown.
D Total returns do not include the effect of the sales charges.
E Amounts do not include the activity of the Underlying Funds.
F Expense ratios reflect operating expenses of the class. Expenses before reductions do not reflect amounts reimbursed by the investment adviser or reductions from expense offset arrangements and do not represent the amount paid by the class during periods when reimbursements or reductions occur. Expenses net of fee waivers reflect expenses after reimbursement by the investment adviser but prior to reductions from expense offset arrangements. Expenses net of all reductions represent the net expenses paid by the class but do not include expenses of the underlying funds in which the Fund invests.
G Annualized
See accompanying notes which are an integral part of the financial statements.
Financial Highlights — Fidelity Advisor Freedom 2045 Fund Class T
| | Six months ended (Unaudited) September 30, | Years ended March 31, | | | | |
| | 2016 | 2016 | 2015 | 2014 | 2013 | 2012 |
| Selected Per–Share Data | | | | | | |
| Net asset value, beginning of period | $10.17 | $11.09 | $11.26 | $10.42 | $9.75 | $10.04 |
| Income from Investment Operations | | | | | | |
| Net investment income (loss)A | .01 | .11 | .13 | .09 | .13 | .11 |
| Net realized and unrealized gain (loss) | .69 | (.54) | .57 | 1.39 | .82 | (.15) |
| Total from investment operations | .70 | (.43) | .70 | 1.48 | .95 | (.04) |
| Distributions from net investment income | –B | (.12) | (.13) | (.10) | (.12) | (.10) |
| Distributions from net realized gain | (.35) | (.37) | (.74) | (.54) | (.15) | (.16) |
| Total distributions | (.35) | (.49) | (.87) | (.64) | (.28)C | (.25)D |
| Net asset value, end of period | $10.52 | $10.17 | $11.09 | $11.26 | $10.42 | $9.75 |
| Total ReturnE,F,G | 7.11% | (4.10)% | 6.50% | 14.45% | 10.02% | (.15)% |
| Ratios to Average Net AssetsH,I | | | | | | |
| Expenses before reductions | .50%J | .50% | .50% | .50% | .50% | .50% |
| Expenses net of fee waivers, if any | .50%J | .50% | .50% | .50% | .50% | .50% |
| Expenses net of all reductions | .50%J | .50% | .50% | .50% | .50% | .50% |
| Net investment income (loss) | .13%J | 1.02% | 1.12% | .87% | 1.34% | 1.16% |
| Supplemental Data | | | | | | |
| Net assets, end of period (000 omitted) | $178,729 | $158,557 | $153,677 | $128,619 | $92,998 | $62,438 |
| Portfolio turnover rateH | 20%J | 26% | 27% | 46% | 25% | 11% |
A Calculated based on average shares outstanding during the period.
B Amount represents less than $.005 per share.
C Total distributions of $.28 per share is comprised of distributions from net investment income of $.124 and distributions from net realized gain of $.153 per share.
D Total distributions of $.25 per share is comprised of distributions from net investment income of $.096 and distributions from net realized gain of $.155 per share.
E Total returns for periods of less than one year are not annualized.
F Total returns would have been lower if certain expenses had not been reduced during the applicable periods shown.
G Total returns do not include the effect of the sales charges.
H Amounts do not include the activity of the Underlying Funds.
I Expense ratios reflect operating expenses of the class. Expenses before reductions do not reflect amounts reimbursed by the investment adviser or reductions from expense offset arrangements and do not represent the amount paid by the class during periods when reimbursements or reductions occur. Expenses net of fee waivers reflect expenses after reimbursement by the investment adviser but prior to reductions from expense offset arrangements. Expenses net of all reductions represent the net expenses paid by the class but do not include expenses of the underlying funds in which the Fund invests.
J Annualized
See accompanying notes which are an integral part of the financial statements.
Financial Highlights — Fidelity Advisor Freedom 2045 Fund Class C
| | Six months ended (Unaudited) September 30, | Years ended March 31, | | | | |
| | 2016 | 2016 | 2015 | 2014 | 2013 | 2012 |
| Selected Per–Share Data | | | | | | |
| Net asset value, beginning of period | $10.09 | $11.01 | $11.19 | $10.36 | $9.71 | $10.00 |
| Income from Investment Operations | | | | | | |
| Net investment income (loss)A | (.02) | .05 | .07 | .04 | .08 | .06 |
| Net realized and unrealized gain (loss) | .69 | (.53) | .57 | 1.38 | .81 | (.14) |
| Total from investment operations | .67 | (.48) | .64 | 1.42 | .89 | (.08) |
| Distributions from net investment income | – | (.08) | (.09) | (.06) | (.09) | (.06) |
| Distributions from net realized gain | (.35) | (.36) | (.73) | (.53) | (.15) | (.15) |
| Total distributions | (.35) | (.44) | (.82) | (.59) | (.24) | (.21) |
| Net asset value, end of period | $10.41 | $10.09 | $11.01 | $11.19 | $10.36 | $9.71 |
| Total ReturnB,C,D | 6.86% | (4.59)% | 5.95% | 13.95% | 9.42% | (.62)% |
| Ratios to Average Net AssetsE,F | | | | | | |
| Expenses before reductions | 1.00%G | 1.00% | 1.00% | 1.00% | 1.00% | 1.00% |
| Expenses net of fee waivers, if any | 1.00%G | 1.00% | 1.00% | 1.00% | 1.00% | 1.00% |
| Expenses net of all reductions | 1.00%G | 1.00% | 1.00% | 1.00% | 1.00% | 1.00% |
| Net investment income (loss) | (.37)%G | .53% | .62% | .37% | .84% | .66% |
| Supplemental Data | | | | | | |
| Net assets, end of period (000 omitted) | $25,354 | $23,423 | $22,493 | $18,457 | $13,415 | $9,926 |
| Portfolio turnover rateE | 20%G | 26% | 27% | 46% | 25% | 11% |
A Calculated based on average shares outstanding during the period.
B Total returns for periods of less than one year are not annualized.
C Total returns would have been lower if certain expenses had not been reduced during the applicable periods shown.
D Total returns do not include the effect of the contingent deferred sales charge.
E Amounts do not include the activity of the Underlying Funds.
F Expense ratios reflect operating expenses of the class. Expenses before reductions do not reflect amounts reimbursed by the investment adviser or reductions from expense offset arrangements and do not represent the amount paid by the class during periods when reimbursements or reductions occur. Expenses net of fee waivers reflect expenses after reimbursement by the investment adviser but prior to reductions from expense offset arrangements. Expenses net of all reductions represent the net expenses paid by the class but do not include expenses of the underlying funds in which the Fund invests.
G Annualized
See accompanying notes which are an integral part of the financial statements.
Financial Highlights — Fidelity Advisor Freedom 2045 Fund Class I
| | Six months ended (Unaudited) September 30, | Years ended March 31, | | | | |
| | 2016 | 2016 | 2015 | 2014 | 2013 | 2012 |
| Selected Per–Share Data | | | | | | |
| Net asset value, beginning of period | $10.28 | $11.21 | $11.37 | $10.50 | $9.83 | $10.11 |
| Income from Investment Operations | | | | | | |
| Net investment income (loss)A | .03 | .16 | .18 | .15 | .18 | .16 |
| Net realized and unrealized gain (loss) | .71 | (.55) | .59 | 1.41 | .81 | (.14) |
| Total from investment operations | .74 | (.39) | .77 | 1.56 | .99 | .02 |
| Distributions from net investment income | –B | (.17) | (.19) | (.15) | (.17) | (.14) |
| Distributions from net realized gain | (.35) | (.37) | (.74) | (.54) | (.15) | (.16) |
| Total distributions | (.35) | (.54) | (.93) | (.69) | (.32) | (.30) |
| Net asset value, end of period | $10.67 | $10.28 | $11.21 | $11.37 | $10.50 | $9.83 |
| Total ReturnC,D | 7.43% | (3.66)% | 7.03% | 15.14% | 10.43% | .45% |
| Ratios to Average Net AssetsE,F | | | | | | |
| Expenses before reductionsG | –%H | –% | –% | –% | –% | –% |
| Expenses net of fee waivers, if any | –%H | –% | –% | –% | –% | –% |
| Expenses net of all reductions | –%H | –% | –% | –% | –% | –% |
| Net investment income (loss) | .63%H | 1.52% | 1.62% | 1.37% | 1.84% | 1.66% |
| Supplemental Data | | | | | | |
| Net assets, end of period (000 omitted) | $402,675 | $390,675 | $400,667 | $378,776 | $269,633 | $162,772 |
| Portfolio turnover rateE | 20%H | 26% | 27% | 46% | 25% | 11% |
A Calculated based on average shares outstanding during the period.
B Amount represents less than $.005 per share.
C Total returns for periods of less than one year are not annualized.
D Total returns would have been lower if certain expenses had not been reduced during the applicable periods shown.
E Amounts do not include the activity of the Underlying Funds.
F Expense ratios reflect operating expenses of the class. Expenses before reductions do not reflect amounts reimbursed by the investment adviser or reductions from expense offset arrangements and do not represent the amount paid by the class during periods when reimbursements or reductions occur. Expenses net of fee waivers reflect expenses after reimbursement by the investment adviser but prior to reductions from expense offset arrangements. Expenses net of all reductions represent the net expenses paid by the class but do not include expenses of the underlying funds in which the Fund invests.
G Amount represents less than .005%.
H Annualized
See accompanying notes which are an integral part of the financial statements.
Fidelity Advisor Freedom® 2050 Fund
Investment Summary (Unaudited)
The information in the following tables is based on the direct investments of the Fund.
Top Holdings as of September 30, 2016
| | % of fund's net assets | % of fund's net assets 6 months ago |
| Fidelity Advisor Series Equity-Income Fund | 11.8 | 11.5 |
| Fidelity Series Emerging Markets Fund | 10.0 | 9.4 |
| Fidelity Series International Value Fund | 9.3 | 9.0 |
| Fidelity Series International Growth Fund | 9.3 | 9.0 |
| Fidelity Advisor Series Growth & Income Fund | 8.2 | 7.9 |
| Fidelity Advisor Series Stock Selector Large Cap Value Fund | 7.9 | 7.7 |
| Fidelity Advisor Series Equity Growth Fund | 6.6 | 6.4 |
| Fidelity Advisor Series Opportunistic Insights Fund | 6.1 | 5.9 |
| Fidelity Series All-Sector Equity Fund | 4.6 | 7.6 |
| Fidelity Advisor Series Growth Opportunities Fund | 4.3 | 4.2 |
| | 78.1 | 78.6 |
Asset Allocation (% of fund's net assets)
| Period end |
| | Domestic Equity Funds | 63.9% |
| | International Equity Funds | 30.7% |
| | Bond Funds | 5.4% |

| Six months ago |
| | Domestic Equity Funds | 65.1% |
| | International Equity Funds | 29.5% |
| | Bond Funds | 5.4% |

Domestic Equity Funds category includes Fidelity Series Commodity Strategy Fund which invests in commodity-related investments.
Fidelity Advisor Freedom® 2050 Fund
Investments September 30, 2016 (Unaudited)
Showing Percentage of Net Assets
| Domestic Equity Funds - 63.9% | | | |
| | | Shares | Value |
| Fidelity Advisor Series Equity Growth Fund (a) | | 5,110,916 | $58,571,095 |
| Fidelity Advisor Series Equity-Income Fund (a) | | 8,517,979 | 105,282,228 |
| Fidelity Advisor Series Growth & Income Fund (a) | | 5,516,822 | 73,042,720 |
| Fidelity Advisor Series Growth Opportunities Fund (a) | | 3,551,713 | 38,642,636 |
| Fidelity Advisor Series Opportunistic Insights Fund (a) | | 3,569,909 | 54,726,710 |
| Fidelity Advisor Series Small Cap Fund (a) | | 2,767,472 | 29,335,200 |
| Fidelity Advisor Series Stock Selector Large Cap Value Fund (a) | | 5,879,604 | 70,143,677 |
| Fidelity Series 100 Index Fund (a) | | 2,110,847 | 30,142,888 |
| Fidelity Series 1000 Value Index Fund (a) | | 1,000,153 | 11,171,711 |
| Fidelity Series All-Sector Equity Fund (a) | | 3,087,673 | 41,467,451 |
| Fidelity Series Commodity Strategy Fund (a)(b) | | 2,842,537 | 15,037,019 |
| Fidelity Series Real Estate Equity Fund (a) | | 488,272 | 6,723,511 |
| Fidelity Series Small Cap Opportunities Fund (a) | | 2,696,239 | 35,455,537 |
| TOTAL DOMESTIC EQUITY FUNDS | | | |
| (Cost $496,375,727) | | | 569,742,383 |
|
| International Equity Funds - 30.7% | | | |
| Fidelity Series Emerging Markets Fund (a) | | 5,310,767 | 89,327,103 |
| Fidelity Series International Growth Fund (a) | | 5,888,784 | 82,442,980 |
| Fidelity Series International Small Cap Fund (a) | | 1,216,499 | 18,940,891 |
| Fidelity Series International Value Fund (a) | | 8,731,184 | 82,771,625 |
| TOTAL INTERNATIONAL EQUITY FUNDS | | | |
| (Cost $247,238,502) | | | 273,482,599 |
|
| Bond Funds - 5.4% | | | |
| Fidelity Series Emerging Markets Debt Fund (a) | | 578,852 | 5,996,906 |
| Fidelity Series Floating Rate High Income Fund (a) | | 238,534 | 2,246,992 |
| Fidelity Series High Income Fund (a) | | 2,780,179 | 26,022,479 |
| Fidelity Series Inflation-Protected Bond Index Fund (a) | | 510,846 | 5,144,222 |
| Fidelity Series Investment Grade Bond Fund (a) | | 372,152 | 4,316,957 |
| Fidelity Series Long-Term Treasury Bond Index Fund (a) | | 529 | 5,103 |
| Fidelity Series Real Estate Income Fund (a) | | 404,148 | 4,534,536 |
| TOTAL BOND FUNDS | | | |
| (Cost $48,935,830) | | | 48,267,195 |
|
| Short-Term Funds - 0.0% | | | |
| Fidelity Advisor Series Short-Term Credit Fund (a) | | 14,623 | 146,811 |
| Fidelity Series Government Money Market Fund 0.29% (a)(c) | | 269,549 | 269,549 |
| TOTAL SHORT-TERM FUNDS | | | |
| (Cost $415,217) | | | 416,360 |
| TOTAL INVESTMENT PORTFOLIO - 100.0% | | | |
| (Cost $792,965,276) | | | 891,908,537 |
| NET OTHER ASSETS (LIABILITIES) - 0.0% | | | (161,396) |
| NET ASSETS - 100% | | | $891,747,141 |
Legend
(a) Affiliated Fund
(b) Non-income producing
(c) The rate quoted is the annualized seven-day yield of the fund at period end.
Affiliated Underlying Funds
Information regarding the Fund's fiscal year to date purchases and sales of the affiliated Underlying Funds and income earned by the Fund from investments in affiliated Underlying Funds is as follows:
| Affiliate | Value, beginning of period | Purchases | Sales Proceeds | Dividend Income | Value, end of period |
| Fidelity Advisor Series Equity Growth Fund | $53,444,997 | $6,470,362 | $5,161,649 | - | $58,571,095 |
| Fidelity Advisor Series Equity-Income Fund | 96,445,139 | 11,426,361 | 9,899,271 | 945,778 | 105,282,228 |
| Fidelity Advisor Series Growth & Income Fund | 66,631,764 | 7,067,148 | 5,892,094 | 545,690 | 73,042,720 |
| Fidelity Advisor Series Growth Opportunities Fund | 35,201,691 | 3,991,363 | 2,667,939 | - | 38,642,636 |
| Fidelity Advisor Series Opportunistic Insights Fund | 49,602,389 | 6,569,552 | 4,605,154 | - | 54,726,710 |
| Fidelity Advisor Series Short-Term Credit Fund | 145,425 | 17,443 | 16,655 | 777 | 146,811 |
| Fidelity Advisor Series Small Cap Fund | 26,676,520 | 3,472,959 | 2,203,741 | - | 29,335,200 |
| Fidelity Advisor Series Stock Selector Large Cap Value Fund | 64,134,084 | 7,995,690 | 6,293,388 | - | 70,143,677 |
| Fidelity Investments Money Market Portfolio Institutional Class 0.59% | 272,285 | 3,162 | 275,447 | 127 | - |
| Fidelity Series 100 Index Fund | 29,102,345 | 1,992,678 | 2,742,470 | - | 30,142,888 |
| Fidelity Series 1000 Value Index Fund | 10,680,890 | 681,332 | 1,050,491 | - | 11,171,711 |
| Fidelity Series All-Sector Equity Fund | 64,061,708 | 3,424,822 | 30,262,225 | - | 41,467,451 |
| Fidelity Series Commodity Strategy Fund | 10,616,309 | 4,476,159 | 929,798 | - | 15,037,019 |
| Fidelity Series Emerging Markets Debt Fund | 5,382,582 | 481,740 | 366,493 | 157,783 | 5,996,906 |
| Fidelity Series Emerging Markets Fund | 78,542,100 | 6,138,743 | 5,709,723 | - | 89,327,103 |
| Fidelity Series Floating Rate High Income Fund | 2,114,129 | 184,395 | 156,250 | 48,147 | 2,246,992 |
| Fidelity Series Government Money Market Fund 0.29% | - | 286,497 | 16,947 | 255 | 269,549 |
| Fidelity Series High Income Fund | 25,037,460 | 752,865 | 1,734,702 | 721,142 | 26,022,479 |
| Fidelity Series Inflation-Protected Bond Index Fund | 4,198,268 | 1,164,009 | 299,758 | 1,888 | 5,144,222 |
| Fidelity Series International Growth Fund | 75,554,508 | 8,681,790 | 5,781,379 | - | 82,442,980 |
| Fidelity Series International Small Cap Fund | 17,708,115 | 2,261,806 | 1,752,906 | - | 18,940,891 |
| Fidelity Series International Value Fund | 74,902,889 | 10,896,356 | 6,160,222 | - | 82,771,625 |
| Fidelity Series Investment Grade Bond Fund | 4,192,443 | 627,003 | 616,751 | 53,517 | 4,316,957 |
| Fidelity Series Long-Term Treasury Bond Index Fund | - | 5,552 | 274 | 22 | 5,103 |
| Fidelity Series Real Estate Equity Fund | 6,697,352 | 925,127 | 755,096 | 60,067 | 6,723,511 |
| Fidelity Series Real Estate Income Fund | 4,275,417 | 532,701 | 410,565 | 110,201 | 4,534,536 |
| Fidelity Series Small Cap Opportunities Fund | 32,194,064 | 3,479,069 | 3,061,873 | 85,233 | 35,455,537 |
| Total | $837,814,873 | $94,006,684 | $98,823,261 | $2,730,627 | $891,908,537 |
Investment Valuation
All investments are categorized as Level 1 under the Fair Value Hierarchy. The inputs or methodology used for valuing securities may not be an indication of the risk associated with investing in those securities. For more information on valuation inputs please refer to the Investment Valuation section in the accompanying Notes to Financial Statements.
See accompanying notes which are an integral part of the financial statements.
Fidelity Advisor Freedom® 2050 Fund
Financial Statements
Statement of Assets and Liabilities
| | | September 30, 2016 (Unaudited) |
| Assets | | |
| Investment in securities, at value (cost $792,965,276) — See accompanying schedule | | $891,908,537 |
| Cash | | 1 |
| Receivable for investments sold | | 3,257,577 |
| Receivable for fund shares sold | | 1,604,060 |
| Receivable from investment adviser for expense reductions | | 56 |
| Total assets | | 896,770,231 |
| Liabilities | | |
| Payable for investments purchased | $763,416 | |
| Payable for fund shares redeemed | 4,098,194 | |
| Distribution and service plan fees payable | 161,480 | |
| Total liabilities | | 5,023,090 |
| Net Assets | | $891,747,141 |
| Net Assets consist of: | | |
| Paid in capital | | $795,862,743 |
| Undistributed net investment income | | 1,784,009 |
| Accumulated undistributed net realized gain (loss) on investments | | (4,842,872) |
| Net unrealized appreciation (depreciation) on investments | | 98,943,261 |
| Net Assets | | $891,747,141 |
| Calculation of Maximum Offering Price | | |
| Class A: | | |
| Net Asset Value and redemption price per share ($384,341,203 ÷ 36,482,081 shares) | | $10.54 |
| Maximum offering price per share (100/94.25 of $10.54) | | $11.18 |
| Class T: | | |
| Net Asset Value and redemption price per share ($144,164,173 ÷ 13,754,389 shares) | | $10.48 |
| Maximum offering price per share (100/96.50 of $10.48) | | $10.86 |
| Class C: | | |
| Net Asset Value and offering price per share ($26,397,507 ÷ 2,543,919 shares)(a) | | $10.38 |
| Class I: | | |
| Net Asset Value, offering price and redemption price per share ($336,844,258 ÷ 31,769,552 shares) | | $10.60 |
(a) Redemption price per share is equal to net asset value less any applicable contingent deferred sales charge.
See accompanying notes which are an integral part of the financial statements.
Statement of Operations
| | | Six months ended September 30, 2016 (Unaudited) |
| Investment Income | | |
| Income distributions from underlying funds | | $2,730,627 |
| Expenses | | |
| Distribution and service plan fees | $942,045 | |
| Independent trustees' fees and expenses | 1,931 | |
| Total expenses before reductions | 943,976 | |
| Expense reductions | (1,931) | 942,045 |
| Net investment income (loss) | | 1,788,582 |
| Realized and Unrealized Gain (Loss) | | |
| Realized gain (loss) on sale of underlying fund shares | 802,947 | |
| Capital gain distributions from underlying funds | 492,076 | |
| Total net realized gain (loss) | | 1,295,023 |
| Change in net unrealized appreciation (depreciation) on underlying funds | | 58,107,283 |
| Net gain (loss) | | 59,402,306 |
| Net increase (decrease) in net assets resulting from operations | | $61,190,888 |
See accompanying notes which are an integral part of the financial statements.
Statement of Changes in Net Assets
| | Six months ended September 30, 2016 (Unaudited) | Year ended March 31, 2016 |
| Increase (Decrease) in Net Assets | | |
| Operations | | |
| Net investment income (loss) | $1,788,582 | $11,027,016 |
| Net realized gain (loss) | 1,295,023 | 33,922,391 |
| Change in net unrealized appreciation (depreciation) | 58,107,283 | (76,873,819) |
| Net increase (decrease) in net assets resulting from operations | 61,190,888 | (31,924,412) |
| Distributions to shareholders from net investment income | (97,227) | (11,232,904) |
| Distributions to shareholders from net realized gain | (28,132,566) | (28,452,580) |
| Total distributions | (28,229,793) | (39,685,484) |
| Share transactions - net increase (decrease) | 21,118,530 | 36,112,151 |
| Total increase (decrease) in net assets | 54,079,625 | (35,497,745) |
| Net Assets | | |
| Beginning of period | 837,667,516 | 873,165,261 |
| End of period | $891,747,141 | $837,667,516 |
| Other Information | | |
| Undistributed net investment income end of period | $1,784,009 | $92,654 |
See accompanying notes which are an integral part of the financial statements.
Financial Highlights — Fidelity Advisor Freedom 2050 Fund Class A
| | Six months ended (Unaudited) September 30, | Years ended March 31, | | | | |
| | 2016 | 2016 | 2015 | 2014 | 2013 | 2012 |
| Selected Per–Share Data | | | | | | |
| Net asset value, beginning of period | $10.16 | $11.06 | $11.24 | $10.39 | $9.61 | $9.93 |
| Income from Investment Operations | | | | | | |
| Net investment income (loss)A | .02 | .13 | .15 | .12 | .15 | .12 |
| Net realized and unrealized gain (loss) | .70 | (.53) | .58 | 1.40 | .82 | (.17) |
| Total from investment operations | .72 | (.40) | .73 | 1.52 | .97 | (.05) |
| Distributions from net investment income | – | (.14) | (.16) | (.12) | (.14) | (.11) |
| Distributions from net realized gain | (.34) | (.36) | (.76) | (.55) | (.05) | (.16) |
| Total distributions | (.34) | (.50) | (.91)B | (.67) | (.19) | (.27) |
| Net asset value, end of period | $10.54 | $10.16 | $11.06 | $11.24 | $10.39 | $9.61 |
| Total ReturnC,D,E | 7.30% | (3.84)% | 6.77% | 14.91% | 10.23% | (.22)% |
| Ratios to Average Net AssetsF,G | | | | | | |
| Expenses before reductions | .25%H | .25% | .25% | .25% | .25% | .25% |
| Expenses net of fee waivers, if any | .25%H | .25% | .25% | .25% | .25% | .25% |
| Expenses net of all reductions | .25%H | .25% | .25% | .25% | .25% | .25% |
| Net investment income (loss) | .38%H | 1.28% | 1.37% | 1.10% | 1.56% | 1.32% |
| Supplemental Data | | | | | | |
| Net assets, end of period (000 omitted) | $384,341 | $363,199 | $415,103 | $401,589 | $352,814 | $280,478 |
| Portfolio turnover rateF | 22%H | 24% | 30% | 47% | 28% | 12% |
A Calculated based on average shares outstanding during the period.
B Total distributions of $.91 per share is comprised of distributions from net investment income of $.155 and distributions from net realized gain of $.755 per share.
C Total returns for periods of less than one year are not annualized.
D Total returns would have been lower if certain expenses had not been reduced during the applicable periods shown.
E Total returns do not include the effect of the sales charges.
F Amounts do not include the activity of the Underlying Funds.
G Expense ratios reflect operating expenses of the class. Expenses before reductions do not reflect amounts reimbursed by the investment adviser or reductions from expense offset arrangements and do not represent the amount paid by the class during periods when reimbursements or reductions occur. Expenses net of fee waivers reflect expenses after reimbursement by the investment adviser but prior to reductions from expense offset arrangements. Expenses net of all reductions represent the net expenses paid by the class but do not include expenses of the underlying funds in which the Fund invests.
H Annualized
See accompanying notes which are an integral part of the financial statements.
Financial Highlights — Fidelity Advisor Freedom 2050 Fund Class T
| | Six months ended (Unaudited) September 30, | Years ended March 31, | | | | |
| | 2016 | 2016 | 2015 | 2014 | 2013 | 2012 |
| Selected Per–Share Data | | | | | | |
| Net asset value, beginning of period | $10.12 | $11.02 | $11.20 | $10.36 | $9.58 | $9.90 |
| Income from Investment Operations | | | | | | |
| Net investment income (loss)A | .01 | .11 | .12 | .09 | .13 | .10 |
| Net realized and unrealized gain (loss) | .68 | (.54) | .58 | 1.39 | .81 | (.17) |
| Total from investment operations | .69 | (.43) | .70 | 1.48 | .94 | (.07) |
| Distributions from net investment income | – | (.12) | (.13) | (.10) | (.12) | (.09) |
| Distributions from net realized gain | (.33) | (.36) | (.76) | (.55) | (.05) | (.16) |
| Total distributions | (.33) | (.47)B | (.88)C | (.64)D | (.16)E | (.25) |
| Net asset value, end of period | $10.48 | $10.12 | $11.02 | $11.20 | $10.36 | $9.58 |
| Total ReturnF,G,H | 7.07% | (4.08)% | 6.54% | 14.61% | 9.99% | (.48)% |
| Ratios to Average Net AssetsI,J | | | | | | |
| Expenses before reductions | .50%K | .50% | .50% | .50% | .50% | .50% |
| Expenses net of fee waivers, if any | .50%K | .50% | .50% | .50% | .50% | .50% |
| Expenses net of all reductions | .50%K | .50% | .50% | .50% | .50% | .50% |
| Net investment income (loss) | .13%K | 1.04% | 1.12% | .85% | 1.31% | 1.07% |
| Supplemental Data | | | | | | |
| Net assets, end of period (000 omitted) | $144,164 | $127,842 | $126,987 | $115,391 | $89,196 | $64,512 |
| Portfolio turnover rateI | 22%K | 24% | 30% | 47% | 28% | 12% |
A Calculated based on average shares outstanding during the period.
B Total distributions of $.47 per share is comprised of distributions from net investment income of $.115 and distributions from net realized gain of $.355 per share.
C Total distributions of $.88 per share is comprised of distributions from net investment income of $.128 and distributions from net realized gain of $.755 per share.
D Total distributions of $.64 per share is comprised of distributions from net investment income of $.097 and distributions from net realized gain of $.546 per share.
E Total distributions of $.16 per share is comprised of distributions from net investment income of $.117 and distributions from net realized gain of $.046 per share.
F Total returns for periods of less than one year are not annualized.
G Total returns would have been lower if certain expenses had not been reduced during the applicable periods shown.
H Total returns do not include the effect of the sales charges.
I Amounts do not include the activity of the Underlying Funds.
J Expense ratios reflect operating expenses of the class. Expenses before reductions do not reflect amounts reimbursed by the investment adviser or reductions from expense offset arrangements and do not represent the amount paid by the class during periods when reimbursements or reductions occur. Expenses net of fee waivers reflect expenses after reimbursement by the investment adviser but prior to reductions from expense offset arrangements. Expenses net of all reductions represent the net expenses paid by the class but do not include expenses of the underlying funds in which the Fund invests.
K Annualized
See accompanying notes which are an integral part of the financial statements.
See accompanying notes which are an integral part of the financial statements.
Financial Highlights — Fidelity Advisor Freedom 2050 Fund Class C
| | Six months ended (Unaudited) September 30, | Years ended March 31, | | | | |
| | 2016 | 2016 | 2015 | 2014 | 2013 | 2012 |
| Selected Per–Share Data | | | | | | |
| Net asset value, beginning of period | $10.04 | $10.95 | $11.14 | $10.31 | $9.54 | $9.87 |
| Income from Investment Operations | | | | | | |
| Net investment income (loss)A | (.02) | .06 | .07 | .04 | .08 | .05 |
| Net realized and unrealized gain (loss) | .69 | (.55) | .57 | 1.38 | .82 | (.18) |
| Total from investment operations | .67 | (.49) | .64 | 1.42 | .90 | (.13) |
| Distributions from net investment income | – | (.08) | (.09) | (.06) | (.08) | (.05) |
| Distributions from net realized gain | (.33) | (.34) | (.74) | (.54) | (.05) | (.15) |
| Total distributions | (.33) | (.42) | (.83) | (.59)B | (.13) | (.20) |
| Net asset value, end of period | $10.38 | $10.04 | $10.95 | $11.14 | $10.31 | $9.54 |
| Total ReturnC,D,E | 6.92% | (4.67)% | 6.01% | 14.06% | 9.53% | (1.08)% |
| Ratios to Average Net AssetsF,G | | | | | | |
| Expenses before reductions | 1.00%H | 1.00% | 1.00% | 1.00% | 1.00% | 1.00% |
| Expenses net of fee waivers, if any | 1.00%H | 1.00% | 1.00% | 1.00% | 1.00% | 1.00% |
| Expenses net of all reductions | 1.00%H | 1.00% | 1.00% | 1.00% | 1.00% | 1.00% |
| Net investment income (loss) | (.37)%H | .54% | .63% | .35% | .81% | .57% |
| Supplemental Data | | | | | | |
| Net assets, end of period (000 omitted) | $26,398 | $24,460 | $24,652 | $21,190 | $16,188 | $13,344 |
| Portfolio turnover rateF | 22%H | 24% | 30% | 47% | 28% | 12% |
A Calculated based on average shares outstanding during the period.
B Total distributions of $.59 per share is comprised of distributions from net investment income of $.056 and distributions from net realized gain of $.536 per share.
C Total returns for periods of less than one year are not annualized.
D Total returns would have been lower if certain expenses had not been reduced during the applicable periods shown.
E Total returns do not include the effect of the contingent deferred sales charge.
F Amounts do not include the activity of the Underlying Funds.
G Expense ratios reflect operating expenses of the class. Expenses before reductions do not reflect amounts reimbursed by the investment adviser or reductions from expense offset arrangements and do not represent the amount paid by the class during periods when reimbursements or reductions occur. Expenses net of fee waivers reflect expenses after reimbursement by the investment adviser but prior to reductions from expense offset arrangements. Expenses net of all reductions represent the net expenses paid by the class but do not include expenses of the underlying funds in which the Fund invests.
H Annualized
See accompanying notes which are an integral part of the financial statements.
Financial Highlights — Fidelity Advisor Freedom 2050 Fund Class I
| | Six months ended (Unaudited) September 30, | Years ended March 31, | | | | |
| | 2016 | 2016 | 2015 | 2014 | 2013 | 2012 |
| Selected Per–Share Data | | | | | | |
| Net asset value, beginning of period | $10.22 | $11.13 | $11.30 | $10.44 | $9.65 | $9.97 |
| Income from Investment Operations | | | | | | |
| Net investment income (loss)A | .03 | .16 | .18 | .15 | .18 | .15 |
| Net realized and unrealized gain (loss) | .69 | (.55) | .59 | 1.40 | .82 | (.18) |
| Total from investment operations | .72 | (.39) | .77 | 1.55 | 1.00 | (.03) |
| Distributions from net investment income | –B | (.16) | (.18) | (.15) | (.16) | (.13) |
| Distributions from net realized gain | (.34) | (.36) | (.76) | (.55) | (.05) | (.16) |
| Total distributions | (.34) | (.52) | (.94) | (.69)C | (.21) | (.29) |
| Net asset value, end of period | $10.60 | $10.22 | $11.13 | $11.30 | $10.44 | $9.65 |
| Total ReturnD,E | 7.32% | (3.65)% | 7.10% | 15.20% | 10.55% | .02% |
| Ratios to Average Net AssetsF,G | | | | | | |
| Expenses before reductionsH | –%I | –% | –% | –% | –% | –% |
| Expenses net of fee waivers, if any | –%I | –% | –% | –% | –% | –% |
| Expenses net of all reductions | –%I | –% | –% | –% | –% | –% |
| Net investment income (loss) | .63%I | 1.53% | 1.62% | 1.35% | 1.81% | 1.57% |
| Supplemental Data | | | | | | |
| Net assets, end of period (000 omitted) | $336,844 | $320,449 | $303,017 | $282,594 | $202,208 | $126,497 |
| Portfolio turnover rateF | 22%I | 24% | 30% | 47% | 28% | 12% |
A Calculated based on average shares outstanding during the period.
B Amount represents less than $.005 per share.
C Total distributions of $.69 per share is comprised of distributions from net investment income of $.147 and distributions from net realized gain of $.546 per share.
D Total returns for periods of less than one year are not annualized.
E Total returns would have been lower if certain expenses had not been reduced during the applicable periods shown.
F Amounts do not include the activity of the Underlying Funds.
G Expense ratios reflect operating expenses of the class. Expenses before reductions do not reflect amounts reimbursed by the investment adviser or reductions from expense offset arrangements and do not represent the amount paid by the class during periods when reimbursements or reductions occur. Expenses net of fee waivers reflect expenses after reimbursement by the investment adviser but prior to reductions from expense offset arrangements. Expenses net of all reductions represent the net expenses paid by the class but do not include expenses of the underlying funds in which the Fund invests.
H Amount represents less than .005%.
I Annualized
See accompanying notes which are an integral part of the financial statements.
Fidelity Advisor Freedom® 2055 Fund
Investment Summary (Unaudited)
The information in the following tables is based on the direct investments of the Fund.
Top Holdings as of September 30, 2016
| | % of fund's net assets | % of fund's net assets 6 months ago |
| Fidelity Advisor Series Equity-Income Fund | 11.8 | 11.5 |
| Fidelity Series Emerging Markets Fund | 10.1 | 9.4 |
| Fidelity Series International Value Fund | 9.3 | 9.0 |
| Fidelity Series International Growth Fund | 9.2 | 9.0 |
| Fidelity Advisor Series Growth & Income Fund | 8.2 | 7.9 |
| Fidelity Advisor Series Stock Selector Large Cap Value Fund | 7.9 | 7.7 |
| Fidelity Advisor Series Equity Growth Fund | 6.6 | 6.4 |
| Fidelity Advisor Series Opportunistic Insights Fund | 6.1 | 5.9 |
| Fidelity Series All-Sector Equity Fund | 4.6 | 7.6 |
| Fidelity Advisor Series Growth Opportunities Fund | 4.3 | 4.2 |
| | 78.1 | 78.6 |
Asset Allocation (% of fund's net assets)
| Period end |
| | Domestic Equity Funds | 63.9% |
| | International Equity Funds | 30.7% |
| | Bond Funds | 5.3% |
| | Short-Term Funds | 0.1% |

| Six months ago |
| | Domestic Equity Funds | 65.1% |
| | International Equity Funds | 29.5% |
| | Bond Funds | 5.3% |
| | Short-Term Funds | 0.1% |

Domestic Equity Funds category includes Fidelity Series Commodity Strategy Fund which invests in commodity-related investments.
Fidelity Advisor Freedom® 2055 Fund
Investments September 30, 2016 (Unaudited)
Showing Percentage of Net Assets
| Domestic Equity Funds - 63.9% | | | |
| | | Shares | Value |
| Fidelity Advisor Series Equity Growth Fund (a) | | 2,039,591 | $23,373,710 |
| Fidelity Advisor Series Equity-Income Fund (a) | | 3,403,438 | 42,066,490 |
| Fidelity Advisor Series Growth & Income Fund (a) | | 2,202,860 | 29,165,866 |
| Fidelity Advisor Series Growth Opportunities Fund (a) | | 1,416,892 | 15,415,788 |
| Fidelity Advisor Series Opportunistic Insights Fund (a) | | 1,424,561 | 21,838,528 |
| Fidelity Advisor Series Small Cap Fund (a) | | 1,105,724 | 11,720,679 |
| Fidelity Advisor Series Stock Selector Large Cap Value Fund (a) | | 2,349,407 | 28,028,427 |
| Fidelity Series 100 Index Fund (a) | | 842,970 | 12,037,607 |
| Fidelity Series 1000 Value Index Fund (a) | | 400,555 | 4,474,203 |
| Fidelity Series All-Sector Equity Fund (a) | | 1,231,792 | 16,542,972 |
| Fidelity Series Commodity Strategy Fund (a)(b) | | 1,166,964 | 6,173,241 |
| Fidelity Series Real Estate Equity Fund (a) | | 195,553 | 2,692,763 |
| Fidelity Series Small Cap Opportunities Fund (a) | | 1,076,551 | 14,156,644 |
| TOTAL DOMESTIC EQUITY FUNDS | | | |
| (Cost $215,583,101) | | | 227,686,918 |
|
| International Equity Funds - 30.7% | | | |
| Fidelity Series Emerging Markets Fund (a) | | 2,128,525 | 35,801,793 |
| Fidelity Series International Growth Fund (a) | | 2,352,937 | 32,941,120 |
| Fidelity Series International Small Cap Fund (a) | | 487,227 | 7,586,117 |
| Fidelity Series International Value Fund (a) | | 3,488,645 | 33,072,356 |
| TOTAL INTERNATIONAL EQUITY FUNDS | | | |
| (Cost $106,289,980) | | | 109,401,386 |
|
| Bond Funds - 5.3% | | | |
| Fidelity Series Emerging Markets Debt Fund (a) | | 227,878 | 2,360,813 |
| Fidelity Series Floating Rate High Income Fund (a) | | 95,222 | 896,995 |
| Fidelity Series High Income Fund (a) | | 1,055,038 | 9,875,158 |
| Fidelity Series Inflation-Protected Bond Index Fund (a) | | 213,338 | 2,148,309 |
| Fidelity Series Investment Grade Bond Fund (a) | | 153,958 | 1,785,910 |
| Fidelity Series Long-Term Treasury Bond Index Fund (a) | | 198 | 1,915 |
| Fidelity Series Real Estate Income Fund (a) | | 158,752 | 1,781,200 |
| TOTAL BOND FUNDS | | | |
| (Cost $19,119,767) | | | 18,850,300 |
|
| Short-Term Funds - 0.1% | | | |
| Fidelity Advisor Series Short-Term Credit Fund (a) | | 6,231 | 62,555 |
| Fidelity Series Government Money Market Fund 0.29% (a)(c) | | 116,118 | 116,118 |
| TOTAL SHORT-TERM FUNDS | | | |
| (Cost $178,244) | | | 178,673 |
| TOTAL INVESTMENT PORTFOLIO - 100.0% | | | |
| (Cost $341,171,092) | | | 356,117,277 |
| NET OTHER ASSETS (LIABILITIES) - 0.0% | | | (58,490) |
| NET ASSETS - 100% | | | $356,058,787 |
Legend
(a) Affiliated Fund
(b) Non-income producing
(c) The rate quoted is the annualized seven-day yield of the fund at period end.
Affiliated Underlying Funds
Information regarding the Fund's fiscal year to date purchases and sales of the affiliated Underlying Funds and income earned by the Fund from investments in affiliated Underlying Funds is as follows:
| Affiliate | Value, beginning of period | Purchases | Sales Proceeds | Dividend Income | Value, end of period |
| Fidelity Advisor Series Equity Growth Fund | $18,983,279 | $4,368,373 | $1,417,039 | - | $23,373,710 |
| Fidelity Advisor Series Equity-Income Fund | 34,256,258 | 7,678,581 | 2,619,235 | 349,038 | 42,066,490 |
| Fidelity Advisor Series Growth & Income Fund | 23,666,811 | 5,011,528 | 1,493,121 | 201,786 | 29,165,866 |
| Fidelity Advisor Series Growth Opportunities Fund | 12,503,288 | 2,790,721 | 680,228 | - | 15,415,788 |
| Fidelity Advisor Series Opportunistic Insights Fund | 17,618,355 | 4,271,207 | 1,247,358 | - | 21,838,528 |
| Fidelity Advisor Series Short-Term Credit Fund | 51,731 | 16,048 | 5,448 | 295 | 62,555 |
| Fidelity Advisor Series Small Cap Fund | 9,475,256 | 2,290,414 | 571,197 | - | 11,720,679 |
| Fidelity Advisor Series Stock Selector Large Cap Value Fund | 22,779,744 | 5,271,055 | 1,631,306 | - | 28,028,427 |
| Fidelity Investments Money Market Portfolio Institutional Class 0.59% | 96,639 | 2,476 | 99,116 | 46 | - |
| Fidelity Series 100 Index Fund | 10,340,624 | 1,770,940 | 745,594 | - | 12,037,607 |
| Fidelity Series 1000 Value Index Fund | 3,793,767 | 640,749 | 281,113 | - | 4,474,203 |
| Fidelity Series All-Sector Equity Fund | 22,754,147 | 3,010,231 | 10,814,439 | - | 16,542,972 |
| Fidelity Series Commodity Strategy Fund | 3,820,342 | 2,326,014 | 304,447 | - | 6,173,241 |
| Fidelity Series Emerging Markets Debt Fund | 1,900,369 | 363,594 | 88,648 | 58,972 | 2,360,813 |
| Fidelity Series Emerging Markets Fund | 27,945,150 | 5,321,858 | 1,451,083 | - | 35,801,793 |
| Fidelity Series Floating Rate High Income Fund | 740,593 | 158,612 | 40,758 | 18,012 | 896,995 |
| Fidelity Series Government Money Market Fund 0.29% | - | 120,421 | 4,304 | 98 | 116,118 |
| Fidelity Series High Income Fund | 8,746,147 | 831,879 | 420,361 | 264,372 | 9,875,158 |
| Fidelity Series Inflation-Protected Bond Index Fund | 1,511,390 | 679,360 | 74,837 | 722 | 2,148,309 |
| Fidelity Series International Growth Fund | 26,892,210 | 6,016,982 | 1,470,201 | - | 32,941,120 |
| Fidelity Series International Small Cap Fund | 6,298,136 | 1,483,459 | 481,046 | - | 7,586,117 |
| Fidelity Series International Value Fund | 26,604,703 | 6,855,620 | 1,590,404 | - | 33,072,356 |
| Fidelity Series Investment Grade Bond Fund | 1,489,038 | 443,027 | 188,583 | 20,195 | 1,785,910 |
| Fidelity Series Long-Term Treasury Bond Index Fund | - | 2,366 | 387 | 9 | 1,915 |
| Fidelity Series Real Estate Equity Fund | 2,375,107 | 595,718 | 215,436 | 23,020 | 2,692,763 |
| Fidelity Series Real Estate Income Fund | 1,502,615 | 345,184 | 115,544 | 41,533 | 1,781,200 |
| Fidelity Series Small Cap Opportunities Fund | 11,434,991 | 2,449,570 | 807,229 | 33,854 | 14,156,644 |
| Total | $297,580,690 | $65,115,987 | $28,858,462 | $1,011,952 | $356,117,277 |
Investment Valuation
All investments are categorized as Level 1 under the Fair Value Hierarchy. The inputs or methodology used for valuing securities may not be an indication of the risk associated with investing in those securities. For more information on valuation inputs please refer to the Investment Valuation section in the accompanying Notes to Financial Statements.
See accompanying notes which are an integral part of the financial statements.
Fidelity Advisor Freedom® 2055 Fund
Financial Statements
Statement of Assets and Liabilities
| | | September 30, 2016 (Unaudited) |
| Assets | | |
| Investment in securities, at value (cost $341,171,092) — See accompanying schedule | | $356,117,277 |
| Cash | | 1 |
| Receivable for investments sold | | 852,296 |
| Receivable for fund shares sold | | 1,085,562 |
| Receivable from investment adviser for expense reductions | | 69 |
| Total assets | | 358,055,205 |
| Liabilities | | |
| Payable for investments purchased | $325,839 | |
| Payable for fund shares redeemed | 1,612,011 | |
| Distribution and service plan fees payable | 58,568 | |
| Total liabilities | | 1,996,418 |
| Net Assets | | $356,058,787 |
| Net Assets consist of: | | |
| Paid in capital | | $343,562,567 |
| Undistributed net investment income | | 686,754 |
| Accumulated undistributed net realized gain (loss) on investments | | (3,136,719) |
| Net unrealized appreciation (depreciation) on investments | | 14,946,185 |
| Net Assets | | $356,058,787 |
| Calculation of Maximum Offering Price | | |
| Class A: | | |
| Net Asset Value and redemption price per share ($153,322,819 ÷ 13,376,803 shares) | | $11.46 |
| Maximum offering price per share (100/94.25 of $11.46) | | $12.16 |
| Class T: | | |
| Net Asset Value and redemption price per share ($50,750,324 ÷ 4,447,637 shares) | | $11.41 |
| Maximum offering price per share (100/96.50 of $11.41) | | $11.82 |
| Class C: | | |
| Net Asset Value and offering price per share ($7,449,935 ÷ 654,927 shares)(a) | | $11.38 |
| Class I: | | |
| Net Asset Value, offering price and redemption price per share ($144,535,709 ÷ 12,555,785 shares) | | $11.51 |
(a) Redemption price per share is equal to net asset value less any applicable contingent deferred sales charge.
See accompanying notes which are an integral part of the financial statements.
Statement of Operations
| | | Six months ended September 30, 2016 (Unaudited) |
| Investment Income | | |
| Income distributions from underlying funds | | $1,011,952 |
| Expenses | | |
| Distribution and service plan fees | $326,892 | |
| Independent trustees' fees and expenses | 714 | |
| Total expenses before reductions | 327,606 | |
| Expense reductions | (714) | 326,892 |
| Net investment income (loss) | | 685,060 |
| Realized and Unrealized Gain (Loss) | | |
| Realized gain (loss) on sale of underlying fund shares | (521,805) | |
| Capital gain distributions from underlying funds | 192,844 | |
| Total net realized gain (loss) | | (328,961) |
| Change in net unrealized appreciation (depreciation) on underlying funds | | 22,800,860 |
| Net gain (loss) | | 22,471,899 |
| Net increase (decrease) in net assets resulting from operations | | $23,156,959 |
See accompanying notes which are an integral part of the financial statements.
Statement of Changes in Net Assets
| | Six months ended September 30, 2016 (Unaudited) | Year ended March 31, 2016 |
| Increase (Decrease) in Net Assets | | |
| Operations | | |
| Net investment income (loss) | $685,060 | $3,577,745 |
| Net realized gain (loss) | (328,961) | 9,462,330 |
| Change in net unrealized appreciation (depreciation) | 22,800,860 | (22,208,242) |
| Net increase (decrease) in net assets resulting from operations | 23,156,959 | (9,168,167) |
| Distributions to shareholders from net investment income | (34,665) | (3,628,682) |
| Distributions to shareholders from net realized gain | (9,286,482) | (6,838,260) |
| Total distributions | (9,321,147) | (10,466,942) |
| Share transactions - net increase (decrease) | 44,690,055 | 76,117,748 |
| Total increase (decrease) in net assets | 58,525,867 | 56,482,639 |
| Net Assets | | |
| Beginning of period | 297,532,920 | 241,050,281 |
| End of period | $356,058,787 | $297,532,920 |
| Other Information | | |
| Undistributed net investment income end of period | $686,754 | $36,359 |
See accompanying notes which are an integral part of the financial statements.
Financial Highlights — Fidelity Advisor Freedom 2055 Fund Class A
| | Six months ended (Unaudited) September 30, | Years ended March 31, | | | | |
| | 2016 | 2016 | 2015 | 2014 | 2013 | 2012A |
| Selected Per–Share Data | | | | | | |
| Net asset value, beginning of period | $11.02 | $11.92 | $11.71 | $10.56 | $9.75 | $10.00 |
| Income from Investment Operations | | | | | | |
| Net investment income (loss)B | .02 | .15 | .16 | .12 | .18 | .11 |
| Net realized and unrealized gain (loss) | .75 | (.59) | .62 | 1.49 | .83 | (.11) |
| Total from investment operations | .77 | (.44) | .78 | 1.61 | 1.01 | – |
| Distributions from net investment income | – | (.14) | (.15) | (.11) | (.13) | (.11) |
| Distributions from net realized gain | (.33) | (.31) | (.42) | (.36) | (.07) | (.15) |
| Total distributions | (.33) | (.46)C | (.57) | (.46)D | (.20) | (.25)E |
| Net asset value, end of period | $11.46 | $11.02 | $11.92 | $11.71 | $10.56 | $9.75 |
| Total ReturnF,G,H | 7.19% | (3.89)% | 6.85% | 15.45% | 10.51% | .29% |
| Ratios to Average Net AssetsI,J | | | | | | |
| Expenses before reductions | .25%K | .25% | .25% | .25% | .25% | .25%K |
| Expenses net of fee waivers, if any | .25%K | .25% | .25% | .25% | .25% | .25%K |
| Expenses net of all reductions | .25%K | .25% | .25% | .25% | .25% | .25%K |
| Net investment income (loss) | .37%K | 1.31% | 1.39% | 1.11% | 1.82% | 1.44%K |
| Supplemental Data | | | | | | |
| Net assets, end of period (000 omitted) | $153,323 | $130,309 | $115,666 | $81,217 | $32,476 | $2,655 |
| Portfolio turnover rateI | 17%K | 24% | 29% | 43% | 29% | 18%K |
A For the period June 1, 2011(commencement of operations) to March 31, 2012.
B Calculated based on average shares outstanding during the period.
C Total distributions of $.46 per share is comprised of distributions from net investment income of $.141 and distributions from net realized gain of $.314 per share.
D Total distributions of $.46 per share is comprised of distributions from net investment income of $.106 and distributions from net realized gain of $.355 per share.
E Total distributions of $.25 per share is comprised of distributions from net investment income of $.105 and distributions from net realized gain of $.146 per share.
F Total returns for periods of less than one year are not annualized.
G Total returns would have been lower if certain expenses had not been reduced during the applicable periods shown.
H Total returns do not include the effect of the sales charges.
I Amounts do not include the activity of the Underlying Funds.
J Expense ratios reflect operating expenses of the class. Expenses before reductions do not reflect amounts reimbursed by the investment adviser or reductions from expense offset arrangements and do not represent the amount paid by the class during periods when reimbursements or reductions occur. Expenses net of fee waivers reflect expenses after reimbursement by the investment adviser but prior to reductions from expense offset arrangements. Expenses net of all reductions represent the net expenses paid by the class but do not include expenses of the underlying funds in which the Fund invests.
K Annualized
See accompanying notes which are an integral part of the financial statements.
Financial Highlights — Fidelity Advisor Freedom 2055 Fund Class T
| | Six months ended (Unaudited) September 30, | Years ended March 31, | | | | |
| | 2016 | 2016 | 2015 | 2014 | 2013 | 2012A |
| Selected Per–Share Data | | | | | | |
| Net asset value, beginning of period | $10.98 | $11.88 | $11.68 | $10.55 | $9.75 | $10.00 |
| Income from Investment Operations | | | | | | |
| Net investment income (loss)B | .01 | .12 | .13 | .10 | .16 | .09 |
| Net realized and unrealized gain (loss) | .75 | (.59) | .62 | 1.47 | .82 | (.10) |
| Total from investment operations | .76 | (.47) | .75 | 1.57 | .98 | (.01) |
| Distributions from net investment income | – | (.12) | (.13) | (.09) | (.11) | (.09) |
| Distributions from net realized gain | (.33) | (.31) | (.42) | (.36) | (.07) | (.15) |
| Total distributions | (.33) | (.43) | (.55) | (.44)C | (.18) | (.24) |
| Net asset value, end of period | $11.41 | $10.98 | $11.88 | $11.68 | $10.55 | $9.75 |
| Total ReturnD,E,F | 7.13% | (4.11)% | 6.55% | 15.07% | 10.24% | .12% |
| Ratios to Average Net AssetsG,H | | | | | | |
| Expenses before reductions | .50%I | .50% | .50% | .50% | .50% | .50%I |
| Expenses net of fee waivers, if any | .50%I | .50% | .50% | .50% | .50% | .50%I |
| Expenses net of all reductions | .50%I | .50% | .50% | .50% | .50% | .50%I |
| Net investment income (loss) | .12%I | 1.06% | 1.14% | .86% | 1.57% | 1.19%I |
| Supplemental Data | | | | | | |
| Net assets, end of period (000 omitted) | $50,750 | $41,956 | $33,436 | $19,134 | $7,239 | $1,444 |
| Portfolio turnover rateG | 17%I | 24% | 29% | 43% | 29% | 18%I |
A For the period June 1, 2011(commencement of operations) to March 31, 2012.
B Calculated based on average shares outstanding during the period.
C Total distributions of $.44 per share is comprised of distributions from net investment income of $.086 and distributions from net realized gain of $.355 per share.
D Total returns for periods of less than one year are not annualized.
E Total returns would have been lower if certain expenses had not been reduced during the applicable periods shown.
F Total returns do not include the effect of the sales charges.
G Amounts do not include the activity of the Underlying Funds.
H Expense ratios reflect operating expenses of the class. Expenses before reductions do not reflect amounts reimbursed by the investment adviser or reductions from expense offset arrangements and do not represent the amount paid by the class during periods when reimbursements or reductions occur. Expenses net of fee waivers reflect expenses after reimbursement by the investment adviser but prior to reductions from expense offset arrangements. Expenses net of all reductions represent the net expenses paid by the class but do not include expenses of the underlying funds in which the Fund invests.
I Annualized
See accompanying notes which are an integral part of the financial statements.
Financial Highlights — Fidelity Advisor Freedom 2055 Fund Class C
| | Six months ended (Unaudited) September 30, | Years ended March 31, | | | | |
| | 2016 | 2016 | 2015 | 2014 | 2013 | 2012A |
| Selected Per–Share Data | | | | | | |
| Net asset value, beginning of period | $10.98 | $11.88 | $11.69 | $10.57 | $9.74 | $10.00 |
| Income from Investment Operations | | | | | | |
| Net investment income (loss)B | (.02) | .06 | .08 | .04 | .10 | .05 |
| Net realized and unrealized gain (loss) | .75 | (.58) | .61 | 1.47 | .83 | (.10) |
| Total from investment operations | .73 | (.52) | .69 | 1.51 | .93 | (.05) |
| Distributions from net investment income | – | (.08) | (.09) | (.05) | (.03) | (.06) |
| Distributions from net realized gain | (.33) | (.30) | (.41) | (.35) | (.07) | (.15) |
| Total distributions | (.33) | (.38) | (.50) | (.39)C | (.10) | (.21) |
| Net asset value, end of period | $11.38 | $10.98 | $11.88 | $11.69 | $10.57 | $9.74 |
| Total ReturnD,E,F | 6.85% | (4.53)% | 6.01% | 14.46% | 9.69% | (.27)% |
| Ratios to Average Net AssetsG,H | | | | | | |
| Expenses before reductions | 1.00%I | 1.00% | 1.00% | 1.00% | 1.00% | 1.00%I |
| Expenses net of fee waivers, if any | 1.00%I | 1.00% | 1.00% | 1.00% | 1.00% | 1.00%I |
| Expenses net of all reductions | 1.00%I | 1.00% | 1.00% | 1.00% | 1.00% | 1.00%I |
| Net investment income (loss) | (.38)%I | .56% | .65% | .36% | 1.07% | .69%I |
| Supplemental Data | | | | | | |
| Net assets, end of period (000 omitted) | $7,450 | $5,671 | $4,180 | $2,491 | $1,094 | $1,127 |
| Portfolio turnover rateG | 17%I | 24% | 29% | 43% | 29% | 18%I |
A For the period June 1, 2011(commencement of operations) to March 31, 2012.
B Calculated based on average shares outstanding during the period.
C Total distributions of $.39 per share is comprised of distributions from net investment income of $.048 and distributions from net realized gain of $.345 per share.
D Total returns for periods of less than one year are not annualized.
E Total returns would have been lower if certain expenses had not been reduced during the applicable periods shown.
F Total returns do not include the effect of the contingent deferred sales charge.
G Amounts do not include the activity of the Underlying Funds.
H Expense ratios reflect operating expenses of the class. Expenses before reductions do not reflect amounts reimbursed by the investment adviser or reductions from expense offset arrangements and do not represent the amount paid by the class during periods when reimbursements or reductions occur. Expenses net of fee waivers reflect expenses after reimbursement by the investment adviser but prior to reductions from expense offset arrangements. Expenses net of all reductions represent the net expenses paid by the class but do not include expenses of the underlying funds in which the Fund invests.
I Annualized
See accompanying notes which are an integral part of the financial statements.
Financial Highlights — Fidelity Advisor Freedom 2055 Fund Class I
| | Six months ended (Unaudited) September 30, | Years ended March 31, | | | | |
| | 2016 | 2016 | 2015 | 2014 | 2013 | 2012A |
| Selected Per–Share Data | | | | | | |
| Net asset value, beginning of period | $11.06 | $11.96 | $11.74 | $10.59 | $9.76 | $10.00 |
| Income from Investment Operations | | | | | | |
| Net investment income (loss)B | .03 | .18 | .19 | .15 | .21 | .13 |
| Net realized and unrealized gain (loss) | .76 | (.60) | .63 | 1.48 | .83 | (.11) |
| Total from investment operations | .79 | (.42) | .82 | 1.63 | 1.04 | .02 |
| Distributions from net investment income | –C | (.17) | (.18) | (.13) | (.14) | (.12) |
| Distributions from net realized gain | (.33) | (.31) | (.42) | (.36) | (.07) | (.15) |
| Total distributions | (.34)D | (.48) | (.60) | (.48)E | (.21) | (.26)F |
| Net asset value, end of period | $11.51 | $11.06 | $11.96 | $11.74 | $10.59 | $9.76 |
| Total ReturnG,H | 7.33% | (3.64)% | 7.15% | 15.61% | 10.84% | .51% |
| Ratios to Average Net AssetsI,J | | | | | | |
| Expenses before reductionsK | –%L | –% | –% | –% | –% | –%L |
| Expenses net of fee waivers, if any | –%L | –% | –% | –% | –% | –%L |
| Expenses net of all reductions | –%L | –% | –% | –% | –% | –%L |
| Net investment income (loss) | .62%L | 1.56% | 1.64% | 1.36% | 2.07% | 1.69%L |
| Supplemental Data | | | | | | |
| Net assets, end of period (000 omitted) | $144,536 | $119,597 | $87,769 | $54,490 | $18,438 | $2,503 |
| Portfolio turnover rateI | 17%L | 24% | 29% | 43% | 29% | 18%L |
A For the period June 1, 2011(commencement of operations) to March 31, 2012.
B Calculated based on average shares outstanding during the period.
C Amount represents less than $.005 per share.
D Total distributions of $.34 per share is comprised of distributions from net investment income of $.003 and distributions from net realized gain of $.332 per share.
E Total distributions of $.48 per share is comprised of distributions from net investment income of $.127 and distributions from net realized gain of $.355 per share.
F Total distributions of $.26 per share is comprised of distributions from net investment income of $.116 and distributions from net realized gain of $.146 per share.
G Total returns for periods of less than one year are not annualized.
H Total returns would have been lower if certain expenses had not been reduced during the applicable periods shown.
I Amounts do not include the activity of the Underlying Funds.
J Expense ratios reflect operating expenses of the class. Expenses before reductions do not reflect amounts reimbursed by the investment adviser or reductions from expense offset arrangements and do not represent the amount paid by the class during periods when reimbursements or reductions occur. Expenses net of fee waivers reflect expenses after reimbursement by the investment adviser but prior to reductions from expense offset arrangements. Expenses net of all reductions represent the net expenses paid by the class but do not include expenses of the underlying funds in which the Fund invests.
K Amount represents less than .005%.
L Annualized
See accompanying notes which are an integral part of the financial statements.
Fidelity Advisor Freedom® 2060 Fund
Investment Summary (Unaudited)
The information in the following tables is based on the direct investments of the Fund.
Top Holdings as of September 30, 2016
| | % of fund's net assets | % of fund's net assets 6 months ago |
| Fidelity Advisor Series Equity-Income Fund | 11.8 | 11.5 |
| Fidelity Series Emerging Markets Fund | 10.0 | 9.4 |
| Fidelity Series International Value Fund | 9.3 | 9.0 |
| Fidelity Series International Growth Fund | 9.3 | 9.0 |
| Fidelity Advisor Series Growth & Income Fund | 8.2 | 7.9 |
| Fidelity Advisor Series Stock Selector Large Cap Value Fund | 7.9 | 7.7 |
| Fidelity Advisor Series Equity Growth Fund | 6.6 | 6.4 |
| Fidelity Advisor Series Opportunistic Insights Fund | 6.1 | 5.9 |
| Fidelity Series All-Sector Equity Fund | 4.6 | 7.6 |
| Fidelity Advisor Series Growth Opportunities Fund | 4.3 | 4.2 |
| | 78.1 | 78.6 |
Asset Allocation (% of fund's net assets)
| Period end |
| | Domestic Equity Funds | 63.9% |
| | International Equity Funds | 30.7% |
| | Bond Funds | 5.3% |
| | Short-Term Funds | 0.1% |

| Six months ago |
| | Domestic Equity Funds | 65.1% |
| | International Equity Funds | 29.5% |
| | Bond Funds | 5.3% |
| | Short-Term Funds | 0.1% |

Domestic Equity Funds category includes Fidelity Series Commodity Strategy Fund which invests in commodity-related investments.
Fidelity Advisor Freedom® 2060 Fund
Investments September 30, 2016 (Unaudited)
Showing Percentage of Net Assets
| Domestic Equity Funds - 63.9% | | | |
| | | Shares | Value |
| Fidelity Advisor Series Equity Growth Fund (a) | | 151,520 | $1,736,421 |
| Fidelity Advisor Series Equity-Income Fund (a) | | 253,295 | 3,130,728 |
| Fidelity Advisor Series Growth & Income Fund (a) | | 163,841 | 2,169,257 |
| Fidelity Advisor Series Growth Opportunities Fund (a) | | 105,197 | 1,144,542 |
| Fidelity Advisor Series Opportunistic Insights Fund (a) | | 105,821 | 1,622,236 |
| Fidelity Advisor Series Small Cap Fund (a) | | 82,288 | 872,253 |
| Fidelity Advisor Series Stock Selector Large Cap Value Fund (a) | | 174,867 | 2,086,158 |
| Fidelity Series 100 Index Fund (a) | | 63,019 | 899,915 |
| Fidelity Series 1000 Value Index Fund (a) | | 30,046 | 335,618 |
| Fidelity Series All-Sector Equity Fund (a) | | 91,461 | 1,228,326 |
| Fidelity Series Commodity Strategy Fund (a)(b) | | 85,698 | 453,343 |
| Fidelity Series Real Estate Equity Fund (a) | | 14,482 | 199,419 |
| Fidelity Series Small Cap Opportunities Fund (a) | | 80,071 | 1,052,936 |
| TOTAL DOMESTIC EQUITY FUNDS | | | |
| (Cost $16,189,665) | | | 16,931,152 |
|
| International Equity Funds - 30.7% | | | |
| Fidelity Series Emerging Markets Fund (a) | | 158,165 | 2,660,339 |
| Fidelity Series International Growth Fund (a) | | 174,972 | 2,449,601 |
| Fidelity Series International Small Cap Fund (a) | | 36,126 | 562,484 |
| Fidelity Series International Value Fund (a) | | 259,429 | 2,459,390 |
| TOTAL INTERNATIONAL EQUITY FUNDS | | | |
| (Cost $7,740,781) | | | 8,131,814 |
|
| Bond Funds - 5.3% | | | |
| Fidelity Series Emerging Markets Debt Fund (a) | | 16,521 | 171,160 |
| Fidelity Series Floating Rate High Income Fund (a) | | 7,050 | 66,413 |
| Fidelity Series High Income Fund (a) | | 80,268 | 751,305 |
| Fidelity Series Inflation-Protected Bond Index Fund (a) | | 15,890 | 160,008 |
| Fidelity Series Investment Grade Bond Fund (a) | | 11,446 | 132,772 |
| Fidelity Series Long-Term Treasury Bond Index Fund (a) | | 20 | 198 |
| Fidelity Series Real Estate Income Fund (a) | | 11,428 | 128,223 |
| TOTAL BOND FUNDS | | | |
| (Cost $1,355,698) | | | 1,410,079 |
|
| Short-Term Funds - 0.1% | | | |
| Fidelity Advisor Series Short-Term Credit Fund (a) | | 464 | 4,659 |
| Fidelity Series Government Money Market Fund 0.29% (a)(c) | | 8,638 | 8,638 |
| TOTAL SHORT-TERM FUNDS | | | |
| (Cost $13,263) | | | 13,297 |
| TOTAL INVESTMENT PORTFOLIO - 100.0% | | | |
| (Cost $25,299,407) | | | 26,486,342 |
| NET OTHER ASSETS (LIABILITIES) - 0.0% | | | (4,341) |
| NET ASSETS - 100% | | | $26,482,001 |
Legend
(a) Affiliated Fund
(b) Non-income producing
(c) The rate quoted is the annualized seven-day yield of the fund at period end.
Affiliated Underlying Funds
Information regarding the Fund's fiscal year to date purchases and sales of the affiliated Underlying Funds and income earned by the Fund from investments in affiliated Underlying Funds is as follows:
| Affiliate | Value, beginning of period | Purchases | Sales Proceeds | Dividend Income | Value, end of period |
| Fidelity Advisor Series Equity Growth Fund | $1,236,832 | $670,184 | $270,053 | - | $1,736,421 |
| Fidelity Advisor Series Equity-Income Fund | 2,233,656 | 1,186,018 | 474,844 | 23,882 | 3,130,728 |
| Fidelity Advisor Series Growth & Income Fund | 1,541,962 | 803,359 | 309,961 | 13,846 | 2,169,257 |
| Fidelity Advisor Series Growth Opportunities Fund | 807,659 | 437,424 | 155,620 | - | 1,144,542 |
| Fidelity Advisor Series Opportunistic Insights Fund | 1,147,902 | 636,612 | 245,450 | - | 1,622,236 |
| Fidelity Advisor Series Short-Term Credit Fund | 3,366 | 2,142 | 865 | 20 | 4,659 |
| Fidelity Advisor Series Small Cap Fund | 617,346 | 337,554 | 118,551 | - | 872,253 |
| Fidelity Advisor Series Stock Selector Large Cap Value Fund | 1,484,173 | 796,778 | 303,347 | - | 2,086,158 |
| Fidelity Investments Money Market Portfolio Institutional Class 0.59% | 6,199 | 455 | 6,654 | 3 | - |
| Fidelity Series 100 Index Fund | 673,729 | 317,063 | 136,768 | - | 899,915 |
| Fidelity Series 1000 Value Index Fund | 248,923 | 118,488 | 53,542 | - | 335,618 |
| Fidelity Series All-Sector Equity Fund | 1,482,514 | 508,876 | 871,970 | - | 1,228,326 |
| Fidelity Series Commodity Strategy Fund | 249,174 | 240,489 | 56,959 | - | 453,343 |
| Fidelity Series Emerging Markets Debt Fund | 121,405 | 59,435 | 22,186 | 3,951 | 171,160 |
| Fidelity Series Emerging Markets Fund | 1,821,194 | 897,687 | 332,470 | - | 2,660,339 |
| Fidelity Series Floating Rate High Income Fund | 48,271 | 24,891 | 9,335 | 1,230 | 66,413 |
| Fidelity Series Government Money Market Fund 0.29% | - | 9,451 | 813 | 7 | 8,638 |
| Fidelity Series High Income Fund | 576,447 | 229,288 | 104,214 | 18,524 | 751,305 |
| Fidelity Series Inflation-Protected Bond Index Fund | 97,150 | 78,956 | 18,435 | 48 | 160,008 |
| Fidelity Series International Growth Fund | 1,749,667 | 946,279 | 348,366 | - | 2,449,601 |
| Fidelity Series International Small Cap Fund | 408,592 | 223,622 | 89,254 | - | 562,484 |
| Fidelity Series International Value Fund | 1,736,941 | 998,584 | 355,457 | - | 2,459,390 |
| Fidelity Series Investment Grade Bond Fund | 96,989 | 61,080 | 28,237 | 1,388 | 132,772 |
| Fidelity Series Long-Term Treasury Bond Index Fund | - | 211 | 8 | 1 | 198 |
| Fidelity Series Real Estate Equity Fund | 156,492 | 91,185 | 43,898 | 1,607 | 199,419 |
| Fidelity Series Real Estate Income Fund | 95,060 | 50,745 | 20,716 | 2,805 | 128,223 |
| Fidelity Series Small Cap Opportunities Fund | 746,776 | 387,655 | 155,817 | 2,521 | 1,052,936 |
| Total | $19,388,419 | $10,114,511 | $4,533,790 | $69,833 | $26,486,342 |
Investment Valuation
All investments are categorized as Level 1 under the Fair Value Hierarchy. The inputs or methodology used for valuing securities may not be an indication of the risk associated with investing in those securities. For more information on valuation inputs please refer to the Investment Valuation section in the accompanying Notes to Financial Statements.
See accompanying notes which are an integral part of the financial statements.
Fidelity Advisor Freedom® 2060 Fund
Financial Statements
Statement of Assets and Liabilities
| | | September 30, 2016 (Unaudited) |
| Assets | | |
| Investment in securities, at value (cost $25,299,407) — See accompanying schedule | | $26,486,342 |
| Receivable for investments sold | | 89,959 |
| Receivable for fund shares sold | | 197,339 |
| Receivable from investment adviser for expense reductions | | 14 |
| Total assets | | 26,773,654 |
| Liabilities | | |
| Payable for investments purchased | $24,250 | |
| Payable for fund shares redeemed | 263,026 | |
| Distribution and service plan fees payable | 4,377 | |
| Total liabilities | | 291,653 |
| Net Assets | | $26,482,001 |
| Net Assets consist of: | | |
| Paid in capital | | $25,713,367 |
| Undistributed net investment income | | 45,361 |
| Accumulated undistributed net realized gain (loss) on investments | | (463,662) |
| Net unrealized appreciation (depreciation) on investments | | 1,186,935 |
| Net Assets | | $26,482,001 |
| Calculation of Maximum Offering Price | | |
| Class A: | | |
| Net Asset Value and redemption price per share ($12,526,711 ÷ 1,238,649 shares) | | $10.11 |
| Maximum offering price per share (100/94.25 of $10.11) | | $10.73 |
| Class T: | | |
| Net Asset Value and redemption price per share ($3,093,435 ÷ 305,904 shares) | | $10.11 |
| Maximum offering price per share (100/96.50 of $10.11) | | $10.48 |
| Class C: | | |
| Net Asset Value and offering price per share ($732,544 ÷ 72,237 shares)(a) | | $10.14 |
| Class I: | | |
| Net Asset Value, offering price and redemption price per share ($10,129,311 ÷ 998,495 shares) | | $10.14 |
(a) Redemption price per share is equal to net asset value less any applicable contingent deferred sales charge.
See accompanying notes which are an integral part of the financial statements.
Statement of Operations
| | | Six months ended September 30, 2016 (Unaudited) |
| Investment Income | | |
| Income distributions from underlying funds | | $69,833 |
| Expenses | | |
| Distribution and service plan fees | $24,765 | |
| Independent trustees' fees and expenses | 48 | |
| Total expenses before reductions | 24,813 | |
| Expense reductions | (48) | 24,765 |
| Net investment income (loss) | | 45,068 |
| Realized and Unrealized Gain (Loss) | | |
| Realized gain (loss) on sale of underlying fund shares | 30,499 | |
| Capital gain distributions from underlying funds | 13,593 | |
| Total net realized gain (loss) | | 44,092 |
| Change in net unrealized appreciation (depreciation) on underlying funds | | 1,486,698 |
| Net gain (loss) | | 1,530,790 |
| Net increase (decrease) in net assets resulting from operations | | $1,575,858 |
See accompanying notes which are an integral part of the financial statements.
Statement of Changes in Net Assets
| | Six months ended September 30, 2016 (Unaudited) | Year ended March 31, 2016 |
| Increase (Decrease) in Net Assets | | |
| Operations | | |
| Net investment income (loss) | $45,068 | $133,580 |
| Net realized gain (loss) | 44,092 | 8,148 |
| Change in net unrealized appreciation (depreciation) | 1,486,698 | (331,013) |
| Net increase (decrease) in net assets resulting from operations | 1,575,858 | (189,285) |
| Distributions to shareholders from net investment income | (707) | (132,580) |
| Distributions to shareholders from net realized gain | (426,418) | (178,082) |
| Total distributions | (427,125) | (310,662) |
| Share transactions - net increase (decrease) | 5,949,046 | 13,834,207 |
| Total increase (decrease) in net assets | 7,097,779 | 13,334,260 |
| Net Assets | | |
| Beginning of period | 19,384,222 | 6,049,962 |
| End of period | $26,482,001 | $19,384,222 |
| Other Information | | |
| Undistributed net investment income end of period | $45,361 | $1,000 |
See accompanying notes which are an integral part of the financial statements.
Financial Highlights — Fidelity Advisor Freedom 2060 Fund Class A
| | Six months ended (Unaudited) September 30, | Years ended March 31, | |
| | 2016 | 2016 | 2015A |
| Selected Per–Share Data | | | |
| Net asset value, beginning of period | $9.62 | $10.34 | $10.00 |
| Income from Investment Operations | | | |
| Net investment income (loss)B | .02 | .12 | .15 |
| Net realized and unrealized gain (loss) | .66 | (.51) | .37 |
| Total from investment operations | .68 | (.39) | .52 |
| Distributions from net investment income | – | (.11) | (.10) |
| Distributions from net realized gain | (.19) | (.22) | (.08) |
| Total distributions | (.19) | (.33) | (.18) |
| Net asset value, end of period | $10.11 | $9.62 | $10.34 |
| Total ReturnC,D,E | 7.25% | (3.89)% | 5.24% |
| Ratios to Average Net AssetsF,G | | | |
| Expenses before reductions | .25%H | .25% | .25%H |
| Expenses net of fee waivers, if any | .25%H | .25% | .25%H |
| Expenses net of all reductions | .25%H | .25% | .25%H |
| Net investment income (loss) | .37%H | 1.29% | 2.24%H |
| Supplemental Data | | | |
| Net assets, end of period (000 omitted) | $12,527 | $9,058 | $2,267 |
| Portfolio turnover rateF | 40%H | 64% | 47%H |
A For the period August 5, 2014 (commencement of operations) to March 31, 2015.
B Calculated based on average shares outstanding during the period.
C Total returns for periods of less than one year are not annualized.
D Total returns would have been lower if certain expenses had not been reduced during the applicable periods shown.
E Total returns do not include the effect of the sales charges.
F Amounts do not include the activity of the Underlying Funds.
G Expense ratios reflect operating expenses of the class. Expenses before reductions do not reflect amounts reimbursed by the investment adviser or reductions from expense offset arrangements and do not represent the amount paid by the class during periods when reimbursements or reductions occur. Expenses net of fee waivers reflect expenses after reimbursement by the investment adviser but prior to reductions from expense offset arrangements. Expenses net of all reductions represent the net expenses paid by the class but do not include expenses of the underlying funds in which the Fund invests.
H Annualized
See accompanying notes which are an integral part of the financial statements.
Financial Highlights — Fidelity Advisor Freedom 2060 Fund Class T
| | Six months ended (Unaudited) September 30, | Years ended March 31, | |
| | 2016 | 2016 | 2015A |
| Selected Per–Share Data | | | |
| Net asset value, beginning of period | $9.63 | $10.33 | $10.00 |
| Income from Investment Operations | | | |
| Net investment income (loss)B | .01 | .10 | .13 |
| Net realized and unrealized gain (loss) | .66 | (.51) | .38 |
| Total from investment operations | .67 | (.41) | .51 |
| Distributions from net investment income | – | (.08) | (.09) |
| Distributions from net realized gain | (.19) | (.21) | (.08) |
| Total distributions | (.19) | (.29) | (.18)C |
| Net asset value, end of period | $10.11 | $9.63 | $10.33 |
| Total ReturnD,E,F | 7.07% | (4.09)% | 5.07% |
| Ratios to Average Net AssetsG,H | | | |
| Expenses before reductions | .50%I | .50% | .51%I,J |
| Expenses net of fee waivers, if any | .50%I | .50% | .51%I,J |
| Expenses net of all reductions | .50%I | .50% | .51%I,J |
| Net investment income (loss) | .12%I | 1.04% | 1.98%I |
| Supplemental Data | | | |
| Net assets, end of period (000 omitted) | $3,093 | $3,189 | $2,062 |
| Portfolio turnover rateG | 40%I | 64% | 47%I |
A For the period August 5, 2014 (commencement of operations) to March 31, 2015.
B Calculated based on average shares outstanding during the period.
C Total distributions of $.18 per share is comprised of distributions from net investment income of $.094 and distributions from net realized gain of $.081 per share.
D Total returns for periods of less than one year are not annualized.
E Total returns would have been lower if certain expenses had not been reduced during the applicable periods shown.
F Total returns do not include the effect of the sales charges.
G Amounts do not include the activity of the Underlying Funds.
H Expense ratios reflect operating expenses of the class. Expenses before reductions do not reflect amounts reimbursed by the investment adviser or reductions from expense offset arrangements and do not represent the amount paid by the class during periods when reimbursements or reductions occur. Expenses net of fee waivers reflect expenses after reimbursement by the investment adviser but prior to reductions from expense offset arrangements. Expenses net of all reductions represent the net expenses paid by the class but do not include expenses of the underlying funds in which the Fund invests.
I Annualized
J On certain classes, the size and fluctuation of net assets may cause rounding of expense amounts and ratios to differ from contractual rates.
See accompanying notes which are an integral part of the financial statements.
Financial Highlights — Fidelity Advisor Freedom 2060 Fund Class C
| | Six months ended (Unaudited) September 30, | Years ended March 31, | |
| | 2016 | 2016 | 2015A |
| Selected Per–Share Data | | | |
| Net asset value, beginning of period | $9.68 | $10.31 | $10.00 |
| Income from Investment Operations | | | |
| Net investment income (loss)B | (.02) | .05 | .10 |
| Net realized and unrealized gain (loss) | .67 | (.51) | .38 |
| Total from investment operations | .65 | (.46) | .48 |
| Distributions from net investment income | – | – | (.08) |
| Distributions from net realized gain | (.19) | (.17) | (.08) |
| Total distributions | (.19) | (.17) | (.17)C |
| Net asset value, end of period | $10.14 | $9.68 | $10.31 |
| Total ReturnD,E,F | 6.82% | (4.60)% | 4.77% |
| Ratios to Average Net AssetsG,H | | | |
| Expenses before reductions | 1.00%I | .99%J | 1.02%I,J |
| Expenses net of fee waivers, if any | 1.00%I | .99%J | 1.02%I,J |
| Expenses net of all reductions | 1.00%I | .99%J | 1.02%I,J |
| Net investment income (loss) | (.38)%I | .55% | 1.47%I |
| Supplemental Data | | | |
| Net assets, end of period (000 omitted) | $733 | $1,292 | $1,322 |
| Portfolio turnover rateG | 40%I | 64% | 47%I |
A For the period August 5, 2014 (commencement of operations) to March 31, 2015.
B Calculated based on average shares outstanding during the period.
C Total distributions of $.17 per share is comprised of distributions from net investment income of $.084 and distributions from net realized gain of $.081 per share.
D Total returns for periods of less than one year are not annualized.
E Total returns would have been lower if certain expenses had not been reduced during the applicable periods shown.
F Total returns do not include the effect of the contingent deferred sales charge.
G Amounts do not include the activity of the Underlying Funds.
H Expense ratios reflect operating expenses of the class. Expenses before reductions do not reflect amounts reimbursed by the investment adviser or reductions from expense offset arrangements and do not represent the amount paid by the class during periods when reimbursements or reductions occur. Expenses net of fee waivers reflect expenses after reimbursement by the investment adviser but prior to reductions from expense offset arrangements. Expenses net of all reductions represent the net expenses paid by the class but do not include expenses of the underlying funds in which the Fund invests.
I Annualized
J On certain classes, the size and fluctuation of net assets may cause rounding of expense amounts and ratios to differ from contractual rates.
See accompanying notes which are an integral part of the financial statements.
Financial Highlights — Fidelity Advisor Freedom 2060 Fund Class I
| | Six months ended (Unaudited) September 30, | Years ended March 31, | |
| | 2016 | 2016 | 2015A |
| Selected Per–Share Data | | | |
| Net asset value, beginning of period | $9.65 | $10.35 | $10.00 |
| Income from Investment Operations | | | |
| Net investment income (loss)B | .03 | .15 | .17 |
| Net realized and unrealized gain (loss) | .66 | (.50) | .37 |
| Total from investment operations | .69 | (.35) | .54 |
| Distributions from net investment income | –C | (.12) | (.10) |
| Distributions from net realized gain | (.20) | (.23) | (.08) |
| Total distributions | (.20) | (.35) | (.19)D |
| Net asset value, end of period | $10.14 | $9.65 | $10.35 |
| Total ReturnE,F | 7.28% | (3.54)% | 5.38% |
| Ratios to Average Net AssetsG,H | | | |
| Expenses before reductionsI | –%J | –% | –%J |
| Expenses net of fee waivers, if any | –%J | –% | –%J |
| Expenses net of all reductions | –%J | –% | –%J |
| Net investment income (loss) | .62%J | 1.54% | 2.49%J |
| Supplemental Data | | | |
| Net assets, end of period (000 omitted) | $10,129 | $5,845 | $399 |
| Portfolio turnover rateG | 40%J | 64% | 47%J |
A For the period August 5, 2014 (commencement of operations) to March 31, 2015.
B Calculated based on average shares outstanding during the period.
C Amount represents less than $.005 per share.
D Total distributions of $.19 per share is comprised of distributions from net investment income of $.104 and distributions from net realized gain of $.081 per share.
E Total returns for periods of less than one year are not annualized.
F Total returns would have been lower if certain expenses had not been reduced during the applicable periods shown.
G Amounts do not include the activity of the Underlying Funds.
H Expense ratios reflect operating expenses of the class. Expenses before reductions do not reflect amounts reimbursed by the investment adviser or reductions from expense offset arrangements and do not represent the amount paid by the class during periods when reimbursements or reductions occur. Expenses net of fee waivers reflect expenses after reimbursement by the investment adviser but prior to reductions from expense offset arrangements. Expenses net of all reductions represent the net expenses paid by the class but do not include expenses of the underlying funds in which the Fund invests.
I Amount represents less than .005%.
J Annualized
See accompanying notes which are an integral part of the financial statements.
Notes to Financial Statements (Unaudited)
For the period ended September 30, 2016
1. Organization.
Fidelity Advisor Freedom Income Fund, Fidelity Advisor Freedom 2005 Fund, Fidelity Advisor Freedom 2010 Fund, Fidelity Advisor Freedom 2015 Fund, Fidelity Advisor Freedom 2020 Fund, Fidelity Advisor Freedom 2025 Fund, Fidelity Advisor Freedom 2030 Fund, Fidelity Advisor Freedom 2035 Fund, Fidelity Advisor Freedom 2040 Fund, Fidelity Advisor Freedom 2045 Fund, Fidelity Advisor Freedom 2050 Fund, Fidelity Advisor Freedom 2055 Fund and Fidelity Advisor Freedom 2060 Fund (the Funds) are funds of Fidelity Aberdeen Street Trust (the Trust). The Trust is registered under the Investment Company Act of 1940, as amended (the 1940 Act), as an open-end management investment company organized as a Delaware statutory trust. Each Fund is authorized to issue an unlimited number of shares. The Funds invest primarily in a combination of other Fidelity equity, bond, and short-term funds (the Underlying Funds) managed by Fidelity Management & Research Company (FMR). Each Fund offers Class A, Class T, Class C, and Class I shares, each of which has equal rights as to assets and voting privileges. Class B shares are closed to new accounts and additional purchases, except for exchanges and reinvestments. Each class has exclusive voting rights with respect to matters that affect that class. Class B shares will automatically convert to Class A shares after a maximum holding period of seven years from the initial date of purchase.
After the close of business on June 24, 2016, each Fund's outstanding Class B shares were converted to Class A shares. Each Fund's current fiscal period dollar and share amounts for Class B presented in the Notes to Financial Statements are for the period April 1, 2016 through June 24, 2016.
2. Significant Accounting Policies.
The financial statements have been prepared in conformity with accounting principles generally accepted in the United States of America (GAAP), which require management to make certain estimates and assumptions at the date of the financial statements. Actual results could differ from those estimates. Subsequent events, if any, through the date that the financial statements were issued have been evaluated in the preparation of the financial statements. The following summarizes the significant accounting policies of the Funds:
Investment Valuation. Investments are valued as of 4:00 p.m. Eastern time on the last calendar day of the period. Each Fund categorizes the inputs to valuation techniques used to value its investments into a disclosure hierarchy consisting of three levels as shown below:
- Level 1 – quoted prices in active markets for identical investments
- Level 2 – other significant observable inputs (including quoted prices for similar investments, interest rates, prepayment speeds, etc.)
- Level 3 – unobservable inputs (including the Fund's own assumptions based on the best information available)
Valuation techniques used to value each Fund's investments by major category are as follows. Investments in the Underlying Funds are valued at their closing net asset value (NAV) each business day and are categorized as Level 1 in the hierarchy.
Investment Transactions and Income. For financial reporting purposes, the Funds' investment holdings and NAV include trades executed through the end of the last business day of the period. The NAV per share for processing shareholder transactions is calculated as of the close of business of the New York Stock Exchange (NYSE), normally 4:00 p.m. Eastern time and includes trades executed through the end of the prior business day. Gains and losses on securities sold are determined on the basis of identified cost. Income and capital gain distributions from the Underlying Funds, if any, are recorded on the ex-dividend date.
Class Allocations and Expenses. Investment income, realized and unrealized capital gains and losses, common expenses of each Fund, and certain fund-level expense reductions, if any, are allocated daily on a pro-rata basis to each class based on the relative net assets of each class to the total net assets of each Fund. Each class differs with respect to distribution and service plan fees incurred. Certain expense reductions may also differ by class. For the reporting period, the allocated portion of income and expenses to each class as a percent of its average net assets may vary due to the timing of recording these transactions in relation to fluctuating net assets of the classes. Expenses directly attributable to a fund are charged to that fund. Expenses attributable to more than one fund are allocated among the respective funds on the basis of relative net assets or other appropriate methods. Expenses included in the accompanying financial statements reflect the expenses of each Fund and do not include any expenses associated with the Underlying Funds. Although not included in each Fund's expenses, each Fund indirectly bears its proportionate share of the Underlying Funds' expenses through the impact of these expenses on each Underlying Fund's NAV. Expense estimates are accrued in the period to which they relate and adjustments are made when actual amounts are known.
Income Tax Information and Distributions to Shareholders. Each year, each Fund intends to qualify as a regulated investment company under Subchapter M of the Internal Revenue Code, including distributing substantially all of its taxable income and realized gains. As a result, no provision for U.S. Federal income taxes is required. Each Fund files a U.S. federal tax return, in addition to state and local tax returns as required. Each Fund's federal income tax returns are subject to examination by the Internal Revenue Service (IRS) for a period of three fiscal years after they are filed. State and local tax returns may be subject to examination for an additional fiscal year depending on the jurisdiction.
Distributions are declared and recorded on the ex-dividend date. Income dividends and capital gain distributions are declared separately for each class. Income and capital gain distributions are determined in accordance with income tax regulations, which may differ from GAAP.
Capital accounts within the financial statements are adjusted for permanent book-tax differences. These adjustments have no impact on net assets or the results of operations. Capital accounts are not adjusted for temporary book-tax differences which will reverse in a subsequent period.
Book-tax differences are primarily due to the short-term gain distributions from the Underlying Funds, losses deferred due to wash sales and excise tax regulations.
The federal tax cost of investment securities and unrealized appreciation (depreciation) as of period end were as follows for each Fund:
| | Tax cost | Gross unrealized appreciation | Gross unrealized depreciation | Net unrealized appreciation (depreciation) on securities |
| Advisor Freedom Income | $221,853,495 | $16,048,593 | $(1,849,407) | $14,199,186 |
| Advisor Freedom 2005 | 209,432,974 | 18,969,272 | (1,865,632) | 17,103,640 |
| Advisor Freedom 2010 | 517,086,121 | 55,806,807 | (4,904,020) | 50,902,787 |
| Advisor Freedom 2015 | 1,166,010,489 | 148,935,919 | (11,007,960) | 137,927,959 |
| Advisor Freedom 2020 | 2,413,153,490 | 286,607,405 | (23,945,864) | 262,661,541 |
| Advisor Freedom 2025 | 2,641,623,357 | 326,121,342 | (28,050,910) | 298,070,432 |
| Advisor Freedom 2030 | 2,517,804,370 | 345,497,096 | (32,005,413) | 313,491,683 |
| Advisor Freedom 2035 | 1,939,238,328 | 279,265,625 | (26,708,169) | 252,557,456 |
| Advisor Freedom 2040 | 1,782,721,633 | 260,114,288 | (23,011,787) | 237,102,501 |
| Advisor Freedom 2045 | 1,037,320,334 | 137,388,247 | (14,878,679) | 122,509,568 |
| Advisor Freedom 2050 | 797,434,737 | 105,756,405 | (11,282,605) | 94,473,800 |
| Advisor Freedom 2055 | 343,526,901 | 19,398,338 | (6,807,962) | 12,590,376 |
| Advisor Freedom 2060 | 25,689,099 | 1,284,107 | (486,864) | 797,243 |
The Fidelity Advisor Freedom Income Fund elected to defer to its next fiscal year approximately $121,506 of capital losses recognized during the period November 1, 2015 to March 31, 2016.
3. Purchases and Redemptions of Underlying Fund Shares.
Purchases and redemptions of the Underlying Fund shares, are noted in the table below.
| | Purchases ($) | Redemptions ($) |
| Advisor Freedom Income | 58,415,737 | 71,535,678 |
| Advisor Freedom 2005 | 45,918,670 | 60,583,281 |
| Advisor Freedom 2010 | 91,308,959 | 146,349,285 |
| Advisor Freedom 2015 | 167,787,299 | 290,546,722 |
| Advisor Freedom 2020 | 277,385,183 | 466,964,729 |
| Advisor Freedom 2025 | 290,438,195 | 430,447,114 |
| Advisor Freedom 2030 | 203,158,413 | 341,038,369 |
| Advisor Freedom 2035 | 169,867,570 | 263,522,435 |
| Advisor Freedom 2040 | 162,955,437 | 247,078,356 |
| Advisor Freedom 2045 | 112,124,387 | 134,897,378 |
| Advisor Freedom 2050 | 94,006,684 | 98,823,261 |
| Advisor Freedom 2055 | 65,115,987 | 28,858,462 |
| Advisor Freedom 2060 | 10,114,511 | 4,533,790 |
4. Fees and Other Transactions with Affiliates.
Management Fee. FMR Co., Inc. (the investment adviser), an affiliate of Fidelity Management & Research Company (FMR), provides the Funds with investment management related services. The Funds do not pay any fees for these services.
Other Transactions. The investment adviser has entered into an administration agreement with FMR under which FMR provides management and administrative services (other than investment advisory services) necessary for the operation of each Fund. Pursuant to this agreement, FMR pays all expenses of each Fund, excluding distribution and service fees, compensation of the independent Trustees and certain other expenses such as interest expense. FMR also contracts with other Fidelity companies to perform the services necessary for the operation of each Fund. The Funds do not pay any fees for these services.
Distribution and Service Plan Fees. In accordance with Rule 12b-1 of the 1940 Act, each Fund has adopted separate Distribution and Service Plans for each class of shares. Certain classes pay Fidelity Distributors Corporation (FDC), an affiliate of the investment adviser, separate Distribution and Service Fees, each of which is based on an annual percentage of each class' average net assets. In addition, FDC may pay financial intermediaries for selling shares of each Fund and providing shareholder support services. For the period, the Distribution and Service Fee rates, total fees and amounts retained by FDC were as follows:
| | Distribution
Fee | Service
Fee | Total Fees | Retained
by FDC |
| Advisor Freedom Income | | | | |
| Class A | -% | .25% | $121,705 | $3,898 |
| Class T | .25% | .25% | 107,236 | 73 |
| Class B | .75% | .25% | 1,357 | 1,031 |
| Class C | .75% | .25% | 75,460 | 5,432 |
| | | | $305,758 | $10,434 |
| Advisor Freedom 2005 | | | | |
| Class A | -% | .25% | $166,816 | $16,961 |
| Class T | .25% | .25% | 73,264 | – |
| Class B | .75% | .25% | 699 | 530 |
| Class C | .75% | .25% | 31,256 | – |
| | | | $272,035 | $17,491 |
| Advisor Freedom 2010 | | | | |
| Class A | -% | .25% | $399,411 | $15,707 |
| Class T | .25% | .25% | 229,978 | – |
| Class B | .75% | .25% | 2,427 | 1,835 |
| Class C | .75% | .25% | 151,073 | 7,574 |
| | | | $782,889 | $25,116 |
| Advisor Freedom 2015 | | | | |
| Class A | -% | .25% | $906,566 | $44,220 |
| Class T | .25% | .25% | 476,468 | 16 |
| Class B | .75% | .25% | 6,377 | 4,815 |
| Class C | .75% | .25% | 312,696 | 25,162 |
| | | | $1,702,107 | $74,213 |
| Advisor Freedom 2020 | | | | |
| Class A | -% | .25% | $1,788,051 | $71,023 |
| Class T | .25% | .25% | 999,900 | 369 |
| Class B | .75% | .25% | 16,308 | 12,312 |
| Class C | .75% | .25% | 524,789 | 54,797 |
| | | | $3,329,048 | $138,501 |
| Advisor Freedom 2025 | | | | |
| Class A | -% | .25% | $1,934,896 | $82,964 |
| Class T | .25% | .25% | 1,025,523 | 2,824 |
| Class B | .75% | .25% | 12,609 | 9,532 |
| Class C | .75% | .25% | 473,403 | 50,178 |
| | | | $3,446,431 | $145,498 |
| Advisor Freedom 2030 | | | | |
| Class A | -% | .25% | $1,774,871 | $82,789 |
| Class T | .25% | .25% | 1,087,584 | 3,379 |
| Class B | .75% | .25% | 14,042 | 10,607 |
| Class C | .75% | .25% | 450,931 | 49,231 |
| | | | $3,327,428 | $146,006 |
| Advisor Freedom 2035 | | | | |
| Class A | -% | .25% | $1,388,997 | $64,006 |
| Class T | .25% | .25% | 783,947 | 981 |
| Class B | .75% | .25% | 9,315 | 7,048 |
| Class C | .75% | .25% | 280,098 | 28,332 |
| | | | $2,462,357 | $100,367 |
| Advisor Freedom 2040 | | | | |
| Class A | -% | .25% | $1,207,232 | $43,093 |
| Class T | .25% | .25% | 795,352 | 2,681 |
| Class B | .75% | .25% | 11,736 | 8,870 |
| Class C | .75% | .25% | 374,725 | 38,138 |
| | | | $2,389,045 | $92,782 |
| Advisor Freedom 2045 | | | | |
| Class A | -% | .25% | $679,203 | $31,860 |
| Class T | .25% | .25% | 423,162 | – |
| Class B | .75% | .25% | 2,713 | 2,052 |
| Class C | .75% | .25% | 120,831 | 20,932 |
| | | | $1,225,909 | $54,844 |
| Advisor Freedom 2050 | | | | |
| Class A | -% | .25% | $470,007 | $14,439 |
| Class T | .25% | .25% | 340,694 | – |
| Class B | .75% | .25% | 3,527 | 2,668 |
| Class C | .75% | .25% | 127,817 | 17,028 |
| | | | $942,045 | $34,135 |
| Advisor Freedom 2055 | | | | |
| Class A | -% | .25% | $177,783 | $4,927 |
| Class T | .25% | .25% | 116,634 | – |
| Class C | .75% | .25% | 32,475 | – |
| | | | $326,892 | $4,927 |
| Advisor Freedom 2060 | | | | |
| Class A | -% | .25% | $13,714 | $13,714 |
| Class T | .25% | .25% | 6,958 | 6,958 |
| Class C | .75% | .25% | 4,093 | 4,093 |
| | | | $24,765 | $24,765 |
Sales Load. FDC may receive a front-end sales charge of up to 5.75% for selling Class A shares and 3.50% for selling Class T shares, some of which is paid to financial intermediaries for selling shares of each Fund. Depending on the holding period, FDC may receive contingent deferred sales charges levied on Class A, Class T, Class B, and Class C redemptions. The deferred sales charges range from 5.00% to 1.00% for Class B shares, 1.00% for Class C shares, 1.00% for certain purchases of Class A shares and .25% for certain purchases of Class T shares.
For the period, sales charge amounts retained by FDC were as follows:
| | Retained
by FDC |
| Advisor Freedom Income | |
| Class A | $2,631 |
| Class T | 1,005 |
| Class B(a) | 96 |
| Class C(a) | 357 |
| | $4,089 |
| Advisor Freedom 2005 | |
| Class A | $940 |
| Class T | 390 |
| Class B(a) | – |
| Class C(a) | 103 |
| | $1,433 |
| Advisor Freedom 2010 | |
| Class A | $1,401 |
| Class T | 1,047 |
| Class B(a) | – |
| Class C(a) | 497 |
| | $2,945 |
| Advisor Freedom 2015 | |
| Class A | $6,494 |
| Class T | 2,737 |
| Class B(a) | 226 |
| Class C(a) | 1,506 |
| | $10,963 |
| Advisor Freedom 2020 | |
| Class A | $21,745 |
| Class T | 10,544 |
| Class B(a) | 136 |
| Class C(a) | 4,884 |
| | $37,309 |
| Advisor Freedom 2025 | |
| Class A | $33,380 |
| Class T | 14,569 |
| Class B(a) | 121 |
| Class C(a) | 4,207 |
| | $52,277 |
| Advisor Freedom 2030 | |
| Class A | $33,873 |
| Class T | 15,381 |
| Class B(a) | 119 |
| Class C(a) | 3,565 |
| | $52,938 |
| Advisor Freedom 2035 | |
| Class A | $30,942 |
| Class T | 16,149 |
| Class B(a) | 44 |
| Class C(a) | 3,753 |
| | $50,888 |
| Advisor Freedom 2040 | |
| Class A | $33,126 |
| Class T | 13,621 |
| Class B(a) | 67 |
| Class C(a) | 4,201 |
| | $51,015 |
| Advisor Freedom 2045 | |
| Class A | $22,320 |
| Class T | 9,074 |
| Class B(a) | 15 |
| Class C(a) | 3,318 |
| | $34,727 |
| Advisor Freedom 2050 | |
| Class A | $15,340 |
| Class T | 6,073 |
| Class B(a) | 28 |
| Class C(a) | 1,918 |
| | $23,359 |
| Advisor Freedom 2055 | |
| Class A | $10,263 |
| Class T | 4,559 |
| Class C(a) | 808 |
| | $15,630 |
| Advisor Freedom 2060 | |
| Class A | $1,322 |
| Class T | 286 |
| Class C(a) | 310 |
| | $1,918 |
(a) When Class B and Class C shares are initially sold, FDC pays commissions from its own resources to financial intermediaries through which the sales are made.
5. Expense Reductions.
FMR voluntarily agreed to reimburse funds to the extent annual operating expenses exceeded certain levels of average net assets as noted in the table below. Some expenses, for example interest expense, are excluded from this reimbursement.
The following classes of each applicable Fund were in reimbursement during the period:
| | Expense
Limitations | Reimbursement |
| Advisor Freedom Income | | |
| Class A | .25% | $221 |
| Class T | .50% | 98 |
| Class B | 1.00% | 1 |
| Class C | 1.00% | 34 |
| Class I | -% | 188 |
| Advisor Freedom 2005 | | |
| Class A | .25% | $300 |
| Class T | .50% | 66 |
| Class B | 1.00% | 1 |
| Class C | 1.00% | 14 |
| Class I | -% | 140 |
| Advisor Freedom 2010 | | |
| Class A | .25% | $724 |
| Class T | .50% | 209 |
| Class B | 1.00% | 2 |
| Class C | 1.00% | 69 |
| Class I | -% | 319 |
| Advisor Freedom 2015 | | |
| Class A | .25% | $1,644 |
| Class T | .50% | 432 |
| Class B | 1.00% | – |
| Class C | 1.00% | 142 |
| Class I | -% | 811 |
| Advisor Freedom 2020 | | |
| Class A | .25% | $3,219 |
| Class T | .50% | 900 |
| Class B | 1.00% | 16 |
| Class C | 1.00% | 236 |
| Class I | -% | 1,748 |
| Advisor Freedom 2025 | | |
| Class A | .25% | $3,467 |
| Class T | .50% | 919 |
| Class B | 1.00% | 12 |
| Class C | 1.00% | 212 |
| Class I | -% | 1,993 |
| Advisor Freedom 2030 | | |
| Class A | .25% | $3,177 |
| Class T | .50% | 973 |
| Class B | 1.00% | 13 |
| Class C | 1.00% | 202 |
| Class I | -% | 1,958 |
| Advisor Freedom 2035 | | |
| Class A | .25% | $2,482 |
| Class T | .50% | 701 |
| Class B | 1.00% | 9 |
| Class C | 1.00% | 125 |
| Class I | -% | 1,538 |
| Advisor Freedom 2040 | | |
| Class A | .25% | $2,159 |
| Class T | .50% | 711 |
| Class B | 1.00% | 11 |
| Class C | 1.00% | 167 |
| Class I | -% | 1,412 |
| Advisor Freedom 2045 | | |
| Class A | .25% | $1,209 |
| Class T | .50% | 377 |
| Class B | 1.00% | – |
| Class C | 1.00% | 54 |
| Class I | -% | 891 |
| Advisor Freedom 2050 | | |
| Class A | .25% | $833 |
| Class T | .50% | 302 |
| Class B | 1.00% | 3 |
| Class C | 1.00% | 57 |
| Class I | -% | 736 |
| Advisor Freedom 2055 | | |
| Class A | .25% | $309 |
| Class T | .50% | 101 |
| Class C | 1.00% | 14 |
| Class I | -% | 290 |
| Advisor Freedom 2060 | | |
| Class A | .25% | $23 |
| Class T | .50% | 6 |
| Class C | 1.00% | 2 |
| Class I | -% | 17 |
6. Distributions to Shareholders.
Distributions to shareholders of each class were as follows:
| | Six months ended
September 30, 2016 | Year ended
March 31, 2016 |
| Advisor Freedom Income | | |
| From net investment income | | |
| Class A | $551,861 | $1,804,087 |
| Class T | 187,386 | 701,827 |
| Class B | 527 | 6,793 |
| Class C | 30,853 | 134,792 |
| Class I | 568,236 | 1,517,104 |
| Total | $1,338,863 | $4,164,603 |
| From net realized gain | | |
| Class A | $805,528 | $1,977,599 |
| Class T | 352,226 | 869,741 |
| Class B | 4,869 | 15,183 |
| Class C | 121,641 | 267,669 |
| Class I | 685,886 | 1,410,195 |
| Total | $1,970,150 | $4,540,387 |
| Advisor Freedom 2005 | | |
| From net investment income | | |
| Class A | $373,427 | $2,323,956 |
| Class T | 66,562 | 432,659 |
| Class B | 184 | 2,404 |
| Class C | 5,930 | 54,932 |
| Class I | 211,454 | 1,193,174 |
| Total | $657,557 | $4,007,125 |
| From net realized gain | | |
| Class A | $1,983,829 | $3,970,930 |
| Class T | 435,215 | 790,924 |
| Class B | 4,475 | 12,507 |
| Class C | 91,652 | 184,344 |
| Class I | 921,721 | 1,679,387 |
| Total | $3,436,892 | $6,638,092 |
| Advisor Freedom 2010 | | |
| From net investment income | | |
| Class A | $803,971 | $6,003,972 |
| Class T | 177,244 | 1,397,138 |
| Class B | 85 | 10,451 |
| Class C | 23,083 | 282,705 |
| Class I | 449,908 | 2,890,342 |
| Total | $1,454,291 | $10,584,608 |
| From net realized gain | | |
| Class A | $5,761,785 | $13,470,039 |
| Class T | 1,656,848 | 3,526,741 |
| Class B | 18,204 | 61,327 |
| Class C | 551,417 | 1,160,445 |
| Class I | 2,545,527 | 5,369,063 |
| Total | $10,533,781 | $23,587,615 |
| Advisor Freedom 2015 | | |
| From net investment income | | |
| Class A | $1,650,611 | $13,583,429 |
| Class T | 321,989 | 2,859,915 |
| Class B | – | 26,012 |
| Class C | 31,863 | 611,152 |
| Class I | 1,062,549 | 7,528,137 |
| Total | $3,067,012 | $24,608,645 |
| From net realized gain | | |
| Class A | $15,049,730 | $29,986,512 |
| Class T | 3,960,466 | 6,985,833 |
| Class B | 56,551 | 188,847 |
| Class C | 1,306,384 | 2,396,646 |
| Class I | 7,468,177 | 13,730,055 |
| Total | $27,841,308 | $53,287,893 |
| Advisor Freedom 2020 | | |
| From net investment income | | |
| Class A | $2,390,409 | $25,698,008 |
| Class T | 410,836 | 5,809,331 |
| Class B | – | 69,298 |
| Class C | – | 982,499 |
| Class I | 1,723,524 | 15,059,860 |
| Total | $4,524,769 | $47,618,996 |
| From net realized gain | | |
| Class A | $32,327,411 | $51,415,664 |
| Class T | 8,975,390 | 13,261,302 |
| Class B | 157,930 | 386,650 |
| Class C | 2,346,829 | 3,437,464 |
| Class I | 17,481,396 | 25,042,847 |
| Total | $61,288,956 | $93,543,927 |
| Advisor Freedom 2025 | | |
| From net investment income | | |
| Class A | $1,979,394 | $25,260,945 |
| Class T | 294,968 | 5,193,908 |
| Class B | – | 46,533 |
| Class C | – | 806,872 |
| Class I | 1,639,360 | 15,273,123 |
| Total | $3,913,722 | $46,581,381 |
| From net realized gain | | |
| Class A | $38,845,583 | $56,433,404 |
| Class T | 10,291,538 | 13,038,884 |
| Class B | 136,189 | 284,440 |
| Class C | 2,384,571 | 3,044,442 |
| Class I | 22,380,657 | 27,170,186 |
| Total | $74,038,538 | $99,971,356 |
| Advisor Freedom 2030 | | |
| From net investment income | | |
| Class A | $429,669 | $21,002,263 |
| Class T | – | 5,079,042 |
| Class B | – | 50,382 |
| Class C | – | 708,607 |
| Class I | 809,189 | 14,549,548 |
| Total | $1,238,858 | $41,389,842 |
| From net realized gain | | |
| Class A | $42,859,300 | $57,942,069 |
| Class T | 13,184,499 | 15,934,228 |
| Class B | 181,885 | 388,181 |
| Class C | 2,704,781 | 3,165,501 |
| Class I | 26,905,985 | 32,127,287 |
| Total | $85,836,450 | $109,557,266 |
| Advisor Freedom 2035 | | |
| From net investment income | | |
| Class A | $– | $15,074,742 |
| Class T | – | 3,409,864 |
| Class B | – | 29,846 |
| Class C | – | 417,642 |
| Class I | – | 10,711,198 |
| Total | $– | $29,643,292 |
| From net realized gain | | |
| Class A | $37,031,615 | $44,129,826 |
| Class T | 10,488,643 | 10,749,563 |
| Class B | 135,368 | 263,010 |
| Class C | 1,915,978 | 1,945,397 |
| Class I | 23,586,972 | 24,715,787 |
| Total | $73,158,576 | $81,803,583 |
| Advisor Freedom 2040 | | |
| From net investment income | | |
| Class A | $– | $13,245,609 |
| Class T | – | 3,474,790 |
| Class B | – | 37,589 |
| Class C | – | 552,326 |
| Class I | 144,081 | 9,948,354 |
| Total | $144,081 | $27,258,668 |
| From net realized gain | | |
| Class A | $32,013,488 | $41,038,189 |
| Class T | 10,633,164 | 12,029,970 |
| Class B | 170,019 | 342,889 |
| Class C | 2,509,725 | 2,798,704 |
| Class I | 21,934,166 | 25,059,447 |
| Total | $67,260,562 | $81,269,199 |
| Advisor Freedom 2045 | | |
| From net investment income | | |
| Class A | $– | $7,193,208 |
| Class T | 5 | 1,742,888 |
| Class B | – | 8,549 |
| Class C | – | 173,785 |
| Class I | 13 | 6,041,225 |
| Total | $18 | $15,159,655 |
| From net realized gain | | |
| Class A | $17,839,134 | $20,290,272 |
| Class T | 5,567,670 | 5,212,191 |
| Class B | 39,187 | 66,944 |
| Class C | 800,254 | 753,888 |
| Class I | 13,503,172 | 13,414,154 |
| Total | $37,749,417 | $39,737,449 |
| Advisor Freedom 2050 | | |
| From net investment income | | |
| Class A | $– | $4,848,702 |
| Class T | – | 1,370,739 |
| Class B | – | 10,523 |
| Class C | – | 179,089 |
| Class I | 97,227 | 4,823,851 |
| Total | $97,227 | $11,232,904 |
| From net realized gain | | |
| Class A | $11,992,023 | $13,328,702 |
| Class T | 4,287,586 | 4,134,203 |
| Class B | 48,585 | 86,878 |
| Class C | 819,179 | 788,832 |
| Class I | 10,985,193 | 10,113,965 |
| Total | $28,132,566 | $28,452,580 |
| Advisor Freedom 2055 | | |
| From net investment income | | |
| Class A | $– | $1,554,706 |
| Class T | – | 404,897 |
| Class C | – | 39,268 |
| Class I | 34,665 | 1,629,811 |
| Total | $34,665 | $3,628,682 |
| From net realized gain | | |
| Class A | $3,954,157 | $3,237,740 |
| Class T | 1,322,417 | 906,964 |
| Class C | 174,735 | 119,080 |
| Class I | 3,835,173 | 2,574,476 |
| Total | $9,286,482 | $6,838,260 |
| Advisor Freedom 2060 | | |
| From net investment income | | |
| Class A | $– | $71,201 |
| Class T | – | 11,114 |
| Class I | 707 | 50,265 |
| Total | $707 | $132,580 |
| From net realized gain | | |
| Class A | $214,171 | $84,170 |
| Class T | 54,115 | 40,079 |
| Class C | 18,295 | 20,446 |
| Class I | 139,837 | 33,387 |
| Total | $426,418 | $178,082 |
7. Share Transactions.
Share transactions for each class were as follows and may contain automatic conversions between classes or exchanges between affiliated funds:
| | Shares | Shares | Dollars | Dollars |
| | Six months ended September 30, 2016 | Year ended March 31, 2016 | Six months ended September 30, 2016 | Year ended March 31, 2016 |
| Advisor Freedom Income | | | | |
| Class A | | | | |
| Shares sold | 1,276,366 | 3,081,818 | $13,735,529 | $32,963,415 |
| Reinvestment of distributions | 125,903 | 348,911 | 1,340,954 | 3,750,259 |
| Shares redeemed | (1,887,653) | (5,370,350) | (20,267,035) | (57,590,121) |
| Net increase (decrease) | (485,384) | (1,939,621) | $(5,190,552) | $(20,876,447) |
| Class T | | | | |
| Shares sold | 558,723 | 2,332,188 | $6,011,759 | $24,979,079 |
| Reinvestment of distributions | 49,460 | 143,605 | 525,939 | 1,538,767 |
| Shares redeemed | (754,594) | (2,760,620) | (8,115,721) | (29,380,371) |
| Net increase (decrease) | (146,411) | (284,827) | $(1,578,023) | $(2,862,525) |
| Class B | | | | |
| Shares sold | 1,191 | 2,784 | $12,706 | $29,065 |
| Reinvestment of distributions | 508 | 1,917 | 5,371 | 20,660 |
| Shares redeemed | (62,185) | (47,919) | (661,437) | (514,935) |
| Net increase (decrease) | (60,486) | (43,218) | $(643,360) | $(465,210) |
| Class C | | | | |
| Shares sold | 100,417 | 235,292 | $1,078,952 | $2,521,615 |
| Reinvestment of distributions | 12,558 | 32,848 | 133,125 | 352,267 |
| Shares redeemed | (97,726) | (310,283) | (1,051,169) | (3,312,864) |
| Net increase (decrease) | 15,249 | (42,143) | $160,908 | $(438,982) |
| Class I | | | | |
| Shares sold | 1,097,078 | 4,013,311 | $11,848,500 | $42,997,083 |
| Reinvestment of distributions | 116,692 | 270,632 | 1,247,165 | 2,912,988 |
| Shares redeemed | (1,585,229) | (3,954,589) | (17,090,398) | (42,448,173) |
| Net increase (decrease) | (371,459) | 329,354 | $(3,994,733) | $3,461,898 |
| Advisor Freedom 2005 | | | | |
| Class A | | | | |
| Shares sold | 1,265,934 | 3,894,452 | $14,683,720 | $45,205,371 |
| Reinvestment of distributions | 205,343 | 530,506 | 2,318,328 | 6,161,983 |
| Shares redeemed | (2,188,429) | (6,082,447) | (25,364,401) | (70,961,720) |
| Net increase (decrease) | (717,152) | (1,657,489) | $(8,362,353) | $(19,594,366) |
| Class T | | | | |
| Shares sold | 330,878 | 965,717 | $3,830,733 | $11,248,895 |
| Reinvestment of distributions | 43,836 | 103,821 | 494,466 | 1,203,224 |
| Shares redeemed | (501,747) | (920,270) | (5,815,192) | (10,661,092) |
| Net increase (decrease) | (127,033) | 149,268 | $(1,489,993) | $1,791,027 |
| Class B | | | | |
| Shares sold | 2 | 14 | $26 | $155 |
| Reinvestment of distributions | 408 | 1,261 | 4,639 | 14,861 |
| Shares redeemed | (29,514) | (23,475) | (337,993) | (278,685) |
| Net increase (decrease) | (29,104) | (22,200) | $(333,328) | $(263,669) |
| Class C | | | | |
| Shares sold | 21,866 | 124,305 | $252,505 | $1,420,571 |
| Reinvestment of distributions | 8,087 | 19,601 | 91,137 | 227,794 |
| Shares redeemed | (31,747) | (214,984) | (364,052) | (2,456,114) |
| Net increase (decrease) | (1,794) | (71,078) | $(20,410) | $(807,749) |
| Class I | | | | |
| Shares sold | 889,376 | 2,114,860 | $10,364,112 | $24,778,151 |
| Reinvestment of distributions | 99,117 | 245,116 | 1,125,973 | 2,859,833 |
| Shares redeemed | (1,131,923) | (2,464,416) | (13,179,144) | (28,948,190) |
| Net increase (decrease) | (143,430) | (104,440) | $(1,689,059) | $(1,310,206) |
| Advisor Freedom 2010 | | | | |
| Class A | | | | |
| Shares sold | 2,452,941 | 5,500,440 | $29,427,063 | $66,809,747 |
| Reinvestment of distributions | 556,039 | 1,586,318 | 6,488,974 | 19,271,859 |
| Shares redeemed | (5,461,061) | (13,363,733) | (65,677,471) | (162,597,001) |
| Net increase (decrease) | (2,452,081) | (6,276,975) | $(29,761,434) | $(76,515,395) |
| Class T | | | | |
| Shares sold | 790,843 | 1,965,974 | $9,482,212 | $23,778,947 |
| Reinvestment of distributions | 156,602 | 404,195 | 1,821,284 | 4,890,781 |
| Shares redeemed | (1,251,001) | (2,923,738) | (14,998,262) | (35,323,217) |
| Net increase (decrease) | (303,556) | (553,569) | $(3,694,766) | $(6,653,489) |
| Class B | | | | |
| Shares sold | 493 | 1,125 | $5,909 | $13,055 |
| Reinvestment of distributions | 1,445 | 5,508 | 16,965 | 67,622 |
| Shares redeemed | (97,295) | (93,180) | (1,146,600) | (1,140,420) |
| Net increase (decrease) | (95,357) | (86,547) | $(1,123,726) | $(1,059,743) |
| Class C | | | | |
| Shares sold | 73,921 | 276,584 | $882,131 | $3,354,365 |
| Reinvestment of distributions | 46,257 | 112,748 | 535,189 | 1,358,925 |
| Shares redeemed | (176,577) | (590,705) | (2,078,263) | (7,096,007) |
| Net increase (decrease) | (56,399) | (201,373) | $(660,943) | $(2,382,717) |
| Class I | | | | |
| Shares sold | 1,567,216 | 4,543,451 | $18,898,558 | $55,631,987 |
| Reinvestment of distributions | 255,004 | 676,590 | 2,988,647 | 8,236,622 |
| Shares redeemed | (2,720,735) | (5,541,203) | (32,755,591) | (67,639,715) |
| Net increase (decrease) | (898,515) | (321,162) | $(10,868,386) | $(3,771,106) |
| Advisor Freedom 2015 | | | | |
| Class A | | | | |
| Shares sold | 6,370,341 | 14,507,166 | $76,014,659 | $175,664,778 |
| Reinvestment of distributions | 1,428,117 | 3,552,535 | 16,523,263 | 43,128,550 |
| Shares redeemed | (12,288,919) | (31,588,039) | (146,739,252) | (383,404,767) |
| Net increase (decrease) | (4,490,461) | (13,528,338) | $(54,201,330) | $(164,611,439) |
| Class T | | | | |
| Shares sold | 1,878,754 | 4,673,502 | $22,408,080 | $56,637,647 |
| Reinvestment of distributions | 364,418 | 798,818 | 4,209,032 | 9,671,398 |
| Shares redeemed | (2,763,015) | (5,802,433) | (32,917,220) | (69,940,072) |
| Net increase (decrease) | (519,843) | (330,113) | $(6,300,108) | $(3,631,027) |
| Class B | | | | |
| Shares sold | 289 | 5,700 | $3,362 | $66,706 |
| Reinvestment of distributions | 4,552 | 16,252 | 52,894 | 199,644 |
| Shares redeemed | (268,343) | (357,170) | (3,136,375) | (4,345,090) |
| Net increase (decrease) | (263,502) | (335,218) | $(3,080,119) | $(4,078,740) |
| Class C | | | | |
| Shares sold | 169,725 | 692,594 | $2,012,689 | $8,328,355 |
| Reinvestment of distributions | 112,621 | 239,055 | 1,292,889 | 2,883,261 |
| Shares redeemed | (560,976) | (1,290,224) | (6,615,207) | (15,480,570) |
| Net increase (decrease) | (278,630) | (358,575) | $(3,309,629) | $(4,268,954) |
| Class I | | | | |
| Shares sold | 3,514,727 | 10,256,294 | $42,366,215 | $125,062,107 |
| Reinvestment of distributions | 723,771 | 1,725,705 | 8,439,164 | 21,067,463 |
| Shares redeemed | (6,840,412) | (14,829,259) | (82,408,270) | (180,244,295) |
| Net increase (decrease) | (2,601,914) | (2,847,260) | $(31,602,891) | $(34,114,725) |
| Advisor Freedom 2020 | | | | |
| Class A | | | | |
| Shares sold | 12,017,243 | 27,782,811 | $151,920,648 | $355,684,542 |
| Reinvestment of distributions | 2,799,032 | 5,909,171 | 34,232,157 | 76,203,121 |
| Shares redeemed | (21,685,563) | (50,488,965) | (274,322,848) | (647,091,927) |
| Net increase (decrease) | (6,869,288) | (16,796,983) | $(88,170,043) | $(215,204,264) |
| Class T | | | | |
| Shares sold | 3,935,154 | 9,558,319 | $49,700,260 | $122,507,769 |
| Reinvestment of distributions | 757,047 | 1,458,598 | 9,258,684 | 18,796,792 |
| Shares redeemed | (4,933,084) | (12,285,705) | (62,299,978) | (157,173,890) |
| Net increase (decrease) | (240,883) | (1,268,788) | $(3,341,034) | $(15,869,329) |
| Class B | | | | |
| Shares sold | 754 | 7,629 | $9,263 | $100,348 |
| Reinvestment of distributions | 12,000 | 32,862 | 147,357 | 428,604 |
| Shares redeemed | (650,519) | (592,571) | (8,037,147) | (7,633,936) |
| Net increase (decrease) | (637,765) | (552,080) | $(7,880,527) | $(7,104,984) |
| Class C | | | | |
| Shares sold | 508,435 | 1,393,631 | $6,365,343 | $17,741,893 |
| Reinvestment of distributions | 184,512 | 328,961 | 2,241,824 | 4,218,594 |
| Shares redeemed | (935,949) | (1,692,524) | (11,753,244) | (21,418,854) |
| Net increase (decrease) | (243,002) | 30,068 | $(3,146,077) | $541,633 |
| Class I | | | | |
| Shares sold | 8,998,419 | 22,381,359 | $114,818,960 | $288,319,323 |
| Reinvestment of distributions | 1,553,645 | 3,087,794 | 19,140,904 | 40,003,312 |
| Shares redeemed | (13,192,580) | (26,374,513) | (168,223,276) | (340,955,124) |
| Net increase (decrease) | (2,640,516) | (905,360) | $(34,263,412) | $(12,632,489) |
| Advisor Freedom 2025 | | | | |
| Class A | | | | |
| Shares sold | 13,038,706 | 31,021,987 | $161,710,319 | $389,903,221 |
| Reinvestment of distributions | 3,365,415 | 6,347,654 | 40,284,015 | 80,854,087 |
| Shares redeemed | (20,406,538) | (51,651,466) | (253,340,615) | (649,941,383) |
| Net increase (decrease) | (4,002,417) | (14,281,825) | $(51,346,281) | $(179,184,075) |
| Class T | | | | |
| Shares sold | 4,868,480 | 11,153,254 | $60,487,975 | $140,827,662 |
| Reinvestment of distributions | 867,099 | 1,407,914 | 10,405,176 | 17,953,059 |
| Shares redeemed | (5,365,678) | (10,680,658) | (66,686,284) | (134,505,078) |
| Net increase (decrease) | 369,901 | 1,880,510 | $4,206,867 | $24,275,643 |
| Class B | | | | |
| Shares sold | 575 | 15,631 | $6,910 | $206,729 |
| Reinvestment of distributions | 10,996 | 25,036 | 131,516 | 321,184 |
| Shares redeemed | (506,132) | (395,799) | (6,082,906) | (4,997,632) |
| Net increase (decrease) | (494,561) | (355,132) | $(5,944,480) | $(4,469,719) |
| Class C | | | | |
| Shares sold | 610,579 | 1,453,933 | $7,495,808 | $18,039,565 |
| Reinvestment of distributions | 193,777 | 292,818 | 2,290,442 | 3,692,311 |
| Shares redeemed | (551,056) | (1,419,290) | (6,738,998) | (17,532,292) |
| Net increase (decrease) | 253,300 | 327,461 | $3,047,252 | $4,199,584 |
| Class I | | | | |
| Shares sold | 10,742,459 | 26,263,342 | $134,487,343 | $332,470,146 |
| Reinvestment of distributions | 1,983,759 | 3,305,581 | 23,943,975 | 42,311,913 |
| Shares redeemed | (14,647,561) | (22,096,996) | (183,557,340) | (280,743,922) |
| Net increase (decrease) | (1,921,343) | 7,471,927 | $(25,126,022) | $94,038,137 |
| Advisor Freedom 2030 | | | | |
| Class A | | | | |
| Shares sold | 12,530,815 | 28,151,571 | $164,083,026 | $374,538,264 |
| Reinvestment of distributions | 3,388,381 | 5,719,438 | 42,591,945 | 77,893,729 |
| Shares redeemed | (18,431,544) | (45,869,341) | (241,373,842) | (612,549,684) |
| Net increase (decrease) | (2,512,348) | (11,998,332) | $(34,698,871) | $(160,117,691) |
| Class T | | | | |
| Shares sold | 4,730,650 | 9,683,529 | $61,708,631 | $128,635,174 |
| Reinvestment of distributions | 1,039,692 | 1,530,517 | 13,016,938 | 20,754,956 |
| Shares redeemed | (5,368,722) | (10,666,344) | (70,083,581) | (142,006,317) |
| Net increase (decrease) | 401,620 | 547,702 | $4,641,988 | $7,383,813 |
| Class B | | | | |
| Shares sold | 806 | 9,381 | $10,114 | $130,487 |
| Reinvestment of distributions | 13,509 | 30,198 | 169,402 | 414,596 |
| Shares redeemed | (539,084) | (504,982) | (6,796,686) | (6,786,052) |
| Net increase (decrease) | (524,769) | (465,403) | $(6,617,170) | $(6,240,969) |
| Class C | | | | |
| Shares sold | 589,524 | 1,223,130 | $7,638,034 | $16,095,011 |
| Reinvestment of distributions | 207,692 | 273,750 | 2,575,377 | 3,692,439 |
| Shares redeemed | (516,713) | (1,184,892) | (6,668,807) | (15,652,704) |
| Net increase (decrease) | 280,503 | 311,988 | $3,544,604 | $4,134,746 |
| Class I | | | | |
| Shares sold | 9,653,366 | 24,677,916 | $127,280,176 | $330,981,929 |
| Reinvestment of distributions | 2,190,878 | 3,416,838 | 27,692,706 | 46,644,604 |
| Shares redeemed | (13,868,233) | (26,842,246) | (182,418,207) | (362,065,195) |
| Net increase (decrease) | (2,023,989) | 1,252,508 | $(27,445,325) | $15,561,338 |
| Advisor Freedom 2035 | | | | |
| Class A | | | | |
| Shares sold | 11,334,338 | 24,128,485 | $140,956,637 | $305,985,627 |
| Reinvestment of distributions | 3,061,632 | 4,482,978 | 36,464,032 | 58,494,924 |
| Shares redeemed | (15,260,189) | (37,394,935) | (190,239,439) | (476,554,268) |
| Net increase (decrease) | (864,219) | (8,783,472) | $(12,818,770) | $(112,073,717) |
| Class T | | | | |
| Shares sold | 4,197,551 | 8,236,595 | $51,850,944 | $104,578,194 |
| Reinvestment of distributions | 874,028 | 1,075,393 | 10,339,754 | 13,933,993 |
| Shares redeemed | (3,625,274) | (7,529,158) | (44,679,718) | (95,022,356) |
| Net increase (decrease) | 1,446,305 | 1,782,830 | $17,510,980 | $23,489,831 |
| Class B | | | | |
| Shares sold | 387 | 3,708 | $4,628 | $47,620 |
| Reinvestment of distributions | 11,097 | 21,835 | 130,498 | 285,009 |
| Shares redeemed | (378,032) | (375,696) | (4,470,318) | (4,759,170) |
| Net increase (decrease) | (366,548) | (350,153) | $(4,335,192) | $(4,426,541) |
| Class C | | | | |
| Shares sold | 349,766 | 944,855 | $4,270,914 | $11,857,748 |
| Reinvestment of distributions | 159,885 | 178,251 | 1,865,862 | 2,289,722 |
| Shares redeemed | (402,537) | (851,468) | (4,847,040) | (10,677,671) |
| Net increase (decrease) | 107,114 | 271,638 | $1,289,736 | $3,469,799 |
| Class I | | | | |
| Shares sold | 8,187,712 | 21,967,842 | $102,644,350 | $280,691,155 |
| Reinvestment of distributions | 1,962,539 | 2,699,214 | 23,530,837 | 35,338,451 |
| Shares redeemed | (12,303,627) | (21,940,442) | (153,963,437) | (281,916,133) |
| Net increase (decrease) | (2,153,376) | 2,726,614 | $(27,788,250) | $34,113,473 |
| Advisor Freedom 2040 | | | | |
| Class A | | | | |
| Shares sold | 9,393,135 | 19,707,947 | $124,943,890 | $267,984,592 |
| Reinvestment of distributions | 2,471,927 | 3,837,419 | 31,541,785 | 53,655,622 |
| Shares redeemed | (12,463,286) | (31,398,245) | (166,332,014) | (428,794,626) |
| Net increase (decrease) | (598,224) | (7,852,879) | $(9,846,339) | $(107,154,412) |
| Class T | | | | |
| Shares sold | 4,203,815 | 6,927,315 | $56,057,518 | $94,215,131 |
| Reinvestment of distributions | 827,533 | 1,098,683 | 10,526,224 | 15,321,785 |
| Shares redeemed | (3,970,078) | (7,588,952) | (52,614,122) | (103,634,804) |
| Net increase (decrease) | 1,061,270 | 437,046 | $13,969,620 | $5,902,112 |
| Class B | | | | |
| Shares sold | 811 | 3,796 | $10,383 | $54,403 |
| Reinvestment of distributions | 12,839 | 26,074 | 162,282 | 365,555 |
| Shares redeemed | (438,998) | (412,767) | (5,572,683) | (5,614,809) |
| Net increase (decrease) | (425,348) | (382,897) | $(5,400,018) | $(5,194,851) |
| Class C | | | | |
| Shares sold | 409,946 | 964,487 | $5,369,121 | $12,948,905 |
| Reinvestment of distributions | 195,594 | 237,233 | 2,448,837 | 3,273,123 |
| Shares redeemed | (456,302) | (999,455) | (5,971,163) | (13,410,631) |
| Net increase (decrease) | 149,238 | 202,265 | $1,846,795 | $2,811,397 |
| Class I | | | | |
| Shares sold | 7,275,668 | 18,978,934 | $97,653,957 | $260,268,870 |
| Reinvestment of distributions | 1,720,091 | 2,493,394 | 22,068,787 | 34,993,505 |
| Shares redeemed | (10,623,705) | (21,436,098) | (142,062,900) | (296,208,636) |
| Net increase (decrease) | (1,627,946) | 36,230 | $(22,340,156) | $(946,261) |
| Advisor Freedom 2045 | | | | |
| Class A | | | | |
| Shares sold | 8,874,971 | 19,079,203 | $91,358,634 | $200,212,363 |
| Reinvestment of distributions | 1,781,064 | 2,516,424 | 17,543,481 | 27,141,967 |
| Shares redeemed | (10,442,276) | (25,563,477) | (107,919,804) | (269,733,077) |
| Net increase (decrease) | 213,759 | (3,967,850) | $982,311 | $(42,378,747) |
| Class T | | | | |
| Shares sold | 3,497,214 | 6,498,285 | $35,689,336 | $67,982,369 |
| Reinvestment of distributions | 565,669 | 645,350 | 5,537,900 | 6,916,374 |
| Shares redeemed | (2,664,108) | (5,407,165) | (27,212,242) | (56,610,131) |
| Net increase (decrease) | 1,398,775 | 1,736,470 | $14,014,994 | $18,288,612 |
| Class B | | | | |
| Shares sold | – | 12,465 | $– | $126,428 |
| Reinvestment of distributions | 4,003 | 6,873 | 39,186 | 74,538 |
| Shares redeemed | (129,611) | (130,687) | (1,280,562) | (1,382,819) |
| Net increase (decrease) | (125,608) | (111,349) | $(1,241,376) | $(1,181,853) |
| Class C | | | | |
| Shares sold | 265,312 | 688,081 | $2,695,953 | $7,146,960 |
| Reinvestment of distributions | 81,745 | 86,426 | 793,745 | 922,037 |
| Shares redeemed | (232,368) | (495,887) | (2,355,047) | (5,163,244) |
| Net increase (decrease) | 114,689 | 278,620 | $1,134,651 | $2,905,753 |
| Class I | | | | |
| Shares sold | 7,227,559 | 17,857,873 | $74,992,192 | $188,145,800 |
| Reinvestment of distributions | 1,362,502 | 1,798,921 | 13,502,397 | 19,453,582 |
| Shares redeemed | (8,835,299) | (17,404,606) | (91,419,371) | (184,937,935) |
| Net increase (decrease) | (245,238) | 2,252,188 | $(2,924,782) | $22,661,447 |
| Advisor Freedom 2050 | | | | |
| Class A | | | | |
| Shares sold | 6,939,645 | 14,778,783 | $70,963,515 | $154,228,676 |
| Reinvestment of distributions | 1,199,833 | 1,671,709 | 11,758,360 | 17,918,683 |
| Shares redeemed | (7,402,959) | (18,220,423) | (76,056,047) | (190,875,160) |
| Net increase (decrease) | 736,519 | (1,769,931) | $6,665,828 | $(18,727,801) |
| Class T | | | | |
| Shares sold | 2,845,863 | 5,220,682 | $28,928,769 | $54,316,675 |
| Reinvestment of distributions | 436,403 | 512,467 | 4,259,289 | 5,468,353 |
| Shares redeemed | (2,163,143) | (4,619,199) | (21,966,760) | (48,267,781) |
| Net increase (decrease) | 1,119,123 | 1,113,950 | $11,221,298 | $11,517,247 |
| Class B | | | | |
| Shares sold | 29 | 2,190 | $284 | $21,909 |
| Reinvestment of distributions | 4,919 | 8,955 | 47,861 | 96,400 |
| Shares redeemed | (174,970) | (151,436) | (1,712,713) | (1,590,133) |
| Net increase (decrease) | (170,022) | (140,291) | $(1,664,568) | $(1,471,824) |
| Class C | | | | |
| Shares sold | 272,135 | 592,294 | $2,752,913 | $6,132,539 |
| Reinvestment of distributions | 83,621 | 89,707 | 809,453 | 953,603 |
| Shares redeemed | (247,008) | (498,907) | (2,487,125) | (5,141,979) |
| Net increase (decrease) | 108,748 | 183,094 | $1,075,241 | $1,944,163 |
| Class I | | | | |
| Shares sold | 6,710,356 | 15,739,783 | $69,186,681 | $164,851,297 |
| Reinvestment of distributions | 1,124,971 | 1,391,015 | 11,080,970 | 14,936,380 |
| Shares redeemed | (7,429,050) | (13,002,547) | (76,446,920) | (136,937,311) |
| Net increase (decrease) | 406,277 | 4,128,251 | $3,820,731 | $42,850,366 |
| Advisor Freedom 2055 | | | | |
| Class A | | | | |
| Shares sold | 3,816,957 | 7,650,491 | $42,489,608 | $86,320,186 |
| Reinvestment of distributions | 357,228 | 403,217 | 3,808,050 | 4,669,301 |
| Shares redeemed | (2,625,864) | (5,932,608) | (29,312,841) | (67,116,441) |
| Net increase (decrease) | 1,548,321 | 2,121,100 | $16,984,817 | $23,873,046 |
| Class T | | | | |
| Shares sold | 1,380,325 | 2,281,706 | $15,299,687 | $25,567,824 |
| Reinvestment of distributions | 124,311 | 113,540 | 1,320,183 | 1,310,222 |
| Shares redeemed | (877,367) | (1,388,534) | (9,726,143) | (15,737,207) |
| Net increase (decrease) | 627,269 | 1,006,712 | $6,893,727 | $11,140,839 |
| Class C | | | | |
| Shares sold | 169,545 | 238,636 | $1,874,454 | $2,683,219 |
| Reinvestment of distributions | 16,448 | 13,580 | 174,514 | 157,087 |
| Shares redeemed | (47,758) | (87,211) | (529,422) | (965,863) |
| Net increase (decrease) | 138,235 | 165,005 | $1,519,546 | $1,874,443 |
| Class I | | | | |
| Shares sold | 3,984,144 | 7,612,107 | $44,535,462 | $85,891,483 |
| Reinvestment of distributions | 362,000 | 363,384 | 3,869,778 | 4,204,287 |
| Shares redeemed | (2,607,382) | (4,499,574) | (29,113,275) | (50,866,350) |
| Net increase (decrease) | 1,738,762 | 3,475,917 | $19,291,965 | $39,229,420 |
| Advisor Freedom 2060 | | | | |
| Class A | | | | |
| Shares sold | 743,259 | 1,272,139 | $7,285,847 | $12,356,911 |
| Reinvestment of distributions | 22,784 | 15,557 | 214,171 | 155,371 |
| Shares redeemed | (468,624) | (565,709) | (4,584,839) | (5,476,304) |
| Net increase (decrease) | 297,419 | 721,987 | $2,915,179 | $7,035,978 |
| Class T | | | | |
| Shares sold | 175,297 | 445,750 | $1,734,614 | $4,200,477 |
| Reinvestment of distributions | 5,750 | 5,022 | 54,109 | 51,193 |
| Shares redeemed | (206,353) | (319,192) | (2,013,173) | (3,003,661) |
| Net increase (decrease) | (25,306) | 131,580 | $(224,450) | $1,248,009 |
| Class C | | | | |
| Shares sold | 30,016 | 231,239 | $295,027 | $2,153,598 |
| Reinvestment of distributions | 1,934 | 1,964 | 18,295 | 20,446 |
| Shares redeemed | (93,216) | (227,970) | (906,738) | (2,119,305) |
| Net increase (decrease) | (61,266) | 5,233 | $(593,416) | $54,739 |
| Class I | | | | |
| Shares sold | 605,689 | 789,224 | $5,963,293 | $7,600,453 |
| Reinvestment of distributions | 14,920 | 8,465 | 140,544 | 83,652 |
| Shares redeemed | (228,103) | (230,196) | (2,252,104) | (2,188,624) |
| Net increase (decrease) | 392,506 | 567,493 | $3,851,733 | $5,495,481 |
8. Other.
The Funds' organizational documents provide former and current trustees and officers with a limited indemnification against liabilities arising in connection with the performance of their duties to the Funds. In the normal course of business, the Funds may also enter into contracts that provide general indemnifications. The Funds' maximum exposure under these arrangements is unknown as this would be dependent on future claims that may be made against the Funds. The risk of material loss from such claims is considered remote.
The Funds do not invest in the Underlying Funds for the purpose of exercising management or control; however, investments by the Funds within their principal investment strategies may represent a significant portion of the Underlying Fund's net assets. At the end of the period, the following Funds were the owners of record of 10% or more of the total outstanding shares of the Underlying Funds.
| Fund | Fidelity Advisor Freedom Income Fund | Fidelity Advisor Freedom 2010 Fund | Fidelity Advisor Freedom 2015 Fund | Fidelity Advisor Freedom 2020 Fund | Fidelity Advisor Freedom 2025 Fund | Fidelity Advisor Freedom 2030 Fund | Fidelity Advisor Freedom 2035 Fund | Fidelity Advisor Freedom 2040 Fund |
| Fidelity Advisor Series Equity-Income Fund | -% | -% | -% | 12% | 15% | 18% | 15% | 14% |
| Fidelity Advisor Series Growth & Income Fund | -% | -% | -% | 12% | 15% | 18% | 15% | 14% |
| Fidelity Advisor Series Opportunistic Insights Fund | -% | -% | -% | 12% | 15% | 18% | 15% | 14% |
| Fidelity Advisor Series Stock Selector Large Cap Value Fund | -% | -% | -% | 12% | 15% | 18% | 15% | 14% |
| Fidelity Advisor Series Small Cap Fund | -% | -% | -% | 12% | 15% | 18% | 15% | 14% |
| Fidelity Advisor Series Growth Opportunities Fund | -% | -% | -% | 12% | 15% | 18% | 15% | 14% |
| Fidelity Advisor Series Equity Growth Fund | -% | -% | -% | 12% | 15% | 18% | 15% | 14% |
| Fidelity Advisor Series Short-Term Credit Fund | 10% | 13% | 19% | 28% | 23% | -% | -% | -% |
The Funds, in aggregate, were the owners of record of more than 20% of the total outstanding shares of the following Underlying Funds.
| Fund | % of shares held |
| Fidelity Advisor Series Equity-Income Fund | 100% |
| Fidelity Advisor Series Growth & Income Fund | 100% |
| Fidelity Advisor Series Opportunistic Insights Fund | 100% |
| Fidelity Advisor Series Stock Selector Large Cap Value Fund | 100% |
| Fidelity Advisor Series Small Cap Fund | 100% |
| Fidelity Advisor Series Growth Opportunities Fund | 100% |
| Fidelity Advisor Series Equity Growth Fund | 100% |
| Fidelity Advisor Series Short-Term Credit Fund | 100% |
Shareholder Expense Example
As a shareholder of the Fund, you incur two types of costs: (1) transaction costs, including sales charges (loads) on purchase payments or redemption proceeds, and (2) ongoing costs, including distribution and/or service (12b-1) fees and other Fund expenses. This Example is intended to help you understand your ongoing costs (in dollars) of investing in the Fund and to compare these costs with the ongoing costs of investing in other mutual funds.
The Example is based on an investment of $1,000 invested at the beginning of the period and held for the entire period (April 1, 2016 to September 30, 2016).
Actual Expenses
The first line of the accompanying table for each class of each fund provides information about actual account values and actual expenses. You may use the information in this line, together with the amount you invested, to estimate the expenses that you paid over the period. Simply divide your account value by $1,000.00 (for example, an $8,600 account value divided by $1,000.00 = 8.6), then multiply the result by the number in the first line for a class of the fund under the heading entitled "Expenses Paid During Period" to estimate the expenses you paid on your account during this period. In addition, each Fund, as a shareholder in underlying Fidelity Funds, will indirectly bear its pro-rata share of the fees and expenses incurred by the underlying Fidelity Funds. These fees and expenses are not included in each Fund's annualized expense ratio used to calculate the expense estimates in the table below.
Hypothetical Example for Comparison Purposes
The second line of the accompanying table for each class of each fund provides information about hypothetical account values and hypothetical expenses based on a Class' actual expense ratio and an assumed rate of return of 5% per year before expenses, which is not the Class' actual return. The hypothetical account values and expenses may not be used to estimate the actual ending account balance or expenses you paid for the period. You may use this information to compare the ongoing costs of investing in the Fund and other funds. To do so, compare this 5% hypothetical example with the 5% hypothetical examples that appear in the shareholder reports of the other funds. In addition, each Fund, as a shareholder in underlying Fidelity Funds, will indirectly bear its pro-rata share of the fees and expenses incurred by the underlying Fidelity Funds. These fees and expenses are not included in each Fund's annualized expense ratio used to calculate the expense estimates in the table below.
Please note that the expenses shown in the table are meant to highlight your ongoing costs only and do not reflect any transaction costs. Therefore, the second line of the table is useful in comparing ongoing costs only, and will not help you determine the relative total costs of owning different funds. In addition, if these transactional costs were included, your costs would have been higher.
| | Annualized Expense Ratio-A | Beginning
Account Value
April 1, 2016 | Ending
Account Value
September 30, 2016 | Expenses Paid
During Period-B
April 1, 2016
to September 30, 2016 |
| Advisor Freedom Income | | | | |
| Class A | .25% | | | |
| Actual | | $1,000.00 | $1,040.60 | $1.28 |
| Hypothetical-C | | $1,000.00 | $1,023.82 | $1.27 |
| Class T | .50% | | | |
| Actual | | $1,000.00 | $1,040.30 | $2.56 |
| Hypothetical-C | | $1,000.00 | $1,022.56 | $2.54 |
| Class C | 1.00% | | | |
| Actual | | $1,000.00 | $1,037.00 | $5.11 |
| Hypothetical-C | | $1,000.00 | $1,020.05 | $5.06 |
| Class I | - % | | | |
| Actual | | $1,000.00 | $1,042.70 | $- |
| Hypothetical-C | | $1,000.00 | $1,025.07 | $- |
| Advisor Freedom 2005 | | | | |
| Class A | .25% | | | |
| Actual | | $1,000.00 | $1,048.10 | $1.28 |
| Hypothetical-C | | $1,000.00 | $1,023.82 | $1.27 |
| Class T | .50% | | | |
| Actual | | $1,000.00 | $1,046.70 | $2.57 |
| Hypothetical-C | | $1,000.00 | $1,022.56 | $2.54 |
| Class C | 1.00% | | | |
| Actual | | $1,000.00 | $1,044.60 | $5.13 |
| Hypothetical-C | | $1,000.00 | $1,020.05 | $5.06 |
| Class I | - % | | | |
| Actual | | $1,000.00 | $1,049.40 | $- |
| Hypothetical-C | | $1,000.00 | $1,025.07 | $- |
| Advisor Freedom 2010 | | | | |
| Class A | .25% | | | |
| Actual | | $1,000.00 | $1,052.80 | $1.29 |
| Hypothetical-C | | $1,000.00 | $1,023.82 | $1.27 |
| Class T | .50% | | | |
| Actual | | $1,000.00 | $1,052.40 | $2.57 |
| Hypothetical-C | | $1,000.00 | $1,022.56 | $2.54 |
| Class C | 1.00% | | | |
| Actual | | $1,000.00 | $1,049.70 | $5.14 |
| Hypothetical-C | | $1,000.00 | $1,020.05 | $5.06 |
| Class I | - % | | | |
| Actual | | $1,000.00 | $1,055.00 | $- |
| Hypothetical-C | | $1,000.00 | $1,025.07 | $- |
| Advisor Freedom 2015 | | | | |
| Class A | .25% | | | |
| Actual | | $1,000.00 | $1,058.30 | $1.29 |
| Hypothetical-C | | $1,000.00 | $1,023.82 | $1.27 |
| Class T | .50% | | | |
| Actual | | $1,000.00 | $1,056.90 | $2.58 |
| Hypothetical-C | | $1,000.00 | $1,022.56 | $2.54 |
| Class C | 1.00% | | | |
| Actual | | $1,000.00 | $1,053.30 | $5.15 |
| Hypothetical-C | | $1,000.00 | $1,020.05 | $5.06 |
| Class I | - % | | | |
| Actual | | $1,000.00 | $1,059.40 | $- |
| Hypothetical-C | | $1,000.00 | $1,025.07 | $- |
| Advisor Freedom 2020 | | | | |
| Class A | .25% | | | |
| Actual | | $1,000.00 | $1,061.00 | $1.29 |
| Hypothetical-C | | $1,000.00 | $1,023.82 | $1.27 |
| Class T | .50% | | | |
| Actual | | $1,000.00 | $1,059.50 | $2.58 |
| Hypothetical-C | | $1,000.00 | $1,022.56 | $2.54 |
| Class C | 1.00% | | | |
| Actual | | $1,000.00 | $1,057.20 | $5.16 |
| Hypothetical-C | | $1,000.00 | $1,020.05 | $5.06 |
| Class I | - % | | | |
| Actual | | $1,000.00 | $1,061.90 | $- |
| Hypothetical-C | | $1,000.00 | $1,025.07 | $- |
| Advisor Freedom 2025 | | | | |
| Class A | .25% | | | |
| Actual | | $1,000.00 | $1,063.50 | $1.29 |
| Hypothetical-C | | $1,000.00 | $1,023.82 | $1.27 |
| Class T | .50% | | | |
| Actual | | $1,000.00 | $1,062.00 | $2.58 |
| Hypothetical-C | | $1,000.00 | $1,022.56 | $2.54 |
| Class C | 1.00% | | | |
| Actual | | $1,000.00 | $1,058.70 | $5.16 |
| Hypothetical-C | | $1,000.00 | $1,020.05 | $5.06 |
| Class I | - % | | | |
| Actual | | $1,000.00 | $1,064.40 | $- |
| Hypothetical-C | | $1,000.00 | $1,025.07 | $- |
| Advisor Freedom 2030 | | | | |
| Class A | .25% | | | |
| Actual | | $1,000.00 | $1,069.40 | $1.30 |
| Hypothetical-C | | $1,000.00 | $1,023.82 | $1.27 |
| Class T | .50% | | | |
| Actual | | $1,000.00 | $1,067.80 | $2.59 |
| Hypothetical-C | | $1,000.00 | $1,022.56 | $2.54 |
| Class C | 1.00% | | | |
| Actual | | $1,000.00 | $1,065.20 | $5.18 |
| Hypothetical-C | | $1,000.00 | $1,020.05 | $5.06 |
| Class I | - % | | | |
| Actual | | $1,000.00 | $1,070.50 | $- |
| Hypothetical-C | | $1,000.00 | $1,025.07 | $- |
| Advisor Freedom 2035 | | | | |
| Class A | .25% | | | |
| Actual | | $1,000.00 | $1,072.30 | $1.30 |
| Hypothetical-C | | $1,000.00 | $1,023.82 | $1.27 |
| Class T | .50% | | | |
| Actual | | $1,000.00 | $1,071.20 | $2.60 |
| Hypothetical-C | | $1,000.00 | $1,022.56 | $2.54 |
| Class C | 1.00% | | | |
| Actual | | $1,000.00 | $1,068.70 | $5.19 |
| Hypothetical-C | | $1,000.00 | $1,020.05 | $5.06 |
| Class I | - % | | | |
| Actual | | $1,000.00 | $1,073.50 | $- |
| Hypothetical-C | | $1,000.00 | $1,025.07 | $- |
| Advisor Freedom 2040 | | | | |
| Class A | .25% | | | |
| Actual | | $1,000.00 | $1,072.10 | $1.30 |
| Hypothetical-C | | $1,000.00 | $1,023.82 | $1.27 |
| Class T | .50% | | | |
| Actual | | $1,000.00 | $1,070.60 | $2.60 |
| Hypothetical-C | | $1,000.00 | $1,022.56 | $2.54 |
| Class C | 1.00% | | | |
| Actual | | $1,000.00 | $1,068.50 | $5.19 |
| Hypothetical-C | | $1,000.00 | $1,020.05 | $5.06 |
| Class I | - % | | | |
| Actual | | $1,000.00 | $1,074.00 | $- |
| Hypothetical-C | | $1,000.00 | $1,025.07 | $- |
| Advisor Freedom 2045 | | | | |
| Class A | .25% | | | |
| Actual | | $1,000.00 | $1,072.70 | $1.30 |
| Hypothetical-C | | $1,000.00 | $1,023.82 | $1.27 |
| Class T | .50% | | | |
| Actual | | $1,000.00 | $1,071.10 | $2.60 |
| Hypothetical-C | | $1,000.00 | $1,022.56 | $2.54 |
| Class C | 1.00% | | | |
| Actual | | $1,000.00 | $1,068.60 | $5.19 |
| Hypothetical-C | | $1,000.00 | $1,020.05 | $5.06 |
| Class I | - % | | | |
| Actual | | $1,000.00 | $1,074.30 | $- |
| Hypothetical-C | | $1,000.00 | $1,025.07 | $- |
| Advisor Freedom 2050 | | | | |
| Class A | .25% | | | |
| Actual | | $1,000.00 | 1,073.00 | $1.30 |
| Hypothetical-C | | $1,000.00 | $1,023.82 | $1.27 |
| Class T | .50% | | | |
| Actual | | $1,000.00 | $1,070.70 | $2.60 |
| Hypothetical-C | | $1,000.00 | $1,022.56 | $2.54 |
| Class C | 1.00% | | | |
| Actual | | $1,000.00 | $1,069.20 | $5.19 |
| Hypothetical-C | | $1,000.00 | $1,020.05 | $5.06 |
| Class I | - % | | | |
| Actual | | $1,000.00 | $1,073.20 | $- |
| Hypothetical-C | | $1,000.00 | $1,025.07 | $- |
| Advisor Freedom 2055 | | | | |
| Class A | .25% | | | |
| Actual | | $1,000.00 | $1,071.90 | $1.30 |
| Hypothetical-C | | $1,000.00 | $1,023.82 | $1.27 |
| Class T | .50% | | | |
| Actual | | $1,000.00 | $1,071.30 | $2.60 |
| Hypothetical-C | | $1,000.00 | $1,022.56 | $2.54 |
| Class C | 1.00% | | | |
| Actual | | $1,000.00 | $1,068.50 | $5.19 |
| Hypothetical-C | | $1,000.00 | $1,020.05 | $5.06 |
| Class I | - % | | | |
| Actual | | $1,000.00 | $1,073.30 | $- |
| Hypothetical-C | | $1,000.00 | $1,025.07 | $- |
| Advisor Freedom 2060 | | | | |
| Class A | .25% | | | |
| Actual | | $1,000.00 | $1,072.50 | $1.30 |
| Hypothetical-C | | $1,000.00 | $1,023.82 | $1.27 |
| Class T | .50% | | | |
| Actual | | $1,000.00 | $1,070.70 | $2.60 |
| Hypothetical-C | | $1,000.00 | $1,022.56 | $2.54 |
| Class C | 1.00% | | | |
| Actual | | $1,000.00 | $1,068.20 | $5.18 |
| Hypothetical-C | | $1,000.00 | $1,020.05 | $5.06 |
| Class I | - % | | | |
| Actual | | $1,000.00 | $1,072.80 | $- |
| Hypothetical-C | | $1,000.00 | $1,025.07 | $- |
| | | | | |
A Annualized expense ratio reflects expenses net of applicable fee waivers.
B Expenses are equal to each Class' annualized expense ratio, multiplied by the average account value over the period, multiplied by 183/365 (to reflect the one-half year period). The fees and expenses of the underlying Fidelity Funds in which each Fund invests are not included in each Class' annualized expense ratio.
C 5% return per year before expenses
Board Approval of Investment Advisory Contracts and Management Fees
Fidelity Advisor Freedom Funds
Each year, the Board of Trustees, including the Independent Trustees (together, the Board), votes on the renewal of the management contract (the Advisory Contract) with FMR Co., Inc. (FMRC), an affiliate of Fidelity Management & Research Company (FMR), and the administration agreement between FMRC and FMR for each fund. The Board, assisted by the advice of fund counsel and Independent Trustees' counsel, requests and considers a broad range of information relevant to the renewal of the Advisory Contracts and administration agreements throughout the year.
The Board meets regularly and, at each of its meetings, covers an extensive agenda of topics and materials and considers factors that are relevant to its annual consideration of the renewal of each fund's Advisory Contract and administration agreement, including the services and support provided to each fund and its shareholders. The Board has established four standing committees (Committees) — Operations, Audit, Fair Valuation, and Governance and Nominating — each composed of and chaired by Independent Trustees with varying backgrounds, to which the Board has assigned specific subject matter responsibilities in order to enhance effective decision-making by the Board. The Operations Committee, of which all of the Independent Trustees are members, meets regularly throughout the year and considers, among other matters, information specifically related to the annual consideration of the renewal of each fund's Advisory Contract and administration agreement. The Board, acting directly and through its Committees, requests and receives information concerning the annual consideration of the renewal of each fund's Advisory Contract and administration agreement. The Board also meets as needed to consider matters specifically related to the Board's annual consideration of the renewal of the Advisory Contracts and administration agreements. Members of the Board may also meet with trustees of other Fidelity funds through ad hoc joint committees to discuss certain matters relevant to all of the Fidelity funds.
At its September 2016 meeting, the Board unanimously determined to renew each fund's Advisory Contract and administration agreement. In reaching its determination, the Board considered all factors it believed relevant and reached a determination, with the assistance of fund counsel and Independent Trustees' counsel and through the exercise of its business judgment, that the renewal of the Advisory Contract was in the best interests of each fund and its shareholders and that the fact that no fees are payable under the Advisory Contracts was fair and reasonable. The Board's decision to renew the Advisory Contracts was not based on any single factor, but rather was based on a comprehensive consideration of all the information provided to the Board at its meetings throughout the year. In reaching its determination, the Board was aware that shareholders of each fund have a broad range of investment choices available to them, including a wide choice among funds offered by Fidelity's competitors, and that each fund's shareholders, who have the opportunity to review and weigh the disclosure provided by the fund in its prospectus and other public disclosures, have chosen to invest in that fund, which is part of the Fidelity family of funds.
Approval of New Advisory Contracts. The Board noted that at its July 2016 meeting, it had voted to approve an amended and restated management contract (New Advisory Contract) for each fund to add a management fee payable by the fund. The Board considered that each fund's New Advisory Contract will not take effect unless the funds' shareholders approve the New Advisory Contracts and shareholders of certain other Fidelity funds also approve amended and restated management contracts. The Board noted that such approvals are scheduled to be voted on at meetings on October 28, 2016, but that one or more of the meetings may be adjourned to later dates. The Board also noted that, under each fund's current Advisory Contract, the fund does not pay a management fee to FMRC and instead each fund indirectly incurs a portion of the management fee and other expenses of each underlying fund as acquired fund fees and expenses. The Board considered that, under each fund's New Advisory Contract, each fund will pay a monthly management fee to FMRC at an annual rate for the fund. The Board noted that the increase in each fund's management fee under the New Advisory Contract will result in the fund's management fee rate ranking above the median of the management fee rates of its competitor funds based on the competitive mapped group data provided to the Board in July 2016 in connection with its consideration of the annual renewal of the current Advisory Contracts. The Board considered that the increase in each fund's management fee under the New Advisory Contract will be more than offset by a decrease in each fund's acquired fund fees and expenses as a result of fee reductions under new management contracts, sub-advisory agreements, transfer agent agreements, and pricing and bookkeeping agreements for the underlying funds (New Underlying Fund Contracts), which will go into effect if the funds' New Advisory Contracts take effect. The Board noted that, once the New Underlying Fund Contracts take effect, the underlying funds will no longer pay any operating expenses, subject to limited exceptions, and, thus, the funds' acquired fund fees and expenses will be significantly reduced. The Board noted that, as a result, the increased management fee and decreased acquired fund fees and expenses are expected to have the combined effect of reducing the total expenses incurred by shareholders of each fund by at least 0.02%. The Board considered that the approval of the New Advisory Contracts will not result in any changes to (i) the investment process or strategies employed in the management of the funds' assets; (ii) the nature, extent and quality of services provided to each fund; or (iii) the day-to-day management of each fund and the personnel primarily responsible for such management. The Board considered that, like the current Advisory Contracts, the New Advisory Contracts provide that FMRC or an affiliate undertakes to pay all operating expenses of the funds, subject to limited exceptions specified in each contract.
The Board noted that certain of the information it considered in reaching its determination with respect to the current Advisory Contracts would no longer be applicable if the New Advisory Contracts take effect. Based on its evaluation of all of the conclusions noted, and after considering all factors it believed relevant, the Board ultimately concluded that the nature, extent and quality of services provided to each fund should continue to benefit shareholders of each fund, that the management fee structures under the New Advisory Contracts are fair and reasonable, and that each fund's New Advisory Contract should be approved.
Nature, Extent, and Quality of Services Provided. The Board considered Fidelity's staffing as it relates to the funds, including the backgrounds of investment personnel of FMRC, and also considered the funds' investment objectives, strategies, and related investment philosophies. The Independent Trustees also had discussions with senior management of Fidelity's investment operations and investment groups with responsibility for the underlying Fidelity funds in which each fund invests. The Board considered the structure of the investment personnel compensation program and whether this structure provides appropriate incentives to act in the best interests of each fund. Additionally, the Board considered the portfolio managers' investments, if any, in the funds that they manage.
Resources Dedicated to Investment Management and Support Services. The Board reviewed the general qualifications and capabilities of Fidelity's investment staff, including its size, education, experience, and resources, as well as Fidelity's approach to recruiting, managing, and compensating investment personnel. The Board noted that Fidelity has continued to increase the resources devoted to non-U.S. offices, including expansion of Fidelity's global investment organization. The Board also noted that Fidelity's analysts have extensive resources, tools and capabilities that allow them to conduct sophisticated quantitative and fundamental analysis, as well as credit analysis of issuers, counterparties and guarantors. Further, the Board considered that Fidelity's investment professionals have sufficient access to global information and data so as to provide competitive investment results over time, and that those professionals also have access to sophisticated tools that permit them to assess portfolio construction and risk and performance attribution characteristics continuously, as well as to transmit new information and research conclusions rapidly around the world. Additionally, in its deliberations, the Board considered Fidelity's risk management, compliance, and technology and operations capabilities and resources, which are integral parts of the investment management process.
Shareholder and Administrative Services. The Board considered (i) the nature, extent, quality, and cost of advisory, administrative, and shareholder services performed by Fidelity under the Advisory Contract and under separate agreements covering administration, transfer agency, and pricing and bookkeeping services for each fund; (ii) the nature and extent of the supervision of third party service providers, principally custodians, subcustodians, and pricing vendors; and (iii) the resources devoted to, and the record of compliance with, each fund's compliance policies and procedures.
The Board noted that the growth of fund assets over time across the complex allows Fidelity to reinvest in the development of services designed to enhance the value or convenience of the Fidelity funds as investment vehicles. These services include 24-hour access to account information and market information through telephone representatives and over the Internet, investor education materials and asset allocation tools, and the expanded availability of Fidelity Investor Centers.
Investment in a Large Fund Family. The Board considered the benefits to shareholders of investing in a Fidelity fund, including the benefits of investing in a fund that is part of a large family of funds offering a variety of investment disciplines and providing a large variety of mutual fund investor services. The Board noted that Fidelity had taken, or had made recommendations that resulted in the Fidelity funds taking, a number of actions over the previous year that benefited particular funds, including: (i) continuing to dedicate additional resources to investment research and to the support of the senior management team that oversees asset management; (ii) continuing efforts to enhance Fidelity's global research capabilities; (iii) launching new funds and making other enhancements to meet client needs; (iv) broadening eligibility requirements for certain lower-priced share classes of, and streamlining the fee structure for, certain existing equity index funds; (v) lowering expense caps for certain existing funds and classes to reduce expenses paid by shareholders; (vi) eliminating redemption fees for certain variable insurance product funds and classes; (vii) continuing to launch dedicated lower cost underlying funds to meet portfolio construction needs related to expanding underlying fund options for Fidelity funds of funds, specifically for the Freedom Fund product lines; (viii) launching a lower cost share class for use by the Freedom Index Fund product line; (ix) rationalizing product lines and gaining increased efficiencies through fund mergers and share class consolidations; (x) continuing to develop, acquire and implement systems and technology to improve services to the funds and shareholders, strengthen information security, and increase efficiency; (xi) implementing investment enhancements to further strengthen Fidelity's target date product line to increase investors' probability of success in achieving their goals; (xii) accelerating the conversion of all remaining Class B shares to Class A shares, which have a lower expense structure; and (xiii) implementing changes to Fidelity's money market fund product line in response to recent regulatory reforms.
Investment Performance. The Board considered whether each fund has operated in accordance with its investment objective, as well as its record of compliance with its investment restrictions and its performance history.
The Board took into account discussions with representatives of the investment adviser about fund investment performance that occur at Board meetings throughout the year. In this regard the Board noted that as part of regularly scheduled fund reviews and other reports to the Board on fund performance, the Board considers annualized return information for each fund for different time periods, measured against one or more securities market indices, including a customized blended index representative of the fund's asset classes (each a "benchmark index") and a peer group of funds with similar objectives ("peer group"), if any. In its evaluation of fund investment performance at meetings throughout the year, the Board gave particular attention to information indicating underperformance of certain Fidelity funds for specific time periods and discussed with the investment adviser the reasons for such underperformance. Advisor Freedom Income Fund underperformed its benchmark for the one- and three-year periods ended January 31, 2016, and as a result, the Board will continue to discuss with FMRC the steps it is taking to address the fund's performance.
In addition to reviewing absolute and relative fund performance, the Independent Trustees periodically consider the appropriateness of fund performance metrics in evaluating the results achieved. In general, the Independent Trustees believe that fund performance should be evaluated based on gross performance (before fees and expenses, including acquired fund fees and expenses, but after transaction costs, if any) compared to appropriate benchmark indices, over appropriate time periods that may include full market cycles, and on net performance (after fees and expenses, including acquired fund fees and expenses) compared to peer groups, as applicable, over the same periods, taking into account relevant factors including the following: general market conditions; the extent to which particular underlying funds affected performance; and fund cash flows and other factors. Depending on the circumstances, the Independent Trustees may be satisfied with a fund's performance notwithstanding that it lags its benchmark index or peer group for certain periods.
The Independent Trustees recognize that shareholders evaluate performance on a net basis over their own holding periods, for which one-, three-, and five-year periods are often used as a proxy. For this reason, the performance information reviewed by the Board also included net cumulative calendar year total return information for each fund and an appropriate benchmark index for the most recent one-, three-, and five-year periods (for the most recent one- and three-year periods for Advisor Freedom 2055 Fund and for the most recent one-year period for Advisor Freedom 2060 Fund).
Based on its review, the Board concluded that the nature, extent, and quality of services provided to each fund under the Advisory Contracts should continue to benefit the shareholders of each fund.
Competitiveness of Management Fee and Total Expense Ratio. The Board noted that the funds currently do not pay FMRC a management fee for investment advisory services, and that each fund bears indirectly the fees and expenses, including the management fees, paid by the underlying Fidelity funds in which it invests. The Board considered each fund's management fee and total expense ratio compared to "mapped groups" of competitive funds and classes created for the purpose of facilitating the Trustees' competitive analysis of management fees and total expenses. Fidelity creates "mapped groups" by combining similar Lipper investment objective categories that have comparable investment mandates. Combining Lipper investment objective categories aids the Board's management fee and total expense ratio comparisons by broadening the competitive group used for comparison.
Management Fee. The Board considered two proprietary management fee comparisons for the 12-month (or shorter) periods shown in basis points (BP) in the charts below. The group of Lipper funds used by the Board for management fee comparisons is referred to below as the "Total Mapped Group." The Total Mapped Group comparison focuses on a fund's standing in terms of gross management fees before expense reimbursements or caps relative to the total universe of funds with comparable investment mandates, regardless of whether their management fee structures also are comparable. Funds with comparable investment mandates offer exposure to similar types of securities. Funds with comparable management fee structures have similar management fee contractual arrangements (
e.g., flat rate charged for advisory services, all-inclusive fee rate,
etc.). "TMG %" represents the percentage of funds in the Total Mapped Group that had management fees that were lower than a fund's. For example, a hypothetical TMG % of 20% would mean that 80% of the funds in the Total Mapped Group had higher, and 20% had lower, management fees than a fund. The funds' actual TMG %s and the number of funds in the Total Mapped Group are in the charts below. The Board also noted that over the past few years, Fidelity has been developing and refining the competitive methodology for the funds to provide a more meaningful competitive comparison. As a result, beginning with the 2014 competitive results, instead of including all funds in one competitive mapped group that includes all funds-of-funds, Fidelity introduced three new Total Mapped Groups that consist of target retirement funds, grouped according to target retirement dates. The Board noted that Fidelity believes that the new Total Mapped Groups provide more meaningful competitive comparisons for the funds because they include target date funds, regardless of whether the fund is a fund of funds, and reflect, among other things, that active target date funds with a higher percentage of assets invested in equities tend to have higher expenses. The "Asset-Size Peer Group" (ASPG) comparison focuses on a fund's standing relative to a subset of non-Fidelity funds within the Total Mapped Group that are similar in size and management fee structure. For example, if a fund is in the first quartile of the ASPG, the fund's management fee ranks in the least expensive or lowest 25% of funds in the ASPG. The ASPG represents at least 15% of the funds in the Total Mapped Group with comparable asset size and management fee structures, subject to a minimum of 50 funds (or all funds in the Total Mapped Group if fewer than 50). Additional information, such as the ASPG quartile in which a fund's management fee rate ranked, is also included in the charts and considered by the Board.
Fidelity Advisor Freedom 2005 Fund
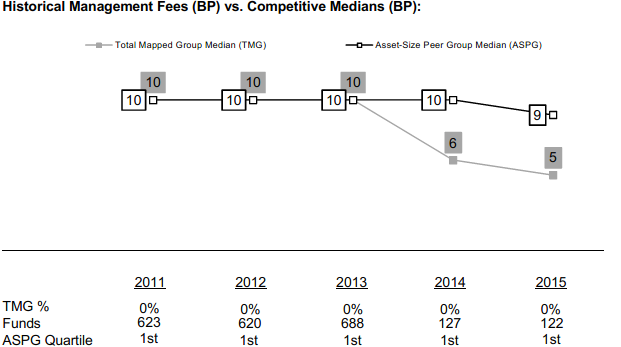
Fidelity Advisor Freedom 2010 Fund

Fidelity Advisor Freedom 2015 Fund
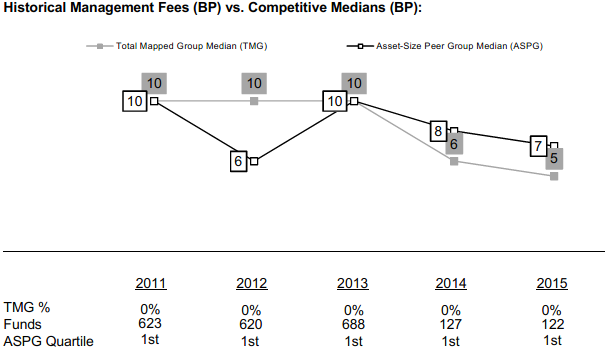
Fidelity Advisor Freedom 2020 Fund
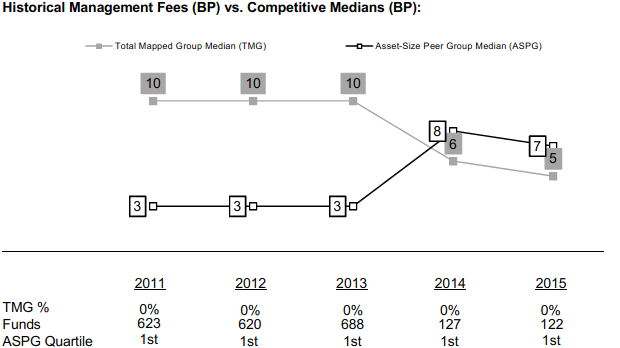
Fidelity Advisor Freedom 2025 Fund
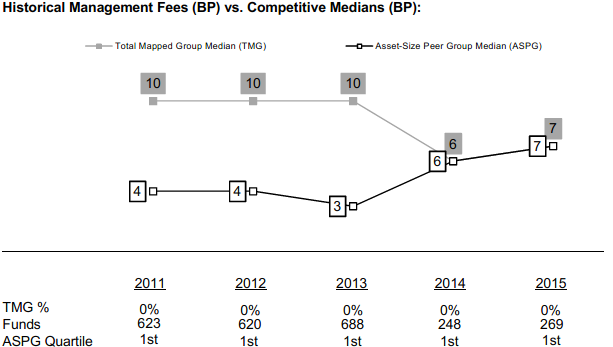
Fidelity Advisor Freedom 2030 Fund

Fidelity Advisor Freedom 2035 Fund
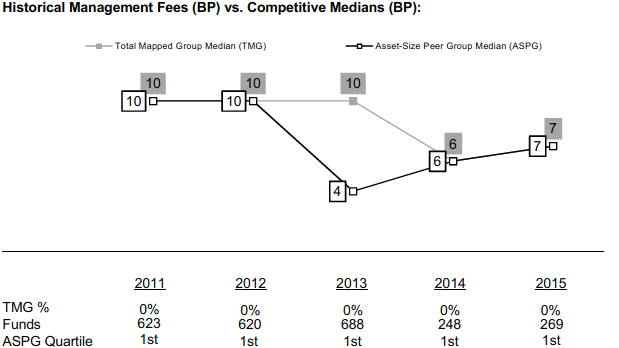
Fidelity Advisor Freedom 2040 Fund
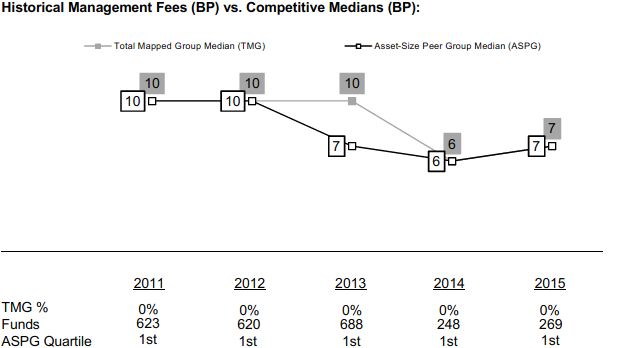
Fidelity Advisor Freedom 2045 Fund
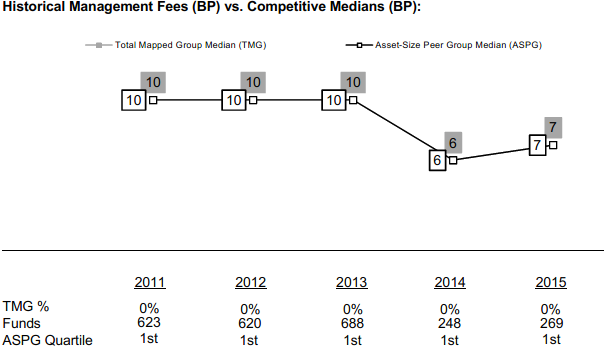
Fidelity Advisor Freedom 2050 Fund
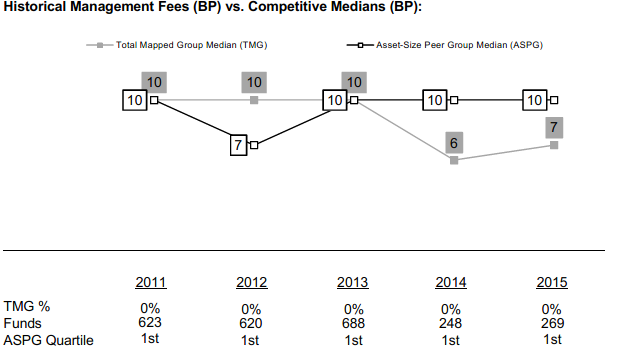
Fidelity Advisor Freedom 2055 Fund

Fidelity Advisor Freedom 2060 Fund
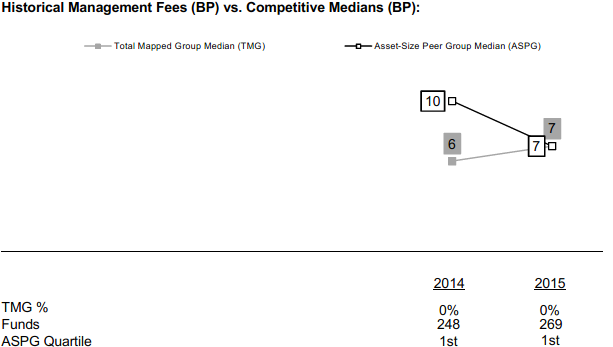
Fidelity Advisor Freedom Income Fund
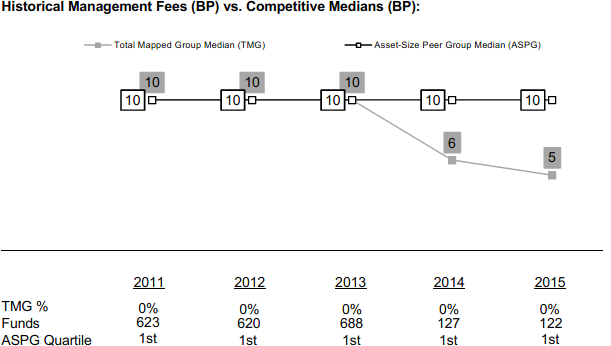
The Board noted that each fund's current management fee rate of 0.00% ranked below the median of its Total Mapped Group and below the median of its ASPG for 2015. The Board further noted that many peer funds pay fund-level expenses, including management fees, to which the funds are not currently subject.
The Board noted that, in 2014, the ad hoc Committee on Group Fee was formed by it and the boards of other Fidelity funds to conduct an in-depth review of the "group fee" component of the management fee of funds with such management fee structures, and that while the funds do not currently pay a management fee, they indirectly bear a portion of the management fees paid by the Fidelity funds in which they invest, some of which are currently subject to the group fee. The Committee's focus included the mechanics of the group fee, the competitive landscape of group fee structures, Fidelity funds with no group fee component (such as the funds) and investment products not included in group fee assets. The Board also considered that, for funds subject to the group fee, FMR agreed to voluntarily waive fees over a specified period of time in amounts designed to account for assets converted from certain funds to certain collective investment trusts.
Based on its review, the Board concluded that each fund's management fee is fair and reasonable in light of the services that the fund receives and the other factors considered.
Total Expense Ratio. In its review of the total expense ratio of each class of each fund, the Board considered fund-paid 12b-1 fees and noted that each fund invests in a class of shares of the underlying Fidelity fund that does not charge a 12b-1 fee to avoid charging fund-paid 12b-1 fees at both fund levels. The Board considered that the funds do not currently pay transfer agent fees. Instead, the applicable class of each underlying Fidelity fund bears its pro rata portion of each fund's transfer agent fee according to the percentage of each fund's assets invested in that underlying fund. The Board further noted that FMR pays all other expenses of each fund, with limited exceptions, pursuant to the administration agreement between FMRC and FMR with respect to each fund.
The Board noted that each fund offers multiple classes, each of which has a different sales load and 12b-1 fee structure, and that the multiple structures are intended to offer a range of pricing options for the intermediary market. The Board also noted that the total expense ratios of the classes of each fund vary primarily by the level of their 12b-1 fees.
The Board noted that the total expense ratio of each of Class A and Class I of each fund ranked below the competitive median for 2015, the total expense ratio of Class C of each fund ranked equal to the competitive median for 2015, and the total expense ratio of Class T of each fund ranked above the competitive median for 2015. The Board considered that, in general, various factors can affect total expense ratios. The Board noted that the total expense ratio of Class T was above the competitive median primarily because of higher 12b-1 fees on Class T as compared to most competitor funds. Class T has a higher 12b-1 fee, but a lower front-end sales charge, than traditionally priced front-end sales charge classes. The Board considered that Class T is primarily sold load-waived in the retirement plan market where its 0.50% 12b-1 fee is comparable to competing no-load, higher 12b-1 fee classes designed specifically for retirement plans.
In considering the total expense ratio of each class of each fund, the Board also considered an alternative competitive analysis that included both top level (
i.e., direct) fund fees and acquired fund fees and expenses for the class and the other funds and classes to which it is compared. The Board noted that, under this alternative competitive analysis, the total expense ratio of each of Class A and Class I of each fund ranked below the competitive median for 2015. The Board noted that the total expense ratio of each of Class T and Class C of Advisor Freedom Income Fund ranked equal to the competitive median for 2015 and the total expense ratio of each of Class T and Class C of each other fund ranked above the competitive median for 2015. The Board noted that the total expense ratio of Class C was above the competitive median primarily because of its 12b-1 fees.
Fees Charged to Other Fidelity Clients. The Board also considered Fidelity fee structures and other information with respect to clients of Fidelity, such as other funds advised or subadvised by Fidelity, pension plan clients, and other institutional clients with similar mandates. The Board noted that an ad hoc joint committee created by it and the boards of other Fidelity funds periodically (most recently in 2013) reviews and compares Fidelity's institutional investment advisory business with its business of providing services to the Fidelity funds, including the differences in services provided, fees charged, and costs incurred, as well as competition in their respective marketplaces.
Based on its review of total expense ratios and fees charged to other Fidelity clients, the Board concluded that, although some classes were above the median of the universe presented for comparison, the total expense ratio of each class of each fund was reasonable in light of the services that the fund and its shareholders receive and the other factors considered.
Costs of the Services and Profitability. The Board considered the level of Fidelity's profits in respect of all the Fidelity funds, including the Fidelity funds in which the funds invest.
PricewaterhouseCoopers LLP (PwC), independent registered public accounting firm and auditor to Fidelity and certain Fidelity funds, has been engaged annually by the Board as part of the Board's assessment of Fidelity's profitability analysis. PwC's engagement includes the review and assessment of the methodologies used by Fidelity in determining the revenues and expenses attributable to Fidelity's mutual fund business, and completion of agreed-upon procedures in respect of the mathematical accuracy of the fund profitability information and its conformity to established allocation methodologies. After considering PwC's reports issued under the engagement and information provided by Fidelity, the Board concluded that while other allocation methods may also be reasonable, Fidelity's profitability methodologies are reasonable in all material respects.
The Board also reviewed Fidelity's non-fund businesses and fall-out benefits related to the mutual fund business as well as cases where Fidelity's affiliates may benefit from or be related to the funds' business.
The Board concluded that the costs of the services provided by and the profits realized by Fidelity in connection with the operation of each fund were not relevant to the renewal of each fund's current Advisory Contract because the funds do not currently pay management fees and FMR pays all other expenses of each fund, with limited exceptions.
Economies of Scale. The Board concluded that because the funds do not currently pay management fees and FMR pays all other expenses of each fund, with limited exceptions, economies of scale cannot currently be realized by the funds, but under the current fee arrangements may be realized by the other Fidelity funds in which each fund invests, many of which may benefit from breakpoints under the group fee arrangement.
Additional Information Requested by the Board. In order to develop fully the factual basis for consideration of the Fidelity funds' advisory contracts, the Board requested and received additional information on certain topics, including: (i) Fidelity's fund profitability methodology, profitability trends for certain funds, and the impact of certain factors on fund profitability results; (ii) portfolio manager changes that have occurred during the past year and the amount of the investment that each portfolio manager has made in the Fidelity fund(s) that he or she manages; (iii) Fidelity's compensation structure for portfolio managers, research analysts, and other key personnel, including its effects on fund profitability, the rationale for the compensation structure, and the extent to which current market conditions have affected retention and recruitment; (iv) the arrangements with and compensation paid to certain fund sub-advisers on behalf of the Fidelity funds; (v) Fidelity's voluntary waiver of its fees to maintain minimum yields for certain money market funds and classes as well as contractual waivers in place for certain funds; (vi) the methodology with respect to competitive fund data and peer group classifications; (vii) Fidelity's transfer agent fee, expense, and service structures for different funds and classes relative to competitive trends, and the impact of the increased use of omnibus accounts; (viii) Fidelity's long-term expectations for its offerings in the workplace investing channel; (ix) new developments in the retail and institutional marketplaces; (x) the approach to considering "fall-out" benefits; and (xi) the impact of money market reform on Fidelity's money market funds, including with respect to costs and profitability. In addition, the Board considered its discussions with Fidelity throughout the year regarding enhanced information security initiatives and the funds' fair valuation policies.
Based on its evaluation of all of the conclusions noted above, and after considering all factors it believed relevant, the Board concluded that the advisory fee structures are fair and reasonable, and that each fund's Advisory Contract should be renewed.
AFF-SANN-1116
1.792138.113
Fidelity Freedom® Index Funds - Income, 2005, 2010, 2015, 2020, 2025, 2030, 2035, 2040, 2045, 2050, 2055, 2060
Semi-Annual Report September 30, 2016 |
|
Contents
To view a fund's proxy voting guidelines and proxy voting record for the 12-month period ended June 30, visit http://www.fidelity.com/proxyvotingresults or visit the Securities and Exchange Commission's (SEC) web site at http://www.sec.gov.
You may also call 1-800-835-5092 (plan accounts and Institutional Premium Class) or 1-800-544-8544 (all other accounts) to request a free copy of the proxy voting guidelines.
Standard & Poor's, S&P and S&P 500 are registered service marks of The McGraw-Hill Companies, Inc. and have been licensed for use by Fidelity Distributors Corporation.
Other third-party marks appearing herein are the property of their respective owners.
All other marks appearing herein are registered or unregistered trademarks or service marks of FMR LLC or an affiliated company. © 2016 FMR LLC. All rights reserved.
This report and the financial statements contained herein are submitted for the general information of the shareholders of the Funds. This report is not authorized for distribution to prospective investors in the Funds unless preceded or accompanied by an effective prospectus.
A fund files its complete schedule of portfolio holdings with the SEC for the first and third quarters of each fiscal year on Form N-Q. Forms N-Q are available on the SEC’s web site at http://www.sec.gov. A fund's Forms N-Q may be reviewed and copied at the SEC’s Public Reference Room in Washington, DC. Information regarding the operation of the SEC's Public Reference Room may be obtained by calling 1-800-SEC-0330.
For a complete list of a fund's portfolio holdings, view the most recent holdings listing, semiannual report, or annual report on Fidelity's web site at http://www.fidelity.com, http://www.institutional.fidelity.com, or http://www.401k.com, as applicable.
NOT FDIC INSURED •MAY LOSE VALUE •NO BANK GUARANTEE
Neither the Funds nor Fidelity Distributors Corporation is a bank.
Fidelity Freedom® Index Income Fund
Investment Summary (Unaudited)
The information in the following tables is based on the direct investments of the Fund.
Top Holdings as of September 30, 2016
| | % of fund's net assets | % of fund's net assets 6 months ago |
| Fidelity U.S. Bond Index Fund Class F | 40.1 | 40.1 |
| Fidelity Series Government Money Market Fund Class F 0.29% | 30.0 | 0.0 |
| Fidelity Total Market Index Fund Class F | 15.7 | 15.7 |
| Fidelity Series Global ex U.S. Index Fund | 7.2 | 7.2 |
| Fidelity Series Inflation-Protected Bond Index Fund Class F | 6.0 | 6.0 |
| Fidelity Series Commodity Strategy Fund Class F | 1.0 | 1.1 |
| Fidelity Institutional Money Market Portfolio Class F 0.39% | 0.0 | 29.9 |
| | 100.0 | 100.0 |
Asset Allocation (% of fund's net assets)
| Period end |
| | Domestic Equity Funds | 15.7% |
| | Commodity Funds | 1.0% |
| | International Equity Funds | 7.2% |
| | Bond Funds | 40.1% |
| | Inflation-Protected Bond Funds | 6.0% |
| | Short-Term Funds | 30.0% |

| Six months ago |
| | Domestic Equity Funds | 15.7% |
| | Commodity Funds | 1.1% |
| | International Equity Funds | 7.2% |
| | Bond Funds | 40.1% |
| | Inflation-Protected Bond Funds | 6.0% |
| | Short-Term Funds | 29.9% |
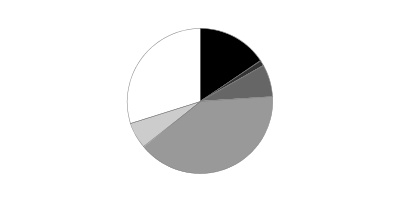
Percentages shown as 0.0% may reflect amounts less than 0.05%.
Fidelity Freedom® Index Income Fund
Investments September 30, 2016 (Unaudited)
Showing Percentage of Net Assets
| Domestic Equity Funds - 15.7% | | | |
| | | Shares | Value |
| Fidelity Total Market Index Fund Class F (a) | | | |
| (Cost $27,375,813) | | 666,382 | 42,088,708 |
|
| Commodity Funds - 1.0% | | | |
| Fidelity Series Commodity Strategy Fund Class F (a)(b) | | | |
| (Cost $3,881,807) | | 528,172 | 2,825,721 |
|
| International Equity Funds - 7.2% | | | |
| Fidelity Series Global ex U.S. Index Fund (a) | | | |
| (Cost $18,286,115) | | 1,729,291 | 19,264,303 |
|
| Bond Funds - 40.1% | | | |
| Fidelity U.S. Bond Index Fund Class F (a) | | | |
| (Cost $103,760,854) | | 8,988,149 | 107,318,494 |
|
| Inflation-Protected Bond Funds - 6.0% | | | |
| Fidelity Series Inflation-Protected Bond Index Fund Class F (a) | | | |
| (Cost $16,695,472) | | 1,594,202 | 16,069,555 |
|
| Short-Term Funds - 30.0% | | | |
| Fidelity Series Government Money Market Fund Class F 0.29% (a)(c) | | | |
| (Cost $80,291,572) | | 80,291,572 | 80,291,572 |
| TOTAL INVESTMENT PORTFOLIO - 100.0% | | | |
| (Cost $250,291,633) | | | 267,858,353 |
| NET OTHER ASSETS (LIABILITIES) - 0.0% | | | (13,109) |
| NET ASSETS - 100% | | | $267,845,244 |
Legend
(a) Affiliated Fund
(b) Non-income producing
(c) The rate quoted is the annualized seven-day yield of the fund at period end.
Affiliated Underlying Funds
Information regarding the Fund's fiscal year to date purchases and sales of the affiliated Underlying Funds and income earned by the Fund from investments in affiliated Underlying Funds is as follows:
| Affiliate | Value, beginning of period | Purchases | Sales Proceeds | Dividend Income | Value, end of period |
| Fidelity Investments Money Market Portfolio Class F | $74,654,882 | $2,279,540 | $76,934,422 | $38,739 | -- |
| Fidelity Series Commodity Strategy Fund Class F | 2,686,206 | 312,816 | 401,204 | -- | 2,825,721 |
| Fidelity Series Global ex U.S. Index Fund | 17,936,908 | 2,154,314 | 2,118,825 | -- | 19,264,303 |
| Fidelity Series Government Money Market Fund | -- | 4,100,111 | 4,100,111 | 72 | -- |
| Fidelity Series Government Money Market Fund Class F 0.29% | -- | 83,001,984 | 2,710,412 | 72,512 | 80,291,572 |
| Fidelity Series Inflation-Protected Bond Index Fund Class F | 14,859,669 | 1,629,425 | 718,923 | 18,433 | 16,069,555 |
| Fidelity Total Market Index Fund Class F | 39,146,637 | 3,862,002 | 3,593,935 | 121,133 | 42,088,708 |
| Fidelity U.S. Bond Index Fund Class F | 100,073,079 | 11,724,970 | 5,966,336 | 1,255,397 | 107,318,494 |
| Total | $249,357,381 | $109,065,162 | $96,544,168 | $1,506,286 | $267,858,353 |
Investment Valuation
All investments are categorized as Level 1 under the Fair Value Hierarchy. The inputs or methodology used for valuing securities may not be an indication of the risk associated with investing in those securities. For more information on valuation inputs please refer to the Investment Valuation section in the accompanying Notes to Financial Statements.
See accompanying notes which are an integral part of the financial statements.
Fidelity Freedom® Index Income Fund
Financial Statements
Statement of Assets and Liabilities
| | | September 30, 2016 (Unaudited) |
| Assets | | |
| Investment in securities, at value (cost $250,291,633) — See accompanying schedule | | $267,858,353 |
| Receivable for investments sold | | 288,135 |
| Receivable for fund shares sold | | 220,251 |
| Receivable from affiliate for expense reductions | | 15,007 |
| Total assets | | 268,381,746 |
| Liabilities | | |
| Payable for investments purchased | $460,986 | |
| Payable for fund shares redeemed | 47,392 | |
| Transfer agent fees payable | 28,124 | |
| Total liabilities | | 536,502 |
| Net Assets | | $267,845,244 |
| Net Assets consist of: | | |
| Paid in capital | | $251,316,006 |
| Undistributed net investment income | | 236,464 |
| Accumulated undistributed net realized gain (loss) on investments | | (1,273,946) |
| Net unrealized appreciation (depreciation) on investments | | 17,566,720 |
| Net Assets | | $267,845,244 |
| Investor Class: | | |
| Net Asset Value, offering price and redemption price per share ($141,446,980 ÷ 12,172,778 shares) | | $11.62 |
| Institutional Premium Class: | | |
| Net Asset Value, offering price and redemption price per share ($126,398,264 ÷ 10,889,683 shares) | | $11.61 |
See accompanying notes which are an integral part of the financial statements.
Statement of Operations
| | | Six months ended September 30, 2016 (Unaudited) |
| Investment Income | | |
| Income distributions from underlying funds | | $1,506,286 |
| Expenses | | |
| Transfer agent fees | $146,814 | |
| Independent trustees' fees and expenses | 580 | |
| Total expenses before reductions | 147,394 | |
| Expense reductions | (80,361) | 67,033 |
| Net investment income (loss) | | 1,439,253 |
| Realized and Unrealized Gain (Loss) | | |
| Realized gain (loss) on sale of underlying fund shares | (3,920) | |
| Capital gain distributions from underlying funds | 72,697 | |
| Total net realized gain (loss) | | 68,777 |
| Change in net unrealized appreciation (depreciation) on investment securities | | 5,984,290 |
| Net gain (loss) | | 6,053,067 |
| Net increase (decrease) in net assets resulting from operations | | $7,492,320 |
See accompanying notes which are an integral part of the financial statements.
Statement of Changes in Net Assets
| | Six months ended September 30, 2016 (Unaudited) | Year ended March 31, 2016 |
| Increase (Decrease) in Net Assets | | |
| Operations | | |
| Net investment income (loss) | $1,439,253 | $3,748,403 |
| Net realized gain (loss) | 68,777 | (155,797) |
| Change in net unrealized appreciation (depreciation) | 5,984,290 | (3,540,802) |
| Net increase (decrease) in net assets resulting from operations | 7,492,320 | 51,804 |
| Distributions to shareholders from net investment income | (1,476,813) | (3,586,304) |
| Distributions to shareholders from net realized gain | (88,855) | (178,836) |
| Total distributions | (1,565,668) | (3,765,140) |
| Share transactions - net increase (decrease) | 12,572,812 | 8,798,766 |
| Total increase (decrease) in net assets | 18,499,464 | 5,085,430 |
| Net Assets | | |
| Beginning of period | 249,345,780 | 244,260,350 |
| End of period | $267,845,244 | $249,345,780 |
| Other Information | | |
| Undistributed net investment income end of period | $236,464 | $274,024 |
See accompanying notes which are an integral part of the financial statements.
Financial Highlights — Fidelity Freedom Index Income Fund Investor Class
| | Six months ended (Unaudited) September 30, | Years ended March 31, | | | | |
| | 2016 | 2016 | 2015 | 2014 | 2013 | 2012 |
| Selected Per–Share Data | | | | | | |
| Net asset value, beginning of period | $11.36 | $11.52 | $11.32 | $11.13 | $10.89 | $10.74 |
| Income from Investment Operations | | | | | | |
| Net investment income (loss)A | .06 | .16 | .17 | .13 | .12 | .13 |
| Net realized and unrealized gain (loss) | .27 | (.15) | .26 | .20 | .29 | .24 |
| Total from investment operations | .33 | .01 | .43 | .33 | .41 | .37 |
| Distributions from net investment income | (.06) | (.16) | (.16) | (.12) | (.11) | (.13) |
| Distributions from net realized gain | –B | (.01) | (.07) | (.02) | (.05) | (.09) |
| Total distributions | (.07)C | (.17) | (.23) | (.14) | (.17)D | (.22) |
| Net asset value, end of period | $11.62 | $11.36 | $11.52 | $11.32 | $11.13 | $10.89 |
| Total ReturnE,F | 2.90% | .10% | 3.83% | 2.98% | 3.75% | 3.52% |
| Ratios to Average Net AssetsG,H | | | | | | |
| Expenses before reductions | .15%I | .15% | .15% | .15% | .15% | .15% |
| Expenses net of fee waivers, if any | .08%I | .07% | .08% | .08% | .10% | .09% |
| Expenses net of all reductions | .08%I | .07% | .08% | .08% | .10% | .09% |
| Net investment income (loss) | 1.08%I | 1.39% | 1.49% | 1.20% | 1.06% | 1.24% |
| Supplemental Data | | | | | | |
| Net assets, end of period (000 omitted) | $141,447 | $140,481 | $244,260 | $164,926 | $132,753 | $67,405 |
| Portfolio turnover rateH | 74 %I | 22% | 20%J | 43% | 19% | 31% |
A Calculated based on average shares outstanding during the period.
B Amount represents less than $.005 per share.
C Total distributions of $.07 per share is comprised of distributions from net investment income of $.064 and distributions from net realized gain of $.004 per share.
D Total distributions of $.17 per share is comprised of distributions from net investment income of $.112 and distributions from net realized gain of $.053 per share.
E Total returns for periods of less than one year are not annualized.
F Total returns would have been lower if certain expenses had not been reduced during the applicable periods shown.
G Expense ratios reflect operating expenses of the class. Expenses before reductions do not reflect amounts reimbursed by the investment adviser or reductions from expense offset arrangements and do not represent the amount paid by the class during periods when reimbursements or reductions occur. Expenses net of fee waivers reflect expenses after reimbursement by the investment adviser but prior to reductions from expense offset arrangements. Expenses net of all reductions represent the net expenses paid by the class.
H Amount does not include the portfolio activity of any Underlying Funds.
I Annualized
J The portfolio turnover rate does not include the assets acquired in the merger.
See accompanying notes which are an integral part of the financial statements.
Financial Highlights — Fidelity Freedom Index Income Fund Institutional Premium Class
| | Six months ended (Unaudited) September 30, | Years ended March 31, |
| | 2016 | 2016 A |
| Selected Per–Share Data | | |
| Net asset value, beginning of period | $11.35 | $11.48 |
| Income from Investment Operations | | |
| Net investment income (loss)B | .07 | .18 |
| Net realized and unrealized gain (loss) | .26 | (.15) |
| Total from investment operations | .33 | .03 |
| Distributions from net investment income | (.07) | (.15) |
| Distributions from net realized gain | –C | (.01) |
| Total distributions | (.07) | (.16) |
| Net asset value, end of period | $11.61 | $11.35 |
| Total ReturnD,E | 2.93% | .26% |
| Ratios to Average Net AssetsF,G | | |
| Expenses before reductions | .07%H | .05%H |
| Expenses net of fee waivers, if any | .02%H | .01%H |
| Expenses net of all reductions | .02%H | .01%H |
| Net investment income (loss) | 1.13%H | 2.12%H |
| Supplemental Data | | |
| Net assets, end of period (000 omitted) | $126,398 | $108,865 |
| Portfolio turnover rateG | 74 %H | 22% |
A For the period June 24, 2015 (commencement of sale of shares) to March 31, 2016.
B Calculated based on average shares outstanding during the period.
C Amount represents less than $.005 per share.
D Total returns for periods of less than one year are not annualized.
E Total returns would have been lower if certain expenses had not been reduced during the applicable periods shown.
F Expense ratios reflect operating expenses of the class. Expenses before reductions do not reflect amounts reimbursed by the investment adviser or reductions from expense offset arrangements and do not represent the amount paid by the class during periods when reimbursements or reductions occur. Expense ratios before reductions for start-up periods may not be representative of longer-term operating periods. Expenses net of fee waivers reflect expenses after reimbursement by the investment adviser but prior to reductions from expense offset arrangements. Expenses net of all reductions represent the net expenses paid by the class.
G Amount does not include the portfolio activity of any Underlying Funds.
H Annualized
See accompanying notes which are an integral part of the financial statements.
Fidelity Freedom® Index 2005 Fund
Investment Summary (Unaudited)
The information in the following tables is based on the direct investments of the Fund.
Top Holdings as of September 30, 2016
| | % of fund's net assets | % of fund's net assets 6 months ago |
| Fidelity U.S. Bond Index Fund Class F | 37.0 | 36.8 |
| Fidelity Total Market Index Fund Class F | 23.9 | 24.5 |
| Fidelity Series Government Money Market Fund Class F 0.29% | 22.4 | 0.0 |
| Fidelity Series Global ex U.S. Index Fund | 10.7 | 11.0 |
| Fidelity Series Inflation-Protected Bond Index Fund Class F | 4.9 | 4.7 |
| Fidelity Series Commodity Strategy Fund Class F | 1.1 | 1.1 |
| Fidelity Institutional Money Market Portfolio Class F 0.39% | 0.0 | 21.9 |
| | 100.0 | 100.0 |
Asset Allocation (% of fund's net assets)
| Period end |
| | Domestic Equity Funds | 23.9% |
| | Commodity Funds | 1.1% |
| | International Equity Funds | 10.7% |
| | Bond Funds | 37.0% |
| | Inflation-Protected Bond Funds | 4.9% |
| | Short-Term Funds | 22.4% |
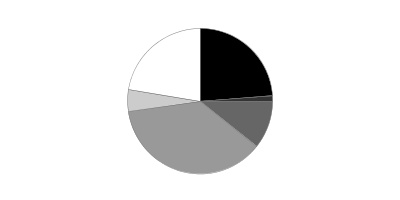
| Six months ago |
| | Domestic Equity Funds | 24.5% |
| | Commodity Funds | 1.1% |
| | International Equity Funds | 11.0% |
| | Bond Funds | 36.8% |
| | Inflation-Protected Bond Funds | 4.7% |
| | Short-Term Funds | 21.9% |
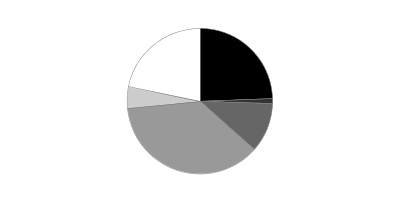
Percentages shown as 0.0% may reflect amounts less than 0.05%.
Fidelity Freedom® Index 2005 Fund
Investments September 30, 2016 (Unaudited)
Showing Percentage of Net Assets
| Domestic Equity Funds - 23.9% | | | |
| | | Shares | Value |
| Fidelity Total Market Index Fund Class F (a) | | | |
| (Cost $13,955,802) | | 340,050 | 21,477,555 |
|
| Commodity Funds - 1.1% | | | |
| Fidelity Series Commodity Strategy Fund Class F (a)(b) | | | |
| (Cost $1,246,126) | | 177,295 | 948,528 |
|
| International Equity Funds - 10.7% | | | |
| Fidelity Series Global ex U.S. Index Fund (a) | | | |
| (Cost $9,242,453) | | 861,010 | 9,591,647 |
|
| Bond Funds - 37.0% | | | |
| Fidelity U.S. Bond Index Fund Class F (a) | | | |
| (Cost $32,138,020) | | 2,779,803 | 33,190,848 |
|
| Inflation-Protected Bond Funds - 4.9% | | | |
| Fidelity Series Inflation-Protected Bond Index Fund Class F (a) | | | |
| (Cost $4,485,168) | | 432,345 | 4,358,036 |
|
| Short-Term Funds - 22.4% | | | |
| Fidelity Series Government Money Market Fund Class F 0.29% (a)(c) | | | |
| (Cost $20,109,531) | | 20,109,531 | 20,109,531 |
| TOTAL INVESTMENT PORTFOLIO - 100.0% | | | |
| (Cost $81,177,100) | | | 89,676,145 |
| NET OTHER ASSETS (LIABILITIES) - 0.0% | | | (4,979) |
| NET ASSETS - 100% | | | $89,671,166 |
Legend
(a) Affiliated Fund
(b) Non-income producing
(c) The rate quoted is the annualized seven-day yield of the fund at period end.
Affiliated Underlying Funds
Information regarding the Fund's fiscal year to date purchases and sales of the affiliated Underlying Funds and income earned by the Fund from investments in affiliated Underlying Funds is as follows:
| Affiliate | Value, beginning of period | Purchases | Sales Proceeds | Dividend Income | Value, end of period |
| Fidelity Investments Money Market Portfolio Class F | $17,442,500 | $888,940 | $18,331,440 | $9,102 | -- |
| Fidelity Series Commodity Strategy Fund Class F | 853,689 | 128,958 | 108,228 | -- | 948,528 |
| Fidelity Series Global ex U.S. Index Fund | 8,738,127 | 1,408,324 | 1,186,536 | -- | 9,591,647 |
| Fidelity Series Government Money Market Fund | -- | 974,265 | 974,265 | 17 | -- |
| Fidelity Series Government Money Market Fund Class F 0.29% | -- | 20,979,219 | 869,689 | 17,416 | 20,109,531 |
| Fidelity Series Inflation-Protected Bond Index Fund Class F | 3,778,796 | 718,354 | 217,645 | 4,780 | 4,358,036 |
| Fidelity Total Market Index Fund Class F | 19,519,820 | 2,817,385 | 2,202,830 | 60,346 | 21,477,555 |
| Fidelity U.S. Bond Index Fund Class F | 29,370,920 | 5,364,335 | 1,981,546 | 373,743 | 33,190,848 |
| Total | $79,703,852 | $33,279,780 | $25,872,179 | $465,404 | $89,676,145 |
Investment Valuation
All investments are categorized as Level 1 under the Fair Value Hierarchy. The inputs or methodology used for valuing securities may not be an indication of the risk associated with investing in those securities. For more information on valuation inputs please refer to the Investment Valuation section in the accompanying Notes to Financial Statements.
See accompanying notes which are an integral part of the financial statements.
Fidelity Freedom® Index 2005 Fund
Financial Statements
Statement of Assets and Liabilities
| | | September 30, 2016 (Unaudited) |
| Assets | | |
| Investment in securities, at value (cost $81,177,100) — See accompanying schedule | | $89,676,145 |
| Cash | | 1 |
| Receivable for investments sold | | 213,438 |
| Receivable for fund shares sold | | 639,902 |
| Receivable from affiliate for expense reductions | | 4,274 |
| Total assets | | 90,533,760 |
| Liabilities | | |
| Payable for investments purchased | $185,997 | |
| Payable for fund shares redeemed | 667,163 | |
| Transfer agent fees payable | 9,434 | |
| Total liabilities | | 862,594 |
| Net Assets | | $89,671,166 |
| Net Assets consist of: | | |
| Paid in capital | | $81,078,471 |
| Undistributed net investment income | | 440,402 |
| Accumulated undistributed net realized gain (loss) on investments | | (346,752) |
| Net unrealized appreciation (depreciation) on investments | | 8,499,045 |
| Net Assets | | $89,671,166 |
| Investor Class: | | |
| Net Asset Value, offering price and redemption price per share ($52,590,715 ÷ 4,089,355 shares) | | $12.86 |
| Institutional Premium Class: | | |
| Net Asset Value, offering price and redemption price per share ($37,080,451 ÷ 2,882,889 shares) | | $12.86 |
See accompanying notes which are an integral part of the financial statements.
Statement of Operations
| | | Six months ended September 30, 2016 (Unaudited) |
| Investment Income | | |
| Income distributions from underlying funds | | $465,404 |
| Expenses | | |
| Transfer agent fees | $49,837 | |
| Independent trustees' fees and expenses | 187 | |
| Total expenses before reductions | 50,024 | |
| Expense reductions | (24,624) | 25,400 |
| Net investment income (loss) | | 440,004 |
| Realized and Unrealized Gain (Loss) | | |
| Realized gain (loss) on sale of underlying fund shares | 40,511 | |
| Capital gain distributions from underlying funds | 36,216 | |
| Total net realized gain (loss) | | 76,727 |
| Change in net unrealized appreciation (depreciation) on investment securities | | 2,524,222 |
| Net gain (loss) | | 2,600,949 |
| Net increase (decrease) in net assets resulting from operations | | $3,040,953 |
See accompanying notes which are an integral part of the financial statements.
Statement of Changes in Net Assets
| | Six months ended September 30, 2016 (Unaudited) | Year ended March 31, 2016 |
| Increase (Decrease) in Net Assets | | |
| Operations | | |
| Net investment income (loss) | $440,004 | $1,278,400 |
| Net realized gain (loss) | 76,727 | 39,809 |
| Change in net unrealized appreciation (depreciation) | 2,524,222 | (1,569,090) |
| Net increase (decrease) in net assets resulting from operations | 3,040,953 | (250,881) |
| Distributions to shareholders from net investment income | (183,922) | (1,242,872) |
| Distributions to shareholders from net realized gain | (92,722) | (24,533) |
| Total distributions | (276,644) | (1,267,405) |
| Share transactions - net increase (decrease) | 7,207,004 | 6,702,183 |
| Total increase (decrease) in net assets | 9,971,313 | 5,183,897 |
| Net Assets | | |
| Beginning of period | 79,699,853 | 74,515,956 |
| End of period | $89,671,166 | $79,699,853 |
| Other Information | | |
| Undistributed net investment income end of period | $440,402 | $184,320 |
See accompanying notes which are an integral part of the financial statements.
Financial Highlights — Fidelity Freedom Index 2005 Fund Investor Class
| | Six months ended (Unaudited) September 30, | Years ended March 31, | | | | |
| | 2016 | 2016 | 2015 | 2014 | 2013 | 2012 |
| Selected Per–Share Data | | | | | | |
| Net asset value, beginning of period | $12.45 | $12.71 | $12.50 | $11.91 | $11.50 | $11.44 |
| Income from Investment Operations | | | | | | |
| Net investment income (loss)A | .06 | .20 | .21 | .16 | .14 | .16 |
| Net realized and unrealized gain (loss) | .39 | (.25) | .39 | .46 | .45 | .18 |
| Total from investment operations | .45 | (.05) | .60 | .62 | .59 | .34 |
| Distributions from net investment income | (.03) | (.20) | (.33) | (.01) | (.14) | (.14) |
| Distributions from net realized gain | (.01) | –B | (.06) | (.02) | (.04) | (.14) |
| Total distributions | (.04) | (.21)C | (.39) | (.03) | (.18) | (.28) |
| Net asset value, end of period | $12.86 | $12.45 | $12.71 | $12.50 | $11.91 | $11.50 |
| Total ReturnD,E | 3.63% | (.40)% | 4.87% | 5.25% | 5.17% | 3.11% |
| Ratios to Average Net AssetsF,G | | | | | | |
| Expenses before reductions | .15%H | .15% | .15% | .15% | .15% | .15% |
| Expenses net of fee waivers, if any | .08%H | .07% | .08% | .08% | .09% | .09% |
| Expenses net of all reductions | .08%H | .07% | .08% | .08% | .09% | .09% |
| Net investment income (loss) | 1.02%H | 1.58% | 1.65% | 1.29% | 1.22% | 1.45% |
| Supplemental Data | | | | | | |
| Net assets, end of period (000 omitted) | $52,591 | $50,790 | $74,516 | $66,401 | $62,983 | $43,986 |
| Portfolio turnover rateG | 61 %H | 28% | 22% | 49% | 23% | 37% |
A Calculated based on average shares outstanding during the period.
B Amount represents less than $.005 per share.
C Total distributions of $.21 per share is comprised of distributions from net investment income of $.203 and distributions from net realized gain of $.004 per share.
D Total returns for periods of less than one year are not annualized.
E Total returns would have been lower if certain expenses had not been reduced during the applicable periods shown.
F Expense ratios reflect operating expenses of the class. Expenses before reductions do not reflect amounts reimbursed by the investment adviser or reductions from expense offset arrangements and do not represent the amount paid by the class during periods when reimbursements or reductions occur. Expenses net of fee waivers reflect expenses after reimbursement by the investment adviser but prior to reductions from expense offset arrangements. Expenses net of all reductions represent the net expenses paid by the class.
G Amount does not include the portfolio activity of any Underlying Funds.
H Annualized
See accompanying notes which are an integral part of the financial statements.
Financial Highlights — Fidelity Freedom Index 2005 Fund Institutional Premium Class
| | Six months ended (Unaudited) September 30, | Years ended March 31, |
| | 2016 | 2016 A |
| Selected Per–Share Data | | |
| Net asset value, beginning of period | $12.45 | $12.73 |
| Income from Investment Operations | | |
| Net investment income (loss)B | .07 | .21 |
| Net realized and unrealized gain (loss) | .38 | (.30) |
| Total from investment operations | .45 | (.09) |
| Distributions from net investment income | (.03) | (.18) |
| Distributions from net realized gain | (.01) | –C |
| Total distributions | (.04) | (.19)D |
| Net asset value, end of period | $12.86 | $12.45 |
| Total ReturnE,F | 3.65% | (.73)% |
| Ratios to Average Net AssetsG,H | | |
| Expenses before reductions | .07%I | .05%I |
| Expenses net of fee waivers, if any | .03%I | .01%I |
| Expenses net of all reductions | .03%I | .01%I |
| Net investment income (loss) | 1.08%I | 2.28%I |
| Supplemental Data | | |
| Net assets, end of period (000 omitted) | $37,080 | $28,910 |
| Portfolio turnover rateH | 61 %I | 28% |
A For the period June 24, 2015 (commencement of sale of shares) to March 31, 2016.
B Calculated based on average shares outstanding during the period.
C Amount represents less than $.005 per share.
D Total distributions of $.19 per share is comprised of distributions from net investment income of $.181 and distributions from net realized gain of $.004 per share.
E Total returns for periods of less than one year are not annualized.
F Total returns would have been lower if certain expenses had not been reduced during the applicable periods shown.
G Expense ratios reflect operating expenses of the class. Expenses before reductions do not reflect amounts reimbursed by the investment adviser or reductions from expense offset arrangements and do not represent the amount paid by the class during periods when reimbursements or reductions occur. Expense ratios before reductions for start-up periods may not be representative of longer-term operating periods. Expenses net of fee waivers reflect expenses after reimbursement by the investment adviser but prior to reductions from expense offset arrangements. Expenses net of all reductions represent the net expenses paid by the class.
H Amount does not include the portfolio activity of any Underlying Funds.
I Annualized
See accompanying notes which are an integral part of the financial statements.
Fidelity Freedom® Index 2010 Fund
Investment Summary (Unaudited)
The information in the following tables is based on the direct investments of the Fund.
Top Holdings as of September 30, 2016
| | % of fund's net assets | % of fund's net assets 6 months ago |
| Fidelity U.S. Bond Index Fund Class F | 34.4 | 34.2 |
| Fidelity Total Market Index Fund Class F | 30.1 | 30.7 |
| Fidelity Series Government Money Market Fund Class F 0.29% | 17.1 | 0.0 |
| Fidelity Series Global ex U.S. Index Fund | 13.3 | 13.6 |
| Fidelity Series Inflation-Protected Bond Index Fund Class F | 4.0 | 3.9 |
| Fidelity Series Commodity Strategy Fund Class F | 1.1 | 1.1 |
| Fidelity Institutional Money Market Portfolio Class F 0.39% | 0.0 | 16.5 |
| | 100.0 | 100.0 |
Asset Allocation (% of fund's net assets)
| Period end |
| | Domestic Equity Funds | 30.1% |
| | Commodity Funds | 1.1% |
| | International Equity Funds | 13.3% |
| | Bond Funds | 34.4% |
| | Inflation-Protected Bond Funds | 4.0% |
| | Short-Term Funds | 17.1% |

| Six months ago |
| | Domestic Equity Funds | 30.7% |
| | Commodity Funds | 1.1% |
| | International Equity Funds | 13.6% |
| | Bond Funds | 34.2% |
| | Inflation-Protected Bond Funds | 3.9% |
| | Short-Term Funds | 16.5% |
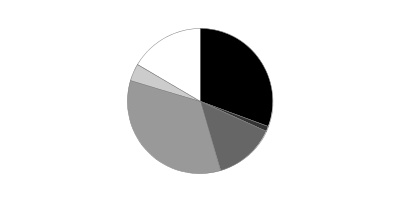
Percentages shown as 0.0% may reflect amounts less than 0.05%.
Fidelity Freedom® Index 2010 Fund
Investments September 30, 2016 (Unaudited)
Showing Percentage of Net Assets
| Domestic Equity Funds - 30.1% | | | |
| | | Shares | Value |
| Fidelity Total Market Index Fund Class F (a) | | | |
| (Cost $81,290,877) | | 2,245,531 | 141,827,750 |
|
| Commodity Funds - 1.1% | | | |
| Fidelity Series Commodity Strategy Fund Class F (a)(b) | | | |
| (Cost $7,029,581) | | 975,808 | 5,220,571 |
|
| International Equity Funds - 13.3% | | | |
| Fidelity Series Global ex U.S. Index Fund (a) | | | |
| (Cost $58,621,016) | | 5,647,563 | 62,913,857 |
|
| Bond Funds - 34.4% | | | |
| Fidelity U.S. Bond Index Fund Class F (a) | | | |
| (Cost $156,694,956) | | 13,593,522 | 162,306,652 |
|
| Inflation-Protected Bond Funds - 4.0% | | | |
| Fidelity Series Inflation-Protected Bond Index Fund Class F (a) | | | |
| (Cost $19,439,108) | | 1,891,831 | 19,069,660 |
|
| Short-Term Funds - 17.1% | | | |
| Fidelity Series Government Money Market Fund Class F 0.29% (a)(c) | | | |
| (Cost $80,612,001) | | 80,612,001 | 80,612,001 |
| TOTAL INVESTMENT PORTFOLIO - 100.0% | | | |
| (Cost $403,687,539) | | | 471,950,491 |
| NET OTHER ASSETS (LIABILITIES) - 0.0% | | | (27,742) |
| NET ASSETS - 100% | | | $471,922,749 |
Legend
(a) Affiliated Fund
(b) Non-income producing
(c) The rate quoted is the annualized seven-day yield of the fund at period end.
Affiliated Underlying Funds
Information regarding the Fund's fiscal year to date purchases and sales of the affiliated Underlying Funds and income earned by the Fund from investments in affiliated Underlying Funds is as follows:
| Affiliate | Value, beginning of period | Purchases | Sales Proceeds | Dividend Income | Value, end of period |
| Fidelity Investments Money Market Portfolio Class F | $73,915,755 | $1,797,235 | $75,712,990 | $38,118 | -- |
| Fidelity Series Commodity Strategy Fund Class F | 5,065,057 | 323,996 | 593,854 | -- | 5,220,571 |
| Fidelity Series Global ex U.S. Index Fund | 60,961,031 | 5,082,694 | 7,330,135 | -- | 62,913,857 |
| Fidelity Series Government Money Market Fund | -- | 4,021,163 | 4,021,163 | 71 | -- |
| Fidelity Series Government Money Market Fund Class F 0.29% | -- | 83,796,951 | 3,184,949 | 70,895 | 80,612,001 |
| Fidelity Series Inflation-Protected Bond Index Fund Class F | 17,478,966 | 2,210,670 | 971,579 | 21,502 | 19,069,660 |
| Fidelity Total Market Index Fund Class F | 137,200,248 | 9,325,235 | 13,722,436 | 424,599 | 141,827,750 |
| Fidelity U.S. Bond Index Fund Class F | 152,976,872 | 17,460,535 | 10,358,332 | 1,880,155 | 162,306,652 |
| Total | $447,597,929 | $124,018,479 | $115,895,438 | $2,435,340 | $471,950,491 |
Investment Valuation
All investments are categorized as Level 1 under the Fair Value Hierarchy. The inputs or methodology used for valuing securities may not be an indication of the risk associated with investing in those securities. For more information on valuation inputs please refer to the Investment Valuation section in the accompanying Notes to Financial Statements.
See accompanying notes which are an integral part of the financial statements.
Fidelity Freedom® Index 2010 Fund
Financial Statements
Statement of Assets and Liabilities
| | | September 30, 2016 (Unaudited) |
| Assets | | |
| Investment in securities, at value (cost $403,687,539) — See accompanying schedule | | $471,950,491 |
| Cash | | 3 |
| Receivable for investments sold | | 1,053,429 |
| Receivable for fund shares sold | | 1,050,306 |
| Receivable from affiliate for expense reductions | | 20,470 |
| Total assets | | 474,074,699 |
| Liabilities | | |
| Payable for investments purchased | $1,845,374 | |
| Payable for fund shares redeemed | 258,362 | |
| Transfer agent fees payable | 48,214 | |
| Total liabilities | | 2,151,950 |
| Net Assets | | $471,922,749 |
| Net Assets consist of: | | |
| Paid in capital | | $403,154,538 |
| Undistributed net investment income | | 2,236,302 |
| Accumulated undistributed net realized gain (loss) on investments | | (1,731,043) |
| Net unrealized appreciation (depreciation) on investments | | 68,262,952 |
| Net Assets | | $471,922,749 |
| Investor Class: | | |
| Net Asset Value, offering price and redemption price per share ($223,921,832 ÷ 16,526,397 shares) | | $13.55 |
| Institutional Premium Class: | | |
| Net Asset Value, offering price and redemption price per share ($248,000,917 ÷ 18,300,784 shares) | | $13.55 |
See accompanying notes which are an integral part of the financial statements.
Statement of Operations
| | | Six months ended September 30, 2016 (Unaudited) |
| Investment Income | | |
| Income distributions from underlying funds | | $2,435,340 |
| Expenses | | |
| Transfer agent fees | $247,744 | |
| Independent trustees' fees and expenses | 1,020 | |
| Total expenses before reductions | 248,764 | |
| Expense reductions | (119,106) | 129,658 |
| Net investment income (loss) | | 2,305,682 |
| Realized and Unrealized Gain (Loss) | | |
| Realized gain (loss) on sale of underlying fund shares | 249,868 | |
| Capital gain distributions from underlying funds | 254,820 | |
| Total net realized gain (loss) | | 504,688 |
| Change in net unrealized appreciation (depreciation) on investment securities | | 15,979,990 |
| Net gain (loss) | | 16,484,678 |
| Net increase (decrease) in net assets resulting from operations | | $18,790,360 |
See accompanying notes which are an integral part of the financial statements.
Statement of Changes in Net Assets
| | Six months ended September 30, 2016 (Unaudited) | Year ended March 31, 2016 |
| Increase (Decrease) in Net Assets | | |
| Operations | | |
| Net investment income (loss) | $2,305,682 | $8,029,523 |
| Net realized gain (loss) | 504,688 | 872,879 |
| Change in net unrealized appreciation (depreciation) | 15,979,990 | (13,115,219) |
| Net increase (decrease) in net assets resulting from operations | 18,790,360 | (4,212,817) |
| Distributions to shareholders from net investment income | (947,502) | (8,001,626) |
| Distributions to shareholders from net realized gain | – | (137,366) |
| Total distributions | (947,502) | (8,138,992) |
| Share transactions - net increase (decrease) | 6,501,296 | (20,930,590) |
| Total increase (decrease) in net assets | 24,344,154 | (33,282,399) |
| Net Assets | | |
| Beginning of period | 447,578,595 | 480,860,994 |
| End of period | $471,922,749 | $447,578,595 |
| Other Information | | |
| Undistributed net investment income end of period | $2,236,302 | $878,122 |
See accompanying notes which are an integral part of the financial statements.
Financial Highlights — Fidelity Freedom Index 2010 Fund Investor Class
| | Six months ended (Unaudited) September 30, | Years ended March 31, | | | | |
| | 2016 | 2016 | 2015 | 2014 | 2013 | 2012 |
| Selected Per–Share Data | | | | | | |
| Net asset value, beginning of period | $13.03 | $13.36 | $13.08 | $12.27 | $11.71 | $11.65 |
| Income from Investment Operations | | | | | | |
| Net investment income (loss)A | .07 | .20 | .23 | .18 | .18 | .20 |
| Net realized and unrealized gain (loss) | .48 | (.30) | .46 | .68 | .61 | .21 |
| Total from investment operations | .55 | (.10) | .69 | .86 | .79 | .41 |
| Distributions from net investment income | (.03) | (.23) | (.35) | (.02) | (.17) | (.18) |
| Distributions from net realized gain | – | –B | (.05) | (.04) | (.06) | (.17) |
| Total distributions | (.03) | (.23) | (.41)C | (.05)D | (.23) | (.35) |
| Net asset value, end of period | $13.55 | $13.03 | $13.36 | $13.08 | $12.27 | $11.71 |
| Total ReturnE,F | 4.20% | (.72)% | 5.36% | 7.05% | 6.80% | 3.64% |
| Ratios to Average Net AssetsG,H | | | | | | |
| Expenses before reductions | .15%I | .15% | .15% | .15% | .15% | .15% |
| Expenses net of fee waivers, if any | .09%I | .08% | .08% | .09% | .10% | .09% |
| Expenses net of all reductions | .09%I | .08% | .08% | .09% | .10% | .09% |
| Net investment income (loss) | .98%I | 1.52% | 1.72% | 1.45% | 1.54% | 1.71% |
| Supplemental Data | | | | | | |
| Net assets, end of period (000 omitted) | $223,922 | $232,187 | $480,861 | $430,767 | $364,853 | $238,158 |
| Portfolio turnover rateH | 51 %I | 22% | 23% | 39% | 21% | 33% |
A Calculated based on average shares outstanding during the period.
B Amount represents less than $.005 per share.
C Total distributions of $.41 per share is comprised of distributions from net investment income of $.353 and distributions from net realized gain of $.055 per share.
D Total distributions of $.05 per share is comprised of distributions from net investment income of $.017 and distributions from net realized gain of $.035 per share.
E Total returns for periods of less than one year are not annualized.
F Total returns would have been lower if certain expenses had not been reduced during the applicable periods shown.
G Expense ratios reflect operating expenses of the class. Expenses before reductions do not reflect amounts reimbursed by the investment adviser or reductions from expense offset arrangements and do not represent the amount paid by the class during periods when reimbursements or reductions occur. Expenses net of fee waivers reflect expenses after reimbursement by the investment adviser but prior to reductions from expense offset arrangements. Expenses net of all reductions represent the net expenses paid by the class.
H Amount does not include the portfolio activity of any Underlying Funds.
I Annualized
See accompanying notes which are an integral part of the financial statements.
Financial Highlights — Fidelity Freedom Index 2010 Fund Institutional Premium Class
| | Six months ended (Unaudited) September 30, | Years ended March 31, |
| | 2016 | 2016 A |
| Selected Per–Share Data | | |
| Net asset value, beginning of period | $13.03 | $13.43 |
| Income from Investment Operations | | |
| Net investment income (loss)B | .07 | .27 |
| Net realized and unrealized gain (loss) | .48 | (.46) |
| Total from investment operations | .55 | (.19) |
| Distributions from net investment income | (.03) | (.21) |
| Distributions from net realized gain | – | –C |
| Total distributions | (.03) | (.21) |
| Net asset value, end of period | $13.55 | $13.03 |
| Total ReturnD,E | 4.22% | (1.39)% |
| Ratios to Average Net AssetsF,G | | |
| Expenses before reductions | .07%H | .05%H |
| Expenses net of fee waivers, if any | .03%H | .02%H |
| Expenses net of all reductions | .03%H | .02%H |
| Net investment income (loss) | 1.04%H | 2.81%H |
| Supplemental Data | | |
| Net assets, end of period (000 omitted) | $248,001 | $215,392 |
| Portfolio turnover rateG | 51 %H | 22% |
A For the period June 24, 2015 (commencement of sale of shares) to March 31, 2016.
B Calculated based on average shares outstanding during the period.
C Amount represents less than $.005 per share.
D Total returns for periods of less than one year are not annualized.
E Total returns would have been lower if certain expenses had not been reduced during the applicable periods shown.
F Expense ratios reflect operating expenses of the class. Expenses before reductions do not reflect amounts reimbursed by the investment adviser or reductions from expense offset arrangements and do not represent the amount paid by the class during periods when reimbursements or reductions occur. Expense ratios before reductions for start-up periods may not be representative of longer-term operating periods. Expenses net of fee waivers reflect expenses after reimbursement by the investment adviser but prior to reductions from expense offset arrangements. Expenses net of all reductions represent the net expenses paid by the class.
G Amount does not include the portfolio activity of any Underlying Funds.
H Annualized
See accompanying notes which are an integral part of the financial statements.
Fidelity Freedom® Index 2015 Fund
Investment Summary (Unaudited)
The information in the following tables is based on the direct investments of the Fund.
Top Holdings as of September 30, 2016
| | % of fund's net assets | % of fund's net assets 6 months ago |
| Fidelity Total Market Index Fund Class F | 36.3 | 36.7 |
| Fidelity U.S. Bond Index Fund Class F | 31.6 | 31.5 |
| Fidelity Series Global ex U.S. Index Fund | 16.0 | 16.2 |
| Fidelity Series Government Money Market Fund Class F 0.29% | 11.7 | 0.0 |
| Fidelity Series Inflation-Protected Bond Index Fund Class F | 3.2 | 3.1 |
| Fidelity Series Commodity Strategy Fund Class F | 1.2 | 1.2 |
| Fidelity Institutional Money Market Portfolio Class F 0.39% | 0.0 | 11.3 |
| | 100.0 | 100.0 |
Asset Allocation (% of fund's net assets)
| Period end |
| | Domestic Equity Funds | 36.3% |
| | Commodity Funds | 1.2% |
| | International Equity Funds | 16.0% |
| | Bond Funds | 31.6% |
| | Inflation-Protected Bond Funds | 3.2% |
| | Short-Term Funds | 11.7% |
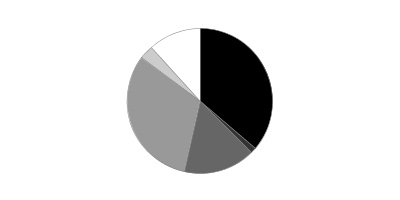
| Six months ago |
| | Domestic Equity Funds | 36.7% |
| | Commodity Funds | 1.2% |
| | International Equity Funds | 16.2% |
| | Bond Funds | 31.5% |
| | Inflation-Protected Bond Funds | 3.1% |
| | Short-Term Funds | 11.3% |

Percentages shown as 0.0% may reflect amounts less than 0.05%.
Fidelity Freedom® Index 2015 Fund
Investments September 30, 2016 (Unaudited)
Showing Percentage of Net Assets
| Domestic Equity Funds - 36.3% | | | |
| | | Shares | Value |
| Fidelity Total Market Index Fund Class F (a) | | | |
| (Cost $220,682,754) | | 5,571,719 | 351,909,803 |
|
| Commodity Funds - 1.2% | | | |
| Fidelity Series Commodity Strategy Fund Class F (a)(b) | | | |
| (Cost $14,948,783) | | 2,080,659 | 11,131,526 |
|
| International Equity Funds - 16.0% | | | |
| Fidelity Series Global ex U.S. Index Fund (a) | | | |
| (Cost $148,188,498) | | 13,926,016 | 155,135,822 |
|
| Bond Funds - 31.6% | | | |
| Fidelity U.S. Bond Index Fund Class F (a) | | | |
| (Cost $296,820,370) | | 25,594,059 | 305,593,068 |
|
| Inflation-Protected Bond Funds - 3.2% | | | |
| Fidelity Series Inflation-Protected Bond Index Fund Class F (a) | | | |
| (Cost $32,042,724) | | 3,096,239 | 31,210,087 |
|
| Short-Term Funds - 11.7% | | | |
| Fidelity Series Government Money Market Fund Class F 0.29% (a)(c) | | | |
| (Cost $113,213,050) | | 113,213,050 | 113,213,050 |
| TOTAL INVESTMENT PORTFOLIO - 100.0% | | | |
| (Cost $825,896,179) | | | 968,193,356 |
| NET OTHER ASSETS (LIABILITIES) - 0.0% | | | (65,614) |
| NET ASSETS - 100% | | | $968,127,742 |
Legend
(a) Affiliated Fund
(b) Non-income producing
(c) The rate quoted is the annualized seven-day yield of the fund at period end.
Affiliated Underlying Funds
Information regarding the Fund's fiscal year to date purchases and sales of the affiliated Underlying Funds and income earned by the Fund from investments in affiliated Underlying Funds is as follows:
| Affiliate | Value, beginning of period | Purchases | Sales Proceeds | Dividend Income | Value, end of period |
| Fidelity Investments Money Market Portfolio Class F | $102,954,321 | $2,324,173 | $105,278,494 | $53,032 | -- |
| Fidelity Series Commodity Strategy Fund Class F | 10,437,138 | 583,330 | 753,186 | -- | 11,131,526 |
| Fidelity Series Global ex U.S. Index Fund | 147,341,830 | 12,921,723 | 15,474,701 | -- | 155,135,822 |
| Fidelity Series Government Money Market Fund | -- | 5,604,306 | 5,604,306 | 99 | -- |
| Fidelity Series Government Money Market Fund Class F 0.29% | -- | 116,222,090 | 3,009,039 | 99,524 | 113,213,050 |
| Fidelity Series Inflation-Protected Bond Index Fund Class F | 28,391,365 | 3,433,997 | 1,185,933 | 34,989 | 31,210,087 |
| Fidelity Total Market Index Fund Class F | 333,289,359 | 22,904,048 | 26,471,291 | 1,031,109 | 351,909,803 |
| Fidelity U.S. Bond Index Fund Class F | 285,756,519 | 31,605,440 | 15,908,855 | 3,526,335 | 305,593,068 |
| Total | $908,170,532 | $195,599,107 | $173,685,805 | $4,745,088 | $968,193,356 |
Investment Valuation
All investments are categorized as Level 1 under the Fair Value Hierarchy. The inputs or methodology used for valuing securities may not be an indication of the risk associated with investing in those securities. For more information on valuation inputs please refer to the Investment Valuation section in the accompanying Notes to Financial Statements.
See accompanying notes which are an integral part of the financial statements.
Fidelity Freedom® Index 2015 Fund
Financial Statements
Statement of Assets and Liabilities
| | | September 30, 2016 (Unaudited) |
| Assets | | |
| Investment in securities, at value (cost $825,896,179) — See accompanying schedule | | $968,193,356 |
| Cash | | 2 |
| Receivable for investments sold | | 2,460,425 |
| Receivable for fund shares sold | | 1,194,036 |
| Receivable from affiliate for expense reductions | | 37,482 |
| Total assets | | 971,885,301 |
| Liabilities | | |
| Payable for investments purchased | $3,311,529 | |
| Payable for fund shares redeemed | 342,781 | |
| Transfer agent fees payable | 103,249 | |
| Total liabilities | | 3,757,559 |
| Net Assets | | $968,127,742 |
| Net Assets consist of: | | |
| Paid in capital | | $828,307,473 |
| Undistributed net investment income | | 4,299,741 |
| Accumulated undistributed net realized gain (loss) on investments | | (6,776,649) |
| Net unrealized appreciation (depreciation) on investments | | 142,297,177 |
| Net Assets | | $968,127,742 |
| Investor Class: | | |
| Net Asset Value, offering price and redemption price per share ($553,810,922 ÷ 40,081,722 shares) | | $13.82 |
| Institutional Premium Class: | | |
| Net Asset Value, offering price and redemption price per share ($414,316,820 ÷ 29,994,388 shares) | | $13.81 |
See accompanying notes which are an integral part of the financial statements.
Statement of Operations
| | | Six months ended September 30, 2016 (Unaudited) |
| Investment Income | | |
| Income distributions from underlying funds | | $4,745,088 |
| Expenses | | |
| Transfer agent fees | $543,861 | |
| Independent trustees' fees and expenses | 2,078 | |
| Total expenses before reductions | 545,939 | |
| Expense reductions | (240,790) | 305,149 |
| Net investment income (loss) | | 4,439,939 |
| Realized and Unrealized Gain (Loss) | | |
| Realized gain (loss) on sale of underlying fund shares | 681,513 | |
| Capital gain distributions from underlying funds | 618,811 | |
| Total net realized gain (loss) | | 1,300,324 |
| Change in net unrealized appreciation (depreciation) on investment securities | | 37,430,239 |
| Net gain (loss) | | 38,730,563 |
| Net increase (decrease) in net assets resulting from operations | | $43,170,502 |
See accompanying notes which are an integral part of the financial statements.
Statement of Changes in Net Assets
| | Six months ended September 30, 2016 (Unaudited) | Year ended March 31, 2016 |
| Increase (Decrease) in Net Assets | | |
| Operations | | |
| Net investment income (loss) | $4,439,939 | $16,831,583 |
| Net realized gain (loss) | 1,300,324 | 960,037 |
| Change in net unrealized appreciation (depreciation) | 37,430,239 | (28,731,002) |
| Net increase (decrease) in net assets resulting from operations | 43,170,502 | (10,939,382) |
| Distributions to shareholders from net investment income | (1,735,714) | (16,720,219) |
| Distributions to shareholders from net realized gain | – | (202,772) |
| Total distributions | (1,735,714) | (16,922,991) |
| Share transactions - net increase (decrease) | 18,566,916 | 25,187,493 |
| Total increase (decrease) in net assets | 60,001,704 | (2,674,880) |
| Net Assets | | |
| Beginning of period | 908,126,038 | 910,800,918 |
| End of period | $968,127,742 | $908,126,038 |
| Other Information | | |
| Undistributed net investment income end of period | $4,299,741 | $1,595,516 |
See accompanying notes which are an integral part of the financial statements.
Financial Highlights — Fidelity Freedom Index 2015 Fund Investor Class
| | Six months ended (Unaudited) September 30, | Years ended March 31, | | | | |
| | 2016 | 2016 | 2015 | 2014 | 2013 | 2012 |
| Selected Per–Share Data | | | | | | |
| Net asset value, beginning of period | $13.22 | $13.62 | $13.31 | $12.39 | $11.80 | $11.71 |
| Income from Investment Operations | | | | | | |
| Net investment income (loss)A | .06 | .23 | .25 | .20 | .19 | .20 |
| Net realized and unrealized gain (loss) | .56 | (.38) | .52 | .75 | .63 | .22 |
| Total from investment operations | .62 | (.15) | .77 | .95 | .82 | .42 |
| Distributions from net investment income | (.02) | (.25) | (.41) | (.02) | (.18) | (.17) |
| Distributions from net realized gain | – | –B | (.05) | (.02) | (.05) | (.15) |
| Total distributions | (.02) | (.25) | (.46) | (.03)C | (.23) | (.33)D |
| Net asset value, end of period | $13.82 | $13.22 | $13.62 | $13.31 | $12.39 | $11.80 |
| Total ReturnE,F | 4.73% | (1.10)% | 5.87% | 7.71% | 7.02% | 3.70% |
| Ratios to Average Net AssetsG,H | | | | | | |
| Expenses before reductions | .15%I | .15% | .15% | .15% | .15% | .15% |
| Expenses net of fee waivers, if any | .09%I | .08% | .08% | .09% | .10% | .09% |
| Expenses net of all reductions | .09%I | .08% | .08% | .09% | .10% | .09% |
| Net investment income (loss) | .93%I | 1.70% | 1.86% | 1.56% | 1.58% | 1.76% |
| Supplemental Data | | | | | | |
| Net assets, end of period (000 omitted) | $553,811 | $577,905 | $910,801 | $828,722 | $672,276 | $412,376 |
| Portfolio turnover rateH | 37%I | 22% | 19% | 29% | 14% | 23% |
A Calculated based on average shares outstanding during the period.
B Amount represents less than $.005 per share.
C Total distributions of $.03 per share is comprised of distributions from net investment income of $.016 and distributions from net realized gain of $.017 per share.
D Total distributions of $.33 per share is comprised of distributions from net investment income of $.174 and distributions from net realized gain of $.151 per share.
E Total returns for periods of less than one year are not annualized.
F Total returns would have been lower if certain expenses had not been reduced during the applicable periods shown.
G Expense ratios reflect operating expenses of the class. Expenses before reductions do not reflect amounts reimbursed by the investment adviser or reductions from expense offset arrangements and do not represent the amount paid by the class during periods when reimbursements or reductions occur. Expenses net of fee waivers reflect expenses after reimbursement by the investment adviser but prior to reductions from expense offset arrangements. Expenses net of all reductions represent the net expenses paid by the class.
H Amount does not include the activity of the underlying investments.
I Annualized
See accompanying notes which are an integral part of the financial statements.
Financial Highlights — Fidelity Freedom Index 2015 Fund Institutional Premium Class
| | Six months ended (Unaudited) September 30, | Years ended March 31, |
| | 2016 | 2016 A |
| Selected Per–Share Data | | |
| Net asset value, beginning of period | $13.21 | $13.72 |
| Income from Investment Operations | | |
| Net investment income (loss)B | .07 | .28 |
| Net realized and unrealized gain (loss) | .56 | (.56) |
| Total from investment operations | .63 | (.28) |
| Distributions from net investment income | (.03) | (.23) |
| Distributions from net realized gain | – | –C |
| Total distributions | (.03) | (.23) |
| Net asset value, end of period | $13.81 | $13.21 |
| Total ReturnD,E | 4.76% | (2.03)% |
| Ratios to Average Net AssetsF,G | | |
| Expenses before reductions | .07%H | .05%H |
| Expenses net of fee waivers, if any | .03%H | .02%H |
| Expenses net of all reductions | .03%H | .02%H |
| Net investment income (loss) | .98%H | 2.84%H |
| Supplemental Data | | |
| Net assets, end of period (000 omitted) | $414,317 | $330,221 |
| Portfolio turnover rateG | 37%H | 22% |
A For the period June 24, 2015 (commencement of sale of shares) to March 31, 2016.
B Calculated based on average shares outstanding during the period.
C Amount represents less than $.005 per share.
D Total returns for periods of less than one year are not annualized.
E Total returns would have been lower if certain expenses had not been reduced during the applicable periods shown.
F Expense ratios reflect operating expenses of the class. Expenses before reductions do not reflect amounts reimbursed by the investment adviser or reductions from expense offset arrangements and do not represent the amount paid by the class during periods when reimbursements or reductions occur. Expense ratios before reductions for start-up periods may not be representative of longer-term operating periods. Expenses net of fee waivers reflect expenses after reimbursement by the investment adviser but prior to reductions from expense offset arrangements. Expenses net of all reductions represent the net expenses paid by the class.
G Amount does not include the activity of the underlying investments.
H Annualized
See accompanying notes which are an integral part of the financial statements.
Fidelity Freedom® Index 2020 Fund
Investment Summary (Unaudited)
The information in the following tables is based on the direct investments of the Fund.
Top Holdings as of September 30, 2016
| | % of fund's net assets | % of fund's net assets 6 months ago |
| Fidelity Total Market Index Fund Class F | 40.3 | 40.7 |
| Fidelity U.S. Bond Index Fund Class F | 30.0 | 29.9 |
| Fidelity Series Global ex U.S. Index Fund | 17.8 | 18.0 |
| Fidelity Series Government Money Market Fund Class F 0.29% | 8.3 | 0.0 |
| Fidelity Series Inflation-Protected Bond Index Fund Class F | 2.4 | 2.3 |
| Fidelity Series Commodity Strategy Fund Class F | 1.2 | 1.2 |
| Fidelity Institutional Money Market Portfolio Class F 0.39% | 0.0 | 7.9 |
| | 100.0 | 100.0 |
Asset Allocation (% of fund's net assets)
| Period end |
| | Domestic Equity Funds | 40.3% |
| | Commodity Funds | 1.2% |
| | International Equity Funds | 17.8% |
| | Bond Funds | 30.0% |
| | Inflation-Protected Bond Funds | 2.4% |
| | Short-Term Funds | 8.3% |

| Six months ago |
| | Domestic Equity Funds | 40.7% |
| | Commodity Funds | 1.2% |
| | International Equity Funds | 18.0% |
| | Bond Funds | 29.9% |
| | Inflation-Protected Bond Funds | 2.3% |
| | Short-Term Funds | 7.9% |
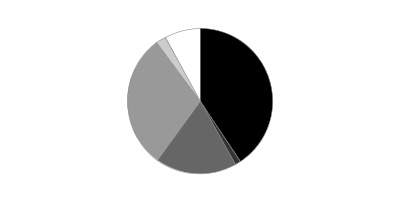
Percentages shown as 0.0% may reflect amounts less than 0.05%.
Fidelity Freedom® Index 2020 Fund
Investments September 30, 2016 (Unaudited)
Showing Percentage of Net Assets
| Domestic Equity Funds - 40.3% | | | |
| | | Shares | Value |
| Fidelity Total Market Index Fund Class F (a) | | | |
| (Cost $850,947,635) | | 19,018,138 | 1,201,185,611 |
|
| Commodity Funds - 1.2% | | | |
| Fidelity Series Commodity Strategy Fund Class F (a)(b) | | | |
| (Cost $46,529,204) | | 6,728,756 | 35,998,844 |
|
| International Equity Funds - 17.8% | | | |
| Fidelity Series Global ex U.S. Index Fund (a) | | | |
| (Cost $515,191,284) | | 47,453,237 | 528,629,061 |
|
| Bond Funds - 30.0% | | | |
| Fidelity U.S. Bond Index Fund Class F (a) | | | |
| (Cost $870,244,216) | | 74,761,719 | 892,654,925 |
|
| Inflation-Protected Bond Funds - 2.4% | | | |
| Fidelity Series Inflation-Protected Bond Index Fund Class F (a) | | | |
| (Cost $73,034,706) | | 7,130,114 | 71,871,548 |
|
| Short-Term Funds - 8.3% | | | |
| Fidelity Series Government Money Market Fund Class F 0.29% (a)(c) | | | |
| (Cost $246,159,281) | | 246,159,281 | 246,159,281 |
| TOTAL INVESTMENT PORTFOLIO - 100.0% | | | |
| (Cost $2,602,106,326) | | | 2,976,499,270 |
| NET OTHER ASSETS (LIABILITIES) - 0.0% | | | (198,262) |
| NET ASSETS - 100% | | | $2,976,301,008 |
Legend
(a) Affiliated Fund
(b) Non-income producing
(c) The rate quoted is the annualized seven-day yield of the fund at period end.
Affiliated Underlying Funds
Information regarding the Fund's fiscal year to date purchases and sales of the affiliated Underlying Funds and income earned by the Fund from investments in affiliated Underlying Funds is as follows:
| Affiliate | Value, beginning of period | Purchases | Sales Proceeds | Dividend Income | Value, end of period |
| Fidelity Investments Money Market Portfolio Class F | $210,392,054 | $5,502,456 | $215,894,511 | $108,896 | -- |
| Fidelity Series Commodity Strategy Fund Class F | 32,340,808 | 3,214,148 | 2,289,155 | -- | 35,998,844 |
| Fidelity Series Global ex U.S. Index Fund | 477,883,309 | 50,124,019 | 33,977,478 | -- | 528,629,061 |
| Fidelity Series Government Money Market Fund | -- | 11,519,232 | 11,519,232 | 204 | -- |
| Fidelity Series Government Money Market Fund Class F 0.29% | -- | 248,456,445 | 2,297,165 | 211,074 | 246,159,281 |
| Fidelity Series Inflation-Protected Bond Index Fund Class F | 61,644,547 | 9,842,029 | 906,930 | 78,032 | 71,871,548 |
| Fidelity Total Market Index Fund Class F | 1,082,595,781 | 96,953,602 | 51,874,881 | 3,362,229 | 1,201,185,611 |
| Fidelity U.S. Bond Index Fund Class F | 795,647,004 | 109,669,781 | 24,267,705 | 10,030,916 | 892,654,925 |
| Total | $2,660,503,503 | $535,281,712 | $343,027,057 | $13,791,351 | $2,976,499,270 |
Investment Valuation
All investments are categorized as Level 1 under the Fair Value Hierarchy. The inputs or methodology used for valuing securities may not be an indication of the risk associated with investing in those securities. For more information on valuation inputs please refer to the Investment Valuation section in the accompanying Notes to Financial Statements.
See accompanying notes which are an integral part of the financial statements.
Fidelity Freedom® Index 2020 Fund
Financial Statements
Statement of Assets and Liabilities
| | | September 30, 2016 (Unaudited) |
| Assets | | |
| Investment in securities, at value (cost $2,602,106,326) — See accompanying schedule | | $2,976,499,270 |
| Receivable for investments sold | | 8,111,067 |
| Receivable for fund shares sold | | 3,585,481 |
| Receivable from affiliate for expense reductions | | 105,766 |
| Total assets | | 2,988,301,584 |
| Liabilities | | |
| Payable for investments purchased | $10,387,871 | |
| Payable for fund shares redeemed | 1,308,676 | |
| Transfer agent fees payable | 304,029 | |
| Total liabilities | | 12,000,576 |
| Net Assets | | $2,976,301,008 |
| Net Assets consist of: | | |
| Paid in capital | | $2,612,997,952 |
| Undistributed net investment income | | 12,524,008 |
| Accumulated undistributed net realized gain (loss) on investments | | (23,613,896) |
| Net unrealized appreciation (depreciation) on investments | | 374,392,944 |
| Net Assets | | $2,976,301,008 |
| Investor Class: | | |
| Net Asset Value, offering price and redemption price per share ($1,391,028,186 ÷ 97,146,598 shares) | | $14.32 |
| Institutional Premium Class: | | |
| Net Asset Value, offering price and redemption price per share ($1,585,272,822 ÷ 110,730,954 shares) | | $14.32 |
See accompanying notes which are an integral part of the financial statements.
Statement of Operations
| | | Six months ended September 30, 2016 (Unaudited) |
| Investment Income | | |
| Income distributions from underlying funds | | $13,791,351 |
| Expenses | | |
| Transfer agent fees | $1,523,750 | |
| Independent trustees' fees and expenses | 6,166 | |
| Total expenses before reductions | 1,529,916 | |
| Expense reductions | (660,063) | 869,853 |
| Net investment income (loss) | | 12,921,498 |
| Realized and Unrealized Gain (Loss) | | |
| Realized gain (loss) on sale of underlying fund shares | (1,815,661) | |
| Capital gain distributions from underlying funds | 2,017,815 | |
| Total net realized gain (loss) | | 202,154 |
| Change in net unrealized appreciation (depreciation) on investment securities | | 125,560,641 |
| Net gain (loss) | | 125,762,795 |
| Net increase (decrease) in net assets resulting from operations | | $138,684,293 |
See accompanying notes which are an integral part of the financial statements.
Statement of Changes in Net Assets
| | Six months ended September 30, 2016 (Unaudited) | Year ended March 31, 2016 |
| Increase (Decrease) in Net Assets | | |
| Operations | | |
| Net investment income (loss) | $12,921,498 | $49,551,490 |
| Net realized gain (loss) | 202,154 | 384,670 |
| Change in net unrealized appreciation (depreciation) | 125,560,641 | (84,872,924) |
| Net increase (decrease) in net assets resulting from operations | 138,684,293 | (34,936,764) |
| Distributions to shareholders from net investment income | (4,802,669) | (48,681,022) |
| Distributions to shareholders from net realized gain | – | (565,398) |
| Total distributions | (4,802,669) | (49,246,420) |
| Share transactions - net increase (decrease) | 182,030,069 | 286,511,907 |
| Total increase (decrease) in net assets | 315,911,693 | 202,328,723 |
| Net Assets | | |
| Beginning of period | 2,660,389,315 | 2,458,060,592 |
| End of period | $2,976,301,008 | $2,660,389,315 |
| Other Information | | |
| Undistributed net investment income end of period | $12,524,008 | $4,405,179 |
See accompanying notes which are an integral part of the financial statements.
Financial Highlights — Fidelity Freedom Index 2020 Fund Investor Class
| | Six months ended (Unaudited) September 30, | Years ended March 31, | | | | |
| | 2016 | 2016 | 2015 | 2014 | 2013 | 2012 |
| Selected Per–Share Data | | | | | | |
| Net asset value, beginning of period | $13.65 | $14.10 | $13.72 | $12.67 | $12.03 | $12.00 |
| Income from Investment Operations | | | | | | |
| Net investment income (loss)A | .06 | .23 | .26 | .22 | .20 | .22 |
| Net realized and unrealized gain (loss) | .63 | (.42) | .57 | .86 | .68 | .16 |
| Total from investment operations | .69 | (.19) | .83 | 1.08 | .88 | .38 |
| Distributions from net investment income | (.02) | (.26) | (.41) | (.02) | (.19) | (.19) |
| Distributions from net realized gain | – | –B | (.04) | (.01) | (.05) | (.16) |
| Total distributions | (.02) | (.26) | (.45) | (.03) | (.24) | (.35) |
| Net asset value, end of period | $14.32 | $13.65 | $14.10 | $13.72 | $12.67 | $12.03 |
| Total ReturnC,D | 5.09% | (1.34)% | 6.18% | 8.55% | 7.38% | 3.36% |
| Ratios to Average Net AssetsE,F | | | | | | |
| Expenses before reductions | .15%G | .15% | .15% | .15% | .15% | .15% |
| Expenses net of fee waivers, if any | .09%G | .08% | .08% | .09% | .10% | .09% |
| Expenses net of all reductions | .09%G | .08% | .08% | .09% | .10% | .09% |
| Net investment income (loss) | .90%G | 1.69% | 1.90% | 1.66% | 1.68% | 1.85% |
| Supplemental Data | | | | | | |
| Net assets, end of period (000 omitted) | $1,391,028 | $1,410,489 | $2,458,061 | $2,010,769 | $1,430,835 | $812,369 |
| Portfolio turnover rateF | 24%G | 16% | 16% | 25% | 11% | 20% |
A Calculated based on average shares outstanding during the period.
B Amount represents less than $.005 per share.
C Total returns for periods of less than one year are not annualized.
D Total returns would have been lower if certain expenses had not been reduced during the applicable periods shown.
E Expense ratios reflect operating expenses of the class. Expenses before reductions do not reflect amounts reimbursed by the investment adviser or reductions from expense offset arrangements and do not represent the amount paid by the class during periods when reimbursements or reductions occur. Expenses net of fee waivers reflect expenses after reimbursement by the investment adviser but prior to reductions from expense offset arrangements. Expenses net of all reductions represent the net expenses paid by the class.
F Amount does not include the portfolio activity of any Underlying Funds.
G Annualized
See accompanying notes which are an integral part of the financial statements.
Financial Highlights — Fidelity Freedom Index 2020 Fund Institutional Premium Class
| | Six months ended (Unaudited) September 30, | Years ended March 31, |
| | 2016 | 2016 A |
| Selected Per–Share Data | | |
| Net asset value, beginning of period | $13.65 | $14.24 |
| Income from Investment Operations | | |
| Net investment income (loss)B | .07 | .32 |
| Net realized and unrealized gain (loss) | .63 | (.67) |
| Total from investment operations | .70 | (.35) |
| Distributions from net investment income | (.03) | (.24) |
| Distributions from net realized gain | – | –C |
| Total distributions | (.03) | (.24) |
| Net asset value, end of period | $14.32 | $13.65 |
| Total ReturnD,E | 5.11% | (2.42)% |
| Ratios to Average Net AssetsF,G | | |
| Expenses before reductions | .07%H | .05%H |
| Expenses net of fee waivers, if any | .03%H | .02%H |
| Expenses net of all reductions | .03%H | .02%H |
| Net investment income (loss) | .95%H | 3.12%H |
| Supplemental Data | | |
| Net assets, end of period (000 omitted) | $1,585,273 | $1,249,900 |
| Portfolio turnover rateG | 24%H | 16% |
A For the period June 24, 2015 (commencement of sale of shares) to March 31, 2016.
B Calculated based on average shares outstanding during the period.
C Amount represents less than $.005 per share.
D Total returns for periods of less than one year are not annualized.
E Total returns would have been lower if certain expenses had not been reduced during the applicable periods shown.
F Expense ratios reflect operating expenses of the class. Expenses before reductions do not reflect amounts reimbursed by the investment adviser or reductions from expense offset arrangements and do not represent the amount paid by the class during periods when reimbursements or reductions occur. Expense ratios before reductions for start-up periods may not be representative of longer-term operating periods. Expenses net of fee waivers reflect expenses after reimbursement by the investment adviser but prior to reductions from expense offset arrangements. Expenses net of all reductions represent the net expenses paid by the class.
G Amount does not include the portfolio activity of any Underlying Funds.
H Annualized
See accompanying notes which are an integral part of the financial statements.
Fidelity Freedom® Index 2025 Fund
Investment Summary (Unaudited)
The information in the following tables is based on the direct investments of the Fund.
Top Holdings as of September 30, 2016
| | % of fund's net assets | % of fund's net assets 6 months ago |
| Fidelity Total Market Index Fund Class F | 44.3 | 45.3 |
| Fidelity U.S. Bond Index Fund Class F | 28.4 | 27.9 |
| Fidelity Series Global ex U.S. Index Fund | 19.5 | 20.0 |
| Fidelity Series Government Money Market Fund Class F 0.29% | 4.9 | 0.0 |
| Fidelity Series Inflation-Protected Bond Index Fund Class F | 1.6 | 1.5 |
| Fidelity Series Commodity Strategy Fund Class F | 1.3 | 1.3 |
| Fidelity Institutional Money Market Portfolio Class F 0.39% | 0.0 | 4.0 |
| | 100.0 | 100.0 |
Asset Allocation (% of fund's net assets)
| Period end |
| | Domestic Equity Funds | 44.3% |
| | Commodity Funds | 1.3% |
| | International Equity Funds | 19.5% |
| | Bond Funds | 28.4% |
| | Inflation-Protected Bond Funds | 1.6% |
| | Short-Term Funds | 4.9% |
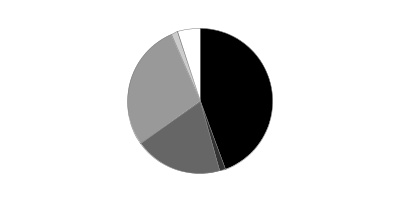
| Six months ago |
| | Domestic Equity Funds | 45.3% |
| | Commodity Funds | 1.3% |
| | International Equity Funds | 20.0% |
| | Bond Funds | 27.9% |
| | Inflation-Protected Bond Funds | 1.5% |
| | Short-Term Funds | 4.0% |
Percentages shown as 0.0% may reflect amounts less than 0.05%.
Fidelity Freedom® Index 2025 Fund
Investments September 30, 2016 (Unaudited)
Showing Percentage of Net Assets
| Domestic Equity Funds - 44.3% | | | |
| | | Shares | Value |
| Fidelity Total Market Index Fund Class F (a) | | | |
| (Cost $737,451,696) | | 16,200,626 | 1,023,231,535 |
|
| Commodity Funds - 1.3% | | | |
| Fidelity Series Commodity Strategy Fund Class F (a)(b) | | | |
| (Cost $36,740,330) | | 5,515,964 | 29,510,408 |
|
| International Equity Funds - 19.5% | | | |
| Fidelity Series Global ex U.S. Index Fund (a) | | | |
| (Cost $438,518,164) | | 40,456,206 | 450,682,130 |
|
| Bond Funds - 28.4% | | | |
| Fidelity U.S. Bond Index Fund Class F (a) | | | |
| (Cost $640,677,833) | | 54,913,451 | 655,666,606 |
|
| Inflation-Protected Bond Funds - 1.6% | | | |
| Fidelity Series Inflation-Protected Bond Index Fund Class F (a) | | | |
| (Cost $37,596,732) | | 3,695,499 | 37,250,635 |
|
| Short-Term Funds - 4.9% | | | |
| Fidelity Series Government Money Market Fund Class F 0.29% (a)(c) | | | |
| (Cost $112,042,262) | | 112,042,262 | 112,042,262 |
| TOTAL INVESTMENT PORTFOLIO - 100.0% | | | |
| (Cost $2,003,027,017) | | | 2,308,383,576 |
| NET OTHER ASSETS (LIABILITIES) - 0.0% | | | (165,954) |
| NET ASSETS - 100% | | | $2,308,217,622 |
Legend
(a) Affiliated Fund
(b) Non-income producing
(c) The rate quoted is the annualized seven-day yield of the fund at period end.
Affiliated Underlying Funds
Information regarding the Fund's fiscal year to date purchases and sales of the affiliated Underlying Funds and income earned by the Fund from investments in affiliated Underlying Funds is as follows:
| Affiliate | Value, beginning of period | Purchases | Sales Proceeds | Dividend Income | Value, end of period |
| Fidelity Investments Money Market Portfolio Class F | $78,284,051 | $5,449,229 | $83,733,280 | $41,174 | -- |
| Fidelity Series Commodity Strategy Fund Class F | 25,103,313 | 3,984,724 | 1,696,134 | -- | 29,510,408 |
| Fidelity Series Global ex U.S. Index Fund | 393,983,564 | 59,371,583 | 32,151,223 | -- | 450,682,130 |
| Fidelity Series Government Money Market Fund | -- | 4,468,018 | 4,468,018 | 79 | -- |
| Fidelity Series Government Money Market Fund Class F 0.29% | -- | 112,683,014 | 640,751 | 89,176 | 112,042,262 |
| Fidelity Series Inflation-Protected Bond Index Fund Class F | 29,741,585 | 7,196,422 | 343,717 | 39,137 | 37,250,635 |
| Fidelity Total Market Index Fund Class F | 894,380,763 | 113,190,719 | 46,927,050 | 2,792,177 | 1,023,231,535 |
| Fidelity U.S. Bond Index Fund Class F | 551,303,177 | 108,889,455 | 12,744,281 | 7,172,760 | 655,666,606 |
| Total | $1,972,796,453 | $415,233,164 | $182,704,454 | $10,134,503 | $2,308,383,576 |
Investment Valuation
All investments are categorized as Level 1 under the Fair Value Hierarchy. The inputs or methodology used for valuing securities may not be an indication of the risk associated with investing in those securities. For more information on valuation inputs please refer to the Investment Valuation section in the accompanying Notes to Financial Statements.
See accompanying notes which are an integral part of the financial statements.
Fidelity Freedom® Index 2025 Fund
Financial Statements
Statement of Assets and Liabilities
| | | September 30, 2016 (Unaudited) |
| Assets | | |
| Investment in securities, at value (cost $2,003,027,017) — See accompanying schedule | | $2,308,383,576 |
| Cash | | 1 |
| Receivable for investments sold | | 6,876,494 |
| Receivable for fund shares sold | | 5,562,628 |
| Receivable from affiliate for expense reductions | | 73,729 |
| Total assets | | 2,320,896,428 |
| Liabilities | | |
| Payable for investments purchased | $11,504,594 | |
| Payable for fund shares redeemed | 934,524 | |
| Transfer agent fees payable | 239,688 | |
| Total liabilities | | 12,678,806 |
| Net Assets | | $2,308,217,622 |
| Net Assets consist of: | | |
| Paid in capital | | $2,014,565,821 |
| Undistributed net investment income | | 9,148,809 |
| Accumulated undistributed net realized gain (loss) on investments | | (20,853,567) |
| Net unrealized appreciation (depreciation) on investments | | 305,356,559 |
| Net Assets | | $2,308,217,622 |
| Investor Class: | | |
| Net Asset Value, offering price and redemption price per share ($1,213,540,134 ÷ 80,775,311 shares) | | $15.02 |
| Institutional Premium Class: | | |
| Net Asset Value, offering price and redemption price per share ($1,094,677,488 ÷ 72,850,537 shares) | | $15.03 |
See accompanying notes which are an integral part of the financial statements.
Statement of Operations
| | | Six months ended September 30, 2016 (Unaudited) |
| Investment Income | | |
| Income distributions from underlying funds | | $10,134,503 |
| Expenses | | |
| Transfer agent fees | $1,214,142 | |
| Independent trustees' fees and expenses | 4,656 | |
| Total expenses before reductions | 1,218,798 | |
| Expense reductions | (495,768) | 723,030 |
| Net investment income (loss) | | 9,411,473 |
| Realized and Unrealized Gain (Loss) | | |
| Realized gain (loss) on sale of underlying fund shares | (583,766) | |
| Capital gain distributions from underlying funds | 1,675,703 | |
| Total net realized gain (loss) | | 1,091,937 |
| Change in net unrealized appreciation (depreciation) on investment securities | | 103,646,741 |
| Net gain (loss) | | 104,738,678 |
| Net increase (decrease) in net assets resulting from operations | | $114,150,151 |
See accompanying notes which are an integral part of the financial statements.
Statement of Changes in Net Assets
| | Six months ended September 30, 2016 (Unaudited) | Year ended March 31, 2016 |
| Increase (Decrease) in Net Assets | | |
| Operations | | |
| Net investment income (loss) | $9,411,473 | $36,771,798 |
| Net realized gain (loss) | 1,091,937 | (2,193,994) |
| Change in net unrealized appreciation (depreciation) | 103,646,741 | (65,098,446) |
| Net increase (decrease) in net assets resulting from operations | 114,150,151 | (30,520,642) |
| Distributions to shareholders from net investment income | (3,133,672) | (35,093,602) |
| Distributions to shareholders from net realized gain | – | (385,553) |
| Total distributions | (3,133,672) | (35,479,155) |
| Share transactions - net increase (decrease) | 224,494,746 | 314,763,608 |
| Total increase (decrease) in net assets | 335,511,225 | 248,763,811 |
| Net Assets | | |
| Beginning of period | 1,972,706,397 | 1,723,942,586 |
| End of period | $2,308,217,622 | $1,972,706,397 |
| Other Information | | |
| Undistributed net investment income end of period | $9,148,809 | $2,871,008 |
See accompanying notes which are an integral part of the financial statements.
Financial Highlights — Fidelity Freedom Index 2025 Fund Investor Class
| | Six months ended (Unaudited) September 30, | Years ended March 31, | | | | |
| | 2016 | 2016 | 2015 | 2014 | 2013 | 2012 |
| Selected Per–Share Data | | | | | | |
| Net asset value, beginning of period | $14.27 | $14.80 | $14.36 | $12.99 | $12.21 | $12.22 |
| Income from Investment Operations | | | | | | |
| Net investment income (loss)A | .06 | .27 | .30 | .24 | .22 | .23 |
| Net realized and unrealized gain (loss) | .71 | (.52) | .65 | 1.15 | .80 | .11 |
| Total from investment operations | .77 | (.25) | .95 | 1.39 | 1.02 | .34 |
| Distributions from net investment income | (.02) | (.27) | (.48)B | (.01) | (.21) | (.19) |
| Distributions from net realized gain | – | –C | (.03)B | (.01) | (.04) | (.16) |
| Total distributions | (.02) | (.28)D | (.51) | (.02) | (.24)E | (.35) |
| Net asset value, end of period | $15.02 | $14.27 | $14.80 | $14.36 | $12.99 | $12.21 |
| Total ReturnF,G | 5.41% | (1.72)% | 6.73% | 10.75% | 8.50% | 3.03% |
| Ratios to Average Net AssetsH,I | | | | | | |
| Expenses before reductions | .15%J | .15% | .15% | .15% | .15% | .15% |
| Expenses net of fee waivers, if any | .09%J | .08% | .08% | .09% | .10% | .09% |
| Expenses net of all reductions | .09%J | .08% | .08% | .09% | .10% | .09% |
| Net investment income (loss) | .86%J | 1.84% | 2.03% | 1.78% | 1.82% | 1.97% |
| Supplemental Data | | | | | | |
| Net assets, end of period (000 omitted) | $1,213,540 | $1,179,785 | $1,723,943 | $1,347,992 | $969,395 | $537,405 |
| Portfolio turnover rateI | 17%J | 17% | 15% | 21% | 10% | 18% |
A Calculated based on average shares outstanding during the period.
B The amounts shown reflect certain reclassifications related to book to tax differences that were made in the year shown.
C Amount represents less than $.005 per share.
D Total distributions of $.28 per share is comprised of distributions from net investment income of $.272 and distributions from net realized gain of $.003 per share.
E Total distributions of $.24 per share is comprised of distributions from net investment income of $.205 and distributions from net realized gain of $.038 per share.
F Total returns for periods of less than one year are not annualized.
G Total returns would have been lower if certain expenses had not been reduced during the applicable periods shown.
H Expense ratios reflect operating expenses of the class. Expenses before reductions do not reflect amounts reimbursed by the investment adviser or reductions from expense offset arrangements and do not represent the amount paid by the class during periods when reimbursements or reductions occur. Expenses net of fee waivers reflect expenses after reimbursement by the investment adviser but prior to reductions from expense offset arrangements. Expenses net of all reductions represent the net expenses paid by the class.
I Amount does not include the portfolio activity of any Underlying Funds.
J Annualized
See accompanying notes which are an integral part of the financial statements.
Financial Highlights — Fidelity Freedom Index 2025 Fund Institutional Premium Class
| | Six months ended (Unaudited) September 30, | Years ended March 31, |
| | 2016 | 2016 A |
| Selected Per–Share Data | | |
| Net asset value, beginning of period | $14.27 | $15.00 |
| Income from Investment Operations | | |
| Net investment income (loss)B | .07 | .33 |
| Net realized and unrealized gain (loss) | .71 | (.79) |
| Total from investment operations | .78 | (.46) |
| Distributions from net investment income | (.02) | (.27) |
| Distributions from net realized gain | – | –C |
| Total distributions | (.02) | (.27) |
| Net asset value, end of period | $15.03 | $14.27 |
| Total ReturnD,E | 5.50% | (3.07)% |
| Ratios to Average Net AssetsF,G | | |
| Expenses before reductions | .07%H | .05%H |
| Expenses net of fee waivers, if any | .04%H | .02%H |
| Expenses net of all reductions | .04%H | .02%H |
| Net investment income (loss) | .91%H | 3.08%H |
| Supplemental Data | | |
| Net assets, end of period (000 omitted) | $1,094,677 | $792,922 |
| Portfolio turnover rateG | 17%H | 17% |
A For the period June 24, 2015 (commencement of sale of shares) to March 31, 2016.
B Calculated based on average shares outstanding during the period.
C Amount represents less than $.005 per share.
D Total returns for periods of less than one year are not annualized.
E Total returns would have been lower if certain expenses had not been reduced during the applicable periods shown.
F Expense ratios reflect operating expenses of the class. Expenses before reductions do not reflect amounts reimbursed by the investment adviser or reductions from expense offset arrangements and do not represent the amount paid by the class during periods when reimbursements or reductions occur. Expense ratios before reductions for start-up periods may not be representative of longer-term operating periods. Expenses net of fee waivers reflect expenses after reimbursement by the investment adviser but prior to reductions from expense offset arrangements. Expenses net of all reductions represent the net expenses paid by the class.
G Amount does not include the portfolio activity of any Underlying Funds.
H Annualized
See accompanying notes which are an integral part of the financial statements.
Fidelity Freedom® Index 2030 Fund
Investment Summary (Unaudited)
The information in the following tables is based on the direct investments of the Fund.
Top Holdings as of September 30, 2016
| | % of fund's net assets | % of fund's net assets 6 months ago |
| Fidelity Total Market Index Fund Class F | 54.6 | 55.3 |
| Fidelity Series Global ex U.S. Index Fund | 23.9 | 24.3 |
| Fidelity U.S. Bond Index Fund Class F | 19.4 | 18.4 |
| Fidelity Series Commodity Strategy Fund Class F | 1.3 | 1.3 |
| Fidelity Series Inflation-Protected Bond Index Fund Class F | 0.8 | 0.7 |
| | 100.0 | 100.0 |
Asset Allocation (% of fund's net assets)
| Period end |
| | Domestic Equity Funds | 54.6% |
| | Commodity Funds | 1.3% |
| | International Equity Funds | 23.9% |
| | Bond Funds | 19.4% |
| | Inflation-Protected Bond Funds | 0.8% |

| Six months ago |
| | Domestic Equity Funds | 55.3% |
| | Commodity Funds | 1.3% |
| | International Equity Funds | 24.3% |
| | Bond Funds | 18.4% |
| | Inflation-Protected Bond Funds | 0.7% |

Fidelity Freedom® Index 2030 Fund
Investments September 30, 2016 (Unaudited)
Showing Percentage of Net Assets
| Domestic Equity Funds - 54.6% | | | |
| | | Shares | Value |
| Fidelity Total Market Index Fund Class F (a) | | | |
| (Cost $1,183,135,839) | | 25,068,819 | 1,583,346,592 |
|
| Commodity Funds - 1.3% | | | |
| Fidelity Series Commodity Strategy Fund Class F (a)(b) | | | |
| (Cost $48,181,523) | | 7,128,967 | 38,139,973 |
|
| International Equity Funds - 23.9% | | | |
| Fidelity Series Global ex U.S. Index Fund (a) | | | |
| (Cost $685,281,979) | | 62,227,143 | 693,210,368 |
|
| Bond Funds - 19.4% | | | |
| Fidelity U.S. Bond Index Fund Class F (a) | | | |
| (Cost $547,535,065) | | 46,987,345 | 561,028,898 |
|
| Inflation-Protected Bond Funds - 0.8% | | | |
| Fidelity Series Inflation-Protected Bond Index Fund Class F (a) | | | |
| (Cost $23,002,556) | | 2,280,846 | 22,990,925 |
| TOTAL INVESTMENT PORTFOLIO - 100.0% | | | |
| (Cost $2,487,136,962) | | | 2,898,716,756 |
| NET OTHER ASSETS (LIABILITIES) - 0.0% | | | (213,177) |
| NET ASSETS - 100% | | | $2,898,503,579 |
Legend
(a) Affiliated Fund
(b) Non-income producing
Affiliated Underlying Funds
Information regarding the Fund's fiscal year to date purchases and sales of the affiliated Underlying Funds and income earned by the Fund from investments in affiliated Underlying Funds is as follows:
| Affiliate | Value, beginning of period | Purchases | Sales Proceeds | Dividend Income | Value, end of period |
| Fidelity Series Commodity Strategy Fund Class F | $32,252,771 | $5,428,901 | $2,320,987 | -- | $38,139,973 |
| Fidelity Series Global ex U.S. Index Fund | 602,068,590 | 80,801,002 | 34,674,039 | -- | 693,210,368 |
| Fidelity Series Inflation-Protected Bond Index Fund Class F | 17,196,324 | 5,595,695 | 201,487 | 23,318 | 22,990,925 |
| Fidelity Total Market Index Fund Class F | 1,372,593,954 | 159,947,991 | 44,954,390 | 4,272,327 | 1,583,346,592 |
| Fidelity U.S. Bond Index Fund Class F | 456,350,844 | 106,432,373 | 8,604,898 | 6,021,475 | 561,028,898 |
| Total | $2,480,462,483 | $358,205,962 | $90,755,801 | $10,317,120 | $2,898,716,756 |
Investment Valuation
All investments are categorized as Level 1 under the Fair Value Hierarchy. The inputs or methodology used for valuing securities may not be an indication of the risk associated with investing in those securities. For more information on valuation inputs please refer to the Investment Valuation section in the accompanying Notes to Financial Statements.
See accompanying notes which are an integral part of the financial statements.
Fidelity Freedom® Index 2030 Fund
Financial Statements
Statement of Assets and Liabilities
| | | September 30, 2016 (Unaudited) |
| Assets | | |
| Investment in securities, at value (cost $2,487,136,962) — See accompanying schedule | | $2,898,716,756 |
| Cash | | 1 |
| Receivable for investments sold | | 10,047,117 |
| Receivable for fund shares sold | | 4,902,941 |
| Receivable from affiliate for expense reductions | | 81,206 |
| Total assets | | 2,913,748,021 |
| Liabilities | | |
| Payable for investments purchased | $12,688,797 | |
| Payable for fund shares redeemed | 2,261,267 | |
| Transfer agent fees payable | 294,378 | |
| Total liabilities | | 15,244,442 |
| Net Assets | | $2,898,503,579 |
| Net Assets consist of: | | |
| Paid in capital | | $2,503,215,096 |
| Undistributed net investment income | | 9,098,875 |
| Accumulated undistributed net realized gain (loss) on investments | | (25,390,186) |
| Net unrealized appreciation (depreciation) on investments | | 411,579,794 |
| Net Assets | | $2,898,503,579 |
| Investor Class: | | |
| Net Asset Value, offering price and redemption price per share ($1,345,284,593 ÷ 87,512,249 shares) | | $15.37 |
| Institutional Premium Class: | | |
| Net Asset Value, offering price and redemption price per share ($1,553,218,986 ÷ 101,028,456 shares) | | $15.37 |
See accompanying notes which are an integral part of the financial statements.
Statement of Operations
| | | Six months ended September 30, 2016 (Unaudited) |
| Investment Income | | |
| Income distributions from underlying funds | | $10,317,120 |
| Expenses | | |
| Transfer agent fees | $1,460,556 | |
| Independent trustees' fees and expenses | 5,847 | |
| Total expenses before reductions | 1,466,403 | |
| Expense reductions | (592,317) | 874,086 |
| Net investment income (loss) | | 9,443,034 |
| Realized and Unrealized Gain (Loss) | | |
| Realized gain (loss) on sale of underlying fund shares | 359,785 | |
| Capital gain distributions from underlying funds | 2,564,002 | |
| Total net realized gain (loss) | | 2,923,787 |
| Change in net unrealized appreciation (depreciation) on investment securities | | 150,453,157 |
| Net gain (loss) | | 153,376,944 |
| Net increase (decrease) in net assets resulting from operations | | $162,819,978 |
See accompanying notes which are an integral part of the financial statements.
Statement of Changes in Net Assets
| | Six months ended September 30, 2016 (Unaudited) | Year ended March 31, 2016 |
| Increase (Decrease) in Net Assets | | |
| Operations | | |
| Net investment income (loss) | $9,443,034 | $47,979,197 |
| Net realized gain (loss) | 2,923,787 | 142,744 |
| Change in net unrealized appreciation (depreciation) | 150,453,157 | (104,899,956) |
| Net increase (decrease) in net assets resulting from operations | 162,819,978 | (56,778,015) |
| Distributions to shareholders from net investment income | (2,522,279) | (47,019,418) |
| Distributions to shareholders from net realized gain | – | (483,473) |
| Total distributions | (2,522,279) | (47,502,891) |
| Share transactions - net increase (decrease) | 257,840,885 | 359,969,928 |
| Total increase (decrease) in net assets | 418,138,584 | 255,689,022 |
| Net Assets | | |
| Beginning of period | 2,480,364,995 | 2,224,675,973 |
| End of period | $2,898,503,579 | $2,480,364,995 |
| Other Information | | |
| Undistributed net investment income end of period | $9,098,875 | $2,178,120 |
See accompanying notes which are an integral part of the financial statements.
Financial Highlights — Fidelity Freedom Index 2030 Fund Investor Class
| | Six months ended (Unaudited) September 30, | Years ended March 31, | | | | |
| | 2016 | 2016 | 2015 | 2014 | 2013 | 2012 |
| Selected Per–Share Data | | | | | | |
| Net asset value, beginning of period | $14.49 | $15.15 | $14.62 | $13.10 | $12.28 | $12.34 |
| Income from Investment Operations | | | | | | |
| Net investment income (loss)A | .05 | .26 | .30 | .25 | .24 | .24 |
| Net realized and unrealized gain (loss) | .84 | (.63) | .73 | 1.29 | .83 | .07 |
| Total from investment operations | .89 | (.37) | 1.03 | 1.54 | 1.07 | .31 |
| Distributions from net investment income | (.01) | (.29) | (.48) | (.01) | (.21) | (.20) |
| Distributions from net realized gain | – | –B | (.02) | (.01) | (.03) | (.16) |
| Total distributions | (.01) | (.29) | (.50) | (.02) | (.25)C | (.37)D |
| Net asset value, end of period | $15.37 | $14.49 | $15.15 | $14.62 | $13.10 | $12.28 |
| Total ReturnE,F | 6.18% | (2.44)% | 7.16% | 11.80% | 8.80% | 2.70% |
| Ratios to Average Net AssetsG,H | | | | | | |
| Expenses before reductions | .15%I | .15% | .15% | .15% | .15% | .15% |
| Expenses net of fee waivers, if any | .09%I | .08% | .08% | .08% | .10% | .09% |
| Expenses net of all reductions | .09%I | .08% | .08% | .08% | .10% | .09% |
| Net investment income (loss) | .68%I | 1.75% | 1.99% | 1.84% | 1.90% | 1.99% |
| Supplemental Data | | | | | | |
| Net assets, end of period (000 omitted) | $1,345,285 | $1,315,200 | $2,224,676 | $1,704,216 | $1,203,044 | $653,920 |
| Portfolio turnover rateH | 7%I | 13% | 12% | 32% | 10% | 18% |
A Calculated based on average shares outstanding during the period.
B Amount represents less than $.005 per share.
C Total distributions of $.25 per share is comprised of distributions from net investment income of $.211 and distributions from net realized gain of $.034 per share.
D Total distributions of $.37 per share is comprised of distributions from net investment income of $.203 and distributions from net realized gain of $.163 per share.
E Total returns for periods of less than one year are not annualized.
F Total returns would have been lower if certain expenses had not been reduced during the applicable periods shown.
G Expense ratios reflect operating expenses of the class. Expenses before reductions do not reflect amounts reimbursed by the investment adviser or reductions from expense offset arrangements and do not represent the amount paid by the class during periods when reimbursements or reductions occur. Expenses net of fee waivers reflect expenses after reimbursement by the investment adviser but prior to reductions from expense offset arrangements. Expenses net of all reductions represent the net expenses paid by the class.
H Amount does not include the portfolio activity of any Underlying Funds.
I Annualized
See accompanying notes which are an integral part of the financial statements.
Financial Highlights — Fidelity Freedom Index 2030 Fund Institutional Premium Class
| | Six months ended (Unaudited) September 30, | Years ended March 31, |
| | 2016 | 2016 A |
| Selected Per–Share Data | | |
| Net asset value, beginning of period | $14.49 | $15.44 |
| Income from Investment Operations | | |
| Net investment income (loss)B | .05 | .38 |
| Net realized and unrealized gain (loss) | .85 | (1.04) |
| Total from investment operations | .90 | (.66) |
| Distributions from net investment income | (.02) | (.29) |
| Distributions from net realized gain | – | –C |
| Total distributions | (.02) | (.29) |
| Net asset value, end of period | $15.37 | $14.49 |
| Total ReturnD,E | 6.18% | (4.28)% |
| Ratios to Average Net AssetsF,G | | |
| Expenses before reductions | .07%H | .05%H |
| Expenses net of fee waivers, if any | .04%H | .02%H |
| Expenses net of all reductions | .04%H | .02%H |
| Net investment income (loss) | .73%H | 3.54%H |
| Supplemental Data | | |
| Net assets, end of period (000 omitted) | $1,553,219 | $1,165,165 |
| Portfolio turnover rateG | 7%H | 13% |
A For the period June 24, 2015 (commencement of sale of shares) to March 31, 2016.
B Calculated based on average shares outstanding during the period.
C Amount represents less than $.005 per share.
D Total returns for periods of less than one year are not annualized.
E Total returns would have been lower if certain expenses had not been reduced during the applicable periods shown.
F Expense ratios reflect operating expenses of the class. Expenses before reductions do not reflect amounts reimbursed by the investment adviser or reductions from expense offset arrangements and do not represent the amount paid by the class during periods when reimbursements or reductions occur. Expense ratios before reductions for start-up periods may not be representative of longer-term operating periods. Expenses net of fee waivers reflect expenses after reimbursement by the investment adviser but prior to reductions from expense offset arrangements. Expenses net of all reductions represent the net expenses paid by the class.
G Amount does not include the portfolio activity of any Underlying Funds.
H Annualized
See accompanying notes which are an integral part of the financial statements.
Fidelity Freedom® Index 2035 Fund
Investment Summary (Unaudited)
The information in the following tables is based on the direct investments of the Fund.
Top Holdings as of September 30, 2016
| | % of fund's net assets | % of fund's net assets 6 months ago |
| Fidelity Total Market Index Fund Class F | 61.7 | 61.7 |
| Fidelity Series Global ex U.S. Index Fund | 27.0 | 27.0 |
| Fidelity U.S. Bond Index Fund Class F | 10.0 | 10.0 |
| Fidelity Series Commodity Strategy Fund Class F | 1.3 | 1.3 |
| | 100.0 | 100.0 |
Asset Allocation (% of fund's net assets)
| Period end |
| | Domestic Equity Funds | 61.7% |
| | Commodity Funds | 1.3% |
| | International Equity Funds | 27.0% |
| | Bond Funds | 10.0% |

| Six months ago |
| | Domestic Equity Funds | 61.7% |
| | Commodity Funds | 1.3% |
| | International Equity Funds | 27.0% |
| | Bond Funds | 10.0% |

Fidelity Freedom® Index 2035 Fund
Investments September 30, 2016 (Unaudited)
Showing Percentage of Net Assets
| Domestic Equity Funds - 61.7% | | | |
| | | Shares | Value |
| Fidelity Total Market Index Fund Class F (a) | | | |
| (Cost $805,627,200) | | 16,861,784 | 1,064,990,300 |
|
| Commodity Funds - 1.3% | | | |
| Fidelity Series Commodity Strategy Fund Class F (a)(b) | | | |
| (Cost $29,222,097) | | 4,380,034 | 23,433,180 |
|
| International Equity Funds - 27.0% | | | |
| Fidelity Series Global ex U.S. Index Fund (a) | | | |
| (Cost $460,028,348) | | 41,858,280 | 466,301,236 |
|
| Bond Funds - 10.0% | | | |
| Fidelity U.S. Bond Index Fund Class F (a) | | | |
| (Cost $168,079,023) | | 14,459,623 | 172,647,894 |
| TOTAL INVESTMENT PORTFOLIO - 100.0% | | | |
| (Cost $1,462,956,668) | | | 1,727,372,610 |
| NET OTHER ASSETS (LIABILITIES) - 0.0% | | | (132,446) |
| NET ASSETS - 100% | | | $1,727,240,164 |
Legend
(a) Affiliated Fund
(b) Non-income producing
Affiliated Underlying Funds
Information regarding the Fund's fiscal year to date purchases and sales of the affiliated Underlying Funds and income earned by the Fund from investments in affiliated Underlying Funds is as follows:
| Affiliate | Value, beginning of period | Purchases | Sales Proceeds | Dividend Income | Value, end of period |
| Fidelity Series Commodity Strategy Fund Class F | $19,326,332 | $3,992,889 | $1,559,659 | -- | $23,433,180 |
| Fidelity Series Global ex U.S. Index Fund | 394,680,096 | 58,919,494 | 17,401,439 | -- | 466,301,236 |
| Fidelity Total Market Index Fund Class F | 902,049,704 | 119,387,896 | 20,407,449 | 2,810,385 | 1,064,990,300 |
| Fidelity U.S. Bond Index Fund Class F | 146,079,513 | 28,462,478 | 4,075,680 | 1,904,575 | 172,647,894 |
| Total | $1,462,135,645 | $210,762,757 | $43,444,227 | $4,714,960 | $1,727,372,610 |
Investment Valuation
All investments are categorized as Level 1 under the Fair Value Hierarchy. The inputs or methodology used for valuing securities may not be an indication of the risk associated with investing in those securities. For more information on valuation inputs please refer to the Investment Valuation section in the accompanying Notes to Financial Statements.
See accompanying notes which are an integral part of the financial statements.
Fidelity Freedom® Index 2035 Fund
Financial Statements
Statement of Assets and Liabilities
| | | September 30, 2016 (Unaudited) |
| Assets | | |
| Investment in securities, at value (cost $1,462,956,668) — See accompanying schedule | | $1,727,372,610 |
| Cash | | 1 |
| Receivable for investments sold | | 4,487,208 |
| Receivable for fund shares sold | | 4,016,926 |
| Receivable from affiliate for expense reductions | | 48,103 |
| Total assets | | 1,735,924,848 |
| Liabilities | | |
| Payable for investments purchased | $7,540,891 | |
| Payable for fund shares redeemed | 963,244 | |
| Transfer agent fees payable | 180,549 | |
| Total liabilities | | 8,684,684 |
| Net Assets | | $1,727,240,164 |
| Net Assets consist of: | | |
| Paid in capital | | $1,476,348,723 |
| Undistributed net investment income | | 3,971,070 |
| Accumulated undistributed net realized gain (loss) on investments | | (17,495,571) |
| Net unrealized appreciation (depreciation) on investments | | 264,415,942 |
| Net Assets | | $1,727,240,164 |
| Investor Class: | | |
| Net Asset Value, offering price and redemption price per share ($924,195,713 ÷ 58,137,374 shares) | | $15.90 |
| Institutional Premium Class: | | |
| Net Asset Value, offering price and redemption price per share ($803,044,451 ÷ 50,494,862 shares) | | $15.90 |
See accompanying notes which are an integral part of the financial statements.
Statement of Operations
| | | Six months ended September 30, 2016 (Unaudited) |
| Investment Income | | |
| Income distributions from underlying funds | | $4,714,960 |
| Expenses | | |
| Transfer agent fees | $915,090 | |
| Independent trustees' fees and expenses | 3,472 | |
| Total expenses before reductions | 918,562 | |
| Expense reductions | (382,762) | 535,800 |
| Net investment income (loss) | | 4,179,160 |
| Realized and Unrealized Gain (Loss) | | |
| Realized gain (loss) on sale of underlying fund shares | (79,346) | |
| Capital gain distributions from underlying funds | 1,686,629 | |
| Total net realized gain (loss) | | 1,607,283 |
| Change in net unrealized appreciation (depreciation) on investment securities | | 98,012,547 |
| Net gain (loss) | | 99,619,830 |
| Net increase (decrease) in net assets resulting from operations | | $103,798,990 |
See accompanying notes which are an integral part of the financial statements.
Statement of Changes in Net Assets
| | Six months ended September 30, 2016 (Unaudited) | Year ended March 31, 2016 |
| Increase (Decrease) in Net Assets | | |
| Operations | | |
| Net investment income (loss) | $4,179,160 | $27,695,838 |
| Net realized gain (loss) | 1,607,283 | (1,700,313) |
| Change in net unrealized appreciation (depreciation) | 98,012,547 | (64,921,556) |
| Net increase (decrease) in net assets resulting from operations | 103,798,990 | (38,926,031) |
| Distributions to shareholders from net investment income | (684,902) | (27,390,419) |
| Distributions to shareholders from net realized gain | – | (272,315) |
| Total distributions | (684,902) | (27,662,734) |
| Share transactions - net increase (decrease) | 162,049,673 | 246,574,595 |
| Total increase (decrease) in net assets | 265,163,761 | 179,985,830 |
| Net Assets | | |
| Beginning of period | 1,462,076,403 | 1,282,090,573 |
| End of period | $1,727,240,164 | $1,462,076,403 |
| Other Information | | |
| Undistributed net investment income end of period | $3,971,070 | $476,812 |
See accompanying notes which are an integral part of the financial statements.
Financial Highlights — Fidelity Freedom Index 2035 Fund Investor Class
| | Six months ended (Unaudited) September 30, | Years ended March 31, | | | | |
| | 2016 | 2016 | 2015 | 2014 | 2013 | 2012 |
| Selected Per–Share Data | | | | | | |
| Net asset value, beginning of period | $14.91 | $15.67 | $15.11 | $13.32 | $12.40 | $12.54 |
| Income from Investment Operations | | | | | | |
| Net investment income (loss)A | .04 | .27 | .31 | .25 | .24 | .23 |
| Net realized and unrealized gain (loss) | .96 | (.73) | .77 | 1.55 | .91 | (.01) |
| Total from investment operations | 1.00 | (.46) | 1.08 | 1.80 | 1.15 | .22 |
| Distributions from net investment income | (.01) | (.30) | (.51) | (.01) | (.22) | (.19) |
| Distributions from net realized gain | – | –B | (.01) | –B | (.02) | (.17) |
| Total distributions | (.01) | (.30) | (.52) | (.01) | (.23)C | (.36) |
| Net asset value, end of period | $15.90 | $14.91 | $15.67 | $15.11 | $13.32 | $12.40 |
| Total ReturnD,E | 6.68% | (2.93)% | 7.25% | 13.56% | 9.44% | 2.00% |
| Ratios to Average Net AssetsF,G | | | | | | |
| Expenses before reductions | .15%H | .15% | .15% | .15% | .15% | .15% |
| Expenses net of fee waivers, if any | .09%H | .08% | .08% | .08% | .09% | .08% |
| Expenses net of all reductions | .09%H | .08% | .08% | .08% | .09% | .08% |
| Net investment income (loss) | .50%H | 1.79% | 2.02% | 1.79% | 1.91% | 1.93% |
| Supplemental Data | | | | | | |
| Net assets, end of period (000 omitted) | $924,196 | $880,845 | $1,282,091 | $1,000,962 | $689,033 | $357,382 |
| Portfolio turnover rateG | 5%H | 11% | 13% | 25% | 8% | 15% |
A Calculated based on average shares outstanding during the period.
B Amount represents less than $.005 per share.
C Total distributions of $.23 per share is comprised of distributions from net investment income of $.215 and distributions from net realized gain of $.019 per share.
D Total returns for periods of less than one year are not annualized.
E Total returns would have been lower if certain expenses had not been reduced during the applicable periods shown.
F Expense ratios reflect operating expenses of the class. Expenses before reductions do not reflect amounts reimbursed by the investment adviser or reductions from expense offset arrangements and do not represent the amount paid by the class during periods when reimbursements or reductions occur. Expenses net of fee waivers reflect expenses after reimbursement by the investment adviser but prior to reductions from expense offset arrangements. Expenses net of all reductions represent the net expenses paid by the class.
G Amount does not include the portfolio activity of any Underlying Funds.
H Annualized
See accompanying notes which are an integral part of the financial statements.
Financial Highlights — Fidelity Freedom Index 2035 Fund Institutional Premium Class
| | Six months ended (Unaudited) September 30, | Years ended March 31, |
| | 2016 | 2016 A |
| Selected Per–Share Data | | |
| Net asset value, beginning of period | $14.92 | $16.03 |
| Income from Investment Operations | | |
| Net investment income (loss)B | .04 | .39 |
| Net realized and unrealized gain (loss) | .95 | (1.20) |
| Total from investment operations | .99 | (.81) |
| Distributions from net investment income | (.01) | (.30) |
| Distributions from net realized gain | – | –C |
| Total distributions | (.01) | (.30) |
| Net asset value, end of period | $15.90 | $14.92 |
| Total ReturnD,E | 6.63% | (5.04)% |
| Ratios to Average Net AssetsF,G | | |
| Expenses before reductions | .07%H | .05%H |
| Expenses net of fee waivers, if any | .04%H | .01%H |
| Expenses net of all reductions | .04%H | .01%H |
| Net investment income (loss) | .56%H | 3.53%H |
| Supplemental Data | | |
| Net assets, end of period (000 omitted) | $803,044 | $581,231 |
| Portfolio turnover rateG | 5%H | 11% |
A For the period June 24, 2015 (commencement of sale of shares) to March 31, 2016.
B Calculated based on average shares outstanding during the period.
C Amount represents less than $.005 per share.
D Total returns for periods of less than one year are not annualized.
E Total returns would have been lower if certain expenses had not been reduced during the applicable periods shown.
F Expense ratios reflect operating expenses of the class. Expenses before reductions do not reflect amounts reimbursed by the investment adviser or reductions from expense offset arrangements and do not represent the amount paid by the class during periods when reimbursements or reductions occur. Expense ratios before reductions for start-up periods may not be representative of longer-term operating periods. Expenses net of fee waivers reflect expenses after reimbursement by the investment adviser but prior to reductions from expense offset arrangements. Expenses net of all reductions represent the net expenses paid by the class.
G Amount does not include the portfolio activity of any Underlying Funds.
H Annualized
See accompanying notes which are an integral part of the financial statements.
Fidelity Freedom® Index 2040 Fund
Investment Summary (Unaudited)
The information in the following tables is based on the direct investments of the Fund.
Top Holdings as of September 30, 2016
| | % of fund's net assets | % of fund's net assets 6 months ago |
| Fidelity Total Market Index Fund Class F | 61.7 | 61.7 |
| Fidelity Series Global ex U.S. Index Fund | 27.0 | 27.0 |
| Fidelity U.S. Bond Index Fund Class F | 10.0 | 10.0 |
| Fidelity Series Commodity Strategy Fund Class F | 1.3 | 1.3 |
| | 100.0 | 100.0 |
Asset Allocation (% of fund's net assets)
| Period end |
| | Domestic Equity Funds | 61.7% |
| | Commodity Funds | 1.3% |
| | International Equity Funds | 27.0% |
| | Bond Funds | 10.0% |

| Six months ago |
| | Domestic Equity Funds | 61.7% |
| | Commodity Funds | 1.3% |
| | International Equity Funds | 27.0% |
| | Bond Funds | 10.0% |

Fidelity Freedom® Index 2040 Fund
Investments September 30, 2016 (Unaudited)
Showing Percentage of Net Assets
| Domestic Equity Funds - 61.7% | | | |
| | | Shares | Value |
| Fidelity Total Market Index Fund Class F (a) | | | |
| (Cost $945,753,677) | | 19,824,112 | 1,252,090,906 |
|
| Commodity Funds - 1.3% | | | |
| Fidelity Series Commodity Strategy Fund Class F (a)(b) | | | |
| (Cost $34,280,914) | | 5,149,717 | 27,550,988 |
|
| International Equity Funds - 27.0% | | | |
| Fidelity Series Global ex U.S. Index Fund (a) | | | |
| (Cost $540,356,923) | | 49,202,748 | 548,118,609 |
|
| Bond Funds - 10.0% | | | |
| Fidelity U.S. Bond Index Fund Class F (a) | | | |
| (Cost $197,924,013) | | 16,993,753 | 202,905,411 |
| TOTAL INVESTMENT PORTFOLIO - 100.0% | | | |
| (Cost $1,718,315,527) | | | 2,030,665,914 |
| NET OTHER ASSETS (LIABILITIES) - 0.0% | | | (149,617) |
| NET ASSETS - 100% | | | $2,030,516,297 |
Legend
(a) Affiliated Fund
(b) Non-income producing
Affiliated Underlying Funds
Information regarding the Fund's fiscal year to date purchases and sales of the affiliated Underlying Funds and income earned by the Fund from investments in affiliated Underlying Funds is as follows:
| Affiliate | Value, beginning of period | Purchases | Sales Proceeds | Dividend Income | Value, end of period |
| Fidelity Series Commodity Strategy Fund Class F | $23,041,158 | $4,358,186 | $1,864,285 | -- | $27,550,988 |
| Fidelity Series Global ex U.S. Index Fund | 469,950,623 | 59,566,109 | 16,828,879 | -- | 548,118,609 |
| Fidelity Total Market Index Fund Class F | 1,074,101,494 | 126,446,860 | 24,110,110 | 3,346,660 | 1,252,090,906 |
| Fidelity U.S. Bond Index Fund Class F | 173,943,568 | 31,235,175 | 4,867,271 | 2,254,190 | 202,905,411 |
| Total | $1,741,036,843 | $221,606,330 | $47,670,545 | $5,600,850 | $2,030,665,914 |
Investment Valuation
All investments are categorized as Level 1 under the Fair Value Hierarchy. The inputs or methodology used for valuing securities may not be an indication of the risk associated with investing in those securities. For more information on valuation inputs please refer to the Investment Valuation section in the accompanying Notes to Financial Statements.
See accompanying notes which are an integral part of the financial statements.
Fidelity Freedom® Index 2040 Fund
Financial Statements
Statement of Assets and Liabilities
| | | September 30, 2016 (Unaudited) |
| Assets | | |
| Investment in securities, at value (cost $1,718,315,527) — See accompanying schedule | | $2,030,665,914 |
| Cash | | 3 |
| Receivable for investments sold | | 5,379,914 |
| Receivable for fund shares sold | | 4,300,406 |
| Receivable from affiliate for expense reductions | | 56,558 |
| Total assets | | 2,040,402,795 |
| Liabilities | | |
| Payable for investments purchased | $8,792,789 | |
| Payable for fund shares redeemed | 887,527 | |
| Transfer agent fees payable | 206,182 | |
| Total liabilities | | 9,886,498 |
| Net Assets | | $2,030,516,297 |
| Net Assets consist of: | | |
| Paid in capital | | $1,729,937,890 |
| Undistributed net investment income | | 4,761,163 |
| Accumulated undistributed net realized gain (loss) on investments | | (16,533,143) |
| Net unrealized appreciation (depreciation) on investments | | 312,350,387 |
| Net Assets | | $2,030,516,297 |
| Investor Class: | | |
| Net Asset Value, offering price and redemption price per share ($941,725,037 ÷ 58,876,153 shares) | | $16.00 |
| Institutional Premium Class: | | |
| Net Asset Value, offering price and redemption price per share ($1,088,791,260 ÷ 68,077,679 shares) | | $15.99 |
See accompanying notes which are an integral part of the financial statements.
Statement of Operations
| | | Six months ended September 30, 2016 (Unaudited) |
| Investment Income | | |
| Income distributions from underlying funds | | $5,600,850 |
| Expenses | | |
| Transfer agent fees | $1,026,293 | |
| Independent trustees' fees and expenses | 4,117 | |
| Total expenses before reductions | 1,030,410 | |
| Expense reductions | (436,014) | 594,396 |
| Net investment income (loss) | | 5,006,454 |
| Realized and Unrealized Gain (Loss) | | |
| Realized gain (loss) on sale of underlying fund shares | (1,042,478) | |
| Capital gain distributions from underlying funds | 2,008,470 | |
| Total net realized gain (loss) | | 965,992 |
| Change in net unrealized appreciation (depreciation) on investment securities | | 116,742,812 |
| Net gain (loss) | | 117,708,804 |
| Net increase (decrease) in net assets resulting from operations | | $122,715,258 |
See accompanying notes which are an integral part of the financial statements.
Statement of Changes in Net Assets
| | Six months ended September 30, 2016 (Unaudited) | Year ended March 31, 2016 |
| Increase (Decrease) in Net Assets | | |
| Operations | | |
| Net investment income (loss) | $5,006,454 | $33,202,212 |
| Net realized gain (loss) | 965,992 | 1,529,561 |
| Change in net unrealized appreciation (depreciation) | 116,742,812 | (80,044,847) |
| Net increase (decrease) in net assets resulting from operations | 122,715,258 | (45,313,074) |
| Distributions to shareholders from net investment income | (829,932) | (32,817,764) |
| Distributions to shareholders from net realized gain | – | (324,545) |
| Total distributions | (829,932) | (33,142,309) |
| Share transactions - net increase (decrease) | 167,657,953 | 308,129,916 |
| Total increase (decrease) in net assets | 289,543,279 | 229,674,533 |
| Net Assets | | |
| Beginning of period | 1,740,973,018 | 1,511,298,485 |
| End of period | $2,030,516,297 | $1,740,973,018 |
| Other Information | | |
| Undistributed net investment income end of period | $4,761,163 | $584,641 |
See accompanying notes which are an integral part of the financial statements.
Financial Highlights — Fidelity Freedom Index 2040 Fund Investor Class
| | Six months ended (Unaudited) September 30, | Years ended March 31, | | | | |
| | 2016 | 2016 | 2015 | 2014 | 2013 | 2012 |
| Selected Per–Share Data | | | | | | |
| Net asset value, beginning of period | $15.00 | $15.76 | $15.18 | $13.36 | $12.42 | $12.58 |
| Income from Investment Operations | | | | | | |
| Net investment income (loss)A | .04 | .26 | .31 | .25 | .24 | .23 |
| Net realized and unrealized gain (loss) | .97 | (.72) | .78 | 1.58 | .93 | (.02) |
| Total from investment operations | 1.01 | (.46) | 1.09 | 1.83 | 1.17 | .21 |
| Distributions from net investment income | (.01) | (.30) | (.50) | (.01) | (.21) | (.20) |
| Distributions from net realized gain | – | –B | –B | –B | (.02) | (.17) |
| Total distributions | (.01) | (.30) | (.51)C | (.01) | (.23) | (.37) |
| Net asset value, end of period | $16.00 | $15.00 | $15.76 | $15.18 | $13.36 | $12.42 |
| Total ReturnD,E | 6.71% | (2.91)% | 7.27% | 13.72% | 9.59% | 1.92% |
| Ratios to Average Net AssetsF,G | | | | | | |
| Expenses before reductions | .15%H | .15% | .15% | .15% | .15% | .15% |
| Expenses net of fee waivers, if any | .09%H | .08% | .08% | .08% | .09% | .08% |
| Expenses net of all reductions | .09%H | .08% | .08% | .08% | .09% | .08% |
| Net investment income (loss) | .50%H | 1.70% | 1.99% | 1.78% | 1.93% | 1.91% |
| Supplemental Data | | | | | | |
| Net assets, end of period (000 omitted) | $941,725 | $910,880 | $1,511,298 | $1,179,249 | $810,449 | $409,300 |
| Portfolio turnover rateG | 5%H | 9% | 12% | 26% | 8% | 16% |
A Calculated based on average shares outstanding during the period.
B Amount represents less than $.005 per share.
C Total distributions of $.51 per share is comprised of distributions from net investment income of $.502 and distributions from net realized gain of $.003 per share.
D Total returns for periods of less than one year are not annualized.
E Total returns would have been lower if certain expenses had not been reduced during the applicable periods shown.
F Expense ratios reflect operating expenses of the class. Expenses before reductions do not reflect amounts reimbursed by the investment adviser or reductions from expense offset arrangements and do not represent the amount paid by the class during periods when reimbursements or reductions occur. Expenses net of fee waivers reflect expenses after reimbursement by the investment adviser but prior to reductions from expense offset arrangements. Expenses net of all reductions represent the net expenses paid by the class.
G Amount does not include the portfolio activity of any Underlying Funds.
H Annualized
See accompanying notes which are an integral part of the financial statements.
Financial Highlights — Fidelity Freedom Index 2040 Fund Institutional Premium Class
| | Six months ended (Unaudited) September 30, | Years ended March 31, |
| | 2016 | 2016 A |
| Selected Per–Share Data | | |
| Net asset value, beginning of period | $15.00 | $16.12 |
| Income from Investment Operations | | |
| Net investment income (loss)B | .04 | .41 |
| Net realized and unrealized gain (loss) | .96 | (1.22) |
| Total from investment operations | 1.00 | (.81) |
| Distributions from net investment income | (.01) | (.30) |
| Distributions from net realized gain | – | –C |
| Total distributions | (.01) | (.31)D |
| Net asset value, end of period | $15.99 | $15.00 |
| Total ReturnE,F | 6.66% | (5.06)% |
| Ratios to Average Net AssetsG,H | | |
| Expenses before reductions | .07%I | .05%I |
| Expenses net of fee waivers, if any | .04%I | .01%I |
| Expenses net of all reductions | .04%I | .01%I |
| Net investment income (loss) | .56%I | 3.69%I |
| Supplemental Data | | |
| Net assets, end of period (000 omitted) | $1,088,791 | $830,093 |
| Portfolio turnover rateH | 5%I | 9% |
A For the period June 24, 2015 (commencement of sale of shares) to March 31, 2016.
B Calculated based on average shares outstanding during the period.
C Amount represents less than $.005 per share.
D Total distributions of $.31 per share is comprised of distributions from net investment income of $.309 and distributions from net realized gain of $003 per share.
E Total returns for periods of less than one year are not annualized.
F Total returns would have been lower if certain expenses had not been reduced during the applicable periods shown.
G Expense ratios reflect operating expenses of the class. Expenses before reductions do not reflect amounts reimbursed by the investment adviser or reductions from expense offset arrangements and do not represent the amount paid by the class during periods when reimbursements or reductions occur. Expense ratios before reductions for start-up periods may not be representative of longer-term operating periods. Expenses net of fee waivers reflect expenses after reimbursement by the investment adviser but prior to reductions from expense offset arrangements. Expenses net of all reductions represent the net expenses paid by the class.
H Amount does not include the portfolio activity of any Underlying Funds.
I Annualized
See accompanying notes which are an integral part of the financial statements.
Fidelity Freedom® Index 2045 Fund
Investment Summary (Unaudited)
The information in the following tables is based on the direct investments of the Fund.
Top Holdings as of September 30, 2016
| | % of fund's net assets | % of fund's net assets 6 months ago |
| Fidelity Total Market Index Fund Class F | 61.6 | 61.7 |
| Fidelity Series Global ex U.S. Index Fund | 27.0 | 27.0 |
| Fidelity U.S. Bond Index Fund Class F | 10.0 | 10.0 |
| Fidelity Series Commodity Strategy Fund Class F | 1.4 | 1.3 |
| | 100.0 | 100.0 |
Asset Allocation (% of fund's net assets)
| Period end |
| | Domestic Equity Funds | 61.6% |
| | Commodity Funds | 1.4% |
| | International Equity Funds | 27.0% |
| | Bond Funds | 10.0% |

| Six months ago |
| | Domestic Equity Funds | 61.7% |
| | Commodity Funds | 1.3% |
| | International Equity Funds | 27.0% |
| | Bond Funds | 10.0% |

Fidelity Freedom® Index 2045 Fund
Investments September 30, 2016 (Unaudited)
Showing Percentage of Net Assets
| Domestic Equity Funds - 61.6% | | | |
| | | Shares | Value |
| Fidelity Total Market Index Fund Class F (a) | | | |
| (Cost $542,976,007) | | 10,998,480 | 694,663,986 |
|
| Commodity Funds - 1.4% | | | |
| Fidelity Series Commodity Strategy Fund Class F (a)(b) | | | |
| (Cost $18,774,619) | | 2,855,624 | 15,277,587 |
|
| International Equity Funds - 27.0% | | | |
| Fidelity Series Global ex U.S. Index Fund (a) | | | |
| (Cost $300,197,638) | | 27,308,809 | 304,220,133 |
|
| Bond Funds - 10.0% | | | |
| Fidelity U.S. Bond Index Fund Class F (a) | | | |
| (Cost $110,244,655) | | 9,435,543 | 112,660,380 |
| TOTAL INVESTMENT PORTFOLIO - 100.0% | | | |
| (Cost $972,192,919) | | | 1,126,822,086 |
| NET OTHER ASSETS (LIABILITIES) - 0.0% | | | (85,068) |
| NET ASSETS - 100% | | | $1,126,737,018 |
Legend
(a) Affiliated Fund
(b) Non-income producing
Affiliated Underlying Funds
Information regarding the Fund's fiscal year to date purchases and sales of the affiliated Underlying Funds and income earned by the Fund from investments in affiliated Underlying Funds is as follows:
| Affiliate | Value, beginning of period | Purchases | Sales Proceeds | Dividend Income | Value, end of period |
| Fidelity Series Commodity Strategy Fund Class F�� | $12,366,948 | $2,886,940 | $1,054,611 | -- | $15,277,587 |
| Fidelity Series Global ex U.S. Index Fund | 250,889,400 | 44,692,969 | 10,946,379 | -- | 304,220,133 |
| Fidelity Total Market Index Fund Class F | 573,463,948 | 90,795,395 | 10,862,058 | 1,798,619 | 694,663,986 |
| Fidelity U.S. Bond Index Fund Class F | 92,874,151 | 20,686,616 | 2,295,778 | 1,226,773 | 112,660,380 |
| Total | $929,594,447 | $159,061,920 | $25,158,826 | $3,025,392 | $1,126,822,086 |
Investment Valuation
All investments are categorized as Level 1 under the Fair Value Hierarchy. The inputs or methodology used for valuing securities may not be an indication of the risk associated with investing in those securities. For more information on valuation inputs please refer to the Investment Valuation section in the accompanying Notes to Financial Statements.
See accompanying notes which are an integral part of the financial statements.
Fidelity Freedom® Index 2045 Fund
Financial Statements
Statement of Assets and Liabilities
| | | September 30, 2016 (Unaudited) |
| Assets | | |
| Investment in securities, at value (cost $972,192,919) — See accompanying schedule | | $1,126,822,086 |
| Cash | | 1 |
| Receivable for investments sold | | 2,697,232 |
| Receivable for fund shares sold | | 3,141,095 |
| Receivable from affiliate for expense reductions | | 31,290 |
| Total assets | | 1,132,691,704 |
| Liabilities | | |
| Payable for investments purchased | $5,396,564 | |
| Payable for fund shares redeemed | 441,764 | |
| Transfer agent fees payable | 116,358 | |
| Total liabilities | | 5,954,686 |
| Net Assets | | $1,126,737,018 |
| Net Assets consist of: | | |
| Paid in capital | | $977,855,065 |
| Undistributed net investment income | | 2,576,886 |
| Accumulated undistributed net realized gain (loss) on investments | | (8,324,100) |
| Net unrealized appreciation (depreciation) on investments | | 154,629,167 |
| Net Assets | | $1,126,737,018 |
| Investor Class: | | |
| Net Asset Value, offering price and redemption price per share ($577,691,922 ÷ 35,817,811 shares) | | $16.13 |
| Institutional Premium Class: | | |
| Net Asset Value, offering price and redemption price per share ($549,045,096 ÷ 34,029,509 shares) | | $16.13 |
See accompanying notes which are an integral part of the financial statements.
Statement of Operations
| | | Six months ended September 30, 2016 (Unaudited) |
| Investment Income | | |
| Income distributions from underlying funds | | $3,025,392 |
| Expenses | | |
| Transfer agent fees | $582,982 | |
| Independent trustees' fees and expenses | 2,227 | |
| Total expenses before reductions | 585,209 | |
| Expense reductions | (244,284) | 340,925 |
| Net investment income (loss) | | 2,684,467 |
| Realized and Unrealized Gain (Loss) | | |
| Realized gain (loss) on sale of underlying fund shares | (1,258,170) | |
| Capital gain distributions from underlying funds | 1,079,426 | |
| Total net realized gain (loss) | | (178,744) |
| Change in net unrealized appreciation (depreciation) on investment securities | | 64,594,190 |
| Net gain (loss) | | 64,415,446 |
| Net increase (decrease) in net assets resulting from operations | | $67,099,913 |
See accompanying notes which are an integral part of the financial statements.
Statement of Changes in Net Assets
| | Six months ended September 30, 2016 (Unaudited) | Year ended March 31, 2016 |
| Increase (Decrease) in Net Assets | | |
| Operations | | |
| Net investment income (loss) | $2,684,467 | $17,217,213 |
| Net realized gain (loss) | (178,744) | 948,334 |
| Change in net unrealized appreciation (depreciation) | 64,594,190 | (40,423,079) |
| Net increase (decrease) in net assets resulting from operations | 67,099,913 | (22,257,532) |
| Distributions to shareholders from net investment income | (433,356) | (16,988,085) |
| Distributions to shareholders from net realized gain | – | (168,117) |
| Total distributions | (433,356) | (17,156,202) |
| Share transactions - net increase (decrease) | 130,512,708 | 218,641,371 |
| Total increase (decrease) in net assets | 197,179,265 | 179,227,637 |
| Net Assets | | |
| Beginning of period | 929,557,753 | 750,330,116 |
| End of period | $1,126,737,018 | $929,557,753 |
| Other Information | | |
| Undistributed net investment income end of period | $2,576,886 | $325,775 |
See accompanying notes which are an integral part of the financial statements.
Financial Highlights — Fidelity Freedom Index 2045 Fund Investor Class
| | Six months ended (Unaudited) September 30, | Years ended March 31, | | | | |
| | 2016 | 2016 | 2015 | 2014 | 2013 | 2012 |
| Selected Per–Share Data | | | | | | |
| Net asset value, beginning of period | $15.13 | $15.89 | $15.32 | $13.44 | $12.47 | $12.63 |
| Income from Investment Operations | | | | | | |
| Net investment income (loss)A | .04 | .28 | .32 | .25 | .25 | .23 |
| Net realized and unrealized gain (loss) | .97 | (.74) | .77 | 1.64 | .95 | (.04) |
| Total from investment operations | 1.01 | (.46) | 1.09 | 1.89 | 1.20 | .19 |
| Distributions from net investment income | (.01) | (.30) | (.51) | (.01) | (.21) | (.19) |
| Distributions from net realized gain | – | –B | (.01) | –B | (.02) | (.16) |
| Total distributions | (.01) | (.30) | (.52) | (.01) | (.23) | (.35) |
| Net asset value, end of period | $16.13 | $15.13 | $15.89 | $15.32 | $13.44 | $12.47 |
| Total ReturnC,D | 6.65% | (2.88)% | 7.22% | 14.07% | 9.76% | 1.74% |
| Ratios to Average Net AssetsE,F | | | | | | |
| Expenses before reductions | .15%G | .15% | .15% | .15% | .15% | .15% |
| Expenses net of fee waivers, if any | .09%G | .08% | .08% | .08% | .09% | .09% |
| Expenses net of all reductions | .09%G | .08% | .08% | .08% | .09% | .09% |
| Net investment income (loss) | .50%G | 1.79% | 2.04% | 1.75% | 1.95% | 1.94% |
| Supplemental Data | | | | | | |
| Net assets, end of period (000 omitted) | $577,692 | $542,581 | $750,330 | $577,603 | $380,466 | $178,881 |
| Portfolio turnover rateF | 5%G | 8% | 12% | 22% | 7% | 15% |
A Calculated based on average shares outstanding during the period.
B Amount represents less than $.005 per share.
C Total returns for periods of less than one year are not annualized.
D Total returns would have been lower if certain expenses had not been reduced during the applicable periods shown.
E Expense ratios reflect operating expenses of the class. Expenses before reductions do not reflect amounts reimbursed by the investment adviser or reductions from expense offset arrangements and do not represent the amount paid by the class during periods when reimbursements or reductions occur. Expenses net of fee waivers reflect expenses after reimbursement by the investment adviser but prior to reductions from expense offset arrangements. Expenses net of all reductions represent the net expenses paid by the class.
F Amount does not include the portfolio activity of any Underlying Funds.
G Annualized
See accompanying notes which are an integral part of the financial statements.
Financial Highlights — Fidelity Freedom Index 2045 Fund Institutional Premium Class
| | Six months ended (Unaudited) September 30, | Years ended March 31, |
| | 2016 | 2016 A |
| Selected Per–Share Data | | |
| Net asset value, beginning of period | $15.13 | $16.26 |
| Income from Investment Operations | | |
| Net investment income (loss)B | .04 | .40 |
| Net realized and unrealized gain (loss) | .97 | (1.22) |
| Total from investment operations | 1.01 | (.82) |
| Distributions from net investment income | (.01) | (.30) |
| Distributions from net realized gain | – | –C |
| Total distributions | (.01) | (.31)D |
| Net asset value, end of period | $16.13 | $15.13 |
| Total ReturnE,F | 6.67% | (5.08)% |
| Ratios to Average Net AssetsG,H | | |
| Expenses before reductions | .07%I | .05%I |
| Expenses net of fee waivers, if any | .04%I | .01%I |
| Expenses net of all reductions | .04%I | .01%I |
| Net investment income (loss) | .55%I | 3.56%I |
| Supplemental Data | | |
| Net assets, end of period (000 omitted) | $549,045 | $386,977 |
| Portfolio turnover rateH | 5%I | 8% |
A For the period June 24, 2015 (commencement of sale of shares) to March 31, 2016.
B Calculated based on average shares outstanding during the period.
C Amount represents less than $.005 per share.
D Total distributions of $.31 per share is comprised of distributions from net investment income of $.303 and distributions from net realized gain of $.003 per share.
E Total returns for periods of less than one year are not annualized.
F Total returns would have been lower if certain expenses had not been reduced during the applicable periods shown.
G Expense ratios reflect operating expenses of the class. Expenses before reductions do not reflect amounts reimbursed by the investment adviser or reductions from expense offset arrangements and do not represent the amount paid by the class during periods when reimbursements or reductions occur. Expense ratios before reductions for start-up periods may not be representative of longer-term operating periods. Expenses net of fee waivers reflect expenses after reimbursement by the investment adviser but prior to reductions from expense offset arrangements. Expenses net of all reductions represent the net expenses paid by the class.
H Amount does not include the portfolio activity of any Underlying Funds.
I Annualized
See accompanying notes which are an integral part of the financial statements.
Fidelity Freedom® Index 2050 Fund
Investment Summary (Unaudited)
The information in the following tables is based on the direct investments of the Fund.
Top Holdings as of September 30, 2016
| | % of fund's net assets | % of fund's net assets 6 months ago |
| Fidelity Total Market Index Fund Class F | 61.6 | 61.7 |
| Fidelity Series Global ex U.S. Index Fund | 27.0 | 27.0 |
| Fidelity U.S. Bond Index Fund Class F | 10.0 | 10.0 |
| Fidelity Series Commodity Strategy Fund Class F | 1.4 | 1.3 |
| | 100.0 | 100.0 |
Asset Allocation (% of fund's net assets)
| Period end |
| | Domestic Equity Funds | 61.6% |
| | Commodity Funds | 1.4% |
| | International Equity Funds | 27.0% |
| | Bond Funds | 10.0% |

| Six months ago |
| | Domestic Equity Funds | 61.7% |
| | Commodity Funds | 1.3% |
| | International Equity Funds | 27.0% |
| | Bond Funds | 10.0% |

Fidelity Freedom® Index 2050 Fund
Investments September 30, 2016 (Unaudited)
Showing Percentage of Net Assets
| Domestic Equity Funds - 61.6% | | | |
| | | Shares | Value |
| Fidelity Total Market Index Fund Class F (a) | | | |
| (Cost $543,921,349) | | 10,793,563 | 681,721,445 |
|
| Commodity Funds - 1.4% | | | |
| Fidelity Series Commodity Strategy Fund Class F (a)(b) | | | |
| (Cost $18,359,708) | | 2,802,506 | 14,993,409 |
|
| International Equity Funds - 27.0% | | | |
| Fidelity Series Global ex U.S. Index Fund (a) | | | |
| (Cost $295,694,554) | | 26,800,001 | 298,552,009 |
|
| Bond Funds - 10.0% | | | |
| Fidelity U.S. Bond Index Fund Class F (a) | | | |
| (Cost $108,383,752) | | 9,259,735 | 110,561,238 |
| TOTAL INVESTMENT PORTFOLIO - 100.0% | | | |
| (Cost $966,359,363) | | | 1,105,828,101 |
| NET OTHER ASSETS (LIABILITIES) - 0.0% | | | (81,709) |
| NET ASSETS - 100% | | | $1,105,746,392 |
Legend
(a) Affiliated Fund
(b) Non-income producing
Affiliated Underlying Funds
Information regarding the Fund's fiscal year to date purchases and sales of the affiliated Underlying Funds and income earned by the Fund from investments in affiliated Underlying Funds is as follows:
| Affiliate | Value, beginning of period | Purchases | Sales Proceeds | Dividend Income | Value, end of period |
| Fidelity Series Commodity Strategy Fund Class F | $12,176,215 | $2,681,815 | $930,668 | -- | $14,993,409 |
| Fidelity Series Global ex U.S. Index Fund | 248,737,255 | 40,383,917 | 9,658,718 | -- | 298,552,009 |
| Fidelity Total Market Index Fund Class F | 568,490,468 | 82,928,945 | 10,218,847 | 1,779,163 | 681,721,445 |
| Fidelity U.S. Bond Index Fund Class F | 92,061,871 | 19,471,091 | 2,358,743 | 1,210,776 | 110,561,238 |
| Total | $921,465,809 | $145,465,768 | $23,166,976 | $2,989,939 | $1,105,828,101 |
Investment Valuation
All investments are categorized as Level 1 under the Fair Value Hierarchy. The inputs or methodology used for valuing securities may not be an indication of the risk associated with investing in those securities. For more information on valuation inputs please refer to the Investment Valuation section in the accompanying Notes to Financial Statements.
See accompanying notes which are an integral part of the financial statements.
Fidelity Freedom® Index 2050 Fund
Financial Statements
Statement of Assets and Liabilities
| | | September 30, 2016 (Unaudited) |
| Assets | | |
| Investment in securities, at value (cost $966,359,363) — See accompanying schedule | | $1,105,828,101 |
| Cash | | 2 |
| Receivable for investments sold | | 2,656,519 |
| Receivable for fund shares sold | | 2,860,556 |
| Receivable from affiliate for expense reductions | | 30,714 |
| Total assets | | 1,111,375,892 |
| Liabilities | | |
| Payable for investments purchased | $5,266,157 | |
| Payable for fund shares redeemed | 250,921 | |
| Transfer agent fees payable | 112,422 | |
| Total liabilities | | 5,629,500 |
| Net Assets | | $1,105,746,392 |
| Net Assets consist of: | | |
| Paid in capital | | $970,474,586 |
| Undistributed net investment income | | 2,560,689 |
| Accumulated undistributed net realized gain (loss) on investments | | (6,757,621) |
| Net unrealized appreciation (depreciation) on investments | | 139,468,738 |
| Net Assets | | $1,105,746,392 |
| Investor Class: | | |
| Net Asset Value, offering price and redemption price per share ($523,359,441 ÷ 32,214,493 shares) | | $16.25 |
| Institutional Premium Class: | | |
| Net Asset Value, offering price and redemption price per share ($582,386,951 ÷ 35,851,000 shares) | | $16.24 |
See accompanying notes which are an integral part of the financial statements.
Statement of Operations
| | | Six months ended September 30, 2016 (Unaudited) |
| Investment Income | | |
| Income distributions from underlying funds | | $2,989,939 |
| Expenses | | |
| Transfer agent fees | $556,675 | |
| Independent trustees' fees and expenses | 2,200 | |
| Total expenses before reductions | 558,875 | |
| Expense reductions | (235,440) | 323,435 |
| Net investment income (loss) | | 2,666,504 |
| Realized and Unrealized Gain (Loss) | | |
| Realized gain (loss) on sale of underlying fund shares | (1,302,328) | |
| Capital gain distributions from underlying funds | 1,067,750 | |
| Total net realized gain (loss) | | (234,578) |
| Change in net unrealized appreciation (depreciation) on investment securities | | 63,376,614 |
| Net gain (loss) | | 63,142,036 |
| Net increase (decrease) in net assets resulting from operations | | $65,808,540 |
See accompanying notes which are an integral part of the financial statements.
Statement of Changes in Net Assets
| | Six months ended September 30, 2016 (Unaudited) | Year ended March 31, 2016 |
| Increase (Decrease) in Net Assets | | |
| Operations | | |
| Net investment income (loss) | $2,666,504 | $16,911,206 |
| Net realized gain (loss) | (234,578) | 1,359,871 |
| Change in net unrealized appreciation (depreciation) | 63,376,614 | (39,140,916) |
| Net increase (decrease) in net assets resulting from operations | 65,808,540 | (20,869,839) |
| Distributions to shareholders from net investment income | (433,038) | (16,694,489) |
| Distributions to shareholders from net realized gain | – | (164,234) |
| Total distributions | (433,038) | (16,858,723) |
| Share transactions - net increase (decrease) | 118,938,789 | 229,522,028 |
| Total increase (decrease) in net assets | 184,314,291 | 191,793,466 |
| Net Assets | | |
| Beginning of period | 921,432,101 | 729,638,635 |
| End of period | $1,105,746,392 | $921,432,101 |
| Other Information | | |
| Undistributed net investment income end of period | $2,560,689 | $327,223 |
See accompanying notes which are an integral part of the financial statements.
Financial Highlights — Fidelity Freedom Index 2050 Fund Investor Class
| | Six months ended (Unaudited) September 30, | Years ended March 31, | | | | |
| | 2016 | 2016 | 2015 | 2014 | 2013 | 2012 |
| Selected Per–Share Data | | | | | | |
| Net asset value, beginning of period | $15.24 | $16.01 | $15.42 | $13.51 | $12.53 | $12.73 |
| Income from Investment Operations | | | | | | |
| Net investment income (loss)A | .04 | .28 | .32 | .26 | .25 | .23 |
| Net realized and unrealized gain (loss) | .98 | (.74) | .78 | 1.66 | .95 | (.09) |
| Total from investment operations | 1.02 | (.46) | 1.10 | 1.92 | 1.20 | .14 |
| Distributions from net investment income | (.01) | (.30) | (.50) | (.01) | (.21) | (.18) |
| Distributions from net realized gain | – | –B | (.01) | –B | (.01) | (.16) |
| Total distributions | (.01) | (.31)C | (.51) | (.01) | (.22) | (.34) |
| Net asset value, end of period | $16.25 | $15.24 | $16.01 | $15.42 | $13.51 | $12.53 |
| Total ReturnD,E | 6.67% | (2.92)% | 7.25% | 14.21% | 9.75% | 1.39% |
| Ratios to Average Net AssetsF,G | | | | | | |
| Expenses before reductions | .15%H | .15% | .15% | .15% | .15% | .15% |
| Expenses net of fee waivers, if any | .09%H | .08% | .08% | .08% | .09% | .08% |
| Expenses net of all reductions | .09%H | .08% | .08% | .08% | .09% | .08% |
| Net investment income (loss) | .50%H | 1.80% | 2.02% | 1.79% | 2.02% | 1.89% |
| Supplemental Data | | | | | | |
| Net assets, end of period (000 omitted) | $523,359 | $486,444 | $729,639 | $521,672 | $326,221 | $140,655 |
| Portfolio turnover rateG | 5%H | 7% | 10% | 24% | 8% | 15% |
A Calculated based on average shares outstanding during the period.
B Amount represents less than $.005 per share.
C Total distributions of $.31 per share is comprised of distributions from net investment income of $.302 and distributions from net realized gain of $.003 per share.
D Total returns for periods of less than one year are not annualized.
E Total returns would have been lower if certain expenses had not been reduced during the applicable periods shown.
F Expense ratios reflect operating expenses of the class. Expenses before reductions do not reflect amounts reimbursed by the investment adviser or reductions from expense offset arrangements and do not represent the amount paid by the class during periods when reimbursements or reductions occur. Expenses net of fee waivers reflect expenses after reimbursement by the investment adviser but prior to reductions from expense offset arrangements. Expenses net of all reductions represent the net expenses paid by the class.
G Amount does not include the portfolio activity of any Underlying Funds.
H Annualized
See accompanying notes which are an integral part of the financial statements.
Financial Highlights — Fidelity Freedom Index 2050 Fund Institutional Premium Class
| | Six months ended (Unaudited) September 30, | Years ended March 31, |
| | 2016 | 2016 A |
| Selected Per–Share Data | | |
| Net asset value, beginning of period | $15.24 | $16.37 |
| Income from Investment Operations | | |
| Net investment income (loss)B | .04 | .38 |
| Net realized and unrealized gain (loss) | .97 | (1.20) |
| Total from investment operations | 1.01 | (.82) |
| Distributions from net investment income | (.01) | (.30) |
| Distributions from net realized gain | – | –C |
| Total distributions | (.01) | (.31)D |
| Net asset value, end of period | $16.24 | $15.24 |
| Total ReturnE,F | 6.62% | (5.04)% |
| Ratios to Average Net AssetsG,H | | |
| Expenses before reductions | .07%I | .05%I |
| Expenses net of fee waivers, if any | .04%I | .01%I |
| Expenses net of all reductions | .04%I | .01%I |
| Net investment income (loss) | .55%I | 3.40%I |
| Supplemental Data | | |
| Net assets, end of period (000 omitted) | $582,387 | $434,989 |
| Portfolio turnover rateH | 5%I | 7% |
A For the period June 24, 2015 (commencement of sale of shares) to March 31, 2016.
B Calculated based on average shares outstanding during the period.
C Amount represents less than $.005 per share.
D Total distributions of $.31 per share is comprised of distributions from net investment income of $.304 and distributions from net realized gain of $.003 per share.
E Total returns for periods of less than one year are not annualized.
F Total returns would have been lower if certain expenses had not been reduced during the applicable periods shown.
G Expense ratios reflect operating expenses of the class. Expenses before reductions do not reflect amounts reimbursed by the investment adviser or reductions from expense offset arrangements and do not represent the amount paid by the class during periods when reimbursements or reductions occur. Expense ratios before reductions for start-up periods may not be representative of longer-term operating periods. Expenses net of fee waivers reflect expenses after reimbursement by the investment adviser but prior to reductions from expense offset arrangements. Expenses net of all reductions represent the net expenses paid by the class.
H Amount does not include the portfolio activity of any Underlying Funds.
I Annualized
See accompanying notes which are an integral part of the financial statements.
Fidelity Freedom® Index 2055 Fund
Investment Summary (Unaudited)
The information in the following tables is based on the direct investments of the Fund.
Top Holdings as of September 30, 2016
| | % of fund's net assets | % of fund's net assets 6 months ago |
| Fidelity Total Market Index Fund Class F | 61.6 | 61.7 |
| Fidelity Series Global ex U.S. Index Fund | 27.0 | 27.0 |
| Fidelity U.S. Bond Index Fund Class F | 10.0 | 10.0 |
| Fidelity Series Commodity Strategy Fund Class F | 1.4 | 1.3 |
| | 100.0 | 100.0 |
Asset Allocation (% of fund's net assets)
| Period end |
| | Domestic Equity Funds | 61.6% |
| | Commodity Funds | 1.4% |
| | International Equity Funds | 27.0% |
| | Bond Funds | 10.0% |

| Six months ago |
| | Domestic Equity Funds | 61.7% |
| | Commodity Funds | 1.3% |
| | International Equity Funds | 27.0% |
| | Bond Funds | 10.0% |

Fidelity Freedom® Index 2055 Fund
Investments September 30, 2016 (Unaudited)
Showing Percentage of Net Assets
| Domestic Equity Funds - 61.6% | | | |
| | | Shares | Value |
| Fidelity Total Market Index Fund Class F (a) | | | |
| (Cost $204,728,025) | | 3,667,895 | 231,664,217 |
|
| Commodity Funds - 1.4% | | | |
| Fidelity Series Commodity Strategy Fund Class F (a)(b) | | | |
| (Cost $5,819,294) | | 951,890 | 5,092,612 |
|
| International Equity Funds - 27.0% | | | |
| Fidelity Series Global ex U.S. Index Fund (a) | | | |
| (Cost $101,736,599) | | 9,107,282 | 101,455,123 |
|
| Bond Funds - 10.0% | | | |
| Fidelity U.S. Bond Index Fund Class F (a) | | | |
| (Cost $36,804,838) | | 3,146,723 | 37,571,875 |
| TOTAL INVESTMENT PORTFOLIO - 100.0% | | | |
| (Cost $349,088,756) | | | 375,783,827 |
| NET OTHER ASSETS (LIABILITIES) - 0.0% | | | (27,857) |
| NET ASSETS - 100% | | | $375,755,970 |
Legend
(a) Affiliated Fund
(b) Non-income producing
Affiliated Underlying Funds
Information regarding the Fund's fiscal year to date purchases and sales of the affiliated Underlying Funds and income earned by the Fund from investments in affiliated Underlying Funds is as follows:
| Affiliate | Value, beginning of period | Purchases | Sales Proceeds | Dividend Income | Value, end of period |
| Fidelity Series Commodity Strategy Fund Class F | $3,772,993 | $1,229,766 | $248,159 | $-- | $5,092,612 |
| Fidelity Series Global ex U.S. Index Fund | 77,082,253 | 21,063,903 | 3,001,800 | -- | 101,455,123 |
| Fidelity Total Market Index Fund Class F | 176,172,155 | 43,469,852 | 1,212,050 | 556,803 | 231,664,217 |
| Fidelity U.S. Bond Index Fund Class F | 28,528,984 | 9,290,203 | 693,549 | 394,112 | 37,571,875 |
| Total | $285,556,385 | $75,053,724 | $5,155,558 | $950,915 | $375,783,827 |
Investment Valuation
All investments are categorized as Level 1 under the Fair Value Hierarchy. The inputs or methodology used for valuing securities may not be an indication of the risk associated with investing in those securities. For more information on valuation inputs please refer to the Investment Valuation section in the accompanying Notes to Financial Statements.
See accompanying notes which are an integral part of the financial statements.
Fidelity Freedom® Index 2055 Fund
Financial Statements
Statement of Assets and Liabilities
| | | September 30, 2016 (Unaudited) |
| Assets | | |
| Investment in securities, at value (cost $349,088,756) — See accompanying schedule | | $375,783,827 |
| Receivable for investments sold | | 828,397 |
| Receivable for fund shares sold | | 1,323,760 |
| Receivable from affiliate for expense reductions | | 10,386 |
| Total assets | | 377,946,370 |
| Liabilities | | |
| Payable for investments purchased | $1,980,806 | |
| Payable for fund shares redeemed | 171,349 | |
| Transfer agent fees payable | 38,245 | |
| Total liabilities | | 2,190,400 |
| Net Assets | | $375,755,970 |
| Net Assets consist of: | | |
| Paid in capital | | $349,148,540 |
| Undistributed net investment income | | 844,090 |
| Accumulated undistributed net realized gain (loss) on investments | | (931,731) |
| Net unrealized appreciation (depreciation) on investments | | 26,695,071 |
| Net Assets | | $375,755,970 |
| Investor Class: | | |
| Net Asset Value, offering price and redemption price per share ($183,844,256 ÷ 14,289,472 shares) | | $12.87 |
| Institutional Premium Class: | | |
| Net Asset Value, offering price and redemption price per share ($191,911,714 ÷ 14,911,154 shares) | | $12.87 |
See accompanying notes which are an integral part of the financial statements.
Statement of Operations
| | | Six months ended September 30, 2016 (Unaudited) |
| Investment Income | | |
| Income distributions from underlying funds | | $950,915 |
| Expenses | | |
| Transfer agent fees | $182,613 | |
| Independent trustees' fees and expenses | 705 | |
| Total expenses before reductions | 183,318 | |
| Expense reductions | (76,493) | 106,825 |
| Net investment income (loss) | | 844,090 |
| Realized and Unrealized Gain (Loss) | | |
| Realized gain (loss) on sale of underlying fund shares | (168,721) | |
| Capital gain distributions from underlying funds | 334,160 | |
| Total net realized gain (loss) | | 165,439 |
| Change in net unrealized appreciation (depreciation) on investment securities | | 20,500,751 |
| Net gain (loss) | | 20,666,190 |
| Net increase (decrease) in net assets resulting from operations | | $21,510,280 |
See accompanying notes which are an integral part of the financial statements.
Statement of Changes in Net Assets
| | Six months ended September 30, 2016 (Unaudited) | Year ended March 31, 2016 |
| Increase (Decrease) in Net Assets | | |
| Operations | | |
| Net investment income (loss) | $844,090 | $4,847,095 |
| Net realized gain (loss) | 165,439 | 32,239 |
| Change in net unrealized appreciation (depreciation) | 20,500,751 | (9,812,175) |
| Net increase (decrease) in net assets resulting from operations | 21,510,280 | (4,932,841) |
| Distributions to shareholders from net investment income | – | (4,901,701) |
| Distributions to shareholders from net realized gain | – | (268,734) |
| Distributions to shareholders from tax return of capital | – | (432,936) |
| Total distributions | – | (5,603,371) |
| Share transactions - net increase (decrease) | 68,699,660 | 112,965,012 |
| Total increase (decrease) in net assets | 90,209,940 | 102,428,800 |
| Net Assets | | |
| Beginning of period | 285,546,030 | 183,117,230 |
| End of period | $375,755,970 | $285,546,030 |
| Other Information | | |
| Undistributed net investment income end of period | $844,090 | $– |
See accompanying notes which are an integral part of the financial statements.
Financial Highlights — Fidelity Freedom Index 2055 Fund Investor Class
| | Six months ended (Unaudited) September 30, | Years ended March 31, | | | | |
| | 2016 | 2016 | 2015 | 2014 | 2013 | 2012 A |
| Selected Per–Share Data | | | | | | |
| Net asset value, beginning of period | $12.06 | $12.71 | $12.07 | $10.67 | $9.86 | $10.00 |
| Income from Investment Operations | | | | | | |
| Net investment income (loss)B | .03 | .25 | .26 | .21 | .21 | .14 |
| Net realized and unrealized gain (loss) | .78 | (.63) | .62 | 1.36 | .77 | (.01) |
| Total from investment operations | .81 | (.38) | .88 | 1.57 | .98 | .13 |
| Distributions from net investment income | – | (.24)C | (.24) | (.17) | (.16) | (.13) |
| Distributions from net realized gain | – | (.01)C | – | –D | (.01) | (.14) |
| Tax return of capital | – | (.02) | – | – | – | – |
| Total distributions | – | (.27) | (.24) | (.17) | (.17) | (.27) |
| Net asset value, end of period | $12.87 | $12.06 | $12.71 | $12.07 | $10.67 | $9.86 |
| Total ReturnE,F | 6.72% | (2.96)% | 7.27% | 14.76% | 10.05% | 1.61% |
| Ratios to Average Net AssetsG,H | | | | | | |
| Expenses before reductions | .15%I | .15% | .15% | .15% | .15% | .15%I |
| Expenses net of fee waivers, if any | .09%I | .08% | .08% | .08% | .09% | .07%I |
| Expenses net of all reductions | .09%I | .08% | .08% | .08% | .09% | .07%I |
| Net investment income (loss) | .48%I | 2.03% | 2.10% | 1.82% | 2.06% | 1.82%I |
| Supplemental Data | | | | | | |
| Net assets, end of period (000 omitted) | $183,844 | $150,332 | $183,117 | $88,084 | $30,205 | $7,931 |
| Portfolio turnover rateH | 3%I | 7% | 8% | 21% | 19% | 14%I |
A For the period June 1, 2011 (commencement of operations) to March 31, 2012.
B Calculated based on average shares outstanding during the period.
C The amounts shown reflect certain reclassifications related to book to tax differences that were made in the year shown.
D Amount represents less than $.005 per share.
E Total returns for periods of less than one year are not annualized.
F Total returns would have been lower if certain expenses had not been reduced during the applicable periods shown.
G Expense ratios reflect operating expenses of the class. Expenses before reductions do not reflect amounts reimbursed by the investment adviser or reductions from expense offset arrangements and do not represent the amount paid by the class during periods when reimbursements or reductions occur. Expense ratios before reductions for start-up periods may not be representative of longer-term operating periods. Expenses net of fee waivers reflect expenses after reimbursement by the investment adviser but prior to reductions from expense offset arrangements. Expenses net of all reductions represent the net expenses paid by the class.
H Amount does not include the portfolio activity of any Underlying Funds.
I Annualized
See accompanying notes which are an integral part of the financial statements.
Financial Highlights — Fidelity Freedom Index 2055 Fund Institutional Premium Class
| | Six months ended (Unaudited) September 30, | Years ended March 31, |
| | 2016 | 2016 A |
| Selected Per–Share Data | | |
| Net asset value, beginning of period | $12.06 | $13.00 |
| Income from Investment Operations | | |
| Net investment income (loss)B | .03 | .23 |
| Net realized and unrealized gain (loss) | .78 | (.89) |
| Total from investment operations | .81 | (.66) |
| Distributions from net investment income | – | (.25)C |
| Distributions from net realized gain | – | (.01)C |
| Tax return of capital | – | (.02) |
| Total distributions | – | (.28) |
| Net asset value, end of period | $12.87 | $12.06 |
| Total ReturnD,E | 6.72% | (5.11)% |
| Ratios to Average Net AssetsF,G | | |
| Expenses before reductions | .07%H | .05%H |
| Expenses net of fee waivers, if any | .04%H | .01%H |
| Expenses net of all reductions | .04%H | .01%H |
| Net investment income (loss) | .54%H | 2.63%H |
| Supplemental Data | | |
| Net assets, end of period (000 omitted) | $191,912 | $135,214 |
| Portfolio turnover rateG | 3%H | 7% |
A For the period June 24, 2015 (commencement of sale of shares) to March 31, 2016.
B Calculated based on average shares outstanding during the period.
C The amounts shown reflect certain reclassifications related to book to tax differences that were made in the year shown.
D Total returns for periods of less than one year are not annualized.
E Total returns would have been lower if certain expenses had not been reduced during the applicable periods shown.
F Expense ratios reflect operating expenses of the class. Expenses before reductions do not reflect amounts reimbursed by the investment adviser or reductions from expense offset arrangements and do not represent the amount paid by the class during periods when reimbursements or reductions occur. Expense ratios before reductions for start-up periods may not be representative of longer-term operating periods. Expenses net of fee waivers reflect expenses after reimbursement by the investment adviser but prior to reductions from expense offset arrangements. Expenses net of all reductions represent the net expenses paid by the class.
G Amount does not include the portfolio activity of any Underlying Funds.
H Annualized
See accompanying notes which are an integral part of the financial statements.
Fidelity Freedom® Index 2060 Fund
Investment Summary (Unaudited)
The information in the following tables is based on the direct investments of the Fund.
Top Holdings as of September 30, 2016
| | % of fund's net assets | % of fund's net assets 6 months ago |
| Fidelity Total Market Index Fund Class F | 61.7 | 61.7 |
| Fidelity Series Global ex U.S. Index Fund | 27.0 | 27.0 |
| Fidelity U.S. Bond Index Fund Class F | 10.0 | 10.0 |
| Fidelity Series Commodity Strategy Fund Class F | 1.3 | 1.3 |
| | 100.0 | 100.0 |
Asset Allocation (% of fund's net assets)
| Period end |
| | Domestic Equity Funds | 61.7% |
| | Commodity Funds | 1.3% |
| | International Equity Funds | 27.0% |
| | Bond Funds | 10.0% |

| Six months ago |
| | Domestic Equity Funds | 61.7% |
| | Commodity Funds | 1.3% |
| | International Equity Funds | 27.0% |
| | Bond Funds | 10.0% |

Fidelity Freedom® Index 2060 Fund
Investments September 30, 2016 (Unaudited)
Showing Percentage of Net Assets
| Domestic Equity Funds - 61.7% | | | |
| | | Shares | Value |
| Fidelity Total Market Index Fund Class F (a) | | | |
| (Cost $28,342,303) | | 473,887 | 29,930,671 |
|
| Commodity Funds - 1.3% | | | |
| Fidelity Series Commodity Strategy Fund Class F (a)(b) | | | |
| (Cost $654,912) | | 122,716 | 656,533 |
|
| International Equity Funds - 27.0% | | | |
| Fidelity Series Global ex U.S. Index Fund (a) | | | |
| (Cost $12,669,207) | | 1,176,671 | 13,108,116 |
|
| Bond Funds - 10.0% | | | |
| Fidelity U.S. Bond Index Fund Class F (a) | | | |
| (Cost $4,783,256) | | 406,585 | 4,854,627 |
| TOTAL INVESTMENT PORTFOLIO - 100.0% | | | |
| (Cost $46,449,678) | | | 48,549,947 |
| NET OTHER ASSETS (LIABILITIES) - 0.0% | | | (3,682) |
| NET ASSETS - 100% | | | $48,546,265 |
Legend
(a) Affiliated Fund
(b) Non-income producing
Affiliated Underlying Funds
Information regarding the Fund's fiscal year to date purchases and sales of the affiliated Underlying Funds and income earned by the Fund from investments in affiliated Underlying Funds is as follows:
| Affiliate | Value, beginning of period | Purchases | Sales Proceeds | Dividend Income | Value, end of period |
| Fidelity Series Commodity Strategy Fund Class F | $354,151 | $294,316 | $25,403 | -- | $656,533 |
| Fidelity Series Global ex U.S. Index Fund | 7,157,920 | 5,437,875 | 193,414 | -- | 13,108,116 |
| Fidelity Total Market Index Fund Class F | 16,361,650 | 12,303,324 | 160,313 | 52,813 | 29,930,671 |
| Fidelity U.S. Bond Index Fund Class F | 2,649,719 | 2,237,991 | 78,649 | 42,907 | 4,854,627 |
| Total | $26,523,440 | $20,273,506 | $457,779 | $95,720 | $48,549,947 |
Investment Valuation
All investments are categorized as Level 1 under the Fair Value Hierarchy. The inputs or methodology used for valuing securities may not be an indication of the risk associated with investing in those securities. For more information on valuation inputs please refer to the Investment Valuation section in the accompanying Notes to Financial Statements.
See accompanying notes which are an integral part of the financial statements.
Fidelity Freedom® Index 2060 Fund
Financial Statements
Statement of Assets and Liabilities
| | | September 30, 2016 (Unaudited) |
| Assets | | |
| Investment in securities, at value (cost $46,449,678) — See accompanying schedule | | $48,549,947 |
| Receivable for investments sold | | 61,755 |
| Receivable for fund shares sold | | 338,647 |
| Receivable from affiliate for expense reductions | | 1,298 |
| Total assets | | 48,951,647 |
| Liabilities | | |
| Payable for investments purchased | $370,076 | |
| Payable for fund shares redeemed | 30,334 | |
| Transfer agent fees payable | 4,972 | |
| Total liabilities | | 405,382 |
| Net Assets | | $48,546,265 |
| Net Assets consist of: | | |
| Paid in capital | | $46,388,482 |
| Undistributed net investment income | | 82,904 |
| Accumulated undistributed net realized gain (loss) on investments | | (25,390) |
| Net unrealized appreciation (depreciation) on investments | | 2,100,269 |
| Net Assets | | $48,546,265 |
| Investor Class: | | |
| Net Asset Value, offering price and redemption price per share ($28,806,204 ÷ 2,748,659 shares) | | $10.48 |
| Institutional Premium Class: | | |
| Net Asset Value, offering price and redemption price per share ($19,740,061 ÷ 1,883,248 shares) | | $10.48 |
See accompanying notes which are an integral part of the financial statements.
Statement of Operations
| | | Six months ended September 30, 2016 (Unaudited) |
| Investment Income | | |
| Income distributions from underlying funds | | $95,720 |
| Expenses | | |
| Transfer agent fees | $21,608 | |
| Independent trustees' fees and expenses | 72 | |
| Total expenses before reductions | 21,680 | |
| Expense reductions | (8,649) | 13,031 |
| Net investment income (loss) | | 82,689 |
| Realized and Unrealized Gain (Loss) | | |
| Realized gain (loss) on sale of underlying fund shares | (2,151) | |
| Capital gain distributions from underlying funds | 31,695 | |
| Total net realized gain (loss) | | 29,544 |
| Change in net unrealized appreciation (depreciation) on investment securities | | 2,213,148 |
| Net gain (loss) | | 2,242,692 |
| Net increase (decrease) in net assets resulting from operations | | $2,325,381 |
See accompanying notes which are an integral part of the financial statements.
Statement of Changes in Net Assets
| | Six months ended September 30, 2016 (Unaudited) | Year ended March 31, 2016 |
| Increase (Decrease) in Net Assets | | |
| Operations | | |
| Net investment income (loss) | $82,689 | $303,394 |
| Net realized gain (loss) | 29,544 | 12,607 |
| Change in net unrealized appreciation (depreciation) | 2,213,148 | (169,757) |
| Net increase (decrease) in net assets resulting from operations | 2,325,381 | 146,244 |
| Distributions to shareholders from net investment income | (10,162) | (293,946) |
| Distributions to shareholders from net realized gain | (54,182) | (5,071) |
| Total distributions | (64,344) | (299,017) |
| Share transactions - net increase (decrease) | 19,762,834 | 23,014,985 |
| Total increase (decrease) in net assets | 22,023,871 | 22,862,212 |
| Net Assets | | |
| Beginning of period | 26,522,394 | 3,660,182 |
| End of period | $48,546,265 | $26,522,394 |
| Other Information | | |
| Undistributed net investment income end of period | $82,904 | $10,377 |
See accompanying notes which are an integral part of the financial statements.
Financial Highlights — Fidelity Freedom Index 2060 Fund Investor Class
| | Six months ended (Unaudited) September 30, | Years ended March 31, | |
| | 2016 | 2016 | 2015 A |
| Selected Per–Share Data | | | |
| Net asset value, beginning of period | $9.85 | $10.33 | $10.00 |
| Income from Investment Operations | | | |
| Net investment income (loss)B | .02 | .25 | .09 |
| Net realized and unrealized gain (loss) | .63 | (.55) | .40 |
| Total from investment operations | .65 | (.30) | .49 |
| Distributions from net investment income | –C | (.18) | (.16) |
| Distributions from net realized gain | (.02) | –C | –C |
| Total distributions | (.02) | (.18) | (.16) |
| Net asset value, end of period | $10.48 | $9.85 | $10.33 |
| Total ReturnD,E | 6.62% | (2.94)% | 4.90% |
| Ratios to Average Net AssetsF,G | | | |
| Expenses before reductions | .15%H | .15% | .15%H |
| Expenses net of fee waivers, if any | .09%H | .08% | .09%H |
| Expenses net of all reductions | .09%H | .08% | .09%H |
| Net investment income (loss) | .44%H | 2.57% | 1.35%H |
| Supplemental Data | | | |
| Net assets, end of period (000 omitted) | $28,806 | $16,979 | $3,660 |
| Portfolio turnover rateG | 3%H | 8% | 33%H |
A For the period August 5, 2014 (commencement of operations) to March 31, 2015.
B Calculated based on average shares outstanding during the period.
C Amount represents less than $.005 per share.
D Total returns for periods of less than one year are not annualized.
E Total returns would have been lower if certain expenses had not been reduced during the applicable periods shown.
F Expense ratios reflect operating expenses of the class. Expenses before reductions do not reflect amounts reimbursed by the investment adviser or reductions from expense offset arrangements and do not represent the amount paid by the class during periods when reimbursements or reductions occur. Expense ratios before reductions for start-up periods may not be representative of longer-term operating periods. Expenses net of fee waivers reflect expenses after reimbursement by the investment adviser but prior to reductions from expense offset arrangements. Expenses net of all reductions represent the net expenses paid by the class.
G Amount does not include the portfolio activity of any Underlying Funds.
H Annualized
See accompanying notes which are an integral part of the financial statements.
Financial Highlights — Fidelity Freedom Index 2060 Fund Institutional Premium Class
| | Six months ended (Unaudited) September 30, | Years ended March 31, |
| | 2016 | 2016 A |
| Selected Per–Share Data | | |
| Net asset value, beginning of period | $9.85 | $10.56 |
| Income from Investment Operations | | |
| Net investment income (loss)B | .02 | .13 |
| Net realized and unrealized gain (loss) | .63 | (.66) |
| Total from investment operations | .65 | (.53) |
| Distributions from net investment income | –C | (.18) |
| Distributions from net realized gain | (.02) | –C |
| Total distributions | (.02) | (.18) |
| Net asset value, end of period | $10.48 | $9.85 |
| Total ReturnD,E | 6.64% | (5.05)% |
| Ratios to Average Net AssetsF,G | | |
| Expenses before reductions | .07%H | .05%H |
| Expenses net of fee waivers, if any | .04%H | .01%H |
| Expenses net of all reductions | .04%H | .01%H |
| Net investment income (loss) | .49%H | 1.80%H |
| Supplemental Data | | |
| Net assets, end of period (000 omitted) | $19,740 | $9,543 |
| Portfolio turnover rateG | 3%H | 8% |
A For the period June 24, 2015 (commencement of sale of shares) to March 31, 2016.
B Calculated based on average shares outstanding during the period.
C Amount represents less than $.005 per share.
D Total returns for periods of less than one year are not annualized.
E Total returns would have been lower if certain expenses had not been reduced during the applicable periods shown.
F Expense ratios reflect operating expenses of the class. Expenses before reductions do not reflect amounts reimbursed by the investment adviser or reductions from expense offset arrangements and do not represent the amount paid by the class during periods when reimbursements or reductions occur. Expense ratios before reductions for start-up periods may not be representative of longer-term operating periods. Expenses net of fee waivers reflect expenses after reimbursement by the investment adviser but prior to reductions from expense offset arrangements. Expenses net of all reductions represent the net expenses paid by the class.
G Amount does not include the portfolio activity of any Underlying Funds.
H Annualized
See accompanying notes which are an integral part of the financial statements.
Notes to Financial Statements (Unaudited)
For the period ended September 30, 2016
1. Organization.
Fidelity Freedom Index Income Fund, Fidelity Freedom Index 2005 Fund, Fidelity Freedom Index 2010 Fund, Fidelity Freedom Index 2015 Fund, Fidelity Freedom Index 2020 Fund, Fidelity Freedom Index 2025 Fund, Fidelity Freedom Index 2030 Fund, Fidelity Freedom Index 2035 Fund, Fidelity Freedom Index 2040 Fund, Fidelity Freedom Index 2045 Fund, Fidelity Freedom Index 2050 Fund, Fidelity Freedom Index 2055 Fund and Fidelity Freedom Index 2060 Fund (the Funds) are funds of Fidelity Aberdeen Street Trust (the Trust). The Trust is registered under the Investment Company Act of 1940, as amended (the 1940 Act), as an open-end management investment company organized as a Delaware statutory trust. Each Fund is authorized to issue an unlimited number of shares. The Funds invest primarily in a combination of other Fidelity equity, bond, and short-term funds (the Underlying Funds) managed by Fidelity Management & Research Company (FMR). Each Fund offers Investor Class (formerly Freedom Index) and Institutional Premium Class (formerly Class W) shares, each of which has equal rights as to assets and voting privileges. Each class has exclusive voting rights with respect to matters that affect that class.
During the period, certain underlying investments incurred name changes. These changes may involve one or more of the following, as applicable: replacing "Spartan" with "Fidelity" or renaming "Fidelity Institutional Money Market" to "Fidelity Investments Money Market." The names of the underlying investments are those in effect at period end."
2. Significant Accounting Policies.
The financial statements have been prepared in conformity with accounting principles generally accepted in the United States of America (GAAP), which require management to make certain estimates and assumptions at the date of the financial statements. Actual results could differ from those estimates. Subsequent events, if any, through the date that the financial statements were issued have been evaluated in the preparation of the financial statements. The following summarizes the significant accounting policies of the Funds:
Investment Valuation. Investments are valued as of 4:00 p.m. Eastern time on the last calendar day of the period. Each Fund categorizes the inputs to valuation techniques used to value its investments into a disclosure hierarchy consisting of three levels as shown below:
- Level 1 – quoted prices in active markets for identical investments
- Level 2 – other significant observable inputs (including quoted prices for similar investments, interest rates, prepayment speeds, etc.)
- Level 3 – unobservable inputs (including the Fund's own assumptions based on the best information available)
Valuation techniques used to value each Fund's investments by major category are as follows. Investments in the Underlying Funds are valued at their closing net asset value (NAV) each business day and are categorized as Level 1 in the hierarchy.
Investment Transactions and Income. For financial reporting purposes, the Funds' investment holdings and NAV include trades executed through the end of the last business day of the period. The NAV per share for processing shareholder transactions is calculated as of the close of business of the New York Stock Exchange (NYSE), normally 4:00 p.m. Eastern time and includes trades executed through the end of the prior business day. Gains and losses on securities sold are determined on the basis of identified cost. Income and capital gain distributions from the Underlying Funds, if any, are recorded on the ex-dividend date.
Class Allocations and Expenses. Investment income, realized and unrealized capital gains and losses, common expenses of each Fund, and certain fund-level expense reductions, if any, are allocated daily on a pro-rata basis to each class based on the relative net assets of each class to the total net assets of each Fund. Each class differs with respect to transfer agent fees incurred. Certain expense reductions may also differ by class. For the reporting period, the allocated portion of income and expenses to each class as a percent of its average net assets may vary due to the timing of recording these transactions in relation to fluctuating net assets of the classes. Expenses directly attributable to a fund are charged to that fund. Expenses attributable to more than one fund are allocated among the respective funds on the basis of relative net assets or other appropriate methods. Expenses included in the accompanying financial statements reflect the expenses of each Fund and do not include any expenses associated with the Underlying Funds. Although not included in each Fund's expenses, each Fund indirectly bears its proportionate share of the Underlying Funds' expenses through the impact of these expenses on each Underlying Fund's NAV. Expense estimates are accrued in the period to which they relate and adjustments are made when actual amounts are known.
Income Tax Information and Distributions to Shareholders. Each year, each Fund intends to qualify as a regulated investment company under Subchapter M of the Internal Revenue Code, including distributing substantially all of its taxable income and realized gains. As a result, no provision for U.S. Federal income taxes is required. Each Fund files a U.S. federal tax return, in addition to state and local tax returns as required. Each Fund's federal income tax returns are subject to examination by the Internal Revenue Service (IRS) for a period of three fiscal years after they are filed. State and local tax returns may be subject to examination for an additional fiscal year depending on the jurisdiction.
Distributions are declared and recorded on the ex-dividend date. Income dividends and capital gain distributions are declared separately for each class. Income and capital gain distributions are determined in accordance with income tax regulations, which may differ from GAAP.
Capital accounts within the financial statements are adjusted for permanent book-tax differences. These adjustments have no impact on net assets or the results of operations. Capital accounts are not adjusted for temporary book-tax differences which will reverse in a subsequent period.
Book-tax differences are primarily due to the short-term gain distributions from the Underlying Funds, capital loss carryforwards and losses deferred due to wash sales and excise tax regulations.
The federal tax cost of investment securities and unrealized appreciation (depreciation) as of period end were as follows for each Fund:
| | Tax cost | Gross unrealized appreciation | Gross unrealized depreciation | Net unrealized appreciation (depreciation) on securities |
| Fidelity Freedom Index Income Fund | $251,209,563 | $19,151,019 | $(2,502,229) | $16,648,790 |
| Fidelity Freedom Index 2005 Fund | 81,524,905 | 8,924,236 | (772,996) | 8,151,240 |
| Fidelity Freedom Index 2010 Fund | 405,658,571 | 69,831,183 | (3,539,263) | 66,291,920 |
| Fidelity Freedom Index 2015 Fund | 829,382,065 | 147,251,497 | (8,440,206) | 138,811,291 |
| Fidelity Freedom Index 2020 Fund | 2,612,555,962 | 392,653,324 | (28,710,016) | 363,943,308 |
| Fidelity Freedom Index 2025 Fund | 2,014,534,164 | 316,182,634 | (22,333,222) | 293,849,412 |
| Fidelity Freedom Index 2030 Fund | 2,498,104,482 | 436,651,924 | (36,039,650) | 400,612,274 |
| Fidelity Freedom Index 2035 Fund | 1,471,693,129 | 278,522,299 | (22,842,818) | 255,679,481 |
| Fidelity Freedom Index 2040 Fund | 1,726,283,831 | 330,022,264 | (25,640,181) | 304,382,083 |
| Fidelity Freedom Index 2045 Fund | 976,945,742 | 163,803,900 | (13,927,556) | 149,876,344 |
| Fidelity Freedom Index 2050 Fund | 970,795,638 | 148,908,796 | (13,876,333) | 135,032,463 |
| Fidelity Freedom Index 2055 Fund | 350,212,851 | 30,509,376 | (4,938,400) | 25,570,976 |
| Fidelity Freedom Index 2060 Fund | 46,486,914 | 2,285,053 | (222,020) | 2,063,033 |
Capital loss carryforwards are only available to offset future capital gains of the Funds to the extent provided by regulations and may be limited. Under the Regulated Investment Company Modernization Act of 2010 (the Act), the Funds are permitted to carry forward capital losses incurred in taxable years beginning after December 22, 2010 for an unlimited period and such capital losses are required to be used prior to any losses that expire. The capital loss carryforward information presented below, including any applicable limitation, is estimated as of prior fiscal period end and is subject to adjustment.
| | Short-term | Long-term | Total no expiration | Total capital loss carryforward |
| Fidelity Freedom Index 2010 Fund | $-– | $(280,853) | $(280,853) | $(280,853) |
| Fidelity Freedom Index 2015 Fund | (187,794) | (3,932,090) | (4,119,884) | (4,119,884) |
| Fidelity Freedom Index 2020 Fund | (1,933,554) | (10,571,536) | (12,505,090) | (12,505,090) |
| Fidelity Freedom Index 2025 Fund | (1,460,037) | (8,209,293) | (9,669,330) | (9,669,330) |
| Fidelity Freedom Index 2030 Fund | (4,377,576) | (11,303,288) | (15,680,864) | (15,680,864) |
| Fidelity Freedom Index 2035 Fund | (2,787,366) | (6,988,548) | (9,775,914) | (9,775,914) |
| Fidelity Freedom Index 2040 Fund | (2,859,906) | (6,913,324) | (9,773,230) | (9,773,230) |
| Fidelity Freedom Index 2045 Fund | (1,814,406) | (2,427,500) | (4,241,906) | (4,241,906) |
| Fidelity Freedom Index 2050 Fund | (1,782,307) | (1,209,678) | (2,991,985) | (2,991,985) |
3. Purchases and Redemptions of Underlying Fund Shares.
Purchases and redemptions of the Underlying Fund shares are noted in the table below.
| | Purchases ($) | Redemptions ($) |
| Fidelity Freedom Index Income Fund | 109,065,162 | 96,544,168 |
| Fidelity Freedom Index 2005 Fund | 33,279,780 | 25,872,179 |
| Fidelity Freedom Index 2010 Fund | 124,018,479 | 115,895,438 |
| Fidelity Freedom Index 2015 Fund | 195,599,107 | 173,685,805 |
| Fidelity Freedom Index 2020 Fund | 535,281,712 | 343,027,057 |
| Fidelity Freedom Index 2025 Fund | 415,233,164 | 182,704,454 |
| Fidelity Freedom Index 2030 Fund | 358,205,962 | 90,755,801 |
| Fidelity Freedom Index 2035 Fund | 210,762,757 | 43,444,227 |
| Fidelity Freedom Index 2040 Fund | 221,606,330 | 47,670,545 |
| Fidelity Freedom Index 2045 Fund | 159,061,920 | 25,158,826 |
| Fidelity Freedom Index 2050 Fund | 145,465,768 | 23,166,976 |
| Fidelity Freedom Index 2055 Fund | 75,053,724 | 5,155,558 |
| Fidelity Freedom Index 2060 Fund | 20,273,506 | 457,779 |
4. Fees and Other Transactions with Affiliates.
Management Fee. FMR Co., Inc. (the investment adviser), an affiliate of FMR, provides the Funds with investment management related services. The Funds do not pay any fees for these services.
Other Transactions. The investment adviser has entered into an administration agreement with FMR under which FMR provides management and administrative services (other than investment advisory services) necessary for the operation of each Fund. Pursuant to this agreement, FMR pays all expenses of each Fund, excluding transfer agent fees, compensation of the independent Trustees and certain other expenses such as interest expense. FMR also contracts with other Fidelity companies to perform the services necessary for the operation of each Fund.
Transfer Agent Fees. Fidelity Investments Institutional Operations Company, Inc., (FIIOC), an affiliate of the investment adviser, is the transfer, dividend disbursing and shareholder servicing agent for each class of the Funds. Effective August 1, 2016 FIIOC receives an asset-based fee of .15% and .10% of class-level average net assets for each Investor class and Institutional Premium Class, respectively. Prior to August 1, 2016, FIIOC received an asset-based fee of .15% and .05% of class-level average net assets for each Investor Class and Institutional Premium Class, respectively. FIIOC pays for typesetting, printing and mailing of shareholder reports, except proxy statements. For the period, transfer agent fees for each applicable class were as follows:
| | Amount | % of Class-Level Average Net Assets(a) |
| Fidelity Freedom Index Income Fund | | |
| Investor Class | $106,975 | .15 |
| Institutional Premium Class | 39,839 | .07 |
| | $146,814 | |
| Fidelity Freedom Index 2005 Fund | | |
| Investor Class | $38,720 | .15 |
| Institutional Premium Class | 11,117 | .07 |
| | $49,837 | |
| Fidelity Freedom Index 2010 Fund | | |
| Investor Class | $170,030 | .15 |
| Institutional Premium Class | 77,714 | .07 |
| | $247,744 | |
| Fidelity Freedom Index 2015 Fund | | |
| Investor Class | $415,200 | .15 |
| Institutional Premium Class | 128,661 | .07 |
| | $543,861 | |
| Fidelity Freedom Index 2020 Fund | | |
| Investor Class | $1,047,143 | .15 |
| Institutional Premium Class | 476,607 | .07 |
| | $1,523,750 | |
| Fidelity Freedom Index 2025 Fund | | |
| Investor Class | $892,305 | .15 |
| Institutional Premium Class | 321,837 | .07 |
| | $1,214,142 | |
| Fidelity Freedom Index 2030 Fund | | |
| Investor Class | $1,001,207 | .15 |
| Institutional Premium Class | 459,349 | .07 |
| | $1,460,556 | |
| Fidelity Freedom Index 2035 Fund | | |
| Investor Class | $678,833 | .15 |
| Institutional Premium Class | 236,257 | .07 |
| | $915,090 | |
| Fidelity Freedom Index 2040 Fund | | |
| Investor Class | $701,486 | .15 |
| Institutional Premium Class | 324,807 | .07 |
| | $1,026,293 | |
| Fidelity Freedom Index 2045 Fund | | |
| Investor Class | $423,879 | .15 |
| Institutional Premium Class | 159,103 | .07 |
| | $582,982 | |
| Fidelity Freedom Index 2050 Fund | | |
| Investor Class | $385,395 | .15 |
| Institutional Premium Class | 171,280 | .07 |
| | $556,675 | |
| Fidelity Freedom Index 2055 Fund | | |
| Investor Class | $127,498 | .15 |
| Institutional Premium Class | 55,115 | .07 |
| | $182,613 | |
| Fidelity Freedom Index 2060 Fund | | |
| Investor Class | $ 16,670 | .15 |
| Institutional Premium Class | 4,938 | .07 |
| | $ 21,608 | |
(a) Annualized
Other. During the period, the investment adviser reimbursed the Funds for certain losses as follows:
| | Amount |
| Fidelity Freedom Index 2015 Fund | $2,234 |
| Fidelity Freedom Index 2020 Fund | 3,869 |
| Fidelity Freedom Index 2025 Fund | 4,562 |
| Fidelity Freedom Index 2030 Fund | 8,832 |
| Fidelity Freedom Index 2035 Fund | 14,766 |
| Fidelity Freedom Index 2040 Fund | 7,048 |
| Fidelity Freedom Index 2045 Fund | 11,476 |
| Fidelity Freedom Index 2050 Fund | 10,785 |
| Fidelity Freedom Index 2055 Fund | 2,661 |
5. Expense Reductions.
FMR contractually agreed to reimburse funds to the extent annual operating expenses, including acquired fund fees and expenses, exceeded certain levels of average net assets as noted in the table below. This reimbursement will remain in place through May 31, 2019. Some expenses, for example interest expense, are excluded from this reimbursement.
The following classes of each applicable Fund were in reimbursement during the period:
| | Expense
Limitations | Reimbursement from Affiliate |
| Fidelity Freedom Index Income Fund | | |
| Investor Class | .16/.15%(a) | $52,413 |
| Institutional Premium Class | .10% | 27,948 |
| Fidelity Freedom Index 2005 Fund | | |
| Investor Class | .16/.15%(a) | $17,681 |
| Institutional Premium Class | .10% | 6,943 |
| Fidelity Freedom Index 2010 Fund | | |
| Investor Class | .16/.15%(a) | $74,156 |
| Institutional Premium Class | .10% | 44,950 |
| Fidelity Freedom Index 2015 Fund | | |
| Investor Class | .16/.15%(a) | $172,519 |
| Institutional Premium Class | .10% | 68,271 |
| Fidelity Freedom Index 2020 Fund | | |
| Investor Class | .16/.15%(a) | $421,457 |
| Institutional Premium Class | .10% | 238,606 |
| Fidelity Freedom Index 2025 Fund | | |
| Investor Class | .16/.15%(a) | $345,795 |
| Institutional Premium Class | .10% | 149,973 |
| Fidelity Freedom Index 2030 Fund | | |
| Investor Class | .16/.15%(a) | $383,935 |
| Institutional Premium Class | .10% | 208,382 |
| Fidelity Freedom Index 2035 Fund | | |
| Investor Class | .16/.15%(a) | $268,972 |
| Institutional Premium Class | .10% | 113,790 |
| Fidelity Freedom Index 2040 Fund | | |
| Investor Class | .16/.15%(a) | $278,813 |
| Institutional Premium Class | .10% | 157,201 |
| Fidelity Freedom Index 2045 Fund | | |
| Investor Class | .16/.15%(a) | $168,016 |
| Institutional Premium Class | .10% | 76,268 |
| Fidelity Freedom Index 2050 Fund | | |
| Investor Class | .16/.15%(a) | $152,804 |
| Institutional Premium Class | .10% | 82,636 |
| Fidelity Freedom Index 2055 Fund | | |
| Investor Class | .16/.15%(a) | $49,973 |
| Institutional Premium Class | .10% | 26,520 |
| Fidelity Freedom Index 2060 Fund | | |
| Investor Class | .16/.15%(a) | $6,367 |
| Institutional Premium Class | .10% | 2,282 |
(a) Expense limitation effective August 1, 2016.
6. Distributions to Shareholders.
Distributions to shareholders of each class were as follows:
| | Six months ended
September 30, 2016 | Year ended March 31, 2016(a) |
| Fidelity Freedom Index Income Fund | | |
| From net investment income | | |
| Investor Class | $790,349 | $2,700,774 |
| Institutional Premium Class | 686,464 | 885,530 |
| Total | $1,476,813 | $3,586,304 |
| From net realized gain | | |
| Investor Class | $48,218 | $107,552 |
| Institutional Premium Class | 40,637 | 71,284 |
| Total | $88,855 | $178,836 |
| Fidelity Freedom Index 2005 Fund | | |
| From net investment income | | |
| Investor Class | $109,981 | $984,947 |
| Institutional Premium Class | 73,941 | 257,925 |
| Total | $183,922 | $1,242,872 |
| From net realized gain | | |
| Investor Class | $57,027 | $18,833 |
| Institutional Premium Class | 35,695 | 5,700 |
| Total | $92,722 | $24,533 |
| Fidelity Freedom Index 2010 Fund | | |
| From net investment income | | |
| Investor Class | $439,883 | $4,906,146 |
| Institutional Premium Class | 507,619 | 3,095,480 |
| Total | $947,502 | $8,001,626 |
| From net realized gain | | |
| Investor Class | $– | $77,838 |
| Institutional Premium Class | – | 59,528 |
| Total | $– | $137,366 |
| Fidelity Freedom Index 2015 Fund | | |
| From net investment income | | |
| Investor Class | $966,229 | $12,413,040 |
| Institutional Premium Class | 769,485 | 4,307,179 |
| Total | $1,735,714 | $16,720,219 |
| From net realized gain | | |
| Investor Class | $– | $145,849 |
| Institutional Premium Class | – | 56,923 |
| Total | $– | $202,772 |
| Fidelity Freedom Index 2020 Fund | | |
| From net investment income | | |
| Investor Class | $2,266,423 | $29,760,778 |
| Institutional Premium Class | 2,536,246 | 18,920,244 |
| Total | $4,802,669 | $48,681,022 |
| From net realized gain | | |
| Investor Class | $– | $329,878 |
| Institutional Premium Class | – | 235,520 |
| Total | $– | $565,398 |
| Fidelity Freedom Index 2025 Fund | | |
| From net investment income | | |
| Investor Class | $1,659,233 | $24,697,425 |
| Institutional Premium Class | 1,474,439 | 10,396,177 |
| Total | $3,133,672 | $35,093,602 |
| From net realized gain | | |
| Investor Class | $– | $268,303 |
| Institutional Premium Class | – | 117,250 |
| Total | $– | $385,553 |
| Fidelity Freedom Index 2030 Fund | | |
| From net investment income | | |
| Investor Class | $1,235,770 | $28,249,189 |
| Institutional Premium Class | 1,286,509 | 18,770,229 |
| Total | $2,522,279 | $47,019,418 |
| From net realized gain | | |
| Investor Class | $– | $286,583 |
| Institutional Premium Class | – | 196,890 |
| Total | $– | $483,473 |
| Fidelity Freedom Index 2035 Fund | | |
| From net investment income | | |
| Investor Class | $344,494 | $18,513,045 |
| Institutional Premium Class | 340,408 | 8,877,374 |
| Total | $684,902 | $27,390,419 |
| From net realized gain | | |
| Investor Class | $– | $183,836 |
| Institutional Premium Class | – | 88,479 |
| Total | $– | $272,315 |
| Fidelity Freedom Index 2040 Fund | | |
| From net investment income | | |
| Investor Class | $359,164 | $18,450,439 |
| Institutional Premium Class | 470,768 | 14,367,325 |
| Total | $829,932 | $32,817,764 |
| From net realized gain | | |
| Investor Class | $– | $182,295 |
| Institutional Premium Class | – | 142,250 |
| Total | $– | $324,545 |
| Fidelity Freedom Index 2045 Fund | | |
| From net investment income | | |
| Investor Class | $212,487 | $10,705,665 |
| Institutional Premium Class | 220,869 | 6,282,420 |
| Total | $433,356 | $16,988,085 |
| From net realized gain | | |
| Investor Class | $– | $105,915 |
| Institutional Premium Class | – | 62,202 |
| Total | $– | $168,117 |
| Fidelity Freedom Index 2050 Fund | | |
| From net investment income | | |
| Investor Class | $193,280 | $9,323,501 |
| Institutional Premium Class | 239,758 | 7,370,988 |
| Total | $433,038 | $16,694,489 |
| From net realized gain | | |
| Investor Class | $– | $91,495 |
| Institutional Premium Class | – | 72,739 |
| Total | $– | $164,234 |
| Fidelity Freedom Index 2055 Fund | | |
| From net investment income | | |
| Investor Class | $– | $2,789,796 |
| Institutional Premium Class | – | 2,111,905 |
| Total | $– | $4,901,701 |
| From net realized gain | | |
| Investor Class | $– | $152,950 |
| Institutional Premium Class | – | 115,784 |
| Total | $– | $268,734 |
| From tax return of capital | | |
| Investor Class | $– | $249,498 |
| Institutional Premium Class | – | 183,438 |
| Total | $– | $432,936 |
| Fidelity Freedom Index 2060 Fund | | |
| From net investment income | | |
| Investor Class | $5,636 | $203,923 |
| Institutional Premium Class | 4,526 | 90,023 |
| Total | $10,162 | $293,946 |
| From net realized gain | | |
| Investor Class | $33,816 | $3,528 |
| Institutional Premium Class | 20,366 | 1,543 |
| Total | $54,182 | $5,071 |
(a) Distributions for Institutional Premium Class are for the period June 24, 2015 (commencement of sale of shares) to March 31, 2016.
7. Share Transactions.
Share transactions for each class were as follows and may contain automatic conversions between classes or exchanges between affiliated funds:
| | Shares | Shares | Dollars | Dollars |
| | Six months ended September 30, 2016 | Year ended March 31, 2016(a) | Six months ended
September 30, 2016 | Year ended March 31, 2016(a) |
| Fidelity Freedom Index Income Fund | | | | |
| Investor Class | | | | |
| Shares sold | 2,746,320 | 6,715,869 | $31,514,923 | $76,213,802 |
| Reinvestment of distributions | 73,088 | 248,024 | 837,164 | 2,805,500 |
| Shares redeemed | (3,014,236) | (15,802,557) | (34,656,508) | (178,312,693) |
| Net increase (decrease) | (194,828) | (8,838,664) | $(2,304,421) | $(99,293,391) |
| Institutional Premium Class | | | | |
| Shares sold | 2,131,606 | 10,631,062 | $24,500,046 | $119,660,753 |
| Reinvestment of distributions | 63,515 | 85,434 | 727,101 | 956,814 |
| Shares redeemed | (900,316) | (1,121,618) | (10,349,914) | (12,525,410) |
| Net increase (decrease) | 1,294,805 | 9,594,878 | $14,877,233 | $108,092,157 |
| Fidelity Freedom Index 2005 Fund | | | | |
| Investor Class | | | | |
| Shares sold | 922,798 | 2,061,227 | $11,703,951 | $25,720,546 |
| Reinvestment of distributions | 13,433 | 81,013 | 166,975 | 1,003,598 |
| Shares redeemed | (926,913) | (3,925,844) | (11,758,987) | (48,463,160) |
| Net increase (decrease) | 9,318 | (1,783,604) | $111,939 | $(21,739,016) |
| Institutional Premium Class | | | | |
| Shares sold | 728,191 | 2,460,346 | $9,224,277 | $30,120,440 |
| Reinvestment of distributions | 8,820 | 21,416 | 109,636 | 263,625 |
| Shares redeemed | (176,518) | (159,366) | (2,238,848) | (1,942,866) |
| Net increase (decrease) | 560,493 | 2,322,396 | $7,095,065 | $28,441,199 |
| Fidelity Freedom Index 2010 Fund | | | | |
| Investor Class | | | | |
| Shares sold | 3,060,064 | 8,644,359 | $40,681,526 | $113,250,252 |
| Reinvestment of distributions | 33,634 | 381,772 | 437,918 | 4,978,043 |
| Shares redeemed | (4,386,396) | (27,189,729) | (58,210,274) | (353,485,636) |
| Net increase (decrease) | (1,292,698) | (18,163,598) | $(17,090,830) | $(235,257,341) |
| Institutional Premium Class | | | | |
| Shares sold | 3,937,881 | 18,039,953 | $52,380,098 | $233,569,990 |
| Reinvestment of distributions | 38,988 | 244,196 | 507,619 | 3,155,008 |
| Shares redeemed | (2,204,555) | (1,755,679) | (29,295,591) | (22,398,247) |
| Net increase (decrease) | 1,772,314 | 16,528,470 | $23,592,126 | $214,326,751 |
| Fidelity Freedom Index 2015 Fund | | | | |
| Investor Class | | | | |
| Shares sold | 8,819,365 | 21,105,246 | $119,309,783 | $280,710,450 |
| Reinvestment of distributions | 72,979 | 948,296 | 963,328 | 12,536,669 |
| Shares redeemed | (12,529,540) | (45,210,446) | (168,895,176) | (593,006,830) |
| Net increase (decrease) | (3,637,196) | (23,156,904) | $(48,622,065) | $(299,759,711) |
| Institutional Premium Class | | | | |
| Shares sold | 8,529,557 | 27,540,788 | $114,846,007 | $357,931,885 |
| Reinvestment of distributions | 58,339 | 332,376 | 769,485 | 4,364,102 |
| Shares redeemed | (3,583,415) | (2,883,257) | (48,426,511) | (37,348,783) |
| Net increase (decrease) | 5,004,481 | 24,989,907 | $67,188,981 | $324,947,204 |
| Fidelity Freedom Index 2020 Fund | | | | |
| Investor Class | | | | |
| Shares sold | 20,664,736 | 51,952,901 | $289,005,184 | $715,490,099 |
| Reinvestment of distributions | 165,990 | 2,197,214 | 2,262,440 | 30,059,629 |
| Shares redeemed | (27,006,926) | (125,114,874) | (377,615,181) | (1,698,253,504) |
| Net increase (decrease) | (6,176,200) | (70,964,759) | $(86,347,557) | $(952,703,776) |
| Institutional Premium Class | | | | |
| Shares sold | 27,929,698 | 97,170,716 | $391,474,657 | $1,312,997,448 |
| Reinvestment of distributions | 186,215 | 1,410,586 | 2,536,246 | 19,155,764 |
| Shares redeemed | (8,965,482) | (7,000,779) | (125,633,277) | (92,937,529) |
| Net increase (decrease) | 19,150,431 | 91,580,523 | $268,377,626 | $1,239,215,683 |
| Fidelity Freedom Index 2025 Fund | | | | |
| Investor Class | | | | |
| Shares sold | 19,308,526 | 41,759,997 | $282,500,498 | $600,958,723 |
| Reinvestment of distributions | 116,239 | 1,746,196 | 1,655,239 | 24,924,051 |
| Shares redeemed | (21,336,383) | (77,309,515) | (312,149,300) | (1,088,985,441) |
| Net increase (decrease) | (1,911,618) | (33,803,322) | $(27,993,563) | $(463,102,667) |
| Institutional Premium Class | | | | |
| Shares sold | 20,908,813 | 57,189,457 | $305,715,202 | $800,211,343 |
| Reinvestment of distributions | 103,542 | 739,341 | 1,474,439 | 10,513,427 |
| Shares redeemed | (3,729,340) | (2,361,276) | (54,701,332) | (32,858,495) |
| Net increase (decrease) | 17,283,015 | 55,567,522 | $252,488,309 | $777,866,275 |
| Fidelity Freedom Index 2030 Fund | | | | |
| Investor Class | | | | |
| Shares sold | 18,208,567 | 43,906,047 | $271,268,346 | $645,938,706 |
| Reinvestment of distributions | 85,546 | 1,956,770 | 1,235,290 | 28,533,934 |
| Shares redeemed | (21,564,447) | (101,954,697) | (322,484,336) | (1,468,703,985) |
| Net increase (decrease) | (3,270,334) | (56,091,880) | $(49,980,700) | $(794,231,345) |
| Institutional Premium Class | | | | |
| Shares sold | 26,056,791 | 82,794,549 | $389,419,661 | $1,186,942,442 |
| Reinvestment of distributions | 89,093 | 1,307,176 | 1,286,509 | 18,967,119 |
| Shares redeemed | (5,553,125) | (3,666,028) | (82,884,585) | (51,708,288) |
| Net increase (decrease) | 20,592,759 | 80,435,697 | $307,821,585 | $1,154,201,273 |
| Fidelity Freedom Index 2035 Fund | | | | |
| Investor Class | | | | |
| Shares sold | 13,903,609 | 27,897,475 | $213,486,339 | $423,212,476 |
| Reinvestment of distributions | 23,192 | 1,243,840 | 344,405 | 18,693,558 |
| Shares redeemed | (14,858,834) | (51,909,978) | (228,948,984) | (767,519,618) |
| Net increase (decrease) | (932,033) | (22,768,663) | $(15,118,240) | $(325,613,584) |
| Institutional Premium Class | | | | |
| Shares sold | 14,269,712 | 39,990,477 | $219,436,919 | $586,694,337 |
| Reinvestment of distributions | 22,923 | 597,724 | 340,408 | 8,965,853 |
| Shares redeemed | (2,764,410) | (1,621,564) | (42,609,414) | (23,472,011) |
| Net increase (decrease) | 11,528,225 | 38,966,637 | $177,167,913 | $572,188,179 |
| Fidelity Freedom Index 2040 Fund | | | | |
| Investor Class | | | | |
| Shares sold | 12,571,417 | 30,635,484 | $194,143,649 | $468,806,968 |
| Reinvestment of distributions | 24,025 | 1,231,237 | 358,933 | 18,621,813 |
| Shares redeemed | (14,428,405) | (67,048,049) | (224,362,231) | (1,006,409,755) |
| Net increase (decrease) | (1,832,963) | (35,181,328) | $(29,859,649) | $(518,980,974) |
| Institutional Premium Class | | | | |
| Shares sold | 16,330,828 | 56,671,368 | $253,208,331 | $845,843,342 |
| Reinvestment of distributions | 31,511 | 961,536 | 470,768 | 14,509,575 |
| Shares redeemed | (3,624,448) | (2,293,116) | (56,161,497) | (33,242,027) |
| Net increase (decrease) | 12,737,891 | 55,339,788 | $197,517,602 | $827,110,890 |
| Fidelity Freedom Index 2045 Fund | | | | |
| Investor Class | | | | |
| Shares sold | 8,934,573 | 19,576,212 | $139,088,657 | $301,341,772 |
| Reinvestment of distributions | 14,093 | 708,893 | 212,383 | 10,810,269 |
| Shares redeemed | (8,994,676) | (31,637,614) | (141,012,158) | (476,223,331) |
| Net increase (decrease) | (46,010) | (11,352,509) | $(1,711,118) | $(164,071,290) |
| Institutional Premium Class | | | | |
| Shares sold | 10,167,971 | 26,372,727 | $158,999,662 | $394,185,595 |
| Reinvestment of distributions | 14,656 | 416,861 | 220,869 | 6,344,622 |
| Shares redeemed | (1,726,472) | (1,216,234) | (26,996,705) | (17,817,556) |
| Net increase (decrease) | 8,456,155 | 25,573,354 | $132,223,826 | $382,712,661 |
| Fidelity Freedom Index 2050 Fund | | | | |
| Investor Class | | | | |
| Shares sold | 7,694,350 | 19,448,196 | $120,738,264 | $301,834,848 |
| Reinvestment of distributions | 12,730 | 612,484 | 193,244 | 9,412,888 |
| Shares redeemed | (7,412,989) | (33,725,377) | (117,446,288) | (513,968,106) |
| Net increase (decrease) | 294,091 | (13,664,697) | $3,485,220 | $(202,720,370) |
| Institutional Premium Class | | | | |
| Shares sold | 9,324,034 | 29,420,562 | $147,329,833 | $444,771,494 |
| Reinvestment of distributions | 15,805 | 485,883 | 239,758 | 7,443,727 |
| Shares redeemed | (2,039,617) | (1,355,667) | (32,116,022) | (19,972,823) |
| Net increase (decrease) | 7,300,222 | 28,550,778 | $115,453,569 | $432,242,398 |
| Fidelity Freedom Index 2055 Fund | | | | |
| Investor Class | | | | |
| Shares sold | 4,644,841 | 10,054,868 | $57,748,912 | $123,788,005 |
| Reinvestment of distributions | – | 262,643 | – | 3,191,611 |
| Shares redeemed | (2,816,965) | (12,265,907) | (35,372,818) | (147,752,272) |
| Net increase (decrease) | 1,827,876 | (1,948,396) | $22,376,094 | $(20,772,656) |
| Institutional Premium Class | | | | |
| Shares sold | 4,470,282 | 11,459,467 | $55,878,469 | $136,592,083 |
| Reinvestment of distributions | – | 198,774 | – | 2,411,127 |
| Shares redeemed | (766,643) | (450,726) | (9,554,903) | (5,265,542) |
| Net increase (decrease) | 3,703,639 | 11,207,515 | $46,323,566 | $133,737,668 |
| Fidelity Freedom Index 2060 Fund | | | | |
| Investor Class | | | | |
| Shares sold | 1,403,238 | 2,171,809 | $14,289,242 | $21,567,527 |
| Reinvestment of distributions | 4,028 | 20,916 | 39,442 | 207,395 |
| Shares redeemed | (382,765) | (823,039) | (3,897,009) | (8,073,598) |
| Net increase (decrease) | 1,024,501 | 1,369,686 | $10,431,675 | $13,701,324 |
| Institutional Premium Class | | | | |
| Shares sold | 1,070,064 | 998,645 | $10,916,643 | $9,593,510 |
| Reinvestment of distributions | 2,543 | 9,249 | 24,892 | 91,566 |
| Shares redeemed | (158,414) | (38,839) | (1,610,376) | (371,415) |
| Net increase (decrease) | 914,193 | 969,055 | $9,331,159 | $9,313,661 |
(a) Share transactions for Institutional Premium Class are for the period June 24, 2015 (commencement of sale of shares) to March 31, 2016.
8. Other.
The Funds' organizational documents provide former and current trustees and officers with a limited indemnification against liabilities arising in connection with the performance of their duties to the Funds. In the normal course of business, the Funds may also enter into contracts that provide general indemnifications. The Funds' maximum exposure under these arrangements is unknown as this would be dependent on future claims that may be made against the Funds. The risk of material loss from such claims is considered remote.
The Funds do not invest in the Underlying Funds for the purpose of exercising management or control; however, investments by the Funds within their principal investment strategies may represent a significant portion of the Underlying Fund's net assets. At the end of the period, the following Funds were the owners of record of 10% or more of the total outstanding shares of the Underlying Funds.
| | Fidelity Freedom Index 2020 Fund | Fidelity Freedom Index 2025 Fund | Fidelity Freedom Index 2030 Fund | Fidelity Freedom Index 2035 Fund | Fidelity Freedom Index 2040 Fund |
| Fund | | | | | |
| Fidelity Series Global ex U.S. Index Fund | 14% | 12% | 19% | 13% | 15% |
The Funds, in aggregate, were the owners of record of more than 20% of the total outstanding shares of the following Funds.
| Fund | % of shares held |
| Fidelity Series Global ex U.S. Index Fund | 99% |
| Fidelity Total Market Index Fund | 24% |
Shareholder Expense Example
As a shareholder of the Fund, you incur two types of costs: (1) transaction costs and (2) ongoing costs, including other Fund expenses. This Example is intended to help you understand your ongoing costs (in dollars) of investing in the Fund and to compare these costs with the ongoing costs of investing in other mutual funds.
The Example is based on an investment of $1,000 invested at the beginning of the period and held for the entire period (April 1, 2016 to September 30, 2016).
Actual Expenses
The first line of the accompanying table for each class of the Fund provides information about actual account values and actual expenses. You may use the information in this line, together with the amount you invested, to estimate the expenses that you paid over the period. Simply divide your account value by $1,000.00 (for example, an $8,600 account value divided by $1,000.00 = 8.6), then multiply the result by the number in the first line for a class of the Fund under the heading entitled "Expenses Paid During Period" to estimate the expenses you paid on your account during this period. In addition, each Fund, as a shareholder in underlying Fidelity Funds, will indirectly bear its pro-rata share of the fees and expenses incurred by the underlying Fidelity Funds. These fees and expenses are not included in each Fund's annualized expense ratio used to calculate the expense estimates in the table below.
Hypothetical Example for Comparison Purposes
The second line of the accompanying table for each class of each fund provides information about hypothetical account values and hypothetical expenses based on a Class' actual expense ratio and an assumed rate of return of 5% per year before expenses, which is not the Class' actual return. The hypothetical account values and expenses may not be used to estimate the actual ending account balance or expenses you paid for the period. You may use this information to compare the ongoing costs of investing in the Fund and other funds. To do so, compare this 5% hypothetical example with the 5% hypothetical examples that appear in the shareholder reports of the other funds. In addition, each Fund, as a shareholder in underlying Fidelity Funds, will indirectly bear its pro-rata share of the fees and expenses incurred by the underlying Fidelity Funds. These fees and expenses are not included in each Fund's annualized expense ratio used to calculate the expense estimates in the table below.
Please note that the expenses shown in the table are meant to highlight your ongoing costs only and do not reflect any transaction costs. Therefore, the second line of the table is useful in comparing ongoing costs only, and will not help you determine the relative total costs of owning different funds.
| | Annualized Expense Ratio-A | Beginning
Account Value
April 1, 2016 | Ending
Account Value
September 30, 2016 | Expenses Paid
During Period-B
April 1, 2016
to September 30, 2016 |
| Fidelity Freedom Index Income Fund | | | | |
| Investor Class | .08% | | | |
| Actual | | $1,000.00 | $1,029.00 | $.41 |
| Hypothetical-C | | $1,000.00 | $1,024.67 | $.41 |
| Institutional Premium Class | .02% | | | |
| Actual | | $1,000.00 | $1,029.30 | $.10 |
| Hypothetical-C | | $1,000.00 | $1,024.97 | $.10 |
| Fidelity Freedom Index 2005 Fund | | | | |
| Investor Class | .08% | | | |
| Actual | | $1,000.00 | $1,036.30 | $.41 |
| Hypothetical-C | | $1,000.00 | $1,024.67 | $.41 |
| Institutional Premium Class | .03% | | | |
| Actual | | $1,000.00 | $1,036.50 | $.15 |
| Hypothetical-C | | $1,000.00 | $1,024.92 | $.15 |
| Fidelity Freedom Index 2010 Fund | | | | |
| Investor Class | .09% | | | |
| Actual | | $1,000.00 | $1,042.00 | $.46 |
| Hypothetical-C | | $1,000.00 | $1,024.62 | $.46 |
| Institutional Premium Class | .03% | | | |
| Actual | | $1,000.00 | $1,042.20 | $.15 |
| Hypothetical-C | | $1,000.00 | $1,024.92 | $.15 |
| Fidelity Freedom Index 2015 Fund | | | | |
| Investor Class | .09% | | | |
| Actual | | $1,000.00 | $1,047.30 | $.46 |
| Hypothetical-C | | $1,000.00 | $1,024.62 | $.46 |
| Institutional Premium Class | .03% | | | |
| Actual | | $1,000.00 | $1,047.60 | $.15 |
| Hypothetical-C | | $1,000.00 | $1,024.92 | $.15 |
| Fidelity Freedom Index 2020 Fund | | | | |
| Investor Class | .09% | | | |
| Actual | | $1,000.00 | $1,050.90 | $.46 |
| Hypothetical-C | | $1,000.00 | $1,024.62 | $.46 |
| Institutional Premium Class | .03% | | | |
| Actual | | $1,000.00 | $1,051.10 | $.15 |
| Hypothetical-C | | $1,000.00 | $1,024.92 | $.15 |
| Fidelity Freedom Index 2025 Fund | | | | |
| Investor Class | .09% | | | |
| Actual | | $1,000.00 | $1,054.10 | $.46 |
| Hypothetical-C | | $1,000.00 | $1,024.62 | $.46 |
| Institutional Premium Class | .04% | | | |
| Actual | | $1,000.00 | $1,055.00 | $.21 |
| Hypothetical-C | | $1,000.00 | $1,024.87 | $.20 |
| Fidelity Freedom Index 2030 Fund | | | | |
| Investor Class | .09% | | | |
| Actual | | $1,000.00 | $1,061.80 | $.47 |
| Hypothetical-C | | $1,000.00 | $1,024.62 | $.46 |
| Institutional Premium Class | .04% | | | |
| Actual | | $1,000.00 | $1,061.80 | $.21 |
| Hypothetical-C | | $1,000.00 | $1,024.87 | $.20 |
| Fidelity Freedom Index 2035 Fund | | | | |
| Investor Class | .09% | | | |
| Actual | | $1,000.00 | $1,066.80 | $.47 |
| Hypothetical-C | | $1,000.00 | $1,024.62 | $.46 |
| Institutional Premium Class | .04% | | | |
| Actual | | $1,000.00 | $1,066.30 | $.21 |
| Hypothetical-C | | $1,000.00 | $1,024.87 | $.20 |
| Fidelity Freedom Index 2040 Fund | | | | |
| Investor Class | .09% | | | |
| Actual | | $1,000.00 | $1,067.10 | $.47 |
| Hypothetical-C | | $1,000.00 | $1,024.62 | $.46 |
| Institutional Premium Class | .04% | | | |
| Actual | | $1,000.00 | $1,066.60 | $.21 |
| Hypothetical-C | | $1,000.00 | $1,024.87 | $.20 |
| Fidelity Freedom Index 2045 Fund | | | | |
| Investor Class | .09% | | | |
| Actual | | $1,000.00 | $1,066.50 | $.47 |
| Hypothetical-C | | $1,000.00 | $1,024.62 | $.46 |
| Institutional Premium Class | .04% | | | |
| Actual | | $1,000.00 | $1,066.70 | $.21 |
| Hypothetical-C | | $1,000.00 | $1,024.87 | $.20 |
| Fidelity Freedom Index 2050 Fund | | | | |
| Investor Class | .09% | | | |
| Actual | | $1,000.00 | $1,066.70 | $.47 |
| Hypothetical-C | | $1,000.00 | $1,024.62 | $.46 |
| Institutional Premium Class | .04% | | | |
| Actual | | $1,000.00 | $1,066.20 | $.21 |
| Hypothetical-C | | $1,000.00 | $1,024.87 | $.20 |
| Fidelity Freedom Index 2055 Fund | | | | |
| Investor Class | .09% | | | |
| Actual | | $1,000.00 | $1,067.20 | $.47 |
| Hypothetical-C | | $1,000.00 | $1,024.62 | $.46 |
| Institutional Premium Class | .04% | | | |
| Actual | | $1,000.00 | $1,067.20 | $.21 |
| Hypothetical-C | | $1,000.00 | $1,024.87 | $.20 |
| Fidelity Freedom Index 2060 Fund | | | | |
| Investor Class | .09% | | | |
| Actual | | $1,000.00 | $1,066.20 | $.47 |
| Hypothetical-C | | $1,000.00 | $1,024.62 | $.46 |
| Institutional Premium Class | .04% | | | |
| Actual | | $1,000.00 | $1,066.40 | $.21 |
| Hypothetical-C | | $1,000.00 | $1,024.87 | $.20 |
| | | | | |
A Annualized expense ratio reflects expenses net of applicable fee waivers.
B Expenses are equal to each Class' annualized expense ratio, multiplied by the average account value over the period, multiplied by 183/ 365 (to reflect the one-half year period). The fees and expenses of the underlying Fidelity Funds in which each Fund invests are not included in each Fund's annualized expense ratio.
C 5% return per year before expenses
Board Approval of Investment Advisory Contracts and Management Fees
Fidelity Freedom Index Funds
Each year, the Board of Trustees, including the Independent Trustees (together, the Board), votes on the renewal of the management contract (the Advisory Contract) with FMR Co., Inc. (FMRC), an affiliate of Fidelity Management & Research Company (FMR), and the administration agreement between FMRC and FMR for each fund. The Board, assisted by the advice of fund counsel and Independent Trustees' counsel, requests and considers a broad range of information relevant to the renewal of the Advisory Contracts and administration agreements throughout the year.
The Board meets regularly and, at each of its meetings, covers an extensive agenda of topics and materials and considers factors that are relevant to its annual consideration of the renewal of each fund's Advisory Contract and administration agreement, including the services and support provided to each fund and its shareholders. The Board has established four standing committees (Committees) — Operations, Audit, Fair Valuation, and Governance and Nominating — each composed of and chaired by Independent Trustees with varying backgrounds, to which the Board has assigned specific subject matter responsibilities in order to enhance effective decision-making by the Board. The Operations Committee, of which all of the Independent Trustees are members, meets regularly throughout the year and considers, among other matters, information specifically related to the annual consideration of the renewal of each fund's Advisory Contract and administration agreement. The Board, acting directly and through its Committees, requests and receives information concerning the annual consideration of the renewal of each fund's Advisory Contract and administration agreement. The Board also meets as needed to consider matters specifically related to the Board's annual consideration of the renewal of the Advisory Contracts and administration agreements. Members of the Board may also meet with trustees of other Fidelity funds through ad hoc joint committees to discuss certain matters relevant to all of the Fidelity funds.
At its September 2016 meeting, the Board unanimously determined to renew each fund's Advisory Contract and administration agreement. In reaching its determination, the Board considered all factors it believed relevant and reached a determination, with the assistance of fund counsel and Independent Trustees' counsel and through the exercise of its business judgment, that the renewal of the Advisory Contract was in the best interests of each fund and its shareholders and that the fact that no fees are payable under the Advisory Contracts was fair and reasonable. The Board's decision to renew the Advisory Contracts was not based on any single factor, but rather was based on a comprehensive consideration of all the information provided to the Board at its meetings throughout the year. In reaching its determination, the Board was aware that shareholders of each fund have a broad range of investment choices available to them, including a wide choice among funds offered by Fidelity's competitors, and that each fund's shareholders, who have the opportunity to review and weigh the disclosure provided by the fund in its prospectus and other public disclosures, have chosen to invest in that fund, which is part of the Fidelity family of funds.
Nature, Extent, and Quality of Services Provided. The Board considered Fidelity's staffing as it relates to the funds, including the backgrounds of investment personnel of FMRC, and also considered the funds' investment objectives, strategies, and related investment philosophies. The Independent Trustees also had discussions with senior management of Fidelity's investment operations and investment groups with responsibility for the underlying Fidelity funds in which each fund invests. The Board considered the structure of the investment personnel compensation program and whether this structure provides appropriate incentives to act in the best interests of each fund. Additionally, the Board considered the portfolio managers' investments, if any, in the funds that they manage.
Resources Dedicated to Investment Management and Support Services. The Board reviewed the general qualifications and capabilities of Fidelity's investment staff, including its size, education, experience, and resources, as well as Fidelity's approach to recruiting, managing, and compensating investment personnel. The Board noted that Fidelity has continued to increase the resources devoted to non-U.S. offices, including expansion of Fidelity's global investment organization. The Board also noted that Fidelity's analysts have extensive resources, tools and capabilities that allow them to conduct sophisticated quantitative and fundamental analysis, as well as credit analysis of issuers, counterparties and guarantors. Further, the Board considered that Fidelity's investment professionals have sufficient access to global information and data so as to provide competitive investment results over time, and that those professionals also have access to sophisticated tools that permit them to assess portfolio construction and risk and performance attribution characteristics continuously, as well as to transmit new information and research conclusions rapidly around the world. Additionally, in its deliberations, the Board considered Fidelity's risk management, compliance, and technology and operations capabilities and resources, which are integral parts of the investment management process.
Shareholder and Administrative Services. The Board considered (i) the nature, extent, quality, and cost of advisory, administrative, and shareholder services performed by Fidelity under the Advisory Contract and under separate agreements covering administration, transfer agency, and pricing and bookkeeping services for each fund; (ii) the nature and extent of the supervision of third party service providers, principally custodians, subcustodians, and pricing vendors; and (iii) the resources devoted to, and the record of compliance with, each fund's compliance policies and procedures.
The Board noted that the growth of fund assets over time across the complex allows Fidelity to reinvest in the development of services designed to enhance the value or convenience of the Fidelity funds as investment vehicles. These services include 24-hour access to account information and market information through telephone representatives and over the Internet, investor education materials and asset allocation tools, and the expanded availability of Fidelity Investor Centers.
Investment in a Large Fund Family. The Board considered the benefits to shareholders of investing in a Fidelity fund, including the benefits of investing in a fund that is part of a large family of funds offering a variety of investment disciplines and providing a large variety of mutual fund investor services. The Board noted that Fidelity had taken, or had made recommendations that resulted in the Fidelity funds taking, a number of actions over the previous year that benefited particular funds, including: (i) continuing to dedicate additional resources to investment research and to the support of the senior management team that oversees asset management; (ii) continuing efforts to enhance Fidelity's global research capabilities; (iii) launching new funds and making other enhancements to meet client needs; (iv) broadening eligibility requirements for certain lower-priced share classes of, and streamlining the fee structure for, certain existing equity index funds; (v) lowering expense caps for certain existing funds and classes to reduce expenses paid by shareholders; (vi) eliminating redemption fees for certain variable insurance product funds and classes; (vii) continuing to launch dedicated lower cost underlying funds to meet portfolio construction needs related to expanding underlying fund options for Fidelity funds of funds, specifically for the Freedom Fund product lines; (viii) launching a lower cost share class for use by the Freedom Index Fund product line; (ix) rationalizing product lines and gaining increased efficiencies through fund mergers and share class consolidations; (x) continuing to develop, acquire and implement systems and technology to improve services to the funds and shareholders, strengthen information security, and increase efficiency; (xi) implementing investment enhancements to further strengthen Fidelity's target date product line to increase investors' probability of success in achieving their goals; (xii) accelerating the conversion of all remaining Class B shares to Class A shares, which have a lower expense structure; and (xiii) implementing changes to Fidelity's money market fund product line in response to recent regulatory reforms.
Investment Performance. The Board considered whether each fund has operated in accordance with its investment objective, as well as its record of compliance with its investment restrictions and its performance history.
The Board took into account discussions with representatives of the investment adviser about fund investment performance that occur at Board meetings throughout the year. In this regard the Board noted that as part of regularly scheduled fund reviews and other reports to the Board on fund performance, the Board considers annualized return information for each fund for different time periods, measured against one or more securities market indices, including a customized blended index representative of the fund's asset classes (each a "benchmark index") and a peer group of funds with similar objectives ("peer group"), if any. In its evaluation of fund investment performance at meetings throughout the year, the Board gave particular attention to information indicating underperformance of certain Fidelity funds for specific time periods and discussed with the investment adviser the reasons for such underperformance.
In addition to reviewing absolute and relative fund performance, the Independent Trustees periodically consider the appropriateness of fund performance metrics in evaluating the results achieved. In general, the Independent Trustees believe that fund performance should be evaluated based on gross performance (before fees and expenses, including acquired fund fees and expenses, but after transaction costs, if any) compared to appropriate benchmark indices, over appropriate time periods that may include full market cycles, and on net performance (after fees and expenses, including acquired fund fees and expenses) compared to peer groups, as applicable, over the same periods, taking into account relevant factors including the following: general market conditions; the extent to which particular underlying funds affected performance; and fund cash flows and other factors. Depending on the circumstances, the Independent Trustees may be satisfied with a fund's performance notwithstanding that it lags its benchmark index or peer group for certain periods.
The Independent Trustees recognize that shareholders evaluate performance on a net basis over their own holding periods, for which one-, three-, and five-year periods are often used as a proxy. For this reason, the performance information reviewed by the Board also included net cumulative calendar year total return information for each fund and an appropriate benchmark index for the most recent one-, three-, and five-year periods (for the most recent one- and three-year periods for Freedom Index
® 2055 Fund and for the most recent one-year period for Freedom Index
® 2060 Fund).
Based on its review, the Board concluded that the nature, extent, and quality of services provided to each fund under the Advisory Contracts should continue to benefit the shareholders of each fund.
Competitiveness of Management Fee and Total Expense Ratio. The Board noted that the funds do not pay FMRC a management fee for investment advisory services, and that each fund bears indirectly the fees and expenses, including the management fees, paid by the underlying Fidelity funds in which it invests. The Board considered each fund's management fee and total expense ratio compared to "mapped groups" of competitive funds and classes created for the purpose of facilitating the Trustees' competitive analysis of management fees and total expenses. Fidelity creates "mapped groups" by combining similar Lipper investment objective categories that have comparable investment mandates. Combining Lipper investment objective categories aids the Board's management fee and total expense ratio comparisons by broadening the competitive group used for comparison.
Management Fee. The Board considered two proprietary management fee comparisons for the 12-month (or shorter) periods shown in basis points (BP) in the charts below. The group of Lipper funds used by the Board for management fee comparisons is referred to below as the "Total Mapped Group." The Total Mapped Group comparison focuses on a fund's standing in terms of gross management fees before expense reimbursements or caps relative to the total universe of funds with comparable investment mandates, regardless of whether their management fee structures also are comparable. Funds with comparable investment mandates offer exposure to similar types of securities. Funds with comparable management fee structures have similar management fee contractual arrangements (
e.g., flat rate charged for advisory services, all-inclusive fee rate,
etc.). "TMG %" represents the percentage of funds in the Total Mapped Group that had management fees that were lower than a fund's. For example, a hypothetical TMG % of 20% would mean that 80% of the funds in the Total Mapped Group had higher, and 20% had lower, management fees than a fund. The funds' actual TMG %s and the number of funds in the Total Mapped Group are in the charts below. The Board also noted that over the past few years, Fidelity has been developing and refining the competitive methodology for the funds to provide a more meaningful competitive comparison. As a result, beginning with the 2014 competitive results, instead of including all funds in one competitive mapped group that includes all funds-of-funds, Fidelity introduced three new Total Mapped Groups that consist of target retirement funds, grouped according to target retirement dates. The Board noted that Fidelity believes that the new Total Mapped Groups provide more meaningful competitive comparisons for the funds because they include target date funds, regardless of whether the fund is a fund of funds, and reflect, among other things, that active target date funds with a higher percentage of assets invested in equities tend to have higher expenses. The "Asset-Size Peer Group" (ASPG) comparison focuses on a fund's standing relative to a subset of non-Fidelity funds within the Total Mapped Group that are similar in size and management fee structure. For example, if a fund is in the first quartile of the ASPG, the fund's management fee ranks in the least expensive or lowest 25% of funds in the ASPG. The ASPG represents at least 15% of the funds in the Total Mapped Group with comparable asset size and management fee structures, subject to a minimum of 50 funds (or all funds in the Total Mapped Group if fewer than 50). Additional information, such as the ASPG quartile in which a fund's management fee rate ranked, is also included in the charts and considered by the Board.
Freedom Index 2005 Fund
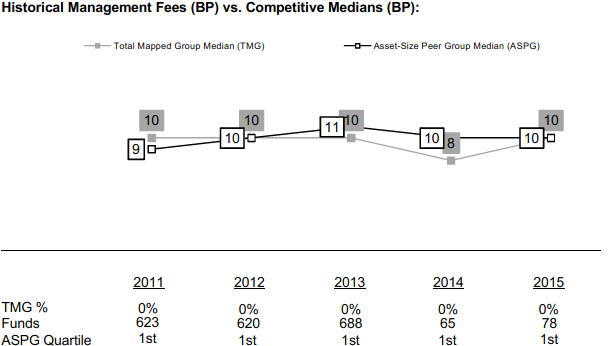
Freedom Index 2010 Fund
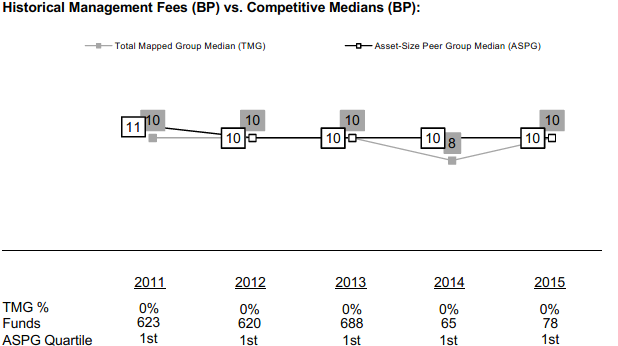
Freedom Index 2015 Fund
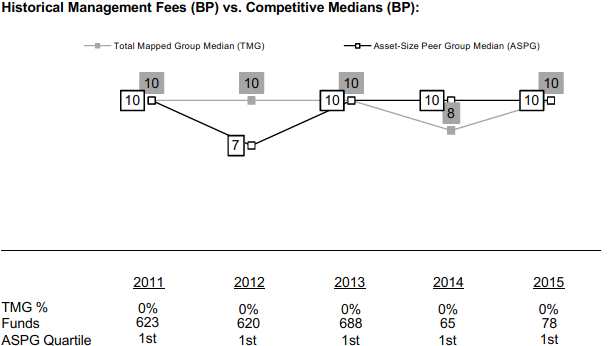
Freedom Index 2020 Fund

Freedom Index 2025 Fund

Freedom Index 2030 Fund
Freedom Index 2035 Fund
Freedom Index 2040 Fund
Freedom Index 2045 Fund
Freedom Index 2050 Fund
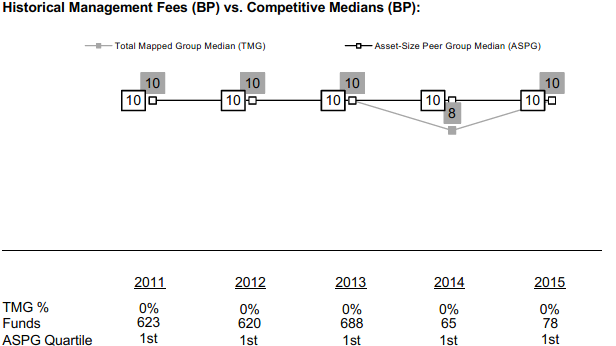
Freedom Index 2055 Fund
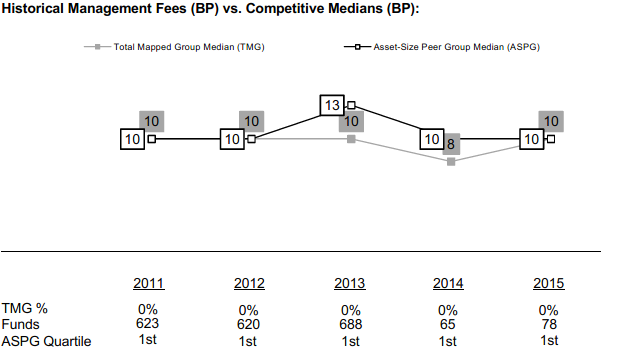
Freedom Index 2060 Fund
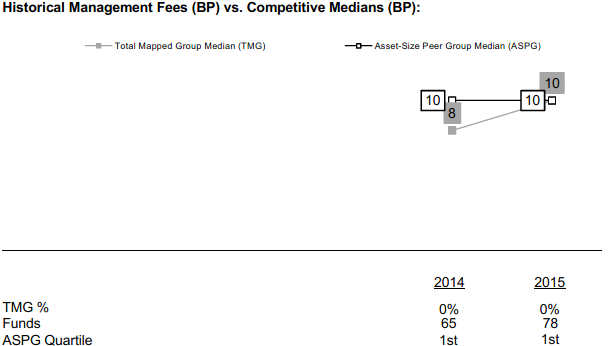
Freedom Index Income Fund
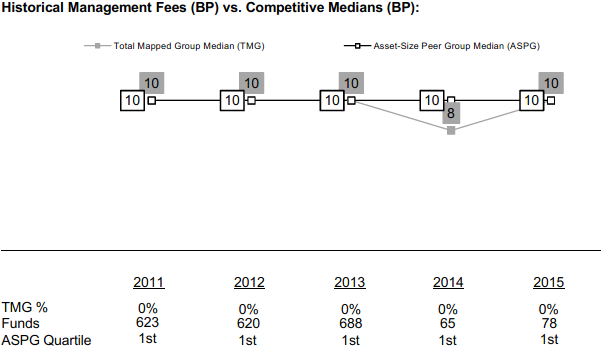
The Board noted that each fund's management fee rate of 0.00% ranked below the median of its Total Mapped Group and below the median of its ASPG for 2015. The Board further noted that many peer funds pay fund-level expenses, including management fees, to which the funds are not subject.
The Board noted that, in 2014, the ad hoc Committee on Group Fee was formed by it and the boards of other Fidelity funds to conduct an in-depth review of the "group fee" component of the management fee of funds with such management fee structures. The Committee's focus included the mechanics of the group fee, the competitive landscape of group fee structures, Fidelity funds with no group fee component (such as the funds) and investment products not included in group fee assets. The Board also considered that, for funds subject to the group fee, FMR agreed to voluntarily waive fees over a specified period of time in amounts designed to account for assets converted from certain funds to certain collective investment trusts.
Based on its review, the Board concluded that each fund's management fee is fair and reasonable in light of the services that the fund receives and the other factors considered.
Total Expense Ratio. In its review of the total expense ratio of each class of each fund, the Board considered that the funds pay transfer agent fees. The Board further noted that FMR pays all other expenses of each fund, with limited exceptions, pursuant to the administration agreement between FMRC and FMR with respect to each fund.
The Board noted that the total expense ratio of each class of each fund ranked below the competitive median for 2015.
In considering the total expense ratio of each class of each fund, the Board also considered an alternative competitive analysis that included both top level (
i.e., direct) fund fees and acquired fund fees and expenses for the class and the other funds and classes to which it is compared. The Board noted that, under this alternative competitive analysis, the total expense ratio of each class of each fund ranked below the competitive median for 2015.
The Board further considered that FMR has contractually agreed to reimburse Investor Class and Institutional Premium Class of each fund to the extent that total operating expenses (including acquired fund fees and expenses, but excluding interest, certain taxes, certain securities lending costs, brokerage commissions, and extraordinary expenses, if any, incurred by the fund or an acquired fund in which the fund invests), as a percentage of their respective average net assets, exceed 0.15% and 0.10% through May 31, 2019.
Fees Charged to Other Fidelity Clients. The Board also considered Fidelity fee structures and other information with respect to clients of Fidelity, such as other funds advised or subadvised by Fidelity, pension plan clients, and other institutional clients with similar mandates. The Board noted that an ad hoc joint committee created by it and the boards of other Fidelity funds periodically (most recently in 2013) reviews and compares Fidelity's institutional investment advisory business with its business of providing services to the Fidelity funds, including the differences in services provided, fees charged, and costs incurred, as well as competition in their respective marketplaces.
Based on its review of total expense ratios and fees charged to other Fidelity clients, the Board concluded that the total expense ratio of each class of each fund was reasonable in light of the services that the fund and its shareholders receive and the other factors considered.
Costs of the Services and Profitability. The Board considered the level of Fidelity's profits in respect of all the Fidelity funds, including the Fidelity funds in which the funds invest.
PricewaterhouseCoopers LLP (PwC), independent registered public accounting firm and auditor to Fidelity and certain Fidelity funds, has been engaged annually by the Board as part of the Board's assessment of Fidelity's profitability analysis. PwC's engagement includes the review and assessment of the methodologies used by Fidelity in determining the revenues and expenses attributable to Fidelity's mutual fund business, and completion of agreed-upon procedures in respect of the mathematical accuracy of the fund profitability information and its conformity to established allocation methodologies. After considering PwC's reports issued under the engagement and information provided by Fidelity, the Board concluded that while other allocation methods may also be reasonable, Fidelity's profitability methodologies are reasonable in all material respects.
The Board also reviewed Fidelity's non-fund businesses and fall-out benefits related to the mutual fund business as well as cases where Fidelity's affiliates may benefit from or be related to the funds' business.
The Board concluded that the costs of the services provided by and the profits realized by Fidelity in connection with the operation of each fund were not relevant to the renewal of each fund's Advisory Contract because the funds do not pay management fees and FMR pays all other expenses of each fund, with limited exceptions.
Economies of Scale. The Board concluded that because the funds do not pay management fees and FMR pays all other expenses of each fund, with limited exceptions, economies of scale cannot be realized by the funds, but may be realized by the other Fidelity funds in which each fund invests.
Additional Information Requested by the Board. In order to develop fully the factual basis for consideration of the Fidelity funds' advisory contracts, the Board requested and received additional information on certain topics, including: (i) Fidelity's fund profitability methodology, profitability trends for certain funds, and the impact of certain factors on fund profitability results; (ii) portfolio manager changes that have occurred during the past year and the amount of the investment that each portfolio manager has made in the Fidelity fund(s) that he or she manages; (iii) Fidelity's compensation structure for portfolio managers, research analysts, and other key personnel, including its effects on fund profitability, the rationale for the compensation structure, and the extent to which current market conditions have affected retention and recruitment; (iv) the arrangements with and compensation paid to certain fund sub-advisers on behalf of the Fidelity funds; (v) Fidelity's voluntary waiver of its fees to maintain minimum yields for certain money market funds and classes as well as contractual waivers in place for certain funds; (vi) the methodology with respect to competitive fund data and peer group classifications; (vii) Fidelity's transfer agent fee, expense, and service structures for different funds and classes relative to competitive trends, and the impact of the increased use of omnibus accounts; (viii) Fidelity's long-term expectations for its offerings in the workplace investing channel; (ix) new developments in the retail and institutional marketplaces; (x) the approach to considering "fall-out" benefits; and (xi) the impact of money market reform on Fidelity's money market funds, including with respect to costs and profitability. In addition, the Board considered its discussions with Fidelity throughout the year regarding enhanced information security initiatives and the funds' fair valuation policies.
Based on its evaluation of all of the conclusions noted above, and after considering all factors it believed relevant, the Board concluded that the advisory fee structures are fair and reasonable, and that each fund's Advisory Contract should be renewed.
FRX-SANN-1116
1.899267.106
Item 2.
Code of Ethics
Not applicable.
Item 3.
Audit Committee Financial Expert
Not applicable.
Item 4.
Principal Accountant Fees and Services
Not applicable.
Item 5.
Audit Committee of Listed Registrants
Not applicable.
Item 6.
Investments
(a)
Not applicable.
(b)
Not applicable
Item 7.
Disclosure of Proxy Voting Policies and Procedures for Closed-End Management Investment Companies
Not applicable.
Item 8.
Portfolio Managers of Closed-End Management Investment Companies
Not applicable.
Item 9.
Purchase of Equity Securities by Closed-End Management Investment Company and Affiliated Purchasers
Not applicable.
Item 10.
Submission of Matters to a Vote of Security Holders
There were no material changes to the procedures by which shareholders may recommend nominees to the Fidelity Aberdeen Street Trust’s Board of Trustees.
Item 11.
Controls and Procedures
(a)(i) The President and Treasurer and the Chief Financial Officer have concluded that the Fidelity Aberdeen Street Trust’s (the “Trust”) disclosure controls and procedures (as defined in Rule 30a-3(c) under the Investment Company Act) provide reasonable assurances that material information relating to the Trust is made known to them by the appropriate persons, based on their evaluation of these controls and procedures as of a date within 90 days of the filing date of this report.
(a)(ii) There was no change in the Trust’s internal control over financial reporting (as defined in Rule 30a-3(d) under the Investment Company Act) that occurred during the second fiscal quarter of the period covered by this report that has materially affected, or is reasonably likely to materially affect, the Trust’s internal control over financial reporting.
Item 12.
Exhibits
| | |
(a) | (1) | Not applicable. |
(a) | (2) | Certification pursuant to Rule 30a-2(a) under the Investment Company Act of 1940 (17 CFR 270.30a-2(a)) is filed and attached hereto as Exhibit 99.CERT. |
(a) | (3) | Not applicable. |
(b) |
| Certification pursuant to Rule 30a-2(b) under the Investment Company Act of 1940 (17 CFR 270.30a-2(b)) is furnished and attached hereto as Exhibit 99.906CERT. |
SIGNATURES
Pursuant to the requirements of the Securities Exchange Act of 1934 and the Investment Company Act of 1940, the registrant has duly caused this report to be signed on its behalf by the undersigned, thereunto duly authorized.
Fidelity Aberdeen Street Trust
| |
By: | /s/Stephanie J. Dorsey |
| Stephanie J. Dorsey |
| President and Treasurer |
|
|
Date: | December 5, 2016 |
Pursuant to the requirements of the Securities Exchange Act of 1934 and the Investment Company Act of 1940, this report has been signed below by the following persons on behalf of the registrant and in the capacities and on the dates indicated.
| |
By: | /s/Stephanie J. Dorsey |
| Stephanie J. Dorsey |
| President and Treasurer |
|
|
Date: | December 5, 2016 |
| |
By: | /s/Howard J. Galligan III |
| Howard J. Galligan III |
| Chief Financial Officer |
|
|
Date: | December 5, 2016 |