UNITED STATES
SECURITIES AND EXCHANGE COMMISSION
Washington, D.C. 20549
FORM N-CSR
CERTIFIED SHAREHOLDER REPORT OF REGISTERED
MANAGEMENT INVESTMENT COMPANIES
Investment Company Act file number 811-6440
Fidelity Aberdeen Street Trust
(Exact name of registrant as specified in charter)
245 Summer St., Boston, MA 02210
(Address of principal executive offices) (Zip code)
William C. Coffey, Secretary
245 Summer St.
Boston, Massachusetts 02210
(Name and address of agent for service)
Registrant's telephone number, including area code:
617-563-7000
| |
Date of fiscal year end: | March 31 |
|
|
Date of reporting period: | September 30, 2018 |
Item 1.
Reports to Stockholders
Fidelity Freedom® Index Funds - Income, 2005, 2010, 2015, 2020, 2025, 2030, 2035, 2040, 2045, 2050, 2055, 2060
Investor Class and Institutional Premium Class
Semi-Annual Report September 30, 2018 |
 |
Contents
To view a fund's proxy voting guidelines and proxy voting record for the 12-month period ended June 30, visit http://www.fidelity.com/proxyvotingresults or visit the Securities and Exchange Commission's (SEC) web site at http://www.sec.gov.
You may also call 1-800-835-5092 to request a free copy of the proxy voting guidelines.
You may also call 1-800-835-5092 (plan accounts and Institutional Premium Class) or 1-800-544-8544 (all other accounts) to request a free copy of the proxy voting guidelines.
Standard & Poor's, S&P and S&P 500 are registered service marks of The McGraw-Hill Companies, Inc. and have been licensed for use by Fidelity Distributors Corporation.
Other third-party marks appearing herein are the property of their respective owners.
All other marks appearing herein are registered or unregistered trademarks or service marks of FMR LLC or an affiliated company. © 2018 FMR LLC. All rights reserved.
This report and the financial statements contained herein are submitted for the general information of the shareholders of the Funds. This report is not authorized for distribution to prospective investors in the Funds unless preceded or accompanied by an effective prospectus.
A fund files its complete schedule of portfolio holdings with the SEC for the first and third quarters of each fiscal year on Form N-Q. Forms N-Q are available on the SEC’s web site at http://www.sec.gov. A fund's Forms N-Q may be reviewed and copied at the SEC’s Public Reference Room in Washington, DC. Information regarding the operation of the SEC's Public Reference Room may be obtained by calling 1-800-SEC-0330.
For a complete list of a fund's portfolio holdings, view the most recent holdings listing, semiannual report, or annual report on Fidelity's web site at http://www.fidelity.com, http://www.institutional.fidelity.com, or http://www.401k.com, as applicable.
NOT FDIC INSURED •MAY LOSE VALUE •NO BANK GUARANTEE
Neither the Funds nor Fidelity Distributors Corporation is a bank.
Note to shareholders:
At its May 2018 meeting, the Board of Trustees approved incremental updates to the strategic asset allocation (i.e., glide path) of Fidelity Freedom Index Funds, adding U.S. Treasury Inflation-Protected Securities and long-term U.S. Treasury bonds as fixed exposures in the Funds’ bond allocations, while removing commodities and slightly reducing the equity and short-term debt allocations for shorter-dated Funds. These updates are expected to be fully implemented by the end of 2018.
Fidelity Freedom® Index Income Fund
Investment Summary (Unaudited)
The information in the following tables is based on the direct investments of the Fund.
Top Holdings as of September 30, 2018
| | % of fund's net assets |
| Fidelity U.S. Bond Index Fund Class F | 45.5 |
| Fidelity Series Treasury Bill Index Fund | 22.6 |
| Fidelity Total Market Index Fund Class F | 13.4 |
| Fidelity Series Inflation-Protected Bond Index Fund | 9.9 |
| Fidelity Series Global ex U.S. Index Fund | 5.7 |
| Fidelity Series Long-Term Treasury Bond Index Fund | 2.9 |
| | 100.0 |
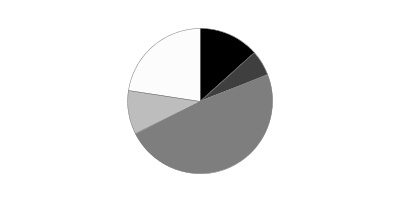
Asset Allocation (% of fund's net assets)
| Period end |
| | Domestic Equity Funds | 13.4% |
| | International Equity Funds | 5.7% |
| | Bond Funds | 48.4% |
| | Inflation-Protected Bond Funds | 9.9% |
| | Short-Term Funds | 22.6% |
Fidelity Freedom® Index Income Fund
Schedule of Investments September 30, 2018 (Unaudited)
Showing Percentage of Net Assets
| Domestic Equity Funds - 13.4% | | | |
| | | Shares | Value |
| Fidelity Total Market Index Fund Class F (a) | | | |
| (Cost $19,348,138) | | 513,331 | 43,196,766 |
|
| International Equity Funds - 5.7% | | | |
| Fidelity Series Global ex U.S. Index Fund (a) | | | |
| (Cost $14,900,066) | | 1,441,230 | 18,519,811 |
|
| Bond Funds - 48.4% | | | |
| Fidelity Series Long-Term Treasury Bond Index Fund (a) | | 1,142,904 | 9,417,525 |
| Fidelity U.S. Bond Index Fund Class F (a) | | 13,157,056 | 146,964,316 |
| TOTAL BOND FUNDS | | | |
| (Cost $160,573,386) | | | 156,381,841 |
|
| Inflation-Protected Bond Funds - 9.9% | | | |
| Fidelity Series Inflation-Protected Bond Index Fund (a) | | | |
| (Cost $33,329,917) | | 3,305,331 | 32,094,760 |
|
| Short-Term Funds - 22.6% | | | |
| Fidelity Series Treasury Bill Index Fund (a) | | | |
| (Cost $72,868,692) | | 7,286,869 | 72,868,692 |
| TOTAL INVESTMENT IN SECURITIES - 100.0% | | | |
| (Cost $301,020,199) | | | 323,061,870 |
| NET OTHER ASSETS (LIABILITIES) - 0.0% | | | (22,350) |
| NET ASSETS - 100% | | | $323,039,520 |
Legend
(a) Affiliated Fund
Affiliated Underlying Funds
Fiscal year to date information regarding the Fund's investments in affiliated Underlying Funds, excluding any Money Market Central Funds, is presented below. Exchanges between classes of the same affiliated Underlying Funds may occur.
| Affiliate | Value, beginning of period | Purchases | Sales Proceeds | Dividend Income | Realized Gain (loss) | Change in Unrealized appreciation (depreciation) | Value, end of period |
| Fidelity Commodity Strategy Fund Class F | $3,156,179 | $314,220 | $3,402,568 | $-- | $86,287 | $(154,118) | $-- |
| Fidelity Series Global ex U.S. Index Fund | 20,722,646 | 3,350,868 | 5,030,213 | -- | 60,815 | (584,305) | 18,519,811 |
| Fidelity Series Government Money Market Fund 2.12% | 87,010,072 | 10,442,274 | 97,452,346 | 662,829 | -- | -- | -- |
| Fidelity Series Inflation-Protected Bond Index Fund | 17,437,302 | 15,695,473 | 1,000,243 | 36,757 | 848 | (38,620) | 32,094,760 |
| Fidelity Series Long-Term Treasury Bond Index Fund | -- | 9,753,918 | 69,787 | 44,938 | (438) | (266,168) | 9,417,525 |
| Fidelity Series Treasury Bill Index Fund | -- | 73,408,985 | 540,293 | 159,707 | -- | -- | 72,868,692 |
| Fidelity Total Market Index Fund Class F | 45,648,675 | 6,903,470 | 14,222,697 | 164,601 | 2,218,128 | 2,649,190 | 43,196,766 |
| Fidelity U.S. Bond Index Fund Class F | 116,416,217 | 38,601,975 | 6,098,776 | 1,778,977 | (23,721) | (1,931,379) | 146,964,316 |
| | $290,391,091 | $158,471,183 | $127,816,923 | $2,847,809 | $2,341,919 | $(325,400) | $323,061,870 |
Amounts in the income column in the above table include any capital gain distributions from underlying funds, which are presented in the corresponding line-item in the Statement of Operations if applicable.
Investment Valuation
All investments are categorized as Level 1 under the Fair Value Hierarchy. The inputs or methodology used for valuing securities may not be an indication of the risk associated with investing in those securities. For more information on valuation inputs please refer to the Investment Valuation section in the accompanying Notes to Financial Statements.
See accompanying notes which are an integral part of the financial statements.
Fidelity Freedom® Index Income Fund
Financial Statements
Statement of Assets and Liabilities
| | | September 30, 2018 (Unaudited) |
| Assets | | |
Investment in securities, at value — See accompanying schedule:
| | |
| Affiliated issuers (cost $301,020,199) | $323,061,870 | |
| Total Investment in Securities (cost $301,020,199) | | $323,061,870 |
| Cash | | 4 |
| Receivable for investments sold | | 442,429 |
| Receivable for fund shares sold | | 396,965 |
| Receivable from investment adviser for expense reductions | | 9,137 |
| Total assets | | 323,910,405 |
| Liabilities | | |
| Payable for investments purchased | $207,467 | |
| Payable for fund shares redeemed | 630,744 | |
| Transfer agent fees payable | 32,674 | |
| Total liabilities | | 870,885 |
| Net Assets | | $323,039,520 |
| Net Assets consist of: | | |
| Paid in capital | | $299,122,580 |
| Undistributed net investment income | | 539,188 |
| Accumulated undistributed net realized gain (loss) on investments | | 1,336,081 |
| Net unrealized appreciation (depreciation) on investments | | 22,041,671 |
| Net Assets | | $323,039,520 |
| Investor Class: | | |
| Net Asset Value, offering price and redemption price per share ($147,328,148 ÷ 12,344,394 shares) | | $11.93 |
| Institutional Premium Class: | | |
| Net Asset Value, offering price and redemption price per share ($175,711,372 ÷ 14,737,881 shares) | | $11.92 |
See accompanying notes which are an integral part of the financial statements.
Statement of Operations
| | | Six months ended September 30, 2018 (Unaudited) |
| Investment Income | | |
| Dividends: | | |
| Affiliated issuers | | $2,838,151 |
| Expenses | | |
| Transfer agent fees | $191,133 | |
| Independent trustees' fees and expenses | 741 | |
| Total expenses before reductions | 191,874 | |
| Expense reductions | (49,970) | |
| Total expenses after reductions | | 141,904 |
| Net investment income (loss) | | 2,696,247 |
| Realized and Unrealized Gain (Loss) | | |
| Net realized gain (loss) on: | | |
| Investment securities: | | |
| Affiliated issuers | 2,341,919 | |
| Capital gain distributions from underlying funds: | | |
| Affiliated issuers | 9,658 | |
| Total net realized gain (loss) | | 2,351,577 |
| Change in net unrealized appreciation (depreciation) on: | | |
| Investment securities: | | |
| Affiliated issuers | (325,400) | |
| Total change in net unrealized appreciation (depreciation) | | (325,400) |
| Net gain (loss) | | 2,026,177 |
| Net increase (decrease) in net assets resulting from operations | | $4,722,424 |
See accompanying notes which are an integral part of the financial statements.
Statement of Changes in Net Assets
| | Six months ended September 30, 2018 (Unaudited) | Year ended March 31, 2018 |
| Increase (Decrease) in Net Assets | | |
| Operations | | |
| Net investment income (loss) | $2,696,247 | $4,737,255 |
| Net realized gain (loss) | 2,351,577 | 392,551 |
| Change in net unrealized appreciation (depreciation) | (325,400) | 5,485,884 |
| Net increase (decrease) in net assets resulting from operations | 4,722,424 | 10,615,690 |
| Distributions to shareholders from net investment income | (2,584,819) | (4,573,579) |
| Distributions to shareholders from net realized gain | – | (992,287) |
| Total distributions | (2,584,819) | (5,565,866) |
| Share transactions - net increase (decrease) | 30,535,166 | 20,903,404 |
| Total increase (decrease) in net assets | 32,672,771 | 25,953,228 |
| Net Assets | | |
| Beginning of period | 290,366,749 | 264,413,521 |
| End of period | $323,039,520 | $290,366,749 |
| Other Information | | |
| Undistributed net investment income end of period | $539,188 | $427,760 |
See accompanying notes which are an integral part of the financial statements.
Financial Highlights
Fidelity Freedom Index Income Fund Investor Class
| | Six months ended (Unaudited) September 30, | Years endedMarch 31, | | | | |
| | 2018 | 2018 | 2017 | 2016 | 2015 | 2014 |
| Selected Per–Share Data | | | | | | |
| Net asset value, beginning of period | $11.86 | $11.63 | $11.36 | $11.52 | $11.32 | $11.13 |
| Income from Investment Operations | | | | | | |
| Net investment income (loss)A | .10 | .20 | .17 | .16 | .17 | .13 |
| Net realized and unrealized gain (loss) | .07 | .27 | .28 | (.15) | .26 | .20 |
| Total from investment operations | .17 | .47 | .45 | .01 | .43 | .33 |
| Distributions from net investment income | (.10) | (.19) | (.17) | (.16) | (.16) | (.12) |
| Distributions from net realized gain | – | (.04) | (.01) | (.01) | (.07) | (.02) |
| Total distributions | (.10) | (.24)B | (.18) | (.17) | (.23) | (.14) |
| Net asset value, end of period | $11.93 | $11.86 | $11.63 | $11.36 | $11.52 | $11.32 |
| Total ReturnC,D | 1.42% | 4.02% | 4.02% | .10% | 3.83% | 2.98% |
| Ratios to Average Net AssetsE,F | | | | | | |
| Expenses before reductions | .15%G | .15% | .15% | .15% | .15% | .15% |
| Expenses net of fee waivers, if any | .12%G | .12% | .08% | .07% | .08% | .08% |
| Expenses net of all reductions | .12%G | .12% | .08% | .07% | .08% | .08% |
| Net investment income (loss) | 1.70%G | 1.69% | 1.48% | 1.39% | 1.49% | 1.20% |
| Supplemental Data | | | | | | |
| Net assets, end of period (000 omitted) | $147,328 | $126,634 | $118,421 | $140,481 | $244,260 | $164,926 |
| Portfolio turnover rateF | 82%G | 17% | 52% | 22% | 20%H | 43% |
A Calculated based on average shares outstanding during the period.
B Total distributions of $.24 per share is comprised of distributions from net investment income of $.192 and distributions from net realized gain of $.043 per share.
C Total returns for periods of less than one year are not annualized.
D Total returns would have been lower if certain expenses had not been reduced during the applicable periods shown.
E Expense ratios reflect operating expenses of the class. Expenses before reductions do not reflect amounts reimbursed by the investment adviser or reductions from expense offset arrangements and do not represent the amount paid by the class during periods when reimbursements or reductions occur. Expenses net of fee waivers reflect expenses after reimbursement by the investment adviser but prior to reductions from expense offset arrangements. Expenses net of all reductions represent the net expenses paid by the class.
F Amount does not include the portfolio activity of any Underlying Funds.
G Annualized
H The portfolio turnover rate does not include the assets acquired in the merger.
See accompanying notes which are an integral part of the financial statements.
Fidelity Freedom Index Income Fund Institutional Premium Class
| | Six months ended (Unaudited) September 30, | Years endedMarch 31, | | |
| | 2018 | 2018 | 2017 | 2016 A |
| Selected Per–Share Data | | | | |
| Net asset value, beginning of period | $11.84 | $11.61 | $11.35 | $11.48 |
| Income from Investment Operations | | | | |
| Net investment income (loss)B | .10 | .21 | .18 | .18 |
| Net realized and unrealized gain (loss) | .08 | .26 | .27 | (.15) |
| Total from investment operations | .18 | .47 | .45 | .03 |
| Distributions from net investment income | (.10) | (.20) | (.18) | (.15) |
| Distributions from net realized gain | – | (.04) | (.01) | (.01) |
| Total distributions | (.10) | (.24) | (.19) | (.16) |
| Net asset value, end of period | $11.92 | $11.84 | $11.61 | $11.35 |
| Total ReturnC,D | 1.53% | 4.07% | 4.00% | .26% |
| Ratios to Average Net AssetsE,F | | | | |
| Expenses before reductions | .10%G | .10% | .09% | .05%G |
| Expenses net of fee waivers, if any | .07%G | .07% | .03% | .01%G |
| Expenses net of all reductions | .07%G | .07% | .03% | .01%G |
| Net investment income (loss) | 1.75%G | 1.74% | 1.54% | 2.12%G |
| Supplemental Data | | | | |
| Net assets, end of period (000 omitted) | $175,711 | $163,733 | $145,993 | $108,865 |
| Portfolio turnover rateF | 82%G | 17% | 52% | 22% |
A For the period June 24, 2015 (commencement of sale of shares) to March 31, 2016.
B Calculated based on average shares outstanding during the period.
C Total returns for periods of less than one year are not annualized.
D Total returns would have been lower if certain expenses had not been reduced during the applicable periods shown.
E Expense ratios reflect operating expenses of the class. Expenses before reductions do not reflect amounts reimbursed by the investment adviser or reductions from expense offset arrangements and do not represent the amount paid by the class during periods when reimbursements or reductions occur. Expense ratios before reductions for start-up periods may not be representative of longer-term operating periods. Expenses net of fee waivers reflect expenses after reimbursement by the investment adviser but prior to reductions from expense offset arrangements. Expenses net of all reductions represent the net expenses paid by the class.
F Amount does not include the portfolio activity of any Underlying Funds.
G Annualized
See accompanying notes which are an integral part of the financial statements.
Fidelity Freedom® Index 2005 Fund
Investment Summary (Unaudited)
The information in the following tables is based on the direct investments of the Fund.
Top Holdings as of September 30, 2018
| | % of fund's net assets |
| Fidelity U.S. Bond Index Fund Class F | 42.4 |
| Fidelity Total Market Index Fund Class F | 19.5 |
| Fidelity Series Treasury Bill Index Fund | 18.4 |
| Fidelity Series Global ex U.S. Index Fund | 8.4 |
| Fidelity Series Inflation-Protected Bond Index Fund | 8.4 |
| Fidelity Series Long-Term Treasury Bond Index Fund | 2.9 |
| | 100.0 |
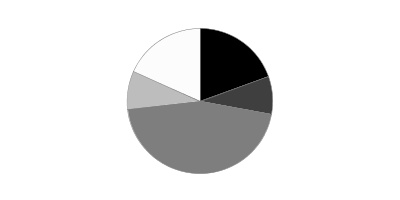
Asset Allocation (% of fund's net assets)
| Period end |
| | Domestic Equity Funds | 19.5% |
| | International Equity Funds | 8.4% |
| | Bond Funds | 45.3% |
| | Inflation-Protected Bond Funds | 8.4% |
| | Short-Term Funds | 18.4% |
Fidelity Freedom® Index 2005 Fund
Schedule of Investments September 30, 2018 (Unaudited)
Showing Percentage of Net Assets
| Domestic Equity Funds - 19.5% | | | |
| | | Shares | Value |
| Fidelity Total Market Index Fund Class F (a) | | | |
| (Cost $9,908,361) | | 267,438 | 22,504,885 |
|
| International Equity Funds - 8.4% | | | |
| Fidelity Series Global ex U.S. Index Fund (a) | | | |
| (Cost $8,026,054) | | 758,019 | 9,740,544 |
|
| Bond Funds - 45.3% | | | |
| Fidelity Series Long-Term Treasury Bond Index Fund (a) | | 410,015 | 3,378,523 |
| Fidelity U.S. Bond Index Fund Class F (a) | | 4,380,638 | 48,931,726 |
| TOTAL BOND FUNDS | | | |
| (Cost $53,847,343) | | | 52,310,249 |
|
| Inflation-Protected Bond Funds - 8.4% | | | |
| Fidelity Series Inflation-Protected Bond Index Fund (a) | | | |
| (Cost $10,020,327) | | 999,611 | 9,706,221 |
|
| Short-Term Funds - 18.4% | | | |
| Fidelity Series Treasury Bill Index Fund (a) | | | |
| (Cost $21,291,488) | | 2,129,149 | 21,291,488 |
| TOTAL INVESTMENT IN SECURITIES - 100.0% | | | |
| (Cost $103,093,573) | | | 115,553,387 |
| NET OTHER ASSETS (LIABILITIES) - 0.0% | | | (8,246) |
| NET ASSETS - 100% | | | $115,545,141 |
Legend
(a) Affiliated Fund
Affiliated Underlying Funds
Fiscal year to date information regarding the Fund's investments in affiliated Underlying Funds, excluding any Money Market Central Funds, is presented below. Exchanges between classes of the same affiliated Underlying Funds may occur.
| Affiliate | Value, beginning of period | Purchases | Sales Proceeds | Dividend Income | Realized Gain (loss) | Change in Unrealized appreciation (depreciation) | Value, end of period |
| Fidelity Commodity Strategy Fund Class F | $1,212,894 | $63,617 | $1,252,923 | $-- | $31,879 | $(55,467) | $-- |
| Fidelity Series Global ex U.S. Index Fund | 11,171,164 | 1,138,911 | 2,319,390 | -- | 19,042 | (269,183) | 9,740,544 |
| Fidelity Series Government Money Market Fund 2.12% | 27,224,733 | 1,940,164 | 29,164,897 | 195,571 | -- | -- | -- |
| Fidelity Series Inflation-Protected Bond Index Fund | 5,796,442 | 4,462,429 | 541,141 | 11,360 | 512 | (12,021) | 9,706,221 |
| Fidelity Series Long-Term Treasury Bond Index Fund | -- | 3,559,494 | 84,061 | 16,287 | (829) | (96,081) | 3,378,523 |
| Fidelity Series Treasury Bill Index Fund | -- | 21,522,546 | 231,058 | 47,007 | -- | -- | 21,291,488 |
| Fidelity Total Market Index Fund Class F | 25,037,660 | 2,171,745 | 7,211,501 | 89,455 | 1,090,199 | 1,416,782 | 22,504,885 |
| Fidelity U.S. Bond Index Fund Class F | 42,778,527 | 10,303,928 | 3,469,803 | 608,680 | (1,524) | (679,402) | 48,931,726 |
| | $113,221,420 | $45,162,834 | $44,274,774 | $968,360 | $1,139,279 | $304,628 | $115,553,387 |
Amounts in the income column in the above table include any capital gain distributions from underlying funds, which are presented in the corresponding line-item in the Statement of Operations if applicable.
Investment Valuation
All investments are categorized as Level 1 under the Fair Value Hierarchy. The inputs or methodology used for valuing securities may not be an indication of the risk associated with investing in those securities. For more information on valuation inputs please refer to the Investment Valuation section in the accompanying Notes to Financial Statements.
See accompanying notes which are an integral part of the financial statements.
Fidelity Freedom® Index 2005 Fund
Financial Statements
Statement of Assets and Liabilities
| | | September 30, 2018 (Unaudited) |
| Assets | | |
Investment in securities, at value — See accompanying schedule:
| | |
| Affiliated issuers (cost $103,093,573) | $115,553,387 | |
| Total Investment in Securities (cost $103,093,573) | | $115,553,387 |
| Cash | | 2 |
| Receivable for investments sold | | 237,118 |
| Receivable for fund shares sold | | 81,072 |
| Receivable from investment adviser for expense reductions | | 3,438 |
| Total assets | | 115,875,017 |
| Liabilities | | |
| Payable for investments purchased | $196,511 | |
| Payable for fund shares redeemed | 121,214 | |
| Transfer agent fees payable | 12,151 | |
| Total liabilities | | 329,876 |
| Net Assets | | $115,545,141 |
| Net Assets consist of: | | |
| Paid in capital | | $101,524,940 |
| Undistributed net investment income | | 892,746 |
| Accumulated undistributed net realized gain (loss) on investments | | 667,641 |
| Net unrealized appreciation (depreciation) on investments | | 12,459,814 |
| Net Assets | | $115,545,141 |
| Investor Class: | | |
| Net Asset Value, offering price and redemption price per share ($60,353,303 ÷ 4,439,489 shares) | | $13.59 |
| Institutional Premium Class: | | |
| Net Asset Value, offering price and redemption price per share ($55,191,838 ÷ 4,058,682 shares) | | $13.60 |
See accompanying notes which are an integral part of the financial statements.
Statement of Operations
| | | Six months ended September 30, 2018 (Unaudited) |
| Investment Income | | |
| Dividends: | | |
| Affiliated issuers | | $963,111 |
| Expenses | | |
| Transfer agent fees | $72,073 | |
| Independent trustees' fees and expenses | 275 | |
| Total expenses before reductions | 72,348 | |
| Expense reductions | (19,030) | |
| Total expenses after reductions | | 53,318 |
| Net investment income (loss) | | 909,793 |
| Realized and Unrealized Gain (Loss) | | |
| Net realized gain (loss) on: | | |
| Investment securities: | | |
| Affiliated issuers | 1,139,279 | |
| Capital gain distributions from underlying funds: | | |
| Affiliated issuers | 5,249 | |
| Total net realized gain (loss) | | 1,144,528 |
| Change in net unrealized appreciation (depreciation) on: | | |
| Investment securities: | | |
| Affiliated issuers | 304,628 | |
| Total change in net unrealized appreciation (depreciation) | | 304,628 |
| Net gain (loss) | | 1,449,156 |
| Net increase (decrease) in net assets resulting from operations | | $2,358,949 |
See accompanying notes which are an integral part of the financial statements.
Statement of Changes in Net Assets
| | Six months ended September 30, 2018 (Unaudited) | Year ended March 31, 2018 |
| Increase (Decrease) in Net Assets | | |
| Operations | | |
| Net investment income (loss) | $909,793 | $1,789,880 |
| Net realized gain (loss) | 1,144,528 | 135,404 |
| Change in net unrealized appreciation (depreciation) | 304,628 | 3,048,242 |
| Net increase (decrease) in net assets resulting from operations | 2,358,949 | 4,973,526 |
| Distributions to shareholders from net investment income | (352,678) | (1,657,960) |
| Distributions to shareholders from net realized gain | – | (480,582) |
| Total distributions | (352,678) | (2,138,542) |
| Share transactions - net increase (decrease) | 327,238 | 19,616,925 |
| Total increase (decrease) in net assets | 2,333,509 | 22,451,909 |
| Net Assets | | |
| Beginning of period | 113,211,632 | 90,759,723 |
| End of period | $115,545,141 | $113,211,632 |
| Other Information | | |
| Undistributed net investment income end of period | $892,746 | $335,631 |
See accompanying notes which are an integral part of the financial statements.
Financial Highlights
Fidelity Freedom Index 2005 Fund Investor Class
| | Six months ended (Unaudited) September 30, | Years endedMarch 31, | | | | |
| | 2018 | 2018 | 2017 | 2016 | 2015 | 2014 |
| Selected Per–Share Data | | | | | | |
| Net asset value, beginning of period | $13.36 | $12.94 | $12.45 | $12.71 | $12.50 | $11.91 |
| Income from Investment Operations | | | | | | |
| Net investment income (loss)A | .11 | .23 | .20 | .20 | .21 | .16 |
| Net realized and unrealized gain (loss) | .16 | .47 | .52 | (.25) | .39 | .46 |
| Total from investment operations | .27 | .70 | .72 | (.05) | .60 | .62 |
| Distributions from net investment income | (.04) | (.21) | (.20) | (.20) | (.33) | (.01) |
| Distributions from net realized gain | – | (.07) | (.03) | –B | (.06) | (.02) |
| Total distributions | (.04) | (.28) | (.23) | (.21)C | (.39) | (.03) |
| Net asset value, end of period | $13.59 | $13.36 | $12.94 | $12.45 | $12.71 | $12.50 |
| Total ReturnD,E | 2.03% | 5.41% | 5.84% | (.40)% | 4.87% | 5.25% |
| Ratios to Average Net AssetsF,G | | | | | | |
| Expenses before reductions | .15%H | .15% | .15% | .15% | .15% | .15% |
| Expenses net of fee waivers, if any | .12%H | .12% | .09% | .07% | .08% | .08% |
| Expenses net of all reductions | .12%H | .12% | .09% | .07% | .08% | .08% |
| Net investment income (loss) | 1.57%H | 1.74% | 1.60% | 1.58% | 1.65% | 1.29% |
| Supplemental Data | | | | | | |
| Net assets, end of period (000 omitted) | $60,353 | $60,299 | $43,767 | $50,790 | $74,516 | $66,401 |
| Portfolio turnover rateG | 78%H | 26% | 52% | 28% | 22% | 49% |
A Calculated based on average shares outstanding during the period.
B Amount represents less than $.005 per share.
C Total distributions of $.21 per share is comprised of distributions from net investment income of $.203 and distributions from net realized gain of $.004 per share.
D Total returns for periods of less than one year are not annualized.
E Total returns would have been lower if certain expenses had not been reduced during the applicable periods shown.
F Expense ratios reflect operating expenses of the class. Expenses before reductions do not reflect amounts reimbursed by the investment adviser or reductions from expense offset arrangements and do not represent the amount paid by the class during periods when reimbursements or reductions occur. Expenses net of fee waivers reflect expenses after reimbursement by the investment adviser but prior to reductions from expense offset arrangements. Expenses net of all reductions represent the net expenses paid by the class.
G Amount does not include the portfolio activity of any Underlying Funds.
H Annualized
See accompanying notes which are an integral part of the financial statements.
Fidelity Freedom Index 2005 Fund Institutional Premium Class
| | Six months ended (Unaudited) September 30, | Years endedMarch 31, | | |
| | 2018 | 2018 | 2017 | 2016 A |
| Selected Per–Share Data | | | | |
| Net asset value, beginning of period | $13.36 | $12.94 | $12.45 | $12.73 |
| Income from Investment Operations | | | | |
| Net investment income (loss)B | .11 | .24 | .21 | .21 |
| Net realized and unrealized gain (loss) | .17 | .46 | .52 | (.30) |
| Total from investment operations | .28 | .70 | .73 | (.09) |
| Distributions from net investment income | (.04) | (.22) | (.21) | (.18) |
| Distributions from net realized gain | – | (.07) | (.03) | –C |
| Total distributions | (.04) | (.28)D | (.24) | (.19)E |
| Net asset value, end of period | $13.60 | $13.36 | $12.94 | $12.45 |
| Total ReturnF,G | 2.12% | 5.45% | 5.90% | (.73)% |
| Ratios to Average Net AssetsH,I | | | | |
| Expenses before reductions | .10%J | .10% | .09% | .05%J |
| Expenses net of fee waivers, if any | .06%J | .07% | .03% | .01%J |
| Expenses net of all reductions | .06%J | .07% | .03% | .01%J |
| Net investment income (loss) | 1.63%J | 1.79% | 1.66% | 2.28%J |
| Supplemental Data | | | | |
| Net assets, end of period (000 omitted) | $55,192 | $52,913 | $46,992 | $28,910 |
| Portfolio turnover rateI | 78%J | 26% | 52% | 28% |
A For the period June 24, 2015 (commencement of sale of shares) to March 31, 2016.
B Calculated based on average shares outstanding during the period.
C Amount represents less than $.005 per share.
D Total distributions of $.28 per share is comprised of distributions from net investment income of $.217 and distributions from net realized gain of $.066 per share.
E Total distributions of $.19 per share is comprised of distributions from net investment income of $.181 and distributions from net realized gain of $.004 per share.
F Total returns for periods of less than one year are not annualized.
G Total returns would have been lower if certain expenses had not been reduced during the applicable periods shown.
H Expense ratios reflect operating expenses of the class. Expenses before reductions do not reflect amounts reimbursed by the investment adviser or reductions from expense offset arrangements and do not represent the amount paid by the class during periods when reimbursements or reductions occur. Expense ratios before reductions for start-up periods may not be representative of longer-term operating periods. Expenses net of fee waivers reflect expenses after reimbursement by the investment adviser but prior to reductions from expense offset arrangements. Expenses net of all reductions represent the net expenses paid by the class.
I Amount does not include the portfolio activity of any Underlying Funds.
J Annualized
See accompanying notes which are an integral part of the financial statements.
Fidelity Freedom® Index 2010 Fund
Investment Summary (Unaudited)
The information in the following tables is based on the direct investments of the Fund.
Top Holdings as of September 30, 2018
| | % of fund's net assets |
| Fidelity U.S. Bond Index Fund Class F | 38.7 |
| Fidelity Total Market Index Fund Class F | 25.9 |
| Fidelity Series Treasury Bill Index Fund | 14.2 |
| Fidelity Series Global ex U.S. Index Fund | 11.2 |
| Fidelity Series Inflation-Protected Bond Index Fund | 7.0 |
| Fidelity Series Long-Term Treasury Bond Index Fund | 3.0 |
| | 100.0 |
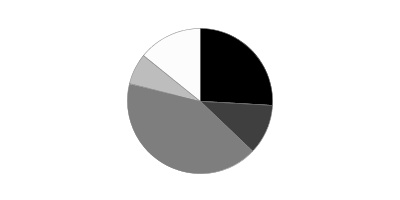
Asset Allocation (% of fund's net assets)
| Period end |
| | Domestic Equity Funds | 25.9% |
| | International Equity Funds | 11.2% |
| | Bond Funds | 41.7% |
| | Inflation-Protected Bond Funds | 7.0% |
| | Short-Term Funds | 14.2% |
Fidelity Freedom® Index 2010 Fund
Schedule of Investments September 30, 2018 (Unaudited)
Showing Percentage of Net Assets
| Domestic Equity Funds - 25.9% | | | |
| | | Shares | Value |
| Fidelity Total Market Index Fund Class F (a) | | | |
| (Cost $59,746,326) | | 1,727,958 | 145,407,657 |
|
| International Equity Funds - 11.2% | | | |
| Fidelity Series Global ex U.S. Index Fund (a) | | | |
| (Cost $49,994,474) | | 4,887,304 | 62,801,854 |
|
| Bond Funds - 41.7% | | | |
| Fidelity Series Long-Term Treasury Bond Index Fund (a) | | 2,003,606 | 16,509,714 |
| Fidelity U.S. Bond Index Fund Class F (a) | | 19,461,111 | 217,380,606 |
| TOTAL BOND FUNDS | | | |
| (Cost $240,578,072) | | | 233,890,320 |
|
| Inflation-Protected Bond Funds - 7.0% | | | |
| Fidelity Series Inflation-Protected Bond Index Fund (a) | | | |
| (Cost $40,427,707) | | 4,046,704 | 39,293,495 |
|
| Short-Term Funds - 14.2% | | | |
| Fidelity Series Treasury Bill Index Fund (a) | | | |
| (Cost $80,045,580) | | 8,004,558 | 80,045,580 |
| TOTAL INVESTMENT IN SECURITIES - 100.0% | | | |
| (Cost $470,792,159) | | | 561,438,906 |
| NET OTHER ASSETS (LIABILITIES) - 0.0% | | | (36,545) |
| NET ASSETS - 100% | | | $561,402,361 |
Legend
(a) Affiliated Fund
Affiliated Underlying Funds
Fiscal year to date information regarding the Fund's investments in affiliated Underlying Funds, excluding any Money Market Central Funds, is presented below. Exchanges between classes of the same affiliated Underlying Funds may occur.
| Affiliate | Value, beginning of period | Purchases | Sales Proceeds | Dividend Income | Realized Gain (loss) | Change in Unrealized appreciation (depreciation) | Value, end of period |
| Fidelity Commodity Strategy Fund Class F | $6,128,984 | $160,916 | $6,172,496 | $-- | $174,426 | $(291,830) | $-- |
| Fidelity Series Global ex U.S. Index Fund | 69,890,623 | 5,004,781 | 10,443,717 | -- | 306,167 | (1,956,000) | 62,801,854 |
| Fidelity Series Government Money Market Fund 2.12% | 104,377,971 | 5,402,970 | 109,780,941 | 754,269 | -- | -- | -- |
| Fidelity Series Inflation-Protected Bond Index Fund | 24,063,708 | 17,105,215 | 1,833,368 | 46,770 | (20,372) | (21,688) | 39,293,495 |
| Fidelity Series Long-Term Treasury Bond Index Fund | -- | 17,316,287 | 335,363 | 79,260 | (2,336) | (468,874) | 16,509,714 |
| Fidelity Series Treasury Bill Index Fund | -- | 80,636,930 | 591,350 | 177,212 | -- | -- | 80,045,580 |
| Fidelity Total Market Index Fund Class F | 157,960,054 | 7,482,977 | 36,024,432 | 566,558 | 11,116,011 | 4,873,047 | 145,407,657 |
| Fidelity U.S. Bond Index Fund Class F | 196,531,759 | 36,811,461 | 12,857,878 | 2,781,357 | (46,513) | (3,058,223) | 217,380,606 |
| | $558,953,099 | $169,921,537 | $178,039,545 | $4,405,426 | $11,527,383 | $(923,568) | $561,438,906 |
Amounts in the income column in the above table include any capital gain distributions from underlying funds, which are presented in the corresponding line-item in the Statement of Operations if applicable.
Investment Valuation
All investments are categorized as Level 1 under the Fair Value Hierarchy. The inputs or methodology used for valuing securities may not be an indication of the risk associated with investing in those securities. For more information on valuation inputs please refer to the Investment Valuation section in the accompanying Notes to Financial Statements.
See accompanying notes which are an integral part of the financial statements.
Fidelity Freedom® Index 2010 Fund
Financial Statements
Statement of Assets and Liabilities
| | | September 30, 2018 (Unaudited) |
| Assets | | |
Investment in securities, at value — See accompanying schedule:
| | |
| Affiliated issuers (cost $470,792,159) | $561,438,906 | |
| Total Investment in Securities (cost $470,792,159) | | $561,438,906 |
| Cash | | 5 |
| Receivable for investments sold | | 2,197,629 |
| Receivable for fund shares sold | | 282,057 |
| Receivable from investment adviser for expense reductions | | 18,190 |
| Total assets | | 563,936,787 |
| Liabilities | | |
| Payable for investments purchased | $339,811 | |
| Payable for fund shares redeemed | 2,137,867 | |
| Transfer agent fees payable | 56,748 | |
| Total liabilities | | 2,534,426 |
| Net Assets | | $561,402,361 |
| Net Assets consist of: | | |
| Paid in capital | | $456,983,466 |
| Undistributed net investment income | | 4,149,390 |
| Accumulated undistributed net realized gain (loss) on investments | | 9,622,758 |
| Net unrealized appreciation (depreciation) on investments | | 90,646,747 |
| Net Assets | | $561,402,361 |
| Investor Class: | | |
| Net Asset Value, offering price and redemption price per share ($237,514,479 ÷ 16,342,342 shares) | | $14.53 |
| Institutional Premium Class: | | |
| Net Asset Value, offering price and redemption price per share ($323,887,882 ÷ 22,282,476 shares) | | $14.54 |
See accompanying notes which are an integral part of the financial statements.
Statement of Operations
| | | Six months ended September 30, 2018 (Unaudited) |
| Investment Income | | |
| Dividends: | | |
| Affiliated issuers | | $4,372,183 |
| Expenses | | |
| Transfer agent fees | $341,714 | |
| Independent trustees' fees and expenses | 1,364 | |
| Total expenses before reductions | 343,078 | |
| Expense reductions | (101,248) | |
| Total expenses after reductions | | 241,830 |
| Net investment income (loss) | | 4,130,353 |
| Realized and Unrealized Gain (Loss) | | |
| Net realized gain (loss) on: | | |
| Investment securities: | | |
| Affiliated issuers | 11,527,383 | |
| Capital gain distributions from underlying funds: | | |
| Affiliated issuers | 33,243 | |
| Total net realized gain (loss) | | 11,560,626 |
| Change in net unrealized appreciation (depreciation) on: | | |
| Investment securities: | | |
| Affiliated issuers | (923,568) | |
| Total change in net unrealized appreciation (depreciation) | | (923,568) |
| Net gain (loss) | | 10,637,058 |
| Net increase (decrease) in net assets resulting from operations | | $14,767,411 |
See accompanying notes which are an integral part of the financial statements.
Statement of Changes in Net Assets
| | Six months ended September 30, 2018 (Unaudited) | Year ended March 31, 2018 |
| Increase (Decrease) in Net Assets | | |
| Operations | | |
| Net investment income (loss) | $4,130,353 | $9,438,265 |
| Net realized gain (loss) | 11,560,626 | 3,283,824 |
| Change in net unrealized appreciation (depreciation) | (923,568) | 19,510,988 |
| Net increase (decrease) in net assets resulting from operations | 14,767,411 | 32,233,077 |
| Distributions to shareholders from net investment income | (1,588,723) | (8,877,889) |
| Distributions to shareholders from net realized gain | (2,256,126) | (4,895,182) |
| Total distributions | (3,844,849) | (13,773,071) |
| Share transactions - net increase (decrease) | (8,428,068) | 49,007,232 |
| Total increase (decrease) in net assets | 2,494,494 | 67,467,238 |
| Net Assets | | |
| Beginning of period | 558,907,867 | 491,440,629 |
| End of period | $561,402,361 | $558,907,867 |
| Other Information | | |
| Undistributed net investment income end of period | $4,149,390 | $1,607,760 |
See accompanying notes which are an integral part of the financial statements.
Financial Highlights
Fidelity Freedom Index 2010 Fund Investor Class
| | Six months ended (Unaudited) September 30, | Years endedMarch 31, | | | | |
| | 2018 | 2018 | 2017 | 2016 | 2015 | 2014 |
| Selected Per–Share Data | | | | | | |
| Net asset value, beginning of period | $14.25 | $13.72 | $13.03 | $13.36 | $13.08 | $12.27 |
| Income from Investment Operations | | | | | | |
| Net investment income (loss)A | .10 | .25 | .23 | .20 | .23 | .18 |
| Net realized and unrealized gain (loss) | .28 | .65 | .71 | (.30) | .46 | .68 |
| Total from investment operations | .38 | .90 | .94 | (.10) | .69 | .86 |
| Distributions from net investment income | (.04) | (.24) | (.22) | (.23) | (.35) | (.02) |
| Distributions from net realized gain | (.06) | (.14) | (.02) | –B | (.05) | (.04) |
| Total distributions | (.10) | (.37)C | (.25)D | (.23) | (.41)E | (.05)F |
| Net asset value, end of period | $14.53 | $14.25 | $13.72 | $13.03 | $13.36 | $13.08 |
| Total ReturnG,H | 2.65% | 6.62% | 7.24% | (.72)% | 5.36% | 7.05% |
| Ratios to Average Net AssetsI,J | | | | | | |
| Expenses before reductions | .15%K | .15% | .15% | .15% | .15% | .15% |
| Expenses net of fee waivers, if any | .12%K | .12% | .09% | .08% | .08% | .09% |
| Expenses net of all reductions | .12%K | .12% | .09% | .08% | .08% | .09% |
| Net investment income (loss) | 1.43%K | 1.77% | 1.70% | 1.52% | 1.72% | 1.45% |
| Supplemental Data | | | | | | |
| Net assets, end of period (000 omitted) | $237,514 | $239,660 | $205,267 | $232,187 | $480,861 | $430,767 |
| Portfolio turnover rateJ | 60%K | 22% | 36% | 22% | 23% | 39% |
A Calculated based on average shares outstanding during the period.
B Amount represents less than $.005 per share.
C Total distributions of $.37 per share is comprised of distributions from net investment income of $.235 and distributions from net realized gain of $.137 per share.
D Total distributions of $.25 per share is comprised of distributions from net investment income of $.221 and distributions from net realized gain of $.024 per share.
E Total distributions of $.41 per share is comprised of distributions from net investment income of $.353 and distributions from net realized gain of $.055 per share.
F Total distributions of $.05 per share is comprised of distributions from net investment income of $.017 and distributions from net realized gain of $.035 per share.
G Total returns for periods of less than one year are not annualized.
H Total returns would have been lower if certain expenses had not been reduced during the applicable periods shown.
I Expense ratios reflect operating expenses of the class. Expenses before reductions do not reflect amounts reimbursed by the investment adviser or reductions from expense offset arrangements and do not represent the amount paid by the class during periods when reimbursements or reductions occur. Expenses net of fee waivers reflect expenses after reimbursement by the investment adviser but prior to reductions from expense offset arrangements. Expenses net of all reductions represent the net expenses paid by the class.
J Amount does not include the portfolio activity of any Underlying Funds.
K Annualized
See accompanying notes which are an integral part of the financial statements.
Fidelity Freedom Index 2010 Fund Institutional Premium Class
| | Six months ended (Unaudited) September 30, | Years endedMarch 31, | | |
| | 2018 | 2018 | 2017 | 2016 A |
| Selected Per–Share Data | | | | |
| Net asset value, beginning of period | $14.25 | $13.73 | $13.03 | $13.43 |
| Income from Investment Operations | | | | |
| Net investment income (loss)B | .11 | .26 | .24 | .27 |
| Net realized and unrealized gain (loss) | .28 | .64 | .71 | (.46) |
| Total from investment operations | .39 | .90 | .95 | (.19) |
| Distributions from net investment income | (.04) | (.24) | (.23) | (.21) |
| Distributions from net realized gain | (.06) | (.14) | (.02) | –C |
| Total distributions | (.10) | (.38) | (.25) | (.21) |
| Net asset value, end of period | $14.54 | $14.25 | $13.73 | $13.03 |
| Total ReturnD,E | 2.73% | 6.59% | 7.39% | (1.39)% |
| Ratios to Average Net AssetsF,G | | | | |
| Expenses before reductions | .10%H | .10% | .09% | .05%H |
| Expenses net of fee waivers, if any | .06%H | .07% | .04% | .02%H |
| Expenses net of all reductions | .06%H | .07% | .04% | .02%H |
| Net investment income (loss) | 1.49%H | 1.82% | 1.75% | 2.81%H |
| Supplemental Data | | | | |
| Net assets, end of period (000 omitted) | $323,888 | $319,248 | $286,173 | $215,392 |
| Portfolio turnover rateG | 60%H | 22% | 36% | 22% |
A For the period June 24, 2015 (commencement of sale of shares) to March 31, 2016.
B Calculated based on average shares outstanding during the period.
C Amount represents less than $.005 per share.
D Total returns for periods of less than one year are not annualized.
E Total returns would have been lower if certain expenses had not been reduced during the applicable periods shown.
F Expense ratios reflect operating expenses of the class. Expenses before reductions do not reflect amounts reimbursed by the investment adviser or reductions from expense offset arrangements and do not represent the amount paid by the class during periods when reimbursements or reductions occur. Expense ratios before reductions for start-up periods may not be representative of longer-term operating periods. Expenses net of fee waivers reflect expenses after reimbursement by the investment adviser but prior to reductions from expense offset arrangements. Expenses net of all reductions represent the net expenses paid by the class.
G Amount does not include the portfolio activity of any Underlying Funds.
H Annualized
See accompanying notes which are an integral part of the financial statements.
Fidelity Freedom® Index 2015 Fund
Investment Summary (Unaudited)
The information in the following tables is based on the direct investments of the Fund.
Top Holdings as of September 30, 2018
| | % of fund's net assets |
| Fidelity U.S. Bond Index Fund Class F | 34.9 |
| Fidelity Total Market Index Fund Class F | 32.3 |
| Fidelity Series Global ex U.S. Index Fund | 13.9 |
| Fidelity Series Treasury Bill Index Fund | 10.1 |
| Fidelity Series Inflation-Protected Bond Index Fund | 5.8 |
| Fidelity Series Long-Term Treasury Bond Index Fund | 3.0 |
| Fidelity Cash Central Fund, 2.11% | 0.0 |
| | 100.0 |
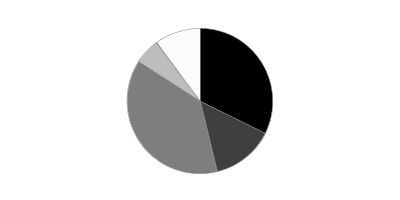
Asset Allocation (% of fund's net assets)
| Period end |
| | Domestic Equity Funds | 32.3% |
| | International Equity Funds | 13.9% |
| | Bond Funds | 37.9% |
| | Inflation-Protected Bond Funds | 5.8% |
| | Short-Term Funds | 10.1% |
Percentages shown as 0.0% may reflect amounts less than 0.05%.
Fidelity Freedom® Index 2015 Fund
Schedule of Investments September 30, 2018 (Unaudited)
Showing Percentage of Net Assets
| Domestic Equity Funds - 32.3% | | | |
| | | Shares | Value |
| Fidelity Total Market Index Fund Class F (a) | | | |
| (Cost $183,956,891) | | 4,890,223 | 411,512,273 |
|
| International Equity Funds - 13.9% | | | |
| Fidelity Series Global ex U.S. Index Fund (a) | | | |
| (Cost $146,482,017) | | 13,791,773 | 177,224,288 |
|
| Bond Funds - 37.9% | | | |
| Fidelity Series Long-Term Treasury Bond Index Fund (a) | | 4,566,866 | 37,630,979 |
| Fidelity U.S. Bond Index Fund Class F (a) | | 39,809,146 | 444,668,162 |
| TOTAL BOND FUNDS | | | |
| (Cost $497,444,426) | | | 482,299,141 |
|
| Inflation-Protected Bond Funds - 5.8% | | | |
| Fidelity Series Inflation-Protected Bond Index Fund (a) | | | |
| (Cost $75,584,043) | | 7,557,981 | 73,387,996 |
|
| Short-Term Funds - 10.1% | | | |
| Fidelity Cash Central Fund, 2.11% (b) | | 8 | 8 |
| Fidelity Series Treasury Bill Index Fund (a) | | 12,823,526 | 128,235,260 |
| TOTAL SHORT-TERM FUNDS | | | |
| (Cost $128,235,268) | | | 128,235,268 |
| TOTAL INVESTMENT IN SECURITIES - 100.0% | | | |
| (Cost $1,031,702,645) | | | 1,272,658,966 |
| NET OTHER ASSETS (LIABILITIES) - 0.0% | | | (75,632) |
| NET ASSETS - 100% | | | $1,272,583,334 |
Legend
(a) Affiliated Fund
(b) Affiliated fund that is generally available only to investment companies and other accounts managed by Fidelity Investments. The rate quoted is the annualized seven-day yield of the fund at period end. A complete unaudited listing of the fund's holdings as of its most recent quarter end is available upon request. In addition, each Fidelity Central Fund's financial statements are available on the SEC's website or upon request.
Affiliated Central Funds
Information regarding fiscal year to date income earned by the Fund from investments in Fidelity Central Funds is as follows:
| Fund | Income earned |
| Fidelity Cash Central Fund | 8 |
| Total | $8 |
Amounts in the income column in the above table include any capital gain distributions from underlying funds, which are presented in the corresponding line-item in the Statement of Operations if applicable.
Affiliated Underlying Funds
Fiscal year to date information regarding the Fund's investments in affiliated Underlying Funds, excluding any Money Market Central Funds, is presented below. Exchanges between classes of the same affiliated Underlying Funds may occur.
| Affiliate | Value, beginning of period | Purchases | Sales Proceeds | Dividend Income | Realized Gain (loss) | Change in Unrealized appreciation (depreciation) | Value, end of period |
| Fidelity Commodity Strategy Fund Class F | $13,941,549 | $815,494 | $14,465,739 | $-- | $370,610 | $(661,914) | $-- |
| Fidelity Series Global ex U.S. Index Fund | 181,915,405 | 19,686,573 | 19,933,427 | -- | (146,807) | (4,297,456) | 177,224,288 |
| Fidelity Series Government Money Market Fund 2.12% | 159,390,236 | 13,574,275 | 172,964,511 | 1,188,195 | -- | -- | -- |
| Fidelity Series Inflation-Protected Bond Index Fund | 41,930,197 | 33,866,107 | 2,318,635 | 87,660 | (672) | (89,001) | 73,387,996 |
| Fidelity Series Long-Term Treasury Bond Index Fund | -- | 39,220,024 | 521,106 | 178,859 | (3,892) | (1,064,047) | 37,630,979 |
| Fidelity Series Treasury Bill Index Fund | -- | 129,095,792 | 860,532 | 282,997 | -- | -- | 128,235,260 |
| Fidelity Total Market Index Fund Class F | 412,852,646 | 32,418,539 | 77,530,938 | 1,488,007 | 11,916,595 | 31,855,431 | 411,512,273 |
| Fidelity U.S. Bond Index Fund Class F | 387,717,936 | 81,925,478 | 18,718,267 | 5,651,177 | (46,064) | (6,210,921) | 444,668,162 |
| Total | $1,197,747,969 | $350,602,282 | $307,313,155 | $8,876,895 | $12,089,770 | $19,532,092 | $1,272,658,958 |
Amounts in the income column in the above table include any capital gain distributions from underlying funds, which are presented in the corresponding line-item in the Statement of Operations if applicable.
Investment Valuation
All investments are categorized as Level 1 under the Fair Value Hierarchy. The inputs or methodology used for valuing securities may not be an indication of the risk associated with investing in those securities. For more information on valuation inputs please refer to the Investment Valuation section in the accompanying Notes to Financial Statements.
See accompanying notes which are an integral part of the financial statements.
Fidelity Freedom® Index 2015 Fund
Financial Statements
Statement of Assets and Liabilities
| | | September 30, 2018 (Unaudited) |
| Assets | | |
Investment in securities, at value — See accompanying schedule:
| | |
| Fidelity Central Funds (cost $8) | $8 | |
| Other affiliated issuers (cost $1,031,702,637) | 1,272,658,958 | |
| Total Investment in Securities (cost $1,031,702,645) | | $1,272,658,966 |
| Cash | | 5 |
| Receivable for investments sold | | 4,301,874 |
| Receivable for fund shares sold | | 2,014,847 |
| Receivable from investment adviser for expense reductions | | 42,347 |
| Total assets | | 1,279,018,039 |
| Liabilities | | |
| Payable for investments purchased | $2,041,624 | |
| Payable for fund shares redeemed | 4,259,479 | |
| Transfer agent fees payable | 133,602 | |
| Total liabilities | | 6,434,705 |
| Net Assets | | $1,272,583,334 |
| Net Assets consist of: | | |
| Paid in capital | | $1,015,329,850 |
| Undistributed net investment income | | 8,232,819 |
| Accumulated undistributed net realized gain (loss) on investments | | 8,064,344 |
| Net unrealized appreciation (depreciation) on investments | | 240,956,321 |
| Net Assets | | $1,272,583,334 |
| Investor Class: | | |
| Net Asset Value, offering price and redemption price per share ($674,688,976 ÷ 43,903,353 shares) | | $15.37 |
| Institutional Premium Class: | | |
| Net Asset Value, offering price and redemption price per share ($597,894,358 ÷ 38,920,239 shares) | | $15.36 |
See accompanying notes which are an integral part of the financial statements.
Statement of Operations
| | | Six months ended September 30, 2018 (Unaudited) |
| Investment Income | | |
| Dividends: | | |
| Affiliated issuers | | $8,789,587 |
| Income from Fidelity Central Funds | | 8 |
| Total income | | 8,789,595 |
| Expenses | | |
| Transfer agent fees | $788,982 | |
| Independent trustees' fees and expenses | 2,991 | |
| Total expenses before reductions | 791,973 | |
| Expense reductions | (233,926) | |
| Total expenses after reductions | | 558,047 |
| Net investment income (loss) | | 8,231,548 |
| Realized and Unrealized Gain (Loss) | | |
| Net realized gain (loss) on: | | |
| Investment securities: | | |
| Affiliated issuers | 12,089,770 | |
| Capital gain distributions from underlying funds: | | |
| Affiliated issuers | 87,308 | |
| Total net realized gain (loss) | | 12,177,078 |
| Change in net unrealized appreciation (depreciation) on: | | |
| Investment securities: | | |
| Affiliated issuers | 19,532,092 | |
| Total change in net unrealized appreciation (depreciation) | | 19,532,092 |
| Net gain (loss) | | 31,709,170 |
| Net increase (decrease) in net assets resulting from operations | | $39,940,718 |
See accompanying notes which are an integral part of the financial statements.
Statement of Changes in Net Assets
| | Six months ended September 30, 2018 (Unaudited) | Year ended March 31, 2018 |
| Increase (Decrease) in Net Assets | | |
| Operations | | |
| Net investment income (loss) | $8,231,548 | $20,647,350 |
| Net realized gain (loss) | 12,177,078 | 2,325,860 |
| Change in net unrealized appreciation (depreciation) | 19,532,092 | 59,059,272 |
| Net increase (decrease) in net assets resulting from operations | 39,940,718 | 82,032,482 |
| Distributions to shareholders from net investment income | (2,840,949) | (19,558,222) |
| Distributions to shareholders from net realized gain | (329,859) | (3,080,301) |
| Total distributions | (3,170,808) | (22,638,523) |
| Share transactions - net increase (decrease) | 38,164,561 | 101,046,987 |
| Total increase (decrease) in net assets | 74,934,471 | 160,440,946 |
| Net Assets | | |
| Beginning of period | 1,197,648,863 | 1,037,207,917 |
| End of period | $1,272,583,334 | $1,197,648,863 |
| Other Information | | |
| Undistributed net investment income end of period | $8,232,819 | $2,842,220 |
See accompanying notes which are an integral part of the financial statements.
Financial Highlights
Fidelity Freedom Index 2015 Fund Investor Class
| | Six months ended (Unaudited) September 30, | Years endedMarch 31, | | | | |
| | 2018 | 2018 | 2017 | 2016 | 2015 | 2014 |
| Selected Per–Share Data | | | | | | |
| Net asset value, beginning of period | $14.92 | $14.11 | $13.22 | $13.62 | $13.31 | $12.39 |
| Income from Investment Operations | | | | | | |
| Net investment income (loss)A | .10 | .27 | .25 | .23 | .25 | .20 |
| Net realized and unrealized gain (loss) | .39 | .83 | .89 | (.38) | .52 | .75 |
| Total from investment operations | .49 | 1.10 | 1.14 | (.15) | .77 | .95 |
| Distributions from net investment income | (.03) | (.25) | (.24) | (.25) | (.41) | (.02) |
| Distributions from net realized gain | –B | (.04) | (.01) | –B | (.05) | (.02) |
| Total distributions | (.04)C | (.29) | (.25) | (.25) | (.46) | (.03)D |
| Net asset value, end of period | $15.37 | $14.92 | $14.11 | $13.22 | $13.62 | $13.31 |
| Total ReturnE,F | 3.27% | 7.82% | 8.71% | (1.10)% | 5.87% | 7.71% |
| Ratios to Average Net AssetsG,H | | | | | | |
| Expenses before reductions | .15%I | .15% | .15% | .15% | .15% | .15% |
| Expenses net of fee waivers, if any | .12%I | .12% | .10% | .08% | .08% | .09% |
| Expenses net of all reductions | .12%I | .12% | .10% | .08% | .08% | .09% |
| Net investment income (loss) | 1.29%I | 1.81% | 1.80% | 1.70% | 1.86% | 1.56% |
| Supplemental Data | | | | | | |
| Net assets, end of period (000 omitted) | $674,689 | $637,221 | $516,456 | $577,905 | $910,801 | $828,722 |
| Portfolio turnover rateH | 49%I | 17% | 29% | 22% | 19% | 29% |
A Calculated based on average shares outstanding during the period.
B Amount represents less than $.005 per share.
C Total distributions of $.04 per share is comprised of distributions from net investment income of $.033 and distributions from net realized gain of $.004 per share.
D Total distributions of $.03 per share is comprised of distributions from net investment income of $.016 and distributions from net realized gain of $.017 per share.
E Total returns for periods of less than one year are not annualized.
F Total returns would have been lower if certain expenses had not been reduced during the applicable periods shown.
G Expense ratios reflect operating expenses of the class. Expenses before reductions do not reflect amounts reimbursed by the investment adviser or reductions from expense offset arrangements and do not represent the amount paid by the class during periods when reimbursements or reductions occur. Expenses net of fee waivers reflect expenses after reimbursement by the investment adviser but prior to reductions from expense offset arrangements. Expenses net of all reductions represent the net expenses paid by the class.
H Amount does not include the portfolio activity of any Underlying Funds.
I Annualized
See accompanying notes which are an integral part of the financial statements.
Fidelity Freedom Index 2015 Fund Institutional Premium Class
| | Six months ended (Unaudited) September 30, | Years endedMarch 31, | | |
| | 2018 | 2018 | 2017 | 2016 A |
| Selected Per–Share Data | | | | |
| Net asset value, beginning of period | $14.92 | $14.10 | $13.21 | $13.72 |
| Income from Investment Operations | | | | |
| Net investment income (loss)B | .10 | .27 | .25 | .28 |
| Net realized and unrealized gain (loss) | .38 | .85 | .90 | (.56) |
| Total from investment operations | .48 | 1.12 | 1.15 | (.28) |
| Distributions from net investment income | (.04) | (.26) | (.25) | (.23) |
| Distributions from net realized gain | –C | (.04) | (.01) | –C |
| Total distributions | (.04) | (.30) | (.26) | (.23) |
| Net asset value, end of period | $15.36 | $14.92 | $14.10 | $13.21 |
| Total ReturnD,E | 3.22% | 7.94% | 8.79% | (2.03)% |
| Ratios to Average Net AssetsF,G | | | | |
| Expenses before reductions | .10%H | .10% | .09% | .05%H |
| Expenses net of fee waivers, if any | .06%H | .07% | .04% | .02%H |
| Expenses net of all reductions | .06%H | .07% | .04% | .02%H |
| Net investment income (loss) | 1.35%H | 1.86% | 1.85% | 2.84%H |
| Supplemental Data | | | | |
| Net assets, end of period (000 omitted) | $597,894 | $560,428 | $520,752 | $330,221 |
| Portfolio turnover rateG | 49%H | 17% | 29% | 22% |
A For the period June 24, 2015 (commencement of sale of shares) to March 31, 2016.
B Calculated based on average shares outstanding during the period.
C Amount represents less than $.005 per share.
D Total returns for periods of less than one year are not annualized.
E Total returns would have been lower if certain expenses had not been reduced during the applicable periods shown.
F Expense ratios reflect operating expenses of the class. Expenses before reductions do not reflect amounts reimbursed by the investment adviser or reductions from expense offset arrangements and do not represent the amount paid by the class during periods when reimbursements or reductions occur. Expense ratios before reductions for start-up periods may not be representative of longer-term operating periods. Expenses net of fee waivers reflect expenses after reimbursement by the investment adviser but prior to reductions from expense offset arrangements. Expenses net of all reductions represent the net expenses paid by the class.
G Amount does not include the portfolio activity of any Underlying Funds.
H Annualized
See accompanying notes which are an integral part of the financial statements.
Fidelity Freedom® Index 2020 Fund
Investment Summary (Unaudited)
The information in the following tables is based on the direct investments of the Fund.
Top Holdings as of September 30, 2018
| | % of fund's net assets |
| Fidelity Total Market Index Fund Class F | 37.6 |
| Fidelity U.S. Bond Index Fund Class F | 31.8 |
| Fidelity Series Global ex U.S. Index Fund | 16.2 |
| Fidelity Series Treasury Bill Index Fund | 6.7 |
| Fidelity Series Inflation-Protected Bond Index Fund | 4.7 |
| Fidelity Series Long-Term Treasury Bond Index Fund | 3.0 |
| | 100.0 |
Asset Allocation (% of fund's net assets)
| Period end |
| | Domestic Equity Funds | 37.6% |
| | International Equity Funds | 16.2% |
| | Bond Funds | 34.8% |
| | Inflation-Protected Bond Funds | 4.7% |
| | Short-Term Funds | 6.7% |
Fidelity Freedom® Index 2020 Fund
Schedule of Investments September 30, 2018 (Unaudited)
Showing Percentage of Net Assets
| Domestic Equity Funds - 37.6% | | | |
| | | Shares | Value |
| Fidelity Total Market Index Fund Class F (a) | | | |
| (Cost $845,482,874) | | 18,910,667 | 1,591,332,591 |
|
| International Equity Funds - 16.2% | | | |
| Fidelity Series Global ex U.S. Index Fund (a) | | | |
| (Cost $585,516,118) | | 53,265,099 | 684,456,519 |
|
| Bond Funds - 34.8% | | | |
| Fidelity Series Long-Term Treasury Bond Index Fund (a) | | 15,191,168 | 125,175,226 |
| Fidelity U.S. Bond Index Fund Class F (a) | | 120,634,111 | 1,347,483,025 |
| TOTAL BOND FUNDS | | | |
| (Cost $1,523,102,506) | | | 1,472,658,251 |
|
| Inflation-Protected Bond Funds - 4.7% | | | |
| Fidelity Series Inflation-Protected Bond Index Fund (a) | | | |
| (Cost $203,384,417) | | 20,477,220 | 198,833,807 |
|
| Short-Term Funds - 6.7% | | | |
| Fidelity Series Treasury Bill Index Fund (a) | | | |
| (Cost $284,650,862) | | 28,465,086 | 284,650,862 |
| TOTAL INVESTMENT IN SECURITIES - 100.0% | | | |
| (Cost $3,442,136,777) | | | 4,231,932,030 |
| NET OTHER ASSETS (LIABILITIES) - 0.0% | | | (259,363) |
| NET ASSETS - 100% | | | $4,231,672,667 |
Legend
(a) Affiliated Fund
Affiliated Underlying Funds
Fiscal year to date information regarding the Fund's investments in affiliated Underlying Funds, excluding any Money Market Central Funds, is presented below. Exchanges between classes of the same affiliated Underlying Funds may occur.
| Affiliate | Value, beginning of period | Purchases | Sales Proceeds | Dividend Income | Realized Gain (loss) | Change in Unrealized appreciation (depreciation) | Value, end of period |
| Fidelity Commodity Strategy Fund Class F | $47,482,685 | $2,113,609 | $48,633,352 | $-- | $1,293,723 | $(2,256,665) | $-- |
| Fidelity Series Global ex U.S. Index Fund | 678,623,098 | 70,568,751 | 48,262,031 | -- | (249,616) | (16,223,683) | 684,456,519 |
| Fidelity Series Government Money Market Fund 2.12% | 366,497,885 | 25,183,238 | 391,681,123 | 2,698,082 | -- | -- | -- |
| Fidelity Series Inflation-Protected Bond Index Fund | 106,069,446 | 96,052,372 | 2,999,155 | 221,604 | (593) | (288,263) | 198,833,807 |
| Fidelity Series Long-Term Treasury Bond Index Fund | -- | 129,186,155 | 470,698 | 591,319 | (2,789) | (3,537,442) | 125,175,226 |
| Fidelity Series Treasury Bill Index Fund | -- | 285,089,226 | 438,364 | 628,183 | -- | -- | 284,650,862 |
| Fidelity Total Market Index Fund Class F | 1,544,841,749 | 100,623,905 | 218,782,929 | 5,549,905 | 13,285,782 | 151,364,084 | 1,591,332,591 |
| Fidelity U.S. Bond Index Fund Class F | 1,199,342,406 | 200,889,931 | 33,634,418 | 17,223,652 | (139,296) | (18,975,598) | 1,347,483,025 |
| | $3,942,857,269 | $909,707,187 | $744,902,070 | $26,912,745 | $14,187,211 | $110,082,433 | $4,231,932,030 |
Amounts in the income column in the above table include any capital gain distributions from underlying funds, which are presented in the corresponding line-item in the Statement of Operations if applicable.
Investment Valuation
All investments are categorized as Level 1 under the Fair Value Hierarchy. The inputs or methodology used for valuing securities may not be an indication of the risk associated with investing in those securities. For more information on valuation inputs please refer to the Investment Valuation section in the accompanying Notes to Financial Statements.
See accompanying notes which are an integral part of the financial statements.
Fidelity Freedom® Index 2020 Fund
Financial Statements
Statement of Assets and Liabilities
| | | September 30, 2018 (Unaudited) |
| Assets | | |
Investment in securities, at value — See accompanying schedule:
| | |
| Affiliated issuers (cost $3,442,136,777) | $4,231,932,030 | |
| Total Investment in Securities (cost $3,442,136,777) | | $4,231,932,030 |
| Cash | | 1 |
| Receivable for investments sold | | 10,620,337 |
| Receivable for fund shares sold | | 9,422,656 |
| Receivable from investment adviser for expense reductions | | 151,049 |
| Total assets | | 4,252,126,073 |
| Liabilities | | |
| Payable for investments purchased | $7,815,782 | |
| Payable for fund shares redeemed | 12,213,695 | |
| Transfer agent fees payable | 423,929 | |
| Total liabilities | | 20,453,406 |
| Net Assets | | $4,231,672,667 |
| Net Assets consist of: | | |
| Paid in capital | | $3,418,804,545 |
| Undistributed net investment income | | 24,477,822 |
| Accumulated undistributed net realized gain (loss) on investments | | (1,404,953) |
| Net unrealized appreciation (depreciation) on investments | | 789,795,253 |
| Net Assets | | $4,231,672,667 |
| Investor Class: | | |
| Net Asset Value, offering price and redemption price per share ($1,781,475,007 ÷ 109,710,346 shares) | | $16.24 |
| Institutional Premium Class: | | |
| Net Asset Value, offering price and redemption price per share ($2,450,197,660 ÷ 150,923,129 shares) | | $16.23 |
See accompanying notes which are an integral part of the financial statements.
Statement of Operations
| | | Six months ended September 30, 2018 (Unaudited) |
| Investment Income | | |
| Dividends: | | |
| Affiliated issuers | | $26,587,106 |
| Expenses | | |
| Transfer agent fees | $2,476,986 | |
| Independent trustees' fees and expenses | 9,828 | |
| Total expenses before reductions | 2,486,814 | |
| Expense reductions | (817,147) | |
| Total expenses after reductions | | 1,669,667 |
| Net investment income (loss) | | 24,917,439 |
| Realized and Unrealized Gain (Loss) | | |
| Net realized gain (loss) on: | | |
| Investment securities: | | |
| Affiliated issuers | 14,187,211 | |
| Capital gain distributions from underlying funds: | | |
| Affiliated issuers | 325,639 | |
| Total net realized gain (loss) | | 14,512,850 |
| Change in net unrealized appreciation (depreciation) on: | | |
| Investment securities: | | |
| Affiliated issuers | 110,082,433 | |
| Total change in net unrealized appreciation (depreciation) | | 110,082,433 |
| Net gain (loss) | | 124,595,283 |
| Net increase (decrease) in net assets resulting from operations | | $149,512,722 |
See accompanying notes which are an integral part of the financial statements.
Statement of Changes in Net Assets
| | Six months ended September 30, 2018 (Unaudited) | Year ended March 31, 2018 |
| Increase (Decrease) in Net Assets | | |
| Operations | | |
| Net investment income (loss) | $24,917,439 | $69,254,977 |
| Net realized gain (loss) | 14,512,850 | 6,838,412 |
| Change in net unrealized appreciation (depreciation) | 110,082,433 | 219,825,684 |
| Net increase (decrease) in net assets resulting from operations | 149,512,722 | 295,919,073 |
| Distributions to shareholders from net investment income | (8,509,416) | (66,426,677) |
| Distributions to shareholders from net realized gain | – | (5,015,590) |
| Total distributions | (8,509,416) | (71,442,267) |
| Share transactions - net increase (decrease) | 148,116,198 | 428,000,426 |
| Total increase (decrease) in net assets | 289,119,504 | 652,477,232 |
| Net Assets | | |
| Beginning of period | 3,942,553,163 | 3,290,075,931 |
| End of period | $4,231,672,667 | $3,942,553,163 |
| Other Information | | |
| Undistributed net investment income end of period | $24,477,822 | $8,069,799 |
See accompanying notes which are an integral part of the financial statements.
Financial Highlights
Fidelity Freedom Index 2020 Fund Investor Class
| | Six months ended (Unaudited) September 30, | Years endedMarch 31, | | | | |
| | 2018 | 2018 | 2017 | 2016 | 2015 | 2014 |
| Selected Per–Share Data | | | | | | |
| Net asset value, beginning of period | $15.69 | $14.70 | $13.65 | $14.10 | $13.72 | $12.67 |
| Income from Investment Operations | | | | | | |
| Net investment income (loss)A | .09 | .29 | .27 | .23 | .26 | .22 |
| Net realized and unrealized gain (loss) | .49 | .99 | 1.04 | (.42) | .57 | .86 |
| Total from investment operations | .58 | 1.28 | 1.31 | (.19) | .83 | 1.08 |
| Distributions from net investment income | (.03) | (.27) | (.25) | (.26) | (.41) | (.02) |
| Distributions from net realized gain | – | (.02) | (.01) | –B | (.04) | (.01) |
| Total distributions | (.03) | (.29) | (.26) | (.26) | (.45) | (.03) |
| Net asset value, end of period | $16.24 | $15.69 | $14.70 | $13.65 | $14.10 | $13.72 |
| Total ReturnC,D | 3.71% | 8.72% | 9.68% | (1.34)% | 6.18% | 8.55% |
| Ratios to Average Net AssetsE,F | | | | | | |
| Expenses before reductions | .15%G | .15% | .15% | .15% | .15% | .15% |
| Expenses net of fee waivers, if any | .11%G | .12% | .10% | .08% | .08% | .09% |
| Expenses net of all reductions | .11%G | .12% | .10% | .08% | .08% | .09% |
| Net investment income (loss) | 1.18%G | 1.86% | 1.88% | 1.69% | 1.90% | 1.66% |
| Supplemental Data | | | | | | |
| Net assets, end of period (000 omitted) | $1,781,475 | $1,638,441 | $1,295,896 | $1,410,489 | $2,458,061 | $2,010,769 |
| Portfolio turnover rateF | 36%G | 11% | 20% | 16% | 16% | 25% |
A Calculated based on average shares outstanding during the period.
B Amount represents less than $.005 per share.
C Total returns for periods of less than one year are not annualized.
D Total returns would have been lower if certain expenses had not been reduced during the applicable periods shown.
E Expense ratios reflect operating expenses of the class. Expenses before reductions do not reflect amounts reimbursed by the investment adviser or reductions from expense offset arrangements and do not represent the amount paid by the class during periods when reimbursements or reductions occur. Expenses net of fee waivers reflect expenses after reimbursement by the investment adviser but prior to reductions from expense offset arrangements. Expenses net of all reductions represent the net expenses paid by the class.
F Amount does not include the portfolio activity of any Underlying Funds.
G Annualized
See accompanying notes which are an integral part of the financial statements.
Fidelity Freedom Index 2020 Fund Institutional Premium Class
| | Six months ended (Unaudited) September 30, | Years endedMarch 31, | | |
| | 2018 | 2018 | 2017 | 2016 A |
| Selected Per–Share Data | | | | |
| Net asset value, beginning of period | $15.69 | $14.70 | $13.65 | $14.24 |
| Income from Investment Operations | | | | |
| Net investment income (loss)B | .10 | .30 | .27 | .32 |
| Net realized and unrealized gain (loss) | .47 | .99 | 1.05 | (.67) |
| Total from investment operations | .57 | 1.29 | 1.32 | (.35) |
| Distributions from net investment income | (.03) | (.28) | (.26) | (.24) |
| Distributions from net realized gain | – | (.02) | (.01) | –C |
| Total distributions | (.03) | (.30) | (.27) | (.24) |
| Net asset value, end of period | $16.23 | $15.69 | $14.70 | $13.65 |
| Total ReturnD,E | 3.66% | 8.77% | 9.75% | (2.42)% |
| Ratios to Average Net AssetsF,G | | | | |
| Expenses before reductions | .10%H | .10% | .09% | .05%H |
| Expenses net of fee waivers, if any | .06%H | .07% | .05% | .02%H |
| Expenses net of all reductions | .06%H | .07% | .05% | .02%H |
| Net investment income (loss) | 1.24%H | 1.91% | 1.93% | 3.12%H |
| Supplemental Data | | | | |
| Net assets, end of period (000 omitted) | $2,450,198 | $2,304,112 | $1,994,180 | $1,249,900 |
| Portfolio turnover rateG | 36%H | 11% | 20% | 16% |
A For the period June 24, 2015 (commencement of sale of shares) to March 31, 2016.
B Calculated based on average shares outstanding during the period.
C Amount represents less than $.005 per share.
D Total returns for periods of less than one year are not annualized.
E Total returns would have been lower if certain expenses had not been reduced during the applicable periods shown.
F Expense ratios reflect operating expenses of the class. Expenses before reductions do not reflect amounts reimbursed by the investment adviser or reductions from expense offset arrangements and do not represent the amount paid by the class during periods when reimbursements or reductions occur. Expense ratios before reductions for start-up periods may not be representative of longer-term operating periods. Expenses net of fee waivers reflect expenses after reimbursement by the investment adviser but prior to reductions from expense offset arrangements. Expenses net of all reductions represent the net expenses paid by the class.
G Amount does not include the portfolio activity of any Underlying Funds.
H Annualized
See accompanying notes which are an integral part of the financial statements.
Fidelity Freedom® Index 2025 Fund
Investment Summary (Unaudited)
The information in the following tables is based on the direct investments of the Fund.
Top Holdings as of September 30, 2018
| | % of fund's net assets |
| Fidelity Total Market Index Fund Class F | 42.2 |
| Fidelity U.S. Bond Index Fund Class F | 29.3 |
| Fidelity Series Global ex U.S. Index Fund | 18.1 |
| Fidelity Series Inflation-Protected Bond Index Fund | 4.0 |
| Fidelity Series Treasury Bill Index Fund | 3.5 |
| Fidelity Series Long-Term Treasury Bond Index Fund | 2.9 |
| Fidelity Cash Central Fund, 2.11% | 0.0 |
| | 100.0 |
Asset Allocation (% of fund's net assets)
| Period end |
| | Domestic Equity Funds | 42.2% |
| | International Equity Funds | 18.1% |
| | Bond Funds | 32.2% |
| | Inflation-Protected Bond Funds | 4.0% |
| | Short-Term Funds | 3.5% |

Percentages shown as 0.0% may reflect amounts less than 0.05%.
Fidelity Freedom® Index 2025 Fund
Schedule of Investments September 30, 2018 (Unaudited)
Showing Percentage of Net Assets
| Domestic Equity Funds - 42.2% | | | |
| | | Shares | Value |
| Fidelity Total Market Index Fund Class F (a) | | | |
| (Cost $1,089,622,193) | | 21,066,440 | 1,772,740,928 |
|
| International Equity Funds - 18.1% | | | |
| Fidelity Series Global ex U.S. Index Fund (a) | | | |
| (Cost $673,659,412) | | 59,333,548 | 762,436,091 |
|
| Bond Funds - 32.2% | | | |
| Fidelity Series Long-Term Treasury Bond Index Fund (a) | | 15,124,955 | 124,629,628 |
| Fidelity U.S. Bond Index Fund Class F (a) | | 110,129,263 | 1,230,143,863 |
| TOTAL BOND FUNDS | | | |
| (Cost $1,400,196,601) | | | 1,354,773,491 |
|
| Inflation-Protected Bond Funds - 4.0% | | | |
| Fidelity Series Inflation-Protected Bond Index Fund (a) | | | |
| (Cost $168,723,962) | | 17,123,372 | 166,267,938 |
|
| Short-Term Funds - 3.5% | | | |
| Fidelity Cash Central Fund, 2.11% (b) | | 1 | 1 |
| Fidelity Series Treasury Bill Index Fund (a) | | 14,531,134 | 145,311,342 |
| TOTAL SHORT-TERM FUNDS | | | |
| (Cost $145,311,343) | | | 145,311,343 |
| TOTAL INVESTMENT IN SECURITIES - 100.0% | | | |
| (Cost $3,477,513,511) | | | 4,201,529,791 |
| NET OTHER ASSETS (LIABILITIES) - 0.0% | | | (265,116) |
| NET ASSETS - 100% | | | $4,201,264,675 |
Legend
(a) Affiliated Fund
(b) Affiliated fund that is generally available only to investment companies and other accounts managed by Fidelity Investments. The rate quoted is the annualized seven-day yield of the fund at period end. A complete unaudited listing of the fund's holdings as of its most recent quarter end is available upon request. In addition, each Fidelity Central Fund's financial statements are available on the SEC's website or upon request.
Affiliated Underlying Funds
Fiscal year to date information regarding the Fund's investments in affiliated Underlying Funds, excluding any Money Market Central Funds, is presented below. Exchanges between classes of the same affiliated Underlying Funds may occur.
| Affiliate | Value, beginning of period | Purchases | Sales Proceeds | Dividend Income | Realized Gain (loss) | Change in Unrealized appreciation (depreciation) | Value, end of period |
| Fidelity Commodity Strategy Fund Class F | $46,124,245 | $3,949,789 | $49,023,505 | $-- | $1,040,826 | $(2,091,355) | $-- |
| Fidelity Series Global ex U.S. Index Fund | 685,349,266 | 121,647,963 | 27,124,760 | -- | (403,434) | (17,032,944) | 762,436,091 |
| Fidelity Series Government Money Market Fund 2.12% | 213,104,497 | 24,410,358 | 237,514,855 | 1,589,134 | -- | -- | -- |
| Fidelity Series Inflation-Protected Bond Index Fund | 67,903,098 | 99,393,804 | 689,984 | 165,823 | 3,676 | (342,656) | 166,267,938 |
| Fidelity Series Long-Term Treasury Bond Index Fund | -- | 128,385,991 | 249,355 | 582,768 | (4,516) | (3,502,492) | 124,629,628 |
| Fidelity Series Treasury Bill Index Fund | -- | 145,594,698 | 283,356 | 326,743 | -- | -- | 145,311,342 |
| Fidelity Total Market Index Fund Class F | 1,561,728,775 | 191,947,409 | 156,811,625 | 5,647,890 | 3,090,213 | 172,786,156 | 1,772,740,928 |
| Fidelity U.S. Bond Index Fund Class F | 1,043,505,486 | 214,455,895 | 10,785,925 | 15,558,254 | (60,593) | (16,971,000) | 1,230,143,863 |
| | $3,617,715,367 | $929,785,907 | $482,483,365 | $23,870,612 | $3,666,172 | $132,845,709 | $4,201,529,790 |
Amounts in the income column in the above table include any capital gain distributions from underlying funds, which are presented in the corresponding line-item in the Statement of Operations if applicable.
Investment Valuation
All investments are categorized as Level 1 under the Fair Value Hierarchy. The inputs or methodology used for valuing securities may not be an indication of the risk associated with investing in those securities. For more information on valuation inputs please refer to the Investment Valuation section in the accompanying Notes to Financial Statements.
See accompanying notes which are an integral part of the financial statements.
Fidelity Freedom® Index 2025 Fund
Financial Statements
Statement of Assets and Liabilities
| | | September 30, 2018 (Unaudited) |
| Assets | | |
Investment in securities, at value — See accompanying schedule:
| | |
| Fidelity Central Funds (cost $1) | $1 | |
| Other affiliated issuers (cost $3,477,513,510) | 4,201,529,790 | |
| Total Investment in Securities (cost $3,477,513,511) | | $4,201,529,791 |
| Cash | | 23 |
| Receivable for investments sold | | 7,955,657 |
| Receivable for fund shares sold | | 11,225,964 |
| Receivable from investment adviser for expense reductions | | 153,678 |
| Total assets | | 4,220,865,113 |
| Liabilities | | |
| Payable for investments purchased | $11,985,420 | |
| Payable for fund shares redeemed | 7,184,674 | |
| Transfer agent fees payable | 430,344 | |
| Total liabilities | | 19,600,438 |
| Net Assets | | $4,201,264,675 |
| Net Assets consist of: | | |
| Paid in capital | | $3,465,340,273 |
| Undistributed net investment income | | 21,402,716 |
| Accumulated undistributed net realized gain (loss) on investments | | (9,494,594) |
| Net unrealized appreciation (depreciation) on investments | | 724,016,280 |
| Net Assets | | $4,201,264,675 |
| Investor Class: | | |
| Net Asset Value, offering price and redemption price per share ($2,024,350,214 ÷ 116,909,668 shares) | | $17.32 |
| Institutional Premium Class: | | |
| Net Asset Value, offering price and redemption price per share ($2,176,914,461 ÷ 125,679,167 shares) | | $17.32 |
See accompanying notes which are an integral part of the financial statements.
Statement of Operations
| | | Six months ended September 30, 2018 (Unaudited) |
| Investment Income | | |
| Dividends: | | |
| Affiliated issuers | | $23,539,224 |
| Expenses | | |
| Transfer agent fees | $2,448,583 | |
| Independent trustees' fees and expenses | 9,285 | |
| Total expenses before reductions | 2,457,868 | |
| Expense reductions | (812,065) | |
| Total expenses after reductions | | 1,645,803 |
| Net investment income (loss) | | 21,893,421 |
| Realized and Unrealized Gain (Loss) | | |
| Net realized gain (loss) on: | | |
| Investment securities: | | |
| Affiliated issuers | 3,666,172 | |
| Capital gain distributions from underlying funds: | | |
| Affiliated issuers | 331,388 | |
| Total net realized gain (loss) | | 3,997,560 |
| Change in net unrealized appreciation (depreciation) on: | | |
| Investment securities: | | |
| Affiliated issuers | 132,845,709 | |
| Total change in net unrealized appreciation (depreciation) | | 132,845,709 |
| Net gain (loss) | | 136,843,269 |
| Net increase (decrease) in net assets resulting from operations | | $158,736,690 |
See accompanying notes which are an integral part of the financial statements.
Statement of Changes in Net Assets
| | Six months ended September 30, 2018 (Unaudited) | Year ended March 31, 2018 |
| Increase (Decrease) in Net Assets | | |
| Operations | | |
| Net investment income (loss) | $21,893,421 | $61,864,354 |
| Net realized gain (loss) | 3,997,560 | 8,148,696 |
| Change in net unrealized appreciation (depreciation) | 132,845,709 | 204,023,909 |
| Net increase (decrease) in net assets resulting from operations | 158,736,690 | 274,036,959 |
| Distributions to shareholders from net investment income | (6,858,720) | (59,481,033) |
| Distributions to shareholders from net realized gain | – | (3,473,804) |
| Total distributions | (6,858,720) | (62,954,837) |
| Share transactions - net increase (decrease) | 431,954,747 | 722,009,775 |
| Total increase (decrease) in net assets | 583,832,717 | 933,091,897 |
| Net Assets | | |
| Beginning of period | 3,617,431,958 | 2,684,340,061 |
| End of period | $4,201,264,675 | $3,617,431,958 |
| Other Information | | |
| Undistributed net investment income end of period | $21,402,716 | $6,368,015 |
See accompanying notes which are an integral part of the financial statements.
Financial Highlights
Fidelity Freedom Index 2025 Fund Investor Class
| | Six months ended (Unaudited) September 30, | Years endedMarch 31, | | | | |
| | 2018 | 2018 | 2017 | 2016 | 2015 | 2014 |
| Selected Per–Share Data | | | | | | |
| Net asset value, beginning of period | $16.67 | $15.50 | $14.27 | $14.80 | $14.36 | $12.99 |
| Income from Investment Operations | | | | | | |
| Net investment income (loss)A | .09 | .31 | .29 | .27 | .30 | .24 |
| Net realized and unrealized gain (loss) | .59 | 1.17 | 1.22 | (.52) | .65 | 1.15 |
| Total from investment operations | .68 | 1.48 | 1.51 | (.25) | .95 | 1.39 |
| Distributions from net investment income | (.03) | (.29) | (.27) | (.27) | (.47)B | (.01) |
| Distributions from net realized gain | – | (.02) | (.01) | –C | (.04)B | (.01) |
| Total distributions | (.03) | (.31) | (.28) | (.28)D | (.51) | (.02) |
| Net asset value, end of period | $17.32 | $16.67 | $15.50 | $14.27 | $14.80 | $14.36 |
| Total ReturnE,F | 4.08% | 9.53% | 10.67% | (1.72)% | 6.73% | 10.75% |
| Ratios to Average Net AssetsG,H | | | | | | |
| Expenses before reductions | .15%I | .15% | .15% | .15% | .15% | .15% |
| Expenses net of fee waivers, if any | .11%I | .12% | .10% | .08% | .08% | .09% |
| Expenses net of all reductions | .11%I | .12% | .10% | .08% | .08% | .09% |
| Net investment income (loss) | 1.08%I | 1.91% | 1.97% | 1.84% | 2.03% | 1.78% |
| Supplemental Data | | | | | | |
| Net assets, end of period (000 omitted) | $2,024,350 | $1,761,022 | $1,227,802 | $1,179,785 | $1,723,943 | $1,347,992 |
| Portfolio turnover rateH | 24%I | 9% | 18% | 17% | 15% | 21% |
A Calculated based on average shares outstanding during the period.
B The amounts shown reflect certain reclassifications related to book to tax differences that were made in the year shown.
C Amount represents less than $.005 per share.
D Total distributions of $.28 per share is comprised of distributions from net investment income of $.272 and distributions from net realized gain of $.003 per share.
E Total returns for periods of less than one year are not annualized.
F Total returns would have been lower if certain expenses had not been reduced during the applicable periods shown.
G Expense ratios reflect operating expenses of the class. Expenses before reductions do not reflect amounts reimbursed by the investment adviser or reductions from expense offset arrangements and do not represent the amount paid by the class during periods when reimbursements or reductions occur. Expenses net of fee waivers reflect expenses after reimbursement by the investment adviser but prior to reductions from expense offset arrangements. Expenses net of all reductions represent the net expenses paid by the class.
H Amount does not include the portfolio activity of any Underlying Funds.
I Annualized
See accompanying notes which are an integral part of the financial statements.
Fidelity Freedom Index 2025 Fund Institutional Premium Class
| | Six months ended (Unaudited) September 30, | Years endedMarch 31, | | |
| | 2018 | 2018 | 2017 | 2016 A |
| Selected Per–Share Data | | | | |
| Net asset value, beginning of period | $16.67 | $15.50 | $14.27 | $15.00 |
| Income from Investment Operations | | | | |
| Net investment income (loss)B | .10 | .32 | .30 | .33 |
| Net realized and unrealized gain (loss) | .58 | 1.17 | 1.22 | (.79) |
| Total from investment operations | .68 | 1.49 | 1.52 | (.46) |
| Distributions from net investment income | (.03) | (.30) | (.28) | (.27) |
| Distributions from net realized gain | – | (.02) | (.01) | –C |
| Total distributions | (.03) | (.32) | (.29) | (.27) |
| Net asset value, end of period | $17.32 | $16.67 | $15.50 | $14.27 |
| Total ReturnD,E | 4.09% | 9.58% | 10.74% | (3.07)% |
| Ratios to Average Net AssetsF,G | | | | |
| Expenses before reductions | .10%H | .10% | .09% | .05%H |
| Expenses net of fee waivers, if any | .06%H | .07% | .05% | .02%H |
| Expenses net of all reductions | .06%H | .07% | .05% | .02%H |
| Net investment income (loss) | 1.13%H | 1.96% | 2.02% | 3.08%H |
| Supplemental Data | | | | |
| Net assets, end of period (000 omitted) | $2,176,914 | $1,856,410 | $1,456,538 | $792,922 |
| Portfolio turnover rateG | 24%H | 9% | 18% | 17% |
A For the period June 24, 2015 (commencement of sale of shares) to March 31, 2016.
B Calculated based on average shares outstanding during the period.
C Amount represents less than $.005 per share.
D Total returns for periods of less than one year are not annualized.
E Total returns would have been lower if certain expenses had not been reduced during the applicable periods shown.
F Expense ratios reflect operating expenses of the class. Expenses before reductions do not reflect amounts reimbursed by the investment adviser or reductions from expense offset arrangements and do not represent the amount paid by the class during periods when reimbursements or reductions occur. Expense ratios before reductions for start-up periods may not be representative of longer-term operating periods. Expenses net of fee waivers reflect expenses after reimbursement by the investment adviser but prior to reductions from expense offset arrangements. Expenses net of all reductions represent the net expenses paid by the class.
G Amount does not include the portfolio activity of any Underlying Funds.
H Annualized
See accompanying notes which are an integral part of the financial statements.
Fidelity Freedom® Index 2030 Fund
Investment Summary (Unaudited)
The information in the following tables is based on the direct investments of the Fund.
Top Holdings as of September 30, 2018
| | % of fund's net assets |
| Fidelity Total Market Index Fund Class F | 50.6 |
| Fidelity U.S. Bond Index Fund Class F | 24.3 |
| Fidelity Series Global ex U.S. Index Fund | 21.7 |
| Fidelity Series Long-Term Treasury Bond Index Fund | 3.0 |
| Fidelity Series Inflation-Protected Bond Index Fund | 0.4 |
| | 100.0 |
Asset Allocation (% of fund's net assets)
| Period end |
| | Domestic Equity Funds | 50.6% |
| | International Equity Funds | 21.7% |
| | Bond Funds | 27.3% |
| | Inflation-Protected Bond Funds | 0.4% |

Fidelity Freedom® Index 2030 Fund
Schedule of Investments September 30, 2018 (Unaudited)
Showing Percentage of Net Assets
| Domestic Equity Funds - 50.6% | | | |
| | | Shares | Value |
| Fidelity Total Market Index Fund Class F (a) | | | |
| (Cost $1,613,688,261) | | 30,983,288 | 2,607,243,685 |
|
| International Equity Funds - 21.7% | | | |
| Fidelity Series Global ex U.S. Index Fund (a) | | | |
| (Cost $995,797,786) | | 87,150,437 | 1,119,883,112 |
|
| Bond Funds - 27.3% | | | |
| Fidelity Series Long-Term Treasury Bond Index Fund (a) | | 18,542,658 | 152,791,505 |
| Fidelity U.S. Bond Index Fund Class F (a) | | 112,121,007 | 1,252,391,650 |
| TOTAL BOND FUNDS | | | |
| (Cost $1,450,215,308) | | | 1,405,183,155 |
|
| Inflation-Protected Bond Funds - 0.4% | | | |
| Fidelity Series Inflation-Protected Bond Index Fund (a) | | | |
| (Cost $20,915,642) | | 2,157,944 | 20,953,633 |
| TOTAL INVESTMENT IN SECURITIES - 100.0% | | | |
| (Cost $4,080,616,997) | | | 5,153,263,585 |
| NET OTHER ASSETS (LIABILITIES) - 0.0% | | | (293,248) |
| NET ASSETS - 100% | | | $5,152,970,337 |
Legend
(a) Affiliated Fund
Affiliated Underlying Funds
Fiscal year to date information regarding the Fund's investments in affiliated Underlying Funds, excluding any Money Market Central Funds, is presented below. Exchanges between classes of the same affiliated Underlying Funds may occur.
| Affiliate | Value, beginning of period | Purchases | Sales Proceeds | Dividend Income | Realized Gain (loss) | Change in Unrealized appreciation (depreciation) | Value, end of period |
| Fidelity Commodity Strategy Fund Class F | $59,460,652 | $3,907,202 | $62,061,527 | $-- | $1,392,663 | $(2,698,990) | $-- |
| Fidelity Series Global ex U.S. Index Fund | 1,016,892,451 | 168,524,776 | 40,250,241 | -- | (480,471) | (24,803,403) | 1,119,883,112 |
| Fidelity Series Inflation-Protected Bond Index Fund | 47,485,726 | 9,366,881 | 36,096,925 | 57,087 | (973,465) | 1,171,416 | 20,953,633 |
| Fidelity Series Long-Term Treasury Bond Index Fund | -- | 157,356,394 | 291,589 | 711,022 | (1,993) | (4,271,307) | 152,791,505 |
| Fidelity Total Market Index Fund Class F | 2,318,668,430 | 230,048,826 | 198,421,109 | 8,348,337 | 2,430,410 | 254,517,128 | 2,607,243,685 |
| Fidelity U.S. Bond Index Fund Class F | 1,057,327,370 | 226,517,909 | 14,292,951 | 15,748,248 | (81,470) | (17,079,208) | 1,252,391,650 |
| | $4,499,834,629 | $795,721,988 | $351,414,342 | $24,864,694 | $2,285,674 | $206,835,636 | $5,153,263,585 |
Amounts in the income column in the above table include any capital gain distributions from underlying funds, which are presented in the corresponding line-item in the Statement of Operations if applicable.
Investment Valuation
All investments are categorized as Level 1 under the Fair Value Hierarchy. The inputs or methodology used for valuing securities may not be an indication of the risk associated with investing in those securities. For more information on valuation inputs please refer to the Investment Valuation section in the accompanying Notes to Financial Statements.
See accompanying notes which are an integral part of the financial statements.
Fidelity Freedom® Index 2030 Fund
Financial Statements
Statement of Assets and Liabilities
| | | September 30, 2018 (Unaudited) |
| Assets | | |
Investment in securities, at value — See accompanying schedule:
| | |
| Affiliated issuers (cost $4,080,616,997) | $5,153,263,585 | |
| Total Investment in Securities (cost $4,080,616,997) | | $5,153,263,585 |
| Receivable for investments sold | | 17,939,236 |
| Receivable for fund shares sold | | 11,962,483 |
| Receivable from investment adviser for expense reductions | | 202,258 |
| Total assets | | 5,183,367,562 |
| Liabilities | | |
| Payable for investments purchased | $21,891,098 | |
| Payable for fund shares redeemed | 7,992,238 | |
| Transfer agent fees payable | 513,889 | |
| Total liabilities | | 30,397,225 |
| Net Assets | | $5,152,970,337 |
| Net Assets consist of: | | |
| Paid in capital | | $4,068,656,578 |
| Undistributed net investment income | | 22,470,623 |
| Accumulated undistributed net realized gain (loss) on investments | | (10,803,452) |
| Net unrealized appreciation (depreciation) on investments | | 1,072,646,588 |
| Net Assets | | $5,152,970,337 |
| Investor Class: | | |
| Net Asset Value, offering price and redemption price per share ($2,171,415,192 ÷ 118,020,221 shares) | | $18.40 |
| Institutional Premium Class: | | |
| Net Asset Value, offering price and redemption price per share ($2,981,555,145 ÷ 162,022,513 shares) | | $18.40 |
See accompanying notes which are an integral part of the financial statements.
Statement of Operations
| | | Six months ended September 30, 2018 (Unaudited) |
| Investment Income | | |
| Dividends: | | |
| Affiliated issuers | | $24,374,858 |
| Expenses | | |
| Transfer agent fees | $2,925,179 | |
| Independent trustees' fees and expenses | 11,426 | |
| Total expenses before reductions | 2,936,605 | |
| Expense reductions | (1,059,069) | |
| Total expenses after reductions | | 1,877,536 |
| Net investment income (loss) | | 22,497,322 |
| Realized and Unrealized Gain (Loss) | | |
| Net realized gain (loss) on: | | |
| Investment securities: | | |
| Affiliated issuers | 2,285,674 | |
| Capital gain distributions from underlying funds: | | |
| Affiliated issuers | 489,836 | |
| Total net realized gain (loss) | | 2,775,510 |
| Change in net unrealized appreciation (depreciation) on: | | |
| Investment securities: | | |
| Affiliated issuers | 206,835,636 | |
| Total change in net unrealized appreciation (depreciation) | | 206,835,636 |
| Net gain (loss) | | 209,611,146 |
| Net increase (decrease) in net assets resulting from operations | | $232,108,468 |
See accompanying notes which are an integral part of the financial statements.
Statement of Changes in Net Assets
| | Six months ended September 30, 2018 (Unaudited) | Year ended March 31, 2018 |
| Increase (Decrease) in Net Assets | | |
| Operations | | |
| Net investment income (loss) | $22,497,322 | $77,497,934 |
| Net realized gain (loss) | 2,775,510 | 10,848,890 |
| Change in net unrealized appreciation (depreciation) | 206,835,636 | 315,081,052 |
| Net increase (decrease) in net assets resulting from operations | 232,108,468 | 403,427,876 |
| Distributions to shareholders from net investment income | (5,875,278) | (75,072,440) |
| Distributions to shareholders from net realized gain | (1,059,357) | (3,357,942) |
| Total distributions | (6,934,635) | (78,430,382) |
| Share transactions - net increase (decrease) | 428,293,747 | 815,123,759 |
| Total increase (decrease) in net assets | 653,467,580 | 1,140,121,253 |
| Net Assets | | |
| Beginning of period | 4,499,502,757 | 3,359,381,504 |
| End of period | $5,152,970,337 | $4,499,502,757 |
| Other Information | | |
| Undistributed net investment income end of period | $22,470,623 | $5,848,579 |
See accompanying notes which are an integral part of the financial statements.
Financial Highlights
Fidelity Freedom Index 2030 Fund Investor Class
| | Six months ended (Unaudited) September 30, | Years endedMarch 31, | | | | |
| | 2018 | 2018 | 2017 | 2016 | 2015 | 2014 |
| Selected Per–Share Data | | | | | | |
| Net asset value, beginning of period | $17.57 | $16.07 | $14.49 | $15.15 | $14.62 | $13.10 |
| Income from Investment Operations | | | | | | |
| Net investment income (loss)A | .08 | .33 | .31 | .26 | .30 | .25 |
| Net realized and unrealized gain (loss) | .78 | 1.50 | 1.57 | (.63) | .73 | 1.29 |
| Total from investment operations | .86 | 1.83 | 1.88 | (.37) | 1.03 | 1.54 |
| Distributions from net investment income | (.02) | (.31) | (.29) | (.29) | (.48) | (.01) |
| Distributions from net realized gain | –B | (.01) | (.01) | –B | (.02) | (.01) |
| Total distributions | (.03)C | (.33)D | (.30) | (.29) | (.50) | (.02) |
| Net asset value, end of period | $18.40 | $17.57 | $16.07 | $14.49 | $15.15 | $14.62 |
| Total ReturnE,F | 4.87% | 11.35% | 13.07% | (2.44)% | 7.16% | 11.80% |
| Ratios to Average Net AssetsG,H | | | | | | |
| Expenses before reductions | .15%I | .15% | .15% | .15% | .15% | .15% |
| Expenses net of fee waivers, if any | .11%I | .12% | .10% | .08% | .08% | .08% |
| Expenses net of all reductions | .11%I | .12% | .10% | .08% | .08% | .08% |
| Net investment income (loss) | .89%I | 1.92% | 2.03% | 1.75% | 1.99% | 1.84% |
| Supplemental Data | | | | | | |
| Net assets, end of period (000 omitted) | $2,171,415 | $1,856,566 | $1,333,880 | $1,315,200 | $2,224,676 | $1,704,216 |
| Portfolio turnover rateH | 15%I | 9% | 13% | 13% | 12% | 32% |
A Calculated based on average shares outstanding during the period.
B Amount represents less than $.005 per share.
C Total distributions of $.03 per share is comprised of distributions from net investment income of $.021 and distributions from net realized gain of $.004 per share.
D Total distributions of $.33 per share is comprised of distributions from net investment income of $.311 and distributions from net realized gain of $.014 per share.
E Total returns for periods of less than one year are not annualized.
F Total returns would have been lower if certain expenses had not been reduced during the applicable periods shown.
G Expense ratios reflect operating expenses of the class. Expenses before reductions do not reflect amounts reimbursed by the investment adviser or reductions from expense offset arrangements and do not represent the amount paid by the class during periods when reimbursements or reductions occur. Expenses net of fee waivers reflect expenses after reimbursement by the investment adviser but prior to reductions from expense offset arrangements. Expenses net of all reductions represent the net expenses paid by the class.
H Amount does not include the portfolio activity of any Underlying Funds.
I Annualized
See accompanying notes which are an integral part of the financial statements.
Fidelity Freedom Index 2030 Fund Institutional Premium Class
| | Six months ended (Unaudited) September 30, | Years endedMarch 31, | | |
| | 2018 | 2018 | 2017 | 2016 A |
| Selected Per–Share Data | | | | |
| Net asset value, beginning of period | $17.57 | $16.07 | $14.49 | $15.44 |
| Income from Investment Operations | | | | |
| Net investment income (loss)B | .09 | .34 | .32 | .38 |
| Net realized and unrealized gain (loss) | .77 | 1.49 | 1.57 | (1.04) |
| Total from investment operations | .86 | 1.83 | 1.89 | (.66) |
| Distributions from net investment income | (.02) | (.32) | (.30) | (.29) |
| Distributions from net realized gain | –C | (.01) | (.01) | –C |
| Total distributions | (.03)D | (.33) | (.31) | (.29) |
| Net asset value, end of period | $18.40 | $17.57 | $16.07 | $14.49 |
| Total ReturnE,F | 4.88% | 11.39% | 13.13% | (4.28)% |
| Ratios to Average Net AssetsG,H | | | | |
| Expenses before reductions | .10%I | .10% | .09% | .05%I |
| Expenses net of fee waivers, if any | .05%I | .07% | .05% | .02%I |
| Expenses net of all reductions | .05%I | .07% | .05% | .02%I |
| Net investment income (loss) | .95%I | 1.97% | 2.08% | 3.54%I |
| Supplemental Data | | | | |
| Net assets, end of period (000 omitted) | $2,981,555 | $2,642,936 | $2,025,502 | $1,165,165 |
| Portfolio turnover rateH | 15%I | 9% | 13% | 13% |
A For the period June 24, 2015 (commencement of sale of shares) to March 31, 2016.
B Calculated based on average shares outstanding during the period.
C Amount represents less than $.005 per share.
D Total distributions of $.03 per share is comprised of distributions from net investment income of $.023 and distributions from net realized gain of $.004 per share.
E Total returns for periods of less than one year are not annualized.
F Total returns would have been lower if certain expenses had not been reduced during the applicable periods shown.
G Expense ratios reflect operating expenses of the class. Expenses before reductions do not reflect amounts reimbursed by the investment adviser or reductions from expense offset arrangements and do not represent the amount paid by the class during periods when reimbursements or reductions occur. Expense ratios before reductions for start-up periods may not be representative of longer-term operating periods. Expenses net of fee waivers reflect expenses after reimbursement by the investment adviser but prior to reductions from expense offset arrangements. Expenses net of all reductions represent the net expenses paid by the class.
H Amount does not include the portfolio activity of any Underlying Funds.
I Annualized
See accompanying notes which are an integral part of the financial statements.
Fidelity Freedom® Index 2035 Fund
Investment Summary (Unaudited)
The information in the following tables is based on the direct investments of the Fund.
Top Holdings as of September 30, 2018
| | % of fund's net assets |
| Fidelity Total Market Index Fund Class F | 60.1 |
| Fidelity Series Global ex U.S. Index Fund | 25.8 |
| Fidelity U.S. Bond Index Fund Class F | 11.1 |
| Fidelity Series Long-Term Treasury Bond Index Fund | 3.0 |
| | 100.0 |
Asset Allocation (% of fund's net assets)
| Period end |
| | Domestic Equity Funds | 60.1% |
| | International Equity Funds | 25.8% |
| | Bond Funds | 14.1% |

Fidelity Freedom® Index 2035 Fund
Schedule of Investments September 30, 2018 (Unaudited)
Showing Percentage of Net Assets
| Domestic Equity Funds - 60.1% | | | |
| | | Shares | Value |
| Fidelity Total Market Index Fund Class F (a) | | | |
| (Cost $1,401,756,079) | | 24,949,384 | 2,099,490,632 |
|
| International Equity Funds - 25.8% | | | |
| Fidelity Series Global ex U.S. Index Fund (a) | | | |
| (Cost $815,195,931) | | 70,175,728 | 901,758,100 |
|
| Bond Funds - 14.1% | | | |
| Fidelity Series Long-Term Treasury Bond Index Fund (a) | | 12,500,266 | 103,002,193 |
| Fidelity U.S. Bond Index Fund Class F (a) | | 34,751,413 | 388,173,285 |
| TOTAL BOND FUNDS | | | |
| (Cost $505,990,420) | | | 491,175,478 |
| TOTAL INVESTMENT IN SECURITIES - 100.0% | | | |
| (Cost $2,722,942,430) | | | 3,492,424,210 |
| NET OTHER ASSETS (LIABILITIES) - 0.0% | | | (214,772) |
| NET ASSETS - 100% | | | $3,492,209,438 |
Legend
(a) Affiliated Fund
Affiliated Underlying Funds
Fiscal year to date information regarding the Fund's investments in affiliated Underlying Funds, excluding any Money Market Central Funds, is presented below. Exchanges between classes of the same affiliated Underlying Funds may occur.
| Affiliate | Value, beginning of period | Purchases | Sales Proceeds | Dividend Income | Realized Gain (loss) | Change in Unrealized appreciation (depreciation) | Value, end of period |
| Fidelity Commodity Strategy Fund Class F | $39,049,622 | $3,503,344 | $41,680,814 | $-- | $851,714 | $(1,723,866) | $-- |
| Fidelity Series Global ex U.S. Index Fund | 763,524,116 | 171,692,278 | 13,986,189 | -- | (445,536) | (19,026,569) | 901,758,100 |
| Fidelity Series Inflation-Protected Bond Index Fund | 6,235,479 | 1,625,132 | 7,899,563 | 7,934 | (44,589) | 83,541 | -- |
| Fidelity Series Long-Term Treasury Bond Index Fund | -- | 106,013,158 | 123,904 | 478,744 | (772) | (2,886,289) | 103,002,193 |
| Fidelity Total Market Index Fund Class F | 1,745,523,415 | 239,742,695 | 86,047,309 | 6,307,943 | (23,336) | 200,295,167 | 2,099,490,632 |
| Fidelity U.S. Bond Index Fund Class F | 359,317,454 | 76,165,698 | 41,743,095 | 5,228,824 | (1,023,698) | (4,543,074) | 388,173,285 |
| | $2,913,650,086 | $598,742,305 | $191,480,874 | $12,023,445 | $(686,217) | $172,198,910 | $3,492,424,210 |
Amounts in the income column in the above table include any capital gain distributions from underlying funds, which are presented in the corresponding line-item in the Statement of Operations if applicable.
Investment Valuation
All investments are categorized as Level 1 under the Fair Value Hierarchy. The inputs or methodology used for valuing securities may not be an indication of the risk associated with investing in those securities. For more information on valuation inputs please refer to the Investment Valuation section in the accompanying Notes to Financial Statements.
See accompanying notes which are an integral part of the financial statements.
Fidelity Freedom® Index 2035 Fund
Financial Statements
Statement of Assets and Liabilities
| | | September 30, 2018 (Unaudited) |
| Assets | | |
Investment in securities, at value — See accompanying schedule:
| | |
| Affiliated issuers (cost $2,722,942,430) | $3,492,424,210 | |
| Total Investment in Securities (cost $2,722,942,430) | | $3,492,424,210 |
| Cash | | 3 |
| Receivable for investments sold | | 5,622,845 |
| Receivable for fund shares sold | | 8,282,358 |
| Receivable from investment adviser for expense reductions | | 134,980 |
| Total assets | | 3,506,464,396 |
| Liabilities | | |
| Payable for investments purchased | $9,778,177 | |
| Payable for fund shares redeemed | 4,120,423 | |
| Transfer agent fees payable | 356,358 | |
| Total liabilities | | 14,254,958 |
| Net Assets | | $3,492,209,438 |
| Net Assets consist of: | | |
| Paid in capital | | $2,720,118,641 |
| Undistributed net investment income | | 10,019,342 |
| Accumulated undistributed net realized gain (loss) on investments | | (7,410,325) |
| Net unrealized appreciation (depreciation) on investments | | 769,481,780 |
| Net Assets | | $3,492,209,438 |
| Investor Class: | | |
| Net Asset Value, offering price and redemption price per share ($1,683,303,093 ÷ 85,435,508 shares) | | $19.70 |
| Institutional Premium Class: | | |
| Net Asset Value, offering price and redemption price per share ($1,808,906,345 ÷ 91,769,215 shares) | | $19.71 |
See accompanying notes which are an integral part of the financial statements.
Statement of Operations
| | | Six months ended September 30, 2018 (Unaudited) |
| Investment Income | | |
| Dividends: | | |
| Affiliated issuers | | $11,653,328 |
| Expenses | | |
| Transfer agent fees | $1,992,507 | |
| Independent trustees' fees and expenses | 7,519 | |
| Total expenses before reductions | 2,000,026 | |
| Expense reductions | (699,763) | |
| Total expenses after reductions | | 1,300,263 |
| Net investment income (loss) | | 10,353,065 |
| Realized and Unrealized Gain (Loss) | | |
| Net realized gain (loss) on: | | |
| Investment securities: | | |
| Affiliated issuers | (686,217) | |
| Capital gain distributions from underlying funds: | | |
| Affiliated issuers | 370,117 | |
| Total net realized gain (loss) | | (316,100) |
| Change in net unrealized appreciation (depreciation) on: | | |
| Investment securities: | | |
| Affiliated issuers | 172,198,910 | |
| Total change in net unrealized appreciation (depreciation) | | 172,198,910 |
| Net gain (loss) | | 171,882,810 |
| Net increase (decrease) in net assets resulting from operations | | $182,235,875 |
See accompanying notes which are an integral part of the financial statements.
Statement of Changes in Net Assets
| | Six months ended September 30, 2018 (Unaudited) | Year ended March 31, 2018 |
| Increase (Decrease) in Net Assets | | |
| Operations | | |
| Net investment income (loss) | $10,353,065 | $48,018,384 |
| Net realized gain (loss) | (316,100) | 7,779,322 |
| Change in net unrealized appreciation (depreciation) | 172,198,910 | 230,704,670 |
| Net increase (decrease) in net assets resulting from operations | 182,235,875 | 286,502,376 |
| Distributions to shareholders from net investment income | (1,730,995) | (46,982,742) |
| Distributions to shareholders from net realized gain | – | (2,454,277) |
| Total distributions | (1,730,995) | (49,437,019) |
| Share transactions - net increase (decrease) | 398,276,424 | 609,809,287 |
| Total increase (decrease) in net assets | 578,781,304 | 846,874,644 |
| Net Assets | | |
| Beginning of period | 2,913,428,134 | 2,066,553,490 |
| End of period | $3,492,209,438 | $2,913,428,134 |
| Other Information | | |
| Undistributed net investment income end of period | $10,019,342 | $1,397,272 |
See accompanying notes which are an integral part of the financial statements.
Financial Highlights
Fidelity Freedom Index 2035 Fund Investor Class
| | Six months ended (Unaudited) September 30, | Years endedMarch 31, | | | | |
| | 2018 | 2018 | 2017 | 2016 | 2015 | 2014 |
| Selected Per–Share Data | | | | | | |
| Net asset value, beginning of period | $18.63 | $16.79 | $14.91 | $15.67 | $15.11 | $13.32 |
| Income from Investment Operations | | | | | | |
| Net investment income (loss)A | .06 | .34 | .32 | .27 | .31 | .25 |
| Net realized and unrealized gain (loss) | 1.02 | 1.84 | 1.87 | (.73) | .77 | 1.55 |
| Total from investment operations | 1.08 | 2.18 | 2.19 | (.46) | 1.08 | 1.80 |
| Distributions from net investment income | (.01) | (.32) | (.30) | (.30) | (.51) | (.01) |
| Distributions from net realized gain | – | (.02) | (.01) | –B | (.01) | –B |
| Total distributions | (.01) | (.34) | (.31) | (.30) | (.52) | (.01) |
| Net asset value, end of period | $19.70 | $18.63 | $16.79 | $14.91 | $15.67 | $15.11 |
| Total ReturnC,D | 5.79% | 12.96% | 14.81% | (2.93)% | 7.25% | 13.56% |
| Ratios to Average Net AssetsE,F | | | | | | |
| Expenses before reductions | .15%G | .15% | .15% | .15% | .15% | .15% |
| Expenses net of fee waivers, if any | .11%G | .12% | .10% | .08% | .08% | .08% |
| Expenses net of all reductions | .11%G | .12% | .10% | .08% | .08% | .08% |
| Net investment income (loss) | .61%G | 1.89% | 2.02% | 1.79% | 2.02% | 1.79% |
| Supplemental Data | | | | | | |
| Net assets, end of period (000 omitted) | $1,683,303 | $1,390,826 | $936,458 | $880,845 | $1,282,091 | $1,000,962 |
| Portfolio turnover rateF | 12%G | 7% | 13% | 11% | 13% | 25% |
A Calculated based on average shares outstanding during the period.
B Amount represents less than $.005 per share.
C Total returns for periods of less than one year are not annualized.
D Total returns would have been lower if certain expenses had not been reduced during the applicable periods shown.
E Expense ratios reflect operating expenses of the class. Expenses before reductions do not reflect amounts reimbursed by the investment adviser or reductions from expense offset arrangements and do not represent the amount paid by the class during periods when reimbursements or reductions occur. Expenses net of fee waivers reflect expenses after reimbursement by the investment adviser but prior to reductions from expense offset arrangements. Expenses net of all reductions represent the net expenses paid by the class.
F Amount does not include the portfolio activity of any Underlying Funds.
G Annualized
See accompanying notes which are an integral part of the financial statements.
Fidelity Freedom Index 2035 Fund Institutional Premium Class
| | Six months ended (Unaudited) September 30, | Years endedMarch 31, | | |
| | 2018 | 2018 | 2017 | 2016 A |
| Selected Per–Share Data | | | | |
| Net asset value, beginning of period | $18.64 | $16.80 | $14.92 | $16.03 |
| Income from Investment Operations | | | | |
| Net investment income (loss)B | .06 | .35 | .33 | .39 |
| Net realized and unrealized gain (loss) | 1.02 | 1.84 | 1.87 | (1.20) |
| Total from investment operations | 1.08 | 2.19 | 2.20 | (.81) |
| Distributions from net investment income | (.01) | (.33) | (.31) | (.30) |
| Distributions from net realized gain | – | (.02) | (.01) | –C |
| Total distributions | (.01) | (.35) | (.32) | (.30) |
| Net asset value, end of period | $19.71 | $18.64 | $16.80 | $14.92 |
| Total ReturnD,E | 5.81% | 13.00% | 14.87% | (5.04)% |
| Ratios to Average Net AssetsF,G | | | | |
| Expenses before reductions | .10%H | .10% | .09% | .05%H |
| Expenses net of fee waivers, if any | .05%H | .07% | .05% | .01%H |
| Expenses net of all reductions | .05%H | .07% | .05% | .01%H |
| Net investment income (loss) | .67%H | 1.94% | 2.07% | 3.53%H |
| Supplemental Data | | | | |
| Net assets, end of period (000 omitted) | $1,808,906 | $1,522,603 | $1,130,096 | $581,231 |
| Portfolio turnover rateG | 12%H | 7% | 13% | 11% |
A For the period June 24, 2015 (commencement of sale of shares) to March 31, 2016.
B Calculated based on average shares outstanding during the period.
C Amount represents less than $.005 per share.
D Total returns for periods of less than one year are not annualized.
E Total returns would have been lower if certain expenses had not been reduced during the applicable periods shown.
F Expense ratios reflect operating expenses of the class. Expenses before reductions do not reflect amounts reimbursed by the investment adviser or reductions from expense offset arrangements and do not represent the amount paid by the class during periods when reimbursements or reductions occur. Expense ratios before reductions for start-up periods may not be representative of longer-term operating periods. Expenses net of fee waivers reflect expenses after reimbursement by the investment adviser but prior to reductions from expense offset arrangements. Expenses net of all reductions represent the net expenses paid by the class.
G Amount does not include the portfolio activity of any Underlying Funds.
H Annualized
See accompanying notes which are an integral part of the financial statements.
Fidelity Freedom® Index 2040 Fund
Investment Summary (Unaudited)
The information in the following tables is based on the direct investments of the Fund.
Top Holdings as of September 30, 2018
| | % of fund's net assets |
| Fidelity Total Market Index Fund Class F | 63.0 |
| Fidelity Series Global ex U.S. Index Fund | 27.1 |
| Fidelity U.S. Bond Index Fund Class F | 7.0 |
| Fidelity Series Long-Term Treasury Bond Index Fund | 2.9 |
| Fidelity Cash Central Fund, 2.11% | 0.0 |
| | 100.0 |
Asset Allocation (% of fund's net assets)
| Period end |
| | Domestic Equity Funds | 63.0% |
| | International Equity Funds | 27.1% |
| | Bond Funds | 9.9% |

Percentages shown as 0.0% may reflect amounts less than 0.05%.
Fidelity Freedom® Index 2040 Fund
Schedule of Investments September 30, 2018 (Unaudited)
Showing Percentage of Net Assets
| Domestic Equity Funds - 63.0% | | | |
| | | Shares | Value |
| Fidelity Total Market Index Fund Class F (a) | | | |
| (Cost $1,538,185,684) | | 27,784,614 | 2,338,075,266 |
|
| International Equity Funds - 27.1% | | | |
| Fidelity Series Global ex U.S. Index Fund (a) | | | |
| (Cost $903,497,649) | | 78,093,925 | 1,003,506,932 |
|
| Bond Funds - 9.9% | | | |
| Fidelity Series Long-Term Treasury Bond Index Fund (a) | | 13,063,551 | 107,643,660 |
| Fidelity U.S. Bond Index Fund Class F (a) | | 23,157,895 | 258,673,690 |
| TOTAL BOND FUNDS | | | |
| (Cost $377,855,857) | | | 366,317,350 |
|
| Short-Term Funds - 0.0% | | | |
| Fidelity Cash Central Fund, 2.11% (b) | | | |
| (Cost $3) | | 3 | 3 |
| TOTAL INVESTMENT IN SECURITIES - 100.0% | | | |
| (Cost $2,819,539,193) | | | 3,707,899,551 |
| NET OTHER ASSETS (LIABILITIES) - 0.0% | | | (220,696) |
| NET ASSETS - 100% | | | $3,707,678,855 |
Legend
(a) Affiliated Fund
(b) Affiliated fund that is generally available only to investment companies and other accounts managed by Fidelity Investments. The rate quoted is the annualized seven-day yield of the fund at period end. A complete unaudited listing of the fund's holdings as of its most recent quarter end is available upon request. In addition, each Fidelity Central Fund's financial statements are available on the SEC's website or upon request.
Affiliated Underlying Funds
Fiscal year to date information regarding the Fund's investments in affiliated Underlying Funds, excluding any Money Market Central Funds, is presented below. Exchanges between classes of the same affiliated Underlying Funds may occur.
| Affiliate | Value, beginning of period | Purchases | Sales Proceeds | Dividend Income | Realized Gain (loss) | Change in Unrealized appreciation (depreciation) | Value, end of period |
| Fidelity Commodity Strategy Fund Class F | $43,562,265 | $2,375,024 | $44,984,771 | $-- | $980,542 | $(1,933,060) | $-- |
| Fidelity Series Global ex U.S. Index Fund | 866,105,013 | 174,859,597 | 15,861,153 | -- | (447,476) | (21,149,049) | 1,003,506,932 |
| Fidelity Series Long-Term Treasury Bond Index Fund | -- | 110,782,532 | 86,491 | 509,087 | (709) | (3,051,672) | 107,643,660 |
| Fidelity Total Market Index Fund Class F | 1,981,539,621 | 199,705,912 | 65,271,024 | 7,141,644 | (158,994) | 222,259,751 | 2,338,075,266 |
| Fidelity U.S. Bond Index Fund Class F | 320,248,391 | 35,748,464 | 92,894,854 | 4,181,035 | (3,022,980) | (1,405,331) | 258,673,690 |
| Total | $3,211,455,290 | $523,471,529 | $219,098,293 | $11,831,766 | $(2,649,617) | $194,720,639 | $3,707,899,548 |
Amounts in the income column in the above table include any capital gain distributions from underlying funds, which are presented in the corresponding line-item in the Statement of Operations if applicable.
Investment Valuation
All investments are categorized as Level 1 under the Fair Value Hierarchy. The inputs or methodology used for valuing securities may not be an indication of the risk associated with investing in those securities. For more information on valuation inputs please refer to the Investment Valuation section in the accompanying Notes to Financial Statements.
See accompanying notes which are an integral part of the financial statements.
Fidelity Freedom® Index 2040 Fund
Financial Statements
Statement of Assets and Liabilities
| | | September 30, 2018 (Unaudited) |
| Assets | | |
Investment in securities, at value — See accompanying schedule:
| | |
| Fidelity Central Funds (cost $3) | $3 | |
| Other affiliated issuers (cost $2,819,539,190) | 3,707,899,548 | |
| Total Investment in Securities (cost $2,819,539,193) | | $3,707,899,551 |
| Cash | | 4 |
| Receivable for fund shares sold | | 7,044,316 |
| Receivable from investment adviser for expense reductions | | 145,638 |
| Total assets | | 3,715,089,509 |
| Liabilities | | |
| Payable for investments purchased | $4,578,073 | |
| Payable for fund shares redeemed | 2,464,939 | |
| Transfer agent fees payable | 367,642 | |
| Total liabilities | | 7,410,654 |
| Net Assets | | $3,707,678,855 |
| Net Assets consist of: | | |
| Paid in capital | | $2,820,166,686 |
| Undistributed net investment income | | 9,690,152 |
| Accumulated undistributed net realized gain (loss) on investments | | (10,538,341) |
| Net unrealized appreciation (depreciation) on investments | | 888,360,358 |
| Net Assets | | $3,707,678,855 |
| Investor Class: | | |
| Net Asset Value, offering price and redemption price per share ($1,528,341,350 ÷ 76,850,862 shares) | | $19.89 |
| Institutional Premium Class: | | |
| Net Asset Value, offering price and redemption price per share ($2,179,337,505 ÷ 109,599,050 shares) | | $19.88 |
See accompanying notes which are an integral part of the financial statements.
Statement of Operations
| | | Six months ended September 30, 2018 (Unaudited) |
| Investment Income | | |
| Dividends: | | |
| Affiliated issuers | | $11,412,732 |
| Expenses | | |
| Transfer agent fees | $2,073,882 | |
| Independent trustees' fees and expenses | 8,126 | |
| Total expenses before reductions | 2,082,008 | |
| Expense reductions | (758,049) | |
| Total expenses after reductions | | 1,323,959 |
| Net investment income (loss) | | 10,088,773 |
| Realized and Unrealized Gain (Loss) | | |
| Net realized gain (loss) on: | | |
| Investment securities: | | |
| Affiliated issuers | (2,649,617) | |
| Capital gain distributions from underlying funds: | | |
| Affiliated issuers | 419,034 | |
| Total net realized gain (loss) | | (2,230,583) |
| Change in net unrealized appreciation (depreciation) on: | | |
| Investment securities: | | |
| Affiliated issuers | 194,720,639 | |
| Total change in net unrealized appreciation (depreciation) | | 194,720,639 |
| Net gain (loss) | | 192,490,056 |
| Net increase (decrease) in net assets resulting from operations | | $202,578,829 |
See accompanying notes which are an integral part of the financial statements.
Statement of Changes in Net Assets
| | Six months ended September 30, 2018 (Unaudited) | Year ended March 31, 2018 |
| Increase (Decrease) in Net Assets | | |
| Operations | | |
| Net investment income (loss) | $10,088,773 | $53,073,570 |
| Net realized gain (loss) | (2,230,583) | 7,407,962 |
| Change in net unrealized appreciation (depreciation) | 194,720,639 | 263,292,142 |
| Net increase (decrease) in net assets resulting from operations | 202,578,829 | 323,773,674 |
| Distributions to shareholders from net investment income | (1,608,254) | (52,237,907) |
| Distributions to shareholders from net realized gain | (1,921,468) | (2,681,758) |
| Total distributions | (3,529,722) | (54,919,665) |
| Share transactions - net increase (decrease) | 297,409,512 | 604,288,654 |
| Total increase (decrease) in net assets | 496,458,619 | 873,142,663 |
| Net Assets | | |
| Beginning of period | 3,211,220,236 | 2,338,077,573 |
| End of period | $3,707,678,855 | $3,211,220,236 |
| Other Information | | |
| Undistributed net investment income end of period | $9,690,152 | $1,209,633 |
See accompanying notes which are an integral part of the financial statements.
Financial Highlights
Fidelity Freedom Index 2040 Fund Investor Class
| | Six months ended (Unaudited) September 30, | Years endedMarch 31, | | | | |
| | 2018 | 2018 | 2017 | 2016 | 2015 | 2014 |
| Selected Per–Share Data | | | | | | |
| Net asset value, beginning of period | $18.77 | $16.90 | $15.00 | $15.76 | $15.18 | $13.36 |
| Income from Investment Operations | | | | | | |
| Net investment income (loss)A | .05 | .34 | .32 | .26 | .31 | .25 |
| Net realized and unrealized gain (loss) | 1.09 | 1.87 | 1.90 | (.72) | .78 | 1.58 |
| Total from investment operations | 1.14 | 2.21 | 2.22 | (.46) | 1.09 | 1.83 |
| Distributions from net investment income | (.01) | (.33) | (.31) | (.30) | (.50) | (.01) |
| Distributions from net realized gain | (.01) | (.02) | (.01) | –B | –B | –B |
| Total distributions | (.02) | (.34)C | (.32) | (.30) | (.51)D | (.01) |
| Net asset value, end of period | $19.89 | $18.77 | $16.90 | $15.00 | $15.76 | $15.18 |
| Total ReturnE,F | 6.07% | 13.08% | 14.90% | (2.91)% | 7.27% | 13.72% |
| Ratios to Average Net AssetsG,H | | | | | | |
| Expenses before reductions | .15%I | .15% | .15% | .15% | .15% | .15% |
| Expenses net of fee waivers, if any | .11%I | .12% | .10% | .08% | .08% | .08% |
| Expenses net of all reductions | .11%I | .12% | .10% | .08% | .08% | .08% |
| Net investment income (loss) | .55%I | 1.87% | 2.02% | 1.70% | 1.99% | 1.78% |
| Supplemental Data | | | | | | |
| Net assets, end of period (000 omitted) | $1,528,341 | $1,281,722 | $900,067 | $910,880 | $1,511,298 | $1,179,249 |
| Portfolio turnover rateH | 13%I | 6% | 13% | 9% | 12% | 26% |
A Calculated based on average shares outstanding during the period.
B Amount represents less than $.005 per share.
C Total distributions of $.34 per share is comprised of distributions from net investment income of $.327 and distributions from net realized gain of $.017 per share
D Total distributions of $.51 per share is comprised of distributions from net investment income of $.502 and distributions from net realized gain of $.003 per share
E Total returns for periods of less than one year are not annualized.
F Total returns would have been lower if certain expenses had not been reduced during the applicable periods shown.
G Expense ratios reflect operating expenses of the class. Expenses before reductions do not reflect amounts reimbursed by the investment adviser or reductions from expense offset arrangements and do not represent the amount paid by the class during periods when reimbursements or reductions occur. Expenses net of fee waivers reflect expenses after reimbursement by the investment adviser but prior to reductions from expense offset arrangements. Expenses net of all reductions represent the net expenses paid by the class.
H Amount does not include the portfolio activity of any Underlying Funds.
I Annualized
See accompanying notes which are an integral part of the financial statements.
Fidelity Freedom Index 2040 Fund Institutional Premium Class
| | Six months ended (Unaudited) September 30, | Years endedMarch 31, | | |
| | 2018 | 2018 | 2017 | 2016 A |
| Selected Per–Share Data | | | | |
| Net asset value, beginning of period | $18.77 | $16.89 | $15.00 | $16.12 |
| Income from Investment Operations | | | | |
| Net investment income (loss)B | .06 | .35 | .33 | .41 |
| Net realized and unrealized gain (loss) | 1.07 | 1.88 | 1.89 | (1.22) |
| Total from investment operations | 1.13 | 2.23 | 2.22 | (.81) |
| Distributions from net investment income | (.01) | (.34) | (.32) | (.30) |
| Distributions from net realized gain | (.01) | (.02) | (.01) | –C |
| Total distributions | (.02) | (.35)D | (.33) | (.31)E |
| Net asset value, end of period | $19.88 | $18.77 | $16.89 | $15.00 |
| Total ReturnF,G | 6.03% | 13.20% | 14.90% | (5.06)% |
| Ratios to Average Net AssetsH,I | | | | |
| Expenses before reductions | .10%J | .10% | .09% | .05%J |
| Expenses net of fee waivers, if any | .05%J | .07% | .05% | .01%J |
| Expenses net of all reductions | .05%J | .07% | .05% | .01%J |
| Net investment income (loss) | .61%J | 1.92% | 2.07% | 3.69%J |
| Supplemental Data | | | | |
| Net assets, end of period (000 omitted) | $2,179,338 | $1,929,498 | $1,438,010 | $830,093 |
| Portfolio turnover rateI | 13%J | 6% | 13% | 9% |
A For the period June 24, 2015 (commencement of sale of shares) to March 31, 2016.
B Calculated based on average shares outstanding during the period.
C Amount represents less than $.005 per share.
D Total distributions of $.35 per share is comprised of distributions from net investment income of $.335 and distributions from net realized gain of $.017 per share.
E Total distributions of $.31 per share is comprised of distributions from net investment income of $.303 and distributions from net realized gain of $.003 per share.
F Total returns for periods of less than one year are not annualized.
G Total returns would have been lower if certain expenses had not been reduced during the applicable periods shown.
H Expense ratios reflect operating expenses of the class. Expenses before reductions do not reflect amounts reimbursed by the investment adviser or reductions from expense offset arrangements and do not represent the amount paid by the class during periods when reimbursements or reductions occur. Expense ratios before reductions for start-up periods may not be representative of longer-term operating periods. Expenses net of fee waivers reflect expenses after reimbursement by the investment adviser but prior to reductions from expense offset arrangements. Expenses net of all reductions represent the net expenses paid by the class.
I Amount does not include the portfolio activity of any Underlying Funds.
J Annualized
See accompanying notes which are an integral part of the financial statements.
Fidelity Freedom® Index 2045 Fund
Investment Summary (Unaudited)
The information in the following tables is based on the direct investments of the Fund.
Top Holdings as of September 30, 2018
| | % of fund's net assets |
| Fidelity Total Market Index Fund Class F | 63.0 |
| Fidelity Series Global ex U.S. Index Fund | 27.1 |
| Fidelity U.S. Bond Index Fund Class F | 7.0 |
| Fidelity Series Long-Term Treasury Bond Index Fund | 2.9 |
| Fidelity Cash Central Fund, 2.11% | 0.0 |
| | 100.0 |
Asset Allocation (% of fund's net assets)
| Period end |
| | Domestic Equity Funds | 63.0% |
| | International Equity Funds | 27.1% |
| | Bond Funds | 9.9% |

Percentages shown as 0.0% may reflect amounts less than 0.05%.
Fidelity Freedom® Index 2045 Fund
Schedule of Investments September 30, 2018 (Unaudited)
Showing Percentage of Net Assets
| Domestic Equity Funds - 63.0% | | | |
| | | Shares | Value |
| Fidelity Total Market Index Fund Class F (a) | | | |
| (Cost $1,021,664,217) | | 17,428,931 | 1,466,644,570 |
|
| International Equity Funds - 27.1% | | | |
| Fidelity Series Global ex U.S. Index Fund (a) | | | |
| (Cost $573,357,466) | | 48,987,354 | 629,487,500 |
|
| Bond Funds - 9.9% | | | |
| Fidelity Series Long-Term Treasury Bond Index Fund (a) | | 8,194,992 | 67,526,738 |
| Fidelity U.S. Bond Index Fund Class F (a) | | 14,526,752 | 162,263,824 |
| TOTAL BOND FUNDS | | | |
| (Cost $237,183,226) | | | 229,790,562 |
|
| Short-Term Funds - 0.0% | | | |
| Fidelity Cash Central Fund, 2.11% (b) | | | |
| (Cost $1) | | 1 | 1 |
| TOTAL INVESTMENT IN SECURITIES - 100.0% | | | |
| (Cost $1,832,204,910) | | | 2,325,922,633 |
| NET OTHER ASSETS (LIABILITIES) - 0.0% | | | (143,208) |
| NET ASSETS - 100% | | | $2,325,779,425 |
Legend
(a) Affiliated Fund
(b) Affiliated fund that is generally available only to investment companies and other accounts managed by Fidelity Investments. The rate quoted is the annualized seven-day yield of the fund at period end. A complete unaudited listing of the fund's holdings as of its most recent quarter end is available upon request. In addition, each Fidelity Central Fund's financial statements are available on the SEC's website or upon request.
Affiliated Underlying Funds
Fiscal year to date information regarding the Fund's investments in affiliated Underlying Funds, excluding any Money Market Central Funds, is presented below. Exchanges between classes of the same affiliated Underlying Funds may occur.
| Affiliate | Value, beginning of period | Purchases | Sales Proceeds | Dividend Income | Realized Gain (loss) | Change in Unrealized appreciation (depreciation) | Value, end of period |
| Fidelity Commodity Strategy Fund Class F | $26,255,219 | $2,109,605 | $27,762,394 | $-- | $538,575 | $(1,141,005) | $-- |
| Fidelity Series Global ex U.S. Index Fund | 521,952,944 | 127,461,370 | 6,534,988 | -- | (295,265) | (13,096,561) | 629,487,500 |
| Fidelity Series Long-Term Treasury Bond Index Fund | -- | 69,497,079 | 58,708 | 318,430 | (346) | (1,911,287) | 67,526,738 |
| Fidelity Total Market Index Fund Class F | 1,194,165,689 | 170,589,618 | 35,587,552 | 4,317,914 | (172,744) | 137,649,559 | 1,466,644,570 |
| Fidelity U.S. Bond Index Fund Class F | 192,994,166 | 27,620,512 | 55,642,896 | 2,581,815 | (1,793,274) | (914,684) | 162,263,824 |
| Total | $1,935,368,018 | $397,278,184 | $125,586,538 | $7,218,159 | $(1,723,054) | $120,586,022 | $2,325,922,632 |
Investment Valuation
All investments are categorized as Level 1 under the Fair Value Hierarchy. The inputs or methodology used for valuing securities may not be an indication of the risk associated with investing in those securities. For more information on valuation inputs please refer to the Investment Valuation section in the accompanying Notes to Financial Statements.
See accompanying notes which are an integral part of the financial statements.
Fidelity Freedom® Index 2045 Fund
Financial Statements
Statement of Assets and Liabilities
| | | September 30, 2018 (Unaudited) |
| Assets | | |
Investment in securities, at value — See accompanying schedule:
| | |
| Fidelity Central Funds (cost $1) | $1 | |
| Other affiliated issuers (cost $1,832,204,909) | 2,325,922,632 | |
| Total Investment in Securities (cost $1,832,204,910) | | $2,325,922,633 |
| Cash | | 4 |
| Receivable for fund shares sold | | 6,506,829 |
| Receivable from investment adviser for expense reductions | | 90,443 |
| Total assets | | 2,332,519,909 |
| Liabilities | | |
| Payable for investments purchased | $5,440,443 | |
| Payable for fund shares redeemed | 1,065,486 | |
| Transfer agent fees payable | 234,555 | |
| Total liabilities | | 6,740,484 |
| Net Assets | | $2,325,779,425 |
| Net Assets consist of: | | |
| Paid in capital | | $1,832,944,692 |
| Undistributed net investment income | | 5,863,571 |
| Accumulated undistributed net realized gain (loss) on investments | | (6,746,561) |
| Net unrealized appreciation (depreciation) on investments | | 493,717,723 |
| Net Assets | | $2,325,779,425 |
| Investor Class: | | |
| Net Asset Value, offering price and redemption price per share ($1,057,287,767 ÷ 52,798,996 shares) | | $20.02 |
| Institutional Premium Class: | | |
| Net Asset Value, offering price and redemption price per share ($1,268,491,658 ÷ 63,324,818 shares) | | $20.03 |
See accompanying notes which are an integral part of the financial statements.
Statement of Operations
| | | Six months ended September 30, 2018 (Unaudited) |
| Investment Income | | |
| Dividends: | | |
| Affiliated issuers | | $6,964,807 |
| Expenses | | |
| Transfer agent fees | $1,306,229 | |
| Independent trustees' fees and expenses | 4,977 | |
| Total expenses before reductions | 1,311,206 | |
| Expense reductions | (466,062) | |
| Total expenses after reductions | | 845,144 |
| Net investment income (loss) | | 6,119,663 |
| Realized and Unrealized Gain (Loss) | | |
| Net realized gain (loss) on: | | |
| Investment securities: | | |
| Affiliated issuers | (1,723,054) | |
| Capital gain distributions from underlying funds: | | |
| Affiliated issuers | 253,352 | |
| Total net realized gain (loss) | | (1,469,702) |
| Change in net unrealized appreciation (depreciation) on: | | |
| Investment securities: | | |
| Affiliated issuers | 120,586,022 | |
| Total change in net unrealized appreciation (depreciation) | | 120,586,022 |
| Net gain (loss) | | 119,116,320 |
| Net increase (decrease) in net assets resulting from operations | | $125,235,983 |
See accompanying notes which are an integral part of the financial statements.
Statement of Changes in Net Assets
| | Six months ended September 30, 2018 (Unaudited) | Year ended March 31, 2018 |
| Increase (Decrease) in Net Assets | | |
| Operations | | |
| Net investment income (loss) | $6,119,663 | $31,416,724 |
| Net realized gain (loss) | (1,469,702) | 4,978,956 |
| Change in net unrealized appreciation (depreciation) | 120,586,022 | 152,405,983 |
| Net increase (decrease) in net assets resulting from operations | 125,235,983 | 188,801,663 |
| Distributions to shareholders from net investment income | (1,027,458) | (31,021,585) |
| Distributions to shareholders from net realized gain | (2,231,357) | (2,702,847) |
| Total distributions | (3,258,815) | (33,724,432) |
| Share transactions - net increase (decrease) | 268,580,250 | 452,606,471 |
| Total increase (decrease) in net assets | 390,557,418 | 607,683,702 |
| Net Assets | | |
| Beginning of period | 1,935,222,007 | 1,327,538,305 |
| End of period | $2,325,779,425 | $1,935,222,007 |
| Other Information | | |
| Undistributed net investment income end of period | $5,863,571 | $771,366 |
See accompanying notes which are an integral part of the financial statements.
Financial Highlights
Fidelity Freedom Index 2045 Fund Investor Class
| | Six months ended (Unaudited) September 30, | Years endedMarch 31, | | | | |
| | 2018 | 2018 | 2017 | 2016 | 2015 | 2014 |
| Selected Per–Share Data | | | | | | |
| Net asset value, beginning of period | $18.91 | $17.04 | $15.13 | $15.89 | $15.32 | $13.44 |
| Income from Investment Operations | | | | | | |
| Net investment income (loss)A | .05 | .35 | .33 | .28 | .32 | .25 |
| Net realized and unrealized gain (loss) | 1.09 | 1.88 | 1.90 | (.74) | .77 | 1.64 |
| Total from investment operations | 1.14 | 2.23 | 2.23 | (.46) | 1.09 | 1.89 |
| Distributions from net investment income | (.01) | (.33) | (.31) | (.30) | (.51) | (.01) |
| Distributions from net realized gain | (.02) | (.03) | (.01) | –B | (.01) | –B |
| Total distributions | (.03) | (.36) | (.32) | (.30) | (.52) | (.01) |
| Net asset value, end of period | $20.02 | $18.91 | $17.04 | $15.13 | $15.89 | $15.32 |
| Total ReturnC,D | 6.03% | 13.08% | 14.87% | (2.88)% | 7.22% | 14.07% |
| Ratios to Average Net AssetsE,F | | | | | | |
| Expenses before reductions | .15%G | .15% | .15% | .15% | .15% | .15% |
| Expenses net of fee waivers, if any | .11%G | .12% | .10% | .08% | .08% | .08% |
| Expenses net of all reductions | .11%G | .12% | .10% | .08% | .08% | .08% |
| Net investment income (loss) | .54%G | 1.89% | 2.04% | 1.79% | 2.04% | 1.75% |
| Supplemental Data | | | | | | |
| Net assets, end of period (000 omitted) | $1,057,288 | $872,779 | $583,893 | $542,581 | $750,330 | $577,603 |
| Portfolio turnover rateF | 12%G | 6% | 15% | 8% | 12% | 22% |
A Calculated based on average shares outstanding during the period.
B Amount represents less than $.005 per share.
C Total returns for periods of less than one year are not annualized.
D Total returns would have been lower if certain expenses had not been reduced during the applicable periods shown.
E Expense ratios reflect operating expenses of the class. Expenses before reductions do not reflect amounts reimbursed by the investment adviser or reductions from expense offset arrangements and do not represent the amount paid by the class during periods when reimbursements or reductions occur. Expenses net of fee waivers reflect expenses after reimbursement by the investment adviser but prior to reductions from expense offset arrangements. Expenses net of all reductions represent the net expenses paid by the class.
F Amount does not include the portfolio activity of any Underlying Funds.
G Annualized
See accompanying notes which are an integral part of the financial statements.
Fidelity Freedom Index 2045 Fund Institutional Premium Class
| | Six months ended (Unaudited) September 30, | Years endedMarch 31, | | |
| | 2018 | 2018 | 2017 | 2016 A |
| Selected Per–Share Data | | | | |
| Net asset value, beginning of period | $18.92 | $17.04 | $15.13 | $16.26 |
| Income from Investment Operations | | | | |
| Net investment income (loss)B | .06 | .36 | .34 | .40 |
| Net realized and unrealized gain (loss) | 1.08 | 1.89 | 1.90 | (1.22) |
| Total from investment operations | 1.14 | 2.25 | 2.24 | (.82) |
| Distributions from net investment income | (.01) | (.34) | (.32) | (.30) |
| Distributions from net realized gain | (.02) | (.03) | (.01) | –C |
| Total distributions | (.03) | (.37) | (.33) | (.31)D |
| Net asset value, end of period | $20.03 | $18.92 | $17.04 | $15.13 |
| Total ReturnE,F | 6.04% | 13.20% | 14.94% | (5.08)% |
| Ratios to Average Net AssetsG,H | | | | |
| Expenses before reductions | .10%I | .10% | .09% | .05%I |
| Expenses net of fee waivers, if any | .05%I | .07% | .05% | .01%I |
| Expenses net of all reductions | .05%I | .07% | .05% | .01%I |
| Net investment income (loss) | .60%I | 1.94% | 2.09% | 3.56%I |
| Supplemental Data | | | | |
| Net assets, end of period (000 omitted) | $1,268,492 | $1,062,443 | $743,645 | $386,977 |
| Portfolio turnover rateH | 12%I | 6% | 15% | 8% |
A For the period June 24, 2015 (commencement of sale of shares) to March 31, 2016.
B Calculated based on average shares outstanding during the period.
C Amount represents less than $.005 per share.
D Total distributions of $.31 per share is comprised of distributions from net investment income of $.303 and distributions from net realized gain of $.003 per share.
E Total returns for periods of less than one year are not annualized.
F Total returns would have been lower if certain expenses had not been reduced during the applicable periods shown.
G Expense ratios reflect operating expenses of the class. Expenses before reductions do not reflect amounts reimbursed by the investment adviser or reductions from expense offset arrangements and do not represent the amount paid by the class during periods when reimbursements or reductions occur. Expense ratios before reductions for start-up periods may not be representative of longer-term operating periods. Expenses net of fee waivers reflect expenses after reimbursement by the investment adviser but prior to reductions from expense offset arrangements. Expenses net of all reductions represent the net expenses paid by the class.
H Amount does not include the portfolio activity of any Underlying Funds.
I Annualized
See accompanying notes which are an integral part of the financial statements.
Fidelity Freedom® Index 2050 Fund
Investment Summary (Unaudited)
The information in the following tables is based on the direct investments of the Fund.
Top Holdings as of September 30, 2018
| | % of fund's net assets |
| Fidelity Total Market Index Fund Class F | 63.0 |
| Fidelity Series Global ex U.S. Index Fund | 27.1 |
| Fidelity U.S. Bond Index Fund Class F | 7.0 |
| Fidelity Series Long-Term Treasury Bond Index Fund | 2.9 |
| Fidelity Cash Central Fund, 2.11% | 0.0 |
| | 100.0 |
Asset Allocation (% of fund's net assets)
| Period end |
| | Domestic Equity Funds | 63.0% |
| | International Equity Funds | 27.1% |
| | Bond Funds | 9.9% |

Percentages shown as 0.0% may reflect amounts less than 0.05%.
Fidelity Freedom® Index 2050 Fund
Schedule of Investments September 30, 2018 (Unaudited)
Showing Percentage of Net Assets
| Domestic Equity Funds - 63.0% | | | |
| | | Shares | Value |
| Fidelity Total Market Index Fund Class F (a) | | | |
| (Cost $933,331,971) | | 15,947,169 | 1,341,954,234 |
|
| International Equity Funds - 27.1% | | | |
| Fidelity Series Global ex U.S. Index Fund (a) | | | |
| (Cost $523,320,899) | | 44,822,649 | 575,971,037 |
|
| Bond Funds - 9.9% | | | |
| Fidelity Series Long-Term Treasury Bond Index Fund (a) | | 7,498,322 | 61,786,170 |
| Fidelity U.S. Bond Index Fund Class F (a) | | 13,291,671 | 148,467,967 |
| TOTAL BOND FUNDS | | | |
| (Cost $217,347,707) | | | 210,254,137 |
|
| Short-Term Funds - 0.0% | | | |
| Fidelity Cash Central Fund, 2.11% (b) | | | |
| (Cost $2) | | 2 | 2 |
| TOTAL INVESTMENT IN SECURITIES - 100.0% | | | |
| (Cost $1,674,000,579) | | | 2,128,179,410 |
| NET OTHER ASSETS (LIABILITIES) - 0.0% | | | (127,142) |
| NET ASSETS - 100% | | | $2,128,052,268 |
Legend
(a) Affiliated Fund
(b) Affiliated fund that is generally available only to investment companies and other accounts managed by Fidelity Investments. The rate quoted is the annualized seven-day yield of the fund at period end. A complete unaudited listing of the fund's holdings as of its most recent quarter end is available upon request. In addition, each Fidelity Central Fund's financial statements are available on the SEC's website or upon request.
Affiliated Underlying Funds
Fiscal year to date information regarding the Fund's investments in affiliated Underlying Funds, excluding any Money Market Central Funds, is presented below. Exchanges between classes of the same affiliated Underlying Funds may occur.
| Affiliate | Value, beginning of period | Purchases | Sales Proceeds | Dividend Income | Realized Gain (loss) | Change in Unrealized appreciation (depreciation) | Value, end of period |
| Fidelity Commodity Strategy Fund Class F | $24,471,106 | $1,837,034 | $25,765,640 | $-- | $519,266 | $(1,061,766) | $-- |
| Fidelity Series Global ex U.S. Index Fund | 486,461,725 | 114,920,086 | 13,313,838 | -- | (364,561) | (11,732,375) | 575,971,037 |
| Fidelity Series Long-Term Treasury Bond Index Fund | -- | 63,588,243 | 52,765 | 291,080 | (501) | (1,748,807) | 61,786,170 |
| Fidelity Total Market Index Fund Class F | 1,112,966,999 | 146,762,100 | 43,681,178 | 4,013,000 | (233,059) | 126,139,372 | 1,341,954,234 |
| Fidelity U.S. Bond Index Fund Class F | 179,870,698 | 24,667,991 | 53,567,592 | 2,366,067 | (1,559,415) | (943,715) | 148,467,967 |
| Total | $1,803,770,528 | $351,775,454 | $136,381,013 | $6,670,147 | $(1,638,270) | $110,652,709 | $2,128,179,408 |
Amounts in the income column in the above table include any capital gain distributions from underlying funds, which are presented in the corresponding line-item in the Statement of Operations if applicable.
Investment Valuation
All investments are categorized as Level 1 under the Fair Value Hierarchy. The inputs or methodology used for valuing securities may not be an indication of the risk associated with investing in those securities. For more information on valuation inputs please refer to the Investment Valuation section in the accompanying Notes to Financial Statements.
See accompanying notes which are an integral part of the financial statements.
Fidelity Freedom® Index 2050 Fund
Financial Statements
Statement of Assets and Liabilities
| | | September 30, 2018 (Unaudited) |
| Assets | | |
Investment in securities, at value — See accompanying schedule:
| | |
| Fidelity Central Funds (cost $2) | $2 | |
| Other affiliated issuers (cost $1,674,000,577) | 2,128,179,408 | |
| Total Investment in Securities (cost $1,674,000,579) | | $2,128,179,410 |
| Cash | | 3 |
| Receivable for fund shares sold | | 5,874,521 |
| Receivable from investment adviser for expense reductions | | 83,338 |
| Total assets | | 2,134,137,272 |
| Liabilities | | |
| Payable for investments purchased | $4,647,996 | |
| Payable for fund shares redeemed | 1,225,664 | |
| Transfer agent fees payable | 211,344 | |
| Total liabilities | | 6,085,004 |
| Net Assets | | $2,128,052,268 |
| Net Assets consist of: | | |
| Paid in capital | | $1,676,398,722 |
| Undistributed net investment income | | 5,551,970 |
| Accumulated undistributed net realized gain (loss) on investments | | (8,077,255) |
| Net unrealized appreciation (depreciation) on investments | | 454,178,831 |
| Net Assets | | $2,128,052,268 |
| Investor Class: | | |
| Net Asset Value, offering price and redemption price per share ($889,892,084 ÷ 44,239,968 shares) | | $20.12 |
| Institutional Premium Class: | | |
| Net Asset Value, offering price and redemption price per share ($1,238,160,184 ÷ 61,554,457 shares) | | $20.11 |
See accompanying notes which are an integral part of the financial statements.
Statement of Operations
| | | Six months ended September 30, 2018 (Unaudited) |
| Investment Income | | |
| Dividends: | | |
| Affiliated issuers | | $6,434,685 |
| Expenses | | |
| Transfer agent fees | $1,179,700 | |
| Independent trustees' fees and expenses | 4,579 | |
| Total expenses before reductions | 1,184,279 | |
| Expense reductions | (429,175) | |
| Total expenses after reductions | | 755,104 |
| Net investment income (loss) | | 5,679,581 |
| Realized and Unrealized Gain (Loss) | | |
| Net realized gain (loss) on: | | |
| Investment securities: | | |
| Affiliated issuers | (1,638,270) | |
| Capital gain distributions from underlying funds: | | |
| Affiliated issuers | 235,462 | |
| Total net realized gain (loss) | | (1,402,808) |
| Change in net unrealized appreciation (depreciation) on: | | |
| Investment securities: | | |
| Affiliated issuers | 110,652,709 | |
| Total change in net unrealized appreciation (depreciation) | | 110,652,709 |
| Net gain (loss) | | 109,249,901 |
| Net increase (decrease) in net assets resulting from operations | | $114,929,482 |
See accompanying notes which are an integral part of the financial statements.
Statement of Changes in Net Assets
| | Six months ended September 30, 2018 (Unaudited) | Year ended March 31, 2018 |
| Increase (Decrease) in Net Assets | | |
| Operations | | |
| Net investment income (loss) | $5,679,581 | $29,220,103 |
| Net realized gain (loss) | (1,402,808) | 5,119,528 |
| Change in net unrealized appreciation (depreciation) | 110,652,709 | 140,888,470 |
| Net increase (decrease) in net assets resulting from operations | 114,929,482 | 175,228,101 |
| Distributions to shareholders from net investment income | (887,970) | (28,745,530) |
| Distributions to shareholders from net realized gain | (2,321,399) | (4,868,444) |
| Total distributions | (3,209,369) | (33,613,974) |
| Share transactions - net increase (decrease) | 212,694,450 | 425,700,354 |
| Total increase (decrease) in net assets | 324,414,563 | 567,314,481 |
| Net Assets | | |
| Beginning of period | 1,803,637,705 | 1,236,323,224 |
| End of period | $2,128,052,268 | $1,803,637,705 |
| Other Information | | |
| Undistributed net investment income end of period | $5,551,970 | $760,359 |
See accompanying notes which are an integral part of the financial statements.
Financial Highlights
Fidelity Freedom Index 2050 Fund Investor Class
| | Six months ended (Unaudited) September 30, | Years endedMarch 31, | | | | |
| | 2018 | 2018 | 2017 | 2016 | 2015 | 2014 |
| Selected Per–Share Data | | | | | | |
| Net asset value, beginning of period | $19.00 | $17.14 | $15.24 | $16.01 | $15.42 | $13.51 |
| Income from Investment Operations | | | | | | |
| Net investment income (loss)A | .05 | .35 | .33 | .28 | .32 | .26 |
| Net realized and unrealized gain (loss) | 1.10 | 1.90 | 1.91 | (.74) | .78 | 1.66 |
| Total from investment operations | 1.15 | 2.25 | 2.24 | (.46) | 1.10 | 1.92 |
| Distributions from net investment income | (.01) | (.33) | (.33) | (.30) | (.50) | (.01) |
| Distributions from net realized gain | (.02) | (.06) | (.01) | –B | (.01) | –B |
| Total distributions | (.03) | (.39) | (.34) | (.31)C | (.51) | (.01) |
| Net asset value, end of period | $20.12 | $19.00 | $17.14 | $15.24 | $16.01 | $15.42 |
| Total ReturnD,E | 6.07% | 13.15% | 14.82% | (2.92)% | 7.25% | 14.21% |
| Ratios to Average Net AssetsF,G | | | | | | |
| Expenses before reductions | .15%H | .15% | .15% | .15% | .15% | .15% |
| Expenses net of fee waivers, if any | .11%H | .12% | .10% | .08% | .08% | .08% |
| Expenses net of all reductions | .11%H | .12% | .10% | .08% | .08% | .08% |
| Net investment income (loss) | .55%H | 1.89% | 2.06% | 1.80% | 2.02% | 1.79% |
| Supplemental Data | | | | | | |
| Net assets, end of period (000 omitted) | $889,892 | $739,919 | $513,543 | $486,444 | $729,639 | $521,672 |
| Portfolio turnover rateG | 14%H | 6% | 19% | 7% | 10% | 24% |
A Calculated based on average shares outstanding during the period.
B Amount represents less than $.005 per share.
C Total distributions of $.31 per share is comprised of distributions from net investment income of $.302 and distributions from net realized gain of $.003 per share.
D Total returns for periods of less than one year are not annualized.
E Total returns would have been lower if certain expenses had not been reduced during the applicable periods shown.
F Expense ratios reflect operating expenses of the class. Expenses before reductions do not reflect amounts reimbursed by the investment adviser or reductions from expense offset arrangements and do not represent the amount paid by the class during periods when reimbursements or reductions occur. Expenses net of fee waivers reflect expenses after reimbursement by the investment adviser but prior to reductions from expense offset arrangements. Expenses net of all reductions represent the net expenses paid by the class.
G Amount does not include the portfolio activity of any Underlying Funds.
H Annualized
See accompanying notes which are an integral part of the financial statements.
Fidelity Freedom Index 2050 Fund Institutional Premium Class
| | Six months ended (Unaudited) September 30, | Years endedMarch 31, | | |
| | 2018 | 2018 | 2017 | 2016 A |
| Selected Per–Share Data | | | | |
| Net asset value, beginning of period | $19.00 | $17.14 | $15.24 | $16.37 |
| Income from Investment Operations | | | | |
| Net investment income (loss)B | .06 | .36 | .34 | .38 |
| Net realized and unrealized gain (loss) | 1.08 | 1.90 | 1.91 | (1.20) |
| Total from investment operations | 1.14 | 2.26 | 2.25 | (.82) |
| Distributions from net investment income | (.01) | (.34) | (.34) | (.30) |
| Distributions from net realized gain | (.02) | (.06) | (.01) | –C |
| Total distributions | (.03) | (.40) | (.35) | (.31)D |
| Net asset value, end of period | $20.11 | $19.00 | $17.14 | $15.24 |
| Total ReturnE,F | 6.03% | 13.20% | 14.88% | (5.04)% |
| Ratios to Average Net AssetsG,H | | | | |
| Expenses before reductions | .10%I | .10% | .09% | .05%I |
| Expenses net of fee waivers, if any | .05%I | .07% | .05% | .01%I |
| Expenses net of all reductions | .05%I | .07% | .05% | .01%I |
| Net investment income (loss) | .60%I | 1.94% | 2.11% | 3.40%I |
| Supplemental Data | | | | |
| Net assets, end of period (000 omitted) | $1,238,160 | $1,063,718 | $722,781 | $434,989 |
| Portfolio turnover rateH | 14%I | 6% | 19% | 7% |
A For the period June 24, 2015 (commencement of sale of shares) to March 31, 2016.
B Calculated based on average shares outstanding during the period.
C Amount represents less than $.005 per share.
D Total distributions of $.31 per share is comprised of distributions from net investment income of $.304 and distributions from net realized gain of $.003 per share.
E Total returns for periods of less than one year are not annualized.
F Total returns would have been lower if certain expenses had not been reduced during the applicable periods shown.
G Expense ratios reflect operating expenses of the class. Expenses before reductions do not reflect amounts reimbursed by the investment adviser or reductions from expense offset arrangements and do not represent the amount paid by the class during periods when reimbursements or reductions occur. Expense ratios before reductions for start-up periods may not be representative of longer-term operating periods. Expenses net of fee waivers reflect expenses after reimbursement by the investment adviser but prior to reductions from expense offset arrangements. Expenses net of all reductions represent the net expenses paid by the class.
H Amount does not include the portfolio activity of any Underlying Funds.
I Annualized
See accompanying notes which are an integral part of the financial statements.
Fidelity Freedom® Index 2055 Fund
Investment Summary (Unaudited)
The information in the following tables is based on the direct investments of the Fund.
Top Holdings as of September 30, 2018
| | % of fund's net assets |
| Fidelity Total Market Index Fund Class F | 63.0 |
| Fidelity Series Global ex U.S. Index Fund | 27.1 |
| Fidelity U.S. Bond Index Fund Class F | 7.0 |
| Fidelity Series Long-Term Treasury Bond Index Fund | 2.9 |
| | 100.0 |
Asset Allocation (% of fund's net assets)
| Period end |
| | Domestic Equity Funds | 63.0% |
| | International Equity Funds | 27.1% |
| | Bond Funds | 9.9% |

Fidelity Freedom® Index 2055 Fund
Schedule of Investments September 30, 2018 (Unaudited)
Showing Percentage of Net Assets
| Domestic Equity Funds - 63.0% | | | |
| | | Shares | Value |
| Fidelity Total Market Index Fund Class F (a) | | | |
| (Cost $406,104,449) | | 6,267,271 | 527,390,836 |
|
| International Equity Funds - 27.1% | | | |
| Fidelity Series Global ex U.S. Index Fund (a) | | | |
| (Cost $209,716,538) | | 17,615,305 | 226,356,669 |
|
| Bond Funds - 9.9% | | | |
| Fidelity Series Long-Term Treasury Bond Index Fund (a) | | 2,947,099 | 24,284,098 |
| Fidelity U.S. Bond Index Fund Class F (a) | | 5,223,586 | 58,347,458 |
| TOTAL BOND FUNDS | | | |
| (Cost $85,240,507) | | | 82,631,556 |
| TOTAL INVESTMENT IN SECURITIES - 100.0% | | | |
| (Cost $701,061,494) | | | 836,379,061 |
| NET OTHER ASSETS (LIABILITIES) - 0.0% | | | (51,653) |
| NET ASSETS - 100% | | | $836,327,408 |
Legend
(a) Affiliated Fund
Affiliated Underlying Funds
Fiscal year to date information regarding the Fund's investments in affiliated Underlying Funds, excluding any Money Market Central Funds, is presented below. Exchanges between classes of the same affiliated Underlying Funds may occur.
| Affiliate | Value, beginning of period | Purchases | Sales Proceeds | Dividend Income | Realized Gain (loss) | Change in Unrealized appreciation (depreciation) | Value, end of period |
| Fidelity Commodity Strategy Fund Class F | $8,795,629 | $1,150,517 | $9,727,525 | $-- | $145,158 | $(363,779) | $-- |
| Fidelity Series Global ex U.S. Index Fund | 174,792,866 | 57,224,410 | 1,041,570 | -- | (77,622) | (4,541,415) | 226,356,669 |
| Fidelity Series Long-Term Treasury Bond Index Fund | -- | 24,979,198 | 11,253 | 113,362 | (137) | (683,710) | 24,284,098 |
| Fidelity Total Market Index Fund Class F | 399,908,097 | 90,321,105 | 10,813,701 | 1,454,732 | (117,780) | 48,093,115 | 527,390,836 |
| Fidelity U.S. Bond Index Fund Class F | 64,628,593 | 13,956,258 | 19,305,170 | 898,493 | (425,773) | (506,450) | 58,347,458 |
| Total | $648,125,185 | $187,631,488 | $40,899,219 | $2,466,587 | $(476,154) | $41,997,761 | $836,379,061 |
Amounts in the income column in the above table include any capital gain distributions from underlying funds, which are presented in the corresponding line-item in the Statement of Operations if applicable.
Investment Valuation
All investments are categorized as Level 1 under the Fair Value Hierarchy. The inputs or methodology used for valuing securities may not be an indication of the risk associated with investing in those securities. For more information on valuation inputs please refer to the Investment Valuation section in the accompanying Notes to Financial Statements.
See accompanying notes which are an integral part of the financial statements.
Fidelity Freedom® Index 2055 Fund
Financial Statements
Statement of Assets and Liabilities
| | | September 30, 2018 (Unaudited) |
| Assets | | |
Investment in securities, at value — See accompanying schedule:
| | |
| Affiliated issuers (cost $701,061,494) | $836,379,061 | |
| Total Investment in Securities (cost $701,061,494) | | $836,379,061 |
| Receivable for fund shares sold | | 3,485,845 |
| Receivable from investment adviser for expense reductions | | 32,295 |
| Total assets | | 839,897,201 |
| Liabilities | | |
| Payable for investments purchased | $2,985,262 | |
| Payable for fund shares redeemed | 500,187 | |
| Transfer agent fees payable | 84,344 | |
| Total liabilities | | 3,569,793 |
| Net Assets | | $836,327,408 |
| Net Assets consist of: | | |
| Paid in capital | | $701,164,101 |
| Undistributed net investment income | | 2,024,518 |
| Accumulated undistributed net realized gain (loss) on investments | | (2,178,778) |
| Net unrealized appreciation (depreciation) on investments | | 135,317,567 |
| Net Assets | | $836,327,408 |
| Investor Class: | | |
| Net Asset Value, offering price and redemption price per share ($387,986,892 ÷ 24,430,787 shares) | | $15.88 |
| Institutional Premium Class: | | |
| Net Asset Value, offering price and redemption price per share ($448,340,516 ÷ 28,207,956 shares) | | $15.89 |
See accompanying notes which are an integral part of the financial statements.
Statement of Operations
| | | Six months ended September 30, 2018 (Unaudited) |
| Investment Income | | |
| Dividends: | | |
| Affiliated issuers | | $2,381,231 |
| Expenses | | |
| Transfer agent fees | $457,889 | |
| Independent trustees' fees and expenses | 1,706 | |
| Total expenses before reductions | 459,595 | |
| Expense reductions | (162,655) | |
| Total expenses after reductions | | 296,940 |
| Net investment income (loss) | | 2,084,291 |
| Realized and Unrealized Gain (Loss) | | |
| Net realized gain (loss) on: | | |
| Investment securities: | | |
| Affiliated issuers | (476,154) | |
| Capital gain distributions from underlying funds: | | |
| Affiliated issuers | 85,356 | |
| Total net realized gain (loss) | | (390,798) |
| Change in net unrealized appreciation (depreciation) on: | | |
| Investment securities: | | |
| Affiliated issuers | 41,997,761 | |
| Total change in net unrealized appreciation (depreciation) | | 41,997,761 |
| Net gain (loss) | | 41,606,963 |
| Net increase (decrease) in net assets resulting from operations | | $43,691,254 |
See accompanying notes which are an integral part of the financial statements.
Statement of Changes in Net Assets
| | Six months ended September 30, 2018 (Unaudited) | Year ended March 31, 2018 |
| Increase (Decrease) in Net Assets | | |
| Operations | | |
| Net investment income (loss) | $2,084,291 | $10,044,680 |
| Net realized gain (loss) | (390,798) | 2,291,231 |
| Change in net unrealized appreciation (depreciation) | 41,997,761 | 46,016,533 |
| Net increase (decrease) in net assets resulting from operations | 43,691,254 | 58,352,444 |
| Distributions to shareholders from net investment income | (278,140) | (9,831,029) |
| Distributions to shareholders from net realized gain | (1,508,089) | (1,192,955) |
| Total distributions | (1,786,229) | (11,023,984) |
| Share transactions - net increase (decrease) | 146,346,117 | 208,298,327 |
| Total increase (decrease) in net assets | 188,251,142 | 255,626,787 |
| Net Assets | | |
| Beginning of period | 648,076,266 | 392,449,479 |
| End of period | $836,327,408 | $648,076,266 |
| Other Information | | |
| Undistributed net investment income end of period | $2,024,518 | $218,367 |
See accompanying notes which are an integral part of the financial statements.
Financial Highlights
Fidelity Freedom Index 2055 Fund Investor Class
| | Six months ended (Unaudited) September 30, | Years endedMarch 31, | | | | |
| | 2018 | 2018 | 2017 | 2016 | 2015 | 2014 |
| Selected Per–Share Data | | | | | | |
| Net asset value, beginning of period | $15.01 | $13.53 | $12.06 | $12.71 | $12.07 | $10.67 |
| Income from Investment Operations | | | | | | |
| Net investment income (loss)A | .04 | .28 | .28 | .25 | .26 | .21 |
| Net realized and unrealized gain (loss) | .87 | 1.49 | 1.50 | (.63) | .62 | 1.36 |
| Total from investment operations | .91 | 1.77 | 1.78 | (.38) | .88 | 1.57 |
| Distributions from net investment income | (.01) | (.26) | (.29) | (.24)B | (.24) | (.17) |
| Distributions from net realized gain | (.03) | (.04) | (.02) | (.01)B | – | –C |
| Tax return of capital | – | – | – | (.02) | – | – |
| Total distributions | (.04) | (.29)D | (.31) | (.27) | (.24) | (.17) |
| Net asset value, end of period | $15.88 | $15.01 | $13.53 | $12.06 | $12.71 | $12.07 |
| Total ReturnE,F | 6.06% | 13.09% | 14.90% | (2.96)% | 7.27% | 14.76% |
| Ratios to Average Net AssetsG,H | | | | | | |
| Expenses before reductions | .15%I | .15% | .15% | .15% | .15% | .15% |
| Expenses net of fee waivers, if any | .11%I | .12% | .10% | .08% | .08% | .08% |
| Expenses net of all reductions | .11%I | .12% | .10% | .08% | .08% | .08% |
| Net investment income (loss) | .53%I | 1.90% | 2.18% | 2.03% | 2.10% | 1.82% |
| Supplemental Data | | | | | | |
| Net assets, end of period (000 omitted) | $387,987 | $305,192 | $181,697 | $150,332 | $183,117 | $88,084 |
| Portfolio turnover rateH | 11%I | 6% | 33% | 7% | 8% | 21% |
A Calculated based on average shares outstanding during the period.
B The amounts shown reflect certain reclassifications related to book to tax differences that were made in the year shown.
C Amount represents less than $.005 per share.
D Total distributions of $.29 per share is comprised of distributions from net investment income of $.255 and distributions from net realized gain of $.036 per share.
E Total returns for periods of less than one year are not annualized.
F Total returns would have been lower if certain expenses had not been reduced during the applicable periods shown.
G Expense ratios reflect operating expenses of the class. Expenses before reductions do not reflect amounts reimbursed by the investment adviser or reductions from expense offset arrangements and do not represent the amount paid by the class during periods when reimbursements or reductions occur. Expenses net of fee waivers reflect expenses after reimbursement by the investment adviser but prior to reductions from expense offset arrangements. Expenses net of all reductions represent the net expenses paid by the class.
H Amount does not include the portfolio activity of any Underlying Funds.
I Annualized
See accompanying notes which are an integral part of the financial statements.
Fidelity Freedom Index 2055 Fund Institutional Premium Class
| | Six months ended (Unaudited) September 30, | Years endedMarch 31, | | |
| | 2018 | 2018 | 2017 | 2016 A |
| Selected Per–Share Data | | | | |
| Net asset value, beginning of period | $15.02 | $13.54 | $12.06 | $13.00 |
| Income from Investment Operations | | | | |
| Net investment income (loss)B | .05 | .29 | .28 | .23 |
| Net realized and unrealized gain (loss) | .86 | 1.49 | 1.51 | (.89) |
| Total from investment operations | .91 | 1.78 | 1.79 | (.66) |
| Distributions from net investment income | (.01) | (.26) | (.29) | (.25)C |
| Distributions from net realized gain | (.03) | (.04) | (.02) | (.01)C |
| Tax return of capital | – | – | – | (.02) |
| Total distributions | (.04) | (.30) | (.31) | (.28) |
| Net asset value, end of period | $15.89 | $15.02 | $13.54 | $12.06 |
| Total ReturnD,E | 6.07% | 13.13% | 14.98% | (5.11)% |
| Ratios to Average Net AssetsF,G | | | | |
| Expenses before reductions | .10%H | .10% | .09% | .05%H |
| Expenses net of fee waivers, if any | .05%H | .07% | .05% | .01%H |
| Expenses net of all reductions | .05%H | .07% | .05% | .01%H |
| Net investment income (loss) | .59%H | 1.95% | 2.23% | 2.63%H |
| Supplemental Data | | | | |
| Net assets, end of period (000 omitted) | $448,341 | $342,884 | $210,752 | $135,214 |
| Portfolio turnover rateG | 11%H | 6% | 33% | 7% |
A For the period June 24, 2015 (commencement of sale of shares) to March 31, 2016.
B Calculated based on average shares outstanding during the period.
C The amounts shown reflect certain reclassifications related to book to tax differences that were made in the year shown.
D Total returns for periods of less than one year are not annualized.
E Total returns would have been lower if certain expenses had not been reduced during the applicable periods shown.
F Expense ratios reflect operating expenses of the class. Expenses before reductions do not reflect amounts reimbursed by the investment adviser or reductions from expense offset arrangements and do not represent the amount paid by the class during periods when reimbursements or reductions occur. Expense ratios before reductions for start-up periods may not be representative of longer-term operating periods. Expenses net of fee waivers reflect expenses after reimbursement by the investment adviser but prior to reductions from expense offset arrangements. Expenses net of all reductions represent the net expenses paid by the class.
G Amount does not include the portfolio activity of any Underlying Funds.
H Annualized
See accompanying notes which are an integral part of the financial statements.
Fidelity Freedom® Index 2060 Fund
Investment Summary (Unaudited)
The information in the following tables is based on the direct investments of the Fund.
Top Holdings as of September 30, 2018
| | % of fund's net assets |
| Fidelity Total Market Index Fund Class F | 63.0 |
| Fidelity Series Global ex U.S. Index Fund | 27.1 |
| Fidelity U.S. Bond Index Fund Class F | 7.0 |
| Fidelity Series Long-Term Treasury Bond Index Fund | 2.9 |
| | 100.0 |
Asset Allocation (% of fund's net assets)
| Period end |
| | Domestic Equity Funds | 63.0% |
| | International Equity Funds | 27.1% |
| | Bond Funds | 9.9% |

Fidelity Freedom® Index 2060 Fund
Schedule of Investments September 30, 2018 (Unaudited)
Showing Percentage of Net Assets
| Domestic Equity Funds - 63.0% | | | |
| | | Shares | Value |
| Fidelity Total Market Index Fund Class F (a) | | | |
| (Cost $120,540,915) | | 1,693,853 | 142,537,768 |
|
| International Equity Funds - 27.1% | | | |
| Fidelity Series Global ex U.S. Index Fund (a) | | | |
| (Cost $58,128,764) | | 4,760,847 | 61,176,882 |
|
| Bond Funds - 9.9% | | | |
| Fidelity Series Long-Term Treasury Bond Index Fund (a) | | 796,621 | 6,564,159 |
| Fidelity U.S. Bond Index Fund Class F (a) | | 1,411,655 | 15,768,191 |
| TOTAL BOND FUNDS | | | |
| (Cost $22,991,566) | | | 22,332,350 |
| TOTAL INVESTMENT IN SECURITIES - 100.0% | | | |
| (Cost $201,661,245) | | | 226,047,000 |
| NET OTHER ASSETS (LIABILITIES) - 0.0% | | | (14,205) |
| NET ASSETS - 100% | | | $226,032,795 |
Legend
(a) Affiliated Fund
Affiliated Underlying Funds
Fiscal year to date information regarding the Fund's investments in affiliated Underlying Funds, excluding any Money Market Central Funds, is presented below. Exchanges between classes of the same affiliated Underlying Funds may occur.
| Affiliate | Value, beginning of period | Purchases | Sales Proceeds | Dividend Income | Realized Gain (loss) | Change in Unrealized appreciation (depreciation) | Value, end of period |
| Fidelity Commodity Strategy Fund Class F | $2,116,181 | $477,917 | $2,536,314 | $-- | $18,526 | $(76,310) | $-- |
| Fidelity Series Global ex U.S. Index Fund | 42,014,997 | 21,231,525 | 967,600 | -- | (31,383) | (1,070,657) | 61,176,882 |
| Fidelity Series Long-Term Treasury Bond Index Fund | -- | 6,759,670 | 13,512 | 29,693 | (223) | (181,776) | 6,564,159 |
| Fidelity Total Market Index Fund Class F | 96,127,986 | 38,182,711 | 3,880,651 | 350,482 | (48,739) | 12,156,461 | 142,537,768 |
| Fidelity U.S. Bond Index Fund Class F | 15,533,738 | 5,701,458 | 5,231,872 | 226,493 | (83,662) | (151,471) | 15,768,191 |
| Total | $155,792,902 | $72,353,281 | $12,629,949 | $606,668 | $(145,481) | $10,676,247 | $226,047,000 |
Amounts in the income column in the above table include any capital gain distributions from underlying funds, which are presented in the corresponding line-item in the Statement of Operations if applicable.
Investment Valuation
All investments are categorized as Level 1 under the Fair Value Hierarchy. The inputs or methodology used for valuing securities may not be an indication of the risk associated with investing in those securities. For more information on valuation inputs please refer to the Investment Valuation section in the accompanying Notes to Financial Statements.
See accompanying notes which are an integral part of the financial statements.
Fidelity Freedom® Index 2060 Fund
Financial Statements
Statement of Assets and Liabilities
| | | September 30, 2018 (Unaudited) |
| Assets | | |
Investment in securities, at value — See accompanying schedule:
| | |
| Affiliated issuers (cost $201,661,245) | $226,047,000 | |
| Total Investment in Securities (cost $201,661,245) | | $226,047,000 |
| Cash | | 1 |
| Receivable for fund shares sold | | 1,429,702 |
| Receivable from investment adviser for expense reductions | | 8,515 |
| Total assets | | 227,485,218 |
| Liabilities | | |
| Payable for investments purchased | $1,216,392 | |
| Payable for fund shares redeemed | 213,174 | |
| Transfer agent fees payable | 22,857 | |
| Total liabilities | | 1,452,423 |
| Net Assets | | $226,032,795 |
| Net Assets consist of: | | |
| Paid in capital | | $201,689,002 |
| Undistributed net investment income | | 484,982 |
| Accumulated undistributed net realized gain (loss) on investments | | (526,944) |
| Net unrealized appreciation (depreciation) on investments | | 24,385,755 |
| Net Assets | | $226,032,795 |
| Investor Class: | | |
| Net Asset Value, offering price and redemption price per share ($114,592,904 ÷ 8,860,311 shares) | | $12.93 |
| Institutional Premium Class: | | |
| Net Asset Value, offering price and redemption price per share ($111,439,891 ÷ 8,611,923 shares) | | $12.94 |
See accompanying notes which are an integral part of the financial statements.
Statement of Operations
| | | Six months ended September 30, 2018 (Unaudited) |
| Investment Income | | |
| Dividends: | | |
| Affiliated issuers | | $586,104 |
| Expenses | | |
| Transfer agent fees | $118,048 | |
| Independent trustees' fees and expenses | 420 | |
| Total expenses before reductions | 118,468 | |
| Expense reductions | (41,030) | |
| Total expenses after reductions | | 77,438 |
| Net investment income (loss) | | 508,666 |
| Realized and Unrealized Gain (Loss) | | |
| Net realized gain (loss) on: | | |
| Investment securities: | | |
| Affiliated issuers | (145,481) | |
| Capital gain distributions from underlying funds: | | |
| Affiliated issuers | 20,564 | |
| Total net realized gain (loss) | | (124,917) |
| Change in net unrealized appreciation (depreciation) on: | | |
| Investment securities: | | |
| Affiliated issuers | 10,676,247 | |
| Total change in net unrealized appreciation (depreciation) | | 10,676,247 |
| Net gain (loss) | | 10,551,330 |
| Net increase (decrease) in net assets resulting from operations | | $11,059,996 |
See accompanying notes which are an integral part of the financial statements.
Statement of Changes in Net Assets
| | Six months ended September 30, 2018 (Unaudited) | Year ended March 31, 2018 |
| Increase (Decrease) in Net Assets | | |
| Operations | | |
| Net investment income (loss) | $508,666 | $2,139,283 |
| Net realized gain (loss) | (124,917) | 506,757 |
| Change in net unrealized appreciation (depreciation) | 10,676,247 | 8,422,450 |
| Net increase (decrease) in net assets resulting from operations | 11,059,996 | 11,068,490 |
| Distributions to shareholders from net investment income | (74,586) | (2,099,984) |
| Distributions to shareholders from net realized gain | (394,022) | (422,478) |
| Total distributions | (468,608) | (2,522,462) |
| Share transactions - net increase (decrease) | 59,660,434 | 80,743,596 |
| Total increase (decrease) in net assets | 70,251,822 | 89,289,624 |
| Net Assets | | |
| Beginning of period | 155,780,973 | 66,491,349 |
| End of period | $226,032,795 | $155,780,973 |
| Other Information | | |
| Undistributed net investment income end of period | $484,982 | $50,902 |
See accompanying notes which are an integral part of the financial statements.
Financial Highlights
Fidelity Freedom Index 2060 Fund Investor Class
| | Six months ended (Unaudited) September 30, | Years endedMarch 31, | | | |
| | 2018 | 2018 | 2017 | 2016 | 2015 A |
| Selected Per–Share Data | | | | | |
| Net asset value, beginning of period | $12.23 | $11.04 | $9.85 | $10.33 | $10.00 |
| Income from Investment Operations | | | | | |
| Net investment income (loss)B | .03 | .24 | .25 | .25 | .09 |
| Net realized and unrealized gain (loss) | .70 | 1.21 | 1.19 | (.55) | .40 |
| Total from investment operations | .73 | 1.45 | 1.44 | (.30) | .49 |
| Distributions from net investment income | (.01) | (.20) | (.22) | (.18) | (.16) |
| Distributions from net realized gain | (.03) | (.06) | (.03) | –C | –C |
| Total distributions | (.03)D | (.26) | (.25) | (.18) | (.16) |
| Net asset value, end of period | $12.93 | $12.23 | $11.04 | $9.85 | $10.33 |
| Total ReturnE,F | 6.01% | 13.17% | 14.80% | (2.94)% | 4.90% |
| Ratios to Average Net AssetsG,H | | | | | |
| Expenses before reductions | .15%I | .15% | .15% | .15% | .15%I |
| Expenses net of fee waivers, if any | .11%I | .12% | .11% | .08% | .09%I |
| Expenses net of all reductions | .11%I | .12% | .11% | .08% | .09%I |
| Net investment income (loss) | .51%I | 1.97% | 2.41% | 2.57% | 1.35%I |
| Supplemental Data | | | | | |
| Net assets, end of period (000 omitted) | $114,593 | $82,123 | $38,013 | $16,979 | $3,660 |
| Portfolio turnover rateH | 13%I | 7% | 41% | 8% | 33%I |
A For the period August 5, 2014 (commencement of operations) to March 31, 2015.
B Calculated based on average shares outstanding during the period.
C Amount represents less than $.005 per share.
D Total distributions of $.03 per share is comprised of distributions from net investment income of $.005 and distributions from net realized gain of $.029 per share.
E Total returns for periods of less than one year are not annualized.
F Total returns would have been lower if certain expenses had not been reduced during the applicable periods shown.
G Expense ratios reflect operating expenses of the class. Expenses before reductions do not reflect amounts reimbursed by the investment adviser or reductions from expense offset arrangements and do not represent the amount paid by the class during periods when reimbursements or reductions occur. Expense ratios before reductions for start-up periods may not be representative of longer-term operating periods. Expenses net of fee waivers reflect expenses after reimbursement by the investment adviser but prior to reductions from expense offset arrangements. Expenses net of all reductions represent the net expenses paid by the class.
H Amount does not include the portfolio activity of any Underlying Funds.
I Annualized
See accompanying notes which are an integral part of the financial statements.
Fidelity Freedom Index 2060 Fund Institutional Premium Class
| | Six months ended (Unaudited) September 30, | Years endedMarch 31, | | |
| | 2018 | 2018 | 2017 | 2016 A |
| Selected Per–Share Data | | | | |
| Net asset value, beginning of period | $12.23 | $11.05 | $9.85 | $10.56 |
| Income from Investment Operations | | | | |
| Net investment income (loss)B | .04 | .24 | .26 | .13 |
| Net realized and unrealized gain (loss) | .71 | 1.21 | 1.19 | (.66) |
| Total from investment operations | .75 | 1.45 | 1.45 | (.53) |
| Distributions from net investment income | (.01) | (.21) | (.22) | (.18) |
| Distributions from net realized gain | (.03) | (.06) | (.03) | –C |
| Total distributions | (.04) | (.27) | (.25) | (.18) |
| Net asset value, end of period | $12.94 | $12.23 | $11.05 | $9.85 |
| Total ReturnD,E | 6.10% | 13.12% | 14.93% | (5.05)% |
| Ratios to Average Net AssetsF,G | | | | |
| Expenses before reductions | .10%H | .10% | .09% | .05%H |
| Expenses net of fee waivers, if any | .05%H | .07% | .06% | .01%H |
| Expenses net of all reductions | .05%H | .07% | .06% | .01%H |
| Net investment income (loss) | .57%H | 2.02% | 2.47% | 1.80%H |
| Supplemental Data | | | | |
| Net assets, end of period (000 omitted) | $111,440 | $73,658 | $28,478 | $9,543 |
| Portfolio turnover rateG | 13%H | 7% | 41% | 8% |
A For the period June 24, 2015 (commencement of sale of shares) to March 31, 2016.
B Calculated based on average shares outstanding during the period.
C Amount represents less than $.005 per share.
D Total returns for periods of less than one year are not annualized.
E Total returns would have been lower if certain expenses had not been reduced during the applicable periods shown.
F Expense ratios reflect operating expenses of the class. Expenses before reductions do not reflect amounts reimbursed by the investment adviser or reductions from expense offset arrangements and do not represent the amount paid by the class during periods when reimbursements or reductions occur. Expense ratios before reductions for start-up periods may not be representative of longer-term operating periods. Expenses net of fee waivers reflect expenses after reimbursement by the investment adviser but prior to reductions from expense offset arrangements. Expenses net of all reductions represent the net expenses paid by the class.
G Amount does not include the portfolio activity of any Underlying Funds.
H Annualized
See accompanying notes which are an integral part of the financial statements.
Notes to Financial Statements (Unaudited)
For the period ended September 30, 2018
1. Organization.
Fidelity Freedom Index Income Fund, Fidelity Freedom Index 2005 Fund, Fidelity Freedom Index 2010 Fund, Fidelity Freedom Index 2015 Fund, Fidelity Freedom Index 2020 Fund, Fidelity Freedom Index 2025 Fund, Fidelity Freedom Index 2030 Fund, Fidelity Freedom Index 2035 Fund, Fidelity Freedom Index 2040 Fund, Fidelity Freedom Index 2045 Fund, Fidelity Freedom Index 2050 Fund, Fidelity Freedom Index 2055 Fund and Fidelity Freedom Index 2060 Fund (the Funds) are funds of Fidelity Aberdeen Street Trust (the Trust). The Trust is registered under the Investment Company Act of 1940, as amended (the 1940 Act), as an open-end management investment company organized as a Delaware statutory trust. Each Fund is authorized to issue an unlimited number of shares. The Funds invest primarily in a combination of other Fidelity equity, bond, and short-term funds (the Underlying Funds) managed by Fidelity Management & Research Company (FMR). Each Fund offers Investor Class and Institutional Premium Class shares, each of which has equal rights as to assets and voting privileges. Each class has exclusive voting rights with respect to matters that affect that class.
2. Investments in Fidelity Central Funds.
The Funds may invest in Fidelity Central Funds, which are open-end investment companies generally available only to other investment companies and accounts managed by the investment adviser and its affiliates. The Funds' Schedules of Investments list each of the Fidelity Central Funds held as of period end, if any, as an investment of each Fund, but do not include the underlying holdings of each Fidelity Central Fund. As an Investing Fund, each Fund indirectly bears its proportionate share of the expenses of the underlying Fidelity Central Funds.
The Money Market Central Funds seek preservation of capital and current income and are managed by Fidelity Investments Money Management, Inc. (FIMM), an affiliate of the investment adviser. Annualized expenses of the Money Market Central Funds as of their most recent shareholder report date are less than .005%.
A complete unaudited list of holdings for each Fidelity Central Fund is available upon request or at the Securities and Exchange Commission (the SEC) website at www.sec.gov. In addition, the financial statements of the Fidelity Central Funds are available on the SEC website or upon request.
3. Significant Accounting Policies.
Each Fund is an investment company and applies the accounting and reporting guidance of the Financial Accounting Standards Board (FASB) Accounting Standards Codification Topic 946 Financial Services – Investments Companies. The financial statements have been prepared in conformity with accounting principles generally accepted in the United States of America (GAAP), which require management to make certain estimates and assumptions at the date of the financial statements. Actual results could differ from those estimates. Subsequent events, if any, through the date that the financial statements were issued have been evaluated in the preparation of the financial statements. The following summarizes the significant accounting policies of the Funds:
Investment Valuation. Investments are valued as of 4:00 p.m. Eastern time on the last calendar day of the period. Each Fund categorizes the inputs to valuation techniques used to value its investments into a disclosure hierarchy consisting of three levels as shown below:
- Level 1 – quoted prices in active markets for identical investments
- Level 2 – other significant observable inputs (including quoted prices for similar investments, interest rates, prepayment speeds, etc.)
- Level 3 – unobservable inputs (including the Fund's own assumptions based on the best information available)
Valuation techniques used to value each Fund's investments by major category are as follows. Investments in the Underlying Funds are valued at their closing net asset value (NAV) each business day and are categorized as Level 1 in the hierarchy.
Investment Transactions and Income. For financial reporting purposes, the Funds' investment holdings and NAV include trades executed through the end of the last business day of the period. The NAV per share for processing shareholder transactions is calculated as of the close of business of the New York Stock Exchange (NYSE), normally 4:00 p.m. Eastern time and includes trades executed through the end of the prior business day. Gains and losses on securities sold are determined on the basis of identified cost. Income and capital gain distributions from the Underlying Funds, if any, are recorded on the ex-dividend date.
Class Allocations and Expenses. Investment income, realized and unrealized capital gains and losses, common expenses of each Fund, and certain fund-level expense reductions, if any, are allocated daily on a pro-rata basis to each class based on the relative net assets of each class to the total net assets of each Fund. Each class differs with respect to transfer agent fees incurred. Certain expense reductions may also differ by class. For the reporting period, the allocated portion of income and expenses to each class as a percent of its average net assets may vary due to the timing of recording these transactions in relation to fluctuating net assets of the classes. Expenses directly attributable to a fund are charged to that fund. Expenses attributable to more than one fund are allocated among the respective funds on the basis of relative net assets or other appropriate methods. Expenses included in the accompanying financial statements reflect the expenses of each Fund and do not include any expenses associated with the Underlying Funds. Although not included in each Fund's expenses, each Fund indirectly bears its proportionate share of the Underlying Funds' expenses through the impact of these expenses on each Underlying Fund's NAV. Expense estimates are accrued in the period to which they relate and adjustments are made when actual amounts are known.
Income Tax Information and Distributions to Shareholders. Each year, each Fund intends to qualify as a regulated investment company under Subchapter M of the Internal Revenue Code, including distributing substantially all of its taxable income and realized gains. As a result, no provision for U.S. Federal income taxes is required. Each Fund files a U.S. federal tax return, in addition to state and local tax returns as required. Each Fund's federal income tax returns are subject to examination by the Internal Revenue Service (IRS) for a period of three fiscal years after they are filed. State and local tax returns may be subject to examination for an additional fiscal year depending on the jurisdiction.
Distributions are declared and recorded on the ex-dividend date. Income and capital gain distributions are declared separately for each class. Income and capital gain distributions are determined in accordance with income tax regulations, which may differ from GAAP.
Capital accounts within the financial statements are adjusted for permanent book-tax differences. These adjustments have no impact on net assets or the results of operations. Capital accounts are not adjusted for temporary book-tax differences which will reverse in a subsequent period.
Book-tax differences are primarily due to the short-term gain distributions from the Underlying Funds, capital loss carryforwards and losses deferred due to wash sales.
As of period end, the cost and unrealized appreciation (depreciation) in securities, and derivatives if applicable, for federal income tax purposes were as follows for each Fund:
| | Tax cost | Gross unrealized appreciation | Gross unrealized depreciation | Net unrealized appreciation (depreciation) |
| Fidelity Freedom Index Income Fund | $301,906,059 | $27,161,242 | $(6,005,431) | $21,155,811 |
| Fidelity Freedom Index 2005 Fund | 103,482,553 | 14,103,007 | (2,032,173) | 12,070,834 |
| Fidelity Freedom Index 2010 Fund | 472,443,575 | 97,666,468 | (8,671,137) | 88,995,331 |
| Fidelity Freedom Index 2015 Fund | 1,035,556,556 | 255,818,721 | (18,716,311) | 237,102,410 |
| Fidelity Freedom Index 2020 Fund | 3,453,805,195 | 837,918,996 | (59,792,161) | 778,126,835 |
| Fidelity Freedom Index 2025 Fund | 3,490,568,694 | 764,867,297 | (53,906,200) | 710,961,097 |
| Fidelity Freedom Index 2030 Fund | 4,092,114,608 | 1,111,524,135 | (50,375,158) | 1,061,148,977 |
| Fidelity Freedom Index 2035 Fund | 2,731,459,517 | 781,337,867 | (20,373,174) | 760,964,693 |
| Fidelity Freedom Index 2040 Fund | 2,828,189,745 | 896,562,501 | (16,852,695) | 879,709,806 |
| Fidelity Freedom Index 2045 Fund | 1,837,795,079 | 499,582,528 | (11,454,974) | 488,127,554 |
| Fidelity Freedom Index 2050 Fund | 1,680,851,218 | 457,920,781 | (10,592,589) | 447,328,192 |
| Fidelity Freedom Index 2055 Fund | 702,965,020 | 137,958,122 | (4,544,081) | 133,414,041 |
| Fidelity Freedom Index 2060 Fund | 202,149,116 | 25,328,169 | (1,430,285) | 23,897,884 |
Capital loss carryforwards are only available to offset future capital gains of the Funds to the extent provided by regulations and may be limited. Under the Regulated Investment Company Modernization Act of 2010 (the Act), the Funds are permitted to carry forward capital losses incurred in taxable years beginning after December 22, 2010 for an unlimited period and such capital losses are required to be used prior to any losses that expire. The capital loss carryforward information presented below, including any applicable limitation, is estimated as of prior fiscal period end and is subject to adjustment.
| | No expiration | | | |
| | Short-term | Long-term | Total no expiration | Total capital loss carryforward |
| Fidelity Freedom Index Income Fund | $– | $(95,156) | $(95,156) | $(95,156) |
| Fidelity Freedom Index 2005 Fund | – | (43,758) | (43,758) | (43,758) |
| Fidelity Freedom Index 2020 Fund | – | (4,155,176) | (4,155,176) | (4,155,176) |
| Fidelity Freedom Index 2025 Fund | – | (490,085) | (490,085) | (490,085) |
| Fidelity Freedom Index 2030 Fund | (1,063,743) | (302,029) | (1,365,772) | (1,365,772) |
4. Purchases and Redemptions of Underlying Fund Shares.
Purchases and redemptions of the Underlying Fund shares are noted in the table below.
| | Purchases ($) | Redemptions ($) |
| Fidelity Freedom Index Income Fund | 158,471,183 | 127,816,923 |
| Fidelity Freedom Index 2005 Fund | 45,162,834 | 44,274,774 |
| Fidelity Freedom Index 2010 Fund | 169,921,537 | 178,039,545 |
| Fidelity Freedom Index 2015 Fund | 350,602,282 | 307,313,155 |
| Fidelity Freedom Index 2020 Fund | 909,707,187 | 744,902,070 |
| Fidelity Freedom Index 2025 Fund | 929,785,907 | 482,483,365 |
| Fidelity Freedom Index 2030 Fund | 795,721,988 | 351,414,342 |
| Fidelity Freedom Index 2035 Fund | 598,742,305 | 191,480,874 |
| Fidelity Freedom Index 2040 Fund | 523,471,529 | 219,098,293 |
| Fidelity Freedom Index 2045 Fund | 397,278,184 | 125,586,538 |
| Fidelity Freedom Index 2050 Fund | 351,775,454 | 136,381,013 |
| Fidelity Freedom Index 2055 Fund | 187,631,488 | 40,899,219 |
| Fidelity Freedom Index 2060 Fund | 72,353,281 | 12,629,949 |
5. Fees and Other Transactions with Affiliates.
Management Fee. FMR Co., Inc. (the investment adviser), an affiliate of FMR, provides the Funds with investment management related services. The Funds do not pay any fees for these services.
Other Transactions. The investment adviser has entered into an administration agreement with FMR under which FMR provides management and administrative services (other than investment advisory services) necessary for the operation of each Fund. Pursuant to this agreement, FMR pays all expenses of each Fund, excluding transfer agent fees, compensation of the independent Trustees and certain other expenses such as interest expense. FMR also contracts with other Fidelity companies to perform the services necessary for the operation of each Fund.
Transfer Agent Fees. Fidelity Investments Institutional Operations Company, Inc., (FIIOC), an affiliate of the investment adviser, is the transfer, dividend disbursing and shareholder servicing agent for each class of the Funds. FIIOC receives an asset-based fee of .15% and .10% of class-level average net assets for each Investor Class and Institutional Premium Class, respectively. FIIOC pays for typesetting, printing and mailing of shareholder reports, except proxy statements. For the period, transfer agent fees for each applicable class were as follows:
| | Amount |
| Fidelity Freedom Index Income Fund | |
| Investor Class | $104,906 |
| Institutional Premium Class | 86,227 |
| | $191,133 |
| Fidelity Freedom Index 2005 Fund | |
| Investor Class | $45,223 |
| Institutional Premium Class | 26,850 |
| | $72,073 |
| Fidelity Freedom Index 2010 Fund | |
| Investor Class | $179,934 |
| Institutional Premium Class | 161,780 |
| | $341,714 |
| Fidelity Freedom Index 2015 Fund | |
| Investor Class | $490,901 |
| Institutional Premium Class | 298,081 |
| | $788,982 |
| Fidelity Freedom Index 2020 Fund | |
| Investor Class | $1,266,757 |
| Institutional Premium Class | 1,210,229 |
| | $2,476,986 |
| Fidelity Freedom Index 2025 Fund | |
| Investor Class | $1,408,411 |
| Institutional Premium Class | 1,040,172 |
| | $2,448,583 |
| Fidelity Freedom Index 2030 Fund | |
| Investor Class | $1,499,679 |
| Institutional Premium Class | 1,425,500 |
| | $2,925,179 |
| Fidelity Freedom Index 2035 Fund | |
| Investor Class | $1,141,628 |
| Institutional Premium Class | 850,879 |
| | $1,992,507 |
| Fidelity Freedom Index 2040 Fund | |
| Investor Class | $1,041,563 |
| Institutional Premium Class | 1,032,319 |
| | $2,073,882 |
| Fidelity Freedom Index 2045 Fund | |
| Investor Class | $715,911 |
| Institutional Premium Class | 590,318 |
| | $1,306,229 |
| Fidelity Freedom Index 2050 Fund | |
| Investor Class | $604,533 |
| Institutional Premium Class | 575,167 |
| | $1,179,700 |
| Fidelity Freedom Index 2055 Fund | |
| Investor Class | $256,432 |
| Institutional Premium Class | 201,457 |
| | $457,889 |
| Fidelity Freedom Index 2060 Fund | |
| Investor Class | $71,308 |
| Institutional Premium Class | 46,740 |
| | $118,048 |
6. Expense Reductions.
FMR contractually agreed to reimburse each class of each Fund to the extent annual operating expenses, including acquired fund fees and expenses, exceeded certain levels of class-level average net assets as noted in the table below. This reimbursement will remain in place through June 30, 2021. Some expenses, for example the compensation of the independent Trustees, and certain other expenses such as interest expense, are excluded from this reimbursement.
The following classes of each applicable Fund were in reimbursement during the period:
| | Expense Limitations(a) | Reimbursement |
| Fidelity Freedom Index Income Fund | | |
| Investor Class | .14% | $19,854 |
| Institutional Premium Class | .08% | 30,116 |
| Fidelity Freedom Index 2005 Fund | | |
| Investor Class | .14% | $9,113 |
| Institutional Premium Class | .08% | 9,917 |
| Fidelity Freedom Index 2010 Fund | | |
| Investor Class | .14% | $38,472 |
| Institutional Premium Class | .08% | 62,776 |
| Fidelity Freedom Index 2015 Fund | | |
| Investor Class | .14% | $112,004 |
| Institutional Premium Class | .08% | 121,922 |
| Fidelity Freedom Index 2020 Fund | | |
| Investor Class | .14% | $302,572 |
| Institutional Premium Class | .08% | 514,575 |
| Fidelity Freedom Index 2025 Fund | | |
| Investor Class | .14% | $351,601 |
| Institutional Premium Class | .08% | 460,464 |
| Fidelity Freedom Index 2030 Fund | | |
| Investor Class | .14% | $396,896 |
| Institutional Premium Class | .08% | 662,113 |
| Fidelity Freedom Index 2035 Fund | | |
| Investor Class | .14% | $302,998 |
| Institutional Premium Class | .08% | 396,765 |
| Fidelity Freedom Index 2040 Fund | | |
| Investor Class | .14% | $276,847 |
| Institutional Premium Class | .08% | 481,202 |
| Fidelity Freedom Index 2045 Fund | | |
| Investor Class | .14% | $190,324 |
| Institutional Premium Class | .08% | 275,738 |
| Fidelity Freedom Index 2050 Fund | | |
| Investor Class | .14% | $160,695 |
| Institutional Premium Class | .08% | 268,480 |
| Fidelity Freedom Index 2055 Fund | | |
| Investor Class | .14% | $68,221 |
| Institutional Premium Class | .08% | 94,433 |
| Fidelity Freedom Index 2060 Fund | | |
| Investor Class | .14% | $18,985 |
| Institutional Premium Class | .08% | 22,045 |
(a) Percentages represent expense limitations effective June 1, 2018. Prior to June 1, 2018, the expense limitations for each Fund were .15% and .10% for Investor Class and Institutional Premium Class, respectively.
In addition, through arrangements with each applicable Fund's custodian, credits realized as a result of certain uninvested cash balances were used to reduce the Fund's expenses. All of the applicable expense reductions are noted in the table below.
| | Custody expense reduction |
| Fidelity Freedom Index 2030 Fund | $60 |
| Fidelity Freedom Index 2055 Fund | $1 |
7. Distributions to Shareholders.
Distributions to shareholders of each class were as follows:
| | Six months ended
September 30, 2018 | Year ended
March 31, 2018 |
| Fidelity Freedom Index Income Fund | | |
| From net investment income | | |
| Investor Class | $1,140,411 | $2,060,275 |
| Institutional Premium Class | 1,444,408 | 2,513,304 |
| Total | $2,584,819 | $4,573,579 |
| From net realized gain | | |
| Investor Class | $– | $452,238 |
| Institutional Premium Class | – | 540,049 |
| Total | $– | $992,287 |
| Fidelity Freedom Index 2005 Fund | | |
| From net investment income | | |
| Investor Class | $183,584 | $858,233 |
| Institutional Premium Class | 169,094 | 799,727 |
| Total | $352,678 | $1,657,960 |
| From net realized gain | | |
| Investor Class | $– | $239,716 |
| Institutional Premium Class | – | 240,866 |
| Total | $– | $480,582 |
| Fidelity Freedom Index 2010 Fund | | |
| From net investment income | | |
| Investor Class | $665,657 | $3,926,080 |
| Institutional Premium Class | 923,066 | 4,951,809 |
| Total | $1,588,723 | $8,877,889 |
| From net realized gain | | |
| Investor Class | $972,840 | $2,079,285 |
| Institutional Premium Class | 1,283,286 | 2,815,897 |
| Total | $2,256,126 | $4,895,182 |
| Fidelity Freedom Index 2015 Fund | | |
| From net investment income | | |
| Investor Class | $1,406,429 | $10,274,814 |
| Institutional Premium Class | 1,434,520 | 9,283,408 |
| Total | $2,840,949 | $19,558,222 |
| From net realized gain | | |
| Investor Class | $170,468 | $1,601,066 |
| Institutional Premium Class | 159,391 | 1,479,235 |
| Total | $329,859 | $3,080,301 |
| Fidelity Freedom Index 2020 Fund | | |
| From net investment income | | |
| Investor Class | $3,336,896 | $27,914,520 |
| Institutional Premium Class | 5,172,520 | 38,512,157 |
| Total | $8,509,416 | $66,426,677 |
| From net realized gain | | |
| Investor Class | $– | $2,119,394 |
| Institutional Premium Class | – | 2,896,196 |
| Total | $– | $5,015,590 |
| Fidelity Freedom Index 2025 Fund | | |
| From net investment income | | |
| Investor Class | $3,110,946 | $28,811,409 |
| Institutional Premium Class | 3,747,774 | 30,669,624 |
| Total | $6,858,720 | $59,481,033 |
| From net realized gain | | |
| Investor Class | $– | $1,710,263 |
| Institutional Premium Class | – | 1,763,541 |
| Total | $– | $3,473,804 |
| Fidelity Freedom Index 2030 Fund | | |
| From net investment income | | |
| Investor Class | $2,271,329 | $31,367,417 |
| Institutional Premium Class | 3,603,949 | 43,705,023 |
| Total | $5,875,278 | $75,072,440 |
| From net realized gain | | |
| Investor Class | $432,584 | $1,424,508 |
| Institutional Premium Class | 626,773 | 1,933,434 |
| Total | $1,059,357 | $3,357,942 |
| Fidelity Freedom Index 2035 Fund | | |
| From net investment income | | |
| Investor Class | $687,409 | $22,129,663 |
| Institutional Premium Class | 1,043,586 | 24,853,079 |
| Total | $1,730,995 | $46,982,742 |
| From net realized gain | | |
| Investor Class | $– | $1,171,326 |
| Institutional Premium Class | – | 1,282,951 |
| Total | $– | $2,454,277 |
| Fidelity Freedom Index 2040 Fund | | |
| From net investment income | | |
| Investor Class | $555,202 | $20,714,478 |
| Institutional Premium Class | 1,053,052 | 31,523,429 |
| Total | $1,608,254 | $52,237,907 |
| From net realized gain | | |
| Investor Class | $763,111 | $1,079,123 |
| Institutional Premium Class | 1,158,357 | 1,602,635 |
| Total | $1,921,468 | $2,681,758 |
| Fidelity Freedom Index 2045 Fund | | |
| From net investment income | | |
| Investor Class | $378,075 | $13,778,964 |
| Institutional Premium Class | 649,383 | 17,242,621 |
| Total | $1,027,458 | $31,021,585 |
| From net realized gain | | |
| Investor Class | $991,626 | $1,210,582 |
| Institutional Premium Class | 1,239,731 | 1,492,265 |
| Total | $2,231,357 | $2,702,847 |
| Fidelity Freedom Index 2050 Fund | | |
| From net investment income | | |
| Investor Class | $318,484 | $11,874,898 |
| Institutional Premium Class | 569,486 | 16,870,632 |
| Total | $887,970 | $28,745,530 |
| From net realized gain | | |
| Investor Class | $954,633 | $2,042,020 |
| Institutional Premium Class | 1,366,766 | 2,826,424 |
| Total | $2,321,399 | $4,868,444 |
| Fidelity Freedom Index 2055 Fund | | |
| From net investment income | | |
| Investor Class | $104,660 | $4,545,026 |
| Institutional Premium Class | 173,480 | 5,286,003 |
| Total | $278,140 | $9,831,029 |
| From net realized gain | | |
| Investor Class | $690,253 | $559,064 |
| Institutional Premium Class | 817,836 | 633,891 |
| Total | $1,508,089 | $1,192,955 |
| Fidelity Freedom Index 2060 Fund | | |
| From net investment income | | |
| Investor Class | $34,683 | $1,127,154 |
| Institutional Premium Class | 39,903 | 972,830 |
| Total | $74,586 | $2,099,984 |
| From net realized gain | | |
| Investor Class | $201,160 | $237,021 |
| Institutional Premium Class | 192,862 | 185,457 |
| Total | $394,022 | $422,478 |
8. Share Transactions.
Share transactions for each class were as follows and may contain automatic conversions between classes or exchanges between affiliated funds:
| | Shares | Shares | Dollars | Dollars |
| | Six months ended September 30, 2018 | Year ended March 31, 2018 | Six months ended September 30, 2018 | Year ended March 31, 2018 |
| Fidelity Freedom Index Income Fund | | | | |
| Investor Class | | | | |
| Shares sold | 2,985,670 | 5,270,832 | $35,447,909 | $62,606,215 |
| Reinvestment of distributions | 95,185 | 211,431 | 1,130,453 | 2,504,402 |
| Shares redeemed | (1,417,113) | (4,985,581) | (16,853,116) | (59,164,225) |
| Net increase (decrease) | 1,663,742 | 496,682 | $19,725,246 | $5,946,392 |
| Institutional Premium Class | | | | |
| Shares sold | 2,679,601 | 4,123,153 | $31,815,661 | $48,941,669 |
| Reinvestment of distributions | 121,741 | 258,152 | 1,444,408 | 3,053,353 |
| Shares redeemed | (1,889,258) | (3,126,138) | (22,450,149) | (37,038,010) |
| Net increase (decrease) | 912,084 | 1,255,167 | $10,809,920 | $14,957,012 |
| Fidelity Freedom Index 2005 Fund | | | | |
| Investor Class | | | | |
| Shares sold | 725,063 | 2,605,617 | $9,765,626 | $34,897,679 |
| Reinvestment of distributions | 13,483 | 80,794 | 180,942 | 1,077,418 |
| Shares redeemed | (812,514) | (1,555,080) | (10,951,480) | (20,723,954) |
| Net increase (decrease) | (73,968) | 1,131,331 | $(1,004,912) | $15,251,143 |
| Institutional Premium Class | | | | |
| Shares sold | 474,675 | 1,311,524 | $6,398,339 | $17,485,786 |
| Reinvestment of distributions | 12,600 | 78,133 | 169,094 | 1,040,593 |
| Shares redeemed | (388,584) | (1,061,065) | (5,235,283) | (14,160,597) |
| Net increase (decrease) | 98,691 | 328,592 | $1,332,150 | $4,365,782 |
| Fidelity Freedom Index 2010 Fund | | | | |
| Investor Class | | | | |
| Shares sold | 2,193,868 | 9,097,238 | $31,534,893 | $129,602,976 |
| Reinvestment of distributions | 113,465 | 422,300 | 1,623,689 | 5,966,009 |
| Shares redeemed | (2,778,447) | (7,662,358) | (39,890,172) | (108,947,096) |
| Net increase (decrease) | (471,114) | 1,857,180 | $(6,731,590) | $26,621,889 |
| Institutional Premium Class | | | | |
| Shares sold | 1,902,429 | 6,289,496 | $27,335,311 | $89,722,927 |
| Reinvestment of distributions | 154,183 | 550,590 | 2,206,352 | 7,767,705 |
| Shares redeemed | (2,171,406) | (5,293,191) | (31,238,141) | (75,105,289) |
| Net increase (decrease) | (114,794) | 1,546,895 | $(1,696,478) | $22,385,343 |
| Fidelity Freedom Index 2015 Fund | | | | |
| Investor Class | | | | |
| Shares sold | 7,827,087 | 18,789,509 | $118,372,237 | $278,514,171 |
| Reinvestment of distributions | 104,151 | 793,802 | 1,571,643 | 11,845,144 |
| Shares redeemed | (6,727,085) | (13,485,936) | (101,741,520) | (199,624,180) |
| Net increase (decrease) | 1,204,153 | 6,097,375 | $18,202,360 | $90,735,135 |
| Institutional Premium Class | | | | |
| Shares sold | 6,407,678 | 9,699,686 | $96,497,792 | $143,909,496 |
| Reinvestment of distributions | 105,697 | 722,091 | 1,593,911 | 10,762,643 |
| Shares redeemed | (5,163,224) | (9,775,693) | (78,129,502) | (144,360,287) |
| Net increase (decrease) | 1,350,151 | 646,084 | $19,962,201 | $10,311,852 |
| Fidelity Freedom Index 2020 Fund | | | | |
| Investor Class | | | | |
| Shares sold | 19,997,000 | 46,676,293 | $319,659,890 | $724,366,488 |
| Reinvestment of distributions | 208,933 | 1,900,549 | 3,324,116 | 29,918,887 |
| Shares redeemed | (14,909,560) | (32,303,403) | (237,702,307) | (503,035,813) |
| Net increase (decrease) | 5,296,373 | 16,273,439 | $85,281,699 | $251,249,562 |
| Institutional Premium Class | | | | |
| Shares sold | 21,973,501 | 35,691,973 | $348,975,456 | $555,197,499 |
| Reinvestment of distributions | 325,316 | 2,634,326 | 5,172,520 | 41,408,353 |
| Shares redeemed | (18,263,999) | (27,129,181) | (291,313,477) | (419,854,988) |
| Net increase (decrease) | 4,034,818 | 11,197,118 | $62,834,499 | $176,750,864 |
| Fidelity Freedom Index 2025 Fund | | | | |
| Investor Class | | | | |
| Shares sold | 24,238,288 | 50,306,958 | $412,067,181 | $827,693,491 |
| Reinvestment of distributions | 183,210 | 1,818,856 | 3,101,738 | 30,448,676 |
| Shares redeemed | (13,178,823) | (25,680,740) | (223,651,047) | (423,486,960) |
| Net increase (decrease) | 11,242,675 | 26,445,074 | $191,517,872 | $434,655,207 |
| Institutional Premium Class | | | | |
| Shares sold | 23,743,190 | 28,457,247 | $400,851,920 | $468,684,110 |
| Reinvestment of distributions | 221,369 | 1,938,990 | 3,747,774 | 32,433,165 |
| Shares redeemed | (9,661,622) | (12,997,440) | (164,162,819) | (213,762,707) |
| Net increase (decrease) | 14,302,937 | 17,398,797 | $240,436,875 | $287,354,568 |
| Fidelity Freedom Index 2030 Fund | | | | |
| Investor Class | | | | |
| Shares sold | 22,774,974 | 48,151,518 | $409,728,775 | $833,049,685 |
| Reinvestment of distributions | 150,605 | 1,853,302 | 2,698,838 | 32,734,769 |
| Shares redeemed | (10,598,870) | (27,332,469) | (190,110,732) | (475,495,111) |
| Net increase (decrease) | 12,326,709 | 22,672,351 | $222,316,881 | $390,289,343 |
| Institutional Premium Class | | | | |
| Shares sold | 22,331,516 | 36,473,271 | $399,301,749 | $631,777,090 |
| Reinvestment of distributions | 236,089 | 2,585,746 | 4,230,722 | 45,638,457 |
| Shares redeemed | (11,004,444) | (14,679,369) | (197,555,605) | (252,581,131) |
| Net increase (decrease) | 11,563,161 | 24,379,648 | $205,976,866 | $424,834,416 |
| Fidelity Freedom Index 2035 Fund | | | | |
| Investor Class | | | | |
| Shares sold | 17,999,023 | 35,873,441 | $345,298,672 | $655,085,363 |
| Reinvestment of distributions | 35,884 | 1,238,632 | 685,733 | 23,270,096 |
| Shares redeemed | (7,251,901) | (18,227,142) | (138,442,050) | (332,963,701) |
| Net increase (decrease) | 10,783,006 | 18,884,931 | $207,542,355 | $345,391,758 |
| Institutional Premium Class | | | | |
| Shares sold | 15,328,236 | 21,221,516 | $291,718,187 | $386,744,447 |
| Reinvestment of distributions | 54,581 | 1,391,995 | 1,043,586 | 26,136,030 |
| Shares redeemed | (5,312,991) | (8,196,588) | (102,027,704) | (148,462,948) |
| Net increase (decrease) | 10,069,826 | 14,416,923 | $190,734,069 | $264,417,529 |
| Fidelity Freedom Index 2040 Fund | | | | |
| Investor Class | | | | |
| Shares sold | 15,316,518 | 31,885,175 | $296,378,368 | $587,361,959 |
| Reinvestment of distributions | 68,333 | 1,150,478 | 1,316,771 | 21,773,814 |
| Shares redeemed | (6,806,371) | (18,031,620) | (130,934,490) | (332,440,351) |
| Net increase (decrease) | 8,578,480 | 15,004,033 | $166,760,649 | $276,695,422 |
| Institutional Premium Class | | | | |
| Shares sold | 14,102,672 | 26,478,063 | $271,437,424 | $486,695,318 |
| Reinvestment of distributions | 114,819 | 1,752,195 | 2,211,409 | 33,126,064 |
| Shares redeemed | (7,426,675) | (10,558,906) | (142,999,970) | (192,228,150) |
| Net increase (decrease) | 6,790,816 | 17,671,352 | $130,648,863 | $327,593,232 |
| Fidelity Freedom Index 2045 Fund | | | | |
| Investor Class | | | | |
| Shares sold | 11,344,958 | 22,795,428 | $221,116,014 | $422,432,733 |
| Reinvestment of distributions | 70,517 | 787,814 | 1,368,017 | 14,967,831 |
| Shares redeemed | (4,762,958) | (11,711,569) | (92,376,709) | (217,232,633) |
| Net increase (decrease) | 6,652,517 | 11,871,673 | $130,107,322 | $220,167,931 |
| Institutional Premium Class | | | | |
| Shares sold | 10,611,037 | 16,857,917 | $205,638,858 | $311,218,678 |
| Reinvestment of distributions | 97,377 | 986,800 | 1,889,114 | 18,734,886 |
| Shares redeemed | (3,546,653) | (5,325,846) | (69,055,044) | (97,515,024) |
| Net increase (decrease) | 7,161,761 | 12,518,871 | $138,472,928 | $232,438,540 |
| Fidelity Freedom Index 2050 Fund | | | | |
| Investor Class | | | | |
| Shares sold | 9,470,393 | 19,485,896 | $185,317,891 | $362,838,945 |
| Reinvestment of distributions | 65,265 | 733,407 | 1,272,014 | 13,906,968 |
| Shares redeemed | (4,236,059) | (11,232,335) | (82,507,236) | (209,630,208) |
| Net increase (decrease) | 5,299,599 | 8,986,968 | $104,082,669 | $167,115,705 |
| Institutional Premium Class | | | | |
| Shares sold | 10,906,679 | 19,205,023 | $212,522,627 | $357,353,233 |
| Reinvestment of distributions | 99,346 | 1,038,931 | 1,936,252 | 19,697,056 |
| Shares redeemed | (5,443,675) | (6,421,264) | (105,847,098) | (118,465,640) |
| Net increase (decrease) | 5,562,350 | 13,822,690 | $108,611,781 | $258,584,649 |
| Fidelity Freedom Index 2055 Fund | | | | |
| Investor Class | | | | |
| Shares sold | 6,572,133 | 11,734,275 | $101,544,657 | $172,500,761 |
| Reinvestment of distributions | 51,612 | 338,818 | 794,313 | 5,101,760 |
| Shares redeemed | (2,520,109) | (5,176,289) | (38,760,853) | (76,127,408) |
| Net increase (decrease) | 4,103,636 | 6,896,804 | $63,578,117 | $101,475,113 |
| Institutional Premium Class | | | | |
| Shares sold | 7,029,533 | 9,594,512 | $108,196,390 | $140,660,073 |
| Reinvestment of distributions | 64,371 | 393,287 | 991,316 | 5,919,894 |
| Shares redeemed | (1,708,400) | (2,733,034) | (26,419,706) | (39,756,753) |
| Net increase (decrease) | 5,385,504 | 7,254,765 | $82,768,000 | $106,823,214 |
| Fidelity Freedom Index 2060 Fund | | | | |
| Investor Class | | | | |
| Shares sold | 3,354,245 | 4,872,076 | $42,309,145 | $58,667,848 |
| Reinvestment of distributions | 18,776 | 111,693 | 235,265 | 1,361,004 |
| Shares redeemed | (1,227,632) | (1,710,846) | (15,421,699) | (20,585,300) |
| Net increase (decrease) | 2,145,389 | 3,272,923 | $27,122,711 | $39,443,552 |
| Institutional Premium Class | | | | |
| Shares sold | 3,469,190 | 4,305,772 | $43,531,920 | $51,680,005 |
| Reinvestment of distributions | 18,562 | 94,964 | 232,765 | 1,158,287 |
| Shares redeemed | (896,586) | (957,866) | (11,226,962) | (11,538,248) |
| Net increase (decrease) | 2,591,166 | 3,442,870 | $32,537,723 | $41,300,044 |
9. Other.
The Funds' organizational documents provide former and current trustees and officers with a limited indemnification against liabilities arising in connection with the performance of their duties to the Funds. In the normal course of business, the Funds may also enter into contracts that provide general indemnifications. The Funds' maximum exposure under these arrangements is unknown as this would be dependent on future claims that may be made against the Funds. The risk of material loss from such claims is considered remote.
The Funds do not invest in the Underlying Funds for the purpose of exercising management or control; however, investments by the Funds within their principal investment strategies may represent a significant portion of the Underlying Fund's net assets. At the end of the period, the following Funds were the owners of record of 10% or more of the total outstanding shares of the Underlying Funds.
| Fund | Fidelity Freedom Index 2010 Fund | Fidelity Freedom Index 2015 Fund | Fidelity Freedom Index 2020 Fund | Fidelity Freedom Index 2025 Fund | Fidelity Freedom Index 2030 Fund | Fidelity Freedom Index 2035 Fund | Fidelity Freedom Index 2040 Fund |
| Fidelity Series Global ex U.S. Index Fund | -% | -% | 11% | 12% | 18% | 14% | 16% |
| Fidelity Series Treasury Bill Index Fund | 11% | 18% | 39% | 20% | -% | -% | -% |
| Fund | Fidelity Freedom Index 2045 Fund | Fidelity Freedom Index Income Fund |
| Fidelity Series Global ex U.S. Index Fund | 10% | –% |
| Fidelity Series Treasury Bill Index Fund | –% | 10% |
The Funds, in aggregate, were the owners of record of more than 20% of the total outstanding shares of the following Underlying Funds.
| Fund | % of shares held |
| Fidelity Series Treasury Bill Index Fund | 100% |
| Fidelity Series Global ex U.S. Index Fund | 100% |
| Fidelity Total Market Index Fund | 25% |
Shareholder Expense Example
As a shareholder of a Fund, you incur two types of costs: (1) transaction costs and (2) ongoing costs, including other Fund expenses. This Example is intended to help you understand your ongoing costs (in dollars) of investing in the Funds and to compare these costs with the ongoing costs of investing in other mutual funds.
The Example is based on an investment of $1,000 invested at the beginning of the period and held for the entire period (April 1, 2018 to September 30, 2018).
Actual Expenses
The first line of the accompanying table for each Class of each fund provides information about actual account values and actual expenses. You may use the information in this line, together with the amount you invested, to estimate the expenses that you paid over the period. Simply divide your account value by $1,000.00 (for example, an $8,600 account value divided by $1,000.00 = 8.6), then multiply the result by the number in the first line for a Class of the fund under the heading entitled "Expenses Paid During Period" to estimate the expenses you paid on your account during this period. In addition, each Fund, as a shareholder in underlying Fidelity Funds, will indirectly bear its pro-rata share of the fees and expenses incurred by the underlying Fidelity Funds. These fees and expenses are not included in each Fund's annualized expense ratio used to calculate the expense estimates in the table below.
Hypothetical Example for Comparison Purposes
The second line of the accompanying table for each Class of each fund provides information about hypothetical account values and hypothetical expenses based on a Class' actual expense ratio and an assumed rate of return of 5% per year before expenses, which is not the Class' actual return. The hypothetical account values and expenses may not be used to estimate the actual ending account balance or expenses you paid for the period. You may use this information to compare the ongoing costs of investing in the Fund and other funds. To do so, compare this 5% hypothetical example with the 5% hypothetical examples that appear in the shareholder reports of the other funds. In addition, each Fund, as a shareholder in underlying Fidelity Funds, will indirectly bear its pro-rata share of the fees and expenses incurred by the underlying Fidelity Funds. These fees and expenses are not included in each Fund's annualized expense ratio used to calculate the expense estimates in the table below.
Please note that the expenses shown in the table are meant to highlight your ongoing costs only and do not reflect any transaction costs. Therefore, the second line of the table is useful in comparing ongoing costs only, and will not help you determine the relative total costs of owning different funds.
| | Annualized Expense Ratio-A | Beginning
Account Value
April 1, 2018 | Ending
Account Value
September 30, 2018 | Expenses Paid
During Period-B
April 1, 2018
to September 30, 2018 |
| Fidelity Freedom Index Income Fund | | | | |
| Investor Class | .12% | | | |
| Actual | | $1,000.00 | $1,014.20 | $.61 |
| Hypothetical-C | | $1,000.00 | $1,024.47 | $.61 |
| Institutional Premium Class | .07% | | | |
| Actual | | $1,000.00 | $1,015.30 | $.35 |
| Hypothetical-C | | $1,000.00 | $1,024.72 | $.36 |
| Fidelity Freedom Index 2005 Fund | | | | |
| Investor Class | .12% | | | |
| Actual | | $1,000.00 | $1,020.30 | $.61 |
| Hypothetical-C | | $1,000.00 | $1,024.47 | $.61 |
| Institutional Premium Class | .06% | | | |
| Actual | | $1,000.00 | $1,021.20 | $.30 |
| Hypothetical-C | | $1,000.00 | $1,024.77 | $.30 |
| Fidelity Freedom Index 2010 Fund | | | | |
| Investor Class | .12% | | | |
| Actual | | $1,000.00 | $1,026.50 | $.61 |
| Hypothetical-C | | $1,000.00 | $1,024.47 | $.61 |
| Institutional Premium Class | .06% | | | |
| Actual | | $1,000.00 | $1,027.30 | $.30 |
| Hypothetical-C | | $1,000.00 | $1,024.77 | $.30 |
| Fidelity Freedom Index 2015 Fund | | | | |
| Investor Class | .12% | | | |
| Actual | | $1,000.00 | $1,032.70 | $.61 |
| Hypothetical-C | | $1,000.00 | $1,024.47 | $.61 |
| Institutional Premium Class | .06% | | | |
| Actual | | $1,000.00 | $1,032.20 | $.31 |
| Hypothetical-C | | $1,000.00 | $1,024.77 | $.30 |
| Fidelity Freedom Index 2020 Fund | | | | |
| Investor Class | .11% | | | |
| Actual | | $1,000.00 | $1,037.10 | $.56 |
| Hypothetical-C | | $1,000.00 | $1,024.52 | $.56 |
| Institutional Premium Class | .06% | | | |
| Actual | | $1,000.00 | $1,036.60 | $.31 |
| Hypothetical-C | | $1,000.00 | $1,024.77 | $.30 |
| Fidelity Freedom Index 2025 Fund | | | | |
| Investor Class | .11% | | | |
| Actual | | $1,000.00 | $1,040.80 | $.56 |
| Hypothetical-C | | $1,000.00 | $1,024.52 | $.56 |
| Institutional Premium Class | .06% | | | |
| Actual | | $1,000.00 | $1,040.90 | $.31 |
| Hypothetical-C | | $1,000.00 | $1,024.77 | $.30 |
| Fidelity Freedom Index 2030 Fund | | | | |
| Investor Class | .11% | | | |
| Actual | | $1,000.00 | $1,048.70 | $.56 |
| Hypothetical-C | | $1,000.00 | $1,024.52 | $.56 |
| Institutional Premium Class | .05% | | | |
| Actual | | $1,000.00 | $1,048.80 | $.26 |
| Hypothetical-C | | $1,000.00 | $1,024.82 | $.25 |
| Fidelity Freedom Index 2035 Fund | | | | |
| Investor Class | .11% | | | |
| Actual | | $1,000.00 | $1,057.90 | $.57 |
| Hypothetical-C | | $1,000.00 | $1,024.52 | $.56 |
| Institutional Premium Class | .05% | | | |
| Actual | | $1,000.00 | $1,058.10 | $.26 |
| Hypothetical-C | | $1,000.00 | $1,024.82 | $.25 |
| Fidelity Freedom Index 2040 Fund | | | | |
| Investor Class | .11% | | | |
| Actual | | $1,000.00 | $1,060.70 | $.57 |
| Hypothetical-C | | $1,000.00 | $1,024.52 | $.56 |
| Institutional Premium Class | .05% | | | |
| Actual | | $1,000.00 | $1,060.30 | $.26 |
| Hypothetical-C | | $1,000.00 | $1,024.82 | $.25 |
| Fidelity Freedom Index 2045 Fund | | | | |
| Investor Class | .11% | | | |
| Actual | | $1,000.00 | $1,060.30 | $.57 |
| Hypothetical-C | | $1,000.00 | $1,024.52 | $.56 |
| Institutional Premium Class | .05% | | | |
| Actual | | $1,000.00 | $1,060.40 | $.26 |
| Hypothetical-C | | $1,000.00 | $1,024.82 | $.25 |
| Fidelity Freedom Index 2050 Fund | | | | |
| Investor Class | .11% | | | |
| Actual | | $1,000.00 | $1,060.70 | $.57 |
| Hypothetical-C | | $1,000.00 | $1,024.52 | $.56 |
| Institutional Premium Class | .05% | | | |
| Actual | | $1,000.00 | $1,060.30 | $.26 |
| Hypothetical-C | | $1,000.00 | $1,024.82 | $.25 |
| Fidelity Freedom Index 2055 Fund | | | | |
| Investor Class | .11% | | | |
| Actual | | $1,000.00 | $1,060.60 | $.57 |
| Hypothetical-C | | $1,000.00 | $1,024.52 | $.56 |
| Institutional Premium Class | .05% | | | |
| Actual | | $1,000.00 | $1,060.70 | $.26 |
| Hypothetical-C | | $1,000.00 | $1,024.82 | $.25 |
| Fidelity Freedom Index 2060 Fund | | | | |
| Investor Class | .11% | | | |
| Actual | | $1,000.00 | $1,060.10 | $.57 |
| Hypothetical-C | | $1,000.00 | $1,024.52 | $.56 |
| Institutional Premium Class | .05% | | | |
| Actual | | $1,000.00 | $1,061.00 | $.26 |
| Hypothetical-C | | $1,000.00 | $1,024.82 | $.25 |
A Annualized expense ratio reflects expenses net of applicable fee waivers.
B Expenses are equal to each Class' annualized expense ratio, multiplied by the average account value over the period, multiplied by 183/365 (to reflect the one-half year period). The fees and expenses of the underlying Fidelity Funds in which each Fund invests are not included in each Fund's annualized expense ratio.
C 5% return per year before expenses
Board Approval of Investment Advisory Contracts and Management Fees
Fidelity Freedom Index Funds
Each year, the Board of Trustees, including the Independent Trustees (together, the Board), votes on the renewal of the management contract (the Advisory Contract) with FMR Co., Inc. (FMRC), an affiliate of Fidelity Management & Research Company (FMR), for each fund. The Board, assisted by the advice of fund counsel and Independent Trustees' counsel, requests and considers a broad range of information relevant to the renewal of the Advisory Contracts throughout the year.
The Board meets regularly and, at each of its meetings, covers an extensive agenda of topics and materials and considers factors that are relevant to its annual consideration of the renewal of each fund's Advisory Contract, including the services and support provided to each fund and its shareholders. The Board has established four standing committees (Committees) — Operations, Audit, Fair Valuation, and Governance and Nominating — each composed of and chaired by Independent Trustees with varying backgrounds, to which the Board has assigned specific subject matter responsibilities in order to enhance effective decision-making by the Board. The Operations Committee, of which all of the Independent Trustees are members, meets regularly throughout the year and considers, among other matters, information specifically related to the annual consideration of the renewal of each fund's Advisory Contract. The Board, acting directly and through its Committees, requests and receives information concerning the annual consideration of the renewal of each fund's Advisory Contract. The Board also meets as needed to review matters specifically related to the Board's annual consideration of the renewal of the Advisory Contracts. Members of the Board may also meet with trustees of other Fidelity funds through joint ad hoc committees to discuss certain matters relevant to all of the Fidelity funds.
At its September 2018 meeting, the Board unanimously determined to renew each fund's Advisory Contract. In reaching its determination, the Board considered all factors it believed relevant and reached a determination, with the assistance of fund counsel and Independent Trustees' counsel and through the exercise of its business judgment, that the renewal of the Advisory Contract was in the best interests of each fund and its shareholders and that the fact that no fees are payable under the Advisory Contracts was fair and reasonable. The Board's decision to renew the Advisory Contracts was not based on any single factor, but rather was based on a comprehensive consideration of all the information provided to the Board at its meetings throughout the year. In reaching its determination, the Board was aware that shareholders of each fund have a broad range of investment choices available to them, including a wide choice among funds offered by Fidelity's competitors, and that each fund's shareholders, who have the opportunity to review and weigh the disclosure provided by the fund in its prospectus and other public disclosures, have chosen to invest in that fund, which is part of the Fidelity family of funds.
Nature, Extent, and Quality of Services Provided. The Board considered Fidelity's staffing as it relates to the funds, including the backgrounds of investment personnel of FMRC, and also considered the funds' investment objectives, strategies, and related investment philosophies. The Independent Trustees also had discussions with senior management of Fidelity's investment operations and investment groups with responsibility for the underlying Fidelity funds in which each fund invests. The Board considered the structure of the investment personnel compensation program and whether this structure provides appropriate incentives to act in the best interests of each fund. Additionally, the Board considered the portfolio managers' investments, if any, in the funds that they manage.
Resources Dedicated to Investment Management and Support Services. The Board reviewed the general qualifications and capabilities of Fidelity's investment staff, including its size, education, experience, and resources, as well as Fidelity's approach to recruiting, managing, and compensating investment personnel. The Board noted that Fidelity has continued to increase the resources devoted to non-U.S. offices, including expansion of Fidelity's global investment organization. The Board also noted that Fidelity's analysts have extensive resources, tools and capabilities that allow them to conduct sophisticated quantitative and fundamental analysis, as well as credit analysis of issuers, counterparties and guarantors. Further, the Board considered that Fidelity's investment professionals have sufficient access to global information and data so as to provide competitive investment results over time, and that those professionals also have access to sophisticated tools that permit them to assess portfolio construction and risk and performance attribution characteristics continuously, as well as to transmit new information and research conclusions rapidly around the world. Additionally, in its deliberations, the Board considered Fidelity's risk management, compliance, and technology and operations capabilities and resources, which are integral parts of the investment management process.
Shareholder and Administrative Services. The Board considered (i) the nature, extent, quality, and cost of advisory, administrative, and shareholder services performed by Fidelity under the Advisory Contract and under separate agreements covering transfer agency, and pricing and bookkeeping services for each fund; (ii) the nature and extent of the supervision of third party service providers, principally custodians, subcustodians, and pricing vendors; and (iii) the resources devoted to, and the record of compliance with, each fund's compliance policies and procedures.
The Board noted that the growth of fund assets over time across the complex allows Fidelity to reinvest in the development of services designed to enhance the value and convenience of the Fidelity funds as investment vehicles. These services include 24-hour access to account information and market information through telephone representatives and over the Internet, investor education materials and asset allocation tools, and the expanded availability of Fidelity Investor Centers.
Investment in a Large Fund Family. The Board considered the benefits to shareholders of investing in a Fidelity fund, including the benefits of investing in a fund that is part of a large family of funds offering a variety of investment disciplines and providing a large variety of mutual fund investor services. The Board noted that Fidelity had taken, or had made recommendations that resulted in the Fidelity funds taking, a number of actions over the previous year that benefited particular funds, including: (i) continuing to dedicate additional resources to Fidelity's investment research process, which includes meetings with management of issuers of securities in which the funds invest, and to the support of the senior management team that oversees asset management; (ii) continuing efforts to enhance Fidelity's global research capabilities; (iii) launching new funds and making other enhancements to meet client needs; (iv) launching new share classes of existing funds; (v) eliminating purchase minimums and broadening eligibility requirements for certain funds and share classes; (vi) reducing management fees and total expenses for certain growth equity funds and index funds; (vii) lowering expense caps for certain existing funds and classes, and converting certain voluntary expense caps to contractual caps, to reduce expenses borne by shareholders; (viii) eliminating short-term redemption fees for funds that had such fees; (ix) rationalizing product lines and gaining increased efficiencies from fund mergers and share class consolidations; (x) continuing to develop, acquire and implement systems and technology to improve services to the funds and shareholders, strengthen information security, and increase efficiency; and (xi) continuing to implement enhancements to further strengthen Fidelity's product line to increase investors' probability of success in achieving their investment goals, including retirement income goals.
Investment Performance. The Board considered whether each fund has operated in accordance with its investment objective, as well as its record of compliance with its investment restrictions and its performance history. The Board noted that there was a portfolio management change for each fund in June 2018.
The Board took into account discussions that occur at Board meetings throughout the year with representatives of the investment adviser about fund investment performance. In this regard the Board noted that as part of regularly scheduled fund reviews and other reports to the Board on fund performance, the Board considers annualized return information for each fund for different time periods, measured against one or more appropriate securities market indices, including a customized blended index that reflects the respective weights of the fund's asset classes (each a "benchmark index") and a peer group of funds with similar objectives ("peer group"), if any. In its evaluation of fund investment performance at meetings throughout the year, the Board gave particular attention to information indicating underperformance of certain Fidelity funds for specific time periods and discussed with the investment adviser the reasons for such underperformance.
In addition to reviewing absolute and relative fund performance, the Independent Trustees periodically consider the appropriateness of fund performance metrics in evaluating the results achieved. In general, the Independent Trustees believe that fund performance should be evaluated based on gross performance (before fees and expenses, including acquired fund fees and expenses, but after transaction costs, if any) compared to appropriate benchmark indices, over appropriate time periods that may include full market cycles, and on net performance (after fees and expenses, including acquired fund fees and expenses) compared to peer groups, as applicable, over the same periods, taking into account relevant factors including the following: general market conditions; the extent to which particular underlying funds affected performance; and fund cash flows and other factors. Depending on the circumstances, the Independent Trustees may be satisfied with a fund's performance notwithstanding that it lags its benchmark index or peer group for certain periods.
The Independent Trustees recognize that shareholders evaluate performance on a net basis over their own holding periods, for which one-, three-, and five-year periods are often used as a proxy. For this reason, the performance information reviewed by the Board also included net cumulative calendar year total return information for each fund and an appropriate benchmark index for the most recent one-, three-, and five-year periods (for the most recent one- and three-year periods for Freedom Index
® 2060 Fund).
Based on its review, the Board concluded that the nature, extent, and quality of services provided to each fund under the Advisory Contracts should continue to benefit the shareholders of each fund.
Competitiveness of Management Fee and Total Expense Ratio. The Board noted that the funds do not pay FMRC a management fee for investment advisory services, and that each fund bears indirectly the fees and expenses, including the management fees, paid by the underlying Fidelity funds in which it invests. The Board considered each fund's management fee and total expense ratio compared to "mapped groups" of competitive funds and classes created for the purpose of facilitating the Trustees' competitive analysis of management fees and total expenses. Fidelity creates "mapped groups" by combining similar Lipper investment objective categories that have comparable investment mandates. Combining Lipper investment objective categories aids the Board's management fee and total expense ratio comparisons by broadening the competitive group used for comparison.
Management Fee. The Board considered two proprietary management fee comparisons for the 12-month (or shorter) periods shown in basis points (BP) in the charts below. The group of Lipper funds used by the Board for management fee comparisons is referred to below as the "Total Mapped Group." The Total Mapped Group comparison focuses on a fund's standing in terms of gross management fees before expense reimbursements or caps relative to the total universe of funds with comparable investment mandates, regardless of whether their management fee structures also are comparable. Funds with comparable investment mandates offer exposure to similar types of securities. Funds with comparable management fee structures have similar management fee contractual arrangements (
e.g., flat rate charged for advisory services, all-inclusive fee rate,
etc.). "TMG %" represents the percentage of funds in the Total Mapped Group that had management fees that were lower than a fund's. For example, a hypothetical TMG % of 20% would mean that 80% of the funds in the Total Mapped Group had higher, and 20% had lower, management fees than a fund. The funds' actual TMG %s and the number of funds in the Total Mapped Group are in the charts below. The Board also noted that over the past few years, Fidelity has been developing and refining the competitive methodology for the funds to provide a more meaningful competitive comparison. As a result, beginning with the 2014 competitive results, instead of including all funds in one competitive mapped group that includes all funds-of-funds, Fidelity introduced three new Total Mapped Groups that consist of target retirement funds. The Board noted that Fidelity believes that the new Total Mapped Groups provide more meaningful competitive comparisons for the funds because they include target date funds, regardless of whether the fund is a fund of funds. The "Asset-Size Peer Group" (ASPG) comparison focuses on a fund's standing relative to a subset of non-Fidelity funds within the Total Mapped Group that are similar in size and management fee structure. For example, if a fund is in the first quartile of the ASPG, the fund's management fee ranks in the least expensive or lowest 25% of funds in the ASPG. The ASPG represents at least 15% of the funds in the Total Mapped Group with comparable asset size and management fee structures, subject to a minimum of 50 funds (or all funds in the Total Mapped Group if fewer than 50). Additional information, such as the ASPG quartile in which a fund's management fee rate ranked, is also included in the charts and was considered by the Board.
Freedom Index 2005 Fund
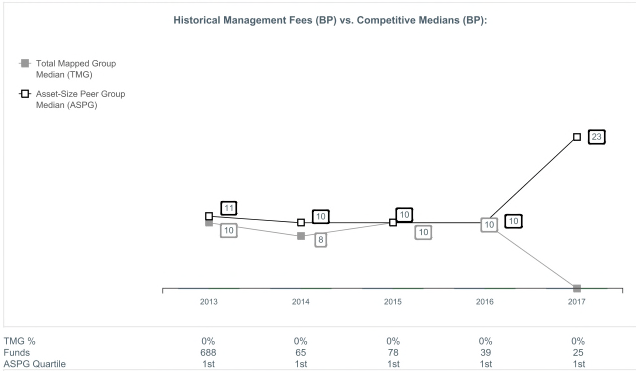
Freedom Index 2010 Fund

Freedom Index 2015 Fund
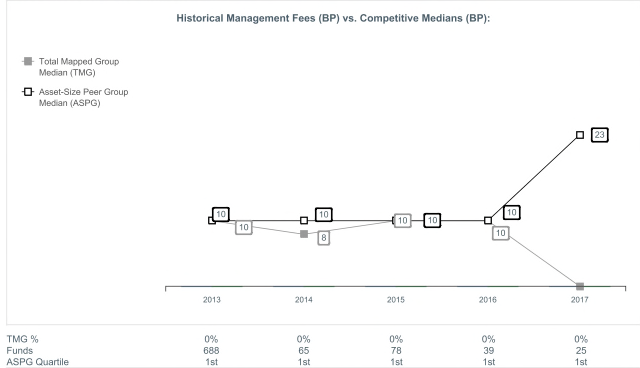
Freedom Index 2020 Fund
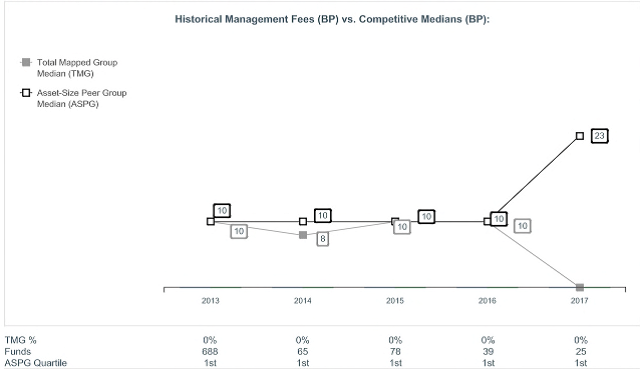
Freedom Index 2025 Fund
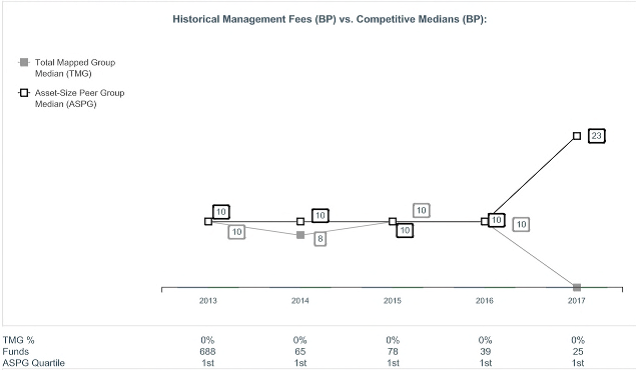
Freedom Index 2030 Fund
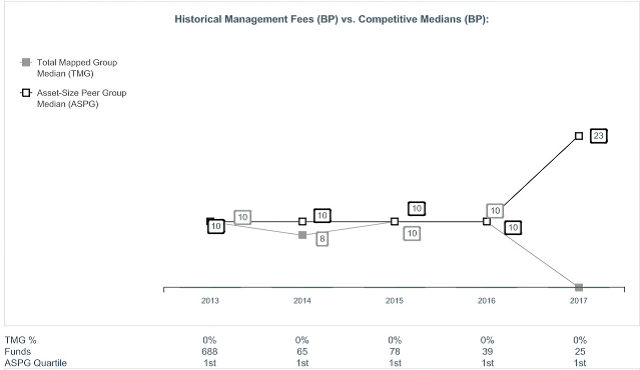
Freedom Index 2035 Fund
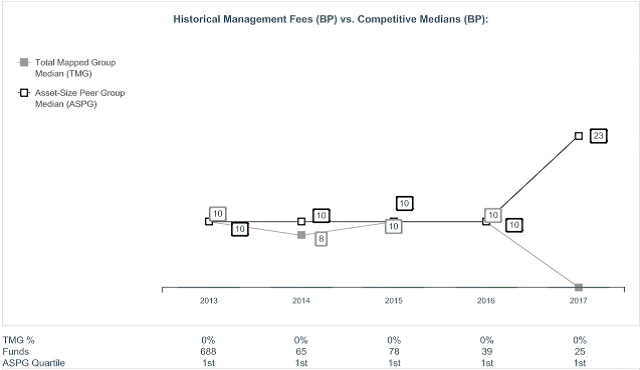
Freedom Index 2040 Fund
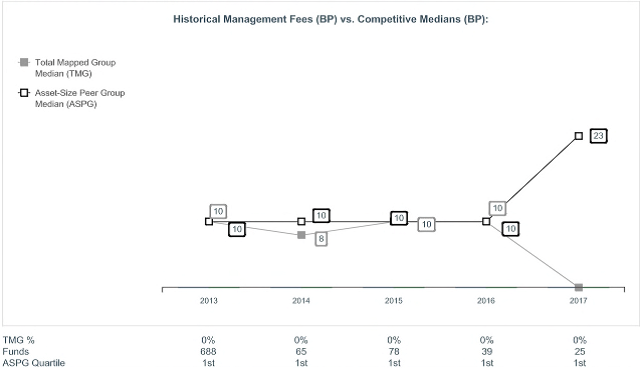
Freedom Index 2045 Fund
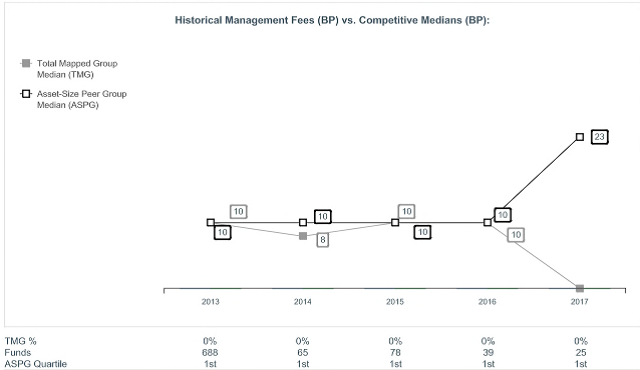
Freedom Index 2050 Fund
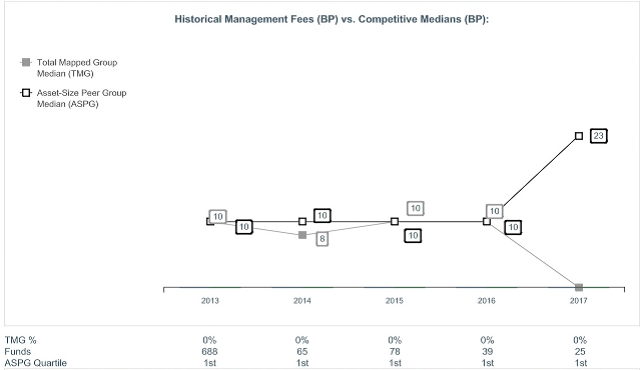
Freedom Index 2055 Fund
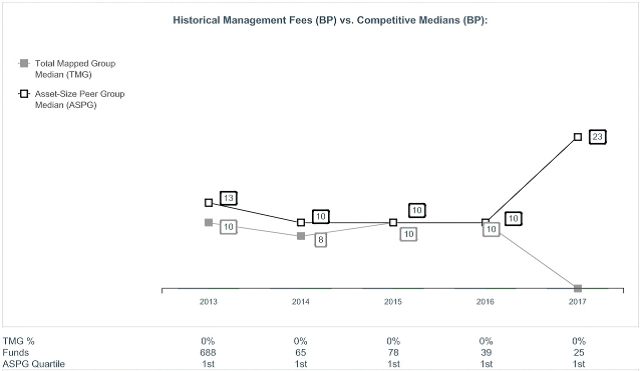
Freedom Index 2060 Fund
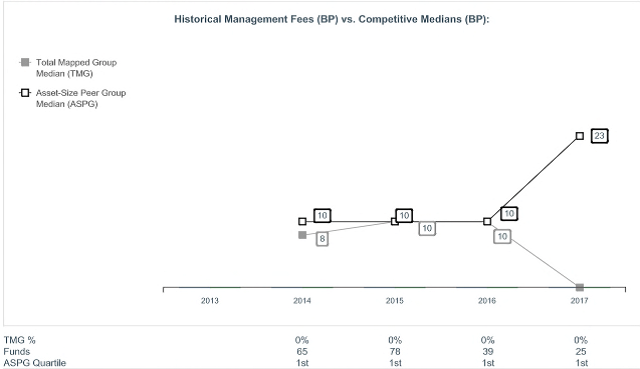
Freedom Index Income Fund

The Board noted that each fund's management fee rate of 0.00% ranked equal to the median of its Total Mapped Group and below the median of its ASPG for 2017. The Board further noted that many peer funds pay fund-level expenses, including management fees, to which the funds are not subject.
The Board noted that it and the boards of other Fidelity funds formed an ad hoc Committee on Group Fee, which meets periodically, to conduct an in-depth review of the "group fee" component of the management fee of funds with such management fee structures. The Committee's focus included the mechanics of the group fee, the competitive landscape of group fee structures, Fidelity funds with no group fee component (such as the funds) and investment products not included in group fee assets. The Board also considered that, for funds subject to the group fee, FMR agreed to voluntarily waive fees over a specified period of time in amounts designed to account for assets converted from certain funds to certain collective investment trusts.
Based on its review, the Board concluded that each fund's management fee is fair and reasonable in light of the services that the fund receives and the other factors considered.
Total Expense Ratio. In its review of the total expense ratio of each class of each fund, the Board considered that the funds pay transfer agent fees. The Board further noted that FMR pays all other expenses of each fund, with limited exceptions.
The Board noted that the total expense ratio of each class of each fund ranked below the competitive median for 2017.
In considering the total expense ratio of each class of each fund, the Board also considered an alternative competitive analysis that included both top level (
i.e., direct) fund fees and acquired fund fees and expenses for the class and the other funds and classes to which it is compared. The Board noted that, under this alternative competitive analysis, the total expense ratio of each class of each fund ranked below the competitive median for 2017.
The Board further considered that FMR has contractually agreed to reimburse Investor Class and Institutional Premium Class of each fund to the extent that total operating expenses (including acquired fund fees and expenses, but excluding interest, certain taxes, certain securities lending costs, brokerage commissions, fees and expenses of the Independent Trustees, and extraordinary expenses, if any, incurred by the fund or an acquired fund in which the fund invests), as a percentage of their respective average net assets, exceed 0.14% and 0.08% through June 30, 2021.
Fees Charged to Other Fidelity Clients. The Board also considered Fidelity fee structures and other information with respect to clients of Fidelity, such as other funds advised or subadvised by Fidelity, pension plan clients, and other institutional clients with similar mandates. The Board noted that a joint ad hoc committee created by it and the boards of other Fidelity funds periodically reviews and compares Fidelity's institutional investment advisory business with its business of providing services to the Fidelity funds and also noted the most recent findings of the committee. The Board noted that the committee's review included a consideration of the differences in services provided, fees charged, and costs incurred, as well as competition in the markets serving the different categories of clients.
Based on its review of total expense ratios and fees charged to other Fidelity clients, the Board concluded that the total expense ratio of each class of each fund was reasonable in light of the services that the fund and its shareholders receive and the other factors considered.
Costs of the Services and Profitability. The Board considered the level of Fidelity's profits in respect of all the Fidelity funds, including the Fidelity funds in which the funds invest.
PricewaterhouseCoopers LLP (PwC), auditor to Fidelity and certain Fidelity funds, has been engaged annually by the Board as part of the Board's assessment of Fidelity's profitability analysis. PwC's engagement includes the review and assessment of the methodologies used by Fidelity in determining the revenues and expenses attributable to Fidelity's mutual fund business, and completion of agreed-upon procedures in respect of the mathematical accuracy of the fund profitability information and its conformity to established allocation methodologies. After considering PwC's reports issued under the engagement and information provided by Fidelity, the Board concluded that while other allocation methods may also be reasonable, Fidelity's profitability methodologies are reasonable in all material respects.
The Board also reviewed Fidelity's non-fund businesses and potential indirect benefits such businesses may have received as a result of their association with Fidelity's mutual fund business (i.e., fall-out benefits) as well as cases where Fidelity's affiliates may benefit from the fund's business. The Board noted that changes to fall-out benefits year-over-year reflect business developments at Fidelity's various businesses.
The Board concluded that the costs of the services provided by and the profits realized by Fidelity in connection with the operation of each fund were not relevant to the renewal of each fund's Advisory Contract because the funds do not pay management fees and FMR pays all other expenses of each fund, with limited exceptions.
Economies of Scale. The Board concluded that because the funds do not pay management fees and FMR pays all other expenses of each fund, with limited exceptions, economies of scale cannot be realized by the funds, but may be realized by the other Fidelity funds in which each fund invests.
Additional Information Requested by the Board. In order to develop fully the factual basis for consideration of the Fidelity funds' advisory contracts, the Board requested and received additional information on certain topics, including: (i) Fidelity's fund profitability methodology, profitability trends for certain funds, the allocation of various costs to different funds, and the impact of certain factors on fund profitability results; (ii) portfolio manager changes that have occurred during the past year and the amount of the investment that each portfolio manager has made in the Fidelity fund(s) that he or she manages; (iii) Fidelity's compensation structure for portfolio managers, research analysts, and other key personnel, including its effects on fund profitability, the rationale for the compensation structure, and the extent to which current market conditions have affected retention and recruitment; (iv) the arrangements with and compensation paid to certain fund sub-advisers on behalf of the Fidelity funds and the treatment of such compensation within Fidelity's fund profitability methodology; (v) the terms of Fidelity's voluntary expense limitation agreements; (vi) the methodology with respect to competitive fund data and peer group classifications; (vii) Fidelity's transfer agent fee, expense, and service structures for different funds and classes relative to competitive trends, and the impact of the increased use of omnibus accounts; (viii) new developments in the retail and institutional marketplaces and the competitive positioning of the funds relative to other investment products and services; (ix) the impact of recent changes to the money market fund landscape, including the full implementation of money market fund reform and rising interest rates, on Fidelity's money market funds; (x) the funds' share class structures and distribution channels; and (xi) explanations regarding the relative total expense ratios of certain funds and classes, total expense competitive trends and methodologies for total expense competitive comparisons, and actions that might be taken by Fidelity to reduce total expense ratios for certain classes. In addition, the Board considered its discussions with Fidelity throughout the year regarding enhanced information security initiatives and the funds' fair valuation policies.
Based on its evaluation of all of the conclusions noted above, and after considering all factors it believed relevant, the Board concluded that the advisory fee arrangements are fair and reasonable, and that each fund's Advisory Contract should be renewed.

FRX-SANN-1118
1.899267.108
Fidelity Freedom® Funds - Income, 2005, 2010, 2015, 2020, 2025, 2030, 2035, 2040, 2045, 2050, 2055, 2060
Semi-Annual Report September 30, 2018 |
|
Contents
To view a fund's proxy voting guidelines and proxy voting record for the 12-month period ended June 30, visit http://www.fidelity.com/proxyvotingresults or visit the Securities and Exchange Commission's (SEC) web site at http://www.sec.gov.
You may also call 1-800-544-8544 to request a free copy of the proxy voting guidelines.
Standard & Poor's, S&P and S&P 500 are registered service marks of The McGraw-Hill Companies, Inc. and have been licensed for use by Fidelity Distributors Corporation.
Other third-party marks appearing herein are the property of their respective owners.
All other marks appearing herein are registered or unregistered trademarks or service marks of FMR LLC or an affiliated company. © 2018 FMR LLC. All rights reserved.
This report and the financial statements contained herein are submitted for the general information of the shareholders of the Funds. This report is not authorized for distribution to prospective investors in the Funds unless preceded or accompanied by an effective prospectus.
A fund files its complete schedule of portfolio holdings with the SEC for the first and third quarters of each fiscal year on Form N-Q. Forms N-Q are available on the SEC’s web site at http://www.sec.gov. A fund's Forms N-Q may be reviewed and copied at the SEC’s Public Reference Room in Washington, DC. Information regarding the operation of the SEC's Public Reference Room may be obtained by calling 1-800-SEC-0330.
For a complete list of a fund's portfolio holdings, view the most recent holdings listing, semiannual report, or annual report on Fidelity's web site at http://www.fidelity.com, http://www.institutional.fidelity.com, or http://www.401k.com, as applicable.
NOT FDIC INSURED •MAY LOSE VALUE •NO BANK GUARANTEE
Neither the Funds nor Fidelity Distributors Corporation is a bank.
Note to shareholders:
At its May 2018 meeting, the Board of Trustees approved incremental updates to the strategic asset allocation (i.e., glide path) of Fidelity Freedom Funds, adding U.S. Treasury Inflation-Protected Securities and long-term U.S. Treasury bonds as fixed exposures in the Funds’ bond allocations, and slightly reducing the equity and short-term debt allocations for shorter-dated Funds. These updates are expected to be fully implemented by the end of 2018.
Fidelity Freedom® Income Fund
Investment Summary (Unaudited)
The information in the following tables is based on the direct investments of the Fund.
Top Holdings as of September 30, 2018
| | % of fund's net assets |
| Fidelity Series Investment Grade Bond Fund | 37.0 |
| Fidelity Series Government Money Market Fund 2.12% | 18.5 |
| Fidelity Series Inflation-Protected Bond Index Fund | 12.9 |
| Fidelity Series Short-Term Credit Fund | 4.7 |
| Fidelity Series Long-Term Treasury Bond Index Fund | 4.5 |
| Fidelity Series Emerging Markets Opportunities Fund | 2.7 |
| Fidelity Series International Growth Fund | 2.2 |
| Fidelity Series International Value Fund | 2.2 |
| Fidelity Series Commodity Strategy Fund | 1.9 |
| Fidelity Series Intrinsic Opportunities Fund | 1.7 |
| | 88.3 |
Asset Allocation (% of fund's net assets)
| Period end |
| | Domestic Equity Funds | 11.2% |
| | International Equity Funds | 8.2% |
| | Bond Funds | 57.2% |
| | Short-Term Funds | 23.4% |

Domestic Equity Funds category includes Fidelity Series Commodity Strategy Fund which invests in commodity-related investments.
Fidelity Freedom® Income Fund
Schedule of Investments September 30, 2018 (Unaudited)
Showing Percentage of Net Assets
| U.S. Treasury Obligations - 0.0% | | | |
| | | Principal Amount | Value |
| U.S. Treasury Bills, yield at date of purchase 1.97% to 2.07% 11/1/18 to 11/29/18 (a) | | | |
| (Cost $2,046,120) | | 2,050,000 | 2,045,940 |
| | | Shares | Value |
|
| Domestic Equity Funds - 11.2% | | | |
| Fidelity Series All-Sector Equity Fund (b) | | 858,243 | $11,680,686 |
| Fidelity Series Blue Chip Growth Fund (b) | | 1,560,696 | 23,878,651 |
| Fidelity Series Commodity Strategy Fund (b) | | 13,244,322 | 66,221,611 |
| Fidelity Series Growth Company Fund (b) | | 2,389,870 | 48,299,268 |
| Fidelity Series Intrinsic Opportunities Fund (b) | | 3,192,734 | 58,522,811 |
| Fidelity Series Large Cap Stock Fund (b) | | 3,223,063 | 51,343,391 |
| Fidelity Series Large Cap Value Index Fund (b) | | 1,082,077 | 14,283,418 |
| Fidelity Series Opportunistic Insights Fund (b) | | 1,306,853 | 25,941,035 |
| Fidelity Series Small Cap Discovery Fund (b) | | 556,478 | 6,761,204 |
| Fidelity Series Small Cap Opportunities Fund (b) | | 1,423,282 | 20,908,009 |
| Fidelity Series Stock Selector Large Cap Value Fund (b) | | 2,935,156 | 38,802,766 |
| Fidelity Series Value Discovery Fund (b) | | 2,009,660 | 27,512,252 |
| TOTAL DOMESTIC EQUITY FUNDS | | | |
| (Cost $276,504,143) | | | 394,155,102 |
|
| International Equity Funds - 8.2% | | | |
| Fidelity Series Canada Fund (b) | | 694,311 | 7,505,503 |
| Fidelity Series Emerging Markets Fund (b) | | 1,256,778 | 12,178,180 |
| Fidelity Series Emerging Markets Opportunities Fund (b) | | 4,889,313 | 93,825,908 |
| Fidelity Series International Growth Fund (b) | | 4,785,578 | 78,483,481 |
| Fidelity Series International Small Cap Fund (b) | | 995,982 | 17,828,076 |
| Fidelity Series International Value Fund (b) | | 7,413,802 | 77,993,198 |
| TOTAL INTERNATIONAL EQUITY FUNDS | | | |
| (Cost $211,566,464) | | | 287,814,346 |
|
| Bond Funds - 57.2% | | | |
| Fidelity Series Emerging Markets Debt Fund (b) | | 2,751,836 | 26,224,993 |
| Fidelity Series Floating Rate High Income Fund (b) | | 923,890 | 8,795,428 |
| Fidelity Series High Income Fund (b) | | 4,996,399 | 48,015,395 |
| Fidelity Series Inflation-Protected Bond Index Fund (b) | | 46,587,298 | 452,362,667 |
| Fidelity Series International Credit Fund (b) | | 189,327 | 1,861,080 |
| Fidelity Series Investment Grade Bond Fund (b) | | 119,477,891 | 1,301,114,228 |
| Fidelity Series Long-Term Treasury Bond Index Fund (b) | | 19,022,011 | 156,741,370 |
| Fidelity Series Real Estate Income Fund (b) | | 1,582,236 | 17,056,501 |
| TOTAL BOND FUNDS | | | |
| (Cost $2,027,662,368) | | | 2,012,171,662 |
|
| Short-Term Funds - 23.4% | | | |
| Fidelity Cash Central Fund, 2.11% (c) | | 6,323,103 | 6,324,368 |
| Fidelity Series Government Money Market Fund 2.12% (b)(d) | | 650,644,590 | 650,644,590 |
| Fidelity Series Short-Term Credit Fund (b) | | 16,816,160 | 165,807,334 |
| TOTAL SHORT-TERM FUNDS | | | |
| (Cost $824,593,524) | | | 822,776,292 |
| TOTAL INVESTMENT IN SECURITIES - 100.0% | | | |
| (Cost $3,342,372,619) | | | 3,518,963,342 |
| NET OTHER ASSETS (LIABILITIES) - 0.0% | | | (1,365,656) |
| NET ASSETS - 100% | | | $3,517,597,686 |
| Futures Contracts | | | | | |
| | Number of contracts | Expiration Date | Notional Amount | Value | Unrealized Appreciation/(Depreciation) |
| Purchased | | | | | |
| Equity Index Contracts | | | | | |
| ICE E-mini MSCI EAFE Index Contracts (United States) | 74 | Dec. 2018 | $7,309,350 | $6,992 | $6,992 |
| ICE E-mini MSCI Emerging Markets Index Contracts (United States) | 302 | Dec. 2018 | 15,850,470 | 306,292 | 306,292 |
|
| TOTAL PURCHASED | | | | | 313,284 |
|
| Sold | | | | | |
| Equity Index Contracts | | | | | |
| CME E-mini S&P 500 Index Contracts (United States) | 120 | Dec. 2018 | 17,514,000 | (5,821) | (5,821) |
| TOTAL FUTURES CONTRACTS | | | | | $307,463 |
The notional amount of futures purchased as a percentage of Net Assets is 0.7%
The notional amount of futures sold as a percentage of Net Assets is 0.5%
Legend
(a) Security or a portion of the security was pledged to cover margin requirements for futures contracts. At period end, the value of securities pledged amounted to $960,279.
(b) Affiliated Fund
(c) Affiliated fund that is generally available only to investment companies and other accounts managed by Fidelity Investments. The rate quoted is the annualized seven-day yield of the fund at period end. A complete unaudited listing of the fund's holdings as of its most recent quarter end is available upon request. In addition, each Fidelity Central Fund's financial statements are available on the SEC's website or upon request.
(d) The rate quoted is the annualized seven-day yield of the fund at period end.
Affiliated Central Funds
Information regarding fiscal year to date income earned by the Fund from investments in Fidelity Central Funds is as follows:
| Fund | Income earned |
| Fidelity Cash Central Fund | $22,227 |
| Total | $22,227 |
Amounts in the income column in the above table include any capital gain distributions from underlying funds, which are presented in the corresponding line-item in the Statement of Operations if applicable.
Affiliated Underlying Funds
Fiscal year to date information regarding the Fund's investments in affiliated Underlying Funds, excluding any Money Market Central Funds, is presented below. Exchanges between classes of the same affiliated Underlying Funds may occur.
| Affiliate | Value, beginning of period | Purchases | Sales Proceeds | Dividend Income | Realized Gain (loss) | Change in Unrealized appreciation (depreciation) | Value, end of period |
| Fidelity Series 100 Index Fund | $15,916,073 | $-- | $16,684,277 | $-- | $6,617,339 | $(5,849,135) | $-- |
| Fidelity Series All-Sector Equity Fund | 30,551,376 | 115,455 | 21,947,241 | -- | 4,831,585 | (1,870,489) | 11,680,686 |
| Fidelity Series Blue Chip Growth Fund | 31,582,362 | 2,352,394 | 13,043,656 | 2,230,117 | 4,900,631 | (1,913,080) | 23,878,651 |
| Fidelity Series Canada Fund | 9,334,390 | 35,276 | 2,424,341 | -- | 38,184 | 521,994 | 7,505,503 |
| Fidelity Series Commodity Strategy Fund | 79,034,933 | 9,548,706 | 16,818,873 | 3,986,945 | (7,468,813) | 1,925,658 | 66,221,611 |
| Fidelity Series Emerging Markets Debt Fund | 28,508,764 | 902,235 | 1,638,828 | 816,946 | (60,408) | (1,486,770) | 26,224,993 |
| Fidelity Series Emerging Markets Fund | -- | 12,208,821 | -- | -- | -- | (30,641) | 12,178,180 |
| Fidelity Series Emerging Markets Opportunities Fund | 114,600,734 | 420,188 | 7,342,008 | - | 1,620,303 | (15,473,309) | 93,825,908 |
| Fidelity Series Floating Rate High Income Fund | 9,147,819 | 274,285 | 635,291 | 238,738 | (20,985) | 29,600 | 8,795,428 |
| Fidelity Series Government Money Market Fund 2.12% | 859,951,401 | 69,275,671 | 278,582,482 | 7,435,363 | -- | -- | 650,644,590 |
| Fidelity Series Growth Company Fund | 67,193,973 | 245,130 | 28,224,982 | -- | 12,524,066 | (3,438,919) | 48,299,268 |
| Fidelity Series High Income Fund | 56,045,887 | 1,643,209 | 10,098,549 | 1,457,553 | (391,510) | 816,358 | 48,015,395 |
| Fidelity Series Inflation-Protected Bond Index Fund | 140,449,749 | 324,353,975 | 10,956,858 | 440,347 | (194,602) | (1,289,597) | 452,362,667 |
| Fidelity Series International Credit Fund | 1,872,196 | 23,073 | 15,354 | 23,073 | (207) | (18,628) | 1,861,080 |
| Fidelity Series International Growth Fund | 97,009,280 | 4,906,227 | 24,528,224 | -- | 5,569,188 | (4,472,990) | 78,483,481 |
| Fidelity Series International Small Cap Fund | 24,130,987 | 722,091 | 6,131,344 | -- | 1,086,699 | (1,980,357) | 17,828,076 |
| Fidelity Series International Value Fund | 95,143,387 | 2,872,788 | 19,256,243 | -- | 2,026,684 | (2,793,418) | 77,993,198 |
| Fidelity Series Intrinsic Opportunities Fund | 78,260,126 | 2,885,114 | 24,344,665 | 2,589,390 | 6,363,540 | (4,641,304) | 58,522,811 |
| Fidelity Series Investment Grade Bond Fund | 1,414,325,467 | 30,307,343 | 127,389,060 | 19,355,296 | (4,842,803) | (11,286,719) | 1,301,114,228 |
| Fidelity Series Large Cap Stock Fund | 69,040,943 | 4,047,231 | 24,920,395 | 3,779,653 | 4,311,623 | (1,136,011) | 51,343,391 |
| Fidelity Series Large Cap Value Index Fund | 19,791,623 | 73,996 | 6,783,122 | -- | 782,291 | 418,630 | 14,283,418 |
| Fidelity Series Long-Term Treasury Bond Index Fund | 78,600,027 | 106,098,031 | 22,416,953 | 1,345,713 | (967,598) | (4,572,137) | 156,741,370 |
| Fidelity Series Opportunistic Insights Fund | 34,616,831 | 133,023 | 12,971,038 | -- | 5,678,589 | (1,516,370) | 25,941,035 |
| Fidelity Series Real Estate Equity Fund | 6,171,500 | 89,767 | 6,510,092 | 82,424 | 1,186,459 | (937,634) | -- |
| Fidelity Series Real Estate Income Fund | 17,355,440 | 796,611 | 1,202,716 | 729,693 | 1,034 | 106,132 | 17,056,501 |
| Fidelity Series Short-Term Credit Fund | 211,429,964 | 3,118,161 | 48,731,013 | 2,306,640 | (675,183) | 665,405 | 165,807,334 |
| Fidelity Series Small Cap Discovery Fund | 9,419,231 | 587,510 | 3,144,728 | 551,769 | 470,284 | (571,093) | 6,761,204 |
| Fidelity Series Small Cap Opportunities Fund | 28,758,372 | 1,735,904 | 11,073,522 | 1,625,936 | 3,635,064 | (2,147,809) | 20,908,009 |
| Fidelity Series Stock Selector Large Cap Value Fund | 53,907,465 | 202,727 | 18,643,449 | -- | 3,992,165 | (656,142) | 38,802,766 |
| Fidelity Series Value Discovery Fund | 38,314,030 | 143,770 | 12,952,582 | -- | 3,272,501 | (1,265,467) | 27,512,252 |
| | $3,720,464,330 | $580,118,712 | $779,411,886 | $48,995,596 | $54,286,120 | $(64,864,242) | $3,510,593,034 |
Amounts in the income column in the above table include any capital gain distributions from underlying funds, which are presented in the corresponding line-item in the Statement of Operations if applicable.
Investment Valuation
The following is a summary of the inputs used, as of September 30, 2018, involving the Fund's assets and liabilities carried at fair value. The inputs or methodology used for valuing securities may not be an indication of the risk associated with investing in those securities. For more information on valuation inputs, and their aggregation into the levels used below, please refer to the Investment Valuation section in the accompanying Notes to Financial Statements.
| | Valuation Inputs at Reporting Date: |
| Description | Total | Level 1 | Level 2 | Level 3 |
| Investments in Securities: | | | | |
| Other Short-Term Investments | $2,045,940 | $-- | $2,045,940 | $-- |
| Domestic Equity Funds | 394,155,102 | 394,155,102 | -- | -- |
| International Equity Funds | 287,814,346 | 287,814,346 | -- | -- |
| Bond Funds | 2,012,171,662 | 2,012,171,662 | -- | -- |
| Short-Term Funds | 822,776,292 | 822,776,292 | -- | -- |
| Total Investments in Securities: | $3,518,963,342 | $3,516,917,402 | $2,045,940 | $-- |
| Derivative Instruments: | | | | |
| Assets | | | | |
| Futures Contracts | $313,284 | $313,284 | $-- | $-- |
| Total Assets | $313,284 | $313,284 | $-- | $-- |
| Liabilities | | | | |
| Futures Contracts | $(5,821) | $(5,821) | $-- | $-- |
| Total Liabilities | $(5,821) | $(5,821) | $-- | $-- |
| Total Derivative Instruments: | $307,463 | $307,463 | $-- | $-- |
Value of Derivative Instruments
The following table is a summary of the Fund's value of derivative instruments by primary risk exposure as of September 30, 2018. For additional information on derivative instruments, please refer to the Derivative Instruments section in the accompanying Notes to Financial Statements.
| Primary Risk Exposure / Derivative Type | Value |
| | Asset | Liability |
| Equity Risk | | |
| Futures Contracts(a) | $313,284 | $(5,821) |
| Total Equity Risk | 313,284 | (5,821) |
| Total Value of Derivatives | $313,284 | $(5,821) |
(a) Reflects gross cumulative appreciation (depreciation) on futures contracts as presented in the Schedule of Investments. In the Statement of Assets and Liabilities, the period end daily variation margin is included in receivable or payable for daily variation margin on futures contracts, and the net cumulative appreciation (depreciation) is included in net unrealized appreciation (depreciation).
See accompanying notes which are an integral part of the financial statements.
Fidelity Freedom® Income Fund
Financial Statements
Statement of Assets and Liabilities
| | | September 30, 2018 (Unaudited) |
| Assets | | |
Investment in securities, at value — See accompanying schedule:
Unaffiliated issuers (cost $2,046,120) | $2,045,940 | |
| Fidelity Central Funds (cost $6,324,368) | 6,324,368 | |
| Other affiliated issuers (cost $3,334,002,131) | 3,510,593,034 | |
| Total Investment in Securities (cost $3,342,372,619) | | $3,518,963,342 |
| Receivable for investments sold | | 28,842,301 |
| Receivable for fund shares sold | | 15,793,947 |
| Distributions receivable from Fidelity Central Funds | | 9,284 |
| Total assets | | 3,563,608,874 |
| Liabilities | | |
| Payable for investments purchased | $26,867,605 | |
| Payable for fund shares redeemed | 17,720,285 | |
| Accrued management fee | 1,301,864 | |
| Payable for daily variation margin on futures contracts | 121,434 | |
| Total liabilities | | 46,011,188 |
| Net Assets | | $3,517,597,686 |
| Net Assets consist of: | | |
| Paid in capital | | $3,277,238,597 |
| Undistributed net investment income | | 10,820,928 |
| Accumulated undistributed net realized gain (loss) on investments | | 52,639,975 |
| Net unrealized appreciation (depreciation) on investments | | 176,898,186 |
| Net Assets | | $3,517,597,686 |
| Fidelity Freedom Income Fund: | | |
| Net Asset Value, offering price and redemption price per share ($2,040,849,966 ÷ 176,249,126 shares) | | $11.58 |
| Class K: | | |
| Net Asset Value, offering price and redemption price per share ($1,388,227,944 ÷ 120,056,290 shares) | | $11.56 |
| Class K6: | | |
| Net Asset Value, offering price and redemption price per share ($88,519,776 ÷ 7,654,695 shares) | | $11.56 |
See accompanying notes which are an integral part of the financial statements.
Statement of Operations
| | | Six months ended September 30, 2018 (Unaudited) |
| Investment Income | | |
| Dividends: | | |
| Affiliated issuers | | $39,690,637 |
| Interest | | 8,225 |
| Income from Fidelity Central Funds | | 22,227 |
| Total income | | 39,721,089 |
| Expenses | | |
| Management fee | $8,016,172 | |
| Independent trustees' fees and expenses | 8,900 | |
| Total expenses before reductions | 8,025,072 | |
| Expense reductions | (54) | |
| Total expenses after reductions | | 8,025,018 |
| Net investment income (loss) | | 31,696,071 |
| Realized and Unrealized Gain (Loss) | | |
| Net realized gain (loss) on: | | |
| Investment securities: | | |
| Fidelity Central Funds | (161) | |
| Other affiliated issuers | 54,286,120 | |
| Futures contracts | (909,660) | |
| Capital gain distributions from underlying funds: | | |
| Affiliated issuers | 9,304,959 | |
| Total net realized gain (loss) | | 62,681,258 |
| Change in net unrealized appreciation (depreciation) on: | | |
| Investment securities: | | |
| Unaffiliated issuers | (163) | |
| Affiliated issuers | (64,864,242) | |
| Futures contracts | 307,463 | |
| Total change in net unrealized appreciation (depreciation) | | (64,556,942) |
| Net gain (loss) | | (1,875,684) |
| Net increase (decrease) in net assets resulting from operations | | $29,820,387 |
See accompanying notes which are an integral part of the financial statements.
Statement of Changes in Net Assets
| | Six months ended September 30, 2018 (Unaudited) | Year ended March 31, 2018 |
| Increase (Decrease) in Net Assets | | |
| Operations | | |
| Net investment income (loss) | $31,696,071 | $54,568,700 |
| Net realized gain (loss) | 62,681,258 | 90,451,426 |
| Change in net unrealized appreciation (depreciation) | (64,556,942) | (21,703,503) |
| Net increase (decrease) in net assets resulting from operations | 29,820,387 | 123,316,623 |
| Distributions to shareholders from net investment income | (26,350,776) | (51,949,454) |
| Distributions to shareholders from net realized gain | (38,860,177) | (67,440,706) |
| Total distributions | (65,210,953) | (119,390,160) |
| Share transactions - net increase (decrease) | (166,581,803) | 1,577,891,442 |
| Total increase (decrease) in net assets | (201,972,369) | 1,581,817,905 |
| Net Assets | | |
| Beginning of period | 3,719,570,055 | 2,137,752,150 |
| End of period | $3,517,597,686 | $3,719,570,055 |
| Other Information | | |
| Undistributed net investment income end of period | $10,820,928 | $5,475,633 |
See accompanying notes which are an integral part of the financial statements.
Financial Highlights
Fidelity Freedom Income Fund
| | Six months ended (Unaudited) September 30, | Years endedMarch 31, | | | | |
| | 2018 | 2018 | 2017 | 2016 | 2015 | 2014 |
| Selected Per–Share Data | | | | | | |
| Net asset value, beginning of period | $11.69 | $11.57 | $11.26 | $11.75 | $11.86 | $11.91 |
| Income from Investment Operations | | | | | | |
| Net investment income (loss)A | .10 | .18 | .19 | .21 | .21 | .16 |
| Net realized and unrealized gain (loss) | –B | .38 | .49 | (.27) | .28 | .30 |
| Total from investment operations | .10 | .56 | .68 | (.06) | .49 | .46 |
| Distributions from net investment income | (.08) | (.19) | (.20)C | (.21) | (.20) | (.16) |
| Distributions from net realized gain | (.12) | (.25) | (.17)C | (.22) | (.40) | (.35) |
| Total distributions | (.21)D | (.44) | (.37) | (.43) | (.60) | (.51) |
| Net asset value, end of period | $11.58 | $11.69 | $11.57 | $11.26 | $11.75 | $11.86 |
| Total ReturnE,F | .83% | 4.86% | 6.16% | (.45)% | 4.31% | 3.95% |
| Ratios to Average Net AssetsG,H | | | | | | |
| Expenses before reductions | .46%I,J | .39% | - %K | - %K | - %K | - %K |
| Expenses net of fee waivers, if any | .46%I,J | .39% | -% | -% | -% | -% |
| Expenses net of all reductions | .46%I,J | .39% | -% | -% | -% | -% |
| Net investment income (loss) | 1.73%I | 1.57% | 1.70% | 1.86% | 1.77% | 1.37% |
| Supplemental Data | | | | | | |
| Net assets, end of period (000 omitted) | $2,040,850 | $2,111,741 | $2,137,752 | $2,184,994 | $2,483,848 | $1,935,210 |
| Portfolio turnover rateH | 32%I | 17%L | 31% | 20% | 26%L | 31% |
A Calculated based on average shares outstanding during the period.
B Amount represents less than $.005 per share.
C The amounts shown reflect certain reclassifications related to book to tax differences that were made in the year shown.
D Total distributions of $.21 per share is comprised of distributions from net investment income of $.083 and distributions from net realized gain of $.123 per share.
E Total returns for periods of less than one year are not annualized.
F Total returns would have been lower if certain expenses had not been reduced during the applicable periods shown.
G Expense ratios reflect operating expenses of the class. Expenses before reductions do not reflect amounts reimbursed by the investment adviser or reductions from expense offset arrangements and do not represent the amount paid by the class during periods when reimbursements or reductions occur. Expenses net of fee waivers reflect expenses after reimbursement by the investment adviser but prior to reductions from expense offset arrangements. Expenses net of all reductions represent the net expenses paid by the class but do not include expenses of the underlying funds in which the Fund invests.
H Amounts do not include the activity of the Underlying Funds.
I Annualized
J On certain classes, the size and fluctuation of net assets and expense amounts may cause ratios to differ from contractual rates.
K Amount represents less than .005%.
L The portfolio turnover rate does not include the assets acquired in the merger.
See accompanying notes which are an integral part of the financial statements.
Fidelity Freedom Income Fund Class K
| | Six months ended (Unaudited) September 30, | Years endedMarch 31, |
| | 2018 | 2018 A |
| Selected Per–Share Data | | |
| Net asset value, beginning of period | $11.68 | $11.76 |
| Income from Investment Operations | | |
| Net investment income (loss)B | .10 | .19 |
| Net realized and unrealized gain (loss) | (.01) | .05 |
| Total from investment operations | .09 | .24 |
| Distributions from net investment income | (.09) | (.16) |
| Distributions from net realized gain | (.12) | (.17) |
| Total distributions | (.21) | (.32)C |
| Net asset value, end of period | $11.56 | $11.68 |
| Total ReturnD,E | .78% | 2.06% |
| Ratios to Average Net AssetsF,G | | |
| Expenses before reductions | .41%H,I | .42%H |
| Expenses net of fee waivers, if any | .41%H,I | .42%H |
| Expenses net of all reductions | .41%H,I | .42%H |
| Net investment income (loss) | 1.78%H | 2.32%H |
| Supplemental Data | | |
| Net assets, end of period (000 omitted) | $1,388,228 | $1,568,576 |
| Portfolio turnover rateG | 32%H | 17%J |
A For the period July 20, 2017 (commencement of sale of shares) to March 31, 2018.
B Calculated based on average shares outstanding during the period.
C Total distributions of $.32 per share is comprised of distributions from net investment income of $.157 and distributions from net realized gain of $.166 per share.
D Total returns for periods of less than one year are not annualized.
E Total returns would have been lower if certain expenses had not been reduced during the applicable periods shown.
F Expense ratios reflect operating expenses of the class. Expenses before reductions do not reflect amounts reimbursed by the investment adviser or reductions from expense offset arrangements and do not represent the amount paid by the class during periods when reimbursements or reductions occur. Expense ratios before reductions for start-up periods may not be representative of longer-term operating periods. Expenses net of fee waivers reflect expenses after reimbursement by the investment adviser but prior to reductions from expense offset arrangements. Expenses net of all reductions represent the net expenses paid by the class but do not include expenses of the underlying funds in which the Fund invests.
G Amounts do not include the activity of the Underlying Funds.
H Annualized
I On certain classes, the size and fluctuation of net assets and expense amounts may cause ratios to differ from contractual rates.
J The portfolio turnover rate does not include the assets acquired in the merger.
See accompanying notes which are an integral part of the financial statements.
Fidelity Freedom Income Fund Class K6
| | Six months ended (Unaudited) September 30, | Years endedMarch 31, |
| | 2018 | 2018 A |
| Selected Per–Share Data | | |
| Net asset value, beginning of period | $11.68 | $11.68 |
| Income from Investment Operations | | |
| Net investment income (loss)B | .11 | .18 |
| Net realized and unrealized gain (loss) | (.01) | .15 |
| Total from investment operations | .10 | .33 |
| Distributions from net investment income | (.09) | (.17) |
| Distributions from net realized gain | (.12) | (.17) |
| Total distributions | (.22)C | (.33)D |
| Net asset value, end of period | $11.56 | $11.68 |
| Total ReturnE,F | .83% | 2.86% |
| Ratios to Average Net AssetsG,H | | |
| Expenses before reductions | .37%I | .37%I |
| Expenses net of fee waivers, if any | .37%I | .37%I |
| Expenses net of all reductions | .37%I | .37%I |
| Net investment income (loss) | 1.83%I | 1.91%I |
| Supplemental Data | | |
| Net assets, end of period (000 omitted) | $88,520 | $39,253 |
| Portfolio turnover rateH | 32%I | 17%J |
A For the period June 7, 2017 (commencement of sale of shares) to March 31, 2018.
B Calculated based on average shares outstanding during the period.
C Total distributions of $.22 per share is comprised of distributions from net investment income of $.092 and distributions from net realized gain of $.123 per share.
D Total distributions of $.33 per share is comprised of distributions from net investment income of $.168 and distributions from net realized gain of $.166 per share.
E Total returns for periods of less than one year are not annualized.
F Total returns would have been lower if certain expenses had not been reduced during the applicable periods shown.
G Expense ratios reflect operating expenses of the class. Expenses before reductions do not reflect amounts reimbursed by the investment adviser or reductions from expense offset arrangements and do not represent the amount paid by the class during periods when reimbursements or reductions occur. Expense ratios before reductions for start-up periods may not be representative of longer-term operating periods. Expenses net of fee waivers reflect expenses after reimbursement by the investment adviser but prior to reductions from expense offset arrangements. Expenses net of all reductions represent the net expenses paid by the class but do not include expenses of the underlying funds in which the Fund invests.
H Amounts do not include the activity of the Underlying Funds.
I Annualized
J The portfolio turnover rate does not include the assets acquired in the merger.
See accompanying notes which are an integral part of the financial statements.
Fidelity Freedom® 2005 Fund
Investment Summary (Unaudited)
The information in the following tables is based on the direct investments of the Fund.
Top Holdings as of September 30, 2018
| | % of fund's net assets |
| Fidelity Series Investment Grade Bond Fund | 33.8 |
| Fidelity Series Government Money Market Fund 2.12% | 15.0 |
| Fidelity Series Inflation-Protected Bond Index Fund | 11.0 |
| Fidelity Series Long-Term Treasury Bond Index Fund | 4.6 |
| Fidelity Series Short-Term Credit Fund | 3.9 |
| Fidelity Series Emerging Markets Opportunities Fund | 3.5 |
| Fidelity Series International Growth Fund | 3.1 |
| Fidelity Series International Value Fund | 3.0 |
| Fidelity Series Intrinsic Opportunities Fund | 2.8 |
| Fidelity Series Large Cap Stock Fund | 2.5 |
| | 83.2 |
Asset Allocation (% of fund's net assets)
| Period end |
| | Domestic Equity Funds | 17.7% |
| | International Equity Funds | 11.0% |
| | Bond Funds | 52.2% |
| | Short-Term Funds | 19.1% |

Domestic Equity Funds category includes Fidelity Series Commodity Strategy Fund which invests in commodity-related investments.
Fidelity Freedom® 2005 Fund
Schedule of Investments September 30, 2018 (Unaudited)
Showing Percentage of Net Assets
| U.S. Treasury Obligations - 0.0% | | | |
| | | Principal Amount | Value |
| U.S. Treasury Bills, yield at date of purchase 1.97% to 2.11% 11/1/18 to 12/6/18 (a) | | | |
| (Cost $548,923) | | 550,000 | 548,875 |
| | | Shares | Value |
|
| Domestic Equity Funds - 17.7% | | | |
| Fidelity Series All-Sector Equity Fund (b) | | 419,751 | $5,712,814 |
| Fidelity Series Blue Chip Growth Fund (b) | | 739,407 | 11,312,923 |
| Fidelity Series Commodity Strategy Fund (b) | | 3,872,246 | 19,361,232 |
| Fidelity Series Growth Company Fund (b) | | 1,126,383 | 22,764,204 |
| Fidelity Series Intrinsic Opportunities Fund (b) | | 1,504,862 | 27,584,116 |
| Fidelity Series Large Cap Stock Fund (b) | | 1,520,594 | 24,223,069 |
| Fidelity Series Large Cap Value Index Fund (b) | | 515,832 | 6,808,987 |
| Fidelity Series Opportunistic Insights Fund (b) | | 618,895 | 12,285,070 |
| Fidelity Series Small Cap Discovery Fund (b) | | 269,538 | 3,274,882 |
| Fidelity Series Small Cap Opportunities Fund (b) | | 674,973 | 9,915,352 |
| Fidelity Series Stock Selector Large Cap Value Fund (b) | | 1,386,991 | 18,336,026 |
| Fidelity Series Value Discovery Fund (b) | | 951,661 | 13,028,244 |
| TOTAL DOMESTIC EQUITY FUNDS | | | |
| (Cost $125,280,107) | | | 174,606,919 |
|
| International Equity Funds - 11.0% | | | |
| Fidelity Series Canada Fund (b) | | 275,001 | 2,972,756 |
| Fidelity Series Emerging Markets Fund (b) | | 444,311 | 4,305,378 |
| Fidelity Series Emerging Markets Opportunities Fund (b) | | 1,777,470 | 34,109,656 |
| Fidelity Series International Growth Fund (b) | | 1,835,426 | 30,100,992 |
| Fidelity Series International Small Cap Fund (b) | | 394,580 | 7,062,991 |
| Fidelity Series International Value Fund (b) | | 2,855,208 | 30,036,787 |
| TOTAL INTERNATIONAL EQUITY FUNDS | | | |
| (Cost $82,972,590) | | | 108,588,560 |
|
| Bond Funds - 52.2% | | | |
| Fidelity Series Emerging Markets Debt Fund (b) | | 743,824 | 7,088,641 |
| Fidelity Series Floating Rate High Income Fund (b) | | 254,282 | 2,420,762 |
| Fidelity Series High Income Fund (b) | | 1,416,745 | 13,614,918 |
| Fidelity Series Inflation-Protected Bond Index Fund (b) | | 11,164,173 | 108,404,115 |
| Fidelity Series International Credit Fund (b) | | 51,571 | 506,942 |
| Fidelity Series Investment Grade Bond Fund (b) | | 30,629,278 | 333,552,834 |
| Fidelity Series Long-Term Treasury Bond Index Fund (b) | | 5,545,446 | 45,694,477 |
| Fidelity Series Real Estate Income Fund (b) | | 440,833 | 4,752,178 |
| TOTAL BOND FUNDS | | | |
| (Cost $534,508,047) | | | 516,034,867 |
|
| Short-Term Funds - 19.1% | | | |
| Fidelity Cash Central Fund, 2.11% (c) | | 1,659,283 | 1,659,615 |
| Fidelity Series Government Money Market Fund 2.12% (b)(d) | | 148,326,056 | 148,326,056 |
| Fidelity Series Short-Term Credit Fund (b) | | 3,905,275 | 38,506,009 |
| TOTAL SHORT-TERM FUNDS | | | |
| (Cost $188,946,883) | | | 188,491,680 |
| TOTAL INVESTMENT IN SECURITIES - 100.0% | | | |
| (Cost $932,256,550) | | | 988,270,901 |
| NET OTHER ASSETS (LIABILITIES) - 0.0% | | | (389,601) |
| NET ASSETS - 100% | | | $987,881,300 |
| Futures Contracts | | | | | |
| | Number of contracts | Expiration Date | Notional Amount | Value | Unrealized Appreciation/(Depreciation) |
| Purchased | | | | | |
| Equity Index Contracts | | | | | |
| ICE E-mini MSCI EAFE Index Contracts (United States) | 24 | Dec. 2018 | $2,370,600 | $2,268 | $2,268 |
| ICE E-mini MSCI Emerging Markets Index Contracts (United States) | 88 | Dec. 2018 | 4,618,680 | 90,385 | 90,384 |
|
| TOTAL PURCHASED | | | | | 92,652 |
|
| Sold | | | | | |
| Equity Index Contracts | | | | | |
| CME E-mini S&P 500 Index Contracts (United States) | 48 | Dec. 2018 | 7,005,600 | (5,028) | (5,028) |
| TOTAL FUTURES CONTRACTS | | | | | $87,624 |
The notional amount of futures purchased as a percentage of Net Assets is 0.7%
The notional amount of futures sold as a percentage of Net Assets is 0.7%
Legend
(a) Security or a portion of the security was pledged to cover margin requirements for futures contracts. At period end, the value of securities pledged amounted to $548,875.
(b) Affiliated Fund
(c) Affiliated fund that is generally available only to investment companies and other accounts managed by Fidelity Investments. The rate quoted is the annualized seven-day yield of the fund at period end. A complete unaudited listing of the fund's holdings as of its most recent quarter end is available upon request. In addition, each Fidelity Central Fund's financial statements are available on the SEC's website or upon request.
(d) The rate quoted is the annualized seven-day yield of the fund at period end.
Affiliated Central Funds
Information regarding fiscal year to date income earned by the Fund from investments in Fidelity Central Funds is as follows:
| Fund | Income earned |
| Fidelity Cash Central Fund | $6,098 |
| Total | $6,098 |
Amounts in the income column in the above table include any capital gain distributions from underlying funds, which are presented in the corresponding line-item in the Statement of Operations if applicable.
Affiliated Underlying Funds
Fiscal year to date information regarding the Fund's investments in affiliated Underlying Funds, excluding any Money Market Central Funds, is presented below. Exchanges between classes of the same affiliated Underlying Funds may occur.
| Affiliate | Value, beginning of period | Purchases | Sales Proceeds | Dividend Income | Realized Gain (loss) | Change in Unrealized appreciation (depreciation) | Value, end of period |
| Fidelity Series 100 Index Fund | $6,515,325 | $-- | $6,766,231 | $-- | $3,060,458 | $(2,809,552) | $-- |
| Fidelity Series All-Sector Equity Fund | 12,530,153 | 323,580 | 8,401,825 | -- | 638,590 | 622,316 | 5,712,814 |
| Fidelity Series Blue Chip Growth Fund | 12,953,358 | 1,402,783 | 4,184,724 | 1,047,213 | 1,473,388 | (331,882) | 11,312,923 |
| Fidelity Series Canada Fund | 3,443,587 | 90,826 | 769,911 | -- | 11,026 | 197,228 | 2,972,756 |
| Fidelity Series Commodity Strategy Fund | 21,665,200 | 3,277,306 | 3,988,960 | 1,155,570 | (3,206,008) | 1,613,694 | 19,361,232 |
| Fidelity Series Emerging Markets Debt Fund | 7,599,846 | 385,829 | 483,923 | 219,233 | (12,852) | (400,259) | 7,088,641 |
| Fidelity Series Emerging Markets Fund | -- | 4,318,466 | -- | -- | -- | (13,088) | 4,305,378 |
| Fidelity Series Emerging Markets Opportunities Fund | 40,950,004 | 1,179,316 | 3,026,645 | -- | 334,133 | (5,327,152) | 34,109,656 |
| Fidelity Series Floating Rate High Income Fund | 2,476,054 | 134,554 | 192,296 | 65,135 | (1,837) | 4,287 | 2,420,762 |
| Fidelity Series Government Money Market Fund 2.12% | 188,891,827 | 24,156,237 | 64,722,008 | 1,675,943 | -- | -- | 148,326,056 |
| Fidelity Series Growth Company Fund | 27,067,672 | 709,266 | 8,781,193 | -- | 3,637,097 | 131,362 | 22,764,204 |
| Fidelity Series High Income Fund | 15,273,504 | 768,359 | 2,545,845 | 407,388 | (93,139) | 212,039 | 13,614,918 |
| Fidelity Series Inflation-Protected Bond Index Fund | 34,330,025 | 77,720,594 | 3,292,577 | 104,461 | (109,818) | (244,109) | 108,404,115 |
| Fidelity Series International Credit Fund | 511,877 | 6,308 | 6,093 | 6,308 | (80) | (5,070) | 506,942 |
| Fidelity Series International Growth Fund | 35,653,275 | 1,361,049 | 7,353,311 | -- | 1,843,979 | (1,404,000) | 30,100,992 |
| Fidelity Series International Small Cap Fund | 8,838,106 | 321,958 | 1,773,378 | -- | 370,877 | (694,572) | 7,062,991 |
| Fidelity Series International Value Fund | 35,085,401 | 929,268 | 5,760,831 | -- | 447 | (217,498) | 30,036,787 |
| Fidelity Series Intrinsic Opportunities Fund | 32,312,650 | 2,084,749 | 7,442,081 | 1,214,527 | 733,664 | (104,866) | 27,584,116 |
| Fidelity Series Investment Grade Bond Fund | 357,195,577 | 15,703,190 | 35,256,473 | 4,918,970 | (1,215,834) | (2,873,626) | 333,552,834 |
| Fidelity Series Large Cap Stock Fund | 28,318,570 | 2,429,949 | 7,842,568 | 1,641,583 | 909,822 | 407,296 | 24,223,069 |
| Fidelity Series Large Cap Value Index Fund | 8,118,267 | 221,652 | 2,054,428 | -- | 175,759 | 347,737 | 6,808,987 |
| Fidelity Series Long-Term Treasury Bond Index Fund | 21,896,394 | 30,282,437 | 4,886,938 | 392,361 | (169,455) | (1,427,961) | 45,694,477 |
| Fidelity Series Opportunistic Insights Fund | 14,197,365 | 387,487 | 4,045,102 | -- | 1,535,896 | 209,424 | 12,285,070 |
| Fidelity Series Real Estate Equity Fund | 2,522,653 | 22,552 | 2,634,464 | 19,427 | 352,087 | (262,828) | -- |
| Fidelity Series Real Estate Income Fund | 4,756,952 | 332,037 | 366,115 | 201,476 | (833) | 30,137 | 4,752,178 |
| Fidelity Series Short-Term Credit Fund | 46,349,875 | 1,780,739 | 9,623,590 | 515,426 | (116,864) | 115,849 | 38,506,009 |
| Fidelity Series Small Cap Discovery Fund | 3,862,917 | 331,020 | 870,333 | 226,894 | 97,568 | (146,290) | 3,274,882 |
| Fidelity Series Small Cap Opportunities Fund | 11,795,128 | 1,081,023 | 3,484,539 | 764,275 | 694,276 | (170,536) | 9,915,352 |
| Fidelity Series Stock Selector Large Cap Value Fund | 22,112,603 | 604,742 | 5,803,995 | -- | 791,480 | 631,196 | 18,336,026 |
| Fidelity Series Value Discovery Fund | 15,714,129 | 429,039 | 3,972,779 | -- | 449,096 | 408,759 | 13,028,244 |
| | $1,022,938,294 | $172,776,315 | $210,333,156 | $14,576,190 | $12,182,923 | $(11,501,965) | $986,062,411 |
Amounts in the income column in the above table include any capital gain distributions from underlying funds, which are presented in the corresponding line-item in the Statement of Operations if applicable.
Investment Valuation
The following is a summary of the inputs used, as of September 30, 2018, involving the Fund's assets and liabilities carried at fair value. The inputs or methodology used for valuing securities may not be an indication of the risk associated with investing in those securities. For more information on valuation inputs, and their aggregation into the levels used below, please refer to the Investment Valuation section in the accompanying Notes to Financial Statements.
| | Valuation Inputs at Reporting Date: |
| Description | Total | Level 1 | Level 2 | Level 3 |
| Investments in Securities: | | | | |
| Other Short-Term Investments | $548,875 | $-- | $548,875 | $-- |
| Domestic Equity Funds | 174,606,919 | 174,606,919 | -- | -- |
| International Equity Funds | 108,588,560 | 108,588,560 | -- | -- |
| Bond Funds | 516,034,867 | 516,034,867 | -- | -- |
| Short-Term Funds | 188,491,680 | 188,491,680 | -- | -- |
| Total Investments in Securities: | $988,270,901 | $987,722,026 | $548,875 | $-- |
| Derivative Instruments: | | | | |
| Assets | | | | |
| Futures Contracts | $92,652 | $92,652 | $-- | $-- |
| Total Assets | $92,652 | $92,652 | $-- | $-- |
| Liabilities | | | | |
| Futures Contracts | $(5,028) | $(5,028) | $-- | $-- |
| Total Liabilities | $(5,028) | $(5,028) | $-- | $-- |
| Total Derivative Instruments: | $87,624 | $87,624 | $-- | $-- |
Value of Derivative Instruments
The following table is a summary of the Fund's value of derivative instruments by primary risk exposure as of September 30, 2018. For additional information on derivative instruments, please refer to the Derivative Instruments section in the accompanying Notes to Financial Statements.
| Primary Risk Exposure / Derivative Type | Value |
| | Asset | Liability |
| Equity Risk | | |
| Futures Contracts(a) | $92,652 | $(5,028) |
| Total Equity Risk | 92,652 | (5,028) |
| Total Value of Derivatives | $92,652 | $(5,028) |
(a) Reflects gross cumulative appreciation (depreciation) on futures contracts as presented in the Schedule of Investments. In the Statement of Assets and Liabilities, the period end daily variation margin is included in receivable or payable for daily variation margin on futures contracts, and the net cumulative appreciation (depreciation) is included in net unrealized appreciation (depreciation).
See accompanying notes which are an integral part of the financial statements.
Fidelity Freedom® 2005 Fund
Financial Statements
Statement of Assets and Liabilities
| | | September 30, 2018 (Unaudited) |
| Assets | | |
Investment in securities, at value — See accompanying schedule:
Unaffiliated issuers (cost $548,923) | $548,875 | |
| Fidelity Central Funds (cost $1,659,615) | 1,659,615 | |
| Other affiliated issuers (cost $930,048,012) | 986,062,411 | |
| Total Investment in Securities (cost $932,256,550) | | $988,270,901 |
| Cash | | 27,686 |
| Receivable for investments sold | | 6,172,493 |
| Receivable for fund shares sold | | 9,845,821 |
| Distributions receivable from Fidelity Central Funds | | 2,443 |
| Total assets | | 1,004,319,344 |
| Liabilities | | |
| Payable for investments purchased | $5,482,681 | |
| Payable for fund shares redeemed | 10,532,505 | |
| Accrued management fee | 376,240 | |
| Payable for daily variation margin on futures contracts | 46,618 | |
| Total liabilities | | 16,438,044 |
| Net Assets | | $987,881,300 |
| Net Assets consist of: | | |
| Paid in capital | | $910,955,558 |
| Undistributed net investment income | | 8,096,776 |
| Accumulated undistributed net realized gain (loss) on investments | | 12,726,991 |
| Net unrealized appreciation (depreciation) on investments | | 56,101,975 |
| Net Assets | | $987,881,300 |
| Fidelity Freedom 2005 Fund: | | |
| Net Asset Value, offering price and redemption price per share ($571,564,332 ÷ 45,945,798 shares) | | $12.44 |
| Class K: | | |
| Net Asset Value, offering price and redemption price per share ($386,290,515 ÷ 31,090,455 shares) | | $12.42 |
| Class K6: | | |
| Net Asset Value, offering price and redemption price per share ($30,026,453 ÷ 2,415,955 shares) | | $12.43 |
See accompanying notes which are an integral part of the financial statements.
Statement of Operations
| | | Six months ended September 30, 2018 (Unaudited) |
| Investment Income | | |
| Dividends: | | |
| Affiliated issuers | | $10,376,153 |
| Interest | | 2,543 |
| Income from Fidelity Central Funds | | 6,098 |
| Total income | | 10,384,794 |
| Expenses | | |
| Management fee | $2,305,748 | |
| Independent trustees' fees and expenses | 2,463 | |
| Total expenses before reductions | 2,308,211 | |
| Expense reductions | (70) | |
| Total expenses after reductions | | 2,308,141 |
| Net investment income (loss) | | 8,076,653 |
| Realized and Unrealized Gain (Loss) | | |
| Net realized gain (loss) on: | | |
| Investment securities: | | |
| Fidelity Central Funds | (32) | |
| Other affiliated issuers | 12,182,923 | |
| Futures contracts | (373,350) | |
| Capital gain distributions from underlying funds: | | |
| Affiliated issuers | 4,200,037 | |
| Total net realized gain (loss) | | 16,009,578 |
| Change in net unrealized appreciation (depreciation) on: | | |
| Investment securities: | | |
| Unaffiliated issuers | (43) | |
| Affiliated issuers | (11,501,965) | |
| Futures contracts | 87,624 | |
| Total change in net unrealized appreciation (depreciation) | | (11,414,384) |
| Net gain (loss) | | 4,595,194 |
| Net increase (decrease) in net assets resulting from operations | | $12,671,847 |
See accompanying notes which are an integral part of the financial statements.
Statement of Changes in Net Assets
| | Six months ended September 30, 2018 (Unaudited) | Year ended March 31, 2018 |
| Increase (Decrease) in Net Assets | | |
| Operations | | |
| Net investment income (loss) | $8,076,653 | $14,738,670 |
| Net realized gain (loss) | 16,009,578 | 30,625,628 |
| Change in net unrealized appreciation (depreciation) | (11,414,384) | 1,018,991 |
| Net increase (decrease) in net assets resulting from operations | 12,671,847 | 46,383,289 |
| Distributions to shareholders from net investment income | (2,637,248) | (13,671,334) |
| Distributions to shareholders from net realized gain | (15,179,078) | (20,759,680) |
| Total distributions | (17,816,326) | (34,431,014) |
| Share transactions - net increase (decrease) | (29,634,052) | 426,953,870 |
| Total increase (decrease) in net assets | (34,778,531) | 438,906,145 |
| Net Assets | | |
| Beginning of period | 1,022,659,831 | 583,753,686 |
| End of period | $987,881,300 | $1,022,659,831 |
| Other Information | | |
| Undistributed net investment income end of period | $8,096,776 | $2,657,371 |
See accompanying notes which are an integral part of the financial statements.
Financial Highlights
Fidelity Freedom 2005 Fund
| | Six months ended (Unaudited) September 30, | Years endedMarch 31, | | | | |
| | 2018 | 2018 | 2017 | 2016 | 2015 | 2014 |
| Selected Per–Share Data | | | | | | |
| Net asset value, beginning of period | $12.50 | $12.20 | $11.66 | $12.24 | $12.01 | $11.53 |
| Income from Investment Operations | | | | | | |
| Net investment income (loss)A | .10 | .19 | .20 | .22 | .22 | .16 |
| Net realized and unrealized gain (loss) | .06 | .59 | .71 | (.34) | .40 | .58 |
| Total from investment operations | .16 | .78 | .91 | (.12) | .62 | .74 |
| Distributions from net investment income | (.03) | (.18) | (.22)B | (.22) | (.23) | (.15) |
| Distributions from net realized gain | (.19) | (.30) | (.15)B | (.23) | (.17) | (.10) |
| Total distributions | (.22) | (.48) | (.37) | (.46)C | (.39)D | (.26)E |
| Net asset value, end of period | $12.44 | $12.50 | $12.20 | $11.66 | $12.24 | $12.01 |
| Total ReturnF,G | 1.28% | 6.43% | 7.91% | (1.01)% | 5.26% | 6.43% |
| Ratios to Average Net AssetsH,I | | | | | | |
| Expenses before reductions | .48%J | .41% | - %K | - %K | - %K | - %K |
| Expenses net of fee waivers, if any | .48%J | .41% | -% | -% | -% | -% |
| Expenses net of all reductions | .48%J | .41% | -% | -% | -% | -% |
| Net investment income (loss) | 1.58%J | 1.52% | 1.70% | 1.87% | 1.79% | 1.38% |
| Supplemental Data | | | | | | |
| Net assets, end of period (000 omitted) | $571,564 | $590,056 | $583,754 | $580,726 | $639,723 | $668,987 |
| Portfolio turnover rateI | 34%J | 23%L | 31% | 22% | 23% | 44% |
A Calculated based on average shares outstanding during the period.
B The amounts shown reflect certain reclassifications related to book to tax differences that were made in the year shown.
C Total distributions of $.46 per share is comprised of distributions from net investment income of $.223 and distributions from net realized gain of $.234 per share.
D Total distributions of $.39 per share is comprised of distributions from net investment income of $.225 and distributions from net realized gain of $.168 per share.
E Total distributions of $.26 per share is comprised of distributions from net investment income of $.153 and distributions from net realized gain of $.103 per share.
F Total returns for periods of less than one year are not annualized.
G Total returns would have been lower if certain expenses had not been reduced during the applicable periods shown.
H Expense ratios reflect operating expenses of the class. Expenses before reductions do not reflect amounts reimbursed by the investment adviser or reductions from expense offset arrangements and do not represent the amount paid by the class during periods when reimbursements or reductions occur. Expenses net of fee waivers reflect expenses after reimbursement by the investment adviser but prior to reductions from expense offset arrangements. Expenses net of all reductions represent the net expenses paid by the class but do not include expenses of the underlying funds in which the Fund invests.
I Amounts do not include the activity of the Underlying Funds.
J Annualized
K Amount represents less than $.005 per share.
L The portfolio turnover rate does not include the assets acquired in the merger.
See accompanying notes which are an integral part of the financial statements.
Fidelity Freedom 2005 Fund Class K
| | Six months ended (Unaudited) September 30, | Years endedMarch 31, |
| | 2018 | 2018 A |
| Selected Per–Share Data | | |
| Net asset value, beginning of period | $12.49 | $12.48 |
| Income from Investment Operations | | |
| Net investment income (loss)B | .10 | .21 |
| Net realized and unrealized gain (loss) | .05 | .15 |
| Total from investment operations | .15 | .36 |
| Distributions from net investment income | (.03) | (.16) |
| Distributions from net realized gain | (.19) | (.19) |
| Total distributions | (.22) | (.35) |
| Net asset value, end of period | $12.42 | $12.49 |
| Total ReturnC,D | 1.21% | 2.89% |
| Ratios to Average Net AssetsE,F | | |
| Expenses before reductions | .43%G | .44%G |
| Expenses net of fee waivers, if any | .43%G | .44%G |
| Expenses net of all reductions | .43%G | .44%G |
| Net investment income (loss) | 1.64%G | 2.37%G |
| Supplemental Data | | |
| Net assets, end of period (000 omitted) | $386,291 | $422,622 |
| Portfolio turnover rateF | 34%G | 23%H |
A For the period July 20, 2017 (commencement of sale of shares) to March 31, 2018.
B Calculated based on average shares outstanding during the period.
C Total returns for periods of less than one year are not annualized.
D Total returns would have been lower if certain expenses had not been reduced during the applicable periods shown.
E Expense ratios reflect operating expenses of the class. Expenses before reductions do not reflect amounts reimbursed by the investment adviser or reductions from expense offset arrangements and do not represent the amount paid by the class during periods when reimbursements or reductions occur. Expense ratios before reductions for start-up periods may not be representative of longer-term operating periods. Expenses net of fee waivers reflect expenses after reimbursement by the investment adviser but prior to reductions from expense offset arrangements. Expenses net of all reductions represent the net expenses paid by the class but do not include expenses of the underlying funds in which the Fund invests.
F Amounts do not include the activity of the Underlying Funds.
G Annualized
H The portfolio turnover rate does not include the assets acquired in the merger.
See accompanying notes which are an integral part of the financial statements.
Fidelity Freedom 2005 Fund Class K6
| | Six months ended (Unaudited) September 30, | Years endedMarch 31, |
| | 2018 | 2018 A |
| Selected Per–Share Data | | |
| Net asset value, beginning of period | $12.49 | $12.36 |
| Income from Investment Operations | | |
| Net investment income (loss)B | .10 | .20 |
| Net realized and unrealized gain (loss) | .07 | .29 |
| Total from investment operations | .17 | .49 |
| Distributions from net investment income | (.04) | (.16) |
| Distributions from net realized gain | (.19) | (.19) |
| Total distributions | (.23) | (.36)C |
| Net asset value, end of period | $12.43 | $12.49 |
| Total ReturnD,E | 1.34% | 3.92% |
| Ratios to Average Net AssetsF,G | | |
| Expenses before reductions | .37%H | .38%H |
| Expenses net of fee waivers, if any | .37%H | .38%H |
| Expenses net of all reductions | .37%H | .38%H |
| Net investment income (loss) | 1.69%H | 1.93%H |
| Supplemental Data | | |
| Net assets, end of period (000 omitted) | $30,026 | $9,983 |
| Portfolio turnover rateG | 34%H | 23%I |
A For the period June 7, 2017 (commencement of sale of shares) to March 31, 2018.
B Calculated based on average shares outstanding during the period.
C Total distributions of $.36 per share is comprised of distributions from net investment income of $.164 and distributions from net realized gain of $.192 per share.
D Total returns for periods of less than one year are not annualized.
E Total returns would have been lower if certain expenses had not been reduced during the applicable periods shown.
F Expense ratios reflect operating expenses of the class. Expenses before reductions do not reflect amounts reimbursed by the investment adviser or reductions from expense offset arrangements and do not represent the amount paid by the class during periods when reimbursements or reductions occur. Expense ratios before reductions for start-up periods may not be representative of longer-term operating periods. Expenses net of fee waivers reflect expenses after reimbursement by the investment adviser but prior to reductions from expense offset arrangements. Expenses net of all reductions represent the net expenses paid by the class but do not include expenses of the underlying funds in which the Fund invests.
G Amounts do not include the activity of the Underlying Funds.
H Annualized
I The portfolio turnover rate does not include the assets acquired in the merger.
See accompanying notes which are an integral part of the financial statements.
Fidelity Freedom® 2010 Fund
Investment Summary (Unaudited)
The information in the following tables is based on the direct investments of the Fund.
Top Holdings as of September 30, 2018
| | % of fund's net assets |
| Fidelity Series Investment Grade Bond Fund | 30.1 |
| Fidelity Series Government Money Market Fund 2.12% | 11.7 |
| Fidelity Series Inflation-Protected Bond Index Fund | 9.1 |
| Fidelity Series Long-Term Treasury Bond Index Fund | 4.8 |
| Fidelity Series Emerging Markets Opportunities Fund | 4.3 |
| Fidelity Series Intrinsic Opportunities Fund | 4.0 |
| Fidelity Series International Value Fund | 3.9 |
| Fidelity Series International Growth Fund | 3.9 |
| Fidelity Series Large Cap Stock Fund | 3.5 |
| Fidelity Series Growth Company Fund | 3.2 |
| | 78.5 |
Asset Allocation (% of fund's net assets)
| Period end |
| | Domestic Equity Funds | 24.3% |
| | International Equity Funds | 13.8% |
| | Bond Funds | 46.9% |
| | Short-Term Funds | 14.9% |
| | Short-Term Investments | 0.1% |

Domestic Equity Funds category includes Fidelity Series Commodity Strategy Fund which invests in commodity-related investments.
Fidelity Freedom® 2010 Fund
Schedule of Investments September 30, 2018 (Unaudited)
Showing Percentage of Net Assets
| U.S. Treasury Obligations - 0.1% | | | |
| | | Principal Amount | Value |
| U.S. Treasury Bills, yield at date of purchase 1.97% to 2.11% 11/1/18 to 12/6/18 (a) | | | |
| (Cost $4,309,407) | | 4,320,000 | 4,309,070 |
| | | Shares | Value |
|
| Domestic Equity Funds - 24.3% | | | |
| Fidelity Series All-Sector Equity Fund (b) | | 3,812,876 | $51,893,237 |
| Fidelity Series Blue Chip Growth Fund (b) | | 6,597,640 | 100,943,885 |
| Fidelity Series Commodity Strategy Fund (b) | | 24,645,939 | 123,229,693 |
| Fidelity Series Growth Company Fund (b) | | 10,020,378 | 202,511,830 |
| Fidelity Series Intrinsic Opportunities Fund (b) | | 13,428,098 | 246,137,030 |
| Fidelity Series Large Cap Stock Fund (b) | | 13,535,206 | 215,615,835 |
| Fidelity Series Large Cap Value Index Fund (b) | | 4,622,485 | 61,016,805 |
| Fidelity Series Opportunistic Insights Fund (b) | | 5,521,417 | 109,600,136 |
| Fidelity Series Small Cap Discovery Fund (b) | | 2,429,120 | 29,513,812 |
| Fidelity Series Small Cap Opportunities Fund (b) | | 6,027,343 | 88,541,674 |
| Fidelity Series Stock Selector Large Cap Value Fund (b) | | 12,356,692 | 163,355,472 |
| Fidelity Series Value Discovery Fund (b) | | 8,489,413 | 116,220,062 |
| TOTAL DOMESTIC EQUITY FUNDS | | | |
| (Cost $1,034,501,591) | | | 1,508,579,471 |
|
| International Equity Funds - 13.8% | | | |
| Fidelity Series Canada Fund (b) | | 2,237,101 | 24,183,067 |
| Fidelity Series Emerging Markets Fund (b) | | 2,676,477 | 25,935,067 |
| Fidelity Series Emerging Markets Opportunities Fund (b) | | 13,889,539 | 266,540,245 |
| Fidelity Series International Growth Fund (b) | | 14,717,387 | 241,365,148 |
| Fidelity Series International Small Cap Fund (b) | | 3,217,762 | 57,597,941 |
| Fidelity Series International Value Fund (b) | | 23,261,039 | 244,706,131 |
| TOTAL INTERNATIONAL EQUITY FUNDS | | | |
| (Cost $645,578,380) | | | 860,327,599 |
|
| Bond Funds - 46.9% | | | |
| Fidelity Series Emerging Markets Debt Fund (b) | | 4,671,644 | 44,520,764 |
| Fidelity Series Floating Rate High Income Fund (b) | | 1,560,283 | 14,853,890 |
| Fidelity Series High Income Fund (b) | | 8,986,621 | 86,361,428 |
| Fidelity Series Inflation-Protected Bond Index Fund (b) | | 57,872,983 | 561,946,665 |
| Fidelity Series International Credit Fund (b) | | 347,035 | 3,411,358 |
| Fidelity Series Investment Grade Bond Fund (b) | | 171,882,124 | 1,871,796,329 |
| Fidelity Series Long-Term Treasury Bond Index Fund (b) | | 36,342,844 | 299,465,037 |
| Fidelity Series Real Estate Income Fund (b) | | 2,720,658 | 29,328,693 |
| TOTAL BOND FUNDS | | | |
| (Cost $3,013,964,424) | | | 2,911,684,164 |
|
| Short-Term Funds - 14.9% | | | |
| Fidelity Cash Central Fund, 2.11% (c) | | 10,449,674 | 10,451,764 |
| Fidelity Series Government Money Market Fund 2.12% (b)(d) | | 725,083,274 | 725,083,274 |
| Fidelity Series Short-Term Credit Fund (b) | | 19,574,073 | 193,000,357 |
| TOTAL SHORT-TERM FUNDS | | | |
| (Cost $930,862,691) | | | 928,535,395 |
| TOTAL INVESTMENT IN SECURITIES - 100.0% | | | |
| (Cost $5,629,216,493) | | | 6,213,435,699 |
| NET OTHER ASSETS (LIABILITIES) - 0.0% | | | (2,837,036) |
| NET ASSETS - 100% | | | $6,210,598,663 |
| Futures Contracts | | | | | |
| | Number of contracts | Expiration Date | Notional Amount | Value | Unrealized Appreciation/(Depreciation) |
| Purchased | | | | | |
| Equity Index Contracts | | | | | |
| ICE E-mini MSCI EAFE Index Contracts (United States) | 170 | Dec. 2018 | $16,791,750 | $16,062 | $16,062 |
| ICE E-mini MSCI Emerging Markets Index Contracts (United States) | 690 | Dec. 2018 | 36,214,650 | 701,623 | 701,623 |
|
| TOTAL PURCHASED | | | | | 717,685 |
|
| Sold | | | | | |
| Equity Index Contracts | | | | | |
| CME E-mini S&P 500 Index Contracts (United States) | 373 | Dec. 2018 | 54,439,350 | (56,078) | (56,078) |
| TOTAL FUTURES CONTRACTS | | | | | $661,607 |
The notional amount of futures purchased as a percentage of Net Assets is 0.9%
The notional amount of futures sold as a percentage of Net Assets is 0.9%
Legend
(a) Security or a portion of the security was pledged to cover margin requirements for futures contracts. At period end, the value of securities pledged amounted to $3,246,959.
(b) Affiliated Fund
(c) Affiliated fund that is generally available only to investment companies and other accounts managed by Fidelity Investments. The rate quoted is the annualized seven-day yield of the fund at period end. A complete unaudited listing of the fund's holdings as of its most recent quarter end is available upon request. In addition, each Fidelity Central Fund's financial statements are available on the SEC's website or upon request.
(d) The rate quoted is the annualized seven-day yield of the fund at period end.
Affiliated Central Funds
Information regarding fiscal year to date income earned by the Fund from investments in Fidelity Central Funds is as follows:
| Fund | Income earned |
| Fidelity Cash Central Fund | $41,034 |
| Total | $41,034 |
Amounts in the income column in the above table include any capital gain distributions from underlying funds, which are presented in the corresponding line-item in the Statement of Operations if applicable.
Affiliated Underlying Funds
Fiscal year to date information regarding the Fund's investments in affiliated Underlying Funds, excluding any Money Market Central Funds, is presented below. Exchanges between classes of the same affiliated Underlying Funds may occur.
| Affiliate | Value, beginning of period | Purchases | Sales Proceeds | Dividend Income | Realized Gain (loss) | Change in Unrealized appreciation (depreciation) | Value, end of period |
| Fidelity Series 100 Index Fund | $54,376,498 | $2 | $56,567,080 | $-- | $23,146,601 | $(20,956,021) | $-- |
| Fidelity Series All-Sector Equity Fund | 104,338,689 | 142,565 | 63,245,555 | -- | 6,739,679 | 3,917,859 | 51,893,237 |
| Fidelity Series Blue Chip Growth Fund | 107,885,174 | 9,571,563 | 25,469,308 | 9,418,055 | 9,382,474 | (426,018) | 100,943,885 |
| Fidelity Series Canada Fund | 27,093,349 | 35,848 | 4,597,144 | -- | 80,354 | 1,570,660 | 24,183,067 |
| Fidelity Series Commodity Strategy Fund | 137,197,589 | 17,628,555 | 21,424,243 | 7,411,479 | (12,115,316) | 1,943,108 | 123,229,693 |
| Fidelity Series Emerging Markets Debt Fund | 48,296,926 | 1,438,936 | 2,591,766 | 1,387,040 | (109,787) | (2,513,545) | 44,520,764 |
| Fidelity Series Emerging Markets Fund | -- | 26,014,737 | -- | -- | -- | (79,670) | 25,935,067 |
| Fidelity Series Emerging Markets Opportunities Fund | 317,936,755 | 7,629,394 | 20,111,703 | -- | 2,800,779 | (41,714,980) | 266,540,245 |
| Fidelity Series Floating Rate High Income Fund | 15,446,698 | 425,382 | 1,033,012 | 403,743 | (42,046) | 56,868 | 14,853,890 |
| Fidelity Series Government Money Market Fund 2.12% | 939,655,611 | 101,925,082 | 316,497,419 | 8,361,044 | -- | -- | 725,083,274 |
| Fidelity Series Growth Company Fund | 223,906,115 | 299,703 | 53,389,773 | -- | 25,688,430 | 6,007,355 | 202,511,830 |
| Fidelity Series High Income Fund | 96,454,868 | 2,706,830 | 13,554,009 | 2,594,305 | (561,419) | 1,315,158 | 86,361,428 |
| Fidelity Series Inflation-Protected Bond Index Fund | 178,194,874 | 401,025,758 | 15,393,845 | 540,807 | (725,022) | (1,155,100) | 561,946,665 |
| Fidelity Series International Credit Fund | 3,431,541 | 42,292 | 27,952 | 42,290 | (375) | (34,148) | 3,411,358 |
| Fidelity Series International Growth Fund | 280,934,996 | 364,682 | 43,632,249 | -- | 14,316,017 | (10,618,298) | 241,365,148 |
| Fidelity Series International Small Cap Fund | 69,606,079 | 1,327,875 | 10,790,607 | -- | 3,208,646 | (5,754,052) | 57,597,941 |
| Fidelity Series International Value Fund | 276,230,918 | 364,680 | 30,540,985 | -- | 1,301,162 | (2,649,644) | 244,706,131 |
| Fidelity Series Intrinsic Opportunities Fund | 270,386,197 | 11,254,573 | 40,362,721 | 10,890,050 | 3,820,323 | 1,038,658 | 246,137,030 |
| Fidelity Series Investment Grade Bond Fund | 2,054,586,502 | 31,367,263 | 190,897,443 | 27,937,353 | (7,420,763) | (15,839,230) | 1,871,796,329 |
| Fidelity Series Large Cap Stock Fund | 237,596,786 | 14,375,642 | 47,469,959 | 14,042,007 | 5,646,648 | 5,466,718 | 215,615,835 |
| Fidelity Series Large Cap Value Index Fund | 67,588,086 | 91,972 | 11,119,800 | -- | 1,037,885 | 3,418,662 | 61,016,805 |
| Fidelity Series Long-Term Treasury Bond Index Fund | 140,751,002 | 187,086,796 | 17,807,500 | 2,801,879 | (514,079) | (10,051,182) | 299,465,037 |
| Fidelity Series Opportunistic Insights Fund | 118,254,820 | 162,955 | 23,557,539 | -- | 10,352,028 | 4,387,872 | 109,600,136 |
| Fidelity Series Real Estate Equity Fund | 20,792,626 | 142,266 | 21,515,609 | 117,176 | 3,933,001 | (3,352,284) | -- |
| Fidelity Series Real Estate Income Fund | 29,805,115 | 1,295,676 | 1,957,655 | 1,254,330 | 101,713 | 83,844 | 29,328,693 |
| Fidelity Series Short-Term Credit Fund | 230,191,316 | 2,867,077 | 40,055,309 | 2,546,712 | (564,132) | 561,405 | 193,000,357 |
| Fidelity Series Small Cap Discovery Fund | 32,169,764 | 1,928,944 | 4,176,144 | 1,883,849 | 405,377 | (814,129) | 29,513,812 |
| Fidelity Series Small Cap Opportunities Fund | 98,250,232 | 7,014,990 | 20,651,145 | 6,878,847 | 5,002,322 | (1,074,725) | 88,541,674 |
| Fidelity Series Stock Selector Large Cap Value Fund | 184,075,787 | 251,770 | 33,072,920 | -- | 7,257,308 | 4,843,527 | 163,355,472 |
| Fidelity Series Value Discovery Fund | 130,831,369 | 178,467 | 22,070,434 | -- | 5,600,160 | 1,680,500 | 116,220,062 |
| | $6,496,266,282 | $828,962,275 | $1,153,580,828 | $98,510,966 | $107,767,968 | $(80,740,832) | $6,198,674,865 |
Amounts in the income column in the above table include any capital gain distributions from underlying funds, which are presented in the corresponding line-item in the Statement of Operations if applicable.
Investment Valuation
The following is a summary of the inputs used, as of September 30, 2018, involving the Fund's assets and liabilities carried at fair value. The inputs or methodology used for valuing securities may not be an indication of the risk associated with investing in those securities. For more information on valuation inputs, and their aggregation into the levels used below, please refer to the Investment Valuation section in the accompanying Notes to Financial Statements.
| | Valuation Inputs at Reporting Date: |
| Description | Total | Level 1 | Level 2 | Level 3 |
| Investments in Securities: | | | | |
| Other Short-Term Investments | $4,309,070 | $-- | $4,309,070 | $-- |
| Domestic Equity Funds | 1,508,579,471 | 1,508,579,471 | -- | -- |
| International Equity Funds | 860,327,599 | 860,327,599 | -- | -- |
| Bond Funds | 2,911,684,164 | 2,911,684,164 | -- | -- |
| Short-Term Funds | 928,535,395 | 928,535,395 | -- | -- |
| Total Investments in Securities: | $6,213,435,699 | $6,209,126,629 | $4,309,070 | $-- |
| Derivative Instruments: | | | | |
| Assets | | | | |
| Futures Contracts | $717,685 | $717,685 | $-- | $-- |
| Total Assets | $717,685 | $717,685 | $-- | $-- |
| Liabilities | | | | |
| Futures Contracts | $(56,078) | $(56,078) | $-- | $-- |
| Total Liabilities | $(56,078) | $(56,078) | $-- | $-- |
| Total Derivative Instruments: | $661,607 | $661,607 | $-- | $-- |
Value of Derivative Instruments
The following table is a summary of the Fund's value of derivative instruments by primary risk exposure as of September 30, 2018. For additional information on derivative instruments, please refer to the Derivative Instruments section in the accompanying Notes to Financial Statements.
| Primary Risk Exposure / Derivative Type | Value |
| | Asset | Liability |
| Equity Risk | | |
| Futures Contracts(a) | $717,685 | $(56,078) |
| Total Equity Risk | 717,685 | (56,078) |
| Total Value of Derivatives | $717,685 | $(56,078) |
(a) Reflects gross cumulative appreciation (depreciation) on futures contracts as presented in the Schedule of Investments. In the Statement of Assets and Liabilities, the period end daily variation margin is included in receivable or payable for daily variation margin on futures contracts, and the net cumulative appreciation (depreciation) is included in net unrealized appreciation (depreciation).
See accompanying notes which are an integral part of the financial statements.
Fidelity Freedom® 2010 Fund
Financial Statements
Statement of Assets and Liabilities
| | | September 30, 2018 (Unaudited) |
| Assets | | |
Investment in securities, at value — See accompanying schedule:
Unaffiliated issuers (cost $4,309,407) | $4,309,070 | |
| Fidelity Central Funds (cost $10,451,764) | 10,451,764 | |
| Other affiliated issuers (cost $5,614,455,322) | 6,198,674,865 | |
| Total Investment in Securities (cost $5,629,216,493) | | $6,213,435,699 |
| Receivable for investments sold | | 25,395,869 |
| Receivable for fund shares sold | | 43,423,852 |
| Distributions receivable from Fidelity Central Funds | | 15,258 |
| Other receivables | | 93,931 |
| Total assets | | 6,282,364,609 |
| Liabilities | | |
| Payable for investments purchased | $23,412,225 | |
| Payable for fund shares redeemed | 45,312,623 | |
| Accrued management fee | 2,592,155 | |
| Payable for daily variation margin on futures contracts | 355,010 | |
| Other payables and accrued expenses | 93,933 | |
| Total liabilities | | 71,765,946 |
| Net Assets | | $6,210,598,663 |
| Net Assets consist of: | | |
| Paid in capital | | $5,453,599,612 |
| Undistributed net investment income | | 45,776,812 |
| Accumulated undistributed net realized gain (loss) on investments | | 126,341,426 |
| Net unrealized appreciation (depreciation) on investments | | 584,880,813 |
| Net Assets | | $6,210,598,663 |
| Fidelity Freedom 2010 Fund: | | |
| Net Asset Value, offering price and redemption price per share ($3,912,850,518 ÷ 246,545,650 shares) | | $15.87 |
| Class K: | | |
| Net Asset Value, offering price and redemption price per share ($2,141,312,975 ÷ 135,032,714 shares) | | $15.86 |
| Class K6: | | |
| Net Asset Value, offering price and redemption price per share ($156,435,170 ÷ 9,869,361 shares) | | $15.85 |
See accompanying notes which are an integral part of the financial statements.
Statement of Operations
| | | Six months ended September 30, 2018 (Unaudited) |
| Investment Income | | |
| Dividends: | | |
| Affiliated issuers | | $61,624,998 |
| Interest | | 17,873 |
| Income from Fidelity Central Funds | | 41,034 |
| Total income | | 61,683,905 |
| Expenses | | |
| Management fee | $15,920,645 | |
| Independent trustees' fees and expenses | 15,661 | |
| Total expenses before reductions | 15,936,306 | |
| Expense reductions | (38) | |
| Total expenses after reductions | | 15,936,268 |
| Net investment income (loss) | | 45,747,637 |
| Realized and Unrealized Gain (Loss) | | |
| Net realized gain (loss) on: | | |
| Investment securities: | | |
| Fidelity Central Funds | (160) | |
| Other affiliated issuers | 107,767,968 | |
| Futures contracts | (2,468,390) | |
| Capital gain distributions from underlying funds: | | |
| Affiliated issuers | 36,885,968 | |
| Total net realized gain (loss) | | 142,185,386 |
| Change in net unrealized appreciation (depreciation) on: | | |
| Investment securities: | | |
| Unaffiliated issuers | (308) | |
| Affiliated issuers | (80,740,832) | |
| Futures contracts | 661,607 | |
| Total change in net unrealized appreciation (depreciation) | | (80,079,533) |
| Net gain (loss) | | 62,105,853 |
| Net increase (decrease) in net assets resulting from operations | | $107,853,490 |
See accompanying notes which are an integral part of the financial statements.
Statement of Changes in Net Assets
| | Six months ended September 30, 2018 (Unaudited) | Year ended March 31, 2018 |
| Increase (Decrease) in Net Assets | | |
| Operations | | |
| Net investment income (loss) | $45,747,637 | $95,597,195 |
| Net realized gain (loss) | 142,185,386 | 280,325,462 |
| Change in net unrealized appreciation (depreciation) | (80,079,533) | 13,024,260 |
| Net increase (decrease) in net assets resulting from operations | 107,853,490 | 388,946,917 |
| Distributions to shareholders from net investment income | (13,644,925) | (93,275,651) |
| Distributions to shareholders from net realized gain | (139,801,282) | (192,908,815) |
| Total distributions | (153,446,207) | (286,184,466) |
| Share transactions - net increase (decrease) | (238,158,638) | 2,254,227,956 |
| Total increase (decrease) in net assets | (283,751,355) | 2,356,990,407 |
| Net Assets | | |
| Beginning of period | 6,494,350,018 | 4,137,359,611 |
| End of period | $6,210,598,663 | $6,494,350,018 |
| Other Information | | |
| Undistributed net investment income end of period | $45,776,812 | $13,674,100 |
See accompanying notes which are an integral part of the financial statements.
Financial Highlights
Fidelity Freedom 2010 Fund
| | Six months ended (Unaudited) September 30, | Years endedMarch 31, | | | | |
| | 2018 | 2018 | 2017 | 2016 | 2015 | 2014 |
| Selected Per–Share Data | | | | | | |
| Net asset value, beginning of period | $15.98 | $15.56 | $14.75 | $15.75 | $15.51 | $14.67 |
| Income from Investment Operations | | | | | | |
| Net investment income (loss)A | .11 | .24 | .26 | .28 | .28 | .22 |
| Net realized and unrealized gain (loss) | .16 | .95 | 1.08 | (.50) | .62 | .99 |
| Total from investment operations | .27 | 1.19 | 1.34 | (.22) | .90 | 1.21 |
| Distributions from net investment income | (.03) | (.23) | (.26) | (.29) | (.29) | (.21) |
| Distributions from net realized gain | (.35) | (.54) | (.26) | (.49) | (.36) | (.16) |
| Total distributions | (.38) | (.77) | (.53)B | (.78) | (.66)C | (.37) |
| Net asset value, end of period | $15.87 | $15.98 | $15.56 | $14.75 | $15.75 | $15.51 |
| Total ReturnD,E | 1.71% | 7.74% | 9.27% | (1.42)% | 5.91% | 8.31% |
| Ratios to Average Net AssetsF,G | | | | | | |
| Expenses before reductions | .52%H,I | .44% | - %J | - %J | - %J | - %J |
| Expenses net of fee waivers, if any | .52%H,I | .44% | -% | -% | -% | -% |
| Expenses net of all reductions | .52%H,I | .44% | -% | -% | -% | -% |
| Net investment income (loss) | 1.41%H | 1.47% | 1.69% | 1.86% | 1.81% | 1.43% |
| Supplemental Data | | | | | | |
| Net assets, end of period (000 omitted) | $3,912,851 | $4,038,370 | $4,137,360 | $4,271,151 | $4,940,590 | $5,419,921 |
| Portfolio turnover rateG | 26%H | 19%K | 23% | 17% | 18% | 35% |
A Calculated based on average shares outstanding during the period.
B Total distributions of $.53 per share is comprised of distributions from net investment income of $.262 and distributions from net realized gain of $.264 per share.
C Total distributions of $.66 per share is comprised of distributions from net investment income of $.294 and distributions from net realized gain of $.361 per share.
D Total returns for periods of less than one year are not annualized.
E Total returns would have been lower if certain expenses had not been reduced during the applicable periods shown.
F Expense ratios reflect operating expenses of the class. Expenses before reductions do not reflect amounts reimbursed by the investment adviser or reductions from expense offset arrangements and do not represent the amount paid by the class during periods when reimbursements or reductions occur. Expenses net of fee waivers reflect expenses after reimbursement by the investment adviser but prior to reductions from expense offset arrangements. Expenses net of all reductions represent the net expenses paid by the class but do not include expenses of the underlying funds in which the Fund invests.
G Amounts do not include the activity of the Underlying Funds.
H Annualized
I On certain classes, the size and fluctuation of net assets and expense amounts may cause ratios to differ from contractual rates.
J Amount represents less than .005%.
K The portfolio turnover rate does not include the assets acquired in the merger.
See accompanying notes which are an integral part of the financial statements.
Fidelity Freedom 2010 Fund Class K
| | Six months ended (Unaudited) September 30, | Years endedMarch 31, |
| | 2018 | 2018 A |
| Selected Per–Share Data | | |
| Net asset value, beginning of period | $15.97 | $15.96 |
| Income from Investment Operations | | |
| Net investment income (loss)B | .12 | .27 |
| Net realized and unrealized gain (loss) | .15 | .31 |
| Total from investment operations | .27 | .58 |
| Distributions from net investment income | (.04) | (.22) |
| Distributions from net realized gain | (.35) | (.35) |
| Total distributions | (.38)C | (.57) |
| Net asset value, end of period | $15.86 | $15.97 |
| Total ReturnD,E | 1.72% | 3.59% |
| Ratios to Average Net AssetsF,G | | |
| Expenses before reductions | .46%H | .47%H |
| Expenses net of fee waivers, if any | .46%H | .47%H |
| Expenses net of all reductions | .46%H | .47%H |
| Net investment income (loss) | 1.48%H | 2.42%H |
| Supplemental Data | | |
| Net assets, end of period (000 omitted) | $2,141,313 | $2,396,182 |
| Portfolio turnover rateG | 26%H | 19%I |
A For the period July 20, 2017 (commencement of sale of shares) to March 31, 2018.
B Calculated based on average shares outstanding during the period.
C Total distributions of $.38 per share is comprised of distributions from net investment income of $.035 and distributions from net realized gain of $.347 per share.
D Total returns for periods of less than one year are not annualized.
E Total returns would have been lower if certain expenses had not been reduced during the applicable periods shown.
F Expense ratios reflect operating expenses of the class. Expenses before reductions do not reflect amounts reimbursed by the investment adviser or reductions from expense offset arrangements and do not represent the amount paid by the class during periods when reimbursements or reductions occur. Expense ratios before reductions for start-up periods may not be representative of longer-term operating periods. Expenses net of fee waivers reflect expenses after reimbursement by the investment adviser but prior to reductions from expense offset arrangements. Expenses net of all reductions represent the net expenses paid by the class but do not include expenses of the underlying funds in which the Fund invests.
G Amounts do not include the activity of the Underlying Funds.
H Annualized
I The portfolio turnover rate does not include the assets acquired in the merger.
See accompanying notes which are an integral part of the financial statements.
Fidelity Freedom 2010 Fund Class K6
| | Six months ended (Unaudited) September 30, | Years endedMarch 31, |
| | 2018 | 2018 A |
| Selected Per–Share Data | | |
| Net asset value, beginning of period | $15.97 | $15.77 |
| Income from Investment Operations | | |
| Net investment income (loss)B | .12 | .27 |
| Net realized and unrealized gain (loss) | .15 | .50 |
| Total from investment operations | .27 | .77 |
| Distributions from net investment income | (.05) | (.22) |
| Distributions from net realized gain | (.35) | (.35) |
| Total distributions | (.39)C | (.57) |
| Net asset value, end of period | $15.85 | $15.97 |
| Total ReturnD,E | 1.72% | 4.89% |
| Ratios to Average Net AssetsF,G | | |
| Expenses before reductions | .39%H | .40%H |
| Expenses net of fee waivers, if any | .39%H | .40%H |
| Expenses net of all reductions | .39%H | .40%H |
| Net investment income (loss) | 1.54%H | 2.07%H |
| Supplemental Data | | |
| Net assets, end of period (000 omitted) | $156,435 | $59,797 |
| Portfolio turnover rateG | 26%H | 19%I |
A For the period June 7, 2017 (commencement of sale of shares) to March 31, 2018.
B Calculated based on average shares outstanding during the period.
C Total distributions of $.39 per share is comprised of distributions from net investment income of $.045 and distributions from net realized gain of $.347 per share.
D Total returns for periods of less than one year are not annualized.
E Total returns would have been lower if certain expenses had not been reduced during the applicable periods shown.
F Expense ratios reflect operating expenses of the class. Expenses before reductions do not reflect amounts reimbursed by the investment adviser or reductions from expense offset arrangements and do not represent the amount paid by the class during periods when reimbursements or reductions occur. Expense ratios before reductions for start-up periods may not be representative of longer-term operating periods. Expenses net of fee waivers reflect expenses after reimbursement by the investment adviser but prior to reductions from expense offset arrangements. Expenses net of all reductions represent the net expenses paid by the class but do not include expenses of the underlying funds in which the Fund invests.
G Amounts do not include the activity of the Underlying Funds.
H Annualized
I The portfolio turnover rate does not include the assets acquired in the merger.
See accompanying notes which are an integral part of the financial statements.
Fidelity Freedom® 2015 Fund
Investment Summary (Unaudited)
The information in the following tables is based on the direct investments of the Fund.
Top Holdings as of September 30, 2018
| | % of fund's net assets |
| Fidelity Series Investment Grade Bond Fund | 26.4 |
| Fidelity Series Government Money Market Fund 2.12% | 8.9 |
| Fidelity Series Inflation-Protected Bond Index Fund | 7.1 |
| Fidelity Series Intrinsic Opportunities Fund | 5.1 |
| Fidelity Series Emerging Markets Opportunities Fund | 5.0 |
| Fidelity Series Long-Term Treasury Bond Index Fund | 4.9 |
| Fidelity Series International Value Fund | 4.8 |
| Fidelity Series International Growth Fund | 4.8 |
| Fidelity Series Large Cap Stock Fund | 4.5 |
| Fidelity Series Growth Company Fund | 4.2 |
| | 75.7 |
Asset Allocation (% of fund's net assets)
| Period end |
| | Domestic Equity Funds | 30.8% |
| | International Equity Funds | 16.4% |
| | Bond Funds | 41.3% |
| | Short-Term Funds | 11.4% |
| | Short-Term Investments | 0.1% |
Domestic Equity Funds category includes Fidelity Series Commodity Strategy Fund which invests in commodity-related investments.
Fidelity Freedom® 2015 Fund
Schedule of Investments September 30, 2018 (Unaudited)
Showing Percentage of Net Assets
| U.S. Treasury Obligations - 0.1% | | | |
| | | Principal Amount | Value |
| U.S. Treasury Bills, yield at date of purchase 1.97% to 2.11% 11/1/18 to 12/6/18 (a) | | | |
| (Cost $6,963,454) | | 6,980,000 | 6,962,914 |
| | | Shares | Value |
|
| Domestic Equity Funds - 30.8% | | | |
| Fidelity Series All-Sector Equity Fund (b) | | 7,658,881 | $104,237,365 |
| Fidelity Series Blue Chip Growth Fund (b) | | 13,099,158 | 200,417,110 |
| Fidelity Series Commodity Strategy Fund (b) | | 38,185,260 | 190,926,300 |
| Fidelity Series Growth Company Fund (b) | | 19,881,835 | 401,811,889 |
| Fidelity Series Intrinsic Opportunities Fund (b) | | 26,628,510 | 488,100,596 |
| Fidelity Series Large Cap Stock Fund (b) | | 26,863,876 | 427,941,546 |
| Fidelity Series Large Cap Value Index Fund (b) | | 9,184,646 | 121,237,328 |
| Fidelity Series Opportunistic Insights Fund (b) | | 10,962,366 | 217,602,974 |
| Fidelity Series Small Cap Discovery Fund (b) | | 4,752,915 | 57,747,920 |
| Fidelity Series Small Cap Opportunities Fund (b) | | 11,968,751 | 175,820,954 |
| Fidelity Series Stock Selector Large Cap Value Fund (b) | | 24,529,834 | 324,284,401 |
| Fidelity Series Value Discovery Fund (b) | | 16,856,316 | 230,762,968 |
| TOTAL DOMESTIC EQUITY FUNDS | | | |
| (Cost $2,013,102,833) | | | 2,940,891,351 |
|
| International Equity Funds - 16.4% | | | |
| Fidelity Series Canada Fund (b) | | 4,212,192 | 45,533,790 |
| Fidelity Series Emerging Markets Fund (b) | | 2,124,534 | 20,586,736 |
| Fidelity Series Emerging Markets Opportunities Fund (b) | | 24,635,965 | 472,764,169 |
| Fidelity Series International Growth Fund (b) | | 27,776,770 | 455,539,033 |
| Fidelity Series International Small Cap Fund (b) | | 6,080,028 | 108,832,500 |
| Fidelity Series International Value Fund (b) | | 43,901,453 | 461,843,287 |
| TOTAL INTERNATIONAL EQUITY FUNDS | | | |
| (Cost $1,161,992,869) | | | 1,565,099,515 |
|
| Bond Funds - 41.3% | | | |
| Fidelity Series Emerging Markets Debt Fund (b) | | 6,862,234 | 65,397,088 |
| Fidelity Series Floating Rate High Income Fund (b) | | 2,348,381 | 22,356,586 |
| Fidelity Series High Income Fund (b) | | 14,013,876 | 134,673,346 |
| Fidelity Series Inflation-Protected Bond Index Fund (b) | | 69,490,388 | 674,751,670 |
| Fidelity Series International Credit Fund (b) | | 527,686 | 5,187,152 |
| Fidelity Series Investment Grade Bond Fund (b) | | 231,533,682 | 2,521,401,798 |
| Fidelity Series Long-Term Treasury Bond Index Fund (b) | | 56,905,913 | 468,904,720 |
| Fidelity Series Real Estate Income Fund (b) | | 4,047,514 | 43,632,202 |
| TOTAL BOND FUNDS | | | |
| (Cost $4,044,757,529) | | | 3,936,304,562 |
|
| Short-Term Funds - 11.4% | | | |
| Fidelity Cash Central Fund, 2.11% (c) | | 13,952,759 | 13,955,550 |
| Fidelity Series Government Money Market Fund 2.12% (b)(d) | | 843,781,001 | 843,781,001 |
| Fidelity Series Short-Term Credit Fund (b) | | 23,286,742 | 229,607,272 |
| TOTAL SHORT-TERM FUNDS | | | |
| (Cost $1,090,261,051) | | | 1,087,343,823 |
| TOTAL INVESTMENT IN SECURITIES - 100.0% | | | |
| (Cost $8,317,077,736) | | | 9,536,602,165 |
| NET OTHER ASSETS (LIABILITIES) - 0.0% | | | (4,222,720) |
| NET ASSETS - 100% | | | $9,532,379,445 |
| Futures Contracts | | | | | |
| | Number of contracts | Expiration Date | Notional Amount | Value | Unrealized Appreciation/(Depreciation) |
| Purchased | | | | | |
| Equity Index Contracts | | | | | |
| ICE E-mini MSCI Emerging Markets Index Contracts (United States) | 1,504 | Dec. 2018 | $78,937,440 | $1,452,217 | $1,452,217 |
| Sold | | | | | |
| Equity Index Contracts | | | | | |
| CME E-mini S&P 500 Index Contracts (United States) | 633 | Dec. 2018 | 92,386,350 | (110,178) | (110,178) |
| TOTAL FUTURES CONTRACTS | | | | | $1,342,039 |
The notional amount of futures purchased as a percentage of Net Assets is 0.8%
The notional amount of futures sold as a percentage of Net Assets is 1.0%
Legend
(a) Security or a portion of the security was pledged to cover margin requirements for futures contracts. At period end, the value of securities pledged amounted to $5,755,063.
(b) Affiliated Fund
(c) Affiliated fund that is generally available only to investment companies and other accounts managed by Fidelity Investments. The rate quoted is the annualized seven-day yield of the fund at period end. A complete unaudited listing of the fund's holdings as of its most recent quarter end is available upon request. In addition, each Fidelity Central Fund's financial statements are available on the SEC's website or upon request.
(d) The rate quoted is the annualized seven-day yield of the fund at period end.
Affiliated Central Funds
Information regarding fiscal year to date income earned by the Fund from investments in Fidelity Central Funds is as follows:
| Fund | Income earned |
| Fidelity Cash Central Fund | $56,713 |
| Total | $56,713 |
Amounts in the income column in the above table include any capital gain distributions from underlying funds, which are presented in the corresponding line-item in the Statement of Operations if applicable.
Affiliated Underlying Funds
Fiscal year to date information regarding the Fund's investments in affiliated Underlying Funds, excluding any Money Market Central Funds, is presented below. Exchanges between classes of the same affiliated Underlying Funds may occur.
| Affiliate | Value, beginning of period | Purchases | Sales Proceeds | Dividend Income | Realized Gain (loss) | Change in Unrealized appreciation (depreciation) | Value, end of period |
| Fidelity Series 100 Index Fund | $105,566,561 | $1 | $109,407,302 | $-- | $40,106,846 | $(36,266,106) | $-- |
| Fidelity Series All-Sector Equity Fund | 202,550,169 | 165,642 | 119,273,752 | -- | 17,821,865 | 2,973,441 | 104,237,365 |
| Fidelity Series Blue Chip Growth Fund | 209,424,941 | 18,861,866 | 44,822,850 | 18,683,697 | 16,415,893 | 537,260 | 200,417,110 |
| Fidelity Series Canada Fund | 50,695,921 | 44,480 | 8,302,451 | -- | 150,419 | 2,945,421 | 45,533,790 |
| Fidelity Series Commodity Strategy Fund | 214,500,126 | 26,473,497 | 34,262,949 | 11,474,253 | (14,531,977) | (1,252,397) | 190,926,300 |
| Fidelity Series Emerging Markets Debt Fund | 72,411,618 | 2,115,267 | 5,219,690 | 2,061,854 | (192,210) | (3,717,897) | 65,397,088 |
| Fidelity Series Emerging Markets Fund | -- | 20,647,008 | -- | -- | -- | (60,272) | 20,586,736 |
| Fidelity Series Emerging Markets Opportunities Fund | 567,323,168 | 19,277,116 | 44,269,796 | -- | 4,838,181 | (74,404,500) | 472,764,169 |
| Fidelity Series Floating Rate High Income Fund | 23,739,962 | 637,234 | 2,042,272 | 614,954 | (82,549) | 104,211 | 22,356,586 |
| Fidelity Series Government Money Market Fund 2.12% | 1,087,835,535 | 130,846,320 | 374,900,854 | 9,813,245 | -- | -- | 843,781,001 |
| Fidelity Series Growth Company Fund | 432,334,504 | 327,473 | 92,082,102 | -- | 42,975,194 | 18,256,820 | 401,811,889 |
| Fidelity Series High Income Fund | 148,415,499 | 4,173,453 | 19,083,941 | 4,057,611 | (765,770) | 1,934,105 | 134,673,346 |
| Fidelity Series Inflation-Protected Bond Index Fund | 199,093,014 | 500,074,055 | 21,995,353 | 632,749 | (549,352) | (1,870,694) | 674,751,670 |
| Fidelity Series International Credit Fund | 5,270,239 | 64,952 | 95,017 | 64,949 | (1,322) | (51,700) | 5,187,152 |
| Fidelity Series International Growth Fund | 522,861,176 | 447,505 | 74,893,359 | -- | 24,509,876 | (17,386,165) | 455,539,033 |
| Fidelity Series International Small Cap Fund | 130,259,302 | 2,410,977 | 19,170,077 | -- | 5,779,036 | (10,446,738) | 108,832,500 |
| Fidelity Series International Value Fund | 517,007,350 | 447,500 | 53,572,606 | -- | 3,710,775 | (5,749,732) | 461,843,287 |
| Fidelity Series Intrinsic Opportunities Fund | 526,008,710 | 21,994,978 | 69,121,942 | 21,592,356 | 6,511,770 | 2,707,080 | 488,100,596 |
| Fidelity Series Investment Grade Bond Fund | 2,839,330,215 | 40,597,523 | 326,746,479 | 38,121,432 | (14,687,457) | (17,092,004) | 2,521,401,798 |
| Fidelity Series Large Cap Stock Fund | 468,089,078 | 27,655,756 | 89,839,128 | 27,279,056 | 6,297,421 | 15,738,419 | 427,941,546 |
| Fidelity Series Large Cap Value Index Fund | 131,206,403 | 101,894 | 18,797,821 | -- | 2,088,173 | 6,638,679 | 121,237,328 |
| Fidelity Series Long-Term Treasury Bond Index Fund | 222,582,675 | 287,217,527 | 24,286,590 | 4,814,374 | (548,000) | (16,060,892) | 468,904,720 |
| Fidelity Series Opportunistic Insights Fund | 229,538,880 | 178,725 | 40,742,237 | -- | 16,518,077 | 12,109,529 | 217,602,974 |
| Fidelity Series Real Estate Equity Fund | 40,229,865 | 286,682 | 41,604,622 | 251,884 | 6,843,030 | (5,754,955) | -- |
| Fidelity Series Real Estate Income Fund | 45,268,860 | 1,945,253 | 3,877,160 | 1,878,975 | 225,064 | 70,185 | 43,632,202 |
| Fidelity Series Short-Term Credit Fund | 266,092,890 | 3,150,871 | 39,632,397 | 2,916,475 | (544,484) | 540,392 | 229,607,272 |
| Fidelity Series Small Cap Discovery Fund | 62,450,884 | 3,708,234 | 7,624,147 | 3,648,644 | 713,232 | (1,500,283) | 57,747,920 |
| Fidelity Series Small Cap Opportunities Fund | 190,744,879 | 13,804,967 | 36,025,212 | 13,648,437 | 8,560,808 | (1,264,488) | 175,820,954 |
| Fidelity Series Stock Selector Large Cap Value Fund | 357,360,316 | 278,813 | 56,973,360 | -- | 11,923,124 | 11,695,508 | 324,284,401 |
| Fidelity Series Value Discovery Fund | 253,985,129 | 197,475 | 37,652,579 | -- | 9,584,673 | 4,648,270 | 230,762,968 |
| | $10,122,177,869 | $1,128,133,044 | $1,816,318,045 | $161,554,945 | $193,670,336 | $(111,979,503) | $9,515,683,701 |
Amounts in the income column in the above table include any capital gain distributions from underlying funds, which are presented in the corresponding line-item in the Statement of Operations if applicable.
Investment Valuation
The following is a summary of the inputs used, as of September 30, 2018, involving the Fund's assets and liabilities carried at fair value. The inputs or methodology used for valuing securities may not be an indication of the risk associated with investing in those securities. For more information on valuation inputs, and their aggregation into the levels used below, please refer to the Investment Valuation section in the accompanying Notes to Financial Statements.
| | Valuation Inputs at Reporting Date: |
| Description | Total | Level 1 | Level 2 | Level 3 |
| Investments in Securities: | | | | |
| Other Short-Term Investments | $6,962,914 | $-- | $6,962,914 | $-- |
| Domestic Equity Funds | 2,940,891,351 | 2,940,891,351 | -- | -- |
| International Equity Funds | 1,565,099,515 | 1,565,099,515 | -- | -- |
| Bond Funds | 3,936,304,562 | 3,936,304,562 | -- | -- |
| Short-Term Funds | 1,087,343,823 | 1,087,343,823 | -- | -- |
| Total Investments in Securities: | $9,536,602,165 | $9,529,639,251 | $6,962,914 | $-- |
| Derivative Instruments: | | | | |
| Assets | | | | |
| Futures Contracts | $1,452,217 | $1,452,217 | $-- | $-- |
| Total Assets | $1,452,217 | $1,452,217 | $-- | $-- |
| Liabilities | | | | |
| Futures Contracts | $(110,178) | $(110,178) | $-- | $-- |
| Total Liabilities | $(110,178) | $(110,178) | $-- | $-- |
| Total Derivative Instruments: | $1,342,039 | $1,342,039 | $-- | $-- |
Value of Derivative Instruments
The following table is a summary of the Fund's value of derivative instruments by primary risk exposure as of September 30, 2018. For additional information on derivative instruments, please refer to the Derivative Instruments section in the accompanying Notes to Financial Statements.
| Primary Risk Exposure / Derivative Type | Value |
| | Asset | Liability |
| Equity Risk | | |
| Futures Contracts(a) | $1,452,217 | $(110,178) |
| Total Equity Risk | 1,452,217 | (110,178) |
| Total Value of Derivatives | $1,452,217 | $(110,178) |
(a) Reflects gross cumulative appreciation (depreciation) on futures contracts as presented in the Schedule of Investments. In the Statement of Assets and Liabilities, the period end daily variation margin is included in receivable or payable for daily variation margin on futures contracts, and the net cumulative appreciation (depreciation) is included in net unrealized appreciation (depreciation).
See accompanying notes which are an integral part of the financial statements.
Fidelity Freedom® 2015 Fund
Financial Statements
Statement of Assets and Liabilities
| | | September 30, 2018 (Unaudited) |
| Assets | | |
Investment in securities, at value — See accompanying schedule:
Unaffiliated issuers (cost $6,963,454) | $6,962,914 | |
| Fidelity Central Funds (cost $13,955,550) | 13,955,550 | |
| Other affiliated issuers (cost $8,296,158,732) | 9,515,683,701 | |
| Total Investment in Securities (cost $8,317,077,736) | | $9,536,602,165 |
| Receivable for investments sold | | 19,451,157 |
| Receivable for fund shares sold | | 151,139,181 |
| Distributions receivable from Fidelity Central Funds | | 20,143 |
| Total assets | | 9,707,212,646 |
| Liabilities | | |
| Payable for investments purchased | $15,312,677 | |
| Payable for fund shares redeemed | 154,742,851 | |
| Accrued management fee | 4,235,571 | |
| Payable for daily variation margin on futures contracts | 542,102 | |
| Total liabilities | | 174,833,201 |
| Net Assets | | $9,532,379,445 |
| Net Assets consist of: | | |
| Paid in capital | | $8,004,819,143 |
| Undistributed net investment income | | 62,789,082 |
| Accumulated undistributed net realized gain (loss) on investments | | 243,904,752 |
| Net unrealized appreciation (depreciation) on investments | | 1,220,866,468 |
| Net Assets | | $9,532,379,445 |
| Fidelity Freedom 2015 Fund: | | |
| Net Asset Value, offering price and redemption price per share ($5,221,028,753 ÷ 393,516,799 shares) | | $13.27 |
| Class K: | | |
| Net Asset Value, offering price and redemption price per share ($3,944,021,176 ÷ 297,621,143 shares) | | $13.25 |
| Class K6: | | |
| Net Asset Value, offering price and redemption price per share ($367,329,516 ÷ 27,706,572 shares) | | $13.26 |
See accompanying notes which are an integral part of the financial statements.
Statement of Operations
| | | Six months ended September 30, 2018 (Unaudited) |
| Investment Income | | |
| Dividends: | | |
| Affiliated issuers | | $89,189,405 |
| Interest | | 27,693 |
| Income from Fidelity Central Funds | | 56,713 |
| Total income | | 89,273,811 |
| Expenses | | |
| Management fee | $26,301,567 | |
| Independent trustees' fees and expenses | 24,338 | |
| Total expenses before reductions | 26,325,905 | |
| Expense reductions | (55) | |
| Total expenses after reductions | | 26,325,850 |
| Net investment income (loss) | | 62,947,961 |
| Realized and Unrealized Gain (Loss) | | |
| Net realized gain (loss) on: | | |
| Investment securities: | | |
| Fidelity Central Funds | (192) | |
| Other affiliated issuers | 193,670,336 | |
| Futures contracts | (4,911,076) | |
| Capital gain distributions from underlying funds: | | |
| Affiliated issuers | 72,365,540 | |
| Total net realized gain (loss) | | 261,124,608 |
| Change in net unrealized appreciation (depreciation) on: | | |
| Investment securities: | | |
| Unaffiliated issuers | (496) | |
| Affiliated issuers | (111,979,503) | |
| Futures contracts | 1,342,039 | |
| Total change in net unrealized appreciation (depreciation) | | (110,637,960) |
| Net gain (loss) | | 150,486,648 |
| Net increase (decrease) in net assets resulting from operations | | $213,434,609 |
See accompanying notes which are an integral part of the financial statements.
Statement of Changes in Net Assets
| | Six months ended September 30, 2018 (Unaudited) | Year ended March 31, 2018 |
| Increase (Decrease) in Net Assets | | |
| Operations | | |
| Net investment income (loss) | $62,947,961 | $141,540,775 |
| Net realized gain (loss) | 261,124,608 | 463,661,846 |
| Change in net unrealized appreciation (depreciation) | (110,637,960) | 46,350,154 |
| Net increase (decrease) in net assets resulting from operations | 213,434,609 | 651,552,775 |
| Distributions to shareholders from net investment income | (16,218,290) | (138,935,375) |
| Distributions to shareholders from net realized gain | (243,245,554) | (291,414,799) |
| Total distributions | (259,463,844) | (430,350,174) |
| Share transactions - net increase (decrease) | (540,504,439) | 4,570,397,075 |
| Total increase (decrease) in net assets | (586,533,674) | 4,791,599,676 |
| Net Assets | | |
| Beginning of period | 10,118,913,119 | 5,327,313,443 |
| End of period | $9,532,379,445 | $10,118,913,119 |
| Other Information | | |
| Undistributed net investment income end of period | $62,789,082 | $16,059,411 |
See accompanying notes which are an integral part of the financial statements.
Financial Highlights
Fidelity Freedom 2015 Fund
| | Six months ended (Unaudited) September 30, | Years endedMarch 31, | | | | |
| | 2018 | 2018 | 2017 | 2016 | 2015 | 2014 |
| Selected Per–Share Data | | | | | | |
| Net asset value, beginning of period | $13.33 | $12.82 | $12.03 | $12.92 | $12.91 | $12.28 |
| Income from Investment Operations | | | | | | |
| Net investment income (loss)A | .08 | .19 | .21 | .23 | .23 | .18 |
| Net realized and unrealized gain (loss) | .21 | .97 | 1.04 | (.46) | .57 | .91 |
| Total from investment operations | .29 | 1.16 | 1.25 | (.23) | .80 | 1.09 |
| Distributions from net investment income | (.02) | (.19) | (.21) | (.23) | (.25) | (.18) |
| Distributions from net realized gain | (.32) | (.46) | (.24) | (.43) | (.54) | (.28) |
| Total distributions | (.35)B | (.65) | (.46)C | (.66) | (.79) | (.46) |
| Net asset value, end of period | $13.27 | $13.33 | $12.82 | $12.03 | $12.92 | $12.91 |
| Total ReturnD,E | 2.16% | 9.15% | 10.63% | (1.83)% | 6.42% | 8.95% |
| Ratios to Average Net AssetsF,G | | | | | | |
| Expenses before reductions | .57%H | .48% | - %I | - %I | - %I | - %I |
| Expenses net of fee waivers, if any | .57%H | .48% | -% | -% | -% | -% |
| Expenses net of all reductions | .57%H | .48% | -% | -% | -% | -% |
| Net investment income (loss) | 1.24%H | 1.40% | 1.69% | 1.87% | 1.83% | 1.47% |
| Supplemental Data | | | | | | |
| Net assets, end of period (000 omitted) | $5,221,029 | $5,380,580 | $5,327,313 | $5,354,142 | $6,056,161 | $6,388,485 |
| Portfolio turnover rateG | 23%H | 23%J | 21% | 17% | 18% | 39% |
A Calculated based on average shares outstanding during the period.
B Total distributions of $.35 per share is comprised of distributions from net investment income of $.021 and distributions from net realized gain of $.324 per share.
C Total distributions of $.46 per share is comprised of distributions from net investment income of $.214 and distributions from net realized gain of $.243 per share.
D Total returns for periods of less than one year are not annualized.
E Total returns would have been lower if certain expenses had not been reduced during the applicable periods shown.
F Expense ratios reflect operating expenses of the class. Expenses before reductions do not reflect amounts reimbursed by the investment adviser or reductions from expense offset arrangements and do not represent the amount paid by the class during periods when reimbursements or reductions occur. Expenses net of fee waivers reflect expenses after reimbursement by the investment adviser but prior to reductions from expense offset arrangements. Expenses net of all reductions represent the net expenses paid by the class but do not include expenses of the underlying funds in which the Fund invests.
G Amounts do not include the activity of the Underlying Funds.
H Annualized
I Amount represents less than $.005 per share.
J The portfolio turnover rate does not include the assets acquired in the merger.
See accompanying notes which are an integral part of the financial statements.
Fidelity Freedom 2015 Fund Class K
| | Six months ended (Unaudited) September 30, | Years endedMarch 31, |
| | 2018 | 2018 A |
| Selected Per–Share Data | | |
| Net asset value, beginning of period | $13.31 | $13.21 |
| Income from Investment Operations | | |
| Net investment income (loss)B | .09 | .22 |
| Net realized and unrealized gain (loss) | .20 | .34 |
| Total from investment operations | .29 | .56 |
| Distributions from net investment income | (.02) | (.18) |
| Distributions from net realized gain | (.32) | (.29) |
| Total distributions | (.35)C | (.46)D |
| Net asset value, end of period | $13.25 | $13.31 |
| Total ReturnE,F | 2.17% | 4.25% |
| Ratios to Average Net AssetsG,H | | |
| Expenses before reductions | .50%I | .51%I,J |
| Expenses net of fee waivers, if any | .50%I | .51%I,J |
| Expenses net of all reductions | .50%I | .51%I,J |
| Net investment income (loss) | 1.31%I | 2.39%I |
| Supplemental Data | | |
| Net assets, end of period (000 omitted) | $3,944,021 | $4,624,065 |
| Portfolio turnover rateH | 23%I | 23%K |
A For the period July 20, 2017 (commencement of sale of shares) to March 31, 2018.
B Calculated based on average shares outstanding during the period.
C Total distributions of $.35 per share is comprised of distributions from net investment income of $.022 and distributions from net realized gain of $.324 per share.
D Total distributions of $.46 per share is comprised of distributions from net investment income of $.176 and distributions from net realized gain of $.288 per share.
E Total returns for periods of less than one year are not annualized.
F Total returns would have been lower if certain expenses had not been reduced during the applicable periods shown.
G Expense ratios reflect operating expenses of the class. Expenses before reductions do not reflect amounts reimbursed by the investment adviser or reductions from expense offset arrangements and do not represent the amount paid by the class during periods when reimbursements or reductions occur. Expense ratios before reductions for start-up periods may not be representative of longer-term operating periods. Expenses net of fee waivers reflect expenses after reimbursement by the investment adviser but prior to reductions from expense offset arrangements. Expenses net of all reductions represent the net expenses paid by the class but do not include expenses of the underlying funds in which the Fund invests.
H Amounts do not include the activity of the Underlying Funds.
I Annualized
J On certain classes, the size and fluctuation of net assets and expense amounts may cause ratios to differ from contractual rates.
K The portfolio turnover rate does not include the assets acquired in the merger.
See accompanying notes which are an integral part of the financial statements.
Fidelity Freedom 2015 Fund Class K6
| | Six months ended (Unaudited) September 30, | Years endedMarch 31, |
| | 2018 | 2018 A |
| Selected Per–Share Data | | |
| Net asset value, beginning of period | $13.32 | $13.03 |
| Income from Investment Operations | | |
| Net investment income (loss)B | .09 | .21 |
| Net realized and unrealized gain (loss) | .21 | .55 |
| Total from investment operations | .30 | .76 |
| Distributions from net investment income | (.03) | (.18) |
| Distributions from net realized gain | (.32) | (.29) |
| Total distributions | (.36)C | (.47) |
| Net asset value, end of period | $13.26 | $13.32 |
| Total ReturnD,E | 2.24% | 5.80% |
| Ratios to Average Net AssetsF,G | | |
| Expenses before reductions | .41%H | .42%H |
| Expenses net of fee waivers, if any | .41%H | .42%H |
| Expenses net of all reductions | .41%H | .42%H |
| Net investment income (loss) | 1.40%H | 1.88%H |
| Supplemental Data | | |
| Net assets, end of period (000 omitted) | $367,330 | $114,268 |
| Portfolio turnover rateG | 23%H | 23%I |
A For the period June 7, 2017 (commencement of sale of shares) to March 31, 2018.
B Calculated based on average shares outstanding during the period.
C Total distributions of $.36 per share is comprised of distributions from net investment income of $.031 and distributions from net realized gain of $.324 per share.
D Total returns for periods of less than one year are not annualized.
E Total returns would have been lower if certain expenses had not been reduced during the applicable periods shown.
F Expense ratios reflect operating expenses of the class. Expenses before reductions do not reflect amounts reimbursed by the investment adviser or reductions from expense offset arrangements and do not represent the amount paid by the class during periods when reimbursements or reductions occur. Expense ratios before reductions for start-up periods may not be representative of longer-term operating periods. Expenses net of fee waivers reflect expenses after reimbursement by the investment adviser but prior to reductions from expense offset arrangements. Expenses net of all reductions represent the net expenses paid by the class but do not include expenses of the underlying funds in which the Fund invests.
G Amounts do not include the activity of the Underlying Funds.
H Annualized
I The portfolio turnover rate does not include the assets acquired in the merger.
See accompanying notes which are an integral part of the financial statements.
Fidelity Freedom® 2020 Fund
Investment Summary (Unaudited)
The information in the following tables is based on the direct investments of the Fund.
Top Holdings as of September 30, 2018
| | % of fund's net assets |
| Fidelity Series Investment Grade Bond Fund | 23.4 |
| Fidelity Series Government Money Market Fund 2.12% | 6.7 |
| Fidelity Series Intrinsic Opportunities Fund | 6.0 |
| Fidelity Series Emerging Markets Opportunities Fund | 5.6 |
| Fidelity Series International Value Fund | 5.6 |
| Fidelity Series International Growth Fund | 5.5 |
| Fidelity Series Large Cap Stock Fund | 5.3 |
| Fidelity Series Inflation-Protected Bond Index Fund | 5.2 |
| Fidelity Series Long-Term Treasury Bond Index Fund | 5.0 |
| Fidelity Series Growth Company Fund | 5.0 |
| | 73.3 |
Asset Allocation (% of fund's net assets)
| Period end |
| | Domestic Equity Funds | 36.0% |
| | International Equity Funds | 18.8% |
| | Bond Funds | 36.5% |
| | Short-Term Funds | 8.7% |
| | Short-Term Investments | 0.1% |
| | Net Other Assets (Liabilities)* | (0.1)% |

* Net Other Assets (Liabilities) are not included in the pie chart
Domestic Equity Funds category includes Fidelity Series Commodity Strategy Fund which invests in commodity-related investments.
Fidelity Freedom® 2020 Fund
Schedule of Investments September 30, 2018 (Unaudited)
Showing Percentage of Net Assets
| U.S. Treasury Obligations - 0.1% | | | |
| | | Principal Amount | Value |
| U.S. Treasury Bills, yield at date of purchase 1.97% to 2.11% 11/1/18 to 12/6/18 (a) | | | |
| (Cost $20,684,518) | | 20,740,000 | 20,682,973 |
| | | Shares | Value |
|
| Domestic Equity Funds - 36.0% | | | |
| Fidelity Series All-Sector Equity Fund (b) | | 27,901,675 | $379,741,798 |
| Fidelity Series Blue Chip Growth Fund (b) | | 47,180,854 | 721,867,065 |
| Fidelity Series Commodity Strategy Fund (b) | | 115,360,190 | 576,800,948 |
| Fidelity Series Growth Company Fund (b) | | 71,744,072 | 1,449,947,705 |
| Fidelity Series Intrinsic Opportunities Fund (b) | | 95,774,150 | 1,755,540,176 |
| Fidelity Series Large Cap Stock Fund (b) | | 96,968,323 | 1,544,705,386 |
| Fidelity Series Large Cap Value Index Fund (b) | | 33,002,026 | 435,626,739 |
| Fidelity Series Opportunistic Insights Fund (b) | | 39,499,537 | 784,065,805 |
| Fidelity Series Small Cap Discovery Fund (b) | | 16,912,504 | 205,486,924 |
| Fidelity Series Small Cap Opportunities Fund (b) | | 43,090,956 | 633,006,149 |
| Fidelity Series Stock Selector Large Cap Value Fund (b) | | 88,498,465 | 1,169,949,712 |
| Fidelity Series Value Discovery Fund (b) | | 60,755,485 | 831,742,593 |
| TOTAL DOMESTIC EQUITY FUNDS | | | |
| (Cost $7,381,363,828) | | | 10,488,481,000 |
|
| International Equity Funds - 18.8% | | | |
| Fidelity Series Canada Fund (b) | | 15,702,480 | 169,743,805 |
| Fidelity Series Emerging Markets Fund (b) | | 4,980,307 | 48,259,173 |
| Fidelity Series Emerging Markets Opportunities Fund (b) | | 85,388,757 | 1,638,610,256 |
| Fidelity Series International Growth Fund (b) | | 97,581,000 | 1,600,328,399 |
| Fidelity Series International Small Cap Fund (b) | | 21,324,242 | 381,703,938 |
| Fidelity Series International Value Fund (b) | | 154,295,465 | 1,623,188,288 |
| TOTAL INTERNATIONAL EQUITY FUNDS | | | |
| (Cost $4,160,105,513) | | | 5,461,833,859 |
|
| Bond Funds - 36.5% | | | |
| Fidelity Series Emerging Markets Debt Fund (b) | | 20,245,743 | 192,941,935 |
| Fidelity Series Floating Rate High Income Fund (b) | | 7,073,863 | 67,343,177 |
| Fidelity Series High Income Fund (b) | | 43,144,010 | 414,613,939 |
| Fidelity Series Inflation-Protected Bond Index Fund (b) | | 155,310,033 | 1,508,060,418 |
| Fidelity Series International Credit Fund (b) | | 1,792,036 | 17,615,710 |
| Fidelity Series Investment Grade Bond Fund (b) | | 625,929,878 | 6,816,376,369 |
| Fidelity Series Long-Term Treasury Bond Index Fund (b) | | 177,442,343 | 1,462,124,903 |
| Fidelity Series Real Estate Income Fund (b) | | 12,447,953 | 134,188,936 |
| TOTAL BOND FUNDS | | | |
| (Cost $10,980,191,105) | | | 10,613,265,387 |
|
| Short-Term Funds - 8.7% | | | |
| Fidelity Cash Central Fund, 2.11% (c) | | 42,140,236 | 42,148,664 |
| Fidelity Series Government Money Market Fund 2.12% (b)(d) | | 1,944,540,655 | 1,944,540,655 |
| Fidelity Series Short-Term Credit Fund (b) | | 55,059,947 | 542,891,082 |
| TOTAL SHORT-TERM FUNDS | | | |
| (Cost $2,536,671,980) | | | 2,529,580,401 |
| TOTAL INVESTMENT IN SECURITIES - 100.1% | | | |
| (Cost $25,079,016,944) | | | 29,113,843,620 |
| NET OTHER ASSETS (LIABILITIES) - (0.1)% | | | (14,640,031) |
| NET ASSETS - 100% | | | $29,099,203,589 |
| Futures Contracts | | | | | |
| | Number of contracts | Expiration Date | Notional Amount | Value | Unrealized Appreciation/(Depreciation) |
| Purchased | | | | | |
| Equity Index Contracts | | | | | |
| ICE E-mini MSCI Emerging Markets Index Contracts (United States) | 4,535 | Dec. 2018 | $238,019,475 | $4,376,008 | $4,376,008 |
| Sold | | | | | |
| Equity Index Contracts | | | | | |
| CME E-mini S&P 500 Index Contracts (United States) | 1,796 | Dec. 2018 | 262,126,200 | (307,900) | (307,900) |
| TOTAL FUTURES CONTRACTS | | | | | $4,068,108 |
The notional amount of futures purchased as a percentage of Net Assets is 0.8%
The notional amount of futures sold as a percentage of Net Assets is 0.9%
Legend
(a) Security or a portion of the security was pledged to cover margin requirements for futures contracts. At period end, the value of securities pledged amounted to $17,053,430.
(b) Affiliated Fund
(c) Affiliated fund that is generally available only to investment companies and other accounts managed by Fidelity Investments. The rate quoted is the annualized seven-day yield of the fund at period end. A complete unaudited listing of the fund's holdings as of its most recent quarter end is available upon request. In addition, each Fidelity Central Fund's financial statements are available on the SEC's website or upon request.
(d) The rate quoted is the annualized seven-day yield of the fund at period end.
Affiliated Central Funds
Information regarding fiscal year to date income earned by the Fund from investments in Fidelity Central Funds is as follows:
| Fund | Income earned |
| Fidelity Cash Central Fund | $162,964 |
| Total | $162,964 |
Amounts in the income column in the above table include any capital gain distributions from underlying funds, which are presented in the corresponding line-item in the Statement of Operations if applicable.
Affiliated Underlying Funds
Fiscal year to date information regarding the Fund's investments in affiliated Underlying Funds, excluding any Money Market Central Funds, is presented below. Exchanges between classes of the same affiliated Underlying Funds may occur.
| Affiliate | Value, beginning of period | Purchases | Sales Proceeds | Dividend Income | Realized Gain (loss) | Change in Unrealized appreciation (depreciation) | Value, end of period |
| Fidelity Series 100 Index Fund | $360,400,417 | $18 | $373,452,465 | $-- | $134,660,262 | $(121,608,232) | $-- |
| Fidelity Series All-Sector Equity Fund | 691,515,664 | 5,912,990 | 390,346,648 | -- | 47,833,809 | 24,825,983 | 379,741,798 |
| Fidelity Series Blue Chip Growth Fund | 714,854,503 | 73,434,189 | 123,409,663 | 67,214,282 | 43,462,382 | 13,525,654 | 721,867,065 |
| Fidelity Series Canada Fund | 169,349,670 | 648,026 | 10,636,089 | -- | 129,982 | 10,252,216 | 169,743,805 |
| Fidelity Series Commodity Strategy Fund | 638,248,050 | 78,993,185 | 92,859,241 | 34,628,683 | (45,876,779) | (1,704,267) | 576,800,948 |
| Fidelity Series Emerging Markets Debt Fund | 209,218,641 | 6,706,916 | 11,624,759 | 6,022,733 | (499,589) | (10,859,274) | 192,941,935 |
| Fidelity Series Emerging Markets Fund | -- | 48,402,903 | -- | -- | -- | (143,730) | 48,259,173 |
| Fidelity Series Emerging Markets Opportunities Fund | 1,848,959,268 | 123,491,002 | 102,599,769 | -- | (746,065) | (230,494,180) | 1,638,610,256 |
| Fidelity Series Floating Rate High Income Fund | 69,635,549 | 2,114,433 | 4,473,612 | 1,829,305 | (122,884) | 189,691 | 67,343,177 |
| Fidelity Series Government Money Market Fund 2.12% | 2,454,122,385 | 321,786,452 | 831,368,182 | 22,641,479 | -- | -- | 1,944,540,655 |
| Fidelity Series Growth Company Fund | 1,469,022,731 | 5,359,767 | 237,023,800 | -- | 93,373,769 | 119,215,238 | 1,449,947,705 |
| Fidelity Series High Income Fund | 434,030,687 | 13,681,073 | 36,622,814 | 12,260,125 | (1,265,562) | 4,790,555 | 414,613,939 |
| Fidelity Series Inflation-Protected Bond Index Fund | 347,776,727 | 1,194,769,059 | 28,339,402 | 1,379,976 | (648,563) | (5,497,403) | 1,508,060,418 |
| Fidelity Series International Credit Fund | 17,926,241 | 220,920 | 351,103 | 220,920 | (4,832) | (175,516) | 17,615,710 |
| Fidelity Series International Growth Fund | 1,737,696,795 | 6,165,398 | 168,803,959 | -- | 43,054,241 | (17,784,076) | 1,600,328,399 |
| Fidelity Series International Small Cap Fund | 434,859,065 | 12,224,124 | 49,635,188 | -- | 9,108,149 | (24,852,212) | 381,703,938 |
| Fidelity Series International Value Fund | 1,726,630,081 | 6,581,315 | 104,401,927 | -- | 3,185,545 | (8,806,726) | 1,623,188,288 |
| Fidelity Series Intrinsic Opportunities Fund | 1,772,722,653 | 84,228,130 | 130,872,669 | 77,651,229 | 11,980,201 | 17,481,861 | 1,755,540,176 |
| Fidelity Series Investment Grade Bond Fund | 7,589,645,384 | 130,699,952 | 818,830,011 | 102,923,588 | (43,165,455) | (41,973,501) | 6,816,376,369 |
| Fidelity Series Large Cap Stock Fund | 1,614,989,603 | 102,266,670 | 248,681,205 | 96,277,444 | 10,554,794 | 65,575,524 | 1,544,705,386 |
| Fidelity Series Large Cap Value Index Fund | 448,080,326 | 1,673,594 | 44,586,413 | -- | 4,293,345 | 26,165,887 | 435,626,739 |
| Fidelity Series Long-Term Treasury Bond Index Fund | 665,667,185 | 883,693,252 | 35,609,154 | 13,856,674 | (144,171) | (51,482,209) | 1,462,124,903 |
| Fidelity Series Opportunistic Insights Fund | 783,485,090 | 2,927,703 | 101,693,495 | -- | 27,776,159 | 71,570,348 | 784,065,805 |
| Fidelity Series Real Estate Equity Fund | 138,627,411 | 1,050,429 | 143,649,574 | 919,961 | 17,526,868 | (13,555,134) | -- |
| Fidelity Series Real Estate Income Fund | 135,680,911 | 6,271,124 | 8,623,823 | 5,733,380 | (24,741) | 885,465 | 134,188,936 |
| Fidelity Series Short-Term Credit Fund | 587,623,481 | 8,924,659 | 53,652,115 | 6,544,973 | (659,181) | 654,238 | 542,891,082 |
| Fidelity Series Small Cap Discovery Fund | 213,189,712 | 13,443,747 | 18,319,251 | 12,594,460 | 814,202 | (3,641,486) | 205,486,924 |
| Fidelity Series Small Cap Opportunities Fund | 651,074,180 | 51,481,288 | 92,958,343 | 49,078,326 | 15,604,718 | 7,804,306 | 633,006,149 |
| Fidelity Series Stock Selector Large Cap Value Fund | 1,220,429,926 | 4,574,271 | 137,418,773 | -- | 5,123,409 | 77,240,879 | 1,169,949,712 |
| Fidelity Series Value Discovery Fund | 867,290,850 | 5,047,119 | 90,171,026 | -- | 16,315,887 | 33,259,763 | 831,742,593 |
| | $30,012,753,186 | $3,196,773,708 | $4,491,014,473 | $511,777,538 | $391,639,900 | $(59,140,338) | $29,051,011,983 |
Amounts in the income column in the above table include any capital gain distributions from underlying funds, which are presented in the corresponding line-item in the Statement of Operations if applicable.
Investment Valuation
The following is a summary of the inputs used, as of September 30, 2018, involving the Fund's assets and liabilities carried at fair value. The inputs or methodology used for valuing securities may not be an indication of the risk associated with investing in those securities. For more information on valuation inputs, and their aggregation into the levels used below, please refer to the Investment Valuation section in the accompanying Notes to Financial Statements.
| | Valuation Inputs at Reporting Date: |
| Description | Total | Level 1 | Level 2 | Level 3 |
| Investments in Securities: | | | | |
| Other Short-Term Investments | $20,682,973 | $-- | $20,682,973 | $-- |
| Domestic Equity Funds | 10,488,481,000 | 10,488,481,000 | -- | -- |
| International Equity Funds | 5,461,833,859 | 5,461,833,859 | -- | -- |
| Bond Funds | 10,613,265,387 | 10,613,265,387 | -- | -- |
| Short-Term Funds | 2,529,580,401 | 2,529,580,401 | -- | -- |
| Total Investments in Securities: | $29,113,843,620 | $29,093,160,647 | $20,682,973 | $-- |
| Derivative Instruments: | | | | |
| Assets | | | | |
| Futures Contracts | $4,376,008 | $4,376,008 | $-- | $-- |
| Total Assets | $4,376,008 | $4,376,008 | $-- | $-- |
| Liabilities | | | | |
| Futures Contracts | $(307,900) | $(307,900) | $-- | $-- |
| Total Liabilities | $(307,900) | $(307,900) | $-- | $-- |
| Total Derivative Instruments: | $4,068,108 | $4,068,108 | $-- | $-- |
Value of Derivative Instruments
The following table is a summary of the Fund's value of derivative instruments by primary risk exposure as of September 30, 2018. For additional information on derivative instruments, please refer to the Derivative Instruments section in the accompanying Notes to Financial Statements.
| Primary Risk Exposure / Derivative Type | Value |
| | Asset | Liability |
| Equity Risk | | |
| Futures Contracts(a) | $4,376,008 | $(307,900) |
| Total Equity Risk | 4,376,008 | (307,900) |
| Total Value of Derivatives | $4,376,008 | $(307,900) |
(a) Reflects gross cumulative appreciation (depreciation) on futures contracts as presented in the Schedule of Investments. In the Statement of Assets and Liabilities, the period end daily variation margin is included in receivable or payable for daily variation margin on futures contracts, and the net cumulative appreciation (depreciation) is included in net unrealized appreciation (depreciation).
See accompanying notes which are an integral part of the financial statements.
Fidelity Freedom® 2020 Fund
Financial Statements
Statement of Assets and Liabilities
| | | September 30, 2018 (Unaudited) |
| Assets | | |
Investment in securities, at value — See accompanying schedule:
Unaffiliated issuers (cost $20,684,518) | $20,682,973 | |
| Fidelity Central Funds (cost $42,148,664) | 42,148,664 | |
| Other affiliated issuers (cost $25,016,183,762) | 29,051,011,983 | |
| Total Investment in Securities (cost $25,079,016,944) | | $29,113,843,620 |
| Receivable for investments sold | | 37,923,786 |
| Receivable for fund shares sold | | 514,747,929 |
| Distributions receivable from Fidelity Central Funds | | 60,894 |
| Other receivables | | 212,156 |
| Total assets | | 29,666,788,385 |
| Liabilities | | |
| Payable for investments purchased | $33,203,900 | |
| Payable for fund shares redeemed | 518,888,158 | |
| Accrued management fee | 13,626,759 | |
| Payable for daily variation margin on futures contracts | 1,653,823 | |
| Other payables and accrued expenses | 212,156 | |
| Total liabilities | | 567,584,796 |
| Net Assets | | $29,099,203,589 |
| Net Assets consist of: | | |
| Paid in capital | | $24,306,599,649 |
| Undistributed net investment income | | 169,346,562 |
| Accumulated undistributed net realized gain (loss) on investments | | 584,362,594 |
| Net unrealized appreciation (depreciation) on investments | | 4,038,894,784 |
| Net Assets | | $29,099,203,589 |
| Fidelity Freedom 2020 Fund: | | |
| Net Asset Value, offering price and redemption price per share ($12,864,323,624 ÷ 779,070,636 shares) | | $16.51 |
| Class K: | | |
| Net Asset Value, offering price and redemption price per share ($14,833,133,079 ÷ 899,112,347 shares) | | $16.50 |
| Class K6: | | |
| Net Asset Value, offering price and redemption price per share ($1,401,746,886 ÷ 84,913,068 shares) | | $16.51 |
See accompanying notes which are an integral part of the financial statements.
Statement of Operations
| | | Six months ended September 30, 2018 (Unaudited) |
| Investment Income | | |
| Dividends: | | |
| Affiliated issuers | | $253,523,770 |
| Interest | | 86,552 |
| Income from Fidelity Central Funds | | 162,964 |
| Total income | | 253,773,286 |
| Expenses | | |
| Management fee | $83,688,050 | |
| Independent trustees' fees and expenses | 72,715 | |
| Total expenses before reductions | 83,760,765 | |
| Expense reductions | (13) | |
| Total expenses after reductions | | 83,760,752 |
| Net investment income (loss) | | 170,012,534 |
| Realized and Unrealized Gain (Loss) | | |
| Net realized gain (loss) on: | | |
| Investment securities: | | |
| Fidelity Central Funds | (181) | |
| Other affiliated issuers | 391,639,900 | |
| Futures contracts | (15,516,827) | |
| Capital gain distributions from underlying funds: | | |
| Affiliated issuers | 258,253,768 | |
| Total net realized gain (loss) | | 634,376,660 |
| Change in net unrealized appreciation (depreciation) on: | | |
| Investment securities: | | |
| Unaffiliated issuers | (1,416) | |
| Affiliated issuers | (59,140,338) | |
| Futures contracts | 4,068,108 | |
| Total change in net unrealized appreciation (depreciation) | | (55,073,646) |
| Net gain (loss) | | 579,303,014 |
| Net increase (decrease) in net assets resulting from operations | | $749,315,548 |
See accompanying notes which are an integral part of the financial statements.
Statement of Changes in Net Assets
| | Six months ended September 30, 2018 (Unaudited) | Year ended March 31, 2018 |
| Increase (Decrease) in Net Assets | | |
| Operations | | |
| Net investment income (loss) | $170,012,534 | $395,829,727 |
| Net realized gain (loss) | 634,376,660 | 1,249,079,495 |
| Change in net unrealized appreciation (depreciation) | (55,073,646) | 265,229,829 |
| Net increase (decrease) in net assets resulting from operations | 749,315,548 | 1,910,139,051 |
| Distributions to shareholders from net investment income | (35,844,885) | (388,661,235) |
| Distributions to shareholders from net realized gain | (703,638,216) | (719,753,000) |
| Total distributions | (739,483,101) | (1,108,414,235) |
| Share transactions - net increase (decrease) | (912,760,404) | 16,921,166,403 |
| Total increase (decrease) in net assets | (902,927,957) | 17,722,891,219 |
| Net Assets | | |
| Beginning of period | 30,002,131,546 | 12,279,240,327 |
| End of period | $29,099,203,589 | $30,002,131,546 |
| Other Information | | |
| Undistributed net investment income end of period | $169,346,562 | $35,178,913 |
See accompanying notes which are an integral part of the financial statements.
Financial Highlights
Fidelity Freedom 2020 Fund
| | Six months ended (Unaudited) September 30, | Years endedMarch 31, | | | | |
| | 2018 | 2018 | 2017 | 2016 | 2015 | 2014 |
| Selected Per–Share Data | | | | | | |
| Net asset value, beginning of period | $16.51 | $15.70 | $14.63 | $15.76 | $15.81 | $14.94 |
| Income from Investment Operations | | | | | | |
| Net investment income (loss)A | .09 | .22 | .25 | .28 | .28 | .23 |
| Net realized and unrealized gain (loss) | .32 | 1.34 | 1.40 | (.60) | .73 | 1.22 |
| Total from investment operations | .41 | 1.56 | 1.65 | (.32) | 1.01 | 1.45 |
| Distributions from net investment income | (.02) | (.22) | (.26) | (.28) | (.29) | (.23) |
| Distributions from net realized gain | (.39) | (.52) | (.32) | (.53) | (.77) | (.36) |
| Total distributions | (.41) | (.75)B | (.58) | (.81) | (1.06) | (.58)C |
| Net asset value, end of period | $16.51 | $16.51 | $15.70 | $14.63 | $15.76 | $15.81 |
| Total ReturnD,E | 2.50% | 10.01% | 11.57% | (2.10)% | 6.71% | 9.83% |
| Ratios to Average Net AssetsF,G | | | | | | |
| Expenses before reductions | .61%H | .52% | - %I | - %I | - %I | - %I |
| Expenses net of fee waivers, if any | .61%H | .52% | -% | -% | -% | -% |
| Expenses net of all reductions | .61%H | .52% | -% | -% | -% | -% |
| Net investment income (loss) | 1.10%H | 1.34% | 1.69% | 1.83% | 1.83% | 1.49% |
| Supplemental Data | | | | | | |
| Net assets, end of period (000 omitted) | $12,864,324 | $12,916,078 | $12,279,240 | $11,732,980 | $12,868,898 | $13,343,983 |
| Portfolio turnover rateG | 22%H | 21%J | 19% | 17% | 17% | 39% |
A Calculated based on average shares outstanding during the period.
B Total distributions of $.75 per share is comprised of distributions from net investment income of $.221 and distributions from net realized gain of $.524 per share.
C Total distributions of $.58 per share is comprised of distributions from net investment income of $.228 and distributions from net realized gain of $.356 per share.
D Total returns for periods of less than one year are not annualized.
E Total returns would have been lower if certain expenses had not been reduced during the applicable periods shown.
F Expense ratios reflect operating expenses of the class. Expenses before reductions do not reflect amounts reimbursed by the investment adviser or reductions from expense offset arrangements and do not represent the amount paid by the class during periods when reimbursements or reductions occur. Expenses net of fee waivers reflect expenses after reimbursement by the investment adviser but prior to reductions from expense offset arrangements. Expenses net of all reductions represent the net expenses paid by the class but do not include expenses of the underlying funds in which the Fund invests.
G Amounts do not include the activity of the Underlying Funds.
H Annualized
I Amount represents less than .005%.
J The portfolio turnover rate does not include the assets acquired in the merger.
See accompanying notes which are an integral part of the financial statements.
Fidelity Freedom 2020 Fund Class K
| | Six months ended (Unaudited) September 30, | Years endedMarch 31, |
| | 2018 | 2018 A |
| Selected Per–Share Data | | |
| Net asset value, beginning of period | $16.49 | $16.24 |
| Income from Investment Operations | | |
| Net investment income (loss)B | .10 | .27 |
| Net realized and unrealized gain (loss) | .32 | .50 |
| Total from investment operations | .42 | .77 |
| Distributions from net investment income | (.02) | (.21) |
| Distributions from net realized gain | (.39) | (.31) |
| Total distributions | (.41) | (.52) |
| Net asset value, end of period | $16.50 | $16.49 |
| Total ReturnC,D | 2.57% | 4.73% |
| Ratios to Average Net AssetsE,F | | |
| Expenses before reductions | .53%G | .54%G |
| Expenses net of fee waivers, if any | .53%G | .54%G |
| Expenses net of all reductions | .53%G | .54%G |
| Net investment income (loss) | 1.18%G | 2.34%G |
| Supplemental Data | | |
| Net assets, end of period (000 omitted) | $14,833,133 | $16,611,072 |
| Portfolio turnover rateF | 22%G | 21%H |
A For the period July 20, 2017 (commencement of sale of shares) to March 31, 2018.
B Calculated based on average shares outstanding during the period.
C Total returns for periods of less than one year are not annualized.
D Total returns would have been lower if certain expenses had not been reduced during the applicable periods shown.
E Expense ratios reflect operating expenses of the class. Expenses before reductions do not reflect amounts reimbursed by the investment adviser or reductions from expense offset arrangements and do not represent the amount paid by the class during periods when reimbursements or reductions occur. Expense ratios before reductions for start-up periods may not be representative of longer-term operating periods. Expenses net of fee waivers reflect expenses after reimbursement by the investment adviser but prior to reductions from expense offset arrangements. Expenses net of all reductions represent the net expenses paid by the class but do not include expenses of the underlying funds in which the Fund invests.
F Amounts do not include the activity of the Underlying Funds.
G Annualized
H The portfolio turnover rate does not include the assets acquired in the merger.
See accompanying notes which are an integral part of the financial statements.
Fidelity Freedom 2020 Fund Class K6
| | Six months ended (Unaudited) September 30, | Years endedMarch 31, |
| | 2018 | 2018 A |
| Selected Per–Share Data | | |
| Net asset value, beginning of period | $16.50 | $16.00 |
| Income from Investment Operations | | |
| Net investment income (loss)B | .10 | .24 |
| Net realized and unrealized gain (loss) | .33 | .79 |
| Total from investment operations | .43 | 1.03 |
| Distributions from net investment income | (.03) | (.22) |
| Distributions from net realized gain | (.39) | (.31) |
| Total distributions | (.42) | (.53) |
| Net asset value, end of period | $16.51 | $16.50 |
| Total ReturnC,D | 2.64% | 6.40% |
| Ratios to Average Net AssetsE,F | | |
| Expenses before reductions | .43%G | .44%G |
| Expenses net of fee waivers, if any | .43%G | .44%G |
| Expenses net of all reductions | .43%G | .44%G |
| Net investment income (loss) | 1.28%G | 1.79%G |
| Supplemental Data | | |
| Net assets, end of period (000 omitted) | $1,401,747 | $474,981 |
| Portfolio turnover rateF | 22%G | 21%H |
A For the period June 7, 2017 (commencement of sale of shares) to March 31, 2018.
B Calculated based on average shares outstanding during the period.
C Total returns for periods of less than one year are not annualized.
D Total returns would have been lower if certain expenses had not been reduced during the applicable periods shown.
E Expense ratios reflect operating expenses of the class. Expenses before reductions do not reflect amounts reimbursed by the investment adviser or reductions from expense offset arrangements and do not represent the amount paid by the class during periods when reimbursements or reductions occur. Expense ratios before reductions for start-up periods may not be representative of longer-term operating periods. Expenses net of fee waivers reflect expenses after reimbursement by the investment adviser but prior to reductions from expense offset arrangements. Expenses net of all reductions represent the net expenses paid by the class but do not include expenses of the underlying funds in which the Fund invests.
F Amounts do not include the activity of the Underlying Funds.
G Annualized
H The portfolio turnover rate does not include the assets acquired in the merger.
See accompanying notes which are an integral part of the financial statements.
Fidelity Freedom® 2025 Fund
Investment Summary (Unaudited)
The information in the following tables is based on the direct investments of the Fund.
Top Holdings as of September 30, 2018
| | % of fund's net assets |
| Fidelity Series Investment Grade Bond Fund | 19.8 |
| Fidelity Series Intrinsic Opportunities Fund | 6.8 |
| Fidelity Series Emerging Markets Opportunities Fund | 6.2 |
| Fidelity Series International Value Fund | 6.2 |
| Fidelity Series International Growth Fund | 6.2 |
| Fidelity Series Large Cap Stock Fund | 6.1 |
| Fidelity Series Growth Company Fund | 5.7 |
| Fidelity Series Long-Term Treasury Bond Index Fund | 5.5 |
| Fidelity Series Stock Selector Large Cap Value Fund | 4.6 |
| Fidelity Series Government Money Market Fund 2.12% | 4.6 |
| | 71.7 |
Asset Allocation (% of fund's net assets)
| Period end |
| | Domestic Equity Funds | 40.9% |
| | International Equity Funds | 20.9% |
| | Bond Funds | 32.2% |
| | Short-Term Funds | 6.0% |
| | Short-Term Investments | 0.1% |
| | Net Other Assets (Liabilities)* | (0.1)% |

* Net Other Assets (Liabilities) are not included in the pie chart
Domestic Equity Funds category includes Fidelity Series Commodity Strategy Fund which invests in commodity-related investments.
Fidelity Freedom® 2025 Fund
Schedule of Investments September 30, 2018 (Unaudited)
Showing Percentage of Net Assets
| U.S. Treasury Obligations - 0.1% | | | |
| | | Principal Amount | Value |
| U.S. Treasury Bills, yield at date of purchase 1.97% to 2.11% 11/1/18 to 12/6/18 (a) | | | |
| (Cost $19,442,444) | | 19,490,000 | 19,440,982 |
| | | Shares | Value |
|
| Domestic Equity Funds - 40.9% | | | |
| Fidelity Series All-Sector Equity Fund (b) | | 30,302,311 | $412,414,456 |
| Fidelity Series Blue Chip Growth Fund (b) | | 50,976,342 | 779,938,038 |
| Fidelity Series Commodity Strategy Fund (b) | | 110,170,047 | 550,850,234 |
| Fidelity Series Growth Company Fund (b) | | 77,589,531 | 1,568,084,421 |
| Fidelity Series Intrinsic Opportunities Fund (b) | | 102,930,239 | 1,886,711,284 |
| Fidelity Series Large Cap Stock Fund (b) | | 104,879,975 | 1,670,737,995 |
| Fidelity Series Large Cap Value Index Fund (b) | | 35,606,853 | 470,010,462 |
| Fidelity Series Opportunistic Insights Fund (b) | | 42,684,373 | 847,284,803 |
| Fidelity Series Small Cap Discovery Fund (b) | | 18,261,335 | 221,875,223 |
| Fidelity Series Small Cap Opportunities Fund (b) | | 46,547,929 | 683,789,084 |
| Fidelity Series Stock Selector Large Cap Value Fund (b) | | 95,699,550 | 1,265,148,047 |
| Fidelity Series Value Discovery Fund (b) | | 65,662,320 | 898,917,161 |
| TOTAL DOMESTIC EQUITY FUNDS | | | |
| (Cost $8,187,698,363) | | | 11,255,761,208 |
|
| International Equity Funds - 20.9% | | | |
| Fidelity Series Canada Fund (b) | | 16,156,197 | 174,648,485 |
| Fidelity Series Emerging Markets Fund (b) | | 5,764,656 | 55,859,521 |
| Fidelity Series Emerging Markets Opportunities Fund (b) | | 89,442,930 | 1,716,409,834 |
| Fidelity Series International Growth Fund (b) | | 103,044,534 | 1,689,930,355 |
| Fidelity Series International Small Cap Fund (b) | | 22,449,718 | 401,849,944 |
| Fidelity Series International Value Fund (b) | | 162,577,898 | 1,710,319,490 |
| TOTAL INTERNATIONAL EQUITY FUNDS | | | |
| (Cost $4,533,831,290) | | | 5,749,017,629 |
|
| Bond Funds - 32.2% | | | |
| Fidelity Series Emerging Markets Debt Fund (b) | | 18,481,956 | 176,133,041 |
| Fidelity Series Floating Rate High Income Fund (b) | | 6,637,878 | 63,192,596 |
| Fidelity Series High Income Fund (b) | | 40,188,331 | 386,209,861 |
| Fidelity Series Inflation-Protected Bond Index Fund (b) | | 115,530,452 | 1,121,800,684 |
| Fidelity Series International Credit Fund (b) | | 1,540,231 | 15,140,469 |
| Fidelity Series Investment Grade Bond Fund (b) | | 501,829,516 | 5,464,923,433 |
| Fidelity Series Long-Term Treasury Bond Index Fund (b) | | 184,541,040 | 1,520,618,174 |
| Fidelity Series Real Estate Income Fund (b) | | 11,609,758 | 125,153,191 |
| TOTAL BOND FUNDS | | | |
| (Cost $9,171,160,909) | | | 8,873,171,449 |
|
| Short-Term Funds - 6.0% | | | |
| Fidelity Cash Central Fund, 2.11% (c) | | 41,037,700 | 41,045,907 |
| Fidelity Series Government Money Market Fund 2.12% (b)(d) | | 1,253,497,910 | 1,253,497,910 |
| Fidelity Series Short-Term Credit Fund (b) | | 37,391,811 | 368,683,260 |
| TOTAL SHORT-TERM FUNDS | | | |
| (Cost $1,668,019,128) | | | 1,663,227,077 |
| TOTAL INVESTMENT IN SECURITIES - 100.1% | | | |
| (Cost $23,580,152,134) | | | 27,560,618,345 |
| NET OTHER ASSETS (LIABILITIES) - (0.1)% | | | (14,682,467) |
| NET ASSETS - 100% | | | $27,545,935,878 |
| Futures Contracts | | | | | |
| | Number of contracts | Expiration Date | Notional Amount | Value | Unrealized Appreciation/(Depreciation) |
| Purchased | | | | | |
| Equity Index Contracts | | | | | |
| ICE E-mini MSCI Emerging Markets Index Contracts (United States) | 3,728 | Dec. 2018 | $195,664,080 | $3,633,712 | $3,633,712 |
| Sold | | | | | |
| Equity Index Contracts | | | | | |
| CME E-mini S&P 500 Index Contracts (United States) | 1,696 | Dec. 2018 | 247,531,200 | (288,162) | (288,162) |
| TOTAL FUTURES CONTRACTS | | | | | $3,345,550 |
The notional amount of futures purchased as a percentage of Net Assets is 0.7%
The notional amount of futures sold as a percentage of Net Assets is 0.9%
Legend
(a) Security or a portion of the security was pledged to cover margin requirements for futures contracts. At period end, the value of securities pledged amounted to $15,876,324.
(b) Affiliated Fund
(c) Affiliated fund that is generally available only to investment companies and other accounts managed by Fidelity Investments. The rate quoted is the annualized seven-day yield of the fund at period end. A complete unaudited listing of the fund's holdings as of its most recent quarter end is available upon request. In addition, each Fidelity Central Fund's financial statements are available on the SEC's website or upon request.
(d) The rate quoted is the annualized seven-day yield of the fund at period end.
Affiliated Central Funds
Information regarding fiscal year to date income earned by the Fund from investments in Fidelity Central Funds is as follows:
| Fund | Income earned |
| Fidelity Cash Central Fund | $153,942 |
| Total | $153,942 |
Amounts in the income column in the above table include any capital gain distributions from underlying funds, which are presented in the corresponding line-item in the Statement of Operations if applicable.
Affiliated Underlying Funds
Fiscal year to date information regarding the Fund's investments in affiliated Underlying Funds, excluding any Money Market Central Funds, is presented below. Exchanges between classes of the same affiliated Underlying Funds may occur.
| Affiliate | Value, beginning of period | Purchases | Sales Proceeds | Dividend Income | Realized Gain (loss) | Change in Unrealized appreciation (depreciation) | Value, end of period |
| Fidelity Series 100 Index Fund | $366,746,530 | $384 | $382,199,252 | $-- | $139,134,622 | $(123,682,284) | $-- |
| Fidelity Series All-Sector Equity Fund | 705,221,492 | 15,551,846 | 384,070,279 | -- | 36,458,834 | 39,252,563 | 412,414,456 |
| Fidelity Series Blue Chip Growth Fund | 728,890,637 | 88,795,941 | 94,156,576 | 72,350,827 | 22,684,036 | 33,724,000 | 779,938,038 |
| Fidelity Series Canada Fund | 169,257,716 | 3,477,368 | 8,571,760 | -- | 116,918 | 10,368,243 | 174,648,485 |
| Fidelity Series Commodity Strategy Fund | 582,964,326 | 81,295,478 | 68,462,613 | 32,961,333 | (28,404,874) | (16,542,083) | 550,850,234 |
| Fidelity Series Emerging Markets Debt Fund | 184,835,032 | 8,877,984 | 7,483,112 | 5,408,566 | (411,653) | (9,685,210) | 176,133,041 |
| Fidelity Series Emerging Markets Fund | -- | 55,960,024 | -- | -- | -- | (100,503) | 55,859,521 |
| Fidelity Series Emerging Markets Opportunities Fund | 1,817,196,161 | 193,452,530 | 63,823,094 | -- | (3,018,174) | (227,397,589) | 1,716,409,834 |
| Fidelity Series Floating Rate High Income Fund | 62,801,027 | 3,130,310 | 2,803,707 | 1,683,568 | (63,140) | 128,106 | 63,192,596 |
| Fidelity Series Government Money Market Fund 2.12% | 1,735,916,271 | 172,279,209 | 654,697,570 | 15,253,300 | -- | -- | 1,253,497,910 |
| Fidelity Series Growth Company Fund | 1,493,068,097 | 31,322,027 | 177,032,286 | -- | 36,615,397 | 184,111,186 | 1,568,084,421 |
| Fidelity Series High Income Fund | 387,878,745 | 18,504,114 | 23,389,205 | 11,220,336 | (589,516) | 3,805,723 | 386,209,861 |
| Fidelity Series Inflation-Protected Bond Index Fund | 222,364,297 | 911,178,259 | 6,827,308 | 988,660 | (23,267) | (4,891,297) | 1,121,800,684 |
| Fidelity Series International Credit Fund | 15,496,785 | 191,690 | 392,105 | 190,980 | (5,113) | (150,788) | 15,140,469 |
| Fidelity Series International Growth Fund | 1,728,455,734 | 43,212,609 | 108,064,363 | -- | 15,054,172 | 11,272,203 | 1,689,930,355 |
| Fidelity Series International Small Cap Fund | 431,342,797 | 8,755,526 | 21,742,015 | -- | 1,443,936 | (17,950,300) | 401,849,944 |
| Fidelity Series International Value Fund | 1,725,207,204 | 62,987,330 | 73,295,750 | -- | (538,505) | (4,040,789) | 1,710,319,490 |
| Fidelity Series Intrinsic Opportunities Fund | 1,796,627,752 | 121,591,534 | 59,030,567 | 83,401,306 | 1,578,802 | 25,943,763 | 1,886,711,284 |
| Fidelity Series Investment Grade Bond Fund | 5,978,177,564 | 195,897,113 | 641,768,213 | 81,796,113 | (28,536,206) | (38,846,825) | 5,464,923,433 |
| Fidelity Series Large Cap Stock Fund | 1,631,361,660 | 135,740,643 | 174,727,221 | 101,329,164 | 6,575,880 | 71,787,033 | 1,670,737,995 |
| Fidelity Series Large Cap Value Index Fund | 457,041,989 | 9,676,985 | 28,662,009 | -- | 999,171 | 30,954,326 | 470,010,462 |
| Fidelity Series Long-Term Treasury Bond Index Fund | 610,405,640 | 976,089,648 | 14,154,094 | 14,920,890 | (230,741) | (51,492,279) | 1,520,618,174 |
| Fidelity Series Opportunistic Insights Fund | 798,825,062 | 17,066,251 | 71,713,173 | -- | 5,365,848 | 97,740,815 | 847,284,803 |
| Fidelity Series Real Estate Equity Fund | 142,057,130 | 1,088,209 | 147,363,842 | 964,911 | 10,969,915 | (6,751,412) | -- |
| Fidelity Series Real Estate Income Fund | 121,846,965 | 8,009,657 | 5,442,189 | 5,285,335 | (80,098) | 818,856 | 125,153,191 |
| Fidelity Series Short-Term Credit Fund | 397,592,784 | 13,176,053 | 42,081,652 | 4,455,640 | (495,834) | 491,909 | 368,683,260 |
| Fidelity Series Small Cap Discovery Fund | 217,412,216 | 17,811,259 | 10,236,357 | 13,071,975 | (155,699) | (2,956,196) | 221,875,223 |
| Fidelity Series Small Cap Opportunities Fund | 663,854,507 | 66,759,576 | 69,193,679 | 52,816,971 | 8,136,431 | 14,232,249 | 683,789,084 |
| Fidelity Series Stock Selector Large Cap Value Fund | 1,244,944,162 | 26,153,549 | 91,381,663 | -- | 9,787 | 85,422,212 | 1,265,148,047 |
| Fidelity Series Value Discovery Fund | 884,624,024 | 18,724,436 | 56,090,981 | -- | 716,663 | 50,943,019 | 898,917,161 |
| Total | $27,302,414,306 | $3,306,757,542 | $3,488,856,635 | $498,099,875 | $223,307,592 | $156,508,651 | $27,500,131,456 |
Amounts in the income column in the above table include any capital gain distributions from underlying funds, which are presented in the corresponding line-item in the Statement of Operations if applicable.
Investment Valuation
The following is a summary of the inputs used, as of September 30, 2018, involving the Fund's assets and liabilities carried at fair value. The inputs or methodology used for valuing securities may not be an indication of the risk associated with investing in those securities. For more information on valuation inputs, and their aggregation into the levels used below, please refer to the Investment Valuation section in the accompanying Notes to Financial Statements.
| | Valuation Inputs at Reporting Date: |
| Description | Total | Level 1 | Level 2 | Level 3 |
| Investments in Securities: | | | | |
| Other Short-Term Investments | $19,440,982 | $-- | $19,440,982 | $-- |
| Domestic Equity Funds | 11,255,761,208 | 11,255,761,208 | -- | -- |
| International Equity Funds | 5,749,017,629 | 5,749,017,629 | -- | -- |
| Bond Funds | 8,873,171,449 | 8,873,171,449 | -- | -- |
| Short-Term Funds | 1,663,227,077 | 1,663,227,077 | -- | -- |
| Total Investments in Securities: | $27,560,618,345 | $27,541,177,363 | $19,440,982 | $-- |
| Derivative Instruments: | | | | |
| Assets | | | | |
| Futures Contracts | $3,633,712 | $3,633,712 | $-- | $-- |
| Total Assets | $3,633,712 | $3,633,712 | $-- | $-- |
| Liabilities | | | | |
| Futures Contracts | $(288,162) | $(288,162) | $-- | $-- |
| Total Liabilities | $(288,162) | $(288,162) | $-- | $-- |
| Total Derivative Instruments: | $3,345,550 | $3,345,550 | $-- | $-- |
Value of Derivative Instruments
The following table is a summary of the Fund's value of derivative instruments by primary risk exposure as of September 30, 2018. For additional information on derivative instruments, please refer to the Derivative Instruments section in the accompanying Notes to Financial Statements.
| Primary Risk Exposure / Derivative Type | Value |
| | Asset | Liability |
| Equity Risk | | |
| Futures Contracts(a) | $3,633,712 | $(288,162) |
| Total Equity Risk | 3,633,712 | (288,162) |
| Total Value of Derivatives | $3,633,712 | $(288,162) |
(a) Reflects gross cumulative appreciation (depreciation) on futures contracts as presented in the Schedule of Investments. In the Statement of Assets and Liabilities, the period end daily variation margin is included in receivable or payable for daily variation margin on futures contracts, and the net cumulative appreciation (depreciation) is included in net unrealized appreciation (depreciation).
See accompanying notes which are an integral part of the financial statements.
Fidelity Freedom® 2025 Fund
Financial Statements
Statement of Assets and Liabilities
| | | September 30, 2018 (Unaudited) |
| Assets | | |
Investment in securities, at value — See accompanying schedule:
Unaffiliated issuers (cost $19,442,444) | $19,440,982 | |
| Fidelity Central Funds (cost $41,045,907) | 41,045,907 | |
| Other affiliated issuers (cost $23,519,663,783) | 27,500,131,456 | |
| Total Investment in Securities (cost $23,580,152,134) | | $27,560,618,345 |
| Receivable for investments sold | | 45,676,268 |
| Receivable for fund shares sold | | 629,791,752 |
| Distributions receivable from Fidelity Central Funds | | 58,853 |
| Total assets | | 28,236,145,218 |
| Liabilities | | |
| Payable for investments purchased | $52,497,661 | |
| Payable for fund shares redeemed | 622,403,206 | |
| Accrued management fee | 13,618,137 | |
| Payable for daily variation margin on futures contracts | 1,690,336 | |
| Total liabilities | | 690,209,340 |
| Net Assets | | $27,545,935,878 |
| Net Assets consist of: | | |
| Paid in capital | | $22,983,958,524 |
| Undistributed net investment income | | 140,625,726 |
| Accumulated undistributed net realized gain (loss) on investments | | 437,539,867 |
| Net unrealized appreciation (depreciation) on investments | | 3,983,811,761 |
| Net Assets | | $27,545,935,878 |
| Fidelity Freedom 2025 Fund: | | |
| Net Asset Value, offering price and redemption price per share ($11,181,853,747 ÷ 775,112,675 shares) | | $14.43 |
| Class K: | | |
| Net Asset Value, offering price and redemption price per share ($14,621,522,701 ÷ 1,014,803,262 shares) | | $14.41 |
| Class K6: | | |
| Net Asset Value, offering price and redemption price per share ($1,742,559,430 ÷ 120,774,335 shares) | | $14.43 |
See accompanying notes which are an integral part of the financial statements.
Statement of Operations
| | | Six months ended September 30, 2018 (Unaudited) |
| Investment Income | | |
| Dividends: | | |
| Affiliated issuers | | $222,419,803 |
| Interest | | 86,188 |
| Income from Fidelity Central Funds | | 153,942 |
| Total income | | 222,659,933 |
| Expenses | | |
| Management fee | $82,393,147 | |
| Independent trustees' fees and expenses | 66,851 | |
| Total expenses before reductions | 82,459,998 | |
| Expense reductions | (12) | |
| Total expenses after reductions | | 82,459,986 |
| Net investment income (loss) | | 140,199,947 |
| Realized and Unrealized Gain (Loss) | | |
| Net realized gain (loss) on: | | |
| Investment securities: | | |
| Fidelity Central Funds | 153 | |
| Other affiliated issuers | 223,307,592 | |
| Futures contracts | (16,107,477) | |
| Capital gain distributions from underlying funds: | | |
| Affiliated issuers | 275,680,072 | |
| Total net realized gain (loss) | | 482,880,340 |
| Change in net unrealized appreciation (depreciation) on: | | |
| Investment securities: | | |
| Unaffiliated issuers | (1,345) | |
| Affiliated issuers | 156,508,651 | |
| Futures contracts | 3,345,550 | |
| Total change in net unrealized appreciation (depreciation) | | 159,852,856 |
| Net gain (loss) | | 642,733,196 |
| Net increase (decrease) in net assets resulting from operations | | $782,933,143 |
See accompanying notes which are an integral part of the financial statements.
Statement of Changes in Net Assets
| | Six months ended September 30, 2018 (Unaudited) | Year ended March 31, 2018 |
| Increase (Decrease) in Net Assets | | |
| Operations | | |
| Net investment income (loss) | $140,199,947 | $338,806,701 |
| Net realized gain (loss) | 482,880,340 | 1,044,395,111 |
| Change in net unrealized appreciation (depreciation) | 159,852,856 | 390,546,666 |
| Net increase (decrease) in net assets resulting from operations | 782,933,143 | 1,773,748,478 |
| Distributions to shareholders from net investment income | (20,792,240) | (337,178,441) |
| Distributions to shareholders from net realized gain | (610,170,349) | (559,307,494) |
| Total distributions | (630,962,589) | (896,485,935) |
| Share transactions - net increase (decrease) | 102,036,675 | 16,650,118,805 |
| Total increase (decrease) in net assets | 254,007,229 | 17,527,381,348 |
| Net Assets | | |
| Beginning of period | 27,291,928,649 | 9,764,547,301 |
| End of period | $27,545,935,878 | $27,291,928,649 |
| Other Information | | |
| Undistributed net investment income end of period | $140,625,726 | $21,218,019 |
See accompanying notes which are an integral part of the financial statements.
Financial Highlights
Fidelity Freedom 2025 Fund
| | Six months ended (Unaudited) September 30, | Years endedMarch 31, | | | | |
| | 2018 | 2018 | 2017 | 2016 | 2015 | 2014 |
| Selected Per–Share Data | | | | | | |
| Net asset value, beginning of period | $14.35 | $13.50 | $12.49 | $13.51 | $13.49 | $12.58 |
| Income from Investment Operations | | | | | | |
| Net investment income (loss)A | .07 | .18 | .21 | .22 | .24 | .20 |
| Net realized and unrealized gain (loss) | .34 | 1.26 | 1.30 | (.54) | .69 | 1.30 |
| Total from investment operations | .41 | 1.44 | 1.51 | (.32) | .93 | 1.50 |
| Distributions from net investment income | (.01) | (.18) | (.21) | (.23) | (.25) | (.20) |
| Distributions from net realized gain | (.32) | (.41) | (.29) | (.47) | (.66) | (.39) |
| Total distributions | (.33) | (.59) | (.50) | (.70) | (.91) | (.59) |
| Net asset value, end of period | $14.43 | $14.35 | $13.50 | $12.49 | $13.51 | $13.49 |
| Total ReturnB,C | 2.88% | 10.81% | 12.46% | (2.50)% | 7.23% | 12.08% |
| Ratios to Average Net AssetsD,E | | | | | | |
| Expenses before reductions | .65%F | .56%G | - %H | - %H | - %H | - %H |
| Expenses net of fee waivers, if any | .65%F | .56%G | -% | -% | -% | -% |
| Expenses net of all reductions | .65%F | .56%G | -% | -% | -% | -% |
| Net investment income (loss) | .96%F | 1.28% | 1.66% | 1.75% | 1.81% | 1.53% |
| Supplemental Data | | | | | | |
| Net assets, end of period (000 omitted) | $11,181,854 | $10,923,217 | $9,764,547 | $8,717,568 | $9,054,681 | $8,865,153 |
| Portfolio turnover rateD | 24%F | 18%I | 19% | 17% | 19% | 46% |
A Calculated based on average shares outstanding during the period.
B Total returns for periods of less than one year are not annualized.
C Total returns would have been lower if certain expenses had not been reduced during the applicable periods shown.
D Amounts do not include the activity of the Underlying Funds.
E Expense ratios reflect operating expenses of the class. Expenses before reductions do not reflect amounts reimbursed by the investment adviser or reductions from expense offset arrangements and do not represent the amount paid by the class during periods when reimbursements or reductions occur. Expenses net of fee waivers reflect expenses after reimbursement by the investment adviser but prior to reductions from expense offset arrangements. Expenses net of all reductions represent the net expenses paid by the class but do not include expenses of the underlying funds in which the Fund invests.
F Annualized
G On certain classes, the size and fluctuation of net assets and expense amounts may cause ratios to differ from contractual rates.
H Amount represents less than .005%.
I The portfolio turnover rate does not include the assets acquired in the merger.
See accompanying notes which are an integral part of the financial statements.
Fidelity Freedom 2025 Fund Class K
| | Six months ended (Unaudited) September 30, | Years endedMarch 31, |
| | 2018 | 2018 A |
| Selected Per–Share Data | | |
| Net asset value, beginning of period | $14.33 | $14.02 |
| Income from Investment Operations | | |
| Net investment income (loss)B | .08 | .23 |
| Net realized and unrealized gain (loss) | .33 | .50 |
| Total from investment operations | .41 | .73 |
| Distributions from net investment income | (.01) | (.18) |
| Distributions from net realized gain | (.32) | (.24) |
| Total distributions | (.33) | (.42) |
| Net asset value, end of period | $14.41 | $14.33 |
| Total ReturnC,D | 2.89% | 5.18% |
| Ratios to Average Net AssetsE,F | | |
| Expenses before reductions | .57%G | .58%G,H |
| Expenses net of fee waivers, if any | .57%G | .58%G,H |
| Expenses net of all reductions | .57%G | .58%G,H |
| Net investment income (loss) | 1.05%G | 2.28%G |
| Supplemental Data | | |
| Net assets, end of period (000 omitted) | $14,621,523 | $15,743,238 |
| Portfolio turnover rateE | 24%G | 18%I |
A For the period July 20, 2017 (commencement of sale of shares) to March 31, 2018.
B Calculated based on average shares outstanding during the period.
C Total returns for periods of less than one year are not annualized.
D Total returns would have been lower if certain expenses had not been reduced during the applicable periods shown.
E Amounts do not include the activity of the Underlying Funds.
F Expense ratios reflect operating expenses of the class. Expenses before reductions do not reflect amounts reimbursed by the investment adviser or reductions from expense offset arrangements and do not represent the amount paid by the class during periods when reimbursements or reductions occur. Expense ratios before reductions for start-up periods may not be representative of longer-term operating periods. Expenses net of fee waivers reflect expenses after reimbursement by the investment adviser but prior to reductions from expense offset arrangements. Expenses net of all reductions represent the net expenses paid by the class but do not include expenses of the underlying funds in which the Fund invests.
G Annualized
H On certain classes, the size and fluctuation of net assets and expense amounts may cause ratios to differ from contractual rates.
I The portfolio turnover rate does not include the assets acquired in the merger.
See accompanying notes which are an integral part of the financial statements.
Fidelity Freedom 2025 Fund Class K6
| | Six months ended (Unaudited) September 30, | Years endedMarch 31, |
| | 2018 | 2018 A |
| Selected Per–Share Data | | |
| Net asset value, beginning of period | $14.35 | $13.80 |
| Income from Investment Operations | | |
| Net investment income (loss)B | .08 | .21 |
| Net realized and unrealized gain (loss) | .34 | .76 |
| Total from investment operations | .42 | .97 |
| Distributions from net investment income | (.02) | (.19) |
| Distributions from net realized gain | (.32) | (.24) |
| Total distributions | (.34) | (.42)C |
| Net asset value, end of period | $14.43 | $14.35 |
| Total ReturnD,E | 2.96% | 7.02% |
| Ratios to Average Net AssetsF,G | | |
| Expenses before reductions | .45%H | .46%H,I |
| Expenses net of fee waivers, if any | .45%H | .46%H,I |
| Expenses net of all reductions | .45%H | .46%H,I |
| Net investment income (loss) | 1.16%H | 1.78%H |
| Supplemental Data | | |
| Net assets, end of period (000 omitted) | $1,742,559 | $625,475 |
| Portfolio turnover rateF | 24%H | 18%J |
A For the period June 7, 2017 (commencement of sale of shares) to March 31, 2018.
B Calculated based on average shares outstanding during the period.
C Total distributions of $.42 per share is comprised of distributions from net investment income of $.186 and distributions from net realized gain of $.235 per share.
D Total returns for periods of less than one year are not annualized.
E Total returns would have been lower if certain expenses had not been reduced during the applicable periods shown.
F Amounts do not include the activity of the Underlying Funds.
G Expense ratios reflect operating expenses of the class. Expenses before reductions do not reflect amounts reimbursed by the investment adviser or reductions from expense offset arrangements and do not represent the amount paid by the class during periods when reimbursements or reductions occur. Expense ratios before reductions for start-up periods may not be representative of longer-term operating periods. Expenses net of fee waivers reflect expenses after reimbursement by the investment adviser but prior to reductions from expense offset arrangements. Expenses net of all reductions represent the net expenses paid by the class but do not include expenses of the underlying funds in which the Fund invests.
H Annualized
I On certain classes, the size and fluctuation of net assets and expense amounts may cause ratios to differ from contractual rates.
J The portfolio turnover rate does not include the assets acquired in the merger.
See accompanying notes which are an integral part of the financial statements.
Fidelity Freedom® 2030 Fund
Investment Summary (Unaudited)
The information in the following tables is based on the direct investments of the Fund.
Top Holdings as of September 30, 2018
| | % of fund's net assets |
| Fidelity Series Investment Grade Bond Fund | 14.8 |
| Fidelity Series Intrinsic Opportunities Fund | 8.3 |
| Fidelity Series Large Cap Stock Fund | 7.5 |
| Fidelity Series International Value Fund | 7.4 |
| Fidelity Series International Growth Fund | 7.3 |
| Fidelity Series Emerging Markets Opportunities Fund | 7.2 |
| Fidelity Series Growth Company Fund | 7.0 |
| Fidelity Series Long-Term Treasury Bond Index Fund | 5.7 |
| Fidelity Series Stock Selector Large Cap Value Fund | 5.6 |
| Fidelity Series Value Discovery Fund | 4.0 |
| | 74.8 |
Asset Allocation (% of fund's net assets)
| Period end |
| | Domestic Equity Funds | 49.7% |
| | International Equity Funds | 24.4% |
| | Bond Funds | 23.8% |
| | Short-Term Funds | 2.1% |
| | Short-Term Investments | 0.1% |
| | Net Other Assets (Liabilities)* | (0.1)% |

* Net Other Assets (Liabilities) are not included in the pie chart
Domestic Equity Funds category includes Fidelity Series Commodity Strategy Fund which invests in commodity-related investments.
Fidelity Freedom® 2030 Fund
Schedule of Investments September 30, 2018 (Unaudited)
Showing Percentage of Net Assets
| U.S. Treasury Obligations - 0.1% | | | |
| | | Principal Amount | Value |
| U.S. Treasury Bills, yield at date of purchase 1.95% to 2.11% 10/4/18 to 12/6/18 (a) | | | |
| (Cost $25,205,940) | | 25,260,000 | 25,204,030 |
| | | Shares | Value |
|
| Domestic Equity Funds - 49.7% | | | |
| Fidelity Series All-Sector Equity Fund (b) | | 44,050,276 | $599,524,254 |
| Fidelity Series Blue Chip Growth Fund (b) | | 74,555,783 | 1,140,703,474 |
| Fidelity Series Commodity Strategy Fund (b) | | 130,252,240 | 651,261,198 |
| Fidelity Series Growth Company Fund (b) | | 112,903,677 | 2,281,783,314 |
| Fidelity Series Intrinsic Opportunities Fund (b) | | 148,507,834 | 2,722,148,603 |
| Fidelity Series Large Cap Stock Fund (b) | | 152,593,102 | 2,430,808,108 |
| Fidelity Series Large Cap Value Index Fund (b) | | 51,897,098 | 685,041,696 |
| Fidelity Series Opportunistic Insights Fund (b) | | 62,381,585 | 1,238,274,464 |
| Fidelity Series Small Cap Discovery Fund (b) | | 26,055,621 | 316,575,795 |
| Fidelity Series Small Cap Opportunities Fund (b) | | 68,156,053 | 1,001,212,413 |
| Fidelity Series Stock Selector Large Cap Value Fund (b) | | 138,308,669 | 1,828,440,603 |
| Fidelity Series Value Discovery Fund (b) | | 95,556,105 | 1,308,163,072 |
| TOTAL DOMESTIC EQUITY FUNDS | | | |
| (Cost $11,819,275,843) | | | 16,203,936,994 |
|
| International Equity Funds - 24.4% | | | |
| Fidelity Series Canada Fund (b) | | 21,948,698 | 237,265,422 |
| Fidelity Series Emerging Markets Fund (b) | | 3,400,900 | 32,954,720 |
| Fidelity Series Emerging Markets Opportunities Fund (b) | | 121,836,204 | 2,338,036,755 |
| Fidelity Series International Growth Fund (b) | | 144,054,803 | 2,362,498,763 |
| Fidelity Series International Small Cap Fund (b) | | 31,288,983 | 560,072,787 |
| Fidelity Series International Value Fund (b) | | 229,310,702 | 2,412,348,583 |
| TOTAL INTERNATIONAL EQUITY FUNDS | | | |
| (Cost $6,346,733,407) | | | 7,943,177,030 |
|
| Bond Funds - 23.8% | | | |
| Fidelity Series Emerging Markets Debt Fund (b) | | 21,165,377 | 201,706,044 |
| Fidelity Series Floating Rate High Income Fund (b) | | 7,555,495 | 71,928,312 |
| Fidelity Series High Income Fund (b) | | 46,272,752 | 444,681,144 |
| Fidelity Series Inflation-Protected Bond Index Fund (b) | | 20,070,118 | 194,880,847 |
| Fidelity Series International Credit Fund (b) | | 1,508,083 | 14,824,460 |
| Fidelity Series Investment Grade Bond Fund (b) | | 444,336,171 | 4,838,820,902 |
| Fidelity Series Long-Term Treasury Bond Index Fund (b) | | 223,360,988 | 1,840,494,539 |
| Fidelity Series Real Estate Income Fund (b) | | 13,346,860 | 143,879,149 |
| TOTAL BOND FUNDS | | | |
| (Cost $8,004,673,099) | | | 7,751,215,397 |
|
| Short-Term Funds - 2.1% | | | |
| Fidelity Cash Central Fund, 2.11% (c) | | 54,688,497 | 54,699,435 |
| Fidelity Series Government Money Market Fund 2.12% (b)(d) | | 547,321,333 | 547,321,333 |
| Fidelity Series Short-Term Credit Fund (b) | | 8,973,065 | 88,474,421 |
| TOTAL SHORT-TERM FUNDS | | | |
| (Cost $691,463,657) | | | 690,495,189 |
| TOTAL INVESTMENT IN SECURITIES - 100.1% | | | |
| (Cost $26,887,351,946) | | | 32,614,028,640 |
| NET OTHER ASSETS (LIABILITIES) - (0.1)% | | | (18,581,786) |
| NET ASSETS - 100% | | | $32,595,446,854 |
| Futures Contracts | | | | | |
| | Number of contracts | Expiration Date | Notional Amount | Value | Unrealized Appreciation/(Depreciation) |
| Purchased | | | | | |
| Equity Index Contracts | | | | | |
| ICE E-mini MSCI EAFE Index Contracts (United States) | 773 | Dec. 2018 | $76,353,075 | $73,036 | $73,036 |
| ICE E-mini MSCI Emerging Markets Index Contracts (United States) | 5,316 | Dec. 2018 | 279,010,260 | 4,533,104 | 4,533,104 |
|
| TOTAL PURCHASED | | | | | 4,606,140 |
|
| Sold | | | | | |
| Equity Index Contracts | | | | | |
| CME E-mini S&P 500 Index Contracts (United States) | 2,691 | Dec. 2018 | 392,751,450 | (576,670) | (576,670) |
| TOTAL FUTURES CONTRACTS | | | | | $4,029,470 |
The notional amount of futures purchased as a percentage of Net Assets is 1.1%
The notional amount of futures sold as a percentage of Net Assets is 1.2%
Legend
(a) Security or a portion of the security was pledged to cover margin requirements for futures contracts. At period end, the value of securities pledged amounted to $20,259,827.
(b) Affiliated Fund
(c) Affiliated fund that is generally available only to investment companies and other accounts managed by Fidelity Investments. The rate quoted is the annualized seven-day yield of the fund at period end. A complete unaudited listing of the fund's holdings as of its most recent quarter end is available upon request. In addition, each Fidelity Central Fund's financial statements are available on the SEC's website or upon request.
(d) The rate quoted is the annualized seven-day yield of the fund at period end.
Affiliated Central Funds
Information regarding fiscal year to date income earned by the Fund from investments in Fidelity Central Funds is as follows:
| Fund | Income earned |
| Fidelity Cash Central Fund | $221,630 |
| Total | $221,630 |
Amounts in the income column in the above table include any capital gain distributions from underlying funds, which are presented in the corresponding line-item in the Statement of Operations if applicable.
Affiliated Underlying Funds
Fiscal year to date information regarding the Fund's investments in affiliated Underlying Funds, excluding any Money Market Central Funds, is presented below. Exchanges between classes of the same affiliated Underlying Funds may occur.
| Affiliate | Value, beginning of period | Purchases | Sales Proceeds | Dividend Income | Realized Gain (loss) | Change in Unrealized appreciation (depreciation) | Value, end of period |
| Fidelity Series 100 Index Fund | $523,652,000 | $24 | $549,343,064 | $-- | $200,853,736 | $(175,162,696) | $-- |
| Fidelity Series All-Sector Equity Fund | 1,006,674,195 | 22,105,224 | 537,576,734 | -- | 51,276,421 | 57,045,148 | 599,524,254 |
| Fidelity Series Blue Chip Growth Fund | 1,040,466,499 | 129,307,574 | 107,580,334 | 105,831,273 | 22,646,957 | 55,862,778 | 1,140,703,474 |
| Fidelity Series Canada Fund | 235,908,154 | 5,112,459 | 18,402,531 | -- | 335,871 | 14,311,469 | 237,265,422 |
| Fidelity Series Commodity Strategy Fund | 678,337,536 | 83,335,244 | 57,285,341 | 38,971,319 | (23,483,368) | (29,642,873) | 651,261,198 |
| Fidelity Series Emerging Markets Debt Fund | 210,639,143 | 10,437,695 | 7,837,060 | 6,179,255 | (361,124) | (11,172,610) | 201,706,044 |
| Fidelity Series Emerging Markets Fund | -- | 32,487,281 | -- | -- | -- | 467,439 | 32,954,720 |
| Fidelity Series Emerging Markets Opportunities Fund | 2,446,367,661 | 279,033,917 | 77,551,712 | -- | (3,375,147) | (306,437,964) | 2,338,036,755 |
| Fidelity Series Floating Rate High Income Fund | 71,095,281 | 3,685,608 | 2,927,236 | 1,911,057 | (32,913) | 107,572 | 71,928,312 |
| Fidelity Series Government Money Market Fund 2.12% | 457,362,031 | 226,160,805 | 136,201,503 | 4,916,975 | -- | -- | 547,321,333 |
| Fidelity Series Growth Company Fund | 2,122,560,480 | 47,163,873 | 203,105,725 | -- | 28,314,903 | 286,849,783 | 2,281,783,314 |
| Fidelity Series High Income Fund | 444,355,054 | 22,105,175 | 25,461,784 | 12,910,808 | (746,610) | 4,429,309 | 444,681,144 |
| Fidelity Series Inflation-Protected Bond Index Fund | 247,162,137 | 53,553,459 | 106,574,704 | 394,032 | (2,173,611) | 2,913,566 | 194,880,847 |
| Fidelity Series International Credit Fund | 15,086,864 | 185,988 | 296,613 | 185,928 | (4,075) | (147,704) | 14,824,460 |
| Fidelity Series International Growth Fund | 2,382,946,699 | 51,248,291 | 108,273,033 | -- | 11,295,639 | 25,281,167 | 2,362,498,763 |
| Fidelity Series International Small Cap Fund | 594,583,372 | 12,662,974 | 24,214,228 | -- | 1,226,184 | (24,185,515) | 560,072,787 |
| Fidelity Series International Value Fund | 2,404,694,160 | 106,423,632 | 92,694,257 | -- | (1,050,685) | (5,024,267) | 2,412,348,583 |
| Fidelity Series Intrinsic Opportunities Fund | 2,568,837,729 | 182,683,247 | 68,157,071 | 120,288,014 | 727,007 | 38,057,691 | 2,722,148,603 |
| Fidelity Series Investment Grade Bond Fund | 4,977,920,975 | 278,109,296 | 359,592,418 | 69,992,733 | (9,544,137) | (48,072,814) | 4,838,820,902 |
| Fidelity Series Large Cap Stock Fund | 2,275,914,375 | 199,919,997 | 154,232,033 | 145,485,860 | 3,965,440 | 105,240,329 | 2,430,808,108 |
| Fidelity Series Large Cap Value Index Fund | 652,413,502 | 14,841,575 | 28,013,720 | -- | 274,413 | 45,525,926 | 685,041,696 |
| Fidelity Series Long-Term Treasury Bond Index Fund | 706,504,608 | 1,224,965,093 | 25,227,049 | 17,613,147 | (626,000) | (65,122,113) | 1,840,494,539 |
| Fidelity Series Opportunistic Insights Fund | 1,140,294,140 | 25,645,066 | 75,420,844 | -- | 4,699,953 | 143,056,149 | 1,238,274,464 |
| Fidelity Series Real Estate Equity Fund | 205,077,929 | 680,015 | 212,531,811 | 485,076 | 14,711,673 | (7,937,806) | -- |
| Fidelity Series Real Estate Income Fund | 139,377,400 | 9,402,509 | 5,741,598 | 6,065,896 | (40,571) | 881,409 | 143,879,149 |
| Fidelity Series Short-Term Credit Fund | 88,680,442 | 3,874,426 | 4,079,896 | 1,018,804 | (25,923) | 25,372 | 88,474,421 |
| Fidelity Series Small Cap Discovery Fund | 310,348,477 | 26,328,041 | 15,638,080 | 18,659,360 | (237,639) | (4,225,004) | 316,575,795 |
| Fidelity Series Small Cap Opportunities Fund | 947,696,222 | 98,306,995 | 74,534,789 | 77,345,038 | 7,513,985 | 22,230,000 | 1,001,212,413 |
| Fidelity Series Stock Selector Large Cap Value Fund | 1,777,139,590 | 40,439,055 | 110,604,134 | -- | (703,827) | 122,169,919 | 1,828,440,603 |
| Fidelity Series Value Discovery Fund | 1,262,780,275 | 28,774,334 | 57,181,244 | -- | 348,018 | 73,441,689 | 1,308,163,072 |
| | $31,934,876,930 | $3,218,978,872 | $3,246,280,546 | $628,254,575 | $305,784,570 | $320,765,349 | $32,534,125,175 |
Amounts in the income column in the above table include any capital gain distributions from underlying funds, which are presented in the corresponding line-item in the Statement of Operations if applicable.
Investment Valuation
The following is a summary of the inputs used, as of September 30, 2018, involving the Fund's assets and liabilities carried at fair value. The inputs or methodology used for valuing securities may not be an indication of the risk associated with investing in those securities. For more information on valuation inputs, and their aggregation into the levels used below, please refer to the Investment Valuation section in the accompanying Notes to Financial Statements.
| | Valuation Inputs at Reporting Date: |
| Description | Total | Level 1 | Level 2 | Level 3 |
| Investments in Securities: | | | | |
| Other Short-Term Investments | $25,204,030 | $-- | $25,204,030 | $-- |
| Domestic Equity Funds | 16,203,936,994 | 16,203,936,994 | -- | -- |
| International Equity Funds | 7,943,177,030 | 7,943,177,030 | -- | -- |
| Bond Funds | 7,751,215,397 | 7,751,215,397 | -- | -- |
| Short-Term Funds | 690,495,189 | 690,495,189 | -- | -- |
| Total Investments in Securities: | $32,614,028,640 | $32,588,824,610 | $25,204,030 | $-- |
| Derivative Instruments: | | | | |
| Assets | | | | |
| Futures Contracts | $4,606,140 | $4,606,140 | $-- | $-- |
| Total Assets | $4,606,140 | $4,606,140 | $-- | $-- |
| Liabilities | | | | |
| Futures Contracts | $(576,670) | $(576,670) | $-- | $-- |
| Total Liabilities | $(576,670) | $(576,670) | $-- | $-- |
| Total Derivative Instruments: | $4,029,470 | $4,029,470 | $-- | $-- |
Value of Derivative Instruments
The following table is a summary of the Fund's value of derivative instruments by primary risk exposure as of September 30, 2018. For additional information on derivative instruments, please refer to the Derivative Instruments section in the accompanying Notes to Financial Statements.
| Primary Risk Exposure / Derivative Type | Value |
| | Asset | Liability |
| Equity Risk | | |
| Futures Contracts(a) | $4,606,140 | $(576,670) |
| Total Equity Risk | 4,606,140 | (576,670) |
| Total Value of Derivatives | $4,606,140 | $(576,670) |
(a) Reflects gross cumulative appreciation (depreciation) on futures contracts as presented in the Schedule of Investments. In the Statement of Assets and Liabilities, the period end daily variation margin is included in receivable or payable for daily variation margin on futures contracts, and the net cumulative appreciation (depreciation) is included in net unrealized appreciation (depreciation).
See accompanying notes which are an integral part of the financial statements.
Fidelity Freedom® 2030 Fund
Financial Statements
Statement of Assets and Liabilities
| | | September 30, 2018 (Unaudited) |
| Assets | | |
Investment in securities, at value — See accompanying schedule:
Unaffiliated issuers (cost $25,205,940) | $25,204,030 | |
| Fidelity Central Funds (cost $54,699,435) | 54,699,435 | |
| Other affiliated issuers (cost $26,807,446,571) | 32,534,125,175 | |
| Total Investment in Securities (cost $26,887,351,946) | | $32,614,028,640 |
| Receivable for investments sold | | 28,439,597 |
| Receivable for fund shares sold | | 584,248,775 |
| Distributions receivable from Fidelity Central Funds | | 79,961 |
| Other receivables | | 174,805 |
| Total assets | | 33,226,971,778 |
| Liabilities | | |
| Payable for investments purchased | $37,076,575 | |
| Payable for fund shares redeemed | 575,563,524 | |
| Accrued management fee | 17,106,352 | |
| Payable for daily variation margin on futures contracts | 1,603,663 | |
| Other payables and accrued expenses | 174,810 | |
| Total liabilities | | 631,524,924 |
| Net Assets | | $32,595,446,854 |
| Net Assets consist of: | | |
| Paid in capital | | $26,117,842,770 |
| Undistributed net investment income | | 126,011,784 |
| Accumulated undistributed net realized gain (loss) on investments | | 620,886,136 |
| Net unrealized appreciation (depreciation) on investments | | 5,730,706,164 |
| Net Assets | | $32,595,446,854 |
| Fidelity Freedom 2030 Fund: | | |
| Net Asset Value, offering price and redemption price per share ($13,154,661,716 ÷ 724,774,267 shares) | | $18.15 |
| Class K: | | |
| Net Asset Value, offering price and redemption price per share ($17,523,373,807 ÷ 966,301,913 shares) | | $18.13 |
| Class K6: | | |
| Net Asset Value, offering price and redemption price per share ($1,917,411,331 ÷ 105,627,135 shares) | | $18.15 |
See accompanying notes which are an integral part of the financial statements.
Statement of Operations
| | | Six months ended September 30, 2018 (Unaudited) |
| Investment Income | | |
| Dividends: | | |
| Affiliated issuers | | $228,866,659 |
| Interest | | 127,831 |
| Income from Fidelity Central Funds | | 221,630 |
| Total income | | 229,216,120 |
| Expenses | | |
| Management fee | $102,979,239 | |
| Independent trustees' fees and expenses | 78,558 | |
| Total expenses before reductions | 103,057,797 | |
| Expense reductions | (25) | |
| Total expenses after reductions | | 103,057,772 |
| Net investment income (loss) | | 126,158,348 |
| Realized and Unrealized Gain (Loss) | | |
| Net realized gain (loss) on: | | |
| Investment securities: | | |
| Fidelity Central Funds | 611 | |
| Other affiliated issuers | 305,784,570 | |
| Futures contracts | (26,433,469) | |
| Capital gain distributions from underlying funds: | | |
| Affiliated issuers | 399,387,916 | |
| Total net realized gain (loss) | | 678,739,628 |
| Change in net unrealized appreciation (depreciation) on: | | |
| Investment securities: | | |
| Unaffiliated issuers | (1,773) | |
| Affiliated issuers | 320,765,349 | |
| Futures contracts | 4,029,470 | |
| Total change in net unrealized appreciation (depreciation) | | 324,793,046 |
| Net gain (loss) | | 1,003,532,674 |
| Net increase (decrease) in net assets resulting from operations | | $1,129,691,022 |
See accompanying notes which are an integral part of the financial statements.
Statement of Changes in Net Assets
| | Six months ended September 30, 2018 (Unaudited) | Year ended March 31, 2018 |
| Increase (Decrease) in Net Assets | | |
| Operations | | |
| Net investment income (loss) | $126,158,348 | $381,629,218 |
| Net realized gain (loss) | 678,739,628 | 1,448,536,874 |
| Change in net unrealized appreciation (depreciation) | 324,793,046 | 643,449,189 |
| Net increase (decrease) in net assets resulting from operations | 1,129,691,022 | 2,473,615,281 |
| Distributions to shareholders from net investment income | – | (396,775,824) |
| Distributions to shareholders from net realized gain | (851,354,197) | (769,505,029) |
| Total distributions | (851,354,197) | (1,166,280,853) |
| Share transactions - net increase (decrease) | 395,481,166 | 19,308,625,938 |
| Total increase (decrease) in net assets | 673,817,991 | 20,615,960,366 |
| Net Assets | | |
| Beginning of period | 31,921,628,863 | 11,305,668,497 |
| End of period | $32,595,446,854 | $31,921,628,863 |
| Other Information | | |
| Undistributed net investment income end of period | $126,011,784 | $– |
| Distributions in excess of net investment income end of period | $– | $(146,564) |
See accompanying notes which are an integral part of the financial statements.
Financial Highlights
Fidelity Freedom 2030 Fund
| | Six months ended (Unaudited) September 30, | Years endedMarch 31, | | | | |
| | 2018 | 2018 | 2017 | 2016 | 2015 | 2014 |
| Selected Per–Share Data | | | | | | |
| Net asset value, beginning of period | $18.00 | $16.72 | $15.20 | $16.62 | $16.47 | $15.02 |
| Income from Investment Operations | | | | | | |
| Net investment income (loss)A | .06 | .21 | .25 | .25 | .27 | .24 |
| Net realized and unrealized gain (loss) | .57 | 1.90 | 1.90 | (.75) | .95 | 1.71 |
| Total from investment operations | .63 | 2.11 | 2.15 | (.50) | 1.22 | 1.95 |
| Distributions from net investment income | – | (.22) | (.25) | (.26) | (.28) | (.25) |
| Distributions from net realized gain | (.48) | (.61) | (.38) | (.67) | (.79) | (.25) |
| Total distributions | (.48) | (.83) | (.63) | (.92)B | (1.07) | (.50) |
| Net asset value, end of period | $18.15 | $18.00 | $16.72 | $15.20 | $16.62 | $16.47 |
| Total ReturnC,D | 3.52% | 12.78% | 14.58% | (3.17)% | 7.76% | 13.08% |
| Ratios to Average Net AssetsE,F | | | | | | |
| Expenses before reductions | .70%G | .59% | - %H | - %H | - %H | - %H |
| Expenses net of fee waivers, if any | .70%G | .59% | -% | -% | -% | -% |
| Expenses net of all reductions | .70%G | .59% | -% | -% | -% | -% |
| Net investment income (loss) | .72%G | 1.20% | 1.57% | 1.59% | 1.68% | 1.50% |
| Supplemental Data | | | | | | |
| Net assets, end of period (000 omitted) | $13,154,662 | $12,684,794 | $11,305,668 | $10,150,137 | $10,883,658 | $10,933,549 |
| Portfolio turnover rateF | 20%G | 18%I | 17% | 16% | 17% | 54% |
A Calculated based on average shares outstanding during the period.
B Total distributions of $.92 per share is comprised of distributions from net investment income of $.257 and distributions from net realized gain of $.665 per share.
C Total returns for periods of less than one year are not annualized.
D Total returns would have been lower if certain expenses had not been reduced during the applicable periods shown.
E Expense ratios reflect operating expenses of the class. Expenses before reductions do not reflect amounts reimbursed by the investment adviser or reductions from expense offset arrangements and do not represent the amount paid by the class during periods when reimbursements or reductions occur. Expenses net of fee waivers reflect expenses after reimbursement by the investment adviser but prior to reductions from expense offset arrangements. Expenses net of all reductions represent the net expenses paid by the class but do not include expenses of the underlying funds in which the Fund invests.
F Amounts do not include the activity of the Underlying Funds.
G Annualized
H Amount represents less than $.005 per share.
I The portfolio turnover rate does not include the assets acquired in the merger.
See accompanying notes which are an integral part of the financial statements.
Fidelity Freedom 2030 Fund Class K
| | Six months ended (Unaudited) September 30, | Years endedMarch 31, |
| | 2018 | 2018 A |
| Selected Per–Share Data | | |
| Net asset value, beginning of period | $17.98 | $17.47 |
| Income from Investment Operations | | |
| Net investment income (loss)B | .07 | .28 |
| Net realized and unrealized gain (loss) | .56 | .81 |
| Total from investment operations | .63 | 1.09 |
| Distributions from net investment income | – | (.24) |
| Distributions from net realized gain | (.48) | (.35) |
| Total distributions | (.48) | (.58)C |
| Net asset value, end of period | $18.13 | $17.98 |
| Total ReturnD,E | 3.53% | 6.24% |
| Ratios to Average Net AssetsF,G | | |
| Expenses before reductions | .60%H | .62%H,I |
| Expenses net of fee waivers, if any | .60%H | .62%H,I |
| Expenses net of all reductions | .60%H | .62%H,I |
| Net investment income (loss) | .81%H | 2.23%H |
| Supplemental Data | | |
| Net assets, end of period (000 omitted) | $17,523,374 | $18,414,961 |
| Portfolio turnover rateG | 20%H | 18%J |
A For the period July 20, 2017 (commencement of sale of shares) to March 31, 2018.
B Calculated based on average shares outstanding during the period.
C Total distributions of $.58 per share is comprised of distributions from net investment income of $.237 and distributions from net realized gain of $.345 per share.
D Total returns for periods of less than one year are not annualized.
E Total returns would have been lower if certain expenses had not been reduced during the applicable periods shown.
F Expense ratios reflect operating expenses of the class. Expenses before reductions do not reflect amounts reimbursed by the investment adviser or reductions from expense offset arrangements and do not represent the amount paid by the class during periods when reimbursements or reductions occur. Expense ratios before reductions for start-up periods may not be representative of longer-term operating periods. Expenses net of fee waivers reflect expenses after reimbursement by the investment adviser but prior to reductions from expense offset arrangements. Expenses net of all reductions represent the net expenses paid by the class but do not include expenses of the underlying funds in which the Fund invests.
G Amounts do not include the activity of the Underlying Funds.
H Annualized
I On certain classes, the size and fluctuation of net assets and expense amounts may cause ratios to differ from contractual rates.
J The portfolio turnover rate does not include the assets acquired in the merger.
See accompanying notes which are an integral part of the financial statements.
Fidelity Freedom 2030 Fund Class K6
| | Six months ended (Unaudited) September 30, | Years endedMarch 31, |
| | 2018 | 2018 A |
| Selected Per–Share Data | | |
| Net asset value, beginning of period | $18.00 | $17.15 |
| Income from Investment Operations | | |
| Net investment income (loss)B | .08 | .26 |
| Net realized and unrealized gain (loss) | .56 | 1.18 |
| Total from investment operations | .64 | 1.44 |
| Distributions from net investment income | – | (.24) |
| Distributions from net realized gain | (.49) | (.35) |
| Total distributions | (.49) | (.59) |
| Net asset value, end of period | $18.15 | $18.00 |
| Total ReturnC,D | 3.60% | 8.35% |
| Ratios to Average Net AssetsE,F | | |
| Expenses before reductions | .47%G | .48%G,H |
| Expenses net of fee waivers, if any | .47%G | .48%G,H |
| Expenses net of all reductions | .47%G | .48%G,H |
| Net investment income (loss) | .94%G | 1.76%G |
| Supplemental Data | | |
| Net assets, end of period (000 omitted) | $1,917,411 | $821,874 |
| Portfolio turnover rateF | 20%G | 18%I |
A For the period June 7, 2017 (commencement of sale of shares) to March 31, 2018.
B Calculated based on average shares outstanding during the period.
C Total returns for periods of less than one year are not annualized.
D Total returns would have been lower if certain expenses had not been reduced during the applicable periods shown.
E Expense ratios reflect operating expenses of the class. Expenses before reductions do not reflect amounts reimbursed by the investment adviser or reductions from expense offset arrangements and do not represent the amount paid by the class during periods when reimbursements or reductions occur. Expense ratios before reductions for start-up periods may not be representative of longer-term operating periods. Expenses net of fee waivers reflect expenses after reimbursement by the investment adviser but prior to reductions from expense offset arrangements. Expenses net of all reductions represent the net expenses paid by the class but do not include expenses of the underlying funds in which the Fund invests.
F Amounts do not include the activity of the Underlying Funds.
G Annualized
H On certain classes, the size and fluctuation of net assets and expense amounts may cause ratios to differ from contractual rates.
I The portfolio turnover rate does not include the assets acquired in the merger.
See accompanying notes which are an integral part of the financial statements.
Fidelity Freedom® 2035 Fund
Investment Summary (Unaudited)
The information in the following tables is based on the direct investments of the Fund.
Top Holdings as of September 30, 2018
| | % of fund's net assets |
| Fidelity Series Intrinsic Opportunities Fund | 9.9 |
| Fidelity Series Large Cap Stock Fund | 8.9 |
| Fidelity Series International Growth Fund | 8.8 |
| Fidelity Series International Value Fund | 8.7 |
| Fidelity Series Growth Company Fund | 8.3 |
| Fidelity Series Emerging Markets Opportunities Fund | 8.1 |
| Fidelity Series Stock Selector Large Cap Value Fund | 6.6 |
| Fidelity Series Long-Term Treasury Bond Index Fund | 5.7 |
| Fidelity Series Value Discovery Fund | 4.7 |
| Fidelity Series Opportunistic Insights Fund | 4.5 |
| | 74.2 |
Asset Allocation (% of fund's net assets)
| Period end |
| | Domestic Equity Funds | 58.4% |
| | International Equity Funds | 28.9% |
| | Bond Funds | 10.2% |
| | Short-Term Funds | 2.5% |
| | Short-Term Investments | 0.1% |
| | Net Other Assets (Liabilities)* | (0.1)% |

* Net Other Assets (Liabilities) are not included in the pie chart
Domestic Equity Funds category includes Fidelity Series Commodity Strategy Fund which invests in commodity-related investments.
Fidelity Freedom® 2035 Fund
Schedule of Investments September 30, 2018 (Unaudited)
Showing Percentage of Net Assets
| U.S. Treasury Obligations - 0.1% | | | |
| | | Principal Amount | Value |
| U.S. Treasury Bills, yield at date of purchase 1.99% to 2.11% 11/1/18 to 12/6/18 (a) | | | |
| (Cost $17,577,887) | | 17,640,000 | 17,576,708 |
| | | Shares | Value |
|
| Domestic Equity Funds - 58.4% | | | |
| Fidelity Series All-Sector Equity Fund (b) | | 36,814,673 | $501,047,694 |
| Fidelity Series Blue Chip Growth Fund (b) | | 60,663,209 | 928,147,102 |
| Fidelity Series Commodity Strategy Fund (b) | | 89,911,671 | 449,558,355 |
| Fidelity Series Growth Company Fund (b) | | 92,790,382 | 1,875,293,611 |
| Fidelity Series Intrinsic Opportunities Fund (b) | | 121,998,296 | 2,236,228,763 |
| Fidelity Series Large Cap Stock Fund (b) | | 125,505,222 | 1,999,298,183 |
| Fidelity Series Large Cap Value Index Fund (b) | | 41,863,738 | 552,601,343 |
| Fidelity Series Opportunistic Insights Fund (b) | | 50,841,038 | 1,009,194,608 |
| Fidelity Series Small Cap Discovery Fund (b) | | 20,977,180 | 254,872,740 |
| Fidelity Series Small Cap Opportunities Fund (b) | | 55,328,429 | 812,774,628 |
| Fidelity Series Stock Selector Large Cap Value Fund (b) | | 112,814,009 | 1,491,401,198 |
| Fidelity Series Value Discovery Fund (b) | | 76,860,403 | 1,052,218,913 |
| TOTAL DOMESTIC EQUITY FUNDS | | | |
| (Cost $9,840,507,082) | | | 13,162,637,138 |
|
| International Equity Funds - 28.9% | | | |
| Fidelity Series Canada Fund (b) | | 17,897,494 | 193,471,907 |
| Fidelity Series Emerging Markets Fund (b) | | 8,343,172 | 80,845,337 |
| Fidelity Series Emerging Markets Opportunities Fund (b) | | 95,777,119 | 1,837,962,916 |
| Fidelity Series International Growth Fund (b) | | 120,789,387 | 1,980,945,950 |
| Fidelity Series International Small Cap Fund (b) | | 25,267,369 | 452,285,906 |
| Fidelity Series International Value Fund (b) | | 187,089,755 | 1,968,184,226 |
| TOTAL INTERNATIONAL EQUITY FUNDS | | | |
| (Cost $5,341,147,046) | | | 6,513,696,242 |
|
| Bond Funds - 10.2% | | | |
| Fidelity Series Emerging Markets Debt Fund (b) | | 14,217,374 | 135,491,577 |
| Fidelity Series Floating Rate High Income Fund (b) | | 5,130,279 | 48,840,256 |
| Fidelity Series High Income Fund (b) | | 31,321,943 | 301,003,871 |
| Fidelity Series Inflation-Protected Bond Index Fund (b) | | 6,991,725 | 67,889,646 |
| Fidelity Series International Credit Fund (b) | | 1,004,298 | 9,872,251 |
| Fidelity Series Investment Grade Bond Fund (b) | | 33,211,964 | 361,678,292 |
| Fidelity Series Long-Term Treasury Bond Index Fund (b) | | 154,389,770 | 1,272,171,704 |
| Fidelity Series Real Estate Income Fund (b) | | 8,986,146 | 96,870,657 |
| TOTAL BOND FUNDS | | | |
| (Cost $2,366,856,425) | | | 2,293,818,254 |
|
| Short-Term Funds - 2.5% | | | |
| Fidelity Cash Central Fund, 2.11% (c) | | 38,244,331 | 38,251,980 |
| Fidelity Series Government Money Market Fund 2.12% (b)(d) | | 462,174,903 | 462,174,903 |
| Fidelity Series Short-Term Credit Fund (b) | | 7,762,794 | 76,541,145 |
| TOTAL SHORT-TERM FUNDS | | | |
| (Cost $577,645,636) | | | 576,968,028 |
| TOTAL INVESTMENT IN SECURITIES - 100.1% | | | |
| (Cost $18,143,734,076) | | | 22,564,696,370 |
| NET OTHER ASSETS (LIABILITIES) - (0.1)% | | | (13,410,204) |
| NET ASSETS - 100% | | | $22,551,286,166 |
| Futures Contracts | | | | | |
| | Number of contracts | Expiration Date | Notional Amount | Value | Unrealized Appreciation/(Depreciation) |
| Purchased | | | | | |
| Equity Index Contracts | | | | | |
| ICE E-mini MSCI Emerging Markets Index Contracts (United States) | 2,751 | Dec. 2018 | $144,386,235 | $2,627,144 | $2,627,144 |
| Sold | | | | | |
| Equity Index Contracts | | | | | |
| CME E-mini S&P 500 Index Contracts (United States) | 494 | Dec. 2018 | 72,099,300 | (19,060) | (19,060) |
| TOTAL FUTURES CONTRACTS | | | | | $2,608,084 |
The notional amount of futures purchased as a percentage of Net Assets is 0.6%
The notional amount of futures sold as a percentage of Net Assets is 0.3%
Legend
(a) Security or a portion of the security was pledged to cover margin requirements for futures contracts. At period end, the value of securities pledged amounted to $7,887,391.
(b) Affiliated Fund
(c) Affiliated fund that is generally available only to investment companies and other accounts managed by Fidelity Investments. The rate quoted is the annualized seven-day yield of the fund at period end. A complete unaudited listing of the fund's holdings as of its most recent quarter end is available upon request. In addition, each Fidelity Central Fund's financial statements are available on the SEC's website or upon request.
(d) The rate quoted is the annualized seven-day yield of the fund at period end.
Affiliated Central Funds
Information regarding fiscal year to date income earned by the Fund from investments in Fidelity Central Funds is as follows:
| Fund | Income earned |
| Fidelity Cash Central Fund | $145,928 |
| Total | $145,928 |
Amounts in the income column in the above table include any capital gain distributions from underlying funds, which are presented in the corresponding line-item in the Statement of Operations if applicable.
Affiliated Underlying Funds
Fiscal year to date information regarding the Fund's investments in affiliated Underlying Funds, excluding any Money Market Central Funds, is presented below. Exchanges between classes of the same affiliated Underlying Funds may occur.
| Affiliate | Value, beginning of period | Purchases | Sales Proceeds | Dividend Income | Realized Gain (loss) | Change in Unrealized appreciation (depreciation) | Value, end of period |
| Fidelity Series 100 Index Fund | $418,817,851 | $3,601 | $440,838,264 | $-- | $160,376,149 | $(138,359,337) | $-- |
| Fidelity Series All-Sector Equity Fund | 805,615,379 | 27,361,544 | 420,827,419 | -- | 36,027,949 | 52,870,241 | 501,047,694 |
| Fidelity Series Blue Chip Growth Fund | 832,667,609 | 114,383,257 | 81,570,449 | 85,894,267 | 9,683,702 | 52,982,983 | 928,147,102 |
| Fidelity Series Canada Fund | 185,991,221 | 6,149,793 | 10,250,918 | -- | (11,650) | 11,593,461 | 193,471,907 |
| Fidelity Series Commodity Strategy Fund | 453,122,550 | 76,772,936 | 43,332,261 | 26,837,691 | (17,353,739) | (19,651,131) | 449,558,355 |
| Fidelity Series Emerging Markets Debt Fund | 140,311,483 | 8,610,723 | 5,742,203 | 4,137,287 | (307,279) | (7,381,147) | 135,491,577 |
| Fidelity Series Emerging Markets Fund | -- | 80,275,959 | -- | -- | -- | 569,378 | 80,845,337 |
| Fidelity Series Emerging Markets | 1,945,942,220 | 223,499,911 | 88,001,466 | -- | 10,448,933 | (253,926,682) | 1,837,962,916 |
| Fidelity Series Floating Rate High Income | 47,711,855 | 3,153,791 | 2,076,272 | 1,290,502 | (79,995) | 130,877 | 48,840,256 |
| Fidelity Series Government Money Market | 352,943,664 | 270,920,162 | 161,688,923 | 3,578,741 | -- | -- | 462,174,903 |
| Fidelity Series Growth Company Fund | 1,693,158,763 | 57,557,267 | 128,860,040 | -- | 11,147,470 | 242,290,151 | 1,875,293,611 |
| Fidelity Series High Income Fund | 298,102,772 | 18,339,807 | 17,915,862 | 8,705,548 | (470,083) | 2,947,237 | 301,003,871 |
| Fidelity Series Inflation-Protected Bond | 174,598,700 | 9,342,620 | 117,010,764 | 246,475 | (1,578,931) | 2,538,021 | 67,889,646 |
| Fidelity Series International Credit Fund | 10,076,621 | 125,758 | 228,757 | 124,183 | (3,046) | (98,325) | 9,872,251 |
| Fidelity Series International Growth Fund | 1,868,762,602 | 153,379,972 | 70,470,184 | -- | 1,300,738 | 27,972,822 | 1,980,945,950 |
| Fidelity Series International Small Cap Fund | 466,280,560 | 20,569,472 | 16,553,692 | -- | 107,215 | (18,117,649) | 452,285,906 |
| Fidelity Series International Value Fund | 1,895,917,767 | 107,796,187 | 31,170,945 | -- | (349,328) | (4,009,455) | 1,968,184,226 |
| Fidelity Series Intrinsic Opportunities Fund | 2,060,082,541 | 219,240,215 | 72,729,681 | 98,684,642 | (594,625) | 30,230,313 | 2,236,228,763 |
| Fidelity Series Investment Grade Bond Fund | 615,546,408 | 88,212,235 | 335,643,559 | 8,174,344 | (9,336,344) | 2,899,552 | 361,678,292 |
| Fidelity Series Large Cap Stock Fund | 1,821,590,263 | 180,934,692 | 91,419,252 | 116,769,390 | 2,891,183 | 85,301,297 | 1,999,298,183 |
| Fidelity Series Large Cap Value Index Fund | 522,138,865 | 18,247,259 | 24,557,870 | -- | 237,831 | 36,535,258 | 552,601,343 |
| Fidelity Series Long-Term Treasury Bond | 491,792,423 | 833,013,935 | 7,929,947 | 12,300,551 | (65,252) | (44,639,455) | 1,272,171,704 |
| Fidelity Series Opportunistic Insights Fund | 912,528,026 | 31,309,395 | 53,789,259 | -- | 2,647,348 | 116,499,098 | 1,009,194,608 |
| Fidelity Series Real Estate Equity Fund | 164,451,251 | 839,371 | 170,955,908 | 599,773 | 6,052,433 | (387,147) | -- |
| Fidelity Series Real Estate Income Fund | 92,891,573 | 7,575,464 | 4,153,955 | 4,070,012 | (76,837) | 634,412 | 96,870,657 |
| Fidelity Series Short-Term Credit Fund | 63,956,869 | 15,567,312 | 2,982,244 | 741,324 | (24,635) | 23,843 | 76,541,145 |
| Fidelity Series Small Cap Discovery Fund | 246,110,044 | 23,650,443 | 11,286,557 | 14,889,900 | (235,397) | (3,365,793) | 254,872,740 |
| Fidelity Series Small Cap Opportunities Fund | 755,904,140 | 88,219,698 | 54,776,548 | 62,629,639 | 3,398,567 | 20,028,771 | 812,774,628 |
| Fidelity Series Stock Selector Large Cap | 1,415,005,805 | 65,512,938 | 86,527,858 | -- | (219,711) | 97,630,024 | 1,491,401,198 |
| Fidelity Series Value Discovery Fund | 1,003,212,077 | 35,601,371 | 45,578,684 | -- | 59,606 | 58,924,543 | 1,052,218,913 |
| | $21,755,231,902 | $2,786,167,088 | $2,598,869,741 | $449,674,269 | $213,672,272 | $352,666,161 | $22,508,867,682 |
Amounts in the income column in the above table include any capital gain distributions from underlying funds, which are presented in the corresponding line-item in the Statement of Operations if applicable.
Investment Valuation
The following is a summary of the inputs used, as of September 30, 2018, involving the Fund's assets and liabilities carried at fair value. The inputs or methodology used for valuing securities may not be an indication of the risk associated with investing in those securities. For more information on valuation inputs, and their aggregation into the levels used below, please refer to the Investment Valuation section in the accompanying Notes to Financial Statements.
| | Valuation Inputs at Reporting Date: |
| Description | Total | Level 1 | Level 2 | Level 3 |
| Investments in Securities: | | | | |
| Other Short-Term Investments | $17,576,708 | $-- | $17,576,708 | $-- |
| Domestic Equity Funds | 13,162,637,138 | 13,162,637,138 | -- | -- |
| International Equity Funds | 6,513,696,242 | 6,513,696,242 | -- | -- |
| Bond Funds | 2,293,818,254 | 2,293,818,254 | -- | -- |
| Short-Term Funds | 576,968,028 | 576,968,028 | -- | -- |
| Total Investments in Securities: | $22,564,696,370 | $22,547,119,662 | $17,576,708 | $-- |
| Derivative Instruments: | | | | |
| Assets | | | | |
| Futures Contracts | $2,627,144 | $2,627,144 | $-- | $-- |
| Total Assets | $2,627,144 | $2,627,144 | $-- | $-- |
| Liabilities | | | | |
| Futures Contracts | $(19,060) | $(19,060) | $-- | $-- |
| Total Liabilities | $(19,060) | $(19,060) | $-- | $-- |
| Total Derivative Instruments: | $2,608,084 | $2,608,084 | $-- | $-- |
Value of Derivative Instruments
The following table is a summary of the Fund's value of derivative instruments by primary risk exposure as of September 30, 2018. For additional information on derivative instruments, please refer to the Derivative Instruments section in the accompanying Notes to Financial Statements.
| Primary Risk Exposure / Derivative Type | Value |
| | Asset | Liability |
| Equity Risk | | |
| Futures Contracts(a) | $2,627,144 | $(19,060) |
| Total Equity Risk | 2,627,144 | (19,060) |
| Total Value of Derivatives | $2,627,144 | $(19,060) |
(a) Reflects gross cumulative appreciation (depreciation) on futures contracts as presented in the Schedule of Investments. In the Statement of Assets and Liabilities, the period end daily variation margin is included in receivable or payable for daily variation margin on futures contracts, and the net cumulative appreciation (depreciation) is included in net unrealized appreciation (depreciation).
See accompanying notes which are an integral part of the financial statements.
Fidelity Freedom® 2035 Fund
Financial Statements
Statement of Assets and Liabilities
| | | September 30, 2018 (Unaudited) |
| Assets | | |
Investment in securities, at value — See accompanying schedule:
Unaffiliated issuers (cost $17,577,887) | $17,576,708 | |
| Fidelity Central Funds (cost $38,251,980) | 38,251,980 | |
| Other affiliated issuers (cost $18,087,904,209) | 22,508,867,682 | |
| Total Investment in Securities (cost $18,143,734,076) | | $22,564,696,370 |
| Receivable for investments sold | | 124,362,252 |
| Receivable for fund shares sold | | 531,751,543 |
| Distributions receivable from Fidelity Central Funds | | 56,169 |
| Total assets | | 23,220,866,334 |
| Liabilities | | |
| Payable for investments purchased | $136,895,830 | |
| Payable for fund shares redeemed | 519,193,278 | |
| Accrued management fee | 12,417,868 | |
| Payable for daily variation margin on futures contracts | 1,073,192 | |
| Total liabilities | | 669,580,168 |
| Net Assets | | $22,551,286,166 |
| Net Assets consist of: | | |
| Paid in capital | | $17,589,345,001 |
| Undistributed net investment income | | 52,160,426 |
| Accumulated undistributed net realized gain (loss) on investments | | 486,210,361 |
| Net unrealized appreciation (depreciation) on investments | | 4,423,570,378 |
| Net Assets | | $22,551,286,166 |
| Fidelity Freedom 2035 Fund: | | |
| Net Asset Value, offering price and redemption price per share ($8,454,366,057 ÷ 547,781,227 shares) | | $15.43 |
| Class K: | | |
| Net Asset Value, offering price and redemption price per share ($12,449,643,168 ÷ 807,585,097 shares) | | $15.42 |
| Class K6: | | |
| Net Asset Value, offering price and redemption price per share ($1,647,276,941 ÷ 106,684,812 shares) | | $15.44 |
See accompanying notes which are an integral part of the financial statements.
Statement of Operations
| | | Six months ended September 30, 2018 (Unaudited) |
| Investment Income | | �� |
| Dividends: | | |
| Affiliated issuers | | $126,493,352 |
| Interest | | 82,705 |
| Income from Fidelity Central Funds | | 145,928 |
| Total income | | 126,721,985 |
| Expenses | | |
| Management fee | $74,507,738 | |
| Independent trustees' fees and expenses | 53,821 | |
| Total expenses | | 74,561,559 |
| Net investment income (loss) | | 52,160,426 |
| Realized and Unrealized Gain (Loss) | | |
| Net realized gain (loss) on: | | |
| Investment securities: | | |
| Fidelity Central Funds | 103 | |
| Other affiliated issuers | 213,672,272 | |
| Futures contracts | (12,173,716) | |
| Capital gain distributions from underlying funds: | | |
| Affiliated issuers | 323,180,917 | |
| Total net realized gain (loss) | | 524,679,576 |
| Change in net unrealized appreciation (depreciation) on: | | |
| Investment securities: | | |
| Unaffiliated issuers | (1,179) | |
| Affiliated issuers | 352,666,161 | |
| Futures contracts | 2,608,084 | |
| Total change in net unrealized appreciation (depreciation) | | 355,273,066 |
| Net gain (loss) | | 879,952,642 |
| Net increase (decrease) in net assets resulting from operations | | $932,113,068 |
See accompanying notes which are an integral part of the financial statements.
Statement of Changes in Net Assets
| | Six months ended September 30, 2018 (Unaudited) | Year ended March 31, 2018 |
| Increase (Decrease) in Net Assets | | |
| Operations | | |
| Net investment income (loss) | $52,160,426 | $234,969,726 |
| Net realized gain (loss) | 524,679,576 | 967,655,889 |
| Change in net unrealized appreciation (depreciation) | 355,273,066 | 651,152,594 |
| Net increase (decrease) in net assets resulting from operations | 932,113,068 | 1,853,778,209 |
| Distributions to shareholders from net investment income | – | (255,443,857) |
| Distributions to shareholders from net realized gain | (589,171,303) | (469,405,267) |
| Total distributions | (589,171,303) | (724,849,124) |
| Share transactions - net increase (decrease) | 465,511,100 | 13,724,076,087 |
| Total increase (decrease) in net assets | 808,452,865 | 14,853,005,172 |
| Net Assets | | |
| Beginning of period | 21,742,833,301 | 6,889,828,129 |
| End of period | $22,551,286,166 | $21,742,833,301 |
| Other Information | | |
| Undistributed net investment income end of period | $52,160,426 | $– |
See accompanying notes which are an integral part of the financial statements.
Financial Highlights
Fidelity Freedom 2035 Fund
| | Six months ended (Unaudited) September 30, | Years endedMarch 31, | | | | |
| | 2018 | 2018 | 2017 | 2016 | 2015 | 2014 |
| Selected Per–Share Data | | | | | | |
| Net asset value, beginning of period | $15.20 | $13.88 | $12.46 | $13.67 | $13.62 | $12.57 |
| Income from Investment Operations | | | | | | |
| Net investment income (loss)A | .03 | .16 | .19 | .19 | .22 | .18 |
| Net realized and unrealized gain (loss) | .61 | 1.81 | 1.75 | (.65) | .80 | 1.63 |
| Total from investment operations | .64 | 1.97 | 1.94 | (.46) | 1.02 | 1.81 |
| Distributions from net investment income | – | (.17) | (.18) | (.20) | (.23) | (.19) |
| Distributions from net realized gain | (.41) | (.47) | (.34) | (.55) | (.75) | (.57) |
| Total distributions | (.41) | (.65)B | (.52) | (.75) | (.97)C | (.76) |
| Net asset value, end of period | $15.43 | $15.20 | $13.88 | $12.46 | $13.67 | $13.62 |
| Total ReturnD,E | 4.24% | 14.32% | 16.09% | (3.59)% | 7.90% | 14.76% |
| Ratios to Average Net AssetsF,G | | | | | | |
| Expenses before reductions | .74%H | .63%I | - %J | - %J | - %J | - %J |
| Expenses net of fee waivers, if any | .74%H | .63%I | -% | -% | -% | -% |
| Expenses net of all reductions | .74%H | .63%I | -% | -% | -% | -% |
| Net investment income (loss) | .40%H | 1.06% | 1.45% | 1.48% | 1.62% | 1.42% |
| Supplemental Data | | | | | | |
| Net assets, end of period (000 omitted) | $8,454,366 | $8,050,659 | $6,889,828 | $5,961,088 | $6,289,345 | $6,183,144 |
| Portfolio turnover rateF | 23%H | 17%K | 16% | 15% | 18% | 54% |
A Calculated based on average shares outstanding during the period.
B Total distributions of $.65 per share is comprised of distributions from net investment income of $.171 and distributions from net realized gain of $.474 per share.
C Total distributions of $.97 per share is comprised of distributions from net investment income of $.226 and distributions from net realized gain of $.746 per share.
D Total returns for periods of less than one year are not annualized.
E Total returns would have been lower if certain expenses had not been reduced during the applicable periods shown.
F Amounts do not include the activity of the Underlying Funds.
G Expense ratios reflect operating expenses of the class. Expenses before reductions do not reflect amounts reimbursed by the investment adviser or reductions from expense offset arrangements and do not represent the amount paid by the class during periods when reimbursements or reductions occur. Expenses net of fee waivers reflect expenses after reimbursement by the investment adviser but prior to reductions from expense offset arrangements. Expenses net of all reductions represent the net expenses paid by the class but do not include expenses of the underlying funds in which the Fund invests.
H Annualized
I On certain classes, the size and fluctuation of net assets and expense amounts may cause ratios to differ from contractual rates.
J Amount represents less than .005%.
K The portfolio turnover rate does not include the assets acquired in the merger.
See accompanying notes which are an integral part of the financial statements.
Fidelity Freedom 2035 Fund Class K
| | Six months ended (Unaudited) September 30, | Years endedMarch 31, |
| | 2018 | 2018 A |
| Selected Per–Share Data | | |
| Net asset value, beginning of period | $15.18 | $14.60 |
| Income from Investment Operations | | |
| Net investment income (loss)B | .04 | .22 |
| Net realized and unrealized gain (loss) | .61 | .82 |
| Total from investment operations | .65 | 1.04 |
| Distributions from net investment income | – | (.19) |
| Distributions from net realized gain | (.41) | (.26) |
| Total distributions | (.41) | (.46)C |
| Net asset value, end of period | $15.42 | $15.18 |
| Total ReturnD,E | 4.32% | 7.09% |
| Ratios to Average Net AssetsF,G | | |
| Expenses before reductions | .64%H | .65%H,I |
| Expenses net of fee waivers, if any | .64%H | .65%H,I |
| Expenses net of all reductions | .64%H | .65%H,I |
| Net investment income (loss) | .50%H | 2.07%H |
| Supplemental Data | | |
| Net assets, end of period (000 omitted) | $12,449,643 | $12,979,898 |
| Portfolio turnover rateF | 23%H | 17%J |
A For the period July 20, 2017 (commencement of sale of shares) to March 31, 2018.
B Calculated based on average shares outstanding during the period.
C Total distributions of $.46 per share is comprised of distributions from net investment income of $.193 and distributions from net realized gain of $.264 per share.
D Total returns for periods of less than one year are not annualized.
E Total returns would have been lower if certain expenses had not been reduced during the applicable periods shown.
F Amounts do not include the activity of the Underlying Funds.
G Expense ratios reflect operating expenses of the class. Expenses before reductions do not reflect amounts reimbursed by the investment adviser or reductions from expense offset arrangements and do not represent the amount paid by the class during periods when reimbursements or reductions occur. Expense ratios before reductions for start-up periods may not be representative of longer-term operating periods. Expenses net of fee waivers reflect expenses after reimbursement by the investment adviser but prior to reductions from expense offset arrangements. Expenses net of all reductions represent the net expenses paid by the class but do not include expenses of the underlying funds in which the Fund invests.
H Annualized
I On certain classes, the size and fluctuation of net assets and expense amounts may cause ratios to differ from contractual rates.
J The portfolio turnover rate does not include the assets acquired in the merger.
See accompanying notes which are an integral part of the financial statements.
Fidelity Freedom 2035 Fund Class K6
| | Six months ended (Unaudited) September 30, | Years endedMarch 31, |
| | 2018 | 2018 A |
| Selected Per–Share Data | | |
| Net asset value, beginning of period | $15.20 | $14.30 |
| Income from Investment Operations | | |
| Net investment income (loss)B | .05 | .20 |
| Net realized and unrealized gain (loss) | .61 | 1.16 |
| Total from investment operations | .66 | 1.36 |
| Distributions from net investment income | – | (.20) |
| Distributions from net realized gain | (.42) | (.26) |
| Total distributions | (.42) | (.46) |
| Net asset value, end of period | $15.44 | $15.20 |
| Total ReturnC,D | 4.38% | 9.50% |
| Ratios to Average Net AssetsE,F | | |
| Expenses before reductions | .49%G | .50%G,H |
| Expenses net of fee waivers, if any | .49%G | .50%G,H |
| Expenses net of all reductions | .49%G | .50%G,H |
| Net investment income (loss) | .65%G | 1.61%G |
| Supplemental Data | | |
| Net assets, end of period (000 omitted) | $1,647,277 | $712,276 |
| Portfolio turnover rateE | 23%G | 17%I |
A For the period June 7, 2017 (commencement of sale of shares) to March 31, 2018.
B Calculated based on average shares outstanding during the period.
C Total returns for periods of less than one year are not annualized.
D Total returns would have been lower if certain expenses had not been reduced during the applicable periods shown.
E Amounts do not include the activity of the Underlying Funds.
F Expense ratios reflect operating expenses of the class. Expenses before reductions do not reflect amounts reimbursed by the investment adviser or reductions from expense offset arrangements and do not represent the amount paid by the class during periods when reimbursements or reductions occur. Expense ratios before reductions for start-up periods may not be representative of longer-term operating periods. Expenses net of fee waivers reflect expenses after reimbursement by the investment adviser but prior to reductions from expense offset arrangements. Expenses net of all reductions represent the net expenses paid by the class but do not include expenses of the underlying funds in which the Fund invests.
G Annualized
H On certain classes, the size and fluctuation of net assets and expense amounts may cause ratios to differ from contractual rates.
I The portfolio turnover rate does not include the assets acquired in the merger.
See accompanying notes which are an integral part of the financial statements.
Fidelity Freedom® 2040 Fund
Investment Summary (Unaudited)
The information in the following tables is based on the direct investments of the Fund.
Top Holdings as of September 30, 2018
| | % of fund's net assets |
| Fidelity Series Intrinsic Opportunities Fund | 10.0 |
| Fidelity Series International Growth Fund | 9.2 |
| Fidelity Series International Value Fund | 9.2 |
| Fidelity Series Large Cap Stock Fund | 9.1 |
| Fidelity Series Growth Company Fund | 8.7 |
| Fidelity Series Emerging Markets Opportunities Fund | 8.6 |
| Fidelity Series Stock Selector Large Cap Value Fund | 6.8 |
| Fidelity Series Value Discovery Fund | 4.8 |
| Fidelity Series Opportunistic Insights Fund | 4.6 |
| Fidelity Series Blue Chip Growth Fund | 4.3 |
| | 75.3 |
Asset Allocation (% of fund's net assets)
| Period end |
| | Domestic Equity Funds | 60.5% |
| | International Equity Funds | 30.7% |
| | Bond Funds | 6.8% |
| | Short-Term Funds | 2.0% |
| | Short-Term Investments | 0.1% |
| | Net Other Assets (Liabilities)* | (0.1)% |

* Net Other Assets (Liabilities) are not included in the pie chart
Domestic Equity Funds category includes Fidelity Series Commodity Strategy Fund which invests in commodity-related investments.
Fidelity Freedom® 2040 Fund
Schedule of Investments September 30, 2018 (Unaudited)
Showing Percentage of Net Assets
| U.S. Treasury Obligations - 0.1% | | | |
| | | Principal Amount | Value |
| U.S. Treasury Bills, yield at date of purchase 2.07% to 2.11% 11/23/18 to 12/6/18 (a) | | | |
| (Cost $16,082,704) | | 16,140,000 | 16,081,594 |
| | | Shares | Value |
|
| Domestic Equity Funds - 60.5% | | | |
| Fidelity Series All-Sector Equity Fund (b) | | 43,938,325 | $598,000,603 |
| Fidelity Series Blue Chip Growth Fund (b) | | 65,050,428 | 995,271,542 |
| Fidelity Series Commodity Strategy Fund (b) | | 97,318,133 | 486,590,666 |
| Fidelity Series Growth Company Fund (b) | | 99,485,793 | 2,010,607,877 |
| Fidelity Series Intrinsic Opportunities Fund (b) | | 126,314,507 | 2,315,344,903 |
| Fidelity Series Large Cap Stock Fund (b) | | 132,332,398 | 2,108,055,106 |
| Fidelity Series Large Cap Value Index Fund (b) | | 43,740,787 | 577,378,392 |
| Fidelity Series Opportunistic Insights Fund (b) | | 53,951,887 | 1,070,944,952 |
| Fidelity Series Small Cap Discovery Fund (b) | | 21,787,669 | 264,720,180 |
| Fidelity Series Small Cap Opportunities Fund (b) | | 58,943,997 | 865,887,311 |
| Fidelity Series Stock Selector Large Cap Value Fund (b) | | 118,097,827 | 1,561,253,269 |
| Fidelity Series Value Discovery Fund (b) | | 80,836,457 | 1,106,651,100 |
| TOTAL DOMESTIC EQUITY FUNDS | | | |
| (Cost $10,380,676,631) | | | 13,960,705,901 |
|
| International Equity Funds - 30.7% | | | |
| Fidelity Series Canada Fund (b) | | 19,115,204 | 206,635,357 |
| Fidelity Series Emerging Markets Fund (b) | | 13,541,799 | 131,220,029 |
| Fidelity Series Emerging Markets Opportunities Fund (b) | | 103,283,200 | 1,982,004,603 |
| Fidelity Series International Growth Fund (b) | | 130,397,487 | 2,138,518,788 |
| Fidelity Series International Small Cap Fund (b) | | 28,191,793 | 504,633,094 |
| Fidelity Series International Value Fund (b) | | 201,985,694 | 2,124,889,501 |
| TOTAL INTERNATIONAL EQUITY FUNDS | | | |
| (Cost $5,833,211,429) | | | 7,087,901,372 |
|
| Bond Funds - 6.8% | | | |
| Fidelity Series Emerging Markets Debt Fund (b) | | 14,522,240 | 138,396,945 |
| Fidelity Series Floating Rate High Income Fund (b) | | 5,213,336 | 49,630,963 |
| Fidelity Series High Income Fund (b) | | 31,434,469 | 302,085,249 |
| Fidelity Series Inflation-Protected Bond Index Fund (b) | | 7,166,130 | 69,583,120 |
| Fidelity Series International Credit Fund (b) | | 976,302 | 9,597,049 |
| Fidelity Series Investment Grade Bond Fund (b) | | 9,401,599 | 102,383,409 |
| Fidelity Series Long-Term Treasury Bond Index Fund (b) | | 97,224,848 | 801,132,751 |
| Fidelity Series Real Estate Income Fund (b) | | 9,264,875 | 99,875,358 |
| TOTAL BOND FUNDS | | | |
| (Cost $1,618,063,599) | | | 1,572,684,844 |
|
| Short-Term Funds - 2.0% | | | |
| Fidelity Cash Central Fund, 2.11% (c) | | 37,819,990 | 37,827,554 |
| Fidelity Series Government Money Market Fund 2.12% (b)(d) | | 340,006,298 | 340,006,298 |
| Fidelity Series Short-Term Credit Fund (b) | | 7,287,247 | 71,852,258 |
| TOTAL SHORT-TERM FUNDS | | | |
| (Cost $450,381,363) | | | 449,686,110 |
| TOTAL INVESTMENT IN SECURITIES - 100.1% | | | |
| (Cost $18,298,415,726) | | | 23,087,059,821 |
| NET OTHER ASSETS (LIABILITIES) - (0.1)% | | | (13,477,224) |
| NET ASSETS - 100% | | | $23,073,582,597 |
| Futures Contracts | | | | | |
| | Number of contracts | Expiration Date | Notional Amount | Value | Unrealized Appreciation/(Depreciation) |
| Purchased | | | | | |
| Equity Index Contracts | | | | | |
| CME E-mini S&P 500 Index Contracts (United States) | 892 | Dec. 2018 | $130,187,400 | $25,254 | $25,254 |
| ICE E-mini MSCI Emerging Markets Index Contracts (United States) | 1,348 | Dec. 2018 | 70,749,780 | 1,391,164 | 1,391,164 |
|
| TOTAL PURCHASED | | | | | 1,416,418 |
|
| Sold | | | | | |
| Equity Index Contracts | | | | | |
| ICE E-mini MSCI EAFE Index Contracts (United States) | 579 | Dec. 2018 | 57,190,725 | (109,951) | (109,951) |
| TOTAL FUTURES CONTRACTS | | | | | $1,306,467 |
The notional amount of futures purchased as a percentage of Net Assets is 0.9%
The notional amount of futures sold as a percentage of Net Assets is 0.2%
Legend
(a) Security or a portion of the security was pledged to cover margin requirements for futures contracts. At period end, the value of securities pledged amounted to $4,626,926.
(b) Affiliated Fund
(c) Affiliated fund that is generally available only to investment companies and other accounts managed by Fidelity Investments. The rate quoted is the annualized seven-day yield of the fund at period end. A complete unaudited listing of the fund's holdings as of its most recent quarter end is available upon request. In addition, each Fidelity Central Fund's financial statements are available on the SEC's website or upon request.
(d) The rate quoted is the annualized seven-day yield of the fund at period end.
Affiliated Central Funds
Information regarding fiscal year to date income earned by the Fund from investments in Fidelity Central Funds is as follows:
| Fund | Income earned |
| Fidelity Cash Central Fund | $108,550 |
| Total | $108,550 |
Amounts in the income column in the above table include any capital gain distributions from underlying funds, which are presented in the corresponding line-item in the Statement of Operations if applicable.
Affiliated Underlying Funds
Fiscal year to date information regarding the Fund's investments in affiliated Underlying Funds, excluding any Money Market Central Funds, is presented below. Exchanges between classes of the same affiliated Underlying Funds may occur.
| Affiliate | Value, beginning of period | Purchases | Sales Proceeds | Dividend Income | Realized Gain (loss) | Change in Unrealized appreciation (depreciation) | Value, end of period |
| Fidelity Series 100 Index Fund | $443,201,000 | $27,501 | $474,621,171 | $-- | $177,785,602 | $(146,392,932) | $-- |
| Fidelity Series All-Sector Equity Fund | 852,293,455 | 24,197,249 | 374,915,415 | -- | 31,443,706 | 64,981,608 | 598,000,603 |
| Fidelity Series Blue Chip Growth Fund | 880,936,658 | 117,426,287 | 68,058,169 | 92,264,868 | 7,111,070 | 57,855,696 | 995,271,542 |
| Fidelity Series Canada Fund | 196,369,345 | 6,501,630 | 8,450,552 | -- | 88,964 | 12,125,970 | 206,635,357 |
| Fidelity Series Commodity Strategy Fund | 466,509,085 | 77,353,445 | 17,904,068 | 29,095,323 | (1,935,730) | (37,432,066) | 486,590,666 |
| Fidelity Series Emerging Markets Debt Fund | 144,474,691 | 8,021,063 | 6,181,522 | 4,243,910 | (293,676) | (7,623,611) | 138,396,945 |
| Fidelity Series Emerging Markets Fund | -- | 129,520,127 | -- | -- | -- | 1,699,902 | 131,220,029 |
| Fidelity Series Emerging Markets Opportunities Fund | 2,040,911,915 | 294,103,418 | 93,230,305 | -- | 9,288,341 | (269,068,766) | 1,982,004,603 |
| Fidelity Series Floating Rate High Income Fund | 48,961,247 | 2,892,013 | 2,273,354 | 1,318,733 | (76,825) | 127,882 | 49,630,963 |
| Fidelity Series Government Money Market Fund 2.12% | 359,251,220 | 335,374,530 | 354,619,452 | 2,952,239 | -- | -- | 340,006,298 |
| Fidelity Series Growth Company Fund | 1,792,770,541 | 50,554,267 | 99,878,731 | -- | 5,854,361 | 261,307,439 | 2,010,607,877 |
| Fidelity Series High Income Fund | 309,170,419 | 16,972,033 | 26,552,474 | 8,855,688 | (920,483) | 3,415,754 | 302,085,249 |
| Fidelity Series Inflation-Protected Bond Index Fund | 179,663,816 | 17,824,120 | 128,620,481 | 268,259 | (1,799,563) | 2,515,228 | 69,583,120 |
| Fidelity Series International Credit Fund | 9,784,897 | 121,452 | 210,862 | 120,588 | (2,839) | (95,599) | 9,597,049 |
| Fidelity Series International Growth Fund | 1,977,736,139 | 205,266,391 | 75,652,385 | -- | 556,482 | 30,612,161 | 2,138,518,788 |
| Fidelity Series International Small Cap Fund | 493,473,677 | 39,166,053 | 8,672,381 | -- | (190,415) | (19,143,840) | 504,633,094 |
| Fidelity Series International Value Fund | 2,001,758,300 | 156,532,720 | 28,980,633 | -- | (441,746) | (3,979,140) | 2,124,889,501 |
| Fidelity Series Intrinsic Opportunities Fund | 2,182,350,576 | 172,205,101 | 72,183,411 | 102,232,148 | (722,382) | 33,695,019 | 2,315,344,903 |
| Fidelity Series Investment Grade Bond Fund | 106,425,476 | 8,154,992 | 10,972,404 | 1,464,336 | (228,115) | (996,540) | 102,383,409 |
| Fidelity Series Large Cap Stock Fund | 1,927,084,035 | 184,317,739 | 96,464,157 | 123,283,869 | 3,084,014 | 90,033,475 | 2,108,055,106 |
| Fidelity Series Large Cap Value Index Fund | 549,397,749 | 16,102,234 | 26,742,399 | -- | 237,872 | 38,382,936 | 577,378,392 |
| Fidelity Series Long-Term Treasury Bond Index Fund | 501,632,815 | 510,802,067 | 184,480,090 | 10,136,286 | (6,059,591) | (20,762,450) | 801,132,751 |
| Fidelity Series Opportunistic Insights Fund | 965,411,695 | 28,548,166 | 48,692,488 | -- | 1,973,431 | 123,704,148 | 1,070,944,952 |
| Fidelity Series Real Estate Equity Fund | 176,406,153 | 1,945,989 | 185,854,727 | 1,804,383 | 8,722,617 | (1,220,032) | -- |
| Fidelity Series Real Estate Income Fund | 96,629,351 | 7,170,921 | 4,513,145 | 4,212,008 | (60,648) | 648,879 | 99,875,358 |
| Fidelity Series Short-Term Credit Fund | 65,675,427 | 9,328,493 | 3,151,127 | 756,431 | (20,266) | 19,731 | 71,852,258 |
| Fidelity Series Small Cap Discovery Fund | 257,910,452 | 23,251,638 | 12,711,314 | 15,566,375 | (208,305) | (3,522,291) | 264,720,180 |
| Fidelity Series Small Cap Opportunities Fund | 796,470,742 | 90,162,268 | 44,855,532 | 66,836,804 | 2,311,957 | 21,797,876 | 865,887,311 |
| Fidelity Series Stock Selector Large Cap Value Fund | 1,499,209,905 | 44,063,467 | 85,412,611 | -- | (1,027,241) | 104,419,749 | 1,561,253,269 |
| Fidelity Series Value Discovery Fund | 1,063,662,736 | 32,345,134 | 51,751,101 | -- | (309,483) | 62,703,814 | 1,106,651,100 |
| | $22,385,533,517 | $2,610,252,508 | $2,596,606,461 | $465,412,248 | $234,161,109 | $399,810,000 | $23,033,150,673 |
Amounts in the income column in the above table include any capital gain distributions from underlying funds, which are presented in the corresponding line-item in the Statement of Operations if applicable.
Investment Valuation
The following is a summary of the inputs used, as of September 30, 2018, involving the Fund's assets and liabilities carried at fair value. The inputs or methodology used for valuing securities may not be an indication of the risk associated with investing in those securities. For more information on valuation inputs, and their aggregation into the levels used below, please refer to the Investment Valuation section in the accompanying Notes to Financial Statements.
| | Valuation Inputs at Reporting Date: |
| Description | Total | Level 1 | Level 2 | Level 3 |
| Investments in Securities: | | | | |
| Other Short-Term Investments | $16,081,594 | $-- | $16,081,594 | $-- |
| Domestic Equity Funds | 13,960,705,901 | 13,960,705,901 | -- | -- |
| International Equity Funds | 7,087,901,372 | 7,087,901,372 | -- | -- |
| Bond Funds | 1,572,684,844 | 1,572,684,844 | -- | -- |
| Short-Term Funds | 449,686,110 | 449,686,110 | -- | -- |
| Total Investments in Securities: | $23,087,059,821 | $23,070,978,227 | $16,081,594 | $-- |
| Derivative Instruments: | | | | |
| Assets | | | | |
| Futures Contracts | $1,416,418 | $1,416,418 | $-- | $-- |
| Total Assets | $1,416,418 | $1,416,418 | $-- | $-- |
| Liabilities | | | | |
| Futures Contracts | $(109,951) | $(109,951) | $-- | $-- |
| Total Liabilities | $(109,951) | $(109,951) | $-- | $-- |
| Total Derivative Instruments: | $1,306,467 | $1,306,467 | $-- | $-- |
Value of Derivative Instruments
The following table is a summary of the Fund's value of derivative instruments by primary risk exposure as of September 30, 2018. For additional information on derivative instruments, please refer to the Derivative Instruments section in the accompanying Notes to Financial Statements.
| Primary Risk Exposure / Derivative Type | Value |
| | Asset | Liability |
| Equity Risk | | |
| Futures Contracts(a) | $1,416,418 | $(109,951) |
| Total Equity Risk | 1,416,418 | (109,951) |
| Total Value of Derivatives | $1,416,418 | $(109,951) |
(a) Reflects gross cumulative appreciation (depreciation) on futures contracts as presented in the Schedule of Investments. In the Statement of Assets and Liabilities, the period end daily variation margin is included in receivable or payable for daily variation margin on futures contracts, and the net cumulative appreciation (depreciation) is included in net unrealized appreciation (depreciation).
See accompanying notes which are an integral part of the financial statements.
Fidelity Freedom® 2040 Fund
Financial Statements
Statement of Assets and Liabilities
| | | September 30, 2018 (Unaudited) |
| Assets | | |
Investment in securities, at value — See accompanying schedule:
Unaffiliated issuers (cost $16,082,704) | $16,081,594 | |
| Fidelity Central Funds (cost $37,827,554) | 37,827,554 | |
| Other affiliated issuers (cost $18,244,505,468) | 23,033,150,673 | |
| Total Investment in Securities (cost $18,298,415,726) | | $23,087,059,821 |
| Receivable for investments sold | | 248,367,537 |
| Receivable for fund shares sold | | 486,204,460 |
| Distributions receivable from Fidelity Central Funds | | 57,793 |
| Total assets | | 23,821,689,611 |
| Liabilities | | |
| Payable for investments purchased | $258,377,839 | |
| Payable for fund shares redeemed | 476,105,038 | |
| Accrued management fee | 12,873,523 | |
| Payable for daily variation margin on futures contracts | 750,614 | |
| Total liabilities | | 748,107,014 |
| Net Assets | | $23,073,582,597 |
| Net Assets consist of: | | |
| Paid in capital | | $17,714,232,439 |
| Undistributed net investment income | | 46,346,812 |
| Accumulated undistributed net realized gain (loss) on investments | | 523,052,784 |
| Net unrealized appreciation (depreciation) on investments | | 4,789,950,562 |
| Net Assets | | $23,073,582,597 |
| Fidelity Freedom 2040 Fund: | | |
| Net Asset Value, offering price and redemption price per share ($8,675,308,806 ÷ 799,343,174 shares) | | $10.85 |
| Class K: | | |
| Net Asset Value, offering price and redemption price per share ($12,883,091,744 ÷ 1,187,775,379 shares) | | $10.85 |
| Class K6: | | |
| Net Asset Value, offering price and redemption price per share ($1,515,182,047 ÷ 139,638,273 shares) | | $10.85 |
See accompanying notes which are an integral part of the financial statements.
Statement of Operations
| | | Six months ended September 30, 2018 (Unaudited) |
| Investment Income | | |
| Dividends: | | |
| Affiliated issuers | | $123,622,532 |
| Interest | | 89,185 |
| Income from Fidelity Central Funds | | 108,550 |
| Total income | | 123,820,267 |
| Expenses | | |
| Management fee | $77,418,111 | |
| Independent trustees' fees and expenses | 55,344 | |
| Total expenses | | 77,473,455 |
| Net investment income (loss) | | 46,346,812 |
| Realized and Unrealized Gain (Loss) | | |
| Net realized gain (loss) on: | | |
| Investment securities: | | |
| Fidelity Central Funds | 64 | |
| Other affiliated issuers | 234,161,109 | |
| Futures contracts | (11,626,230) | |
| Capital gain distributions from underlying funds: | | |
| Affiliated issuers | 341,789,716 | |
| Total net realized gain (loss) | | 564,324,659 |
| Change in net unrealized appreciation (depreciation) on: | | |
| Investment securities: | | |
| Unaffiliated issuers | (1,110) | |
| Affiliated issuers | 399,810,000 | |
| Futures contracts | 1,306,467 | |
| Total change in net unrealized appreciation (depreciation) | | 401,115,357 |
| Net gain (loss) | | 965,440,016 |
| Net increase (decrease) in net assets resulting from operations | | $1,011,786,828 |
See accompanying notes which are an integral part of the financial statements.
Statement of Changes in Net Assets
| | Six months ended September 30, 2018 (Unaudited) | Year ended March 31, 2018 |
| Increase (Decrease) in Net Assets | | |
| Operations | | |
| Net investment income (loss) | $46,346,812 | $241,539,734 |
| Net realized gain (loss) | 564,324,659 | 1,033,195,358 |
| Change in net unrealized appreciation (depreciation) | 401,115,357 | 685,250,223 |
| Net increase (decrease) in net assets resulting from operations | 1,011,786,828 | 1,959,985,315 |
| Distributions to shareholders from net investment income | – | (266,263,160) |
| Distributions to shareholders from net realized gain | (621,028,991) | (509,942,580) |
| Total distributions | (621,028,991) | (776,205,740) |
| Share transactions - net increase (decrease) | 310,072,638 | 13,924,513,839 |
| Total increase (decrease) in net assets | 700,830,475 | 15,108,293,414 |
| Net Assets | | |
| Beginning of period | 22,372,752,122 | 7,264,458,708 |
| End of period | $23,073,582,597 | $22,372,752,122 |
| Other Information | | |
| Undistributed net investment income end of period | $46,346,812 | $– |
See accompanying notes which are an integral part of the financial statements.
Financial Highlights
Fidelity Freedom 2040 Fund
| | Six months ended (Unaudited) September 30, | Years endedMarch 31, | | | | |
| | 2018 | 2018 | 2017 | 2016 | 2015 | 2014 |
| Selected Per–Share Data | | | | | | |
| Net asset value, beginning of period | $10.67 | $9.74 | $8.75 | $9.63 | $9.62 | $8.78 |
| Income from Investment Operations | | | | | | |
| Net investment income (loss)A | .02 | .11 | .13 | .13 | .15 | .13 |
| Net realized and unrealized gain (loss) | .45 | 1.29 | 1.24 | (.46) | .57 | 1.17 |
| Total from investment operations | .47 | 1.40 | 1.37 | (.33) | .72 | 1.30 |
| Distributions from net investment income | – | (.12) | (.13) | (.14) | (.16) | (.13) |
| Distributions from net realized gain | (.29) | (.35) | (.24) | (.41) | (.55) | (.33) |
| Total distributions | (.29) | (.47) | (.38)B | (.55) | (.71) | (.46) |
| Net asset value, end of period | $10.85 | $10.67 | $9.74 | $8.75 | $9.63 | $9.62 |
| Total ReturnC,D | 4.48% | 14.52% | 16.14% | (3.62)% | 7.86% | 15.08% |
| Ratios to Average Net AssetsE,F | | | | | | |
| Expenses before reductions | .75%G | .63%H | - %I | - %I | - %I | - %I |
| Expenses net of fee waivers, if any | .75%G | .63%H | -% | -% | -% | -% |
| Expenses net of all reductions | .75%G | .63%H | -% | -% | -% | -% |
| Net investment income (loss) | .34%G | 1.04% | 1.44% | 1.47% | 1.61% | 1.40% |
| Supplemental Data | | | | | | |
| Net assets, end of period (000 omitted) | $8,675,309 | $8,285,660 | $7,264,459 | $6,388,566 | $6,901,191 | $7,016,128 |
| Portfolio turnover rateF | 23%G | 16%J | 15% | 16% | 17% | 49% |
A Calculated based on average shares outstanding during the period.
B Total distributions of $.38 per share is comprised of distributions from net investment income of $.132 and distributions from net realized gain of $.244 per share.
C Total returns for periods of less than one year are not annualized.
D Total returns would have been lower if certain expenses had not been reduced during the applicable periods shown.
E Expense ratios reflect operating expenses of the class. Expenses before reductions do not reflect amounts reimbursed by the investment adviser or reductions from expense offset arrangements and do not represent the amount paid by the class during periods when reimbursements or reductions occur. Expenses net of fee waivers reflect expenses after reimbursement by the investment adviser but prior to reductions from expense offset arrangements. Expenses net of all reductions represent the net expenses paid by the class but do not include expenses of the underlying funds in which the Fund invests.
F Amounts do not include the activity of the Underlying Funds.
G Annualized
H On certain classes, the size and fluctuation of net assets and expense amounts may cause ratios to differ from contractual rates.
I Amount represents less than $.005 per share.
J The portfolio turnover rate does not include the assets acquired in the merger.
See accompanying notes which are an integral part of the financial statements.
Fidelity Freedom 2040 Fund Class K
| | Six months ended (Unaudited) September 30, | Years endedMarch 31, |
| | 2018 | 2018 A |
| Selected Per–Share Data | | |
| Net asset value, beginning of period | $10.66 | $10.25 |
| Income from Investment Operations | | |
| Net investment income (loss)B | .02 | .15 |
| Net realized and unrealized gain (loss) | .46 | .59 |
| Total from investment operations | .48 | .74 |
| Distributions from net investment income | – | (.14) |
| Distributions from net realized gain | (.29) | (.19) |
| Total distributions | (.29) | (.33) |
| Net asset value, end of period | $10.85 | $10.66 |
| Total ReturnC,D | 4.59% | 7.21% |
| Ratios to Average Net AssetsE,F | | |
| Expenses before reductions | .64%G | .65%G,H |
| Expenses net of fee waivers, if any | .64%G | .65%G,H |
| Expenses net of all reductions | .64%G | .65%G,H |
| Net investment income (loss) | .44%G | 2.06%G |
| Supplemental Data | | |
| Net assets, end of period (000 omitted) | $12,883,092 | $13,434,642 |
| Portfolio turnover rateF | 23%G | 16%I |
A For the period July 20, 2017 (commencement of sale of shares) to March 31, 2018.
B Calculated based on average shares outstanding during the period.
C Total returns for periods of less than one year are not annualized.
D Total returns would have been lower if certain expenses had not been reduced during the applicable periods shown.
E Expense ratios reflect operating expenses of the class. Expenses before reductions do not reflect amounts reimbursed by the investment adviser or reductions from expense offset arrangements and do not represent the amount paid by the class during periods when reimbursements or reductions occur. Expense ratios before reductions for start-up periods may not be representative of longer-term operating periods. Expenses net of fee waivers reflect expenses after reimbursement by the investment adviser but prior to reductions from expense offset arrangements. Expenses net of all reductions represent the net expenses paid by the class but do not include expenses of the underlying funds in which the Fund invests.
F Amounts do not include the activity of the Underlying Funds.
G Annualized
H On certain classes, the size and fluctuation of net assets and expense amounts may cause ratios to differ from contractual rates.
I The portfolio turnover rate does not include the assets acquired in the merger.
See accompanying notes which are an integral part of the financial statements.
Fidelity Freedom 2040 Fund Class K6
| | Six months ended (Unaudited) September 30, | Years endedMarch 31, |
| | 2018 | 2018 A |
| Selected Per–Share Data | | |
| Net asset value, beginning of period | $10.66 | $10.03 |
| Income from Investment Operations | | |
| Net investment income (loss)B | .03 | .13 |
| Net realized and unrealized gain (loss) | .46 | .83 |
| Total from investment operations | .49 | .96 |
| Distributions from net investment income | – | (.14) |
| Distributions from net realized gain | (.30) | (.19) |
| Total distributions | (.30) | (.33) |
| Net asset value, end of period | $10.85 | $10.66 |
| Total ReturnC,D | 4.67% | 9.60% |
| Ratios to Average Net AssetsE,F | | |
| Expenses before reductions | .49%G | .50%G,H |
| Expenses net of fee waivers, if any | .49%G | .50%G,H |
| Expenses net of all reductions | .49%G | .50%G,H |
| Net investment income (loss) | .59%G | 1.55%G |
| Supplemental Data | | |
| Net assets, end of period (000 omitted) | $1,515,182 | $652,451 |
| Portfolio turnover rateF | 23%G | 16%I |
A For the period June 7, 2017 (commencement of sale of shares) to March 31, 2018.
B Calculated based on average shares outstanding during the period.
C Total returns for periods of less than one year are not annualized.
D Total returns would have been lower if certain expenses had not been reduced during the applicable periods shown.
E Expense ratios reflect operating expenses of the class. Expenses before reductions do not reflect amounts reimbursed by the investment adviser or reductions from expense offset arrangements and do not represent the amount paid by the class during periods when reimbursements or reductions occur. Expense ratios before reductions for start-up periods may not be representative of longer-term operating periods. Expenses net of fee waivers reflect expenses after reimbursement by the investment adviser but prior to reductions from expense offset arrangements. Expenses net of all reductions represent the net expenses paid by the class but do not include expenses of the underlying funds in which the Fund invests.
F Amounts do not include the activity of the Underlying Funds.
G Annualized
H On certain classes, the size and fluctuation of net assets and expense amounts may cause ratios to differ from contractual rates.
I The portfolio turnover rate does not include the assets acquired in the merger.
See accompanying notes which are an integral part of the financial statements.
Fidelity Freedom® 2045 Fund
Investment Summary (Unaudited)
The information in the following tables is based on the direct investments of the Fund.
Top Holdings as of September 30, 2018
| | % of fund's net assets |
| Fidelity Series Intrinsic Opportunities Fund | 10.0 |
| Fidelity Series International Growth Fund | 9.3 |
| Fidelity Series International Value Fund | 9.2 |
| Fidelity Series Large Cap Stock Fund | 9.2 |
| Fidelity Series Growth Company Fund | 8.7 |
| Fidelity Series Emerging Markets Opportunities Fund | 8.6 |
| Fidelity Series Stock Selector Large Cap Value Fund | 6.8 |
| Fidelity Series Value Discovery Fund | 4.8 |
| Fidelity Series Opportunistic Insights Fund | 4.6 |
| Fidelity Series Blue Chip Growth Fund | 4.3 |
| | 75.5 |
Asset Allocation (% of fund's net assets)
| Period end |
| | Domestic Equity Funds | 60.5% |
| | International Equity Funds | 30.7% |
| | Bond Funds | 6.8% |
| | Short-Term Funds | 2.0% |
| | Short-Term Investments | 0.1% |
| | Net Other Assets (Liabilities)* | (0.1)% |

* Net Other Assets (Liabilities) are not included in the pie chart
Domestic Equity Funds category includes Fidelity Series Commodity Strategy Fund which invests in commodity-related investments.
Fidelity Freedom® 2045 Fund
Schedule of Investments September 30, 2018 (Unaudited)
Showing Percentage of Net Assets
| U.S. Treasury Obligations - 0.1% | | | |
| | | Principal Amount | Value |
| U.S. Treasury Bills, yield at date of purchase 2.07% to 2.11% 11/23/18 to 12/6/18 (a) | | | |
| (Cost $9,735,283) | | 9,770,000 | 9,734,611 |
| | | Shares | Value |
|
| Domestic Equity Funds - 60.5% | | | |
| Fidelity Series All-Sector Equity Fund (b) | | 26,590,695 | $361,899,353 |
| Fidelity Series Blue Chip Growth Fund (b) | | 39,340,323 | 601,906,944 |
| Fidelity Series Commodity Strategy Fund (b) | | 58,878,930 | 294,394,650 |
| Fidelity Series Growth Company Fund (b) | | 60,165,742 | 1,215,949,643 |
| Fidelity Series Intrinsic Opportunities Fund (b) | | 75,872,561 | 1,390,744,043 |
| Fidelity Series Large Cap Stock Fund (b) | | 80,167,106 | 1,277,061,994 |
| Fidelity Series Large Cap Value Index Fund (b) | | 26,501,754 | 349,823,158 |
| Fidelity Series Opportunistic Insights Fund (b) | | 32,668,157 | 648,462,908 |
| Fidelity Series Small Cap Discovery Fund (b) | | 13,196,321 | 160,335,301 |
| Fidelity Series Small Cap Opportunities Fund (b) | | 35,672,838 | 524,033,991 |
| Fidelity Series Stock Selector Large Cap Value Fund (b) | | 71,642,465 | 947,113,392 |
| Fidelity Series Value Discovery Fund (b) | | 48,964,904 | 670,329,533 |
| TOTAL DOMESTIC EQUITY FUNDS | | | |
| (Cost $6,431,635,018) | | | 8,442,054,910 |
|
| International Equity Funds - 30.7% | | | |
| Fidelity Series Canada Fund (b) | | 11,558,671 | 124,949,235 |
| Fidelity Series Emerging Markets Fund (b) | | 8,194,082 | 79,400,651 |
| Fidelity Series Emerging Markets Opportunities Fund (b) | | 62,480,406 | 1,198,998,998 |
| Fidelity Series International Growth Fund (b) | | 78,861,334 | 1,293,325,876 |
| Fidelity Series International Small Cap Fund (b) | | 17,061,172 | 305,394,985 |
| Fidelity Series International Value Fund (b) | | 122,157,013 | 1,285,091,775 |
| TOTAL INTERNATIONAL EQUITY FUNDS | | | |
| (Cost $3,585,281,459) | | | 4,287,161,520 |
|
| Bond Funds - 6.8% | | | |
| Fidelity Series Emerging Markets Debt Fund (b) | | 8,666,418 | 82,590,966 |
| Fidelity Series Floating Rate High Income Fund (b) | | 3,193,051 | 30,397,841 |
| Fidelity Series High Income Fund (b) | | 18,962,277 | 182,227,485 |
| Fidelity Series Inflation-Protected Bond Index Fund (b) | | 4,333,400 | 42,077,311 |
| Fidelity Series International Credit Fund (b) | | 580,874 | 5,709,994 |
| Fidelity Series Investment Grade Bond Fund (b) | | 5,685,095 | 61,910,683 |
| Fidelity Series Long-Term Treasury Bond Index Fund (b) | | 58,781,722 | 484,361,389 |
| Fidelity Series Real Estate Income Fund (b) | | 5,527,798 | 59,589,661 |
| TOTAL BOND FUNDS | | | |
| (Cost $974,494,789) | | | 948,865,330 |
|
| Short-Term Funds - 2.0% | | | |
| Fidelity Cash Central Fund, 2.11% (c) | | 22,418,427 | 22,422,911 |
| Fidelity Series Government Money Market Fund 2.12% (b)(d) | | 206,170,237 | 206,170,237 |
| Fidelity Series Short-Term Credit Fund (b) | | 4,445,351 | 43,831,163 |
| TOTAL SHORT-TERM FUNDS | | | |
| (Cost $272,833,074) | | | 272,424,311 |
| TOTAL INVESTMENT IN SECURITIES - 100.1% | | | |
| (Cost $11,273,979,623) | | | 13,960,240,682 |
| NET OTHER ASSETS (LIABILITIES) - (0.1)% | | | (8,051,180) |
| NET ASSETS - 100% | | | $13,952,189,502 |
| Futures Contracts | | | | | |
| | Number of contracts | Expiration Date | Notional Amount | Value | Unrealized Appreciation/(Depreciation) |
| Purchased | | | | | |
| Equity Index Contracts | | | | | |
| CME E-mini S&P 500 Index Contracts (United States) | 538 | Dec. 2018 | $78,521,100 | $15,232 | $15,232 |
| ICE E-mini MSCI Emerging Markets Index Contracts (United States) | 805 | Dec. 2018 | 42,250,425 | 831,292 | 831,291 |
|
| TOTAL PURCHASED | | | | | 846,523 |
|
| Sold | | | | | |
| Equity Index Contracts | | | | | |
| ICE E-mini MSCI EAFE Index Contracts (United States) | 357 | Dec. 2018 | 35,262,675 | (65,996) | (65,996) |
| TOTAL FUTURES CONTRACTS | | | | | $780,527 |
The notional amount of futures purchased as a percentage of Net Assets is 0.9%
The notional amount of futures sold as a percentage of Net Assets is 0.3%
Legend
(a) Security or a portion of the security was pledged to cover margin requirements for futures contracts. At period end, the value of securities pledged amounted to $3,063,229.
(b) Affiliated Fund
(c) Affiliated fund that is generally available only to investment companies and other accounts managed by Fidelity Investments. The rate quoted is the annualized seven-day yield of the fund at period end. A complete unaudited listing of the fund's holdings as of its most recent quarter end is available upon request. In addition, each Fidelity Central Fund's financial statements are available on the SEC's website or upon request.
(d) The rate quoted is the annualized seven-day yield of the fund at period end.
Affiliated Central Funds
Information regarding fiscal year to date income earned by the Fund from investments in Fidelity Central Funds is as follows:
| Fund | Income earned |
| Fidelity Cash Central Fund | $64,023 |
| Total | $64,023 |
Amounts in the income column in the above table include any capital gain distributions from underlying funds, which are presented in the corresponding line-item in the Statement of Operations if applicable.
Affiliated Underlying Funds
Fiscal year to date information regarding the Fund's investments in affiliated Underlying Funds, excluding any Money Market Central Funds, is presented below. Exchanges between classes of the same affiliated Underlying Funds may occur.
| Affiliate | Value, beginning of period | Purchases | Sales Proceeds | Dividend Income | Realized Gain (loss) | Change in Unrealized appreciation (depreciation) | Value, end of period |
| Fidelity Series 100 Index Fund | $263,182,195 | $35,408 | $281,858,315 | $-- | $118,503,464 | $(99,862,752) | $-- |
| Fidelity Series All-Sector Equity Fund | 507,057,960 | 24,353,815 | 227,413,942 | -- | 18,530,840 | 39,370,680 | 361,899,353 |
| Fidelity Series Blue Chip Growth Fund | 524,034,296 | 81,496,149 | 42,346,463 | 55,573,624 | 3,493,846 | 35,229,116 | 601,906,944 |
| Fidelity Series Canada Fund | 116,819,435 | 6,299,081 | 5,482,303 | -- | 71,714 | 7,241,308 | 124,949,235 |
| Fidelity Series Commodity Strategy Fund | 278,070,063 | 51,506,286 | 11,487,190 | 17,538,017 | (3,602,850) | (20,091,659) | 294,394,650 |
| Fidelity Series Emerging Markets Debt Fund | 84,775,451 | 6,393,438 | 3,923,165 | 2,511,531 | (224,211) | (4,430,547) | 82,590,966 |
| Fidelity Series Emerging Markets Fund | -- | 78,363,361 | -- | -- | -- | 1,037,290 | 79,400,651 |
| Fidelity Series Emerging Markets | 1,214,195,749 | 188,564,627 | 48,629,828 | -- | 3,819,543 | (158,951,093) | 1,198,998,998 |
| Fidelity Series Floating Rate High Income | 29,413,979 | 2,417,035 | 1,464,882 | 800,443 | (17,991) | 49,700 | 30,397,841 |
| Fidelity Series Government Money Market | 212,944,275 | 206,857,434 | 213,631,472 | 1,768,652 | -- | -- | 206,170,237 |
| Fidelity Series Growth Company Fund | 1,066,317,020 | 52,635,966 | 63,084,957 | -- | 2,632,734 | 157,448,880 | 1,215,949,643 |
| Fidelity Series High Income Fund | 182,802,662 | 13,621,170 | 15,687,741 | 5,292,179 | (529,000) | 2,020,394 | 182,227,485 |
| Fidelity Series Inflation-Protected Bond | 107,538,333 | 12,390,610 | 78,265,538 | 161,549 | (1,138,569) | 1,552,475 | 42,077,311 |
| Fidelity Series International Credit Fund | 5,867,034 | 73,386 | 171,403 | 72,304 | (2,180) | (56,843) | 5,709,994 |
| Fidelity Series International Growth Fund | 1,176,177,691 | 146,185,242 | 47,854,051 | -- | 315,125 | 18,501,869 | 1,293,325,876 |
| Fidelity Series International Small Cap Fund | 293,469,300 | 27,090,346 | 3,600,391 | -- | (84,294) | (11,479,976) | 305,394,985 |
| Fidelity Series International Value Fund | 1,190,569,587 | 110,110,678 | 13,284,283 | -- | (231,909) | (2,072,298) | 1,285,091,775 |
| Fidelity Series Intrinsic Opportunities Fund | 1,296,043,058 | 130,912,741 | 55,737,519 | 61,226,029 | (316,164) | 19,841,927 | 1,390,744,043 |
| Fidelity Series Investment Grade Bond Fund | 63,493,715 | 6,095,948 | 6,945,249 | 876,834 | (125,745) | (607,986) | 61,910,683 |
| Fidelity Series Large Cap Stock Fund | 1,146,756,357 | 134,528,542 | 60,233,607 | 73,856,655 | 1,837,134 | 54,173,568 | 1,277,061,994 |
| Fidelity Series Large Cap Value Index Fund | 326,476,656 | 16,808,742 | 16,647,296 | -- | 178,547 | 23,006,509 | 349,823,158 |
| Fidelity Series Long-Term Treasury Bond | 298,749,888 | 313,580,010 | 111,834,803 | 6,088,342 | (3,635,195) | (12,498,511) | 484,361,389 |
| Fidelity Series Opportunistic Insights Fund | 574,264,670 | 29,391,946 | 30,526,169 | -- | 968,168 | 74,364,293 | 648,462,908 |
| Fidelity Series Real Estate Equity Fund | 104,846,888 | 1,163,810 | 110,503,750 | 1,022,178 | 2,026,500 | 2,466,552 | -- |
| Fidelity Series Real Estate Income Fund | 56,559,805 | 5,536,640 | 2,846,803 | 2,495,998 | (45,685) | 385,704 | 59,589,661 |
| Fidelity Series Short-Term Credit Fund | 39,780,377 | 6,044,691 | 1,993,471 | 463,472 | (18,313) | 17,879 | 43,831,163 |
| Fidelity Series Small Cap Discovery Fund | 153,285,060 | 17,243,463 | 7,896,625 | 9,343,718 | (199,374) | (2,097,223) | 160,335,301 |
| Fidelity Series Small Cap Opportunities Fund | 473,946,400 | 64,311,717 | 28,349,478 | 40,284,725 | 1,187,258 | 12,938,094 | 524,033,991 |
| Fidelity Series Stock Selector Large Cap | 892,343,372 | 45,059,942 | 52,400,911 | -- | (838,495) | 62,949,484 | 947,113,392 |
| Fidelity Series Value Discovery Fund | 633,054,295 | 32,049,251 | 32,196,070 | -- | (234,814) | 37,656,871 | 670,329,533 |
| | 13,312,835,571 | 1,811,121,475 | 1,576,297,675 | 279,376,250 | 142,320,084 | 238,103,705 | 13,928,083,160 |
Amounts in the income column in the above table include any capital gain distributions from underlying funds, which are presented in the corresponding line-item in the Statement of Operations if applicable.
Investment Valuation
The following is a summary of the inputs used, as of September 30, 2018, involving the Fund's assets and liabilities carried at fair value. The inputs or methodology used for valuing securities may not be an indication of the risk associated with investing in those securities. For more information on valuation inputs, and their aggregation into the levels used below, please refer to the Investment Valuation section in the accompanying Notes to Financial Statements.
| | Valuation Inputs at Reporting Date: |
| Description | Total | Level 1 | Level 2 | Level 3 |
| Investments in Securities: | | | | |
| Other Short-Term Investments | $9,734,611 | $-- | $9,734,611 | $-- |
| Domestic Equity Funds | 8,442,054,910 | 8,442,054,910 | -- | -- |
| International Equity Funds | 4,287,161,520 | 4,287,161,520 | -- | -- |
| Bond Funds | 948,865,330 | 948,865,330 | -- | -- |
| Short-Term Funds | 272,424,311 | 272,424,311 | -- | -- |
| Total Investments in Securities: | $13,960,240,682 | $13,950,506,071 | $9,734,611 | $-- |
| Derivative Instruments: | | | | |
| Assets | | | | |
| Futures Contracts | $846,523 | $846,523 | $-- | $-- |
| Total Assets | $846,523 | $846,523 | $-- | $-- |
| Liabilities | | | | |
| Futures Contracts | $(65,996) | $(65,996) | $-- | $-- |
| Total Liabilities | $(65,996) | $(65,996) | $-- | $-- |
| Total Derivative Instruments: | $780,527 | $780,527 | $-- | $-- |
Value of Derivative Instruments
The following table is a summary of the Fund's value of derivative instruments by primary risk exposure as of September 30, 2018. For additional information on derivative instruments, please refer to the Derivative Instruments section in the accompanying Notes to Financial Statements.
| Primary Risk Exposure / Derivative Type | Value |
| | Asset | Liability |
| Equity Risk | | |
| Futures Contracts(a) | $846,523 | $(65,996) |
| Total Equity Risk | 846,523 | (65,996) |
| Total Value of Derivatives | $846,523 | $(65,996) |
(a) Reflects gross cumulative appreciation (depreciation) on futures contracts as presented in the Schedule of Investments. In the Statement of Assets and Liabilities, the period end daily variation margin is included in receivable or payable for daily variation margin on futures contracts, and the net cumulative appreciation (depreciation) is included in net unrealized appreciation (depreciation).
See accompanying notes which are an integral part of the financial statements.
Fidelity Freedom® 2045 Fund
Financial Statements
Statement of Assets and Liabilities
| | | September 30, 2018 (Unaudited) |
| Assets | | |
Investment in securities, at value — See accompanying schedule:
Unaffiliated issuers (cost $9,735,283) | $9,734,611 | |
| Fidelity Central Funds (cost $22,422,911) | 22,422,911 | |
| Other affiliated issuers (cost $11,241,821,429) | 13,928,083,160 | |
| Total Investment in Securities (cost $11,273,979,623) | | $13,960,240,682 |
| Receivable for investments sold | | 151,576,786 |
| Receivable for fund shares sold | | 427,176,820 |
| Distributions receivable from Fidelity Central Funds | | 34,252 |
| Total assets | | 14,539,028,540 |
| Liabilities | | |
| Payable for investments purchased | $167,584,241 | |
| Payable for fund shares redeemed | 411,118,337 | |
| Accrued management fee | 7,686,377 | |
| Payable for daily variation margin on futures contracts | 450,083 | |
| Total liabilities | | 586,839,038 |
| Net Assets | | $13,952,189,502 |
| Net Assets consist of: | | |
| Paid in capital | | $10,919,127,495 |
| Undistributed net investment income | | 28,158,063 |
| Accumulated undistributed net realized gain (loss) on investments | | 317,862,358 |
| Net unrealized appreciation (depreciation) on investments | | 2,687,041,586 |
| Net Assets | | $13,952,189,502 |
| Fidelity Freedom 2045 Fund: | | |
| Net Asset Value, offering price and redemption price per share ($4,406,664,525 ÷ 357,974,618 shares) | | $12.31 |
| Class K: | | |
| Net Asset Value, offering price and redemption price per share ($8,465,002,997 ÷ 688,288,075 shares) | | $12.30 |
| Class K6: | | |
| Net Asset Value, offering price and redemption price per share ($1,080,521,980 ÷ 87,784,470 shares) | | $12.31 |
See accompanying notes which are an integral part of the financial statements.
Statement of Operations
| | | Six months ended September 30, 2018 (Unaudited) |
| Investment Income | | |
| Dividends: | | |
| Affiliated issuers | | $74,110,475 |
| Interest | | 53,658 |
| Income from Fidelity Central Funds | | 64,023 |
| Total income | | 74,228,156 |
| Expenses | | |
| Management fee | $46,037,061 | |
| Independent trustees' fees and expenses | 33,061 | |
| Total expenses before reductions | 46,070,122 | |
| Expense reductions | (29) | |
| Total expenses after reductions | | 46,070,093 |
| Net investment income (loss) | | 28,158,063 |
| Realized and Unrealized Gain (Loss) | | |
| Net realized gain (loss) on: | | |
| Investment securities: | | |
| Fidelity Central Funds | 38 | |
| Other affiliated issuers | 142,320,084 | |
| Futures contracts | (6,976,326) | |
| Capital gain distributions from underlying funds: | | |
| Affiliated issuers | 205,265,775 | |
| Total net realized gain (loss) | | 340,609,571 |
| Change in net unrealized appreciation (depreciation) on: | | |
| Investment securities: | | |
| Unaffiliated issuers | (672) | |
| Affiliated issuers | 238,103,705 | |
| Futures contracts | 780,527 | |
| Total change in net unrealized appreciation (depreciation) | | 238,883,560 |
| Net gain (loss) | | 579,493,131 |
| Net increase (decrease) in net assets resulting from operations | | $607,651,194 |
See accompanying notes which are an integral part of the financial statements.
Statement of Changes in Net Assets
| | Six months ended September 30, 2018 (Unaudited) | Year ended March 31, 2018 |
| Increase (Decrease) in Net Assets | | |
| Operations | | |
| Net investment income (loss) | $28,158,063 | $142,234,368 |
| Net realized gain (loss) | 340,609,571 | 576,736,884 |
| Change in net unrealized appreciation (depreciation) | 238,883,560 | 374,497,649 |
| Net increase (decrease) in net assets resulting from operations | 607,651,194 | 1,093,468,901 |
| Distributions to shareholders from net investment income | – | (156,078,537) |
| Distributions to shareholders from net realized gain | (360,127,155) | (256,279,773) |
| Total distributions | (360,127,155) | (412,358,310) |
| Share transactions - net increase (decrease) | 399,339,193 | 9,128,031,725 |
| Total increase (decrease) in net assets | 646,863,232 | 9,809,142,316 |
| Net Assets | | |
| Beginning of period | 13,305,326,270 | 3,496,183,954 |
| End of period | $13,952,189,502 | $13,305,326,270 |
| Other Information | | |
| Undistributed net investment income end of period | $28,158,063 | $– |
See accompanying notes which are an integral part of the financial statements.
Financial Highlights
Fidelity Freedom 2045 Fund
| | Six months ended (Unaudited) September 30, | Years endedMarch 31, | | | | |
| | 2018 | 2018 | 2017 | 2016 | 2015 | 2014 |
| Selected Per–Share Data | | | | | | |
| Net asset value, beginning of period | $12.09 | $11.00 | $9.89 | $10.84 | $11.09 | $10.42 |
| Income from Investment Operations | | | | | | |
| Net investment income (loss)A | .02 | .12 | .15 | .15 | .17 | .15 |
| Net realized and unrealized gain (loss) | .52 | 1.46 | 1.39 | (.52) | .64 | 1.39 |
| Total from investment operations | .54 | 1.58 | 1.54 | (.37) | .81 | 1.54 |
| Distributions from net investment income | – | (.13) | (.15) | (.16) | (.18) | (.15) |
| Distributions from net realized gain | (.32) | (.35) | (.28) | (.43) | (.89) | (.72) |
| Total distributions | (.32) | (.49)B | (.43) | (.58)C | (1.06)D | (.87) |
| Net asset value, end of period | $12.31 | $12.09 | $11.00 | $9.89 | $10.84 | $11.09 |
| Total ReturnE,F | 4.53% | 14.48% | 16.08% | (3.59)% | 7.93% | 15.38% |
| Ratios to Average Net AssetsG,H | | | | | | |
| Expenses before reductions | .75%I | .63%J | - %K | - %K | - %K | - %K |
| Expenses net of fee waivers, if any | .75%I | .63%J | -% | -% | -% | -% |
| Expenses net of all reductions | .75%I | .63%J | -% | -% | -% | -% |
| Net investment income (loss) | .34%I | 1.04% | 1.45% | 1.48% | 1.62% | 1.42% |
| Supplemental Data | | | | | | |
| Net assets, end of period (000 omitted) | $4,406,665 | $4,144,152 | $3,496,184 | $2,912,972 | $2,993,926 | $2,885,106 |
| Portfolio turnover rateG | 23%I | 17%L | 15% | 17% | 21% | 53% |
A Calculated based on average shares outstanding during the period.
B Total distributions of $.49 per share is comprised of distributions from net investment income of $.134 and distributions from net realized gain of $.352 per share.
C Total distributions of $.58 per share is comprised of distributions from net investment income of $.155 and distributions from net realized gain of $.427 per share.
D Total distributions of $1.06 per share is comprised of distributions from net investment income of $.178 and distributions from net realized gain of $.886 per share.
E Total returns for periods of less than one year are not annualized.
F Total returns would have been lower if certain expenses had not been reduced during the applicable periods shown.
G Amounts do not include the activity of the Underlying Funds.
H Expense ratios reflect operating expenses of the class. Expenses before reductions do not reflect amounts reimbursed by the investment adviser or reductions from expense offset arrangements and do not represent the amount paid by the class during periods when reimbursements or reductions occur. Expenses net of fee waivers reflect expenses after reimbursement by the investment adviser but prior to reductions from expense offset arrangements. Expenses net of all reductions represent the net expenses paid by the class but do not include expenses of the underlying funds in which the Fund invests.
I Annualized
J On certain classes, the size and fluctuation of net assets and expense amounts may cause ratios to differ from contractual rates.
K Amount represents less than .005%.
L The portfolio turnover rate does not include the assets acquired in the merger.
See accompanying notes which are an integral part of the financial statements.
Fidelity Freedom 2045 Fund Class K
| | Six months ended (Unaudited) September 30, | Years endedMarch 31, |
| | 2018 | 2018 A |
| Selected Per–Share Data | | |
| Net asset value, beginning of period | $12.08 | $11.59 |
| Income from Investment Operations | | |
| Net investment income (loss)B | .03 | .17 |
| Net realized and unrealized gain (loss) | .51 | .67 |
| Total from investment operations | .54 | .84 |
| Distributions from net investment income | – | (.15) |
| Distributions from net realized gain | (.32) | (.19) |
| Total distributions | (.32) | (.35)C |
| Net asset value, end of period | $12.30 | $12.08 |
| Total ReturnD,E | 4.55% | 7.21% |
| Ratios to Average Net AssetsF,G | | |
| Expenses before reductions | .64%H | .65%H,I |
| Expenses net of fee waivers, if any | .64%H | .65%H,I |
| Expenses net of all reductions | .64%H | .65%H,I |
| Net investment income (loss) | .44%H | 2.05%H |
| Supplemental Data | | |
| Net assets, end of period (000 omitted) | $8,465,003 | $8,748,416 |
| Portfolio turnover rateF | 23%H | 17%J |
A For the period July 20, 2017 (commencement of sale of shares) to March 31, 2018.
B Calculated based on average shares outstanding during the period.
C Total distributions of $.35 per share is comprised of distributions from net investment income of $.153 and distributions from net realized gain of $.194 per share.
D Total returns for periods of less than one year are not annualized.
E Total returns would have been lower if certain expenses had not been reduced during the applicable periods shown.
F Amounts do not include the activity of the Underlying Funds.
G Expense ratios reflect operating expenses of the class. Expenses before reductions do not reflect amounts reimbursed by the investment adviser or reductions from expense offset arrangements and do not represent the amount paid by the class during periods when reimbursements or reductions occur. Expense ratios before reductions for start-up periods may not be representative of longer-term operating periods. Expenses net of fee waivers reflect expenses after reimbursement by the investment adviser but prior to reductions from expense offset arrangements. Expenses net of all reductions represent the net expenses paid by the class but do not include expenses of the underlying funds in which the Fund invests.
H Annualized
I On certain classes, the size and fluctuation of net assets and expense amounts may cause ratios to differ from contractual rates.
J The portfolio turnover rate does not include the assets acquired in the merger.
See accompanying notes which are an integral part of the financial statements.
Fidelity Freedom 2045 Fund Class K6
| | Six months ended (Unaudited) September 30, | Years endedMarch 31, |
| | 2018 | 2018 A |
| Selected Per–Share Data | | |
| Net asset value, beginning of period | $12.09 | $11.34 |
| Income from Investment Operations | | |
| Net investment income (loss)B | .04 | .14 |
| Net realized and unrealized gain (loss) | .51 | .96 |
| Total from investment operations | .55 | 1.10 |
| Distributions from net investment income | – | (.16) |
| Distributions from net realized gain | (.33) | (.19) |
| Total distributions | (.33) | (.35) |
| Net asset value, end of period | $12.31 | $12.09 |
| Total ReturnC,D | 4.61% | 9.70% |
| Ratios to Average Net AssetsE,F | | |
| Expenses before reductions | .49%G | .50%G,H |
| Expenses net of fee waivers, if any | .49%G | .50%G,H |
| Expenses net of all reductions | .49%G | .50%G,H |
| Net investment income (loss) | .59%G | 1.45%G |
| Supplemental Data | | |
| Net assets, end of period (000 omitted) | $1,080,522 | $412,758 |
| Portfolio turnover rateE | 23%G | 17%I |
A For the period June 7, 2017 (commencement of sale of shares) to March 31, 2018.
B Calculated based on average shares outstanding during the period.
C Total returns for periods of less than one year are not annualized.
D Total returns would have been lower if certain expenses had not been reduced during the applicable periods shown.
E Amounts do not include the activity of the Underlying Funds.
F Expense ratios reflect operating expenses of the class. Expenses before reductions do not reflect amounts reimbursed by the investment adviser or reductions from expense offset arrangements and do not represent the amount paid by the class during periods when reimbursements or reductions occur. Expense ratios before reductions for start-up periods may not be representative of longer-term operating periods. Expenses net of fee waivers reflect expenses after reimbursement by the investment adviser but prior to reductions from expense offset arrangements. Expenses net of all reductions represent the net expenses paid by the class but do not include expenses of the underlying funds in which the Fund invests.
G Annualized
H On certain classes, the size and fluctuation of net assets and expense amounts may cause ratios to differ from contractual rates.
I The portfolio turnover rate does not include the assets acquired in the merger.
See accompanying notes which are an integral part of the financial statements.
Fidelity Freedom® 2050 Fund
Investment Summary (Unaudited)
The information in the following tables is based on the direct investments of the Fund.
Top Holdings as of September 30, 2018
| | % of fund's net assets |
| Fidelity Series Intrinsic Opportunities Fund | 10.0 |
| Fidelity Series International Growth Fund | 9.3 |
| Fidelity Series International Value Fund | 9.2 |
| Fidelity Series Large Cap Stock Fund | 9.1 |
| Fidelity Series Growth Company Fund | 8.7 |
| Fidelity Series Emerging Markets Opportunities Fund | 8.6 |
| Fidelity Series Stock Selector Large Cap Value Fund | 6.8 |
| Fidelity Series Value Discovery Fund | 4.8 |
| Fidelity Series Opportunistic Insights Fund | 4.6 |
| Fidelity Series Blue Chip Growth Fund | 4.3 |
| | 75.4 |
Asset Allocation (% of fund's net assets)
| Period end |
| | Domestic Equity Funds | 60.5% |
| | International Equity Funds | 30.7% |
| | Bond Funds | 6.8% |
| | Short-Term Funds | 2.0% |
| | Short-Term Investments | 0.1% |
| | Net Other Assets (Liabilities)* | (0.1)% |

* Net Other Assets (Liabilities) are not included in the pie chart
Domestic Equity Funds category includes Fidelity Series Commodity Strategy Fund which invests in commodity-related investments.
Fidelity Freedom® 2050 Fund
Schedule of Investments September 30, 2018 (Unaudited)
Showing Percentage of Net Assets
| U.S. Treasury Obligations - 0.1% | | | |
| | | Principal Amount | Value |
| U.S. Treasury Bills, yield at date of purchase 2.07% to 2.11% 11/23/18 to 12/6/18 (a) | | | |
| (Cost $9,595,334) | | 9,630,000 | 9,594,688 |
| | | Shares | Value |
|
| Domestic Equity Funds - 60.5% | | | |
| Fidelity Series All-Sector Equity Fund (b) | | 22,515,292 | $306,433,123 |
| Fidelity Series Blue Chip Growth Fund (b) | | 33,464,933 | 512,013,480 |
| Fidelity Series Commodity Strategy Fund (b) | | 50,104,202 | 250,521,009 |
| Fidelity Series Growth Company Fund (b) | | 51,179,943 | 1,034,346,656 |
| Fidelity Series Intrinsic Opportunities Fund (b) | | 64,781,043 | 1,187,436,516 |
| Fidelity Series Large Cap Stock Fund (b) | | 68,157,030 | 1,085,741,494 |
| Fidelity Series Large Cap Value Index Fund (b) | | 22,542,698 | 297,563,612 |
| Fidelity Series Opportunistic Insights Fund (b) | | 27,775,224 | 551,338,197 |
| Fidelity Series Small Cap Discovery Fund (b) | | 11,221,790 | 136,344,747 |
| Fidelity Series Small Cap Opportunities Fund (b) | | 30,337,217 | 445,653,721 |
| Fidelity Series Stock Selector Large Cap Value Fund (b) | | 60,924,097 | 805,416,567 |
| Fidelity Series Value Discovery Fund (b) | | 41,636,845 | 570,008,406 |
| TOTAL DOMESTIC EQUITY FUNDS | | | |
| (Cost $5,504,813,976) | | | 7,182,817,528 |
|
| International Equity Funds - 30.7% | | | |
| Fidelity Series Canada Fund (b) | | 9,834,409 | 106,309,962 |
| Fidelity Series Emerging Markets Fund (b) | | 6,933,301 | 67,183,687 |
| Fidelity Series Emerging Markets Opportunities Fund (b) | | 53,162,111 | 1,020,180,919 |
| Fidelity Series International Growth Fund (b) | | 67,097,861 | 1,100,404,913 |
| Fidelity Series International Small Cap Fund (b) | | 14,516,948 | 259,853,377 |
| Fidelity Series International Value Fund (b) | | 103,935,372 | 1,093,400,112 |
| TOTAL INTERNATIONAL EQUITY FUNDS | | | |
| (Cost $3,060,959,152) | | | 3,647,332,970 |
|
| Bond Funds - 6.8% | | | |
| Fidelity Series Emerging Markets Debt Fund (b) | | 7,358,488 | 70,126,390 |
| Fidelity Series Floating Rate High Income Fund (b) | | 2,739,712 | 26,082,060 |
| Fidelity Series High Income Fund (b) | | 16,127,528 | 154,985,547 |
| Fidelity Series Inflation-Protected Bond Index Fund (b) | | 3,686,975 | 35,800,531 |
| Fidelity Series International Credit Fund (b) | | 491,100 | 4,827,510 |
| Fidelity Series Investment Grade Bond Fund (b) | | 4,837,109 | 52,676,120 |
| Fidelity Series Long-Term Treasury Bond Index Fund (b) | | 50,008,589 | 412,070,773 |
| Fidelity Series Real Estate Income Fund (b) | | 4,707,019 | 50,741,661 |
| TOTAL BOND FUNDS | | | |
| (Cost $829,868,479) | | | 807,310,592 |
|
| Short-Term Funds - 2.0% | | | |
| Fidelity Cash Central Fund, 2.11% (c) | | 17,576,469 | 17,579,984 |
| Fidelity Series Government Money Market Fund 2.12% (b)(d) | | 175,810,970 | 175,810,970 |
| Fidelity Series Short-Term Credit Fund (b) | | 3,784,431 | 37,314,486 |
| TOTAL SHORT-TERM FUNDS | | | |
| (Cost $231,050,030) | | | 230,705,440 |
| TOTAL INVESTMENT IN SECURITIES - 100.1% | | | |
| (Cost $9,636,286,971) | | | 11,877,761,218 |
| NET OTHER ASSETS (LIABILITIES) - (0.1)% | | | (6,842,419) |
| NET ASSETS - 100% | | | $11,870,918,799 |
| Futures Contracts | | | | | |
| | Number of contracts | Expiration Date | Notional Amount | Value | Unrealized Appreciation/(Depreciation) |
| Purchased | | | | | |
| Equity Index Contracts | | | | | |
| CME E-mini S&P 500 Index Contracts (United States) | 458 | Dec. 2018 | $66,845,100 | $12,967 | $12,967 |
| ICE E-mini MSCI Emerging Markets Index Contracts (United States) | 690 | Dec. 2018 | 36,214,650 | 713,671 | 713,671 |
|
| TOTAL PURCHASED | | | | | 726,638 |
|
| Sold | | | | | |
| Equity Index Contracts | | | | | |
| ICE E-mini MSCI EAFE Index Contracts (United States) | 304 | Dec. 2018 | 30,027,600 | (57,281) | (57,281) |
| TOTAL FUTURES CONTRACTS | | | | | $669,357 |
The notional amount of futures purchased as a percentage of Net Assets is 0.9%
The notional amount of futures sold as a percentage of Net Assets is 0.3%
Legend
(a) Security or a portion of the security was pledged to cover margin requirements for futures contracts. At period end, the value of securities pledged amounted to $2,627,720.
(b) Affiliated Fund
(c) Affiliated fund that is generally available only to investment companies and other accounts managed by Fidelity Investments. The rate quoted is the annualized seven-day yield of the fund at period end. A complete unaudited listing of the fund's holdings as of its most recent quarter end is available upon request. In addition, each Fidelity Central Fund's financial statements are available on the SEC's website or upon request.
(d) The rate quoted is the annualized seven-day yield of the fund at period end.
Affiliated Central Funds
Information regarding fiscal year to date income earned by the Fund from investments in Fidelity Central Funds is as follows:
| Fund | Income earned |
| Fidelity Cash Central Fund | $52,191 |
| Total | $52,191 |
Amounts in the income column in the above table include any capital gain distributions from underlying funds, which are presented in the corresponding line-item in the Statement of Operations if applicable.
Affiliated Underlying Funds
Fiscal year to date information regarding the Fund's investments in affiliated Underlying Funds, excluding any Money Market Central Funds, is presented below. Exchanges between classes of the same affiliated Underlying Funds may occur.
| Affiliate | Value, beginning of period | Purchases | Sales Proceeds | Dividend Income | Realized Gain (loss) | Change in Unrealized appreciation (depreciation) | Value, end of period |
| Fidelity Series 100 Index Fund | $222,464,053 | $56,827 | $238,274,425 | $-- | $97,847,141 | $(82,093,596) | $-- |
| Fidelity Series All-Sector Equity Fund | 429,071,816 | 23,203,101 | 195,029,830 | -- | 15,206,670 | 33,981,366 | 306,433,123 |
| Fidelity Series Blue Chip Growth Fund | 443,402,520 | 71,874,053 | 36,006,249 | 47,308,816 | 2,066,813 | 30,676,343 | 512,013,480 |
| Fidelity Series Canada Fund | 98,832,496 | 5,930,275 | 4,654,623 | -- | 49,720 | 6,152,094 | 106,309,962 |
| Fidelity Series Commodity Strategy Fund | 235,237,103 | 45,065,827 | 9,591,708 | 14,932,723 | (2,403,843) | (17,786,370) | 250,521,009 |
| Fidelity Series Emerging Markets Debt Fund | 71,582,940 | 5,817,711 | 3,327,094 | 2,128,234 | (173,741) | (3,773,426) | 70,126,390 |
| Fidelity Series Emerging Markets Fund | -- | 66,268,976 | -- | -- | -- | 914,711 | 67,183,687 |
| Fidelity Series Emerging Markets | 1,027,149,604 | 171,335,113 | 46,443,815 | -- | 1,447,820 | (133,307,803) | 1,020,180,919 |
| Fidelity Series Floating Rate High Income | 25,093,502 | 2,221,355 | 1,260,070 | 685,282 | (27,263) | 54,536 | 26,082,060 |
| Fidelity Series Government Money Market | 180,118,828 | 177,577,132 | 181,884,990 | 1,502,022 | -- | -- | 175,810,970 |
| Fidelity Series Growth Company Fund | 902,132,390 | 50,611,056 | 54,335,090 | -- | 927,756 | 135,010,544 | 1,034,346,656 |
| Fidelity Series High Income Fund | 154,489,571 | 12,376,379 | 13,147,475 | 4,489,822 | (380,771) | 1,647,843 | 154,985,547 |
| Fidelity Series Inflation-Protected Bond | 90,992,656 | 10,995,849 | 66,540,392 | 137,196 | (954,534) | 1,306,952 | 35,800,531 |
| Fidelity Series International Credit Fund | 4,937,865 | 62,671 | 123,351 | 60,853 | (1,612) | (48,063) | 4,827,510 |
| Fidelity Series International Growth Fund | 995,013,836 | 129,843,691 | 40,354,120 | -- | 168,830 | 15,732,676 | 1,100,404,913 |
| Fidelity Series International Small Cap Fund | 248,264,939 | 25,685,853 | 4,248,837 | -- | (138,481) | (9,710,097) | 259,853,377 |
| Fidelity Series International Value Fund | 1,007,232,591 | 101,308,164 | 13,049,891 | -- | (417,648) | (1,673,104) | 1,093,400,112 |
| Fidelity Series Intrinsic Opportunities Fund | 1,095,273,542 | 117,261,037 | 41,405,597 | 52,267,409 | (393,442) | 16,700,976 | 1,187,436,516 |
| Fidelity Series Investment Grade Bond Fund | 53,699,737 | 5,477,301 | 5,879,050 | 743,427 | (96,326) | (525,542) | 52,676,120 |
| Fidelity Series Large Cap Stock Fund | 970,491,938 | 120,229,598 | 52,258,201 | 63,018,374 | 734,823 | 46,543,336 | 1,085,741,494 |
| Fidelity Series Large Cap Value Index Fund | 276,330,213 | 15,997,436 | 14,478,986 | -- | 109,664 | 19,605,285 | 297,563,612 |
| Fidelity Series Long-Term Treasury Bond | 252,756,420 | 267,096,767 | 94,079,575 | 5,190,693 | (3,100,499) | (10,602,340) | 412,070,773 |
| Fidelity Series Opportunistic Insights Fund | 485,903,915 | 27,930,559 | 26,437,478 | -- | 356,244 | 63,584,957 | 551,338,197 |
| Fidelity Series Real Estate Equity Fund | 88,578,147 | 981,590 | 93,370,139 | 825,806 | 1,459,039 | 2,351,363 | -- |
| Fidelity Series Real Estate Income Fund | 47,880,196 | 5,011,646 | 2,437,954 | 2,122,902 | (18,325) | 306,098 | 50,741,661 |
| Fidelity Series Short-Term Credit Fund | 33,678,083 | 5,344,509 | 1,707,854 | 394,128 | (13,639) | 13,387 | 37,314,486 |
| Fidelity Series Small Cap Discovery Fund | 129,743,700 | 15,429,674 | 6,877,644 | 7,926,368 | (178,694) | (1,772,289) | 136,344,747 |
| Fidelity Series Small Cap Opportunities Fund | 401,012,829 | 57,117,828 | 24,405,892 | 34,284,495 | 695,328 | 11,233,628 | 445,653,721 |
| Fidelity Series Stock Selector Large Cap | 755,175,216 | 42,865,141 | 45,413,304 | -- | (760,392) | 53,549,906 | 805,416,567 |
| Fidelity Series Value Discovery Fund | 535,725,735 | 30,443,623 | 27,957,249 | -- | (226,486) | 32,022,783 | 570,008,406 |
| | $11,262,266,381 | $1,611,420,742 | $1,344,980,883 | $238,018,550 | $111,784,152 | $210,096,154 | $11,850,586,546 |
Amounts in the income column in the above table include any capital gain distributions from underlying funds, which are presented in the corresponding line-item in the Statement of Operations if applicable.
Investment Valuation
The following is a summary of the inputs used, as of September 30, 2018, involving the Fund's assets and liabilities carried at fair value. The inputs or methodology used for valuing securities may not be an indication of the risk associated with investing in those securities. For more information on valuation inputs, and their aggregation into the levels used below, please refer to the Investment Valuation section in the accompanying Notes to Financial Statements.
| | Valuation Inputs at Reporting Date: |
| Description | Total | Level 1 | Level 2 | Level 3 |
| Investments in Securities: | | | | |
| Other Short-Term Investments | $9,594,688 | $-- | $9,594,688 | $-- |
| Domestic Equity Funds | 7,182,817,528 | 7,182,817,528 | -- | -- |
| International Equity Funds | 3,647,332,970 | 3,647,332,970 | -- | -- |
| Bond Funds | 807,310,592 | 807,310,592 | -- | -- |
| Short-Term Funds | 230,705,440 | 230,705,440 | -- | -- |
| Total Investments in Securities: | $11,877,761,218 | $11,868,166,530 | $9,594,688 | $-- |
| Derivative Instruments: | | | | |
| Assets | | | | |
| Futures Contracts | $726,638 | $726,638 | $-- | $-- |
| Total Assets | $726,638 | $726,638 | $-- | $-- |
| Liabilities | | | | |
| Futures Contracts | $(57,281) | $(57,281) | $-- | $-- |
| Total Liabilities | $(57,281) | $(57,281) | $-- | $-- |
| Total Derivative Instruments: | $669,357 | $669,357 | $-- | $-- |
Value of Derivative Instruments
The following table is a summary of the Fund's value of derivative instruments by primary risk exposure as of September 30, 2018. For additional information on derivative instruments, please refer to the Derivative Instruments section in the accompanying Notes to Financial Statements.
| Primary Risk Exposure / Derivative Type | Value |
| | Asset | Liability |
| Equity Risk | | |
| Futures Contracts(a) | $726,638 | $(57,281) |
| Total Equity Risk | 726,638 | (57,281) |
| Total Value of Derivatives | $726,638 | $(57,281) |
(a) Reflects gross cumulative appreciation (depreciation) on futures contracts as presented in the Schedule of Investments. In the Statement of Assets and Liabilities, the period end daily variation margin is included in receivable or payable for daily variation margin on futures contracts, and the net cumulative appreciation (depreciation) is included in net unrealized appreciation (depreciation).
See accompanying notes which are an integral part of the financial statements.
Fidelity Freedom® 2050 Fund
Financial Statements
Statement of Assets and Liabilities
| | | September 30, 2018 (Unaudited) |
| Assets | | |
Investment in securities, at value — See accompanying schedule:
Unaffiliated issuers (cost $9,595,334) | $9,594,688 | |
| Fidelity Central Funds (cost $17,579,984) | 17,579,984 | |
| Other affiliated issuers (cost $9,609,111,653) | 11,850,586,546 | |
| Total Investment in Securities (cost $9,636,286,971) | | $11,877,761,218 |
| Receivable for investments sold | | 129,841,397 |
| Receivable for fund shares sold | | 347,764,386 |
| Distributions receivable from Fidelity Central Funds | | 27,111 |
| Total assets | | 12,355,394,112 |
| Liabilities | | |
| Payable for investments purchased | $144,898,700 | |
| Payable for fund shares redeemed | 332,652,271 | |
| Accrued management fee | 6,538,783 | |
| Payable for daily variation margin on futures contracts | 385,559 | |
| Total liabilities | | 484,475,313 |
| Net Assets | | $11,870,918,799 |
| Net Assets consist of: | | |
| Paid in capital | | $9,344,212,215 |
| Undistributed net investment income | | 22,952,456 |
| Accumulated undistributed net realized gain (loss) on investments | | 261,610,524 |
| Net unrealized appreciation (depreciation) on investments | | 2,242,143,604 |
| Net Assets | | $11,870,918,799 |
| Fidelity Freedom 2050 Fund: | | |
| Net Asset Value, offering price and redemption price per share ($3,699,609,000 ÷ 298,791,260 shares) | | $12.38 |
| Class K: | | |
| Net Asset Value, offering price and redemption price per share ($7,287,972,236 ÷ 589,203,351 shares) | | $12.37 |
| Class K6: | | |
| Net Asset Value, offering price and redemption price per share ($883,337,563 ÷ 71,295,771 shares) | | $12.39 |
See accompanying notes which are an integral part of the financial statements.
Statement of Operations
| | | Six months ended September 30, 2018 (Unaudited) |
| Investment Income | | |
| Dividends: | | |
| Affiliated issuers | | $63,019,629 |
| Interest | | 47,268 |
| Income from Fidelity Central Funds | | 52,191 |
| Total income | | 63,119,088 |
| Expenses | | |
| Management fee | $39,062,176 | |
| Independent trustees' fees and expenses | 28,016 | |
| Total expenses before reductions | 39,090,192 | |
| Expense reductions | (6) | |
| Total expenses after reductions | | 39,090,186 |
| Net investment income (loss) | | 24,028,902 |
| Realized and Unrealized Gain (Loss) | | |
| Net realized gain (loss) on: | | |
| Investment securities: | | |
| Fidelity Central Funds | 33 | |
| Other affiliated issuers | 111,784,152 | |
| Futures contracts | (5,971,111) | |
| Capital gain distributions from underlying funds: | | |
| Affiliated issuers | 174,998,921 | |
| Total net realized gain (loss) | | 280,811,995 |
| Change in net unrealized appreciation (depreciation) on: | | |
| Investment securities: | | |
| Unaffiliated issuers | (646) | |
| Affiliated issuers | 210,096,154 | |
| Futures contracts | 669,357 | |
| Total change in net unrealized appreciation (depreciation) | | 210,764,865 |
| Net gain (loss) | | 491,576,860 |
| Net increase (decrease) in net assets resulting from operations | | $515,605,762 |
See accompanying notes which are an integral part of the financial statements.
Statement of Changes in Net Assets
| | Six months ended September 30, 2018 (Unaudited) | Year ended March 31, 2018 |
| Increase (Decrease) in Net Assets | | |
| Operations | | |
| Net investment income (loss) | $24,028,902 | $119,339,449 |
| Net realized gain (loss) | 280,811,995 | 479,169,493 |
| Change in net unrealized appreciation (depreciation) | 210,764,865 | 312,072,760 |
| Net increase (decrease) in net assets resulting from operations | 515,605,762 | 910,581,702 |
| Distributions to shareholders from net investment income | – | (131,450,258) |
| Distributions to shareholders from net realized gain | (299,795,085) | (213,055,694) |
| Total distributions | (299,795,085) | (344,505,952) |
| Share transactions - net increase (decrease) | 399,180,447 | 7,805,021,541 |
| Total increase (decrease) in net assets | 614,991,124 | 8,371,097,291 |
| Net Assets | | |
| Beginning of period | 11,255,927,675 | 2,884,830,384 |
| End of period | $11,870,918,799 | $11,255,927,675 |
| Other Information | | |
| Undistributed net investment income end of period | $22,952,456 | $– |
| Distributions in excess of net investment income end of period | $– | $(1,076,446) |
See accompanying notes which are an integral part of the financial statements.
Financial Highlights
Fidelity Freedom 2050 Fund
| | Six months ended (Unaudited) September 30, | Years endedMarch 31, | | | | |
| | 2018 | 2018 | 2017 | 2016 | 2015 | 2014 |
| Selected Per–Share Data | | | | | | |
| Net asset value, beginning of period | $12.16 | $11.05 | $9.93 | $10.90 | $11.15 | $10.28 |
| Income from Investment Operations | | | | | | |
| Net investment income (loss)A | .02 | .12 | .15 | .15 | .17 | .15 |
| Net realized and unrealized gain (loss) | .52 | 1.48 | 1.40 | (.52) | .65 | 1.41 |
| Total from investment operations | .54 | 1.60 | 1.55 | (.37) | .82 | 1.56 |
| Distributions from net investment income | – | (.14) | (.15) | (.16) | (.18) | (.15) |
| Distributions from net realized gain | (.32) | (.35) | (.28) | (.44) | (.89) | (.54) |
| Total distributions | (.32) | (.49) | (.43) | (.60) | (1.07) | (.69) |
| Net asset value, end of period | $12.38 | $12.16 | $11.05 | $9.93 | $10.90 | $11.15 |
| Total ReturnB,C | 4.48% | 14.59% | 16.11% | (3.65)% | 7.91% | 15.53% |
| Ratios to Average Net AssetsD,E | | | | | | |
| Expenses before reductions | .75%F | .63%G | - %H | - %H | - %H | - %H |
| Expenses net of fee waivers, if any | .75%F | .63%G | -% | -% | -% | -% |
| Expenses net of all reductions | .75%F | .63%G | -% | -% | -% | -% |
| Net investment income (loss) | .34%F | 1.04% | 1.45% | 1.49% | 1.62% | 1.41% |
| Supplemental Data | | | | | | |
| Net assets, end of period (000 omitted) | $3,699,609 | $3,452,997 | $2,884,830 | $2,363,381 | $2,375,308 | $2,297,832 |
| Portfolio turnover rateD | 23%F | 16%I | 15% | 17% | 23% | 57% |
A Calculated based on average shares outstanding during the period.
B Total returns for periods of less than one year are not annualized.
C Total returns would have been lower if certain expenses had not been reduced during the applicable periods shown.
D Amounts do not include the activity of the Underlying Funds.
E Expense ratios reflect operating expenses of the class. Expenses before reductions do not reflect amounts reimbursed by the investment adviser or reductions from expense offset arrangements and do not represent the amount paid by the class during periods when reimbursements or reductions occur. Expenses net of fee waivers reflect expenses after reimbursement by the investment adviser but prior to reductions from expense offset arrangements. Expenses net of all reductions represent the net expenses paid by the class but do not include expenses of the underlying funds in which the Fund invests.
F Annualized
G On certain classes, the size and fluctuation of net assets and expense amounts may cause ratios to differ from contractual rates.
H Amount represents less than .005%.
I The portfolio turnover rate does not include the assets acquired in the merger.
See accompanying notes which are an integral part of the financial statements.
Fidelity Freedom 2050 Fund Class K
| | Six months ended (Unaudited) September 30, | Years endedMarch 31, |
| | 2018 | 2018 A |
| Selected Per–Share Data | | |
| Net asset value, beginning of period | $12.14 | $11.65 |
| Income from Investment Operations | | |
| Net investment income (loss)B | .03 | .17 |
| Net realized and unrealized gain (loss) | .52 | .67 |
| Total from investment operations | .55 | .84 |
| Distributions from net investment income | – | (.15) |
| Distributions from net realized gain | (.32) | (.19) |
| Total distributions | (.32) | (.35)C |
| Net asset value, end of period | $12.37 | $12.14 |
| Total ReturnD,E | 4.57% | 7.18% |
| Ratios to Average Net AssetsF,G | | |
| Expenses before reductions | .64%H | .65%H,I |
| Expenses net of fee waivers, if any | .64%H | .65%H,I |
| Expenses net of all reductions | .64%H | .65%H,I |
| Net investment income (loss) | .44%H | 2.04%H |
| Supplemental Data | | |
| Net assets, end of period (000 omitted) | $7,287,972 | $7,475,339 |
| Portfolio turnover rateF | 23%H | 16%J |
A For the period July 20, 2017 (commencement of sale of shares) to March 31, 2018.
B Calculated based on average shares outstanding during the period.
C Total distributions of $.35 per share is comprised of distributions from net investment income of $.154 and distributions from net realized gain of $.194 per share.
D Total returns for periods of less than one year are not annualized.
E Total returns would have been lower if certain expenses had not been reduced during the applicable periods shown.
F Amounts do not include the activity of the Underlying Funds.
G Expense ratios reflect operating expenses of the class. Expenses before reductions do not reflect amounts reimbursed by the investment adviser or reductions from expense offset arrangements and do not represent the amount paid by the class during periods when reimbursements or reductions occur. Expense ratios before reductions for start-up periods may not be representative of longer-term operating periods. Expenses net of fee waivers reflect expenses after reimbursement by the investment adviser but prior to reductions from expense offset arrangements. Expenses net of all reductions represent the net expenses paid by the class but do not include expenses of the underlying funds in which the Fund invests.
H Annualized
I On certain classes, the size and fluctuation of net assets and expense amounts may cause ratios to differ from contractual rates.
J The portfolio turnover rate does not include the assets acquired in the merger.
See accompanying notes which are an integral part of the financial statements.
Fidelity Freedom 2050 Fund Class K6
| | Six months ended (Unaudited) September 30, | Years endedMarch 31, |
| | 2018 | 2018 A |
| Selected Per–Share Data | | |
| Net asset value, beginning of period | $12.15 | $11.40 |
| Income from Investment Operations | | |
| Net investment income (loss)B | .04 | .14 |
| Net realized and unrealized gain (loss) | .52 | .96 |
| Total from investment operations | .56 | 1.10 |
| Distributions from net investment income | – | (.16) |
| Distributions from net realized gain | (.32) | (.19) |
| Total distributions | (.32) | (.35) |
| Net asset value, end of period | $12.39 | $12.15 |
| Total ReturnC,D | 4.65% | 9.65% |
| Ratios to Average Net AssetsE,F | | |
| Expenses before reductions | .49%G | .50%G,H |
| Expenses net of fee waivers, if any | .49%G | .50%G,H |
| Expenses net of all reductions | .49%G | .50%G,H |
| Net investment income (loss) | .59%G | 1.42%G |
| Supplemental Data | | |
| Net assets, end of period (000 omitted) | $883,338 | $327,591 |
| Portfolio turnover rateE | 23%G | 16%I |
A For the period June 7, 2017 (commencement of sale of shares) to March 31, 2018.
B Calculated based on average shares outstanding during the period.
C Total returns for periods of less than one year are not annualized.
D Total returns would have been lower if certain expenses had not been reduced during the applicable periods shown.
E Amounts do not include the activity of the Underlying Funds.
F Expense ratios reflect operating expenses of the class. Expenses before reductions do not reflect amounts reimbursed by the investment adviser or reductions from expense offset arrangements and do not represent the amount paid by the class during periods when reimbursements or reductions occur. Expense ratios before reductions for start-up periods may not be representative of longer-term operating periods. Expenses net of fee waivers reflect expenses after reimbursement by the investment adviser but prior to reductions from expense offset arrangements. Expenses net of all reductions represent the net expenses paid by the class but do not include expenses of the underlying funds in which the Fund invests.
G Annualized
H On certain classes, the size and fluctuation of net assets and expense amounts may cause ratios to differ from contractual rates.
I The portfolio turnover rate does not include the assets acquired in the merger.
See accompanying notes which are an integral part of the financial statements.
Fidelity Freedom® 2055 Fund
Investment Summary (Unaudited)
The information in the following tables is based on the direct investments of the Fund.
Top Holdings as of September 30, 2018
| | % of fund's net assets |
| Fidelity Series Intrinsic Opportunities Fund | 10.0 |
| Fidelity Series International Growth Fund | 9.3 |
| Fidelity Series International Value Fund | 9.2 |
| Fidelity Series Large Cap Stock Fund | 9.2 |
| Fidelity Series Growth Company Fund | 8.7 |
| Fidelity Series Emerging Markets Opportunities Fund | 8.6 |
| Fidelity Series Stock Selector Large Cap Value Fund | 6.8 |
| Fidelity Series Value Discovery Fund | 4.8 |
| Fidelity Series Opportunistic Insights Fund | 4.6 |
| Fidelity Series Blue Chip Growth Fund | 4.3 |
| | 75.5 |
Asset Allocation (% of fund's net assets)
| Period end |
| | Domestic Equity Funds | 60.5% |
| | International Equity Funds | 30.7% |
| | Bond Funds | 6.8% |
| | Short-Term Funds | 2.0% |
| | Short-Term Investments | 0.1% |
| | Net Other Assets (Liabilities)* | (0.1)% |

* Net Other Assets (Liabilities) are not included in the pie chart
Domestic Equity Funds category includes Fidelity Series Commodity Strategy Fund which invests in commodity-related investments.
Fidelity Freedom® 2055 Fund
Schedule of Investments September 30, 2018 (Unaudited)
Showing Percentage of Net Assets
| U.S. Treasury Obligations - 0.1% | | | |
| | | Principal Amount | Value |
| U.S. Treasury Bills, yield at date of purchase 2.09% to 2.11% 11/29/18 to 12/6/18 (a) | | | |
| (Cost $3,706,510) | | 3,720,000 | 3,706,269 |
| | | Shares | Value |
|
| Domestic Equity Funds - 60.5% | | | |
| Fidelity Series All-Sector Equity Fund (b) | | 9,105,100 | $123,920,415 |
| Fidelity Series Blue Chip Growth Fund (b) | | 13,918,412 | 212,951,704 |
| Fidelity Series Commodity Strategy Fund (b) | | 20,839,020 | 104,195,101 |
| Fidelity Series Growth Company Fund (b) | | 21,286,614 | 430,202,477 |
| Fidelity Series Intrinsic Opportunities Fund (b) | | 26,849,368 | 492,148,917 |
| Fidelity Series Large Cap Stock Fund (b) | | 28,430,084 | 452,891,238 |
| Fidelity Series Large Cap Value Index Fund (b) | | 9,421,404 | 124,362,536 |
| Fidelity Series Opportunistic Insights Fund (b) | | 11,575,672 | 229,777,087 |
| Fidelity Series Small Cap Discovery Fund (b) | | 4,689,690 | 56,979,736 |
| Fidelity Series Small Cap Opportunities Fund (b) | | 12,651,242 | 185,846,750 |
| Fidelity Series Stock Selector Large Cap Value Fund (b) | | 25,485,771 | 336,921,888 |
| Fidelity Series Value Discovery Fund (b) | | 17,396,737 | 238,161,325 |
| TOTAL DOMESTIC EQUITY FUNDS | | | |
| (Cost $2,505,455,575) | | | 2,988,359,174 |
|
| International Equity Funds - 30.7% | | | |
| Fidelity Series Canada Fund (b) | | 4,096,017 | 44,277,940 |
| Fidelity Series Emerging Markets Fund (b) | | 2,889,271 | 27,997,039 |
| Fidelity Series Emerging Markets Opportunities Fund (b) | | 22,099,529 | 424,089,956 |
| Fidelity Series International Growth Fund(b) | | 27,919,825 | 457,885,133 |
| Fidelity Series International Small Cap Fund (b) | | 6,045,264 | 108,210,220 |
| Fidelity Series International Value Fund (b) | | 43,248,584 | 454,975,106 |
| TOTAL INTERNATIONAL EQUITY FUNDS | | | |
| (Cost $1,361,572,493) | | | 1,517,435,394 |
|
| Bond Funds - 6.8% | | | |
| Fidelity Series Emerging Markets Debt Fund (b) | | 2,990,132 | 28,495,959 |
| Fidelity Series Floating Rate High Income Fund (b) | | 1,171,446 | 11,152,165 |
| Fidelity Series High Income Fund (b) | | 6,716,711 | 64,547,595 |
| Fidelity Series Inflation-Protected Bond Index Fund (b) | | 1,533,598 | 14,891,240 |
| Fidelity Series International Credit Fund (b) | | 165,944 | 1,631,234 |
| Fidelity Series Investment Grade Bond Fund (b) | | 2,012,097 | 21,911,734 |
| Fidelity Series Long-Term Treasury Bond Index Fund (b) | | 20,791,298 | 171,320,295 |
| Fidelity Series Real Estate Income Fund (b) | | 1,993,634 | 21,491,371 |
| TOTAL BOND FUNDS | | | |
| (Cost $344,257,444) | | | 335,441,593 |
|
| Short-Term Funds - 2.0% | | | |
| Fidelity Cash Central Fund, 2.11% (c) | | 6,950,741 | 6,952,131 |
| Fidelity Series Government Money Market Fund 2.12% (b)(d) | | 73,977,592 | 73,977,592 |
| Fidelity Series Short-Term Credit Fund (b) | | 1,592,464 | 15,701,695 |
| TOTAL SHORT-TERM FUNDS | | | |
| (Cost $96,762,701) | | | 96,631,418 |
| TOTAL INVESTMENT IN SECURITIES - 100.1% | | | |
| (Cost $4,311,754,723) | | | 4,941,573,848 |
| NET OTHER ASSETS (LIABILITIES) - (0.1)% | | | (2,809,177) |
| NET ASSETS - 100% | | | $4,938,764,671 |
| Futures Contracts | | | | | |
| | Number of contracts | Expiration Date | Notional Amount | Value | Unrealized Appreciation/(Depreciation) |
| Purchased | | | | | |
| Equity Index Contracts | | | | | |
| CME E-mini S&P 500 Index Contracts (United States) | 190 | Dec. 2018 | $27,730,500 | $5,379 | $5,379 |
| ICE E-mini MSCI Emerging Markets Index Contracts (United States) | 294 | Dec. 2018 | 15,430,590 | 303,896 | 303,896 |
|
| TOTAL PURCHASED | | | | | 309,275 |
|
| Sold | | | | | |
| Equity Index Contracts | | | | | |
| ICE E-mini MSCI EAFE Index Contracts (United States) | 130 | Dec. 2018 | 12,840,750 | (24,737) | (24,737) |
| TOTAL FUTURES CONTRACTS | | | | | $284,538 |
The notional amount of futures purchased as a percentage of Net Assets is 0.9%
The notional amount of futures sold as a percentage of Net Assets is 0.3%
Legend
(a) Security or a portion of the security was pledged to cover margin requirements for futures contracts. At period end, the value of securities pledged amounted to $1,012,037.
(b) Affiliated Fund
(c) Affiliated fund that is generally available only to investment companies and other accounts managed by Fidelity Investments. The rate quoted is the annualized seven-day yield of the fund at period end. A complete unaudited listing of the fund's holdings as of its most recent quarter end is available upon request. In addition, each Fidelity Central Fund's financial statements are available on the SEC's website or upon request.
(d) The rate quoted is the annualized seven-day yield of the fund at period end.
Affiliated Central Funds
Information regarding fiscal year to date income earned by the Fund from investments in Fidelity Central Funds is as follows:
| Fund | Income earned |
| Fidelity Cash Central Fund | $20,640 |
| Total | $20,640 |
Amounts in the income column in the above table include any capital gain distributions from underlying funds, which are presented in the corresponding line-item in the Statement of Operations if applicable.
Affiliated Underlying Funds
Fiscal year to date information regarding the Fund's investments in affiliated Underlying Funds, excluding any Money Market Central Funds, is presented below. Exchanges between classes of the same affiliated Underlying Funds may occur.
| Affiliate | Value, beginning of period | Purchases | Sales Proceeds | Dividend Income | Realized Gain (loss) | Change in Unrealized appreciation (depreciation) | Value, end of period |
| Fidelity Series 100 Index Fund | $86,342,541 | $40,265 | $92,405,409 | $-- | $25,419,336 | $(19,396,733) | $-- |
| Fidelity Series All-Sector Equity Fund | 167,584,790 | 19,623,829 | 83,103,942 | -- | 1,590,789 | 18,224,949 | 123,920,415 |
| Fidelity Series Blue Chip Growth Fund | 173,114,503 | 40,669,813 | 13,494,103 | 19,514,468 | 325,897 | 12,335,594 | 212,951,704 |
| Fidelity Series Canada Fund | 38,606,833 | 4,913,985 | 1,709,856 | -- | 5,757 | 2,461,221 | 44,277,940 |
| Fidelity Series Commodity Strategy Fund | 91,934,990 | 24,165,924 | 3,631,640 | 6,162,495 | (725,531) | (7,548,642) | 104,195,101 |
| Fidelity Series Emerging Markets Debt Fund | 27,209,763 | 3,986,873 | 1,183,395 | 835,394 | (78,112) | (1,439,170) | 28,495,959 |
| Fidelity Series Emerging Markets Fund | -- | 27,521,583 | -- | -- | -- | 475,456 | 27,997,039 |
| Fidelity Series Emerging Markets | 400,892,549 | 91,268,462 | 15,514,228 | -- | (555,073) | (52,001,754) | 424,089,956 |
| Fidelity Series Floating Rate High Income | 10,002,475 | 1,595,128 | 457,856 | 282,755 | (18,646) | 31,064 | 11,152,165 |
| Fidelity Series Government Money Market | 70,121,042 | 79,169,095 | 75,312,545 | 602,092 | -- | -- | 73,977,592 |
| Fidelity Series Growth Company Fund | 351,980,935 | 42,863,477 | 19,396,307 | -- | (194,061) | 54,948,433 | 430,202,477 |
| Fidelity Series High Income Fund | 60,175,196 | 8,543,861 | 4,685,695 | 1,807,339 | (48,275) | 562,508 | 64,547,595 |
| Fidelity Series Inflation-Protected Bond | 35,675,631 | 6,468,769 | 27,409,696 | 54,689 | (391,567) | 548,103 | 14,891,240 |
| Fidelity Series International Credit Fund | 1,668,964 | 21,592 | 42,533 | 20,568 | (554) | (16,235) | 1,631,234 |
| Fidelity Series International Growth Fund | 388,374,374 | 78,177,947 | 15,142,246 | -- | 14,193 | 6,460,865 | 457,885,133 |
| Fidelity Series International Small Cap Fund | 96,898,872 | 16,002,322 | 760,708 | -- | (23,665) | (3,906,601) | 108,210,220 |
| Fidelity Series International Value Fund | 393,238,509 | 65,652,903 | 3,359,381 | -- | (70,422) | (486,503) | 454,975,106 |
| Fidelity Series Intrinsic Opportunities Fund | 427,000,743 | 76,843,928 | 17,728,133 | 21,499,702 | (225,687) | 6,258,066 | 492,148,917 |
| Fidelity Series Investment Grade Bond Fund | 20,925,164 | 3,446,720 | 2,211,247 | 299,154 | (32,344) | (216,559) | 21,911,734 |
| Fidelity Series Large Cap Stock Fund | 379,289,030 | 73,469,947 | 18,701,835 | 25,555,321 | 131,364 | 18,702,732 | 452,891,238 |
| Fidelity Series Large Cap Value Index Fund | 107,932,581 | 13,647,427 | 5,184,343 | -- | (13,108) | 7,979,979 | 124,362,536 |
| Fidelity Series Long-Term Treasury Bond | 98,801,847 | 112,745,472 | 34,624,345 | 2,093,100 | (1,147,844) | (4,454,835) | 171,320,295 |
| Fidelity Series Opportunistic Insights Fund | 189,694,018 | 23,880,844 | 9,477,035 | -- | (22,574) | 25,701,834 | 229,777,087 |
| Fidelity Series Real Estate Equity Fund | 34,294,713 | 463,365 | 36,252,452 | 286,222 | (1,538,115) | 3,032,489 | -- |
| Fidelity Series Real Estate Income Fund | 18,928,290 | 3,346,298 | 886,958 | 878,372 | (14,904) | 118,645 | 21,491,371 |
| Fidelity Series Short-Term Credit Fund | 13,333,440 | 3,001,184 | 632,860 | 162,173 | (7,214) | 7,145 | 15,701,695 |
| Fidelity Series Small Cap Discovery Fund | 50,681,737 | 9,590,504 | 2,456,218 | 3,177,393 | (108,252) | (728,035) | 56,979,736 |
| Fidelity Series Small Cap Opportunities Fund | 156,598,303 | 33,707,367 | 8,734,827 | 14,178,837 | 48,666 | 4,227,241 | 185,846,750 |
| Fidelity Series Stock Selector Large Cap | 295,167,577 | 36,472,682 | 16,018,928 | -- | (352,721) | 21,653,278 | 336,921,888 |
| Fidelity Series Value Discovery Fund | 209,366,384 | 26,003,717 | 9,998,819 | -- | (168,652) | 12,958,695 | 238,161,325 |
| | $4,395,835,794 | $927,305,283 | $520,517,540 | $97,410,074 | $21,798,681 | $106,493,230 | $4,930,915,448 |
Amounts in the income column in the above table include any capital gain distributions from underlying funds, which are presented in the corresponding line-item in the Statement of Operations if applicable.
Investment Valuation
The following is a summary of the inputs used, as of September 30, 2018, involving the Fund's assets and liabilities carried at fair value. The inputs or methodology used for valuing securities may not be an indication of the risk associated with investing in those securities. For more information on valuation inputs, and their aggregation into the levels used below, please refer to the Investment Valuation section in the accompanying Notes to Financial Statements.
| | Valuation Inputs at Reporting Date: |
| Description | Total | Level 1 | Level 2 | Level 3 |
| Investments in Securities: | | | | |
| Other Short-Term Investments | $3,706,269 | $-- | $3,706,269 | $-- |
| Domestic Equity Funds | 2,988,359,174 | 2,988,359,174 | -- | -- |
| International Equity Funds | 1,517,435,394 | 1,517,435,394 | -- | -- |
| Bond Funds | 335,441,593 | 335,441,593 | -- | -- |
| Short-Term Funds | 96,631,418 | 96,631,418 | -- | -- |
| Total Investments in Securities: | $4,941,573,848 | $4,937,867,579 | $3,706,269 | $-- |
| Derivative Instruments: | | | | |
| Assets | | | | |
| Futures Contracts | $309,275 | $309,275 | $-- | $-- |
| Total Assets | $309,275 | $309,275 | $-- | $-- |
| Liabilities | | | | |
| Futures Contracts | $(24,737) | $(24,737) | $-- | $-- |
| Total Liabilities | $(24,737) | $(24,737) | $-- | $-- |
| Total Derivative Instruments: | $284,538 | $284,538 | $-- | $-- |
Value of Derivative Instruments
The following table is a summary of the Fund's value of derivative instruments by primary risk exposure as of September 30, 2018. For additional information on derivative instruments, please refer to the Derivative Instruments section in the accompanying Notes to Financial Statements.
| Primary Risk Exposure / Derivative Type | Value |
| | Asset | Liability |
| Equity Risk | | |
| Futures Contracts(a) | $309,275 | $(24,737) |
| Total Equity Risk | 309,275 | (24,737) |
| Total Value of Derivatives | $309,275 | $(24,737) |
(a) Reflects gross cumulative appreciation (depreciation) on futures contracts as presented in the Schedule of Investments. In the Statement of Assets and Liabilities, the period end daily variation margin is included in receivable or payable for daily variation margin on futures contracts, and the net cumulative appreciation (depreciation) is included in net unrealized appreciation (depreciation).
See accompanying notes which are an integral part of the financial statements.
Fidelity Freedom® 2055 Fund
Financial Statements
Statement of Assets and Liabilities
| | | September 30, 2018 (Unaudited) |
| Assets | | |
Investment in securities, at value — See accompanying schedule:
Unaffiliated issuers (cost $3,706,510) | $3,706,269 | |
| Fidelity Central Funds (cost $6,952,131) | 6,952,131 | |
| Other affiliated issuers (cost $4,301,096,082) | 4,930,915,448 | |
| Total Investment in Securities (cost $4,311,754,723) | | $4,941,573,848 |
| Receivable for investments sold | | 54,262,972 |
| Receivable for fund shares sold | | 174,703,171 |
| Distributions receivable from Fidelity Central Funds | | 10,704 |
| Total assets | | 5,170,550,695 |
| Liabilities | | |
| Payable for investments purchased | $63,768,967 | |
| Payable for fund shares redeemed | 165,180,564 | |
| Accrued management fee | 2,691,672 | |
| Payable for daily variation margin on futures contracts | 144,821 | |
| Total liabilities | | 231,786,024 |
| Net Assets | | $4,938,764,671 |
| Net Assets consist of: | | |
| Paid in capital | | $4,220,697,866 |
| Undistributed net investment income | | 8,115,432 |
| Accumulated undistributed net realized gain (loss) on investments | | 79,847,710 |
| Net unrealized appreciation (depreciation) on investments | | 630,103,663 |
| Net Assets | | $4,938,764,671 |
| Fidelity Freedom 2055 Fund: | | |
| Net Asset Value, offering price and redemption price per share ($1,428,045,930 ÷ 102,125,383 shares) | | $13.98 |
| Class K: | | |
| Net Asset Value, offering price and redemption price per share ($3,114,215,499 ÷ 222,803,681 shares) | | $13.98 |
| Class K6: | | |
| Net Asset Value, offering price and redemption price per share ($396,503,242 ÷ 28,326,689 shares) | | $14.00 |
See accompanying notes which are an integral part of the financial statements.
Statement of Operations
| | | Six months ended September 30, 2018 (Unaudited) |
| Investment Income | | |
| Dividends: | | |
| Affiliated issuers | | $25,605,821 |
| Interest | | 18,667 |
| Income from Fidelity Central Funds | | 20,640 |
| Total income | | 25,645,128 |
| Expenses | | |
| Management fee | $15,687,234 | |
| Independent trustees' fees and expenses | 11,101 | |
| Total expenses before reductions | 15,698,335 | |
| Expense reductions | (6) | |
| Total expenses after reductions | | 15,698,329 |
| Net investment income (loss) | | 9,946,799 |
| Realized and Unrealized Gain (Loss) | | |
| Net realized gain (loss) on: | | |
| Investment securities: | | |
| Fidelity Central Funds | 12 | |
| Other affiliated issuers | 21,798,681 | |
| Futures contracts | (2,541,532) | |
| Capital gain distributions from underlying funds: | | |
| Affiliated issuers | 71,804,253 | |
| Total net realized gain (loss) | | 91,061,414 |
| Change in net unrealized appreciation (depreciation) on: | | |
| Investment securities: | | |
| Unaffiliated issuers | (241) | |
| Affiliated issuers | 106,493,230 | |
| Futures contracts | 284,538 | |
| Total change in net unrealized appreciation (depreciation) | | 106,777,527 |
| Net gain (loss) | | 197,838,941 |
| Net increase (decrease) in net assets resulting from operations | | $207,785,740 |
See accompanying notes which are an integral part of the financial statements.
Statement of Changes in Net Assets
| | Six months ended September 30, 2018 (Unaudited) | Year ended March 31, 2018 |
| Increase (Decrease) in Net Assets | | |
| Operations | | |
| Net investment income (loss) | $9,946,799 | $44,165,758 |
| Net realized gain (loss) | 91,061,414 | 169,529,579 |
| Change in net unrealized appreciation (depreciation) | 106,777,527 | 107,945,915 |
| Net increase (decrease) in net assets resulting from operations | 207,785,740 | 321,641,252 |
| Distributions to shareholders from net investment income | – | (48,627,128) |
| Distributions to shareholders from net realized gain | (108,392,501) | (70,153,488) |
| Total distributions | (108,392,501) | (118,780,616) |
| Share transactions - net increase (decrease) | 445,979,420 | 3,268,247,071 |
| Total increase (decrease) in net assets | 545,372,659 | 3,471,107,707 |
| Net Assets | | |
| Beginning of period | 4,393,392,012 | 922,284,305 |
| End of period | $4,938,764,671 | $4,393,392,012 |
| Other Information | | |
| Undistributed net investment income end of period | $8,115,432 | $– |
| Distributions in excess of net investment income end of period | $– | $(1,831,367) |
See accompanying notes which are an integral part of the financial statements.
Financial Highlights
Fidelity Freedom 2055 Fund
| | Six months ended (Unaudited) September 30, | Years endedMarch 31, | | | | |
| | 2018 | 2018 | 2017 | 2016 | 2015 | 2014 |
| Selected Per–Share Data | | | | | | |
| Net asset value, beginning of period | $13.70 | $12.41 | $11.08 | $12.06 | $11.73 | $10.56 |
| Income from Investment Operations | | | | | | |
| Net investment income (loss)A | .02 | .14 | .17 | .17 | .19 | .16 |
| Net realized and unrealized gain (loss) | .59 | 1.64 | 1.57 | (.59) | .72 | 1.51 |
| Total from investment operations | .61 | 1.78 | 1.74 | (.42) | .91 | 1.67 |
| Distributions from net investment income | – | (.15) | (.16) | (.17) | (.18) | (.14) |
| Distributions from net realized gain | (.33) | (.34) | (.25) | (.39) | (.39) | (.36) |
| Total distributions | (.33) | (.49) | (.41) | (.56) | (.58)B | (.50) |
| Net asset value, end of period | $13.98 | $13.70 | $12.41 | $11.08 | $12.06 | $11.73 |
| Total ReturnC,D | 4.48% | 14.49% | 16.17% | (3.69)% | 7.98% | 16.00% |
| Ratios to Average Net AssetsE,F | | | | | | |
| Expenses before reductions | .75%G | .64%H | - %I | - %I | - %I | - %I |
| Expenses net of fee waivers, if any | .75%G | .64%H | -% | -% | -% | -% |
| Expenses net of all reductions | .75%G | .64%H | -% | -% | -% | -% |
| Net investment income (loss) | .35%G | 1.06% | 1.46% | 1.51% | 1.64% | 1.40% |
| Supplemental Data | | | | | | |
| Net assets, end of period (000 omitted) | $1,428,046 | $1,265,311 | $922,284 | $649,621 | $527,231 | $350,647 |
| Portfolio turnover rateE | 22%G | 15%J | 18% | 20% | 21% | 47% |
A Calculated based on average shares outstanding during the period.
B Total distributions of $.58 per share is comprised of distributions from net investment income of $.184 and distributions from net realized gain of $.394 per share.
C Total returns for periods of less than one year are not annualized.
D Total returns would have been lower if certain expenses had not been reduced during the applicable periods shown.
E Amounts do not include the activity of the Underlying Funds.
F Expense ratios reflect operating expenses of the class. Expenses before reductions do not reflect amounts reimbursed by the investment adviser or reductions from expense offset arrangements and do not represent the amount paid by the class during periods when reimbursements or reductions occur. Expenses net of fee waivers reflect expenses after reimbursement by the investment adviser but prior to reductions from expense offset arrangements. Expenses net of all reductions represent the net expenses paid by the class but do not include expenses of the underlying funds in which the Fund invests.
G Annualized
H On certain classes, the size and fluctuation of net assets and expense amounts may cause ratios to differ from contractual rates.
I Amount represents less than .005%.
J The portfolio turnover rate does not include the assets acquired in the merger.
See accompanying notes which are an integral part of the financial statements.
Fidelity Freedom 2055 Fund Class K
| | Six months ended (Unaudited) September 30, | Years endedMarch 31, |
| | 2018 | 2018 A |
| Selected Per–Share Data | | |
| Net asset value, beginning of period | $13.69 | $13.11 |
| Income from Investment Operations | | |
| Net investment income (loss)B | .03 | .19 |
| Net realized and unrealized gain (loss) | .59 | .76 |
| Total from investment operations | .62 | .95 |
| Distributions from net investment income | – | (.17) |
| Distributions from net realized gain | (.33) | (.20) |
| Total distributions | (.33) | (.37) |
| Net asset value, end of period | $13.98 | $13.69 |
| Total ReturnC,D | 4.56% | 7.26% |
| Ratios to Average Net AssetsE,F | | |
| Expenses before reductions | .64%G | .65%G,H |
| Expenses net of fee waivers, if any | .64%G | .65%G,H |
| Expenses net of all reductions | .64%G | .65%G,H |
| Net investment income (loss) | .45%G | 2.01%G |
| Supplemental Data | | |
| Net assets, end of period (000 omitted) | $3,114,215 | $2,992,599 |
| Portfolio turnover rateE | 22%G | 15%I |
A For the period July 20, 2017 (commencement of sale of shares) to March 31, 2018.
B Calculated based on average shares outstanding during the period.
C Total returns for periods of less than one year are not annualized.
D Total returns would have been lower if certain expenses had not been reduced during the applicable periods shown.
E Amounts do not include the activity of the Underlying Funds.
F Expense ratios reflect operating expenses of the class. Expenses before reductions do not reflect amounts reimbursed by the investment adviser or reductions from expense offset arrangements and do not represent the amount paid by the class during periods when reimbursements or reductions occur. Expense ratios before reductions for start-up periods may not be representative of longer-term operating periods. Expenses net of fee waivers reflect expenses after reimbursement by the investment adviser but prior to reductions from expense offset arrangements. Expenses net of all reductions represent the net expenses paid by the class but do not include expenses of the underlying funds in which the Fund invests.
G Annualized
H On certain classes, the size and fluctuation of net assets and expense amounts may cause ratios to differ from contractual rates.
I The portfolio turnover rate does not include the assets acquired in the merger.
See accompanying notes which are an integral part of the financial statements.
Fidelity Freedom 2055 Fund Class K6
| | Six months ended (Unaudited) September 30, | Years endedMarch 31, |
| | 2018 | 2018 A |
| Selected Per–Share Data | | |
| Net asset value, beginning of period | $13.70 | $12.83 |
| Income from Investment Operations | | |
| Net investment income (loss)B | .04 | .16 |
| Net realized and unrealized gain (loss) | .59 | 1.09 |
| Total from investment operations | .63 | 1.25 |
| Distributions from net investment income | – | (.17) |
| Distributions from net realized gain | (.33) | (.20) |
| Total distributions | (.33) | (.38)C |
| Net asset value, end of period | $14.00 | $13.70 |
| Total ReturnD,E | 4.63% | 9.70% |
| Ratios to Average Net AssetsF,G | | |
| Expenses before reductions | .49%H | .50%H,I |
| Expenses net of fee waivers, if any | .49%H | .50%H,I |
| Expenses net of all reductions | .49%H | .50%H,I |
| Net investment income (loss) | .60%H | 1.43%H |
| Supplemental Data | | |
| Net assets, end of period (000 omitted) | $396,503 | $135,481 |
| Portfolio turnover rateF | 22%H | 15%J |
A For the period June 7, 2017 (commencement of sale of shares) to March 31, 2018.
B Calculated based on average shares outstanding during the period.
C Total distributions of $.38 per share is comprised of distributions from net investment income of $.174 and distributions from net realized gain of $.202 per share.
D Total returns for periods of less than one year are not annualized.
E Total returns would have been lower if certain expenses had not been reduced during the applicable periods shown.
F Amounts do not include the activity of the Underlying Funds.
G Expense ratios reflect operating expenses of the class. Expenses before reductions do not reflect amounts reimbursed by the investment adviser or reductions from expense offset arrangements and do not represent the amount paid by the class during periods when reimbursements or reductions occur. Expense ratios before reductions for start-up periods may not be representative of longer-term operating periods. Expenses net of fee waivers reflect expenses after reimbursement by the investment adviser but prior to reductions from expense offset arrangements. Expenses net of all reductions represent the net expenses paid by the class but do not include expenses of the underlying funds in which the Fund invests.
H Annualized
I On certain classes, the size and fluctuation of net assets and expense amounts may cause ratios to differ from contractual rates.
J The portfolio turnover rate does not include the assets acquired in the merger.
See accompanying notes which are an integral part of the financial statements.
Fidelity Freedom® 2060 Fund
Investment Summary (Unaudited)
The information in the following tables is based on the direct investments of the Fund.
Top Holdings as of September 30, 2018
| | % of fund's net assets |
| Fidelity Series Intrinsic Opportunities Fund | 10.0 |
| Fidelity Series International Growth Fund | 9.3 |
| Fidelity Series International Value Fund | 9.2 |
| Fidelity Series Large Cap Stock Fund | 9.2 |
| Fidelity Series Growth Company Fund | 8.7 |
| Fidelity Series Emerging Markets Opportunities Fund | 8.6 |
| Fidelity Series Stock Selector Large Cap Value Fund | 6.9 |
| Fidelity Series Value Discovery Fund | 4.8 |
| Fidelity Series Opportunistic Insights Fund | 4.6 |
| Fidelity Series Blue Chip Growth Fund | 4.3 |
| | 75.6 |
Asset Allocation (% of fund's net assets)
| Period end |
| | Domestic Equity Funds | 60.5% |
| | International Equity Funds | 30.7% |
| | Bond Funds | 6.8% |
| | Short-Term Funds | 2.0% |
| | Short-Term Investments | 0.1% |
| | Net Other Assets (Liabilities)* | (0.1)% |

* Net Other Assets (Liabilities) are not included in the pie chart
Domestic Equity Funds category includes Fidelity Series Commodity Strategy Fund which invests in commodity-related investments.
Fidelity Freedom® 2060 Fund
Schedule of Investments September 30, 2018 (Unaudited)
Showing Percentage of Net Assets
| U.S. Treasury Obligations - 0.1% | | | |
| | | Principal Amount | Value |
| U.S. Treasury Bills, yield at date of purchase 2.07% to 2.11% 11/29/18 to 12/6/18 (a) | | | |
| (Cost $797,085) | | 800,000 | 797,034 |
| | | Shares | Value |
|
| Domestic Equity Funds - 60.5% | | | |
| Fidelity Series All-Sector Equity Fund (b) | | 1,838,644 | $25,023,944 |
| Fidelity Series Blue Chip Growth Fund (b) | | 2,975,684 | 45,527,971 |
| Fidelity Series Commodity Strategy Fund (b) | | 4,443,106 | 22,215,528 |
| Fidelity Series Growth Company Fund (b) | | 4,550,993 | 91,975,570 |
| Fidelity Series Intrinsic Opportunities Fund (b) | | 5,755,511 | 105,498,519 |
| Fidelity Series Large Cap Stock Fund (b) | | 6,104,939 | 97,251,673 |
| Fidelity Series Large Cap Value Index Fund (b) | | 2,020,457 | 26,670,027 |
| Fidelity Series Opportunistic Insights Fund (b) | | 2,477,154 | 49,171,512 |
| Fidelity Series Small Cap Discovery Fund (b) | | 1,011,206 | 12,286,156 |
| Fidelity Series Small Cap Opportunities Fund (b) | | 2,710,144 | 39,812,021 |
| Fidelity Series Stock Selector Large Cap Value Fund (b) | | 5,477,758 | 72,415,966 |
| Fidelity Series Value Discovery Fund (b) | | 3,730,125 | 51,065,405 |
| TOTAL DOMESTIC EQUITY FUNDS | | | |
| (Cost $576,230,099) | | | 638,914,292 |
|
| International Equity Funds - 30.7% | | | |
| Fidelity Series Canada Fund (b) | | 877,904 | 9,490,147 |
| Fidelity Series Emerging Markets Fund (b) | | 606,572 | 5,877,687 |
| Fidelity Series Emerging Markets Opportunities Fund (b) | | 4,731,379 | 90,795,162 |
| Fidelity Series International Growth Fund (b) | | 5,970,220 | 97,911,608 |
| Fidelity Series International Small Cap Fund (b) | | 1,293,735 | 23,157,854 |
| Fidelity Series International Value Fund (b) | | 9,248,206 | 97,291,122 |
| TOTAL INTERNATIONAL EQUITY FUNDS | | | |
| (Cost $305,822,397) | | | 324,523,580 |
|
| Bond Funds - 6.8% | | | |
| Fidelity Series Emerging Markets Debt Fund (b) | | 630,546 | 6,009,107 |
| Fidelity Series Floating Rate High Income Fund (b) | | 256,242 | 2,439,422 |
| Fidelity Series High Income Fund (b) | | 1,440,033 | 13,838,718 |
| Fidelity Series Inflation-Protected Bond Index Fund (b) | | 327,898 | 3,183,891 |
| Fidelity Series International Credit Fund (b) | | 24,341 | 239,271 |
| Fidelity Series Investment Grade Bond Fund (b) | | 430,423 | 4,687,309 |
| Fidelity Series Long-Term Treasury Bond Index Fund (b) | | 4,442,787 | 36,608,565 |
| Fidelity Series Real Estate Income Fund (b) | | 435,539 | 4,695,111 |
| TOTAL BOND FUNDS | | | |
| (Cost $73,129,110) | | | 71,701,394 |
|
| Short-Term Funds - 2.0% | | | |
| Fidelity Cash Central Fund, 2.11% (c) | | 1,236,628 | 1,236,876 |
| Fidelity Series Government Money Market Fund 2.12% (b)(d) | | 15,937,406 | 15,937,406 |
| Fidelity Series Short-Term Credit Fund (b) | | 344,943 | 3,401,134 |
| TOTAL SHORT-TERM FUNDS | | | |
| (Cost $20,599,005) | | | 20,575,416 |
| TOTAL INVESTMENT IN SECURITIES - 100.1% | | | |
| (Cost $976,577,696) | | | 1,056,511,716 |
| NET OTHER ASSETS (LIABILITIES) - (0.1)% | | | (551,752) |
| NET ASSETS - 100% | | | $1,055,959,964 |
| Futures Contracts | | | | | |
| | Number of contracts | Expiration Date | Notional Amount | Value | Unrealized Appreciation/(Depreciation) |
| Purchased | | | | | |
| Equity Index Contracts | | | | | |
| CME E-mini S&P 500 Index Contracts (United States) | 40 | Dec. 2018 | $5,838,000 | $1,132 | $1,132 |
| ICE E-mini MSCI Emerging Markets Index Contracts (United States) | 63 | Dec. 2018 | 3,306,555 | 65,214 | 65,214 |
|
| TOTAL PURCHASED | | | | | 66,346 |
|
| Sold | | | | | |
| Equity Index Contracts | | | | | |
| ICE E-mini MSCI EAFE Index Contracts (United States) | 28 | Dec. 2018 | 2,765,700 | (4,509) | (4,509) |
| TOTAL FUTURES CONTRACTS | | | | | $61,837 |
The notional amount of futures purchased as a percentage of Net Assets is 0.9%
The notional amount of futures sold as a percentage of Net Assets is 0.3%
Legend
(a) Security or a portion of the security was pledged to cover margin requirements for futures contracts. At period end, the value of securities pledged amounted to $239,064.
(b) Affiliated Fund
(c) Affiliated fund that is generally available only to investment companies and other accounts managed by Fidelity Investments. The rate quoted is the annualized seven-day yield of the fund at period end. A complete unaudited listing of the fund's holdings as of its most recent quarter end is available upon request. In addition, each Fidelity Central Fund's financial statements are available on the SEC's website or upon request.
(d) The rate quoted is the annualized seven-day yield of the fund at period end.
Affiliated Central Funds
Information regarding fiscal year to date income earned by the Fund from investments in Fidelity Central Funds is as follows:
| Fund | Income earned |
| Fidelity Cash Central Fund | $3,858 |
| Total | $3,858 |
Amounts in the income column in the above table include any capital gain distributions from underlying funds, which are presented in the corresponding line-item in the Statement of Operations if applicable.
Affiliated Underlying Funds
Fiscal year to date information regarding the Fund's investments in affiliated Underlying Funds, excluding any Money Market Central Funds, is presented below. Exchanges between classes of the same affiliated Underlying Funds may occur.
| Affiliate | Value, beginning of period | Purchases | Sales Proceeds | Dividend Income | Realized Gain (loss) | Change in Unrealized appreciation (depreciation) | Value, end of period |
| Fidelity Series 100 Index Fund | $15,904,680 | $26,022 | $17,014,627 | $-- | $2,869,723 | $(1,785,798) | $-- |
| Fidelity Series All-Sector Equity Fund | 31,253,568 | 8,281,207 | 18,450,077 | -- | 331,215 | 3,608,031 | 25,023,944 |
| Fidelity Series Blue Chip Growth Fund | 32,253,565 | 13,299,443 | 2,291,558 | 4,121,215 | (27,941) | 2,294,462 | 45,527,971 |
| Fidelity Series Canada Fund | 7,202,539 | 2,080,748 | 271,469 | -- | (3,918) | 482,247 | 9,490,147 |
| Fidelity Series Commodity Strategy Fund | 17,145,686 | 7,426,851 | 641,267 | 1,298,303 | (15,376) | (1,700,366) | 22,215,528 |
| Fidelity Series Emerging Markets Debt Fund | 4,840,852 | 1,635,292 | 183,184 | 163,432 | (13,354) | (270,499) | 6,009,107 |
| Fidelity Series Emerging Markets Fund | -- | 5,783,206 | -- | -- | -- | 94,481 | 5,877,687 |
| Fidelity Series Emerging Markets Opportunities Fund | 74,428,681 | 29,507,460 | 2,800,586 | -- | (171,091) | (10,169,302) | 90,795,162 |
| Fidelity Series Floating Rate High Income Fund | 1,890,315 | 620,513 | 74,436 | 57,613 | (915) | 3,945 | 2,439,422 |
| Fidelity Series Government Money Market Fund 2.12% | 13,009,017 | 18,108,826 | 15,180,437 | 118,221 | -- | -- | 15,937,406 |
| Fidelity Series Growth Company Fund | 65,444,549 | 18,545,105 | 2,958,205 | -- | (69,744) | 11,013,865 | 91,975,570 |
| Fidelity Series High Income Fund | 11,127,742 | 3,246,886 | 640,430 | 360,558 | (6,771) | 111,291 | 13,838,718 |
| Fidelity Series Inflation-Protected Bond Index Fund | 6,768,528 | 2,198,589 | 5,813,413 | 10,958 | (73,455) | 103,642 | 3,183,891 |
| Fidelity Series International Credit Fund | 244,476 | 3,750 | 6,496 | 3,013 | (83) | (2,376) | 239,271 |
| Fidelity Series International Growth Fund | 72,306,514 | 26,958,054 | 2,671,371 | -- | (269) | 1,318,680 | 97,911,608 |
| Fidelity Series International Small Cap Fund | 18,039,162 | 6,212,841 | 324,152 | -- | (6,710) | (763,287) | 23,157,854 |
| Fidelity Series International Value Fund | 73,255,562 | 24,797,563 | 743,071 | -- | (38,882) | 19,950 | 97,291,122 |
| Fidelity Series Intrinsic Opportunities Fund | 79,157,527 | 27,884,606 | 2,480,933 | 4,550,343 | (51,985) | 989,304 | 105,498,519 |
| Fidelity Series Investment Grade Bond Fund | 3,875,761 | 1,226,939 | 366,110 | 59,786 | (5,123) | (44,158) | 4,687,309 |
| Fidelity Series Large Cap Stock Fund | 70,836,746 | 25,776,696 | 2,991,297 | 5,233,170 | (40,706) | 3,670,234 | 97,251,673 |
| Fidelity Series Large Cap Value Index Fund | 20,224,908 | 5,727,431 | 880,618 | -- | (14,018) | 1,612,324 | 26,670,027 |
| Fidelity Series Long-Term Treasury Bond Index Fund | 18,521,138 | 24,874,281 | 5,632,143 | 417,397 | (191,191) | (963,520) | 36,608,565 |
| Fidelity Series Opportunistic Insights Fund | 35,335,440 | 10,245,532 | 1,506,699 | -- | (25,768) | 5,123,007 | 49,171,512 |
| Fidelity Series Real Estate Equity Fund | 6,272,892 | 370,736 | 6,935,358 | 55,732 | (243,095) | 534,825 | -- |
| Fidelity Series Real Estate Income Fund | 3,580,706 | 1,242,001 | 142,212 | 183,543 | (3,786) | 18,402 | 4,695,111 |
| Fidelity Series Short-Term Credit Fund | 2,622,315 | 910,408 | 131,568 | 34,374 | (1,629) | 1,608 | 3,401,134 |
| Fidelity Series Small Cap Discovery Fund | 9,487,528 | 3,377,568 | 393,631 | 626,810 | (21,529) | (163,780) | 12,286,156 |
| Fidelity Series Small Cap Opportunities Fund | 29,169,642 | 11,379,312 | 1,357,623 | 3,000,140 | (8,998) | 629,688 | 39,812,021 |
| Fidelity Series Stock Selector Large Cap Value Fund | 55,114,043 | 15,634,527 | 2,594,313 | -- | (85,780) | 4,347,489 | 72,415,966 |
| Fidelity Series Value Discovery Fund | 39,075,165 | 11,108,650 | 1,659,297 | -- | (39,722) | 2,580,609 | 51,065,405 |
| | $818,389,247 | $308,491,043 | $97,136,581 | $20,294,608 | $2,039,099 | $22,694,998 | $1,054,477,806 |
Amounts in the income column in the above table include any capital gain distributions from underlying funds, which are presented in the corresponding line-item in the Statement of Operations if applicable.
Investment Valuation
The following is a summary of the inputs used, as of September 30, 2018, involving the Fund's assets and liabilities carried at fair value. The inputs or methodology used for valuing securities may not be an indication of the risk associated with investing in those securities. For more information on valuation inputs, and their aggregation into the levels used below, please refer to the Investment Valuation section in the accompanying Notes to Financial Statements.
| | Valuation Inputs at Reporting Date: |
| Description | Total | Level 1 | Level 2 | Level 3 |
| Investments in Securities: | | | | |
| Other Short-Term Investments | $797,034 | $-- | $797,034 | $-- |
| Domestic Equity Funds | 638,914,292 | 638,914,292 | -- | -- |
| International Equity Funds | 324,523,580 | 324,523,580 | -- | -- |
| Bond Funds | 71,701,394 | 71,701,394 | -- | -- |
| Short-Term Funds | 20,575,416 | 20,575,416 | -- | -- |
| Total Investments in Securities: | $1,056,511,716 | $1,055,714,682 | $797,034 | $-- |
| Derivative Instruments: | | | | |
| Assets | | | | |
| Futures Contracts | $66,346 | $66,346 | $-- | $-- |
| Total Assets | $66,346 | $66,346 | $-- | $-- |
| Liabilities | | | | |
| Futures Contracts | $(4,509) | $(4,509) | $-- | $-- |
| Total Liabilities | $(4,509) | $(4,509) | $-- | $-- |
| Total Derivative Instruments: | $61,837 | $61,837 | $-- | $-- |
Value of Derivative Instruments
The following table is a summary of the Fund's value of derivative instruments by primary risk exposure as of September 30, 2018. For additional information on derivative instruments, please refer to the Derivative Instruments section in the accompanying Notes to Financial Statements.
| Primary Risk Exposure / Derivative Type | Value |
| | Asset | Liability |
| Equity Risk | | |
| Futures Contracts(a) | $66,346 | $(4,509) |
| Total Equity Risk | 66,346 | (4,509) |
| Total Value of Derivatives | $66,346 | $(4,509) |
(a) Reflects gross cumulative appreciation (depreciation) on futures contracts as presented in the Schedule of Investments. In the Statement of Assets and Liabilities, the period end daily variation margin is included in receivable or payable for daily variation margin on futures contracts, and the net cumulative appreciation (depreciation) is included in net unrealized appreciation (depreciation).
See accompanying notes which are an integral part of the financial statements.
Fidelity Freedom® 2060 Fund
Financial Statements
Statement of Assets and Liabilities
| | | September 30, 2018 (Unaudited) |
| Assets | | |
Investment in securities, at value — See accompanying schedule:
Unaffiliated issuers (cost $797,085) | $797,034 | |
| Fidelity Central Funds (cost $1,236,876) | 1,236,876 | |
| Other affiliated issuers (cost $974,543,735) | 1,054,477,806 | |
| Total Investment in Securities (cost $976,577,696) | | $1,056,511,716 |
| Cash | | 49,000 |
| Receivable for investments sold | | 11,995,418 |
| Receivable for fund shares sold | | 38,486,998 |
| Distributions receivable from Fidelity Central Funds | | 1,950 |
| Total assets | | 1,107,045,082 |
| Liabilities | | |
| Payable for investments purchased | $16,921,506 | |
| Payable for fund shares redeemed | 33,560,005 | |
| Accrued management fee | 569,739 | |
| Payable for daily variation margin on futures contracts | 33,868 | |
| Total liabilities | | 51,085,118 |
| Net Assets | | $1,055,959,964 |
| Net Assets consist of: | | |
| Paid in capital | | $959,240,324 |
| Undistributed net investment income | | 1,465,439 |
| Accumulated undistributed net realized gain (loss) on investments | | 15,258,344 |
| Net unrealized appreciation (depreciation) on investments | | 79,995,857 |
| Net Assets | | $1,055,959,964 |
| Fidelity Freedom 2060 Fund: | | |
| Net Asset Value, offering price and redemption price per share ($308,416,621 ÷ 24,683,601 shares) | | $12.49 |
| Class K: | | |
| Net Asset Value, offering price and redemption price per share ($665,459,435 ÷ 53,288,428 shares) | | $12.49 |
| Class K6: | | |
| Net Asset Value, offering price and redemption price per share ($82,083,908 ÷ 6,561,514 shares) | | $12.51 |
See accompanying notes which are an integral part of the financial statements.
Statement of Operations
| | | Six months ended September 30, 2018 (Unaudited) |
| Investment Income | | |
| Dividends: | | |
| Affiliated issuers | | $5,251,724 |
| Interest | | 3,695 |
| Income from Fidelity Central Funds | | 3,858 |
| Total income | | 5,259,277 |
| Expenses | | |
| Management fee | $3,136,166 | |
| Independent trustees' fees and expenses | 2,137 | |
| Total expenses | | 3,138,303 |
| Net investment income (loss) | | 2,120,974 |
| Realized and Unrealized Gain (Loss) | | |
| Net realized gain (loss) on: | | |
| Investment securities: | | |
| Fidelity Central Funds | 3 | |
| Other affiliated issuers | 2,039,099 | |
| Futures contracts | (525,815) | |
| Capital gain distributions from underlying funds: | | |
| Affiliated issuers | 15,042,884 | |
| Total net realized gain (loss) | | 16,556,171 |
| Change in net unrealized appreciation (depreciation) on: | | |
| Investment securities: | | |
| Unaffiliated issuers | (51) | |
| Affiliated issuers | 22,694,998 | |
| Futures contracts | 61,837 | |
| Total change in net unrealized appreciation (depreciation) | | 22,756,784 |
| Net gain (loss) | | 39,312,955 |
| Net increase (decrease) in net assets resulting from operations | | $41,433,929 |
See accompanying notes which are an integral part of the financial statements.
Statement of Changes in Net Assets
| | Six months ended September 30, 2018 (Unaudited) | Year ended March 31, 2018 |
| Increase (Decrease) in Net Assets | | |
| Operations | | |
| Net investment income (loss) | $2,120,974 | $6,919,637 |
| Net realized gain (loss) | 16,556,171 | 26,038,634 |
| Change in net unrealized appreciation (depreciation) | 22,756,784 | 12,512,816 |
| Net increase (decrease) in net assets resulting from operations | 41,433,929 | 45,471,087 |
| Distributions to shareholders from net investment income | – | (7,703,403) |
| Distributions to shareholders from net realized gain | (18,081,222) | (9,428,917) |
| Total distributions | (18,081,222) | (17,132,320) |
| Share transactions - net increase (decrease) | 214,665,548 | 673,447,954 |
| Total increase (decrease) in net assets | 238,018,255 | 701,786,721 |
| Net Assets | | |
| Beginning of period | 817,941,709 | 116,154,988 |
| End of period | $1,055,959,964 | $817,941,709 |
| Other Information | | |
| Undistributed net investment income end of period | $1,465,439 | $– |
| Distributions in excess of net investment income end of period | $– | $(655,535) |
See accompanying notes which are an integral part of the financial statements.
Financial Highlights
Fidelity Freedom 2060 Fund
| | Six months ended (Unaudited) September 30, | Years endedMarch 31, | | | |
| | 2018 | 2018 | 2017 | 2016 | 2015 A |
| Selected Per–Share Data | | | | | |
| Net asset value, beginning of period | $12.20 | $11.01 | $9.78 | $10.45 | $10.00 |
| Income from Investment Operations | | | | | |
| Net investment income (loss)B | .02 | .13 | .16 | .16 | .10 |
| Net realized and unrealized gain (loss) | .52 | 1.46 | 1.37 | (.53) | .52 |
| Total from investment operations | .54 | 1.59 | 1.53 | (.37) | .62 |
| Distributions from net investment income | – | (.13) | (.13) | (.12) | (.10) |
| Distributions from net realized gain | (.25) | (.26) | (.17) | (.17) | (.07) |
| Total distributions | (.25) | (.40)C | (.30) | (.30)D | (.17) |
| Net asset value, end of period | $12.49 | $12.20 | $11.01 | $9.78 | $10.45 |
| Total ReturnE,F | 4.49% | 14.50% | 16.01% | (3.67)% | 6.22% |
| Ratios to Average Net AssetsG,H | | | | | |
| Expenses before reductions | .75%I | .66%J | - %K | - %K | - %I,K |
| Expenses net of fee waivers, if any | .75%I | .66%J | -% | -% | - %I |
| Expenses net of all reductions | .75%I | .66%J | -% | -% | - %I |
| Net investment income (loss) | .38%I | 1.09% | 1.54% | 1.67% | 1.54%I |
| Supplemental Data | | | | | |
| Net assets, end of period (000 omitted) | $308,417 | $241,896 | $116,155 | $47,019 | $8,968 |
| Portfolio turnover rateG | 21%I | 11%L | 21% | 31% | 28%I |
A For the period August 5, 2014 (commencement of operations) to March 31, 2015.
B Calculated based on average shares outstanding during the period.
C Total distributions of $.40 per share is comprised of distributions from net investment income of $.132 and distributions from net realized gain of $.263 per share.
D Total distributions of $.30 per share is comprised of distributions from net investment income of $.121 and distributions from net realized gain of $.174 per share.
E Total returns for periods of less than one year are not annualized.
F Total returns would have been lower if certain expenses had not been reduced during the applicable periods shown.
G Amounts do not include the activity of the Underlying Funds.
H Expense ratios reflect operating expenses of the class. Expenses before reductions do not reflect amounts reimbursed by the investment adviser or reductions from expense offset arrangements and do not represent the amount paid by the class during periods when reimbursements or reductions occur. Expenses net of fee waivers reflect expenses after reimbursement by the investment adviser but prior to reductions from expense offset arrangements. Expenses net of all reductions represent the net expenses paid by the class but do not include expenses of the underlying funds in which the Fund invests.
I Annualized
J On certain classes, the size and fluctuation of net assets and expense amounts may cause ratios to differ from contractual rates.
K Amount represents less than .005%.
L The portfolio turnover rate does not include the assets acquired in the merger.
See accompanying notes which are an integral part of the financial statements.
Fidelity Freedom 2060 Fund Class K
| | Six months ended (Unaudited) September 30, | Years endedMarch 31, |
| | 2018 | 2018 A |
| Selected Per–Share Data | | |
| Net asset value, beginning of period | $12.19 | $11.65 |
| Income from Investment Operations | | |
| Net investment income (loss)B | .03 | .16 |
| Net realized and unrealized gain (loss) | .52 | .68 |
| Total from investment operations | .55 | .84 |
| Distributions from net investment income | – | (.15) |
| Distributions from net realized gain | (.25) | (.15) |
| Total distributions | (.25) | (.30) |
| Net asset value, end of period | $12.49 | $12.19 |
| Total ReturnC,D | 4.58% | 7.19% |
| Ratios to Average Net AssetsE,F | | |
| Expenses before reductions | .64%G | .65%G,H |
| Expenses net of fee waivers, if any | .64%G | .65%G,H |
| Expenses net of all reductions | .64%G | .65%G,H |
| Net investment income (loss) | .48%G | 1.92%G |
| Supplemental Data | | |
| Net assets, end of period (000 omitted) | $665,459 | $549,158 |
| Portfolio turnover rateE | 21%G | 11%I |
A For the period July 20, 2017 (commencement of sale of shares) to March 31, 2018.
B Calculated based on average shares outstanding during the period.
C Total returns for periods of less than one year are not annualized.
D Total returns would have been lower if certain expenses had not been reduced during the applicable periods shown.
E Amounts do not include the activity of the Underlying Funds.
F Expense ratios reflect operating expenses of the class. Expenses before reductions do not reflect amounts reimbursed by the investment adviser or reductions from expense offset arrangements and do not represent the amount paid by the class during periods when reimbursements or reductions occur. Expense ratios before reductions for start-up periods may not be representative of longer-term operating periods. Expenses net of fee waivers reflect expenses after reimbursement by the investment adviser but prior to reductions from expense offset arrangements. Expenses net of all reductions represent the net expenses paid by the class but do not include expenses of the underlying funds in which the Fund invests.
G Annualized
H On certain classes, the size and fluctuation of net assets and expense amounts may cause ratios to differ from contractual rates.
I The portfolio turnover rate does not include the assets acquired in the merger.
See accompanying notes which are an integral part of the financial statements.
Fidelity Freedom 2060 Fund Class K6
| | Six months ended (Unaudited) September 30, | Years endedMarch 31, |
| | 2018 | 2018 A |
| Selected Per–Share Data | | |
| Net asset value, beginning of period | $12.20 | $11.40 |
| Income from Investment Operations | | |
| Net investment income (loss)B | .04 | .14 |
| Net realized and unrealized gain (loss) | .52 | .96 |
| Total from investment operations | .56 | 1.10 |
| Distributions from net investment income | – | (.15) |
| Distributions from net realized gain | (.25) | (.15) |
| Total distributions | (.25) | (.30) |
| Net asset value, end of period | $12.51 | $12.20 |
| Total ReturnC,D | 4.66% | 9.65% |
| Ratios to Average Net AssetsE,F | | |
| Expenses before reductions | .49%G | .50%G,H |
| Expenses net of fee waivers, if any | .49%G | .50%G,H |
| Expenses net of all reductions | .49%G | .50%G,H |
| Net investment income (loss) | .63%G | 1.44%G |
| Supplemental Data | | |
| Net assets, end of period (000 omitted) | $82,084 | $26,888 |
| Portfolio turnover rateE | 21%G | 11%I |
A For the period June 7, 2017 (commencement of sale of shares) to March 31, 2018.
B Calculated based on average shares outstanding during the period.
C Total returns for periods of less than one year are not annualized.
D Total returns would have been lower if certain expenses had not been reduced during the applicable periods shown.
E Amounts do not include the activity of the Underlying Funds.
F Expense ratios reflect operating expenses of the class. Expenses before reductions do not reflect amounts reimbursed by the investment adviser or reductions from expense offset arrangements and do not represent the amount paid by the class during periods when reimbursements or reductions occur. Expense ratios before reductions for start-up periods may not be representative of longer-term operating periods. Expenses net of fee waivers reflect expenses after reimbursement by the investment adviser but prior to reductions from expense offset arrangements. Expenses net of all reductions represent the net expenses paid by the class but do not include expenses of the underlying funds in which the Fund invests.
G Annualized
H On certain classes, the size and fluctuation of net assets and expense amounts may cause ratios to differ from contractual rates.
I The portfolio turnover rate does not include the assets acquired in the merger.
See accompanying notes which are an integral part of the financial statements.
Notes to Financial Statements (Unaudited)
For the period ended September 30, 2018
1. Organization.
Fidelity Freedom Income Fund, Fidelity Freedom 2005 Fund, Fidelity Freedom 2010 Fund, Fidelity Freedom 2015 Fund, Fidelity Freedom 2020 Fund, Fidelity Freedom 2025 Fund, Fidelity Freedom 2030 Fund, Fidelity Freedom 2035 Fund, Fidelity Freedom 2040 Fund, Fidelity Freedom 2045 Fund, Fidelity Freedom 2050 Fund, Fidelity Freedom 2055 Fund and Fidelity Freedom 2060 Fund (the Funds) are funds of Fidelity Aberdeen Street Trust (the Trust). The Trust is registered under the Investment Company Act of 1940, as amended (the 1940 Act), as an open-end management investment company organized as a Delaware statutory trust. Each Fund is authorized to issue an unlimited number of shares. Each Fund offers Fidelity Freedom, Class K and Class K6 shares, each of which has equal rights as to assets and voting privileges. Each class has exclusive voting rights with respect to matters that affect that class. The Funds invest primarily in a combination of other Fidelity equity, bond, and short-term funds (the Underlying Funds) managed by Fidelity Management & Research Company (FMR). Certain Underlying Funds incurred name changes since their most recent shareholder report. The names of the Underlying Funds are those in effect at period end. In the prior year, the Funds transitioned their portfolios to invest exclusively in classes of the Fidelity Series funds, offered only to certain other Fidelity funds advised by FMR or its affiliates.
2. Investments in Fidelity Central Funds.
The Funds may invest in Fidelity Central Funds, which are open-end investment companies generally available only to other investment companies and accounts managed by the investment adviser and its affiliates. The Funds' Schedules of Investments list each of the Fidelity Central Funds held as of period end, if any, as an investment of each Fund, but do not include the underlying holdings of each Fidelity Central Fund. As an Investing Fund, each Fund indirectly bears its proportionate share of the expenses of the underlying Fidelity Central Funds.
The Money Market Central Funds seek preservation of capital and current income and are managed by Fidelity Investments Money Management, Inc. (FIMM), an affiliate of the investment adviser. Annualized expenses of the Money Market Central Funds as of their most recent shareholder report date are less than .005%.
A complete unaudited list of holdings for each Fidelity Central Fund is available upon request or at the Securities and Exchange Commission (the SEC) website at www.sec.gov. In addition, the financial statements of the Fidelity Central Funds are available on the SEC website or upon request.
3. Significant Accounting Policies.
Each Fund is an investment company and applies the accounting and reporting guidance of the Financial Accounting Standards Board (FASB) Accounting Standards Codification Topic 946 Financial Services – Investments Companies. The financial statements have been prepared in conformity with accounting principles generally accepted in the United States of America (GAAP), which require management to make certain estimates and assumptions at the date of the financial statements. Actual results could differ from those estimates. Subsequent events, if any, through the date that the financial statements were issued have been evaluated in the preparation of the financial statements. The following summarizes the significant accounting policies of the Funds:
Investment Valuation. Investments are valued as of 4:00 p.m. Eastern time on the last calendar day of the period. The Board of Trustees (the Board) has delegated the day to day responsibility for the valuation of each Fund's investments to the Fair Value Committee (the Committee) established by each Fund's investment adviser. In accordance with valuation policies and procedures approved by the Board, each Fund attempts to obtain prices from one or more third party pricing vendors or brokers to value its investments. When current market prices, quotations or currency exchange rates are not readily available or reliable, investments will be fair valued in good faith by the Committee, in accordance with procedures adopted by the Board. Factors used in determining fair value vary by investment type and may include market or investment specific events, changes in interest rates and credit quality. The frequency with which these procedures are used cannot be predicted and they may be utilized to a significant extent. The Committee oversees each Fund's valuation policies and procedures and reports to the Board on the Committee's activities and fair value determinations. The Board monitors the appropriateness of the procedures used in valuing each Fund's investments and ratifies the fair value determinations of the Committee. Each Fund categorizes the inputs to valuation techniques used to value its investments into a disclosure hierarchy consisting of three levels as shown below:
- Level 1 – quoted prices in active markets for identical investments
- Level 2 – other significant observable inputs (including quoted prices for similar investments, interest rates, prepayment speeds, etc.)
- Level 3 – unobservable inputs (including the Fund's own assumptions based on the best information available)
Valuation techniques used to value each Fund's investments by major category are as follows. Investments in the Underlying Funds are valued at their closing net asset value (NAV) each business day and are categorized as Level 1 in the hierarchy. Debt securities, including restricted securities, are valued based on evaluated prices received from third party pricing vendors or from brokers who make markets in such securities. U.S. government and government agency obligations are valued by pricing vendors who utilize matrix pricing which considers yield or price of bonds of comparable quality, coupon, maturity and type or by broker-supplied prices. When independent prices are unavailable or unreliable, debt securities may be valued utilizing pricing methodologies which consider similar factors that would be used by third party pricing vendors. Debt securities are generally categorized as Level 2 in the hierarchy but may be Level 3 depending on the circumstances.
Futures contracts are valued at the settlement price established each day by the board of trade or exchange on which they are traded and are categorized as Level 1 in the hierarchy.
The aggregate value of investments by input level as of September 30, 2018 is included at the end of each applicable Fund's Schedule of Investments.
Investment Transactions and Income. For financial reporting purposes, the Funds' investment holdings and NAV include trades executed through the end of the last business day of the period. The NAV per share for processing shareholder transactions is calculated as of the close of business of the New York Stock Exchange (NYSE), normally 4:00 p.m. Eastern time and includes trades executed through the end of the prior business day. Gains and losses on securities sold are determined on the basis of identified cost. Income and capital gain distributions from the Underlying Funds, if any, are recorded on the ex-dividend date. Interest income is accrued as earned. Interest income includes coupon interest and amortization of premium and accretion of discount on debt securities as applicable.
Class Allocations and Expenses. Investment income, realized and unrealized capital gains and losses, common expenses of each Fund, and certain fund-level expense reductions, if any, are allocated daily on a pro-rata basis to each class based on the relative net assets of each class to the total net assets of each Fund. Each class differs with respect to fees incurred. Certain expense reductions may also differ by class. For the reporting period, the allocated portion of income and expenses to each class as a percent of its average net assets may vary due to the timing of recording these transactions in relation to fluctuating net assets of the classes. Expenses directly attributable to a fund are charged to that fund. Expenses attributable to more than one fund are allocated among the respective funds on the basis of relative net assets or other appropriate methods. Expenses included in the accompanying financial statements reflect the expenses of each Fund and do not include any expenses associated with the Underlying Funds. Although not included in each Fund's expenses, each Fund indirectly bears its proportionate share of the Underlying Funds' expenses through the impact of these expenses on each Underlying Fund's NAV. Expense estimates are accrued in the period to which they relate and adjustments are made when actual amounts are known.
Deferred Trustee Compensation. Under a Deferred Compensation Plan (the Plan) for Fidelity Freedom 2010 Fund, Fidelity Freedom 2020 Fund and Fidelity Freedom 2030 Fund, certain independent Trustees have elected to defer receipt of a portion of their annual compensation. Deferred amounts are invested in a cross-section of Fidelity funds, are marked-to-market and remain in each Fund until distributed in accordance with the Plan. The investment of deferred amounts and the offsetting payable to the Trustees presented below are included in each accompanying Statement of Assets and Liabilities in other receivables and other payables and accrued expenses, respectively.
| Fidelity Freedom 2010 Fund | $93,931 |
| Fidelity Freedom 2020 Fund | 212,156 |
| Fidelity Freedom 2030 Fund | 174,805 |
Income Tax Information and Distributions to Shareholders. Each year, each Fund intends to qualify as a regulated investment company under Subchapter M of the Internal Revenue Code, including distributing substantially all of its taxable income and realized gains. As a result, no provision for U.S. Federal income taxes is required. Each Fund files a U.S. federal tax return, in addition to state and local tax returns as required. Each Fund's federal income tax returns are subject to examination by the Internal Revenue Service (IRS) for a period of three fiscal years after they are filed. State and local tax returns may be subject to examination for an additional fiscal year depending on the jurisdiction.
Distributions are declared and recorded on the ex-dividend date. Income and capital gain distributions are declared separately for each class. Income and capital gain distributions are determined in accordance with income tax regulations, which may differ from GAAP.
Capital accounts within the financial statements are adjusted for permanent book-tax differences. These adjustments have no impact on net assets or the results of operations. Capital accounts are not adjusted for temporary book-tax differences which will reverse in a subsequent period.
Book-tax differences are primarily due to the short-term gain distributions from the Underlying Funds, futures contracts, market discount, deferred trustees compensation, losses deferred due to wash sales, and excise tax regulations.
As of period end, the cost and unrealized appreciation (depreciation) in securities, and derivatives if applicable, for federal income tax purposes were as follows for each Fund:
| | Tax cost | Gross unrealized appreciation | Gross unrealized depreciation | Net unrealized appreciation (depreciation) |
| Fidelity Freedom Income Fund | $3,348,077,971 | $219,688,827 | $(48,495,993) | $171,192,834 |
| Fidelity Freedom 2005 Fund | 934,442,654 | 77,482,242 | (23,566,371) | 53,915,871 |
| Fidelity Freedom 2010 Fund | 5,637,412,521 | 704,900,587 | (128,215,802) | 576,684,785 |
| Fidelity Freedom 2015 Fund | 8,327,269,154 | 1,359,749,262 | (149,074,212) | 1,210,675,050 |
| Fidelity Freedom 2020 Fund | 25,108,681,386 | 4,480,786,893 | (471,556,551) | 4,009,230,342 |
| Fidelity Freedom 2025 Fund | 23,618,026,776 | 4,344,409,295 | (398,472,176) | 3,945,937,119 |
| Fidelity Freedom 2030 Fund | 26,942,964,282 | 6,063,148,062 | (388,054,234) | 5,675,093,828 |
| Fidelity Freedom 2035 Fund | 18,177,492,824 | 4,546,451,869 | (156,640,239) | 4,389,811,630 |
| Fidelity Freedom 2040 Fund | 18,340,202,614 | 4,904,765,625 | (156,601,951) | 4,748,163,674 |
| Fidelity Freedom 2045 Fund | 11,299,537,650 | 2,751,964,841 | (90,481,282) | 2,661,483,559 |
| Fidelity Freedom 2050 Fund | 9,660,653,843 | 2,295,466,260 | (77,689,528) | 2,217,776,732 |
| Fidelity Freedom 2055 Fund | 4,325,199,677 | 654,003,691 | (37,344,982) | 616,658,709 |
| Fidelity Freedom 2060 Fund | 978,408,082 | 88,105,095 | (9,939,624) | 78,165,471 |
Certain of the Funds elected to defer to the next fiscal year ordinary losses recognized during the period January 1, 2018 to March 31, 2018. Loss deferrals were as follows:
| | Ordinary losses |
| Fidelity Freedom 2050 Fund | $1,076,447 |
| Fidelity Freedom 2055 Fund | 1,831,366 |
| Fidelity Freedom 2060 Fund | 655,535 |
4. Derivative Instruments.
Risk Exposures and the Use of Derivative Instruments. The Funds' investment objective allows the Funds to enter into various types of derivative contracts, including futures contracts. Derivatives are investments whose value is primarily derived from underlying assets, indices or reference rates and may be transacted on an exchange or over-the-counter (OTC). Derivatives may involve a future commitment to buy or sell a specified asset based on specified terms, to exchange future cash flows at periodic intervals based on a notional principal amount, or for one party to make one or more payments upon the occurrence of specified events in exchange for periodic payments from the other party.
The Funds used derivatives to increase returns and to manage exposure to certain risks as defined below. The success of any strategy involving derivatives depends on analysis of numerous economic factors, and if the strategies for investment do not work as intended, the Funds may not achieve their objectives.
The Funds' use of derivatives increased or decreased their exposure to the following risk:
| Equity Risk | Equity risk relates to the fluctuations in the value of financial instruments as a result of changes in market prices (other than those arising from interest rate risk or foreign exchange risk), whether caused by factors specific to an individual investment, its issuer, or all factors affecting all instruments traded in a market or market segment.
|
The Funds are also exposed to additional risks from investing in derivatives, such as liquidity risk and counterparty credit risk. Liquidity risk is the risk that the Funds will be unable to close out the derivative in the open market in a timely manner. Counterparty credit risk is the risk that the counterparty will not be able to fulfill its obligation to the Funds. Counterparty credit risk related to exchange-traded futures contracts may be mitigated by the protection provided by the exchange on which they trade.
Investing in derivatives may involve greater risks than investing in the underlying assets directly and, to varying degrees, may involve risk of loss in excess of any initial investment and collateral received and amounts recognized in the Statement of Assets and Liabilities. In addition, there may be the risk that the change in value of the derivative contract does not correspond to the change in value of the underlying instrument.
Futures Contracts. A futures contract is an agreement between two parties to buy or sell a specified underlying instrument for a fixed price at a specified future date. The Funds used futures contracts to manage their exposure to the stock market.
Upon entering into a futures contract, a fund is required to deposit either cash or securities (initial margin) with a clearing broker in an amount equal to a certain percentage of the face value of the contract. Futures contracts are marked-to-market daily and subsequent daily payments (variation margin) are made or received by a fund depending on the daily fluctuations in the value of the futures contracts and are recorded as unrealized appreciation or (depreciation). This receivable and/or payable, if any, is included in daily variation margin on futures contracts in the Statement of Assets and Liabilities. Realized gain or (loss) is recorded upon the expiration or closing of a futures contract. The net realized gain (loss) and change in net unrealized appreciation (depreciation) on futures contracts during the period is presented in the Statement of Operations.
Any open futures contracts at period end are presented in the Schedule of Investments under the caption "Futures Contracts". The notional amount at value reflects each contract's exposure to the underlying instrument or index at period end.
5. Purchases and Sales of Investments.
Purchases and sales of securities, other than short-term securities, are noted in the table below.
| | Purchases ($) | Sales ($) |
| Fidelity Freedom Income Fund | 580,118,712 | 779,411,886 |
| Fidelity Freedom 2005 Fund | 172,776,315 | 210,333,156 |
| Fidelity Freedom 2010 Fund | 828,962,275 | 1,153,580,828 |
| Fidelity Freedom 2015 Fund | 1,128,133,044 | 1,816,318,045 |
| Fidelity Freedom 2020 Fund | 3,196,773,708 | 4,491,014,473 |
| Fidelity Freedom 2025 Fund | 3,306,757,542 | 3,488,856,635 |
| Fidelity Freedom 2030 Fund | 3,218,978,872 | 3,246,280,546 |
| Fidelity Freedom 2035 Fund | 2,786,167,088 | 2,598,869,741 |
| Fidelity Freedom 2040 Fund | 2,610,252,508 | 2,596,606,461 |
| Fidelity Freedom 2045 Fund | 1,811,121,475 | 1,576,297,675 |
| Fidelity Freedom 2050 Fund | 1,611,420,742 | 1,344,980,883 |
| Fidelity Freedom 2055 Fund | 927,305,283 | 520,517,490 |
| Fidelity Freedom 2060 Fund | 308,491,043 | 97,136,581 |
6. Fees and Other Transactions with Affiliates.
Management Fee and Expense Contract. FMR Co., Inc. (the investment adviser), an affiliate of FMR, and its affiliates provide the Funds with investment management related services. Under the management contract, effective June 1, 2017, each Class of each Fund pays a monthly management fee that is set at an annual rate by referring to each Fund's target date, indicated by its name, such that the management fee rate applicable to each Class of each Fund is reduced as the fund approaches, and then passes, its target date. In addition, under the management contract, the investment adviser pays all ordinary operating expenses of each Fund, except fees and expenses of the independent Trustees, and certain miscellaneous expenses such as proxy and shareholder meeting expenses. The management fee is reduced by an amount equal to the fees and expenses paid by each Fund to the independent Trustees. Prior to June 1, 2017, the investment advisor provided the Funds with investment management related services. The Funds did not pay any fees for these services. For the reporting period, the total annual management fee rate for each Class of each Fund was as follows:
| | Annual % of Class-Level Average Net Assets (Fidelity Freedom Class) | Annual % of Class-Level Average Net Assets (Class K) |
| Fidelity Freedom Income Fund | .465% | .415% |
| Fidelity Freedom 2005 Fund | .482% | .428% |
| Fidelity Freedom 2010 Fund | .525% | .461% |
| Fidelity Freedom 2015 Fund | .567% | .496% |
| Fidelity Freedom 2020 Fund | .610% | .531% |
| Fidelity Freedom 2025 Fund | .652% | .566% |
| Fidelity Freedom 2030 Fund | .695% | .601% |
| Fidelity Freedom 2035 Fund | .737% | .636% |
| Fidelity Freedom 2040 Fund | .746% | .643% |
| Fidelity Freedom 2045 Fund | .746% | .643% |
| Fidelity Freedom 2050 Fund | .746% | .643% |
| Fidelity Freedom 2055 Fund | .746% | .643% |
| Fidelity Freedom 2060 Fund | .746% | .643% |
Under the expense contract, the investment adviser pays class-level expenses for Class K6 of each Fund as necessary so that Class K6 total expenses do not exceed certain amounts of Class K6 average net assets on an annual basis with certain exceptions, as noted in the following table:
| | Annual % of Class-Level Average Net Assets (Class K6) |
| Fidelity Freedom Income Fund | .365% |
| Fidelity Freedom 2005 Fund | .373% |
| Fidelity Freedom 2010 Fund | .392% |
| Fidelity Freedom 2015 Fund | .412% |
| Fidelity Freedom 2020 Fund | .431% |
| Fidelity Freedom 2025 Fund | .450% |
| Fidelity Freedom 2030 Fund | .470% |
| Fidelity Freedom 2035 Fund | .489% |
| Fidelity Freedom 2040 Fund | .493% |
| Fidelity Freedom 2045 Fund | .493% |
| Fidelity Freedom 2050 Fund | .493% |
| Fidelity Freedom 2055 Fund | .493% |
| Fidelity Freedom 2060 Fund | .493% |
Other Transactions. The investment adviser has entered into an administration agreement with FMR under which FMR provides management and administrative services (other than investment advisory services) necessary for the operation of each Fund. Pursuant to this agreement, FMR pays all expenses of each Fund, excluding compensation of the independent Trustees and certain miscellaneous expenses such as proxy and shareholder meeting expenses. FMR also contracts with other Fidelity companies to perform the services necessary for the operation of each Fund. The Funds do not pay any fees for these services.
Prior Fiscal Year Reallocation of Underlying Fund Investments. During the prior period, the investment adviser reallocated investments of the Funds. This involved taxable redemptions of the Funds' interest in Fidelity Series Value Discovery Fund, ("selected Underlying Fund") for investments and cash and non-taxable exchanges of those investments and cash for shares of Fidelity Series Intrinsic Opportunities Fund and Fidelity Series Growth & Income Fund which are affiliated investment companies managed by FMR.
Details of these transactions with the net related gain (loss) for the Funds are presented in the accompanying table:
| | Value of Investments and Cash reallocated | Net realized Gain (Loss) on redemptions of selected Underlying Fund |
| Freedom Income Fund | $ 21,943,732 | $ 5,248,386 |
| Freedom 2005 Fund | 9,132,913 | 818,016 |
| Freedom 2010 Fund | 82,938,352 | 17,423,248 |
| Freedom 2015 Fund | 132,300,852 | 26,218,924 |
| Freedom 2020 Fund | 349,185,809 | 55,046,914 |
| Freedom 2025 Fund | 312,149,126 | 36,476,750 |
| Freedom 2030 Fund | 443,448,822 | 45,658,987 |
| Freedom 2035 Fund | 315,567,651 | 25,385,650 |
| Freedom 2040 Fund | 341,654,429 | 31,022,107 |
| Freedom 2045 Fund | 165,214,747 | 12,941,012 |
| Freedom 2050 Fund | 136,449,649 | 10,462,773 |
| Freedom 2055 Fund | 44,625,815 | 2,684,111 |
| Freedom 2060 Fund | 6,196,209 | 137,579 |
7. Expense Reductions.
Through arrangements with each applicable Fund's custodian, credits realized as a result of certain uninvested cash balances were used to reduce the Fund's expenses. All of the applicable expense reductions are noted in the table below.
| | Expense reduction |
| Fidelity Freedom Income Fund | $54 |
| Fidelity Freedom 2005 Fund | 70 |
| Fidelity Freedom 2010 Fund | 38 |
| Fidelity Freedom 2015 Fund | 55 |
| Fidelity Freedom 2020 Fund | 13 |
| Fidelity Freedom 2025 Fund | 12 |
| Fidelity Freedom 2030 Fund | 25 |
| Fidelity Freedom 2045 Fund | 29 |
| Fidelity Freedom 2050 Fund | 6 |
| Fidelity Freedom 2055 Fund | 6 |
8. Distributions to Shareholders.
Distributions to shareholders of each class were as follows:
| | Six months ended
September 30, 2018 | Year ended
March 31, 2018(a) |
| Fidelity Freedom Income Fund | | |
| From net investment income | | |
| Fidelity Freedom Income Fund | $14,984,465 | $34,335,271 |
| Class K | 10,910,977 | 17,390,446 |
| Class K6 | 455,334 | 223,737 |
| Total | $26,350,776 | $51,949,454 |
| From net realized gain | | |
| Fidelity Freedom Income Fund | $22,330,640 | $44,712,535 |
| Class K | 16,009,200 | 22,488,873 |
| Class K6 | 520,337 | 239,298 |
| Total | $38,860,177 | $67,440,706 |
| Fidelity Freedom 2005 Fund | | |
| From net investment income | | |
| Fidelity Freedom 2005 Fund | $1,524,497 | $8,256,167 |
| Class K | 1,072,276 | 5,348,186 |
| Class K6 | 40,475 | 66,981 |
| Total | $2,637,248 | $13,671,334 |
| From net realized gain | | |
| Fidelity Freedom 2005 Fund | $8,908,779 | $14,263,444 |
| Class K | 6,076,226 | 6,417,819 |
| Class K6 | 194,073 | 78,417 |
| Total | $15,179,078 | $20,759,680 |
| Fidelity Freedom 2010 Fund | | |
| From net investment income | | |
| Fidelity Freedom 2010 Fund | $8,368,166 | $59,450,122 |
| Class K | 5,046,887 | 33,379,063 |
| Class K6 | 229,872 | 446,466 |
| Total | $13,644,925 | $93,275,651 |
| From net realized gain | | |
| Fidelity Freedom 2010 Fund | $87,992,475 | $138,121,654 |
| Class K | 50,036,243 | 54,086,430 |
| Class K6 | 1,772,564 | 700,731 |
| Total | $139,801,282 | $192,908,815 |
| Fidelity Freedom 2015 Fund | | |
| From net investment income | | |
| Fidelity Freedom 2015 Fund | $8,688,870 | $75,356,851 |
| Class K | 7,132,266 | 62,744,245 |
| Class K6 | 397,154 | 834,279 |
| Total | $16,218,290 | $138,935,375 |
| From net realized gain | | |
| Fidelity Freedom 2015 Fund | $134,055,986 | $187,400,162 |
| Class K | 105,038,677 | 102,672,333 |
| Class K6 | 4,150,891 | 1,342,304 |
| Total | $243,245,554 | $291,414,799 |
| Fidelity Freedom 2020 Fund | | |
| From net investment income | | |
| Fidelity Freedom 2020 Fund | $15,444,745 | $170,977,599 |
| Class K | 19,118,065 | 214,523,078 |
| Class K6 | 1,282,075 | 3,160,558 |
| Total | $35,844,885 | $388,661,235 |
| From net realized gain | | |
| Fidelity Freedom 2020 Fund | $316,208,644 | $406,127,361 |
| Class K | 371,844,368 | 309,195,087 |
| Class K6 | 15,585,204 | 4,430,552 |
| Total | $703,638,216 | $719,753,000 |
| Fidelity Freedom 2025 Fund | | |
| From net investment income | | |
| Fidelity Freedom 2025 Fund | $8,064,374 | $135,746,842 |
| Class K | 11,556,354 | 196,874,291 |
| Class K6 | 1,171,512 | 4,557,308 |
| Total | $20,792,240 | $337,178,441 |
| From net realized gain | | |
| Fidelity Freedom 2025 Fund | $257,242,278 | $300,732,953 |
| Class K | 335,132,279 | 252,816,654 |
| Class K6 | 17,795,792 | 5,757,887 |
| Total | $610,170,349 | $559,307,494 |
| Fidelity Freedom 2030 Fund | | |
| From net investment income | | |
| Fidelity Freedom 2030 Fund | $– | $152,399,042 |
| Class K | – | 237,812,270 |
| Class K6 | – | 6,564,512 |
| Total | $– | $396,775,824 |
| From net realized gain | | |
| Fidelity Freedom 2030 Fund | $350,600,239 | $413,872,411 |
| Class K | 473,811,407 | 346,196,136 |
| Class K6 | 26,942,551 | 9,436,482 |
| Total | $851,354,197 | $769,505,029 |
| Fidelity Freedom 2035 Fund | | |
| From net investment income | | |
| Fidelity Freedom 2035 Fund | $– | $87,722,896 |
| Class K | – | 162,011,402 |
| Class K6 | – | 5,709,559 |
| Total | $– | $255,443,857 |
| From net realized gain | | |
| Fidelity Freedom 2035 Fund | $230,445,861 | $240,142,544 |
| Class K | 335,955,382 | 221,611,338 |
| Class K6 | 22,770,060 | 7,651,385 |
| Total | $589,171,303 | $469,405,267 |
| Fidelity Freedom 2040 Fund | | |
| From net investment income | | |
| Fidelity Freedom 2040 Fund | $– | $90,536,406 |
| Class K | – | 170,937,500 |
| Class K6 | – | 4,789,254 |
| Total | $– | $266,263,160 |
| From net realized gain | | |
| Fidelity Freedom 2040 Fund | $241,363,664 | $261,248,683 |
| Class K | 357,897,586 | 242,057,363 |
| Class K6 | 21,767,741 | 6,636,534 |
| Total | $621,028,991 | $509,942,580 |
| Fidelity Freedom 2045 Fund | | |
| From net investment income | | |
| Fidelity Freedom 2045 Fund | $– | $44,250,979 |
| Class K | – | 109,126,440 |
| Class K6 | – | 2,701,118 |
| Total | $– | $156,078,537 |
| From net realized gain | | |
| Fidelity Freedom 2045 Fund | $121,573,693 | $114,572,629 |
| Class K | 225,623,203 | 138,369,458 |
| Class K6 | 12,930,259 | 3,337,686 |
| Total | $360,127,155 | $256,279,773 |
| Fidelity Freedom 2050 Fund | | |
| From net investment income | | |
| Fidelity Freedom 2050 Fund | $– | $36,777,044 |
| Class K | – | 92,715,220 |
| Class K6 | – | 1,957,994 |
| Total | $– | $131,450,258 |
| From net realized gain | | |
| Fidelity Freedom 2050 Fund | $98,786,680 | $93,839,199 |
| Class K | 191,006,262 | 116,797,064 |
| Class K6 | 10,002,143 | 2,419,431 |
| Total | $299,795,085 | $213,055,694 |
| Fidelity Freedom 2055 Fund | | |
| From net investment income | | |
| Fidelity Freedom 2055 Fund | $– | $12,886,343 |
| Class K | – | 34,941,200 |
| Class K6 | – | 799,585 |
| Total | $– | $48,627,128 |
| From net realized gain | | |
| Fidelity Freedom 2055 Fund | $34,080,234 | $27,949,675 |
| Class K | 70,641,422 | 41,275,560 |
| Class K6 | 3,670,845 | 928,253 |
| Total | $108,392,501 | $70,153,488 |
| Fidelity Freedom 2060 Fund | | |
| From net investment income | | |
| Fidelity Freedom 2060 Fund | $– | $2,107,103 |
| Class K | – | 5,444,764 |
| Class K6 | – | 151,536 |
| Total | $– | $7,703,403 |
| From net realized gain | | |
| Fidelity Freedom 2060 Fund | $5,777,935 | $3,721,242 |
| Class K | 11,676,178 | 5,555,128 |
| Class K6 | 627,109 | 152,547 |
| Total | $18,081,222 | $9,428,917 |
(a) Amounts for Class K and Class K6 are for the period July 20, 2017 and June 7, 2017, respectively, (commencement of sale of shares) to March 31, 2018.
9. Share Transactions.
Share transactions for each class were as follows and may contain automatic conversions between classes or exchanges between affiliated funds:
| | Shares | Shares | Dollars | Dollars |
| | Six months ended September 30, 2018 | Year ended March 31, 2018 (a) | Six months ended September 30, 2018 | Year ended March 31, 2018 (a) |
| Fidelity Freedom Income Fund | | | | |
| Fidelity Freedom Income Fund | | | | |
| Shares sold | 12,814,841 | 27,221,111 | $148,674,954 | $320,765,917 |
| Reinvestment of distributions | 3,164,229 | 6,605,290 | 36,540,585 | 77,395,265 |
| Shares redeemed | (20,352,135) | (38,028,513) | (235,957,475) | (447,668,101) |
| Net increase (decrease) | (4,373,065) | (4,202,112) | $(50,741,936) | $(49,506,919) |
| Class K | | | | |
| Shares sold | 12,517,953 | 23,453,639 | $144,956,112 | $277,296,475 |
| Issued in exchange for the shares of Fidelity Freedom K Income Fund | – | 136,520,990 | – | 1,613,678,107 |
| Reinvestment of distributions | 2,334,978 | 3,392,232 | 26,920,177 | 39,879,319 |
| Shares redeemed | (29,145,944) | (29,017,558) | (337,442,532) | (343,144,692) |
| Net increase (decrease) | (14,293,013) | 134,349,303 | $(165,566,243) | $1,587,709,209 |
| Class K6 | | | | |
| Shares sold | 4,888,043 | 3,890,192 | $56,611,838 | $45,935,962 |
| Reinvestment of distributions | 84,555 | 39,381 | 975,671 | 463,035 |
| Shares redeemed | (678,423) | (569,053) | (7,861,133) | (6,709,845) |
| Net increase (decrease) | 4,294,175 | 3,360,520 | $49,726,376 | $39,689,152 |
| Fidelity Freedom 2005 Fund | | | | |
| Fidelity Freedom 2005 Fund | | | | |
| Shares sold | 3,686,723 | 7,378,209 | $45,792,236 | $92,645,422 |
| Reinvestment of distributions | 835,563 | 1,791,008 | 10,335,921 | 22,315,999 |
| Shares redeemed | (5,768,683) | (9,828,104) | (71,645,766) | (123,356,983) |
| Net increase (decrease) | (1,246,397) | (658,887) | $(15,517,609) | $(8,395,562) |
| Class K | | | | |
| Shares sold | 4,893,445 | 9,369,547 | $60,658,371 | $118,391,743 |
| Issued in exchange for the shares of Fidelity Freedom K 2005 Fund | – | 32,823,330 | – | 412,589,249 |
| Reinvestment of distributions | 578,826 | 938,278 | 7,148,502 | 11,766,005 |
| Shares redeemed | (8,230,204) | (9,282,767) | (102,006,836) | (117,477,612) |
| Net increase (decrease) | (2,757,933) | 33,848,388 | $(34,199,963) | $425,269,385 |
| Class K6 | | | | |
| Shares sold | 1,771,969 | 893,756 | $22,013,023 | $11,275,207 |
| Reinvestment of distributions | 18,992 | 11,585 | 234,548 | 145,398 |
| Shares redeemed | (174,160) | (106,187) | (2,164,051) | (1,340,558) |
| Net increase (decrease) | 1,616,801 | 799,154 | $20,083,520 | $10,080,047 |
| Fidelity Freedom 2010 Fund | | | | |
| Fidelity Freedom 2010 Fund | | | | |
| Shares sold | 12,416,194 | 23,767,583 | $196,634,359 | $381,761,384 |
| Reinvestment of distributions | 6,029,770 | 12,229,853 | 94,968,861 | 194,626,240 |
| Shares redeemed | (24,565,366) | (49,294,217) | (388,720,220) | (791,146,041) |
| Net increase (decrease) | (6,119,402) | (13,296,781) | $(97,117,000) | $(214,758,417) |
| Class K | | | | |
| Shares sold | 9,503,819 | 20,322,144 | $150,402,768 | $328,782,786 |
| Issued in exchange for the shares of Fidelity Freedom K 2010 Fund | – | 158,527,428 | – | 2,547,535,809 |
| Reinvestment of distributions | 3,501,788 | 5,452,961 | 55,083,130 | 87,465,493 |
| Shares redeemed | (28,041,001) | (34,234,425) | (443,557,450) | (555,204,634) |
| Net increase (decrease) | (15,035,394) | 150,068,108 | $(238,071,552) | $2,408,579,454 |
| Class K6 | | | | |
| Shares sold | 6,624,451 | 4,164,658 | $104,974,043 | $67,215,211 |
| Reinvestment of distributions | 127,381 | 71,521 | 2,002,436 | 1,147,196 |
| Shares redeemed | (627,780) | (490,870) | (9,946,565) | (7,955,488) |
| Net increase (decrease) | 6,124,052 | 3,745,309 | $97,029,914 | $60,406,919 |
| Fidelity Freedom 2015 Fund | | | | |
| Fidelity Freedom 2015 Fund | | | | |
| Shares sold | 42,069,204 | 72,616,042 | $555,702,088 | $968,356,768 |
| Reinvestment of distributions | 10,754,160 | 19,682,696 | 141,309,668 | 260,136,127 |
| Shares redeemed | (63,033,983) | (104,001,992) | (832,380,628) | (1,384,215,146) |
| Net increase (decrease) | (10,210,619) | (11,703,254) | $(135,368,872) | $(155,722,251) |
| Class K | | | | |
| Shares sold | 24,763,747 | 57,486,192 | $326,582,470 | $773,133,070 |
| Issued in exchange for the shares of Fidelity Freedom K 2015 Fund | – | 357,299,109 | – | 4,748,505,056 |
| Reinvestment of distributions | 8,549,615 | 12,372,220 | 112,170,943 | 165,416,578 |
| Shares redeemed | (83,158,645) | (79,691,095) | (1,097,577,183) | (1,075,934,728) |
| Net increase (decrease) | (49,845,283) | 347,466,426 | $(658,823,770) | $4,611,119,976 |
| Class K6 | | | | |
| Shares sold | 21,150,472 | 10,514,183 | $280,449,664 | $140,899,779 |
| Reinvestment of distributions | 346,650 | 162,796 | 4,548,045 | 2,176,583 |
| Shares redeemed | (2,371,453) | (2,096,076) | (31,309,506) | (28,077,012) |
| Net increase (decrease) | 19,125,669 | 8,580,903 | $253,688,203 | $114,999,350 |
| Fidelity Freedom 2020 Fund | | | | |
| Fidelity Freedom 2020 Fund | | | | |
| Shares sold | 100,964,511 | 152,441,221 | $1,654,474,680 | $2,504,940,140 |
| Reinvestment of distributions | 20,131,258 | 35,050,498 | 328,743,442 | 571,436,446 |
| Shares redeemed | (124,487,003) | (187,167,034) | (2,042,470,360) | (3,072,056,561) |
| Net increase (decrease) | (3,391,234) | 324,685 | $(59,252,238) | $4,320,025 |
| Class K | | | | |
| Shares sold | 81,218,328 | 159,801,375 | $1,331,407,311 | $2,656,458,207 |
| Issued in exchange for the shares of Fidelity Freedom K 2020 Fund | – | 997,191,746 | – | 16,284,141,352 |
| Reinvestment of distributions | 23,970,719 | 31,625,493 | 390,962,433 | 523,718,165 |
| Shares redeemed | (213,603,512) | (181,091,802) | (3,500,766,327) | (3,024,255,229) |
| Net increase (decrease) | (108,414,465) | 1,007,526,812 | $(1,778,396,583) | $16,440,062,495 |
| Class K6 | | | | |
| Shares sold | 59,778,897 | 31,475,610 | $984,841,647 | $521,683,894 |
| Reinvestment of distributions | 1,033,534 | 458,124 | 16,867,279 | 7,591,110 |
| Shares redeemed | (4,685,421) | (3,147,676) | (76,820,509) | (52,491,121) |
| Net increase (decrease) | 56,127,010 | 28,786,058 | $924,888,417 | $476,783,883 |
| Fidelity Freedom 2025 Fund | | | | |
| Fidelity Freedom 2025 Fund | | | | |
| Shares sold | 115,752,184 | 158,726,717 | $1,650,321,426 | $2,259,361,477 |
| Reinvestment of distributions | 18,499,634 | 30,656,487 | 263,619,804 | 433,261,289 |
| Shares redeemed | (120,383,751) | (151,675,334) | (1,722,482,523) | (2,154,686,419) |
| Net increase (decrease) | 13,868,067 | 37,707,870 | $191,458,707 | $537,936,347 |
| Class K | | | | |
| Shares sold | 110,517,604 | 199,976,963 | $1,578,994,350 | $2,881,263,698 |
| Issued in exchange for the shares of Fidelity Freedom K 2025 Fund | – | 1,039,138,058 | – | 14,641,455,337 |
| Reinvestment of distributions | 24,363,221 | 31,228,538 | 346,688,633 | 449,690,945 |
| Shares redeemed | (218,947,438) | (171,473,684) | (3,125,322,228) | (2,483,694,512) |
| Net increase (decrease) | (84,066,613) | 1,098,869,875 | $(1,199,639,245) | $15,488,715,468 |
| Class K6 | | | | |
| Shares sold | 80,963,256 | 47,051,793 | $1,164,521,730 | $673,422,348 |
| Reinvestment of distributions | 1,331,974 | 715,836 | 18,967,304 | 10,315,195 |
| Shares redeemed | (5,116,200) | (4,172,324) | (73,271,821) | (60,270,553) |
| Net increase (decrease) | 77,179,030 | 43,595,305 | $1,110,217,213 | $623,466,990 |
| Fidelity Freedom 2030 Fund | | | | |
| Fidelity Freedom 2030 Fund | | | | |
| Shares sold | 89,856,024 | 123,266,681 | $1,607,142,710 | $2,193,032,389 |
| Reinvestment of distributions | 19,465,688 | 31,803,918 | 348,046,505 | 561,630,140 |
| Shares redeemed | (89,285,758) | (126,546,656) | (1,604,093,908) | (2,245,714,755) |
| Net increase (decrease) | 20,035,954 | 28,523,943 | $351,095,307 | $508,947,774 |
| Class K | | | | |
| Shares sold | 93,910,114 | 159,214,941 | $1,684,872,969 | $2,878,963,957 |
| Issued in exchange for the shares of Fidelity Freedom K 2030 Fund | – | 980,848,240 | – | 17,213,886,716 |
| Reinvestment of distributions | 26,529,194 | 32,337,117 | 473,811,407 | 584,008,406 |
| Shares redeemed | (178,456,993) | (148,080,700) | (3,197,204,014) | (2,692,845,198) |
| Net increase (decrease) | (58,017,685) | 1,024,319,598 | $(1,038,519,638) | $17,984,013,881 |
| Class K6 | | | | |
| Shares sold | 62,570,300 | 47,995,734 | $1,130,087,929 | $858,334,852 |
| Reinvestment of distributions | 1,507,697 | 885,011 | 26,942,551 | 16,000,993 |
| Shares redeemed | (4,118,136) | (3,213,471) | (74,124,983) | (58,671,562) |
| Net increase (decrease) | 59,959,861 | 45,667,274 | $1,082,905,497 | $815,664,283 |
| Fidelity Freedom 2035 Fund | | | | |
| Fidelity Freedom 2035 Fund | | | | |
| Shares sold | 86,025,453 | 110,962,220 | $1,299,965,870 | $1,654,304,549 |
| Reinvestment of distributions | 15,107,462 | 21,957,182 | 229,180,205 | 325,960,643 |
| Shares redeemed | (82,917,707) | (99,897,658) | (1,262,836,996) | (1,486,838,456) |
| Net increase (decrease) | 18,215,208 | 33,021,744 | $266,309,079 | $493,426,736 |
| Class K | | | | |
| Shares sold | 93,071,804 | 152,904,028 | $1,414,570,724 | $2,323,823,499 |
| Issued in exchange for the shares of Fidelity Freedom K 2035 Fund | – | 810,190,579 | – | 11,861,189,816 |
| Reinvestment of distributions | 22,189,920 | 25,155,590 | 335,955,382 | 383,622,740 |
| Shares redeemed | (162,819,808) | (133,107,016) | (2,469,554,267) | (2,040,612,137) |
| Net increase (decrease) | (47,558,084) | 855,143,181 | $(719,028,161) | $12,528,023,918 |
| Class K6 | | | | |
| Shares sold | 61,962,222 | 48,428,487 | $950,919,386 | $727,016,849 |
| Reinvestment of distributions | 1,501,983 | 875,553 | 22,770,060 | 13,360,944 |
| Shares redeemed | (3,635,653) | (2,447,780) | (55,459,264) | (37,752,360) |
| Net increase (decrease) | 59,828,552 | 46,856,260 | $918,230,182 | $702,625,433 |
| Fidelity Freedom 2040 Fund | | | | |
| Fidelity Freedom 2040 Fund | | | | |
| Shares sold | 114,357,824 | 136,619,831 | $1,212,979,858 | $1,431,492,061 |
| Reinvestment of distributions | 22,477,411 | 33,488,676 | 239,384,409 | 348,747,375 |
| Shares redeemed | (113,943,932) | (139,529,622) | (1,218,390,159) | (1,457,941,134) |
| Net increase (decrease) | 22,891,303 | 30,578,885 | $233,974,108 | $322,298,302 |
| Class K | | | | |
| Shares sold | 127,998,063 | 204,272,570 | $1,366,553,863 | $2,180,144,652 |
| Issued in exchange for the shares of Fidelity Freedom K 2040 Fund | – | 1,209,417,175 | – | 12,432,808,583 |
| Reinvestment of distributions | 33,636,990 | 38,561,612 | 357,897,586 | 412,994,864 |
| Shares redeemed | (234,086,037) | (192,024,994) | (2,494,022,833) | (2,069,340,268) |
| Net increase (decrease) | (72,450,984) | 1,260,226,363 | $(769,571,384) | $12,956,607,831 |
| Class K6 | | | | |
| Shares sold | 81,192,591 | 63,538,724 | $875,001,916 | $671,238,294 |
| Reinvestment of distributions | 2,045,840 | 1,066,834 | 21,767,741 | 11,425,788 |
| Shares redeemed | (4,778,362) | (3,427,354) | (51,099,743) | (37,056,376) |
| Net increase (decrease) | 78,460,069 | 61,178,204 | $845,669,914 | $645,607,706 |
| Fidelity Freedom 2045 Fund | | | | |
| Fidelity Freedom 2045 Fund | | | | |
| Shares sold | 75,278,694 | 83,678,942 | $904,770,311 | $990,525,865 |
| Reinvestment of distributions | 9,991,436 | 13,350,262 | 120,696,554 | 157,549,317 |
| Shares redeemed | (69,963,161) | (72,278,251) | (848,390,338) | (853,762,795) |
| Net increase (decrease) | 15,306,969 | 24,750,953 | $177,076,527 | $294,312,387 |
| Class K | | | | |
| Shares sold | 90,594,687 | 138,438,372 | $1,096,330,973 | $1,672,115,670 |
| Issued in exchange for the shares of Fidelity Freedom K 2045 Fund | – | 680,392,245 | – | 7,906,157,717 |
| Reinvestment of distributions | 18,708,391 | 20,403,619 | 225,623,203 | 247,495,898 |
| Shares redeemed | (145,350,988) | (114,898,251) | (1,756,100,626) | (1,401,257,211) |
| Net increase (decrease) | (36,047,910) | 724,335,985 | $(434,146,450) | $8,424,512,074 |
| Class K6 | | | | |
| Shares sold | 55,104,850 | 35,416,332 | $674,338,014 | $424,716,328 |
| Reinvestment of distributions | 1,072,161 | 497,430 | 12,930,259 | 6,038,804 |
| Shares redeemed | (2,544,483) | (1,761,820) | (30,859,157) | (21,547,868) |
| Net increase (decrease) | 53,632,528 | 34,151,942 | $656,409,116 | $409,207,264 |
| Fidelity Freedom 2050 Fund | | | | |
| Fidelity Freedom 2050 Fund | | | | |
| Shares sold | 62,676,941 | 75,824,728 | $758,627,978 | $902,647,093 |
| Reinvestment of distributions | 8,041,120 | 10,861,802 | 97,699,616 | 128,951,626 |
| Shares redeemed | (55,905,302) | (63,697,605) | (681,837,559) | (756,367,850) |
| Net increase (decrease) | 14,812,759 | 22,988,925 | $174,490,035 | $275,230,869 |
| Class K | | | | |
| Shares sold | 85,023,890 | 122,562,514 | $1,034,677,925 | $1,491,197,304 |
| Issued in exchange for the shares of Fidelity Freedom K 2050 Fund | – | 572,849,516 | – | 6,690,882,218 |
| Reinvestment of distributions | 15,746,600 | 17,173,138 | 191,006,262 | 209,512,284 |
| Shares redeemed | (127,274,019) | (96,878,288) | (1,546,685,578) | (1,187,384,579) |
| Net increase (decrease) | (26,503,529) | 615,706,880 | $(321,001,391) | $7,204,207,227 |
| Class K6 | | | | |
| Shares sold | 46,171,269 | 28,136,620 | $568,148,027 | $340,101,592 |
| Reinvestment of distributions | 823,900 | 358,805 | 10,002,143 | 4,377,425 |
| Shares redeemed | (2,658,062) | (1,536,761) | (32,458,367) | (18,895,572) |
| Net increase (decrease) | 44,337,107 | 26,958,664 | $545,691,803 | $325,583,445 |
| Fidelity Freedom 2055 Fund | | | | |
| Fidelity Freedom 2055 Fund | | | | |
| Shares sold | 30,143,474 | 38,370,551 | $412,297,361 | $515,078,307 |
| Reinvestment of distributions | 2,447,312 | 2,987,887 | 33,577,117 | 40,144,179 |
| Shares redeemed | (22,821,438) | (23,349,667) | (314,192,707) | (313,087,284) |
| Net increase (decrease) | 9,769,348 | 18,008,771 | $131,681,771 | $242,135,202 |
| Class K | | | | |
| Shares sold | 46,944,626 | 61,914,305 | $645,358,663 | $850,947,947 |
| Issued in exchange for the shares of Fidelity Freedom K 2055 Fund | – | 187,145,598 | – | 2,460,964,568 |
| Reinvestment of distributions | 5,152,547 | 5,543,037 | 70,641,422 | 76,216,759 |
| Shares redeemed | (47,923,670) | (35,972,762) | (658,081,760) | (496,645,456) |
| Net increase (decrease) | 4,173,503 | 218,630,178 | $57,918,325 | $2,891,483,818 |
| Class K6 | | | | |
| Shares sold | 19,370,629 | 10,467,862 | $269,291,987 | $142,591,736 |
| Reinvestment of distributions | 267,554 | 125,661 | 3,670,845 | 1,727,838 |
| Shares redeemed | (1,203,845) | (701,172) | (16,583,508) | (9,691,523) |
| Net increase (decrease) | 18,434,338 | 9,892,351 | $256,379,324 | $134,628,051 |
| Fidelity Freedom 2060 Fund | | | | |
| Fidelity Freedom 2060 Fund | | | | |
| Shares sold | 9,862,313 | 13,553,573 | $120,757,734 | $162,527,190 |
| Reinvestment of distributions | 460,211 | 472,322 | 5,642,179 | 5,668,501 |
| Shares redeemed | (5,461,471) | (4,749,212) | (67,177,088) | (56,963,732) |
| Net increase (decrease) | 4,861,053 | 9,276,683 | $59,222,825 | $111,231,959 |
| Class K | | | | |
| Shares sold | 19,320,842 | 21,671,635 | $237,336,253 | $266,499,060 |
| Issued in exchange for the shares of Fidelity Freedom K 2060 Fund | – | 30,017,564 | – | 350,605,136 |
| Reinvestment of distributions | 953,157 | 897,950 | 11,676,178 | 10,999,891 |
| Shares redeemed | (12,034,179) | (7,538,541) | (147,707,053) | (92,630,473) |
| Net increase (decrease) | 8,239,820 | 45,048,608 | $101,305,378 | $535,473,614 |
| Class K6 | | | | |
| Shares sold | 4,634,350 | 2,364,906 | $57,544,228 | $28,724,895 |
| Reinvestment of distributions | 51,151 | 24,823 | 627,109 | 304,083 |
| Shares redeemed | (327,504) | (186,212) | (4,033,992) | (2,286,597) |
| Net increase (decrease) | 4,357,997 | 2,203,517 | $54,137,345 | $26,742,381 |
(a) Amounts for Class K and Class K6 are for the period July 20, 2017 and June 7, 2017, respectively, (commencement of sale of shares) to March 31, 2018.
10. Other.
The Funds' organizational documents provide former and current trustees and officers with a limited indemnification against liabilities arising in connection with the performance of their duties to the Funds. In the normal course of business, the Funds may also enter into contracts that provide general indemnifications. The Funds' maximum exposure under these arrangements is unknown as this would be dependent on future claims that may be made against the Funds. The risk of material loss from such claims is considered remote.
The Funds do not invest in the Underlying Funds for the purpose of exercising management or control; however, investments by the Funds within their principal investment strategies may represent a significant portion of the Underlying Fund's net assets. At the end of the period, the following Funds were the owners of record of 10% or more of the total outstanding shares of the Underlying Funds.
| | Fidelity Freedom 2010 Fund | Fidelity Freedom 2015 Fund | Fidelity Freedom 2025 Fund | Fidelity Freedom 2030 Fund | Fidelity Freedom 2035 Fund | Fidelity Freedom 2040 Fund | Fidelity Freedom 2045 Fund |
| Fidelity Series Small Cap Opportunities Fund | – | – | 11% | 16% | 13% | 14% | – |
| Fidelity Series Investment Grade Bond Fund | – | 10% | 21% | 19% | 1% | – | – |
| Fidelity Series All-Sector Equity Fund | – | – | 10% | 15% | 13% | 15% | – |
| Fidelity Series Emerging Markets Opportunities Fund | – | – | 12% | 16% | 13% | 14% | – |
| Fidelity Series Inflation-Protected Bond Index Fund | 10% | 12% | 19% | – | – | – | – |
| Fidelity Series High Income Fund | – | – | 14% | 16% | 11% | 11% | – |
| Fidelity Series Floating Rate High Income Fund | – | – | 14% | 16% | 11% | 11% | – |
| Fidelity Series Real Estate Income Fund | – | – | 14% | 16% | 11% | 11% | – |
| Fidelity Series Commodity Strategy Fund | – | – | 13% | 16% | 11% | 12% | – |
| Fidelity Series International Growth Fund | – | – | 11% | 16% | 13% | 14% | – |
| Fidelity Series International Value Fund | – | – | 11% | 16% | 13% | 14% | – |
| Fidelity Series International Small Cap Fund | – | – | 11% | 16% | 13% | 14% | – |
| Fidelity Series Emerging Markets Debt Fund | – | – | 14% | 16% | 10% | 11% | – |
| Fidelity Series Value Discovery Fund | – | – | 11% | 16% | 13% | 13% | – |
| Fidelity Series Intrinsic Opportunities Fund | – | – | 13% | 18% | 15% | 16% | – |
| Fidelity Series Large Cap Stock Fund | – | – | 11% | 16% | 13% | 14% | – |
| Fidelity Series Opportunistic Insights Fund | – | – | 11% | 16% | 13% | 14% | – |
| Fidelity Series Stock Selector Large Cap Value Fund | – | – | 11% | 16% | 13% | 14% | – |
| Fidelity Series Growth Company Fund | – | – | 12% | 18% | 15% | 16% | 10% |
| Fidelity Series Blue Chip Growth Fund | – | – | 12% | 18% | 15% | 16% | 10% |
| Fidelity Series Large Cap Value Index Fund | – | – | 12% | 18% | 14% | 15% | – |
| Fidelity Series Small Cap Discovery Fund | – | – | 13% | 18% | 15% | 15% | – |
| Fidelity Series Short-Term Credit Fund | – | 11% | 18% | – | – | – | – |
| Fidelity Series Government Money Market Fund | – | 10% | 15% | – | – | – | – |
| Fidelity Series Long-Term Treasury Bond Index Fund | – | – | 14% | 17% | 12% | – | – |
| Fidelity Series International Credit Fund | – | – | 15% | 15% | 10% | 10% | – |
| Fidelity Series Canada Fund | – | – | 12% | 16% | 13% | 14% | – |
| Fidelity Series Emerging Markets Fund | – | – | – | – | – | 15% | – |
The Funds, in aggregate, were the owners of record of more than 20% of the total outstanding shares of the following Underlying Funds.
| Fund | % of shares held |
| Fidelity Series Small Cap Opportunities Fund | 89% |
| Fidelity Series Investment Grade Bond Fund | 91% |
| Fidelity Series All-Sector Equity Fund | 87% |
| Fidelity Series Emerging Markets Opportunities Fund | 90% |
| Fidelity Series Inflation-Protected Bond Index Fund | 83% |
| Fidelity Series High Income Fund | 91% |
| Fidelity Series Floating Rate High Income Fund | 90% |
| Fidelity Series Real Estate Income Fund | 90% |
| Fidelity Series Commodity Strategy Fund | 90% |
| Fidelity Series International Growth Fund | 90% |
| Fidelity Series International Value Fund | 90% |
| Fidelity Series International Small Cap Fund | 90% |
| Fidelity Series Emerging Markets Debt Fund | 90% |
| Fidelity Series Value Discovery Fund | 86% |
| Fidelity Series Intrinsic Opportunities Fund | 99% |
| Fidelity Series Large Cap Stock Fund | 88% |
| Fidelity Series Opportunistic Insights Fund | 87% |
| Fidelity Series Stock Selector Large Cap Value Fund | 89% |
| Fidelity Series Growth Company Fund | 99% |
| Fidelity Series Blue Chip Growth Fund | 99% |
| Fidelity Series Large Cap Value Index Fund | 94% |
| Fidelity Series Small Cap Discovery Fund | 99% |
| Fidelity Series Short-Term Credit Fund | 91% |
| Fidelity Series Government Money Market Fund | 91% |
| Fidelity Series Long-Term Treasury Bond Index Fund | 83% |
| Fidelity Series International Credit Fund | 91% |
| Fidelity Series Canada Fund | 90% |
| Fidelity Series Emerging Markets Fund | 67% |
11. Prior Year Merger Information.
On September 8, 2017, each Surviving Fund acquired all of the assets and assumed all of the liabilities of each Target Fund pursuant to each Agreement and Plan of Reorganization approved by the Board of Trustees ("The Board"). Each acquisition was accomplished by an exchange of Class K shares of each Surviving Fund for corresponding shares then outstanding of each Target Fund, at their respective net asset value on the acquisition date. In addition, the Board approved the creation of additional classes of shares that commenced sale of shares on July 20, 2017. The reorganization provided shareholders of each Target Fund access to a larger portfolio with a similar investment objective and lower expenses. The reorganization qualified as a tax-free reorganization for federal income tax purposes with no gain or loss recognized to the funds or their shareholders.
Combined total net assets after the acquisition are as follows:
| Target Funds | Securities | Unrealized appreciation (depreciation) | Net Assets | Surviving Funds | Net assets | Total net assets after the acquisition |
| Fidelity Freedom K 2005 Fund | $412,419,889 | $40,449,279 | $412,589,249 | Fidelity Freedom 2005 Fund | $610,614,214 | $1,023,203,463 |
| Fidelity Freedom K 2010 Fund | 2,546,556,623 | 329,226,460 | 2,547,535,809 | Fidelity Freedom 2010 Fund | 4,238,458,400 | 6,785,994,209 |
| Fidelity Freedom K 2015 Fund | 4,746,815,623 | 696,286,166 | 4,748,505,056 | Fidelity Freedom 2015 Fund | 5,645,731,933 | 10,394,236,989 |
| Fidelity Freedom K 2020 Fund | 16,278,675,415 | 2,424,773,804 | 16,284,141,352 | Fidelity Freedom 2020 Fund | 13,414,449,646 | 29,698,590,998 |
| Fidelity Freedom K 2025 Fund | 14,636,906,056 | 2,237,270,202 | 14,641,455,337 | Fidelity Freedom 2025 Fund | 11,194,758,422 | 25,836,213,759 |
| Fidelity Freedom K 2030 Fund | 17,209,401,290 | 3,150,938,702 | 17,213,886,716 | Fidelity Freedom 2030 Fund | 12,912,345,253 | 30,126,231,969 |
| Fidelity Freedom K 2035 Fund | 11,858,805,237 | 2,326,083,837 | 11,861,189,816 | Fidelity Freedom 2035 Fund | 8,269,361,979 | 20,130,551,795 |
| Fidelity Freedom K 2040 Fund | 12,430,342,176 | 2,512,607,175 | 12,432,808,583 | Fidelity Freedom 2040 Fund | 8,489,396,048 | 20,922,204,631 |
| Fidelity Freedom K 2045 Fund | 7,904,615,516 | 1,469,965,780 | 7,906,157,717 | Fidelity Freedom 2045 Fund | 4,301,147,363 | 12,207,305,080 |
| Fidelity Freedom K 2050 Fund | 6,689,588,035 | 1,219,930,995 | 6,690,882,218 | Fidelity Freedom 2050 Fund | 3,509,123,170 | 10,200,005,388 |
| Fidelity Freedom K 2055 Fund | 2,460,473,831 | 326,647,894 | 2,460,964,568 | Fidelity Freedom 2055 Fund | 1,221,516,226 | 3,682,480,794 |
| Fidelity Freedom K 2060 Fund | 350,535,702 | 37,076,005 | 350,605,136 | Fidelity Freedom 2060 Fund | 184,982,168 | 535,587,304 |
| Fidelity Freedom K Income Fund | 1,612,974,652 | 111,654,038 | 1,613,678,107 | Fidelity Freedom Income Fund | 2,180,776,091 | 3,794,454,198 |
Pro forma results of operations of the combined entity for the entire period ended March 31, 2018, as though the acquisition had occurred as of the beginning of the year (rather than on the actual acquisition date), are as follows:
| Surviving Funds | Net investment income (loss) | Total net realized gain (loss) | Total change in net unrealized appreciation (depreciation) | Net increase (decrease) in net assets resulting from operations |
| Fidelity Freedom 2005 Fund | $16,728,029 | $35,389,643 | $11,609,337 | $63,727,009 |
| Fidelity Freedom 2010 Fund | 106,763,939 | 333,966,494 | 71,884,105 | 512,614,538 |
| Fidelity Freedom 2015 Fund | 159,942,201 | 586,125,932 | 165,934,516 | 912,002,649 |
| Fidelity Freedom 2020 Fund | 450,417,256 | 1,534,035,495 | 849,346,252 | 2,833,799,003 |
| Fidelity Freedom 2025 Fund | 380,268,141 | 1,245,869,247 | 1,016,040,300 | 2,642,177,688 |
| Fidelity Freedom 2030 Fund | 412,091,376 | 1,721,922,624 | 1,479,580,811 | 3,613,594,811 |
| Fidelity Freedom 2035 Fund | 242,223,907 | 1,155,921,037 | 1,298,580,090 | 2,696,725,034 |
| Fidelity Freedom 2040 Fund | 248,017,447 | 1,233,803,836 | 1,365,296,048 | 2,847,117,331 |
| Fidelity Freedom 2045 Fund | 146,215,610 | 672,902,843 | 832,531,991 | 1,651,650,444 |
| Fidelity Freedom 2050 Fund | 122,703,111 | 561,458,056 | 703,867,025 | 1,388,028,192 |
| Fidelity Freedom 2055 Fund | 45,262,250 | 182,494,227 | 254,156,558 | 481,913,035 |
| Fidelity Freedom 2060 Fund | 7,044,354 | 27,215,638 | 32,045,178 | 66,305,170 |
| Fidelity Freedom Income Fund | 63,379,287 | 104,507,706 | 13,301,658 | 181,188,651 |
Because each combined investment portfolio have been managed as a single portfolio since each acquisition was completed, it is not practicable to separate the amounts of revenue and earnings of each Target Fund that have been included in the Surviving Fund's accompanying Statement of Operations since September 8, 2017.
Shareholder Expense Example
As a shareholder of a Fund, you incur two types of costs: (1) transaction costs and (2) ongoing costs, including other Fund expenses. This Example is intended to help you understand your ongoing costs (in dollars) of investing in the Funds and to compare these costs with the ongoing costs of investing in other mutual funds.
The Example is based on an investment of $1,000 invested at the beginning of the period and held for the entire period (April 1, 2018 to September 30, 2018).
Actual Expenses
The first line of the accompanying table for each Class of each fund provides information about actual account values and actual expenses. You may use the information in this line, together with the amount you invested, to estimate the expenses that you paid over the period. Simply divide your account value by $1,000.00 (for example, an $8,600 account value divided by $1,000.00 = 8.6), then multiply the result by the number in the first line for a Class of the fund under the heading entitled "Expenses Paid During Period" to estimate the expenses you paid on your account during this period. A small balance maintenance fee of $12.00 that is charged once a year may apply for certain accounts with a value of less than $2,000. This fee, which was eliminated effective August 1, 2018, is not included in the table below. If it was, the estimate of expenses you paid during the period would be higher, and your ending account value lower, by this amount. In addition, each Fund, as a shareholder in underlying Fidelity Funds, will indirectly bear its pro-rata share of the fees and expenses incurred by the underlying Fidelity Funds. These fees and expenses are not included in each Fund's annualized expense ratio used to calculate the expense estimates in the table below.
Hypothetical Example for Comparison Purposes
The second line of the accompanying table for each Class of each fund provides information about hypothetical account values and hypothetical expenses based on a Class' actual expense ratio and an assumed rate of return of 5% per year before expenses, which is not the Class' actual return. The hypothetical account values and expenses may not be used to estimate the actual ending account balance or expenses you paid for the period. You may use this information to compare the ongoing costs of investing in the Fund and other funds. To do so, compare this 5% hypothetical example with the 5% hypothetical examples that appear in the shareholder reports of the other funds. A small balance maintenance fee of $12.00 that is charged once a year may apply for certain accounts with a value of less than $2,000. This fee, which was eliminated effective August 1, 2018, is not included in the table below. If it was, the estimate of expenses you paid during the period would be higher, and your ending account value lower, by this amount. In addition, each Fund, as a shareholder in underlying Fidelity Funds, will indirectly bear its pro-rata share of the fees and expenses incurred by the underlying Fidelity Funds. These fees and expenses are not included in each Fund's annualized expense ratio used to calculate the expense estimates in the table below.
Please note that the expenses shown in the table are meant to highlight your ongoing costs only and do not reflect any transaction costs. Therefore, the second line of the table is useful in comparing ongoing costs only, and will not help you determine the relative total costs of owning different funds.
| | Annualized Expense Ratio-A | Beginning
Account Value
April 1, 2018 | Ending
Account Value
September 30, 2018 | Expenses Paid
During Period-B
April 1, 2018
to September 30, 2018 |
| Fidelity Freedom Income Fund | | | | |
| Fidelity Freedom Income Fund | .46% | | | |
| Actual | | $1,000.00 | $1,008.30 | $2.32 |
| Hypothetical-C | | $1,000.00 | $1,022.76 | $2.33 |
| Class K | .41% | | | |
| Actual | | $1,000.00 | $1,007.80 | $2.06 |
| Hypothetical-C | | $1,000.00 | $1,023.01 | $2.08 |
| Class K6 | .37% | | | |
| Actual | | $1,000.00 | $1,008.30 | $1.86 |
| Hypothetical-C | | $1,000.00 | $1,023.21 | $1.88 |
| Fidelity Freedom 2005 Fund | | | | |
| Fidelity Freedom 2005 Fund | .48% | | | |
| Actual | | $1,000.00 | $1,012.80 | $2.42 |
| Hypothetical-C | | $1,000.00 | $1,022.66 | $2.43 |
| Class K | .43% | | | |
| Actual | | $1,000.00 | $1,012.10 | $2.17 |
| Hypothetical-C | | $1,000.00 | $1,022.91 | $2.18 |
| Class K6 | .37% | | | |
| Actual | | $1,000.00 | $1,013.40 | $1.87 |
| Hypothetical-C | | $1,000.00 | $1,023.21 | $1.88 |
| Fidelity Freedom 2010 Fund | | | | |
| Fidelity Freedom 2010 Fund | .52% | | | |
| Actual | | $1,000.00 | $1,017.10 | $2.63 |
| Hypothetical-C | | $1,000.00 | $1,022.46 | $2.64 |
| Class K | .46% | | | |
| Actual | | $1,000.00 | $1,017.20 | $2.33 |
| Hypothetical-C | | $1,000.00 | $1,022.76 | $2.33 |
| Class K6 | .39% | | | |
| Actual | | $1,000.00 | $1,017.20 | $1.97 |
| Hypothetical-C | | $1,000.00 | $1,023.11 | $1.98 |
| Fidelity Freedom 2015 Fund | | | | |
| Fidelity Freedom 2015 Fund | .57% | | | |
| Actual | | $1,000.00 | $1,021.60 | $2.89 |
| Hypothetical-C | | $1,000.00 | $1,022.21 | $2.89 |
| Class K | .50% | | | |
| Actual | | $1,000.00 | $1,021.70 | $2.53 |
| Hypothetical-C | | $1,000.00 | $1,022.56 | $2.54 |
| Class K6 | .41% | | | |
| Actual�� | | $1,000.00 | $1,022.40 | $2.08 |
| Hypothetical-C | | $1,000.00 | $1,023.01 | $2.08 |
| Fidelity Freedom 2020 Fund | | | | |
| Fidelity Freedom 2020 Fund | .61% | | | |
| Actual | | $1,000.00 | $1,025.00 | $3.10 |
| Hypothetical-C | | $1,000.00 | $1,022.01 | $3.09 |
| Class K | .53% | | | |
| Actual | | $1,000.00 | $1,025.70 | $2.69 |
| Hypothetical-C | | $1,000.00 | $1,022.41 | $2.69 |
| Class K6 | .43% | | | |
| Actual | | $1,000.00 | $1,026.40 | $2.18 |
| Hypothetical-C | | $1,000.00 | $1,022.91 | $2.18 |
| Fidelity Freedom 2025 Fund | | | | |
| Fidelity Freedom 2025 Fund | .65% | | | |
| Actual | | $1,000.00 | $1,028.80 | $3.31 |
| Hypothetical-C | | $1,000.00 | $1,021.81 | $3.29 |
| Class K | .57% | | | |
| Actual | | $1,000.00 | $1,028.90 | $2.90 |
| Hypothetical-C | | $1,000.00 | $1,022.21 | $2.89 |
| Class K6 | .45% | | | |
| Actual | | $1,000.00 | $1,029.60 | $2.29 |
| Hypothetical-C | | $1,000.00 | $1,022.81 | $2.28 |
| Fidelity Freedom 2030 Fund | | | | |
| Fidelity Freedom 2030 Fund | .70% | | | |
| Actual | | $1,000.00 | $1,035.20 | $3.57 |
| Hypothetical-C | | $1,000.00 | $1,021.56 | $3.55 |
| Class K | .60% | | | |
| Actual | | $1,000.00 | $1,035.30 | $3.06 |
| Hypothetical-C | | $1,000.00 | $1,022.06 | $3.04 |
| Class K6 | .47% | | | |
| Actual | | $1,000.00 | $1,036.00 | $2.40 |
| Hypothetical-C | | $1,000.00 | $1,022.71 | $2.38 |
| Fidelity Freedom 2035 Fund | | | | |
| Fidelity Freedom 2035 Fund | .74% | | | |
| Actual | | $1,000.00 | $1,042.40 | $3.79 |
| Hypothetical-C | | $1,000.00 | $1,021.36 | $3.75 |
| Class K | .64% | | | |
| Actual | | $1,000.00 | $1,043.20 | $3.28 |
| Hypothetical-C | | $1,000.00 | $1,021.86 | $3.24 |
| Class K6 | .49% | | | |
| Actual | | $1,000.00 | $1,043.80 | $2.51 |
| Hypothetical-C | | $1,000.00 | $1,022.61 | $2.48 |
| Fidelity Freedom 2040 Fund | | | | |
| Fidelity Freedom 2040 Fund | .75% | | | |
| Actual | | $1,000.00 | $1,044.80 | $3.84 |
| Hypothetical-C | | $1,000.00 | $1,021.31 | $3.80 |
| Class K | .64% | | | |
| Actual | | $1,000.00 | $1,045.90 | $3.28 |
| Hypothetical-C | | $1,000.00 | $1,021.86 | $3.24 |
| Class K6 | .49% | | | |
| Actual | | $1,000.00 | $1,046.70 | $2.51 |
| Hypothetical-C | | $1,000.00 | $1,022.61 | $2.48 |
| Fidelity Freedom 2045 Fund | | | | |
| Fidelity Freedom 2045 Fund | .75% | | | |
| Actual | | $1,000.00 | $1,045.30 | $3.85 |
| Hypothetical-C | | $1,000.00 | $1,021.31 | $3.80 |
| Class K | .64% | | | |
| Actual | | $1,000.00 | $1,045.50 | $3.28 |
| Hypothetical-C | | $1,000.00 | $1,021.86 | $3.24 |
| Class K6 | .49% | | | |
| Actual | | $1,000.00 | $1,046.10 | $2.51 |
| Hypothetical-C | | $1,000.00 | $1,022.61 | $2.48 |
| Fidelity Freedom 2050 Fund | | | | |
| Fidelity Freedom 2050 Fund | .75% | | | |
| Actual | | $1,000.00 | $1,044.80 | $3.84 |
| Hypothetical-C | | $1,000.00 | $1,021.31 | $3.80 |
| Class K | .64% | | | |
| Actual | | $1,000.00 | $1,045.70 | $3.28 |
| Hypothetical-C | | $1,000.00 | $1,021.86 | $3.24 |
| Class K6 | .49% | | | |
| Actual | | $1,000.00 | $1,046.50 | $2.51 |
| Hypothetical-C | | $1,000.00 | $1,022.61 | $2.48 |
| Fidelity Freedom 2055 Fund | | | | |
| Fidelity Freedom 2055 Fund | .75% | | | |
| Actual | | $1,000.00 | $1,044.80 | $3.84 |
| Hypothetical-C | | $1,000.00 | $1,021.31 | $3.80 |
| Class K | .64% | | | |
| Actual | | $1,000.00 | $1,045.60 | $3.28 |
| Hypothetical-C | | $1,000.00 | $1,021.86 | $3.24 |
| Class K6 | .49% | | | |
| Actual | | $1,000.00 | $1,046.30 | $2.51 |
| Hypothetical-C | | $1,000.00 | $1,022.61 | $2.48 |
| Fidelity Freedom 2060 Fund | | | | |
| Fidelity Freedom 2060 Fund | .75% | | | |
| Actual | | $1,000.00 | $1,044.90 | $3.84 |
| Hypothetical-C | | $1,000.00 | $1,021.31 | $3.80 |
| Class K | .64% | | | |
| Actual | | $1,000.00 | $1,045.80 | $3.28 |
| Hypothetical-C | | $1,000.00 | $1,021.86 | $3.24 |
| Class K6 | .49% | | | |
| Actual | | $1,000.00 | $1,046.60 | $2.51 |
| Hypothetical-C | | $1,000.00 | $1,022.61 | $2.48 |
A Annualized expense ratio reflects expenses net of applicable fee waivers.
B Expenses are equal to each Class' annualized expense ratio, multiplied by the average account value over the period, multiplied by 183/ 365 (to reflect the one-half year period). The fees and expenses of the underlying Fidelity Funds in which each Fund invests are not included in each Fund's annualized expense ratio.
C 5% return per year before expenses
Board Approval of Investment Advisory Contracts and Management Fees
Fidelity Freedom Funds
Each year, the Board of Trustees, including the Independent Trustees (together, the Board), votes on the renewal of the management contract (the Advisory Contract) with FMR Co., Inc. (FMRC), an affiliate of Fidelity Management & Research Company (FMR), for each fund. The Board, assisted by the advice of fund counsel and Independent Trustees' counsel, requests and considers a broad range of information relevant to the renewal of the Advisory Contracts throughout the year.
The Board meets regularly and, at each of its meetings, covers an extensive agenda of topics and materials and considers factors that are relevant to its annual consideration of the renewal of each fund's Advisory Contract, including the services and support provided to each fund and its shareholders. The Board has established four standing committees (Committees) — Operations, Audit, Fair Valuation, and Governance and Nominating — each composed of and chaired by Independent Trustees with varying backgrounds, to which the Board has assigned specific subject matter responsibilities in order to enhance effective decision-making by the Board. The Operations Committee, of which all of the Independent Trustees are members, meets regularly throughout the year and considers, among other matters, information specifically related to the annual consideration of the renewal of each fund's Advisory Contract. The Board, acting directly and through its Committees, requests and receives information concerning the annual consideration of the renewal of each fund's Advisory Contract. The Board also meets as needed to review matters specifically related to the Board's annual consideration of the renewal of the Advisory Contracts. Members of the Board may also meet with trustees of other Fidelity funds through joint ad hoc committees to discuss certain matters relevant to all of the Fidelity funds.
At its September 2018 meeting, the Board unanimously determined to renew each fund's Advisory Contract. In reaching its determination, the Board considered all factors it believed relevant, including (i) the nature, extent, and quality of the services to be provided to each fund and its shareholders (including the investment performance of each fund); (ii) the competitiveness of each fund's management fee and total expense ratio relative to peer funds; (iii) the total costs of the services to be provided by and the profits to be realized by Fidelity from its relationships with each fund; and (iv) the extent to which, if any, economies of scale exist and would be realized as each fund grows, and whether any economies of scale are appropriately shared with fund shareholders. The Board also considered that, effective June 1, 2017, each fund had implemented a new fee structure whereby it pays an all-inclusive management fee that covers all operating expenses of the fund, subject to certain exceptions, and varies by class (unified fee) and the underlying Fidelity funds in which the fund invests (Series Funds) no longer pay expenses, with certain limited exceptions. In connection with the renewal of the Advisory Contracts for the funds, the Board and the board of other funds that invest their assets in Series Funds and the boards of the Series Funds formed a joint ad hoc committee to review the responsibilities of each board related to the consideration of the renewal of the Advisory Contracts for the funds, other funds that invest substantially all of their assets in Series Funds, and the Series Funds.
In considering whether to renew the Advisory Contract for each fund, the Board reached a determination, with the assistance of fund counsel and Independent Trustees' counsel and through the exercise of its business judgment, that the renewal of the Advisory Contract was in the best interests of each fund and its shareholders and that the compensation payable under the Advisory Contracts was fair and reasonable. The Board's decision to renew the Advisory Contracts was not based on any single factor, but rather was based on a comprehensive consideration of all the information provided to the Board at its meetings throughout the year. The Board, in reaching its determination to renew the Advisory Contracts, was aware that shareholders of each fund have a broad range of investment choices available to them, including a wide choice among funds offered by Fidelity's competitors, and that each fund's shareholders, who have the opportunity to review and weigh the disclosure provided by the fund in its prospectus and other public disclosures, have chosen to invest in that fund, which is part of the Fidelity family of funds.
Nature, Extent, and Quality of Services Provided. The Board considered Fidelity's staffing as it relates to the funds, including the backgrounds of investment personnel of FMRC, and also considered the funds' investment objectives, strategies, and related investment philosophies. The Independent Trustees also had discussions with senior management of Fidelity's investment operations and investment groups with responsibility for the Series Funds. The Board considered the structure of the investment personnel compensation program and whether this structure provides appropriate incentives to act in the best interests of each fund. Additionally, the Board considered the portfolio managers' investments, if any, in the funds that they manage.
Resources Dedicated to Investment Management and Support Services. The Board reviewed the general qualifications and capabilities of Fidelity's investment staff, including its size, education, experience, and resources, as well as Fidelity's approach to recruiting, managing, and compensating investment personnel. The Board noted that Fidelity has continued to increase the resources devoted to non-U.S. offices, including expansion of Fidelity's global investment organization. The Board also noted that Fidelity's analysts have extensive resources, tools and capabilities that allow them to conduct sophisticated quantitative and fundamental analysis, as well as credit analysis of issuers, counterparties and guarantors. Further, the Board considered that Fidelity's investment professionals have sufficient access to global information and data so as to provide competitive investment results over time, and that those professionals also have access to sophisticated tools that permit them to assess portfolio construction and risk and performance attribution characteristics continuously, as well as to transmit new information and research conclusions rapidly around the world. Additionally, in its deliberations, the Board considered Fidelity's risk management, compliance, and technology and operations capabilities and resources, which are integral parts of the investment management process.
Shareholder and Administrative Services. The Board considered (i) the nature, extent, quality, and cost of advisory, administrative, and shareholder services performed by Fidelity under the Advisory Contract and under separate agreements covering transfer agency and pricing and bookkeeping services for each fund; (ii) the nature and extent of the supervision of third party service providers, principally custodians, subcustodians, and pricing vendors; and (iii) the resources devoted to, and the record of compliance with, each fund's compliance policies and procedures.
The Board noted that the growth of fund assets over time across the complex allows Fidelity to reinvest in the development of services designed to enhance the value and convenience of the Fidelity funds as investment vehicles. These services include 24-hour access to account information and market information through telephone representatives and over the Internet, investor education materials and asset allocation tools, and the expanded availability of Fidelity Investor Centers.
Investment in a Large Fund Family. The Board considered the benefits to shareholders of investing in a Fidelity fund, including the benefits of investing in a fund that is part of a large family of funds offering a variety of investment disciplines and providing a large variety of mutual fund investor services. The Board noted that Fidelity had taken, or had made recommendations that resulted in the Fidelity funds taking, a number of actions over the previous year that benefited particular funds, including: (i) continuing to dedicate additional resources to Fidelity's investment research process, which includes meetings with management of issuers of securities in which the funds invest, and to the support of the senior management team that oversees asset management; (ii) continuing efforts to enhance Fidelity's global research capabilities; (iii) launching new funds and making other enhancements to meet client needs; (iv) launching new share classes of existing funds; (v) eliminating purchase minimums and broadening eligibility requirements for certain funds and share classes; (vi) reducing management fees and total expenses for certain growth equity funds and index funds; (vii) lowering expense caps for certain existing funds and classes, and converting certain voluntary expense caps to contractual caps, to reduce expenses borne by shareholders; (viii) eliminating short-term redemption fees for funds that had such fees; (ix) rationalizing product lines and gaining increased efficiencies from fund mergers and share class consolidations; (x) continuing to develop, acquire and implement systems and technology to improve services to the funds and shareholders, strengthen information security, and increase efficiency; and (xi) continuing to implement enhancements to further strengthen Fidelity's product line to increase investors' probability of success in achieving their investment goals, including retirement income goals.
Investment Performance. The Board considered whether each fund has operated in accordance with its investment objective, as well as its record of compliance with its investment restrictions and its performance history.
The Board took into account discussions that occur at Board meetings throughout the year with representatives of the investment adviser about fund investment performance. In this regard the Board noted that as part of regularly scheduled fund reviews and other reports to the Board on fund performance, the Board considers annualized return information for each fund for different time periods, measured against one or more appropriate securities market indices, including a customized blended index that reflects the respective weights of the fund's asset classes (each a "benchmark index") and a peer group of funds with similar objectives ("peer group"), if any. In its evaluation of fund investment performance at meetings throughout the year, the Board gave particular attention to information indicating underperformance of certain Fidelity funds for specific time periods and discussed with the investment adviser the reasons for such underperformance.
In addition to reviewing absolute and relative fund performance, the Independent Trustees periodically consider the appropriateness of fund performance metrics in evaluating the results achieved. In general, the Independent Trustees believe that fund performance should be evaluated based on gross performance (before fees and expenses, including acquired fund fees and expenses, but after transaction costs, if any) compared to appropriate benchmark indices, over appropriate time periods that may include full market cycles, and on net performance (after fees and expenses, including acquired fund fees and expenses, if any) compared to peer groups, as applicable, over the same periods, taking into account relevant factors including the following: general market conditions; the extent to which particular underlying funds affected performance; and fund cash flows and other factors. Depending on the circumstances, the Independent Trustees may be satisfied with a fund's performance notwithstanding that it lags its benchmark index or peer group for certain periods.
The Independent Trustees recognize that shareholders evaluate performance on a net basis over their own holding periods, for which one-, three-, and five-year periods are often used as a proxy. For this reason, the performance information reviewed by the Board also included net cumulative calendar year total return information for each fund and an appropriate benchmark index for the most recent one-, three-, and five-year periods (for the most recent one- and three-year periods for Freedom 2060 Fund).
Based on its review, the Board concluded that the nature, extent, and quality of services provided to each fund under the Advisory Contracts should continue to benefit the shareholders of each fund.
Competitiveness of Management Fee and Total Expense Ratio. The Board considered each fund's management fee and total expense ratio compared to "mapped groups" of competitive funds and classes created for the purpose of facilitating the Trustees' competitive analysis of management fees and total expenses. Fidelity creates "mapped groups" by combining similar Lipper investment objective categories that have comparable investment mandates. Combining Lipper investment objective categories aids the Board's management fee and total expense ratio comparisons by broadening the competitive group used for comparison.
Management Fee. The Board considered two proprietary management fee comparisons for the 12-month periods shown in basis points (BP) in the charts below. The group of Lipper funds used by the Board for management fee comparisons is referred to below as the "Total Mapped Group." The Total Mapped Group comparison focuses on a fund's standing in terms of gross management fees before expense reimbursements or caps relative to the total universe of funds with comparable investment mandates, regardless of whether their management fee structures also are comparable. Funds with comparable investment mandates offer exposure to similar types of securities. Funds with comparable management fee structures have similar management fee contractual arrangements (
e.g., flat rate charged for advisory services, all-inclusive fee rate,
etc.). "TMG %" represents the percentage of funds in the Total Mapped Group that had management fees that were lower than a fund's. For example, a hypothetical TMG % of 20% would mean that 80% of the funds in the Total Mapped Group had higher, and 20% had lower, management fees than a fund. The funds' actual TMG %s and the number of funds in the Total Mapped Group are in the charts below. The "Asset-Size Peer Group" (ASPG) comparison focuses on a fund's standing relative to a subset of non-Fidelity funds within the Total Mapped Group that are similar in size and management fee structure. For example, if a fund is in the first quartile of the ASPG, the fund's management fee ranks in the least expensive or lowest 25% of funds in the ASPG. The ASPG represents at least 15% of the funds in the Total Mapped Group with comparable asset size and management fee structures, subject to a minimum of 50 funds (or all funds in the Total Mapped Group if fewer than 50). Additional information, such as the ASPG quartile in which a fund's management fee rate ranked, is also included in the charts and was considered by the Board. The Board considered that the charts below reflect the funds' fee structure effective June 1, 2017, as if it was in effect for the entire year.
Fidelity Freedom 2005 Fund

Fidelity Freedom 2010 Fund
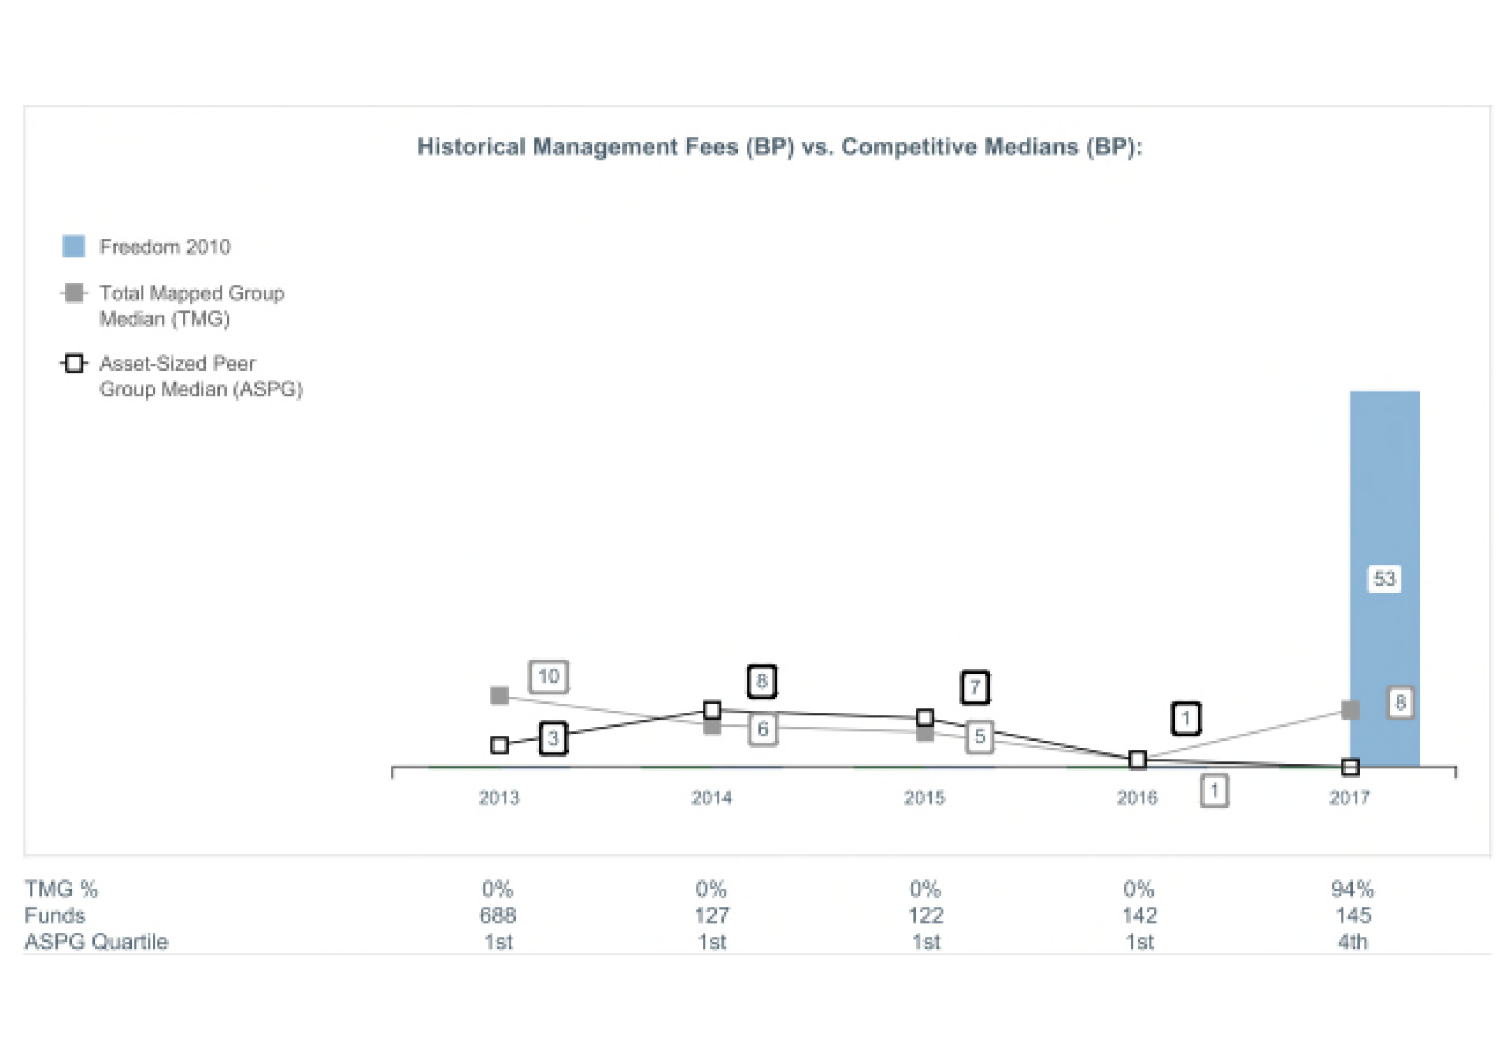
Fidelity Freedom 2015 Fund
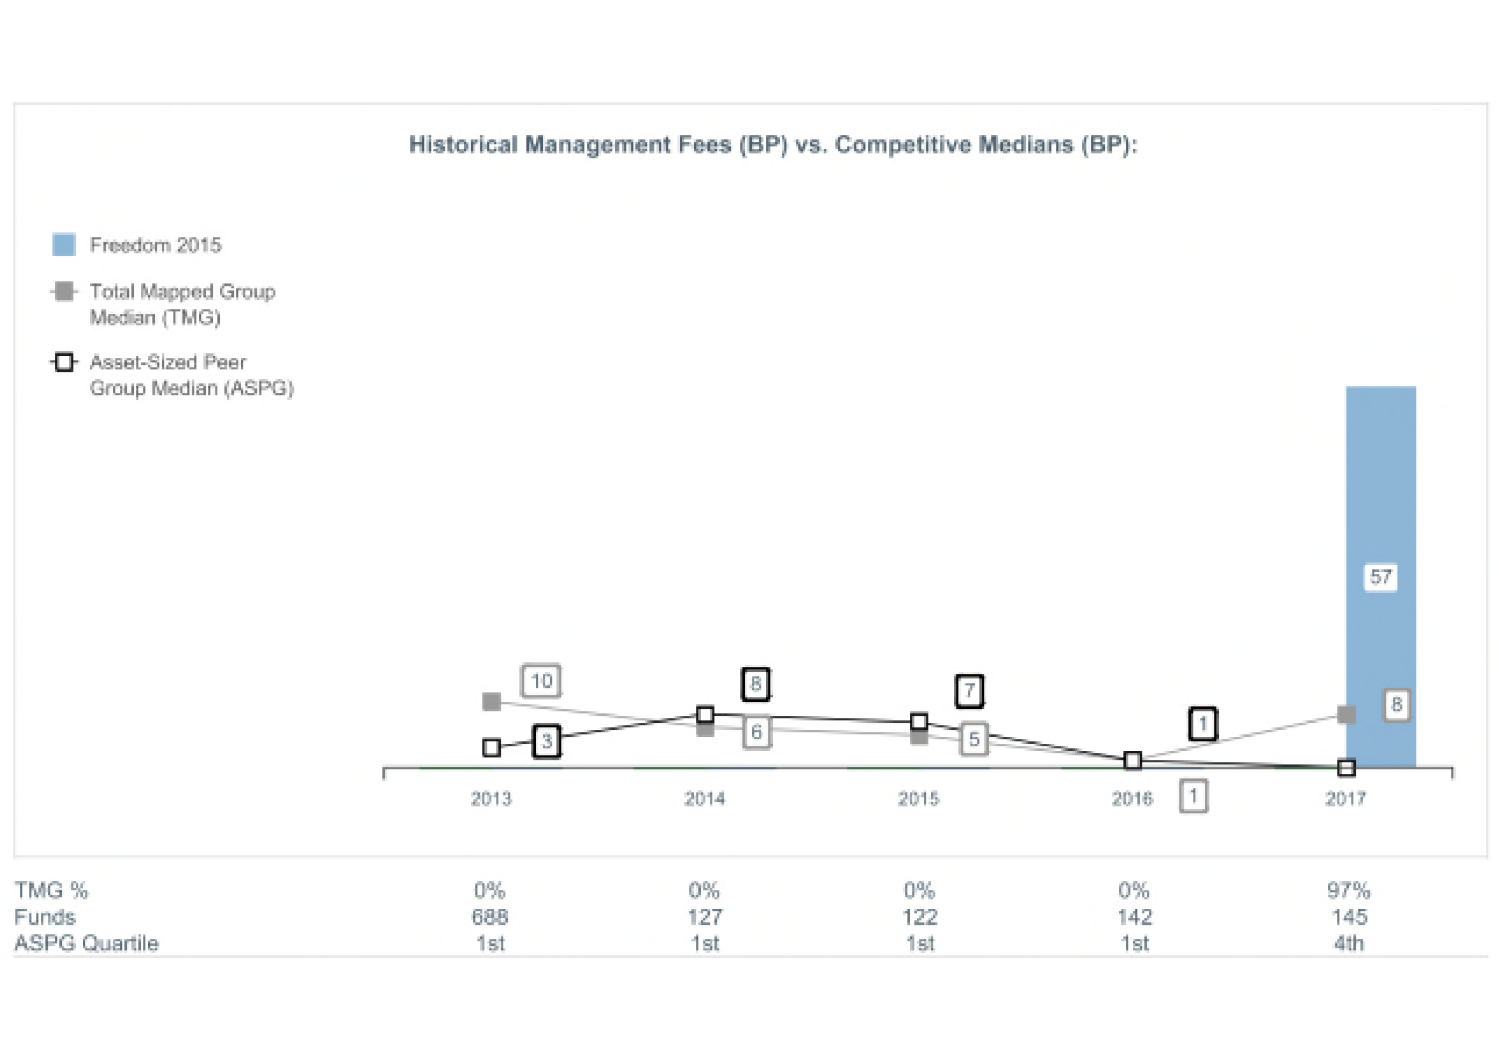
Fidelity Freedom 2020 Fund
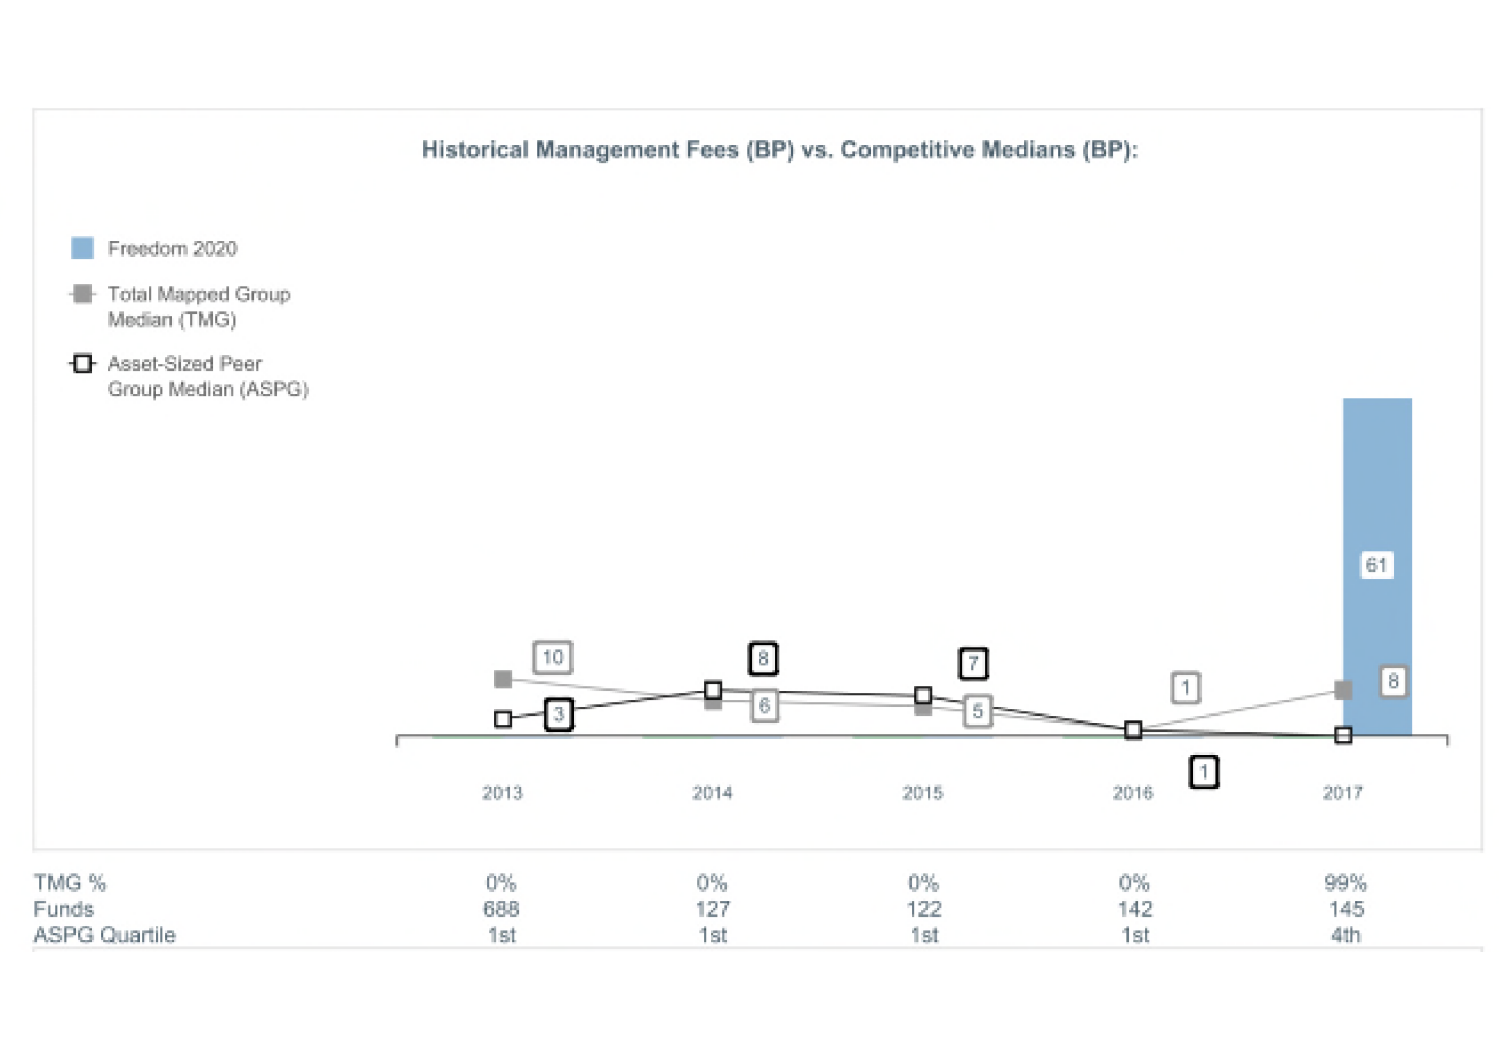
Fidelity Freedom 2025 Fund
Fidelity Freedom 2030 Fund
Fidelity Freedom 2035 Fund
Fidelity Freedom 2040 Fund
Fidelity Freedom 2045 Fund
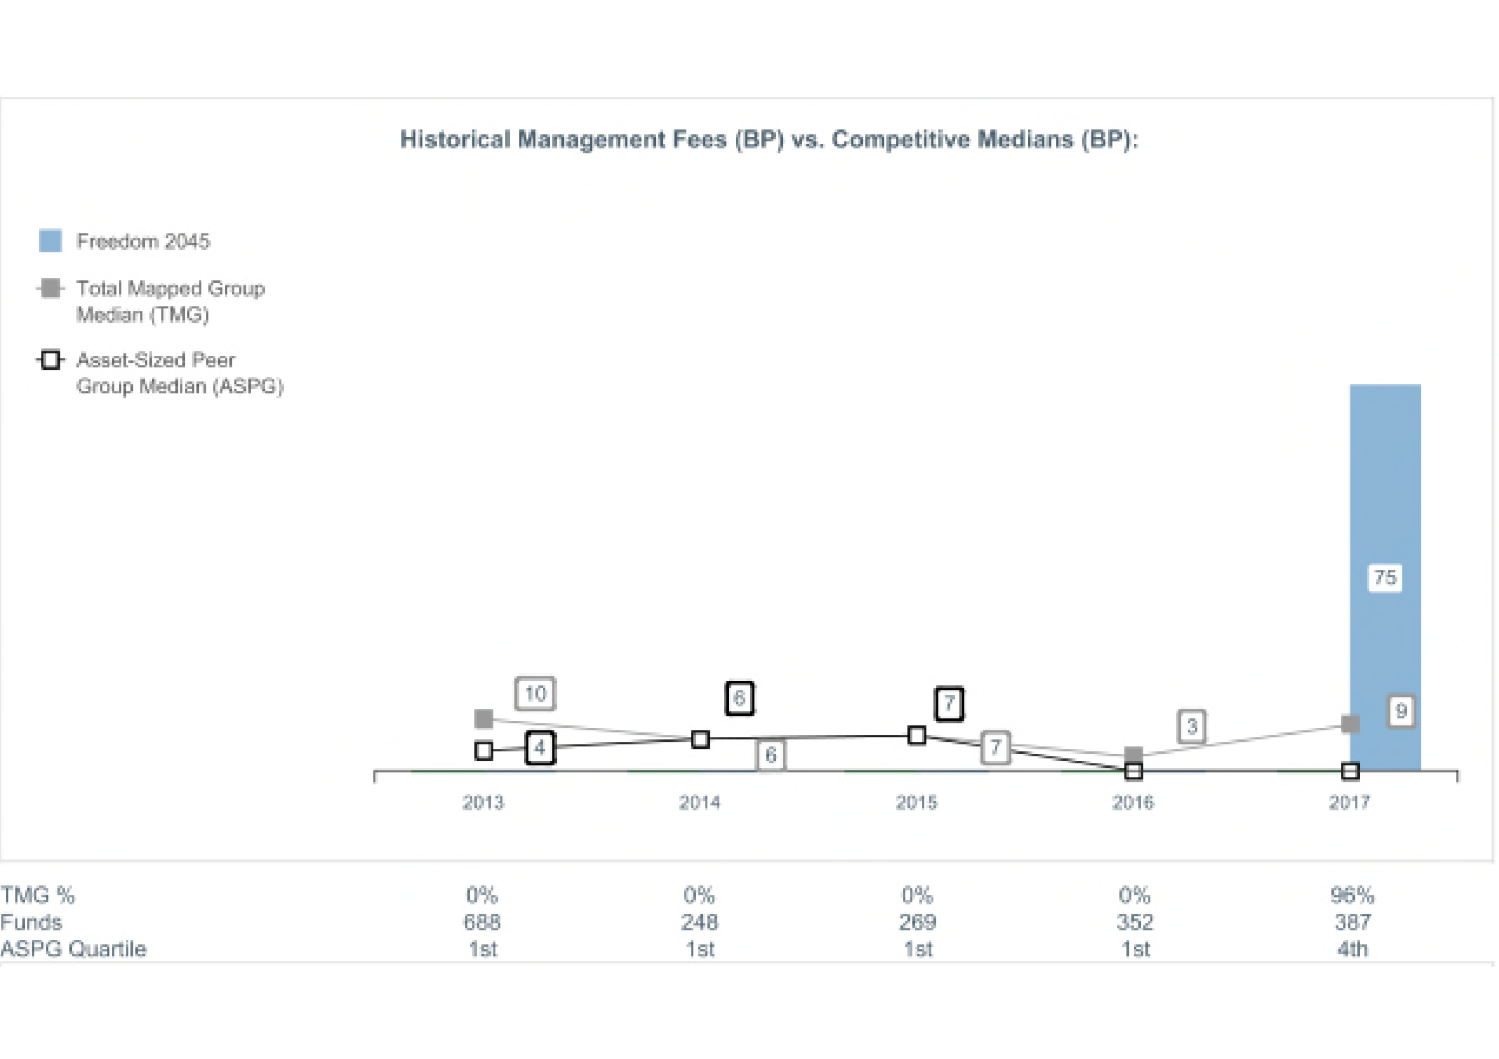
Fidelity Freedom 2050 Fund
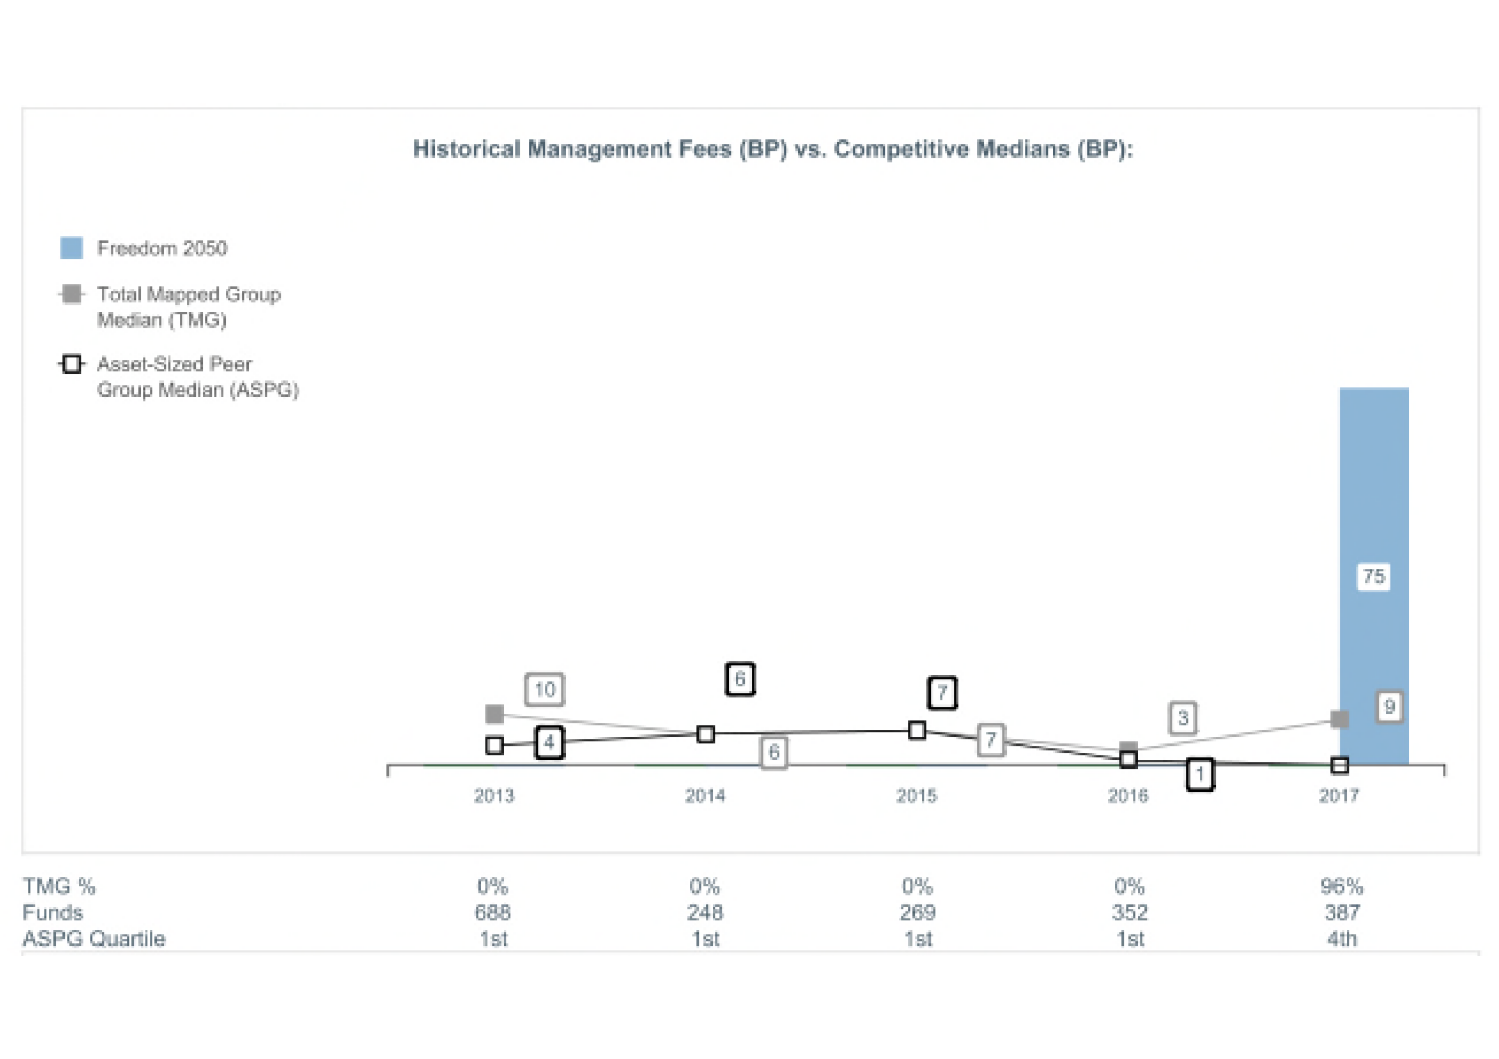
Fidelity Freedom 2055 Fund
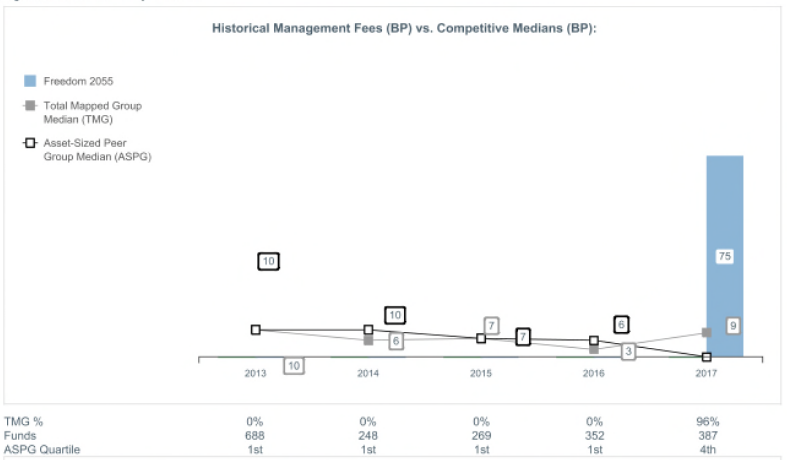
Fidelity Freedom 2060 Fund
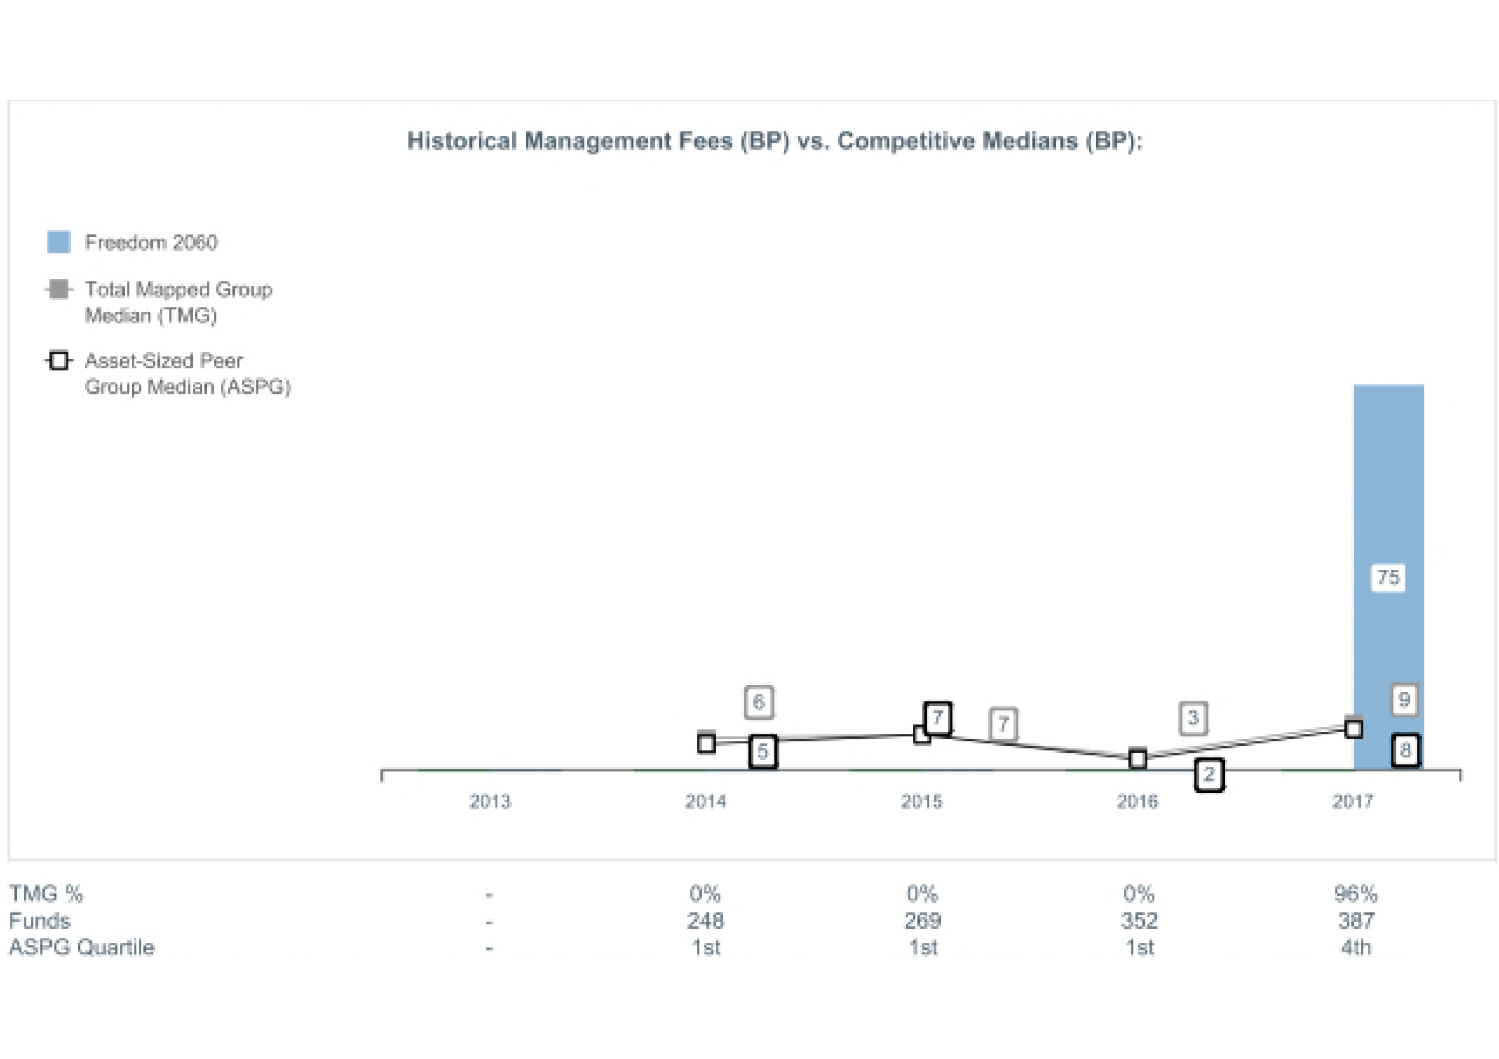
Fidelity Freedom Income Fund
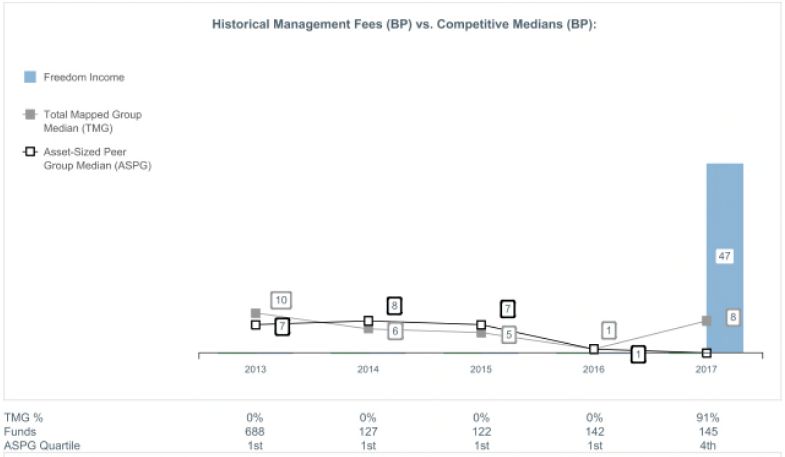
The Board compared each fund's class-level management fee rate for the current fiscal year relative to the median of its competitor funds in the applicable Total Mapped Group based on competitive data for 2017. The Board noted that each fund's class-level management fee rate ranks above the median of its competitor funds in the applicable Total Mapped Group based on competitive data for 2017. The Board noted that the majority of peer funds do not have top-level management fees, similar to the funds' fee structure prior to June 1, 2017. The Board also noted that the funds' total expense comparisons, which include the expenses of the Series Funds, facilitate better comparisons with funds and classes that use different expense structures and that the funds' total expense ratio comparisons to competitors generally were more favorable.
Based on its review, the Board concluded that each fund's management fee is fair and reasonable in light of the services that the fund receives and the other factors considered.
Total Expense Ratio. In its review of the total expense ratio of each class of each fund, the Board considered the fund's class-level management fee rate under the Advisory Contract. The Board also considered other expenses, such as transfer agent fees, pricing and bookkeeping fees, and custodial, legal, and audit fees, paid by FMR under the unified fee arrangement. The Board also noted that Fidelity may agree to waive fees and expenses from time to time, and the extent to which, if any, it has done so for each fund. As part of its review, the Board considered the total expense ratio of each class of each fund compared to the median total expenses for competitor funds (including expenses of underlying funds) based on competitive data for 2017. Each class of each fund is compared to those funds and classes in the Total Mapped Group (used by the Board for management fee comparisons) that have a similar sales load structure.
The Board noted that each fund offers multiple classes and that the multiple structures are intended to offer pricing options for the intermediary market. The Board also noted that the total expense ratios of the classes of each fund vary primarily due to differences in transfer agent fees. The Board considered that, in general, various factors can affect total expense ratios.
The Board noted that the total expense ratio of the retail class (including expenses of the Series Funds): (i) ranked below the competitive median for 2017 for Freedom 2005 Fund, Freedom 2010 Fund, Freedom 2015 Fund, Freedom 2025 Fund, Freedom 2030 Fund, Freedom 2035 Fund, and Freedom Income Fund; (ii) ranked equal to the competitive median for 2017 for Freedom 2040 Fund, Freedom 2045 Fund, Freedom 2050 Fund, Freedom 2055 Fund, and Freedom 2060 Fund; and (iii) ranked above the competitive median for 2017 for Freedom 2020 Fund. The Board noted that for Freedom 2020 Fund, the total expense ratio of the retail class is above the competitive median because a number of competitor target date funds are classified by Lipper as active, even though their underlying holdings are primarily passive. The Board considered that, when the Total Mapped Group is adjusted to remove funds that invest primarily in passive products, the total expense ratio of the retail class of Freedom 2020 Fund ranks below the competitive median.
The Board noted that the total expense ratio of each of Class K and Class K6 (including expenses of the Series Funds) for each fund ranked below the competitive median for 2017.
The Board considered that current contractual arrangements for the fund oblige FMR to pay all "class-level" expenses of Class K6 of each fund to the extent necessary to limit total operating expenses, with certain exceptions, to an amount specified in the applicable expense contract.
These contractual arrangements may not be amended to increase the fees or expenses payable by Class K6 of a fund except by a vote of a majority of the Board of Trustees and by a vote of a majority of the outstanding voting securities of Class K6 of the applicable fund.
Fees Charged to Other Fidelity Clients. The Board also considered Fidelity fee structures and other information with respect to clients of Fidelity, such as other funds advised or subadvised by Fidelity, pension plan clients, and other institutional clients with similar mandates. The Board noted that a joint ad hoc committee created by it and the boards of other Fidelity funds periodically reviews and compares Fidelity's institutional investment advisory business with its business of providing services to the Fidelity funds and also noted the most recent findings of the committee. The Board noted that the committee's review included a consideration of the differences in services provided, fees charged, and costs incurred, as well as competition in the markets serving the different categories of clients.
Based on its review of total expense ratios and fees charged to other Fidelity clients, the Board concluded that the total expense ratio of each class of each fund was reasonable in light of the services that the fund and its shareholders receive and the other factors considered.
Costs of the Services and Profitability. The Board considered the revenues earned and the expenses incurred by Fidelity in conducting the business of developing, marketing, distributing, managing, administering and servicing each fund and the Series Funds in which each fund invests and in servicing each fund's shareholders. The Board also considered the level of Fidelity's profits in respect of all the Fidelity funds.
On an annual basis, Fidelity presents to the Board information about the profitability of its relationships with each fund. Fidelity calculates profitability information for each fund, as well as aggregate profitability information for groups of Fidelity funds and all Fidelity funds, using a series of detailed revenue and cost allocation methodologies which originate with the books and records of Fidelity on which Fidelity's audited financial statements are based. The Audit Committee of the Board reviews any significant changes from the prior year's methodologies.
PricewaterhouseCoopers LLP (PwC), auditor to Fidelity and certain Fidelity funds, has been engaged annually by the Board as part of the Board's assessment of Fidelity's profitability analysis. PwC's engagement includes the review and assessment of the methodologies used by Fidelity in determining the revenues and expenses attributable to Fidelity's mutual fund business, and completion of agreed-upon procedures in respect of the mathematical accuracy of the fund profitability information and its conformity to established allocation methodologies. After considering PwC's reports issued under the engagement and information provided by Fidelity, the Board concluded that while other allocation methods may also be reasonable, Fidelity's profitability methodologies are reasonable in all material respects.
The Board also reviewed Fidelity's non-fund businesses and potential indirect benefits such businesses may have received as a result of their association with Fidelity's mutual fund business (i.e., fall-out benefits) as well as cases where Fidelity's affiliates may benefit from the funds' business. The Board noted that changes to fall-out benefits year-over-year reflect business developments at Fidelity's various businesses.
The Board considered the costs of the services provided by and the profits realized by Fidelity in connection with the operation of each fund and was satisfied that the profitability was not excessive.
Economies of Scale. The Board considered whether there have been economies of scale in respect of the management of the Fidelity funds, whether the Fidelity funds (including each fund) have appropriately benefited from any such economies of scale, and whether there is potential for realization of any further economies of scale. The Board considered the extent to which each fund will benefit from economies of scale as assets grow through increased services to the fund, through waivers or reimbursements, or through fee or expense ratio reductions. The Board recognized that, due to each fund's current contractual arrangements, its expense ratio will not decline if the fund's operating costs decrease as assets grow, or rise as assets decrease. The Board also noted that a committee (the Economies of Scale Committee) created by it and the boards of other Fidelity funds periodically analyzes whether Fidelity attains economies of scale in respect of the management and servicing of the Fidelity funds, whether the Fidelity funds have appropriately benefited from such economies of scale, and whether there is potential for realization of any further economies of scale.
The Board concluded, taking into account the analysis of the Economies of Scale Committee, that economies of scale, if any, are being appropriately shared between fund shareholders and Fidelity.
Additional Information Requested by the Board. In order to develop fully the factual basis for consideration of the Fidelity funds' advisory contracts, the Board requested and received additional information on certain topics, including: (i) Fidelity's fund profitability methodology, profitability trends for certain funds, the allocation of various costs to different funds, and the impact of certain factors on fund profitability results; (ii) portfolio manager changes that have occurred during the past year and the amount of the investment that each portfolio manager has made in the Fidelity fund(s) that he or she manages; (iii) Fidelity's compensation structure for portfolio managers, research analysts, and other key personnel, including its effects on fund profitability, the rationale for the compensation structure, and the extent to which current market conditions have affected retention and recruitment; (iv) the arrangements with and compensation paid to certain fund sub-advisers on behalf of the Fidelity funds and the treatment of such compensation within Fidelity's fund profitability methodology; (v) the terms of Fidelity's voluntary expense limitation agreements; (vi) the methodology with respect to competitive fund data and peer group classifications; (vii) Fidelity's transfer agent fee, expense, and service structures for different funds and classes relative to competitive trends, and the impact of the increased use of omnibus accounts; (viii) new developments in the retail and institutional marketplaces and the competitive positioning of the funds relative to other investment products and services; (ix) the impact of recent changes to the money market fund landscape, including the full implementation of money market fund reform and rising interest rates, on Fidelity's money market funds; (x) the funds' share class structures and distribution channels; and (xi) explanations regarding the relative total expense ratios of certain funds and classes, total expense competitive trends and methodologies for total expense competitive comparisons, and actions that might be taken by Fidelity to reduce total expense ratios for certain classes. In addition, the Board considered its discussions with Fidelity throughout the year regarding enhanced information security initiatives and the funds' fair valuation policies.
Based on its evaluation of all of the conclusions noted above, and after considering all factors it believed relevant, the Board concluded that the advisory fee arrangements are fair and reasonable, and that each fund's Advisory Contract should be renewed.
FF-SANN-1118
1.537284.121
Fidelity Advisor Freedom® Funds - Income, 2005, 2010, 2015, 2020, 2025, 2030, 2035, 2040, 2045, 2050, 2055, 2060 - Class A, Class M, Class C and Class I
Semi-Annual Report September 30, 2018 |
|
Contents
To view a fund's proxy voting guidelines and proxy voting record for the 12-month period ended June 30, visit http://www.fidelity.com/proxyvotingresults or visit the Securities and Exchange Commission's (SEC) web site at http://www.sec.gov.
You may also call 1-877-208-0098 to request a free copy of the proxy voting guidelines.
Standard & Poor's, S&P and S&P 500 are registered service marks of The McGraw-Hill Companies, Inc. and have been licensed for use by Fidelity Distributors Corporation.
Other third-party marks appearing herein are the property of their respective owners.
All other marks appearing herein are registered or unregistered trademarks or service marks of FMR LLC or an affiliated company. © 2018 FMR LLC. All rights reserved.
This report and the financial statements contained herein are submitted for the general information of the shareholders of the Funds. This report is not authorized for distribution to prospective investors in the Funds unless preceded or accompanied by an effective prospectus.
A fund files its complete schedule of portfolio holdings with the SEC for the first and third quarters of each fiscal year on Form N-Q. Forms N-Q are available on the SEC’s web site at http://www.sec.gov. A fund's Forms N-Q may be reviewed and copied at the SEC’s Public Reference Room in Washington, DC. Information regarding the operation of the SEC's Public Reference Room may be obtained by calling 1-800-SEC-0330.
For a complete list of a fund's portfolio holdings, view the most recent holdings listing, semiannual report, or annual report on Fidelity's web site at http://www.fidelity.com, http://www.institutional.fidelity.com, or http://www.401k.com, as applicable.
NOT FDIC INSURED •MAY LOSE VALUE •NO BANK GUARANTEE
Neither the Funds nor Fidelity Distributors Corporation is a bank.
Note to shareholders:
At its May 2018 meeting, the Board of Trustees approved incremental updates to the strategic asset allocation (i.e., glide path) of Fidelity Advisor Freedom Funds, adding U.S. Treasury Inflation-Protected Securities and long-term U.S. Treasury bonds as fixed exposures in the Funds’ bond allocations, and slightly reducing the equity and short-term debt allocations for shorter-dated Funds. These updates are expected to be fully implemented by the end of 2018.
Fidelity Advisor Freedom® Income Fund
Investment Summary (Unaudited)
The information in the following tables is based on the direct investments of the Fund.
Top Holdings as of September 30, 2018
| | % of fund's net assets |
| Fidelity Series Investment Grade Bond Fund | 37.0 |
| Fidelity Series Government Money Market Fund 2.12% | 18.5 |
| Fidelity Series Inflation-Protected Bond Index Fund | 12.8 |
| Fidelity Series Short-Term Credit Fund | 4.7 |
| Fidelity Series Long-Term Treasury Bond Index Fund | 4.4 |
| Fidelity Series Emerging Markets Opportunities Fund | 2.7 |
| Fidelity Series International Growth Fund | 2.2 |
| Fidelity Series International Value Fund | 2.2 |
| Fidelity Series Commodity Strategy Fund | 2.0 |
| Fidelity Series Large Cap Stock Fund | 2.0 |
| | 88.5 |
Asset Allocation (% of fund's net assets)
| Period end |
| | Domestic Equity Funds | 11.3% |
| | International Equity Funds | 8.2% |
| | Bond Funds | 57.1% |
| | Short-Term Funds | 23.3% |
| | Short-Term Investments | 0.1% |

Domestic Equity Funds category includes Fidelity Series Commodity Strategy Fund which invests in commodity-related investments.
Fidelity Advisor Freedom® Income Fund
Schedule of Investments September 30, 2018 (Unaudited)
Showing Percentage of Net Assets
| U.S. Treasury Obligations - 0.1% | | | |
| | | Principal Amount | Value |
| U.S. Treasury Bills, yield at date of purchase 1.97% to 2.09% 11/1/18 to 11/29/18 (a) | | | |
| (Cost $139,597) | | 140,000 | 139,587 |
| | | Shares | Value |
|
| Domestic Equity Funds - 11.3% | | | |
| Fidelity Advisor Series Equity Growth Fund (b) | | 165,767 | $2,562,760 |
| Fidelity Advisor Series Growth Opportunities Fund (b) | | 102,497 | 1,705,553 |
| Fidelity Advisor Series Small Cap Fund (b) | | 95,773 | 1,203,867 |
| Fidelity Series All-Sector Equity Fund (b) | | 76,141 | 1,036,276 |
| Fidelity Series Commodity Strategy Fund (b) | | 913,217 | 4,566,084 |
| Fidelity Series Large Cap Stock Fund (b) | | 279,220 | 4,447,967 |
| Fidelity Series Large Cap Value Index Fund (b) | | 36,247 | 478,461 |
| Fidelity Series Opportunistic Insights Fund (b) | | 119,930 | 2,380,602 |
| Fidelity Series Small Cap Opportunities Fund (b) | | 103,334 | 1,517,971 |
| Fidelity Series Stock Selector Large Cap Value Fund (b) | | 217,146 | 2,870,664 |
| Fidelity Series Value Discovery Fund (b) | | 206,877 | 2,832,143 |
| TOTAL DOMESTIC EQUITY FUNDS | | | |
| (Cost $19,783,979) | | | 25,602,348 |
|
| International Equity Funds - 8.2% | | | |
| Fidelity Series Canada Fund (b) | | 44,194 | 477,736 |
| Fidelity Series Emerging Markets Fund (b) | | 81,074 | 785,606 |
| Fidelity Series Emerging Markets Opportunities Fund (b) | | 319,827 | 6,137,471 |
| Fidelity Series International Growth Fund (b) | | 309,625 | 5,077,853 |
| Fidelity Series International Small Cap Fund (b) | | 64,191 | 1,149,021 |
| Fidelity Series International Value Fund (b) | | 479,684 | 5,046,280 |
| TOTAL INTERNATIONAL EQUITY FUNDS | | | |
| (Cost $13,718,992) | | | 18,673,967 |
|
| Bond Funds - 57.1% | | | |
| Fidelity Series Emerging Markets Debt Fund (b) | | 177,507 | 1,691,644 |
| Fidelity Series Floating Rate High Income Fund (b) | | 60,206 | 573,160 |
| Fidelity Series High Income Fund (b) | | 313,609 | 3,013,780 |
| Fidelity Series Inflation-Protected Bond Index Fund (b) | | 2,997,990 | 29,110,482 |
| Fidelity Series International Credit Fund (b) | | 11,350 | 111,566 |
| Fidelity Series Investment Grade Bond Fund (b) | | 7,704,272 | 83,899,517 |
| Fidelity Series Long-Term Treasury Bond Index Fund (b) | | 1,219,899 | 10,051,966 |
| Fidelity Series Real Estate Income Fund (b) | | 102,467 | 1,104,594 |
| TOTAL BOND FUNDS | | | |
| (Cost $130,353,290) | | | 129,556,709 |
|
| Short-Term Funds - 23.3% | | | |
| Fidelity Cash Central Fund, 2.11% (c) | | 271,895 | 271,950 |
| Fidelity Series Government Money Market Fund 2.12% (b)(d) | | 41,955,747 | 41,955,747 |
| Fidelity Series Short-Term Credit Fund (b) | | 1,084,441 | 10,692,591 |
| TOTAL SHORT-TERM FUNDS | | | |
| (Cost $53,008,512) | | | 52,920,288 |
| TOTAL INVESTMENT IN SECURITIES - 100.0% | | | |
| (Cost $217,004,370) | | | 226,892,899 |
| NET OTHER ASSETS (LIABILITIES) - 0.0% | | | (110,233) |
| NET ASSETS - 100% | | | $226,782,666 |
| Futures Contracts | | | | | |
| | Number of contracts | Expiration Date | Notional Amount | Value | Unrealized Appreciation/(Depreciation) |
| Purchased | | | | | |
| Equity Index Contracts | | | | | |
| ICE E-mini MSCI EAFE Index Contracts (United States) | 4 | Dec. 2018 | $395,100 | $378 | $378 |
| ICE E-mini MSCI Emerging Markets Index Contracts (United States) | 19 | Dec. 2018 | 997,215 | 19,053 | 19,053 |
| | | | | | 19,431 |
| Sold | | | | | |
| Equity Index Contracts | | | | | |
| CME E-mini S&P 500 Index Contracts (United States) | 6 | Dec. 2018 | 875,700 | (232) | (232) |
| TOTAL FUTURES CONTRACTS | | | | | $19,199 |
The notional amount of futures purchased as a percentage of Net Assets is 0.6%
The notional amount of futures sold as a percentage of Net Assets is 0.4%
Legend
(a) Security or a portion of the security was pledged to cover margin requirements for futures contracts. At period end, the value of securities pledged amounted to $119,656.
(b) Affiliated Fund
(c) Affiliated fund that is generally available only to investment companies and other accounts managed by Fidelity Investments. The rate quoted is the annualized seven-day yield of the fund at period end. A complete unaudited listing of the fund's holdings as of its most recent quarter end is available upon request. In addition, each Fidelity Central Fund's financial statements are available on the SEC's website or upon request.
(d) The rate quoted is the annualized seven-day yield of the fund at period end.
Affiliated Central Funds
Information regarding fiscal year to date income earned by the Fund from investments in Fidelity Central Funds is as follows:
| Fund | Income earned |
| Fidelity Cash Central Fund | $1,148 |
| Total | $1,148 |
Amounts in the income column in the above table include any capital gain distributions from underlying funds, which are presented in the corresponding line-item in the Statement of Operations if applicable.
Affiliated Underlying Funds
Fiscal year to date information regarding the Fund's investments in affiliated Underlying Funds, excluding any Money Market Central Funds, is presented below. Exchanges between classes of the same affiliated Underlying Funds may occur.
| Affiliate | Value, beginning of period | Purchases | Sales Proceeds | Dividend Income | Realized Gain (loss) | Change in Unrealized appreciation (depreciation) | Value, end of period |
| Fidelity Advisor Series Equity Growth Fund | $2,986,272 | $404,065 | $1,243,424 | $ - | $221,129 | $194,718 | $2,562,760 |
| Fidelity Advisor Series Equity Value Fund | 3,441,952 | 554,341 | 1,263,738 | 91,665 | 155,363 | (651,254) | - |
| Fidelity Advisor Series Growth & Income Fund | 5,267,197 | 1,126,410 | 2,094,596 | 408,911 | 147,730 | (1,111,601) | - |
| Fidelity Advisor Series Growth Opportunities Fund | 1,963,092 | 267,804 | 1,013,805 | - | 264,099 | 224,363 | 1,705,553 |
| Fidelity Advisor Series Opportunistic Insights Fund | 2,809,288 | 550,119 | 1,177,658 | 174,096 | 310,239 | (1,149,788) | - |
| Fidelity Advisor Series Small Cap Fund | 1,497,643 | 198,788 | 582,975 | - | 73,075 | 17,336 | 1,203,867 |
| Fidelity Advisor Series Stock Selector Large Cap Value Fund | 3,474,257 | 698,024 | 1,284,824 | 232,137 | 163,270 | (660,926) | - |
| Fidelity Series 100 Index Fund | 1,480,375 | - | 1,552,285 | - | 970,147 | (898,237) | - |
| Fidelity Series All-Sector Equity Fund | 2,050,720 | 273,716 | 1,507,380 | - | 341,462 | (122,242) | 1,036,276 |
| Fidelity Series Canada Fund | 536,118 | 70,669 | 162,912 | - | 2,657 | 31,204 | 477,736 |
| Fidelity Series Commodity Strategy Fund | 4,537,656 | 1,195,010 | 793,076 | 274,339 | (216,245) | (157,261) | 4,566,084 |
| Fidelity Series Emerging Markets Debt Fund | 1,670,287 | 217,522 | 103,012 | 50,757 | (2,133) | (91,020) | 1,691,644 |
| Fidelity Series Emerging Markets Fund | - | 787,669 | - | - | - | (2,063) | 785,606 |
| Fidelity Series Emerging Markets Opportunities Fund | 6,576,903 | 944,745 | 542,730 | - | (12,516) | (828,931) | 6,137,471 |
| Fidelity Series Floating Rate High Income Fund | 531,740 | 83,617 | 42,926 | 14,898 | (28) | 757 | 573,160 |
| Fidelity Series Government Money Market Fund 2.12% | 49,380,363 | 9,928,070 | 17,352,686 | 457,077 | - | - | 41,955,747 |
| Fidelity Series High Income Fund | 3,122,185 | 448,693 | 584,008 | 87,348 | (17,625) | 44,535 | 3,013,780 |
| Fidelity Series Inflation-Protected Bond Index Fund | 8,056,431 | 22,154,849 | 1,002,523 | 27,690 | (4,949) | (93,326) | 29,110,482 |
| Fidelity Series International Credit Fund | 111,314 | 1,372 | - | 1,372 | - | (1,120) | 111,566 |
| Fidelity Series International Growth Fund | 5,569,432 | 1,027,847 | 1,593,116 | - | 226,534 | (152,844) | 5,077,853 |
| Fidelity Series International Small Cap Fund | 1,385,201 | 200,768 | 383,353 | - | 36,940 | (90,535) | 1,149,021 |
| Fidelity Series International Value Fund | 5,462,228 | 898,069 | 1,273,777 | - | 43,620 | (83,860) | 5,046,280 |
| Fidelity Series Investment Grade Bond Fund | 81,183,581 | 11,575,978 | 7,892,375 | 1,194,751 | (19,148) | (948,519) | 83,899,517 |
| Fidelity Series Large Cap Stock Fund | - | 2,067 | 14,093 | - | (129) | 1,124,982 | 4,447,967 |
| Fidelity Series Large Cap Value Index Fund | 585,207 | 77,945 | 224,470 | - | 32,616 | 7,163 | 478,461 |
| Fidelity Series Long-Term Treasury Bond Index Fund | 4,509,835 | 7,231,307 | 1,370,904 | 85,312 | (44,834) | (273,438) | 10,051,966 |
| Fidelity Series Opportunistic Insights Fund | - | 1,142 | 7,550 | - | (9) | 1,044,819 | 2,380,602 |
| Fidelity Series Real Estate Equity Fund | 358,281 | 5,202 | 378,004 | 4,736 | 63,966 | (49,445) | - |
| Fidelity Series Real Estate Income Fund | 1,049,918 | 174,933 | 125,561 | 46,150 | (430) | 5,734 | 1,104,594 |
| Fidelity Series Short-Term Credit Fund | 12,143,757 | 1,793,460 | 3,245,178 | 142,729 | (22,892) | 23,444 | 10,692,591 |
| Fidelity Series Small Cap Opportunities Fund | 1,815,589 | 361,462 | 756,318 | 117,711 | 242,995 | (145,757) | 1,517,971 |
| Fidelity Series Stock Selector Large Cap Value Fund | - | 2,693 | 13,909 | - | (156) | 492,235 | 2,870,664 |
| Fidelity Series Value Discovery Fund | - | 1,335 | 9,060 | - | (88) | 603,292 | 2,832,143 |
| | $213,556,822 | $63,259,691 | $49,592,226 | $3,411,679 | $2,954,660 | $(3,697,585) | $226,481,362 |
Amounts in the income column in the above table include any capital gain distributions from underlying funds, which are presented in the corresponding line-item in the Statement of Operations if applicable.
Investment Valuation
The following is a summary of the inputs used, as of September 30, 2018, involving the Fund's assets and liabilities carried at fair value. The inputs or methodology used for valuing securities may not be an indication of the risk associated with investing in those securities. For more information on valuation inputs, and their aggregation into the levels used below, please refer to the Investment Valuation section in the accompanying Notes to Financial Statements.
| | Valuation Inputs at Reporting Date: |
| Description | Total | Level 1 | Level 2 | Level 3 |
| Investments in Securities: | | | | |
| Other Short-Term Investments | $139,587 | $-- | $139,587 | $-- |
| Domestic Equity Funds | 25,602,348 | 25,602,348 | -- | -- |
| International Equity Funds | 18,673,967 | 18,673,967 | -- | -- |
| Bond Funds | 129,556,709 | 129,556,709 | -- | -- |
| Short-Term Funds | 52,920,288 | 52,920,288 | -- | -- |
| Total Investments in Securities: | $226,892,899 | $226,753,312 | $139,587 | $-- |
| Derivative Instruments: | | | | |
| Assets | | | | |
| Futures Contracts | $19,431 | $19,431 | $-- | $-- |
| Total Assets | $19,431 | $19,431 | $-- | $-- |
| Liabilities | | | | |
| Futures Contracts | $(232) | $(232) | $-- | $-- |
| Total Liabilities | $(232) | $(232) | $-- | $-- |
| Total Derivative Instruments: | $19,199 | $19,199 | $-- | $-- |
Value of Derivative Instruments
The following table is a summary of the Fund's value of derivative instruments by primary risk exposure as of September 30, 2018. For additional information on derivative instruments, please refer to the Derivative Instruments section in the accompanying Notes to Financial Statements.
| Primary Risk Exposure / Derivative Type | Value |
| | Asset | Liability |
| Equity Risk | | |
| Futures Contracts(a) | $19,431 | $(232) |
| Total Equity Risk | 19,431 | (232) |
| Total Value of Derivatives | $19,431 | $(232) |
(a) Reflects gross cumulative appreciation (depreciation) on futures contracts as presented in the Schedule of Investments. In the Statement of Assets and Liabilities, the period end daily variation margin is included in receivable or payable for daily variation margin on futures contracts, and the net cumulative appreciation (depreciation) is included in net unrealized appreciation (depreciation).
See accompanying notes which are an integral part of the financial statements.
Fidelity Advisor Freedom® Income Fund
Financial Statements
Statement of Assets and Liabilities
| | | September 30, 2018 (Unaudited) |
| Assets | | |
Investment in securities, at value — See accompanying schedule:
Unaffiliated issuers (cost $139,597) | $139,587 | |
| Fidelity Central Funds (cost $271,950) | 271,950 | |
| Other affiliated issuers (cost $216,592,823) | 226,481,362 | |
| Total Investment in Securities (cost $217,004,370) | | $226,892,899 |
| Cash | | 24,980 |
| Receivable for investments sold | | 2,212,924 |
| Receivable for fund shares sold | | 80,585 |
| Distributions receivable from Fidelity Central Funds | | 395 |
| Total assets | | 229,211,783 |
| Liabilities | | |
| Payable for investments purchased | $1,858,464 | |
| Payable for fund shares redeemed | 435,020 | |
| Accrued management fee | 86,767 | |
| Distribution and service plan fees payable | 41,081 | |
| Payable for daily variation margin on futures contracts | 7,785 | |
| Total liabilities | | 2,429,117 |
| Net Assets | | $226,782,666 |
| Net Assets consist of: | | |
| Paid in capital | | $212,884,732 |
| Undistributed net investment income | | 728,725 |
| Accumulated undistributed net realized gain (loss) on investments | | 3,261,481 |
| Net unrealized appreciation (depreciation) on investments | | 9,907,728 |
| Net Assets | | $226,782,666 |
| Calculation of Maximum Offering Price | | |
| Class A: | | |
| Net Asset Value and redemption price per share ($71,071,968 ÷ 6,532,358 shares) | | $10.88 |
| Maximum offering price per share (100/94.25 of $10.88) | | $11.54 |
| Class M: | | |
| Net Asset Value and redemption price per share ($37,593,914 ÷ 3,458,670 shares) | | $10.87 |
| Maximum offering price per share (100/96.50 of $10.87) | | $11.26 |
| Class C: | | |
| Net Asset Value and offering price per share ($12,600,033 ÷ 1,161,571 shares)(a) | | $10.85 |
| Class I: | | |
| Net Asset Value, offering price and redemption price per share ($89,438,285 ÷ 8,195,320 shares) | | $10.91 |
| Class Z6: | | |
| Net Asset Value, offering price and redemption price per share ($16,078,466 ÷ 1,474,648 shares) | | $10.90 |
(a) Redemption price per share is equal to net asset value less any applicable contingent deferred sales charge.
See accompanying notes which are an integral part of the financial statements.
Statement of Operations
| | | Six months ended September 30, 2018 (Unaudited) |
| Investment Income | | |
| Dividends: | | |
| Affiliated issuers | | $2,567,653 |
| Interest | | 457 |
| Income from Fidelity Central Funds | | 1,148 |
| Total income | | 2,569,258 |
| Expenses | | |
| Management fee | $513,658 | |
| Distribution and service plan fees | 254,346 | |
| Independent trustees' fees and expenses | 534 | |
| Total expenses before reductions | 768,538 | |
| Expense reductions | (40) | |
| Total expenses after reductions | | 768,498 |
| Net investment income (loss) | | 1,800,760 |
| Realized and Unrealized Gain (Loss) | | |
| Net realized gain (loss) on: | | |
| Investment securities: | | |
| Fidelity Central Funds | (9) | |
| Other affiliated issuers | 2,954,660 | |
| Futures contracts | (18,771) | |
| Capital gain distributions from underlying funds: | | |
| Affiliated issuers | 844,026 | |
| Total net realized gain (loss) | | 3,779,906 |
| Change in net unrealized appreciation (depreciation) on: | | |
| Investment securities: | | |
| Unaffiliated issuers | (9) | |
| Affiliated issuers | (3,697,585) | |
| Futures contracts | 19,199 | |
| Total change in net unrealized appreciation (depreciation) | | (3,678,395) |
| Net gain (loss) | | 101,511 |
| Net increase (decrease) in net assets resulting from operations | | $1,902,271 |
See accompanying notes which are an integral part of the financial statements.
Statement of Changes in Net Assets
| | Six months ended September 30, 2018 (Unaudited) | Year ended March 31, 2018 |
| Increase (Decrease) in Net Assets | | |
| Operations | | |
| Net investment income (loss) | $1,800,760 | $3,029,100 |
| Net realized gain (loss) | 3,779,906 | 6,815,367 |
| Change in net unrealized appreciation (depreciation) | (3,678,395) | (240,746) |
| Net increase (decrease) in net assets resulting from operations | 1,902,271 | 9,603,721 |
| Distributions to shareholders from net investment income | (1,325,123) | (2,967,012) |
| Distributions to shareholders from net realized gain | (3,148,159) | (5,087,952) |
| Total distributions | (4,473,282) | (8,054,964) |
| Share transactions - net increase (decrease) | 15,866,157 | (10,830,864) |
| Total increase (decrease) in net assets | 13,295,146 | (9,282,107) |
| Net Assets | | |
| Beginning of period | 213,487,520 | 222,769,627 |
| End of period | $226,782,666 | $213,487,520 |
| Other Information | | |
| Undistributed net investment income end of period | $728,725 | $253,088 |
See accompanying notes which are an integral part of the financial statements.
Financial Highlights
Fidelity Advisor Freedom Income Fund Class A
| | Six months ended (Unaudited) September 30, | Years endedMarch 31, | | | | |
| | 2018 | 2018 | 2017 | 2016 | 2015 | 2014 |
| Selected Per–Share Data | | | | | | |
| Net asset value, beginning of period | $11.01 | $10.94 | $10.64 | $11.07 | $11.20 | $11.21 |
| Income from Investment Operations | | | | | | |
| Net investment income (loss)A | .09 | .15 | .16 | .18 | .16 | .12 |
| Net realized and unrealized gain (loss) | –B | .34 | .44 | (.25) | .24 | .28 |
| Total from investment operations | .09 | .49 | .60 | (.07) | .40 | .40 |
| Distributions from net investment income | (.06) | (.15) | (.16)C | (.18) | (.17) | (.12) |
| Distributions from net realized gain | (.16) | (.26) | (.14)C | (.19) | (.36) | (.29) |
| Total distributions | (.22) | (.42)D | (.30) | (.36)E | (.53) | (.41) |
| Net asset value, end of period | $10.88 | $11.01 | $10.94 | $10.64 | $11.07 | $11.20 |
| Total ReturnF,G,H | .83% | 4.47% | 5.74% | (.59)% | 3.65% | 3.65% |
| Ratios to Average Net AssetsI,J | | | | | | |
| Expenses before reductions | .71%K,L | .63% | .25% | .25% | .25% | .25% |
| Expenses net of fee waivers, if any | .71%K,L | .63% | .25% | .25% | .25% | .25% |
| Expenses net of all reductions | .71%K,L | .63% | .25% | .25% | .25% | .25% |
| Net investment income (loss) | 1.59%K | 1.38% | 1.47% | 1.63% | 1.48% | 1.10% |
| Supplemental Data | | | | | | |
| Net assets, end of period (000 omitted) | $71,072 | $76,141 | $87,983 | $99,211 | $124,755 | $147,818 |
| Portfolio turnover rateI | 45%K | 21% | 38% | 30% | 38% | 36% |
A Calculated based on average shares outstanding during the period.
B Amount represents less than $.005 per share.
C The amounts shown reflect certain reclassifications related to book to tax differences that were made in the year shown.
D Total distributions of $.42 per share is comprised of distributions from net investment income of $.153 and distributions from net realized gain of $.263 per share.
E Total distributions of $.36 per share is comprised of distributions from net investment income of $.176 and distributions from net realized gain of $.187 per share.
F Total returns for periods of less than one year are not annualized.
G Total returns would have been lower if certain expenses had not been reduced during the applicable periods shown.
H Total returns do not include the effect of the sales charges.
I Amounts do not include the activity of the Underlying Funds.
J Expense ratios reflect operating expenses of the class. Expenses before reductions do not reflect amounts reimbursed by the investment adviser or reductions from expense offset arrangements and do not represent the amount paid by the class during periods when reimbursements or reductions occur. Expenses net of fee waivers reflect expenses after reimbursement by the investment adviser but prior to reductions from expense offset arrangements. Expenses net of all reductions represent the net expenses paid by the class but do not include expenses of the underlying funds in which the Fund invests.
K Annualized
L On certain classes, the size and fluctuation of net assets and expense amounts may cause ratios to differ from contractual rates.
See accompanying notes which are an integral part of the financial statements.
Fidelity Advisor Freedom Income Fund Class M
| | Six months ended (Unaudited) September 30, | Years endedMarch 31, | | | | |
| | 2018 | 2018 | 2017 | 2016 | 2015 | 2014 |
| Selected Per–Share Data | | | | | | |
| Net asset value, beginning of period | $11.00 | $10.93 | $10.62 | $11.06 | $11.19 | $11.20 |
| Income from Investment Operations | | | | | | |
| Net investment income (loss)A | .07 | .13 | .13 | .15 | .14 | .09 |
| Net realized and unrealized gain (loss) | .01 | .33 | .45 | (.25) | .23 | .28 |
| Total from investment operations | .08 | .46 | .58 | (.10) | .37 | .37 |
| Distributions from net investment income | (.05) | (.13) | (.13)B | (.15) | (.14) | (.09) |
| Distributions from net realized gain | (.16) | (.26) | (.14)B | (.19) | (.36) | (.29) |
| Total distributions | (.21) | (.39) | (.27) | (.34) | (.50) | (.38) |
| Net asset value, end of period | $10.87 | $11.00 | $10.93 | $10.62 | $11.06 | $11.19 |
| Total ReturnC,D,E | .70% | 4.22% | 5.56% | (.93)% | 3.39% | 3.40% |
| Ratios to Average Net AssetsF,G | | | | | | |
| Expenses before reductions | .96%H,I | .89% | .50% | .50% | .50% | .50% |
| Expenses net of fee waivers, if any | .96%H,I | .89% | .50% | .50% | .50% | .50% |
| Expenses net of all reductions | .96%H,I | .89% | .50% | .50% | .50% | .50% |
| Net investment income (loss) | 1.34%H | 1.13% | 1.22% | 1.38% | 1.23% | .85% |
| Supplemental Data | | | | | | |
| Net assets, end of period (000 omitted) | $37,594 | $38,204 | $38,513 | $42,887 | $47,804 | $53,019 |
| Portfolio turnover rateF | 45%H | 21% | 38% | 30% | 38% | 36% |
A Calculated based on average shares outstanding during the period.
B The amounts shown reflect certain reclassifications related to book to tax differences that were made in the year shown.
C Total returns for periods of less than one year are not annualized.
D Total returns would have been lower if certain expenses had not been reduced during the applicable periods shown.
E Total returns do not include the effect of the sales charges.
F Amounts do not include the activity of the Underlying Funds.
G Expense ratios reflect operating expenses of the class. Expenses before reductions do not reflect amounts reimbursed by the investment adviser or reductions from expense offset arrangements and do not represent the amount paid by the class during periods when reimbursements or reductions occur. Expenses net of fee waivers reflect expenses after reimbursement by the investment adviser but prior to reductions from expense offset arrangements. Expenses net of all reductions represent the net expenses paid by the class but do not include expenses of the underlying funds in which the Fund invests.
H Annualized
I On certain classes, the size and fluctuation of net assets and expense amounts may cause ratios to differ from contractual rates.
See accompanying notes which are an integral part of the financial statements.
Fidelity Advisor Freedom Income Fund Class C
| | Six months ended (Unaudited) September 30, | Years endedMarch 31, | | | | |
| | 2018 | 2018 | 2017 | 2016 | 2015 | 2014 |
| Selected Per–Share Data | | | | | | |
| Net asset value, beginning of period | $10.98 | $10.91 | $10.61 | $11.04 | $11.17 | $11.18 |
| Income from Investment Operations | | | | | | |
| Net investment income (loss)A | .05 | .07 | .08 | .09 | .08 | .04 |
| Net realized and unrealized gain (loss) | –B | .33 | .44 | (.24) | .24 | .28 |
| Total from investment operations | .05 | .40 | .52 | (.15) | .32 | .32 |
| Distributions from net investment income | (.02) | (.07) | (.08)C | (.10) | (.09) | (.04) |
| Distributions from net realized gain | (.16) | (.26) | (.14)C | (.19) | (.36) | (.29) |
| Total distributions | (.18) | (.33) | (.22) | (.28)D | (.45) | (.33) |
| Net asset value, end of period | $10.85 | $10.98 | $10.91 | $10.61 | $11.04 | $11.17 |
| Total ReturnE,F,G | .46% | 3.69% | 4.99% | (1.35)% | 2.90% | 2.89% |
| Ratios to Average Net AssetsH,I | | | | | | |
| Expenses before reductions | 1.46%J,K | 1.39% | 1.00% | 1.00% | 1.00% | 1.00% |
| Expenses net of fee waivers, if any | 1.46%J,K | 1.39% | 1.00% | 1.00% | 1.00% | 1.00% |
| Expenses net of all reductions | 1.46%J,K | 1.39% | 1.00% | 1.00% | 1.00% | 1.00% |
| Net investment income (loss) | .84%J | .63% | .72% | .88% | .73% | .35% |
| Supplemental Data | | | | | | |
| Net assets, end of period (000 omitted) | $12,600 | $13,727 | $14,434 | $14,712 | $15,780 | $15,735 |
| Portfolio turnover rateH | 45%J | 21% | 38% | 30% | 38% | 36% |
A Calculated based on average shares outstanding during the period.
B Amount represents less than $.005 per share.
C The amounts shown reflect certain reclassifications related to book to tax differences that were made in the year shown.
D Total distributions of $.28 per share is comprised of distributions from net investment income of $.095 and distributions from net realized gain of $.187 per share.
E Total returns for periods of less than one year are not annualized.
F Total returns would have been lower if certain expenses had not been reduced during the applicable periods shown.
G Total returns do not include the effect of the contingent deferred sales charge.
H Amounts do not include the activity of the Underlying Funds.
I Expense ratios reflect operating expenses of the class. Expenses before reductions do not reflect amounts reimbursed by the investment adviser or reductions from expense offset arrangements and do not represent the amount paid by the class during periods when reimbursements or reductions occur. Expenses net of fee waivers reflect expenses after reimbursement by the investment adviser but prior to reductions from expense offset arrangements. Expenses net of all reductions represent the net expenses paid by the class but do not include expenses of the underlying funds in which the Fund invests.
J Annualized
K On certain classes, the size and fluctuation of net assets and expense amounts may cause ratios to differ from contractual rates.
See accompanying notes which are an integral part of the financial statements.
Fidelity Advisor Freedom Income Fund Class I
| | Six months ended (Unaudited) September 30, | Years endedMarch 31, | | | | |
| | 2018 | 2018 | 2017 | 2016 | 2015 | 2014 |
| Selected Per–Share Data | | | | | | |
| Net asset value, beginning of period | $11.05 | $10.98 | $10.67 | $11.10 | $11.23 | $11.23 |
| Income from Investment Operations | | | | | | |
| Net investment income (loss)A | .10 | .18 | .19 | .20 | .19 | .15 |
| Net realized and unrealized gain (loss) | –B | .33 | .45 | (.24) | .24 | .29 |
| Total from investment operations | .10 | .51 | .64 | (.04) | .43 | .44 |
| Distributions from net investment income | (.08) | (.18) | (.19)C | (.20) | (.19) | (.15) |
| Distributions from net realized gain | (.16) | (.26) | (.14)C | (.19) | (.36) | (.29) |
| Total distributions | (.24) | (.44) | (.33) | (.39) | (.56)D | (.44) |
| Net asset value, end of period | $10.91 | $11.05 | $10.98 | $10.67 | $11.10 | $11.23 |
| Total ReturnE,F | .89% | 4.70% | 6.07% | (.34)% | 3.89% | 3.98% |
| Ratios to Average Net AssetsG,H | | | | | | |
| Expenses before reductions | .47%I | .39% | - %J | - %J | - %J | - %J |
| Expenses net of fee waivers, if any | .47%I | .39% | -% | -% | -% | -% |
| Expenses net of all reductions | .47%I | .39% | -% | -% | -% | -% |
| Net investment income (loss) | 1.84%I | 1.63% | 1.72% | 1.88% | 1.73% | 1.35% |
| Supplemental Data | | | | | | |
| Net assets, end of period (000 omitted) | $89,438 | $83,723 | $81,839 | $83,497 | $83,253 | $71,933 |
| Portfolio turnover rateG | 45%I | 21% | 38% | 30% | 38% | 36% |
A Calculated based on average shares outstanding during the period.
B Amount represents less than $.005 per share.
C The amounts shown reflect certain reclassifications related to book to tax differences that were made in the year shown.
D Total distributions of $.56 per share is comprised of distributions from net investment income of $.194 and distributions from net realized gain of $.361 per share.
E Total returns for periods of less than one year are not annualized.
F Total returns would have been lower if certain expenses had not been reduced during the applicable periods shown.
G Amounts do not include the activity of the Underlying Funds.
H Expense ratios reflect operating expenses of the class. Expenses before reductions do not reflect amounts reimbursed by the investment adviser or reductions from expense offset arrangements and do not represent the amount paid by the class during periods when reimbursements or reductions occur. Expenses net of fee waivers reflect expenses after reimbursement by the investment adviser but prior to reductions from expense offset arrangements. Expenses net of all reductions represent the net expenses paid by the class but do not include expenses of the underlying funds in which the Fund invests.
I Annualized
J Amount represents less than .005%.
See accompanying notes which are an integral part of the financial statements.
Fidelity Advisor Freedom Income Fund Class Z6
| | Six months ended (Unaudited) September 30, | Years endedMarch 31, |
| | 2018 | 2018 A |
| Selected Per–Share Data | | |
| Net asset value, beginning of period | $11.04 | $11.09 |
| Income from Investment Operations | | |
| Net investment income (loss)B | .10 | .27 |
| Net realized and unrealized gain (loss) | .01 | .03 |
| Total from investment operations | .11 | .30 |
| Distributions from net investment income | (.09) | (.16) |
| Distributions from net realized gain | (.16) | (.19) |
| Total distributions | (.25) | (.35) |
| Net asset value, end of period | $10.90 | $11.04 |
| Total ReturnC,D | .98% | 2.69% |
| Ratios to Average Net AssetsE,F | | |
| Expenses before reductions | .37%G | .37%G |
| Expenses net of fee waivers, if any | .37%G | .37%G |
| Expenses net of all reductions | .37%G | .37%G |
| Net investment income (loss) | 1.93%G | 2.92%G |
| Supplemental Data | | |
| Net assets, end of period (000 omitted) | $16,078 | $1,693 |
| Portfolio turnover rateE | 45%G | 21% |
A For the period June 6, 2017 (commencement of sale of shares) to March 31, 2018.
B Calculated based on average shares outstanding during the period.
C Total returns for periods of less than one year are not annualized.
D Total returns would have been lower if certain expenses had not been reduced during the applicable periods shown.
E Amounts do not include the activity of the Underlying Funds.
F Expense ratios reflect operating expenses of the class. Expenses before reductions do not reflect amounts reimbursed by the investment adviser or reductions from expense offset arrangements and do not represent the amount paid by the class during periods when reimbursements or reductions occur. Expenses net of fee waivers reflect expenses after reimbursement by the investment adviser but prior to reductions from expense offset arrangements. Expenses net of all reductions represent the net expenses paid by the class but do not include expenses of the underlying funds in which the Fund invests.
G Annualized
See accompanying notes which are an integral part of the financial statements.
Fidelity Advisor Freedom® 2005 Fund
Investment Summary (Unaudited)
The information in the following tables is based on the direct investments of the Fund.
Top Holdings as of September 30, 2018
| | % of fund's net assets |
| Fidelity Series Investment Grade Bond Fund | 33.8 |
| Fidelity Series Government Money Market Fund 2.12% | 15.1 |
| Fidelity Series Inflation-Protected Bond Index Fund | 10.9 |
| Fidelity Series Long-Term Treasury Bond Index Fund | 4.6 |
| Fidelity Series Short-Term Credit Fund | 3.9 |
| Fidelity Series Emerging Markets Opportunities Fund | 3.6 |
| Fidelity Series Large Cap Stock Fund | 3.3 |
| Fidelity Series International Growth Fund | 3.0 |
| Fidelity Series International Value Fund | 3.0 |
| Fidelity Series Stock Selector Large Cap Value Fund | 2.1 |
| | 83.3 |
Asset Allocation (% of fund's net assets)
| Period end |
| | Domestic Equity Funds | 17.6% |
| | International Equity Funds | 11.1% |
| | Bond Funds | 52.2% |
| | Short-Term Funds | 19.1% |

Domestic Equity Funds category includes Fidelity Series Commodity Strategy Fund which invests in commodity-related investments.
Fidelity Advisor Freedom® 2005 Fund
Schedule of Investments September 30, 2018 (Unaudited)
Showing Percentage of Net Assets
| U.S. Treasury Obligations - 0.0% | | | |
| | | Principal Amount | Value |
| U.S. Treasury Bills, yield at date of purchase 1.97% to 2.09% 11/1/18 to 11/29/18 (a) | | | |
| (Cost $99,694) | | 100,000 | 99,687 |
| | | Shares | Value |
|
| Domestic Equity Funds - 17.6% | | | |
| Fidelity Advisor Series Equity Growth Fund (b) | | 229,426 | $3,546,925 |
| Fidelity Advisor Series Growth Opportunities Fund (b) | | 141,915 | 2,361,471 |
| Fidelity Advisor Series Small Cap Fund (b) | | 132,653 | 1,667,445 |
| Fidelity Series All-Sector Equity Fund (b) | | 109,609 | 1,491,777 |
| Fidelity Series Commodity Strategy Fund (b) | | 754,404 | 3,772,021 |
| Fidelity Series Large Cap Stock Fund (b) | | 386,585 | 6,158,296 |
| Fidelity Series Large Cap Value Index Fund (b) | | 50,261 | 663,448 |
| Fidelity Series Opportunistic Insights Fund (b) | | 166,032 | 3,295,726 |
| Fidelity Series Small Cap Opportunities Fund (b) | | 143,050 | 2,101,403 |
| Fidelity Series Stock Selector Large Cap Value Fund (b) | | 300,722 | 3,975,541 |
| Fidelity Series Value Discovery Fund (b) | | 286,498 | 3,922,154 |
| TOTAL DOMESTIC EQUITY FUNDS | | | |
| (Cost $24,512,831) | | | 32,956,207 |
|
| International Equity Funds - 11.1% | | | |
| Fidelity Series Canada Fund (b) | | 52,244 | 564,755 |
| Fidelity Series Emerging Markets Fund (b) | | 84,485 | 818,662 |
| Fidelity Series Emerging Markets Opportunities Fund (b) | | 353,779 | 6,789,016 |
| Fidelity Series International Growth Fund (b) | | 346,727 | 5,686,326 |
| Fidelity Series International Small Cap Fund (b) | | 74,922 | 1,341,109 |
| Fidelity Series International Value Fund (b) | | 539,625 | 5,676,850 |
| TOTAL INTERNATIONAL EQUITY FUNDS | | | |
| (Cost $15,017,120) | | | 20,876,718 |
|
| Bond Funds - 52.2% | | | |
| Fidelity Series Emerging Markets Debt Fund (b) | | 147,635 | 1,406,964 |
| Fidelity Series Floating Rate High Income Fund (b) | | 48,772 | 464,307 |
| Fidelity Series High Income Fund (b) | | 260,950 | 2,507,726 |
| Fidelity Series Inflation-Protected Bond Index Fund (b) | | 2,099,784 | 20,388,904 |
| Fidelity Series International Credit Fund (b) | | 10,786 | 106,030 |
| Fidelity Series Investment Grade Bond Fund (b) | | 5,818,186 | 63,360,042 |
| Fidelity Series Long-Term Treasury Bond Index Fund (b) | | 1,052,702 | 8,674,262 |
| Fidelity Series Real Estate Income Fund (b) | | 84,455 | 910,424 |
| TOTAL BOND FUNDS | | | |
| (Cost $98,781,996) | | | 97,818,659 |
|
| Short-Term Funds - 19.1% | | | |
| Fidelity Cash Central Fund, 2.11% (c) | | 298,745 | 298,805 |
| Fidelity Series Government Money Market Fund 2.12% (b)(d) | | 28,248,650 | 28,248,650 |
| Fidelity Series Short-Term Credit Fund (b) | | 741,578 | 7,311,963 |
| TOTAL SHORT-TERM FUNDS | | | |
| (Cost $35,929,504) | | | 35,859,418 |
| TOTAL INVESTMENT IN SECURITIES - 100.0% | | | |
| (Cost $174,341,145) | | | 187,610,689 |
| NET OTHER ASSETS (LIABILITIES) - 0.0% | | | (91,059) |
| NET ASSETS - 100% | | | $187,519,630 |
| Futures Contracts | | | | | |
| | Number of contracts | Expiration Date | Notional Amount | Value | Unrealized Appreciation/(Depreciation) |
| Purchased | | | | | |
| Equity Index Contracts | | | | | |
| ICE E-mini MSCI EAFE Index Contracts (United States) | 4 | Dec. 2018 | $395,100 | $378 | $378 |
| ICE E-mini MSCI Emerging Markets Index Contracts (United States) | 12 | Dec. 2018 | 629,820 | 12,547 | 12,547 |
| | | | | | 12,925 |
| Sold | | | | | |
| Equity Index Contracts | | | | | |
| CME E-mini S&P 500 Index Contracts (United States) | 6 | Dec. 2018 | 875,700 | (232) | (232) |
| TOTAL FUTURES CONTRACTS | | | | | $12,693 |
The notional amount of futures purchased as a percentage of Net Assets is 0.5%
The notional amount of futures sold as a percentage of Net Assets is 0.5%
Legend
(a) Security or a portion of the security was pledged to cover margin requirements for futures contracts. At period end, the value of securities pledged amounted to $89,721.
(b) Affiliated Fund
(c) Affiliated fund that is generally available only to investment companies and other accounts managed by Fidelity Investments. The rate quoted is the annualized seven-day yield of the fund at period end. A complete unaudited listing of the fund's holdings as of its most recent quarter end is available upon request. In addition, each Fidelity Central Fund's financial statements are available on the SEC's website or upon request.
(d) The rate quoted is the annualized seven-day yield of the fund at period end.
Affiliated Central Funds
Information regarding fiscal year to date income earned by the Fund from investments in Fidelity Central Funds is as follows:
| Fund | Income earned |
| Fidelity Cash Central Fund | $1,202 |
| Total | $1,202 |
Amounts in the income column in the above table include any capital gain distributions from underlying funds, which are presented in the corresponding line-item in the Statement of Operations if applicable.
Affiliated Underlying Funds
Fiscal year to date information regarding the Fund's investments in affiliated Underlying Funds, excluding any Money Market Central Funds, is presented below. Exchanges between classes of the same affiliated Underlying Funds may occur.
| Affiliate | Value, beginning of period | Purchases | Sales Proceeds | Dividend Income | Realized Gain (loss) | Change in Unrealized appreciation (depreciation) | Value, end of period |
| Fidelity Advisor Series Equity Growth Fund | $4,047,155 | $139,532 | $1,181,704 | $ - | $284,244 | $257,698 | $3,546,925 |
| Fidelity Advisor Series Equity Value Fund | 4,664,011 | 288,144 | 1,141,903 | 127,066 | 217,350 | (924,480) | - |
| Fidelity Advisor Series Growth & Income Fund | 7,130,190 | 795,871 | 1,935,101 | 545,542 | 186,602 | (1,576,253) | - |
| Fidelity Advisor Series Growth Opportunities Fund | 2,658,831 | 91,613 | 1,028,450 | - | 332,633 | 306,844 | 2,361,471 |
| Fidelity Advisor Series Opportunistic Insights Fund | 3,789,230 | 371,465 | 1,101,674 | 241,244 | 419,267 | (1,614,752) | - |
| Fidelity Advisor Series Small Cap Fund | 2,027,176 | 68,640 | 542,109 | - | 94,474 | 19,264 | 1,667,445 |
| Fidelity Advisor Series Stock Selector Large Cap Value Fund | 4,707,725 | 482,249 | 1,160,459 | 322,685 | 216,415 | (929,438) | - |
| Fidelity Series 100 Index Fund | 2,007,990 | - | 2,088,591 | - | 1,070,909 | (990,308) | - |
| Fidelity Series All-Sector Equity Fund | 2,777,333 | 92,723 | 1,664,062 | - | 357,643 | (71,860) | 1,491,777 |
| Fidelity Series Canada Fund | 653,217 | 21,460 | 149,325 | - | 1,921 | 37,482 | 564,755 |
| Fidelity Series Commodity Strategy Fund | 4,089,262 | 670,339 | 680,899 | 227,243 | (271,764) | (34,917) | 3,772,021 |
| Fidelity Series Emerging Markets Debt Fund | 1,503,577 | 81,821 | 96,690 | 43,406 | (2,589) | (79,155) | 1,406,964 |
| Fidelity Series Emerging Markets Fund | - | 821,372 | - | - | - | (2,710) | 818,662 |
| Fidelity Series Emerging Markets Opportunities Fund | 7,766,630 | 615,001 | 626,925 | - | 44,991 | (1,010,681) | 6,789,016 |
| Fidelity Series Floating Rate High Income Fund | 475,597 | 28,502 | 40,287 | 12,495 | (1,461) | 1,956 | 464,307 |
| Fidelity Series Government Money Market Fund 2.12% | 35,857,816 | 4,681,631 | 12,290,797 | 317,353 | - | - | 28,248,650 |
| Fidelity Series High Income Fund | 2,929,758 | 159,042 | 603,368 | 75,820 | (24,342) | 46,636 | 2,507,726 |
| Fidelity Series Inflation-Protected Bond Index Fund | 6,471,850 | 14,823,262 | 838,879 | 19,908 | (7,981) | (59,348) | 20,388,904 |
| Fidelity Series International Credit Fund | 105,791 | 1,303 | - | 1,304 | - | (1,064) | 106,030 |
| Fidelity Series International Growth Fund | 6,768,564 | 337,263 | 1,502,929 | - | 495,550 | (412,122) | 5,686,326 |
| Fidelity Series International Small Cap Fund | 1,676,957 | 67,126 | 342,123 | - | 116,021 | (176,872) | 1,341,109 |
| Fidelity Series International Value Fund | 6,654,429 | 211,468 | 1,148,534 | - | 117,198 | (157,711) | 5,676,850 |
| Fidelity Series Investment Grade Bond Fund | 67,757,886 | 2,950,937 | 6,561,473 | 933,237 | (110,358) | (676,950) | 63,360,042 |
| Fidelity Series Large Cap Stock Fund | - | 27 | 30,882 | - | (271) | 1,588,113 | 6,158,296 |
| Fidelity Series Large Cap Value Index Fund | 789,577 | 26,955 | 205,983 | - | 40,769 | 12,130 | 663,448 |
| Fidelity Series Long-Term Treasury Bond Index Fund | 4,133,151 | 5,849,401 | 1,028,891 | 77,011 | (35,404) | (243,995) | 8,674,262 |
| Fidelity Series Opportunistic Insights Fund | - | 41 | 16,493 | - | (16) | 1,448,658 | 3,295,726 |
| Fidelity Series Real Estate Equity Fund | 486,818 | 4,826 | 508,792 | 4,181 | 91,368 | (74,220) | - |
| Fidelity Series Real Estate Income Fund | 922,555 | 68,816 | 86,211 | 38,703 | 2,451 | 2,813 | 910,424 |
| Fidelity Series Short-Term Credit Fund | 8,765,987 | 390,850 | 1,844,723 | 97,451 | (17,081) | 16,930 | 7,311,963 |
| Fidelity Series Small Cap Opportunities Fund | 2,472,892 | 247,811 | 734,449 | 163,386 | 296,382 | (181,233) | 2,101,403 |
| Fidelity Series Stock Selector Large Cap Value Fund | - | 3,055 | 29,111 | - | 91 | 685,014 | 3,975,541 |
| Fidelity Series Value Discovery Fund | - | 21 | 19,800 | - | (202) | 839,013 | 3,922,154 |
| | $194,091,955 | $34,392,567 | $41,231,617 | $3,248,035 | $3,914,810 | $(3,955,518) | $187,212,197 |
Amounts in the income column in the above table include any capital gain distributions from underlying funds, which are presented in the corresponding line-item in the Statement of Operations if applicable.
Investment Valuation
The following is a summary of the inputs used, as of September 30, 2018, involving the Fund's assets and liabilities carried at fair value. The inputs or methodology used for valuing securities may not be an indication of the risk associated with investing in those securities. For more information on valuation inputs, and their aggregation into the levels used below, please refer to the Investment Valuation section in the accompanying Notes to Financial Statements.
| | Valuation Inputs at Reporting Date: |
| Description | Total | Level 1 | Level 2 | Level 3 |
| Investments in Securities: | | | | |
| Other Short-Term Investments | $99,687 | $-- | $99,687 | $-- |
| Domestic Equity Funds | 32,956,207 | 32,956,207 | -- | -- |
| International Equity Funds | 20,876,718 | 20,876,718 | -- | -- |
| Bond Funds | 97,818,659 | 97,818,659 | -- | -- |
| Short-Term Funds | 35,859,418 | 35,859,418 | -- | -- |
| Total Investments in Securities: | $187,610,689 | $187,511,002 | $99,687 | $-- |
| Derivative Instruments: | | | | |
| Assets | | | | |
| Futures Contracts | $12,925 | $12,925 | $-- | $-- |
| Total Assets | $12,925 | $12,925 | $-- | $-- |
| Liabilities | | | | |
| Futures Contracts | $(232) | $(232) | $-- | $-- |
| Total Liabilities | $(232) | $(232) | $-- | $-- |
| Total Derivative Instruments: | $12,693 | $12,693 | $-- | $-- |
Value of Derivative Instruments
The following table is a summary of the Fund's value of derivative instruments by primary risk exposure as of September 30, 2018. For additional information on derivative instruments, please refer to the Derivative Instruments section in the accompanying Notes to Financial Statements.
| Primary Risk Exposure / Derivative Type | Value |
| | Asset | Liability |
| Equity Risk | | |
| Futures Contracts(a) | $12,925 | $(232) |
| Total Equity Risk | 12,925 | (232) |
| Total Value of Derivatives | $12,925 | $(232) |
(a) Reflects gross cumulative appreciation (depreciation) on futures contracts as presented in the Schedule of Investments. In the Statement of Assets and Liabilities, the period end daily variation margin is included in receivable or payable for daily variation margin on futures contracts, and the net cumulative appreciation (depreciation) is included in net unrealized appreciation (depreciation).
See accompanying notes which are an integral part of the financial statements.
Fidelity Advisor Freedom® 2005 Fund
Financial Statements
Statement of Assets and Liabilities
| | | September 30, 2018 (Unaudited) |
| Assets | | |
Investment in securities, at value — See accompanying schedule:
Unaffiliated issuers (cost $99,694) | $99,687 | |
| Fidelity Central Funds (cost $298,805) | 298,805 | |
| Other affiliated issuers (cost $173,942,646) | 187,212,197 | |
| Total Investment in Securities (cost $174,341,145) | | $187,610,689 |
| Cash | | 31,750 |
| Receivable for investments sold | | 1,321,598 |
| Receivable for fund shares sold | | 79,773 |
| Distributions receivable from Fidelity Central Funds | | 456 |
| Total assets | | 189,044,266 |
| Liabilities | | |
| Payable for investments purchased | $1,097,133 | |
| Payable for fund shares redeemed | 309,088 | |
| Accrued management fee | 75,512 | |
| Distribution and service plan fees payable | 34,818 | |
| Payable for daily variation margin on futures contracts | 8,085 | |
| Total liabilities | | 1,524,636 |
| Net Assets | | $187,519,630 |
| Net Assets consist of: | | |
| Paid in capital | | $168,245,478 |
| Undistributed net investment income | | 1,427,142 |
| Accumulated undistributed net realized gain (loss) on investments | | 4,564,773 |
| Net unrealized appreciation (depreciation) on investments | | 13,282,237 |
| Net Assets | | $187,519,630 |
| Calculation of Maximum Offering Price | | |
| Class A: | | |
| Net Asset Value and redemption price per share ($93,168,916 ÷ 7,923,377 shares) | | $11.76 |
| Maximum offering price per share (100/94.25 of $11.76) | | $12.48 |
| Class M: | | |
| Net Asset Value and redemption price per share ($25,147,539 ÷ 2,142,751 shares) | | $11.74 |
| Maximum offering price per share (100/96.50 of $11.74) | | $12.17 |
| Class C: | | |
| Net Asset Value and offering price per share ($5,746,217 ÷ 490,500 shares)(a) | | $11.72 |
| Class I: | | |
| Net Asset Value, offering price and redemption price per share ($61,842,868 ÷ 5,220,863 shares) | | $11.85 |
| Class Z6: | | |
| Net Asset Value, offering price and redemption price per share ($1,614,090 ÷ 136,363 shares) | | $11.84 |
(a) Redemption price per share is equal to net asset value less any applicable contingent deferred sales charge.
See accompanying notes which are an integral part of the financial statements.
Statement of Operations
| | | Six months ended September 30, 2018 (Unaudited) |
| Investment Income | | |
| Dividends: | | |
| Affiliated issuers | | $2,101,126 |
| Interest | | 406 |
| Income from Fidelity Central Funds | | 1,202 |
| Total income | | 2,102,734 |
| Expenses | | |
| Management fee | $458,818 | |
| Distribution and service plan fees | 214,227 | |
| Independent trustees' fees and expenses | 467 | |
| Total expenses before reductions | 673,512 | |
| Expense reductions | (32) | |
| Total expenses after reductions | | 673,480 |
| Net investment income (loss) | | 1,429,254 |
| Realized and Unrealized Gain (Loss) | | |
| Net realized gain (loss) on: | | |
| Investment securities: | | |
| Fidelity Central Funds | (10) | |
| Other affiliated issuers | 3,914,810 | |
| Futures contracts | (27,701) | |
| Capital gain distributions from underlying funds: | | |
| Affiliated issuers | 1,146,909 | |
| Total net realized gain (loss) | | 5,034,008 |
| Change in net unrealized appreciation (depreciation) on: | | |
| Investment securities: | | |
| Unaffiliated issuers | (6) | |
| Affiliated issuers | (3,955,518) | |
| Futures contracts | 12,693 | |
| Total change in net unrealized appreciation (depreciation) | | (3,942,831) |
| Net gain (loss) | | 1,091,177 |
| Net increase (decrease) in net assets resulting from operations | | $2,520,431 |
See accompanying notes which are an integral part of the financial statements.
Statement of Changes in Net Assets
| | Six months ended September 30, 2018 (Unaudited) | Year ended March 31, 2018 |
| Increase (Decrease) in Net Assets | | |
| Operations | | |
| Net investment income (loss) | $1,429,254 | $2,777,359 |
| Net realized gain (loss) | 5,034,008 | 9,885,530 |
| Change in net unrealized appreciation (depreciation) | (3,942,831) | (528,591) |
| Net increase (decrease) in net assets resulting from operations | 2,520,431 | 12,134,298 |
| Distributions to shareholders from net investment income | (385,627) | (2,811,909) |
| Distributions to shareholders from net realized gain | (4,800,304) | (7,338,936) |
| Total distributions | (5,185,931) | (10,150,845) |
| Share transactions - net increase (decrease) | (3,846,376) | (18,509,645) |
| Total increase (decrease) in net assets | (6,511,876) | (16,526,192) |
| Net Assets | | |
| Beginning of period | 194,031,506 | 210,557,698 |
| End of period | $187,519,630 | $194,031,506 |
| Other Information | | |
| Undistributed net investment income end of period | $1,427,142 | $383,515 |
See accompanying notes which are an integral part of the financial statements.
Financial Highlights
Fidelity Advisor Freedom 2005 Fund Class A
| | Six months ended (Unaudited) September 30, | Years endedMarch 31, | | | | |
| | 2018 | 2018 | 2017 | 2016 | 2015 | 2014 |
| Selected Per–Share Data | | | | | | |
| Net asset value, beginning of period | $11.92 | $11.84 | $11.44 | $12.10 | $12.17 | $11.90 |
| Income from Investment Operations | | | | | | |
| Net investment income (loss)A | .09 | .16 | .17 | .19 | .19 | .13 |
| Net realized and unrealized gain (loss) | .07 | .53 | .67 | (.34) | .36 | .57 |
| Total from investment operations | .16 | .69 | .84 | (.15) | .55 | .70 |
| Distributions from net investment income | (.02) | (.17) | (.19)B | (.20) | (.19) | (.12) |
| Distributions from net realized gain | (.30) | (.44) | (.25)B | (.32) | (.42) | (.31) |
| Total distributions | (.32) | (.61) | (.44) | (.51)C | (.62)D | (.43) |
| Net asset value, end of period | $11.76 | $11.92 | $11.84 | $11.44 | $12.10 | $12.17 |
| Total ReturnE,F,G | 1.37% | 5.87% | 7.55% | (1.23)% | 4.60% | 5.98% |
| Ratios to Average Net AssetsH,I | | | | | | |
| Expenses before reductions | .73%J | .66% | .25% | .25% | .25% | .25% |
| Expenses net of fee waivers, if any | .73%J | .66% | .25% | .25% | .25% | .25% |
| Expenses net of all reductions | .73%J | .66% | .25% | .25% | .25% | .25% |
| Net investment income (loss) | 1.47%J | 1.34% | 1.46% | 1.62% | 1.54% | 1.10% |
| Supplemental Data | | | | | | |
| Net assets, end of period (000 omitted) | $93,169 | $101,642 | $118,902 | $134,262 | $162,069 | $187,224 |
| Portfolio turnover rateH | 36%J | 20% | 32% | 30% | 29% | 49% |
A Calculated based on average shares outstanding during the period.
B The amounts shown reflect certain reclassifications related to book to tax differences that were made in the year shown.
C Total distributions of $.51 per share is comprised of distributions from net investment income of $.196 and distributions from net realized gain of $.317 per share.
D Total distributions of $.62 per share is comprised of distributions from net investment income of $.193 and distributions from net realized gain of $.423 per share.
E Total returns for periods of less than one year are not annualized.
F Total returns would have been lower if certain expenses had not been reduced during the applicable periods shown.
G Total returns do not include the effect of the sales charges.
H Amounts do not include the activity of the Underlying Funds.
I Expense ratios reflect operating expenses of the class. Expenses before reductions do not reflect amounts reimbursed by the investment adviser or reductions from expense offset arrangements and do not represent the amount paid by the class during periods when reimbursements or reductions occur. Expenses net of fee waivers reflect expenses after reimbursement by the investment adviser but prior to reductions from expense offset arrangements. Expenses net of all reductions represent the net expenses paid by the class but do not include expenses of the underlying funds in which the Fund invests.
J Annualized
See accompanying notes which are an integral part of the financial statements.
Fidelity Advisor Freedom 2005 Fund Class M
| | Six months ended (Unaudited) September 30, | Years endedMarch 31, | | | | |
| | 2018 | 2018 | 2017 | 2016 | 2015 | 2014 |
| Selected Per–Share Data | | | | | | |
| Net asset value, beginning of period | $11.91 | $11.83 | $11.43 | $12.09 | $12.16 | $11.90 |
| Income from Investment Operations | | | | | | |
| Net investment income (loss)A | .07 | .13 | .14 | .16 | .16 | .10 |
| Net realized and unrealized gain (loss) | .07 | .53 | .67 | (.33) | .35 | .57 |
| Total from investment operations | .14 | .66 | .81 | (.17) | .51 | .67 |
| Distributions from net investment income | (.02) | (.14) | (.16)B | (.17) | (.16) | (.10) |
| Distributions from net realized gain | (.30) | (.44) | (.25)B | (.32) | (.42) | (.31) |
| Total distributions | (.31)C | (.58) | (.41) | (.49) | (.58) | (.41) |
| Net asset value, end of period | $11.74 | $11.91 | $11.83 | $11.43 | $12.09 | $12.16 |
| Total ReturnD,E,F | 1.22% | 5.64% | 7.29% | (1.45)% | 4.33% | 5.68% |
| Ratios to Average Net AssetsG,H | | | | | | |
| Expenses before reductions | .98%I | .91% | .50% | .50% | .50% | .50% |
| Expenses net of fee waivers, if any | .98%I | .91% | .50% | .50%�� | .50% | .50% |
| Expenses net of all reductions | .98%I | .91% | .50% | .50% | .50% | .50% |
| Net investment income (loss) | 1.22%I | 1.08% | 1.21% | 1.37% | 1.29% | .85% |
| Supplemental Data | | | | | | |
| Net assets, end of period (000 omitted) | $25,148 | $25,730 | $27,091 | $29,347 | $29,246 | $29,912 |
| Portfolio turnover rateG | 36%I | 20% | 32% | 30% | 29% | 49% |
A Calculated based on average shares outstanding during the period.
B The amounts shown reflect certain reclassifications related to book to tax differences that were made in the year shown.
C Total distributions of $.31 per share is comprised of distributions from net investment income of $.015 and distributions from net realized gain of $.298 per share.
D Total returns for periods of less than one year are not annualized.
E Total returns would have been lower if certain expenses had not been reduced during the applicable periods shown.
F Total returns do not include the effect of the sales charges.
G Amounts do not include the activity of the Underlying Funds.
H Expense ratios reflect operating expenses of the class. Expenses before reductions do not reflect amounts reimbursed by the investment adviser or reductions from expense offset arrangements and do not represent the amount paid by the class during periods when reimbursements or reductions occur. Expenses net of fee waivers reflect expenses after reimbursement by the investment adviser but prior to reductions from expense offset arrangements. Expenses net of all reductions represent the net expenses paid by the class but do not include expenses of the underlying funds in which the Fund invests.
I Annualized
See accompanying notes which are an integral part of the financial statements.
Fidelity Advisor Freedom 2005 Fund Class C
| | Six months ended (Unaudited) September 30, | Years endedMarch 31, | | | | |
| | 2018 | 2018 | 2017 | 2016 | 2015 | 2014 |
| Selected Per–Share Data | | | | | | |
| Net asset value, beginning of period | $11.91 | $11.81 | $11.41 | $12.06 | $12.14 | $11.87 |
| Income from Investment Operations | | | | | | |
| Net investment income (loss)A | .04 | .07 | .08 | .10 | .10 | .04 |
| Net realized and unrealized gain (loss) | .07 | .54 | .67 | (.33) | .34 | .58 |
| Total from investment operations | .11 | .61 | .75 | (.23) | .44 | .62 |
| Distributions from net investment income | –B | (.07) | (.10)C | (.10) | (.10) | (.04) |
| Distributions from net realized gain | (.30) | (.44) | (.25)C | (.32) | (.42) | (.31) |
| Total distributions | (.30) | (.51) | (.35) | (.42) | (.52) | (.35) |
| Net asset value, end of period | $11.72 | $11.91 | $11.81 | $11.41 | $12.06 | $12.14 |
| Total ReturnD,E,F | .86% | 5.21% | 6.75% | (1.98)% | 3.73% | 5.28% |
| Ratios to Average Net AssetsG,H | | | | | | |
| Expenses before reductions | 1.48%I | 1.41% | 1.00% | 1.00% | 1.00% | 1.00% |
| Expenses net of fee waivers, if any | 1.48%I | 1.41% | 1.00% | 1.00% | 1.00% | 1.00% |
| Expenses net of all reductions | 1.48%I | 1.41% | 1.00% | 1.00% | 1.00% | 1.00% |
| Net investment income (loss) | .72%I | .58% | .71% | .87% | .79% | .35% |
| Supplemental Data | | | | | | |
| Net assets, end of period (000 omitted) | $5,746 | $5,867 | $5,623 | $6,200 | $7,410 | $8,910 |
| Portfolio turnover rateG | 36%I | 20% | 32% | 30% | 29% | 49% |
A Calculated based on average shares outstanding during the period.
B Amount represents less than $.005 per share.
C The amounts shown reflect certain reclassifications related to book to tax differences that were made in the year shown.
D Total returns for periods of less than one year are not annualized.
E Total returns would have been lower if certain expenses had not been reduced during the applicable periods shown.
F Total returns do not include the effect of the contingent deferred sales charge.
G Amounts do not include the activity of the Underlying Funds.
H Expense ratios reflect operating expenses of the class. Expenses before reductions do not reflect amounts reimbursed by the investment adviser or reductions from expense offset arrangements and do not represent the amount paid by the class during periods when reimbursements or reductions occur. Expenses net of fee waivers reflect expenses after reimbursement by the investment adviser but prior to reductions from expense offset arrangements. Expenses net of all reductions represent the net expenses paid by the class but do not include expenses of the underlying funds in which the Fund invests.
I Annualized
See accompanying notes which are an integral part of the financial statements.
Fidelity Advisor Freedom 2005 Fund Class I
| | Six months ended (Unaudited) September 30, | Years endedMarch 31, | | | | |
| | 2018 | 2018 | 2017 | 2016 | 2015 | 2014 |
| Selected Per–Share Data | | | | | | |
| Net asset value, beginning of period | $12.00 | $11.92 | $11.51 | $12.18 | $12.25 | $11.97 |
| Income from Investment Operations | | | | | | |
| Net investment income (loss)A | .10 | .19 | .20 | .22 | .22 | .16 |
| Net realized and unrealized gain (loss) | .08 | .54 | .68 | (.34) | .36 | .58 |
| Total from investment operations | .18 | .73 | .88 | (.12) | .58 | .74 |
| Distributions from net investment income | (.03) | (.20) | (.22)B | (.23) | (.23) | (.15) |
| Distributions from net realized gain | (.30) | (.44) | (.25)B | (.32) | (.42) | (.31) |
| Total distributions | (.33) | (.65)C | (.47) | (.55) | (.65) | (.46) |
| Net asset value, end of period | $11.85 | $12.00 | $11.92 | $11.51 | $12.18 | $12.25 |
| Total ReturnD,E | 1.51% | 6.13% | 7.87% | (1.04)% | 4.85% | 6.29% |
| Ratios to Average Net AssetsF,G | | | | | | |
| Expenses before reductions | .48%H | .41% | - %I | - %I | - %I | - %I |
| Expenses net of fee waivers, if any | .48%H | .41% | -% | -% | -% | -% |
| Expenses net of all reductions | .48%H | .41% | -% | -% | -% | -% |
| Net investment income (loss) | 1.72%H | 1.58% | 1.71% | 1.87% | 1.79% | 1.35% |
| Supplemental Data | | | | | | |
| Net assets, end of period (000 omitted) | $61,843 | $59,386 | $58,940 | $61,440 | $66,255 | $67,435 |
| Portfolio turnover rateF | 36%H | 20% | 32% | 30% | 29% | 49% |
A Calculated based on average shares outstanding during the period.
B The amounts shown reflect certain reclassifications related to book to tax differences that were made in the year shown.
C Total distributions of $.65 per share is comprised of distributions from net investment income of $.203 and distributions from net realized gain of $.443 per share.
D Total returns for periods of less than one year are not annualized.
E Total returns would have been lower if certain expenses had not been reduced during the applicable periods shown.
F Amounts do not include the activity of the Underlying Funds.
G Expense ratios reflect operating expenses of the class. Expenses before reductions do not reflect amounts reimbursed by the investment adviser or reductions from expense offset arrangements and do not represent the amount paid by the class during periods when reimbursements or reductions occur. Expenses net of fee waivers reflect expenses after reimbursement by the investment adviser but prior to reductions from expense offset arrangements. Expenses net of all reductions represent the net expenses paid by the class but do not include expenses of the underlying funds in which the Fund invests.
H Annualized
I Amount represents less than .005%.
See accompanying notes which are an integral part of the financial statements.
Fidelity Advisor Freedom 2005 Fund Class Z6
| | Six months ended (Unaudited) September 30, | Years endedMarch 31, |
| | 2018 | 2018 A |
| Selected Per–Share Data | | |
| Net asset value, beginning of period | $12.00 | $12.04 |
| Income from Investment Operations | | |
| Net investment income (loss)B | .11 | .13 |
| Net realized and unrealized gain (loss) | .07 | .33 |
| Total from investment operations | .18 | .46 |
| Distributions from net investment income | (.04) | (.19) |
| Distributions from net realized gain | (.30) | (.31) |
| Total distributions | (.34) | (.50) |
| Net asset value, end of period | $11.84 | $12.00 |
| Total ReturnC,D | 1.49% | 3.78% |
| Ratios to Average Net AssetsE,F | | |
| Expenses before reductions | .37%G | .39%G,H |
| Expenses net of fee waivers, if any | .37%G | .39%G,H |
| Expenses net of all reductions | .37%G | .39%G,H |
| Net investment income (loss) | 1.83%G | 1.30%G |
| Supplemental Data | | |
| Net assets, end of period (000 omitted) | $1,614 | $1,408 |
| Portfolio turnover rateE | 36%G | 20% |
A For the period June 6, 2017 (commencement of sale of shares) to March 31, 2018.
B Calculated based on average shares outstanding during the period.
C Total returns for periods of less than one year are not annualized.
D Total returns would have been lower if certain expenses had not been reduced during the applicable periods shown.
E Amounts do not include the activity of the Underlying Funds.
F Expense ratios reflect operating expenses of the class. Expenses before reductions do not reflect amounts reimbursed by the investment adviser or reductions from expense offset arrangements and do not represent the amount paid by the class during periods when reimbursements or reductions occur. Expenses net of fee waivers reflect expenses after reimbursement by the investment adviser but prior to reductions from expense offset arrangements. Expenses net of all reductions represent the net expenses paid by the class but do not include expenses of the underlying funds in which the Fund invests.
G Annualized
H On certain classes, the size and fluctuation of net assets and expense amounts may cause ratios to differ from contractual rates.
See accompanying notes which are an integral part of the financial statements.
Fidelity Advisor Freedom® 2010 Fund
Investment Summary (Unaudited)
The information in the following tables is based on the direct investments of the Fund.
Top Holdings as of September 30, 2018
| | % of fund's net assets |
| Fidelity Series Investment Grade Bond Fund | 30.2 |
| Fidelity Series Government Money Market Fund 2.12% | 11.8 |
| Fidelity Series Inflation-Protected Bond Index Fund | 8.8 |
| Fidelity Series Long-Term Treasury Bond Index Fund | 4.8 |
| Fidelity Series Large Cap Stock Fund | 4.6 |
| Fidelity Series Emerging Markets Opportunities Fund | 4.5 |
| Fidelity Series International Value Fund | 3.9 |
| Fidelity Series International Growth Fund | 3.9 |
| Fidelity Series Short-Term Credit Fund | 3.1 |
| Fidelity Series Stock Selector Large Cap Value Fund | 3.0 |
| | 78.6 |
Asset Allocation (% of fund's net assets)
| Period end |
| | Domestic Equity Funds | 24.0% |
| | International Equity Funds | 14.2% |
| | Bond Funds | 46.7% |
| | Short-Term Funds | 15.1% |
| | Short-Term Investments | 0.1% |
| | Net Other Assets (Liabilities)* | (0.1)% |

* Net Other Assets (Liabilities) are not included in the pie chart
Domestic Equity Funds category includes Fidelity Series Commodity Strategy Fund which invests in commodity-related investments.
Fidelity Advisor Freedom® 2010 Fund
Schedule of Investments September 30, 2018 (Unaudited)
Showing Percentage of Net Assets
| U.S. Treasury Obligations - 0.1% | | | |
| | | Principal Amount | Value |
| U.S. Treasury Bills, yield at date of purchase 1.97% to 2.09% 11/1/18 to 11/29/18 (a) | | | |
| (Cost $269,116) | | 270,000 | 269,096 |
| | | Shares | Value |
|
| Domestic Equity Funds - 24.0% | | | |
| Fidelity Advisor Series Equity Growth Fund (b) | | 778,653 | $12,037,974 |
| Fidelity Advisor Series Growth Opportunities Fund (b) | | 481,546 | 8,012,931 |
| Fidelity Advisor Series Small Cap Fund (b) | | 450,218 | 5,659,236 |
| Fidelity Series All-Sector Equity Fund (b) | | 380,831 | 5,183,113 |
| Fidelity Series Commodity Strategy Fund (b) | | 1,810,978 | 9,054,892 |
| Fidelity Series Large Cap Stock Fund (b) | | 1,312,510 | 20,908,286 |
| Fidelity Series Large Cap Value Index Fund (b) | | 170,379 | 2,248,997 |
| Fidelity Series Opportunistic Insights Fund (b) | | 563,541 | 11,186,289 |
| Fidelity Series Small Cap Opportunities Fund (b) | | 485,390 | 7,130,381 |
| Fidelity Series Stock Selector Large Cap Value Fund (b) | | 1,020,993 | 13,497,532 |
| Fidelity Series Value Discovery Fund (b) | | 972,681 | 13,315,998 |
| TOTAL DOMESTIC EQUITY FUNDS | | | |
| (Cost $80,264,632) | | | 108,235,629 |
|
| International Equity Funds - 14.2% | | | |
| Fidelity Series Canada Fund (b) | | 162,310 | 1,754,567 |
| Fidelity Series Emerging Markets Fund (b) | | 245,677 | 2,380,615 |
| Fidelity Series Emerging Markets Opportunities Fund (b) | | 1,053,553 | 20,217,687 |
| Fidelity Series International Growth Fund (b) | | 1,077,241 | 17,666,746 |
| Fidelity Series International Small Cap Fund (b) | | 233,606 | 4,181,551 |
| Fidelity Series International Value Fund (b) | | 1,681,238 | 17,686,621 |
| TOTAL INTERNATIONAL EQUITY FUNDS | | | |
| (Cost $46,922,499) | | | 63,887,787 |
|
| Bond Funds - 46.7% | | | |
| Fidelity Series Emerging Markets Debt Fund (b) | | 351,870 | 3,353,321 |
| Fidelity Series Floating Rate High Income Fund (b) | | 115,124 | 1,095,979 |
| Fidelity Series High Income Fund (b) | | 625,176 | 6,007,945 |
| Fidelity Series Inflation-Protected Bond Index Fund (b) | | 4,093,385 | 39,746,764 |
| Fidelity Series International Credit Fund (b) | | 25,922 | 254,816 |
| Fidelity Series Investment Grade Bond Fund (b) | | 12,484,201 | 135,952,954 |
| Fidelity Series Long-Term Treasury Bond Index Fund (b) | | 2,639,863 | 21,752,473 |
| Fidelity Series Real Estate Income Fund (b) | | 202,097 | 2,178,606 |
| TOTAL BOND FUNDS | | | |
| (Cost $211,938,957) | | | 210,342,858 |
|
| Short-Term Funds - 15.1% | | | |
| Fidelity Cash Central Fund, 2.11% (c) | | 780,300 | 780,456 |
| Fidelity Series Government Money Market Fund 2.12% (b)(d) | | 53,513,501 | 53,513,501 |
| Fidelity Series Short-Term Credit Fund (b) | | 1,421,064 | 14,011,692 |
| TOTAL SHORT-TERM FUNDS | | | |
| (Cost $68,449,034) | | | 68,305,649 |
| TOTAL INVESTMENT IN SECURITIES - 100.1% | | | |
| (Cost $407,844,238) | | | 451,041,019 |
| NET OTHER ASSETS (LIABILITIES) - (0.1)% | | | (246,813) |
| NET ASSETS - 100% | | | $450,794,206 |
| Futures Contracts | | | | | |
| | Number of contracts | Expiration Date | Notional Amount | Value | Unrealized Appreciation/(Depreciation) |
| Purchased | | | | | |
| Equity Index Contracts | | | | | |
| ICE E-mini MSCI EAFE Index Contracts (United States) | 11 | Dec. 2018 | $1,086,525 | $1,039 | $1,039 |
| ICE E-mini MSCI Emerging Markets Index Contracts (United States) | 25 | Dec. 2018 | 1,312,125 | 27,226 | 27,226 |
| | | | | | 28,265 |
| Sold | | | | | |
| Equity Index Contracts | | | | | |
| CME E-mini S&P 500 Index Contracts (United States) | 17 | Dec. 2018 | 2,481,150 | (1,053) | (1,053) |
| TOTAL FUTURES CONTRACTS | | | | | $27,212 |
The notional amount of futures purchased as a percentage of Net Assets is 0.5%
The notional amount of futures sold as a percentage of Net Assets is 0.6%
Legend
(a) Security or a portion of the security was pledged to cover margin requirements for futures contracts. At period end, the value of securities pledged amounted to $239,201.
(b) Affiliated Fund
(c) Affiliated fund that is generally available only to investment companies and other accounts managed by Fidelity Investments. The rate quoted is the annualized seven-day yield of the fund at period end. A complete unaudited listing of the fund's holdings as of its most recent quarter end is available upon request. In addition, each Fidelity Central Fund's financial statements are available on the SEC's website or upon request.
(d) The rate quoted is the annualized seven-day yield of the fund at period end.
Affiliated Central Funds
Information regarding fiscal year to date income earned by the Fund from investments in Fidelity Central Funds is as follows:
| Fund | Income earned |
| Fidelity Cash Central Fund | $2,700 |
| Total | $2,700 |
Amounts in the income column in the above table include any capital gain distributions from underlying funds, which are presented in the corresponding line-item in the Statement of Operations if applicable.
Affiliated Underlying Funds
Fiscal year to date information regarding the Fund's investments in affiliated Underlying Funds, excluding any Money Market Central Funds, is presented below. Exchanges between classes of the same affiliated Underlying Funds may occur.
| Affiliate | Value, beginning of period | Purchases | Sales Proceeds | Dividend Income | Realized Gain (loss) | Change in Unrealized appreciation (depreciation) | Value, end of period |
| Fidelity Advisor Series Equity Growth Fund | $13,023,682 | $159,249 | $2,901,979 | $ - | $695,307 | $1,061,715 | $12,037,974 |
| Fidelity Advisor Series Equity Value Fund | 15,002,185 | 588,925 | 2,706,061 | 430,024 | 527,009 | (2,940,962) | - |
| Fidelity Advisor Series Growth & Income Fund | 22,959,845 | 2,050,281 | 4,728,608 | 1,822,417 | 237,531 | (5,119,432) | - |
| Fidelity Advisor Series Growth Opportunities Fund | 8,558,055 | 104,991 | 2,720,091 | - | 927,438 | 1,142,538 | 8,012,931 |
| Fidelity Advisor Series Opportunistic Insights Fund | 12,165,303 | 935,874 | 2,712,466 | 816,271 | 1,050,228 | (5,161,232) | - |
| Fidelity Advisor Series Small Cap Fund | 6,526,055 | 77,854 | 1,311,018 | - | 236,805 | 129,540 | 5,659,236 |
| Fidelity Advisor Series Stock Selector Large Cap Value Fund | 15,144,178 | 1,233,923 | 2,700,278 | 1,089,541 | 548,007 | (2,987,555) | - |
| Fidelity Series 100 Index Fund | 6,480,007 | - | 6,717,475 | - | 2,651,503 | (2,414,035) | - |
| Fidelity Series All-Sector Equity Fund | 8,936,502 | 105,106 | 4,787,644 | - | 1,048,111 | (118,962) | 5,183,113 |
| Fidelity Series Canada Fund | 1,983,826 | 23,183 | 372,930 | - | 5,894 | 114,594 | 1,754,567 |
| Fidelity Series Commodity Strategy Fund | 10,008,890 | 1,424,419 | 1,630,731 | 544,044 | (605,354) | (142,332) | 9,054,892 |
| Fidelity Series Emerging Markets Debt Fund | 3,656,577 | 138,457 | 243,933 | 104,444 | (8,575) | (189,205) | 3,353,321 |
| Fidelity Series Emerging Markets Fund | - | 2,374,526 | - | - | - | 6,089 | 2,380,615 |
| Fidelity Series Emerging Markets Opportunities Fund | 23,275,501 | 1,815,459 | 1,980,454 | - | 109,256 | (3,002,075) | 20,217,687 |
| Fidelity Series Floating Rate High Income Fund | 1,152,519 | 44,028 | 101,637 | 29,854 | (3,896) | 4,965 | 1,095,979 |
| Fidelity Series Government Money Market Fund 2.12% | 68,838,813 | 7,685,041 | 23,010,353 | 609,323 | - | - | 53,513,501 |
| Fidelity Series High Income Fund | 7,117,769 | 257,106 | 1,420,679 | 183,289 | (58,309) | 112,058 | 6,007,945 |
| Fidelity Series Inflation-Protected Bond Index Fund | 12,966,248 | 28,854,794 | 1,944,372 | 39,615 | (33,551) | (96,355) | 39,746,764 |
| Fidelity Series International Credit Fund | 254,240 | 3,134 | - | 3,133 | - | (2,558) | 254,816 |
| Fidelity Series International Growth Fund | 20,582,564 | 574,179 | 3,758,213 | - | 1,370,793 | (1,102,577) | 17,666,746 |
| Fidelity Series International Small Cap Fund | 5,097,991 | 145,755 | 877,156 | - | 305,769 | (490,808) | 4,181,551 |
| Fidelity Series International Value Fund | 20,222,495 | 233,309 | 2,666,518 | - | 322,055 | (424,720) | 17,686,621 |
| Fidelity Series Investment Grade Bond Fund | 150,574,589 | 3,774,734 | 16,714,209 | 2,033,159 | (434,918) | (1,247,242) | 135,952,954 |
| Fidelity Series Large Cap Stock Fund | - | 53,996 | 26,868 | - | (204) | 5,481,745 | 20,908,286 |
| Fidelity Series Large Cap Value Index Fund | 2,542,533 | 32,080 | 497,058 | - | 107,585 | 63,857 | 2,248,997 |
| Fidelity Series Long-Term Treasury Bond Index Fund | 10,266,228 | 13,874,429 | 1,684,245 | 207,104 | (53,817) | (650,122) | 21,752,473 |
| Fidelity Series Opportunistic Insights Fund | - | 28,930 | 15,169 | - | (72) | 4,894,893 | 11,186,289 |
| Fidelity Series Real Estate Equity Fund | 1,572,454 | 13,344 | 1,630,378 | 11,220 | 280,304 | (235,724) | - |
| Fidelity Series Real Estate Income Fund | 2,235,813 | 119,682 | 191,103 | 93,008 | 10,469 | 3,745 | 2,178,606 |
| Fidelity Series Short-Term Credit Fund | 16,750,769 | 380,920 | 3,120,266 | 183,715 | (34,792) | 35,061 | 14,011,692 |
| Fidelity Series Small Cap Opportunities Fund | 7,960,899 | 649,183 | 1,818,804 | 552,865 | 700,179 | (361,076) | 7,130,381 |
| Fidelity Series Stock Selector Large Cap Value Fund | - | 38,641 | 91,069 | - | 383 | 2,311,302 | 13,497,532 |
| Fidelity Series Value Discovery Fund | - | 34,670 | 17,365 | - | (155) | 2,827,752 | 13,315,998 |
| | $475,856,530 | $67,830,202 | $95,099,130 | $8,753,026 | $9,900,983 | $(8,497,118) | $449,991,467 |
Amounts in the income column in the above table include any capital gain distributions from underlying funds, which are presented in the corresponding line-item in the Statement of Operations if applicable.
Investment Valuation
The following is a summary of the inputs used, as of September 30, 2018, involving the Fund's assets and liabilities carried at fair value. The inputs or methodology used for valuing securities may not be an indication of the risk associated with investing in those securities. For more information on valuation inputs, and their aggregation into the levels used below, please refer to the Investment Valuation section in the accompanying Notes to Financial Statements.
| | Valuation Inputs at Reporting Date: |
| Description | Total | Level 1 | Level 2 | Level 3 |
| Investments in Securities: | | | | |
| Other Short-Term Investments | $269,096 | $-- | $269,096 | $-- |
| Domestic Equity Funds | 108,235,629 | 108,235,629 | -- | -- |
| International Equity Funds | 63,887,787 | 63,887,787 | -- | -- |
| Bond Funds | 210,342,858 | 210,342,858 | -- | -- |
| Short-Term Funds | 68,305,649 | 68,305,649 | -- | -- |
| Total Investments in Securities: | $451,041,019 | $450,771,923 | $269,096 | $-- |
| Derivative Instruments: | | | | |
| Assets | | | | |
| Futures Contracts | $28,265 | $28,265 | $-- | $-- |
| Total Assets | $28,265 | $28,265 | $-- | $-- |
| Liabilities | | | | |
| Futures Contracts | $(1,053) | $(1,053) | $-- | $-- |
| Total Liabilities | $(1,053) | $(1,053) | $-- | $-- |
| Total Derivative Instruments: | $27,212 | $27,212 | $-- | $-- |
Value of Derivative Instruments
The following table is a summary of the Fund's value of derivative instruments by primary risk exposure as of September 30, 2018. For additional information on derivative instruments, please refer to the Derivative Instruments section in the accompanying Notes to Financial Statements.
| Primary Risk Exposure / Derivative Type | Value |
| | Asset | Liability |
| Equity Risk | | |
| Futures Contracts(a) | $28,265 | $(1,053) |
| Total Equity Risk | 28,265 | (1,053) |
| Total Value of Derivatives | $28,265 | $(1,053) |
(a) Reflects gross cumulative appreciation (depreciation) on futures contracts as presented in the Schedule of Investments. In the Statement of Assets and Liabilities, the period end daily variation margin is included in receivable or payable for daily variation margin on futures contracts, and the net cumulative appreciation (depreciation) is included in net unrealized appreciation (depreciation).
See accompanying notes which are an integral part of the financial statements.
Fidelity Advisor Freedom® 2010 Fund
Financial Statements
Statement of Assets and Liabilities
| | | September 30, 2018 (Unaudited) |
| Assets | | |
Investment in securities, at value — See accompanying schedule:
Unaffiliated issuers (cost $269,116) | $269,096 | |
| Fidelity Central Funds (cost $780,456) | 780,456 | |
| Other affiliated issuers (cost $406,794,666) | 449,991,467 | |
| Total Investment in Securities (cost $407,844,238) | | $451,041,019 |
| Cash | | 25,475 |
| Receivable for investments sold | | 1,888,552 |
| Receivable for fund shares sold | | 360,122 |
| Distributions receivable from Fidelity Central Funds | | 1,159 |
| Total assets | | 453,316,327 |
| Liabilities | | |
| Payable for investments purchased | $1,902,072 | |
| Payable for fund shares redeemed | 312,009 | |
| Accrued management fee | 196,506 | |
| Distribution and service plan fees payable | 94,270 | |
| Payable for daily variation margin on futures contracts | 17,264 | |
| Total liabilities | | 2,522,121 |
| Net Assets | | $450,794,206 |
| Net Assets consist of: | | |
| Paid in capital | | $391,702,251 |
| Undistributed net investment income | | 3,120,956 |
| Accumulated undistributed net realized gain (loss) on investments | | 12,747,006 |
| Net unrealized appreciation (depreciation) on investments | | 43,223,993 |
| Net Assets | | $450,794,206 |
| Calculation of Maximum Offering Price | | |
| Class A: | | |
| Net Asset Value and redemption price per share ($207,131,694 ÷ 16,899,218 shares) | | $12.26 |
| Maximum offering price per share (100/94.25 of $12.26) | | $13.01 |
| Class M: | | |
| Net Asset Value and redemption price per share ($74,514,170 ÷ 6,107,574 shares) | | $12.20 |
| Maximum offering price per share (100/96.50 of $12.20) | | $12.64 |
| Class C: | | |
| Net Asset Value and offering price per share ($23,878,963 ÷ 1,973,147 shares)(a) | | $12.10 |
| Class I: | | |
| Net Asset Value, offering price and redemption price per share ($140,301,224 ÷ 11,393,341 shares) | | $12.31 |
| Class Z6: | | |
| Net Asset Value, offering price and redemption price per share ($4,968,155 ÷ 403,585 shares) | | $12.31 |
(a) Redemption price per share is equal to net asset value less any applicable contingent deferred sales charge.
See accompanying notes which are an integral part of the financial statements.
Statement of Operations
| | | Six months ended September 30, 2018 (Unaudited) |
| Investment Income | | |
| Dividends: | | |
| Affiliated issuers | | $4,901,205 |
| Interest | | 1,122 |
| Income from Fidelity Central Funds | | 2,700 |
| Total income | | 4,905,027 |
| Expenses | | |
| Management fee | $1,210,792 | |
| Distribution and service plan fees | 586,155 | |
| Independent trustees' fees and expenses | 1,142 | |
| Total expenses before reductions | 1,798,089 | |
| Expense reductions | (35) | |
| Total expenses after reductions | | 1,798,054 |
| Net investment income (loss) | | 3,106,973 |
| Realized and Unrealized Gain (Loss) | | |
| Net realized gain (loss) on: | | |
| Investment securities: | | |
| Fidelity Central Funds | (24) | |
| Other affiliated issuers | 9,900,983 | |
| Futures contracts | (46,257) | |
| Capital gain distributions from underlying funds: | | |
| Affiliated issuers | 3,851,821 | |
| Total net realized gain (loss) | | 13,706,523 |
| Change in net unrealized appreciation (depreciation) on: | | |
| Investment securities: | | |
| Unaffiliated issuers | (17) | |
| Affiliated issuers | (8,497,118) | |
| Futures contracts | 27,212 | |
| Total change in net unrealized appreciation (depreciation) | | (8,469,923) |
| Net gain (loss) | | 5,236,600 |
| Net increase (decrease) in net assets resulting from operations | | $8,343,573 |
See accompanying notes which are an integral part of the financial statements.
Statement of Changes in Net Assets
| | Six months ended September 30, 2018 (Unaudited) | Year ended March 31, 2018 |
| Increase (Decrease) in Net Assets | | |
| Operations | | |
| Net investment income (loss) | $3,106,973 | $6,311,536 |
| Net realized gain (loss) | 13,706,523 | 29,999,898 |
| Change in net unrealized appreciation (depreciation) | (8,469,923) | (1,539,645) |
| Net increase (decrease) in net assets resulting from operations | 8,343,573 | 34,771,789 |
| Distributions to shareholders from net investment income | (626,664) | (6,662,107) |
| Distributions to shareholders from net realized gain | (13,936,354) | (24,206,337) |
| Total distributions | (14,563,018) | (30,868,444) |
| Share transactions - net increase (decrease) | (18,597,246) | (36,175,930) |
| Total increase (decrease) in net assets | (24,816,691) | (32,272,585) |
| Net Assets | | |
| Beginning of period | 475,610,897 | 507,883,482 |
| End of period | $450,794,206 | $475,610,897 |
| Other Information | | |
| Undistributed net investment income end of period | $3,120,956 | $640,647 |
See accompanying notes which are an integral part of the financial statements.
Financial Highlights
Fidelity Advisor Freedom 2010 Fund Class A
| | Six months ended (Unaudited) September 30, | Years endedMarch 31, | | | | |
| | 2018 | 2018 | 2017 | 2016 | 2015 | 2014 |
| Selected Per–Share Data | | | | | | |
| Net asset value, beginning of period | $12.42 | $12.34 | $11.87 | $12.72 | $12.91 | $12.50 |
| Income from Investment Operations | | | | | | |
| Net investment income (loss)A | .08 | .16 | .18 | .20 | .20 | .15 |
| Net realized and unrealized gain (loss) | .15 | .72 | .84 | (.41) | .44 | .82 |
| Total from investment operations | .23 | .88 | 1.02 | (.21) | .64 | .97 |
| Distributions from net investment income | (.02) | (.17) | (.19) | (.21) | (.22) | (.14) |
| Distributions from net realized gain | (.37) | (.62) | (.36) | (.44) | (.61) | (.42) |
| Total distributions | (.39) | (.80)B | (.55) | (.64)C | (.83) | (.56) |
| Net asset value, end of period | $12.26 | $12.42 | $12.34 | $11.87 | $12.72 | $12.91 |
| Total ReturnD,E,F | 1.85% | 7.18% | 8.87% | (1.67)% | 5.08% | 7.86% |
| Ratios to Average Net AssetsG,H | | | | | | |
| Expenses before reductions | .77%I,J | .69% | .25% | .25% | .25% | .25% |
| Expenses net of fee waivers, if any | .77%I,J | .69% | .25% | .25% | .25% | .25% |
| Expenses net of all reductions | .77%I,J | .69% | .25% | .25% | .25% | .25% |
| Net investment income (loss) | 1.34%I | 1.29% | 1.45% | 1.63% | 1.55% | 1.15% |
| Supplemental Data | | | | | | |
| Net assets, end of period (000 omitted) | $207,132 | $230,553 | $263,496 | $328,232 | $431,498 | $502,834 |
| Portfolio turnover rateG | 29%I | 20% | 26% | 21% | 22% | 39% |
A Calculated based on average shares outstanding during the period.
B Total distributions of $.80 per share is comprised of distributions from net investment income of $.173 and distributions from net realized gain of $.624 per share.
C Total distributions of $.64 per share is comprised of distributions from net investment income of $.206 and distributions from net realized gain of $.437 per share.
D Total returns for periods of less than one year are not annualized.
E Total returns would have been lower if certain expenses had not been reduced during the applicable periods shown.
F Total returns do not include the effect of the sales charges.
G Amounts do not include the activity of the Underlying Funds.
H Expense ratios reflect operating expenses of the class. Expenses before reductions do not reflect amounts reimbursed by the investment adviser or reductions from expense offset arrangements and do not represent the amount paid by the class during periods when reimbursements or reductions occur. Expenses net of fee waivers reflect expenses after reimbursement by the investment adviser but prior to reductions from expense offset arrangements. Expenses net of all reductions represent the net expenses paid by the class but do not include expenses of the underlying funds in which the Fund invests.
I Annualized
J On certain classes, the size and fluctuation of net assets and expense amounts may cause ratios to differ from contractual rates
See accompanying notes which are an integral part of the financial statements.
Fidelity Advisor Freedom 2010 Fund Class M
| | Six months ended (Unaudited) September 30, | Years endedMarch 31, | | | | |
| | 2018 | 2018 | 2017 | 2016 | 2015 | 2014 |
| Selected Per–Share Data | | | | | | |
| Net asset value, beginning of period | $12.37 | $12.30 | $11.83 | $12.68 | $12.87 | $12.46 |
| Income from Investment Operations | | | | | | |
| Net investment income (loss)A | .07 | .13 | .14 | .17 | .17 | .11 |
| Net realized and unrealized gain (loss) | .14 | .71 | .85 | (.41) | .43 | .83 |
| Total from investment operations | .21 | .84 | .99 | (.24) | .60 | .94 |
| Distributions from net investment income | (.01) | (.15) | (.16) | (.18) | (.18) | (.11) |
| Distributions from net realized gain | (.37) | (.62) | (.36) | (.44) | (.61) | (.42) |
| Total distributions | (.38) | (.77) | (.52) | (.61)B | (.79) | (.53) |
| Net asset value, end of period | $12.20 | $12.37 | $12.30 | $11.83 | $12.68 | $12.87 |
| Total ReturnC,D,E | 1.70% | 6.89% | 8.63% | (1.92)% | 4.81% | 7.62% |
| Ratios to Average Net AssetsF,G | | | | | | |
| Expenses before reductions | 1.02%H,I | .94% | .50% | .50% | .50% | .50% |
| Expenses net of fee waivers, if any | 1.02%H,I | .94% | .50% | .50% | .50% | .50% |
| Expenses net of all reductions | 1.02%H,I | .94% | .50% | .50% | .50% | .50% |
| Net investment income (loss) | 1.09%H | 1.03% | 1.20% | 1.38% | 1.30% | .90% |
| Supplemental Data | | | | | | |
| Net assets, end of period (000 omitted) | $74,514 | $77,068 | $83,881 | $92,543 | $106,189 | $124,997 |
| Portfolio turnover rateF | 29%H | 20% | 26% | 21% | 22% | 39% |
A Calculated based on average shares outstanding during the period.
B Total distributions of $.61 per share is comprised of distributions from net investment income of $.176 and distributions from net realized gain of $.437 per share.
C Total returns for periods of less than one year are not annualized.
D Total returns would have been lower if certain expenses had not been reduced during the applicable periods shown.
E Total returns do not include the effect of the sales charges.
F Amounts do not include the activity of the Underlying Funds.
G Expense ratios reflect operating expenses of the class. Expenses before reductions do not reflect amounts reimbursed by the investment adviser or reductions from expense offset arrangements and do not represent the amount paid by the class during periods when reimbursements or reductions occur. Expenses net of fee waivers reflect expenses after reimbursement by the investment adviser but prior to reductions from expense offset arrangements. Expenses net of all reductions represent the net expenses paid by the class but do not include expenses of the underlying funds in which the Fund invests.
H Annualized
I On certain classes, the size and fluctuation of net assets and expense amounts may cause ratios to differ from contractual rates.
See accompanying notes which are an integral part of the financial statements.
Fidelity Advisor Freedom 2010 Fund Class C
| | Six months ended (Unaudited) September 30, | Years endedMarch 31, | | | | |
| | 2018 | 2018 | 2017 | 2016 | 2015 | 2014 |
| Selected Per–Share Data | | | | | | |
| Net asset value, beginning of period | $12.29 | $12.22 | $11.76 | $12.60 | $12.79 | $12.39 |
| Income from Investment Operations | | | | | | |
| Net investment income (loss)A | .04 | .07 | .08 | .11 | .10 | .05 |
| Net realized and unrealized gain (loss) | .13 | .70 | .84 | (.40) | .44 | .81 |
| Total from investment operations | .17 | .77 | .92 | (.29) | .54 | .86 |
| Distributions from net investment income | – | (.08) | (.10) | (.11) | (.12) | (.05) |
| Distributions from net realized gain | (.36) | (.62) | (.36) | (.44) | (.61) | (.41) |
| Total distributions | (.36) | (.70) | (.46) | (.55) | (.73) | (.46) |
| Net asset value, end of period | $12.10 | $12.29 | $12.22 | $11.76 | $12.60 | $12.79 |
| Total ReturnB,C,D | 1.42% | 6.37% | 8.07% | (2.39)% | 4.33% | 7.04% |
| Ratios to Average Net AssetsE,F | | | | | | |
| Expenses before reductions | 1.52%G,H | 1.44% | 1.00% | 1.00% | 1.00% | 1.00% |
| Expenses net of fee waivers, if any | 1.52%G,H | 1.44% | 1.00% | 1.00% | 1.00% | 1.00% |
| Expenses net of all reductions | 1.52%G,H | 1.44% | 1.00% | 1.00% | 1.00% | 1.00% |
| Net investment income (loss) | .59%G | .54% | .70% | .88% | .80% | .40% |
| Supplemental Data | | | | | | |
| Net assets, end of period (000 omitted) | $23,879 | $26,227 | $29,290 | $30,150 | $34,839 | $36,622 |
| Portfolio turnover rateE | 29%G | 20% | 26% | 21% | 22% | 39% |
A Calculated based on average shares outstanding during the period.
B Total returns for periods of less than one year are not annualized.
C Total returns would have been lower if certain expenses had not been reduced during the applicable periods shown.
D Total returns do not include the effect of the contingent deferred sales charge.
E Amounts do not include the activity of the Underlying Funds.
F Expense ratios reflect operating expenses of the class. Expenses before reductions do not reflect amounts reimbursed by the investment adviser or reductions from expense offset arrangements and do not represent the amount paid by the class during periods when reimbursements or reductions occur. Expenses net of fee waivers reflect expenses after reimbursement by the investment adviser but prior to reductions from expense offset arrangements. Expenses net of all reductions represent the net expenses paid by the class but do not include expenses of the underlying funds in which the Fund invests.
G Annualized
H On certain classes, the size and fluctuation of net assets and expense amounts may cause ratios to differ from contractual rates.
See accompanying notes which are an integral part of the financial statements.
Fidelity Advisor Freedom 2010 Fund Class I
| | Six months ended (Unaudited) September 30, | Years endedMarch 31, | | | | |
| | 2018 | 2018 | 2017 | 2016 | 2015 | 2014 |
| Selected Per–Share Data | | | | | | |
| Net asset value, beginning of period | $12.47 | $12.40 | $11.92 | $12.77 | $12.96 | $12.55 |
| Income from Investment Operations | | | | | | |
| Net investment income (loss)A | .10 | .19 | .21 | .23 | .23 | .18 |
| Net realized and unrealized gain (loss) | .14 | .72 | .85 | (.40) | .44 | .82 |
| Total from investment operations | .24 | .91 | 1.06 | (.17) | .67 | 1.00 |
| Distributions from net investment income | (.03) | (.21) | (.22) | (.24) | (.25) | (.17) |
| Distributions from net realized gain | (.37) | (.62) | (.36) | (.44) | (.61) | (.42) |
| Total distributions | (.40) | (.84)B | (.58) | (.68) | (.86) | (.59) |
| Net asset value, end of period | $12.31 | $12.47 | $12.40 | $11.92 | $12.77 | $12.96 |
| Total ReturnC,D | 1.91% | 7.39% | 9.22% | (1.40)% | 5.34% | 8.10% |
| Ratios to Average Net AssetsE,F | | | | | | |
| Expenses before reductions | .53%G | .45% | - %H | - %H | - %H | - %H |
| Expenses net of fee waivers, if any | .53%G | .45% | -% | -% | -% | -% |
| Expenses net of all reductions | .53%G | .45% | -% | -% | -% | -% |
| Net investment income (loss) | 1.59%G | 1.53% | 1.70% | 1.88% | 1.80% | 1.40% |
| Supplemental Data | | | | | | |
| Net assets, end of period (000 omitted) | $140,301 | $137,019 | $131,216 | $143,715 | $158,071 | $191,276 |
| Portfolio turnover rateE | 29%G | 20% | 26% | 21% | 22% | 39% |
A Calculated based on average shares outstanding during the period.
B Total distributions of $.84 per share is comprised of distributions from net investment income of $.212 and distributions from net realized gain of $.624 per share.
C Total returns for periods of less than one year are not annualized.
D Total returns would have been lower if certain expenses had not been reduced during the applicable periods shown.
E Amounts do not include the activity of the Underlying Funds.
F Expense ratios reflect operating expenses of the class. Expenses before reductions do not reflect amounts reimbursed by the investment adviser or reductions from expense offset arrangements and do not represent the amount paid by the class during periods when reimbursements or reductions occur. Expenses net of fee waivers reflect expenses after reimbursement by the investment adviser but prior to reductions from expense offset arrangements. Expenses net of all reductions represent the net expenses paid by the class but do not include expenses of the underlying funds in which the Fund invests.
G Annualized
H Amount represents less than .005%.
See accompanying notes which are an integral part of the financial statements.
Fidelity Advisor Freedom 2010 Fund Class Z6
| | Six months ended (Unaudited) September 30, | Years endedMarch 31, |
| | 2018 | 2018 A |
| Selected Per–Share Data | | |
| Net asset value, beginning of period | $12.47 | $12.50 |
| Income from Investment Operations | | |
| Net investment income (loss)B | .11 | .05 |
| Net realized and unrealized gain (loss) | .13 | .53 |
| Total from investment operations | .24 | .58 |
| Distributions from net investment income | (.03) | (.20) |
| Distributions from net realized gain | (.37) | (.42) |
| Total distributions | (.40) | (.61)C |
| Net asset value, end of period | $12.31 | $12.47 |
| Total ReturnD,E | 1.98% | 4.62% |
| Ratios to Average Net AssetsF,G | | |
| Expenses before reductions | .39%H | .41%H,I |
| Expenses net of fee waivers, if any | .39%H | .41%H,I |
| Expenses net of all reductions | .39%H | .41%H,I |
| Net investment income (loss) | 1.73%H | .45%H |
| Supplemental Data | | |
| Net assets, end of period (000 omitted) | $4,968 | $4,744 |
| Portfolio turnover rateF | 29%H | 20% |
A For the period June 6, 2017 (commencement of sale of shares) to March 31, 2018.
B Calculated based on average shares outstanding during the period.
C Total distributions of $.61 per share is comprised of distributions from net investment income of $.195 and distributions from net realized gain of $.416 per share.
D Total returns for periods of less than one year are not annualized.
E Total returns would have been lower if certain expenses had not been reduced during the applicable periods shown.
F Amounts do not include the activity of the Underlying Funds.
G Expense ratios reflect operating expenses of the class. Expenses before reductions do not reflect amounts reimbursed by the investment adviser or reductions from expense offset arrangements and do not represent the amount paid by the class during periods when reimbursements or reductions occur. Expenses net of fee waivers reflect expenses after reimbursement by the investment adviser but prior to reductions from expense offset arrangements. Expenses net of all reductions represent the net expenses paid by the class but do not include expenses of the underlying funds in which the Fund invests.
H Annualized
I On certain classes, the size and fluctuation of net assets and expense amounts may cause ratios to differ from contractual rates.
See accompanying notes which are an integral part of the financial statements.
Fidelity Advisor Freedom® 2015 Fund
Investment Summary (Unaudited)
The information in the following tables is based on the direct investments of the Fund.
Top Holdings as of September 30, 2018
| | % of fund's net assets |
| Fidelity Series Investment Grade Bond Fund | 26.5 |
| Fidelity Series Government Money Market Fund 2.12% | 8.9 |
| Fidelity Series Inflation-Protected Bond Index Fund | 6.9 |
| Fidelity Series Large Cap Stock Fund | 6.0 |
| Fidelity Series Emerging Markets Opportunities Fund | 5.1 |
| Fidelity Series Long-Term Treasury Bond Index Fund | 4.9 |
| Fidelity Series International Growth Fund | 4.9 |
| Fidelity Series International Value Fund | 4.9 |
| Fidelity Series Stock Selector Large Cap Value Fund | 3.9 |
| Fidelity Series Value Discovery Fund | 3.8 |
| | 75.8 |
Asset Allocation (% of fund's net assets)
| Period end |
| | Domestic Equity Funds | 30.6% |
| | International Equity Funds | 16.9% |
| | Bond Funds | 41.1% |
| | Short-Term Funds | 11.4% |
| | Short-Term Investments | 0.1% |
| | Net Other Assets (Liabilities)* | (0.1)% |

* Net Other Assets (Liabilities) are not included in the pie chart
Domestic Equity Funds category includes Fidelity Series Commodity Strategy Fund which invests in commodity-related investments.
Fidelity Advisor Freedom® 2015 Fund
Schedule of Investments September 30, 2018 (Unaudited)
Showing Percentage of Net Assets
| U.S. Treasury Obligations - 0.1% | | | |
| | | Principal Amount | Value |
| U.S. Treasury Bills, yield at date of purchase 1.97% to 2.09% 11/1/18 to 11/29/18 (a) | | | |
| (Cost $727,768) | | 730,000 | 727,716 |
| | | Shares | Value |
|
| Domestic Equity Funds - 30.6% | | | |
| Fidelity Advisor Series Equity Growth Fund (b) | | 2,380,504 | $36,802,593 |
| Fidelity Advisor Series Growth Opportunities Fund (b) | | 1,474,936 | 24,542,929 |
| Fidelity Advisor Series Small Cap Fund (b) | | 1,381,670 | 17,367,591 |
| Fidelity Series All-Sector Equity Fund (b) | | 1,174,373 | 15,983,211 |
| Fidelity Series Commodity Strategy Fund (b) | | 4,262,930 | 21,314,648 |
| Fidelity Series Large Cap Stock Fund (b) | | 4,007,165 | 63,834,138 |
| Fidelity Series Large Cap Value Index Fund (b) | | 528,940 | 6,982,009 |
| Fidelity Series Opportunistic Insights Fund (b) | | 1,723,400 | 34,209,493 |
| Fidelity Series Small Cap Opportunities Fund (b) | | 1,487,144 | 21,846,151 |
| Fidelity Series Stock Selector Large Cap Value Fund (b) | | 3,120,586 | 41,254,145 |
| Fidelity Series Value Discovery Fund (b) | | 2,973,028 | 40,700,750 |
| TOTAL DOMESTIC EQUITY FUNDS | | | |
| (Cost $237,758,390) | | | 324,837,658 |
|
| International Equity Funds - 16.9% | | | |
| Fidelity Series Canada Fund (b) | | 469,784 | 5,078,361 |
| Fidelity Series Emerging Markets Fund (b) | | 477,859 | 4,630,450 |
| Fidelity Series Emerging Markets Opportunities Fund (b) | | 2,833,564 | 54,376,086 |
| Fidelity Series International Growth Fund (b) | | 3,143,319 | 51,550,432 |
| Fidelity Series International Small Cap Fund (b) | | 677,941 | 12,135,145 |
| Fidelity Series International Value Fund (b) | | 4,895,921 | 51,505,093 |
| TOTAL INTERNATIONAL EQUITY FUNDS | | | |
| (Cost $128,482,828) | | | 179,275,567 |
|
| Bond Funds - 41.1% | | | |
| Fidelity Series Emerging Markets Debt Fund (b) | | 800,149 | 7,625,416 |
| Fidelity Series Floating Rate High Income Fund (b) | | 265,953 | 2,531,872 |
| Fidelity Series High Income Fund (b) | | 1,491,639 | 14,334,652 |
| Fidelity Series Inflation-Protected Bond Index Fund (b) | | 7,529,224 | 73,108,768 |
| Fidelity Series International Credit Fund (b) | | 61,699 | 606,505 |
| Fidelity Series Investment Grade Bond Fund (b) | | 25,836,693 | 281,361,590 |
| Fidelity Series Long-Term Treasury Bond Index Fund (b) | | 6,353,810 | 52,355,392 |
| Fidelity Series Real Estate Income Fund (b) | | 472,246 | 5,090,813 |
| TOTAL BOND FUNDS | | | |
| (Cost $440,260,965) | | | 437,015,008 |
|
| Short-Term Funds - 11.4% | | | |
| Fidelity Cash Central Fund, 2.11% (c) | | 1,548,501 | 1,548,811 |
| Fidelity Series Government Money Market Fund 2.12% (b)(d) | | 94,047,905 | 94,047,905 |
| Fidelity Series Short-Term Credit Fund (b) | | 2,596,030 | 25,596,854 |
| TOTAL SHORT-TERM FUNDS | | | |
| (Cost $121,479,616) | | | 121,193,570 |
| TOTAL INVESTMENT IN SECURITIES - 100.1% | | | |
| (Cost $928,709,567) | | | 1,063,049,519 |
| NET OTHER ASSETS (LIABILITIES) - (0.1)% | | | (749,484) |
| NET ASSETS - 100% | | | $1,062,300,035 |
| Futures Contracts | | | | | |
| | Number of contracts | Expiration Date | Notional Amount | Value | Unrealized Appreciation/(Depreciation) |
| Purchased | | | | | |
| Equity Index Contracts | | | | | |
| ICE E-mini MSCI Emerging Markets Index Contracts (United States) | 92 | Dec. 2018 | $4,828,620 | $95,080 | $95,080 |
| Sold | | | | | |
| Equity Index Contracts | | | | | |
| CME E-mini S&P 500 Index Contracts (United States) | 50 | Dec. 2018 | 7,297,500 | (6,296) | (6,296) |
| TOTAL FUTURES CONTRACTS | | | | | $88,784 |
The notional amount of futures purchased as a percentage of Net Assets is 0.5%
The notional amount of futures sold as a percentage of Net Assets is 0.7%
Legend
(a) Security or a portion of the security was pledged to cover margin requirements for futures contracts. At period end, the value of securities pledged amounted to $580,204.
(b) Affiliated Fund
(c) Affiliated fund that is generally available only to investment companies and other accounts managed by Fidelity Investments. The rate quoted is the annualized seven-day yield of the fund at period end. A complete unaudited listing of the fund's holdings as of its most recent quarter end is available upon request. In addition, each Fidelity Central Fund's financial statements are available on the SEC's website or upon request.
(d) The rate quoted is the annualized seven-day yield of the fund at period end.
Affiliated Central Funds
Information regarding fiscal year to date income earned by the Fund from investments in Fidelity Central Funds is as follows:
| Fund | Income earned |
| Fidelity Cash Central Fund | $5,410 |
| Total | $5,410 |
Amounts in the income column in the above table include any capital gain distributions from underlying funds, which are presented in the corresponding line-item in the Statement of Operations if applicable.
Affiliated Underlying Funds
Fiscal year to date information regarding the Fund's investments in affiliated Underlying Funds, excluding any Money Market Central Funds, is presented below. Exchanges between classes of the same affiliated Underlying Funds may occur.
| Affiliate | Value, beginning of period | Purchases | Sales Proceeds | Dividend Income | Realized Gain (loss) | Change in Unrealized appreciation (depreciation) | Value, end of period |
| Fidelity Advisor Series Equity Growth Fund | $37,891,446 | $282,916 | $6,552,137 | $ - | $1,438,268 | $3,742,100 | $36,802,593 |
| Fidelity Advisor Series Equity Value Fund | 43,651,783 | 1,656,198 | 5,722,681 | 1,314,556 | 1,056,853 | (8,551,333) | - |
| Fidelity Advisor Series Growth & Income Fund | 66,814,273 | 5,971,811 | 10,530,736 | 5,486,222 | 504,557 | (14,109,562) | - |
| Fidelity Advisor Series Growth Opportunities Fund | 24,894,051 | 186,011 | 6,639,321 | - | 2,269,083 | 3,833,105 | 24,542,929 |
| Fidelity Advisor Series Opportunistic Insights Fund | 35,344,528 | 2,747,572 | 6,063,396 | 2,496,531 | 2,234,625 | (15,007,785) | - |
| Fidelity Advisor Series Small Cap Fund | 18,976,799 | 138,686 | 2,813,462 | - | 498,158 | 567,410 | 17,367,591 |
| Fidelity Advisor Series Stock Selector Large Cap Value Fund | 44,062,046 | 3,642,226 | 5,808,563 | 3,336,667 | 1,101,002 | (8,686,915) | - |
| Fidelity Series 100 Index Fund | 18,832,089 | - | 19,671,736 | - | 9,254,652 | (8,415,005) | - |
| Fidelity Series All-Sector Equity Fund | 25,994,366 | 209,736 | 12,952,866 | - | 2,828,696 | (96,721) | 15,983,211 |
| Fidelity Series Canada Fund | 5,562,712 | 39,386 | 861,216 | - | 12,463 | 325,016 | 5,078,361 |
| Fidelity Series Commodity Strategy Fund | 23,427,565 | 3,190,650 | 3,547,750 | 1,279,772 | (1,344,245) | (411,572) | 21,314,648 |
| Fidelity Series Emerging Markets Debt Fund | 8,307,794 | 284,419 | 517,220 | 237,472 | (23,044) | (426,533) | 7,625,416 |
| Fidelity Series Emerging Markets Fund | - | 4,628,714 | - | - | - | 1,736 | 4,630,450 |
| Fidelity Series Emerging Markets Opportunities Fund | 62,250,067 | 4,603,856 | 4,695,710 | - | 219,527 | (8,001,654) | 54,376,086 |
| Fidelity Series Floating Rate High Income Fund | 2,656,415 | 88,481 | 215,508 | 74,384 | (7,746) | 10,230 | 2,531,872 |
| Fidelity Series Government Money Market Fund 2.12% | 119,493,654 | 14,190,732 | 39,636,481 | 1,082,585 | - | - | 94,047,905 |
| Fidelity Series High Income Fund | 16,441,680 | 535,080 | 2,768,715 | 433,303 | (110,798) | 237,405 | 14,334,652 |
| Fidelity Series Inflation-Protected Bond Index Fund | 21,521,301 | 54,561,039 | 2,714,760 | 70,716 | (21,960) | (236,852) | 73,108,768 |
| Fidelity Series International Credit Fund | 605,136 | 7,456 | - | 7,458 | - | (6,087) | 606,505 |
| Fidelity Series International Growth Fund | 57,433,691 | 1,143,703 | 7,810,945 | - | 2,836,992 | (2,053,009) | 51,550,432 |
| Fidelity Series International Small Cap Fund | 14,297,809 | 349,008 | 1,998,984 | - | 701,063 | (1,213,751) | 12,135,145 |
| Fidelity Series International Value Fund | 56,727,990 | 398,441 | 5,396,382 | - | 670,509 | (895,465) | 51,505,093 |
| Fidelity Series Investment Grade Bond Fund | 312,691,131 | 6,342,948 | 34,184,120 | 4,205,190 | (1,058,754) | (2,429,615) | 281,361,590 |
| Fidelity Series Large Cap Stock Fund | - | 23,151 | 94,036 | - | (765) | 15,255,445 | 63,834,138 |
| Fidelity Series Large Cap Value Index Fund | 7,381,653 | 75,212 | 972,223 | - | 199,354 | 298,013 | 6,982,009 |
| Fidelity Series Long-Term Treasury Bond Index Fund | 24,264,680 | 32,207,350 | 2,467,167 | 499,524 | (76,255) | (1,573,216) | 52,355,392 |
| Fidelity Series Opportunistic Insights Fund | - | 12,560 | 50,415 | - | 35 | 14,991,769 | 34,209,493 |
| Fidelity Series Real Estate Equity Fund | 4,572,433 | 35,205 | 4,731,454 | 31,043 | 793,797 | (669,981) | - |
| Fidelity Series Real Estate Income Fund | 5,209,016 | 254,685 | 405,241 | 217,809 | 21,220 | 11,133 | 5,090,813 |
| Fidelity Series Short-Term Credit Fund | 29,016,136 | 538,006 | 3,957,442 | 317,563 | (43,421) | 43,575 | 25,596,854 |
| Fidelity Series Small Cap Opportunities Fund | 23,153,614 | 1,863,688 | 4,072,758 | 1,692,787 | 1,549,644 | (648,037) | 21,846,151 |
| Fidelity Series Stock Selector Large Cap Value Fund | - | 22,392 | 156,406 | - | 205 | 7,078,158 | 41,254,145 |
| Fidelity Series Value Discovery Fund | - | 14,914 | 60,487 | - | (529) | 8,656,032 | 40,700,750 |
| | $1,111,475,858 | $140,246,232 | $198,070,318 | $22,783,582 | $25,503,186 | $(18,381,966) | $1,060,772,992 |
Amounts in the income column in the above table include any capital gain distributions from underlying funds, which are presented in the corresponding line-item in the Statement of Operations if applicable.
Investment Valuation
The following is a summary of the inputs used, as of September 30, 2018, involving the Fund's assets and liabilities carried at fair value. The inputs or methodology used for valuing securities may not be an indication of the risk associated with investing in those securities. For more information on valuation inputs, and their aggregation into the levels used below, please refer to the Investment Valuation section in the accompanying Notes to Financial Statements.
| | Valuation Inputs at Reporting Date: |
| Description | Total | Level 1 | Level 2 | Level 3 |
| Investments in Securities: | | | | |
| Other Short-Term Investments | $727,716 | $-- | $727,716 | $-- |
| Domestic Equity Funds | 324,837,658 | 324,837,658 | -- | -- |
| International Equity Funds | 179,275,567 | 179,275,567 | -- | -- |
| Bond Funds | 437,015,008 | 437,015,008 | -- | -- |
| Short-Term Funds | 121,193,570 | 121,193,570 | -- | -- |
| Total Investments in Securities: | $1,063,049,519 | $1,062,321,803 | $727,716 | $-- |
| Derivative Instruments: | | | | |
| Assets | | | | |
| Futures Contracts | $95,080 | $95,080 | $-- | $-- |
| Total Assets | $95,080 | $95,080 | $-- | $-- |
| Liabilities | | | | |
| Futures Contracts | $(6,296) | $(6,296) | $-- | $-- |
| Total Liabilities | $(6,296) | $(6,296) | $-- | $-- |
| Total Derivative Instruments: | $88,784 | $88,784 | $-- | $-- |
Value of Derivative Instruments
The following table is a summary of the Fund's value of derivative instruments by primary risk exposure as of September 30, 2018. For additional information on derivative instruments, please refer to the Derivative Instruments section in the accompanying Notes to Financial Statements.
| Primary Risk Exposure / Derivative Type | Value |
| | Asset | Liability |
| Equity Risk | | |
| Futures Contracts(a) | $95,080 | $(6,296) |
| Total Equity Risk | 95,080 | (6,296) |
| Total Value of Derivatives | $95,080 | $(6,296) |
(a) Reflects gross cumulative appreciation (depreciation) on futures contracts as presented in the Schedule of Investments. In the Statement of Assets and Liabilities, the period end daily variation margin is included in receivable or payable for daily variation margin on futures contracts, and the net cumulative appreciation (depreciation) is included in net unrealized appreciation (depreciation).
See accompanying notes which are an integral part of the financial statements.
Fidelity Advisor Freedom® 2015 Fund
Financial Statements
Statement of Assets and Liabilities
| | | September 30, 2018 (Unaudited) |
| Assets | | |
Investment in securities, at value — See accompanying schedule:
Unaffiliated issuers (cost $727,768) | $727,716 | |
| Fidelity Central Funds (cost $1,548,811) | 1,548,811 | |
| Other affiliated issuers (cost $926,432,988) | 1,060,772,992 | |
| Total Investment in Securities (cost $928,709,567) | | $1,063,049,519 |
| Receivable for investments sold | | 2,134,916 |
| Receivable for fund shares sold | | 404,571 |
| Distributions receivable from Fidelity Central Funds | | 2,172 |
| Total assets | | 1,065,591,178 |
| Liabilities | | |
| Payable for investments purchased | $1,529,099 | |
| Payable for fund shares redeemed | 998,696 | |
| Accrued management fee | 500,446 | |
| Distribution and service plan fees payable | 218,891 | |
| Payable for daily variation margin on futures contracts | 44,011 | |
| Total liabilities | | 3,291,143 |
| Net Assets | | $1,062,300,035 |
| Net Assets consist of: | | |
| Paid in capital | | $886,200,287 |
| Undistributed net investment income | | 6,647,686 |
| Accumulated undistributed net realized gain (loss) on investments | | 35,023,326 |
| Net unrealized appreciation (depreciation) on investments | | 134,428,736 |
| Net Assets | | $1,062,300,035 |
| Calculation of Maximum Offering Price | | |
| Class A: | | |
| Net Asset Value and redemption price per share ($513,320,745 ÷ 41,372,817 shares) | | $12.41 |
| Maximum offering price per share (100/94.25 of $12.41) | | $13.17 |
| Class M: | | |
| Net Asset Value and redemption price per share ($162,401,312 ÷ 13,127,259 shares) | | $12.37 |
| Maximum offering price per share (100/96.50 of $12.37) | | $12.82 |
| Class C: | | |
| Net Asset Value and offering price per share ($53,075,846 ÷ 4,325,968 shares)(a) | | $12.27 |
| Class I: | | |
| Net Asset Value, offering price and redemption price per share ($320,018,464 ÷ 25,563,015 shares) | | $12.52 |
| Class Z6: | | |
| Net Asset Value, offering price and redemption price per share ($13,483,668 ÷ 1,078,306 shares) | | $12.50 |
(a) Redemption price per share is equal to net asset value less any applicable contingent deferred sales charge.
See accompanying notes which are an integral part of the financial statements.
Statement of Operations
| | | Six months ended September 30, 2018 (Unaudited) |
| Investment Income | | |
| Dividends: | | |
| Affiliated issuers | | $11,065,298 |
| Interest | | 2,577 |
| Income from Fidelity Central Funds | | 5,410 |
| Total income | | 11,073,285 |
| Expenses | | |
| Management fee | $3,067,631 | |
| Distribution and service plan fees | 1,347,126 | |
| Independent trustees' fees and expenses | 2,676 | |
| Total expenses before reductions | 4,417,433 | |
| Expense reductions | (37) | |
| Total expenses after reductions | | 4,417,396 |
| Net investment income (loss) | | 6,655,889 |
| Realized and Unrealized Gain (Loss) | | |
| Net realized gain (loss) on: | | |
| Investment securities: | | |
| Fidelity Central Funds | (34) | |
| Other affiliated issuers | 25,503,186 | |
| Futures contracts | (215,546) | |
| Capital gain distributions from underlying funds: | | |
| Affiliated issuers | 11,718,284 | |
| Total net realized gain (loss) | | 37,005,890 |
| Change in net unrealized appreciation (depreciation) on: | | |
| Investment securities: | | |
| Unaffiliated issuers | (47) | |
| Affiliated issuers | (18,381,966) | |
| Futures contracts | 88,784 | |
| Total change in net unrealized appreciation (depreciation) | | (18,293,229) |
| Net gain (loss) | | 18,712,661 |
| Net increase (decrease) in net assets resulting from operations | | $25,368,550 |
See accompanying notes which are an integral part of the financial statements.
Statement of Changes in Net Assets
| | Six months ended September 30, 2018 (Unaudited) | Year ended March 31, 2018 |
| Increase (Decrease) in Net Assets | | |
| Operations | | |
| Net investment income (loss) | $6,655,889 | $14,255,743 |
| Net realized gain (loss) | 37,005,890 | 81,625,051 |
| Change in net unrealized appreciation (depreciation) | (18,293,229) | 210,738 |
| Net increase (decrease) in net assets resulting from operations | 25,368,550 | 96,091,532 |
| Distributions to shareholders from net investment income | (966,089) | (15,646,822) |
| Distributions to shareholders from net realized gain | (39,785,117) | (63,171,458) |
| Total distributions | (40,751,206) | (78,818,280) |
| Share transactions - net increase (decrease) | (33,153,413) | (118,085,087) |
| Total increase (decrease) in net assets | (48,536,069) | (100,811,835) |
| Net Assets | | |
| Beginning of period | 1,110,836,104 | 1,211,647,939 |
| End of period | $1,062,300,035 | $1,110,836,104 |
| Other Information | | |
| Undistributed net investment income end of period | $6,647,686 | $957,886 |
See accompanying notes which are an integral part of the financial statements.
Financial Highlights
Fidelity Advisor Freedom 2015 Fund Class A
| | Six months ended (Unaudited) September 30, | Years endedMarch 31, | | | | |
| | 2018 | 2018 | 2017 | 2016 | 2015 | 2014 |
| Selected Per–Share Data | | | | | | |
| Net asset value, beginning of period | $12.59 | $12.43 | $11.81 | $12.70 | $12.87 | $12.47 |
| Income from Investment Operations | | | | | | |
| Net investment income (loss)A | .08 | .16 | .18 | .20 | .20 | .15 |
| Net realized and unrealized gain (loss) | .21 | .87 | .99 | (.45) | .49 | .89 |
| Total from investment operations | .29 | 1.03 | 1.17 | (.25) | .69 | 1.04 |
| Distributions from net investment income | (.01) | (.18) | (.19) | (.21) | (.21) | (.15) |
| Distributions from net realized gain | (.46) | (.70) | (.36) | (.43) | (.64) | (.50) |
| Total distributions | (.47) | (.87)B | (.55) | (.64) | (.86)C | (.64)D |
| Net asset value, end of period | $12.41 | $12.59 | $12.43 | $11.81 | $12.70 | $12.87 |
| Total ReturnE,F,G | 2.34% | 8.42% | 10.23% | (2.07)% | 5.51% | 8.54% |
| Ratios to Average Net AssetsH,I | | | | | | |
| Expenses before reductions | .82%J | .72% | .25% | .25% | .25% | .25% |
| Expenses net of fee waivers, if any | .82%J | .72% | .25% | .25% | .25% | .25% |
| Expenses net of all reductions | .82%J | .72% | .25% | .25% | .25% | .25% |
| Net investment income (loss) | 1.22%J | 1.22% | 1.46% | 1.64% | 1.58% | 1.19% |
| Supplemental Data | | | | | | |
| Net assets, end of period (000 omitted) | $513,321 | $551,179 | $653,982 | $739,929 | $967,164 | $1,086,606 |
| Portfolio turnover rateH | 26%J | 19% | 22% | 20% | 21% | 37% |
A Calculated based on average shares outstanding during the period.
B Total distributions of $.87 per share is comprised of distributions from net investment income of $.175 and distributions from net realized gain of $.699 per share.
C Total distributions of $.86 per share is comprised of distributions from net investment income of $.214 and distributions from net realized gain of $.642 per share.
D Total distributions of $.64 per share is comprised of distributions from net investment income of $.146 and distributions from net realized gain of $.498 per share.
E Total returns for periods of less than one year are not annualized.
F Total returns would have been lower if certain expenses had not been reduced during the applicable periods shown.
G Total returns do not include the effect of the sales charges.
H Amounts do not include the activity of the Underlying Funds.
I Expense ratios reflect operating expenses of the class. Expenses before reductions do not reflect amounts reimbursed by the investment adviser or reductions from expense offset arrangements and do not represent the amount paid by the class during periods when reimbursements or reductions occur. Expenses net of fee waivers reflect expenses after reimbursement by the investment adviser but prior to reductions from expense offset arrangements. Expenses net of all reductions represent the net expenses paid by the class but do not include expenses of the underlying funds in which the Fund invests.
J Annualized
See accompanying notes which are an integral part of the financial statements.
Fidelity Advisor Freedom 2015 Fund Class M
| | Six months ended (Unaudited) September 30, | Years endedMarch 31, | | | | |
| | 2018 | 2018 | 2017 | 2016 | 2015 | 2014 |
| Selected Per–Share Data | | | | | | |
| Net asset value, beginning of period | $12.56 | $12.41 | $11.79 | $12.68 | $12.85 | $12.46 |
| Income from Investment Operations | | | | | | |
| Net investment income (loss)A | .06 | .12 | .15 | .17 | .17 | .12 |
| Net realized and unrealized gain (loss) | .21 | .87 | .99 | (.45) | .48 | .88 |
| Total from investment operations | .27 | .99 | 1.14 | (.28) | .65 | 1.00 |
| Distributions from net investment income | –B | (.15) | (.16) | (.18) | (.18) | (.11) |
| Distributions from net realized gain | (.46) | (.70) | (.36) | (.43) | (.64) | (.50) |
| Total distributions | (.46) | (.84)C | (.52) | (.61) | (.82) | (.61) |
| Net asset value, end of period | $12.37 | $12.56 | $12.41 | $11.79 | $12.68 | $12.85 |
| Total ReturnD,E,F | 2.19% | 8.10% | 9.98% | (2.32)% | 5.26% | 8.20% |
| Ratios to Average Net AssetsG,H | | | | | | |
| Expenses before reductions | 1.07%I | .98% | .50% | .50% | .50% | .50% |
| Expenses net of fee waivers, if any | 1.07%I | .98% | .50% | .50% | .50% | .50% |
| Expenses net of all reductions | 1.07%I | .98% | .50% | .50% | .50% | .50% |
| Net investment income (loss) | .97%I | .96% | 1.21% | 1.39% | 1.33% | .94% |
| Supplemental Data | | | | | | |
| Net assets, end of period (000 omitted) | $162,401 | $167,835 | $178,795 | $190,018 | $208,468 | $226,663 |
| Portfolio turnover rateG | 26%I | 19% | 22% | 20% | 21% | 37% |
A Calculated based on average shares outstanding during the period.
B Amount represents less than $.005 per share.
C Total distributions of $.84 per share is comprised of distributions from net investment income of $.145 and distributions from net realized gain of $.699 per share.
D Total returns for periods of less than one year are not annualized.
E Total returns would have been lower if certain expenses had not been reduced during the applicable periods shown.
F Total returns do not include the effect of the sales charges.
G Amounts do not include the activity of the Underlying Funds.
H Expense ratios reflect operating expenses of the class. Expenses before reductions do not reflect amounts reimbursed by the investment adviser or reductions from expense offset arrangements and do not represent the amount paid by the class during periods when reimbursements or reductions occur. Expenses net of fee waivers reflect expenses after reimbursement by the investment adviser but prior to reductions from expense offset arrangements. Expenses net of all reductions represent the net expenses paid by the class but do not include expenses of the underlying funds in which the Fund invests.
I Annualized
See accompanying notes which are an integral part of the financial statements.
Fidelity Advisor Freedom 2015 Fund Class C
| | Six months ended (Unaudited) September 30, | Years endedMarch 31, | | | | |
| | 2018 | 2018 | 2017 | 2016 | 2015 | 2014 |
| Selected Per–Share Data | | | | | | |
| Net asset value, beginning of period | $12.47 | $12.32 | $11.72 | $12.60 | $12.77 | $12.39 |
| Income from Investment Operations | | | | | | |
| Net investment income (loss)A | .03 | .06 | .08 | .11 | .11 | .05 |
| Net realized and unrealized gain (loss) | .22 | .86 | .98 | (.45) | .48 | .88 |
| Total from investment operations | .25 | .92 | 1.06 | (.34) | .59 | .93 |
| Distributions from net investment income | – | (.08) | (.10) | (.11) | (.12) | (.06) |
| Distributions from net realized gain | (.45) | (.70) | (.36) | (.43) | (.64) | (.49) |
| Total distributions | (.45) | (.77)B | (.46) | (.54) | (.76) | (.55) |
| Net asset value, end of period | $12.27 | $12.47 | $12.32 | $11.72 | $12.60 | $12.77 |
| Total ReturnC,D,E | 1.99% | 7.57% | 9.33% | (2.76)% | 4.75% | 7.65% |
| Ratios to Average Net AssetsF,G | | | | | | |
| Expenses before reductions | 1.57%H | 1.48% | 1.00% | 1.00% | 1.00% | 1.00% |
| Expenses net of fee waivers, if any | 1.57%H | 1.48% | 1.00% | 1.00% | 1.00% | 1.00% |
| Expenses net of all reductions | 1.57%H | 1.48% | 1.00% | 1.00% | 1.00% | 1.00% |
| Net investment income (loss) | .47%H | .47% | .71% | .89% | .83% | .44% |
| Supplemental Data | | | | | | |
| Net assets, end of period (000 omitted) | $53,076 | $54,730 | $61,332 | $63,443 | $72,725 | $75,682 |
| Portfolio turnover rateF | 26%H | 19% | 22% | 20% | 21% | 37% |
A Calculated based on average shares outstanding during the period.
B Total distributions of $.77 per share is comprised of distributions from net investment income of $.075 and distributions from net realized gain of $.699 per share.
C Total returns for periods of less than one year are not annualized.
D Total returns would have been lower if certain expenses had not been reduced during the applicable periods shown.
E Total returns do not include the effect of the contingent deferred sales charge.
F Amounts do not include the activity of the Underlying Funds.
G Expense ratios reflect operating expenses of the class. Expenses before reductions do not reflect amounts reimbursed by the investment adviser or reductions from expense offset arrangements and do not represent the amount paid by the class during periods when reimbursements or reductions occur. Expenses net of fee waivers reflect expenses after reimbursement by the investment adviser but prior to reductions from expense offset arrangements. Expenses net of all reductions represent the net expenses paid by the class but do not include expenses of the underlying funds in which the Fund invests.
H Annualized
See accompanying notes which are an integral part of the financial statements.
Fidelity Advisor Freedom 2015 Fund Class I
| | Six months ended (Unaudited) September 30, | Years endedMarch 31, | | | | |
| | 2018 | 2018 | 2017 | 2016 | 2015 | 2014 |
| Selected Per–Share Data | | | | | | |
| Net asset value, beginning of period | $12.69 | $12.53 | $11.90 | $12.79 | $12.96 | $12.56 |
| Income from Investment Operations | | | | | | |
| Net investment income (loss)A | .09 | .19 | .21 | .23 | .24 | .18 |
| Net realized and unrealized gain (loss) | .22 | .88 | 1.00 | (.45) | .48 | .90 |
| Total from investment operations | .31 | 1.07 | 1.21 | (.22) | .72 | 1.08 |
| Distributions from net investment income | (.02) | (.21) | (.22) | (.24) | (.25) | (.18) |
| Distributions from net realized gain | (.46) | (.70) | (.36) | (.43) | (.64) | (.50) |
| Total distributions | (.48) | (.91) | (.58) | (.67) | (.89) | (.68) |
| Net asset value, end of period | $12.52 | $12.69 | $12.53 | $11.90 | $12.79 | $12.96 |
| Total ReturnB,C | 2.47% | 8.66% | 10.53% | (1.80)% | 5.74% | 8.75% |
| Ratios to Average Net AssetsD,E | | | | | | |
| Expenses before reductions | .57%F | .48% | - %G | - %G | - %G | - %G |
| Expenses net of fee waivers, if any | .57%F | .48% | -% | -% | -% | -% |
| Expenses net of all reductions | .57%F | .48% | -% | -% | -% | -% |
| Net investment income (loss) | 1.47%F | 1.46% | 1.71% | 1.89% | 1.83% | 1.44% |
| Supplemental Data | | | | | | |
| Net assets, end of period (000 omitted) | $320,018 | $324,189 | $317,539 | $361,722 | $425,176 | $488,611 |
| Portfolio turnover rateD | 26%F | 19% | 22% | 20% | 21% | 37% |
A Calculated based on average shares outstanding during the period.
B Total returns for periods of less than one year are not annualized.
C Total returns would have been lower if certain expenses had not been reduced during the applicable periods shown.
D Amounts do not include the activity of the Underlying Funds.
E Expense ratios reflect operating expenses of the class. Expenses before reductions do not reflect amounts reimbursed by the investment adviser or reductions from expense offset arrangements and do not represent the amount paid by the class during periods when reimbursements or reductions occur. Expenses net of fee waivers reflect expenses after reimbursement by the investment adviser but prior to reductions from expense offset arrangements. Expenses net of all reductions represent the net expenses paid by the class but do not include expenses of the underlying funds in which the Fund invests.
F Annualized
G Amount represents less than .005%.
See accompanying notes which are an integral part of the financial statements.
Fidelity Advisor Freedom 2015 Fund Class Z6
| | Six months ended (Unaudited) September 30, | Years endedMarch 31, |
| | 2018 | 2018 A |
| Selected Per–Share Data | | |
| Net asset value, beginning of period | $12.67 | $12.66 |
| Income from Investment Operations | | |
| Net investment income (loss)B | .10 | .18 |
| Net realized and unrealized gain (loss) | .22 | .51 |
| Total from investment operations | .32 | .69 |
| Distributions from net investment income | (.03) | (.21) |
| Distributions from net realized gain | (.46) | (.47) |
| Total distributions | (.49) | (.68) |
| Net asset value, end of period | $12.50 | $12.67 |
| Total ReturnC,D | 2.55% | 5.42% |
| Ratios to Average Net AssetsE,F | | |
| Expenses before reductions | .41%G | .43%G,H |
| Expenses net of fee waivers, if any | .41%G | .43%G,H |
| Expenses net of all reductions | .41%G | .43%G,H |
| Net investment income (loss) | 1.63%G | 1.75%G |
| Supplemental Data | | |
| Net assets, end of period (000 omitted) | $13,484 | $12,903 |
| Portfolio turnover rateE | 26%G | 19% |
A For the period June 6, 2017 (commencement of sale of shares) to March 31, 2018.
B Calculated based on average shares outstanding during the period.
C Total returns for periods of less than one year are not annualized.
D Total returns would have been lower if certain expenses had not been reduced during the applicable periods shown.
E Amounts do not include the activity of the Underlying Funds.
F Expense ratios reflect operating expenses of the class. Expenses before reductions do not reflect amounts reimbursed by the investment adviser or reductions from expense offset arrangements and do not represent the amount paid by the class during periods when reimbursements or reductions occur. Expenses net of fee waivers reflect expenses after reimbursement by the investment adviser but prior to reductions from expense offset arrangements. Expenses net of all reductions represent the net expenses paid by the class but do not include expenses of the underlying funds in which the Fund invests.
G Annualized
H On certain classes, the size and fluctuation of net assets and expense amounts may cause ratios to differ from contractual rates.
See accompanying notes which are an integral part of the financial statements.
Fidelity Advisor Freedom® 2020 Fund
Investment Summary (Unaudited)
The information in the following tables is based on the direct investments of the Fund.
Top Holdings as of September 30, 2018
| | % of fund's net assets |
| Fidelity Series Investment Grade Bond Fund | 23.4 |
| Fidelity Series Large Cap Stock Fund | 7.1 |
| Fidelity Series Government Money Market Fund 2.12% | 6.7 |
| Fidelity Series Emerging Markets Opportunities Fund | 5.7 |
| Fidelity Series International Growth Fund | 5.6 |
| Fidelity Series International Value Fund | 5.6 |
| Fidelity Series Inflation-Protected Bond Index Fund | 5.1 |
| Fidelity Series Long-Term Treasury Bond Index Fund | 5.0 |
| Fidelity Series Stock Selector Large Cap Value Fund | 4.6 |
| Fidelity Series Value Discovery Fund | 4.6 |
| | 73.4 |
Asset Allocation (% of fund's net assets)
| Period end |
| | Domestic Equity Funds | 35.8% |
| | International Equity Funds | 19.1% |
| | Bond Funds | 36.4% |
| | Short-Term Funds | 8.7% |
| | Short-Term Investments | 0.1% |
| | Net Other Assets (Liabilities)* | (0.1)% |

* Net Other Assets (Liabilities) are not included in the pie chart
Domestic Equity Funds category includes Fidelity Series Commodity Strategy Fund which invests in commodity-related investments.
Fidelity Advisor Freedom® 2020 Fund
Schedule of Investments September 30, 2018 (Unaudited)
Showing Percentage of Net Assets
| U.S. Treasury Obligations - 0.1% | | | |
| | | Principal Amount | Value |
| U.S. Treasury Bills, yield at date of purchase 1.95% to 2.09% 10/4/18 to 11/29/18 (a) | | | |
| (Cost $1,555,215) | | 1,560,000 | 1,555,112 |
| | | Shares | Value |
|
| Domestic Equity Funds - 35.8% | | | |
| Fidelity Advisor Series Equity Growth Fund (b) | | 6,497,301 | $100,448,277 |
| Fidelity Advisor Series Growth Opportunities Fund (b) | | 4,025,902 | 66,991,017 |
| Fidelity Advisor Series Small Cap Fund (b) | | 3,760,308 | 47,267,071 |
| Fidelity Series All-Sector Equity Fund (b) | | 3,231,260 | 43,977,444 |
| Fidelity Series Commodity Strategy Fund (b) | | 9,823,537 | 49,117,685 |
| Fidelity Series Large Cap Stock Fund (b) | | 10,937,325 | 174,231,594 |
| Fidelity Series Large Cap Value Index Fund (b) | | 1,444,646 | 19,069,326 |
| Fidelity Series Opportunistic Insights Fund (b) | | 4,704,091 | 93,376,212 |
| Fidelity Series Small Cap Opportunities Fund (b) | | 4,059,610 | 59,635,670 |
| Fidelity Series Stock Selector Large Cap Value Fund (b) | | 8,518,141 | 112,609,828 |
| Fidelity Series Value Discovery Fund (b) | | 8,115,440 | 111,100,367 |
| TOTAL DOMESTIC EQUITY FUNDS | | | |
| (Cost $650,132,437) | | | 877,824,491 |
|
| International Equity Funds - 19.1% | | | |
| Fidelity Series Canada Fund (b) | | 1,317,370 | 14,240,764 |
| Fidelity Series Emerging Markets Fund (b) | | 696,051 | 6,744,733 |
| Fidelity Series Emerging Markets Opportunities Fund (b) | | 7,313,750 | 140,350,867 |
| Fidelity Series International Growth Fund (b) | | 8,331,063 | 136,629,428 |
| Fidelity Series International Small Cap Fund (b) | | 1,792,446 | 32,084,788 |
| Fidelity Series International Value Fund (b) | | 12,964,894 | 136,390,683 |
| TOTAL INTERNATIONAL EQUITY FUNDS | | | |
| (Cost $342,996,041) | | | 466,441,263 |
|
| Bond Funds - 36.4% | | | |
| Fidelity Series Emerging Markets Debt Fund (b) | | 1,766,007 | 16,830,048 |
| Fidelity Series Floating Rate High Income Fund (b) | | 599,079 | 5,703,232 |
| Fidelity Series High Income Fund (b) | | 3,533,325 | 33,955,253 |
| Fidelity Series Inflation-Protected Bond Index Fund (b) | | 12,864,535 | 124,914,631 |
| Fidelity Series International Credit Fund (b) | | 132,613 | 1,303,590 |
| Fidelity Series Investment Grade Bond Fund (b) | | 52,717,585 | 574,094,499 |
| Fidelity Series Long-Term Treasury Bond Index Fund (b) | | 14,956,434 | 123,241,015 |
| Fidelity Series Real Estate Income Fund (b) | | 1,068,440 | 11,517,787 |
| TOTAL BOND FUNDS | | | |
| (Cost $913,115,358) | | | 891,560,055 |
|
| Short-Term Funds - 8.7% | | | |
| Fidelity Cash Central Fund, 2.11% (c) | | 4,120,886 | 4,121,710 |
| Fidelity Series Government Money Market Fund 2.12% (b)(d) | | 164,261,368 | 164,261,368 |
| Fidelity Series Short-Term Credit Fund (b) | | 4,637,953 | 45,730,217 |
| TOTAL SHORT-TERM FUNDS | | | |
| (Cost $214,622,531) | | | 214,113,295 |
| TOTAL INVESTMENT IN SECURITIES - 100.1% | | | |
| (Cost $2,122,421,582) | | | 2,451,494,216 |
| NET OTHER ASSETS (LIABILITIES) - (0.1)% | | | (1,773,947) |
| NET ASSETS - 100% | | | $2,449,720,269 |
| Futures Contracts | | | | | |
| | Number of contracts | Expiration Date | Notional Amount | Value | Unrealized Appreciation/(Depreciation) |
| Purchased | | | | | |
| Equity Index Contracts | | | | | |
| ICE E-mini MSCI Emerging Markets Index Contracts (United States) | 287 | Dec. 2018 | $15,063,195 | $282,354 | $282,354 |
| Sold | | | | | |
| Equity Index Contracts | | | | | |
| CME E-mini S&P 500 Index Contracts (United States) | 112 | Dec. 2018 | 16,346,400 | (15,041) | (15,041) |
| TOTAL FUTURES CONTRACTS | | | | | $267,313 |
The notional amount of futures purchased as a percentage of Net Assets is 0.6%
The notional amount of futures sold as a percentage of Net Assets is 0.7%
Legend
(a) Security or a portion of the security was pledged to cover margin requirements for futures contracts. At period end, the value of securities pledged amounted to $1,097,705.
(b) Affiliated Fund
(c) Affiliated fund that is generally available only to investment companies and other accounts managed by Fidelity Investments. The rate quoted is the annualized seven-day yield of the fund at period end. A complete unaudited listing of the fund's holdings as of its most recent quarter end is available upon request. In addition, each Fidelity Central Fund's financial statements are available on the SEC's website or upon request.
(d) The rate quoted is the annualized seven-day yield of the fund at period end.
Affiliated Central Funds
Information regarding fiscal year to date income earned by the Fund from investments in Fidelity Central Funds is as follows:
| Fund | Income earned |
| Fidelity Cash Central Fund | $12,038 |
| Total | $12,038 |
Amounts in the income column in the above table include any capital gain distributions from underlying funds, which are presented in the corresponding line-item in the Statement of Operations if applicable.
Affiliated Underlying Funds
Fiscal year to date information regarding the Fund's investments in affiliated Underlying Funds, excluding any Money Market Central Funds, is presented below. Exchanges between classes of the same affiliated Underlying Funds may occur.
| Affiliate | Value, beginning of period | Purchases | Sales Proceeds | Dividend Income | Realized Gain (loss) | Change in Unrealized appreciation (depreciation) | Value, end of period |
| Fidelity Advisor Series Equity Growth Fund | $97,996,442 | $1,090,875 | $12,256,439 | $ - | $1,424,244 | $12,193,155 | $100,448,277 |
| Fidelity Advisor Series Equity Value Fund | 112,977,029 | 4,851,014 | 9,367,482 | 3,594,095 | 575,945 | (21,311,894) | - |
| Fidelity Advisor Series Growth & Income Fund | 172,970,500 | 16,688,509 | 19,127,430 | 14,743,256 | 964,547 | (32,886,455) | - |
| Fidelity Advisor Series Growth Opportunities Fund | 64,366,555 | 717,908 | 14,143,503 | - | 4,271,998 | 11,778,059 | 66,991,017 |
| Fidelity Advisor Series Opportunistic Insights Fund | 91,315,922 | 7,831,256 | 11,088,207 | 6,825,313 | 2,240,465 | (37,653,473) | - |
| Fidelity Advisor Series Small Cap Fund | 49,077,299 | 536,780 | 5,122,083 | - | 567,141 | 2,207,934 | 47,267,071 |
| Fidelity Advisor Series Stock Selector Large Cap Value Fund | 114,047,646 | 10,209,187 | 9,656,059 | 9,096,431 | 653,530 | (21,613,588) | - |
| Fidelity Series 100 Index Fund | 48,677,255 | - | 51,233,085 | - | 20,253,867 | (17,698,037) | - |
| Fidelity Series All-Sector Equity Fund | 67,245,550 | 782,700 | 31,298,111 | - | 6,358,973 | 888,332 | 43,977,444 |
| Fidelity Series Canada Fund | 14,121,725 | 148,784 | 892,176 | - | 6,338 | 856,093 | 14,240,764 |
| Fidelity Series Commodity Strategy Fund | 53,066,753 | 7,172,660 | 7,097,912 | 2,948,556 | (2,633,367) | (1,390,449) | 49,117,685 |
| Fidelity Series Emerging Markets Debt Fund | 18,075,963 | 678,981 | 941,619 | 521,431 | (39,369) | (943,908) | 16,830,048 |
| Fidelity Series Emerging Markets Fund | - | 6,751,163 | - | - | - | (6,430) | 6,744,733 |
| Fidelity Series Emerging Markets Opportunities Fund | 154,150,718 | 14,781,209 | 9,009,138 | - | 21,422 | (19,593,344) | 140,350,867 |
| Fidelity Series Floating Rate High Income Fund | 5,870,063 | 219,825 | 392,341 | 154,173 | (9,845) | 15,530 | 5,703,232 |
| Fidelity Series Government Money Market Fund 2.12% | 204,141,698 | 29,762,864 | 69,643,194 | 1,880,422 | - | - | 164,261,368 |
| Fidelity Series High Income Fund | 36,542,127 | 1,348,508 | 4,226,625 | 1,007,086 | (149,706) | 440,949 | 33,955,253 |
| Fidelity Series Inflation-Protected Bond Index Fund | 28,559,768 | 100,618,081 | 3,746,584 | 112,656 | (45,685) | (470,949) | 124,914,631 |
| Fidelity Series International Credit Fund | 1,300,646 | 16,029 | - | 16,029 | - | (13,085) | 1,303,590 |
| Fidelity Series International Growth Fund | 144,970,532 | 3,292,732 | 13,759,858 | - | 4,309,435 | (2,183,413) | 136,629,428 |
| Fidelity Series International Small Cap Fund | 36,256,739 | 1,346,054 | 4,201,866 | - | 988,822 | (2,304,961) | 32,084,788 |
| Fidelity Series International Value Fund | 143,946,261 | 1,813,703 | 8,884,599 | - | 720,698 | (1,205,380) | 136,390,683 |
| Fidelity Series Investment Grade Bond Fund | 637,028,192 | 14,871,185 | 70,656,747 | 8,602,340 | (2,824,683) | (4,323,448) | 574,094,499 |
| Fidelity Series Large Cap Stock Fund | - | 19,215 | 445,408 | - | (5,298) | 36,053,414 | 174,231,594 |
| Fidelity Series Large Cap Value Index Fund | 19,081,531 | 286,218 | 1,613,868 | - | 258,596 | 1,056,849 | 19,069,326 |
| Fidelity Series Long-Term Treasury Bond Index Fund | 55,292,489 | 76,121,780 | 4,187,581 | 1,195,989 | (43,260) | (3,942,413) | 123,241,015 |
| Fidelity Series Opportunistic Insights Fund | - | 10,298 | 240,426 | - | (937) | 40,961,314 | 93,376,212 |
| Fidelity Series Real Estate Equity Fund | 11,817,048 | 75,560 | 12,196,466 | 64,942 | 1,586,811 | (1,282,953) | - |
| Fidelity Series Real Estate Income Fund | 11,569,965 | 614,208 | 737,806 | 490,565 | 27,916 | 43,504 | 11,517,787 |
| Fidelity Series Short-Term Credit Fund | 49,294,490 | 1,096,467 | 4,660,858 | 548,805 | (39,152) | 39,270 | 45,730,217 |
| Fidelity Series Small Cap Opportunities Fund | 59,875,853 | 5,278,899 | 7,756,053 | 4,620,502 | 2,021,348 | 215,623 | 59,635,670 |
| Fidelity Series Stock Selector Large Cap Value Fund | - | 159,363 | 500,759 | - | (456) | 19,310,964 | 112,609,828 |
| Fidelity Series Value Discovery Fund | - | 12,330 | 286,087 | - | (3,761) | 23,653,273 | 111,100,367 |
| | $2,503,636,759 | $309,204,345 | $389,370,370 | $56,422,591 | $41,456,577 | $(19,109,917) | $2,445,817,394 |
Amounts in the income column in the above table include any capital gain distributions from underlying funds, which are presented in the corresponding line-item in the Statement of Operations if applicable.
Investment Valuation
The following is a summary of the inputs used, as of September 30, 2018, involving the Fund's assets and liabilities carried at fair value. The inputs or methodology used for valuing securities may not be an indication of the risk associated with investing in those securities. For more information on valuation inputs, and their aggregation into the levels used below, please refer to the Investment Valuation section in the accompanying Notes to Financial Statements.
| | Valuation Inputs at Reporting Date: |
| Description | Total | Level 1 | Level 2 | Level 3 |
| Investments in Securities: | | | | |
| Other Short-Term Investments | $1,555,112 | $-- | $1,555,112 | $-- |
| Domestic Equity Funds | 877,824,491 | 877,824,491 | -- | -- |
| International Equity Funds | 466,441,263 | 466,441,263 | -- | -- |
| Bond Funds | 891,560,055 | 891,560,055 | -- | -- |
| Short-Term Funds | 214,113,295 | 214,113,295 | -- | -- |
| Total Investments in Securities: | $2,451,494,216 | $2,449,939,104 | $1,555,112 | $-- |
| Derivative Instruments: | | | | |
| Assets | | | | |
| Futures Contracts | $282,354 | $282,354 | $-- | $-- |
| Total Assets | $282,354 | $282,354 | $-- | $-- |
| Liabilities | | | | |
| Futures Contracts | $(15,041) | $(15,041) | $-- | $-- |
| Total Liabilities | $(15,041) | $(15,041) | $-- | $-- |
| Total Derivative Instruments: | $267,313 | $267,313 | $-- | $-- |
Value of Derivative Instruments
The following table is a summary of the Fund's value of derivative instruments by primary risk exposure as of September 30, 2018. For additional information on derivative instruments, please refer to the Derivative Instruments section in the accompanying Notes to Financial Statements.
| Primary Risk Exposure / Derivative Type | Value |
| | Asset | Liability |
| Equity Risk | | |
| Futures Contracts(a) | $282,354 | $(15,041) |
| Total Equity Risk | 282,354 | (15,041) |
| Total Value of Derivatives | $282,354 | $(15,041) |
(a) Reflects gross cumulative appreciation (depreciation) on futures contracts as presented in the Schedule of Investments. In the Statement of Assets and Liabilities, the period end daily variation margin is included in receivable or payable for daily variation margin on futures contracts, and the net cumulative appreciation (depreciation) is included in net unrealized appreciation (depreciation).
See accompanying notes which are an integral part of the financial statements.
Fidelity Advisor Freedom® 2020 Fund
Financial Statements
Statement of Assets and Liabilities
| | | September 30, 2018 (Unaudited) |
| Assets | | |
Investment in securities, at value — See accompanying schedule:
Unaffiliated issuers (cost $1,555,215) | $1,555,112 | |
| Fidelity Central Funds (cost $4,121,710) | 4,121,710 | |
| Other affiliated issuers (cost $2,116,744,657) | 2,445,817,394 | |
| Total Investment in Securities (cost $2,122,421,582) | | $2,451,494,216 |
| Receivable for investments sold | | 6,415,339 |
| Receivable for fund shares sold | | 1,742,837 |
| Distributions receivable from Fidelity Central Funds | | 5,907 |
| Total assets | | 2,459,658,299 |
| Liabilities | | |
| Payable for investments purchased | $2,951,701 | |
| Payable for fund shares redeemed | 5,162,754 | |
| Accrued management fee | 1,239,415 | |
| Distribution and service plan fees payable | 467,537 | |
| Payable for daily variation margin on futures contracts | 116,623 | |
| Total liabilities | | 9,938,030 |
| Net Assets | | $2,449,720,269 |
| Net Assets consist of: | | |
| Paid in capital | | $2,038,672,935 |
| Undistributed net investment income | | 14,190,650 |
| Accumulated undistributed net realized gain (loss) on investments | | 67,516,737 |
| Net unrealized appreciation (depreciation) on investments | | 329,339,947 |
| Net Assets | | $2,449,720,269 |
| Calculation of Maximum Offering Price | | |
| Class A: | | |
| Net Asset Value and redemption price per share ($1,118,826,042 ÷ 82,304,950 shares) | | $13.59 |
| Maximum offering price per share (100/94.25 of $13.59) | | $14.42 |
| Class M: | | |
| Net Asset Value and redemption price per share ($367,155,036 ÷ 27,038,637 shares) | | $13.58 |
| Maximum offering price per share (100/96.50 of $13.58) | | $14.07 |
| Class C: | | |
| Net Asset Value and offering price per share ($97,906,837 ÷ 7,278,073 shares)(a) | | $13.45 |
| Class I: | | |
| Net Asset Value, offering price and redemption price per share ($829,133,332 ÷ 60,461,925 shares) | | $13.71 |
| Class Z6: | | |
| Net Asset Value, offering price and redemption price per share ($36,699,022 ÷ 2,679,584 shares) | | $13.70 |
(a) Redemption price per share is equal to net asset value less any applicable contingent deferred sales charge.
See accompanying notes which are an integral part of the financial statements.
Statement of Operations
| | | Six months ended September 30, 2018 (Unaudited) |
| Investment Income | | |
| Dividends: | | |
| Affiliated issuers | | $24,608,223 |
| Interest | | 6,273 |
| Income from Fidelity Central Funds | | 12,038 |
| Total income | | 24,626,534 |
| Expenses | | |
| Management fee | $7,539,185 | |
| Distribution and service plan fees | 2,866,648 | |
| Independent trustees' fees and expenses | 6,070 | |
| Total expenses before reductions | 10,411,903 | |
| Expense reductions | (39) | |
| Total expenses after reductions | | 10,411,864 |
| Net investment income (loss) | | 14,214,670 |
| Realized and Unrealized Gain (Loss) | | |
| Net realized gain (loss) on: | | |
| Investment securities: | | |
| Fidelity Central Funds | (35) | |
| Other affiliated issuers | 41,456,577 | |
| Futures contracts | (914,042) | |
| Capital gain distributions from underlying funds: | | |
| Affiliated issuers | 31,814,368 | |
| Total net realized gain (loss) | | 72,356,868 |
| Change in net unrealized appreciation (depreciation) on: | | |
| Investment securities: | | |
| Unaffiliated issuers | (91) | |
| Affiliated issuers | (19,109,917) | |
| Futures contracts | 267,313 | |
| Total change in net unrealized appreciation (depreciation) | | (18,842,695) |
| Net gain (loss) | | 53,514,173 |
| Net increase (decrease) in net assets resulting from operations | | $67,728,843 |
See accompanying notes which are an integral part of the financial statements.
Statement of Changes in Net Assets
| | Six months ended September 30, 2018 (Unaudited) | Year ended March 31, 2018 |
| Increase (Decrease) in Net Assets | | |
| Operations | | |
| Net investment income (loss) | $14,214,670 | $30,214,061 |
| Net realized gain (loss) | 72,356,868 | 162,690,491 |
| Change in net unrealized appreciation (depreciation) | (18,842,695) | 32,981,869 |
| Net increase (decrease) in net assets resulting from operations | 67,728,843 | 225,886,421 |
| Distributions to shareholders from net investment income | (1,169,226) | (33,576,472) |
| Distributions to shareholders from net realized gain | (87,706,280) | (112,956,333) |
| Total distributions | (88,875,506) | (146,532,805) |
| Share transactions - net increase (decrease) | (31,303,153) | (133,083,804) |
| Total increase (decrease) in net assets | (52,449,816) | (53,730,188) |
| Net Assets | | |
| Beginning of period | 2,502,170,085 | 2,555,900,273 |
| End of period | $2,449,720,269 | $2,502,170,085 |
| Other Information | | |
| Undistributed net investment income end of period | $14,190,650 | $1,145,206 |
See accompanying notes which are an integral part of the financial statements.
Financial Highlights
Fidelity Advisor Freedom 2020 Fund Class A
| | Six months ended (Unaudited) September 30, | Years endedMarch 31, | | | | |
| | 2018 | 2018 | 2017 | 2016 | 2015 | 2014 |
| Selected Per–Share Data | | | | | | |
| Net asset value, beginning of period | $13.71 | $13.31 | $12.51 | $13.44 | $13.54 | $13.05 |
| Income from Investment Operations | | | | | | |
| Net investment income (loss)A | .08 | .16 | .19 | .21 | .22 | .16 |
| Net realized and unrealized gain (loss) | .29 | 1.05 | 1.16 | (.51) | .55 | 1.04 |
| Total from investment operations | .37 | 1.21 | 1.35 | (.30) | .77 | 1.20 |
| Distributions from net investment income | –B | (.18) | (.19) | (.21) | (.23) | (.16) |
| Distributions from net realized gain | (.49) | (.62) | (.36) | (.41) | (.64) | (.55) |
| Total distributions | (.49) | (.81)C | (.55) | (.63)D | (.87) | (.71) |
| Net asset value, end of period | $13.59 | $13.71 | $13.31 | $12.51 | $13.44 | $13.54 |
| Total ReturnE,F,G | 2.74% | 9.15% | 11.17% | (2.35)% | 5.82% | 9.38% |
| Ratios to Average Net AssetsH,I | | | | | | |
| Expenses before reductions | .86%J | .76% | .25% | .25% | .25% | .25% |
| Expenses net of fee waivers, if any | .86%J | .76% | .25% | .25% | .25% | .25% |
| Expenses net of all reductions | .86%J | .76% | .25% | .25% | .25% | .25% |
| Net investment income (loss) | 1.12%J | 1.18% | 1.46% | 1.62% | 1.59% | 1.22% |
| Supplemental Data | | | | | | |
| Net assets, end of period (000 omitted) | $1,118,826 | $1,196,128 | $1,315,261 | $1,442,826 | $1,775,399 | $1,910,164 |
| Portfolio turnover rateH | 25%J | 20% | 19% | 20% | 21% | 40% |
A Calculated based on average shares outstanding during the period.
B Amount represents less than $.005 per share.
C Total distributions of $.81 per share is comprised of distributions from net investment income of $.184 and distributions from net realized gain of $.621 per share.
D Total distributions of $.63 per share is comprised of distributions from net investment income of $.214 and distributions from net realized gain of $.411 per share.
E Total returns for periods of less than one year are not annualized.
F Total returns would have been lower if certain expenses had not been reduced during the applicable periods shown.
G Total returns do not include the effect of the sales charges.
H Amounts do not include the activity of the Underlying Funds.
I Expense ratios reflect operating expenses of the class. Expenses before reductions do not reflect amounts reimbursed by the investment adviser or reductions from expense offset arrangements and do not represent the amount paid by the class during periods when reimbursements or reductions occur. Expenses net of fee waivers reflect expenses after reimbursement by the investment adviser but prior to reductions from expense offset arrangements. Expenses net of all reductions represent the net expenses paid by the class but do not include expenses of the underlying funds in which the Fund invests.
J Annualized
See accompanying notes which are an integral part of the financial statements.
Fidelity Advisor Freedom 2020 Fund Class M
| | Six months ended (Unaudited) September 30, | Years endedMarch 31, | | | | |
| | 2018 | 2018 | 2017 | 2016 | 2015 | 2014 |
| Selected Per–Share Data | | | | | | |
| Net asset value, beginning of period | $13.71 | $13.30 | $12.51 | $13.44 | $13.54 | $13.05 |
| Income from Investment Operations | | | | | | |
| Net investment income (loss)A | .06 | .13 | .15 | .18 | .18 | .13 |
| Net realized and unrealized gain (loss) | .29 | 1.05 | 1.16 | (.52) | .55 | 1.03 |
| Total from investment operations | .35 | 1.18 | 1.31 | (.34) | .73 | 1.16 |
| Distributions from net investment income | – | (.15) | (.16) | (.18) | (.19) | (.13) |
| Distributions from net realized gain | (.48) | (.62) | (.36) | (.41) | (.64) | (.55) |
| Total distributions | (.48) | (.77) | (.52) | (.59) | (.83) | (.67)B |
| Net asset value, end of period | $13.58 | $13.71 | $13.30 | $12.51 | $13.44 | $13.54 |
| Total ReturnC,D,E | 2.60% | 8.97% | 10.81% | (2.59)% | 5.56% | 9.11% |
| Ratios to Average Net AssetsF,G | | | | | | |
| Expenses before reductions | 1.11%H | 1.01% | .50% | .50% | .50% | .50% |
| Expenses net of fee waivers, if any | 1.11%H | 1.01% | .50% | .50% | .50% | .50% |
| Expenses net of all reductions | 1.11%H | 1.01% | .50% | .50% | .50% | .50% |
| Net investment income (loss) | .87%H | .92% | 1.21% | 1.37% | 1.34% | .97% |
| Supplemental Data | | | | | | |
| Net assets, end of period (000 omitted) | $367,155 | $374,470 | $396,330 | $394,406 | $440,674 | $465,828 |
| Portfolio turnover rateF | 25%H | 20% | 19% | 20% | 21% | 40% |
A Calculated based on average shares outstanding during the period.
B Total distributions of $.67 per share is comprised of distributions from net investment income of $.125 and distributions from net realized gain of $.549 per share.
C Total returns for periods of less than one year are not annualized.
D Total returns would have been lower if certain expenses had not been reduced during the applicable periods shown.
E Total returns do not include the effect of the sales charges.
F Amounts do not include the activity of the Underlying Funds.
G Expense ratios reflect operating expenses of the class. Expenses before reductions do not reflect amounts reimbursed by the investment adviser or reductions from expense offset arrangements and do not represent the amount paid by the class during periods when reimbursements or reductions occur. Expenses net of fee waivers reflect expenses after reimbursement by the investment adviser but prior to reductions from expense offset arrangements. Expenses net of all reductions represent the net expenses paid by the class but do not include expenses of the underlying funds in which the Fund invests.
H Annualized
See accompanying notes which are an integral part of the financial statements.
Fidelity Advisor Freedom 2020 Fund Class C
| | Six months ended (Unaudited) September 30, | Years endedMarch 31, | | | | |
| | 2018 | 2018 | 2017 | 2016 | 2015 | 2014 |
| Selected Per–Share Data | | | | | | |
| Net asset value, beginning of period | $13.60 | $13.20 | $12.42 | $13.35 | $13.45 | $12.97 |
| Income from Investment Operations | | | | | | |
| Net investment income (loss)A | .03 | .06 | .09 | .11 | .11 | .06 |
| Net realized and unrealized gain (loss) | .28 | 1.05 | 1.15 | (.51) | .55 | 1.03 |
| Total from investment operations | .31 | 1.11 | 1.24 | (.40) | .66 | 1.09 |
| Distributions from net investment income | – | (.09) | (.10) | (.12) | (.12) | (.07) |
| Distributions from net realized gain | (.46) | (.62) | (.36) | (.41) | (.64) | (.54) |
| Total distributions | (.46) | (.71) | (.46) | (.53) | (.76) | (.61) |
| Net asset value, end of period | $13.45 | $13.60 | $13.20 | $12.42 | $13.35 | $13.45 |
| Total ReturnB,C,D | 2.32% | 8.45% | 10.26% | (3.11)% | 5.07% | 8.57% |
| Ratios to Average Net AssetsE,F | | | | | | |
| Expenses before reductions | 1.61%G | 1.52% | 1.00% | 1.00% | 1.00% | 1.00% |
| Expenses net of fee waivers, if any | 1.61%G | 1.52% | 1.00% | 1.00% | 1.00% | 1.00% |
| Expenses net of all reductions | 1.61%G | 1.52% | 1.00% | 1.00% | 1.00% | 1.00% |
| Net investment income (loss) | .37%G | .42% | .71% | .87% | .84% | .47% |
| Supplemental Data | | | | | | |
| Net assets, end of period (000 omitted) | $97,907 | $98,878 | $101,268 | $105,128 | $112,535 | $113,194 |
| Portfolio turnover rateE | 25%G | 20% | 19% | 20% | 21% | 40% |
A Calculated based on average shares outstanding during the period.
B Total returns for periods of less than one year are not annualized.
C Total returns would have been lower if certain expenses had not been reduced during the applicable periods shown.
D Total returns do not include the effect of the contingent deferred sales charge.
E Amounts do not include the activity of the Underlying Funds.
F Expense ratios reflect operating expenses of the class. Expenses before reductions do not reflect amounts reimbursed by the investment adviser or reductions from expense offset arrangements and do not represent the amount paid by the class during periods when reimbursements or reductions occur. Expenses net of fee waivers reflect expenses after reimbursement by the investment adviser but prior to reductions from expense offset arrangements. Expenses net of all reductions represent the net expenses paid by the class but do not include expenses of the underlying funds in which the Fund invests.
G Annualized
See accompanying notes which are an integral part of the financial statements.
Fidelity Advisor Freedom 2020 Fund Class I
| | Six months ended (Unaudited) September 30, | Years endedMarch 31, | | | | |
| | 2018 | 2018 | 2017 | 2016 | 2015 | 2014 |
| Selected Per–Share Data | | | | | | |
| Net asset value, beginning of period | $13.82 | $13.41 | $12.61 | $13.54 | $13.63 | $13.14 |
| Income from Investment Operations | | | | | | |
| Net investment income (loss)A | .09 | .20 | .22 | .24 | .25 | .20 |
| Net realized and unrealized gain (loss) | .30 | 1.05 | 1.16 | (.51) | .56 | 1.03 |
| Total from investment operations | .39 | 1.25 | 1.38 | (.27) | .81 | 1.23 |
| Distributions from net investment income | (.01) | (.22) | (.22) | (.25) | (.26) | (.19) |
| Distributions from net realized gain | (.49) | (.62) | (.36) | (.41) | (.64) | (.55) |
| Total distributions | (.50) | (.84) | (.58) | (.66) | (.90) | (.74) |
| Net asset value, end of period | $13.71 | $13.82 | $13.41 | $12.61 | $13.54 | $13.63 |
| Total ReturnB,C | 2.86% | 9.45% | 11.36% | (2.07)% | 6.13% | 9.58% |
| Ratios to Average Net AssetsD,E | | | | | | |
| Expenses before reductions | .61%F | .52% | - %G | - %G | - %G | - %G |
| Expenses net of fee waivers, if any | .61%F | .52% | -% | -% | -% | -% |
| Expenses net of all reductions | .61%F | .52% | -% | -% | -% | -% |
| Net investment income (loss) | 1.37%F | 1.42% | 1.71% | 1.87% | 1.84% | 1.47% |
| Supplemental Data | | | | | | |
| Net assets, end of period (000 omitted) | $829,133 | $803,562 | $743,042 | $767,908 | $836,880 | $875,979 |
| Portfolio turnover rateD | 25%F | 20% | 19% | 20% | 21% | 40% |
A Calculated based on average shares outstanding during the period.
B Total returns for periods of less than one year are not annualized.
C Total returns would have been lower if certain expenses had not been reduced during the applicable periods shown.
D Amounts do not include the activity of the Underlying Funds.
E Expense ratios reflect operating expenses of the class. Expenses before reductions do not reflect amounts reimbursed by the investment adviser or reductions from expense offset arrangements and do not represent the amount paid by the class during periods when reimbursements or reductions occur. Expenses net of fee waivers reflect expenses after reimbursement by the investment adviser but prior to reductions from expense offset arrangements. Expenses net of all reductions represent the net expenses paid by the class but do not include expenses of the underlying funds in which the Fund invests.
F Annualized
G Amount represents less than .005%.
See accompanying notes which are an integral part of the financial statements.
Fidelity Advisor Freedom 2020 Fund Class Z6
| | Six months ended (Unaudited) September 30, | Years endedMarch 31, |
| | 2018 | 2018 A |
| Selected Per–Share Data | | |
| Net asset value, beginning of period | $13.81 | $13.62 |
| Income from Investment Operations | | |
| Net investment income (loss)B | .11 | .08 |
| Net realized and unrealized gain (loss) | .29 | .75 |
| Total from investment operations | .40 | .83 |
| Distributions from net investment income | (.03) | (.23) |
| Distributions from net realized gain | (.49) | (.41) |
| Total distributions | (.51)C | (.64) |
| Net asset value, end of period | $13.70 | $13.81 |
| Total ReturnD,E | 2.97% | 6.08% |
| Ratios to Average Net AssetsF,G | | |
| Expenses before reductions | .43%H | .45%H,I |
| Expenses net of fee waivers, if any | .43%H | .45%H,I |
| Expenses net of all reductions | .43%H | .45%H,I |
| Net investment income (loss) | 1.55%H | .71%H |
| Supplemental Data | | |
| Net assets, end of period (000 omitted) | $36,699 | $29,132 |
| Portfolio turnover rateF | 25%H | 20% |
A For the period June 6, 2017 (commencement of sale of shares) to March 31, 2018.
B Calculated based on average shares outstanding during the period.
C Total distributions of $.51 per share is comprised of distributions from net investment income of $.026 and distributions from net realized gain of $.486 per share.
D Total returns for periods of less than one year are not annualized.
E Total returns would have been lower if certain expenses had not been reduced during the applicable periods shown.
F Amounts do not include the activity of the Underlying Funds.
G Expense ratios reflect operating expenses of the class. Expenses before reductions do not reflect amounts reimbursed by the investment adviser or reductions from expense offset arrangements and do not represent the amount paid by the class during periods when reimbursements or reductions occur. Expenses net of fee waivers reflect expenses after reimbursement by the investment adviser but prior to reductions from expense offset arrangements. Expenses net of all reductions represent the net expenses paid by the class but do not include expenses of the underlying funds in which the Fund invests.
H Annualized
I On certain classes, the size and fluctuation of net assets and expense amounts may cause ratios to differ from contractual rates.
See accompanying notes which are an integral part of the financial statements.
Fidelity Advisor Freedom® 2025 Fund
Investment Summary (Unaudited)
The information in the following tables is based on the direct investments of the Fund.
Top Holdings as of September 30, 2018
| | % of fund's net assets |
| Fidelity Series Investment Grade Bond Fund | 19.8 |
| Fidelity Series Large Cap Stock Fund | 8.1 |
| Fidelity Series Emerging Markets Opportunities Fund | 6.2 |
| Fidelity Series International Value Fund | 6.2 |
| Fidelity Series International Growth Fund | 6.2 |
| Fidelity Series Long-Term Treasury Bond Index Fund | 5.5 |
| Fidelity Series Stock Selector Large Cap Value Fund | 5.2 |
| Fidelity Series Value Discovery Fund | 5.2 |
| Fidelity Advisor Series Equity Growth Fund | 4.6 |
| Fidelity Series Government Money Market Fund 2.12% | 4.6 |
| | 71.6 |
Asset Allocation (% of fund's net assets)
| Period end |
| | Domestic Equity Funds | 40.5% |
| | International Equity Funds | 21.3% |
| | Bond Funds | 32.1% |
| | Short-Term Funds | 6.1% |
| | Short-Term Investments | 0.1% |
| | Net Other Assets (Liabilities)* | (0.1)% |
* Net Other Assets (Liabilities) are not included in the pie chart
Domestic Equity Funds category includes Fidelity Series Commodity Strategy Fund which invests in commodity-related investments.
Fidelity Advisor Freedom® 2025 Fund
Schedule of Investments September 30, 2018 (Unaudited)
Showing Percentage of Net Assets
| U.S. Treasury Obligations - 0.1% | | | |
| | | Principal Amount | Value |
| U.S. Treasury Bills, yield at date of purchase 1.95% to 2.11% 10/4/18 to 12/6/18 (a) | | | |
| (Cost $2,004,370) | | 2,010,000 | 2,004,248 |
| | | Shares | Value |
|
| Domestic Equity Funds - 40.5% | | | |
| Fidelity Advisor Series Equity Growth Fund (b) | | 8,962,976 | $138,567,614 |
| Fidelity Advisor Series Growth Opportunities Fund (b) | | 5,567,135 | 92,637,122 |
| Fidelity Advisor Series Small Cap Fund (b) | | 5,185,545 | 65,182,303 |
| Fidelity Series All-Sector Equity Fund (b) | | 4,510,363 | 61,386,043 |
| Fidelity Series Commodity Strategy Fund (b) | | 11,942,352 | 59,711,760 |
| Fidelity Series Large Cap Stock Fund (b) | | 15,176,410 | 241,760,204 |
| Fidelity Series Large Cap Value Index Fund (b) | | 1,970,756 | 26,013,985 |
| Fidelity Series Opportunistic Insights Fund (b) | | 6,515,453 | 129,331,733 |
| Fidelity Series Small Cap Opportunities Fund (b) | | 5,610,672 | 82,420,778 |
| Fidelity Series Stock Selector Large Cap Value Fund (b) | | 11,806,647 | 156,083,873 |
| Fidelity Series Value Discovery Fund (b) | | 11,248,022 | 153,985,419 |
| TOTAL DOMESTIC EQUITY FUNDS | | | |
| (Cost $904,287,696) | | | 1,207,080,834 |
|
| International Equity Funds - 21.3% | | | |
| Fidelity Series Canada Fund (b) | | 1,685,104 | 18,215,975 |
| Fidelity Series Emerging Markets Fund (b) | | 1,910,303 | 18,510,841 |
| Fidelity Series Emerging Markets Opportunities Fund (b) | | 9,706,646 | 186,270,530 |
| Fidelity Series International Growth Fund (b) | | 11,216,552 | 183,951,453 |
| Fidelity Series International Small Cap Fund (b) | | 2,418,934 | 43,298,924 |
| Fidelity Series International Value Fund (b) | | 17,605,679 | 185,211,740 |
| TOTAL INTERNATIONAL EQUITY FUNDS | | | |
| (Cost $480,183,234) | | | 635,459,463 |
|
| Bond Funds - 32.1% | | | |
| Fidelity Series Emerging Markets Debt Fund (b) | | 2,087,846 | 19,897,168 |
| Fidelity Series Floating Rate High Income Fund (b) | | 717,666 | 6,832,178 |
| Fidelity Series High Income Fund (b) | | 4,223,265 | 40,585,577 |
| Fidelity Series Inflation-Protected Bond Index Fund (b) | | 12,106,914 | 117,558,134 |
| Fidelity Series International Credit Fund (b) | | 153,748 | 1,511,341 |
| Fidelity Series Investment Grade Bond Fund (b) | | 54,288,740 | 591,204,378 |
| Fidelity Series Long-Term Treasury Bond Index Fund (b) | | 20,015,204 | 164,925,285 |
| Fidelity Series Real Estate Income Fund (b) | | 1,271,840 | 13,710,439 |
| TOTAL BOND FUNDS | | | |
| (Cost $984,097,333) | | | 956,224,500 |
|
| Short-Term Funds - 6.1% | | | |
| Fidelity Cash Central Fund, 2.11% (c) | | 4,600,835 | 4,601,755 |
| Fidelity Series Government Money Market Fund 2.12% (b)(d) | | 137,293,397 | 137,293,397 |
| Fidelity Series Short-Term Credit Fund (b) | | 4,047,769 | 39,911,006 |
| TOTAL SHORT-TERM FUNDS | | | |
| (Cost $182,258,449) | | | 181,806,158 |
| TOTAL INVESTMENT IN SECURITIES - 100.1% | | | |
| (Cost $2,552,831,082) | | | 2,982,575,203 |
| NET OTHER ASSETS (LIABILITIES) - (0.1)% | | | (2,220,442) |
| NET ASSETS - 100% | | | $2,980,354,761 |
| Futures Contracts | | | | | |
| | Number of contracts | Expiration Date | Notional Amount | Value | Unrealized Appreciation/(Depreciation) |
| Purchased | | | | | |
| Equity Index Contracts | | | | | |
| ICE E-mini MSCI EAFE Index Contracts (United States) | 58 | Dec. 2018 | $5,728,950 | $5,480 | $5,480 |
| ICE E-mini MSCI Emerging Markets Index Contracts (United States) | 153 | Dec. 2018 | 8,030,205 | 170,078 | 170,078 |
| | | | | | 175,558 |
| Sold | | | | | |
| Equity Index Contracts | | | | | |
| CME E-mini S&P 500 Index Contracts (United States) | 109 | Dec. 2018 | 15,908,550 | (4,206) | (4,206) |
| TOTAL FUTURES CONTRACTS | | | | | $171,352 |
The notional amount of futures purchased as a percentage of Net Assets is 0.5%
The notional amount of futures sold as a percentage of Net Assets is 0.5%
Legend
(a) Security or a portion of the security was pledged to cover margin requirements for futures contracts. At period end, the value of securities pledged amounted to $740,306.
(b) Affiliated Fund
(c) Affiliated fund that is generally available only to investment companies and other accounts managed by Fidelity Investments. The rate quoted is the annualized seven-day yield of the fund at period end. A complete unaudited listing of the fund's holdings as of its most recent quarter end is available upon request. In addition, each Fidelity Central Fund's financial statements are available on the SEC's website or upon request.
(d) The rate quoted is the annualized seven-day yield of the fund at period end.
Affiliated Central Funds
Information regarding fiscal year to date income earned by the Fund from investments in Fidelity Central Funds is as follows:
| Fund | Income earned |
| Fidelity Cash Central Fund | $14,786 |
| Total | $14,786 |
Amounts in the income column in the above table include any capital gain distributions from underlying funds, which are presented in the corresponding line-item in the Statement of Operations if applicable.
Affiliated Underlying Funds
Fiscal year to date information regarding the Fund's investments in affiliated Underlying Funds, excluding any Money Market Central Funds, is presented below. Exchanges between classes of the same affiliated Underlying Funds may occur.
| Affiliate | Value, beginning of period | Purchases | Sales Proceeds | Dividend Income | Realized Gain (loss) | Change in Unrealized appreciation (depreciation) | Value, end of period |
| Fidelity Advisor Series Equity Growth Fund | $131,910,093 | $1,906,118 | $13,720,640 | $-- | $1,353,062 | $17,118,981 | $138,567,614 |
| Fidelity Advisor Series Equity Value Fund | 152,092,384 | 7,220,187 | 8,850,175 | 4,976,571 | 15,369 | (27,114,731) | -- |
| Fidelity Advisor Series Growth & Income Fund | 232,877,392 | 23,627,036 | 19,584,205 | 20,285,784 | 893,424 | (40,937,622) | -- |
| Fidelity Advisor Series Growth Opportunities Fund | 86,630,974 | 1,255,304 | 17,020,419 | -- | 4,688,601 | 17,082,662 | 92,637,122 |
| Fidelity Advisor Series Opportunistic Insights Fund | 122,841,576 | 11,177,854 | 11,719,625 | 9,444,437 | 1,028,545 | (49,877,717) | -- |
| Fidelity Advisor Series Small Cap Fund | 66,053,566 | 937,638 | 5,557,115 | -- | 287,842 | 3,460,372 | 65,182,303 |
| Fidelity Advisor Series Stock Selector Large Cap Value Fund | 153,544,687 | 14,783,410 | 9,378,406 | 12,607,884 | (25,500) | (27,284,594) | -- |
| Fidelity Series 100 Index Fund | 65,608,385 | -- | 69,164,114 | -- | 30,450,312 | (26,894,583) | -- |
| Fidelity Series All-Sector Equity Fund | 90,515,999 | 1,263,036 | 40,247,667 | -- | 7,778,618 | 2,076,057 | 61,386,043 |
| Fidelity Series Canada Fund | 18,652,399 | 254,674 | 1,835,091 | -- | 27,133 | 1,116,860 | 18,215,975 |
| Fidelity Series Commodity Strategy Fund | 64,190,392 | 8,481,873 | 8,069,668 | 3,582,275 | (2,974,263) | (1,916,574) | 59,711,760 |
| Fidelity Series Emerging Markets Debt Fund | 21,250,839 | 860,879 | 1,056,359 | 615,517 | (28,269) | (1,129,922) | 19,897,168 |
| Fidelity Series Emerging Markets Fund | -- | 18,467,053 | -- | -- | -- | 43,788 | 18,510,841 |
| Fidelity Series Emerging Markets Opportunities Fund | 200,253,721 | 21,710,096 | 10,098,220 | -- | (70,671) | (25,524,396) | 186,270,530 |
| Fidelity Series Floating Rate High Income Fund | 6,978,916 | 286,532 | 440,150 | 184,289 | (3,803) | 10,683 | 6,832,178 |
| Fidelity Series Government Money Market Fund 2.12% | 191,905,833 | 28,146,084 | 82,758,520 | 1,669,588 | -- | -- | 137,293,397 |
| Fidelity Series High Income Fund | 42,751,545 | 1,728,742 | 4,239,864 | 1,196,986 | (65,571) | 410,725 | 40,585,577 |
| Fidelity Series Inflation-Protected Bond Index Fund | 24,067,874 | 97,540,926 | 3,556,459 | 106,273 | (41,903) | (452,304) | 117,558,134 |
| Fidelity Series International Credit Fund | 1,507,928 | 18,583 | -- | 18,583 | -- | (15,170) | 1,511,341 |
| Fidelity Series International Growth Fund | 190,574,782 | 5,152,137 | 14,622,041 | -- | 3,657,893 | (811,318) | 183,951,453 |
| Fidelity Series International Small Cap Fund | 47,564,731 | 621,275 | 3,081,359 | -- | 627,587 | (2,433,310) | 43,298,924 |
| Fidelity Series International Value Fund | 190,117,014 | 6,494,697 | 10,837,314 | -- | 489,359 | (1,052,016) | 185,211,740 |
| Fidelity Series Investment Grade Bond Fund | 663,099,615 | 17,323,811 | 81,859,849 | 8,904,338 | (3,658,472) | (3,700,727) | 591,204,378 |
| Fidelity Series Large Cap Stock Fund | -- | 80,181 | 589,797 | -- | (3,153) | 45,396,948 | 241,760,204 |
| Fidelity Series Large Cap Value Index Fund | 25,669,107 | 423,625 | 1,855,837 | -- | 185,329 | 1,591,761 | 26,013,985 |
| Fidelity Series Long-Term Treasury Bond Index Fund | 67,087,281 | 108,763,652 | 5,565,664 | 1,664,628 | (107,210) | (5,252,774) | 164,925,285 |
| Fidelity Series Opportunistic Insights Fund | -- | 42,961 | 316,868 | -- | (877) | 56,155,884 | 129,331,733 |
| Fidelity Series Real Estate Equity Fund | 15,933,541 | 90,689 | 16,421,405 | 77,109 | 1,659,698 | (1,262,523) | -- |
| Fidelity Series Real Estate Income Fund | 13,677,837 | 775,479 | 827,566 | 583,159 | 2,689 | 82,000 | 13,710,439 |
| Fidelity Series Short-Term Credit Fund | 43,250,992 | 1,113,572 | 4,453,948 | 481,085 | (39,911) | 40,301 | 39,911,006 |
| Fidelity Series Small Cap Opportunities Fund | 80,597,666 | 7,534,245 | 8,566,615 | 6,381,676 | 1,515,335 | 1,340,147 | 82,420,778 |
| Fidelity Series Stock Selector Large Cap Value Fund | -- | 107,618 | 485,240 | -- | (24,840) | 24,846,738 | 156,083,873 |
| Fidelity Series Value Discovery Fund | -- | 51,574 | 379,486 | -- | (2,178) | 30,952,475 | 153,985,419 |
| | $3,011,207,069 | $388,241,541 | $457,159,686 | $72,780,182 | $47,614,175 | $(13,933,899) | $2,975,969,200 |
Amounts in the income column in the above table include any capital gain distributions from underlying funds, which are presented in the corresponding line-item in the Statement of Operations if applicable.
Investment Valuation
The following is a summary of the inputs used, as of September 30, 2018, involving the Fund's assets and liabilities carried at fair value. The inputs or methodology used for valuing securities may not be an indication of the risk associated with investing in those securities. For more information on valuation inputs, and their aggregation into the levels used below, please refer to the Investment Valuation section in the accompanying Notes to Financial Statements.
| | Valuation Inputs at Reporting Date: |
| Description | Total | Level 1 | Level 2 | Level 3 |
| Investments in Securities: | | | | |
| Other Short-Term Investments | $2,004,248 | $-- | $2,004,248 | $-- |
| Domestic Equity Funds | 1,207,080,834 | 1,207,080,834 | -- | -- |
| International Equity Funds | 635,459,463 | 635,459,463 | -- | -- |
| Bond Funds | 956,224,500 | 956,224,500 | -- | -- |
| Short-Term Funds | 181,806,158 | 181,806,158 | -- | -- |
| Total Investments in Securities: | $2,982,575,203 | $2,980,570,955 | $2,004,248 | $-- |
| Derivative Instruments: | | | | |
| Assets | | | | |
| Futures Contracts | $175,558 | $175,558 | $-- | $-- |
| Total Assets | $175,558 | $175,558 | $-- | $-- |
| Liabilities | | | | |
| Futures Contracts | $(4,206) | $(4,206) | $-- | $-- |
| Total Liabilities | $(4,206) | $(4,206) | $-- | $-- |
| Total Derivative Instruments: | $171,352 | $171,352 | $-- | $-- |
Value of Derivative Instruments
The following table is a summary of the Fund's value of derivative instruments by primary risk exposure as of September 30, 2018. For additional information on derivative instruments, please refer to the Derivative Instruments section in the accompanying Notes to Financial Statements.
| Primary Risk Exposure / Derivative Type | Value |
| | Asset | Liability |
| Equity Risk | | |
| Futures Contracts(a) | $175,558 | $(4,206) |
| Total Equity Risk | 175,558 | (4,206) |
| Total Value of Derivatives | $175,558 | $(4,206) |
(a) Reflects gross cumulative appreciation (depreciation) on futures contracts as presented in the Schedule of Investments. In the Statement of Assets and Liabilities, the period end daily variation margin is included in receivable or payable for daily variation margin on futures contracts, and the net cumulative appreciation (depreciation) is included in net unrealized appreciation (depreciation).
See accompanying notes which are an integral part of the financial statements.
Fidelity Advisor Freedom® 2025 Fund
Financial Statements
Statement of Assets and Liabilities
| | | September 30, 2018 (Unaudited) |
| Assets | | |
Investment in securities, at value — See accompanying schedule:
Unaffiliated issuers (cost $2,004,370) | $2,004,248 | |
| Fidelity Central Funds (cost $4,601,755) | 4,601,755 | |
| Other affiliated issuers (cost $2,546,224,957) | 2,975,969,200 | |
| Total Investment in Securities (cost $2,552,831,082) | | $2,982,575,203 |
| Receivable for investments sold | | 3,821,643 |
| Receivable for fund shares sold | | 2,678,302 |
| Dividends receivable | | 6,303 |
| Distributions receivable from Fidelity Central Funds | | 6,611 |
| Total assets | | 2,989,088,062 |
| Liabilities | | |
| Payable for investments purchased | $2,803,230 | |
| Payable for fund shares redeemed | 3,664,577 | |
| Accrued management fee | 1,610,876 | |
| Distribution and service plan fees payable | 546,210 | |
| Payable for daily variation margin on futures contracts | 108,408 | |
| Total liabilities | | 8,733,301 |
| Net Assets | | $2,980,354,761 |
| Net Assets consist of: | | |
| Paid in capital | | $2,449,768,891 |
| Undistributed net investment income | | 15,744,231 |
| Accumulated undistributed net realized gain (loss) on investments | | 84,926,166 |
| Net unrealized appreciation (depreciation) on investments | | 429,915,473 |
| Net Assets | | $2,980,354,761 |
| Calculation of Maximum Offering Price | | |
| Class A: | | |
| Net Asset Value and redemption price per share ($1,372,451,670 ÷ 100,347,726 shares) | | $13.68 |
| Maximum offering price per share (100/94.25 of $13.68) | | $14.51 |
| Class M: | | |
| Net Asset Value and redemption price per share ($431,703,548 ÷ 31,525,839 shares) | | $13.69 |
| Maximum offering price per share (100/96.50 of $13.69) | | $14.19 |
| Class C: | | |
| Net Asset Value and offering price per share ($96,149,994 ÷ 7,153,113 shares)(a) | | $13.44 |
| Class I: | | |
| Net Asset Value, offering price and redemption price per share ($1,044,154,370 ÷ 75,607,024 shares) | | $13.81 |
| Class Z6: | | |
| Net Asset Value, offering price and redemption price per share ($35,895,179 ÷ 2,600,966 shares) | | $13.80 |
(a) Redemption price per share is equal to net asset value less any applicable contingent deferred sales charge.
See accompanying notes which are an integral part of the financial statements.
Statement of Operations
| | | Six months ended September 30, 2018 (Unaudited) |
| Investment Income | | |
| Dividends: | | |
| Affiliated issuers | | $28,833,830 |
| Interest | | 8,521 |
| Income from Fidelity Central Funds | | 14,786 |
| Total income | | 28,857,137 |
| Expenses | | |
| Management fee | $9,769,969 | |
| Distribution and service plan fees | 3,325,192 | |
| Independent trustees' fees and expenses | 7,338 | |
| Total expenses before reductions | 13,102,499 | |
| Expense reductions | (48) | |
| Total expenses after reductions | | 13,102,451 |
| Net investment income (loss) | | 15,754,686 |
| Realized and Unrealized Gain (Loss) | | |
| Net realized gain (loss) on: | | |
| Investment securities: | | |
| Fidelity Central Funds | (28) | |
| Other affiliated issuers | 47,614,175 | |
| Futures contracts | (595,667) | |
| Capital gain distributions from underlying funds: | | |
| Affiliated issuers | 43,946,352 | |
| Total net realized gain (loss) | | 90,964,832 |
| Change in net unrealized appreciation (depreciation) on: | | |
| Investment securities: | | |
| Unaffiliated issuers | (109) | |
| Affiliated issuers | (13,933,899) | |
| Futures contracts | 171,352 | |
| Total change in net unrealized appreciation (depreciation) | | (13,762,656) |
| Net gain (loss) | | 77,202,176 |
| Net increase (decrease) in net assets resulting from operations | | $92,956,862 |
See accompanying notes which are an integral part of the financial statements.
Statement of Changes in Net Assets
| | Six months ended September 30, 2018 (Unaudited) | Year ended March 31, 2018 |
| Increase (Decrease) in Net Assets | | |
| Operations | | |
| Net investment income (loss) | $15,754,686 | $33,835,159 |
| Net realized gain (loss) | 90,964,832 | 183,273,762 |
| Change in net unrealized appreciation (depreciation) | (13,762,656) | 66,482,962 |
| Net increase (decrease) in net assets resulting from operations | 92,956,862 | 283,591,883 |
| Distributions to shareholders from net investment income | (184,657) | (38,001,071) |
| Distributions to shareholders from net realized gain | (105,484,492) | (117,185,415) |
| Total distributions | (105,669,149) | (155,186,486) |
| Share transactions - net increase (decrease) | (16,299,612) | (18,870,598) |
| Total increase (decrease) in net assets | (29,011,899) | 109,534,799 |
| Net Assets | | |
| Beginning of period | 3,009,366,660 | 2,899,831,861 |
| End of period | $2,980,354,761 | $3,009,366,660 |
| Other Information | | |
| Undistributed net investment income end of period | $15,744,231 | $174,202 |
See accompanying notes which are an integral part of the financial statements.
Financial Highlights
Fidelity Advisor Freedom 2025 Fund Class A
| | Six months ended (Unaudited) September 30, | Years endedMarch 31, | | | | |
| | 2018 | 2018 | 2017 | 2016 | 2015 | 2014 |
| Selected Per–Share Data | | | | | | |
| Net asset value, beginning of period | $13.74 | $13.16 | $12.29 | $13.25 | $13.33 | $12.72 |
| Income from Investment Operations | | | | | | |
| Net investment income (loss)A | .07 | .15 | .18 | .19 | .21 | .16 |
| Net realized and unrealized gain (loss) | .35 | 1.15 | 1.24 | (.54) | .60 | 1.26 |
| Total from investment operations | .42 | 1.30 | 1.42 | (.35) | .81 | 1.42 |
| Distributions from net investment income | – | (.17) | (.18) | (.20) | (.22) | (.16) |
| Distributions from net realized gain | (.48) | (.55) | (.37) | (.42) | (.67) | (.66) |
| Total distributions | (.48) | (.72) | (.55) | (.61)B | (.89) | (.81)C |
| Net asset value, end of period | $13.68 | $13.74 | $13.16 | $12.29 | $13.25 | $13.33 |
| Total ReturnD,E,F | 3.14% | 9.96% | 12.00% | (2.72)% | 6.26% | 11.54% |
| Ratios to Average Net AssetsG,H | | | | | | |
| Expenses before reductions | .90%I | .80% | .25% | .25% | .25% | .25% |
| Expenses net of fee waivers, if any | .90%I | .80% | .25% | .25% | .25% | .25% |
| Expenses net of all reductions | .90%I | .80% | .25% | .25% | .25% | .25% |
| Net investment income (loss) | 1.02%I | 1.11% | 1.43% | 1.53% | 1.55% | 1.25% |
| Supplemental Data | | | | | | |
| Net assets, end of period (000 omitted) | $1,372,452 | $1,435,987 | $1,503,384 | $1,543,665 | $1,853,121 | $1,907,797 |
| Portfolio turnover rateH | 26%I | 23% | 20% | 24% | 23% | 41% |
A Calculated based on average shares outstanding during the period.
B Total distributions of $.61 per share is comprised of distributions from net investment income of $.195 and distributions from net realized gain of $.419 per share.
C Total distributions of $.81 per share is comprised of distributions from net investment income of $.157 and distributions from net realized gain of $.657 per share.
D Total returns for periods of less than one year are not annualized.
E Total returns would have been lower if certain expenses had not been reduced during the applicable periods shown.
F Total returns do not include the effect of the sales charges.
G Expense ratios reflect operating expenses of the class. Expenses before reductions do not reflect amounts reimbursed by the investment adviser or reductions from expense offset arrangements and do not represent the amount paid by the class during periods when reimbursements or reductions occur. Expenses net of fee waivers reflect expenses after reimbursement by the investment adviser but prior to reductions from expense offset arrangements. Expenses net of all reductions represent the net expenses paid by the class but do not include expenses of the underlying funds in which the Fund invests.
H Amounts do not include the activity of the Underlying Funds.
I Annualized
See accompanying notes which are an integral part of the financial statements.
Fidelity Advisor Freedom 2025 Fund Class M
| | Six months ended (Unaudited) September 30, | Years endedMarch 31, | | | | |
| | 2018 | 2018 | 2017 | 2016 | 2015 | 2014 |
| Selected Per–Share Data | | | | | | |
| Net asset value, beginning of period | $13.76 | $13.18 | $12.31 | $13.27 | $13.35 | $12.74 |
| Income from Investment Operations | | | | | | |
| Net investment income (loss)A | .05 | .12 | .15 | .16 | .17 | .13 |
| Net realized and unrealized gain (loss) | .36 | 1.15 | 1.24 | (.54) | .61 | 1.26 |
| Total from investment operations | .41 | 1.27 | 1.39 | (.38) | .78 | 1.39 |
| Distributions from net investment income | – | (.14) | (.15) | (.16) | (.19) | (.13) |
| Distributions from net realized gain | (.48) | (.55) | (.37) | (.42) | (.67) | (.66) |
| Total distributions | (.48) | (.69) | (.52) | (.58) | (.86) | (.78)B |
| Net asset value, end of period | $13.69 | $13.76 | $13.18 | $12.31 | $13.27 | $13.35 |
| Total ReturnC,D,E | 2.99% | 9.69% | 11.70% | (2.95)% | 6.00% | 11.27% |
| Ratios to Average Net AssetsF,G | | | | | | |
| Expenses before reductions | 1.15%H | 1.05% | .50% | .50% | .50% | .50% |
| Expenses net of fee waivers, if any | 1.15%H | 1.05% | .50% | .50% | .50% | .50% |
| Expenses net of all reductions | 1.15%H | 1.05% | .50% | .50% | .50% | .50% |
| Net investment income (loss) | .77%H | .86% | 1.18% | 1.28% | 1.30% | 1.00% |
| Supplemental Data | | | | | | |
| Net assets, end of period (000 omitted) | $431,704 | $432,227 | $418,713 | $399,088 | $405,224 | $387,919 |
| Portfolio turnover rateG | 26%H | 23% | 20% | 24% | 23% | 41% |
A Calculated based on average shares outstanding during the period.
B Total distributions of $.78 per share is comprised of distributions from net investment income of $.127 and distributions from net realized gain of $.657 per share.
C Total returns for periods of less than one year are not annualized.
D Total returns would have been lower if certain expenses had not been reduced during the applicable periods shown.
E Total returns do not include the effect of the sales charges.
F Expense ratios reflect operating expenses of the class. Expenses before reductions do not reflect amounts reimbursed by the investment adviser or reductions from expense offset arrangements and do not represent the amount paid by the class during periods when reimbursements or reductions occur. Expenses net of fee waivers reflect expenses after reimbursement by the investment adviser but prior to reductions from expense offset arrangements. Expenses net of all reductions represent the net expenses paid by the class but do not include expenses of the underlying funds in which the Fund invests.
G Amounts do not include the activity of the Underlying Funds.
H Annualized
See accompanying notes which are an integral part of the financial statements.
Fidelity Advisor Freedom 2025 Fund Class C
| | Six months ended (Unaudited) September 30, | Years endedMarch 31, | | | | |
| | 2018 | 2018 | 2017 | 2016 | 2015 | 2014 |
| Selected Per–Share Data | | | | | | |
| Net asset value, beginning of period | $13.54 | $12.98 | $12.14 | $13.09 | $13.19 | $12.60 |
| Income from Investment Operations | | | | | | |
| Net investment income (loss)A | .02 | .05 | .08 | .10 | .11 | .06 |
| Net realized and unrealized gain (loss) | .34 | 1.13 | 1.23 | (.53) | .59 | 1.25 |
| Total from investment operations | .36 | 1.18 | 1.31 | (.43) | .70 | 1.31 |
| Distributions from net investment income | – | (.08) | (.10) | (.11) | (.12) | (.07) |
| Distributions from net realized gain | (.46) | (.54) | (.37) | (.41) | (.67) | (.65) |
| Total distributions | (.46) | (.62) | (.47) | (.52) | (.80)B | (.72) |
| Net asset value, end of period | $13.44 | $13.54 | $12.98 | $12.14 | $13.09 | $13.19 |
| Total ReturnC,D,E | 2.73% | 9.14% | 11.13% | (3.40)% | 5.42% | 10.71% |
| Ratios to Average Net AssetsF,G | | | | | | |
| Expenses before reductions | 1.65%H | 1.55% | 1.00% | 1.00% | 1.00% | 1.00% |
| Expenses net of fee waivers, if any | 1.65%H | 1.55% | 1.00% | 1.00% | 1.00% | 1.00% |
| Expenses net of all reductions | 1.65%H | 1.55% | 1.00% | 1.00% | 1.00% | 1.00% |
| Net investment income (loss) | .27%H | .36% | .68% | .78% | .80% | .50% |
| Supplemental Data | | | | | | |
| Net assets, end of period (000 omitted) | $96,150 | $97,691 | $97,994 | $91,941 | $94,878 | $89,402 |
| Portfolio turnover rateG | 26%H | 23% | 20% | 24% | 23% | 41% |
A Calculated based on average shares outstanding during the period.
B Total distributions of $.80 per share is comprised of distributions from net investment income of $.124 and distributions from net realized gain of $.672 per share.
C Total returns for periods of less than one year are not annualized.
D Total returns would have been lower if certain expenses had not been reduced during the applicable periods shown.
E Total returns do not include the effect of the contingent deferred sales charge.
F Expense ratios reflect operating expenses of the class. Expenses before reductions do not reflect amounts reimbursed by the investment adviser or reductions from expense offset arrangements and do not represent the amount paid by the class during periods when reimbursements or reductions occur. Expenses net of fee waivers reflect expenses after reimbursement by the investment adviser but prior to reductions from expense offset arrangements. Expenses net of all reductions represent the net expenses paid by the class but do not include expenses of the underlying funds in which the Fund invests.
G Amounts do not include the activity of the Underlying Funds.
H Annualized
See accompanying notes which are an integral part of the financial statements.
Fidelity Advisor Freedom 2025 Fund Class I
| | Six months ended (Unaudited) September 30, | Years endedMarch 31, | | | | |
| | 2018 | 2018 | 2017 | 2016 | 2015 | 2014 |
| Selected Per–Share Data | | | | | | |
| Net asset value, beginning of period | $13.86 | $13.27 | $12.39 | $13.35 | $13.43 | $12.81 |
| Income from Investment Operations | | | | | | |
| Net investment income (loss)A | .09 | .19 | .21 | .23 | .24 | .19 |
| Net realized and unrealized gain (loss) | .35 | 1.16 | 1.26 | (.54) | .60 | 1.28 |
| Total from investment operations | .44 | 1.35 | 1.47 | (.31) | .84 | 1.47 |
| Distributions from net investment income | –B | (.21) | (.21) | (.23) | (.25) | (.19) |
| Distributions from net realized gain | (.49) | (.55) | (.37) | (.42) | (.67) | (.66) |
| Total distributions | (.49) | (.76) | (.59)C | (.65) | (.92) | (.85) |
| Net asset value, end of period | $13.81 | $13.86 | $13.27 | $12.39 | $13.35 | $13.43 |
| Total ReturnD,E | 3.26% | 10.26% | 12.26% | (2.44)% | 6.48% | 11.81% |
| Ratios to Average Net AssetsF,G | | | | | | |
| Expenses before reductions | .65%H | .56% | - %I | - %I | - %I | - %I |
| Expenses net of fee waivers, if any | .65%H | .56% | -% | -% | -% | -% |
| Expenses net of all reductions | .65%H | .56% | -% | -% | -% | -% |
| Net investment income (loss) | 1.27%H | 1.35% | 1.68% | 1.78% | 1.80% | 1.50% |
| Supplemental Data | | | | | | |
| Net assets, end of period (000 omitted) | $1,044,154 | $1,018,536 | $879,740 | $870,772 | $838,616 | $846,372 |
| Portfolio turnover rateG | 26%H | 23% | 20% | 24% | 23% | 41% |
A Calculated based on average shares outstanding during the period.
B Amount represents less than $.005 per share.
C Total distributions of $.59 per share is comprised of distributions from net investment income of $.212 and distributions from net realized gain of $.373 per share.
D Total returns for periods of less than one year are not annualized.
E Total returns would have been lower if certain expenses had not been reduced during the applicable periods shown.
F Expense ratios reflect operating expenses of the class. Expenses before reductions do not reflect amounts reimbursed by the investment adviser or reductions from expense offset arrangements and do not represent the amount paid by the class during periods when reimbursements or reductions occur. Expenses net of fee waivers reflect expenses after reimbursement by the investment adviser but prior to reductions from expense offset arrangements. Expenses net of all reductions represent the net expenses paid by the class but do not include expenses of the underlying funds in which the Fund invests.
G Amounts do not include the activity of the Underlying Funds.
H Annualized
I Amount represents less than .005%.
See accompanying notes which are an integral part of the financial statements.
Fidelity Advisor Freedom 2025 Fund Class Z6
| | Six months ended (Unaudited) September 30, | Years endedMarch 31, |
| | 2018 | 2018 A |
| Selected Per–Share Data | | |
| Net asset value, beginning of period | $13.85 | $13.53 |
| Income from Investment Operations | | |
| Net investment income (loss)B | .10 | .10 |
| Net realized and unrealized gain (loss) | .36 | .80 |
| Total from investment operations | .46 | .90 |
| Distributions from net investment income | (.02) | (.22) |
| Distributions from net realized gain | (.49) | (.36) |
| Total distributions | (.51) | (.58) |
| Net asset value, end of period | $13.80 | $13.85 |
| Total ReturnC,D | 3.36% | 6.61% |
| Ratios to Average Net AssetsE,F | | |
| Expenses before reductions | .45%G | .47%G,H |
| Expenses net of fee waivers, if any | .45%G | .47%G,H |
| Expenses net of all reductions | .45%G | .47%G,H |
| Net investment income (loss) | 1.47%G | .89%G |
| Supplemental Data | | |
| Net assets, end of period (000 omitted) | $35,895 | $24,926 |
| Portfolio turnover rateF | 26%G | 23% |
A For the period June 6, 2017 (commencement of sale of shares) to March 31, 2018.
B Calculated based on average shares outstanding during the period.
C Total returns for periods of less than one year are not annualized.
D Total returns would have been lower if certain expenses had not been reduced during the applicable periods shown.
E Expense ratios reflect operating expenses of the class. Expenses before reductions do not reflect amounts reimbursed by the investment adviser or reductions from expense offset arrangements and do not represent the amount paid by the class during periods when reimbursements or reductions occur. Expenses net of fee waivers reflect expenses after reimbursement by the investment adviser but prior to reductions from expense offset arrangements. Expenses net of all reductions represent the net expenses paid by the class but do not include expenses of the underlying funds in which the Fund invests.
F Amounts do not include the activity of the Underlying Funds.
G Annualized
H On certain classes, the size and fluctuation of net assets and expense amounts may cause ratios to differ from contractual rates.
See accompanying notes which are an integral part of the financial statements.
Fidelity Advisor Freedom® 2030 Fund
Investment Summary (Unaudited)
The information in the following tables is based on the direct investments of the Fund.
Top Holdings as of September 30, 2018
| | % of fund's net assets |
| Fidelity Series Investment Grade Bond Fund | 14.9 |
| Fidelity Series Large Cap Stock Fund | 9.9 |
| Fidelity Series International Value Fund | 7.4 |
| Fidelity Series International Growth Fund | 7.4 |
| Fidelity Series Emerging Markets Opportunities Fund | 7.2 |
| Fidelity Series Stock Selector Large Cap Value Fund | 6.4 |
| Fidelity Series Value Discovery Fund | 6.3 |
| Fidelity Series Long-Term Treasury Bond Index Fund | 5.7 |
| Fidelity Advisor Series Equity Growth Fund | 5.6 |
| Fidelity Series Opportunistic Insights Fund | 5.3 |
| | 76.1 |
Asset Allocation (% of fund's net assets)
| Period end |
| | Domestic Equity Funds | 49.0% |
| | International Equity Funds | 24.7% |
| | Bond Funds | 23.8% |
| | Short-Term Funds | 2.5% |
| | Short-Term Investments | 0.1% |
| | Net Other Assets (Liabilities)* | (0.1)% |

* Net Other Assets (Liabilities) are not included in the pie chart
Domestic Equity Funds category includes Fidelity Series Commodity Strategy Fund which invests in commodity-related investments.
Fidelity Advisor Freedom® 2030 Fund
Schedule of Investments September 30, 2018 (Unaudited)
Showing Percentage of Net Assets
| U.S. Treasury Obligations - 0.1% | | | |
| | | Principal Amount | Value |
| U.S. Treasury Bills, yield at date of purchase 1.95% to 2.11% 10/4/18 to 12/6/18 (a) | | | |
| (Cost $2,153,188) | | 2,160,000 | 2,153,045 |
| | | Shares | Value |
|
| Domestic Equity Funds - 49.0% | | | |
| Fidelity Advisor Series Equity Growth Fund (b) | | 11,148,580 | $172,357,049 |
| Fidelity Advisor Series Growth Opportunities Fund (b) | | 6,964,890 | 115,895,776 |
| Fidelity Advisor Series Small Cap Fund (b) | | 6,449,549 | 81,070,831 |
| Fidelity Series All-Sector Equity Fund (b) | | 5,662,337 | 77,064,405 |
| Fidelity Series Commodity Strategy Fund (b) | | 12,400,243 | 62,001,213 |
| Fidelity Series Large Cap Stock Fund (b) | | 18,937,306 | 301,671,286 |
| Fidelity Series Large Cap Value Index Fund (b) | | 2,463,800 | 32,522,158 |
| Fidelity Series Opportunistic Insights Fund (b) | | 8,129,477 | 161,370,127 |
| Fidelity Series Small Cap Opportunities Fund (b) | | 7,019,213 | 103,112,237 |
| Fidelity Series Stock Selector Large Cap Value Fund (b) | | 14,684,481 | 194,128,839 |
| Fidelity Series Value Discovery Fund (b) | | 13,938,082 | 190,812,349 |
| TOTAL DOMESTIC EQUITY FUNDS | | | |
| (Cost $1,136,008,030) | | | 1,492,006,270 |
|
| International Equity Funds - 24.7% | | | |
| Fidelity Series Canada Fund (b) | | 2,052,838 | 22,191,183 |
| Fidelity Series Emerging Markets Fund (b) | | 837,991 | 8,120,136 |
| Fidelity Series Emerging Markets Opportunities Fund (b) | | 11,475,427 | 220,213,450 |
| Fidelity Series International Growth Fund (b) | | 13,656,432 | 223,965,477 |
| Fidelity Series International Small Cap Fund (b) | | 2,910,557 | 52,098,969 |
| Fidelity Series International Value Fund (b) | | 21,444,746 | 225,598,731 |
| TOTAL INTERNATIONAL EQUITY FUNDS | | | |
| (Cost $577,085,125) | | | 752,187,946 |
|
| Bond Funds - 23.8% | | | |
| Fidelity Series Emerging Markets Debt Fund (b) | | 2,050,068 | 19,537,152 |
| Fidelity Series Floating Rate High Income Fund (b) | | 711,119 | 6,769,851 |
| Fidelity Series High Income Fund (b) | | 4,332,397 | 41,634,336 |
| Fidelity Series Inflation-Protected Bond Index Fund (b) | | 1,843,483 | 17,900,220 |
| Fidelity Series International Credit Fund (b) | | 150,745 | 1,481,821 |
| Fidelity Series Investment Grade Bond Fund (b) | | 41,541,109 | 452,382,676 |
| Fidelity Series Long-Term Treasury Bond Index Fund (b) | | 20,922,640 | 172,402,550 |
| Fidelity Series Real Estate Income Fund (b) | | 1,261,476 | 13,598,714 |
| TOTAL BOND FUNDS | | | |
| (Cost $746,100,743) | | | 725,707,320 |
|
| Short-Term Funds - 2.5% | | | |
| Fidelity Cash Central Fund, 2.11% (c) | | 6,848,744 | 6,850,114 |
| Fidelity Series Government Money Market Fund 2.12% (b)(d) | | 60,680,590 | 60,680,590 |
| Fidelity Series Short-Term Credit Fund (b) | | 856,434 | 8,444,443 |
| TOTAL SHORT-TERM FUNDS | | | |
| (Cost $76,052,275) | | | 75,975,147 |
| TOTAL INVESTMENT IN SECURITIES - 100.1% | | | |
| (Cost $2,537,399,361) | | | 3,048,029,728 |
| NET OTHER ASSETS (LIABILITIES) - (0.1)% | | | (2,412,036) |
| NET ASSETS - 100% | | | $3,045,617,692 |
| Futures Contracts | | | | | |
| | Number of contracts | Expiration Date | Notional Amount | Value | Unrealized Appreciation/(Depreciation) |
| Purchased | | | | | |
| Equity Index Contracts | | | | | |
| ICE E-mini MSCI Emerging Markets Index Contracts (United States) | 370 | Dec. 2018 | $19,419,450 | $361,216 | $361,216 |
| Sold | | | | | |
| Equity Index Contracts | | | | | |
| CME E-mini S&P 500 Index Contracts (United States) | 92 | Dec. 2018 | 13,427,400 | (3,550) | (3,550) |
| TOTAL FUTURES CONTRACTS | | | | | $357,666 |
The notional amount of futures purchased as a percentage of Net Assets is 0.6%
The notional amount of futures sold as a percentage of Net Assets is 0.4%
Legend
(a) Security or a portion of the security was pledged to cover margin requirements for futures contracts. At period end, the value of securities pledged amounted to $1,090,522.
(b) Affiliated Fund
(c) Affiliated fund that is generally available only to investment companies and other accounts managed by Fidelity Investments. The rate quoted is the annualized seven-day yield of the fund at period end. A complete unaudited listing of the fund's holdings as of its most recent quarter end is available upon request. In addition, each Fidelity Central Fund's financial statements are available on the SEC's website or upon request.
(d) The rate quoted is the annualized seven-day yield of the fund at period end.
Affiliated Central Funds
Information regarding fiscal year to date income earned by the Fund from investments in Fidelity Central Funds is as follows:
| Fund | Income earned |
| Fidelity Cash Central Fund | $26,805 |
| Total | $26,805 |
Amounts in the income column in the above table include any capital gain distributions from underlying funds, which are presented in the corresponding line-item in the Statement of Operations if applicable.
Affiliated Underlying Funds
Fiscal year to date information regarding the Fund's investments in affiliated Underlying Funds, excluding any Money Market Central Funds, is presented below. Exchanges between classes of the same affiliated Underlying Funds may occur.
| Affiliate | Value, beginning of period | Purchases | Sales Proceeds | Dividend Income | Realized Gain (loss) | Change in Unrealized appreciation (depreciation) | Value, end of period |
| Fidelity Advisor Series Equity Growth Fund | $160,105,288 | $3,828,101 | $14,252,362 | $ - | $1,204,438 | $21,471,584 | $172,357,049 |
| Fidelity Advisor Series Equity Value Fund | 184,673,886 | 10,441,310 | 8,856,983 | 6,157,923 | 50,845 | (29,651,736) | - |
| Fidelity Advisor Series Growth & Income Fund | 282,815,807 | 31,809,428 | 19,123,671 | 25,143,407 | 717,689 | (46,871,778) | - |
| Fidelity Advisor Series Growth Opportunities Fund | 105,130,031 | 2,508,205 | 18,447,881 | - | 4,204,450 | 22,500,971 | 115,895,776 |
| Fidelity Advisor Series Opportunistic Insights Fund | 148,960,609 | 15,259,900 | 11,514,929 | 11,766,897 | 826,448 | (59,487,019) | - |
| Fidelity Advisor Series Small Cap Fund | 80,158,042 | 1,874,035 | 5,547,359 | - | 181,742 | 4,404,371 | 81,070,831 |
| Fidelity Advisor Series Stock Selector Large Cap Value Fund | 186,438,157 | 19,697,824 | 8,899,130 | 15,631,435 | 18,504 | (29,303,322) | - |
| Fidelity Series 100 Index Fund | 79,553,910 | - | 83,647,944 | - | 32,125,582 | (28,031,548) | - |
| Fidelity Series All-Sector Equity Fund | 109,869,027 | 2,521,119 | 47,490,964 | - | 8,571,919 | 3,593,304 | 77,064,405 |
| Fidelity Series Canada Fund | 22,113,942 | 496,745 | 1,785,474 | - | 30,090 | 1,335,880 | 22,191,183 |
| Fidelity Series Commodity Strategy Fund | 63,089,625 | 9,073,291 | 5,100,580 | 3,708,801 | (1,477,355) | (3,583,768) | 62,001,213 |
| Fidelity Series Emerging Markets Debt Fund | 20,524,216 | 1,005,831 | 870,527 | 599,687 | (29,535) | (1,092,833) | 19,537,152 |
| Fidelity Series Emerging Markets Fund | - | 8,088,532 | - | - | - | 31,604 | 8,120,136 |
| Fidelity Series Emerging Markets Opportunities Fund | 229,181,656 | 30,055,815 | 9,603,350 | - | (308,867) | (29,111,804) | 220,213,450 |
| Fidelity Series Floating Rate High Income Fund | 6,775,351 | 350,047 | 362,578 | 180,870 | (1,684) | 8,715 | 6,769,851 |
| Fidelity Series Government Money Market Fund 2.12% | 43,596,913 | 34,638,798 | 17,555,121 | 474,689 | - | - | 60,680,590 |
| Fidelity Series High Income Fund | 42,436,867 | 2,097,185 | 3,246,489 | 1,217,336 | (47,605) | 394,378 | 41,634,336 |
| Fidelity Series Inflation-Protected Bond Index Fund | 23,288,678 | 5,178,316 | 10,639,250 | 36,902 | (189,300) | 261,776 | 17,900,220 |
| Fidelity Series International Credit Fund | 1,478,474 | 18,221 | - | 18,220 | - | (14,874) | 1,481,821 |
| Fidelity Series International Growth Fund | 223,420,738 | 8,007,878 | 10,875,013 | - | 1,254,496 | 2,157,378 | 223,965,477 |
| Fidelity Series International Small Cap Fund | 55,748,352 | 1,300,805 | 2,809,565 | - | 279,434 | (2,420,057) | 52,098,969 |
| Fidelity Series International Value Fund | 225,385,847 | 11,298,318 | 10,407,013 | - | (142,331) | (536,090) | 225,598,731 |
| Fidelity Series Investment Grade Bond Fund | 465,066,009 | 29,957,958 | 37,267,066 | 6,545,327 | (477,702) | (4,896,523) | 452,382,676 |
| Fidelity Series Large Cap Stock Fund | - | 142,454 | 339,365 | - | (1,369) | 52,522,091 | 301,671,286 |
| Fidelity Series Large Cap Value Index Fund | 31,129,323 | 734,196 | 1,521,453 | - | 14,960 | 2,165,132 | 32,522,158 |
| Fidelity Series Long-Term Treasury Bond Index Fund | 65,647,248 | 118,011,854 | 5,272,535 | 1,713,227 | (126,601) | (5,857,416) | 172,402,550 |
| Fidelity Series Opportunistic Insights Fund | - | 76,330 | 182,672 | - | (9,269) | 67,440,729 | 161,370,127 |
| Fidelity Series Real Estate Equity Fund | 19,318,083 | 264 | 19,796,788 | 154 | 1,704,398 | (1,225,957) | - |
| Fidelity Series Real Estate Income Fund | 13,306,628 | 892,465 | 681,768 | 574,265 | 2,204 | 79,185 | 13,598,714 |
| Fidelity Series Short-Term Credit Fund | 8,273,138 | 772,858 | 601,829 | 93,960 | (2,214) | 2,490 | 8,444,443 |
| Fidelity Series Small Cap Opportunities Fund | 97,802,834 | 10,262,280 | 8,270,812 | 7,960,953 | 1,039,216 | 2,278,719 | 103,112,237 |
| Fidelity Series Stock Selector Large Cap Value Fund | - | 351,554 | 264,467 | - | (14,970) | 26,104,689 | 194,128,839 |
| Fidelity Series Value Discovery Fund | - | 91,567 | 218,260 | - | (5,485) | 34,287,205 | 190,812,349 |
| | $2,995,288,679 | $360,843,484 | $365,453,198 | $81,824,053 | $49,392,128 | $(1,044,524) | $3,039,026,569 |
Amounts in the income column in the above table include any capital gain distributions from underlying funds, which are presented in the corresponding line-item in the Statement of Operations if applicable.
Investment Valuation
The following is a summary of the inputs used, as of September 30, 2018, involving the Fund's assets and liabilities carried at fair value. The inputs or methodology used for valuing securities may not be an indication of the risk associated with investing in those securities. For more information on valuation inputs, and their aggregation into the levels used below, please refer to the Investment Valuation section in the accompanying Notes to Financial Statements.
| | Valuation Inputs at Reporting Date: |
| Description | Total | Level 1 | Level 2 | Level 3 |
| Investments in Securities: | | | | |
| Other Short-Term Investments | $2,153,045 | $-- | $2,153,045 | $-- |
| Domestic Equity Funds | 1,492,006,270 | 1,492,006,270 | -- | -- |
| International Equity Funds | 752,187,946 | 752,187,946 | -- | -- |
| Bond Funds | 725,707,320 | 725,707,320 | -- | -- |
| Short-Term Funds | 75,975,147 | 75,975,147 | -- | -- |
| Total Investments in Securities: | $3,048,029,728 | $3,045,876,683 | $2,153,045 | $-- |
| Derivative Instruments: | | | | |
| Assets | | | | |
| Futures Contracts | $361,216 | $361,216 | $-- | $-- |
| Total Assets | $361,216 | $361,216 | $-- | $-- |
| Liabilities | | | | |
| Futures Contracts | $(3,550) | $(3,550) | $-- | $-- |
| Total Liabilities | $(3,550) | $(3,550) | $-- | $-- |
| Total Derivative Instruments: | $357,666 | $357,666 | $-- | $-- |
Value of Derivative Instruments
The following table is a summary of the Fund's value of derivative instruments by primary risk exposure as of September 30, 2018. For additional information on derivative instruments, please refer to the Derivative Instruments section in the accompanying Notes to Financial Statements.
| Primary Risk Exposure / Derivative Type | Value |
| | Asset | Liability |
| Equity Risk | | |
| Futures Contracts(a) | $361,216 | $(3,550) |
| Total Equity Risk | 361,216 | (3,550) |
| Total Value of Derivatives | $361,216 | $(3,550) |
(a) Reflects gross cumulative appreciation (depreciation) on futures contracts as presented in the Schedule of Investments. In the Statement of Assets and Liabilities, the period end daily variation margin is included in receivable or payable for daily variation margin on futures contracts, and the net cumulative appreciation (depreciation) is included in net unrealized appreciation (depreciation).
See accompanying notes which are an integral part of the financial statements.
Fidelity Advisor Freedom® 2030 Fund
Financial Statements
Statement of Assets and Liabilities
| | | September 30, 2018 (Unaudited) |
| Assets | | |
Investment in securities, at value — See accompanying schedule:
Unaffiliated issuers (cost $2,153,188) | $2,153,045 | |
| Fidelity Central Funds (cost $6,850,114) | 6,850,114 | |
| Other affiliated issuers (cost $2,528,396,059) | 3,039,026,569 | |
| Total Investment in Securities (cost $2,537,399,361) | | $3,048,029,728 |
| Receivable for investments sold | | 10,365,166 |
| Receivable for fund shares sold | | 2,214,391 |
| Distributions receivable from Fidelity Central Funds | | 10,200 |
| Total assets | | 3,060,619,485 |
| Liabilities | | |
| Payable for investments purchased | $7,902,050 | |
| Payable for fund shares redeemed | 4,646,771 | |
| Accrued management fee | 1,748,436 | |
| Distribution and service plan fees payable | 554,821 | |
| Payable for daily variation margin on futures contracts | 149,715 | |
| Total liabilities | | 15,001,793 |
| Net Assets | | $3,045,617,692 |
| Net Assets consist of: | | |
| Paid in capital | | $2,424,971,246 |
| Undistributed net investment income | | 13,452,907 |
| Accumulated undistributed net realized gain (loss) on investments | | 96,205,506 |
| Net unrealized appreciation (depreciation) on investments | | 510,988,033 |
| Net Assets | | $3,045,617,692 |
| Calculation of Maximum Offering Price | | |
| Class A: | | |
| Net Asset Value and redemption price per share ($1,343,871,152 ÷ 90,059,554 shares) | | $14.92 |
| Maximum offering price per share (100/94.25 of $14.92) | | $15.83 |
| Class M: | | |
| Net Asset Value and redemption price per share ($464,853,948 ÷ 31,328,481 shares) | | $14.84 |
| Maximum offering price per share (100/96.50 of $14.84) | | $15.38 |
| Class C: | | |
| Net Asset Value and offering price per share ($99,042,908 ÷ 6,770,002 shares)(a) | | $14.63 |
| Class I: | | |
| Net Asset Value, offering price and redemption price per share ($1,092,140,557 ÷ 72,702,203 shares) | | $15.02 |
| Class Z6: | | |
| Net Asset Value, offering price and redemption price per share ($45,709,127 ÷ 3,045,737 shares) | | $15.01 |
(a) Redemption price per share is equal to net asset value less any applicable contingent deferred sales charge.
See accompanying notes which are an integral part of the financial statements.
Statement of Operations
| | | Six months ended September 30, 2018 (Unaudited) |
| Investment Income | | |
| Dividends: | | |
| Affiliated issuers | | $27,265,404 |
| Interest | | 10,089 |
| Income from Fidelity Central Funds | | 26,805 |
| Total income | | 27,302,298 |
| Expenses | | |
| Management fee | $10,501,690 | |
| Distribution and service plan fees | 3,340,722 | |
| Independent trustees' fees and expenses | 7,356 | |
| Total expenses before reductions | 13,849,768 | |
| Expense reductions | (55) | |
| Total expenses after reductions | | 13,849,713 |
| Net investment income (loss) | | 13,452,585 |
| Realized and Unrealized Gain (Loss) | | |
| Net realized gain (loss) on: | | |
| Investment securities: | | |
| Fidelity Central Funds | (67) | |
| Other affiliated issuers | 49,392,128 | |
| Futures contracts | (955,929) | |
| Capital gain distributions from underlying funds: | | |
| Affiliated issuers | 54,558,649 | |
| Total net realized gain (loss) | | 102,994,781 |
| Change in net unrealized appreciation (depreciation) on: | | |
| Investment securities: | | |
| Unaffiliated issuers | (130) | |
| Affiliated issuers | (1,044,524) | |
| Futures contracts | 357,666 | |
| Total change in net unrealized appreciation (depreciation) | | (686,988) |
| Net gain (loss) | | 102,307,793 |
| Net increase (decrease) in net assets resulting from operations | | $115,760,378 |
See accompanying notes which are an integral part of the financial statements.
Statement of Changes in Net Assets
| | Six months ended September 30, 2018 (Unaudited) | Year ended March 31, 2018 |
| Increase (Decrease) in Net Assets | | |
| Operations | | |
| Net investment income (loss) | $13,452,585 | $29,589,232 |
| Net realized gain (loss) | 102,994,781 | 206,631,223 |
| Change in net unrealized appreciation (depreciation) | (686,988) | 87,525,917 |
| Net increase (decrease) in net assets resulting from operations | 115,760,378 | 323,746,372 |
| Distributions to shareholders from net investment income | – | (32,430,120) |
| Distributions to shareholders from net realized gain | (120,442,750) | (127,678,746) |
| Total distributions | (120,442,750) | (160,108,866) |
| Share transactions - net increase (decrease) | 56,965,527 | 6,442,311 |
| Total increase (decrease) in net assets | 52,283,155 | 170,079,817 |
| Net Assets | | |
| Beginning of period | 2,993,334,537 | 2,823,254,720 |
| End of period | $3,045,617,692 | $2,993,334,537 |
| Other Information | | |
| Undistributed net investment income end of period | $13,452,907 | $322 |
See accompanying notes which are an integral part of the financial statements.
Financial Highlights
Fidelity Advisor Freedom 2030 Fund Class A
| | Six months ended (Unaudited) September 30, | Years endedMarch 31, | | | | |
| | 2018 | 2018 | 2017 | 2016 | 2015 | 2014 |
| Selected Per–Share Data | | | | | | |
| Net asset value, beginning of period | $14.95 | $14.12 | $12.99 | $14.13 | $14.15 | $13.36 |
| Income from Investment Operations | | | | | | |
| Net investment income (loss)A | .06 | .15 | .18 | .19 | .20 | .17 |
| Net realized and unrealized gain (loss) | .51 | 1.50 | 1.57 | (.64) | .70 | 1.47 |
| Total from investment operations | .57 | 1.65 | 1.75 | (.45) | .90 | 1.64 |
| Distributions from net investment income | – | (.16) | (.18) | (.19) | (.21) | (.18) |
| Distributions from net realized gain | (.60) | (.66) | (.44) | (.50) | (.71) | (.67) |
| Total distributions | (.60) | (.82) | (.62) | (.69) | (.92) | (.85) |
| Net asset value, end of period | $14.92 | $14.95 | $14.12 | $12.99 | $14.13 | $14.15 |
| Total ReturnB,C,D | 3.88% | 11.80% | 14.02% | (3.36)% | 6.54% | 12.60% |
| Ratios to Average Net AssetsE,F | | | | | | |
| Expenses before reductions | .94%G,H | .84% | .25% | .25% | .25% | .25% |
| Expenses net of fee waivers, if any | .94%G,H | .84% | .25% | .25% | .25% | .25% |
| Expenses net of all reductions | .94%G,H | .84% | .25% | .25% | .25% | .25% |
| Net investment income (loss) | .85%G | .99% | 1.34% | 1.39% | 1.42% | 1.24% |
| Supplemental Data | | | | | | |
| Net assets, end of period (000 omitted) | $1,343,871 | $1,374,112 | $1,414,388 | $1,409,909 | $1,704,036 | $1,777,132 |
| Portfolio turnover rateE | 24%G | 25% | 18% | 22% | 24% | 53% |
A Calculated based on average shares outstanding during the period.
B Total returns for periods of less than one year are not annualized.
C Total returns would have been lower if certain expenses had not been reduced during the applicable periods shown.
D Total returns do not include the effect of the sales charges.
E Amounts do not include the activity of the Underlying Funds.
F Expense ratios reflect operating expenses of the class. Expenses before reductions do not reflect amounts reimbursed by the investment adviser or reductions from expense offset arrangements and do not represent the amount paid by the class during periods when reimbursements or reductions occur. Expenses net of fee waivers reflect expenses after reimbursement by the investment adviser but prior to reductions from expense offset arrangements. Expenses net of all reductions represent the net expenses paid by the class but do not include expenses of the underlying funds in which the Fund invests.
G Annualized
H On certain classes, the size and fluctuation of net assets and expense amounts may cause ratios to differ from contractual rates.
See accompanying notes which are an integral part of the financial statements.
Fidelity Advisor Freedom 2030 Fund Class M
| | Six months ended (Unaudited) September 30, | Years endedMarch 31, | | | | |
| | 2018 | 2018 | 2017 | 2016 | 2015 | 2014 |
| Selected Per–Share Data | | | | | | |
| Net asset value, beginning of period | $14.88 | $14.06 | $12.94 | $14.09 | $14.10 | $13.32 |
| Income from Investment Operations | | | | | | |
| Net investment income (loss)A | .04 | .11 | .15 | .15 | .17 | .14 |
| Net realized and unrealized gain (loss) | .51 | 1.50 | 1.56 | (.64) | .71 | 1.46 |
| Total from investment operations | .55 | 1.61 | 1.71 | (.49) | .88 | 1.60 |
| Distributions from net investment income | – | (.13) | (.15) | (.16) | (.18) | (.15) |
| Distributions from net realized gain | (.59) | (.66) | (.44) | (.50) | (.71) | (.67) |
| Total distributions | (.59) | (.79) | (.59) | (.66) | (.89) | (.82) |
| Net asset value, end of period | $14.84 | $14.88 | $14.06 | $12.94 | $14.09 | $14.10 |
| Total ReturnB,C,D | 3.77% | 11.53% | 13.74% | (3.67)% | 6.37% | 12.29% |
| Ratios to Average Net AssetsE,F | | | | | | |
| Expenses before reductions | 1.19%G,H | 1.09% | .50% | .50% | .50% | .50% |
| Expenses net of fee waivers, if any | 1.19%G,H | 1.09% | .50% | .50% | .50% | .50% |
| Expenses net of all reductions | 1.19%G,H | 1.09% | .50% | .50% | .50% | .50% |
| Net investment income (loss) | .60%G | .74% | 1.09% | 1.14% | 1.17% | .99% |
| Supplemental Data | | | | | | |
| Net assets, end of period (000 omitted) | $464,854 | $452,750 | $442,505 | $423,312 | $453,137 | $453,944 |
| Portfolio turnover rateE | 24%G | 25% | 18% | 22% | 24% | 53% |
A Calculated based on average shares outstanding during the period.
B Total returns for periods of less than one year are not annualized.
C Total returns would have been lower if certain expenses had not been reduced during the applicable periods shown.
D Total returns do not include the effect of the sales charges.
E Amounts do not include the activity of the Underlying Funds.
F Expense ratios reflect operating expenses of the class. Expenses before reductions do not reflect amounts reimbursed by the investment adviser or reductions from expense offset arrangements and do not represent the amount paid by the class during periods when reimbursements or reductions occur. Expenses net of fee waivers reflect expenses after reimbursement by the investment adviser but prior to reductions from expense offset arrangements. Expenses net of all reductions represent the net expenses paid by the class but do not include expenses of the underlying funds in which the Fund invests.
G Annualized
H On certain classes, the size and fluctuation of net assets and expense amounts may cause ratios to differ from contractual rates.
See accompanying notes which are an integral part of the financial statements.
Fidelity Advisor Freedom 2030 Fund Class C
| | Six months ended (Unaudited) September 30, | Years endedMarch 31, | | | | |
| | 2018 | 2018 | 2017 | 2016 | 2015 | 2014 |
| Selected Per–Share Data | | | | | | |
| Net asset value, beginning of period | $14.71 | $13.92 | $12.83 | $13.97 | $14.00 | $13.23 |
| Income from Investment Operations | | | | | | |
| Net investment income (loss)A | .01 | .03 | .08 | .08 | .09 | .07 |
| Net realized and unrealized gain (loss) | .49 | 1.48 | 1.55 | (.63) | .70 | 1.45 |
| Total from investment operations | .50 | 1.51 | 1.63 | (.55) | .79 | 1.52 |
| Distributions from net investment income | – | (.07) | (.10) | (.11) | (.12) | (.09) |
| Distributions from net realized gain | (.58) | (.65) | (.44) | (.48) | (.70) | (.66) |
| Total distributions | (.58) | (.72) | (.54) | (.59) | (.82) | (.75) |
| Net asset value, end of period | $14.63 | $14.71 | $13.92 | $12.83 | $13.97 | $14.00 |
| Total ReturnB,C,D | 3.48% | 10.97% | 13.21% | (4.10)% | 5.76% | 11.77% |
| Ratios to Average Net AssetsE,F | | | | | | |
| Expenses before reductions | 1.70%G | 1.59% | 1.00% | 1.00% | 1.00% | 1.00% |
| Expenses net of fee waivers, if any | 1.70%G | 1.59% | 1.00% | 1.00% | 1.00% | 1.00% |
| Expenses net of all reductions | 1.70%G | 1.59% | 1.00% | 1.00% | 1.00% | 1.00% |
| Net investment income (loss) | .10%G | .24% | .59% | .64% | .67% | .49% |
| Supplemental Data | | | | | | |
| Net assets, end of period (000 omitted) | $99,043 | $96,199 | $94,517 | $87,691 | $91,154 | $87,867 |
| Portfolio turnover rateE | 24%G | 25% | 18% | 22% | 24% | 53% |
A Calculated based on average shares outstanding during the period.
B Total returns for periods of less than one year are not annualized.
C Total returns would have been lower if certain expenses had not been reduced during the applicable periods shown.
D Total returns do not include the effect of the contingent deferred sales charge.
E Amounts do not include the activity of the Underlying Funds.
F Expense ratios reflect operating expenses of the class. Expenses before reductions do not reflect amounts reimbursed by the investment adviser or reductions from expense offset arrangements and do not represent the amount paid by the class during periods when reimbursements or reductions occur. Expenses net of fee waivers reflect expenses after reimbursement by the investment adviser but prior to reductions from expense offset arrangements. Expenses net of all reductions represent the net expenses paid by the class but do not include expenses of the underlying funds in which the Fund invests.
G Annualized
See accompanying notes which are an integral part of the financial statements.
Fidelity Advisor Freedom 2030 Fund Class I
| | Six months ended (Unaudited) September 30, | Years endedMarch 31, | | | | |
| | 2018 | 2018 | 2017 | 2016 | 2015 | 2014 |
| Selected Per–Share Data | | | | | | |
| Net asset value, beginning of period | $15.04 | $14.21 | $13.06 | $14.21 | $14.22 | $13.42 |
| Income from Investment Operations | | | | | | |
| Net investment income (loss)A | .08 | .18 | .21 | .22 | .24 | .20 |
| Net realized and unrealized gain (loss) | .51 | 1.51 | 1.59 | (.65) | .71 | 1.48 |
| Total from investment operations | .59 | 1.69 | 1.80 | (.43) | .95 | 1.68 |
| Distributions from net investment income | – | (.21) | (.21) | (.23) | (.25) | (.21) |
| Distributions from net realized gain | (.61) | (.66) | (.44) | (.50) | (.71) | (.67) |
| Total distributions | (.61) | (.86)B | (.65) | (.72)C | (.96) | (.88) |
| Net asset value, end of period | $15.02 | $15.04 | $14.21 | $13.06 | $14.21 | $14.22 |
| Total ReturnD,E | 4.00% | 12.04% | 14.38% | (3.16)% | 6.85% | 12.89% |
| Ratios to Average Net AssetsF,G | | | | | | |
| Expenses before reductions | .70%H | .60% | - %I | - %I | - %I | - %I |
| Expenses net of fee waivers, if any | .70%H | .60% | -% | -% | -% | -% |
| Expenses net of all reductions | .70%H | .60% | -% | -% | -% | -% |
| Net investment income (loss) | 1.10%H | 1.23% | 1.59% | 1.64% | 1.67% | 1.49% |
| Supplemental Data | | | | | | |
| Net assets, end of period (000 omitted) | $1,092,141 | $1,043,420 | $871,845 | $861,408 | $919,561 | $897,398 |
| Portfolio turnover rateF | 24%H | 25% | 18% | 22% | 24% | 53% |
A Calculated based on average shares outstanding during the period.
B Total distributions of $.86 per share is comprised of distributions from net investment income of $.205 and distributions from net realized gain of $.656 per share.
C Total distributions of $.72 per share is comprised of distributions from net investment income of $.225 and distributions from net realized gain of $.499 per share.
D Total returns for periods of less than one year are not annualized.
E Total returns would have been lower if certain expenses had not been reduced during the applicable periods shown.
F Amounts do not include the activity of the Underlying Funds.
G Expense ratios reflect operating expenses of the class. Expenses before reductions do not reflect amounts reimbursed by the investment adviser or reductions from expense offset arrangements and do not represent the amount paid by the class during periods when reimbursements or reductions occur. Expenses net of fee waivers reflect expenses after reimbursement by the investment adviser but prior to reductions from expense offset arrangements. Expenses net of all reductions represent the net expenses paid by the class but do not include expenses of the underlying funds in which the Fund invests.
H Annualized
I Amount represents less than .005%.
See accompanying notes which are an integral part of the financial statements.
Fidelity Advisor Freedom 2030 Fund Class Z6
| | Six months ended (Unaudited) September 30, | Years endedMarch 31, |
| | 2018 | 2018 A |
| Selected Per–Share Data | | |
| Net asset value, beginning of period | $15.03 | $14.53 |
| Income from Investment Operations | | |
| Net investment income (loss)B | .10 | .16 |
| Net realized and unrealized gain (loss) | .51 | .99 |
| Total from investment operations | .61 | 1.15 |
| Distributions from net investment income | – | (.23) |
| Distributions from net realized gain | (.63) | (.42) |
| Total distributions | (.63) | (.65) |
| Net asset value, end of period | $15.01 | $15.03 |
| Total ReturnC,D | 4.12% | 7.90% |
| Ratios to Average Net AssetsE,F | | |
| Expenses before reductions | .47%G | .49%G,H |
| Expenses net of fee waivers, if any | .47%G | .49%G,H |
| Expenses net of all reductions | .47%G | .49%G,H |
| Net investment income (loss) | 1.33%G | 1.29%G |
| Supplemental Data | | |
| Net assets, end of period (000 omitted) | $45,709 | $26,854 |
| Portfolio turnover rateE | 24%G | 25% |
A For the period June 6, 2017 (commencement of sale of shares) to March 31, 2018.
B Calculated based on average shares outstanding during the period.
C Total returns for periods of less than one year are not annualized.
D Total returns would have been lower if certain expenses had not been reduced during the applicable periods shown.
E Amounts do not include the activity of the Underlying Funds.
F Expense ratios reflect operating expenses of the class. Expenses before reductions do not reflect amounts reimbursed by the investment adviser or reductions from expense offset arrangements and do not represent the amount paid by the class during periods when reimbursements or reductions occur. Expenses net of fee waivers reflect expenses after reimbursement by the investment adviser but prior to reductions from expense offset arrangements. Expenses net of all reductions represent the net expenses paid by the class but do not include expenses of the underlying funds in which the Fund invests.
G Annualized
H On certain classes, the size and fluctuation of net assets and expense amounts may cause ratios to differ from contractual rates.
See accompanying notes which are an integral part of the financial statements.
Fidelity Advisor Freedom® 2035 Fund
Investment Summary (Unaudited)
The information in the following tables is based on the direct investments of the Fund.
Top Holdings as of September 30, 2018
| | % of fund's net assets |
| Fidelity Series Large Cap Stock Fund | 11.7 |
| Fidelity Series International Growth Fund | 8.9 |
| Fidelity Series International Value Fund | 8.8 |
| Fidelity Series Emerging Markets Opportunities Fund | 8.3 |
| Fidelity Series Stock Selector Large Cap Value Fund | 7.4 |
| Fidelity Series Value Discovery Fund | 7.3 |
| Fidelity Advisor Series Equity Growth Fund | 6.7 |
| Fidelity Series Opportunistic Insights Fund | 6.3 |
| Fidelity Series Long-Term Treasury Bond Index Fund | 5.7 |
| Fidelity Advisor Series Growth Opportunities Fund | 4.6 |
| | 75.7 |
Asset Allocation (% of fund's net assets)
| Period end |
| | Domestic Equity Funds | 57.6% |
| | International Equity Funds | 29.3% |
| | Bond Funds | 10.2% |
| | Short-Term Funds | 2.9% |
| | Short-Term Investments | 0.1% |
| | Net Other Assets (Liabilities)* | (0.1)% |

* Net Other Assets (Liabilities) are not included in the pie chart
Domestic Equity Funds category includes Fidelity Series Commodity Strategy Fund which invests in commodity-related investments.
Fidelity Advisor Freedom® 2035 Fund
Schedule of Investments September 30, 2018 (Unaudited)
Showing Percentage of Net Assets
| U.S. Treasury Obligations - 0.1% | | | |
| | | Principal Amount | Value |
| U.S. Treasury Bills, yield at date of purchase 2.03% to 2.11% 11/23/18 to 12/6/18 (a) | | | |
| (Cost $1,744,009) | | 1,750,000 | 1,743,850 |
| | | Shares | Value |
|
| Domestic Equity Funds - 57.6% | | | |
| Fidelity Advisor Series Equity Growth Fund (b) | | 10,706,056 | $165,515,633 |
| Fidelity Advisor Series Growth Opportunities Fund (b) | | 6,718,164 | 111,790,254 |
| Fidelity Advisor Series Small Cap Fund (b) | | 6,166,917 | 77,518,140 |
| Fidelity Series All-Sector Equity Fund (b) | | 5,514,649 | 75,054,369 |
| Fidelity Series Commodity Strategy Fund (b) | | 10,051,953 | 50,259,766 |
| Fidelity Series Large Cap Stock Fund (b) | | 18,107,156 | 288,446,994 |
| Fidelity Series Large Cap Value Index Fund (b) | | 2,289,043 | 30,215,367 |
| Fidelity Series Opportunistic Insights Fund (b) | | 7,807,140 | 154,971,727 |
| Fidelity Series Small Cap Opportunities Fund (b) | | 6,791,356 | 99,765,021 |
| Fidelity Series Stock Selector Large Cap Value Fund (b) | | 13,780,802 | 182,182,202 |
| Fidelity Series Value Discovery Fund (b) | | 13,070,393 | 178,933,681 |
| TOTAL DOMESTIC EQUITY FUNDS | | | |
| (Cost $1,091,451,772) | | | 1,414,653,154 |
|
| International Equity Funds - 29.3% | | | |
| Fidelity Series Canada Fund (b) | | 1,951,495 | 21,095,657 |
| Fidelity Series Emerging Markets Fund (b) | | 1,112,140 | 10,776,633 |
| Fidelity Series Emerging Markets Opportunities Fund (b) | | 10,614,120 | 203,684,958 |
| Fidelity Series International Growth Fund (b) | | 13,273,560 | 217,686,379 |
| Fidelity Series International Small Cap Fund (b) | | 2,855,713 | 51,117,271 |
| Fidelity Series International Value Fund (b) | | 20,560,234 | 216,293,659 |
| TOTAL INTERNATIONAL EQUITY FUNDS | | | |
| (Cost $566,136,596) | | | 720,654,557 |
|
| Bond Funds - 10.2% | | | |
| Fidelity Series Emerging Markets Debt Fund (b) | | 1,574,046 | 15,000,663 |
| Fidelity Series Floating Rate High Income Fund (b) | | 554,769 | 5,281,402 |
| Fidelity Series High Income Fund (b) | | 3,394,619 | 32,622,292 |
| Fidelity Series Inflation-Protected Bond Index Fund (b) | | 751,506 | 7,297,124 |
| Fidelity Series International Credit Fund (b) | | 118,992 | 1,169,694 |
| Fidelity Series Investment Grade Bond Fund (b) | | 3,618,784 | 39,408,552 |
| Fidelity Series Long-Term Treasury Bond Index Fund (b) | | 16,864,244 | 138,961,374 |
| Fidelity Series Real Estate Income Fund (b) | | 988,359 | 10,654,513 |
| TOTAL BOND FUNDS | | | |
| (Cost $257,712,928) | | | 250,395,614 |
|
| Short-Term Funds - 2.9% | | | |
| Fidelity Cash Central Fund, 2.11% (c) | | 5,643,649 | 5,644,777 |
| Fidelity Series Government Money Market Fund 2.12% (b)(d) | | 53,292,763 | 53,292,763 |
| Fidelity Series Short-Term Credit Fund (b) | | 1,127,113 | 11,113,338 |
| TOTAL SHORT-TERM FUNDS | | | |
| (Cost $70,114,170) | | | 70,050,878 |
| TOTAL INVESTMENT IN SECURITIES - 100.1% | | | |
| (Cost $1,987,159,475) | | | 2,457,498,053 |
| NET OTHER ASSETS (LIABILITIES) - (0.1)% | | | (2,006,693) |
| NET ASSETS - 100% | | | $2,455,491,360 |
| Futures Contracts | | | | | |
| | Number of contracts | Expiration Date | Notional Amount | Value | Unrealized Appreciation/(Depreciation) |
| Purchased | | | | | |
| Equity Index Contracts | | | | | |
| CME E-mini S&P 500 Index Contracts (United States) | 82 | Dec. 2018 | $11,967,900 | $2,322 | $2,322 |
| ICE E-mini MSCI Emerging Markets Index Contracts (United States) | 199 | Dec. 2018 | 10,444,515 | 200,745 | 200,744 |
| | | | | | 203,066 |
| Sold | | | | | |
| Equity Index Contracts | | | | | |
| ICE E-mini MSCI EAFE Index Contracts (United States) | 54 | Dec. 2018 | 5,333,850 | (10,417) | (10,417) |
| TOTAL FUTURES CONTRACTS | | | | | $192,649 |
The notional amount of futures purchased as a percentage of Net Assets is 0.9%
The notional amount of futures sold as a percentage of Net Assets is 0.2%
Legend
(a) Security or a portion of the security was pledged to cover margin requirements for futures contracts. At period end, the value of securities pledged amounted to $792,058.
(b) Affiliated Fund
(c) Affiliated fund that is generally available only to investment companies and other accounts managed by Fidelity Investments. The rate quoted is the annualized seven-day yield of the fund at period end. A complete unaudited listing of the fund's holdings as of its most recent quarter end is available upon request. In addition, each Fidelity Central Fund's financial statements are available on the SEC's website or upon request.
(d) The rate quoted is the annualized seven-day yield of the fund at period end.
Affiliated Central Funds
Information regarding fiscal year to date income earned by the Fund from investments in Fidelity Central Funds is as follows:
| Fund | Income earned |
| Fidelity Cash Central Fund | $19,904 |
| Total | $19,904 |
Amounts in the income column in the above table include any capital gain distributions from underlying funds, which are presented in the corresponding line-item in the Statement of Operations if applicable.
Affiliated Underlying Funds
Fiscal year to date information regarding the Fund's investments in affiliated Underlying Funds, excluding any Money Market Central Funds, is presented below. Exchanges between classes of the same affiliated Underlying Funds may occur.
| Affiliate | Value, beginning of period | Purchases | Sales Proceeds | Dividend Income | Realized Gain (loss) | Change in Unrealized appreciation (depreciation) | Value, end of period |
| Fidelity Advisor Series Equity Growth Fund | $150,443,525 | $3,861,007 | $10,272,360 | $-- | $725,919 | $20,757,542 | $165,515,633 |
| Fidelity Advisor Series Equity Value Fund | 173,506,004 | 10,161,919 | 8,970,095 | 5,777,955 | 19,833 | (24,184,445) | -- |
| Fidelity Advisor Series Growth & Income Fund | 265,948,888 | 30,860,979 | 13,869,398 | 24,005,982 | 268,512 | (40,994,581) | -- |
| Fidelity Advisor Series Growth Opportunities Fund | 98,717,003 | 2,543,351 | 14,771,726 | -- | 2,716,369 | 22,585,257 | 111,790,254 |
| Fidelity Advisor Series Opportunistic Insights Fund | 139,796,668 | 14,890,529 | 7,734,189 | 11,306,712 | 438,538 | (53,339,875) | -- |
| Fidelity Advisor Series Small Cap Fund | 75,222,187 | 1,894,112 | 3,906,447 | -- | 66,899 | 4,241,389 | 77,518,140 |
| Fidelity Advisor Series Stock Selector Large Cap Value Fund | 175,247,506 | 18,975,974 | 8,963,167 | 14,685,040 | (37,770) | (24,040,272) | -- |
| Fidelity Series 100 Index Fund | 74,585,869 | -- | 79,175,006 | -- | 32,848,621 | (28,259,484) | -- |
| Fidelity Series All-Sector Equity Fund | 103,183,521 | 2,531,388 | 42,362,534 | -- | 5,146,342 | 6,555,652 | 75,054,369 |
| Fidelity Series Canada Fund | 20,489,780 | 497,145 | 1,156,149 | -- | 13,554 | 1,251,327 | 21,095,657 |
| Fidelity Series Commodity Strategy Fund | 49,722,217 | 8,606,020 | 3,922,703 | 3,009,105 | (959,330) | (3,186,438) | 50,259,766 |
| Fidelity Series Emerging Markets Debt Fund | 15,939,875 | 808,644 | 881,526 | 462,253 | (22,353) | (843,977) | 15,000,663 |
| Fidelity Series Emerging Markets Fund | -- | 10,678,668 | -- | -- | -- | 97,965 | 10,776,633 |
| Fidelity Series Emerging Markets Opportunities Fund | 214,011,029 | 33,080,187 | 16,730,487 | -- | 1,048,553 | (27,724,324) | 203,684,958 |
| Fidelity Series Floating Rate High Income Fund | 5,296,327 | 286,557 | 306,892 | 141,506 | (1,123) | 6,533 | 5,281,402 |
| Fidelity Series Government Money Market Fund 2.12% | 39,244,766 | 33,602,186 | 19,554,189 | 385,990 | -- | -- | 53,292,763 |
| Fidelity Series High Income Fund | 33,209,545 | 1,709,379 | 2,567,866 | 955,104 | (57,360) | 328,594 | 32,622,292 |
| Fidelity Series Inflation-Protected Bond Index Fund | 18,823,072 | 1,476,389 | 13,105,678 | 26,737 | (130,789) | 234,130 | 7,297,124 |
| Fidelity Series International Credit Fund | 1,167,052 | 14,383 | -- | 14,383 | -- | (11,741) | 1,169,694 |
| Fidelity Series International Growth Fund | 205,931,630 | 18,848,924 | 10,259,122 | -- | 312,096 | 2,852,851 | 217,686,379 |
| Fidelity Series International Small Cap Fund | 51,382,631 | 4,503,034 | 2,769,846 | -- | 3,585 | (2,002,133) | 51,117,271 |
| Fidelity Series International Value Fund | 208,848,910 | 18,073,163 | 10,032,333 | -- | (159,512) | (436,569) | 216,293,659 |
| Fidelity Series Investment Grade Bond Fund | 67,616,932 | 9,982,081 | 37,487,403 | 895,466 | (986,222) | 283,164 | 39,408,552 |
| Fidelity Series Large Cap Stock Fund | -- | 28,237 | 285,618 | -- | (3,690) | 46,493,665 | 288,446,994 |
| Fidelity Series Large Cap Value Index Fund | 28,939,369 | 774,107 | 1,526,679 | -- | 17,205 | 2,011,365 | 30,215,367 |
| Fidelity Series Long-Term Treasury Bond Index Fund | 53,989,913 | 94,205,016 | 4,480,424 | 1,396,070 | (113,260) | (4,639,871) | 138,961,374 |
| Fidelity Series Opportunistic Insights Fund | -- | 16,884 | 152,994 | -- | (6,832) | 61,062,998 | 154,971,727 |
| Fidelity Series Real Estate Equity Fund | 18,057,338 | -- | 18,571,957 | -- | 1,255,944 | (741,325) | -- |
| Fidelity Series Real Estate Income Fund | 10,443,233 | 723,551 | 577,019 | 450,780 | 2,846 | 61,902 | 10,654,513 |
| Fidelity Series Short-Term Credit Fund | 6,886,600 | 4,737,927 | 511,490 | 78,873 | (2,364) | 2,665 | 11,113,338 |
| Fidelity Series Small Cap Opportunities Fund | 91,742,421 | 10,043,438 | 4,824,085 | 7,709,229 | 282,768 | 2,520,479 | 99,765,021 |
| Fidelity Series Stock Selector Large Cap Value Fund | -- | 153,922 | 236,475 | -- | (8,370) | 21,090,854 | 182,182,202 |
| Fidelity Series Value Discovery Fund | -- | 18,407 | 183,630 | -- | (3,898) | 28,569,586 | 178,933,681 |
| | $2,398,393,811 | $338,587,508 | $340,149,487 | $71,301,185 | $42,674,711 | $10,602,883 | $2,450,109,426 |
Amounts in the income column in the above table include any capital gain distributions from underlying funds, which are presented in the corresponding line-item in the Statement of Operations if applicable.
Investment Valuation
The following is a summary of the inputs used, as of September 30, 2018, involving the Fund's assets and liabilities carried at fair value. The inputs or methodology used for valuing securities may not be an indication of the risk associated with investing in those securities. For more information on valuation inputs, and their aggregation into the levels used below, please refer to the Investment Valuation section in the accompanying Notes to Financial Statements.
| | Valuation Inputs at Reporting Date: |
| Description | Total | Level 1 | Level 2 | Level 3 |
| Investments in Securities: | | | | |
| Other Short-Term Investments | $1,743,850 | $-- | $1,743,850 | $-- |
| Domestic Equity Funds | 1,414,653,154 | 1,414,653,154 | -- | -- |
| International Equity Funds | 720,654,557 | 720,654,557 | -- | -- |
| Bond Funds | 250,395,614 | 250,395,614 | -- | -- |
| Short-Term Funds | 70,050,878 | 70,050,878 | -- | -- |
| Total Investments in Securities: | $2,457,498,053 | $2,455,754,203 | $1,743,850 | $-- |
| Derivative Instruments: | | | | |
| Assets | | | | |
| Futures Contracts | $203,066 | $203,066 | $-- | $-- |
| Total Assets | $203,066 | $203,066 | $-- | $-- |
| Liabilities | | | | |
| Futures Contracts | $(10,417) | $(10,417) | $-- | $-- |
| Total Liabilities | $(10,417) | $(10,417) | $-- | $-- |
| Total Derivative Instruments: | $192,649 | $192,649 | $-- | $-- |
Value of Derivative Instruments
The following table is a summary of the Fund's value of derivative instruments by primary risk exposure as of September 30, 2018. For additional information on derivative instruments, please refer to the Derivative Instruments section in the accompanying Notes to Financial Statements.
| Primary Risk Exposure / Derivative Type | Value |
| | Asset | Liability |
| Equity Risk | | |
| Futures Contracts(a) | $203,066 | $(10,417) |
| Total Equity Risk | 203,066 | (10,417) |
| Total Value of Derivatives | $203,066 | $(10,417) |
(a) Reflects gross cumulative appreciation (depreciation) on futures contracts as presented in the Schedule of Investments. In the Statement of Assets and Liabilities, the period end daily variation margin is included in receivable or payable for daily variation margin on futures contracts, and the net cumulative appreciation (depreciation) is included in net unrealized appreciation (depreciation).
See accompanying notes which are an integral part of the financial statements.
Fidelity Advisor Freedom® 2035 Fund
Financial Statements
Statement of Assets and Liabilities
| | | September 30, 2018 (Unaudited) |
| Assets | | |
Investment in securities, at value — See accompanying schedule:
Unaffiliated issuers (cost $1,744,009) | $1,743,850 | |
| Fidelity Central Funds (cost $5,644,777) | 5,644,777 | |
| Other affiliated issuers (cost $1,979,770,689) | 2,450,109,426 | |
| Total Investment in Securities (cost $1,987,159,475) | | $2,457,498,053 |
| Receivable for investments sold | | 29,704,586 |
| Receivable for fund shares sold | | 3,420,673 |
| Distributions receivable from Fidelity Central Funds | | 8,646 |
| Other receivables | | 3,750 |
| Total assets | | 2,490,635,708 |
| Liabilities | | |
| Payable for investments purchased | $29,259,638 | |
| Payable for fund shares redeemed | 3,840,438 | |
| Accrued management fee | 1,494,810 | |
| Distribution and service plan fees payable | 434,578 | |
| Payable for daily variation margin on futures contracts | 114,884 | |
| Total liabilities | | 35,144,348 |
| Net Assets | | $2,455,491,360 |
| Net Assets consist of: | | |
| Paid in capital | | $1,889,139,455 |
| Undistributed net investment income | | 6,850,855 |
| Accumulated undistributed net realized gain (loss) on investments | | 88,969,823 |
| Net unrealized appreciation (depreciation) on investments | | 470,531,227 |
| Net Assets | | $2,455,491,360 |
| Calculation of Maximum Offering Price | | |
| Class A: | | |
| Net Asset Value and redemption price per share ($1,075,820,898 ÷ 73,194,057 shares) | | $14.70 |
| Maximum offering price per share (100/94.25 of $14.70) | | $15.60 |
| Class M: | | |
| Net Asset Value and redemption price per share ($376,028,609 ÷ 25,845,641 shares) | | $14.55 |
| Maximum offering price per share (100/96.50 of $14.55) | | $15.08 |
| Class C: | | |
| Net Asset Value and offering price per share ($67,668,725 ÷ 4,744,306 shares)(a) | | $14.26 |
| Class I: | | |
| Net Asset Value, offering price and redemption price per share ($904,297,090 ÷ 61,012,992 shares) | | $14.82 |
| Class Z6: | | |
| Net Asset Value, offering price and redemption price per share ($31,676,038 ÷ 2,135,765 shares) | | $14.83 |
(a) Redemption price per share is equal to net asset value less any applicable contingent deferred sales charge.
See accompanying notes which are an integral part of the financial statements.
Statement of Operations
| | | Six months ended September 30, 2018 (Unaudited) |
| Investment Income | | |
| Dividends: | | |
| Affiliated issuers | | $19,282,508 |
| Interest | | 9,244 |
| Income from Fidelity Central Funds | | 19,904 |
| Total income | | 19,311,656 |
| Expenses | | |
| Management fee | $8,968,328 | |
| Distribution and service plan fees | 2,608,877 | |
| Independent trustees' fees and expenses | 5,915 | |
| Total expenses before reductions | 11,583,120 | |
| Expense reductions | (5) | |
| Total expenses after reductions | | 11,583,115 |
| Net investment income (loss) | | 7,728,541 |
| Realized and Unrealized Gain (Loss) | | |
| Net realized gain (loss) on: | | |
| Investment securities: | | |
| Fidelity Central Funds | (15) | |
| Other affiliated issuers | 42,674,711 | |
| Futures contracts | (1,049,722) | |
| Capital gain distributions from underlying funds: | | |
| Affiliated issuers | 52,018,677 | |
| Total net realized gain (loss) | | 93,643,651 |
| Change in net unrealized appreciation (depreciation) on: | | |
| Investment securities: | | |
| Unaffiliated issuers | (159) | |
| Affiliated issuers | 10,602,883 | |
| Futures contracts | 192,649 | |
| Total change in net unrealized appreciation (depreciation) | | 10,795,373 |
| Net gain (loss) | | 104,439,024 |
| Net increase (decrease) in net assets resulting from operations | | $112,167,565 |
See accompanying notes which are an integral part of the financial statements.
Statement of Changes in Net Assets
| | Six months ended September 30, 2018 (Unaudited) | Year ended March 31, 2018 |
| Increase (Decrease) in Net Assets | | |
| Operations | | |
| Net investment income (loss) | $7,728,541 | $19,282,132 |
| Net realized gain (loss) | 93,643,651 | 167,323,622 |
| Change in net unrealized appreciation (depreciation) | 10,795,373 | 99,438,855 |
| Net increase (decrease) in net assets resulting from operations | 112,167,565 | 286,044,609 |
| Distributions to shareholders from net investment income | – | (22,868,765) |
| Distributions to shareholders from net realized gain | (102,902,472) | (96,748,987) |
| Total distributions | (102,902,472) | (119,617,752) |
| Share transactions - net increase (decrease) | 49,777,837 | 25,065,653 |
| Total increase (decrease) in net assets | 59,042,930 | 191,492,510 |
| Net Assets | | |
| Beginning of period | 2,396,448,430 | 2,204,955,920 |
| End of period | $2,455,491,360 | $2,396,448,430 |
| Other Information | | |
| Undistributed net investment income end of period | $6,850,855 | $– |
| Distributions in excess of net investment income end of period | $– | $(877,686) |
See accompanying notes which are an integral part of the financial statements.
Financial Highlights
Fidelity Advisor Freedom 2035 Fund Class A
| | Six months ended (Unaudited) September 30, | Years endedMarch 31, | | | | |
| | 2018 | 2018 | 2017 | 2016 | 2015 | 2014 |
| Selected Per–Share Data | | | | | | |
| Net asset value, beginning of period | $14.65 | $13.61 | $12.37 | $13.51 | $13.54 | $12.74 |
| Income from Investment Operations | | | | | | |
| Net investment income (loss)A | .04 | .12 | .16 | .16 | .19 | .15 |
| Net realized and unrealized gain (loss) | .64 | 1.67 | 1.68 | (.66) | .71 | 1.59 |
| Total from investment operations | .68 | 1.79 | 1.84 | (.50) | .90 | 1.74 |
| Distributions from net investment income | – | (.14) | (.16) | (.17) | (.19) | (.15) |
| Distributions from net realized gain | (.63) | (.61) | (.44) | (.47) | (.73) | (.79) |
| Total distributions | (.63) | (.75) | (.60) | (.64) | (.93)B | (.94) |
| Net asset value, end of period | $14.70 | $14.65 | $13.61 | $12.37 | $13.51 | $13.54 |
| Total ReturnC,D,E | 4.72% | 13.26% | 15.51% | (3.92)% | 6.81% | 14.15% |
| Ratios to Average Net AssetsF,G | | | | | | |
| Expenses before reductions | .99%H | .87% | .25% | .25% | .25% | .25% |
| Expenses net of fee waivers, if any | .99%H | .87% | .25% | .25% | .25% | .25% |
| Expenses net of all reductions | .99%H | .87% | .25% | .25% | .25% | .25% |
| Net investment income (loss) | .59%H | .80% | 1.22% | 1.28% | 1.36% | 1.13% |
| Supplemental Data | | | | | | |
| Net assets, end of period (000 omitted) | $1,075,821 | $1,082,982 | $1,117,175 | $1,094,459 | $1,313,452 | $1,348,500 |
| Portfolio turnover rateG | 28%H | 23% | 18% | 22% | 25% | 48% |
A Calculated based on average shares outstanding during the period.
B Total distributions of $.93 per share is comprised of distributions from net investment income of $.194 and distributions from net realized gain of $.733 per share.
C Total returns for periods of less than one year are not annualized.
D Total returns would have been lower if certain expenses had not been reduced during the applicable periods shown.
E Total returns do not include the effect of the sales charges.
F Expense ratios reflect operating expenses of the class. Expenses before reductions do not reflect amounts reimbursed by the investment adviser or reductions from expense offset arrangements and do not represent the amount paid by the class during periods when reimbursements or reductions occur. Expenses net of fee waivers reflect expenses after reimbursement by the investment adviser but prior to reductions from expense offset arrangements. Expenses net of all reductions represent the net expenses paid by the class but do not include expenses of the underlying funds in which the Fund invests.
G Amounts do not include the activity of the Underlying Funds.
H Annualized
See accompanying notes which are an integral part of the financial statements.
Fidelity Advisor Freedom 2035 Fund Class M
| | Six months ended (Unaudited) September 30, | Years endedMarch 31, | | | | |
| | 2018 | 2018 | 2017 | 2016 | 2015 | 2014 |
| Selected Per–Share Data | | | | | | |
| Net asset value, beginning of period | $14.53 | $13.51 | $12.29 | $13.42 | $13.46 | $12.68 |
| Income from Investment Operations | | | | | | |
| Net investment income (loss)A | .02 | .08 | .12 | .13 | .15 | .11 |
| Net realized and unrealized gain (loss) | .63 | 1.66 | 1.68 | (.65) | .71 | 1.58 |
| Total from investment operations | .65 | 1.74 | 1.80 | (.52) | .86 | 1.69 |
| Distributions from net investment income | – | (.12) | (.14) | (.14) | (.16) | (.12) |
| Distributions from net realized gain | (.63) | (.60) | (.44) | (.46) | (.73) | (.79) |
| Total distributions | (.63) | (.72) | (.58) | (.61)B | (.90)C | (.91) |
| Net asset value, end of period | $14.55 | $14.53 | $13.51 | $12.29 | $13.42 | $13.46 |
| Total ReturnD,E,F | 4.55% | 12.98% | 15.24% | (4.08)% | 6.52% | 13.81% |
| Ratios to Average Net AssetsG,H | | | | | | |
| Expenses before reductions | 1.24%I | 1.13% | .50% | .50% | .50% | .50% |
| Expenses net of fee waivers, if any | 1.24%I | 1.13% | .50% | .50% | .50% | .50% |
| Expenses net of all reductions | 1.24%I | 1.13% | .50% | .50% | .50% | .50% |
| Net investment income (loss) | .34%I | .55% | .97% | 1.03% | 1.11% | .88% |
| Supplemental Data | | | | | | |
| Net assets, end of period (000 omitted) | $376,029 | $364,455 | $336,939 | $299,952 | $303,711 | $276,113 |
| Portfolio turnover rateH | 28%I | 23% | 18% | 22% | 25% | 48% |
A Calculated based on average shares outstanding during the period.
B Total distributions of $.61 per share is comprised of distributions from net investment income of $.143 and distributions from net realized gain of $.464 per share.
C Total distributions of $.90 per share is comprised of distributions from net investment income of $.162 and distributions from net realized gain of $.733 per share.
D Total returns for periods of less than one year are not annualized.
E Total returns would have been lower if certain expenses had not been reduced during the applicable periods shown.
F Total returns do not include the effect of the sales charges.
G Expense ratios reflect operating expenses of the class. Expenses before reductions do not reflect amounts reimbursed by the investment adviser or reductions from expense offset arrangements and do not represent the amount paid by the class during periods when reimbursements or reductions occur. Expenses net of fee waivers reflect expenses after reimbursement by the investment adviser but prior to reductions from expense offset arrangements. Expenses net of all reductions represent the net expenses paid by the class but do not include expenses of the underlying funds in which the Fund invests.
H Amounts do not include the activity of the Underlying Funds.
I Annualized
See accompanying notes which are an integral part of the financial statements.
Fidelity Advisor Freedom 2035 Fund Class C
| | Six months ended (Unaudited) September 30, | Years endedMarch 31, | | | | |
| | 2018 | 2018 | 2017 | 2016 | 2015 | 2014 |
| Selected Per–Share Data | | | | | | |
| Net asset value, beginning of period | $14.29 | $13.32 | $12.14 | $13.27 | $13.32 | $12.56 |
| Income from Investment Operations | | | | | | |
| Net investment income (loss)A | (.01) | .01 | .06 | .07 | .08 | .05 |
| Net realized and unrealized gain (loss) | .61 | 1.62 | 1.65 | (.65) | .70 | 1.56 |
| Total from investment operations | .60 | 1.63 | 1.71 | (.58) | .78 | 1.61 |
| Distributions from net investment income | – | (.07) | (.09) | (.10) | (.11) | (.07) |
| Distributions from net realized gain | (.63) | (.60) | (.44) | (.45) | (.72) | (.78) |
| Total distributions | (.63) | (.66)B | (.53) | (.55) | (.83) | (.85) |
| Net asset value, end of period | $14.26 | $14.29 | $13.32 | $12.14 | $13.27 | $13.32 |
| Total ReturnC,D,E | 4.27% | 12.40% | 14.69% | (4.58)% | 6.01% | 13.27% |
| Ratios to Average Net AssetsF,G | | | | | | |
| Expenses before reductions | 1.74%H | 1.63% | 1.00% | 1.00% | 1.00% | 1.00% |
| Expenses net of fee waivers, if any | 1.74%H | 1.63% | 1.00% | 1.00% | 1.00% | 1.00% |
| Expenses net of all reductions | 1.74%H | 1.63% | 1.00% | 1.00% | 1.00% | 1.00% |
| Net investment income (loss) | (.16)%H | .05% | .47% | .53% | .61% | .38% |
| Supplemental Data | | | | | | |
| Net assets, end of period (000 omitted) | $67,669 | $65,519 | $61,581 | $54,813 | $56,318 | $51,931 |
| Portfolio turnover rateG | 28%H | 23% | 18% | 22% | 25% | 48% |
A Calculated based on average shares outstanding during the period.
B Total distributions of $.66 per share is comprised of distributions from net investment income of $.066 and distributions from net realized gain of $.598 per share.
C Total returns for periods of less than one year are not annualized.
D Total returns would have been lower if certain expenses had not been reduced during the applicable periods shown.
E Total returns do not include the effect of the contingent deferred sales charge.
F Expense ratios reflect operating expenses of the class. Expenses before reductions do not reflect amounts reimbursed by the investment adviser or reductions from expense offset arrangements and do not represent the amount paid by the class during periods when reimbursements or reductions occur. Expenses net of fee waivers reflect expenses after reimbursement by the investment adviser but prior to reductions from expense offset arrangements. Expenses net of all reductions represent the net expenses paid by the class but do not include expenses of the underlying funds in which the Fund invests.
G Amounts do not include the activity of the Underlying Funds.
H Annualized
See accompanying notes which are an integral part of the financial statements.
Fidelity Advisor Freedom 2035 Fund Class I
| | Six months ended (Unaudited) September 30, | Years endedMarch 31, | | | | |
| | 2018 | 2018 | 2017 | 2016 | 2015 | 2014 |
| Selected Per–Share Data | | | | | | |
| Net asset value, beginning of period | $14.75 | $13.71 | $12.45 | $13.59 | $13.61 | $12.80 |
| Income from Investment Operations | | | | | | |
| Net investment income (loss)A | .06 | .15 | .19 | .20 | .22 | .18 |
| Net realized and unrealized gain (loss) | .64 | 1.68 | 1.70 | (.67) | .72 | 1.60 |
| Total from investment operations | .70 | 1.83 | 1.89 | (.47) | .94 | 1.78 |
| Distributions from net investment income | – | (.17) | (.19) | (.20) | (.23) | (.18) |
| Distributions from net realized gain | (.63) | (.62) | (.44) | (.47) | (.73) | (.79) |
| Total distributions | (.63) | (.79) | (.63) | (.67) | (.96) | (.97) |
| Net asset value, end of period | $14.82 | $14.75 | $13.71 | $12.45 | $13.59 | $13.61 |
| Total ReturnB,C | 4.83% | 13.50% | 15.79% | (3.63)% | 7.11% | 14.44% |
| Ratios to Average Net AssetsD,E | | | | | | |
| Expenses before reductions | .74%F | .64% | - %G | - %G | - %G | - %G |
| Expenses net of fee waivers, if any | .74%F | .64% | -% | -% | -% | -% |
| Expenses net of all reductions | .74%F | .64% | -% | -% | -% | -% |
| Net investment income (loss) | .84%F | 1.04% | 1.47% | 1.53% | 1.61% | 1.38% |
| Supplemental Data | | | | | | |
| Net assets, end of period (000 omitted) | $904,297 | $867,707 | $689,261 | $684,976 | $710,667 | $695,092 |
| Portfolio turnover rateE | 28%F | 23% | 18% | 22% | 25% | 48% |
A Calculated based on average shares outstanding during the period.
B Total returns for periods of less than one year are not annualized.
C Total returns would have been lower if certain expenses had not been reduced during the applicable periods shown.
D Expense ratios reflect operating expenses of the class. Expenses before reductions do not reflect amounts reimbursed by the investment adviser or reductions from expense offset arrangements and do not represent the amount paid by the class during periods when reimbursements or reductions occur. Expenses net of fee waivers reflect expenses after reimbursement by the investment adviser but prior to reductions from expense offset arrangements. Expenses net of all reductions represent the net expenses paid by the class but do not include expenses of the underlying funds in which the Fund invests.
E Amounts do not include the activity of the Underlying Funds.
F Annualized
G Amount represents less than .005%.
See accompanying notes which are an integral part of the financial statements.
Fidelity Advisor Freedom 2035 Fund Class Z6
| | Six months ended (Unaudited) September 30, | Years endedMarch 31, |
| | 2018 | 2018 A |
| Selected Per–Share Data | | |
| Net asset value, beginning of period | $14.75 | $14.07 |
| Income from Investment Operations | | |
| Net investment income (loss)B | .08 | .12 |
| Net realized and unrealized gain (loss) | .63 | 1.15 |
| Total from investment operations | .71 | 1.27 |
| Distributions from net investment income | – | (.22) |
| Distributions from net realized gain | (.63) | (.38) |
| Total distributions | (.63) | (.59)C |
| Net asset value, end of period | $14.83 | $14.75 |
| Total ReturnD,E | 4.90% | 9.03% |
| Ratios to Average Net AssetsF,G | | |
| Expenses before reductions | .49%H | .51%H,I |
| Expenses net of fee waivers, if any | .49%H | .51%H,I |
| Expenses net of all reductions | .49%H | .51%H,I |
| Net investment income (loss) | 1.09%H | .97%H |
| Supplemental Data | | |
| Net assets, end of period (000 omitted) | $31,676 | $15,784 |
| Portfolio turnover rateG | 28%H | 23% |
A For the period June 6, 2017 (commencement of sale of shares) to March 31, 2018.
B Calculated based on average shares outstanding during the period.
C Total distributions of $.59 per share is comprised of distributions from net investment income of $.216 and distributions from net realized gain of $.378 per share.
D Total returns for periods of less than one year are not annualized.
E Total returns would have been lower if certain expenses had not been reduced during the applicable periods shown.
F Expense ratios reflect operating expenses of the class. Expenses before reductions do not reflect amounts reimbursed by the investment adviser or reductions from expense offset arrangements and do not represent the amount paid by the class during periods when reimbursements or reductions occur. Expenses net of fee waivers reflect expenses after reimbursement by the investment adviser but prior to reductions from expense offset arrangements. Expenses net of all reductions represent the net expenses paid by the class but do not include expenses of the underlying funds in which the Fund invests.
G Amounts do not include the activity of the Underlying Funds.
H Annualized
I On certain classes, the size and fluctuation of net assets and expense amounts may cause ratios to differ from contractual rates.
See accompanying notes which are an integral part of the financial statements.
Fidelity Advisor Freedom® 2040 Fund
Investment Summary (Unaudited)
The information in the following tables is based on the direct investments of the Fund.
Top Holdings as of September 30, 2018
| | % of fund's net assets |
| Fidelity Series Large Cap Stock Fund | 12.3 |
| Fidelity Series International Growth Fund | 9.3 |
| Fidelity Series International Value Fund | 9.2 |
| Fidelity Series Emerging Markets Opportunities Fund | 8.6 |
| Fidelity Series Stock Selector Large Cap Value Fund | 7.8 |
| Fidelity Series Value Discovery Fund | 7.7 |
| Fidelity Advisor Series Equity Growth Fund | 7.1 |
| Fidelity Series Opportunistic Insights Fund | 6.6 |
| Fidelity Advisor Series Growth Opportunities Fund | 4.7 |
| Fidelity Series Small Cap Opportunities Fund | 4.2 |
| | 77.5 |
Asset Allocation (% of fund's net assets)
| Period end |
| | Domestic Equity Funds | 60.5% |
| | International Equity Funds | 30.8% |
| | Bond Funds | 6.8% |
| | Short-Term Funds | 1.9% |
| | Short-Term Investments | 0.1% |
| | Net Other Assets (Liabilities)* | (0.1)% |

* Net Other Assets (Liabilities) are not included in the pie chart
Domestic Equity Funds category includes Fidelity Series Commodity Strategy Fund which invests in commodity-related investments.
Fidelity Advisor Freedom® 2040 Fund
Schedule of Investments September 30, 2018 (Unaudited)
Showing Percentage of Net Assets
| U.S. Treasury Obligations - 0.1% | | | |
| | | Principal Amount | Value |
| U.S. Treasury Bills, yield at date of purchase 2.07% to 2.09% 11/23/18 to 11/29/18 (a) | | | |
| (Cost $1,425,202) | | 1,430,000 | 1,425,094 |
| | | Shares | Value |
|
| Domestic Equity Funds - 60.5% | | | |
| Fidelity Advisor Series Equity Growth Fund (b) | | 10,255,360 | $158,547,859 |
| Fidelity Advisor Series Growth Opportunities Fund (b) | | 6,417,737 | 106,791,139 |
| Fidelity Advisor Series Small Cap Fund (b) | | 5,778,599 | 72,636,990 |
| Fidelity Series All-Sector Equity Fund (b) | | 5,810,391 | 79,079,422 |
| Fidelity Series Commodity Strategy Fund (b) | | 9,441,930 | 47,209,648 |
| Fidelity Series Large Cap Stock Fund (b) | | 17,296,748 | 275,537,193 |
| Fidelity Series Large Cap Value Index Fund (b) | | 2,156,107 | 28,460,607 |
| Fidelity Series Opportunistic Insights Fund (b) | | 7,424,358 | 147,373,500 |
| Fidelity Series Small Cap Opportunities Fund (b) | | 6,370,737 | 93,586,120 |
| Fidelity Series Stock Selector Large Cap Value Fund (b) | | 13,326,200 | 176,172,364 |
| Fidelity Series Value Discovery Fund (b) | | 12,674,091 | 173,508,307 |
| TOTAL DOMESTIC EQUITY FUNDS | | | |
| (Cost $1,056,601,209) | | | 1,358,903,149 |
|
| International Equity Funds - 30.8% | | | |
| Fidelity Series Canada Fund (b) | | 1,863,449 | 20,143,879 |
| Fidelity Series Emerging Markets Fund (b) | | 1,428,867 | 13,845,725 |
| Fidelity Series Emerging Markets Opportunities Fund (b) | | 10,068,549 | 193,215,450 |
| Fidelity Series International Growth Fund (b) | | 12,694,933 | 208,196,902 |
| Fidelity Series International Small Cap Fund (b) | | 2,737,719 | 49,005,173 |
| Fidelity Series International Value Fund (b) | | 19,664,231 | 206,867,714 |
| TOTAL INTERNATIONAL EQUITY FUNDS | | | |
| (Cost $544,755,307) | | | 691,274,843 |
|
| Bond Funds - 6.8% | | | |
| Fidelity Series Emerging Markets Debt Fund (b) | | 1,450,466 | 13,822,938 |
| Fidelity Series Floating Rate High Income Fund (b) | | 505,287 | 4,810,336 |
| Fidelity Series High Income Fund (b) | | 3,045,509 | 29,267,344 |
| Fidelity Series Inflation-Protected Bond Index Fund (b) | | 697,996 | 6,777,538 |
| Fidelity Series International Credit Fund (b) | | 108,372 | 1,065,296 |
| Fidelity Series Investment Grade Bond Fund (b) | | 916,047 | 9,975,750 |
| Fidelity Series Long-Term Treasury Bond Index Fund (b) | | 9,483,964 | 78,147,860 |
| Fidelity Series Real Estate Income Fund (b) | | 901,559 | 9,718,804 |
| TOTAL BOND FUNDS | | | |
| (Cost $158,083,976) | | | 153,585,866 |
|
| Short-Term Funds - 1.9% | | | |
| Fidelity Cash Central Fund, 2.11% (c) | | 5,084,769 | 5,085,786 |
| Fidelity Series Government Money Market Fund 2.12% (b)(d) | | 31,273,503 | 31,273,503 |
| Fidelity Series Short-Term Credit Fund (b) | | 686,097 | 6,764,917 |
| TOTAL SHORT-TERM FUNDS | | | |
| (Cost $43,182,727) | | | 43,124,206 |
| TOTAL INVESTMENT IN SECURITIES - 100.1% | | | |
| (Cost $1,804,048,421) | | | 2,248,313,158 |
| NET OTHER ASSETS (LIABILITIES) - (0.1)% | | | (1,868,108) |
| NET ASSETS - 100% | | | $2,246,445,050 |
| Futures Contracts | | | | | |
| | Number of contracts | Expiration Date | Notional Amount | Value | Unrealized Appreciation/(Depreciation) |
| Purchased | | | | | |
| Equity Index Contracts | | | | | |
| CME E-mini S&P 500 Index Contracts (United States) | 88 | Dec. 2018 | $12,843,600 | $2,491 | $2,491 |
| ICE E-mini MSCI Emerging Markets Index Contracts (United States) | 108 | Dec. 2018 | 5,668,380 | 114,414 | 114,414 |
| | | | | | 116,905 |
| Sold | | | | | |
| Equity Index Contracts | | | | | |
| ICE E-mini MSCI EAFE Index Contracts (United States) | 52 | Dec. 2018 | 5,136,300 | (11,896) | (11,896) |
| TOTAL FUTURES CONTRACTS | | | | | $105,009 |
The notional amount of futures purchased as a percentage of Net Assets is 0.8%
The notional amount of futures sold as a percentage of Net Assets is 0.2%
Legend
(a) Security or a portion of the security was pledged to cover margin requirements for futures contracts. At period end, the value of securities pledged amounted to $577,002.
(b) Affiliated Fund
(c) Affiliated fund that is generally available only to investment companies and other accounts managed by Fidelity Investments. The rate quoted is the annualized seven-day yield of the fund at period end. A complete unaudited listing of the fund's holdings as of its most recent quarter end is available upon request. In addition, each Fidelity Central Fund's financial statements are available on the SEC's website or upon request.
(d) The rate quoted is the annualized seven-day yield of the fund at period end.
Affiliated Central Funds
Information regarding fiscal year to date income earned by the Fund from investments in Fidelity Central Funds is as follows:
| Fund | Income earned |
| Fidelity Cash Central Fund | $13,272 |
| Total | $13,272 |
Amounts in the income column in the above table include any capital gain distributions from underlying funds, which are presented in the corresponding line-item in the Statement of Operations if applicable.
Affiliated Underlying Funds
Fiscal year to date information regarding the Fund's investments in affiliated Underlying Funds, excluding any Money Market Central Funds, is presented below. Exchanges between classes of the same affiliated Underlying Funds may occur.
| Affiliate | Value, beginning of period | Purchases | Sales Proceeds | Dividend Income | Realized Gain (loss) | Change in Unrealized appreciation (depreciation) | Value, end of period |
| Fidelity Advisor Series Equity Growth Fund | $140,682,362 | $4,356,454 | $6,697,608 | $ - | $295,809 | $19,910,842 | $158,547,859 |
| Fidelity Advisor Series Equity Value Fund | 162,239,363 | 14,846,287 | 7,538,784 | 5,595,859 | (57,730) | (23,785,932) | - |
| Fidelity Advisor Series Growth & Income Fund | 248,668,633 | 33,284,770 | 11,706,553 | 22,620,219 | 188,101 | (38,338,164) | - |
| Fidelity Advisor Series Growth Opportunities Fund | 92,316,051 | 2,429,246 | 11,738,103 | - | 1,746,136 | 22,037,809 | 106,791,139 |
| Fidelity Advisor Series Opportunistic Insights Fund | 130,719,494 | 15,285,834 | 6,147,582 | 10,739,473 | 234,454 | (50,881,217) | - |
| Fidelity Advisor Series Small Cap Fund | 70,269,615 | 1,804,278 | 3,455,371 | - | 41,440 | 3,977,028 | 72,636,990 |
| Fidelity Advisor Series Stock Selector Large Cap Value Fund | 163,792,386 | 23,058,659 | 7,605,464 | 14,178,371 | (65,106) | (23,665,293) | - |
| Fidelity Series 100 Index Fund | 69,719,202 | - | 75,057,597 | - | 30,843,158 | (25,504,763) | - |
| Fidelity Series All-Sector Equity Fund | 96,485,101 | 2,422,458 | 30,804,417 | - | 2,529,546 | 8,446,734 | 79,079,422 |
| Fidelity Series Canada Fund | 19,115,913 | 755,952 | 911,015 | - | 6,578 | 1,176,451 | 20,143,879 |
| Fidelity Series Commodity Strategy Fund | 45,218,312 | 7,964,420 | 2,129,699 | 2,823,231 | (186,366) | (3,657,019) | 47,209,648 |
| Fidelity Series Emerging Markets Debt Fund | 14,499,809 | 743,482 | 627,621 | 423,785 | (20,626) | (772,106) | 13,822,938 |
| Fidelity Series Emerging Markets Fund | - | 13,861,376 | - | - | - | (15,651) | 13,845,725 |
| Fidelity Series Emerging Markets Opportunities Fund | 198,131,267 | 39,862,316 | 19,702,113 | - | 452,540 | (25,528,560) | 193,215,450 |
| Fidelity Series Floating Rate High Income Fund | 4,805,312 | 261,478 | 261,447 | 128,329 | (791) | 5,784 | 4,810,336 |
| Fidelity Series Government Money Market Fund 2.12% | 35,343,924 | 28,913,154 | 32,983,575 | 284,356 | - | - | 31,273,503 |
| Fidelity Series High Income Fund | 30,392,696 | 1,553,520 | 2,922,355 | 860,993 | (82,215) | 325,698 | 29,267,344 |
| Fidelity Series Inflation-Protected Bond Index Fund | 17,270,143 | 2,322,726 | 12,895,773 | 25,607 | (133,235) | 213,677 | 6,777,538 |
| Fidelity Series International Credit Fund | 1,062,890 | 13,099 | - | 13,099 | - | (10,693) | 1,065,296 |
| Fidelity Series International Growth Fund | 192,586,304 | 21,667,959 | 9,082,300 | - | 115,189 | 2,909,750 | 208,196,902 |
| Fidelity Series International Small Cap Fund | 48,053,368 | 5,099,574 | 2,269,882 | - | (1,384) | (1,876,503) | 49,005,173 |
| Fidelity Series International Value Fund | 194,847,297 | 21,438,373 | 8,969,172 | - | (86,198) | (362,586) | 206,867,714 |
| Fidelity Series Investment Grade Bond Fund | 10,253,916 | 938,885 | 1,098,114 | 141,265 | (14,125) | (104,812) | 9,975,750 |
| Fidelity Series Large Cap Stock Fund | - | 194,788 | 185,220 | - | (221) | 43,431,059 | 275,537,193 |
| Fidelity Series Large Cap Value Index Fund | 27,203,330 | 706,505 | 1,354,271 | - | 2,944 | 1,902,099 | 28,460,607 |
| Fidelity Series Long-Term Treasury Bond Index Fund | 48,736,296 | 50,742,939 | 18,752,565 | 990,434 | (572,638) | (2,006,172) | 78,147,860 |
| Fidelity Series Opportunistic Insights Fund | - | 107,165 | 99,177 | - | (2,279) | 58,156,808 | 147,373,500 |
| Fidelity Series Real Estate Equity Fund | 16,888,409 | 140,814 | 17,708,456 | 89,155 | 1,454,060 | (774,827) | - |
| Fidelity Series Real Estate Income Fund | 9,492,141 | 660,157 | 491,615 | 409,722 | (2,482) | 60,603 | 9,718,804 |
| Fidelity Series Short-Term Credit Fund | 6,224,937 | 906,283 | 366,460 | 70,991 | (1,183) | 1,340 | 6,764,917 |
| Fidelity Series Small Cap Opportunities Fund | 85,799,818 | 9,450,271 | 4,263,385 | 7,222,923 | 194,810 | 2,404,606 | 93,586,120 |
| Fidelity Series Stock Selector Large Cap Value Fund | - | 268,916 | 128,166 | - | (5,293) | 20,521,725 | 176,172,364 |
| Fidelity Series Value Discovery Fund | - | 125,518 | 118,954 | - | (1,491) | 27,800,030 | 173,508,307 |
| | $2,180,818,289 | $306,187,656 | $298,072,814 | $66,617,812 | $36,871,402 | $15,997,745 | $2,241,802,278 |
Amounts in the income column in the above table include any capital gain distributions from underlying funds, which are presented in the corresponding line-item in the Statement of Operations if applicable.
Investment Valuation
The following is a summary of the inputs used, as of September 30, 2018, involving the Fund's assets and liabilities carried at fair value. The inputs or methodology used for valuing securities may not be an indication of the risk associated with investing in those securities. For more information on valuation inputs, and their aggregation into the levels used below, please refer to the Investment Valuation section in the accompanying Notes to Financial Statements.
| | Valuation Inputs at Reporting Date: |
| Description | Total | Level 1 | Level 2 | Level 3 |
| Investments in Securities: | | | | |
| Other Short-Term Investments | $1,425,094 | $-- | $1,425,094 | $-- |
| Domestic Equity Funds | 1,358,903,149 | 1,358,903,149 | -- | -- |
| International Equity Funds | 691,274,843 | 691,274,843 | -- | -- |
| Bond Funds | 153,585,866 | 153,585,866 | -- | -- |
| Short-Term Funds | 43,124,206 | 43,124,206 | -- | -- |
| Total Investments in Securities: | $2,248,313,158 | $2,246,888,064 | $1,425,094 | $-- |
| Derivative Instruments: | | | | |
| Assets | | | | |
| Futures Contracts | $116,905 | $116,905 | $-- | $-- |
| Total Assets | $116,905 | $116,905 | $-- | $-- |
| Liabilities | | | | |
| Futures Contracts | $(11,896) | $(11,896) | $-- | $-- |
| Total Liabilities | $(11,896) | $(11,896) | $-- | $-- |
| Total Derivative Instruments: | $105,009 | $105,009 | $-- | $-- |
Value of Derivative Instruments
The following table is a summary of the Fund's value of derivative instruments by primary risk exposure as of September 30, 2018. For additional information on derivative instruments, please refer to the Derivative Instruments section in the accompanying Notes to Financial Statements.
| Primary Risk Exposure / Derivative Type | Value |
| | Asset | Liability |
| Equity Risk | | |
| Futures Contracts(a) | $116,905 | $(11,896) |
| Total Equity Risk | 116,905 | (11,896) |
| Total Value of Derivatives | $116,905 | $(11,896) |
(a) Reflects gross cumulative appreciation (depreciation) on futures contracts as presented in the Schedule of Investments. In the Statement of Assets and Liabilities, the period end daily variation margin is included in receivable or payable for daily variation margin on futures contracts, and the net cumulative appreciation (depreciation) is included in net unrealized appreciation (depreciation).
See accompanying notes which are an integral part of the financial statements.
Fidelity Advisor Freedom® 2040 Fund
Financial Statements
Statement of Assets and Liabilities
| | | September 30, 2018 (Unaudited) |
| Assets | | |
Investment in securities, at value — See accompanying schedule:
Unaffiliated issuers (cost $1,425,202) | $1,425,094 | |
| Fidelity Central Funds (cost $5,085,786) | 5,085,786 | |
| Other affiliated issuers (cost $1,797,537,433) | 2,241,802,278 | |
| Total Investment in Securities (cost $1,804,048,421) | | $2,248,313,158 |
| Cash | | 153 |
| Receivable for investments sold | | 25,835,086 |
| Receivable for fund shares sold | | 2,367,688 |
| Distributions receivable from Fidelity Central Funds | | 7,655 |
| Total assets | | 2,276,523,740 |
| Liabilities | | |
| Payable for investments purchased | $26,202,171 | |
| Payable for fund shares redeemed | 1,993,369 | |
| Accrued management fee | 1,381,737 | |
| Distribution and service plan fees payable | 414,846 | |
| Payable for daily variation margin on futures contracts | 86,567 | |
| Total liabilities | | 30,078,690 |
| Net Assets | | $2,246,445,050 |
| Net Assets consist of: | | |
| Paid in capital | | $1,716,426,747 |
| Undistributed net investment income | | 4,700,386 |
| Accumulated undistributed net realized gain (loss) on investments | | 80,948,171 |
| Net unrealized appreciation (depreciation) on investments | | 444,369,746 |
| Net Assets | | $2,246,445,050 |
| Calculation of Maximum Offering Price | | |
| Class A: | | |
| Net Asset Value and redemption price per share ($942,738,091 ÷ 59,758,448 shares) | | $15.78 |
| Maximum offering price per share (100/94.25 of $15.78) | | $16.74 |
| Class M: | | |
| Net Asset Value and redemption price per share ($357,953,503 ÷ 22,820,756 shares) | | $15.69 |
| Maximum offering price per share (100/96.50 of $15.69) | | $16.26 |
| Class C: | | |
| Net Asset Value and offering price per share ($85,766,642 ÷ 5,591,783 shares)(a) | | $15.34 |
| Class I: | | |
| Net Asset Value, offering price and redemption price per share ($829,235,065 ÷ 52,176,043 shares) | | $15.89 |
| Class Z6: | | |
| Net Asset Value, offering price and redemption price per share ($30,751,749 ÷ 1,934,716 shares) | | $15.89 |
(a) Redemption price per share is equal to net asset value less any applicable contingent deferred sales charge.
See accompanying notes which are an integral part of the financial statements.
Statement of Operations
| | | Six months ended September 30, 2018 (Unaudited) |
| Investment Income | | |
| Dividends: | | |
| Affiliated issuers | | $17,201,976 |
| Interest | | 9,470 |
| Income from Fidelity Central Funds | | 13,272 |
| Total income | | 17,224,718 |
| Expenses | | |
| Management fee | $8,259,097 | |
| Distribution and service plan fees | 2,483,934 | |
| Independent trustees' fees and expenses | 5,379 | |
| Total expenses before reductions | 10,748,410 | |
| Expense reductions | (1) | |
| Total expenses after reductions | | 10,748,409 |
| Net investment income (loss) | | 6,476,309 |
| Realized and Unrealized Gain (Loss) | | |
| Net realized gain (loss) on: | | |
| Investment securities: | | |
| Fidelity Central Funds | (4) | |
| Other affiliated issuers | 36,871,402 | |
| Futures contracts | (875,983) | |
| Capital gain distributions from underlying funds: | | |
| Affiliated issuers | 49,415,836 | |
| Total net realized gain (loss) | | 85,411,251 |
| Change in net unrealized appreciation (depreciation) on: | | |
| Investment securities: | | |
| Unaffiliated issuers | (108) | |
| Affiliated issuers | 15,997,745 | |
| Futures contracts | 105,009 | |
| Total change in net unrealized appreciation (depreciation) | | 16,102,646 |
| Net gain (loss) | | 101,513,897 |
| Net increase (decrease) in net assets resulting from operations | | $107,990,206 |
See accompanying notes which are an integral part of the financial statements.
Statement of Changes in Net Assets
| | Six months ended September 30, 2018 (Unaudited) | Year ended March 31, 2018 |
| Increase (Decrease) in Net Assets | | |
| Operations | | |
| Net investment income (loss) | $6,476,309 | $16,946,945 |
| Net realized gain (loss) | 85,411,251 | 154,265,342 |
| Change in net unrealized appreciation (depreciation) | 16,102,646 | 91,725,502 |
| Net increase (decrease) in net assets resulting from operations | 107,990,206 | 262,937,789 |
| Distributions to shareholders from net investment income | – | (20,779,436) |
| Distributions to shareholders from net realized gain | (93,540,540) | (90,229,747) |
| Total distributions | (93,540,540) | (111,009,183) |
| Share transactions - net increase (decrease) | 52,968,089 | 7,294,311 |
| Total increase (decrease) in net assets | 67,417,755 | 159,222,917 |
| Net Assets | | |
| Beginning of period | 2,179,027,295 | 2,019,804,378 |
| End of period | $2,246,445,050 | $2,179,027,295 |
| Other Information | | |
| Undistributed net investment income end of period | $4,700,386 | $– |
| Distributions in excess of net investment income end of period | $– | $(1,775,923) |
See accompanying notes which are an integral part of the financial statements.
Financial Highlights
Fidelity Advisor Freedom 2040 Fund Class A
| | Six months ended (Unaudited) September 30, | Years endedMarch 31, | | | | |
| | 2018 | 2018 | 2017 | 2016 | 2015 | 2014 |
| Selected Per–Share Data | | | | | | |
| Net asset value, beginning of period | $15.69 | $14.57 | $13.25 | $14.49 | $14.51 | $13.61 |
| Income from Investment Operations | | | | | | |
| Net investment income (loss)A | .04 | .12 | .17 | .17 | .20 | .15 |
| Net realized and unrealized gain (loss) | .72 | 1.81 | 1.80 | (.69) | .76 | 1.74 |
| Total from investment operations | .76 | 1.93 | 1.97 | (.52) | .96 | 1.89 |
| Distributions from net investment income | – | (.15) | (.17) | (.18) | (.21) | (.16) |
| Distributions from net realized gain | (.67) | (.66) | (.48) | (.54) | (.77) | (.83) |
| Total distributions | (.67) | (.81) | (.65) | (.72) | (.98) | (.99) |
| Net asset value, end of period | $15.78 | $15.69 | $14.57 | $13.25 | $14.49 | $14.51 |
| Total ReturnB,C,D | 4.97% | 13.42% | 15.53% | (3.82)% | 6.76% | 14.37% |
| Ratios to Average Net AssetsE,F | | | | | | |
| Expenses before reductions | 1.00%G | .87% | .25% | .25% | .25% | .25% |
| Expenses net of fee waivers, if any | 1.00%G | .87% | .25% | .25% | .25% | .25% |
| Expenses net of all reductions | 1.00%G | .87% | .25% | .25% | .25% | .25% |
| Net investment income (loss) | .55%G | .78% | 1.22% | 1.27% | 1.35% | 1.10% |
| Supplemental Data | | | | | | |
| Net assets, end of period (000 omitted) | $942,738 | $948,970 | $965,401 | $950,816 | $1,154,277 | $1,195,641 |
| Portfolio turnover rateE | 27%G | 23% | 18% | 21% | 24% | 47% |
A Calculated based on average shares outstanding during the period.
B Total returns for periods of less than one year are not annualized.
C Total returns would have been lower if certain expenses had not been reduced during the applicable periods shown.
D Total returns do not include the effect of the sales charges.
E Amounts do not include the activity of the Underlying Funds.
F Expense ratios reflect operating expenses of the class. Expenses before reductions do not reflect amounts reimbursed by the investment adviser or reductions from expense offset arrangements and do not represent the amount paid by the class during periods when reimbursements or reductions occur. Expenses net of fee waivers reflect expenses after reimbursement by the investment adviser but prior to reductions from expense offset arrangements. Expenses net of all reductions represent the net expenses paid by the class but do not include expenses of the underlying funds in which the Fund invests.
G Annualized
See accompanying notes which are an integral part of the financial statements.
Fidelity Advisor Freedom 2040 Fund Class M
| | Six months ended (Unaudited) September 30, | Years endedMarch 31, | | | | |
| | 2018 | 2018 | 2017 | 2016 | 2015 | 2014 |
| Selected Per–Share Data | | | | | | |
| Net asset value, beginning of period | $15.62 | $14.52 | $13.21 | $14.45 | $14.47 | $13.58 |
| Income from Investment Operations | | | | | | |
| Net investment income (loss)A | .02 | .08 | .13 | .14 | .16 | .12 |
| Net realized and unrealized gain (loss) | .72 | 1.80 | 1.81 | (.70) | .76 | 1.73 |
| Total from investment operations | .74 | 1.88 | 1.94 | (.56) | .92 | 1.85 |
| Distributions from net investment income | – | (.12) | (.15) | (.15) | (.17) | (.13) |
| Distributions from net realized gain | (.67) | (.66) | (.48) | (.53) | (.77) | (.83) |
| Total distributions | (.67) | (.78) | (.63) | (.68) | (.94) | (.96) |
| Net asset value, end of period | $15.69 | $15.62 | $14.52 | $13.21 | $14.45 | $14.47 |
| Total ReturnB,C,D | 4.86% | 13.11% | 15.26% | (4.07)% | 6.51% | 14.06% |
| Ratios to Average Net AssetsE,F | | | | | | |
| Expenses before reductions | 1.25%G | 1.13% | .50% | .50% | .50% | .50% |
| Expenses net of fee waivers, if any | 1.25%G | 1.13% | .50% | .50% | .50% | .50% |
| Expenses net of all reductions | 1.25%G | 1.13% | .50% | .50% | .50% | .50% |
| Net investment income (loss) | .30%G | .53% | .97% | 1.02% | 1.10% | .85% |
| Supplemental Data | | | | | | |
| Net assets, end of period (000 omitted) | $357,954 | $343,164 | $324,990 | $310,107 | $333,069 | $341,608 |
| Portfolio turnover rateE | 27%G | 23% | 18% | 21% | 24% | 47% |
A Calculated based on average shares outstanding during the period.
B Total returns for periods of less than one year are not annualized.
C Total returns would have been lower if certain expenses had not been reduced during the applicable periods shown.
D Total returns do not include the effect of the sales charges.
E Amounts do not include the activity of the Underlying Funds.
F Expense ratios reflect operating expenses of the class. Expenses before reductions do not reflect amounts reimbursed by the investment adviser or reductions from expense offset arrangements and do not represent the amount paid by the class during periods when reimbursements or reductions occur. Expenses net of fee waivers reflect expenses after reimbursement by the investment adviser but prior to reductions from expense offset arrangements. Expenses net of all reductions represent the net expenses paid by the class but do not include expenses of the underlying funds in which the Fund invests.
G Annualized
See accompanying notes which are an integral part of the financial statements.
Fidelity Advisor Freedom 2040 Fund Class C
| | Six months ended (Unaudited) September 30, | Years endedMarch 31, | | | | |
| | 2018 | 2018 | 2017 | 2016 | 2015 | 2014 |
| Selected Per–Share Data | | | | | | |
| Net asset value, beginning of period | $15.32 | $14.28 | $13.02 | $14.27 | $14.30 | $13.43 |
| Income from Investment Operations | | | | | | |
| Net investment income (loss)A | (.01) | –B | .06 | .07 | .09 | .05 |
| Net realized and unrealized gain (loss) | .70 | 1.77 | 1.78 | (.70) | .75 | 1.71 |
| Total from investment operations | .69 | 1.77 | 1.84 | (.63) | .84 | 1.76 |
| Distributions from net investment income | – | (.07) | (.10) | (.10) | (.12) | (.07) |
| Distributions from net realized gain | (.67) | (.66) | (.48) | (.52) | (.75) | (.82) |
| Total distributions | (.67) | (.73) | (.58) | (.62) | (.87) | (.89) |
| Net asset value, end of period | $15.34 | $15.32 | $14.28 | $13.02 | $14.27 | $14.30 |
| Total ReturnC,D,E | 4.62% | 12.52% | 14.70% | (4.63)% | 6.01% | 13.57% |
| Ratios to Average Net AssetsF,G | | | | | | |
| Expenses before reductions | 1.75%H | 1.63% | 1.00% | 1.00% | 1.00% | 1.00% |
| Expenses net of fee waivers, if any | 1.75%H | 1.63% | 1.00% | 1.00% | 1.00% | 1.00% |
| Expenses net of all reductions | 1.75%H | 1.63% | 1.00% | 1.00% | 1.00% | 1.00% |
| Net investment income (loss) | (.20)%H | .03% | .48% | .52% | .60% | .35% |
| Supplemental Data | | | | | | |
| Net assets, end of period (000 omitted) | $85,767 | $84,365 | $79,480 | $73,036 | $77,130 | $72,247 |
| Portfolio turnover rateF | 27%H | 23% | 18% | 21% | 24% | 47% |
A Calculated based on average shares outstanding during the period.
B Amount represents less than $.005 per share.
C Total returns for periods of less than one year are not annualized.
D Total returns would have been lower if certain expenses had not been reduced during the applicable periods shown.
E Total returns do not include the effect of the contingent deferred sales charge.
F Amounts do not include the activity of the Underlying Funds.
G Expense ratios reflect operating expenses of the class. Expenses before reductions do not reflect amounts reimbursed by the investment adviser or reductions from expense offset arrangements and do not represent the amount paid by the class during periods when reimbursements or reductions occur. Expenses net of fee waivers reflect expenses after reimbursement by the investment adviser but prior to reductions from expense offset arrangements. Expenses net of all reductions represent the net expenses paid by the class but do not include expenses of the underlying funds in which the Fund invests.
H Annualized
See accompanying notes which are an integral part of the financial statements.
Fidelity Advisor Freedom 2040 Fund Class I
| | Six months ended (Unaudited) September 30, | Years endedMarch 31, | | | | |
| | 2018 | 2018 | 2017 | 2016 | 2015 | 2014 |
| Selected Per–Share Data | | | | | | |
| Net asset value, beginning of period | $15.78 | $14.65 | $13.32 | $14.57 | $14.59 | $13.67 |
| Income from Investment Operations | | | | | | |
| Net investment income (loss)A | .06 | .16 | .20 | .21 | .23 | .19 |
| Net realized and unrealized gain (loss) | .72 | 1.83 | 1.82 | (.71) | .76 | 1.75 |
| Total from investment operations | .78 | 1.99 | 2.02 | (.50) | .99 | 1.94 |
| Distributions from net investment income | – | (.19) | (.20) | (.22) | (.24) | (.19) |
| Distributions from net realized gain | (.67) | (.67) | (.49) | (.54) | (.77) | (.83) |
| Total distributions | (.67) | (.86) | (.69) | (.75)B | (1.01) | (1.02) |
| Net asset value, end of period | $15.89 | $15.78 | $14.65 | $13.32 | $14.57 | $14.59 |
| Total ReturnC,D | 5.07% | 13.74% | 15.82% | (3.62)% | 6.99% | 14.73% |
| Ratios to Average Net AssetsE,F | | | | | | |
| Expenses before reductions | .75%G | .63% | - %H | - %H | - %H | - %H |
| Expenses net of fee waivers, if any | .75%G | .63% | -% | -% | -% | -% |
| Expenses net of all reductions | .75%G | .63% | -% | -% | -% | -% |
| Net investment income (loss) | .80%G | 1.02% | 1.47% | 1.52% | 1.60% | 1.35% |
| Supplemental Data | | | | | | |
| Net assets, end of period (000 omitted) | $829,235 | $790,667 | $649,934 | $629,599 | $688,278 | $664,689 |
| Portfolio turnover rateE | 27%G | 23% | 18% | 21% | 24% | 47% |
A Calculated based on average shares outstanding during the period.
B Total distributions of $.75 per share is comprised of distributions from net investment income of $.216 and distributions from net realized gain of $.535 per share.
C Total returns for periods of less than one year are not annualized.
D Total returns would have been lower if certain expenses had not been reduced during the applicable periods shown.
E Amounts do not include the activity of the Underlying Funds.
F Expense ratios reflect operating expenses of the class. Expenses before reductions do not reflect amounts reimbursed by the investment adviser or reductions from expense offset arrangements and do not represent the amount paid by the class during periods when reimbursements or reductions occur. Expenses net of fee waivers reflect expenses after reimbursement by the investment adviser but prior to reductions from expense offset arrangements. Expenses net of all reductions represent the net expenses paid by the class but do not include expenses of the underlying funds in which the Fund invests.
G Annualized
H Amount represents less than .005%.
See accompanying notes which are an integral part of the financial statements.
Fidelity Advisor Freedom 2040 Fund Class Z6
| | Six months ended (Unaudited) September 30, | Years endedMarch 31, |
| | 2018 | 2018 A |
| Selected Per–Share Data | | |
| Net asset value, beginning of period | $15.76 | $15.04 |
| Income from Investment Operations | | |
| Net investment income (loss)B | .08 | .18 |
| Net realized and unrealized gain (loss) | .72 | 1.20 |
| Total from investment operations | .80 | 1.38 |
| Distributions from net investment income | – | (.23) |
| Distributions from net realized gain | (.67) | (.42) |
| Total distributions | (.67) | (.66)C |
| Net asset value, end of period | $15.89 | $15.76 |
| Total ReturnD,E | 5.21% | 9.12% |
| Ratios to Average Net AssetsF,G | | |
| Expenses before reductions | .49%H | .51%H,I |
| Expenses net of fee waivers, if any | .49%H | .51%H,I |
| Expenses net of all reductions | .49%H | .51%H,I |
| Net investment income (loss) | 1.05%H | 1.39%H |
| Supplemental Data | | |
| Net assets, end of period (000 omitted) | $30,752 | $11,861 |
| Portfolio turnover rateF | 27%H | 23% |
A For the period June 6, 2017 (commencement of sale of shares) to March 31, 2018.
B Calculated based on average shares outstanding during the period.
C Total distributions of $.66 per share is comprised of distributions from net investment income of $.234 and distributions from net realized gain of $.421 per share.
D Total returns for periods of less than one year are not annualized.
E Total returns would have been lower if certain expenses had not been reduced during the applicable periods shown.
F Amounts do not include the activity of the Underlying Funds.
G Expense ratios reflect operating expenses of the class. Expenses before reductions do not reflect amounts reimbursed by the investment adviser or reductions from expense offset arrangements and do not represent the amount paid by the class during periods when reimbursements or reductions occur. Expenses net of fee waivers reflect expenses after reimbursement by the investment adviser but prior to reductions from expense offset arrangements. Expenses net of all reductions represent the net expenses paid by the class but do not include expenses of the underlying funds in which the Fund invests.
H Annualized
I On certain classes, the size and fluctuation of net assets and expense amounts may cause ratios to differ from contractual rates.
See accompanying notes which are an integral part of the financial statements.
Fidelity Advisor Freedom® 2045 Fund
Investment Summary (Unaudited)
The information in the following tables is based on the direct investments of the Fund.
Top Holdings as of September 30, 2018
| | % of fund's net assets |
| Fidelity Series Large Cap Stock Fund | 12.3 |
| Fidelity Series International Growth Fund | 9.3 |
| Fidelity Series International Value Fund | 9.2 |
| Fidelity Series Emerging Markets Opportunities Fund | 8.6 |
| Fidelity Series Stock Selector Large Cap Value Fund | 7.8 |
| Fidelity Series Value Discovery Fund | 7.7 |
| Fidelity Advisor Series Equity Growth Fund | 7.1 |
| Fidelity Series Opportunistic Insights Fund | 6.6 |
| Fidelity Advisor Series Growth Opportunities Fund | 4.7 |
| Fidelity Series Small Cap Opportunities Fund | 4.2 |
| | 77.5 |
Asset Allocation (% of fund's net assets)
| Period end |
| | Domestic Equity Funds | 60.5% |
| | International Equity Funds | 30.8% |
| | Bond Funds | 6.8% |
| | Short-Term Funds | 1.9% |
| | Short-Term Investments | 0.1% |
| | Net Other Assets (Liabilities)* | (0.1)% |

* Net Other Assets (Liabilities) are not included in the pie chart
Domestic Equity Funds category includes Fidelity Series Commodity Strategy Fund which invests in commodity-related investments.
Fidelity Advisor Freedom® 2045 Fund
Schedule of Investments September 30, 2018 (Unaudited)
Showing Percentage of Net Assets
| U.S. Treasury Obligations - 0.1% | | | |
| | | Principal Amount | Value |
| U.S. Treasury Bills, yield at date of purchase 2.07% to 2.09% 11/23/18 to 11/29/18 (a) | | | |
| (Cost $906,938) | | 910,000 | 906,870 |
| | | Shares | Value |
|
| Domestic Equity Funds - 60.5% | | | |
| Fidelity Advisor Series Equity Growth Fund (b) | | 6,508,750 | $100,625,282 |
| Fidelity Advisor Series Growth Opportunities Fund (b) | | 4,074,026 | 67,791,796 |
| Fidelity Advisor Series Small Cap Fund (b) | | 3,671,361 | 46,149,002 |
| Fidelity Series All-Sector Equity Fund (b) | | 3,691,793 | 50,245,301 |
| Fidelity Series Commodity Strategy Fund (b) | | 6,003,511 | 30,017,553 |
| Fidelity Series Large Cap Stock Fund (b) | | 10,978,430 | 174,886,391 |
| Fidelity Series Large Cap Value Index Fund (b) | | 1,368,359 | 18,062,344 |
| Fidelity Series Opportunistic Insights Fund (b) | | 4,711,968 | 93,532,569 |
| Fidelity Series Small Cap Opportunities Fund (b) | | 4,045,428 | 59,427,335 |
| Fidelity Series Stock Selector Large Cap Value Fund (b) | | 8,458,016 | 111,814,966 |
| Fidelity Series Value Discovery Fund (b) | | 8,044,132 | 110,124,168 |
| TOTAL DOMESTIC EQUITY FUNDS | | | |
| (Cost $687,201,053) | | | 862,676,707 |
|
| International Equity Funds - 30.8% | | | |
| Fidelity Series Canada Fund (b) | | 1,182,901 | 12,787,161 |
| Fidelity Series Emerging Markets Fund (b) | | 912,624 | 8,843,324 |
| Fidelity Series Emerging Markets Opportunities Fund (b) | | 6,391,479 | 122,652,479 |
| Fidelity Series International Growth Fund (b) | | 8,059,877 | 132,181,990 |
| Fidelity Series International Small Cap Fund (b) | | 1,738,915 | 31,126,585 |
| Fidelity Series International Value Fund (b) | | 12,484,627 | 131,338,271 |
| TOTAL INTERNATIONAL EQUITY FUNDS | | | |
| (Cost $357,217,826) | | | 438,929,810 |
|
| Bond Funds - 6.8% | | | |
| Fidelity Series Emerging Markets Debt Fund (b) | | 907,496 | 8,648,436 |
| Fidelity Series Floating Rate High Income Fund (b) | | 323,474 | 3,079,471 |
| Fidelity Series High Income Fund (b) | | 1,923,544 | 18,485,263 |
| Fidelity Series Inflation-Protected Bond Index Fund (b) | | 443,117 | 4,302,663 |
| Fidelity Series International Credit Fund (b) | | 65,291 | 641,811 |
| Fidelity Series Investment Grade Bond Fund (b) | | 581,526 | 6,332,823 |
| Fidelity Series Long-Term Treasury Bond Index Fund (b) | | 6,019,876 | 49,603,774 |
| Fidelity Series Real Estate Income Fund (b) | | 569,895 | 6,143,467 |
| TOTAL BOND FUNDS | | | |
| (Cost $99,788,212) | | | 97,237,708 |
|
| Short-Term Funds - 1.9% | | | |
| Fidelity Cash Central Fund, 2.11% (c) | | 3,274,206 | 3,274,861 |
| Fidelity Series Government Money Market Fund 2.12% (b)(d) | | 19,881,121 | 19,881,121 |
| Fidelity Series Short-Term Credit Fund (b) | | 438,291 | 4,321,544 |
| TOTAL SHORT-TERM FUNDS | | | |
| (Cost $27,514,339) | | | 27,477,526 |
| TOTAL INVESTMENT IN SECURITIES - 100.1% | | | |
| (Cost $1,172,628,368) | | | 1,427,228,621 |
| NET OTHER ASSETS (LIABILITIES) - (0.1)% | | | (1,154,239) |
| NET ASSETS - 100% | | | $1,426,074,382 |
| Futures Contracts | | | | | |
| | Number of contracts | Expiration Date | Notional Amount | Value | Unrealized Appreciation/(Depreciation) |
| Purchased | | | | | |
| Equity Index Contracts | | | | | |
| CME E-mini S&P 500 Index Contracts (United States) | 56 | Dec. 2018 | $8,173,200 | $1,585 | $1,585 |
| ICE E-mini MSCI Emerging Markets Index Contracts (United States) | 68 | Dec. 2018 | 3,568,980 | 72,066 | 72,067 |
| | | | | | 73,652 |
| Sold | | | | | |
| Equity Index Contracts | | | | | |
| ICE E-mini MSCI EAFE Index Contracts (United States) | 33 | Dec. 2018 | 3,259,575 | (8,296) | (8,296) |
| TOTAL FUTURES CONTRACTS | | | | | $65,356 |
The notional amount of futures purchased as a percentage of Net Assets is 0.8%
The notional amount of futures sold as a percentage of Net Assets is 0.2%
Legend
(a) Security or a portion of the security was pledged to cover margin requirements for futures contracts. At period end, the value of securities pledged amounted to $363,743.
(b) Affiliated Fund
(c) Affiliated fund that is generally available only to investment companies and other accounts managed by Fidelity Investments. The rate quoted is the annualized seven-day yield of the fund at period end. A complete unaudited listing of the fund's holdings as of its most recent quarter end is available upon request. In addition, each Fidelity Central Fund's financial statements are available on the SEC's website or upon request.
(d) The rate quoted is the annualized seven-day yield of the fund at period end.
Affiliated Central Funds
Information regarding fiscal year to date income earned by the Fund from investments in Fidelity Central Funds is as follows:
| Fund | Income earned |
| Fidelity Cash Central Fund | $8,471 |
| Total | $8,471 |
Amounts in the income column in the above table include any capital gain distributions from underlying funds, which are presented in the corresponding line-item in the Statement of Operations if applicable.
Affiliated Underlying Funds
Fiscal year to date information regarding the Fund's investments in affiliated Underlying Funds, excluding any Money Market Central Funds, is presented below. Exchanges between classes of the same affiliated Underlying Funds may occur.
| Affiliate | Value, beginning of period | Purchases | Sales Proceeds | Dividend Income | Realized Gain (loss) | Change in Unrealized appreciation (depreciation) | Value, end of period |
| Fidelity Advisor Series Equity Growth Fund | $87,585,095 | $4,097,740 | $3,771,237 | $-- | $71,867 | $12,641,817 | $100,625,282 |
| Fidelity Advisor Series Equity Value Fund | 101,062,304 | 10,772,182 | 4,243,501 | 3,549,420 | (13,968) | (11,254,877) | -- |
| Fidelity Advisor Series Growth & Income Fund | 154,913,386 | 23,199,677 | 6,588,966 | 14,317,406 | 71,885 | (21,854,702) | -- |
| Fidelity Advisor Series Growth Opportunities Fund | 57,467,634 | 2,409,665 | 7,046,137 | -- | 944,697 | 14,015,937 | 67,791,796 |
| Fidelity Advisor Series Opportunistic Insights Fund | 81,384,078 | 10,890,542 | 3,463,613 | 6,811,697 | 50,151 | (27,571,504) | -- |
| Fidelity Advisor Series Small Cap Fund | 43,759,112 | 1,790,518 | 1,925,176 | -- | 24,337 | 2,500,211 | 46,149,002 |
| Fidelity Advisor Series Stock Selector Large Cap Value Fund | 102,033,097 | 15,983,029 | 4,260,772 | 8,994,303 | (37,896) | (11,088,764) | -- |
| Fidelity Series 100 Index Fund | 43,308,860 | -- | 46,620,020 | -- | 20,937,928 | (17,626,768) | -- |
| Fidelity Series All-Sector Equity Fund | 60,085,583 | 2,386,488 | 19,142,545 | -- | 1,370,501 | 5,545,274 | 50,245,301 |
| Fidelity Series Canada Fund | 11,904,189 | 652,968 | 511,312 | -- | 6,028 | 735,288 | 12,787,161 |
| Fidelity Series Commodity Strategy Fund | 28,249,093 | 5,387,177 | 1,184,249 | 1,794,332 | (14,615) | (2,419,853) | 30,017,553 |
| Fidelity Series Emerging Markets Debt Fund | 8,907,300 | 580,337 | 349,548 | 262,993 | (12,035) | (477,618) | 8,648,436 |
| Fidelity Series Emerging Markets Fund | -- | 8,853,279 | -- | -- | -- | (9,955) | 8,843,324 |
| Fidelity Series Emerging Markets Opportunities Fund | 123,530,365 | 26,811,607 | 11,946,239 | -- | 668 | (15,743,922) | 122,652,479 |
| Fidelity Series Floating Rate High Income Fund | 3,008,295 | 213,514 | 145,615 | 81,347 | (156) | 3,433 | 3,079,471 |
| Fidelity Series Government Money Market Fund 2.12% | 21,893,886 | 18,776,169 | 20,788,934 | 178,623 | -- | -- | 19,881,121 |
| Fidelity Series High Income Fund | 18,707,935 | 1,225,224 | 1,600,870 | 537,818 | (28,498) | 181,472 | 18,485,263 |
| Fidelity Series Inflation-Protected Bond Index Fund | 10,812,378 | 1,525,400 | 8,084,321 | 16,213 | (97,547) | 146,753 | 4,302,663 |
| Fidelity Series International Credit Fund | 640,362 | 7,891 | -- | 7,892 | -- | (6,442) | 641,811 |
| Fidelity Series International Growth Fund | 119,909,466 | 15,483,652 | 5,119,452 | -- | 10,204 | 1,898,120 | 132,181,990 |
| Fidelity Series International Small Cap Fund | 29,918,661 | 3,690,753 | 1,302,876 | -- | (10,086) | (1,169,867) | 31,126,585 |
| Fidelity Series International Value Fund | 121,339,335 | 15,374,305 | 5,107,705 | -- | (112,290) | (155,374) | 131,338,271 |
| Fidelity Series Investment Grade Bond Fund | 6,440,580 | 655,670 | 688,904 | 89,174 | (9,532) | (64,991) | 6,332,823 |
| Fidelity Series Large Cap Stock Fund | -- | 205,681 | 100,843 | -- | (496) | 25,040,769 | 174,886,391 |
| Fidelity Series Large Cap Value Index Fund | 16,906,145 | 711,093 | 754,528 | -- | 892 | 1,198,742 | 18,062,344 |
| Fidelity Series Long-Term Treasury Bond Index Fund | 30,339,836 | 32,511,347 | 11,615,972 | 624,178 | (356,464) | (1,274,973) | 49,603,774 |
| Fidelity Series Opportunistic Insights Fund | -- | 110,891 | 54,001 | -- | (3,741) | 32,189,766 | 93,532,569 |
| Fidelity Series Real Estate Equity Fund | 10,477,062 | 88,288�� | 10,987,257 | 55,604 | 580,263 | (158,356) | -- |
| Fidelity Series Real Estate Income Fund | 5,876,043 | 506,044 | 273,754 | 257,563 | (2,041) | 37,175 | 6,143,467 |
| Fidelity Series Short-Term Credit Fund | 3,944,220 | 580,861 | 203,667 | 45,618 | (483) | 613 | 4,321,544 |
| Fidelity Series Small Cap Opportunities Fund | 53,422,944 | 6,792,908 | 2,375,810 | 4,584,423 | 59,971 | 1,527,322 | 59,427,335 |
| Fidelity Series Stock Selector Large Cap Value Fund | -- | 232,057 | 91,242 | -- | (4,923) | 9,050,380 | 111,814,966 |
| Fidelity Series Value Discovery Fund | -- | 132,205 | 64,765 | -- | (1,149) | 13,735,737 | 110,124,168 |
| | $1,357,827,244 | $212,639,162 | $180,413,831 | $42,208,604 | $23,423,472 | $9,570,843 | $1,423,046,890 |
Amounts in the income column in the above table include any capital gain distributions from underlying funds, which are presented in the corresponding line-item in the Statement of Operations if applicable.
Investment Valuation
The following is a summary of the inputs used, as of September 30, 2018, involving the Fund's assets and liabilities carried at fair value. The inputs or methodology used for valuing securities may not be an indication of the risk associated with investing in those securities. For more information on valuation inputs, and their aggregation into the levels used below, please refer to the Investment Valuation section in the accompanying Notes to Financial Statements.
| | Valuation Inputs at Reporting Date: |
| Description | Total | Level 1 | Level 2 | Level 3 |
| Investments in Securities: | | | | |
| Other Short-Term Investments | $906,870 | $-- | $906,870 | $-- |
| Domestic Equity Funds | 862,676,707 | 862,676,707 | -- | -- |
| International Equity Funds | 438,929,810 | 438,929,810 | -- | -- |
| Bond Funds | 97,237,708 | 97,237,708 | -- | -- |
| Short-Term Funds | 27,477,526 | 27,477,526 | -- | -- |
| Total Investments in Securities: | $1,427,228,621 | $1,426,321,751 | $906,870 | $-- |
| Derivative Instruments: | | | | |
| Assets | | | | |
| Futures Contracts | $73,652 | $73,652 | $-- | $-- |
| Total Assets | $73,652 | $73,652 | $-- | $-- |
| Liabilities | | | | |
| Futures Contracts | $(8,296) | $(8,296) | $-- | $-- |
| Total Liabilities | $(8,296) | $(8,296) | $-- | $-- |
| Total Derivative Instruments: | $65,356 | $65,356 | $-- | $-- |
Value of Derivative Instruments
The following table is a summary of the Fund's value of derivative instruments by primary risk exposure as of September 30, 2018. For additional information on derivative instruments, please refer to the Derivative Instruments section in the accompanying Notes to Financial Statements.
| Primary Risk Exposure / Derivative Type | Value |
| | Asset | Liability |
| Equity Risk | | |
| Futures Contracts(a) | $73,652 | $(8,296) |
| Total Equity Risk | 73,652 | (8,296) |
| Total Value of Derivatives | $73,652 | $(8,296) |
(a) Reflects gross cumulative appreciation (depreciation) on futures contracts as presented in the Schedule of Investments. In the Statement of Assets and Liabilities, the period end daily variation margin is included in receivable or payable for daily variation margin on futures contracts, and the net cumulative appreciation (depreciation) is included in net unrealized appreciation (depreciation).
See accompanying notes which are an integral part of the financial statements.
Fidelity Advisor Freedom® 2045 Fund
Financial Statements
Statement of Assets and Liabilities
| | | September 30, 2018 (Unaudited) |
| Assets | | |
Investment in securities, at value — See accompanying schedule:
Unaffiliated issuers (cost $906,938) | $906,870 | |
| Fidelity Central Funds (cost $3,274,861) | 3,274,861 | |
| Other affiliated issuers (cost $1,168,446,569) | 1,423,046,890 | |
| Total Investment in Securities (cost $1,172,628,368) | | $1,427,228,621 |
| Cash | | 988 |
| Receivable for investments sold | | 16,611,346 |
| Receivable for fund shares sold | | 2,035,006 |
| Distributions receivable from Fidelity Central Funds | | 4,930 |
| Total assets | | 1,445,880,891 |
| Liabilities | | |
| Payable for investments purchased | $16,906,646 | |
| Payable for fund shares redeemed | 1,735,551 | |
| Accrued management fee | 875,939 | |
| Distribution and service plan fees payable | 234,732 | |
| Payable for daily variation margin on futures contracts | 53,641 | |
| Total liabilities | | 19,806,509 |
| Net Assets | | $1,426,074,382 |
| Net Assets consist of: | | |
| Paid in capital | | $1,117,738,127 |
| Undistributed net investment income | | 3,529,113 |
| Accumulated undistributed net realized gain (loss) on investments | | 50,141,533 |
| Net unrealized appreciation (depreciation) on investments | | 254,665,609 |
| Net Assets | | $1,426,074,382 |
| Calculation of Maximum Offering Price | | |
| Class A: | | |
| Net Asset Value and redemption price per share ($570,258,333 ÷ 46,347,081 shares) | | $12.30 |
| Maximum offering price per share (100/94.25 of $12.30) | | $13.05 |
| Class M: | | |
| Net Asset Value and redemption price per share ($217,117,388 ÷ 17,808,017 shares) | | $12.19 |
| Maximum offering price per share (100/96.50 of $12.19) | | $12.63 |
| Class C: | | |
| Net Asset Value and offering price per share ($32,196,061 ÷ 2,680,361 shares)(a) | | $12.01 |
| Class I: | | |
| Net Asset Value, offering price and redemption price per share ($584,234,593 ÷ 47,123,864 shares) | | $12.40 |
| Class Z6: | | |
| Net Asset Value, offering price and redemption price per share ($22,268,007 ÷ 1,794,914 shares) | | $12.41 |
(a) Redemption price per share is equal to net asset value less any applicable contingent deferred sales charge.
See accompanying notes which are an integral part of the financial statements.
Statement of Operations
| | | Six months ended September 30, 2018 (Unaudited) |
| Investment Income | | |
| Dividends: | | |
| Affiliated issuers | | $10,874,315 |
| Interest | | 6,025 |
| Income from Fidelity Central Funds | | 8,471 |
| Total income | | 10,888,811 |
| Expenses | | |
| Management fee | $5,195,656 | |
| Distribution and service plan fees | 1,399,519 | |
| Independent trustees' fees and expenses | 3,366 | |
| Total expenses | | 6,598,541 |
| Net investment income (loss) | | 4,290,270 |
| Realized and Unrealized Gain (Loss) | | |
| Net realized gain (loss) on: | | |
| Investment securities: | | |
| Fidelity Central Funds | 1 | |
| Other affiliated issuers | 23,423,472 | |
| Futures contracts | (547,794) | |
| Capital gain distributions from underlying funds: | | |
| Affiliated issuers | 31,334,289 | |
| Total net realized gain (loss) | | 54,209,968 |
| Change in net unrealized appreciation (depreciation) on: | | |
| Investment securities: | | |
| Unaffiliated issuers | (68) | |
| Affiliated issuers | 9,570,843 | |
| Futures contracts | 65,356 | |
| Total change in net unrealized appreciation (depreciation) | | 9,636,131 |
| Net gain (loss) | | 63,846,099 |
| Net increase (decrease) in net assets resulting from operations | | $68,136,369 |
See accompanying notes which are an integral part of the financial statements.
Statement of Changes in Net Assets
| | Six months ended September 30, 2018 (Unaudited) | Year ended March 31, 2018 |
| Increase (Decrease) in Net Assets | | |
| Operations | | |
| Net investment income (loss) | $4,290,270 | $10,671,463 |
| Net realized gain (loss) | 54,209,968 | 86,422,686 |
| Change in net unrealized appreciation (depreciation) | 9,636,131 | 61,790,750 |
| Net increase (decrease) in net assets resulting from operations | 68,136,369 | 158,884,899 |
| Distributions to shareholders from net investment income | – | (12,899,292) |
| Distributions to shareholders from net realized gain | (55,973,793) | (46,138,745) |
| Total distributions | (55,973,793) | (59,038,037) |
| Share transactions - net increase (decrease) | 57,166,729 | 66,150,547 |
| Total increase (decrease) in net assets | 69,329,305 | 165,997,409 |
| Net Assets | | |
| Beginning of period | 1,356,745,077 | 1,190,747,668 |
| End of period | $1,426,074,382 | $1,356,745,077 |
| Other Information | | |
| Undistributed net investment income end of period | $3,529,113 | $– |
| Distributions in excess of net investment income end of period | $– | $(761,157) |
See accompanying notes which are an integral part of the financial statements.
Financial Highlights
Fidelity Advisor Freedom 2045 Fund Class A
| | Six months ended (Unaudited) September 30, | Years endedMarch 31, | | | | |
| | 2018 | 2018 | 2017 | 2016 | 2015 | 2014 |
| Selected Per–Share Data | | | | | | |
| Net asset value, beginning of period | $12.21 | $11.26 | $10.23 | $11.15 | $11.31 | $10.46 |
| Income from Investment Operations | | | | | | |
| Net investment income (loss)A | .03 | .10 | .13 | .13 | .15 | .12 |
| Net realized and unrealized gain (loss) | .56 | 1.40 | 1.39 | (.54) | .59 | 1.39 |
| Total from investment operations | .59 | 1.50 | 1.52 | (.41) | .74 | 1.51 |
| Distributions from net investment income | – | (.12) | (.13) | (.14) | (.16) | (.12) |
| Distributions from net realized gain | (.50) | (.43) | (.36) | (.37) | (.74) | (.54) |
| Total distributions | (.50) | (.55) | (.49) | (.51) | (.90) | (.66) |
| Net asset value, end of period | $12.30 | $12.21 | $11.26 | $10.23 | $11.15 | $11.31 |
| Total ReturnB,C,D | 4.93% | 13.44% | 15.50% | (3.85)% | 6.80% | 14.74% |
| Ratios to Average Net AssetsE,F | | | | | | |
| Expenses before reductions | 1.00%G | .87% | .25% | .25% | .25% | .25% |
| Expenses net of fee waivers, if any | 1.00%G | .87% | .25% | .25% | .25% | .25% |
| Expenses net of all reductions | 1.00%G | .87% | .25% | .25% | .25% | .25% |
| Net investment income (loss) | .56%G | .79% | 1.22% | 1.27% | 1.37% | 1.12% |
| Supplemental Data | | | | | | |
| Net assets, end of period (000 omitted) | $570,258 | $566,474 | $556,090 | $531,510 | $623,734 | $612,735 |
| Portfolio turnover rateF | 26%G | 21% | 22% | 26% | 27% | 46% |
A Calculated based on average shares outstanding during the period.
B Total returns for periods of less than one year are not annualized.
C Total returns would have been lower if certain expenses had not been reduced during the applicable periods shown.
D Total returns do not include the effect of the sales charges.
E Expense ratios reflect operating expenses of the class. Expenses before reductions do not reflect amounts reimbursed by the investment adviser or reductions from expense offset arrangements and do not represent the amount paid by the class during periods when reimbursements or reductions occur. Expenses net of fee waivers reflect expenses after reimbursement by the investment adviser but prior to reductions from expense offset arrangements. Expenses net of all reductions represent the net expenses paid by the class but do not include expenses of the underlying funds in which the Fund invests.
F Amounts do not include the activity of the Underlying Funds.
G Annualized
See accompanying notes which are an integral part of the financial statements.
Fidelity Advisor Freedom 2045 Fund Class M
| | Six months ended (Unaudited) September 30, | Years endedMarch 31, | | | | |
| | 2018 | 2018 | 2017 | 2016 | 2015 | 2014 |
| Selected Per–Share Data | | | | | | |
| Net asset value, beginning of period | $12.12 | $11.19 | $10.17 | $11.09 | $11.26 | $10.42 |
| Income from Investment Operations | | | | | | |
| Net investment income (loss)A | .02 | .06 | .10 | .11 | .13 | .09 |
| Net realized and unrealized gain (loss) | .55 | 1.39 | 1.39 | (.54) | .57 | 1.39 |
| Total from investment operations | .57 | 1.45 | 1.49 | (.43) | .70 | 1.48 |
| Distributions from net investment income | – | (.10) | (.11) | (.12) | (.13) | (.10) |
| Distributions from net realized gain | (.50) | (.43) | (.36) | (.37) | (.74) | (.54) |
| Total distributions | (.50) | (.52)B | (.47) | (.49) | (.87) | (.64) |
| Net asset value, end of period | $12.19 | $12.12 | $11.19 | $10.17 | $11.09 | $11.26 |
| Total ReturnC,D,E | 4.80% | 13.12% | 15.29% | (4.10)% | 6.50% | 14.45% |
| Ratios to Average Net AssetsF,G | | | | | | |
| Expenses before reductions | 1.25%H | 1.13% | .50% | .50% | .50% | .50% |
| Expenses net of fee waivers, if any | 1.25%H | 1.13% | .50% | .50% | .50% | .50% |
| Expenses net of all reductions | 1.25%H | 1.13% | .50% | .50% | .50% | .50% |
| Net investment income (loss) | .31%H | .54% | .97% | 1.02% | 1.12% | .87% |
| Supplemental Data | | | | | | |
| Net assets, end of period (000 omitted) | $217,117 | $207,442 | $186,200 | $158,557 | $153,677 | $128,619 |
| Portfolio turnover rateG | 26%H | 21% | 22% | 26% | 27% | 46% |
A Calculated based on average shares outstanding during the period.
B Total distributions of $.52 per share is comprised of distributions from net investment income of $.096 and distributions from net realized gain of $.428 per share.
C Total returns for periods of less than one year are not annualized.
D Total returns would have been lower if certain expenses had not been reduced during the applicable periods shown.
E Total returns do not include the effect of the sales charges.
F Expense ratios reflect operating expenses of the class. Expenses before reductions do not reflect amounts reimbursed by the investment adviser or reductions from expense offset arrangements and do not represent the amount paid by the class during periods when reimbursements or reductions occur. Expenses net of fee waivers reflect expenses after reimbursement by the investment adviser but prior to reductions from expense offset arrangements. Expenses net of all reductions represent the net expenses paid by the class but do not include expenses of the underlying funds in which the Fund invests.
G Amounts do not include the activity of the Underlying Funds.
H Annualized
See accompanying notes which are an integral part of the financial statements.
Fidelity Advisor Freedom 2045 Fund Class C
| | Six months ended (Unaudited) September 30, | Years endedMarch 31, | | | | |
| | 2018 | 2018 | 2017 | 2016 | 2015 | 2014 |
| Selected Per–Share Data | | | | | | |
| Net asset value, beginning of period | $11.98 | $11.08 | $10.09 | $11.01 | $11.19 | $10.36 |
| Income from Investment Operations | | | | | | |
| Net investment income (loss)A | (.01) | –B | .05 | .05 | .07 | .04 |
| Net realized and unrealized gain (loss) | .54 | 1.38 | 1.38 | (.53) | .57 | 1.38 |
| Total from investment operations | .53 | 1.38 | 1.43 | (.48) | .64 | 1.42 |
| Distributions from net investment income | – | (.05) | (.08) | (.08) | (.09) | (.06) |
| Distributions from net realized gain | (.50) | (.43) | (.36) | (.36) | (.73) | (.53) |
| Total distributions | (.50) | (.48) | (.44) | (.44) | (.82) | (.59) |
| Net asset value, end of period | $12.01 | $11.98 | $11.08 | $10.09 | $11.01 | $11.19 |
| Total ReturnC,D,E | 4.51% | 12.59% | 14.71% | (4.59)% | 5.95% | 13.95% |
| Ratios to Average Net AssetsF,G | | | | | | |
| Expenses before reductions | 1.75%H | 1.63% | 1.00% | 1.00% | 1.00% | 1.00% |
| Expenses net of fee waivers, if any | 1.75%H | 1.63% | 1.00% | 1.00% | 1.00% | 1.00% |
| Expenses net of all reductions | 1.75%H | 1.63% | 1.00% | 1.00% | 1.00% | 1.00% |
| Net investment income (loss) | (.19)%H | .04% | .47% | .53% | .62% | .37% |
| Supplemental Data | | | | | | |
| Net assets, end of period (000 omitted) | $32,196 | $30,549 | $27,491 | $23,423 | $22,493 | $18,457 |
| Portfolio turnover rateG | 26%H | 21% | 22% | 26% | 27% | 46% |
A Calculated based on average shares outstanding during the period.
B Amount represents less than $.005 per share.
C Total returns for periods of less than one year are not annualized.
D Total returns would have been lower if certain expenses had not been reduced during the applicable periods shown.
E Total returns do not include the effect of the contingent deferred sales charge.
F Expense ratios reflect operating expenses of the class. Expenses before reductions do not reflect amounts reimbursed by the investment adviser or reductions from expense offset arrangements and do not represent the amount paid by the class during periods when reimbursements or reductions occur. Expenses net of fee waivers reflect expenses after reimbursement by the investment adviser but prior to reductions from expense offset arrangements. Expenses net of all reductions represent the net expenses paid by the class but do not include expenses of the underlying funds in which the Fund invests.
G Amounts do not include the activity of the Underlying Funds.
H Annualized
See accompanying notes which are an integral part of the financial statements.
Fidelity Advisor Freedom 2045 Fund Class I
| | Six months ended (Unaudited) September 30, | Years endedMarch 31, | | | | |
| | 2018 | 2018 | 2017 | 2016 | 2015 | 2014 |
| Selected Per–Share Data | | | | | | |
| Net asset value, beginning of period | $12.29 | $11.33 | $10.28 | $11.21 | $11.37 | $10.50 |
| Income from Investment Operations | | | | | | |
| Net investment income (loss)A | .05 | .12 | .16 | .16 | .18 | .15 |
| Net realized and unrealized gain (loss) | .56 | 1.42 | 1.40 | (.55) | .59 | 1.41 |
| Total from investment operations | .61 | 1.54 | 1.56 | (.39) | .77 | 1.56 |
| Distributions from net investment income | – | (.14) | (.15) | (.17) | (.19) | (.15) |
| Distributions from net realized gain | (.50) | (.44) | (.36) | (.37) | (.74) | (.54) |
| Total distributions | (.50) | (.58) | (.51) | (.54) | (.93) | (.69) |
| Net asset value, end of period | $12.40 | $12.29 | $11.33 | $10.28 | $11.21 | $11.37 |
| Total ReturnB,C | 5.07% | 13.77% | 15.83% | (3.66)% | 7.03% | 15.14% |
| Ratios to Average Net AssetsD,E | | | | | | |
| Expenses before reductions | .75%F | .64% | - %G | - %G | - %G | - %G |
| Expenses net of fee waivers, if any | .75%F | .64% | -% | -% | -% | -% |
| Expenses net of all reductions | .75%F | .64% | -% | -% | -% | -% |
| Net investment income (loss) | .81%F | 1.03% | 1.47% | 1.52% | 1.62% | 1.37% |
| Supplemental Data | | | | | | |
| Net assets, end of period (000 omitted) | $584,235 | $543,170 | $420,967 | $390,675 | $400,667 | $378,776 |
| Portfolio turnover rateE | 26%F | 21% | 22% | 26% | 27% | 46% |
A Calculated based on average shares outstanding during the period.
B Total returns for periods of less than one year are not annualized.
C Total returns would have been lower if certain expenses had not been reduced during the applicable periods shown.
D Expense ratios reflect operating expenses of the class. Expenses before reductions do not reflect amounts reimbursed by the investment adviser or reductions from expense offset arrangements and do not represent the amount paid by the class during periods when reimbursements or reductions occur. Expenses net of fee waivers reflect expenses after reimbursement by the investment adviser but prior to reductions from expense offset arrangements. Expenses net of all reductions represent the net expenses paid by the class but do not include expenses of the underlying funds in which the Fund invests.
E Amounts do not include the activity of the Underlying Funds.
F Annualized
G Amount represents less than .005%.
See accompanying notes which are an integral part of the financial statements.
Fidelity Advisor Freedom 2045 Fund Class Z6
| | Six months ended (Unaudited) September 30, | Years endedMarch 31, |
| | 2018 | 2018 A |
| Selected Per–Share Data | | |
| Net asset value, beginning of period | $12.28 | $11.65 |
| Income from Investment Operations | | |
| Net investment income (loss)B | .06 | .15 |
| Net realized and unrealized gain (loss) | .57 | .92 |
| Total from investment operations | .63 | 1.07 |
| Distributions from net investment income | – | (.18) |
| Distributions from net realized gain | (.50) | (.26) |
| Total distributions | (.50) | (.44) |
| Net asset value, end of period | $12.41 | $12.28 |
| Total ReturnC,D | 5.24% | 9.15% |
| Ratios to Average Net AssetsE,F | | |
| Expenses before reductions | .49%G | .51%G,H |
| Expenses net of fee waivers, if any | .49%G | .51%G,H |
| Expenses net of all reductions | .49%G | .51%G,H |
| Net investment income (loss) | 1.06%G | 1.50%G |
| Supplemental Data | | |
| Net assets, end of period (000 omitted) | $22,268 | $9,112 |
| Portfolio turnover rateF | 26%G | 21% |
A For the period June 6, 2017 (commencement of sale of shares) to March 31, 2018.
B Calculated based on average shares outstanding during the period.
C Total returns for periods of less than one year are not annualized.
D Total returns would have been lower if certain expenses had not been reduced during the applicable periods shown.
E Expense ratios reflect operating expenses of the class. Expenses before reductions do not reflect amounts reimbursed by the investment adviser or reductions from expense offset arrangements and do not represent the amount paid by the class during periods when reimbursements or reductions occur. Expenses net of fee waivers reflect expenses after reimbursement by the investment adviser but prior to reductions from expense offset arrangements. Expenses net of all reductions represent the net expenses paid by the class but do not include expenses of the underlying funds in which the Fund invests.
F Amounts do not include the activity of the Underlying Funds.
G Annualized
H On certain classes, the size and fluctuation of net assets and expense amounts may cause ratios to differ from contractual rates.
See accompanying notes which are an integral part of the financial statements.
Fidelity Advisor Freedom® 2050 Fund
Investment Summary (Unaudited)
The information in the following tables is based on the direct investments of the Fund.
Top Holdings as of September 30, 2018
| | % of fund's net assets |
| Fidelity Series Large Cap Stock Fund | 12.3 |
| Fidelity Series International Growth Fund | 9.3 |
| Fidelity Series International Value Fund | 9.2 |
| Fidelity Series Emerging Markets Opportunities Fund | 8.6 |
| Fidelity Series Stock Selector Large Cap Value Fund | 7.8 |
| Fidelity Series Value Discovery Fund | 7.7 |
| Fidelity Advisor Series Equity Growth Fund | 7.1 |
| Fidelity Series Opportunistic Insights Fund | 6.6 |
| Fidelity Advisor Series Growth Opportunities Fund | 4.7 |
| Fidelity Series Small Cap Opportunities Fund | 4.2 |
| | 77.5 |
Asset Allocation (% of fund's net assets)
| Period end |
| | Domestic Equity Funds | 60.5% |
| | International Equity Funds | 30.8% |
| | Bond Funds | 6.8% |
| | Short-Term Funds | 1.9% |
| | Short-Term Investments | 0.1% |
| | Net Other Assets (Liabilities)* | (0.1)% |

* Net Other Assets (Liabilities) are not included in the pie chart
Domestic Equity Funds category includes Fidelity Series Commodity Strategy Fund which invests in commodity-related investments.
Fidelity Advisor Freedom® 2050 Fund
Schedule of Investments September 30, 2018 (Unaudited)
Showing Percentage of Net Assets
| U.S. Treasury Obligations - 0.1% | | | |
| | | Principal Amount | Value |
| U.S. Treasury Bills, yield at date of purchase 2.07% to 2.09% 11/23/18 to 11/29/18 (a) | | | |
| (Cost $727,547) | | 730,000 | 727,491 |
| | | Shares | Value |
|
| Domestic Equity Funds - 60.5% | | | |
| Fidelity Advisor Series Equity Growth Fund (b) | | 5,289,533 | $81,776,182 |
| Fidelity Advisor Series Growth Opportunities Fund (b) | | 3,310,972 | 55,094,573 |
| Fidelity Advisor Series Small Cap Fund (b) | | 2,984,443 | 37,514,451 |
| Fidelity Series All-Sector Equity Fund (b) | | 2,998,758 | 40,813,090 |
| Fidelity Series Commodity Strategy Fund (b) | | 4,880,788 | 24,403,940 |
| Fidelity Series Large Cap Stock Fund (b) | | 8,921,878 | 142,125,510 |
| Fidelity Series Large Cap Value Index Fund (b) | | 1,112,453 | 14,684,377 |
| Fidelity Series Opportunistic Insights Fund (b) | | 3,829,348 | 76,012,567 |
| Fidelity Series Small Cap Opportunities Fund (b) | | 3,287,681 | 48,296,040 |
| Fidelity Series Stock Selector Large Cap Value Fund (b) | | 6,873,786 | 90,871,445 |
| Fidelity Series Value Discovery Fund (b) | | 6,537,530 | 89,498,785 |
| TOTAL DOMESTIC EQUITY FUNDS | | | |
| (Cost $562,804,299) | | | 701,090,960 |
|
| International Equity Funds - 30.8% | | | |
| Fidelity Series Canada Fund (b) | | 961,283 | 10,391,470 |
| Fidelity Series Emerging Markets Fund (b) | | 743,432 | 7,203,859 |
| Fidelity Series Emerging Markets Opportunities Fund (b) | | 5,194,080 | 99,674,389 |
| Fidelity Series International Growth Fund (b) | | 6,550,170 | 107,422,787 |
| Fidelity Series International Small Cap Fund (b) | | 1,413,588 | 25,303,220 |
| Fidelity Series International Value Fund (b) | | 10,146,147 | 106,737,471 |
| TOTAL INTERNATIONAL EQUITY FUNDS | | | |
| (Cost $292,574,631) | | | 356,733,196 |
|
| Bond Funds - 6.8% | | | |
| Fidelity Series Emerging Markets Debt Fund (b) | | 734,669 | 7,001,393 |
| Fidelity Series Floating Rate High Income Fund (b) | | 264,373 | 2,516,835 |
| Fidelity Series High Income Fund (b) | | 1,559,960 | 14,991,216 |
| Fidelity Series Inflation-Protected Bond Index Fund (b) | | 360,108 | 3,496,646 |
| Fidelity Series International Credit Fund (b) | | 51,312 | 504,395 |
| Fidelity Series Investment Grade Bond Fund (b) | | 472,603 | 5,146,642 |
| Fidelity Series Long-Term Treasury Bond Index Fund (b) | | 4,892,358 | 40,313,026 |
| Fidelity Series Real Estate Income Fund (b) | | 464,015 | 5,002,081 |
| TOTAL BOND FUNDS | | | |
| (Cost $81,264,483) | | | 78,972,234 |
|
| Short-Term Funds - 1.9% | | | |
| Fidelity Cash Central Fund, 2.11% (c) | | 2,629,194 | 2,629,720 |
| Fidelity Series Government Money Market Fund 2.12% (b)(d) | | 16,163,327 | 16,163,327 |
| Fidelity Series Short-Term Credit Fund (b) | | 357,394 | 3,523,909 |
| TOTAL SHORT-TERM FUNDS | | | |
| (Cost $22,346,101) | | | 22,316,956 |
| TOTAL INVESTMENT IN SECURITIES - 100.1% | | | |
| (Cost $959,717,061) | | | 1,159,840,837 |
| NET OTHER ASSETS (LIABILITIES) - (0.1)% | | | (934,072) |
| NET ASSETS - 100% | | | $1,158,906,765 |
| Futures Contracts | | | | | |
| | Number of contracts | Expiration Date | Notional Amount | Value | Unrealized Appreciation/(Depreciation) |
| Purchased | | | | | |
| Equity Index Contracts | | | | | |
| CME E-mini S&P 500 Index Contracts (United States) | 45 | Dec. 2018 | $6,567,750 | $1,274 | $1,274 |
| ICE E-mini MSCI Emerging Markets Index Contracts (United States) | 55 | Dec. 2018 | 2,886,675 | 58,311 | 58,311 |
| | | | | | 59,585 |
| Sold | | | | | |
| Equity Index Contracts | | | | | |
| ICE E-mini MSCI EAFE Index Contracts (United States) | 27 | Dec. 2018 | 2,666,925 | (6,089) | (6,089) |
| TOTAL FUTURES CONTRACTS | | | | | $53,496 |
The notional amount of futures purchased as a percentage of Net Assets is 0.8%
The notional amount of futures sold as a percentage of Net Assets is 0.2%
Legend
(a) Security or a portion of the security was pledged to cover margin requirements for futures contracts. At period end, the value of securities pledged amounted to $296,973.
(b) Affiliated Fund
(c) Affiliated fund that is generally available only to investment companies and other accounts managed by Fidelity Investments. The rate quoted is the annualized seven-day yield of the fund at period end. A complete unaudited listing of the fund's holdings as of its most recent quarter end is available upon request. In addition, each Fidelity Central Fund's financial statements are available on the SEC's website or upon request.
(d) The rate quoted is the annualized seven-day yield of the fund at period end.
Affiliated Central Funds
Information regarding fiscal year to date income earned by the Fund from investments in Fidelity Central Funds is as follows:
| Fund | Income earned |
| Fidelity Cash Central Fund | $6,739 |
| Total | $6,739 |
Amounts in the income column in the above table include any capital gain distributions from underlying funds, which are presented in the corresponding line-item in the Statement of Operations if applicable.
Affiliated Underlying Funds
Fiscal year to date information regarding the Fund's investments in affiliated Underlying Funds, excluding any Money Market Central Funds, is presented below. Exchanges between classes of the same affiliated Underlying Funds may occur.
| Affiliate | Value, beginning of period | Purchases | Sales Proceeds | Dividend Income | Realized Gain (loss) | Change in Unrealized appreciation (depreciation) | Value, end of period |
| Fidelity Advisor Series Equity Growth Fund | $70,351,965 | $4,450,685 | $3,292,165 | $-- | $52,411 | $10,213,286 | $81,776,182 |
| Fidelity Advisor Series Equity Value Fund | 81,184,995 | 9,855,105 | 3,708,775 | 2,879,441 | (35,683) | (8,589,666) | -- |
| Fidelity Advisor Series Growth & Income Fund | 124,458,830 | 20,534,452 | 5,760,026 | 11,601,729 | 44,166 | (16,838,229) | -- |
| Fidelity Advisor Series Growth Opportunities Fund | 46,159,904 | 2,760,227�� | 5,910,475 | -- | 857,310 | 11,227,607 | 55,094,573 |
| Fidelity Advisor Series Opportunistic Insights Fund | 65,364,078 | 9,792,962 | 3,042,075 | 5,525,925 | 27,726 | (21,284,157) | -- |
| Fidelity Advisor Series Small Cap Fund | 35,146,093 | 2,051,377 | 1,716,777 | -- | 14,426 | 2,019,332 | 37,514,451 |
| Fidelity Advisor Series Stock Selector Large Cap Value Fund | 81,966,944 | 13,879,105 | 3,743,822 | 7,276,804 | (37,495) | (8,311,521) | -- |
| Fidelity Series 100 Index Fund | 34,748,219 | -- | 37,407,729 | -- | 16,279,802 | (13,620,292) | -- |
| Fidelity Series All-Sector Equity Fund | 48,267,467 | 2,717,986 | 15,759,364 | -- | 1,092,117 | 4,494,884 | 40,813,090 |
| Fidelity Series Canada Fund | 9,565,126 | 690,876 | 461,910 | -- | 2,751 | 594,627 | 10,391,470 |
| Fidelity Series Commodity Strategy Fund | 22,713,854 | 4,722,322 | 1,058,249 | 1,453,518 | (159,442) | (1,814,545) | 24,403,940 |
| Fidelity Series Emerging Markets Debt Fund | 7,129,561 | 575,050 | 310,227 | 211,756 | (11,924) | (381,067) | 7,001,393 |
| Fidelity Series Emerging Markets Fund | -- | 7,211,913 | -- | -- | -- | (8,054) | 7,203,859 |
| Fidelity Series Emerging Markets Opportunities Fund | 99,246,751 | 23,286,825 | 10,151,629 | -- | (197,829) | (12,509,729) | 99,674,389 |
| Fidelity Series Floating Rate High Income Fund | 2,426,049 | 217,337 | 129,251 | 66,063 | (941) | 3,641 | 2,516,835 |
| Fidelity Series Government Money Market Fund 2.12% | 17,563,064 | 15,459,704 | 16,859,441 | 144,239 | -- | -- | 16,163,327 |
| Fidelity Series High Income Fund | 14,946,932 | 1,220,044 | 1,299,159 | 433,148 | (10,922) | 134,321 | 14,991,216 |
| Fidelity Series Inflation-Protected Bond Index Fund | 8,708,325 | 1,326,280 | 6,577,531 | 13,139 | (82,396) | 121,968 | 3,496,646 |
| Fidelity Series International Credit Fund | 503,256 | 6,201 | -- | 6,202 | -- | (5,062) | 504,395 |
| Fidelity Series International Growth Fund | 96,317,039 | 14,186,811 | 4,618,877 | -- | 4,945 | 1,532,869 | 107,422,787 |
| Fidelity Series International Small Cap Fund | 24,031,703 | 3,406,054 | 1,180,174 | -- | (17,157) | (937,206) | 25,303,220 |
| Fidelity Series International Value Fund | 97,470,380 | 14,102,701 | 4,618,877 | -- | (113,007) | (103,726) | 106,737,471 |
| Fidelity Series Investment Grade Bond Fund | 5,182,457 | 610,454 | 586,304 | 72,160 | (8,433) | (51,532) | 5,146,642 |
| Fidelity Series Large Cap Stock Fund | -- | 352,315 | 55,085 | -- | 125 | 19,388,962 | 142,125,510 |
| Fidelity Series Large Cap Value Index Fund | 13,577,147 | 809,817 | 671,520 | -- | (339) | 969,272 | 14,684,377 |
| Fidelity Series Long-Term Treasury Bond Index Fund | 24,382,002 | 26,839,597 | 9,589,393 | 506,091 | (288,636) | (1,030,544) | 40,313,026 |
| Fidelity Series Opportunistic Insights Fund | -- | 190,726 | 29,496 | -- | (2,296) | 24,995,099 | 76,012,567 |
| Fidelity Series Real Estate Equity Fund | 8,433,757 | 71,694 | 8,845,995 | 45,364 | 399,314 | (58,770) | -- |
| Fidelity Series Real Estate Income Fund | 4,723,812 | 492,783 | 242,977 | 208,381 | (3,940) | 32,403 | 5,002,081 |
| Fidelity Series Short-Term Credit Fund | 3,186,925 | 513,834 | 176,978 | 37,176 | (925) | 1,053 | 3,523,909 |
| Fidelity Series Small Cap Opportunities Fund | 42,907,982 | 6,247,521 | 2,124,913 | 3,711,430 | 49,938 | 1,215,512 | 48,296,040 |
| Fidelity Series Stock Selector Large Cap Value Fund | -- | 501,328 | 38,854 | -- | (2,736) | 6,658,496 | 90,871,445 |
| Fidelity Series Value Discovery Fund | -- | 226,565 | 35,377 | -- | (734) | 10,602,355 | 89,498,785 |
| | $1,090,664,617 | $189,310,651 | $150,003,425 | $34,192,566 | $17,850,196 | $8,661,587 | $1,156,483,626 |
Amounts in the income column in the above table include any capital gain distributions from underlying funds, which are presented in the corresponding line-item in the Statement of Operations if applicable.
Investment Valuation
The following is a summary of the inputs used, as of September 30, 2018, involving the Fund's assets and liabilities carried at fair value. The inputs or methodology used for valuing securities may not be an indication of the risk associated with investing in those securities. For more information on valuation inputs, and their aggregation into the levels used below, please refer to the Investment Valuation section in the accompanying Notes to Financial Statements.
| | Valuation Inputs at Reporting Date: |
| Description | Total | Level 1 | Level 2 | Level 3 |
| Investments in Securities: | | | | |
| Other Short-Term Investments | $727,491 | $-- | $727,491 | $-- |
| Domestic Equity Funds | 701,090,960 | 701,090,960 | -- | -- |
| International Equity Funds | 356,733,196 | 356,733,196 | -- | -- |
| Bond Funds | 78,972,234 | 78,972,234 | -- | -- |
| Short-Term Funds | 22,316,956 | 22,316,956 | -- | -- |
| Total Investments in Securities: | $1,159,840,837 | $1,159,113,346 | $727,491 | $-- |
| Derivative Instruments: | | | | |
| Assets | | | | |
| Futures Contracts | $59,585 | $59,585 | $-- | $-- |
| Total Assets | $59,585 | $59,585 | $-- | $-- |
| Liabilities | | | | |
| Futures Contracts | $(6,089) | $(6,089) | $-- | $-- |
| Total Liabilities | $(6,089) | $(6,089) | $-- | $-- |
| Total Derivative Instruments: | $53,496 | $53,496 | $-- | $-- |
Value of Derivative Instruments
The following table is a summary of the Fund's value of derivative instruments by primary risk exposure as of September 30, 2018. For additional information on derivative instruments, please refer to the Derivative Instruments section in the accompanying Notes to Financial Statements.
| Primary Risk Exposure / Derivative Type | Value |
| | Asset | Liability |
| Equity Risk | | |
| Futures Contracts(a) | $59,585 | $(6,089) |
| Total Equity Risk | 59,585 | (6,089) |
| Total Value of Derivatives | $59,585 | $(6,089) |
(a) Reflects gross cumulative appreciation (depreciation) on futures contracts as presented in the Schedule of Investments. In the Statement of Assets and Liabilities, the period end daily variation margin is included in receivable or payable for daily variation margin on futures contracts, and the net cumulative appreciation (depreciation) is included in net unrealized appreciation (depreciation).
See accompanying notes which are an integral part of the financial statements.
Fidelity Advisor Freedom® 2050 Fund
Financial Statements
Statement of Assets and Liabilities
| | | September 30, 2018 (Unaudited) |
| Assets | | |
Investment in securities, at value — See accompanying schedule:
Unaffiliated issuers (cost $727,547) | $727,491 | |
| Fidelity Central Funds (cost $2,629,720) | 2,629,720 | |
| Other affiliated issuers (cost $956,359,794) | 1,156,483,626 | |
| Total Investment in Securities (cost $959,717,061) | | $1,159,840,837 |
| Receivable for investments sold | | 13,468,826 |
| Receivable for fund shares sold | | 1,674,695 |
| Distributions receivable from Fidelity Central Funds | | 3,956 |
| Total assets | | 1,174,988,314 |
| Liabilities | | |
| Payable for investments purchased | $13,914,511 | |
| Payable for fund shares redeemed | 1,224,347 | |
| Accrued management fee | 710,239 | |
| Distribution and service plan fees payable | 188,525 | |
| Payable for daily variation margin on futures contracts | 43,927 | |
| Total liabilities | | 16,081,549 |
| Net Assets | | $1,158,906,765 |
| Net Assets consist of: | | |
| Paid in capital | | $916,402,251 |
| Undistributed net investment income | | 2,586,760 |
| Accumulated undistributed net realized gain (loss) on investments | | 39,740,482 |
| Net unrealized appreciation (depreciation) on investments | | 200,177,272 |
| Net Assets | | $1,158,906,765 |
| Calculation of Maximum Offering Price | | |
| Class A: | | |
| Net Asset Value and redemption price per share ($420,053,311 ÷ 34,211,307 shares) | | $12.28 |
| Maximum offering price per share (100/94.25 of $12.28) | | $13.03 |
| Class M: | | |
| Net Asset Value and redemption price per share ($177,208,406 ÷ 14,530,809 shares) | | $12.20 |
| Maximum offering price per share (100/96.50 of $12.20) | | $12.64 |
| Class C: | | |
| Net Asset Value and offering price per share ($34,382,252 ÷ 2,858,390 shares)(a) | | $12.03 |
| Class I: | | |
| Net Asset Value, offering price and redemption price per share ($512,069,781 ÷ 41,392,604 shares) | | $12.37 |
| Class Z6: | | |
| Net Asset Value, offering price and redemption price per share ($15,193,015 ÷ 1,227,419 shares) | | $12.38 |
(a) Redemption price per share is equal to net asset value less any applicable contingent deferred sales charge.
See accompanying notes which are an integral part of the financial statements.
Statement of Operations
| | | Six months ended September 30, 2018 (Unaudited) |
| Investment Income | | |
| Dividends: | | |
| Affiliated issuers | | $8,803,080 |
| Interest | | 4,884 |
| Income from Fidelity Central Funds | | 6,739 |
| Total income | | 8,814,703 |
| Expenses | | |
| Management fee | $4,201,296 | |
| Distribution and service plan fees | 1,125,460 | |
| Independent trustees' fees and expenses | 2,712 | |
| Total expenses before reductions | 5,329,468 | |
| Expense reductions | (2) | |
| Total expenses after reductions | | 5,329,466 |
| Net investment income (loss) | | 3,485,237 |
| Realized and Unrealized Gain (Loss) | | |
| Net realized gain (loss) on: | | |
| Investment securities: | | |
| Fidelity Central Funds | 1 | |
| Other affiliated issuers | 17,850,196 | |
| Futures contracts | (442,546) | |
| Capital gain distributions from underlying funds: | | |
| Affiliated issuers | 25,389,486 | |
| Total net realized gain (loss) | | 42,797,137 |
| Change in net unrealized appreciation (depreciation) on: | | |
| Investment securities: | | |
| Unaffiliated issuers | (56) | |
| Affiliated issuers | 8,661,587 | |
| Futures contracts | 53,496 | |
| Total change in net unrealized appreciation (depreciation) | | 8,715,027 |
| Net gain (loss) | | 51,512,164 |
| Net increase (decrease) in net assets resulting from operations | | $54,997,401 |
See accompanying notes which are an integral part of the financial statements.
Statement of Changes in Net Assets
| | Six months ended September 30, 2018 (Unaudited) | Year ended March 31, 2018 |
| Increase (Decrease) in Net Assets | | |
| Operations | | |
| Net investment income (loss) | $3,485,237 | $8,457,626 |
| Net realized gain (loss) | 42,797,137 | 66,828,415 |
| Change in net unrealized appreciation (depreciation) | 8,715,027 | 49,404,768 |
| Net increase (decrease) in net assets resulting from operations | 54,997,401 | 124,690,809 |
| Distributions to shareholders from net investment income | – | (10,251,675) |
| Distributions to shareholders from net realized gain | (43,902,951) | (34,153,397) |
| Total distributions | (43,902,951) | (44,405,072) |
| Share transactions - net increase (decrease) | 58,015,509 | 79,870,312 |
| Total increase (decrease) in net assets | 69,109,959 | 160,156,049 |
| Net Assets | | |
| Beginning of period | 1,089,796,806 | 929,640,757 |
| End of period | $1,158,906,765 | $1,089,796,806 |
| Other Information | | |
| Undistributed net investment income end of period | $2,586,760 | $– |
| Distributions in excess of net investment income end of period | $– | $(898,477) |
See accompanying notes which are an integral part of the financial statements.
Financial Highlights
Fidelity Advisor Freedom 2050 Fund Class A
| | Six months ended (Unaudited) September 30, | Years endedMarch 31, | | | | |
| | 2018 | 2018 | 2017 | 2016 | 2015 | 2014 |
| Selected Per–Share Data | | | | | | |
| Net asset value, beginning of period | $12.17 | $11.20 | $10.16 | $11.06 | $11.24 | $10.39 |
| Income from Investment Operations | | | | | | |
| Net investment income (loss)A | .03 | .09 | .13 | .13 | .15 | .12 |
| Net realized and unrealized gain (loss) | .57 | 1.40 | 1.39 | (.53) | .58 | 1.40 |
| Total from investment operations | .60 | 1.49 | 1.52 | (.40) | .73 | 1.52 |
| Distributions from net investment income | – | (.12) | (.13) | (.14) | (.16) | (.12) |
| Distributions from net realized gain | (.49) | (.40) | (.34) | (.36) | (.76) | (.55) |
| Total distributions | (.49) | (.52) | (.48)B | (.50) | (.91)C | (.67) |
| Net asset value, end of period | $12.28 | $12.17 | $11.20 | $10.16 | $11.06 | $11.24 |
| Total ReturnD,E,F | 5.00% | 13.42% | 15.52% | (3.84)% | 6.77% | 14.91% |
| Ratios to Average Net AssetsG,H | | | | | | |
| Expenses before reductions | 1.00%I | .88% | .25% | .25% | .25% | .25% |
| Expenses net of fee waivers, if any | 1.00%I | .88% | .25% | .25% | .25% | .25% |
| Expenses net of all reductions | 1.00%I | .88% | .25% | .25% | .25% | .25% |
| Net investment income (loss) | .56%I | .79% | 1.22% | 1.28% | 1.37% | 1.10% |
| Supplemental Data | | | | | | |
| Net assets, end of period (000 omitted) | $420,053 | $418,313 | $396,373 | $363,199 | $415,103 | $401,589 |
| Portfolio turnover rateH | 27%I | 20% | 25% | 24% | 30% | 47% |
A Calculated based on average shares outstanding during the period.
B Total distributions of $.48 per share is comprised of distributions from net investment income of $.131 and distributions from net realized gain of $.344 per share.
C Total distributions of $.91 per share is comprised of distributions from net investment income of $.155 and distributions from net realized gain of $.755 per share.
D Total returns for periods of less than one year are not annualized.
E Total returns would have been lower if certain expenses had not been reduced during the applicable periods shown.
F Total returns do not include the effect of the sales charges.
G Expense ratios reflect operating expenses of the class. Expenses before reductions do not reflect amounts reimbursed by the investment adviser or reductions from expense offset arrangements and do not represent the amount paid by the class during periods when reimbursements or reductions occur. Expenses net of fee waivers reflect expenses after reimbursement by the investment adviser but prior to reductions from expense offset arrangements. Expenses net of all reductions represent the net expenses paid by the class but do not include expenses of the underlying funds in which the Fund invests.
H Amounts do not include the activity of the Underlying Funds.
I Annualized
See accompanying notes which are an integral part of the financial statements.
Fidelity Advisor Freedom 2050 Fund Class M
| | Six months ended (Unaudited) September 30, | Years endedMarch 31, | | | | |
| | 2018 | 2018 | 2017 | 2016 | 2015 | 2014 |
| Selected Per–Share Data | | | | | | |
| Net asset value, beginning of period | $12.11 | $11.15 | $10.12 | $11.02 | $11.20 | $10.36 |
| Income from Investment Operations | | | | | | |
| Net investment income (loss)A | .02 | .06 | .10 | .11 | .12 | .09 |
| Net realized and unrealized gain (loss) | .56 | 1.39 | 1.38 | (.54) | .58 | 1.39 |
| Total from investment operations | .58 | 1.45 | 1.48 | (.43) | .70 | 1.48 |
| Distributions from net investment income | – | (.10) | (.11) | (.12) | (.13) | (.10) |
| Distributions from net realized gain | (.49) | (.40) | (.34) | (.36) | (.76) | (.55) |
| Total distributions | (.49) | (.49)B | (.45) | (.47)C | (.88)D | (.64)E |
| Net asset value, end of period | $12.20 | $12.11 | $11.15 | $10.12 | $11.02 | $11.20 |
| Total ReturnF,G,H | 4.85% | 13.16% | 15.22% | (4.08)% | 6.54% | 14.61% |
| Ratios to Average Net AssetsI,J | | | | | | |
| Expenses before reductions | 1.25%K | 1.13% | .50% | .50% | .50% | .50% |
| Expenses net of fee waivers, if any | 1.25%K | 1.13% | .50% | .50% | .50% | .50% |
| Expenses net of all reductions | 1.25%K | 1.13% | .50% | .50% | .50% | .50% |
| Net investment income (loss) | .31%K | .54% | .97% | 1.04% | 1.12% | .85% |
| Supplemental Data | | | | | | |
| Net assets, end of period (000 omitted) | $177,208 | $166,634 | $147,601 | $127,842 | $126,987 | $115,391 |
| Portfolio turnover rateJ | 27%K | 20% | 25% | 24% | 30% | 47% |
A Calculated based on average shares outstanding during the period.
B Total distributions of $.49 per share is comprised of distributions from net investment income of $.096 and distributions from net realized gain of $.398 per share.
C Total distributions of $.47 per share is comprised of distributions from net investment income of $.115 and distributions from net realized gain of $.355 per share.
D Total distributions of $.88 per share is comprised of distributions from net investment income of $.128 and distributions from net realized gain of $.755 per share.
E Total distributions of $.64 per share is comprised of distributions from net investment income of $.097 and distributions from net realized gain of $.546 per share.
F Total returns for periods of less than one year are not annualized.
G Total returns would have been lower if certain expenses had not been reduced during the applicable periods shown.
H Total returns do not include the effect of the sales charges.
I Expense ratios reflect operating expenses of the class. Expenses before reductions do not reflect amounts reimbursed by the investment adviser or reductions from expense offset arrangements and do not represent the amount paid by the class during periods when reimbursements or reductions occur. Expenses net of fee waivers reflect expenses after reimbursement by the investment adviser but prior to reductions from expense offset arrangements. Expenses net of all reductions represent the net expenses paid by the class but do not include expenses of the underlying funds in which the Fund invests.
J Amounts do not include the activity of the Underlying Funds.
K Annualized
See accompanying notes which are an integral part of the financial statements.
Fidelity Advisor Freedom 2050 Fund Class C
| | Six months ended (Unaudited) September 30, | Years endedMarch 31, | | | | |
| | 2018 | 2018 | 2017 | 2016 | 2015 | 2014 |
| Selected Per–Share Data | | | | | | |
| Net asset value, beginning of period | $11.98 | $11.05 | $10.04 | $10.95 | $11.14 | $10.31 |
| Income from Investment Operations | | | | | | |
| Net investment income (loss)A | (.01) | –B | .05 | .06 | .07 | .04 |
| Net realized and unrealized gain (loss) | .55 | 1.38 | 1.37 | (.55) | .57 | 1.38 |
| Total from investment operations | .54 | 1.38 | 1.42 | (.49) | .64 | 1.42 |
| Distributions from net investment income | – | (.06) | (.08) | (.08) | (.09) | (.06) |
| Distributions from net realized gain | (.49) | (.39) | (.34) | (.34) | (.74) | (.54) |
| Total distributions | (.49) | (.45) | (.41)C | (.42) | (.83) | (.59)D |
| Net asset value, end of period | $12.03 | $11.98 | $11.05 | $10.04 | $10.95 | $11.14 |
| Total ReturnE,F,G | 4.56% | 12.59% | 14.73% | (4.67)% | 6.01% | 14.06% |
| Ratios to Average Net AssetsH,I | | | | | | |
| Expenses before reductions | 1.75%J | 1.63% | 1.00% | 1.00% | 1.00% | 1.00% |
| Expenses net of fee waivers, if any | 1.75%J | 1.63% | 1.00% | 1.00% | 1.00% | 1.00% |
| Expenses net of all reductions | 1.75%J | 1.63% | 1.00% | 1.00% | 1.00% | 1.00% |
| Net investment income (loss) | (.19)%J | .04% | .47% | .54% | .63% | .35% |
| Supplemental Data | | | | | | |
| Net assets, end of period (000 omitted) | $34,382 | $32,763 | $28,268 | $24,460 | $24,652 | $21,190 |
| Portfolio turnover rateI | 27%J | 20% | 25% | 24% | 30% | 47% |
A Calculated based on average shares outstanding during the period.
B Amount represents less than $.005 per share.
C Total distributions of $.41 per share is comprised of distributions from net investment income of $.075 and distributions from net realized gain of $.339 per share.
D Total distributions of $.59 per share is comprised of distributions from net investment income of $.056 and distributions from net realized gain of $.536 per share.
E Total returns for periods of less than one year are not annualized.
F Total returns would have been lower if certain expenses had not been reduced during the applicable periods shown.
G Total returns do not include the effect of the contingent deferred sales charge.
H Expense ratios reflect operating expenses of the class. Expenses before reductions do not reflect amounts reimbursed by the investment adviser or reductions from expense offset arrangements and do not represent the amount paid by the class during periods when reimbursements or reductions occur. Expenses net of fee waivers reflect expenses after reimbursement by the investment adviser but prior to reductions from expense offset arrangements. Expenses net of all reductions represent the net expenses paid by the class but do not include expenses of the underlying funds in which the Fund invests.
I Amounts do not include the activity of the Underlying Funds.
J Annualized
See accompanying notes which are an integral part of the financial statements.
Fidelity Advisor Freedom 2050 Fund Class I
| | Six months ended (Unaudited) September 30, | Years endedMarch 31, | | | | |
| | 2018 | 2018 | 2017 | 2016 | 2015 | 2014 |
| Selected Per–Share Data | | | | | | |
| Net asset value, beginning of period | $12.25 | $11.27 | $10.22 | $11.13 | $11.30 | $10.44 |
| Income from Investment Operations | | | | | | |
| Net investment income (loss)A | .05 | .12 | .16 | .16 | .18 | .15 |
| Net realized and unrealized gain (loss) | .56 | 1.41 | 1.39 | (.55) | .59 | 1.40 |
| Total from investment operations | .61 | 1.53 | 1.55 | (.39) | .77 | 1.55 |
| Distributions from net investment income | – | (.14) | (.15) | (.16) | (.18) | (.15) |
| Distributions from net realized gain | (.49) | (.41) | (.35) | (.36) | (.76) | (.55) |
| Total distributions | (.49) | (.55) | (.50) | (.52) | (.94) | (.69)B |
| Net asset value, end of period | $12.37 | $12.25 | $11.27 | $10.22 | $11.13 | $11.30 |
| Total ReturnC,D | 5.05% | 13.74% | 15.81% | (3.65)% | 7.10% | 15.20% |
| Ratios to Average Net AssetsE,F | | | | | | |
| Expenses before reductions | .75%G | .64% | - %H | - %H | - %H | - %H |
| Expenses net of fee waivers, if any | .75%G | .64% | -% | -% | -% | -% |
| Expenses net of all reductions | .75%G | .64% | -% | -% | -% | -% |
| Net investment income (loss) | .81%G | 1.03% | 1.47% | 1.53% | 1.62% | 1.35% |
| Supplemental Data | | | | | | |
| Net assets, end of period (000 omitted) | $512,070 | $466,677 | $357,398 | $320,449 | $303,017 | $282,594 |
| Portfolio turnover rateF | 27%G | 20% | 25% | 24% | 30% | 47% |
A Calculated based on average shares outstanding during the period.
B Total distributions of $.69 per share is comprised of distributions from net investment income of $.147 and distributions from net realized gain of $.546 per share.
C Total returns for periods of less than one year are not annualized.
D Total returns would have been lower if certain expenses had not been reduced during the applicable periods shown.
E Expense ratios reflect operating expenses of the class. Expenses before reductions do not reflect amounts reimbursed by the investment adviser or reductions from expense offset arrangements and do not represent the amount paid by the class during periods when reimbursements or reductions occur. Expenses net of fee waivers reflect expenses after reimbursement by the investment adviser but prior to reductions from expense offset arrangements. Expenses net of all reductions represent the net expenses paid by the class but do not include expenses of the underlying funds in which the Fund invests.
F Amounts do not include the activity of the Underlying Funds.
G Annualized
H Amount represents less than .005%.
See accompanying notes which are an integral part of the financial statements.
Fidelity Advisor Freedom 2050 Fund Class Z6
| | Six months ended (Unaudited) September 30, | Years endedMarch 31, |
| | 2018 | 2018 A |
| Selected Per–Share Data | | |
| Net asset value, beginning of period | $12.24 | $11.59 |
| Income from Investment Operations | | |
| Net investment income (loss)B | .06 | .23 |
| Net realized and unrealized gain (loss) | .57 | .83 |
| Total from investment operations | .63 | 1.06 |
| Distributions from net investment income | – | (.17) |
| Distributions from net realized gain | (.49) | (.24) |
| Total distributions | (.49) | (.41) |
| Net asset value, end of period | $12.38 | $12.24 |
| Total ReturnC,D | 5.22% | 9.15% |
| Ratios to Average Net AssetsE,F | | |
| Expenses before reductions | .49%G | .51%G,H |
| Expenses net of fee waivers, if any | .49%G | .51%G,H |
| Expenses net of all reductions | .49%G | .51%G,H |
| Net investment income (loss) | 1.06%G | 2.27%G |
| Supplemental Data | | |
| Net assets, end of period (000 omitted) | $15,193 | $5,410 |
| Portfolio turnover rateF | 27%G | 20% |
A For the period June 6, 2017 (commencement of sale of shares) to March 31, 2018.
B Calculated based on average shares outstanding during the period.
C Total returns for periods of less than one year are not annualized.
D Total returns would have been lower if certain expenses had not been reduced during the applicable periods shown.
E Expense ratios reflect operating expenses of the class. Expenses before reductions do not reflect amounts reimbursed by the investment adviser or reductions from expense offset arrangements and do not represent the amount paid by the class during periods when reimbursements or reductions occur. Expenses net of fee waivers reflect expenses after reimbursement by the investment adviser but prior to reductions from expense offset arrangements. Expenses net of all reductions represent the net expenses paid by the class but do not include expenses of the underlying funds in which the Fund invests.
F Amounts do not include the activity of the Underlying Funds.
G Annualized
H On certain classes, the size and fluctuation of net assets and expense amounts may cause ratios to differ from contractual rates.
See accompanying notes which are an integral part of the financial statements.
Fidelity Advisor Freedom® 2055 Fund
Investment Summary (Unaudited)
The information in the following tables is based on the direct investments of the Fund.
Top Holdings as of September 30, 2018
| | % of fund's net assets |
| Fidelity Series Large Cap Stock Fund | 12.3 |
| Fidelity Series International Growth Fund | 9.3 |
| Fidelity Series International Value Fund | 9.2 |
| Fidelity Series Emerging Markets Opportunities Fund | 8.6 |
| Fidelity Series Stock Selector Large Cap Value Fund | 7.8 |
| Fidelity Series Value Discovery Fund | 7.7 |
| Fidelity Advisor Series Equity Growth Fund | 7.0 |
| Fidelity Series Opportunistic Insights Fund | 6.5 |
| Fidelity Advisor Series Growth Opportunities Fund | 4.8 |
| Fidelity Series Small Cap Opportunities Fund | 4.2 |
| | 77.4 |
Asset Allocation (% of fund's net assets)
| Period end |
| | Domestic Equity Funds | 60.5% |
| | International Equity Funds | 30.8% |
| | Bond Funds | 6.8% |
| | Short-Term Funds | 1.9% |
| | Short-Term Investments | 0.1% |
| | Net Other Assets (Liabilities)* | (0.1)% |

* Net Other Assets (Liabilities) are not included in the pie chart
Domestic Equity Funds category includes Fidelity Series Commodity Strategy Fund which invests in commodity-related investments.
Fidelity Advisor Freedom® 2055 Fund
Schedule of Investments September 30, 2018 (Unaudited)
Showing Percentage of Net Assets
| U.S. Treasury Obligations - 0.1% | | | |
| | | Principal Amount | Value |
| U.S. Treasury Bills, yield at date of purchase 2.07% to 2.09% 11/23/18 to 11/29/18 (a) | | | |
| (Cost $398,663) | | 400,000 | 398,633 |
| | | Shares | Value |
|
| Domestic Equity Funds - 60.5% | | | |
| Fidelity Advisor Series Equity Growth Fund (b) | | 2,828,444 | $43,727,744 |
| Fidelity Advisor Series Growth Opportunities Fund (b) | | 1,773,103 | 29,504,429 |
| Fidelity Advisor Series Small Cap Fund (b) | | 1,606,291 | 20,191,075 |
| Fidelity Series All-Sector Equity Fund (b) | | 1,612,743 | 21,949,435 |
| Fidelity Series Commodity Strategy Fund (b) | | 2,615,040 | 13,075,201 |
| Fidelity Series Large Cap Stock Fund (b) | | 4,773,579 | 76,043,116 |
| Fidelity Series Large Cap Value Index Fund (b) | | 598,823 | 7,904,465 |
| Fidelity Series Opportunistic Insights Fund (b) | | 2,047,405 | 40,640,987 |
| Fidelity Series Small Cap Opportunities Fund (b) | | 1,766,852 | 25,955,055 |
| Fidelity Series Stock Selector Large Cap Value Fund (b) | | 3,676,161 | 48,598,854 |
| Fidelity Series Value Discovery Fund (b) | | 3,496,292 | 47,864,234 |
| TOTAL DOMESTIC EQUITY FUNDS | | | |
| (Cost $328,027,130) | | | 375,454,595 |
|
| International Equity Funds - 30.8% | | | |
| Fidelity Series Canada Fund (b) | | 514,750 | 5,564,449 |
| Fidelity Series Emerging Markets Fund (b) | | 400,700 | 3,882,779 |
| Fidelity Series Emerging Markets Opportunities Fund (b) | | 2,781,364 | 53,374,380 |
| Fidelity Series International Growth Fund (b) | | 3,507,997 | 57,531,157 |
| Fidelity Series International Small Cap Fund (b) | | 757,604 | 13,561,117 |
| Fidelity Series International Value Fund (b) | | 5,433,943 | 57,165,076 |
| TOTAL INTERNATIONAL EQUITY FUNDS | | | |
| (Cost $170,343,008) | | | 191,078,958 |
|
| Bond Funds - 6.8% | | | |
| Fidelity Series Emerging Markets Debt Fund (b) | | 380,409 | 3,625,302 |
| Fidelity Series Floating Rate High Income Fund (b) | | 144,630 | 1,376,882 |
| Fidelity Series High Income Fund (b) | | 845,208 | 8,122,447 |
| Fidelity Series Inflation-Protected Bond Index Fund (b) | | 192,828 | 1,872,358 |
| Fidelity Series International Credit Fund (b) | | 23,435 | 230,370 |
| Fidelity Series Investment Grade Bond Fund (b) | | 253,088 | 2,756,128 |
| Fidelity Series Long-Term Treasury Bond Index Fund (b) | | 2,620,888 | 21,596,118 |
| Fidelity Series Real Estate Income Fund (b) | | 248,404 | 2,677,791 |
| TOTAL BOND FUNDS | | | |
| (Cost $43,349,269) | | | 42,257,396 |
|
| Short-Term Funds - 1.9% | | | |
| Fidelity Cash Central Fund, 2.11% (c) | | 1,268,631 | 1,268,885 |
| Fidelity Series Government Money Market Fund 2.12% (b)(d) | | 8,668,157 | 8,668,157 |
| Fidelity Series Short-Term Credit Fund (b) | | 193,123 | 1,904,195 |
| TOTAL SHORT-TERM FUNDS | | | |
| (Cost $11,855,230) | | | 11,841,237 |
| TOTAL INVESTMENT IN SECURITIES - 100.1% | | | |
| (Cost $553,973,300) | | | 621,030,819 |
| NET OTHER ASSETS (LIABILITIES) - (0.1)% | | | (427,278) |
| NET ASSETS - 100% | | | $620,603,541 |
| Futures Contracts | | | | | |
| | Number of contracts | Expiration Date | Notional Amount | Value | Unrealized Appreciation/(Depreciation) |
| Purchased | | | | | |
| Equity Index Contracts | | | | | |
| CME E-mini S&P 500 Index Contracts (United States) | 23 | Dec. 2018 | $3,356,850 | $651 | $651 |
| ICE E-mini MSCI Emerging Markets Index Contracts (United States) | 29 | Dec. 2018 | 1,522,065 | 30,662 | 30,662 |
| | | | | | 31,313 |
| Sold | | | | | |
| Equity Index Contracts | | | | | |
| ICE E-mini MSCI EAFE Index Contracts (United States) | 14 | Dec. 2018 | 1,382,850 | (3,095) | (3,095) |
| TOTAL FUTURES CONTRACTS | | | | | $28,218 |
The notional amount of futures purchased as a percentage of Net Assets is 0.8%
The notional amount of futures sold as a percentage of Net Assets is 0.2%
Legend
(a) Security or a portion of the security was pledged to cover margin requirements for futures contracts. At period end, the value of securities pledged amounted to $264,088.
(b) Affiliated Fund
(c) Affiliated fund that is generally available only to investment companies and other accounts managed by Fidelity Investments. The rate quoted is the annualized seven-day yield of the fund at period end. A complete unaudited listing of the fund's holdings as of its most recent quarter end is available upon request. In addition, each Fidelity Central Fund's financial statements are available on the SEC's website or upon request.
(d) The rate quoted is the annualized seven-day yield of the fund at period end.
Affiliated Central Funds
Information regarding fiscal year to date income earned by the Fund from investments in Fidelity Central Funds is as follows:
| Fund | Income earned |
| Fidelity Cash Central Fund | $3,312 |
| Total | $3,312 |
Amounts in the income column in the above table include any capital gain distributions from underlying funds, which are presented in the corresponding line-item in the Statement of Operations if applicable.
Affiliated Underlying Funds
Fiscal year to date information regarding the Fund's investments in affiliated Underlying Funds, excluding any Money Market Central Funds, is presented below. Exchanges between classes of the same affiliated Underlying Funds may occur.
| Affiliate | Value, beginning of period | Purchases | Sales Proceeds | Dividend Income | Realized Gain (loss) | Change in Unrealized appreciation (depreciation) | Value, end of period |
| Fidelity Advisor Series Equity Growth Fund | $35,257,766 | $5,673,939 | $2,552,914 | $-- | $27,365 | $5,321,588 | $43,727,744 |
| Fidelity Advisor Series Equity Value Fund | 40,711,563 | 8,794,623 | 2,954,979 | 1,532,713 | (29,410) | (1,526,372) | -- |
| Fidelity Advisor Series Growth & Income Fund | 62,431,831 | 16,416,685 | 4,551,923 | 6,157,448 | (18,915) | (5,700,139) | -- |
| Fidelity Advisor Series Growth Opportunities Fund | 23,131,051 | 3,685,629 | 3,612,709 | -- | 184,974 | 6,115,484 | 29,504,429 |
| Fidelity Advisor Series Opportunistic Insights Fund | 32,751,801 | 8,132,560 | 2,378,126 | 2,940,841 | 3,433 | (6,223,305) | -- |
| Fidelity Advisor Series Small Cap Fund | 17,635,097 | 2,775,555 | 1,274,847 | -- | (2,665) | 1,057,935 | 20,191,075 |
| Fidelity Advisor Series Stock Selector Large Cap Value Fund | 41,106,481 | 10,891,588 | 2,948,553 | 3,870,324 | (26,490) | (856,706) | -- |
| Fidelity Series 100 Index Fund | 17,322,149 | -- | 18,596,135 | -- | 5,457,697 | (4,183,711) | -- |
| Fidelity Series All-Sector Equity Fund | 24,199,576 | 3,731,040 | 8,906,089 | -- | 85,913 | 2,838,995 | 21,949,435 |
| Fidelity Series Canada Fund | 4,795,728 | 806,349 | 344,215 | -- | (1,243) | 307,830 | 5,564,449 |
| Fidelity Series Commodity Strategy Fund | 11,380,188 | 3,563,579 | 814,815 | 775,141 | (2,208) | (1,051,543) | 13,075,201 |
| Fidelity Series Emerging Markets Debt Fund | 3,454,885 | 598,854 | 233,347 | 106,817 | (11,520) | (183,570) | 3,625,302 |
| Fidelity Series Emerging Markets Fund | -- | 3,887,052 | -- | -- | -- | (4,273) | 3,882,779 |
| Fidelity Series Emerging Markets Opportunities Fund | 49,716,265 | 16,743,332 | 6,489,655 | -- | (293,133) | (6,302,429) | 53,374,380 |
| Fidelity Series Floating Rate High Income Fund | 1,232,572 | 239,988 | 97,233 | 35,120 | (501) | 2,056 | 1,376,882 |
| Fidelity Series Government Money Market Fund 2.12% | 8,792,437 | 8,986,486 | 9,110,766 | 74,905 | -- | -- | 8,668,157 |
| Fidelity Series High Income Fund | 7,612,274 | 1,281,935 | 837,192 | 228,848 | (8,027) | 73,457 | 8,122,447 |
| Fidelity Series Inflation-Protected Bond Index Fund | 4,372,056 | 1,075,001 | 3,595,642 | 6,866 | (47,656) | 68,599 | 1,872,358 |
| Fidelity Series International Credit Fund | 229,849 | 2,833 | -- | 2,833 | -- | (2,312) | 230,370 |
| Fidelity Series International Growth Fund | 48,270,376 | 11,939,972 | 3,483,903 | -- | (5,375) | 810,087 | 57,531,157 |
| Fidelity Series International Small Cap Fund | 12,042,724 | 2,898,075 | 882,170 | -- | (15,086) | (482,426) | 13,561,117 |
| Fidelity Series International Value Fund | 48,858,175 | 11,892,966 | 3,483,904 | -- | (109,509) | 7,348 | 57,165,076 |
| Fidelity Series Investment Grade Bond Fund | 2,594,775 | 537,311 | 345,265 | 37,887 | (3,555) | (27,138) | 2,756,128 |
| Fidelity Series Large Cap Stock Fund | -- | 483,771 | 3,981 | -- | 9 | 6,985,778 | 76,043,116 |
| Fidelity Series Large Cap Value Index Fund | 6,806,286 | 1,090,274 | 501,342 | -- | (3,153) | 512,400 | 7,904,465 |
| Fidelity Series Long-Term Treasury Bond Index Fund | 12,223,528 | 15,504,720 | 5,442,783 | 264,962 | (161,226) | (528,121) | 21,596,118 |
| Fidelity Series Opportunistic Insights Fund | -- | 260,165 | 2,131 | -- | (162) | 8,096,752 | 40,640,987 |
| Fidelity Series Real Estate Equity Fund | 4,170,084 | 90,949 | 4,430,923 | 21,233 | (113,492) | 283,382 | -- |
| Fidelity Series Real Estate Income Fund | 2,352,341 | 494,540 | 182,786 | 109,384 | (2,072) | 15,768 | 2,677,791 |
| Fidelity Series Short-Term Credit Fund | 1,606,596 | 432,304 | 134,821 | 19,746 | (1,016) | 1,132 | 1,904,195 |
| Fidelity Series Small Cap Opportunities Fund | 21,522,309 | 5,397,564 | 1,566,865 | 1,984,601 | 9,196 | 592,851 | 25,955,055 |
| Fidelity Series Stock Selector Large Cap Value Fund | -- | 506,297 | 13,197 | -- | (762) | (59,804) | 48,598,854 |
| Fidelity Series Value Discovery Fund | -- | 310,858 | 2,556 | -- | (52) | 2,560,559 | 47,864,234 |
| | $546,580,763 | $149,126,794 | $89,775,767 | $18,169,669 | $4,911,359 | $8,520,152 | $619,363,301 |
Amounts in the income column in the above table include any capital gain distributions from underlying funds, which are presented in the corresponding line-item in the Statement of Operations if applicable.
Investment Valuation
The following is a summary of the inputs used, as of September 30, 2018, involving the Fund's assets and liabilities carried at fair value. The inputs or methodology used for valuing securities may not be an indication of the risk associated with investing in those securities. For more information on valuation inputs, and their aggregation into the levels used below, please refer to the Investment Valuation section in the accompanying Notes to Financial Statements.
| | Valuation Inputs at Reporting Date: |
| Description | Total | Level 1 | Level 2 | Level 3 |
| Investments in Securities: | | | | |
| Other Short-Term Investments | $398,633 | $-- | $398,633 | $-- |
| Domestic Equity Funds | 375,454,595 | 375,454,595 | -- | -- |
| International Equity Funds | 191,078,958 | 191,078,958 | -- | -- |
| Bond Funds | 42,257,396 | 42,257,396 | -- | -- |
| Short-Term Funds | 11,841,237 | 11,841,237 | -- | -- |
| Total Investments in Securities: | $621,030,819 | $620,632,186 | $398,633 | $-- |
| Derivative Instruments: | | | | |
| Assets | | | | |
| Futures Contracts | $31,313 | $31,313 | $-- | $-- |
| Total Assets | $31,313 | $31,313 | $-- | $-- |
| Liabilities | | | | |
| Futures Contracts | $(3,095) | $(3,095) | $-- | $-- |
| Total Liabilities | $(3,095) | $(3,095) | $-- | $-- |
| Total Derivative Instruments: | $28,218 | $28,218 | $-- | $-- |
Value of Derivative Instruments
The following table is a summary of the Fund's value of derivative instruments by primary risk exposure as of September 30, 2018. For additional information on derivative instruments, please refer to the Derivative Instruments section in the accompanying Notes to Financial Statements.
| Primary Risk Exposure / Derivative Type | Value |
| | Asset | Liability |
| Equity Risk | | |
| Futures Contracts(a) | $31,313 | $(3,095) |
| Total Equity Risk | 31,313 | (3,095) |
| Total Value of Derivatives | $31,313 | $(3,095) |
(a) Reflects gross cumulative appreciation (depreciation) on futures contracts as presented in the Schedule of Investments. In the Statement of Assets and Liabilities, the period end daily variation margin is included in receivable or payable for daily variation margin on futures contracts, and the net cumulative appreciation (depreciation) is included in net unrealized appreciation (depreciation).
See accompanying notes which are an integral part of the financial statements.
Fidelity Advisor Freedom® 2055 Fund
Financial Statements
Statement of Assets and Liabilities
| | | September 30, 2018 (Unaudited) |
| Assets | | |
Investment in securities, at value — See accompanying schedule:
Unaffiliated issuers (cost $398,663) | $398,633 | |
| Fidelity Central Funds (cost $1,268,885) | 1,268,885 | |
| Other affiliated issuers (cost $552,305,752) | 619,363,301 | |
| Total Investment in Securities (cost $553,973,300) | | $621,030,819 |
| Cash | | 43,463 |
| Receivable for investments sold | | 7,134,844 |
| Receivable for fund shares sold | | 1,967,107 |
| Distributions receivable from Fidelity Central Funds | | 1,947 |
| Total assets | | 630,178,180 |
| Liabilities | | |
| Payable for investments purchased | $8,749,393 | |
| Payable for fund shares redeemed | 337,048 | |
| Accrued management fee | 378,482 | |
| Distribution and service plan fees payable | 86,284 | |
| Payable for daily variation margin on futures contracts | 23,432 | |
| Total liabilities | | 9,574,639 |
| Net Assets | | $620,603,541 |
| Net Assets consist of: | | |
| Paid in capital | | $535,690,935 |
| Undistributed net investment income | | 1,493,957 |
| Accumulated undistributed net realized gain (loss) on investments | | 16,332,912 |
| Net unrealized appreciation (depreciation) on investments | | 67,085,737 |
| Net Assets | | $620,603,541 |
| Calculation of Maximum Offering Price | | |
| Class A: | | |
| Net Asset Value and redemption price per share ($210,307,449 ÷ 15,539,155 shares) | | $13.53 |
| Maximum offering price per share (100/94.25 of $13.53) | | $14.36 |
| Class M: | | |
| Net Asset Value and redemption price per share ($81,488,450 ÷ 6,058,237 shares) | | $13.45 |
| Maximum offering price per share (100/96.50 of $13.45) | | $13.94 |
| Class C: | | |
| Net Asset Value and offering price per share ($11,503,687 ÷ 861,033 shares)(a) | | $13.36 |
| Class I: | | |
| Net Asset Value, offering price and redemption price per share ($308,853,712 ÷ 22,700,966 shares) | | $13.61 |
| Class Z6: | | |
| Net Asset Value, offering price and redemption price per share ($8,450,243 ÷ 620,759 shares) | | $13.61 |
(a) Redemption price per share is equal to net asset value less any applicable contingent deferred sales charge.
See accompanying notes which are an integral part of the financial statements.
Statement of Operations
| | | Six months ended September 30, 2018 (Unaudited) |
| Investment Income | | |
| Dividends: | | |
| Affiliated issuers | | $4,646,931 |
| Interest | | 2,520 |
| Income from Fidelity Central Funds | | 3,312 |
| Total income | | 4,652,763 |
| Expenses | | |
| Management fee | $2,192,734 | |
| Distribution and service plan fees | 512,882 | |
| Independent trustees' fees and expenses | 1,392 | |
| Total expenses before reductions | 2,707,008 | |
| Expense reductions | (2) | |
| Total expenses after reductions | | 2,707,006 |
| Net investment income (loss) | | 1,945,757 |
| Realized and Unrealized Gain (Loss) | | |
| Net realized gain (loss) on: | | |
| Investment securities: | | |
| Fidelity Central Funds | 2 | |
| Other affiliated issuers | 4,911,359 | |
| Futures contracts | (217,834) | |
| Capital gain distributions from underlying funds: | | |
| Affiliated issuers | 13,522,738 | |
| Total net realized gain (loss) | | 18,216,265 |
| Change in net unrealized appreciation (depreciation) on: | | |
| Investment securities: | | |
| Unaffiliated issuers | (30) | |
| Affiliated issuers | 8,520,152 | |
| Futures contracts | 28,218 | |
| Total change in net unrealized appreciation (depreciation) | | 8,548,340 |
| Net gain (loss) | | 26,764,605 |
| Net increase (decrease) in net assets resulting from operations | | $28,710,362 |
See accompanying notes which are an integral part of the financial statements.
Statement of Changes in Net Assets
| | Six months ended September 30, 2018 (Unaudited) | Year ended March 31, 2018 |
| Increase (Decrease) in Net Assets | | |
| Operations | | |
| Net investment income (loss) | $1,945,757 | $4,172,517 |
| Net realized gain (loss) | 18,216,265 | 28,526,248 |
| Change in net unrealized appreciation (depreciation) | 8,548,340 | 24,677,049 |
| Net increase (decrease) in net assets resulting from operations | 28,710,362 | 57,375,814 |
| Distributions to shareholders from net investment income | – | (5,050,072) |
| Distributions to shareholders from net realized gain | (20,742,895) | (11,461,480) |
| Total distributions | (20,742,895) | (16,511,552) |
| Share transactions - net increase (decrease) | 66,477,792 | 102,640,679 |
| Total increase (decrease) in net assets | 74,445,259 | 143,504,941 |
| Net Assets | | |
| Beginning of period | 546,158,282 | 402,653,341 |
| End of period | $620,603,541 | $546,158,282 |
| Other Information | | |
| Undistributed net investment income end of period | $1,493,957 | $– |
| Distributions in excess of net investment income end of period | $– | $(451,800) |
See accompanying notes which are an integral part of the financial statements.
Financial Highlights
Fidelity Advisor Freedom 2055 Fund Class A
| | Six months ended (Unaudited) September 30, | Years endedMarch 31, | | | | |
| | 2018 | 2018 | 2017 | 2016 | 2015 | 2014 |
| Selected Per–Share Data | | | | | | |
| Net asset value, beginning of period | $13.37 | $12.19 | $11.02 | $11.92 | $11.71 | $10.56 |
| Income from Investment Operations | | | | | | |
| Net investment income (loss)A | .04 | .11 | .14 | .15 | .16 | .12 |
| Net realized and unrealized gain (loss) | .61 | 1.51 | 1.51 | (.59) | .62 | 1.49 |
| Total from investment operations | .65 | 1.62 | 1.65 | (.44) | .78 | 1.61 |
| Distributions from net investment income | – | (.13) | (.14) | (.14) | (.15) | (.11) |
| Distributions from net realized gain | (.49) | (.32) | (.34) | (.31) | (.42) | (.36) |
| Total distributions | (.49) | (.44)B | (.48) | (.46)C | (.57) | (.46)D |
| Net asset value, end of period | $13.53 | $13.37 | $12.19 | $11.02 | $11.92 | $11.71 |
| Total ReturnE,F,G | 4.96% | 13.40% | 15.49% | (3.89)% | 6.85% | 15.45% |
| Ratios to Average Net AssetsH,I | | | | | | |
| Expenses before reductions | 1.00%J | .88% | .25% | .25% | .25% | .25% |
| Expenses net of fee waivers, if any | 1.00%J | .88% | .25% | .25% | .25% | .25% |
| Expenses net of all reductions | 1.00%J | .88% | .25% | .25% | .25% | .25% |
| Net investment income (loss) | .58%J | .81% | 1.24% | 1.31% | 1.39% | 1.11% |
| Supplemental Data | | | | | | |
| Net assets, end of period (000 omitted) | $210,307 | $209,824 | $170,352 | $130,309 | $115,666 | $81,217 |
| Portfolio turnover rateI | 30%J | 18% | 24% | 24% | 29% | 43% |
A Calculated based on average shares outstanding during the period.
B Total distributions of $.44 per share is comprised of distributions from net investment income of $.125 and distributions from net realized gain of $.317 per share.
C Total distributions of $.46 per share is comprised of distributions from net investment income of $.141 and distributions from net realized gain of $.314 per share.
D Total distributions of $.46 per share is comprised of distributions from net investment income of $.106 and distributions from net realized gain of $.355 per share.
E Total returns for periods of less than one year are not annualized.
F Total returns would have been lower if certain expenses had not been reduced during the applicable periods shown.
G Total returns do not include the effect of the sales charges.
H Expense ratios reflect operating expenses of the class. Expenses before reductions do not reflect amounts reimbursed by the investment adviser or reductions from expense offset arrangements and do not represent the amount paid by the class during periods when reimbursements or reductions occur. Expenses net of fee waivers reflect expenses after reimbursement by the investment adviser but prior to reductions from expense offset arrangements. Expenses net of all reductions represent the net expenses paid by the class but do not include expenses of the underlying funds in which the Fund invests.
I Amounts do not include the activity of the Underlying Funds.
J Annualized
See accompanying notes which are an integral part of the financial statements.
Fidelity Advisor Freedom 2055 Fund Class M
| | Six months ended (Unaudited) September 30, | Years endedMarch 31, | | | | |
| | 2018 | 2018 | 2017 | 2016 | 2015 | 2014 |
| Selected Per–Share Data | | | | | | |
| Net asset value, beginning of period | $13.31 | $12.14 | $10.98 | $11.88 | $11.68 | $10.55 |
| Income from Investment Operations | | | | | | |
| Net investment income (loss)A | .02 | .07 | .11 | .12 | .13 | .10 |
| Net realized and unrealized gain (loss) | .61 | 1.52 | 1.51 | (.59) | .62 | 1.47 |
| Total from investment operations | .63 | 1.59 | 1.62 | (.47) | .75 | 1.57 |
| Distributions from net investment income | – | (.11) | (.12) | (.12) | (.13) | (.09) |
| Distributions from net realized gain | (.49) | (.31) | (.34) | (.31) | (.42) | (.36) |
| Total distributions | (.49) | (.42) | (.46) | (.43) | (.55) | (.44)B |
| Net asset value, end of period | $13.45 | $13.31 | $12.14 | $10.98 | $11.88 | $11.68 |
| Total ReturnC,D,E | 4.83% | 13.15% | 15.27% | (4.11)% | 6.55% | 15.07% |
| Ratios to Average Net AssetsF,G | | | | | | |
| Expenses before reductions | 1.25%H | 1.14% | .50% | .50% | .50% | .50% |
| Expenses net of fee waivers, if any | 1.25%H | 1.14% | .50% | .50% | .50% | .50% |
| Expenses net of all reductions | 1.25%H | 1.14% | .50% | .50% | .50% | .50% |
| Net investment income (loss) | .33%H | .56% | .99% | 1.06% | 1.14% | .86% |
| Supplemental Data | | | | | | |
| Net assets, end of period (000 omitted) | $81,488 | $73,101 | $58,052 | $41,956 | $33,436 | $19,134 |
| Portfolio turnover rateG | 30%H | 18% | 24% | 24% | 29% | 43% |
A Calculated based on average shares outstanding during the period.
B Total distributions of $.44 per share is comprised of distributions from net investment income of $.086 and distributions from net realized gain of $.355 per share.
C Total returns for periods of less than one year are not annualized.
D Total returns would have been lower if certain expenses had not been reduced during the applicable periods shown.
E Total returns do not include the effect of the sales charges.
F Expense ratios reflect operating expenses of the class. Expenses before reductions do not reflect amounts reimbursed by the investment adviser or reductions from expense offset arrangements and do not represent the amount paid by the class during periods when reimbursements or reductions occur. Expenses net of fee waivers reflect expenses after reimbursement by the investment adviser but prior to reductions from expense offset arrangements. Expenses net of all reductions represent the net expenses paid by the class but do not include expenses of the underlying funds in which the Fund invests.
G Amounts do not include the activity of the Underlying Funds.
H Annualized
See accompanying notes which are an integral part of the financial statements.
Fidelity Advisor Freedom 2055 Fund Class C
| | Six months ended (Unaudited) September 30, | Years endedMarch 31, | | | | |
| | 2018 | 2018 | 2017 | 2016 | 2015 | 2014 |
| Selected Per–Share Data | | | | | | |
| Net asset value, beginning of period | $13.26 | $12.11 | $10.98 | $11.88 | $11.69 | $10.57 |
| Income from Investment Operations | | | | | | |
| Net investment income (loss)A | (.01) | .01 | .06 | .06 | .08 | .04 |
| Net realized and unrealized gain (loss) | .60 | 1.51 | 1.49 | (.58) | .61 | 1.47 |
| Total from investment operations | .59 | 1.52 | 1.55 | (.52) | .69 | 1.51 |
| Distributions from net investment income | – | (.06) | (.08) | (.08) | (.09) | (.05) |
| Distributions from net realized gain | (.49) | (.31) | (.34) | (.30) | (.41) | (.35) |
| Total distributions | (.49) | (.37) | (.42) | (.38) | (.50) | (.39)B |
| Net asset value, end of period | $13.36 | $13.26 | $12.11 | $10.98 | $11.88 | $11.69 |
| Total ReturnC,D,E | 4.55% | 12.62% | 14.62% | (4.53)% | 6.01% | 14.46% |
| Ratios to Average Net AssetsF,G | | | | | | |
| Expenses before reductions | 1.75%H | 1.64% | 1.00% | 1.00% | 1.00% | 1.00% |
| Expenses net of fee waivers, if any | 1.75%H | 1.64% | 1.00% | 1.00% | 1.00% | 1.00% |
| Expenses net of all reductions | 1.75%H | 1.64% | 1.00% | 1.00% | 1.00% | 1.00% |
| Net investment income (loss) | (.17)%H | .05% | .49% | .56% | .65% | .36% |
| Supplemental Data | | | | | | |
| Net assets, end of period (000 omitted) | $11,504 | $10,685 | $8,529 | $5,671 | $4,180 | $2,491 |
| Portfolio turnover rateG | 30%H | 18% | 24% | 24% | 29% | 43% |
A Calculated based on average shares outstanding during the period.
B Total distributions of $.39 per share is comprised of distributions from net investment income of $.048 and distributions from net realized gain of $.345 per share.
C Total returns for periods of less than one year are not annualized.
D Total returns would have been lower if certain expenses had not been reduced during the applicable periods shown.
E Total returns do not include the effect of the contingent deferred sales charge.
F Expense ratios reflect operating expenses of the class. Expenses before reductions do not reflect amounts reimbursed by the investment adviser or reductions from expense offset arrangements and do not represent the amount paid by the class during periods when reimbursements or reductions occur. Expenses net of fee waivers reflect expenses after reimbursement by the investment adviser but prior to reductions from expense offset arrangements. Expenses net of all reductions represent the net expenses paid by the class but do not include expenses of the underlying funds in which the Fund invests.
G Amounts do not include the activity of the Underlying Funds.
H Annualized
See accompanying notes which are an integral part of the financial statements.
Fidelity Advisor Freedom 2055 Fund Class I
| | Six months ended (Unaudited) September 30, | Years endedMarch 31, | | | | |
| | 2018 | 2018 | 2017 | 2016 | 2015 | 2014 |
| Selected Per–Share Data | | | | | | |
| Net asset value, beginning of period | $13.43 | $12.24 | $11.06 | $11.96 | $11.74 | $10.59 |
| Income from Investment Operations | | | | | | |
| Net investment income (loss)A | .06 | .14 | .17 | .18 | .19 | .15 |
| Net realized and unrealized gain (loss) | .61 | 1.53 | 1.51 | (.60) | .63 | 1.48 |
| Total from investment operations | .67 | 1.67 | 1.68 | (.42) | .82 | 1.63 |
| Distributions from net investment income | – | (.16) | (.16) | (.17) | (.18) | (.13) |
| Distributions from net realized gain | (.49) | (.32) | (.34) | (.31) | (.42) | (.36) |
| Total distributions | (.49) | (.48) | (.50) | (.48) | (.60) | (.48)B |
| Net asset value, end of period | $13.61 | $13.43 | $12.24 | $11.06 | $11.96 | $11.74 |
| Total ReturnC,D | 5.10% | 13.74% | 15.81% | (3.64)% | 7.15% | 15.61% |
| Ratios to Average Net AssetsE,F | | | | | | |
| Expenses before reductions | .75%G | .64% | - %H | - %H | - %H | - %H |
| Expenses net of fee waivers, if any | .75%G | .64% | -% | -% | -% | -% |
| Expenses net of all reductions | .75%G | .64% | -% | -% | -% | -% |
| Net investment income (loss) | .83%G | 1.05% | 1.49% | 1.56% | 1.64% | 1.36% |
| Supplemental Data | | | | | | |
| Net assets, end of period (000 omitted) | $308,854 | $249,432 | $165,720 | $119,597 | $87,769 | $54,490 |
| Portfolio turnover rateF | 30%G | 18% | 24% | 24% | 29% | 43% |
A Calculated based on average shares outstanding during the period.
B Total distributions of $.48 per share is comprised of distributions from net investment income of $.127 and distributions from net realized gain of $.355 per share.
C Total returns for periods of less than one year are not annualized.
D Total returns would have been lower if certain expenses had not been reduced during the applicable periods shown.
E Expense ratios reflect operating expenses of the class. Expenses before reductions do not reflect amounts reimbursed by the investment adviser or reductions from expense offset arrangements and do not represent the amount paid by the class during periods when reimbursements or reductions occur. Expenses net of fee waivers reflect expenses after reimbursement by the investment adviser but prior to reductions from expense offset arrangements. Expenses net of all reductions represent the net expenses paid by the class but do not include expenses of the underlying funds in which the Fund invests.
F Amounts do not include the activity of the Underlying Funds.
G Annualized
H Amount represents less than .005%.
See accompanying notes which are an integral part of the financial statements.
Fidelity Advisor Freedom 2055 Fund Class Z6
| | Six months ended (Unaudited) September 30, | Years endedMarch 31, |
| | 2018 | 2018 A |
| Selected Per–Share Data | | |
| Net asset value, beginning of period | $13.42 | $12.63 |
| Income from Investment Operations | | |
| Net investment income (loss)B | .07 | .47 |
| Net realized and unrealized gain (loss) | .61 | .69 |
| Total from investment operations | .68 | 1.16 |
| Distributions from net investment income | – | (.19) |
| Distributions from net realized gain | (.49) | (.18) |
| Total distributions | (.49) | (.37) |
| Net asset value, end of period | $13.61 | $13.42 |
| Total ReturnC,D | 5.18% | 9.16% |
| Ratios to Average Net AssetsE,F | | |
| Expenses before reductions | .49%G | .50%G,H |
| Expenses net of fee waivers, if any | .49%G | .50%G,H |
| Expenses net of all reductions | .49%G | .50%G,H |
| Net investment income (loss) | 1.08%G | 4.26%G |
| Supplemental Data | | |
| Net assets, end of period (000 omitted) | $8,450 | $3,116 |
| Portfolio turnover rateF | 30%G | 18% |
A For the period June 6, 2017 (commencement of sale of shares) to March 31, 2018.
B Calculated based on average shares outstanding during the period.
C Total returns for periods of less than one year are not annualized.
D Total returns would have been lower if certain expenses had not been reduced during the applicable periods shown.
E Expense ratios reflect operating expenses of the class. Expenses before reductions do not reflect amounts reimbursed by the investment adviser or reductions from expense offset arrangements and do not represent the amount paid by the class during periods when reimbursements or reductions occur. Expenses net of fee waivers reflect expenses after reimbursement by the investment adviser but prior to reductions from expense offset arrangements. Expenses net of all reductions represent the net expenses paid by the class but do not include expenses of the underlying funds in which the Fund invests.
F Amounts do not include the activity of the Underlying Funds.
G Annualized
H On certain classes, the size and fluctuation of net assets and expense amounts may cause ratios to differ from contractual rates.
See accompanying notes which are an integral part of the financial statements.
Fidelity Advisor Freedom® 2060 Fund
Investment Summary (Unaudited)
The information in the following tables is based on the direct investments of the Fund.
Top Holdings as of September 30, 2018
| | % of fund's net assets |
| Fidelity Series Large Cap Stock Fund | 12.2 |
| Fidelity Series International Growth Fund | 9.3 |
| Fidelity Series International Value Fund | 9.2 |
| Fidelity Series Emerging Markets Opportunities Fund | 8.6 |
| Fidelity Series Stock Selector Large Cap Value Fund | 7.8 |
| Fidelity Series Value Discovery Fund | 7.7 |
| Fidelity Advisor Series Equity Growth Fund | 7.0 |
| Fidelity Series Opportunistic Insights Fund | 6.5 |
| Fidelity Advisor Series Growth Opportunities Fund | 4.8 |
| Fidelity Series Small Cap Opportunities Fund | 4.2 |
| | 77.3 |
Asset Allocation (% of fund's net assets)
| Period end |
| | Domestic Equity Funds | 60.5% |
| | International Equity Funds | 30.8% |
| | Bond Funds | 6.8% |
| | Short-Term Funds | 1.9% |
| | Short-Term Investments | 0.1% |
| | Net Other Assets (Liabilities)* | (0.1)% |

* Net Other Assets (Liabilities) are not included in the pie chart
Domestic Equity Funds category includes Fidelity Series Commodity Strategy Fund which invests in commodity-related investments.
Fidelity Advisor Freedom® 2060 Fund
Schedule of Investments September 30, 2018 (Unaudited)
Showing Percentage of Net Assets
| U.S. Treasury Obligations - 0.1% | | | |
| | | Principal Amount | Value |
| U.S. Treasury Bills, yield at date of purchase 2.07% to 2.09% 11/23/18 to 11/29/18 (a) | | | |
| (Cost $89,701) | | 90,000 | 89,695 |
| | | Shares | Value |
|
| Domestic Equity Funds - 60.5% | | | |
| Fidelity Advisor Series Equity Growth Fund (b) | | 586,688 | $9,070,193 |
| Fidelity Advisor Series Growth Opportunities Fund (b) | | 367,926 | 6,122,290 |
| Fidelity Advisor Series Small Cap Fund (b) | | 334,785 | 4,208,247 |
| Fidelity Series All-Sector Equity Fund (b) | | 335,985 | 4,572,761 |
| Fidelity Series Commodity Strategy Fund (b) | | 541,488 | 2,707,439 |
| Fidelity Series Large Cap Stock Fund (b) | | 990,361 | 15,776,445 |
| Fidelity Series Large Cap Value Index Fund (b) | | 125,604 | 1,657,976 |
| Fidelity Series Opportunistic Insights Fund (b) | | 424,641 | 8,429,122 |
| Fidelity Series Small Cap Opportunities Fund (b) | | 366,518 | 5,384,152 |
| Fidelity Series Stock Selector Large Cap Value Fund (b) | | 762,844 | 10,084,798 |
| Fidelity Series Value Discovery Fund (b) | | 725,590 | 9,933,325 |
| TOTAL DOMESTIC EQUITY FUNDS | | | |
| (Cost $72,445,463) | | | 77,946,748 |
|
| International Equity Funds - 30.8% | | | |
| Fidelity Series Canada Fund (b) | | 106,877 | 1,155,342 |
| Fidelity Series Emerging Markets Fund (b) | | 83,753 | 811,570 |
| Fidelity Series Emerging Markets Opportunities Fund (b) | | 577,403 | 11,080,356 |
| Fidelity Series International Growth Fund (b) | | 728,343 | 11,944,823 |
| Fidelity Series International Small Cap Fund (b) | | 157,421 | 2,817,832 |
| Fidelity Series International Value Fund (b) | | 1,128,233 | 11,869,008 |
| TOTAL INTERNATIONAL EQUITY FUNDS | | | |
| (Cost $37,314,098) | | | 39,678,931 |
|
| Bond Funds - 6.8% | | | |
| Fidelity Series Emerging Markets Debt Fund (b) | | 76,517 | 729,211 |
| Fidelity Series Floating Rate High Income Fund (b) | | 31,843 | 303,142 |
| Fidelity Series High Income Fund (b) | | 176,190 | 1,693,187 |
| Fidelity Series Inflation-Protected Bond Index Fund (b) | | 40,034 | 388,729 |
| Fidelity Series International Credit Fund (b) | | 3,119 | 30,657 |
| Fidelity Series Investment Grade Bond Fund (b) | | 52,551 | 572,284 |
| Fidelity Series Long-Term Treasury Bond Index Fund (b) | | 543,456 | 4,478,075 |
| Fidelity Series Real Estate Income Fund (b) | | 53,004 | 571,381 |
| TOTAL BOND FUNDS | | | |
| (Cost $8,928,677) | | | 8,766,666 |
|
| Short-Term Funds - 1.9% | | | |
| Fidelity Cash Central Fund, 2.11% (c) | | 221,452 | 221,497 |
| Fidelity Series Government Money Market Fund 2.12% (b)(d) | | 1,801,252 | 1,801,252 |
| Fidelity Series Short-Term Credit Fund (b) | | 40,481 | 399,145 |
| TOTAL SHORT-TERM FUNDS | | | |
| (Cost $2,424,346) | | | 2,421,894 |
| TOTAL INVESTMENT IN SECURITIES - 100.1% | | | |
| (Cost $121,202,285) | | | 128,903,934 |
| NET OTHER ASSETS (LIABILITIES) - (0.1)% | | | (68,430) |
| NET ASSETS - 100% | | | $128,835,504 |
| Futures Contracts | | | | | |
| | Number of contracts | Expiration Date | Notional Amount | Value | Unrealized Appreciation/(Depreciation) |
| Purchased | | | | | |
| Equity Index Contracts | | | | | |
| CME E-mini S&P 500 Index Contracts (United States) | 4 | Dec. 2018 | $583,800 | $113 | $113 |
| ICE E-mini MSCI Emerging Markets Index Contracts (United States) | 7 | Dec. 2018 | 367,395 | 7,311 | 7,311 |
| | | | | | 7,424 |
| Sold | | | | | |
| Equity Index Contracts | | | | | |
| ICE E-mini MSCI EAFE Index Contracts (United States) | 2 | Dec. 2018 | 197,550 | (202) | (202) |
| TOTAL FUTURES CONTRACTS | | | | | $7,222 |
The notional amount of futures purchased as a percentage of Net Assets is 0.7%
The notional amount of futures sold as a percentage of Net Assets is 0.2%
Legend
(a) Security or a portion of the security was pledged to cover margin requirements for futures contracts. At period end, the value of securities pledged amounted to $89,695.
(b) Affiliated Fund
(c) Affiliated fund that is generally available only to investment companies and other accounts managed by Fidelity Investments. The rate quoted is the annualized seven-day yield of the fund at period end. A complete unaudited listing of the fund's holdings as of its most recent quarter end is available upon request. In addition, each Fidelity Central Fund's financial statements are available on the SEC's website or upon request.
(d) The rate quoted is the annualized seven-day yield of the fund at period end.
Affiliated Central Funds
Information regarding fiscal year to date income earned by the Fund from investments in Fidelity Central Funds is as follows:
| Fund | Income earned |
| Fidelity Cash Central Fund | $564 |
| Total | $564 |
Amounts in the income column in the above table include any capital gain distributions from underlying funds, which are presented in the corresponding line-item in the Statement of Operations if applicable.
Affiliated Underlying Funds
Fiscal year to date information regarding the Fund's investments in affiliated Underlying Funds, excluding any Money Market Central Funds, is presented below. Exchanges between classes of the same affiliated Underlying Funds may occur.
| Affiliate | Value, beginning of period | Purchases | Sales Proceeds | Dividend Income | Realized Gain (loss) | Change in Unrealized appreciation (depreciation) | Value, end of period |
| Fidelity Advisor Series Equity Growth Fund | $6,288,635 | $2,206,223 | $446,808 | $-- | $2,256 | $1,019,887 | $9,070,193 |
| Fidelity Advisor Series Equity Value Fund | 7,280,061 | 2,863,215 | 506,547 | 315,375 | (6,329) | 30,552 | -- |
| Fidelity Advisor Series Growth & Income Fund | 11,166,059 | 4,992,960 | 775,814 | 1,232,411 | (8,249) | (462,261) | -- |
| Fidelity Advisor Series Growth Opportunities Fund | 4,124,065 | 1,448,488 | 656,216 | -- | 11,431 | 1,194,522 | 6,122,290 |
| Fidelity Advisor Series Opportunistic Insights Fund | 5,834,760 | 2,587,956 | 411,083 | 604,806 | (1,541) | (483,852) | -- |
| Fidelity Advisor Series Small Cap Fund | 3,146,914 | 1,083,172 | 218,027 | -- | 128 | 196,060 | 4,208,247 |
| Fidelity Advisor Series Stock Selector Large Cap Value Fund | 7,352,294 | 3,217,852 | 506,995 | 790,396 | (7,650) | 80,511 | -- |
| Fidelity Series 100 Index Fund | 3,048,825 | -- | 3,273,763 | -- | 568,572 | (343,634) | -- |
| Fidelity Series All-Sector Equity Fund | 4,321,439 | 1,455,852 | 1,768,067 | -- | 3,874 | 559,663 | 4,572,761 |
| Fidelity Series Canada Fund | 856,840 | 299,526 | 58,514 | -- | (418) | 57,908 | 1,155,342 |
| Fidelity Series Commodity Strategy Fund | 2,033,402 | 1,021,578 | 135,360 | 158,317 | (4,006) | (208,175) | 2,707,439 |
| Fidelity Series Emerging Markets Debt Fund | 582,422 | 220,386 | 39,360 | 19,825 | (2,307) | (31,930) | 729,211 |
| Fidelity Series Emerging Markets Fund | -- | 812,093 | -- | -- | -- | (523) | 811,570 |
| Fidelity Series Emerging Markets Opportunities Fund | 8,861,174 | 4,576,915 | 1,107,121 | -- | (74,022) | (1,176,590) | 11,080,356 |
| Fidelity Series Floating Rate High Income Fund | 232,073 | 87,089 | 16,401 | 7,171 | (177) | 558 | 303,142 |
| Fidelity Series Government Money Market Fund 2.12% | 1,561,672 | 2,198,795 | 1,959,215 | 14,278 | -- | -- | 1,801,252 |
| Fidelity Series High Income Fund | 1,351,010 | 457,047 | 127,616 | 44,166 | (222) | 12,968 | 1,693,187 |
| Fidelity Series Inflation-Protected Bond Index Fund | 790,717 | 312,709 | 718,437 | 1,334 | (8,182) | 11,922 | 388,729 |
| Fidelity Series International Credit Fund | 30,588 | 377 | -- | 377 | -- | (308) | 30,657 |
| Fidelity Series International Growth Fund | 8,611,222 | 3,764,896 | 586,906 | -- | (4,978) | 160,589 | 11,944,823 |
| Fidelity Series International Small Cap Fund | 2,147,956 | 917,282 | 152,569 | -- | (4,760) | (90,077) | 2,817,832 |
| Fidelity Series International Value Fund | 8,722,314 | 3,741,094 | 586,906 | -- | (27,911) | 20,417 | 11,869,008 |
| Fidelity Series Investment Grade Bond Fund | 462,499 | 235,670 | 120,176 | 7,648 | (1,540) | (4,169) | 572,284 |
| Fidelity Series Large Cap Stock Fund | -- | 196,365 | -- | -- | -- | 667,385 | 15,776,445 |
| Fidelity Series Large Cap Value Index Fund | 1,220,452 | 423,676 | 85,217 | -- | (454) | 99,519 | 1,657,976 |
| Fidelity Series Long-Term Treasury Bond Index Fund | 2,189,125 | 3,427,720 | 999,279 | 51,073 | (29,790) | (109,701) | 4,478,075 |
| Fidelity Series Opportunistic Insights Fund | -- | 105,781 | -- | -- | -- | 797,101 | 8,429,122 |
| Fidelity Series Real Estate Equity Fund | 730,473 | 46,531 | 807,279 | 3,914 | (29,795) | 60,070 | -- |
| Fidelity Series Real Estate Income Fund | 427,825 | 172,507 | 30,831 | 22,262 | (204) | 2,084 | 571,381 |
| Fidelity Series Short-Term Credit Fund | 295,984 | 125,546 | 22,417 | 4,008 | (160) | 192 | 399,145 |
| Fidelity Series Small Cap Opportunities Fund | 3,829,440 | 1,744,809 | 270,161 | 405,740 | 1,079 | 78,985 | 5,384,152 |
| Fidelity Series Stock Selector Large Cap Value Fund | -- | 248,981 | 1,449 | -- | (99) | (298,647) | 10,084,798 |
| Fidelity Series Value Discovery Fund | -- | 126,204 | -- | -- | -- | 146,169 | 9,933,325 |
| | $97,500,240 | $45,119,295 | $16,388,534 | $3,683,101 | $374,546 | $1,987,195 | $128,592,742 |
Amounts in the income column in the above table include any capital gain distributions from underlying funds, which are presented in the corresponding line-item in the Statement of Operations if applicable.
Investment Valuation
The following is a summary of the inputs used, as of September 30, 2018, involving the Fund's assets and liabilities carried at fair value. The inputs or methodology used for valuing securities may not be an indication of the risk associated with investing in those securities. For more information on valuation inputs, and their aggregation into the levels used below, please refer to the Investment Valuation section in the accompanying Notes to Financial Statements.
| | Valuation Inputs at Reporting Date: |
| Description | Total | Level 1 | Level 2 | Level 3 |
| Investments in Securities: | | | | |
| Other Short-Term Investments | $89,695 | $-- | $89,695 | $-- |
| Domestic Equity Funds | 77,946,748 | 77,946,748 | -- | -- |
| International Equity Funds | 39,678,931 | 39,678,931 | -- | -- |
| Bond Funds | 8,766,666 | 8,766,666 | -- | -- |
| Short-Term Funds | 2,421,894 | 2,421,894 | -- | -- |
| Total Investments in Securities: | $128,903,934 | $128,814,239 | $89,695 | $-- |
| Derivative Instruments: | | | | |
| Assets | | | | |
| Futures Contracts | $7,424 | $7,424 | $-- | $-- |
| Total Assets | $7,424 | $7,424 | $-- | $-- |
| Liabilities | | | | |
| Futures Contracts | $(202) | $(202) | $-- | $-- |
| Total Liabilities | $(202) | $(202) | $-- | $-- |
| Total Derivative Instruments: | $7,222 | $7,222 | $-- | $-- |
Value of Derivative Instruments
The following table is a summary of the Fund's value of derivative instruments by primary risk exposure as of September 30, 2018. For additional information on derivative instruments, please refer to the Derivative Instruments section in the accompanying Notes to Financial Statements.
| Primary Risk Exposure / Derivative Type | Value |
| | Asset | Liability |
| Equity Risk | | |
| Futures Contracts(a) | $7,424 | $(202) |
| Total Equity Risk | 7,424 | (202) |
| Total Value of Derivatives | $7,424 | $(202) |
(a) Reflects gross cumulative appreciation (depreciation) on futures contracts as presented in the Schedule of Investments. In the Statement of Assets and Liabilities, the period end daily variation margin is included in receivable or payable for daily variation margin on futures contracts, and the net cumulative appreciation (depreciation) is included in net unrealized appreciation (depreciation).
See accompanying notes which are an integral part of the financial statements.
Fidelity Advisor Freedom® 2060 Fund
Financial Statements
Statement of Assets and Liabilities
| | | September 30, 2018 (Unaudited) |
| Assets | | |
Investment in securities, at value — See accompanying schedule:
Unaffiliated issuers (cost $89,701) | $89,695 | |
| Fidelity Central Funds (cost $221,497) | 221,497 | |
| Other affiliated issuers (cost $120,891,087) | 128,592,742 | |
| Total Investment in Securities (cost $121,202,285) | | $128,903,934 |
| Cash | | 32,588 |
| Receivable for investments sold | | 1,427,979 |
| Receivable for fund shares sold | | 580,468 |
| Distributions receivable from Fidelity Central Funds | | 353 |
| Total assets | | 130,945,322 |
| Liabilities | | |
| Payable for investments purchased | $1,935,480 | |
| Payable for fund shares redeemed | 72,883 | |
| Accrued management fee | 77,565 | |
| Distribution and service plan fees payable | 19,105 | |
| Payable for daily variation margin on futures contracts | 4,785 | |
| Total liabilities | | 2,109,818 |
| Net Assets | | $128,835,504 |
| Net Assets consist of: | | |
| Paid in capital | | $118,073,601 |
| Undistributed net investment income | | 312,168 |
| Accumulated undistributed net realized gain (loss) on investments | | 2,740,864 |
| Net unrealized appreciation (depreciation) on investments | | 7,708,871 |
| Net Assets | | $128,835,504 |
| Calculation of Maximum Offering Price | | |
| Class A: | | |
| Net Asset Value and redemption price per share ($47,044,037 ÷ 3,896,952 shares) | | $12.07 |
| Maximum offering price per share (100/94.25 of $12.07) | | $12.81 |
| Class M: | | |
| Net Asset Value and redemption price per share ($16,676,187 ÷ 1,383,939 shares) | | $12.05 |
| Maximum offering price per share (100/96.50 of $12.05) | | $12.49 |
| Class C: | | |
| Net Asset Value and offering price per share ($3,385,937 ÷ 281,214 shares)(a) | | $12.04 |
| Class I: | | |
| Net Asset Value, offering price and redemption price per share ($59,972,753 ÷ 4,944,269 shares) | | $12.13 |
| Class Z6: | | |
| Net Asset Value, offering price and redemption price per share ($1,756,590 ÷ 144,654 shares) | | $12.14 |
(a) Redemption price per share is equal to net asset value less any applicable contingent deferred sales charge.
See accompanying notes which are an integral part of the financial statements.
Statement of Operations
| | | Six months ended September 30, 2018 (Unaudited) |
| Investment Income | | |
| Dividends: | | |
| Affiliated issuers | | $930,564 |
| Interest | | 490 |
| Income from Fidelity Central Funds | | 564 |
| Total income | | 931,618 |
| Expenses | | |
| Management fee | $423,105 | |
| Distribution and service plan fees | 103,973 | |
| Independent trustees' fees and expenses | 258 | |
| Total expenses | | 527,336 |
| Net investment income (loss) | | 404,282 |
| Realized and Unrealized Gain (Loss) | | |
| Net realized gain (loss) on: | | |
| Investment securities: | | |
| Affiliated issuers | 374,546 | |
| Futures contracts | (28,440) | |
| Capital gain distributions from underlying funds: | | |
| Affiliated issuers | 2,752,537 | |
| Total net realized gain (loss) | | 3,098,643 |
| Change in net unrealized appreciation (depreciation) on: | | |
| Investment securities: | | |
| Unaffiliated issuers | (6) | |
| Affiliated issuers | 1,987,195 | |
| Futures contracts | 7,222 | |
| Total change in net unrealized appreciation (depreciation) | | 1,994,411 |
| Net gain (loss) | | 5,093,054 |
| Net increase (decrease) in net assets resulting from operations | | $5,497,336 |
See accompanying notes which are an integral part of the financial statements.
Statement of Changes in Net Assets
| | Six months ended September 30, 2018 (Unaudited) | Year ended March 31, 2018 |
| Increase (Decrease) in Net Assets | | |
| Operations | | |
| Net investment income (loss) | $404,282 | $632,280 |
| Net realized gain (loss) | 3,098,643 | 4,117,080 |
| Change in net unrealized appreciation (depreciation) | 1,994,411 | 2,766,010 |
| Net increase (decrease) in net assets resulting from operations | 5,497,336 | 7,515,370 |
| Distributions to shareholders from net investment income | – | (781,225) |
| Distributions to shareholders from net realized gain | (3,236,416) | (1,302,479) |
| Total distributions | (3,236,416) | (2,083,704) |
| Share transactions - net increase (decrease) | 29,148,448 | 48,422,056 |
| Total increase (decrease) in net assets | 31,409,368 | 53,853,722 |
| Net Assets | | |
| Beginning of period | 97,426,136 | 43,572,414 |
| End of period | $128,835,504 | $97,426,136 |
| Other Information | | |
| Undistributed net investment income end of period | $312,168 | $– |
| Distributions in excess of net investment income end of period | $– | $(92,114) |
See accompanying notes which are an integral part of the financial statements.
Financial Highlights
Fidelity Advisor Freedom 2060 Fund Class A
| | Six months ended (Unaudited) September 30, | Years endedMarch 31, | | | |
| | 2018 | 2018 | 2017 | 2016 | 2015 A |
| Selected Per–Share Data | | | | | |
| Net asset value, beginning of period | $11.86 | $10.76 | $9.62 | $10.34 | $10.00 |
| Income from Investment Operations | | | | | |
| Net investment income (loss)B | .04 | .10 | .13 | .12 | .15 |
| Net realized and unrealized gain (loss) | .54 | 1.34 | 1.33 | (.51) | .37 |
| Total from investment operations | .58 | 1.44 | 1.46 | (.39) | .52 |
| Distributions from net investment income | – | (.11) | (.12) | (.11) | (.10) |
| Distributions from net realized gain | (.37) | (.23) | (.20) | (.22) | (.08) |
| Total distributions | (.37) | (.34) | (.32) | (.33) | (.18) |
| Net asset value, end of period | $12.07 | $11.86 | $10.76 | $9.62 | $10.34 |
| Total ReturnC,D,E | 4.95% | 13.44% | 15.55% | (3.89)% | 5.24% |
| Ratios to Average Net AssetsF,G | | | | | |
| Expenses before reductions | 1.00%H | .91% | .25% | .25% | .25%H |
| Expenses net of fee waivers, if any | 1.00%H | .91% | .25% | .25% | .25%H |
| Expenses net of all reductions | 1.00%H | .91% | .25% | .25% | .25%H |
| Net investment income (loss) | .64%H | .84% | 1.30% | 1.29% | 2.24%H |
| Supplemental Data | | | | | |
| Net assets, end of period (000 omitted) | $47,044 | $37,880 | $18,482 | $9,058 | $2,267 |
| Portfolio turnover rateG | 29%H | 16% | 32% | 64% | 47%H |
A For the period August 5, 2014 (commencement of operations) to March 31, 2015.
B Calculated based on average shares outstanding during the period.
C Total returns for periods of less than one year are not annualized.
D Total returns would have been lower if certain expenses had not been reduced during the applicable periods shown.
E Total returns do not include the effect of the sales charges.
F Expense ratios reflect operating expenses of the class. Expenses before reductions do not reflect amounts reimbursed by the investment adviser or reductions from expense offset arrangements and do not represent the amount paid by the class during periods when reimbursements or reductions occur. Expenses net of fee waivers reflect expenses after reimbursement by the investment adviser but prior to reductions from expense offset arrangements. Expenses net of all reductions represent the net expenses paid by the class but do not include expenses of the underlying funds in which the Fund invests.
G Amounts do not include the activity of the Underlying Funds.
H Annualized
See accompanying notes which are an integral part of the financial statements.
Fidelity Advisor Freedom 2060 Fund Class M
| | Six months ended (Unaudited) September 30, | Years endedMarch 31, | | | |
| | 2018 | 2018 | 2017 | 2016 | 2015 A |
| Selected Per–Share Data | | | | | |
| Net asset value, beginning of period | $11.85 | $10.77 | $9.63 | $10.33 | $10.00 |
| Income from Investment Operations | | | | | |
| Net investment income (loss)B | .02 | .07 | .11 | .10 | .13 |
| Net realized and unrealized gain (loss) | .55 | 1.33 | 1.33 | (.51) | .38 |
| Total from investment operations | .57 | 1.40 | 1.44 | (.41) | .51 |
| Distributions from net investment income | – | (.10) | (.10) | (.08) | (.09) |
| Distributions from net realized gain | (.37) | (.22) | (.20) | (.21) | (.08) |
| Total distributions | (.37) | (.32) | (.30) | (.29) | (.18)C |
| Net asset value, end of period | $12.05 | $11.85 | $10.77 | $9.63 | $10.33 |
| Total ReturnD,E,F | 4.87% | 13.04% | 15.29% | (4.09)% | 5.07% |
| Ratios to Average Net AssetsG,H | | | | | |
| Expenses before reductions | 1.25%I | 1.16% | .50% | .50% | .51%I,J |
| Expenses net of fee waivers, if any | 1.25%I | 1.16% | .50% | .50% | .51%I,J |
| Expenses net of all reductions | 1.25%I | 1.16% | .50% | .50% | .51%I,J |
| Net investment income (loss) | .39%I | .59% | 1.05% | 1.04% | 1.98%I |
| Supplemental Data | | | | | |
| Net assets, end of period (000 omitted) | $16,676 | $12,628 | $5,719 | $3,189 | $2,062 |
| Portfolio turnover rateH | 29%I | 16% | 32% | 64% | 47%I |
A For the period August 5, 2014 (commencement of operations) to March 31, 2015.
B Calculated based on average shares outstanding during the period.
C Total distributions of $.18 per share is comprised of distributions from net investment income of $.094 and distributions from net realized gain of $.081 per share.
D Total returns for periods of less than one year are not annualized.
E Total returns would have been lower if certain expenses had not been reduced during the applicable periods shown.
F Total returns do not include the effect of the sales charges.
G Expense ratios reflect operating expenses of the class. Expenses before reductions do not reflect amounts reimbursed by the investment adviser or reductions from expense offset arrangements and do not represent the amount paid by the class during periods when reimbursements or reductions occur. Expenses net of fee waivers reflect expenses after reimbursement by the investment adviser but prior to reductions from expense offset arrangements. Expenses net of all reductions represent the net expenses paid by the class but do not include expenses of the underlying funds in which the Fund invests.
H Amounts do not include the activity of the Underlying Funds.
I Annualized
J On certain classes, the size and fluctuation of net assets and expense amounts may cause ratios to differ from contractual rates.
See accompanying notes which are an integral part of the financial statements.
Fidelity Advisor Freedom 2060 Fund Class C
| | Six months ended (Unaudited) September 30, | Years endedMarch 31, | | | |
| | 2018 | 2018 | 2017 | 2016 | 2015 A |
| Selected Per–Share Data | | | | | |
| Net asset value, beginning of period | $11.87 | $10.81 | $9.68 | $10.31 | $10.00 |
| Income from Investment Operations | | | | | |
| Net investment income (loss)B | (.01) | .01 | .06 | .05 | .10 |
| Net realized and unrealized gain (loss) | .55 | 1.34 | 1.33 | (.51) | .38 |
| Total from investment operations | .54 | 1.35 | 1.39 | (.46) | .48 |
| Distributions from net investment income | – | (.07) | (.06) | – | (.08) |
| Distributions from net realized gain | (.37) | (.22) | (.20) | (.17) | (.08) |
| Total distributions | (.37) | (.29) | (.26) | (.17) | (.17)C |
| Net asset value, end of period | $12.04 | $11.87 | $10.81 | $9.68 | $10.31 |
| Total ReturnD,E,F | 4.60% | 12.53% | 14.65% | (4.60)% | 4.77% |
| Ratios to Average Net AssetsG,H | | | | | |
| Expenses before reductions | 1.75%I | 1.66% | 1.00% | .99%J | 1.02%I,J |
| Expenses net of fee waivers, if any | 1.75%I | 1.66% | 1.00% | .99%J | 1.02%I,J |
| Expenses net of all reductions | 1.75%I | 1.66% | 1.00% | .99%J | 1.02%I,J |
| Net investment income (loss) | (.11)%I | .09% | .55% | .55% | 1.47%I |
| Supplemental Data | | | | | |
| Net assets, end of period (000 omitted) | $3,386 | $2,604 | $1,209 | $1,292 | $1,322 |
| Portfolio turnover rateH | 29%I | 16% | 32% | 64% | 47%I |
A For the period August 5, 2014 (commencement of operations) to March 31, 2015.
B Calculated based on average shares outstanding during the period.
C Total distributions of $.17 per share is comprised of distributions from net investment income of $.084 and distributions from net realized gain of $.081 per share.
D Total returns for periods of less than one year are not annualized.
E Total returns would have been lower if certain expenses had not been reduced during the applicable periods shown.
F Total returns do not include the effect of the contingent deferred sales charge.
G Expense ratios reflect operating expenses of the class. Expenses before reductions do not reflect amounts reimbursed by the investment adviser or reductions from expense offset arrangements and do not represent the amount paid by the class during periods when reimbursements or reductions occur. Expenses net of fee waivers reflect expenses after reimbursement by the investment adviser but prior to reductions from expense offset arrangements. Expenses net of all reductions represent the net expenses paid by the class but do not include expenses of the underlying funds in which the Fund invests.
H Amounts do not include the activity of the Underlying Funds.
I Annualized
J On certain classes, the size and fluctuation of net assets and expense amounts may cause ratios to differ from contractual rates.
See accompanying notes which are an integral part of the financial statements.
Fidelity Advisor Freedom 2060 Fund Class I
| | Six months ended (Unaudited) September 30, | Years endedMarch 31, | | | |
| | 2018 | 2018 | 2017 | 2016 | 2015 A |
| Selected Per–Share Data | | | | | |
| Net asset value, beginning of period | $11.90 | $10.80 | $9.65 | $10.35 | $10.00 |
| Income from Investment Operations | | | | | |
| Net investment income (loss)B | .05 | .13 | .16 | .15 | .17 |
| Net realized and unrealized gain (loss) | .55 | 1.33 | 1.33 | (.50) | .37 |
| Total from investment operations | .60 | 1.46 | 1.49 | (.35) | .54 |
| Distributions from net investment income | – | (.13) | (.13) | (.12) | (.10) |
| Distributions from net realized gain | (.37) | (.23) | (.20) | (.23) | (.08) |
| Total distributions | (.37) | (.36) | (.34)C | (.35) | (.19)D |
| Net asset value, end of period | $12.13 | $11.90 | $10.80 | $9.65 | $10.35 |
| Total ReturnE,F | 5.11% | 13.63% | 15.82% | (3.54)% | 5.38% |
| Ratios to Average Net AssetsG,H | | | | | |
| Expenses before reductions | .75%I | .66% | - %J | - %J | - %I,J |
| Expenses net of fee waivers, if any | .75%I | .66% | -% | -% | - %I |
| Expenses net of all reductions | .75%I | .66% | -% | -% | - %I |
| Net investment income (loss) | .89%I | 1.09% | 1.55% | 1.54% | 2.49%I |
| Supplemental Data | | | | | |
| Net assets, end of period (000 omitted) | $59,973 | $43,513 | $18,162 | $5,845 | $399 |
| Portfolio turnover rateH | 29%I | 16% | 32% | 64% | 47%I |
A For the period August 5, 2014 (commencement of operations) to March 31, 2015.
B Calculated based on average shares outstanding during the period.
C Total distributions of $.34 per share is comprised of distributions from net investment income of $.132 and distributions from net realized gain of $.204 per share.
D Total distributions of $.19 per share is comprised of distributions from net investment income of $.104 and distributions from net realized gain of $.081 per share.
E Total returns for periods of less than one year are not annualized.
F Total returns would have been lower if certain expenses had not been reduced during the applicable periods shown.
G Expense ratios reflect operating expenses of the class. Expenses before reductions do not reflect amounts reimbursed by the investment adviser or reductions from expense offset arrangements and do not represent the amount paid by the class during periods when reimbursements or reductions occur. Expenses net of fee waivers reflect expenses after reimbursement by the investment adviser but prior to reductions from expense offset arrangements. Expenses net of all reductions represent the net expenses paid by the class but do not include expenses of the underlying funds in which the Fund invests.
H Amounts do not include the activity of the Underlying Funds.
I Annualized
J Amount represents less than .005%.
See accompanying notes which are an integral part of the financial statements.
Fidelity Advisor Freedom 2060 Fund Class Z6
| | Six months ended (Unaudited) September 30, | Years endedMarch 31, |
| | 2018 | 2018 A |
| Selected Per–Share Data | | |
| Net asset value, beginning of period | $11.90 | $11.16 |
| Income from Investment Operations | | |
| Net investment income (loss)B | .07 | .33 |
| Net realized and unrealized gain (loss) | .54 | .69 |
| Total from investment operations | .61 | 1.02 |
| Distributions from net investment income | – | (.16) |
| Distributions from net realized gain | (.37) | (.13) |
| Total distributions | (.37) | (.28)C |
| Net asset value, end of period | $12.14 | $11.90 |
| Total ReturnD,E | 5.19% | 9.14% |
| Ratios to Average Net AssetsF,G | | |
| Expenses before reductions | .49%H | .50%H,I |
| Expenses net of fee waivers, if any | .49%H | .50%H,I |
| Expenses net of all reductions | .49%H | .50%H,I |
| Net investment income (loss) | 1.14%H | 3.41%H |
| Supplemental Data | | |
| Net assets, end of period (000 omitted) | $1,757 | $802 |
| Portfolio turnover rateG | 29%H | 16% |
A For the period June 6, 2017 (commencement of sale of shares) to March 31, 2018.
B Calculated based on average shares outstanding during the period.
C Total distributions of $.28 per share is comprised of distributions from net investment income of $.155 and distributions from net realized gain of $.127 per share.
D Total returns for periods of less than one year are not annualized.
E Total returns would have been lower if certain expenses had not been reduced during the applicable periods shown.
F Expense ratios reflect operating expenses of the class. Expenses before reductions do not reflect amounts reimbursed by the investment adviser or reductions from expense offset arrangements and do not represent the amount paid by the class during periods when reimbursements or reductions occur. Expenses net of fee waivers reflect expenses after reimbursement by the investment adviser but prior to reductions from expense offset arrangements. Expenses net of all reductions represent the net expenses paid by the class but do not include expenses of the underlying funds in which the Fund invests.
G Amounts do not include the activity of the Underlying Funds.
H Annualized
I On certain classes, the size and fluctuation of net assets and expense amounts may cause ratios to differ from contractual rates.
See accompanying notes which are an integral part of the financial statements.
Notes to Financial Statements (Unaudited)
For the period ended September 30, 2018
1. Organization.
Fidelity Advisor Freedom Income Fund, Fidelity Advisor Freedom 2005 Fund, Fidelity Advisor Freedom 2010 Fund, Fidelity Advisor Freedom 2015 Fund, Fidelity Advisor Freedom 2020 Fund, Fidelity Advisor Freedom 2025 Fund, Fidelity Advisor Freedom 2030 Fund, Fidelity Advisor Freedom 2035 Fund, Fidelity Advisor Freedom 2040 Fund, Fidelity Advisor Freedom 2045 Fund, Fidelity Advisor Freedom 2050 Fund, Fidelity Advisor Freedom 2055 Fund and Fidelity Advisor Freedom 2060 Fund (the Funds) are funds of Fidelity Aberdeen Street Trust (the Trust). The Trust is registered under the Investment Company Act of 1940, as amended (the 1940 Act), as an open-end management investment company organized as a Delaware statutory trust. Each Fund is authorized to issue an unlimited number of shares. Each Fund offers Class A, Class M, Class C, Class I and Class Z6 shares, each of which has equal rights as to assets and voting privileges. Each class has exclusive voting rights with respect to matters that affect that class. The Funds invest primarily in a combination of other Fidelity equity, bond, and short-term funds (the Underlying Funds) managed by Fidelity Management & Research Company (FMR). Certain Underlying Funds incurred name changes since their most recent shareholder report. The names of the Underlying Funds are those in effect at period end. In the prior year, the Funds transitioned their portfolios to invest exclusively in classes of the Fidelity Series funds, offered only to certain other Fidelity funds advised by FMR or its affiliates.
2. Investments in Fidelity Central Funds.
The Funds invest in Fidelity Central Funds, which are open-end investment companies generally available only to other investment companies and accounts managed by the investment adviser and its affiliates. The Funds' Schedules of Investments list each of the Fidelity Central Funds held as of period end, if any, as an investment of each Fund, but does not include the underlying holdings of each Fidelity Central Fund. As an Investing Fund, each Fund indirectly bears its proportionate share of the expenses of the underlying Fidelity Central Funds.
The Money Market Central Funds seek preservation of capital and current income and are managed by Fidelity Investments Money Management, Inc. (FIMM), an affiliate of the investment adviser. Annualized expenses of the Money Market Central Funds as of their most recent shareholder report date are less than .005%.
A complete unaudited list of holdings for each Fidelity Central Fund is available upon request or at the Securities and Exchange Commission (the SEC) website at www.sec.gov. In addition, the financial statements of the Fidelity Central Funds are available on the SEC website or upon request.
3. Significant Accounting Policies.
Each Fund is an investment company and applies the accounting and reporting guidance of the Financial Accounting Standards Board (FASB) Accounting Standards Codification Topic 946 Financial Services – Investments Companies. The financial statements have been prepared in conformity with accounting principles generally accepted in the United States of America (GAAP), which require management to make certain estimates and assumptions at the date of the financial statements. Actual results could differ from those estimates. Subsequent events, if any, through the date that the financial statements were issued have been evaluated in the preparation of the financial statements. The following summarizes the significant accounting policies of the Funds:
Investment Valuation. Investments are valued as of 4:00 p.m. Eastern time on the last calendar day of the period. The Board of Trustees (the Board) has delegated the day to day responsibility for the valuation of each Fund's investments to the Fair Value Committee (the Committee) established by the each Fund's investment adviser. In accordance with valuation policies and procedures approved by the Board, each Fund attempts to obtain prices from one or more third party pricing vendors or brokers to value its investments. When current market prices, quotations or currency exchange rates are not readily available or reliable, investments will be fair valued in good faith by the Committee, in accordance with procedures adopted by the Board. Factors used in determining fair value vary by investment type and may include market or investment specific events, changes in interest rates and credit quality. The frequency with which these procedures are used cannot be predicted and they may be utilized to a significant extent. The Committee oversees each Fund's valuation policies and procedures and reports to the Board on the Committee's activities and fair value determinations. The Board monitors the appropriateness of the procedures used in valuing each Fund's investments and ratifies the fair value determinations of the Committee. Each Fund categorizes the inputs to valuation techniques used to value its investments into a disclosure hierarchy consisting of three levels as shown below:
- Level 1 – quoted prices in active markets for identical investments
- Level 2 – other significant observable inputs (including quoted prices for similar investments, interest rates, prepayment speeds, etc.)
- Level 3 – unobservable inputs (including the Fund's own assumptions based on the best information available)
Valuation techniques used to value each Fund's investments by major category are as follows. Investments in the Underlying Funds are valued at their closing net asset value (NAV) each business day and are categorized as Level 1 in the hierarchy. Debt securities, including restricted securities, are valued based on evaluated prices received from third party pricing vendors or from brokers who make markets in such securities. U.S. government and government agency obligations are valued by pricing vendors who utilize matrix pricing which considers yield or price of bonds of comparable quality, coupon, maturity and type or by broker-supplied prices. When independent prices are unavailable or unreliable, debt securities may be valued utilizing pricing methodologies which consider similar factors that would be used by third party pricing vendors. Debt securities are generally categorized as Level 2 in the hierarchy but may be Level 3 depending on the circumstances.
Futures contracts are valued at the settlement price established each day by the board of trade or exchange on which they are traded and are categorized as Level 1 in the hierarchy.
Investment Transactions and Income. For financial reporting purposes, the Funds' investment holdings and NAV include trades executed through the end of the last business day of the period. The NAV per share for processing shareholder transactions is calculated as of the close of business of the New York Stock Exchange (NYSE), normally 4:00 p.m. Eastern time and includes trades executed through the end of the prior business day. Gains and losses on securities sold are determined on the basis of identified cost. Income and capital gain distributions from the Underlying Funds, if any, are recorded on the ex-dividend date. Interest income is accrued as earned. Interest income includes coupon interest and amortization of premium and accretion of discount on debt securities as applicable.
Class Allocations and Expenses. Investment income, realized and unrealized capital gains and losses, common expenses of each Fund, and certain fund-level expense reductions, if any, are allocated daily on a pro-rata basis to each class based on the relative net assets of each class to the total net assets of each Fund. Each class differs with respect to distribution and service plan fees incurred. Certain expense reductions may also differ by class. For the reporting period, the allocated portion of income and expenses to each class as a percent of its average net assets may vary due to the timing of recording these transactions in relation to fluctuating net assets of the classes. Expenses directly attributable to a fund are charged to that fund. Expenses attributable to more than one fund are allocated among the respective funds on the basis of relative net assets or other appropriate methods. Expenses included in the accompanying financial statements reflect the expenses of each Fund and do not include any expenses associated with the Underlying Funds. Although not included in each Fund's expenses, each Fund indirectly bears its proportionate share of the Underlying Funds' expenses through the impact of these expenses on each Underlying Fund's NAV. Expense estimates are accrued in the period to which they relate and adjustments are made when actual amounts are known.
Income Tax Information and Distributions to Shareholders. Each year, each Fund intends to qualify as a regulated investment company under Subchapter M of the Internal Revenue Code, including distributing substantially all of its taxable income and realized gains. As a result, no provision for U.S. Federal income taxes is required. Each Fund files a U.S. federal tax return, in addition to state and local tax returns as required. Each Fund's federal income tax returns are subject to examination by the Internal Revenue Service (IRS) for a period of three fiscal years after they are filed. State and local tax returns may be subject to examination for an additional fiscal year depending on the jurisdiction.
Distributions are declared and recorded on the ex-dividend date. Income and capital gain distributions are declared separately for each class. Income and capital gain distributions are determined in accordance with income tax regulations, which may differ from GAAP.
Capital accounts within the financial statements are adjusted for permanent book-tax differences. These adjustments have no impact on net assets or the results of operations. Capital accounts are not adjusted for temporary book-tax differences which will reverse in a subsequent period.
Book-tax differences are primarily due to the short-term gain distributions from the Underlying Funds, futures contracts, market discount and losses deferred due to wash sales and excise tax regulations.
As of period end, the cost and unrealized appreciation (depreciation) in securities, and derivatives if applicable, for federal income tax purposes were as follows for each Fund:
| | Tax cost | Gross unrealized appreciation | Gross unrealized depreciation | Net unrealized appreciation (depreciation) |
| Advisor Freedom Income | $217,546,224 | $12,693,876 | $(3,328,002) | $9,365,874 |
| Advisor Freedom 2005 | 174,696,002 | 15,371,237 | (2,443,857) | 12,927,380 |
| Advisor Freedom 2010 | 408,526,262 | 47,426,523 | (4,884,554) | 42,541,969 |
| Advisor Freedom 2015 | 930,053,617 | 144,973,140 | (11,888,454) | 133,084,686 |
| Advisor Freedom 2020 | 2,124,994,731 | 361,101,254 | (34,334,456) | 326,766,798 |
| Advisor Freedom 2025 | 2,556,407,055 | 470,031,565 | (43,692,065) | 426,339,500 |
| Advisor Freedom 2030 | 2,542,150,551 | 543,512,062 | (37,275,219) | 506,236,843 |
| Advisor Freedom 2035 | 1,990,909,385 | 487,530,271 | (20,748,954) | 466,781,317 |
| Advisor Freedom 2040 | 1,808,464,369 | 457,994,813 | (18,041,015) | 439,953,798 |
| Advisor Freedom 2045 | 1,176,720,994 | 262,756,329 | (12,183,346) | 250,572,983 |
| Advisor Freedom 2050 | 962,959,480 | 207,052,309 | (10,117,456) | 196,934,853 |
| Advisor Freedom 2055 | 556,050,807 | 71,525,873 | (6,517,643) | 65,008,230 |
| Advisor Freedom 2060 | 121,617,270 | 9,016,654 | (1,722,768) | 7,293,886 |
4. Derivative Instruments.
Risk Exposures and the Use of Derivative Instruments. The Funds' investment objective allows the Funds to enter into various types of derivative contracts, including futures contracts. Derivatives are investments whose value is primarily derived from underlying assets, indices or reference rates and may be transacted on an exchange or over-the-counter (OTC). Derivatives may involve a future commitment to buy or sell a specified asset based on specified terms, to exchange future cash flows at periodic intervals based on a notional principal amount, or for one party to make one or more payments upon the occurrence of specified events in exchange for periodic payments from the other party.
The Funds used derivatives to increase returns and to manage exposure to certain risks as defined below. The success of any strategy involving derivatives depends on analysis of numerous economic factors, and if the strategies for investment do not work as intended, the Funds may not achieve their objectives.
The Funds' use of derivatives increased or decreased their exposure to the following risk:
| Equity Risk | Equity risk relates to the fluctuations in the value of financial instruments as a result of changes in market prices (other than those arising from interest rate risk or foreign exchange risk), whether caused by factors specific to an individual investment, its issuer, or all factors affecting all instruments traded in a market or market segment.
|
The Funds are also exposed to additional risks from investing in derivatives, such as liquidity risk and counterparty credit risk. Liquidity risk is the risk that the Funds will be unable to close out the derivative in the open market in a timely manner. Counterparty credit risk is the risk that the counterparty will not be able to fulfill its obligation to the Funds. Counterparty credit risk related to exchange-traded futures contracts may be mitigated by the protection provided by the exchange on which they trade.
Investing in derivatives may involve greater risks than investing in the underlying assets directly and, to varying degrees, may involve risk of loss in excess of any initial investment and collateral received and amounts recognized in the Statement of Assets and Liabilities. In addition, there may be the risk that the change in value of the derivative contract does not correspond to the change in value of the underlying instrument.
Futures Contracts. A futures contract is an agreement between two parties to buy or sell a specified underlying instrument for a fixed price at a specified future date. The Funds used futures contracts to manage their exposure to the stock market.
Upon entering into a futures contract, a fund is required to deposit either cash or securities (initial margin) with a clearing broker in an amount equal to a certain percentage of the face value of the contract. Futures contracts are marked-to-market daily and subsequent daily payments (variation margin) are made or received by a fund depending on the daily fluctuations in the value of the futures contracts and are recorded as unrealized appreciation or (depreciation). This receivable and/or payable, if any, is included in daily variation margin on futures contracts in the Statement of Assets and Liabilities. Realized gain or (loss) is recorded upon the expiration or closing of a futures contract. The net realized gain (loss) and change in net unrealized appreciation (depreciation) on futures contracts during the period is presented in the Statement of Operations.
Any open futures contracts at period end are presented in the Schedule of Investments under the caption "Futures Contracts". The notional amount at value reflects each contract's exposure to the underlying instrument or index at period end and is representative of volume of activity during the period. Securities deposited to meet initial margin requirements are identified in the Schedule of Investments.
5. Purchases and Sales of Investments.
Purchases and sales of securities including the Underlying Fund shares, other than short-term securities, are noted in the table below.
| | Purchases ($) | Sales ($) |
| Advisor Freedom Income | 63,259,691 | 49,592,226 |
| Advisor Freedom 2005 | 34,392,567 | 41,231,617 |
| Advisor Freedom 2010 | 67,830,202 | 95,099,130 |
| Advisor Freedom 2015 | 140,246,232 | 198,070,318 |
| Advisor Freedom 2020 | 309,204,345 | 389,370,370 |
| Advisor Freedom 2025 | 388,241,541 | 457,159,686 |
| Advisor Freedom 2030 | 360,843,484 | 365,453,198 |
| Advisor Freedom 2035 | 338,587,508 | 340,149,487 |
| Advisor Freedom 2040 | 306,187,656 | 298,072,814 |
| Advisor Freedom 2045 | 212,639,162 | 180,413,831 |
| Advisor Freedom 2050 | 189,310,651 | 150,003,425 |
| Advisor Freedom 2055 | 149,126,794 | 89,775,767 |
| Advisor Freedom 2060 | 45,119,295 | 16,388,534 |
6. Fees and Other Transactions with Affiliates.
Management Fee and Expense Contract. FMR Co., Inc. (the investment adviser), an affiliate of FMR, and its affiliates provide the Funds with investment management related services. Under the management contract, effective June 1, 2017, each Class of each Fund pays a monthly management fee that is set at an annual rate by referring to each Fund's target date, indicated by its name, such that the management fee rate applicable to each Class of each Fund is reduced as the fund approaches, and then passes, its target date. In addition, under the management contract, the investment adviser pays all ordinary operating expenses of each Fund, except distribution and service plan fees, fees and expenses of the independent Trustees, and certain miscellaneous expenses such as proxy and shareholder meeting expenses. The management fee is reduced by an amount equal to the fees and expenses paid by each Fund to the independent Trustees. Prior to June 1, 2017, the investment adviser provided the Funds with investment management related services. The Funds did not pay any fees for these services. For the reporting period, the total annual management fee rate for each Class of each Fund was as follows:
| | Annual % of Class-Level Average Net Assets (Classes A, M, C, I) | Annual % of Class-Level Average Net Assets
(Class Z6) |
| Fidelity Advisor Freedom Income Fund | .465% | .415% |
| Fidelity Advisor Freedom 2005 Fund | .482% | .428% |
| Fidelity Advisor Freedom 2010 Fund | .525% | .461% |
| Fidelity Advisor Freedom 2015 Fund | .567% | .496% |
| Fidelity Advisor Freedom 2020 Fund | .610% | .531% |
| Fidelity Advisor Freedom 2025 Fund | .652% | .566% |
| Fidelity Advisor Freedom 2030 Fund | .695% | .601% |
| Fidelity Advisor Freedom 2035 Fund | .737% | .636% |
| Fidelity Advisor Freedom 2040 Fund | .746% | .643% |
| Fidelity Advisor Freedom 2045 Fund | .746% | .643% |
| Fidelity Advisor Freedom 2050 Fund | .746% | .643% |
| Fidelity Advisor Freedom 2055 Fund | .746% | .643% |
| Fidelity Advisor Freedom 2060 Fund | .746% | .643% |
Under the expense contract, the investment adviser pays class-level expenses for Class Z6 of each Fund as necessary so that Class Z6 total expenses do not exceed certain amounts of Class Z6 average net assets on an annual basis with certain exceptions, as noted in the following table:
| | Annual % of Class-Level Average Net Assets (Class Z6) |
| Fidelity Advisor Freedom Income Fund | .365% |
| Fidelity Advisor Freedom 2005 Fund | .373% |
| Fidelity Advisor Freedom 2010 Fund | .392% |
| Fidelity Advisor Freedom 2015 Fund | .412% |
| Fidelity Advisor Freedom 2020 Fund | .431% |
| Fidelity Advisor Freedom 2025 Fund | .450% |
| Fidelity Advisor Freedom 2030 Fund | .470% |
| Fidelity Advisor Freedom 2035 Fund | .489% |
| Fidelity Advisor Freedom 2040 Fund | .493% |
| Fidelity Advisor Freedom 2045 Fund | .493% |
| Fidelity Advisor Freedom 2050 Fund | .493% |
| Fidelity Advisor Freedom 2055 Fund | .493% |
| Fidelity Advisor Freedom 2060 Fund | .493% |
Other Transactions. The investment adviser has entered into an administration agreement with FMR under which FMR provides management and administrative services (other than investment advisory services) necessary for the operation of each Fund. Pursuant to this agreement, FMR pays all expenses of each Fund, excluding distribution and service plan fees, compensation of the independent Trustees and certain miscellaneous expenses such as proxy and shareholder meeting expenses. FMR also contracts with other Fidelity companies to perform the services necessary for the operation of each Fund. The Funds do not pay any fees for these services.
Distribution and Service Plan Fees. In accordance with Rule 12b-1 of the 1940 Act, each Fund has adopted separate Distribution and Service Plans for each class of shares. Certain classes pay Fidelity Distributors Corporation (FDC), an affiliate of the investment adviser, separate Distribution and Service Fees, each of which is based on an annual percentage of each class' average net assets. In addition, FDC may pay financial intermediaries for selling shares of each Fund and providing shareholder support services. For the period, the Distribution and Service Fee rates, total fees and amounts retained by FDC were as follows:
| | Distribution Fee | Service Fee | Total Fees | Retained by FDC |
| Advisor Freedom Income | | | | |
| Class A | -% | .25% | $92,936 | $2,036 |
| Class M | .25% | .25% | 95,674 | – |
| Class C | .75% | .25% | 65,736 | 4,317 |
| | | | $254,346 | $6,353 |
| Advisor Freedom 2005 | | | | |
| Class A | -% | .25% | $121,736 | $3,067 |
| Class M | .25% | .25% | 63,534 | 116 |
| Class C | .75% | .25% | 28,957 | 794 |
| | | | $214,227 | $3,977 |
| Advisor Freedom 2010 | | | | |
| Class A | -% | .25% | $270,934 | $8,345 |
| Class M | .25% | .25% | 189,410 | 4,354 |
| Class C | .75% | .25% | 125,811 | – |
| | | | $586,155 | $12,699 |
| Advisor Freedom 2015 | | | | |
| Class A | -% | .25% | $666,214 | $15,612 |
| Class M | .25% | .25% | 410,540 | 931 |
| Class C | .75% | .25% | 270,372 | 2,694 |
| | | | $1,347,126 | $19,237 |
| Advisor Freedom 2020 | | | | |
| Class A | -% | .25% | $1,442,192 | $31,218 |
| Class M | .25% | .25% | 930,756 | 2,149 |
| Class C | .75% | .25% | 493,700 | 36,481 |
| | | | $2,866,648 | $69,848 |
| Advisor Freedom 2025 | | | | |
| Class A | -% | .25% | $1,753,532 | $48,612 |
| Class M | .25% | .25% | 1,085,076 | 3,237 |
| Class C | .75% | .25% | 486,584 | 46,012 |
| | | | $3,325,192 | $97,861 |
| Advisor Freedom 2030 | | | | |
| Class A | -% | .25% | $1,700,779 | $34,744 |
| Class M | .25% | .25% | 1,152,156 | 1,939 |
| Class C | .75% | .25% | 487,787 | 49,263 |
| | | | $3,340,722 | $85,946 |
| Advisor Freedom 2035 | | | | |
| Class A | -% | .25% | $1,354,313 | $31,398 |
| Class M | .25% | .25% | 921,192 | 4,709 |
| Class C | .75% | .25% | 333,372 | 35,655 |
| | | | $2,608,877 | $71,762 |
| Advisor Freedom 2040 | | | | |
| Class A | -% | .25% | $1,183,873 | $26,801 |
| Class M | .25% | .25% | 878,106 | 763 |
| Class C | .75% | .25% | 421,955 | 34,877 |
| | | | $2,483,934 | $62,441 |
| Advisor Freedom 2045 | | | | |
| Class A | -% | .25% | $713,037 | $17,244 |
| Class M | .25% | .25% | 528,795 | 3,924 |
| Class C | .75% | .25% | 157,687 | 23,971 |
| | | | $1,399,519 | $45,139 |
| Advisor Freedom 2050 | | | | |
| Class A | -% | .25% | $527,349 | $7,795 |
| Class M | .25% | .25% | 429,854 | 2,179 |
| Class C | .75% | .25% | 168,257 | 25,667 |
| | | | $1,125,460 | $35,641 |
| Advisor Freedom 2055 | | | | |
| Class A | -% | .25% | $263,653 | $4,137 |
| Class M | .25% | .25% | 193,044 | 163 |
| Class C | .75% | .25% | 56,185 | 11,590 |
| | | | $512,882 | $15,890 |
| Advisor Freedom 2060 | | | | |
| Class A | -% | .25% | $52,834 | $27,374 |
| Class M | .25% | .25% | 36,616 | 22 |
| Class C | .75% | .25% | 14,523 | 7,314 |
| | | | $103,973 | $34,710 |
Sales Load. FDC may receive a front-end sales charge of up to 5.75% for selling Class A shares and 3.50% for selling Class M shares, some of which is paid to financial intermediaries for selling shares of each Fund. Depending on the holding period, FDC may receive contingent deferred sales charges levied on Class A, Class M and Class C redemptions. The deferred sales charges are 1.00% for Class C shares, 1.00% for certain purchases of Class A shares and .25% for certain purchases of Class M shares.
For the period, sales charge amounts retained by FDC were as follows:
| | Retained by FDC |
| Advisor Freedom Income | |
| Class A | $6,948 |
| Class M | 528 |
| Class C(a) | 901 |
| | $8,377 |
| Advisor Freedom 2005 | |
| Class A | $1,569 |
| Class M | 446 |
| Class C(a) | 268 |
| | $2,283 |
| Advisor Freedom 2010 | |
| Class A | $2,755 |
| Class M | 738 |
| Class C(a) | 396 |
| | $3,889 |
| Advisor Freedom 2015 | |
| Class A | $9,530 |
| Class M | 3,344 |
| Class C(a) | 902 |
| | $13,776 |
| Advisor Freedom 2020 | |
| Class A | $23,113 |
| Class M | 8,535 |
| Class C(a) | 2,865 |
| | $34,513 |
| Advisor Freedom 2025 | |
| Class A | $31,911 |
| Class M | 16,304 |
| Class C(a) | 3,568 |
| | $51,783 |
| Advisor Freedom 2030 | |
| Class A | $41,912 |
| Class M | 15,037 |
| Class C(a) | 5,366 |
| | $62,315 |
| Advisor Freedom 2035 | |
| Class A | $32,966 |
| Class M | 14,253 |
| Class C(a) | 7,666 |
| | $54,885 |
| Advisor Freedom 2040 | |
| Class A | $40,641 |
| Class M | 12,199 |
| Class C(a) | 3,372 |
| | $56,212 |
| Advisor Freedom 2045 | |
| Class A | $29,981 |
| Class M | 8,409 |
| Class C(a) | 2,210 |
| | $40,600 |
| Advisor Freedom 2050 | |
| Class A | $31,588 |
| Class M | 6,851 |
| Class C(a) | 2,726 |
| | $41,165 |
| Advisor Freedom 2055 | |
| Class A | $16,257 |
| Class M | 5,000 |
| Class C(a) | 1,702 |
| | $22,959 |
| Advisor Freedom 2060 | |
| Class A | $5,852 |
| Class M | 1,005 |
| Class C(a) | 597 |
| | $7,454 |
(a) When Class C shares are initially sold, FDC pays commissions from its own resources to financial intermediaries through which the sales are made.
Prior Fiscal Year Reallocation of Underlying Fund Investments. During the prior period, the investment adviser reallocated investments of the Funds. This involved taxable redemptions of the Funds' interest in Fidelity Advisor Series Equity Value Fund ("selected Underlying Fund") for investments and cash and non-taxable exchanges of those investments and cash for shares of Fidelity Advisor Series Growth & Income Fund which is an affiliated investment company managed by FMR.
Details of these transactions with the related net gain (loss) for the Funds are presented in the accompanying table:
| | Value of Investments and Cash reallocated | Net realized Gain (Loss) on redemptions of selected Underlying Funds |
| Advisor Freedom Income | $1,835,460 | $263,976 |
| Advisor Freedom 2005 | 2,600,106 | 473,487 |
| Advisor Freedom 2010 | 8,110,167 | 1,996,669 |
| Advisor Freedom 2015 | 23,603,334 | 4,562,791 |
| Advisor Freedom 2020 | 57,172,267 | 5,489,085 |
| Advisor Freedom 2025 | 73,263,952 | 6,487,561 |
| Advisor Freedom 2030 | 87,711,735 | 7,386,714 |
| Advisor Freedom 2035 | 79,733,333 | 5,964,782 |
| Advisor Freedom 2040 | 74,045,368 | 5,798,888 |
| Advisor Freedom 2045 | 44,156,583 | 3,196,466 |
| Advisor Freedom 2050 | 34,515,108 | 2,535,731 |
| Advisor Freedom 2055 | 15,452,315 | 540,986 |
| Advisor Freedom 2060 | 1,885,573 | 23,858 |
7. Expense Reductions.
Through arrangements with each applicable Fund's custodian, credits realized as a result of certain uninvested cash balances were used to reduce each applicable Fund's management fee. During the period, these credits reduced management fee by the following amounts:
| Advisor Freedom Income | $40 |
| Advisor Freedom 2005 | 32 |
| Advisor Freedom 2010 | 35 |
| Advisor Freedom 2015 | 37 |
| Advisor Freedom 2020 | 39 |
| Advisor Freedom 2025 | 48 |
| Advisor Freedom 2030 | 55 |
| Advisor Freedom 2035 | 5 |
| Advisor Freedom 2040 | 1 |
| Advisor Freedom 2045 | - |
| Advisor Freedom 2050 | 2 |
| Advisor Freedom 2055 | 2 |
| Advisor Freedom 2060 | - |
8. Distributions to Shareholders.
Distributions to shareholders of each class were as follows:
| | Six months ended
September 30, 2018 | Year ended
March 31, 2018(a) |
| Advisor Freedom Income | | |
| From net investment income | | |
| Class A | $423,372 | $1,099,143 |
| Class M | 168,162 | 434,009 |
| Class C | 25,475 | 84,788 |
| Class I | 620,590 | 1,334,162 |
| Class Z6 | 87,524 | 14,910 |
| Total | $1,325,123 | $2,967,012 |
| From net realized gain | | |
| Class A | $1,083,510 | $1,878,730 |
| Class M | 556,845 | 905,373 |
| Class C | 194,302 | 326,433 |
| Class I | 1,221,176 | 1,957,623 |
| Class Z6 | 92,326 | 19,793 |
| Total | $3,148,159 | $5,087,952 |
| Advisor Freedom 2005 | | |
| From net investment income | | |
| Class A | $192,361 | $1,499,668 |
| Class M | 32,014 | 314,597 |
| Class C | 1,456 | 29,260 |
| Class I | 154,860 | 965,073 |
| Class Z6 | 4,936 | 3,311 |
| Total | $385,627 | $2,811,909 |
| From net realized gain | | |
| Class A | $2,492,331 | $4,027,753 |
| Class M | 636,019 | 991,902 |
| Class C | 144,594 | 192,899 |
| Class I | 1,488,653 | 2,120,987 |
| Class Z6 | 38,707 | 5,395 |
| Total | $4,800,304 | $7,338,936 |
| Advisor Freedom 2010 | | |
| From net investment income | | |
| Class A | $289,119 | $3,281,846 |
| Class M | 49,134 | 928,807 |
| Class C | – | 171,747 |
| Class I | 275,688 | 2,274,695 |
| Class Z6 | 12,723 | 5,012 |
| Total | $626,664 | $6,662,107 |
| From net realized gain | | |
| Class A | $6,685,870 | $12,108,352 |
| Class M | 2,272,428 | 4,030,464 |
| Class C | 755,232 | 1,392,028 |
| Class I | 4,080,167 | 6,664,800 |
| Class Z6 | 142,657 | 10,693 |
| Total | $13,936,354 | $24,206,337 |
| Advisor Freedom 2015 | | |
| From net investment income | | |
| Class A | $430,803 | $7,973,130 |
| Class M | 26,211 | 1,948,902 |
| Class C | – | 332,783 |
| Class I | 479,046 | 5,348,653 |
| Class Z6 | 30,029 | 43,354 |
| Total | $966,089 | $15,646,822 |
| From net realized gain | | |
| Class A | $19,773,366 | $32,654,337 |
| Class M | 6,015,445 | 9,539,452 |
| Class C | 1,933,936 | 3,208,781 |
| Class I | 11,570,107 | 17,671,857 |
| Class Z6 | 492,263 | 97,031 |
| Total | $39,785,117 | $63,171,458 |
| Advisor Freedom 2020 | | |
| From net investment income | | |
| Class A | $343,382 | $16,243,820 |
| Class M | – | 4,166,252 |
| Class C | – | 631,334 |
| Class I | 757,966 | 12,480,682 |
| Class Z6 | 67,878 | 54,384 |
| Total | $1,169,226 | $33,576,472 |
| From net realized gain | | |
| Class A | $41,713,997 | $56,102,883 |
| Class M | 13,057,503 | 17,427,080 |
| Class C | 3,333,696 | 4,617,388 |
| Class I | 28,332,284 | 34,710,233 |
| Class Z6 | 1,268,800 | 98,749 |
| Total | $87,706,280 | $112,956,333 |
| Advisor Freedom 2025 | | |
| From net investment income | | |
| Class A | $– | $18,093,765 |
| Class M | – | 4,378,723 |
| Class C | – | 563,682 |
| Class I | 148,305 | 14,900,347 |
| Class Z6 | 36,352 | 64,554 |
| Total | $184,657 | $38,001,071 |
| From net realized gain | | |
| Class A | $49,671,068 | $58,214,610 |
| Class M | 14,872,667 | 17,087,190 |
| Class C | 3,319,289 | 3,945,982 |
| Class I | 36,429,132 | 37,833,645 |
| Class Z6 | 1,192,336 | 103,988 |
| Total | $105,484,492 | $117,185,415 |
| Advisor Freedom 2030 | | |
| From net investment income | | |
| Class A | $– | $14,665,530 |
| Class M | – | 3,839,299 |
| Class C | – | 484,808 |
| Class I | – | 13,363,681 |
| Class Z6 | – | 76,802 |
| Total | $– | $32,430,120 |
| From net realized gain | | |
| Class A | $54,443,227 | $61,142,849 |
| Class M | 17,958,623 | 19,943,569 |
| Class C | 3,791,454 | 4,240,085 |
| Class I | 42,674,754 | 42,210,713 |
| Class Z6 | 1,574,692 | 141,530 |
| Total | $120,442,750 | $127,678,746 |
| Advisor Freedom 2035 | | |
| From net investment income | | |
| Class A | $– | $10,040,682 |
| Class M | – | 2,832,544 |
| Class C | – | 299,727 |
| Class I | – | 9,653,819 |
| Class Z6 | – | 41,993 |
| Total | $– | $22,868,765 |
| From net realized gain | | |
| Class A | $46,028,719 | $46,063,469 |
| Class M | 15,636,386 | 14,617,860 |
| Class C | 2,884,159 | 2,740,366 |
| Class I | 37,198,863 | 33,253,804 |
| Class Z6 | 1,154,345 | 73,488 |
| Total | $102,902,472 | $96,748,987 |
| Advisor Freedom 2040 | | |
| From net investment income | | |
| Class A | $– | $8,881,190 |
| Class M | – | 2,655,243 |
| Class C | – | 390,961 |
| Class I | – | 8,816,392 |
| Class Z6 | – | 35,650 |
| Total | $– | $20,779,436 |
| From net realized gain | | |
| Class A | $40,182,941 | $40,808,993 |
| Class M | 14,775,205 | 14,342,170 |
| Class C | 3,650,217 | 3,641,921 |
| Class I | 33,884,549 | 31,372,523 |
| Class Z6 | 1,047,628 | 64,140 |
| Total | $93,540,540 | $90,229,747 |
| Advisor Freedom 2045 | | |
| From net investment income | | |
| Class A | $– | $5,219,007 |
| Class M | – | 1,576,055 |
| Class C | – | 129,725 |
| Class I | – | 5,947,360 |
| Class Z6 | – | 27,145 |
| Total | $– | $12,899,292 |
| From net realized gain | | |
| Class A | $23,066,720 | $20,301,003 |
| Class M | 8,519,585 | 7,111,464 |
| Class C | 1,280,087 | 1,051,413 |
| Class I | 22,361,223 | 17,635,957 |
| Class Z6 | 746,178 | 38,908 |
| Total | $55,973,793 | $46,138,745 |
| Advisor Freedom 2050 | | |
| From net investment income | | |
| Class A | $– | $3,857,081 |
| Class M | – | 1,283,517 |
| Class C | – | 145,803 |
| Class I | – | 4,942,896 |
| Class Z6 | – | 22,378 |
| Total | $– | $10,251,675 |
| From net realized gain | | |
| Class A | $16,599,749 | $13,859,582 |
| Class M | 6,720,507 | 5,314,395 |
| Class C | 1,333,297 | 1,032,638 |
| Class I | 18,744,933 | 13,916,045 |
| Class Z6 | 504,465 | 30,737 |
| Total | $43,902,951 | $34,153,397 |
| Advisor Freedom 2055 | | |
| From net investment income | | |
| Class A | $– | $1,844,591 |
| Class M | – | 555,719 |
| Class C | – | 45,985 |
| Class I | – | 2,580,264 |
| Class Z6 | – | 23,513 |
| Total | $– | $5,050,072 |
| From net realized gain | | |
| Class A | $7,394,439 | $4,611,171 |
| Class M | 2,760,331 | 1,578,617 |
| Class C | 408,582 | 232,494 |
| Class I | 9,950,581 | 5,016,561 |
| Class Z6 | 228,962 | 22,637 |
| Total | $20,742,895 | $11,461,480 |
| Advisor Freedom 2060 | | |
| From net investment income | | |
| Class A | $– | $303,602 |
| Class M | – | 87,416 |
| Class C | – | 11,911 |
| Class I | – | 372,369 |
| Class Z6 | – | 5,927 |
| Total | $– | $781,225 |
| From net realized gain | | |
| Class A | $1,198,775 | $536,013 |
| Class M | 420,164 | 172,103 |
| Class C | 83,471 | 34,235 |
| Class I | 1,487,383 | 555,272 |
| Class Z6 | 46,623 | 4,856 |
| Total | $3,236,416 | $1,302,479 |
(a) Distributions for Class Z6 are for the period June 6, 2017 (commencement of sale of shares) to March 31, 2018 .
9. Share Transactions.
Share transactions for each class were as follows and may contain automatic conversions between classes or exchanges between affiliated funds:
| | Shares | Shares | Dollars | Dollars |
| | Six months ended September 30, 2018 | Year ended March 31, 2018 (a) | Six months ended September 30, 2018 | Year endedMarch 31, 2018(a) |
| Advisor Freedom Income | | | | |
| Class A | | | | |
| Shares sold | 996,835 | 1,561,114 | $10,859,784 | $17,372,724 |
| Reinvestment of distributions | 136,668 | 267,313 | 1,480,997 | 2,956,413 |
| Shares redeemed | (1,515,915) | (2,954,671) | (16,513,977) | (32,858,285) |
| Net increase (decrease) | (382,412) | (1,126,244) | $(4,173,196) | $(12,529,148) |
| Class M | | | | |
| Shares sold | 338,494 | 1,231,544 | $3,687,532 | $13,671,270 |
| Reinvestment of distributions | 65,936 | 119,232 | 713,657 | 1,317,819 |
| Shares redeemed | (418,695) | (1,400,766) | (4,556,059) | (15,542,444) |
| Net increase (decrease) | (14,265) | (49,990) | $(154,870) | $(553,355) |
| Class C | | | | |
| Shares sold | 60,295 | 273,309 | $655,111 | $3,025,706 |
| Reinvestment of distributions | 19,254 | 33,546 | 207,871 | 370,253 |
| Shares redeemed | (168,288) | (379,554) | (1,827,961) | (4,206,642) |
| Net increase (decrease) | (88,739) | (72,699) | $(964,979) | $(810,683) |
| Class I | | | | |
| Shares sold | 1,760,317 | 2,536,795 | $19,232,847 | $28,278,478 |
| Reinvestment of distributions | 167,416 | 293,632 | 1,819,876 | 3,259,663 |
| Shares redeemed | (1,311,227) | (2,708,353) | (14,316,892) | (30,196,704) |
| Net increase (decrease) | 616,506 | 122,074 | $6,735,831 | $1,341,437 |
| Class Z6 | | | | |
| Shares sold | 1,435,123 | 206,804 | $15,663,682 | $2,315,726 |
| Reinvestment of distributions | 16,553 | 3,119 | 179,850 | 34,703 |
| Shares redeemed | (130,333) | (56,618) | (1,420,161) | (629,544) |
| Net increase (decrease) | 1,321,343 | 153,305 | $14,423,371 | $1,720,885 |
| Advisor Freedom 2005 | | | | |
| Class A | | | | |
| Shares sold | 619,381 | 1,335,163 | $7,312,002 | $16,124,405 |
| Reinvestment of distributions | 224,250 | 452,684 | 2,619,237 | 5,409,480 |
| Shares redeemed | (1,444,052) | (3,307,757) | (16,990,243) | (40,042,858) |
| Net increase (decrease) | (600,421) | (1,519,910) | $(7,059,004) | $(18,508,973) |
| Class M | | | | |
| Shares sold | 151,500 | 594,769 | $1,781,908 | $7,157,573 |
| Reinvestment of distributions | 57,123 | 108,652 | 666,621 | 1,298,447 |
| Shares redeemed | (226,431) | (833,574) | (2,663,126) | (10,035,595) |
| Net increase (decrease) | (17,808) | (130,153) | $(214,597) | $(1,579,575) |
| Class C | | | | |
| Shares sold | 10,732 | 112,314 | $126,233 | $1,348,518 |
| Reinvestment of distributions | 12,248 | 17,487 | 142,930 | 209,035 |
| Shares redeemed | (25,275) | (113,001) | (297,964) | (1,365,341) |
| Net increase (decrease) | (2,295) | 16,800 | $(28,801) | $192,212 |
| Class I | | | | |
| Shares sold | 837,759 | 1,578,344 | $9,916,811 | $19,235,581 |
| Reinvestment of distributions | 139,245 | 255,470 | 1,637,523 | 3,073,797 |
| Shares redeemed | (703,631) | (1,832,308) | (8,323,173) | (22,354,226) |
| Net increase (decrease) | 273,373 | 1,506 | $3,231,161 | $(44,848) |
| Class Z6 | | | | |
| Shares sold | 34,344 | 122,579 | $406,387 | $1,494,714 |
| Reinvestment of distributions | 3,717 | 722 | 43,643 | 8,706 |
| Shares redeemed | (19,048) | (5,951) | (225,165) | (71,881) |
| Net increase (decrease) | 19,013 | 117,350 | $224,865 | $1,431,539 |
| Advisor Freedom 2010 | | | | |
| Class A | | | | |
| Shares sold | 931,903 | 3,564,998 | $11,418,305 | $44,943,820 |
| Reinvestment of distributions | 567,867 | 1,224,022 | 6,899,587 | 15,229,168 |
| Shares redeemed | (3,161,825) | (7,574,224) | (38,667,927) | (95,614,997) |
| Net increase (decrease) | (1,662,055) | (2,785,204) | $(20,350,035) | $(35,442,009) |
| Class M | | | | |
| Shares sold | 399,815 | 1,361,175 | $4,869,856 | $17,164,227 |
| Reinvestment of distributions | 191,054 | 398,510 | 2,313,669 | 4,940,676 |
| Shares redeemed | (712,121) | (2,349,250) | (8,691,799) | (29,490,893) |
| Net increase (decrease) | (121,252) | (589,565) | $(1,508,274) | $(7,385,990) |
| Class C | | | | |
| Shares sold | 32,114 | 116,566 | $388,639 | $1,455,262 |
| Reinvestment of distributions | 61,598 | 120,905 | 741,019 | 1,491,052 |
| Shares redeemed | (254,529) | (499,934) | (3,084,191) | (6,234,706) |
| Net increase (decrease) | (160,817) | (262,463) | $(1,954,533) | $(3,288,392) |
| Class I | | | | |
| Shares sold | 1,349,440 | 3,628,003 | $16,570,718 | $46,034,277 |
| Reinvestment of distributions | 349,791 | 704,786 | 4,267,451 | 8,802,985 |
| Shares redeemed | (1,292,673) | (3,930,369) | (15,902,986) | (49,731,898) |
| Net increase (decrease) | 406,558 | 402,420 | $4,935,183 | $5,105,364 |
| Class Z6 | | | | |
| Shares sold | 106,088 | 425,699 | $1,307,738 | $5,402,891 |
| Reinvestment of distributions | 12,747 | 1,253 | 155,380 | 15,705 |
| Shares redeemed | (95,769) | (46,433) | (1,182,705) | (583,499) |
| Net increase (decrease) | 23,066 | 380,519 | $280,413 | $4,835,097 |
| Advisor Freedom 2015 | | | | |
| Class A | | | | |
| Shares sold | 2,125,583 | 6,359,677 | $26,370,386 | $81,015,805 |
| Reinvestment of distributions | 1,633,203 | 3,202,904 | 20,039,405 | 40,291,135 |
| Shares redeemed | (6,181,255) | (18,372,028) | (76,502,045) | (233,983,987) |
| Net increase (decrease) | (2,422,469) | (8,809,447) | $(30,092,254) | $(112,677,047) |
| Class M | | | | |
| Shares sold | 874,111 | 2,736,122 | $10,796,661 | $34,744,143 |
| Reinvestment of distributions | 490,432 | 907,945 | 6,007,786 | 11,406,069 |
| Shares redeemed | (1,602,424) | (4,687,987) | (19,798,178) | (59,601,397) |
| Net increase (decrease) | (237,881) | (1,043,920) | $(2,993,731) | $(13,451,185) |
| Class C | | | | |
| Shares sold | 177,394 | 430,509 | $2,171,246 | $5,422,977 |
| Reinvestment of distributions | 157,787 | 276,036 | 1,920,259 | 3,447,300 |
| Shares redeemed | (397,366) | (1,295,042) | (4,873,446) | (16,430,837) |
| Net increase (decrease) | (62,185) | (588,497) | $(781,941) | $(7,560,560) |
| Class I | | | | |
| Shares sold | 2,551,840 | 8,187,613 | $31,803,684 | $105,325,150 |
| Reinvestment of distributions | 960,336 | 1,790,662 | 11,879,368 | 22,716,014 |
| Shares redeemed | (3,500,071) | (9,768,474) | (43,717,096) | (125,622,049) |
| Net increase (decrease) | 12,105 | 209,801 | $(34,044) | $2,419,115 |
| Class Z6 | | | | |
| Shares sold | 222,505 | 1,089,010 | $2,778,094 | $14,093,662 |
| Reinvestment of distributions | 42,124 | 11,019 | 520,233 | 140,385 |
| Shares redeemed | (204,441) | (81,911) | (2,549,770) | (1,049,457) |
| Net increase (decrease) | 60,188 | 1,018,118 | $748,557 | $13,184,590 |
| Advisor Freedom 2020 | | | | |
| Class A | | | | |
| Shares sold | 5,757,426 | 15,638,670 | $77,974,056 | $215,678,977 |
| Reinvestment of distributions | 3,104,795 | 5,240,623 | 41,666,350 | 71,580,589 |
| Shares redeemed | (13,782,495) | (32,501,753) | (186,221,150) | (448,248,436) |
| Net increase (decrease) | (4,920,274) | (11,622,460) | $(66,580,744) | $(160,988,870) |
| Class M | | | | |
| Shares sold | 2,252,794 | 5,929,123 | $30,484,330 | $81,613,945 |
| Reinvestment of distributions | 964,675 | 1,564,174 | 12,945,948 | 21,368,634 |
| Shares redeemed | (3,499,342) | (9,968,053) | (47,335,011) | (137,166,621) |
| Net increase (decrease) | (281,873) | (2,474,756) | $(3,904,733) | $(34,184,042) |
| Class C | | | | |
| Shares sold | 392,761 | 948,078 | $5,273,161 | $12,932,083 |
| Reinvestment of distributions | 246,491 | 375,317 | 3,283,259 | 5,093,860 |
| Shares redeemed | (633,452) | (1,720,609) | (8,506,351) | (23,548,361) |
| Net increase (decrease) | 5,800 | (397,214) | $50,069 | $(5,522,418) |
| Class I | | | | |
| Shares sold | 7,749,708 | 18,997,484 | $105,514,474 | $264,269,563 |
| Reinvestment of distributions | 2,116,930 | 3,388,242 | 28,642,068 | 46,653,405 |
| Shares redeemed | (7,542,493) | (19,661,892) | (102,892,785) | (273,240,745) |
| Net increase (decrease) | 2,324,145 | 2,723,834 | $31,263,757 | $37,682,223 |
| Class Z6 | | | | |
| Shares sold | 1,008,219 | 2,198,548 | $13,779,911 | $31,162,379 |
| Reinvestment of distributions | 99,013 | 11,033 | 1,336,679 | 153,133 |
| Shares redeemed | (537,840) | (99,389) | (7,248,092) | (1,386,209) |
| Net increase (decrease) | 569,392 | 2,110,192 | $7,868,498 | $29,929,303 |
| Advisor Freedom 2025 | | | | |
| Class A | | | | |
| Shares sold | 7,727,707 | 21,155,632 | $105,082,687 | $291,258,604 |
| Reinvestment of distributions | 3,666,825 | 5,553,494 | 49,465,488 | 75,773,123 |
| Shares redeemed | (15,563,912) | (36,469,562) | (211,387,330) | (500,742,895) |
| Net increase (decrease) | (4,169,380) | (9,760,436) | $(56,839,155) | $(133,711,168) |
| Class M | | | | |
| Shares sold | 2,761,700 | 7,381,740 | $37,640,089 | $101,335,661 |
| Reinvestment of distributions | 1,089,369 | 1,551,203 | 14,717,379 | 21,218,934 |
| Shares redeemed | (3,729,447) | (9,297,407) | (50,776,113) | (127,887,305) |
| Net increase (decrease) | 121,622 | (364,464) | $1,581,355 | $(5,332,710) |
| Class C | | | | |
| Shares sold | 374,310 | 1,054,413 | $5,014,018 | $14,230,748 |
| Reinvestment of distributions | 246,159 | 326,578 | 3,271,448 | 4,400,480 |
| Shares redeemed | (681,904) | (1,717,786) | (9,127,365) | (23,308,720) |
| Net increase (decrease) | (61,435) | (336,795) | $(841,899) | $(4,677,492) |
| Class I | | | | |
| Shares sold | 9,891,281 | 25,378,468 | $135,551,153 | $351,808,654 |
| Reinvestment of distributions | 2,638,201 | 3,774,323 | 35,879,552 | 51,976,785 |
| Shares redeemed | (10,401,600) | (21,969,142) | (142,757,344) | (304,482,920) |
| Net increase (decrease) | 2,127,882 | 7,183,649 | $28,673,361 | $99,302,519 |
| Class Z6 | | | | |
| Shares sold | 1,306,665 | 1,889,983 | $17,972,239 | $26,814,303 |
| Reinvestment of distributions | 90,478 | 12,099 | 1,228,688 | 168,542 |
| Shares redeemed | (595,690) | (102,569) | (8,074,201) | (1,434,592) |
| Net increase (decrease) | 801,453 | 1,799,513 | $11,126,726 | $25,548,253 |
| Advisor Freedom 2030 | | | | |
| Class A | | | | |
| Shares sold | 7,312,686 | 18,673,471 | $108,244,266 | $278,431,607 |
| Reinvestment of distributions | 3,688,448 | 5,074,757 | 54,109,564 | 75,068,077 |
| Shares redeemed | (12,829,139) | (31,998,170) | (189,677,578) | (475,713,945) |
| Net increase (decrease) | (1,828,005) | (8,249,942) | $(27,323,748) | $(122,214,261) |
| Class M | | | | |
| Shares sold | 2,940,850 | 6,811,790 | $43,327,842 | $100,640,388 |
| Reinvestment of distributions | 1,216,232 | 1,596,336 | 17,757,001 | 23,510,770 |
| Shares redeemed | (3,249,829) | (9,448,868) | (47,850,527) | (139,471,738) |
| Net increase (decrease) | 907,253 | (1,040,742) | $13,234,316 | $(15,320,580) |
| Class C | | | | |
| Shares sold | 475,900 | 964,743 | $6,914,339 | $14,139,943 |
| Reinvestment of distributions | 260,314 | 315,301 | 3,753,725 | 4,593,826 |
| Shares redeemed | (506,080) | (1,529,804) | (7,365,341) | (22,415,105) |
| Net increase (decrease) | 230,134 | (249,760) | $3,302,723 | $(3,681,336) |
| Class I | | | | |
| Shares sold | 9,897,405 | 24,584,566 | $147,134,579 | $367,677,762 |
| Reinvestment of distributions | 2,819,129 | 3,663,231 | 41,582,158 | 54,563,348 |
| Shares redeemed | (9,380,308) | (20,246,824) | (139,734,381) | (302,278,371) |
| Net increase (decrease) | 3,336,226 | 8,000,973 | $48,982,356 | $119,962,739 |
| Class Z6 | | | | |
| Shares sold | 1,393,458 | 1,841,365 | $20,792,658 | $28,526,620 |
| Reinvestment of distributions | 106,976 | 14,449 | 1,574,692 | 218,332 |
| Shares redeemed | (241,551) | (68,960) | (3,597,470) | (1,049,203) |
| Net increase (decrease) | 1,258,883 | 1,786,854 | $18,769,880 | $27,695,749 |
| Advisor Freedom 2035 | | | | |
| Class A | | | | |
| Shares sold | 6,617,634 | 16,076,305 | $96,202,015 | $233,388,018 |
| Reinvestment of distributions | 3,183,186 | 3,857,946 | 45,837,907 | 55,595,824 |
| Shares redeemed | (10,509,089) | (28,095,944) | (152,546,370) | (406,790,784) |
| Net increase (decrease) | (708,269) | (8,161,693) | $(10,506,448) | $(117,806,942) |
| Class M | | | | |
| Shares sold | 2,701,510 | 6,398,268 | $38,940,620 | $91,831,716 |
| Reinvestment of distributions | 1,087,369 | 1,206,444 | 15,516,791 | 17,272,407 |
| Shares redeemed | (3,027,363) | (7,462,512) | (43,588,981) | (106,846,943) |
| Net increase (decrease) | 761,516 | 142,200 | $10,868,430 | $2,257,180 |
| Class C | | | | |
| Shares sold | 302,357 | 693,842 | $4,282,581 | $9,794,664 |
| Reinvestment of distributions | 203,626 | 212,457 | 2,852,804 | 2,989,811 |
| Shares redeemed | (346,677) | (945,420) | (4,890,074) | (13,367,741) |
| Net increase (decrease) | 159,306 | (39,121) | $2,245,311 | $(583,266) |
| Class I | | | | |
| Shares sold | 8,876,110 | 21,843,836 | $129,750,617 | $318,376,949 |
| Reinvestment of distributions | 2,493,002 | 2,892,062 | 36,173,457 | 42,049,701 |
| Shares redeemed | (9,167,571) | (16,207,972) | (134,377,707) | (235,522,368) |
| Net increase (decrease) | 2,201,541 | 8,527,926 | $31,546,367 | $124,904,282 |
| Class Z6 | | | | |
| Shares sold | 1,119,601 | 1,087,189 | $16,435,157 | $16,548,830 |
| Reinvestment of distributions | 79,580 | 7,787 | 1,153,912 | 115,481 |
| Shares redeemed | (133,843) | (24,549) | (1,964,892) | (369,912) |
| Net increase (decrease) | 1,065,338 | 1,070,427 | $15,624,177 | $16,294,399 |
| Advisor Freedom 2040 | | | | |
| Class A | | | | |
| Shares sold | 5,291,321 | 13,534,093 | $82,421,615 | $210,888,429 |
| Reinvestment of distributions | 2,591,702 | 3,189,871 | 39,989,970 | 49,256,170 |
| Shares redeemed | (8,620,917) | (22,500,034) | (134,165,834) | (348,416,945) |
| Net increase (decrease) | (737,894) | (5,776,070) | $(11,754,249) | $(88,272,346) |
| Class M | | | | |
| Shares sold | 2,264,833 | 5,361,973 | $35,114,373 | $82,647,592 |
| Reinvestment of distributions | 954,523 | 1,095,300 | 14,651,940 | 16,854,754 |
| Shares redeemed | (2,369,247) | (6,875,453) | (36,711,065) | (106,016,831) |
| Net increase (decrease) | 850,109 | (418,180) | $13,055,248 | $(6,514,485) |
| Class C | | | | |
| Shares sold | 318,813 | 663,291 | $4,842,094 | $10,055,292 |
| Reinvestment of distributions | 241,780 | 263,236 | 3,636,371 | 3,975,590 |
| Shares redeemed | (473,956) | (987,718) | (7,211,474) | (15,051,497) |
| Net increase (decrease) | 86,637 | (61,191) | $1,266,991 | $(1,020,615) |
| Class I | | | | |
| Shares sold | 7,283,415 | 18,668,939 | $114,098,178 | $291,013,150 |
| Reinvestment of distributions | 2,127,525 | 2,537,951 | 33,040,481 | 39,478,312 |
| Shares redeemed | (7,343,745) | (15,449,375) | (115,187,547) | (239,687,652) |
| Net increase (decrease) | 2,067,195 | 5,757,515 | $31,951,112 | $90,803,810 |
| Class Z6 | | | | |
| Shares sold | 1,237,560 | 794,020 | $19,344,195 | $12,962,617 |
| Reinvestment of distributions | 67,539 | 6,296 | 1,047,531 | 99,790 |
| Shares redeemed | (122,933) | (47,766) | (1,942,739) | (764,460) |
| Net increase (decrease) | 1,182,166 | 752,550 | $18,448,987 | $12,297,947 |
| Advisor Freedom 2045 | | | | |
| Class A | | | | |
| Shares sold | 5,540,787 | 13,727,303 | $67,280,091 | $165,419,383 |
| Reinvestment of distributions | 1,916,259 | 2,111,307 | 23,052,622 | 25,306,735 |
| Shares redeemed | (7,501,670) | (18,819,577) | (91,007,898) | (226,166,494) |
| Net increase (decrease) | (44,624) | (2,980,967) | $(675,185) | $(35,440,376) |
| Class M | | | | |
| Shares sold | 2,216,052 | 5,337,435 | $26,687,806 | $63,538,185 |
| Reinvestment of distributions | 710,078 | 725,117 | 8,471,240 | 8,629,046 |
| Shares redeemed | (2,235,640) | (5,588,094) | (26,920,363) | (66,670,324) |
| Net increase (decrease) | 690,490 | 474,458 | $8,238,683 | $5,496,907 |
| Class C | | | | |
| Shares sold | 235,030 | 538,892 | $2,794,542 | $6,337,359 |
| Reinvestment of distributions | 108,295 | 100,141 | 1,275,718 | 1,176,826 |
| Shares redeemed | (213,850) | (569,666) | (2,547,234) | (6,680,355) |
| Net increase (decrease) | 129,475 | 69,367 | $1,523,026 | $833,830 |
| Class I | | | | |
| Shares sold | 7,637,522 | 18,230,130 | $93,291,481 | $220,391,466 |
| Reinvestment of distributions | 1,788,223 | 1,909,984 | 21,655,388 | 23,065,247 |
| Shares redeemed | (6,515,473) | (13,073,999) | (79,729,403) | (157,647,342) |
| Net increase (decrease) | 2,910,272 | 7,066,115 | $35,217,466 | $85,809,371 |
| Class Z6 | | | | |
| Shares sold | 1,149,345 | 773,539 | $14,051,844 | $9,848,378 |
| Reinvestment of distributions | 61,617 | 5,348 | 746,178 | 66,053 |
| Shares redeemed | (158,151) | (36,784) | (1,935,283) | (463,616) |
| Net increase (decrease) | 1,052,811 | 742,103 | $12,862,739 | $9,450,815 |
| Advisor Freedom 2050 | | | | |
| Class A | | | | |
| Shares sold | 5,073,711 | 11,534,676 | $61,462,990 | $138,373,199 |
| Reinvestment of distributions | 1,380,223 | 1,468,363 | 16,576,501 | 17,545,962 |
| Shares redeemed | (6,609,335) | (14,017,700) | (80,032,798) | (167,648,735) |
| Net increase (decrease) | (155,401) | (1,014,661) | $(1,993,307) | $(11,729,574) |
| Class M | | | | |
| Shares sold | 2,062,217 | 4,567,158 | $24,835,580 | $54,283,581 |
| Reinvestment of distributions | 556,145 | 548,964 | 6,640,384 | 6,528,163 |
| Shares redeemed | (1,850,058) | (4,589,984) | (22,258,225) | (54,563,744) |
| Net increase (decrease) | 768,304 | 526,138 | $9,217,739 | $6,248,000 |
| Class C | | | | |
| Shares sold | 227,524 | 549,763 | $2,706,833 | $6,479,431 |
| Reinvestment of distributions | 112,829 | 99,910 | 1,331,387 | 1,175,213 |
| Shares redeemed | (217,352) | (472,463) | (2,579,111) | (5,565,541) |
| Net increase (decrease) | 123,001 | 177,210 | $1,459,109 | $2,089,103 |
| Class I | | | | |
| Shares sold | 7,551,921 | 15,917,116 | $92,061,405 | $191,830,629 |
| Reinvestment of distributions | 1,504,665 | 1,535,401 | 18,191,406 | 18,474,731 |
| Shares redeemed | (5,773,584) | (11,055,908) | (70,455,685) | (132,614,886) |
| Net increase (decrease) | 3,283,002 | 6,396,609 | $39,797,126 | $77,690,474 |
| Class Z6 | | | | |
| Shares sold | 844,980 | 472,741 | $10,268,898 | $5,954,232 |
| Reinvestment of distributions | 41,760 | 4,315 | 504,465 | 53,115 |
| Shares redeemed | (101,432) | (34,945) | (1,238,521) | (435,038) |
| Net increase (decrease) | 785,308 | 442,111 | $9,534,842 | $5,572,309 |
| Advisor Freedom 2055 | | | | |
| Class A | | | | |
| Shares sold | 3,573,122 | 7,389,570 | $47,678,222 | $97,025,975 |
| Reinvestment of distributions | 558,186 | 464,392 | 7,390,389 | 6,094,883 |
| Shares redeemed | (4,280,792) | (6,137,615) | (57,286,182) | (80,819,354) |
| Net increase (decrease) | (149,484) | 1,716,347 | $(2,217,571) | $22,301,504 |
| Class M | | | | |
| Shares sold | 1,173,618 | 2,572,643 | $15,592,036 | $33,545,253 |
| Reinvestment of distributions | 208,976 | 162,770 | 2,752,216 | 2,128,319 |
| Shares redeemed | (816,055) | (2,024,835) | (10,812,735) | (26,432,101) |
| Net increase (decrease) | 566,539 | 710,578 | $7,531,517 | $9,241,471 |
| Class C | | | | |
| Shares sold | 104,713 | 234,550 | $1,383,317 | $3,032,224 |
| Reinvestment of distributions | 31,189 | 21,409 | 408,573 | 278,373 |
| Shares redeemed | (80,806) | (154,192) | (1,063,909) | (2,007,723) |
| Net increase (decrease) | 55,096 | 101,767 | $727,981 | $1,302,874 |
| Class I | | | | |
| Shares sold | 6,388,305 | 9,490,266 | $85,734,442 | $125,145,410 |
| Reinvestment of distributions | 712,867 | 575,059 | 9,473,996 | 7,595,782 |
| Shares redeemed | (2,978,672) | (5,026,424) | (39,965,891) | (66,081,707) |
| Net increase (decrease) | 4,122,500 | 5,038,901 | $55,242,547 | $66,659,485 |
| Class Z6 | | | | |
| Shares sold | 423,615 | 249,882 | $5,669,060 | $3,376,620 |
| Reinvestment of distributions | 17,228 | 3,421 | 228,962 | 46,150 |
| Shares redeemed | (52,366) | (21,021) | (704,704) | (287,425) |
| Net increase (decrease) | 388,477 | 232,282 | $5,193,318 | $3,135,345 |
| Advisor Freedom 2060 | | | | |
| Class A | | | | |
| Shares sold | 1,409,138 | 2,518,107 | $16,755,217 | $29,318,657 |
| Reinvestment of distributions | 101,462 | 69,940 | 1,198,268 | 818,159 |
| Shares redeemed | (807,527) | (1,111,272) | (9,601,382) | (13,053,777) |
| Net increase (decrease) | 703,073 | 1,476,775 | $8,352,103 | $17,083,039 |
| Class M | | | | |
| Shares sold | 531,130 | 853,066 | $6,318,556 | $9,913,922 |
| Reinvestment of distributions | 35,607 | 22,158 | 420,164 | 259,519 |
| Shares redeemed | (248,149) | (341,132) | (2,949,070) | (4,020,381) |
| Net increase (decrease) | 318,588 | 534,092 | $3,789,650 | $6,153,060 |
| Class C | | | | |
| Shares sold | 89,752 | 143,405 | $1,067,443 | $1,675,744 |
| Reinvestment of distributions | 7,067 | 3,926 | 83,466 | 46,030 |
| Shares redeemed | (34,893) | (39,845) | (412,410) | (460,687) |
| Net increase (decrease) | 61,926 | 107,486 | $738,499 | $1,261,087 |
| Class I | | | | |
| Shares sold | 2,046,344 | 2,852,854 | $24,436,879 | $33,462,097 |
| Reinvestment of distributions | 122,001 | 78,919 | 1,445,706 | 927,618 |
| Shares redeemed | (880,429) | (957,855) | (10,533,837) | (11,278,135) |
| Net increase (decrease) | 1,287,916 | 1,973,918 | $15,348,748 | $23,111,580 |
| Class Z6 | | | | |
| Shares sold | 116,143 | 137,048 | $1,386,144 | $1,670,098 |
| Reinvestment of distributions | 3,934 | 901 | 46,623 | 10,783 |
| Shares redeemed | (42,819) | (70,553) | (513,319) | (867,591) |
| Net increase (decrease) | 77,258 | 67,396 | $919,448 | $813,290 |
(a) Share transactions for Class Z6 are for the period June 6, 2017 (commencement of sale of shares) to March 31, 2018
10. Other.
The Funds' organizational documents provide former and current trustees and officers with a limited indemnification against liabilities arising in connection with the performance of their duties to the Funds. In the normal course of business, the Funds may also enter into contracts that provide general indemnifications. The Funds' maximum exposure under these arrangements is unknown as this would be dependent on future claims that may be made against the Funds. The risk of material loss from such claims is considered remote.
The Funds do not invest in the Underlying Funds for the purpose of exercising management or control; however, investments by the Funds within their principal investment strategies may represent a significant portion of the Underlying Fund's net assets. At the end of the period, the following Funds were the owners of record of 10% or more of the total outstanding shares of the Underlying Funds.
| Fund | Fidelity Advisor Freedom 2020 Fund | Fidelity Advisor Freedom 2025 Fund | Fidelity Advisor Freedom 2030 Fund | Fidelity Advisor Freedom 2035 Fund | Fidelity Advisor Freedom 2040 Fund | Fidelity Advisor Freedom 2045 Fund |
| Fidelity Advisor Series Equity Growth Fund | 10% | 14% | 17% | 16% | 15% | 10% |
| Fidelity Advisor Series Growth Opportunities Fund | 10% | 14% | 17% | 16% | 15% | 10% |
| Fidelity Advisor Series Small Cap Fund | 10% | 14% | 17% | 16% | 15% | 10% |
The Funds, in aggregate, were the owners of record of more than 20% of the total outstanding shares of the following Underlying Funds.
| Fund | % of shares held |
| Fidelity Advisor Series Equity Growth Fund | 99% |
| Fidelity Advisor Series Growth Opportunities Fund | 99% |
| Fidelity Advisor Series Small Cap Fund | 99% |
Shareholder Expense Example
As a shareholder of a Fund, you incur two types of costs: (1) transaction costs, including sales charges (loads) on purchase payments or redemption proceeds, and (2) ongoing costs, including distribution and/or service (12b-1) fees and other Fund expenses. This Example is intended to help you understand your ongoing costs (in dollars) of investing in the Funds and to compare these costs with the ongoing costs of investing in other mutual funds.
The Example is based on an investment of $1,000 invested at the beginning of the period and held for the entire period (April 1, 2018 to September 30, 2018).
Actual Expenses
The first line of the accompanying table for each Class of each fund provides information about actual account values and actual expenses. You may use the information in this line, together with the amount you invested, to estimate the expenses that you paid over the period. Simply divide your account value by $1,000.00 (for example, an $8,600 account value divided by $1,000.00 = 8.6), then multiply the result by the number in the first line for a Class of the fund under the heading entitled "Expenses Paid During Period" to estimate the expenses you paid on your account during this period. In addition, each Fund, as a shareholder in underlying Fidelity Funds, will indirectly bear its pro-rata share of the fees and expenses incurred by the underlying Fidelity Funds. These fees and expenses are not included in each Fund's annualized expense ratio used to calculate the expense estimates in the table below.
Hypothetical Example for Comparison Purposes
The second line of the accompanying table for each Class of each fund provides information about hypothetical account values and hypothetical expenses based on a Class' actual expense ratio and an assumed rate of return of 5% per year before expenses, which is not the Class' actual return. The hypothetical account values and expenses may not be used to estimate the actual ending account balance or expenses you paid for the period. You may use this information to compare the ongoing costs of investing in the Fund and other funds. To do so, compare this 5% hypothetical example with the 5% hypothetical examples that appear in the shareholder reports of the other funds. In addition, each Fund, as a shareholder in underlying Fidelity Funds, will indirectly bear its pro-rata share of the fees and expenses incurred by the underlying Fidelity Funds. These fees and expenses are not included in each Fund's annualized expense ratio used to calculate the expense estimates in the table below.
Please note that the expenses shown in the table are meant to highlight your ongoing costs only and do not reflect any transaction costs. Therefore, the second line of the table is useful in comparing ongoing costs only, and will not help you determine the relative total costs of owning different funds. In addition, if these transactional costs were included, your costs would have been higher.
| | Annualized Expense Ratio-A | Beginning
Account Value
April 1, 2018 | Ending
Account Value
September 30, 2018 | Expenses Paid
During Period-B
April 1, 2018
to September 30, 2018 |
| Advisor Freedom Income | | | | |
| Class A | .71% | | | |
| Actual | | $1,000.00 | $1,008.30 | $3.57 |
| Hypothetical-C | | $1,000.00 | $1,021.51 | $3.60 |
| Class M | .96% | | | |
| Actual | | $1,000.00 | $1,007.00 | $4.83 |
| Hypothetical-C | | $1,000.00 | $1,020.26 | $4.86 |
| Class C | 1.46% | | | |
| Actual | | $1,000.00 | $1,004.60 | $7.34 |
| Hypothetical-C | | $1,000.00 | $1,017.75 | $7.39 |
| Class I | .47% | | | |
| Actual | | $1,000.00 | $1,008.90 | $2.37 |
| Hypothetical-C | | $1,000.00 | $1,022.71 | $2.38 |
| Class Z6 | .37% | | | |
| Actual | | $1,000.00 | $1,009.80 | $1.86 |
| Hypothetical-C | | $1,000.00 | $1,023.21 | $1.88 |
| Advisor Freedom 2005 | | | | |
| Class A | .73% | | | |
| Actual | | $1,000.00 | $1,013.70 | $3.69 |
| Hypothetical-C | | $1,000.00 | $1,021.41 | $3.70 |
| Class M | .98% | | | |
| Actual | | $1,000.00 | $1,012.20 | $4.94 |
| Hypothetical-C | | $1,000.00 | $1,020.16 | $4.96 |
| Class C | 1.48% | | | |
| Actual | | $1,000.00 | $1,008.60 | $7.45 |
| Hypothetical-C | | $1,000.00 | $1,017.65 | $7.49 |
| Class I | .48% | | | |
| Actual | | $1,000.00 | $1,015.10 | $2.42 |
| Hypothetical-C | | $1,000.00 | $1,022.66 | $2.43 |
| Class Z6 | .37% | | | |
| Actual | | $1,000.00 | $1,014.90 | $1.87 |
| Hypothetical-C | | $1,000.00 | $1,023.21 | $1.88 |
| Advisor Freedom 2010 | | | | |
| Class A | .77% | | | |
| Actual | | $1,000.00 | $1,018.50 | $3.90 |
| Hypothetical-C | | $1,000.00 | $1,021.21 | $3.90 |
| Class M | 1.02% | | | |
| Actual | | $1,000.00 | $1,017.00 | $5.16 |
| Hypothetical-C | | $1,000.00 | $1,019.95 | $5.17 |
| Class C | 1.52% | | | |
| Actual | | $1,000.00 | $1,014.20 | $7.67 |
| Hypothetical-C | | $1,000.00 | $1,017.45 | $7.69 |
| Class I | .53% | | | |
| Actual | | $1,000.00 | $1,019.10 | $2.68 |
| Hypothetical-C | | $1,000.00 | $1,022.41 | $2.69 |
| Class Z6 | .39% | | | |
| Actual | | $1,000.00 | $1,019.80 | $1.97 |
| Hypothetical-C | | $1,000.00 | $1,023.11 | $1.98 |
| Advisor Freedom 2015 | | | | |
| Class A | .82% | | | |
| Actual | | $1,000.00 | $1,023.40 | $4.16 |
| Hypothetical-C | | $1,000.00 | $1,020.96 | $4.15�� |
| Class M | 1.07% | | | |
| Actual | | $1,000.00 | $1,021.90 | $5.42 |
| Hypothetical-C | | $1,000.00 | $1,019.70 | $5.42 |
| Class C | 1.57% | | | |
| Actual | | $1,000.00 | $1,019.90 | $7.95 |
| Hypothetical-C | | $1,000.00 | $1,017.20 | $7.94 |
| Class I | .57% | | | |
| Actual | | $1,000.00 | $1,024.70 | $2.89 |
| Hypothetical-C | | $1,000.00 | $1,022.21 | $2.89 |
| Class Z6 | .41% | | | |
| Actual | | $1,000.00 | $1,025.50 | $2.08 |
| Hypothetical-C | | $1,000.00 | $1,023.01 | $2.08 |
| Advisor Freedom 2020 | | | | |
| Class A | .86% | | | |
| Actual | | $1,000.00 | $1,027.40 | $4.37 |
| Hypothetical-C | | $1,000.00 | $1,020.76 | $4.36 |
| Class M | 1.11% | | | |
| Actual | | $1,000.00 | $1,026.00 | $5.64 |
| Hypothetical-C | | $1,000.00 | $1,019.50 | $5.62 |
| Class C | 1.61% | | | |
| Actual | | $1,000.00 | $1,023.20 | $8.17 |
| Hypothetical-C | | $1,000.00 | $1,017.00 | $8.14 |
| Class I | .61% | | | |
| Actual | | $1,000.00 | $1,028.60 | $3.10 |
| Hypothetical-C | | $1,000.00 | $1,022.01 | $3.09 |
| Class Z6 | .43% | | | |
| Actual | | $1,000.00 | $1,029.70 | $2.19 |
| Hypothetical-C | | $1,000.00 | $1,022.91 | $2.18 |
| Advisor Freedom 2025 | | | | |
| Class A | .90% | | | |
| Actual | | $1,000.00 | $1,031.40 | $4.58 |
| Hypothetical-C | | $1,000.00 | $1,020.56 | $4.56 |
| Class M | 1.15% | | | |
| Actual | | $1,000.00 | $1,029.90 | $5.85 |
| Hypothetical-C | | $1,000.00 | $1,019.30 | $5.82 |
| Class C | 1.65% | | | |
| Actual | | $1,000.00 | $1,027.30 | $8.39 |
| Hypothetical-C | | $1,000.00 | $1,016.80 | $8.34 |
| Class I | .65% | | | |
| Actual | | $1,000.00 | $1,032.60 | $3.31 |
| Hypothetical-C | | $1,000.00 | $1,021.81 | $3.29 |
| Class Z6 | .45% | | | |
| Actual | | $1,000.00 | $1,033.60 | $2.29 |
| Hypothetical-C | | $1,000.00 | $1,022.81 | $2.28 |
| Advisor Freedom 2030 | | | | |
| Class A | .94% | | | |
| Actual | | $1,000.00 | $1,038.80 | $4.80 |
| Hypothetical-C | | $1,000.00 | $1,020.36 | $4.76 |
| Class M | 1.19% | | | |
| Actual | | $1,000.00 | $1,037.70 | $6.08 |
| Hypothetical-C | | $1,000.00 | $1,019.10 | $6.02 |
| Class C | 1.70% | | | |
| Actual | | $1,000.00 | $1,034.80 | $8.67 |
| Hypothetical-C | | $1,000.00 | $1,016.55 | $8.59 |
| Class I | .70% | | | |
| Actual | | $1,000.00 | $1,040.00 | $3.58 |
| Hypothetical-C | | $1,000.00 | $1,021.56 | $3.55 |
| Class Z6 | .47% | | | |
| Actual | | $1,000.00 | $1,041.20 | $2.40 |
| Hypothetical-C | | $1,000.00 | $1,022.71 | $2.38 |
| Advisor Freedom 2035 | | | | |
| Class A | .99% | | | |
| Actual | | $1,000.00 | $1,047.20 | $5.08 |
| Hypothetical-C | | $1,000.00 | $1,020.10 | $5.01 |
| Class M | 1.24% | | | |
| Actual | | $1,000.00 | $1,045.50 | $6.36 |
| Hypothetical-C | | $1,000.00 | $1,018.85 | $6.28 |
| Class C | 1.74% | | | |
| Actual | | $1,000.00 | $1,042.70 | $8.91 |
| Hypothetical-C | | $1,000.00 | $1,016.34 | $8.80 |
| Class I | .74% | | | |
| Actual | | $1,000.00 | $1,048.30 | $3.80 |
| Hypothetical-C | | $1,000.00 | $1,021.36 | $3.75 |
| Class Z6 | .49% | | | |
| Actual | | $1,000.00 | $1,049.00 | $2.52 |
| Hypothetical-C | | $1,000.00 | $1,022.61 | $2.48 |
| Advisor Freedom 2040 | | | | |
| Class A | 1.00% | | | |
| Actual | | $1,000.00 | $1,049.70 | $5.14 |
| Hypothetical-C | | $1,000.00 | $1,020.05 | $5.06 |
| Class M | 1.25% | | | |
| Actual | | $1,000.00 | $1,048.60 | $6.42 |
| Hypothetical-C | | $1,000.00 | $1,018.80 | $6.33 |
| Class C | 1.75% | | | |
| Actual | | $1,000.00 | $1,046.20 | $8.98 |
| Hypothetical-C | | $1,000.00 | $1,016.29 | $8.85 |
| Class I | .75% | | | |
| Actual | | $1,000.00 | $1,050.70 | $3.86 |
| Hypothetical-C | | $1,000.00 | $1,021.31 | $3.80 |
| Class Z6 | .49% | | | |
| Actual | | $1,000.00 | $1,052.10 | $2.52 |
| Hypothetical-C | | $1,000.00 | $1,022.61 | $2.48 |
| Advisor Freedom 2045 | | | | |
| Class A | 1.00% | | | |
| Actual | | $1,000.00 | $1,049.30 | $5.14 |
| Hypothetical-C | | $1,000.00 | $1,020.05 | $5.06 |
| Class M | 1.25% | | | |
| Actual | | $1,000.00 | $1,048.00 | $6.42 |
| Hypothetical-C | | $1,000.00 | $1,018.80 | $6.33 |
| Class C | 1.75% | | | |
| Actual | | $1,000.00 | $1,045.10 | $8.97 |
| Hypothetical-C | | $1,000.00 | $1,016.29 | $8.85 |
| Class I | .75% | | | |
| Actual | | $1,000.00 | $1,050.70 | $3.86 |
| Hypothetical-C | | $1,000.00 | $1,021.31 | $3.80 |
| Class Z6 | .49% | | | |
| Actual | | $1,000.00 | $1,052.40 | $2.52 |
| Hypothetical-C | | $1,000.00 | $1,022.61 | $2.48 |
| Advisor Freedom 2050 | | | | |
| Class A | 1.00% | | | |
| Actual | | $1,000.00 | $1,050.00 | $5.14 |
| Hypothetical-C | | $1,000.00 | $1,020.05 | $5.06 |
| Class M | 1.25% | | | |
| Actual | | $1,000.00 | $1,048.50 | $6.42 |
| Hypothetical-C | | $1,000.00 | $1,018.80 | $6.33 |
| Class C | 1.75% | | | |
| Actual | | $1,000.00 | $1,045.60 | $8.97 |
| Hypothetical-C | | $1,000.00 | $1,016.29 | $8.85 |
| Class I | .75% | | | |
| Actual | | $1,000.00 | $1,050.50 | $3.86 |
| Hypothetical-C | | $1,000.00 | $1,021.31 | $3.80 |
| Class Z6 | .49% | | | |
| Actual | | $1,000.00 | $1,052.20 | $2.52 |
| Hypothetical-C | | $1,000.00 | $1,022.61 | $2.48 |
| Advisor Freedom 2055 | | | | |
| Class A | 1.00% | | | |
| Actual | | $1,000.00 | $1,049.60 | $5.14 |
| Hypothetical-C | | $1,000.00 | $1,020.05 | $5.06 |
| Class M | 1.25% | | | |
| Actual | | $1,000.00 | $1,048.30 | $6.42 |
| Hypothetical-C | | $1,000.00 | $1,018.80 | $6.33 |
| Class C | 1.75% | | | |
| Actual | | $1,000.00 | $1,045.50 | $8.97 |
| Hypothetical-C | | $1,000.00 | $1,016.29 | $8.85 |
| Class I | .75% | | | |
| Actual | | $1,000.00 | $1,051.00 | $3.86 |
| Hypothetical-C | | $1,000.00 | $1,021.31 | $3.80 |
| Class Z6 | .49% | | | |
| Actual | | $1,000.00 | $1,051.80 | $2.52 |
| Hypothetical-C | | $1,000.00 | $1,022.61 | $2.48 |
| Advisor Freedom 2060 | | | | |
| Class A | 1.00% | | | |
| Actual | | $1,000.00 | $1,049.50 | $5.14 |
| Hypothetical-C | | $1,000.00 | $1,020.05 | $5.06 |
| Class M | 1.25% | | | |
| Actual | | $1,000.00 | $1,048.70 | $6.42 |
| Hypothetical-C | | $1,000.00 | $1,018.80 | $6.33 |
| Class C | 1.75% | | | |
| Actual | | $1,000.00 | $1,046.00 | $8.98 |
| Hypothetical-C | | $1,000.00 | $1,016.29 | $8.85 |
| Class I | .75% | | | |
| Actual | | $1,000.00 | $1,051.10 | $3.86 |
| Hypothetical-C | | $1,000.00 | $1,021.31 | $3.80 |
| Class Z6 | .49% | | | |
| Actual | | $1,000.00 | $1,051.90 | $2.52 |
| Hypothetical-C | | $1,000.00 | $1,022.61 | $2.48 |
A Annualized expense ratio reflects expenses net of applicable fee waivers.
B Expenses are equal to each Class' annualized expense ratio, multiplied by the average account value over the period, multiplied by 183/ 365 (to reflect the one-half year period). The fees and expenses of the underlying Fidelity Funds in which each Fund invests are not included in each Class' annualized expense ratio.
C 5% return per year before expenses
Board Approval of Investment Advisory Contracts and Management Fees
Fidelity Advisor Freedom Funds
Each year, the Board of Trustees, including the Independent Trustees (together, the Board), votes on the renewal of the management contract (the Advisory Contract) with FMR Co., Inc. (FMRC), an affiliate of Fidelity Management & Research Company (FMR), for each fund. The Board, assisted by the advice of fund counsel and Independent Trustees' counsel, requests and considers a broad range of information relevant to the renewal of the Advisory Contracts throughout the year.
The Board meets regularly and, at each of its meetings, covers an extensive agenda of topics and materials and considers factors that are relevant to its annual consideration of the renewal of each fund's Advisory Contract, including the services and support provided to each fund and its shareholders. The Board has established four standing committees (Committees) — Operations, Audit, Fair Valuation, and Governance and Nominating — each composed of and chaired by Independent Trustees with varying backgrounds, to which the Board has assigned specific subject matter responsibilities in order to enhance effective decision-making by the Board. The Operations Committee, of which all of the Independent Trustees are members, meets regularly throughout the year and considers, among other matters, information specifically related to the annual consideration of the renewal of each fund's Advisory Contract. The Board, acting directly and through its Committees, requests and receives information concerning the annual consideration of the renewal of each fund's Advisory Contract. The Board also meets as needed to review matters specifically related to the Board's annual consideration of the renewal of the Advisory Contracts. Members of the Board may also meet with trustees of other Fidelity funds through joint ad hoc committees to discuss certain matters relevant to all of the Fidelity funds.
At its September 2018 meeting, the Board unanimously determined to renew each fund's Advisory Contract. In reaching its determination, the Board considered all factors it believed relevant, including (i) the nature, extent, and quality of the services to be provided to each fund and its shareholders (including the investment performance of each fund); (ii) the competitiveness of each fund's management fee and total expense ratio relative to peer funds; (iii) the total costs of the services to be provided by and the profits to be realized by Fidelity from its relationships with each fund; and (iv) the extent to which, if any, economies of scale exist and would be realized as each fund grows, and whether any economies of scale are appropriately shared with fund shareholders. The Board also considered that, effective June 1, 2017, each fund had implemented a new fee structure whereby it pays an all-inclusive management fee that covers all operating expenses of the fund, subject to certain exceptions, and varies by class (unified fee) and the underlying Fidelity funds in which the fund invests (Series Funds) no longer pay expenses, with certain limited exceptions. In connection with the renewal of the Advisory Contracts for the funds, the Board and the board of other funds that invest their assets in Series Funds and the boards of the Series Funds formed a joint ad hoc committee to review the responsibilities of each board related to the consideration of the renewal of the Advisory Contracts for the funds, other funds that invest substantially all of their assets in Series Funds, and the Series Funds.
In considering whether to renew the Advisory Contract for each fund, the Board reached a determination, with the assistance of fund counsel and Independent Trustees' counsel and through the exercise of its business judgment, that the renewal of the Advisory Contract was in the best interests of each fund and its shareholders and that the compensation payable under the Advisory Contracts was fair and reasonable. The Board's decision to renew the Advisory Contracts was not based on any single factor, but rather was based on a comprehensive consideration of all the information provided to the Board at its meetings throughout the year. The Board, in reaching its determination to renew the Advisory Contracts, was aware that shareholders of each fund have a broad range of investment choices available to them, including a wide choice among funds offered by Fidelity's competitors, and that each fund's shareholders, who have the opportunity to review and weigh the disclosure provided by the fund in its prospectus and other public disclosures, have chosen to invest in that fund, which is part of the Fidelity family of funds.
Nature, Extent, and Quality of Services Provided. The Board considered Fidelity's staffing as it relates to the funds, including the backgrounds of investment personnel of FMRC, and also considered the funds' investment objectives, strategies, and related investment philosophies. The Independent Trustees also had discussions with senior management of Fidelity's investment operations and investment groups with responsibility for the Series Funds. The Board considered the structure of the investment personnel compensation program and whether this structure provides appropriate incentives to act in the best interests of each fund. Additionally, the Board considered the portfolio managers' investments, if any, in the funds that they manage.
Resources Dedicated to Investment Management and Support Services. The Board reviewed the general qualifications and capabilities of Fidelity's investment staff, including its size, education, experience, and resources, as well as Fidelity's approach to recruiting, managing, and compensating investment personnel. The Board noted that Fidelity has continued to increase the resources devoted to non-U.S. offices, including expansion of Fidelity's global investment organization. The Board also noted that Fidelity's analysts have extensive resources, tools and capabilities that allow them to conduct sophisticated quantitative and fundamental analysis, as well as credit analysis of issuers, counterparties and guarantors. Further, the Board considered that Fidelity's investment professionals have sufficient access to global information and data so as to provide competitive investment results over time, and that those professionals also have access to sophisticated tools that permit them to assess portfolio construction and risk and performance attribution characteristics continuously, as well as to transmit new information and research conclusions rapidly around the world. Additionally, in its deliberations, the Board considered Fidelity's risk management, compliance, and technology and operations capabilities and resources, which are integral parts of the investment management process.
Shareholder and Administrative Services. The Board considered (i) the nature, extent, quality, and cost of advisory, administrative, and shareholder services performed by Fidelity under the Advisory Contract and under separate agreements covering transfer agency and pricing and bookkeeping services for each fund; (ii) the nature and extent of the supervision of third party service providers, principally custodians, subcustodians, and pricing vendors; and (iii) the resources devoted to, and the record of compliance with, each fund's compliance policies and procedures.
The Board noted that the growth of fund assets over time across the complex allows Fidelity to reinvest in the development of services designed to enhance the value and convenience of the Fidelity funds as investment vehicles. These services include 24-hour access to account information and market information through telephone representatives and over the Internet, investor education materials and asset allocation tools, and the expanded availability of Fidelity Investor Centers.
Investment in a Large Fund Family. The Board considered the benefits to shareholders of investing in a Fidelity fund, including the benefits of investing in a fund that is part of a large family of funds offering a variety of investment disciplines and providing a large variety of mutual fund investor services. The Board noted that Fidelity had taken, or had made recommendations that resulted in the Fidelity funds taking, a number of actions over the previous year that benefited particular funds, including: (i) continuing to dedicate additional resources to Fidelity's investment research process, which includes meetings with management of issuers of securities in which the funds invest, and to the support of the senior management team that oversees asset management; (ii) continuing efforts to enhance Fidelity's global research capabilities; (iii) launching new funds and making other enhancements to meet client needs; (iv) launching new share classes of existing funds; (v) eliminating purchase minimums and broadening eligibility requirements for certain funds and share classes; (vi) reducing management fees and total expenses for certain growth equity funds and index funds; (vii) lowering expense caps for certain existing funds and classes, and converting certain voluntary expense caps to contractual caps, to reduce expenses borne by shareholders; (viii) eliminating short-term redemption fees for funds that had such fees; (ix) rationalizing product lines and gaining increased efficiencies from fund mergers and share class consolidations; (x) continuing to develop, acquire and implement systems and technology to improve services to the funds and shareholders, strengthen information security, and increase efficiency; and (xi) continuing to implement enhancements to further strengthen Fidelity's product line to increase investors' probability of success in achieving their investment goals, including retirement income goals.
Investment Performance. The Board considered whether each fund has operated in accordance with its investment objective, as well as its record of compliance with its investment restrictions and its performance history.
The Board took into account discussions that occur at Board meetings throughout the year with representatives of the investment adviser about fund investment performance. In this regard the Board noted that as part of regularly scheduled fund reviews and other reports to the Board on fund performance, the Board considers annualized return information for each fund for different time periods, measured against one or more appropriate securities market indices, including a customized blended index that reflects the respective weights of the fund's asset classes (each a "benchmark index") and a peer group of funds with similar objectives ("peer group"), if any. In its evaluation of fund investment performance at meetings throughout the year, the Board gave particular attention to information indicating underperformance of certain Fidelity funds for specific time periods and discussed with the investment adviser the reasons for such underperformance.
In addition to reviewing absolute and relative fund performance, the Independent Trustees periodically consider the appropriateness of fund performance metrics in evaluating the results achieved. In general, the Independent Trustees believe that fund performance should be evaluated based on gross performance (before fees and expenses, including acquired fund fees and expenses, but after transaction costs, if any) compared to appropriate benchmark indices, over appropriate time periods that may include full market cycles, and on net performance (after fees and expenses, including acquired fund fees and expenses, if any) compared to peer groups, as applicable, over the same periods, taking into account relevant factors including the following: general market conditions; the extent to which particular underlying funds affected performance; and fund cash flows and other factors. Depending on the circumstances, the Independent Trustees may be satisfied with a fund's performance notwithstanding that it lags its benchmark index or peer group for certain periods.
The Independent Trustees recognize that shareholders evaluate performance on a net basis over their own holding periods, for which one-, three-, and five-year periods are often used as a proxy. For this reason, the performance information reviewed by the Board also included net cumulative calendar year total return information for each fund and an appropriate benchmark index for the most recent one-, three-, and five-year periods (for the most recent one- and three-year periods for Fidelity Advisor Freedom 2060 Fund).
Based on its review, the Board concluded that the nature, extent, and quality of services provided to each fund under the Advisory Contracts should continue to benefit the shareholders of each fund.
Competitiveness of Management Fee and Total Expense Ratio. The Board considered each fund's management fee and total expense ratio compared to "mapped groups" of competitive funds and classes created for the purpose of facilitating the Trustees' competitive analysis of management fees and total expenses. Fidelity creates "mapped groups" by combining similar Lipper investment objective categories that have comparable investment mandates. Combining Lipper investment objective categories aids the Board's management fee and total expense ratio comparisons by broadening the competitive group used for comparison.
Management Fee. The Board considered two proprietary management fee comparisons for the 12-month periods shown in basis points (BP) in the charts below. The group of Lipper funds used by the Board for management fee comparisons is referred to below as the "Total Mapped Group." The Total Mapped Group comparison focuses on a fund's standing in terms of gross management fees before expense reimbursements or caps relative to the total universe of funds with comparable investment mandates, regardless of whether their management fee structures also are comparable. Funds with comparable investment mandates offer exposure to similar types of securities. Funds with comparable management fee structures have similar management fee contractual arrangements (
e.g., flat rate charged for advisory services, all-inclusive fee rate,
etc.). "TMG %" represents the percentage of funds in the Total Mapped Group that had management fees that were lower than a fund's. For example, a hypothetical TMG % of 20% would mean that 80% of the funds in the Total Mapped Group had higher, and 20% had lower, management fees than a fund. The funds' actual TMG %s and the number of funds in the Total Mapped Group are in the charts below. The "Asset-Size Peer Group" (ASPG) comparison focuses on a fund's standing relative to a subset of non-Fidelity funds within the Total Mapped Group that are similar in size and management fee structure. For example, if a fund is in the first quartile of the ASPG, the fund's management fee ranks in the least expensive or lowest 25% of funds in the ASPG. The ASPG represents at least 15% of the funds in the Total Mapped Group with comparable asset size and management fee structures, subject to a minimum of 50 funds (or all funds in the Total Mapped Group if fewer than 50). Additional information, such as the ASPG quartile in which a fund's management fee rate ranked, is also included in the charts and was considered by the Board. The Board considered that the charts below reflect the funds' fee structure effective June 1, 2017, as if it was in effect for the entire year.
Fidelity Advisor Freedom 2005 Fund
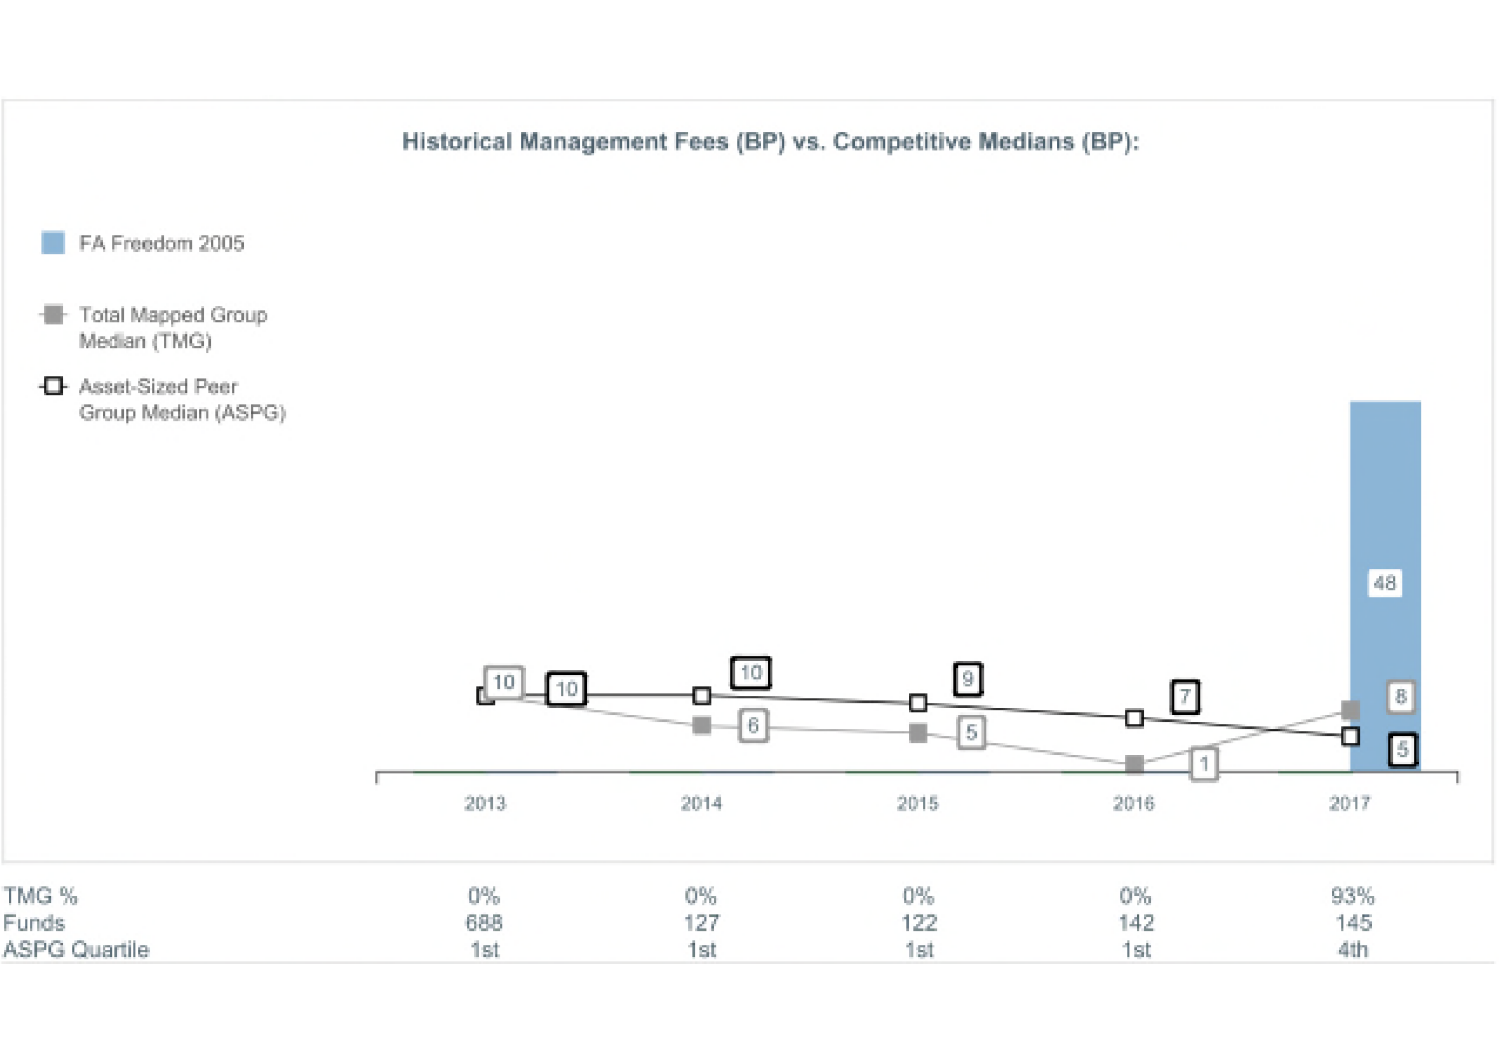
Fidelity Advisor Freedom 2010 Fund
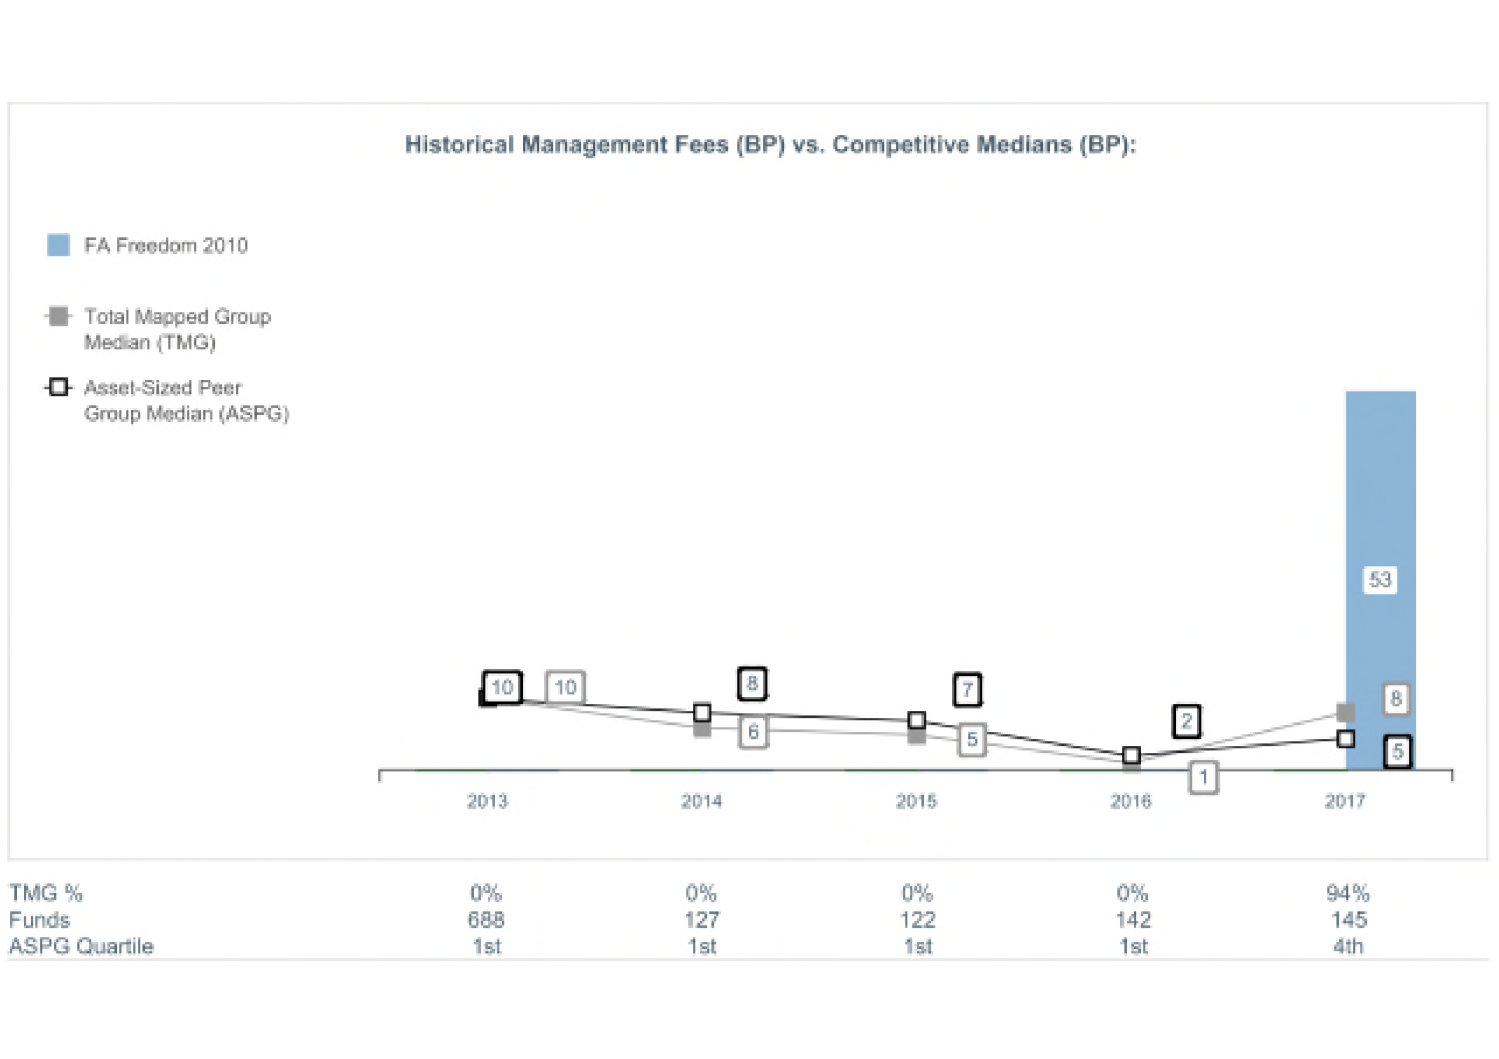
Fidelity Advisor Freedom 2015 Fund
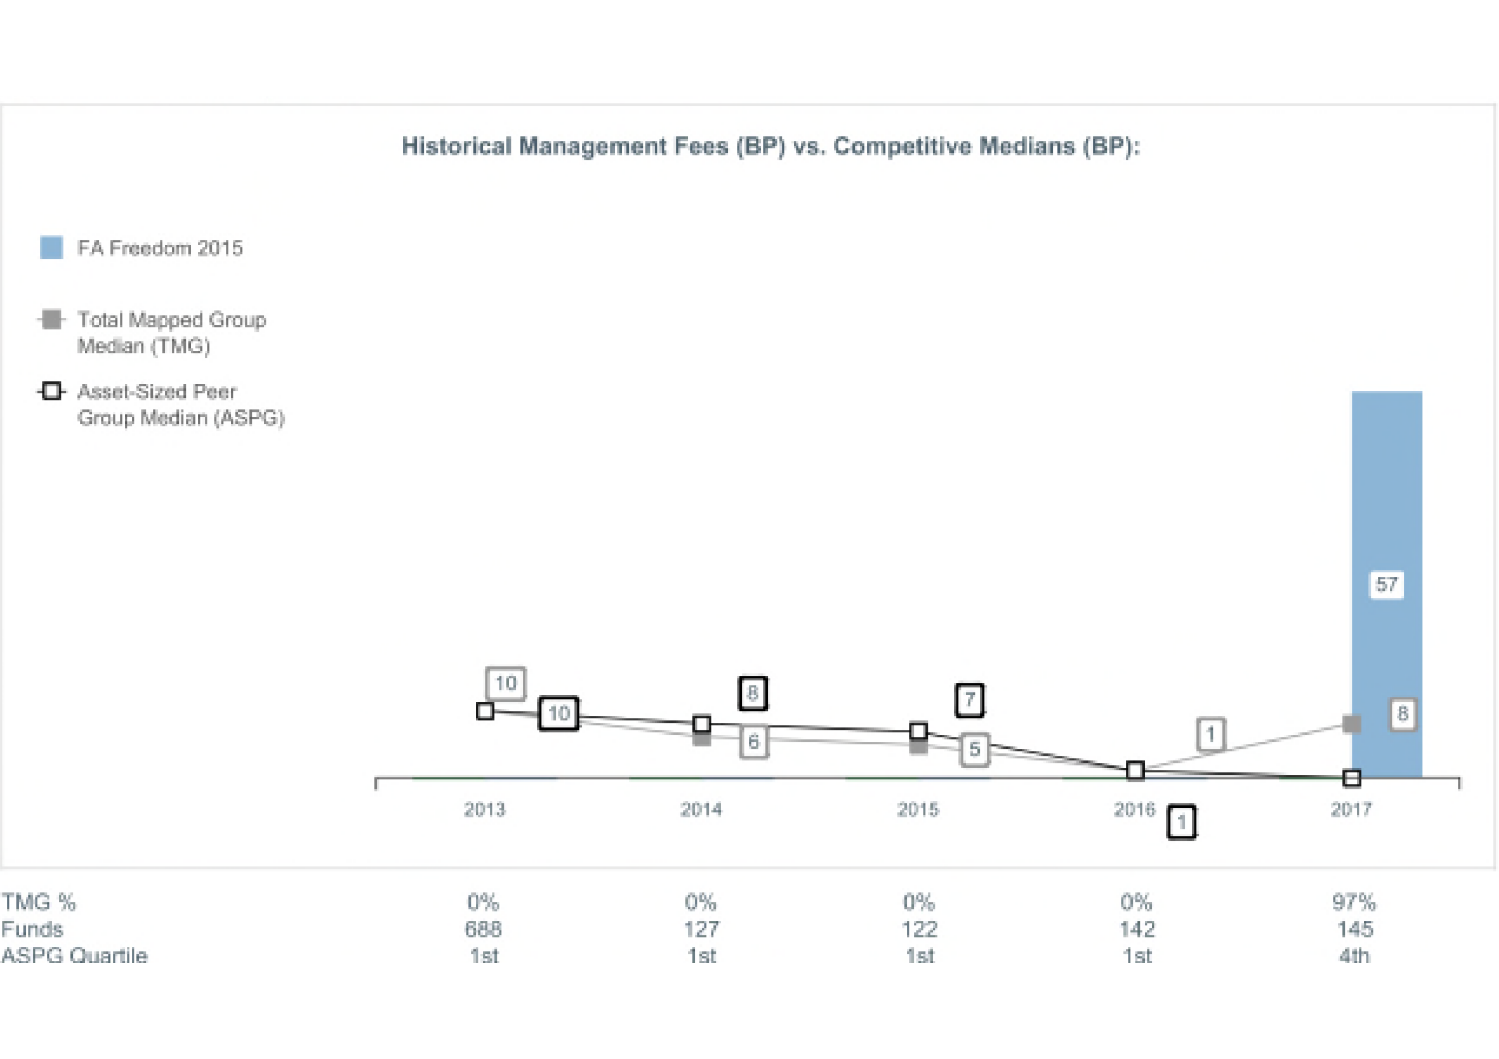
Fidelity Advisor Freedom 2020 Fund
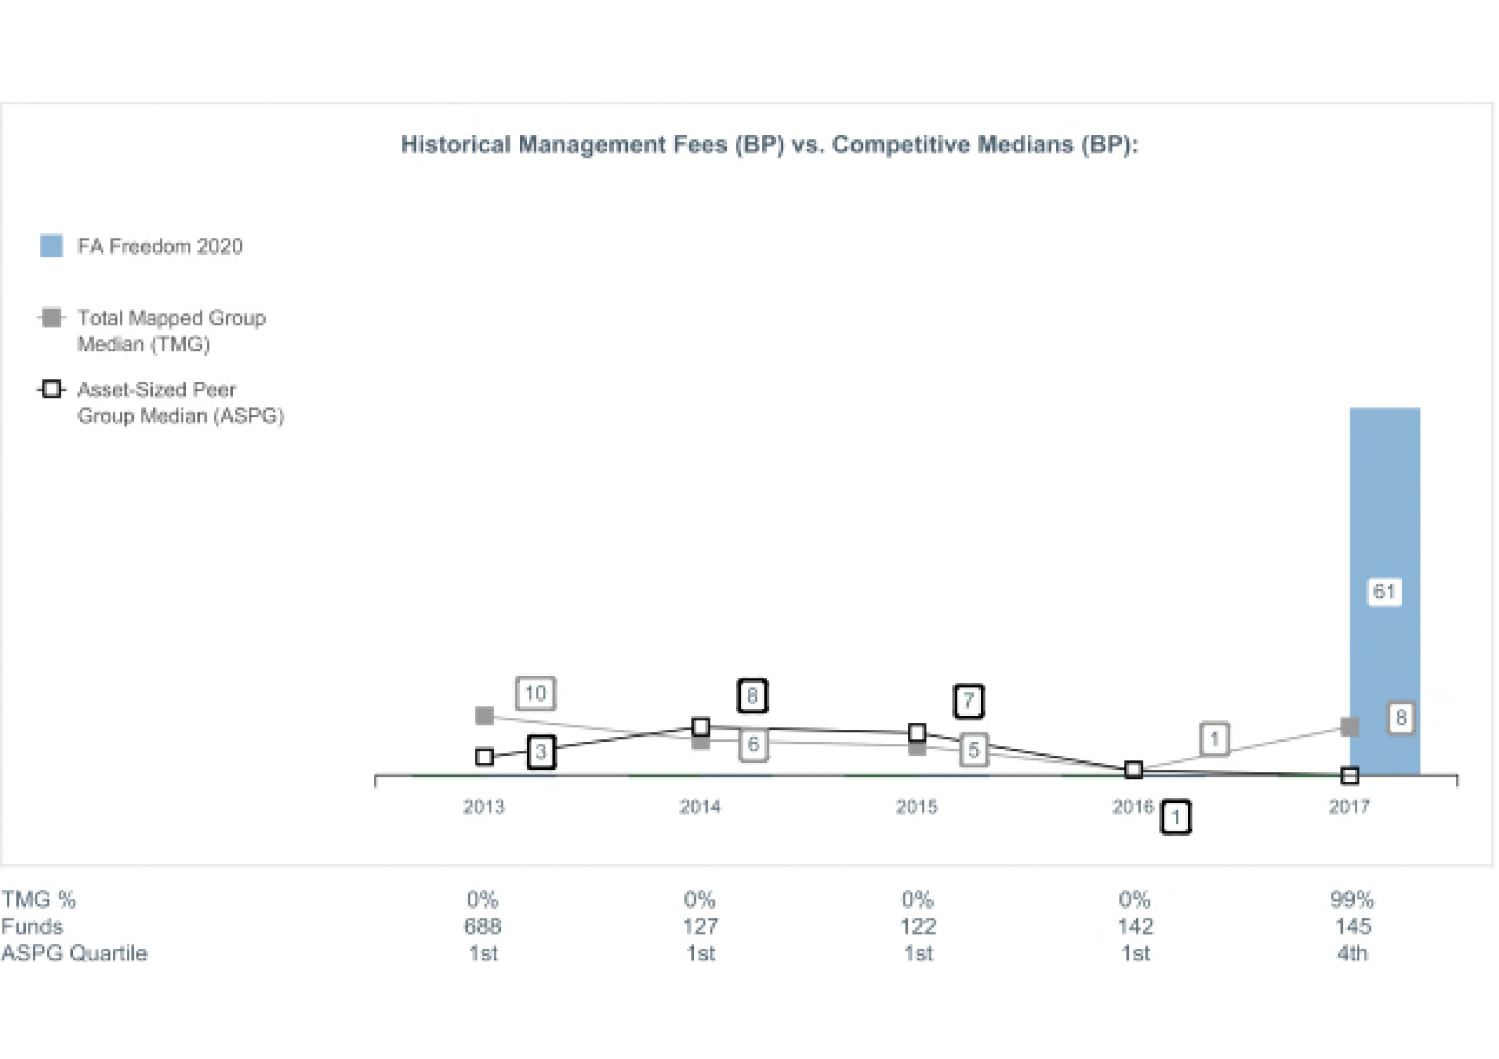
Fidelity Advisor Freedom 2025 Fund
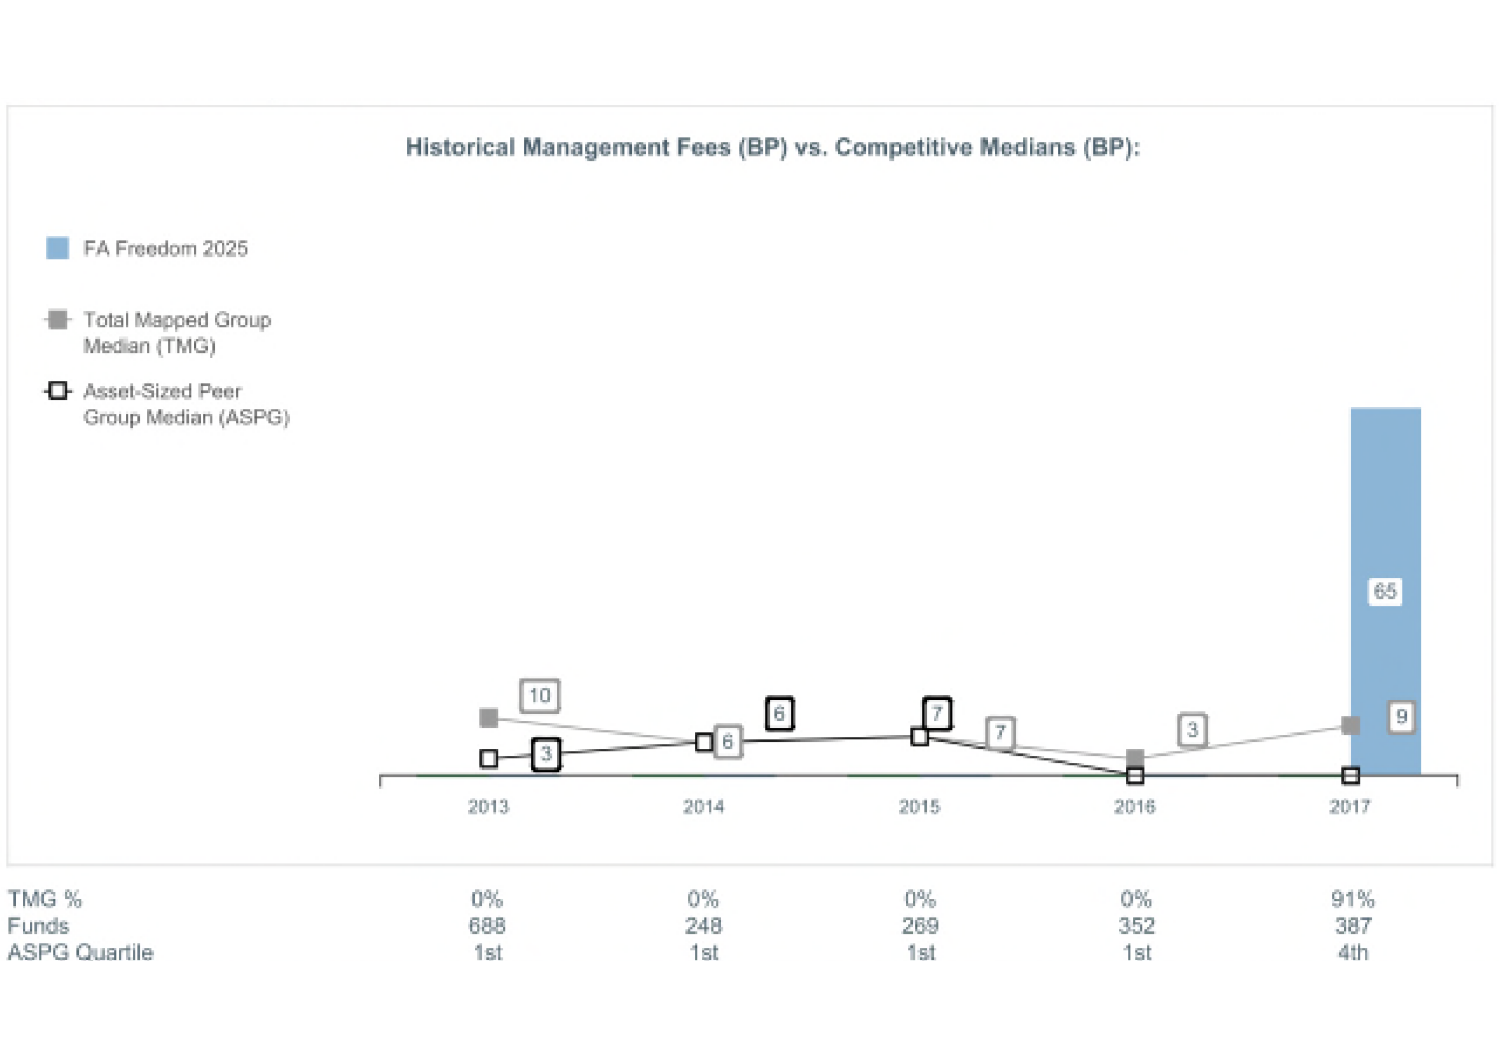
Fidelity Advisor Freedom 2030 Fund
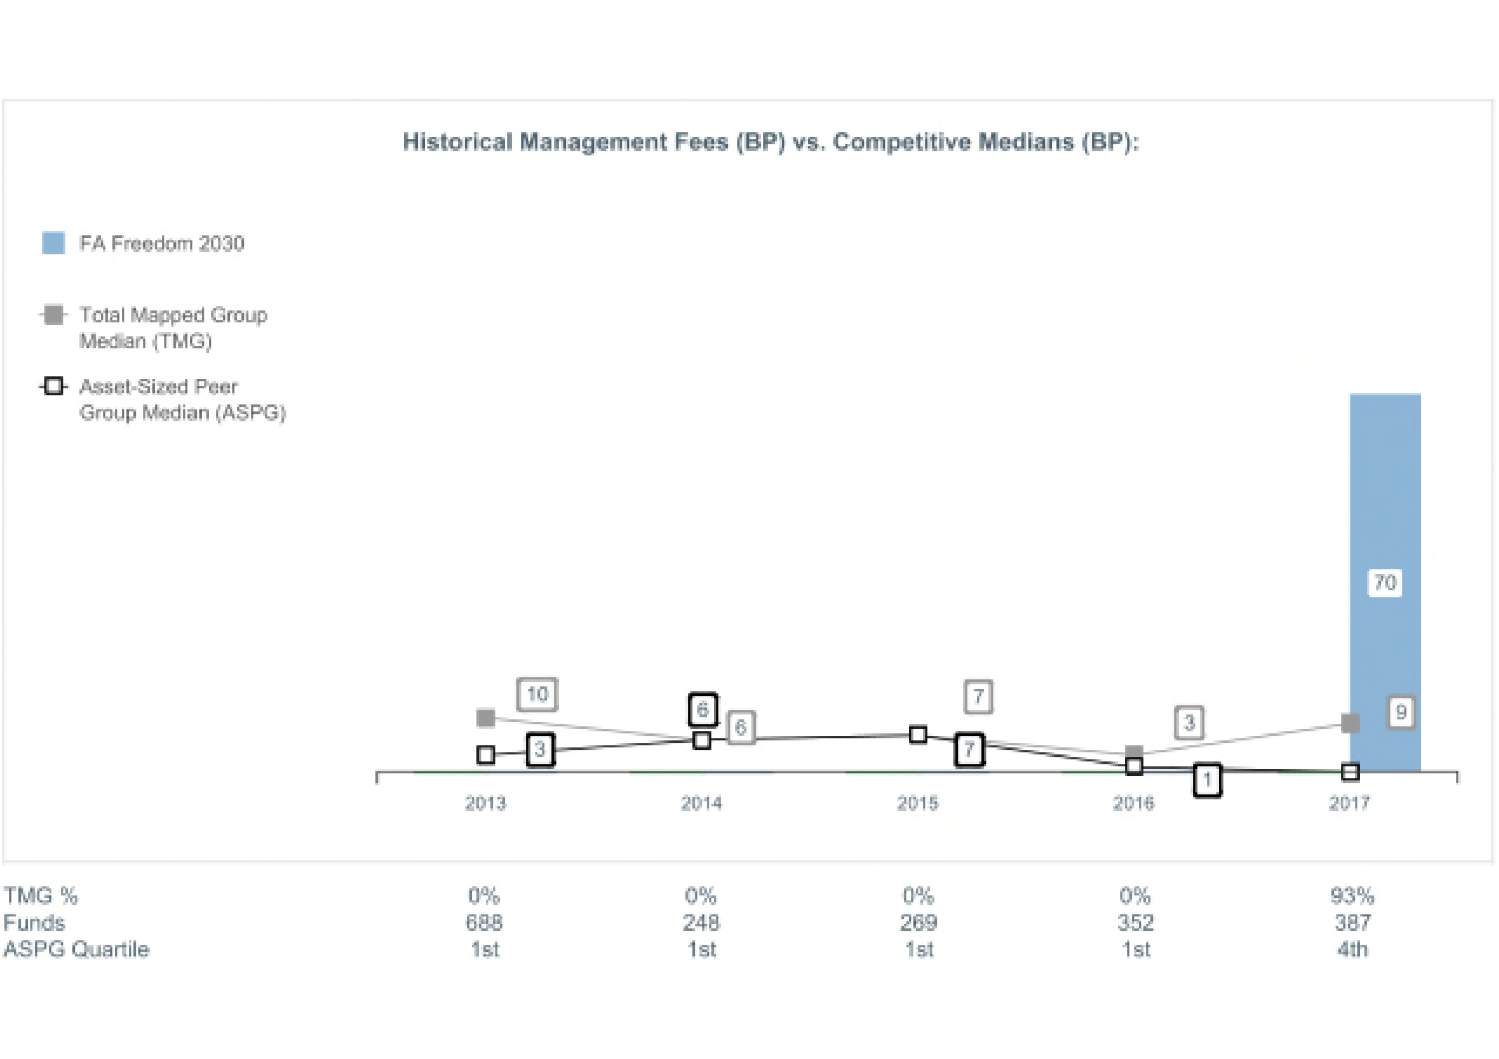
Fidelity Advisor Freedom 2035 Fund
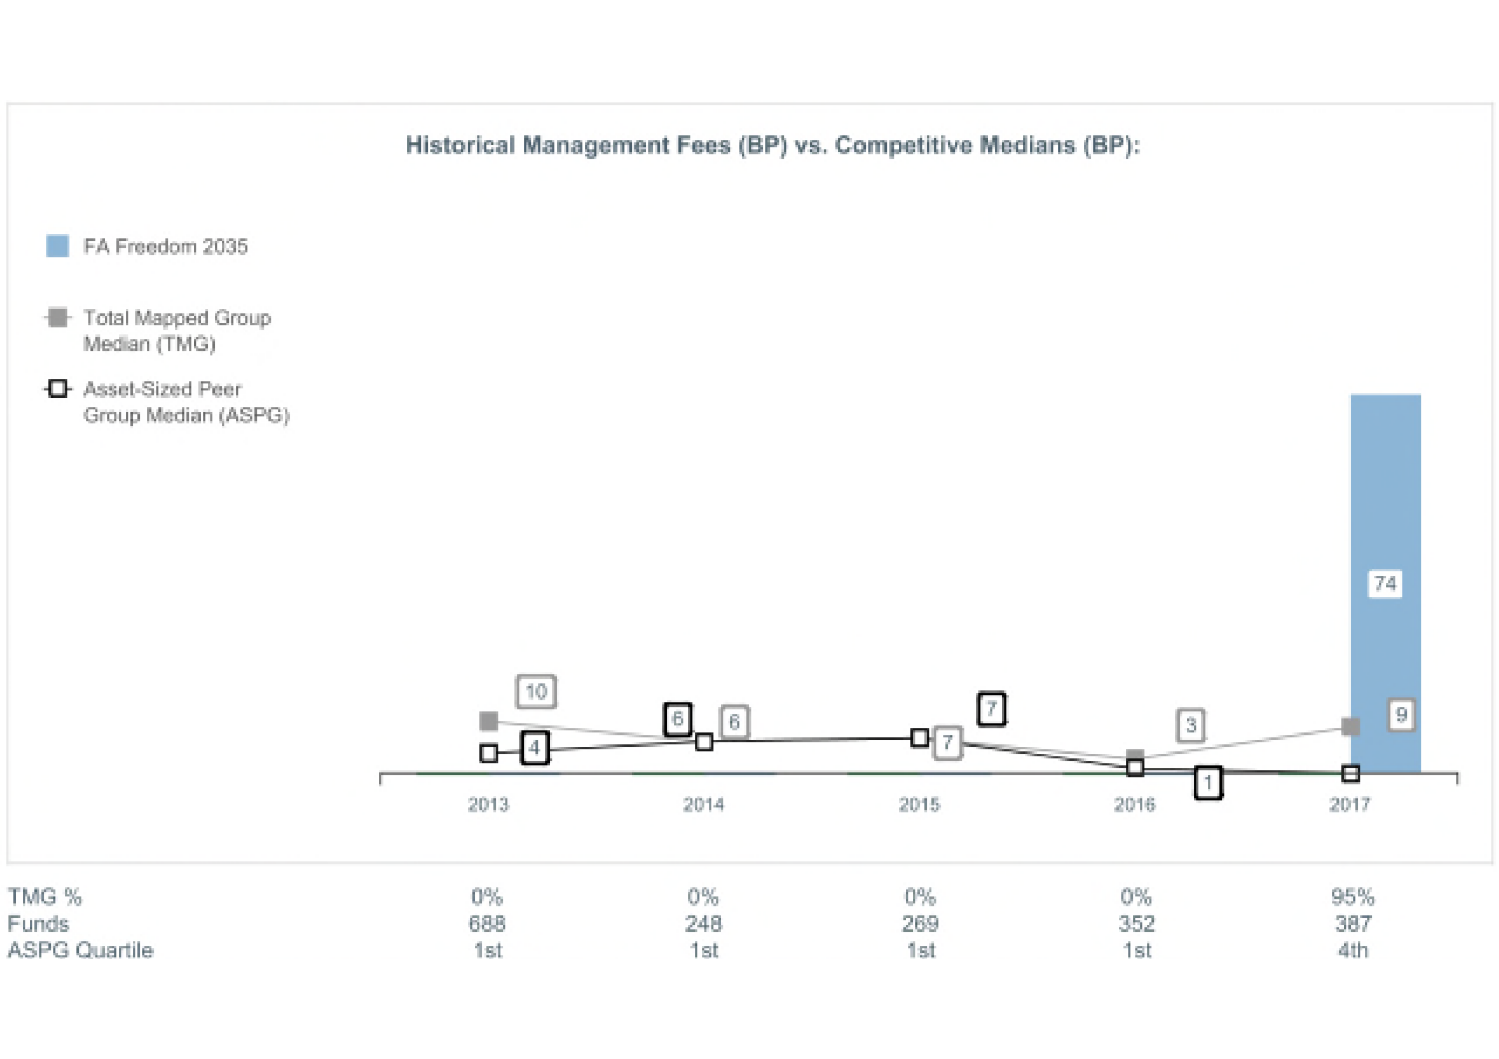
Fidelity Advisor Freedom 2040 Fund
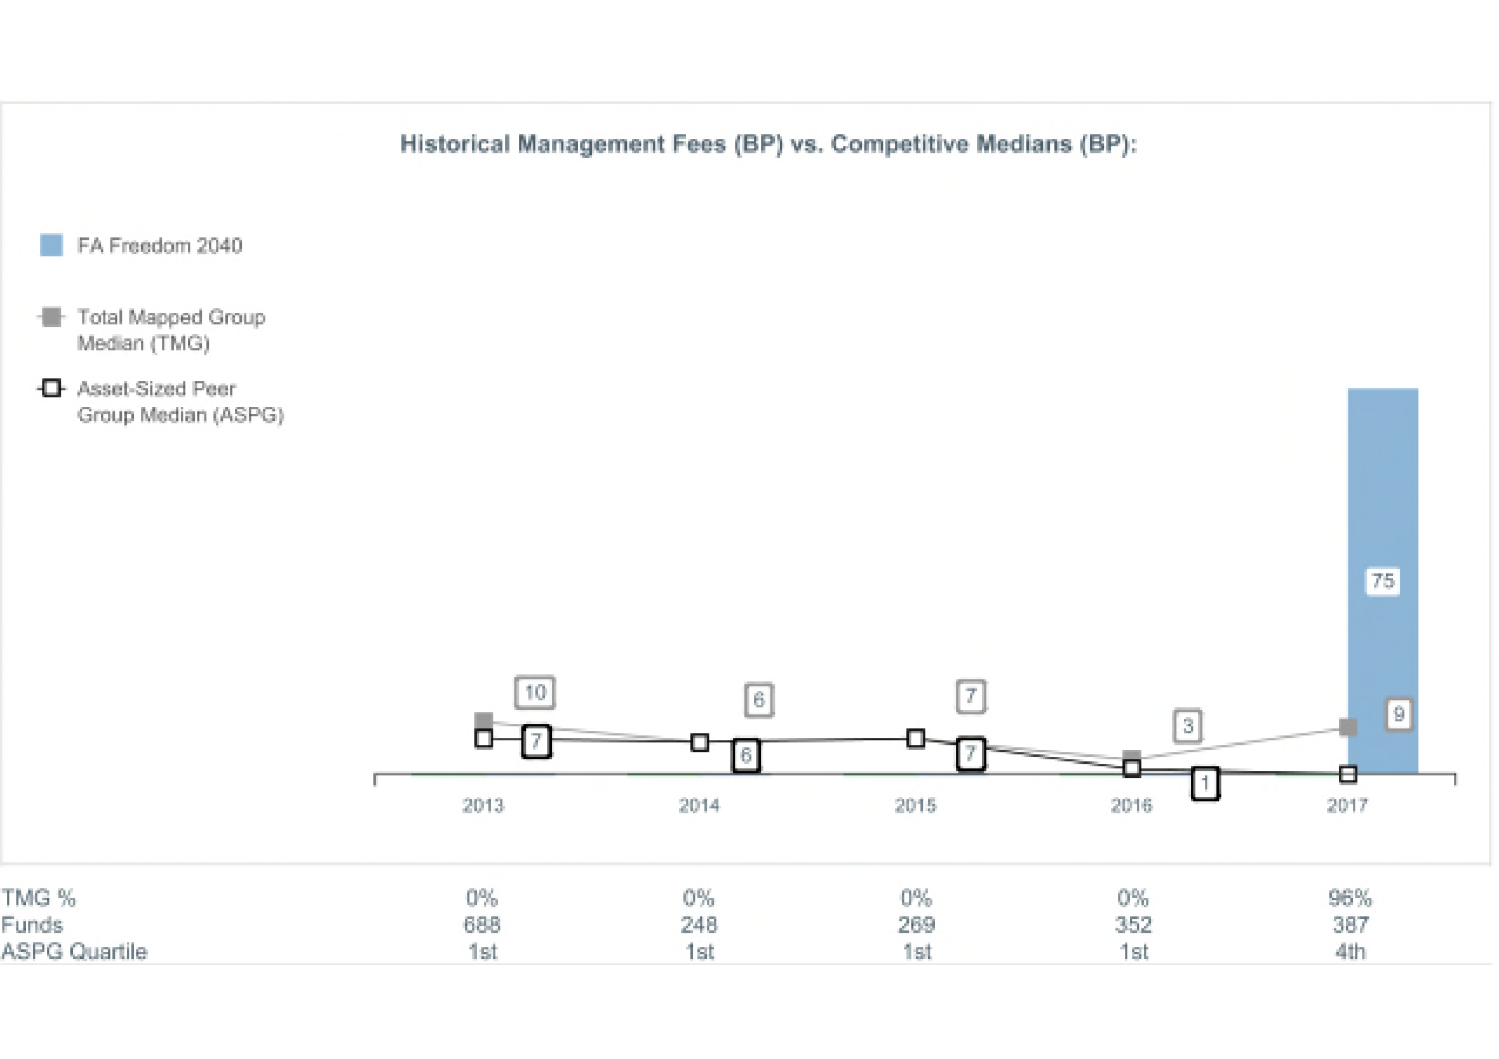
Fidelity Advisor Freedom 2045 Fund
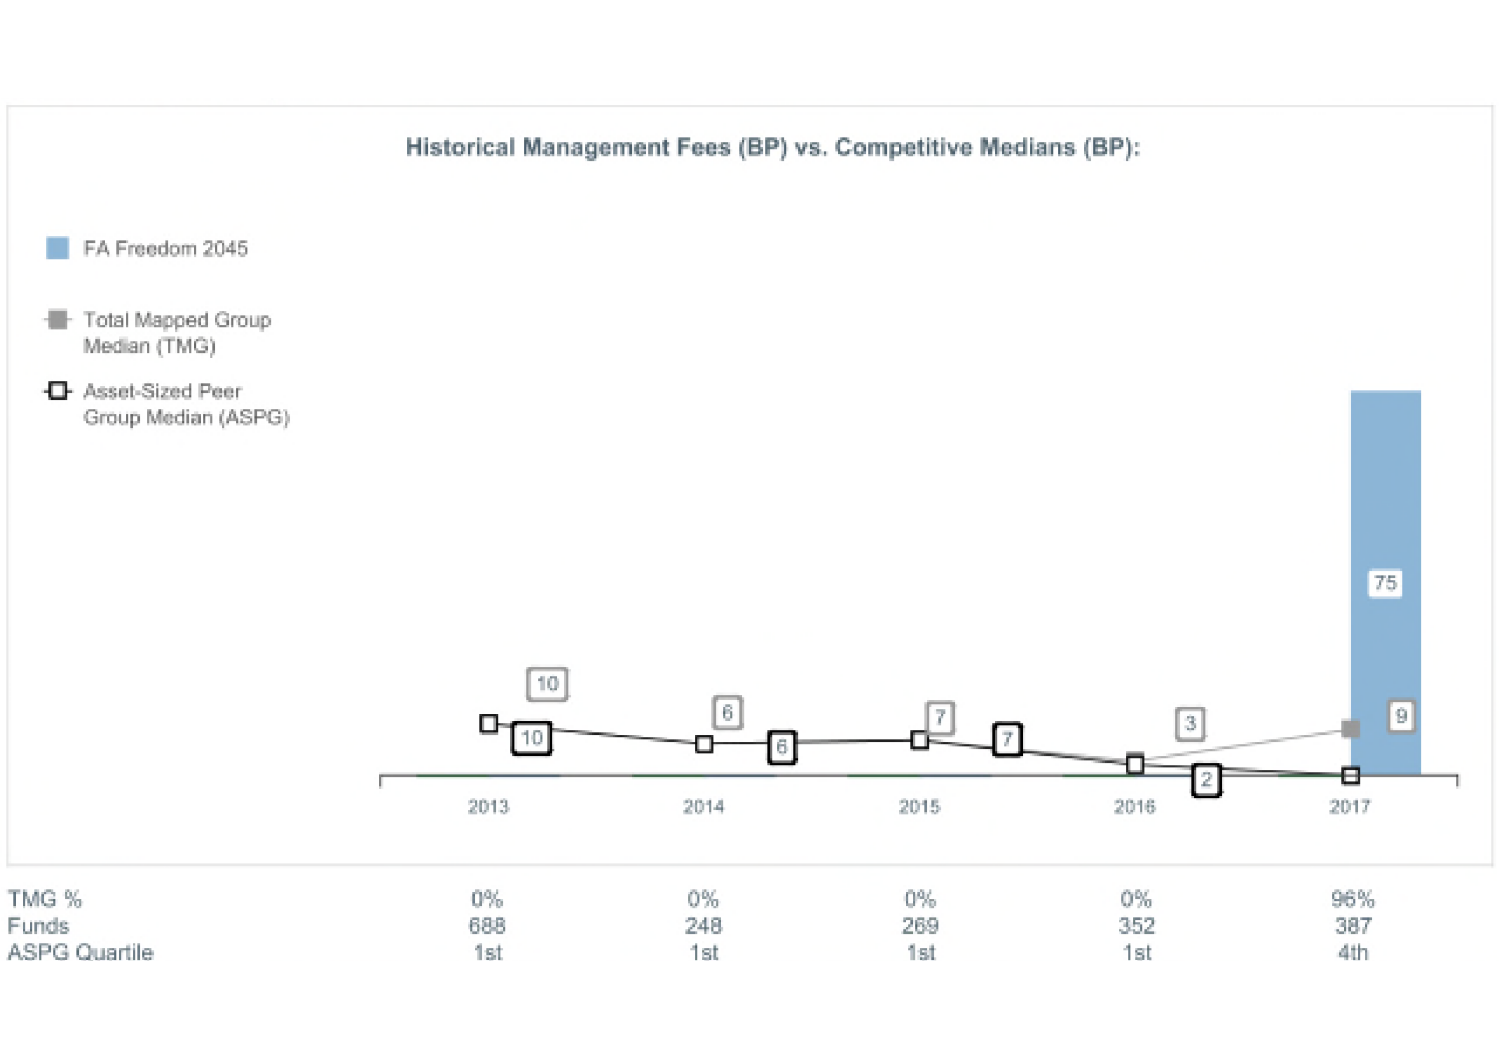
Fidelity Advisor Freedom 2050 Fund
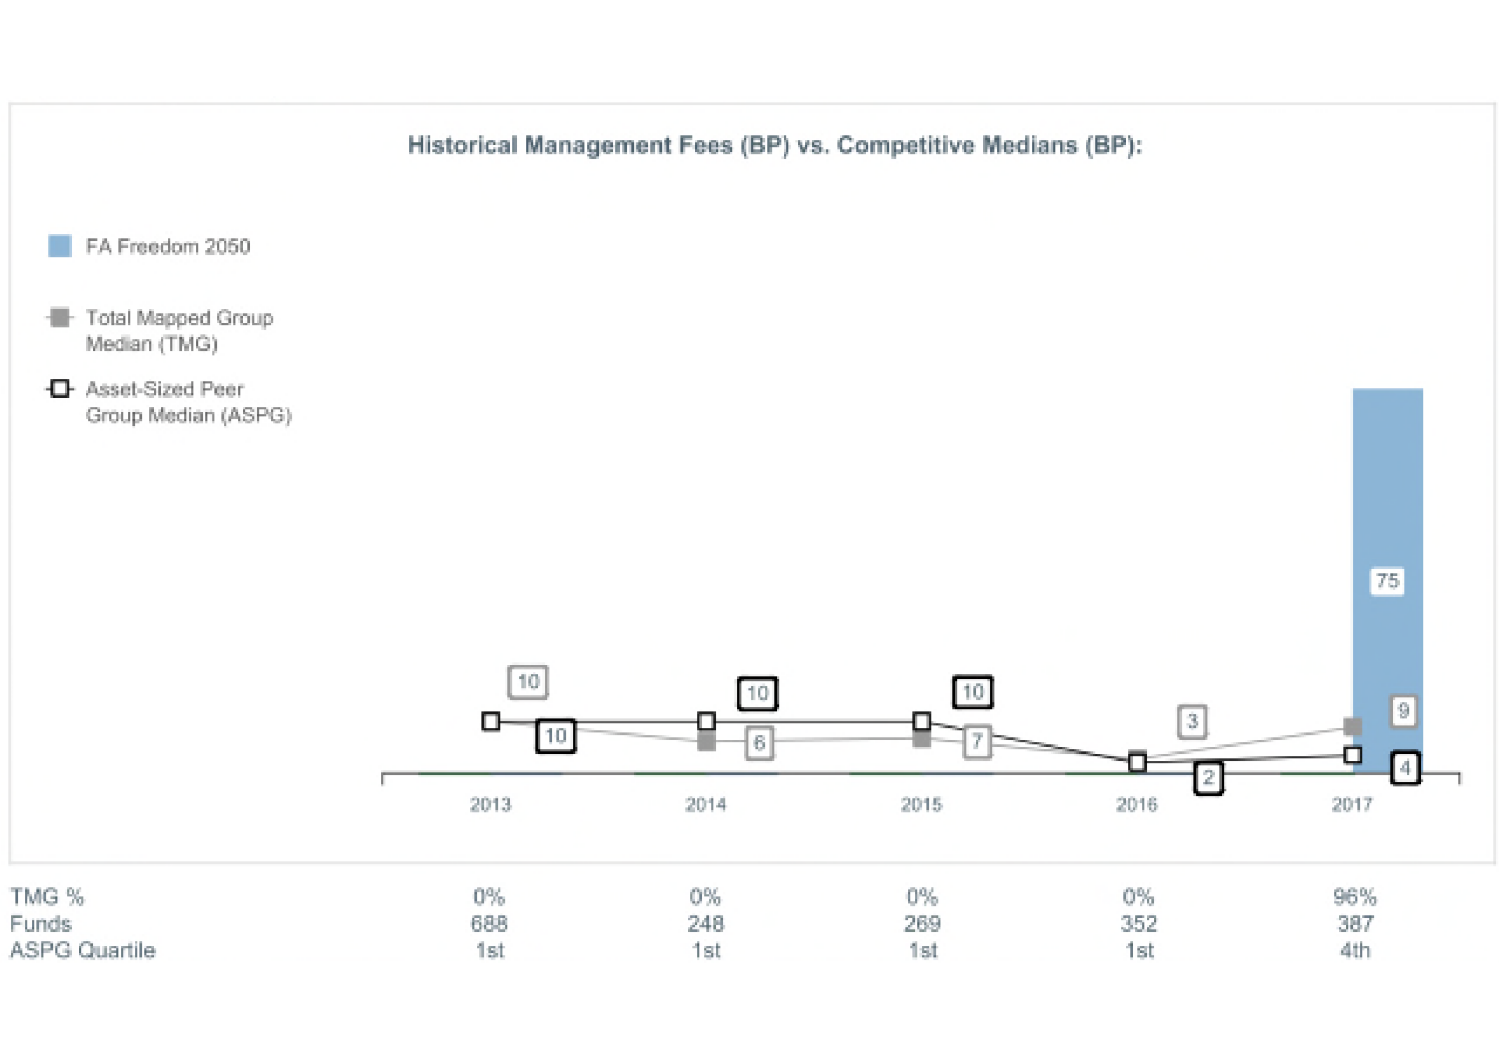
Fidelity Advisor Freedom 2055 Fund
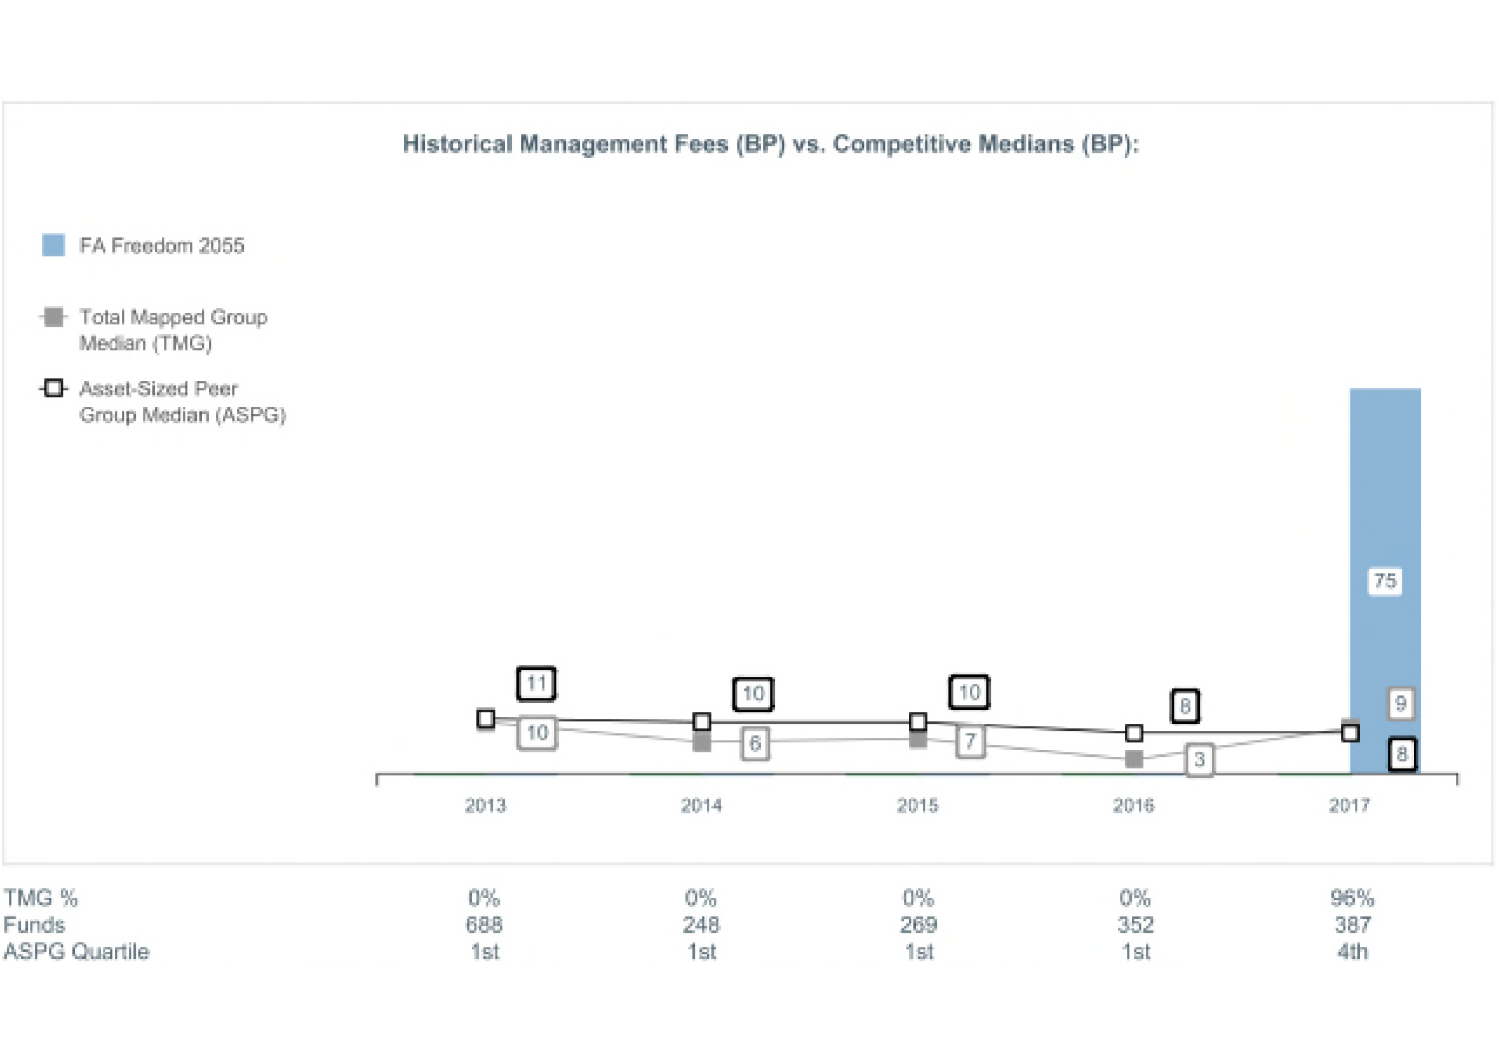
Fidelity Advisor Freedom 2060 Fund
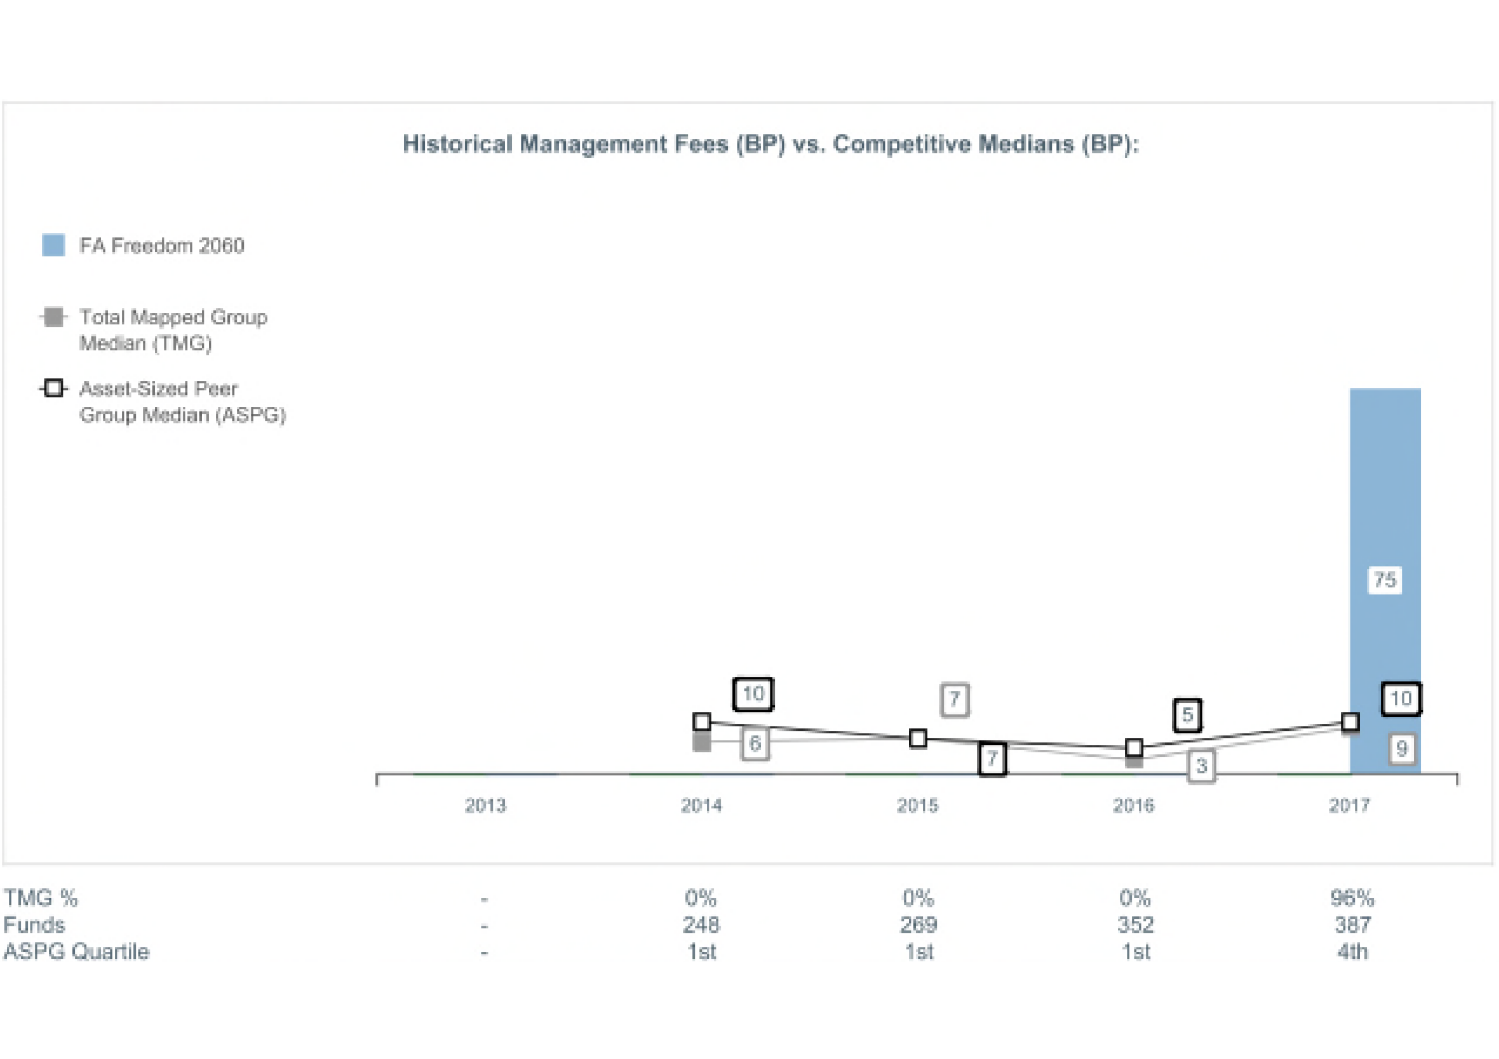
Fidelity Advisor Freedom Income Fund
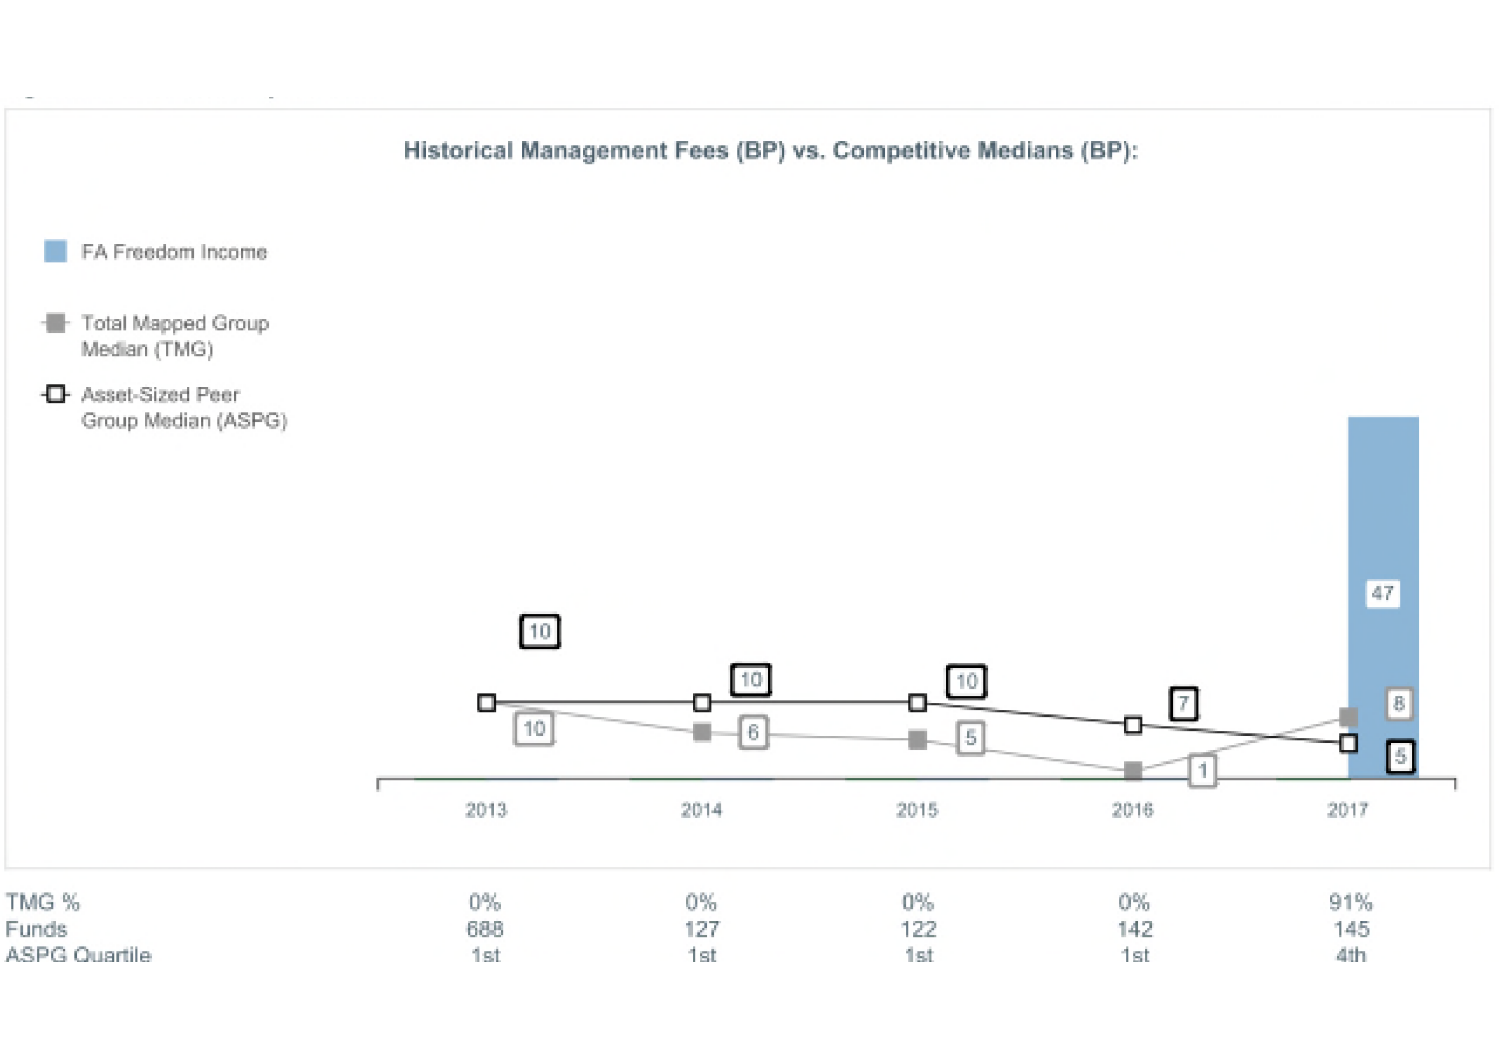
The Board compared each fund's class-level management fee rate for the current fiscal year relative to the median of its competitor funds in the applicable Total Mapped Group based on competitive data for 2017. The Board noted that each fund's class-level management fee rate ranks above the median of its competitor funds in the applicable Total Mapped Group based on competitive data for 2017. The Board noted that the majority of peer funds do not have top-level management fees, similar to the funds' fee structure prior to June 1, 2017. The Board also noted that the funds' total expense comparisons, which include the expenses of the Series Funds, facilitate better comparisons with funds and classes that use different expense structures and that the funds' total expense ratio comparisons to competitors generally were more favorable.
Based on its review, the Board concluded that each fund's management fee is fair and reasonable in light of the services that the fund receives and the other factors considered.
Total Expense Ratio. In its review of the total expense ratio of each class of each fund, the Board considered the fund's class-level management fee rate under the Advisory Contract. The Board also considered other expenses, such as transfer agent fees, pricing and bookkeeping fees, and custodial, legal, and audit fees, paid by FMR under the unified fee arrangement. The Board also noted that Fidelity may agree to waive fees and expenses from time to time, and the extent to which, if any, it has done so for each fund. As part of its review, the Board considered the total expense ratio of each class of each fund compared to the median total expenses for competitor funds (including expenses of underlying funds) based on competitive data for 2017. Each class of each fund is compared to those funds and classes in the Total Mapped Group (used by the Board for management fee comparisons) that have a similar sales load structure.
The Board noted that each fund offers multiple classes, each of which has a different sales load and 12b-1 fee structure, and that the multiple structures are intended to offer a range of pricing options for the intermediary market. The Board also noted that the total expense ratios of the classes of each fund vary primarily by the level of their 12b-1 fees. The Board considered that, in general, various factors can affect total expense ratios.
The Board noted that the total expense ratio of Class A (including expenses of the Series Funds): (i) ranked below the competitive median for 2017 for Fidelity Advisor Freedom 2005 Fund, Fidelity Advisor Freedom 2010 Fund, Fidelity Advisor Freedom 2015 Fund, Fidelity Advisor Freedom 2020 Fund, Fidelity Advisor Freedom 2025 Fund, and Fidelity Advisor Freedom Income Fund; (ii) ranked equal to the competitive median for 2017 for Fidelity Advisor Freedom 2030 Fund; and (iii) ranked above the competitive median for 2017 for Fidelity Advisor Freedom 2035 Fund, Fidelity Advisor Freedom 2040 Fund, Fidelity Advisor Freedom 2045 Fund, Fidelity Advisor Freedom 2050 Fund, Fidelity Advisor Freedom 2055 Fund, and Fidelity Advisor Freedom 2060. The Board noted that for each fund for which the total expense ratio of Class A was above the competitive median, the class was above the competitive median because a number of competitor target date funds are classified by Lipper as active, even though their underlying holdings are primarily passive. The Board considered that, when the Total Mapped Group is adjusted to remove funds that invest primarily in passive products, the total expense ratio of Class A of each such fund ranks below the competitive median.
The Board noted that the total expense ratio of Class M of each fund (including expenses of the Series Funds) ranked above the competitive median for 2017. The Board noted that the total expense ratio of Class M was above the competitive median primarily because of higher 12b-1 fees on Class M as compared to most competitor funds. Class M has a higher 12b-1 fee, but a lower front-end sales charge, than traditionally priced front-end sales charge classes. The Board considered that Class M is primarily sold load-waived to retirement plans and intermediary wrap programs where its 0.50% 12b-1 fee is comparable to competing no-load, higher 12b-1 fee classes designed specifically for retirement plans and wrap programs. The Board noted that, when compared with institutional load funds with a 0.50% 12b-1 fee, the total expense ratio of Class M of certain funds is below median and the total expense ratio of Class M of the remaining funds is above median.
The Board noted that the total expense ratio of Class C (including expenses of the Series Funds): (i) ranked below the competitive median for 2017 for Fidelity Advisor Freedom 2005 Fund and Fidelity Advisor Freedom Income Fund; and (ii) ranked above the competitive median for 2017 for all other funds. The Board noted that the total expense ratio of Class C was above the competitive median primarily because of its 1.00% 12b-1 fee. The Board noted that, when compared with competitor funds that charge a 1.00% 12b-1 fee, the total expense ratio of Class C of certain funds is below median and the total expense ratio of Class C of the remaining funds is above the median.
The Board noted that the total expense ratio of Class I (including expenses of the Series Funds): (i) ranked below the competitive median for 2017 for Fidelity Advisor Freedom 2005 Fund, Fidelity Advisor Freedom 2010 Fund, Fidelity Advisor Freedom 2015 Fund, Fidelity Advisor Freedom 2020 Fund, Fidelity Advisor Freedom 2025 Fund, and Fidelity Advisor Freedom Income Fund; and (ii) ranked above the competitive median for 2017 for Fidelity Advisor Freedom 2030 Fund, Fidelity Advisor Freedom 2035 Fund, Fidelity Advisor Freedom 2040 Fund, Fidelity Advisor Freedom 2045 Fund, Fidelity Advisor Freedom 2050 Fund, Fidelity Advisor Freedom 2055 Fund, and Fidelity Advisor Freedom 2060 Fund. The Board noted that, for each fund for which the total expense ratio of Class I was above the competitive median, the class was above the competitive median because a number of competitor target date funds are classified by Lipper as active, even though their underlying holdings are primarily passive. The Board considered that, when the Total Mapped Group is adjusted to remove funds that invest primarily in passive products, the total expense ratio of Class I of each such fund ranks below the competitive median.
The Board noted that the total expense ratio of Class Z6 (including expenses of the Series Funds) for each fund ranked below the competitive median for 2017.
The Board considered that current contractual arrangements for the fund oblige FMR to pay all "class-level" expenses of Class Z6 of each fund to the extent necessary to limit total operating expenses, with certain exceptions, to an amount specified in the applicable expense contract.
These contractual arrangements may not be amended to increase the fees or expenses payable by Class Z6 of a fund except by a vote of a majority of the Board of Trustees and by a vote of a majority of the outstanding voting securities of Class Z6 of the applicable fund.
Fees Charged to Other Fidelity Clients. The Board also considered Fidelity fee structures and other information with respect to clients of Fidelity, such as other funds advised or subadvised by Fidelity, pension plan clients, and other institutional clients with similar mandates. The Board noted that a joint ad hoc committee created by it and the boards of other Fidelity funds periodically reviews and compares Fidelity's institutional investment advisory business with its business of providing services to the Fidelity funds and also noted the most recent findings of the committee. The Board noted that the committee's review included a consideration of the differences in services provided, fees charged, and costs incurred, as well as competition in the markets serving the different categories of clients.
Based on its review of total expense ratios and fees charged to other Fidelity clients, the Board concluded that the total expense ratio of each class of each fund was reasonable in light of the services that the fund and its shareholders receive and the other factors considered.
Costs of the Services and Profitability. The Board considered the revenues earned and the expenses incurred by Fidelity in conducting the business of developing, marketing, distributing, managing, administering and servicing each fund and the Series Funds in which each fund invests and in servicing each fund's shareholders. The Board also considered the level of Fidelity's profits in respect of all the Fidelity funds.
On an annual basis, Fidelity presents to the Board information about the profitability of its relationships with each fund. Fidelity calculates profitability information for each fund, as well as aggregate profitability information for groups of Fidelity funds and all Fidelity funds, using a series of detailed revenue and cost allocation methodologies which originate with the books and records of Fidelity on which Fidelity's audited financial statements are based. The Audit Committee of the Board reviews any significant changes from the prior year's methodologies.
PricewaterhouseCoopers LLP (PwC), auditor to Fidelity and certain Fidelity funds, has been engaged annually by the Board as part of the Board's assessment of Fidelity's profitability analysis. PwC's engagement includes the review and assessment of the methodologies used by Fidelity in determining the revenues and expenses attributable to Fidelity's mutual fund business, and completion of agreed-upon procedures in respect of the mathematical accuracy of the fund profitability information and its conformity to established allocation methodologies. After considering PwC's reports issued under the engagement and information provided by Fidelity, the Board concluded that while other allocation methods may also be reasonable, Fidelity's profitability methodologies are reasonable in all material respects.
The Board also reviewed Fidelity's non-fund businesses and potential indirect benefits such businesses may have received as a result of their association with Fidelity's mutual fund business (i.e., fall-out benefits) as well as cases where Fidelity's affiliates may benefit from the funds' business. The Board noted that changes to fall-out benefits year-over-year reflect business developments at Fidelity's various businesses.
The Board considered the costs of the services provided by and the profits realized by Fidelity in connection with the operation of each fund and was satisfied that the profitability was not excessive.
Economies of Scale. The Board considered whether there have been economies of scale in respect of the management of the Fidelity funds, whether the Fidelity funds (including each fund) have appropriately benefited from any such economies of scale, and whether there is potential for realization of any further economies of scale. The Board considered the extent to which each fund will benefit from economies of scale as assets grow through increased services to the fund, through waivers or reimbursements, or through fee or expense ratio reductions. The Board recognized that, due to each fund's current contractual arrangements, its expense ratio will not decline if the fund's operating costs decrease as assets grow, or rise as assets decrease. The Board also noted that a committee (the Economies of Scale Committee) created by it and the boards of other Fidelity funds periodically analyzes whether Fidelity attains economies of scale in respect of the management and servicing of the Fidelity funds, whether the Fidelity funds have appropriately benefited from such economies of scale, and whether there is potential for realization of any further economies of scale.
The Board concluded, taking into account the analysis of the Economies of Scale Committee, that economies of scale, if any, are being appropriately shared between fund shareholders and Fidelity.
Additional Information Requested by the Board. In order to develop fully the factual basis for consideration of the Fidelity funds' advisory contracts, the Board requested and received additional information on certain topics, including: (i) Fidelity's fund profitability methodology, profitability trends for certain funds, the allocation of various costs to different funds, and the impact of certain factors on fund profitability results; (ii) portfolio manager changes that have occurred during the past year and the amount of the investment that each portfolio manager has made in the Fidelity fund(s) that he or she manages; (iii) Fidelity's compensation structure for portfolio managers, research analysts, and other key personnel, including its effects on fund profitability, the rationale for the compensation structure, and the extent to which current market conditions have affected retention and recruitment; (iv) the arrangements with and compensation paid to certain fund sub-advisers on behalf of the Fidelity funds and the treatment of such compensation within Fidelity's fund profitability methodology; (v) the terms of Fidelity's voluntary expense limitation agreements; (vi) the methodology with respect to competitive fund data and peer group classifications; (vii) Fidelity's transfer agent fee, expense, and service structures for different funds and classes relative to competitive trends, and the impact of the increased use of omnibus accounts; (viii) new developments in the retail and institutional marketplaces and the competitive positioning of the funds relative to other investment products and services; (ix) the impact of recent changes to the money market fund landscape, including the full implementation of money market fund reform and rising interest rates, on Fidelity's money market funds; (x) the funds' share class structures and distribution channels; and (xi) explanations regarding the relative total expense ratios of certain funds and classes, total expense competitive trends and methodologies for total expense competitive comparisons, and actions that might be taken by Fidelity to reduce total expense ratios for certain classes. In addition, the Board considered its discussions with Fidelity throughout the year regarding enhanced information security initiatives and the funds' fair valuation policies.
Based on its evaluation of all of the conclusions noted above, and after considering all factors it believed relevant, the Board concluded that the advisory fee arrangements are fair and reasonable, and that each fund's Advisory Contract should be renewed.
AFF-SANN-1118
1.792138.115
Fidelity Flex℠ Freedom Funds - Income, 2005, 2010, 2015, 2020, 2025, 2030, 2035, 2040, 2045, 2050, 2055, 2060
Semi-Annual Report September 30, 2018 |
|
Contents
To view a fund's proxy voting guidelines and proxy voting record for the 12-month period ended June 30, visit http://www.fidelity.com/proxyvotingresults or visit the Securities and Exchange Commission's (SEC) web site at http://www.sec.gov.
You may also call 1-800-835-5092 to request a free copy of the proxy voting guidelines.
Standard & Poor's, S&P and S&P 500 are registered service marks of The McGraw-Hill Companies, Inc. and have been licensed for use by Fidelity Distributors Corporation.
Other third-party marks appearing herein are the property of their respective owners.
All other marks appearing herein are registered or unregistered trademarks or service marks of FMR LLC or an affiliated company. © 2018 FMR LLC. All rights reserved.
This report and the financial statements contained herein are submitted for the general information of the shareholders of the Funds. This report is not authorized for distribution to prospective investors in the Funds unless preceded or accompanied by an effective prospectus.
A fund files its complete schedule of portfolio holdings with the SEC for the first and third quarters of each fiscal year on Form N-Q. Forms N-Q are available on the SEC’s web site at http://www.sec.gov. A fund's Forms N-Q may be reviewed and copied at the SEC’s Public Reference Room in Washington, DC. Information regarding the operation of the SEC's Public Reference Room may be obtained by calling 1-800-SEC-0330.
For a complete list of a fund's portfolio holdings, view the most recent holdings listing, semiannual report, or annual report on Fidelity's web site at http://www.fidelity.com, http://www.institutional.fidelity.com, or http://www.401k.com, as applicable.
NOT FDIC INSURED •MAY LOSE VALUE •NO BANK GUARANTEE
Neither the Funds nor Fidelity Distributors Corporation is a bank.
Fidelity Flex℠ Freedom Income Fund
Investment Summary (Unaudited)
The information in the following tables is based on the direct investments of the Fund.
Top Holdings as of September 30, 2018
| | % of fund's net assets |
| Fidelity Series Investment Grade Bond Fund | 36.9 |
| Fidelity Series Government Money Market Fund 2.12% | 18.7 |
| Fidelity Series Inflation-Protected Bond Index Fund | 12.8 |
| Fidelity Series Short-Term Credit Fund | 4.7 |
| Fidelity Series Long-Term Treasury Bond Index Fund | 4.4 |
| Fidelity Series Emerging Markets Opportunities Fund | 3.1 |
| Fidelity Series International Growth Fund | 2.3 |
| Fidelity Series International Value Fund | 2.3 |
| Fidelity Series Commodity Strategy Fund | 1.9 |
| Fidelity Series Intrinsic Opportunities Fund | 1.5 |
| | 88.6 |
Asset Allocation (% of fund's net assets)
| Period end |
| | Domestic Equity Funds | 10.7% |
| | International Equity Funds | 8.8% |
| | Bond Funds | 57.1% |
| | Short-Term Funds | 23.4% |

Domestic Equity Funds category includes Fidelity Series Commodity Strategy Fund which invests in commodity-related investments.
Fidelity Flex℠ Freedom Income Fund
Schedule of Investments September 30, 2018 (Unaudited)
Showing Percentage of Net Assets
| Domestic Equity Funds - 10.7% | | | |
| | | Shares | Value |
| Fidelity Series All-Sector Equity Fund (a) | | 27 | $368 |
| Fidelity Series Blue Chip Growth Fund (a) | | 43 | 661 |
| Fidelity Series Commodity Strategy Fund (a) | | 392 | 1,962 |
| Fidelity Series Growth Company Fund (a) | | 66 | 1,342 |
| Fidelity Series Intrinsic Opportunities Fund (a) | | 88 | 1,608 |
| Fidelity Series Large Cap Stock Fund (a) | | 90 | 1,429 |
| Fidelity Series Large Cap Value Index Fund (a) | | 30 | 400 |
| Fidelity Series Opportunistic Insights Fund (a) | | 36 | 720 |
| Fidelity Series Small Cap Discovery Fund (a) | | 16 | 194 |
| Fidelity Series Small Cap Opportunities Fund (a) | | 41 | 597 |
| Fidelity Series Stock Selector Large Cap Value Fund (a) | | 82 | 1,091 |
| Fidelity Series Value Discovery Fund (a) | | 57 | 775 |
| TOTAL DOMESTIC EQUITY FUNDS | | | |
| (Cost $10,402) | | | 11,147 |
|
| International Equity Funds - 8.8% | | | |
| Fidelity Series Canada Fund (a) | | 22 | 240 |
| Fidelity Series Emerging Markets Fund (a) | | 37 | 361 |
| Fidelity Series Emerging Markets Opportunities Fund (a) | | 169 | 3,247 |
| Fidelity Series International Growth Fund (a) | | 146 | 2,392 |
| Fidelity Series International Small Cap Fund (a) | | 32 | 575 |
| Fidelity Series International Value Fund (a) | | 226 | 2,382 |
| TOTAL INTERNATIONAL EQUITY FUNDS | | | |
| (Cost $8,959) | | | 9,197 |
|
| Bond Funds - 57.1% | | | |
| Fidelity Series Emerging Markets Debt Fund (a) | | 82 | 779 |
| Fidelity Series Floating Rate High Income Fund (a) | | 28 | 264 |
| Fidelity Series High Income Fund (a) | | 148 | 1,426 |
| Fidelity Series Inflation-Protected Bond Index Fund (a) | | 1,379 | 13,389 |
| Fidelity Series International Credit Fund (a) | | 5 | 52 |
| Fidelity Series Investment Grade Bond Fund (a) | | 3,536 | 38,511 |
| Fidelity Series Long-Term Treasury Bond Index Fund (a) | | 563 | 4,635 |
| Fidelity Series Real Estate Income Fund (a) | | 47 | 505 |
| TOTAL BOND FUNDS | | | |
| (Cost $61,316) | | | 59,561 |
|
| Short-Term Funds - 23.4% | | | |
| Fidelity Series Government Money Market Fund 2.12% (a)(b) | | 19,503 | 19,503 |
| Fidelity Series Short-Term Credit Fund (a) | | 494 | 4,874 |
| TOTAL SHORT-TERM FUNDS | | | |
| (Cost $24,437) | | | 24,377 |
| TOTAL INVESTMENT IN SECURITIES - 100.0% | | | |
| (Cost $105,114) | | | 104,282 |
| NET OTHER ASSETS (LIABILITIES) - 0.0% | | | (1) |
| NET ASSETS - 100% | | | $104,281 |
Legend
(a) Affiliated Fund
(b) The rate quoted is the annualized seven-day yield of the fund at period end.
Affiliated Underlying Funds
Fiscal year to date information regarding the Fund's investments in affiliated Underlying Funds, excluding any Money Market Central Funds, is presented below. Exchanges between classes of the same affiliated Underlying Funds may occur.
| Affiliate | Value, beginning of period | Purchases | Sales Proceeds | Dividend Income | Realized Gain (loss) | Change in Unrealized appreciation (depreciation) | Value, end of period |
| Fidelity Series 100 Index Fund | $443 | $-- | $460 | $-- | $48 | $(31) | $-- |
| Fidelity Series All-Sector Equity Fund | 849 | 14 | 582 | -- | 18 | 69 | 368 |
| Fidelity Series Blue Chip Growth Fund | 878 | 90 | 387 | 66 | 44 | 36 | 661 |
| Fidelity Series Canada Fund | 259 | 32 | 67 | -- | 1 | 15 | 240 |
| Fidelity Series Commodity Strategy Fund | 2,193 | 274 | 342 | 117 | (3) | (160) | 1,962 |
| Fidelity Series Emerging Markets Debt Fund | 782 | 40 | -- | 23 | -- | (43) | 779 |
| Fidelity Series Emerging Markets Fund | -- | 361 | -- | -- | -- | -- | 361 |
| Fidelity Series Emerging Markets Opportunities Fund | 3,179 | 1,034 | 589 | -- | 9 | (386) | 3,247 |
| Fidelity Series Floating Rate High Income Fund | 250 | 14 | -- | 7 | -- | -- | 264 |
| Fidelity Series Government Money Market Fund 2.12% | 23,960 | 2,769 | 7,226 | 215 | -- | -- | 19,503 |
| Fidelity Series Growth Company Fund | 1,755 | 68 | 722 | -- | 108 | 133 | 1,342 |
| Fidelity Series High Income Fund | 1,552 | 48 | 186 | 43 | (3) | 15 | 1,426 |
| Fidelity Series Inflation-Protected Bond Index Fund | 3,913 | 9,535 | 16 | 13 | -- | (43) | 13,389 |
| Fidelity Series International Credit Fund | 38 | 14 | -- | 1 | -- | -- | 52 |
| Fidelity Series International Growth Fund | 2,691 | 325 | 655 | -- | 23 | 8 | 2,392 |
| Fidelity Series International Small Cap Fund | 668 | 86 | 154 | -- | 6 | (31) | 575 |
| Fidelity Series International Value Fund | 2,640 | 308 | 544 | -- | (4) | (18) | 2,382 |
| Fidelity Series Intrinsic Opportunities Fund | 2,156 | 154 | 748 | 76 | 59 | (13) | 1,608 |
| Fidelity Series Investment Grade Bond Fund | 39,273 | 972 | 1,277 | 556 | (29) | (428) | 38,511 |
| Fidelity Series Large Cap Stock Fund | 1,920 | 148 | 735 | 102 | 45 | 51 | 1,429 |
| Fidelity Series Large Cap Value Index Fund | 550 | 15 | 200 | -- | 12 | 23 | 400 |
| Fidelity Series Long-Term Treasury Bond Index Fund | 2,147 | 3,207 | 553 | 38 | (34) | (132) | 4,635 |
| Fidelity Series Opportunistic Insights Fund | 962 | 25 | 383 | -- | 34 | 82 | 720 |
| Fidelity Series Real Estate Equity Fund | 173 | 9 | 190 | 3 | (9) | 17 | -- |
| Fidelity Series Real Estate Income Fund | 472 | 30 | -- | 21 | -- | 3 | 505 |
| Fidelity Series Short-Term Credit Fund | 5,864 | 439 | 1,429 | 65 | (17) | 17 | 4,874 |
| Fidelity Series Small Cap Discovery Fund | 262 | 20 | 85 | 16 | 3 | (6) | 194 |
| Fidelity Series Small Cap Opportunities Fund | 799 | 59 | 301 | 48 | 22 | 18 | 597 |
| Fidelity Series Stock Selector Large Cap Value Fund | 1,499 | 23 | 526 | -- | 8 | 87 | 1,091 |
| Fidelity Series Value Discovery Fund | 1,065 | 29 | 376 | -- | 7 | 50 | 775 |
| Total | $103,192 | $20,142 | $18,733 | $1,410 | $348 | $(667) | $104,282 |
Amounts in the income column in the above table include any capital gain distributions from underlying funds, which are presented in the corresponding line-item in the Statement of Operations if applicable.
Investment Valuation
All investments are categorized as Level 1 under the Fair Value Hierarchy. The inputs or methodology used for valuing securities may not be an indication of the risk associated with investing in those securities. For more information on valuation inputs please refer to the Investment Valuation section in the accompanying Notes to Financial Statements.
See accompanying notes which are an integral part of the financial statements.
Fidelity Flex℠ Freedom Income Fund
Financial Statements
Statement of Assets and Liabilities
| | | September 30, 2018 (Unaudited) |
| Assets | | |
Investment in securities, at value — See accompanying schedule:
| | |
| Affiliated issuers (cost $105,114) | $104,282 | |
| Total Investment in Securities (cost $105,114) | | $104,282 |
| Receivable for investments sold | | 1,064 |
| Total assets | | 105,346 |
| Liabilities | | |
| Payable for investments purchased | $1,065 | |
| Total liabilities | | 1,065 |
| Net Assets | | $104,281 |
| Net Assets consist of: | | |
| Paid in capital | | $104,157 |
| Undistributed net investment income | | 355 |
| Accumulated undistributed net realized gain (loss) on investments | | 601 |
| Net unrealized appreciation (depreciation) on investments | | (832) |
| Net Assets, for 10,412 shares outstanding | | $104,281 |
| Net Asset Value, offering price and redemption price per share ($104,281 ÷ 10,412.7 shares) | | $10.01 |
See accompanying notes which are an integral part of the financial statements.
Statement of Operations
| | | Six months ended September 30, 2018 (Unaudited) |
| Investment Income | | |
| Dividends: | | |
| Affiliated issuers | | $1,145 |
| Expenses | | |
| Independent trustees' fees and expenses | $1 | |
| Total expenses | | 1 |
| Net investment income (loss) | | 1,144 |
| Realized and Unrealized Gain (Loss) | | |
| Net realized gain (loss) on: | | |
| Investment securities: | | |
| Affiliated issuers | 348 | |
| Capital gain distributions from underlying funds: | | |
| Affiliated issuers | 265 | |
| Total net realized gain (loss) | | 613 |
| Change in net unrealized appreciation (depreciation) on: | | |
| Investment securities: | | |
| Affiliated issuers | (667) | |
| Total change in net unrealized appreciation (depreciation) | | (667) |
| Net gain (loss) | | (54) |
| Net increase (decrease) in net assets resulting from operations | | $1,090 |
See accompanying notes which are an integral part of the financial statements.
Statement of Changes in Net Assets
| | Six months ended September 30, 2018 (Unaudited) | For the period
June 8, 2017 (commencement of operations) to March 31, 2018 |
| Increase (Decrease) in Net Assets | | |
| Operations | | |
| Net investment income (loss) | $1,144 | $1,843 |
| Net realized gain (loss) | 613 | 1,513 |
| Change in net unrealized appreciation (depreciation) | (667) | (165) |
| Net increase (decrease) in net assets resulting from operations | 1,090 | 3,191 |
| Distributions to shareholders from net investment income | (981) | (1,651) |
| Distributions to shareholders from net realized gain | (921) | (604) |
| Total distributions | (1,902) | (2,255) |
| Share transactions | | |
| Proceeds from sales of shares | – | 100,000 |
| Reinvestment of distributions | 1,902 | 2,255 |
| Net increase (decrease) in net assets resulting from share transactions | 1,902 | 102,255 |
| Total increase (decrease) in net assets | 1,090 | 103,191 |
| Net Assets | | |
| Beginning of period | 103,191 | – |
| End of period | $104,281 | $103,191 |
| Other Information | | |
| Undistributed net investment income end of period | $355 | $192 |
| Shares | | |
| Sold | – | 10,000 |
| Issued in reinvestment of distributions | 190 | 222 |
| Net increase (decrease) | 190 | 10,222 |
See accompanying notes which are an integral part of the financial statements.
Financial Highlights
Fidelity Flex Freedom Income Fund
| | Six months ended (Unaudited) September 30, | Years endedMarch 31, |
| | 2018 | 2018 A |
| Selected Per–Share Data | | |
| Net asset value, beginning of period | $10.09 | $10.00 |
| Income from Investment Operations | | |
| Net investment income (loss)B | .11 | .18 |
| Net realized and unrealized gain (loss) | –C | .13 |
| Total from investment operations | .11 | .31 |
| Distributions from net investment income | (.10) | (.16) |
| Distributions from net realized gain | (.09) | (.06) |
| Total distributions | (.19) | (.22) |
| Net asset value, end of period | $10.01 | $10.09 |
| Total ReturnD | 1.06% | 3.14% |
| Ratios to Average Net AssetsE,F | | |
| Expenses before reductions | - %G,H | - %G |
| Expenses net of fee waivers, if any | - %G,H | - %G |
| Expenses net of all reductions | - %G,H | - %G |
| Net investment income (loss) | 2.21%G | 2.21%G |
| Supplemental Data | | |
| Net assets, end of period (000 omitted) | $104 | $103 |
| Portfolio turnover rateE | 36%G | 10%G |
A For the period June 8, 2017 (commencement of operations) to March 31, 2018.
B Calculated based on average shares outstanding during the period.
C Amount represents less than $.005 per share.
D Total returns for periods of less than one year are not annualized.
E Amounts do not include the activity of the Underlying Funds.
F Expense ratios reflect operating expenses of the Fund. Expenses before reductions do not reflect amounts reimbursed by the investment adviser or reductions from expense offset arrangements and do not represent the amount paid by the Fund during periods when reimbursements or reductions occur. Expenses net of fee waivers reflect expenses after reimbursement by the investment adviser but prior to reductions from expense offset arrangements. Expenses net of all reductions represent the net expenses paid by the Fund but do not include expenses of the underlying funds in which the Fund invests.
G Annualized
H Amount represents less than .005%.
See accompanying notes which are an integral part of the financial statements.
Fidelity Flex℠ Freedom 2005 Fund
Investment Summary (Unaudited)
The information in the following tables is based on the direct investments of the Fund.
Top Holdings as of September 30, 2018
| | % of fund's net assets |
| Fidelity Series Investment Grade Bond Fund | 33.7 |
| Fidelity Series Government Money Market Fund 2.12% | 15.4 |
| Fidelity Series Inflation-Protected Bond Index Fund | 11.0 |
| Fidelity Series Long-Term Treasury Bond Index Fund | 4.6 |
| Fidelity Series Emerging Markets Opportunities Fund | 3.9 |
| Fidelity Series Short-Term Credit Fund | 3.8 |
| Fidelity Series International Growth Fund | 3.2 |
| Fidelity Series International Value Fund | 3.1 |
| Fidelity Series Intrinsic Opportunities Fund | 2.6 |
| Fidelity Series Large Cap Stock Fund | 2.3 |
| | 83.6 |
Asset Allocation (% of fund's net assets)
| Period end |
| | Domestic Equity Funds | 16.9% |
| | International Equity Funds | 11.7% |
| | Bond Funds | 52.2% |
| | Short-Term Funds | 19.2% |

Domestic Equity Funds category includes Fidelity Series Commodity Strategy Fund which invests in commodity-related investments.
Fidelity Flex℠ Freedom 2005 Fund
Schedule of Investments September 30, 2018 (Unaudited)
Showing Percentage of Net Assets
| Domestic Equity Funds - 16.9% | | | |
| | | Shares | Value |
| Fidelity Series All-Sector Equity Fund (a) | | 47 | $634 |
| Fidelity Series Blue Chip Growth Fund (a) | | 75 | 1,141 |
| Fidelity Series Commodity Strategy Fund (a) | | 415 | 2,076 |
| Fidelity Series Growth Company Fund (a) | | 115 | 2,315 |
| Fidelity Series Intrinsic Opportunities Fund (a) | | 151 | 2,774 |
| Fidelity Series Large Cap Stock Fund (a) | | 155 | 2,464 |
| Fidelity Series Large Cap Value Index Fund (a) | | 52 | 690 |
| Fidelity Series Opportunistic Insights Fund (a) | | 63 | 1,242 |
| Fidelity Series Small Cap Discovery Fund (a) | | 28 | 334 |
| Fidelity Series Small Cap Opportunities Fund (a) | | 70 | 1,030 |
| Fidelity Series Stock Selector Large Cap Value Fund (a) | | 142 | 1,881 |
| Fidelity Series Value Discovery Fund (a) | | 98 | 1,336 |
| TOTAL DOMESTIC EQUITY FUNDS | | | |
| (Cost $16,621) | | | 17,917 |
|
| International Equity Funds - 11.7% | | | |
| Fidelity Series Canada Fund (a) | | 31 | 335 |
| Fidelity Series Emerging Markets Fund (a) | | 48 | 461 |
| Fidelity Series Emerging Markets Opportunities Fund (a) | | 216 | 4,141 |
| Fidelity Series International Growth Fund (a) | | 203 | 3,322 |
| Fidelity Series International Small Cap Fund (a) | | 45 | 799 |
| Fidelity Series International Value Fund (a) | | 314 | 3,308 |
| TOTAL INTERNATIONAL EQUITY FUNDS | | | |
| (Cost $12,031) | | | 12,366 |
|
| Bond Funds - 52.2% | | | |
| Fidelity Series Emerging Markets Debt Fund (a) | | 79 | 757 |
| Fidelity Series Floating Rate High Income Fund (a) | | 27 | 257 |
| Fidelity Series High Income Fund (a) | | 152 | 1,457 |
| Fidelity Series Inflation-Protected Bond Index Fund (a) | | 1,194 | 11,591 |
| Fidelity Series International Credit Fund (a) | | 5 | 53 |
| Fidelity Series Investment Grade Bond Fund (a) | | 3,275 | 35,665 |
| Fidelity Series Long-Term Treasury Bond Index Fund (a) | | 593 | 4,884 |
| Fidelity Series Real Estate Income Fund (a) | | 48 | 512 |
| TOTAL BOND FUNDS | | | |
| (Cost $56,821) | | | 55,176 |
|
| Short-Term Funds - 19.2% | | | |
| Fidelity Series Government Money Market Fund 2.12% (a)(b) | | 16,281 | 16,281 |
| Fidelity Series Short-Term Credit Fund (a) | | 413 | 4,069 |
| TOTAL SHORT-TERM FUNDS | | | |
| (Cost $20,398) | | | 20,350 |
| TOTAL INVESTMENT IN SECURITIES - 100.0% | | | |
| (Cost $105,871) | | | 105,809 |
| NET OTHER ASSETS (LIABILITIES) - 0.0% | | | 1 |
| NET ASSETS - 100% | | | $105,810 |
Legend
(a) Affiliated Fund
(b) The rate quoted is the annualized seven-day yield of the fund at period end.
Affiliated Underlying Funds
Fiscal year to date information regarding the Fund's investments in affiliated Underlying Funds, excluding any Money Market Central Funds, is presented below. Exchanges between classes of the same affiliated Underlying Funds may occur.
| Affiliate | Value, beginning of period | Purchases | Sales Proceeds | Dividend Income | Realized Gain (loss) | Change in Unrealized appreciation (depreciation) | Value, end of period |
| Fidelity Series 100 Index Fund | $668 | $-- | $690 | $-- | $68 | $(46) | $-- |
| Fidelity Series All-Sector Equity Fund | 1,281 | 13 | 794 | -- | 27 | 107 | 634 |
| Fidelity Series Blue Chip Growth Fund | 1,338 | 136 | 447 | 112 | 50 | 64 | 1,141 |
| Fidelity Series Canada Fund | 351 | 31 | 68 | -- | 1 | 20 | 335 |
| Fidelity Series Commodity Strategy Fund | 2,201 | 306 | 261 | 124 | (7) | (163) | 2,076 |
| Fidelity Series Emerging Markets Debt Fund | 772 | 27 | -- | 23 | -- | (42) | 757 |
| Fidelity Series Emerging Markets Fund | -- | 461 | -- | -- | -- | -- | 461 |
| Fidelity Series Emerging Markets Opportunities Fund | 4,172 | 1,182 | 691 | -- | (9) | (513) | 4,141 |
| Fidelity Series Floating Rate High Income Fund | 250 | 7 | -- | 7 | -- | -- | 257 |
| Fidelity Series Government Money Market Fund 2.12% | 19,357 | 2,698 | 5,774 | 177 | -- | -- | 16,281 |
| Fidelity Series Growth Company Fund | 2,647 | 82 | 790 | -- | 118 | 258 | 2,315 |
| Fidelity Series High Income Fund | 1,555 | 49 | 160 | 44 | (2) | 15 | 1,457 |
| Fidelity Series Inflation-Protected Bond Index Fund | 3,511 | 8,129 | 13 | 11 | -- | (36) | 11,591 |
| Fidelity Series International Credit Fund | 51 | 3 | -- | 1 | -- | (1) | 53 |
| Fidelity Series International Growth Fund | 3,624 | 276 | 625 | -- | 23 | 24 | 3,322 |
| Fidelity Series International Small Cap Fund | 900 | 101 | 167 | -- | 5 | (40) | 799 |
| Fidelity Series International Value Fund | 3,575 | 218 | 465 | -- | (2) | (18) | 3,308 |
| Fidelity Series Intrinsic Opportunities Fund | 3,236 | 245 | 768 | 129 | 53 | 8 | 2,774 |
| Fidelity Series Investment Grade Bond Fund | 36,345 | 897 | 1,153 | 517 | (29) | (395) | 35,665 |
| Fidelity Series Large Cap Stock Fund | 2,895 | 221 | 794 | 163 | 45 | 97 | 2,464 |
| Fidelity Series Large Cap Value Index Fund | 830 | 10 | 205 | -- | 13 | 42 | 690 |
| Fidelity Series Long-Term Treasury Bond Index Fund | 2,293 | 3,295 | 532 | 41 | (28) | (144) | 4,884 |
| Fidelity Series Opportunistic Insights Fund | 1,451 | 31 | 419 | -- | 36 | 143 | 1,242 |
| Fidelity Series Real Estate Equity Fund | 261 | 2 | 272 | 2 | (16) | 25 | -- |
| Fidelity Series Real Estate Income Fund | 485 | 24 | -- | 21 | -- | 3 | 512 |
| Fidelity Series Short-Term Credit Fund | 4,728 | 502 | 1,162 | 53 | (13) | 14 | 4,069 |
| Fidelity Series Small Cap Discovery Fund | 395 | 30 | 86 | 24 | 2 | (7) | 334 |
| Fidelity Series Small Cap Opportunities Fund | 1,205 | 101 | 328 | 81 | 23 | 29 | 1,030 |
| Fidelity Series Stock Selector Large Cap Value Fund | 2,260 | 34 | 560 | -- | 8 | 139 | 1,881 |
| Fidelity Series Value Discovery Fund | 1,606 | 28 | 387 | -- | 7 | 82 | 1,336 |
| Total | $104,243 | $19,139 | $17,611 | $1,530 | $373 | $(335) | $105,809 |
Amounts in the income column in the above table include any capital gain distributions from underlying funds, which are presented in the corresponding line-item in the Statement of Operations if applicable.
Investment Valuation
All investments are categorized as Level 1 under the Fair Value Hierarchy. The inputs or methodology used for valuing securities may not be an indication of the risk associated with investing in those securities. For more information on valuation inputs please refer to the Investment Valuation section in the accompanying Notes to Financial Statements.
See accompanying notes which are an integral part of the financial statements.
Fidelity Flex℠ Freedom 2005 Fund
Financial Statements
Statement of Assets and Liabilities
| | | September 30, 2018 (Unaudited) |
| Assets | | |
Investment in securities, at value — See accompanying schedule:
| | |
| Affiliated issuers (cost $105,871) | $105,809 | |
| Total Investment in Securities (cost $105,871) | | $105,809 |
| Receivable for investments sold | | 1,324 |
| Total assets | | 107,133 |
| Liabilities | | |
| Payable for investments purchased | $1,323 | |
| Total liabilities | | 1,323 |
| Net Assets | | $105,810 |
| Net Assets consist of: | | |
| Paid in capital | | $103,988 |
| Undistributed net investment income | | 1,089 |
| Accumulated undistributed net realized gain (loss) on investments | | 795 |
| Net unrealized appreciation (depreciation) on investments | | (62) |
| Net Assets, for 10,392 shares outstanding | | $105,810 |
| Net Asset Value, offering price and redemption price per share ($105,810 ÷ 10,392 shares) | | $10.18 |
See accompanying notes which are an integral part of the financial statements.
Statement of Operations
| | | Six months ended September 30, 2018 (Unaudited) |
| Investment Income | | |
| Dividends: | | |
| Affiliated issuers | | $1,094 |
| Expenses | | |
| Independent trustees' fees and expenses | $1 | |
| Total expenses | | 1 |
| Net investment income (loss) | | 1,093 |
| Realized and Unrealized Gain (Loss) | | |
| Net realized gain (loss) on: | | |
| Investment securities: | | |
| Affiliated issuers | 373 | |
| Capital gain distributions from underlying funds: | | |
| Affiliated issuers | 436 | |
| Total net realized gain (loss) | | 809 |
| Change in net unrealized appreciation (depreciation) on: | | |
| Investment securities: | | |
| Affiliated issuers | (335) | |
| Total change in net unrealized appreciation (depreciation) | | (335) |
| Net gain (loss) | | 474 |
| Net increase (decrease) in net assets resulting from operations | | $1,567 |
See accompanying notes which are an integral part of the financial statements.
Statement of Changes in Net Assets
| | Six months ended September 30, 2018 (Unaudited) | For the period
June 8, 2017 (commencement of operations) to March 31, 2018 |
| Increase (Decrease) in Net Assets | | |
| Operations | | |
| Net investment income (loss) | $1,093 | $1,856 |
| Net realized gain (loss) | 809 | 2,114 |
| Change in net unrealized appreciation (depreciation) | (335) | 273 |
| Net increase (decrease) in net assets resulting from operations | 1,567 | 4,243 |
| Distributions to shareholders from net investment income | (460) | (1,400) |
| Distributions to shareholders from net realized gain | (1,328) | (800) |
| Total distributions | (1,788) | (2,200) |
| Share transactions | | |
| Proceeds from sales of shares | – | 100,000 |
| Reinvestment of distributions | 1,788 | 2,200 |
| Net increase (decrease) in net assets resulting from share transactions | 1,788 | 102,200 |
| Total increase (decrease) in net assets | 1,567 | 104,243 |
| Net Assets | | |
| Beginning of period | 104,243 | – |
| End of period | $105,810 | $104,243 |
| Other Information | | |
| Undistributed net investment income end of period | $1,089 | $456 |
| Shares | | |
| Sold | – | 10,000 |
| Issued in reinvestment of distributions | 177 | 215 |
| Net increase (decrease) | 177 | 10,215 |
See accompanying notes which are an integral part of the financial statements.
Financial Highlights
Fidelity Flex Freedom 2005 Fund
| | Six months ended (Unaudited) September 30, | Years endedMarch 31, |
| | 2018 | 2018 A |
| Selected Per–Share Data | | |
| Net asset value, beginning of period | $10.21 | $10.00 |
| Income from Investment Operations | | |
| Net investment income (loss)B | .11 | .18 |
| Net realized and unrealized gain (loss) | .04 | .25 |
| Total from investment operations | .15 | .43 |
| Distributions from net investment income | (.05) | (.14) |
| Distributions from net realized gain | (.13) | (.08) |
| Total distributions | (.18) | (.22) |
| Net asset value, end of period | $10.18 | $10.21 |
| Total ReturnC | 1.43% | 4.29% |
| Ratios to Average Net AssetsD,E | | |
| Expenses before reductions | - %F,G | - %F |
| Expenses net of fee waivers, if any | - %F,G | - %F |
| Expenses net of all reductions | - %F,G | - %F |
| Net investment income (loss) | 2.08%F | 2.21%F |
| Supplemental Data | | |
| Net assets, end of period (000 omitted) | $106 | $104 |
| Portfolio turnover rateD | 34%F | 13%F |
A For the period June 8, 2017 (commencement of operations) to March 31, 2018.
B Calculated based on average shares outstanding during the period.
C Total returns for periods of less than one year are not annualized.
D Amounts do not include the activity of the Underlying Funds.
E Expense ratios reflect operating expenses of the Fund. Expenses before reductions do not reflect amounts reimbursed by the investment adviser or reductions from expense offset arrangements and do not represent the amount paid by the Fund during periods when reimbursements or reductions occur. Expenses net of fee waivers reflect expenses after reimbursement by the investment adviser but prior to reductions from expense offset arrangements. Expenses net of all reductions represent the net expenses paid by the Fund but do not include expenses of the underlying funds in which the Fund invests.
F Annualized
G Amount represents less than .005%.
See accompanying notes which are an integral part of the financial statements.
Fidelity Flex℠ Freedom 2010 Fund
Investment Summary (Unaudited)
The information in the following tables is based on the direct investments of the Fund.
Top Holdings as of September 30, 2018
| | % of fund's net assets |
| Fidelity Series Investment Grade Bond Fund | 30.1 |
| Fidelity Series Government Money Market Fund 2.12% | 12.1 |
| Fidelity Series Inflation-Protected Bond Index Fund | 9.0 |
| Fidelity Series Long-Term Treasury Bond Index Fund | 4.8 |
| Fidelity Series Emerging Markets Opportunities Fund | 4.8 |
| Fidelity Series International Growth Fund | 4.0 |
| Fidelity Series International Value Fund | 4.0 |
| Fidelity Series Intrinsic Opportunities Fund | 3.8 |
| Fidelity Series Large Cap Stock Fund | 3.3 |
| Fidelity Series Growth Company Fund | 3.1 |
| | 79.0 |
Asset Allocation (% of fund's net assets)
| Period end |
| | Domestic Equity Funds | 23.4% |
| | International Equity Funds | 14.7% |
| | Bond Funds | 46.8% |
| | Short-Term Funds | 15.1% |

Domestic Equity Funds category includes Fidelity Series Commodity Strategy Fund which invests in commodity-related investments.
Fidelity Flex℠ Freedom 2010 Fund
Schedule of Investments September 30, 2018 (Unaudited)
Showing Percentage of Net Assets
| Domestic Equity Funds - 23.4% | | | |
| | | Shares | Value |
| Fidelity Series All-Sector Equity Fund (a) | | 67 | $918 |
| Fidelity Series Blue Chip Growth Fund (a) | | 108 | 1,652 |
| Fidelity Series Commodity Strategy Fund (a) | | 425 | 2,123 |
| Fidelity Series Growth Company Fund (a) | | 166 | 3,352 |
| Fidelity Series Intrinsic Opportunities Fund (a) | | 219 | 4,016 |
| Fidelity Series Large Cap Stock Fund (a) | | 224 | 3,568 |
| Fidelity Series Large Cap Value Index Fund (a) | | 76 | 999 |
| Fidelity Series Opportunistic Insights Fund (a) | | 91 | 1,798 |
| Fidelity Series Small Cap Discovery Fund (a) | | 40 | 484 |
| Fidelity Series Small Cap Opportunities Fund (a) | | 102 | 1,492 |
| Fidelity Series Stock Selector Large Cap Value Fund (a) | | 206 | 2,724 |
| Fidelity Series Value Discovery Fund (a) | | 141 | 1,935 |
| TOTAL DOMESTIC EQUITY FUNDS | | | |
| (Cost $23,184) | | | 25,061 |
|
| International Equity Funds - 14.7% | | | |
| Fidelity Series Canada Fund (a) | | 40 | 435 |
| Fidelity Series Emerging Markets Fund (a) | | 59 | 568 |
| Fidelity Series Emerging Markets Opportunities Fund (a) | | 266 | 5,104 |
| Fidelity Series International Growth Fund (a) | | 263 | 4,309 |
| Fidelity Series International Small Cap Fund (a) | | 58 | 1,037 |
| Fidelity Series International Value Fund (a) | | 408 | 4,291 |
| TOTAL INTERNATIONAL EQUITY FUNDS | | | |
| (Cost $15,307) | | | 15,744 |
|
| Bond Funds - 46.8% | | | |
| Fidelity Series Emerging Markets Debt Fund (a) | | 80 | 766 |
| Fidelity Series Floating Rate High Income Fund (a) | | 27 | 260 |
| Fidelity Series High Income Fund (a) | | 155 | 1,491 |
| Fidelity Series Inflation-Protected Bond Index Fund (a) | | 998 | 9,692 |
| Fidelity Series International Credit Fund (a) | | 5 | 53 |
| Fidelity Series Investment Grade Bond Fund (a) | | 2,963 | 32,268 |
| Fidelity Series Long-Term Treasury Bond Index Fund (a) | | 627 | 5,166 |
| Fidelity Series Real Estate Income Fund (a) | | 47 | 508 |
| TOTAL BOND FUNDS | | | |
| (Cost $51,730) | | | 50,204 |
|
| Short-Term Funds - 15.1% | | | |
| Fidelity Series Government Money Market Fund 2.12% (a)(b) | | 12,975 | 12,975 |
| Fidelity Series Short-Term Credit Fund (a) | | 329 | 3,243 |
| TOTAL SHORT-TERM FUNDS | | | |
| (Cost $16,255) | | | 16,218 |
| TOTAL INVESTMENT IN SECURITIES - 100.0% | | | |
| (Cost $106,476) | | | 107,227 |
| NET OTHER ASSETS (LIABILITIES) - 0.0% | | | 0 |
| NET ASSETS - 100% | | | $107,227 |
Legend
(a) Affiliated Fund
(b) The rate quoted is the annualized seven-day yield of the fund at period end.
Affiliated Underlying Funds
Fiscal year to date information regarding the Fund's investments in affiliated Underlying Funds, excluding any Money Market Central Funds, is presented below. Exchanges between classes of the same affiliated Underlying Funds may occur.
| Affiliate | Value, beginning of period | Purchases | Sales Proceeds | Dividend Income | Realized Gain (loss) | Change in Unrealized appreciation (depreciation) | Value, end of period |
| Fidelity Series 100 Index Fund | $884 | $-- | $918 | $-- | $94 | $(60) | $-- |
| Fidelity Series All-Sector Equity Fund | 1,696 | 22 | 983 | -- | 37 | 146 | 918 |
| Fidelity Series Blue Chip Growth Fund | 1,753 | 188 | 431 | 160 | 46 | 96 | 1,652 |
| Fidelity Series Canada Fund | 439 | 37 | 67 | -- | (1) | 27 | 435 |
| Fidelity Series Commodity Strategy Fund | 2,222 | 300 | 226 | 127 | (7) | (166) | 2,123 |
| Fidelity Series Emerging Markets Debt Fund | 762 | 46 | -- | 23 | -- | (42) | 766 |
| Fidelity Series Emerging Markets Fund | -- | 568 | -- | -- | -- | -- | 568 |
| Fidelity Series Emerging Markets Opportunities Fund | 5,149 | 1,402 | 795 | -- | (20) | (632) | 5,104 |
| Fidelity Series Floating Rate High Income Fund | 250 | 19 | 9 | 7 | -- | -- | 260 |
| Fidelity Series Government Money Market Fund 2.12% | 15,228 | 2,542 | 4,795 | 141 | -- | -- | 12,975 |
| Fidelity Series Growth Company Fund | 3,506 | 86 | 749 | -- | 113 | 396 | 3,352 |
| Fidelity Series High Income Fund | 1,558 | 45 | 124 | 44 | (2) | 14 | 1,491 |
| Fidelity Series Inflation-Protected Bond Index Fund | 2,900 | 6,829 | 7 | 9 | -- | (30) | 9,692 |
| Fidelity Series International Credit Fund | 51 | 3 | -- | 1 | -- | (1) | 53 |
| Fidelity Series International Growth Fund | 4,533 | 255 | 540 | -- | 20 | 41 | 4,309 |
| Fidelity Series International Small Cap Fund | 1,127 | 77 | 125 | -- | 5 | (47) | 1,037 |
| Fidelity Series International Value Fund | 4,474 | 248 | 411 | -- | (2) | (18) | 4,291 |
| Fidelity Series Intrinsic Opportunities Fund | 4,286 | 355 | 700 | 185 | 40 | 35 | 4,016 |
| Fidelity Series Investment Grade Bond Fund | 33,239 | 828 | 1,415 | 469 | (30) | (354) | 32,268 |
| Fidelity Series Large Cap Stock Fund | 3,919 | 297 | 840 | 227 | 44 | 148 | 3,568 |
| Fidelity Series Large Cap Value Index Fund | 1,099 | 21 | 196 | -- | 12 | 63 | 999 |
| Fidelity Series Long-Term Treasury Bond Index Fund | 2,246 | 3,370 | 273 | 45 | (14) | (163) | 5,166 |
| Fidelity Series Opportunistic Insights Fund | 1,922 | 37 | 402 | -- | 34 | 207 | 1,798 |
| Fidelity Series Real Estate Equity Fund | 342 | 2 | 354 | 3 | (23) | 33 | -- |
| Fidelity Series Real Estate Income Fund | 474 | 42 | 11 | 21 | -- | 3 | 508 |
| Fidelity Series Short-Term Credit Fund | 3,833 | 355 | 946 | 42 | (11) | 12 | 3,243 |
| Fidelity Series Small Cap Discovery Fund | 523 | 42 | 74 | 31 | 1 | (8) | 484 |
| Fidelity Series Small Cap Opportunities Fund | 1,620 | 141 | 332 | 116 | 23 | 40 | 1,492 |
| Fidelity Series Stock Selector Large Cap Value Fund | 2,994 | 65 | 535 | -- | 7 | 193 | 2,724 |
| Fidelity Series Value Discovery Fund | 2,128 | 52 | 366 | -- | 7 | 114 | 1,935 |
| Total | $105,157 | $18,274 | $16,624 | $1,651 | $373 | $47 | $107,227 |
Amounts in the income column in the above table include any capital gain distributions from underlying funds, which are presented in the corresponding line-item in the Statement of Operations if applicable.
Investment Valuation
All investments are categorized as Level 1 under the Fair Value Hierarchy. The inputs or methodology used for valuing securities may not be an indication of the risk associated with investing in those securities. For more information on valuation inputs please refer to the Investment Valuation section in the accompanying Notes to Financial Statements.
See accompanying notes which are an integral part of the financial statements.
Fidelity Flex℠ Freedom 2010 Fund
Financial Statements
Statement of Assets and Liabilities
| | | September 30, 2018 (Unaudited) |
| Assets | | |
Investment in securities, at value — See accompanying schedule:
| | |
| Affiliated issuers (cost $106,476) | $107,227 | |
| Total Investment in Securities (cost $106,476) | | $107,227 |
| Receivable for investments sold | | 1,471 |
| Total assets | | 108,698 |
| Liabilities | | |
| Payable for investments purchased | $1,471 | |
| Total liabilities | | 1,471 |
| Net Assets | | $107,227 |
| Net Assets consist of: | | |
| Paid in capital | | $104,477 |
| Undistributed net investment income | | 1,035 |
| Accumulated undistributed net realized gain (loss) on investments | | 964 |
| Net unrealized appreciation (depreciation) on investments | | 751 |
| Net Assets, for 10,437 shares outstanding | | $107,227 |
| Net Asset Value, offering price and redemption price per share ($107,227 ÷ 10,437 shares) | | $10.27 |
See accompanying notes which are an integral part of the financial statements.
Statement of Operations
| | | Six months ended September 30, 2018 (Unaudited) |
| Investment Income | | |
| Dividends: | | |
| Affiliated issuers | | $1,037 |
| Expenses | | |
| Independent trustees' fees and expenses | $1 | |
| Total expenses | | 1 |
| Net investment income (loss) | | 1,036 |
| Realized and Unrealized Gain (Loss) | | |
| Net realized gain (loss) on: | | |
| Investment securities: | | |
| Affiliated issuers | 373 | |
| Capital gain distributions from underlying funds: | | |
| Affiliated issuers | 614 | |
| Total net realized gain (loss) | | 987 |
| Change in net unrealized appreciation (depreciation) on: | | |
| Investment securities: | | |
| Affiliated issuers | 47 | |
| Total change in net unrealized appreciation (depreciation) | | 47 |
| Net gain (loss) | | 1,034 |
| Net increase (decrease) in net assets resulting from operations | | $2,070 |
See accompanying notes which are an integral part of the financial statements.
Statement of Changes in Net Assets
| | Six months ended September 30, 2018 (Unaudited) | For the period
June 8, 2017 (commencement of operations) to March 31, 2018 |
| Increase (Decrease) in Net Assets | | |
| Operations | | |
| Net investment income (loss) | $1,036 | $1,868 |
| Net realized gain (loss) | 987 | 2,585 |
| Change in net unrealized appreciation (depreciation) | 47 | 704 |
| Net increase (decrease) in net assets resulting from operations | 2,070 | 5,157 |
| Distributions to shareholders from net investment income | (409) | (1,460) |
| Distributions to shareholders from net realized gain | (1,658) | (950) |
| Total distributions | (2,067) | (2,410) |
| Share transactions | | |
| Proceeds from sales of shares | – | 100,000 |
| Reinvestment of distributions | 2,067 | 2,410 |
| Net increase (decrease) in net assets resulting from share transactions | 2,067 | 102,410 |
| Total increase (decrease) in net assets | 2,070 | 105,157 |
| Net Assets | | |
| Beginning of period | 105,157 | – |
| End of period | $107,227 | $105,157 |
| Other Information | | |
| Undistributed net investment income end of period | $1,035 | $408 |
| Shares | | |
| Sold | – | 10,000 |
| Issued in reinvestment of distributions | 203 | 234 |
| Net increase (decrease) | 203 | 10,234 |
See accompanying notes which are an integral part of the financial statements.
Financial Highlights
Fidelity Flex Freedom 2010 Fund
| | Six months ended (Unaudited) September 30, | Years endedMarch 31, |
| | 2018 | 2018 A |
| Selected Per–Share Data | | |
| Net asset value, beginning of period | $10.28 | $10.00 |
| Income from Investment Operations | | |
| Net investment income (loss)B | .10 | .19 |
| Net realized and unrealized gain (loss) | .09 | .33 |
| Total from investment operations | .19 | .52 |
| Distributions from net investment income | (.04) | (.15) |
| Distributions from net realized gain | (.16) | (.10) |
| Total distributions | (.20) | (.24)C |
| Net asset value, end of period | $10.27 | $10.28 |
| Total ReturnD | 1.89% | 5.20% |
| Ratios to Average Net AssetsE,F | | |
| Expenses before reductions | - %G,H | - %G |
| Expenses net of fee waivers, if any | - %G,H | - %G |
| Expenses net of all reductions | - %G,H | - %G |
| Net investment income (loss) | 1.95%G | 2.22%G |
| Supplemental Data | | |
| Net assets, end of period (000 omitted) | $107 | $105 |
| Portfolio turnover rateE | 31%G | 13%G |
A For the period June 8, 2017 (commencement of operations) to March 31, 2018.
B Calculated based on average shares outstanding during the period.
C Total distributions of $.24 per share is comprised of distributions from net investment income of $.146 and distributions from net realized gain of $.095 per share.
D Total returns for periods of less than one year are not annualized.
E Amounts do not include the activity of the Underlying Funds.
F Expense ratios reflect operating expenses of the Fund. Expenses before reductions do not reflect amounts reimbursed by the investment adviser or reductions from expense offset arrangements and do not represent the amount paid by the Fund during periods when reimbursements or reductions occur. Expenses net of fee waivers reflect expenses after reimbursement by the investment adviser but prior to reductions from expense offset arrangements. Expenses net of all reductions represent the net expenses paid by the Fund but do not include expenses of the underlying funds in which the Fund invests.
G Annualized
H Amount represents less than .005%.
See accompanying notes which are an integral part of the financial statements.
Fidelity Flex℠ Freedom 2015 Fund
Investment Summary (Unaudited)
The information in the following tables is based on the direct investments of the Fund.
Top Holdings as of September 30, 2018
| | % of fund's net assets |
| Fidelity Series Investment Grade Bond Fund | 26.4 |
| Fidelity Series Government Money Market Fund 2.12% | 9.4 |
| Fidelity Series Inflation-Protected Bond Index Fund | 7.1 |
| Fidelity Series Emerging Markets Opportunities Fund | 5.4 |
| Fidelity Series Long-Term Treasury Bond Index Fund | 4.9 |
| Fidelity Series Intrinsic Opportunities Fund | 4.9 |
| Fidelity Series International Growth Fund | 4.8 |
| Fidelity Series International Value Fund | 4.8 |
| Fidelity Series Large Cap Stock Fund | 4.3 |
| Fidelity Series Growth Company Fund | 4.1 |
| | 76.1 |
Asset Allocation (% of fund's net assets)
| Period end |
| | Domestic Equity Funds | 29.9% |
| | International Equity Funds | 17.2% |
| | Bond Funds | 41.2% |
| | Short-Term Funds | 11.7% |

Domestic Equity Funds category includes Fidelity Series Commodity Strategy Fund which invests in commodity-related investments.
Fidelity Flex℠ Freedom 2015 Fund
Schedule of Investments September 30, 2018 (Unaudited)
Showing Percentage of Net Assets
| Domestic Equity Funds - 29.9% | | | |
| | | Shares | Value |
| Fidelity Series All-Sector Equity Fund (a) | | 89 | $1,211 |
| Fidelity Series Blue Chip Growth Fund (a) | | 142 | 2,180 |
| Fidelity Series Commodity Strategy Fund (a) | | 434 | 2,172 |
| Fidelity Series Growth Company Fund (a) | | 219 | 4,422 |
| Fidelity Series Intrinsic Opportunities Fund (a) | | 289 | 5,298 |
| Fidelity Series Large Cap Stock Fund (a) | | 296 | 4,708 |
| Fidelity Series Large Cap Value Index Fund (a) | | 100 | 1,318 |
| Fidelity Series Opportunistic Insights Fund (a) | | 120 | 2,373 |
| Fidelity Series Small Cap Discovery Fund (a) | | 53 | 639 |
| Fidelity Series Small Cap Opportunities Fund (a) | | 134 | 1,968 |
| Fidelity Series Stock Selector Large Cap Value Fund (a) | | 272 | 3,594 |
| Fidelity Series Value Discovery Fund (a) | | 186 | 2,552 |
| TOTAL DOMESTIC EQUITY FUNDS | | | |
| (Cost $29,959) | | | 32,435 |
|
| International Equity Funds - 17.2% | | | |
| Fidelity Series Canada Fund (a) | | 49 | 527 |
| Fidelity Series Emerging Markets Fund (a) | | 67 | 653 |
| Fidelity Series Emerging Markets Opportunities Fund (a) | | 306 | 5,867 |
| Fidelity Series International Growth Fund (a) | | 318 | 5,218 |
| Fidelity Series International Small Cap Fund (a) | | 70 | 1,256 |
| Fidelity Series International Value Fund (a) | | 494 | 5,195 |
| TOTAL INTERNATIONAL EQUITY FUNDS | | | |
| (Cost $18,176) | | | 18,716 |
|
| Bond Funds - 41.2% | | | |
| Fidelity Series Emerging Markets Debt Fund (a) | | 78 | 743 |
| Fidelity Series Floating Rate High Income Fund (a) | | 27 | 253 |
| Fidelity Series High Income Fund (a) | | 160 | 1,537 |
| Fidelity Series Inflation-Protected Bond Index Fund (a) | | 791 | 7,685 |
| Fidelity Series International Credit Fund (a) | | 6 | 54 |
| Fidelity Series Investment Grade Bond Fund (a) | | 2,636 | 28,704 |
| Fidelity Series Long-Term Treasury Bond Index Fund (a) | | 648 | 5,335 |
| Fidelity Series Real Estate Income Fund (a) | | 47 | 503 |
| TOTAL BOND FUNDS | | | |
| (Cost $46,195) | | | 44,814 |
|
| Short-Term Funds - 11.7% | | | |
| Fidelity Series Government Money Market Fund 2.12% (a)(b) | | 10,168 | 10,168 |
| Fidelity Series Short-Term Credit Fund (a) | | 258 | 2,541 |
| TOTAL SHORT-TERM FUNDS | | | |
| (Cost $12,737) | | | 12,709 |
| TOTAL INVESTMENT IN SECURITIES - 100.0% | | | |
| (Cost $107,067) | | | 108,674 |
| NET OTHER ASSETS (LIABILITIES) - 0.0% | | | 1 |
| NET ASSETS - 100% | | | $108,675 |
Legend
(a) Affiliated Fund
(b) The rate quoted is the annualized seven-day yield of the fund at period end.
Affiliated Underlying Funds
Fiscal year to date information regarding the Fund's investments in affiliated Underlying Funds, excluding any Money Market Central Funds, is presented below. Exchanges between classes of the same affiliated Underlying Funds may occur.
| Affiliate | Value, beginning of period | Purchases | Sales Proceeds | Dividend Income | Realized Gain (loss) | Change in Unrealized appreciation (depreciation) | Value, end of period |
| Fidelity Series 100 Index Fund | $1,112 | $-- | $1,151 | $-- | $116 | $(77) | $-- |
| Fidelity Series All-Sector Equity Fund | 2,132 | 28 | 1,182 | -- | 46 | 187 | 1,211 |
| Fidelity Series Blue Chip Growth Fund | 2,204 | 252 | 451 | 210 | 47 | 128 | 2,180 |
| Fidelity Series Canada Fund | 532 | 37 | 73 | -- | 1 | 30 | 527 |
| Fidelity Series Commodity Strategy Fund | 2,252 | 284 | 187 | 130 | (6) | (171) | 2,172 |
| Fidelity Series Emerging Markets Debt Fund | 741 | 43 | -- | 22 | -- | (41) | 743 |
| Fidelity Series Emerging Markets Fund | -- | 653 | -- | -- | -- | -- | 653 |
| Fidelity Series Emerging Markets Opportunities Fund | 5,947 | 1,529 | 854 | -- | (27) | (728) | 5,867 |
| Fidelity Series Floating Rate High Income Fund | 250 | 22 | 19 | 7 | -- | -- | 253 |
| Fidelity Series Government Money Market Fund 2.12% | 11,499 | 2,561 | 3,892 | 108 | -- | -- | 10,168 |
| Fidelity Series Growth Company Fund | 4,439 | 135 | 803 | -- | 114 | 537 | 4,422 |
| Fidelity Series High Income Fund | 1,550 | 51 | 77 | 45 | (1) | 14 | 1,537 |
| Fidelity Series Inflation-Protected Bond Index Fund | 2,090 | 5,627 | 7 | 7 | -- | (25) | 7,685 |
| Fidelity Series International Credit Fund | 51 | 4 | -- | 1 | -- | (1) | 54 |
| Fidelity Series International Growth Fund | 5,462 | 194 | 516 | -- | 19 | 59 | 5,218 |
| Fidelity Series International Small Cap Fund | 1,365 | 76 | 134 | -- | 5 | (56) | 1,256 |
| Fidelity Series International Value Fund | 5,419 | 222 | 425 | -- | (1) | (20) | 5,195 |
| Fidelity Series Intrinsic Opportunities Fund | 5,389 | 461 | 642 | 242 | 30 | 60 | 5,298 |
| Fidelity Series Investment Grade Bond Fund | 29,661 | 762 | 1,377 | 418 | (31) | (311) | 28,704 |
| Fidelity Series Large Cap Stock Fund | 4,974 | 356 | 863 | 293 | 42 | 199 | 4,708 |
| Fidelity Series Large Cap Value Index Fund | 1,382 | 34 | 193 | -- | 11 | 84 | 1,318 |
| Fidelity Series Long-Term Treasury Bond Index Fund | 2,362 | 3,435 | 279 | 47 | (14) | (169) | 5,335 |
| Fidelity Series Opportunistic Insights Fund | 2,416 | 45 | 395 | -- | 33 | 274 | 2,373 |
| Fidelity Series Real Estate Equity Fund | 426 | 4 | 441 | 3 | (30) | 41 | -- |
| Fidelity Series Real Estate Income Fund | 475 | 44 | 20 | 21 | -- | 4 | 503 |
| Fidelity Series Short-Term Credit Fund | 2,821 | 425 | 706 | 32 | (7) | 8 | 2,541 |
| Fidelity Series Small Cap Discovery Fund | 657 | 51 | 60 | 39 | -- | (9) | 639 |
| Fidelity Series Small Cap Opportunities Fund | 2,007 | 192 | 304 | 152 | 21 | 52 | 1,968 |
| Fidelity Series Stock Selector Large Cap Value Fund | 3,764 | 55 | 480 | -- | 6 | 249 | 3,594 |
| Fidelity Series Value Discovery Fund | 2,674 | 66 | 342 | -- | 6 | 148 | 2,552 |
| Total | $106,053 | $17,648 | $15,873 | $1,777 | $380 | $466 | $108,674 |
Amounts in the income column in the above table include any capital gain distributions from underlying funds, which are presented in the corresponding line-item in the Statement of Operations if applicable.
Investment Valuation
All investments are categorized as Level 1 under the Fair Value Hierarchy. The inputs or methodology used for valuing securities may not be an indication of the risk associated with investing in those securities. For more information on valuation inputs please refer to the Investment Valuation section in the accompanying Notes to Financial Statements.
See accompanying notes which are an integral part of the financial statements.
Fidelity Flex℠ Freedom 2015 Fund
Financial Statements
Statement of Assets and Liabilities
| | | September 30, 2018 (Unaudited) |
| Assets | | |
Investment in securities, at value — See accompanying schedule:
| | |
| Affiliated issuers (cost $107,067) | $108,674 | |
| Total Investment in Securities (cost $107,067) | | $108,674 |
| Receivable for investments sold | | 1,566 |
| Total assets | | 110,240 |
| Liabilities | | |
| Payable for investments purchased | $1,565 | |
| Total liabilities | | 1,565 |
| Net Assets | | $108,675 |
| Net Assets consist of: | | |
| Paid in capital | | $104,937 |
| Undistributed net investment income | | 975 |
| Accumulated undistributed net realized gain (loss) on investments | | 1,156 |
| Net unrealized appreciation (depreciation) on investments | | 1,607 |
| Net Assets, for 10,478 shares outstanding | | $108,675 |
| Net Asset Value, offering price and redemption price per share ($108,675 ÷ 10,478 shares) | | $10.37 |
See accompanying notes which are an integral part of the financial statements.
Statement of Operations
| | | Six months ended September 30, 2018 (Unaudited) |
| Investment Income | | |
| Dividends: | | |
| Affiliated issuers | | $979 |
| Expenses | | |
| Independent trustees' fees and expenses | $1 | |
| Total expenses | | 1 |
| Net investment income (loss) | | 978 |
| Realized and Unrealized Gain (Loss) | | |
| Net realized gain (loss) on: | | |
| Investment securities: | | |
| Affiliated issuers | 380 | |
| Capital gain distributions from underlying funds: | | |
| Affiliated issuers | 798 | |
| Total net realized gain (loss) | | 1,178 |
| Change in net unrealized appreciation (depreciation) on: | | |
| Investment securities: | | |
| Affiliated issuers | 466 | |
| Total change in net unrealized appreciation (depreciation) | | 466 |
| Net gain (loss) | | 1,644 |
| Net increase (decrease) in net assets resulting from operations | | $2,622 |
See accompanying notes which are an integral part of the financial statements.
Statement of Changes in Net Assets
| | Six months ended September 30, 2018 (Unaudited) | For the period
June 8, 2017 (commencement of operations) to March 31, 2018 |
| Increase (Decrease) in Net Assets | | |
| Operations | | |
| Net investment income (loss) | $978 | $1,876 |
| Net realized gain (loss) | 1,178 | 3,036 |
| Change in net unrealized appreciation (depreciation) | 466 | 1,141 |
| Net increase (decrease) in net assets resulting from operations | 2,622 | 6,053 |
| Distributions to shareholders from net investment income | (359) | (1,520) |
| Distributions to shareholders from net realized gain | (1,978) | (1,080) |
| Total distributions | (2,337) | (2,600) |
| Share transactions | | |
| Proceeds from sales of shares | – | 100,000 |
| Reinvestment of distributions | 2,337 | 2,600 |
| Net increase (decrease) in net assets resulting from share transactions | 2,337 | 102,600 |
| Total increase (decrease) in net assets | 2,622 | 106,053 |
| Net Assets | | |
| Beginning of period | 106,053 | – |
| End of period | $108,675 | $106,053 |
| Other Information | | |
| Undistributed net investment income end of period | $975 | $356 |
| Shares | | |
| Sold | – | 10,000 |
| Issued in reinvestment of distributions | 228 | 250 |
| Net increase (decrease) | 228 | 10,250 |
See accompanying notes which are an integral part of the financial statements.
Financial Highlights
Fidelity Flex Freedom 2015 Fund
| | Six months ended (Unaudited) September 30, | Years endedMarch 31, |
| | 2018 | 2018 A |
| Selected Per–Share Data | | |
| Net asset value, beginning of period | $10.35 | $10.00 |
| Income from Investment Operations | | |
| Net investment income (loss)B | .09 | .19 |
| Net realized and unrealized gain (loss) | .16 | .42 |
| Total from investment operations | .25 | .61 |
| Distributions from net investment income | (.04) | (.15) |
| Distributions from net realized gain | (.19) | (.11) |
| Total distributions | (.23) | (.26) |
| Net asset value, end of period | $10.37 | $10.35 |
| Total ReturnC | 2.42% | 6.09% |
| Ratios to Average Net AssetsD,E | | |
| Expenses before reductions | - %F,G | - %F |
| Expenses net of fee waivers, if any | - %F,G | - %F |
| Expenses net of all reductions | - %F,G | - %F |
| Net investment income (loss) | 1.82%F | 2.21%F |
| Supplemental Data | | |
| Net assets, end of period (000 omitted) | $109 | $106 |
| Portfolio turnover rateD | 30%F | 14%F |
A For the period June 8, 2017 (commencement of operations) to March 31, 2018.
B Calculated based on average shares outstanding during the period.
C Total returns for periods of less than one year are not annualized.
D Amounts do not include the activity of the Underlying Funds.
E Expense ratios reflect operating expenses of the Fund. Expenses before reductions do not reflect amounts reimbursed by the investment adviser or reductions from expense offset arrangements and do not represent the amount paid by the Fund during periods when reimbursements or reductions occur. Expenses net of fee waivers reflect expenses after reimbursement by the investment adviser but prior to reductions from expense offset arrangements. Expenses net of all reductions represent the net expenses paid by the Fund but do not include expenses of the underlying funds in which the Fund invests.
F Annualized
G Amount represents less than .005%.
See accompanying notes which are an integral part of the financial statements.
Fidelity Flex℠ Freedom 2020 Fund
Investment Summary (Unaudited)
The information in the following tables is based on the direct investments of the Fund.
Top Holdings as of September 30, 2018
| | % of fund's net assets |
| Fidelity Series Investment Grade Bond Fund | 23.4 |
| Fidelity Series Government Money Market Fund 2.12% | 7.1 |
| Fidelity Series Emerging Markets Opportunities Fund | 6.0 |
| Fidelity Series Intrinsic Opportunities Fund | 5.8 |
| Fidelity Series International Growth Fund | 5.5 |
| Fidelity Series International Value Fund | 5.5 |
| Fidelity Series Inflation-Protected Bond Index Fund | 5.2 |
| Fidelity Series Large Cap Stock Fund | 5.2 |
| Fidelity Series Long-Term Treasury Bond Index Fund | 5.0 |
| Fidelity Series Growth Company Fund | 4.8 |
| | 73.5 |
Asset Allocation (% of fund's net assets)
| Period end |
| | Domestic Equity Funds | 35.1% |
| | International Equity Funds | 19.6% |
| | Bond Funds | 36.4% |
| | Short-Term Funds | 8.9% |

Domestic Equity Funds category includes Fidelity Series Commodity Strategy Fund which invests in commodity-related investments.
Fidelity Flex℠ Freedom 2020 Fund
Schedule of Investments September 30, 2018 (Unaudited)
Showing Percentage of Net Assets
| Domestic Equity Funds - 35.1% | | | |
| | | Shares | Value |
| Fidelity Series All-Sector Equity Fund (a) | | 107 | $1,454 |
| Fidelity Series Blue Chip Growth Fund (a) | | 171 | 2,618 |
| Fidelity Series Commodity Strategy Fund (a) | | 434 | 2,170 |
| Fidelity Series Growth Company Fund (a) | | 263 | 5,311 |
| Fidelity Series Intrinsic Opportunities Fund (a) | | 347 | 6,362 |
| Fidelity Series Large Cap Stock Fund (a) | | 355 | 5,653 |
| Fidelity Series Large Cap Value Index Fund (a) | | 120 | 1,583 |
| Fidelity Series Opportunistic Insights Fund (a) | | 144 | 2,849 |
| Fidelity Series Small Cap Discovery Fund (a) | | 63 | 767 |
| Fidelity Series Small Cap Opportunities Fund (a) | | 161 | 2,364 |
| Fidelity Series Stock Selector Large Cap Value Fund (a) | | 326 | 4,316 |
| Fidelity Series Value Discovery Fund (a) | | 224 | 3,065 |
| TOTAL DOMESTIC EQUITY FUNDS | | | |
| (Cost $35,548) | | | 38,512 |
|
| International Equity Funds - 19.6% | | | |
| Fidelity Series Canada Fund (a) | | 57 | 615 |
| Fidelity Series Emerging Markets Fund (a) | | 75 | 727 |
| Fidelity Series Emerging Markets Opportunities Fund (a) | | 340 | 6,529 |
| Fidelity Series International Growth Fund (a) | | 371 | 6,082 |
| Fidelity Series International Small Cap Fund (a) | | 82 | 1,465 |
| Fidelity Series International Value Fund (a) | | 576 | 6,056 |
| TOTAL INTERNATIONAL EQUITY FUNDS | | | |
| (Cost $20,845) | | | 21,474 |
|
| Bond Funds - 36.4% | | | |
| Fidelity Series Emerging Markets Debt Fund (a) | | 76 | 728 |
| Fidelity Series Floating Rate High Income Fund (a) | | 27 | 255 |
| Fidelity Series High Income Fund (a) | | 163 | 1,567 |
| Fidelity Series Inflation-Protected Bond Index Fund (a) | | 585 | 5,677 |
| Fidelity Series International Credit Fund (a) | | 7 | 66 |
| Fidelity Series Investment Grade Bond Fund (a) | | 2,357 | 25,667 |
| Fidelity Series Long-Term Treasury Bond Index Fund (a) | | 669 | 5,509 |
| Fidelity Series Real Estate Income Fund (a) | | 47 | 508 |
| TOTAL BOND FUNDS | | | |
| (Cost $41,245) | | | 39,977 |
|
| Short-Term Funds - 8.9% | | | |
| Fidelity Series Government Money Market Fund 2.12% (a)(b) | | 7,826 | 7,826 |
| Fidelity Series Short-Term Credit Fund (a) | | 198 | 1,956 |
| TOTAL SHORT-TERM FUNDS | | | |
| (Cost $9,802) | | | 9,782 |
| TOTAL INVESTMENT IN SECURITIES - 100.0% | | | |
| (Cost $107,440) | | | 109,745 |
| NET OTHER ASSETS (LIABILITIES) - 0.0% | | | 1 |
| NET ASSETS - 100% | | | $109,746 |
Legend
(a) Affiliated Fund
(b) The rate quoted is the annualized seven-day yield of the fund at period end.
Affiliated Underlying Funds
Fiscal year to date information regarding the Fund's investments in affiliated Underlying Funds, excluding any Money Market Central Funds, is presented below. Exchanges between classes of the same affiliated Underlying Funds may occur.
| Affiliate | Value, beginning of period | Purchases | Sales Proceeds | Dividend Income | Realized Gain (loss) | Change in Unrealized appreciation (depreciation) | Value, end of period |
| Fidelity Series 100 Index Fund | $1,284 | $3 | $1,328 | $-- | $130 | $(89) | $-- |
| Fidelity Series All-Sector Equity Fund | 2,464 | 34 | 1,316 | -- | 53 | 219 | 1,454 |
| Fidelity Series Blue Chip Growth Fund | 2,547 | 306 | 432 | 250 | 42 | 155 | 2,618 |
| Fidelity Series Canada Fund | 602 | 48 | 72 | -- | 2 | 35 | 615 |
| Fidelity Series Commodity Strategy Fund | 2,267 | 287 | 207 | 130 | (7) | (170) | 2,170 |
| Fidelity Series Emerging Markets Debt Fund | 741 | 28 | -- | 22 | -- | (41) | 728 |
| Fidelity Series Emerging Markets Fund | -- | 727 | -- | -- | -- | -- | 727 |
| Fidelity Series Emerging Markets Opportunities Fund | 6,573 | 1,705 | 910 | -- | (35) | (804) | 6,529 |
| Fidelity Series Floating Rate High Income Fund | 250 | 7 | 2 | 7 | -- | -- | 255 |
| Fidelity Series Government Money Market Fund 2.12% | 8,790 | 2,508 | 3,472 | 83 | -- | -- | 7,826 |
| Fidelity Series Growth Company Fund | 5,134 | 167 | 751 | -- | 102 | 659 | 5,311 |
| Fidelity Series High Income Fund | 1,550 | 46 | 42 | 45 | (1) | 14 | 1,567 |
| Fidelity Series Inflation-Protected Bond Index Fund | 1,236 | 4,474 | 12 | 5 | -- | (21) | 5,677 |
| Fidelity Series International Credit Fund | 51 | 16 | -- | 1 | -- | (1) | 66 |
| Fidelity Series International Growth Fund | 6,164 | 238 | 410 | -- | 13 | 77 | 6,082 |
| Fidelity Series International Small Cap Fund | 1,544 | 93 | 114 | -- | 6 | (64) | 1,465 |
| Fidelity Series International Value Fund | 6,138 | 288 | 352 | -- | 2 | (20) | 6,056 |
| Fidelity Series Intrinsic Opportunities Fund | 6,227 | 607 | 570 | 289 | 14 | 84 | 6,362 |
| Fidelity Series Investment Grade Bond Fund | 26,901 | 601 | 1,527 | 379 | (36) | (272) | 25,667 |
| Fidelity Series Large Cap Stock Fund | 5,804 | 413 | 843 | 345 | 40 | 239 | 5,653 |
| Fidelity Series Large Cap Value Index Fund | 1,597 | 44 | 170 | -- | 9 | 103 | 1,583 |
| Fidelity Series Long-Term Treasury Bond Index Fund | 2,388 | 3,485 | 177 | 49 | (10) | (177) | 5,509 |
| Fidelity Series Opportunistic Insights Fund | 2,791 | 58 | 358 | -- | 29 | 329 | 2,849 |
| Fidelity Series Real Estate Equity Fund | 487 | 36 | 540 | 5 | (31) | 48 | -- |
| Fidelity Series Real Estate Income Fund | 485 | 21 | 1 | 21 | -- | 3 | 508 |
| Fidelity Series Short-Term Credit Fund | 2,154 | 424 | 622 | 25 | (7) | 7 | 1,956 |
| Fidelity Series Small Cap Discovery Fund | 760 | 59 | 41 | 45 | (1) | (10) | 767 |
| Fidelity Series Small Cap Opportunities Fund | 2,319 | 230 | 266 | 181 | 19 | 62 | 2,364 |
| Fidelity Series Stock Selector Large Cap Value Fund | 4,349 | 69 | 401 | -- | 5 | 294 | 4,316 |
| Fidelity Series Value Discovery Fund | 3,090 | 69 | 276 | -- | 7 | 175 | 3,065 |
| Total | $106,687 | $17,091 | $15,212 | $1,882 | $345 | $834 | $109,745 |
Amounts in the income column in the above table include any capital gain distributions from underlying funds, which are presented in the corresponding line-item in the Statement of Operations if applicable.
Investment Valuation
All investments are categorized as Level 1 under the Fair Value Hierarchy. The inputs or methodology used for valuing securities may not be an indication of the risk associated with investing in those securities. For more information on valuation inputs please refer to the Investment Valuation section in the accompanying Notes to Financial Statements.
See accompanying notes which are an integral part of the financial statements.
Fidelity Flex℠ Freedom 2020 Fund
Financial Statements
Statement of Assets and Liabilities
| | | September 30, 2018 (Unaudited) |
| Assets | | |
Investment in securities, at value — See accompanying schedule:
| | |
| Affiliated issuers (cost $107,440) | $109,745 | |
| Total Investment in Securities (cost $107,440) | | $109,745 |
| Receivable for investments sold | | 1,647 |
| Total assets | | 111,392 |
| Liabilities | | |
| Payable for investments purchased | $1,646 | |
| Total liabilities | | 1,646 |
| Net Assets | | $109,746 |
| Net Assets consist of: | | |
| Paid in capital | | $105,235 |
| Undistributed net investment income | | 932 |
| Accumulated undistributed net realized gain (loss) on investments | | 1,274 |
| Net unrealized appreciation (depreciation) on investments | | 2,305 |
| Net Assets, for 10,505 shares outstanding | | $109,746 |
| Net Asset Value, offering price and redemption price per share ($109,746 ÷ 10,505 shares) | | $10.45 |
See accompanying notes which are an integral part of the financial statements.
Statement of Operations
| | | Six months ended September 30, 2018 (Unaudited) |
| Investment Income | | |
| Dividends: | | |
| Affiliated issuers | | $934 |
| Expenses | | |
| Independent trustees' fees and expenses | $1 | |
| Total expenses | | 1 |
| Net investment income (loss) | | 933 |
| Realized and Unrealized Gain (Loss) | | |
| Net realized gain (loss) on: | | |
| Investment securities: | | |
| Affiliated issuers | 345 | |
| Capital gain distributions from underlying funds: | | |
| Affiliated issuers | 948 | |
| Total net realized gain (loss) | | 1,293 |
| Change in net unrealized appreciation (depreciation) on: | | |
| Investment securities: | | |
| Affiliated issuers | 834 | |
| Total change in net unrealized appreciation (depreciation) | | 834 |
| Net gain (loss) | | 2,127 |
| Net increase (decrease) in net assets resulting from operations | | $3,060 |
See accompanying notes which are an integral part of the financial statements.
Statement of Changes in Net Assets
| | Six months ended September 30, 2018 (Unaudited) | For the period
June 8, 2017 (commencement of operations) to March 31, 2018 |
| Increase (Decrease) in Net Assets | | |
| Operations | | |
| Net investment income (loss) | $933 | $1,888 |
| Net realized gain (loss) | 1,293 | 3,327 |
| Change in net unrealized appreciation (depreciation) | 834 | 1,471 |
| Net increase (decrease) in net assets resulting from operations | 3,060 | 6,686 |
| Distributions to shareholders from net investment income | (318) | (1,570) |
| Distributions to shareholders from net realized gain | (2,186) | (1,160) |
| Total distributions | (2,504) | (2,730) |
| Share transactions | | |
| Proceeds from sales of shares | – | 100,000 |
| Reinvestment of distributions | 2,504 | 2,730 |
| Net increase (decrease) in net assets resulting from share transactions | 2,504 | 102,730 |
| Total increase (decrease) in net assets | 3,060 | 106,686 |
| Net Assets | | |
| Beginning of period | 106,686 | – |
| End of period | $109,746 | $106,686 |
| Other Information | | |
| Undistributed net investment income end of period | $932 | $317 |
| Shares | | |
| Sold | – | 10,000 |
| Issued in reinvestment of distributions | 243 | 262 |
| Net increase (decrease) | 243 | 10,262 |
See accompanying notes which are an integral part of the financial statements.
Financial Highlights
Fidelity Flex Freedom 2020 Fund
| | Six months ended (Unaudited) September 30, | Years endedMarch 31, |
| | 2018 | 2018 A |
| Selected Per–Share Data | | |
| Net asset value, beginning of period | $10.40 | $10.00 |
| Income from Investment Operations | | |
| Net investment income (loss)B | .09 | .19 |
| Net realized and unrealized gain (loss) | .20 | .48 |
| Total from investment operations | .29 | .67 |
| Distributions from net investment income | (.03) | (.16) |
| Distributions from net realized gain | (.21) | (.12) |
| Total distributions | (.24) | (.27)C |
| Net asset value, end of period | $10.45 | $10.40 |
| Total ReturnD | 2.86% | 6.72% |
| Ratios to Average Net AssetsE,F | | |
| Expenses before reductions | - %G,H | - %G |
| Expenses net of fee waivers, if any | - %G,H | - %G |
| Expenses net of all reductions | - %G,H | - %G |
| Net investment income (loss) | 1.72%G | 2.22%G |
| Supplemental Data | | |
| Net assets, end of period (000 omitted) | $110 | $107 |
| Portfolio turnover rateE | 28%G | 14%G |
A For the period June 8, 2017 (commencement of operations) to March 31, 2018.
B Calculated based on average shares outstanding during the period.
C Total distributions of $.27 per share is comprised of distributions from net investment income of $.157 and distributions from net realized gain of $.116 per share.
D Total returns for periods of less than one year are not annualized.
E Amounts do not include the activity of the Underlying Funds.
F Expense ratios reflect operating expenses of the Fund. Expenses before reductions do not reflect amounts reimbursed by the investment adviser or reductions from expense offset arrangements and do not represent the amount paid by the Fund during periods when reimbursements or reductions occur. Expenses net of fee waivers reflect expenses after reimbursement by the investment adviser but prior to reductions from expense offset arrangements. Expenses net of all reductions represent the net expenses paid by the Fund but do not include expenses of the underlying funds in which the Fund invests.
G Annualized
H Amount represents less than .005%.
See accompanying notes which are an integral part of the financial statements.
Fidelity Flex℠ Freedom 2025 Fund
Investment Summary (Unaudited)
The information in the following tables is based on the direct investments of the Fund.
Top Holdings as of September 30, 2018
| | % of fund's net assets |
| Fidelity Series Investment Grade Bond Fund | 19.8 |
| Fidelity Series Intrinsic Opportunities Fund | 6.6 |
| Fidelity Series Emerging Markets Opportunities Fund | 6.4 |
| Fidelity Series International Growth Fund | 6.2 |
| Fidelity Series International Value Fund | 6.2 |
| Fidelity Series Large Cap Stock Fund | 5.9 |
| Fidelity Series Growth Company Fund | 5.5 |
| Fidelity Series Long-Term Treasury Bond Index Fund | 5.5 |
| Fidelity Series Government Money Market Fund 2.12% | 5.1 |
| Fidelity Series Stock Selector Large Cap Value Fund | 4.5 |
| | 71.7 |
Asset Allocation (% of fund's net assets)
| Period end |
| | Domestic Equity Funds | 39.9% |
| | International Equity Funds | 21.6% |
| | Bond Funds | 32.2% |
| | Short-Term Funds | 6.3% |

Domestic Equity Funds category includes Fidelity Series Commodity Strategy Fund which invests in commodity-related investments.
Fidelity Flex℠ Freedom 2025 Fund
Schedule of Investments September 30, 2018 (Unaudited)
Showing Percentage of Net Assets
| Domestic Equity Funds - 39.9% | | | |
| | | Shares | Value |
| Fidelity Series All-Sector Equity Fund (a) | | 123 | $1,680 |
| Fidelity Series Blue Chip Growth Fund (a) | | 198 | 3,025 |
| Fidelity Series Commodity Strategy Fund (a) | | 442 | 2,211 |
| Fidelity Series Growth Company Fund (a) | | 304 | 6,136 |
| Fidelity Series Intrinsic Opportunities Fund (a) | | 401 | 7,351 |
| Fidelity Series Large Cap Stock Fund (a) | | 410 | 6,532 |
| Fidelity Series Large Cap Value Index Fund (a) | | 139 | 1,829 |
| Fidelity Series Opportunistic Insights Fund (a) | | 166 | 3,292 |
| Fidelity Series Small Cap Discovery Fund (a) | | 73 | 886 |
| Fidelity Series Small Cap Opportunities Fund (a) | | 186 | 2,731 |
| Fidelity Series Stock Selector Large Cap Value Fund (a) | | 377 | 4,986 |
| Fidelity Series Value Discovery Fund (a) | | 259 | 3,541 |
| TOTAL DOMESTIC EQUITY FUNDS | | | |
| (Cost $40,797) | | | 44,200 |
|
| International Equity Funds - 21.6% | | | |
| Fidelity Series Canada Fund (a) | | 64 | 688 |
| Fidelity Series Emerging Markets Fund (a) | | 82 | 791 |
| Fidelity Series Emerging Markets Opportunities Fund (a) | | 370 | 7,108 |
| Fidelity Series International Growth Fund (a) | | 417 | 6,832 |
| Fidelity Series International Small Cap Fund (a) | | 92 | 1,643 |
| Fidelity Series International Value Fund (a) | | 647 | 6,804 |
| TOTAL INTERNATIONAL EQUITY FUNDS | | | |
| (Cost $23,165) | | | 23,866 |
|
| Bond Funds - 32.2% | | | |
| Fidelity Series Emerging Markets Debt Fund (a) | | 75 | 712 |
| Fidelity Series Floating Rate High Income Fund (a) | | 27 | 257 |
| Fidelity Series High Income Fund (a) | | 162 | 1,558 |
| Fidelity Series Inflation-Protected Bond Index Fund (a) | | 463 | 4,500 |
| Fidelity Series International Credit Fund (a) | | 7 | 66 |
| Fidelity Series Investment Grade Bond Fund (a) | | 2,015 | 21,945 |
| Fidelity Series Long-Term Treasury Bond Index Fund (a) | | 741 | 6,105 |
| Fidelity Series Real Estate Income Fund (a) | | 47 | 508 |
| TOTAL BOND FUNDS | | | |
| (Cost $36,799) | | | 35,651 |
|
| Short-Term Funds - 6.3% | | | |
| Fidelity Series Government Money Market Fund 2.12% (a)(b) | | 5,629 | 5,629 |
| Fidelity Series Short-Term Credit Fund (a) | | 142 | 1,402 |
| TOTAL SHORT-TERM FUNDS | | | |
| (Cost $7,045) | | | 7,031 |
| TOTAL INVESTMENT IN SECURITIES - 100.0% | | | |
| (Cost $107,806) | | | 110,748 |
| NET OTHER ASSETS (LIABILITIES) - 0.0% | | | 2 |
| NET ASSETS - 100% | | | $110,750 |
Legend
(a) Affiliated Fund
(b) The rate quoted is the annualized seven-day yield of the fund at period end.
Affiliated Underlying Funds
Fiscal year to date information regarding the Fund's investments in affiliated Underlying Funds, excluding any Money Market Central Funds, is presented below. Exchanges between classes of the same affiliated Underlying Funds may occur.
| Affiliate | Value, beginning of period | Purchases | Sales Proceeds | Dividend Income | Realized Gain (loss) | Change in Unrealized appreciation (depreciation) | Value, end of period |
| Fidelity Series 100 Index Fund | $1,446 | $-- | $1,496 | $-- | $150 | $(100) | $-- |
| Fidelity Series All-Sector Equity Fund | 2,774 | 27 | 1,430 | -- | 60 | 249 | 1,680 |
| Fidelity Series Blue Chip Growth Fund | 2,867 | 341 | 399 | 289 | 36 | 180 | 3,025 |
| Fidelity Series Canada Fund | 665 | 56 | 74 | -- | 1 | 40 | 688 |
| Fidelity Series Commodity Strategy Fund | 2,284 | 288 | 182 | 132 | (6) | (173) | 2,211 |
| Fidelity Series Emerging Markets Debt Fund | 731 | 21 | -- | 22 | -- | (40) | 712 |
| Fidelity Series Emerging Markets Fund | -- | 791 | -- | -- | -- | -- | 791 |
| Fidelity Series Emerging Markets Opportunities Fund | 7,122 | 1,822 | 924 | -- | (42) | (870) | 7,108 |
| Fidelity Series Floating Rate High Income Fund | 250 | 7 | -- | 7 | -- | -- | 257 |
| Fidelity Series Government Money Market Fund 2.12% | 6,818 | 2,085 | 3,274 | 61 | -- | -- | 5,629 |
| Fidelity Series Growth Company Fund | 5,867 | 184 | 779 | -- | 98 | 766 | 6,136 |
| Fidelity Series High Income Fund | 1,540 | 45 | 40 | 45 | (1) | 14 | 1,558 |
| Fidelity Series Inflation-Protected Bond Index Fund | 877 | 3,650 | 10 | 4 | -- | (17) | 4,500 |
| Fidelity Series International Credit Fund | 51 | 16 | -- | 1 | -- | (1) | 66 |
| Fidelity Series International Growth Fund | 6,786 | 251 | 308 | -- | 11 | 92 | 6,832 |
| Fidelity Series International Small Cap Fund | 1,693 | 81 | 67 | -- | 4 | (68) | 1,643 |
| Fidelity Series International Value Fund | 6,778 | 358 | 317 | -- | 4 | (19) | 6,804 |
| Fidelity Series Intrinsic Opportunities Fund | 6,932 | 769 | 453 | 333 | -- | 103 | 7,351 |
| Fidelity Series Investment Grade Bond Fund | 23,448 | 593 | 1,830 | 324 | (35) | (231) | 21,945 |
| Fidelity Series Large Cap Stock Fund | 6,472 | 454 | 706 | 396 | 35 | 277 | 6,532 |
| Fidelity Series Large Cap Value Index Fund | 1,797 | 45 | 139 | -- | 7 | 119 | 1,829 |
| Fidelity Series Long-Term Treasury Bond Index Fund | 2,390 | 4,064 | 149 | 57 | (7) | (193) | 6,105 |
| Fidelity Series Opportunistic Insights Fund | 3,142 | 60 | 315 | -- | 24 | 381 | 3,292 |
| Fidelity Series Real Estate Equity Fund | 543 | 45 | 607 | 6 | (34) | 53 | -- |
| Fidelity Series Real Estate Income Fund | 475 | 31 | -- | 21 | -- | 2 | 508 |
| Fidelity Series Short-Term Credit Fund | 1,699 | 295 | 592 | 18 | (7) | 7 | 1,402 |
| Fidelity Series Small Cap Discovery Fund | 855 | 69 | 26 | 51 | -- | (12) | 886 |
| Fidelity Series Small Cap Opportunities Fund | 2,611 | 276 | 242 | 209 | 16 | 70 | 2,731 |
| Fidelity Series Stock Selector Large Cap Value Fund | 4,896 | 77 | 325 | -- | 3 | 335 | 4,986 |
| Fidelity Series Value Discovery Fund | 3,479 | 56 | 199 | -- | 5 | 200 | 3,541 |
| Total | $107,288 | $16,857 | $14,883 | $1,976 | $322 | $1,164 | $110,748 |
Amounts in the income column in the above table include any capital gain distributions from underlying funds, which are presented in the corresponding line-item in the Statement of Operations if applicable.
Investment Valuation
All investments are categorized as Level 1 under the Fair Value Hierarchy. The inputs or methodology used for valuing securities may not be an indication of the risk associated with investing in those securities. For more information on valuation inputs please refer to the Investment Valuation section in the accompanying Notes to Financial Statements.
See accompanying notes which are an integral part of the financial statements.
Fidelity Flex℠ Freedom 2025 Fund
Financial Statements
Statement of Assets and Liabilities
| | | September 30, 2018 (Unaudited) |
| Assets | | |
Investment in securities, at value — See accompanying schedule:
| | |
| Affiliated issuers (cost $107,806) | $110,748 | |
| Total Investment in Securities (cost $107,806) | | $110,748 |
| Receivable for investments sold | | 1,758 |
| Total assets | | 112,506 |
| Liabilities | | |
| Payable for investments purchased | $1,756 | |
| Total liabilities | | 1,756 |
| Net Assets | | $110,750 |
| Net Assets consist of: | | |
| Paid in capital | | $105,531 |
| Undistributed net investment income | | 877 |
| Accumulated undistributed net realized gain (loss) on investments | | 1,400 |
| Net unrealized appreciation (depreciation) on investments | | 2,942 |
| Net Assets, for 10,531 shares outstanding | | $110,750 |
| Net Asset Value, offering price and redemption price per share ($110,750 ÷ 10,531 shares) | | $10.52 |
See accompanying notes which are an integral part of the financial statements.
Statement of Operations
| | | Six months ended September 30, 2018 (Unaudited) |
| Investment Income | | |
| Dividends: | | |
| Affiliated issuers | | $888 |
| Expenses | | |
| Independent trustees' fees and expenses | $1 | |
| Total expenses | | 1 |
| Net investment income (loss) | | 887 |
| Realized and Unrealized Gain (Loss) | | |
| Net realized gain (loss) on: | | |
| Investment securities: | | |
| Affiliated issuers | 322 | |
| Capital gain distributions from underlying funds: | | |
| Affiliated issuers | 1,088 | |
| Total net realized gain (loss) | | 1,410 |
| Change in net unrealized appreciation (depreciation) on: | | |
| Investment securities: | | |
| Affiliated issuers | 1,164 | |
| Total change in net unrealized appreciation (depreciation) | | 1,164 |
| Net gain (loss) | | 2,574 |
| Net increase (decrease) in net assets resulting from operations | | $3,461 |
See accompanying notes which are an integral part of the financial statements.
Statement of Changes in Net Assets
| | Six months ended September 30, 2018 (Unaudited) | For the period
June 8, 2017 (commencement of operations) to March 31, 2018 |
| Increase (Decrease) in Net Assets | | |
| Operations | | |
| Net investment income (loss) | $887 | $1,878 |
| Net realized gain (loss) | 1,410 | 3,633 |
| Change in net unrealized appreciation (depreciation) | 1,164 | 1,778 |
| Net increase (decrease) in net assets resulting from operations | 3,461 | 7,289 |
| Distributions to shareholders from net investment income | (288) | (1,600) |
| Distributions to shareholders from net realized gain | (2,393) | (1,250) |
| Total distributions | (2,681) | (2,850) |
| Share transactions | | |
| Proceeds from sales of shares | – | 100,000 |
| Reinvestment of distributions | 2,681 | 2,850 |
| Net increase (decrease) in net assets resulting from share transactions | 2,681 | 102,850 |
| Total increase (decrease) in net assets | 3,461 | 107,289 |
| Net Assets | | |
| Beginning of period | 107,289 | – |
| End of period | $110,750 | $107,289 |
| Other Information | | |
| Undistributed net investment income end of period | $877 | $278 |
| Shares | | |
| Sold | – | 10,000 |
| Issued in reinvestment of distributions | 259 | 272 |
| Net increase (decrease) | 259 | 10,272 |
See accompanying notes which are an integral part of the financial statements.
Financial Highlights
Fidelity Flex Freedom 2025 Fund
| | Six months ended (Unaudited) September 30, | Years endedMarch 31, |
| | 2018 | 2018 A |
| Selected Per–Share Data | | |
| Net asset value, beginning of period | $10.44 | $10.00 |
| Income from Investment Operations | | |
| Net investment income (loss)B | .08 | .19 |
| Net realized and unrealized gain (loss) | .26 | .54 |
| Total from investment operations | .34 | .73 |
| Distributions from net investment income | (.03) | (.16) |
| Distributions from net realized gain | (.23) | (.13) |
| Total distributions | (.26) | (.29) |
| Net asset value, end of period | $10.52 | $10.44 |
| Total ReturnC | 3.30% | 7.24% |
| Ratios to Average Net AssetsD,E | | |
| Expenses before reductions | - %F,G | - %F |
| Expenses net of fee waivers, if any | - %F,G | - %F |
| Expenses net of all reductions | - %F,G | - %F |
| Net investment income (loss) | 1.63%F | 2.20%F |
| Supplemental Data | | |
| Net assets, end of period (000 omitted) | $111 | $107 |
| Portfolio turnover rateD | 27%F | 14%F |
A For the period June 8, 2017 (commencement of operations) to March 31, 2018.
B Calculated based on average shares outstanding during the period.
C Total returns for periods of less than one year are not annualized.
D Amounts do not include the activity of the Underlying Funds.
E Expense ratios reflect operating expenses of the Fund. Expenses before reductions do not reflect amounts reimbursed by the investment adviser or reductions from expense offset arrangements and do not represent the amount paid by the Fund during periods when reimbursements or reductions occur. Expenses net of fee waivers reflect expenses after reimbursement by the investment adviser but prior to reductions from expense offset arrangements. Expenses net of all reductions represent the net expenses paid by the Fund but do not include expenses of the underlying funds in which the Fund invests.
F Annualized
G Amount represents less than .005%.
See accompanying notes which are an integral part of the financial statements.
Fidelity Flex℠ Freedom 2030 Fund
Investment Summary (Unaudited)
The information in the following tables is based on the direct investments of the Fund.
Top Holdings as of September 30, 2018
| | % of fund's net assets |
| Fidelity Series Investment Grade Bond Fund | 14.8 |
| Fidelity Series Intrinsic Opportunities Fund | 8.1 |
| Fidelity Series International Growth Fund | 7.4 |
| Fidelity Series International Value Fund | 7.4 |
| Fidelity Series Emerging Markets Opportunities Fund | 7.3 |
| Fidelity Series Large Cap Stock Fund | 7.2 |
| Fidelity Series Growth Company Fund | 6.8 |
| Fidelity Series Long-Term Treasury Bond Index Fund | 5.6 |
| Fidelity Series Stock Selector Large Cap Value Fund | 5.5 |
| Fidelity Series Value Discovery Fund | 3.9 |
| | 74.0 |
Asset Allocation (% of fund's net assets)
| Period end |
| | Domestic Equity Funds | 48.4% |
| | International Equity Funds | 25.4% |
| | Bond Funds | 23.8% |
| | Short-Term Funds | 2.4% |

Domestic Equity Funds category includes Fidelity Series Commodity Strategy Fund which invests in commodity-related investments.
Fidelity Flex℠ Freedom 2030 Fund
Schedule of Investments September 30, 2018 (Unaudited)
Showing Percentage of Net Assets
| Domestic Equity Funds - 48.4% | | | |
| | | Shares | Value |
| Fidelity Series All-Sector Equity Fund (a) | | 154 | $2,098 |
| Fidelity Series Blue Chip Growth Fund (a) | | 247 | 3,776 |
| Fidelity Series Commodity Strategy Fund (a) | | 450 | 2,250 |
| Fidelity Series Growth Company Fund (a) | | 379 | 7,661 |
| Fidelity Series Intrinsic Opportunities Fund (a) | | 501 | 9,178 |
| Fidelity Series Large Cap Stock Fund (a) | | 512 | 8,155 |
| Fidelity Series Large Cap Value Index Fund (a) | | 173 | 2,283 |
| Fidelity Series Opportunistic Insights Fund (a) | | 207 | 4,110 |
| Fidelity Series Small Cap Discovery Fund (a) | | 91 | 1,107 |
| Fidelity Series Small Cap Opportunities Fund (a) | | 232 | 3,410 |
| Fidelity Series Stock Selector Large Cap Value Fund (a) | | 471 | 6,226 |
| Fidelity Series Value Discovery Fund (a) | | 323 | 4,421 |
| TOTAL DOMESTIC EQUITY FUNDS | | | |
| (Cost $50,435) | | | 54,675 |
|
| International Equity Funds - 25.4% | | | |
| Fidelity Series Canada Fund (a) | | 78 | 846 |
| Fidelity Series Emerging Markets Fund (a) | | 95 | 918 |
| Fidelity Series Emerging Markets Opportunities Fund (a) | | 430 | 8,250 |
| Fidelity Series International Growth Fund (a) | | 509 | 8,355 |
| Fidelity Series International Small Cap Fund (a) | | 112 | 2,013 |
| Fidelity Series International Value Fund (a) | | 791 | 8,319 |
| TOTAL INTERNATIONAL EQUITY FUNDS | | | |
| (Cost $27,846) | | | 28,701 |
|
| Bond Funds - 23.8% | | | |
| Fidelity Series Emerging Markets Debt Fund (a) | | 74 | 702 |
| Fidelity Series Floating Rate High Income Fund (a) | | 26 | 250 |
| Fidelity Series High Income Fund (a) | | 160 | 1,539 |
| Fidelity Series Inflation-Protected Bond Index Fund (a) | | 70 | 678 |
| Fidelity Series International Credit Fund (a) | | 6 | 56 |
| Fidelity Series Investment Grade Bond Fund (a) | | 1,537 | 16,736 |
| Fidelity Series Long-Term Treasury Bond Index Fund (a) | | 772 | 6,359 |
| Fidelity Series Real Estate Income Fund (a) | | 46 | 498 |
| TOTAL BOND FUNDS | | | |
| (Cost $27,742) | | | 26,818 |
|
| Short-Term Funds - 2.4% | | | |
| Fidelity Series Government Money Market Fund 2.12% (a)(b) | | 2,125 | 2,125 |
| Fidelity Series Short-Term Credit Fund (a) | | 54 | 530 |
| TOTAL SHORT-TERM FUNDS | | | |
| (Cost $2,657) | | | 2,655 |
| TOTAL INVESTMENT IN SECURITIES - 100.0% | | | |
| (Cost $108,680) | | | 112,849 |
| NET OTHER ASSETS (LIABILITIES) - 0.0% | | | 1 |
| NET ASSETS - 100% | | | $112,850 |
Legend
(a) Affiliated Fund
(b) The rate quoted is the annualized seven-day yield of the fund at period end.
Affiliated Underlying Funds
Fiscal year to date information regarding the Fund's investments in affiliated Underlying Funds, excluding any Money Market Central Funds, is presented below. Exchanges between classes of the same affiliated Underlying Funds may occur.
| Affiliate | Value, beginning of period | Purchases | Sales Proceeds | Dividend Income | Realized Gain (loss) | Change in Unrealized appreciation (depreciation) | Value, end of period |
| Fidelity Series 100 Index Fund | $1,787 | $-- | $1,842 | $-- | $178 | $(123) | $-- |
| Fidelity Series All-Sector Equity Fund | 3,427 | 25 | 1,735 | -- | 73 | 308 | 2,098 |
| Fidelity Series Blue Chip Growth Fund | 3,543 | 416 | 448 | 360 | 39 | 226 | 3,776 |
| Fidelity Series Canada Fund | 802 | 91 | 95 | -- | 1 | 47 | 846 |
| Fidelity Series Commodity Strategy Fund | 2,300 | 298 | 167 | 135 | (5) | (176) | 2,250 |
| Fidelity Series Emerging Markets Debt Fund | 720 | 21 | -- | 21 | -- | (39) | 702 |
| Fidelity Series Emerging Markets Fund | -- | 918 | -- | -- | -- | -- | 918 |
| Fidelity Series Emerging Markets Opportunities Fund | 8,381 | 2,035 | 1,102 | -- | (38) | (1,026) | 8,250 |
| Fidelity Series Floating Rate High Income Fund | 239 | 11 | -- | 7 | -- | -- | 250 |
| Fidelity Series Government Money Market Fund 2.12% | 1,625 | 1,843 | 1,343 | 17 | -- | -- | 2,125 |
| Fidelity Series Growth Company Fund | 7,220 | 198 | 823 | -- | 102 | 964 | 7,661 |
| Fidelity Series High Income Fund | 1,519 | 45 | 38 | 44 | (1) | 14 | 1,539 |
| Fidelity Series Inflation-Protected Bond Index Fund | 840 | 170 | 335 | 1 | (4) | 7 | 678 |
| Fidelity Series International Credit Fund | 51 | 6 | -- | 1 | -- | (1) | 56 |
| Fidelity Series International Growth Fund | 8,098 | 476 | 345 | -- | 11 | 115 | 8,355 |
| Fidelity Series International Small Cap Fund | 2,021 | 138 | 69 | -- | 5 | (82) | 2,013 |
| Fidelity Series International Value Fund | 8,176 | 615 | 459 | -- | 6 | (19) | 8,319 |
| Fidelity Series Intrinsic Opportunities Fund | 8,600 | 954 | 499 | 415 | (5) | 128 | 9,178 |
| Fidelity Series Investment Grade Bond Fund | 16,810 | 1,027 | 906 | 241 | (22) | (173) | 16,736 |
| Fidelity Series Large Cap Stock Fund | 7,747 | 668 | 636 | 489 | 27 | 349 | 8,155 |
| Fidelity Series Large Cap Value Index Fund | 2,221 | 53 | 147 | -- | 4 | 152 | 2,283 |
| Fidelity Series Long-Term Treasury Bond Index Fund | 2,462 | 4,286 | 176 | 60 | (9) | (204) | 6,359 |
| Fidelity Series Opportunistic Insights Fund | 3,883 | 65 | 337 | -- | 24 | 475 | 4,110 |
| Fidelity Series Real Estate Equity Fund | 666 | 8 | 699 | 7 | (40) | 65 | -- |
| Fidelity Series Real Estate Income Fund | 475 | 20 | -- | 21 | -- | 3 | 498 |
| Fidelity Series Short-Term Credit Fund | 345 | 461 | 276 | 5 | (2) | 2 | 530 |
| Fidelity Series Small Cap Discovery Fund | 1,056 | 96 | 30 | 63 | -- | (15) | 1,107 |
| Fidelity Series Small Cap Opportunities Fund | 3,227 | 374 | 295 | 261 | 17 | 87 | 3,410 |
| Fidelity Series Stock Selector Large Cap Value Fund | 6,050 | 146 | 388 | -- | 2 | 416 | 6,226 |
| Fidelity Series Value Discovery Fund | 4,300 | 107 | 236 | -- | 2 | 248 | 4,421 |
| | $108,591 | $15,571 | $13,426 | $2,148 | $365 | $1,748 | $112,849 |
Amounts in the income column in the above table include any capital gain distributions from underlying funds, which are presented in the corresponding line-item in the Statement of Operations if applicable.
Investment Valuation
All investments are categorized as Level 1 under the Fair Value Hierarchy. The inputs or methodology used for valuing securities may not be an indication of the risk associated with investing in those securities. For more information on valuation inputs please refer to the Investment Valuation section in the accompanying Notes to Financial Statements.
See accompanying notes which are an integral part of the financial statements.
Fidelity Flex℠ Freedom 2030 Fund
Financial Statements
Statement of Assets and Liabilities
| | | September 30, 2018 (Unaudited) |
| Assets | | |
Investment in securities, at value — See accompanying schedule:
| | |
| Affiliated issuers (cost $108,680) | $112,849 | |
| Total Investment in Securities (cost $108,680) | | $112,849 |
| Receivable for investments sold | | 1,899 |
| Total assets | | 114,748 |
| Liabilities | | |
| Payable for investments purchased | $1,898 | |
| Total liabilities | | 1,898 |
| Net Assets | | $112,850 |
| Net Assets consist of: | | |
| Paid in capital | | $106,188 |
| Undistributed net investment income | | 789 |
| Accumulated undistributed net realized gain (loss) on investments | | 1,704 |
| Net unrealized appreciation (depreciation) on investments | | 4,169 |
| Net Assets, for 10,588 shares outstanding | | $112,850 |
| Net Asset Value, offering price and redemption price per share ($112,850 ÷ 10,588 shares) | | $10.66 |
See accompanying notes which are an integral part of the financial statements.
Statement of Operations
| | | Six months ended September 30, 2018 (Unaudited) |
| Investment Income | | |
| Dividends: | | |
| Affiliated issuers | | $797 |
| Expenses | | |
| Independent trustees' fees and expenses | $1 | |
| Total expenses | | 1 |
| Net investment income (loss) | | 796 |
| Realized and Unrealized Gain (Loss) | | |
| Net realized gain (loss) on: | | |
| Investment securities: | | |
| Affiliated issuers | 365 | |
| Capital gain distributions from underlying funds: | | |
| Affiliated issuers | 1,351 | |
| Total net realized gain (loss) | | 1,716 |
| Change in net unrealized appreciation (depreciation) on: | | |
| Investment securities: | | |
| Affiliated issuers | 1,748 | |
| Total change in net unrealized appreciation (depreciation) | | 1,748 |
| Net gain (loss) | | 3,464 |
| Net increase (decrease) in net assets resulting from operations | | $4,260 |
See accompanying notes which are an integral part of the financial statements.
Statement of Changes in Net Assets
| | Six months ended September 30, 2018 (Unaudited) | For the period
June 8, 2017 (commencement of operations) to March 31, 2018 |
| Increase (Decrease) in Net Assets | | |
| Operations | | |
| Net investment income (loss) | $796 | $1,849 |
| Net realized gain (loss) | 1,716 | 4,320 |
| Change in net unrealized appreciation (depreciation) | 1,748 | 2,421 |
| Net increase (decrease) in net assets resulting from operations | 4,260 | 8,590 |
| Distributions to shareholders from net investment income | (206) | (1,650) |
| Distributions to shareholders from net realized gain | (2,842) | (1,490) |
| Total distributions | (3,048) | (3,140) |
| Share transactions | | |
| Proceeds from sales of shares | – | 100,000 |
| Reinvestment of distributions | 3,048 | 3,140 |
| Net increase (decrease) in net assets resulting from share transactions | 3,048 | 103,140 |
| Total increase (decrease) in net assets | 4,260 | 108,590 |
| Net Assets | | |
| Beginning of period | 108,590 | – |
| End of period | $112,850 | $108,590 |
| Other Information | | |
| Undistributed net investment income end of period | $789 | $199 |
| Shares | | |
| Sold | – | 10,000 |
| Issued in reinvestment of distributions | 291 | 297 |
| Net increase (decrease) | 291 | 10,297 |
See accompanying notes which are an integral part of the financial statements.
Financial Highlights
Fidelity Flex Freedom 2030 Fund
| | Six months ended (Unaudited) September 30, | Years endedMarch 31, |
| | 2018 | 2018 A |
| Selected Per–Share Data | | |
| Net asset value, beginning of period | $10.55 | $10.00 |
| Income from Investment Operations | | |
| Net investment income (loss)B | .08 | .18 |
| Net realized and unrealized gain (loss) | .33 | .68 |
| Total from investment operations | .41 | .86 |
| Distributions from net investment income | (.02) | (.17) |
| Distributions from net realized gain | (.28) | (.15) |
| Total distributions | (.30) | (.31)C |
| Net asset value, end of period | $10.66 | $10.55 |
| Total ReturnD | 3.90% | 8.63% |
| Ratios to Average Net AssetsE,F | | |
| Expenses before reductions | - %G,H | - %G |
| Expenses net of fee waivers, if any | - %G,H | - %G |
| Expenses net of all reductions | - %G,H | - %G |
| Net investment income (loss) | 1.44%G | 2.15%G |
| Supplemental Data | | |
| Net assets, end of period (000 omitted) | $113 | $109 |
| Portfolio turnover rateE | 24%G | 15%G |
A For the period June 8, 2017 (commencement of operations) to March 31, 2018.
B Calculated based on average shares outstanding during the period.
C Total distributions of $.31 per share is comprised of distributions from net investment income of $.165 and distributions from net realized gain of $.149 per share.
D Total returns for periods of less than one year are not annualized.
E Amounts do not include the activity of the Underlying Funds.
F Expense ratios reflect operating expenses of the Fund. Expenses before reductions do not reflect amounts reimbursed by the investment adviser or reductions from expense offset arrangements and do not represent the amount paid by the Fund during periods when reimbursements or reductions occur. Expenses net of fee waivers reflect expenses after reimbursement by the investment adviser but prior to reductions from expense offset arrangements. Expenses net of all reductions represent the net expenses paid by the Fund but do not include expenses of the underlying funds in which the Fund invests.
G Annualized
H Amount represents less than .005%.
See accompanying notes which are an integral part of the financial statements.
Fidelity Flex℠ Freedom 2035 Fund
Investment Summary (Unaudited)
The information in the following tables is based on the direct investments of the Fund.
Top Holdings as of September 30, 2018
| | % of fund's net assets |
| Fidelity Series Intrinsic Opportunities Fund | 9.8 |
| Fidelity Series Large Cap Stock Fund | 8.7 |
| Fidelity Series International Growth Fund | 8.7 |
| Fidelity Series International Value Fund | 8.7 |
| Fidelity Series Emerging Markets Opportunities Fund | 8.2 |
| Fidelity Series Growth Company Fund | 8.2 |
| Fidelity Series Stock Selector Large Cap Value Fund | 6.7 |
| Fidelity Series Long-Term Treasury Bond Index Fund | 5.6 |
| Fidelity Series Value Discovery Fund | 4.7 |
| Fidelity Series Opportunistic Insights Fund | 4.4 |
| | 73.7 |
Asset Allocation (% of fund's net assets)
| Period end |
| | Domestic Equity Funds | 58.0% |
| | International Equity Funds | 29.5% |
| | Bond Funds | 10.2% |
| | Short-Term Funds | 2.3% |

Domestic Equity Funds category includes Fidelity Series Commodity Strategy Fund which invests in commodity-related investments.
Fidelity Flex℠ Freedom 2035 Fund
Schedule of Investments September 30, 2018 (Unaudited)
Showing Percentage of Net Assets
| Domestic Equity Funds - 58.0% | | | |
| | | Shares | Value |
| Fidelity Series All-Sector Equity Fund (a) | | 189 | $2,574 |
| Fidelity Series Blue Chip Growth Fund (a) | | 303 | 4,634 |
| Fidelity Series Commodity Strategy Fund (a) | | 457 | 2,286 |
| Fidelity Series Growth Company Fund (a) | | 465 | 9,401 |
| Fidelity Series Intrinsic Opportunities Fund (a) | | 614 | 11,262 |
| Fidelity Series Large Cap Stock Fund (a) | | 628 | 10,008 |
| Fidelity Series Large Cap Value Index Fund (a) | | 212 | 2,802 |
| Fidelity Series Opportunistic Insights Fund (a) | | 254 | 5,044 |
| Fidelity Series Small Cap Discovery Fund (a) | | 112 | 1,358 |
| Fidelity Series Small Cap Opportunities Fund (a) | | 285 | 4,184 |
| Fidelity Series Stock Selector Large Cap Value Fund (a) | | 578 | 7,640 |
| Fidelity Series Value Discovery Fund (a) | | 396 | 5,425 |
| TOTAL DOMESTIC EQUITY FUNDS | | | |
| (Cost $61,504) | | | 66,618 |
|
| International Equity Funds - 29.5% | | | |
| Fidelity Series Canada Fund (a) | | 94 | 1,013 |
| Fidelity Series Emerging Markets Fund (a) | | 109 | 1,052 |
| Fidelity Series Emerging Markets Opportunities Fund (a) | | 492 | 9,449 |
| Fidelity Series International Growth Fund (a) | | 610 | 10,007 |
| Fidelity Series International Small Cap Fund (a) | | 135 | 2,411 |
| Fidelity Series International Value Fund (a) | | 947 | 9,964 |
| TOTAL INTERNATIONAL EQUITY FUNDS | | | |
| (Cost $32,874) | | | 33,896 |
|
| Bond Funds - 10.2% | | | |
| Fidelity Series Emerging Markets Debt Fund (a) | | 72 | 691 |
| Fidelity Series Floating Rate High Income Fund (a) | | 27 | 254 |
| Fidelity Series High Income Fund (a) | | 160 | 1,541 |
| Fidelity Series Inflation-Protected Bond Index Fund (a) | | 36 | 345 |
| Fidelity Series International Credit Fund (a) | | 5 | 46 |
| Fidelity Series Investment Grade Bond Fund (a) | | 170 | 1,846 |
| Fidelity Series Long-Term Treasury Bond Index Fund (a) | | 786 | 6,477 |
| Fidelity Series Real Estate Income Fund (a) | | 46 | 495 |
| TOTAL BOND FUNDS | | | |
| (Cost $12,108) | | | 11,695 |
|
| Short-Term Funds - 2.3% | | | |
| Fidelity Series Government Money Market Fund 2.12% (a)(b) | | 2,147 | 2,147 |
| Fidelity Series Short-Term Credit Fund (a) | | 54 | 536 |
| TOTAL SHORT-TERM FUNDS | | | |
| (Cost $2,687) | | | 2,683 |
| TOTAL INVESTMENT IN SECURITIES - 100.0% | | | |
| (Cost $109,173) | | | 114,892 |
| NET OTHER ASSETS (LIABILITIES) - 0.0% | | | 1 |
| NET ASSETS - 100% | | | $114,893 |
Legend
(a) Affiliated Fund
(b) The rate quoted is the annualized seven-day yield of the fund at period end.
Affiliated Underlying Funds
Fiscal year to date information regarding the Fund's investments in affiliated Underlying Funds, excluding any Money Market Central Funds, is presented below. Exchanges between classes of the same affiliated Underlying Funds may occur.
| Affiliate | Value, beginning of period | Purchases | Sales Proceeds | Dividend Income | Realized Gain (loss) | Change in Unrealized appreciation (depreciation) | Value, end of period |
| Fidelity Series 100 Index Fund | $2,123 | $-- | $2,195 | $-- | $218 | $(146) | $-- |
| Fidelity Series All-Sector Equity Fund | 4,071 | 21 | 1,976 | -- | 87 | 371 | 2,574 |
| Fidelity Series Blue Chip Growth Fund | 4,208 | 517 | 399 | 439 | 29 | 279 | 4,634 |
| Fidelity Series Canada Fund | 938 | 105 | 87 | -- | -- | 57 | 1,013 |
| Fidelity Series Commodity Strategy Fund | 2,284 | 348 | 163 | 137 | (4) | (179) | 2,286 |
| Fidelity Series Emerging Markets Debt Fund | 710 | 64 | 45 | 21 | (2) | (36) | 691 |
| Fidelity Series Emerging Markets Fund | -- | 1,052 | -- | -- | -- | -- | 1,052 |
| Fidelity Series Emerging Markets Opportunities Fund | 9,789 | 2,331 | 1,455 | -- | (17) | (1,199) | 9,449 |
| Fidelity Series Floating Rate High Income Fund | 239 | 15 | -- | 7 | -- | -- | 254 |
| Fidelity Series Government Money Market Fund 2.12% | 1,785 | 1,289 | 927 | 17 | -- | -- | 2,147 |
| Fidelity Series Growth Company Fund | 8,679 | 272 | 826 | -- | 78 | 1,198 | 9,401 |
| Fidelity Series High Income Fund | 1,509 | 45 | 25 | 44 | (1) | 13 | 1,541 |
| Fidelity Series Inflation-Protected Bond Index Fund | 881 | 36 | 577 | 1 | (7) | 12 | 345 |
| Fidelity Series International Credit Fund | 52 | -- | 6 | 1 | -- | -- | 46 |
| Fidelity Series International Growth Fund | 9,425 | 803 | 370 | -- | 3 | 146 | 10,007 |
| Fidelity Series International Small Cap Fund | 2,352 | 204 | 55 | -- | 4 | (94) | 2,411 |
| Fidelity Series International Value Fund | 9,564 | 862 | 451 | -- | 2 | (13) | 9,964 |
| Fidelity Series Intrinsic Opportunities Fund | 10,294 | 1,186 | 358 | 507 | (7) | 147 | 11,262 |
| Fidelity Series Investment Grade Bond Fund | 3,132 | 686 | 1,941 | 43 | (56) | 25 | 1,846 |
| Fidelity Series Large Cap Stock Fund | 9,204 | 933 | 576 | 590 | 18 | 429 | 10,008 |
| Fidelity Series Large Cap Value Index Fund | 2,636 | 86 | 105 | -- | 1 | 184 | 2,802 |
| Fidelity Series Long-Term Treasury Bond Index Fund | 2,455 | 4,424 | 181 | 62 | (9) | (212) | 6,477 |
| Fidelity Series Opportunistic Insights Fund | 4,611 | 112 | 278 | -- | 15 | 584 | 5,044 |
| Fidelity Series Real Estate Equity Fund | 786 | 65 | 885 | 9 | (42) | 76 | -- |
| Fidelity Series Real Estate Income Fund | 465 | 27 | -- | 21 | -- | 3 | 495 |
| Fidelity Series Short-Term Credit Fund | 349 | 334 | 147 | 5 | (1) | 1 | 536 |
| Fidelity Series Small Cap Discovery Fund | 1,238 | 156 | 18 | 74 | -- | (18) | 1,358 |
| Fidelity Series Small Cap Opportunities Fund | 3,810 | 489 | 230 | 318 | 13 | 102 | 4,184 |
| Fidelity Series Stock Selector Large Cap Value Fund | 7,097 | 321 | 274 | -- | (1) | 497 | 7,640 |
| Fidelity Series Value Discovery Fund | 5,065 | 167 | 105 | -- | -- | 298 | 5,425 |
| | $109,751 | $16,950 | $14,655 | $2,296 | $321 | $2,525 | $114,892 |
Amounts in the income column in the above table include any capital gain distributions from underlying funds, which are presented in the corresponding line-item in the Statement of Operations if applicable.
Investment Valuation
All investments are categorized as Level 1 under the Fair Value Hierarchy. The inputs or methodology used for valuing securities may not be an indication of the risk associated with investing in those securities. For more information on valuation inputs please refer to the Investment Valuation section in the accompanying Notes to Financial Statements.
See accompanying notes which are an integral part of the financial statements.
Fidelity Flex℠ Freedom 2035 Fund
Financial Statements
Statement of Assets and Liabilities
| | | September 30, 2018 (Unaudited) |
| Assets | | |
Investment in securities, at value — See accompanying schedule:
| | |
| Affiliated issuers (cost $109,173) | $114,892 | |
| Total Investment in Securities (cost $109,173) | | $114,892 |
| Receivable for investments sold | | 2,106 |
| Total assets | | 116,998 |
| Liabilities | | |
| Payable for investments purchased | $2,105 | |
| Total liabilities | | 2,105 |
| Net Assets | | $114,893 |
| Net Assets consist of: | | |
| Paid in capital | | $106,578 |
| Undistributed net investment income | | 653 |
| Accumulated undistributed net realized gain (loss) on investments | | 1,943 |
| Net unrealized appreciation (depreciation) on investments | | 5,719 |
| Net Assets, for 10,618 shares outstanding | | $114,893 |
| Net Asset Value, offering price and redemption price per share ($114,893 ÷ 10,618 shares) | | $10.82 |
See accompanying notes which are an integral part of the financial statements.
Statement of Operations
| | | Six months ended September 30, 2018 (Unaudited) |
| Investment Income | | |
| Dividends: | | |
| Affiliated issuers | | $654 |
| Expenses | | |
| Independent trustees' fees and expenses | $1 | |
| Total expenses | | 1 |
| Net investment income (loss) | | 653 |
| Realized and Unrealized Gain (Loss) | | |
| Net realized gain (loss) on: | | |
| Investment securities: | | |
| Affiliated issuers | 321 | |
| Capital gain distributions from underlying funds: | | |
| Affiliated issuers | 1,642 | |
| Total net realized gain (loss) | | 1,963 |
| Change in net unrealized appreciation (depreciation) on: | | |
| Investment securities: | | |
| Affiliated issuers | 2,525 | |
| Total change in net unrealized appreciation (depreciation) | | 2,525 |
| Net gain (loss) | | 4,488 |
| Net increase (decrease) in net assets resulting from operations | | $5,141 |
See accompanying notes which are an integral part of the financial statements.
Statement of Changes in Net Assets
| | Six months ended September 30, 2018 (Unaudited) | For the period
June 8, 2017 (commencement of operations) to March 31, 2018 |
| Increase (Decrease) in Net Assets | | |
| Operations | | |
| Net investment income (loss) | $653 | $1,753 |
| Net realized gain (loss) | 1,963 | 4,805 |
| Change in net unrealized appreciation (depreciation) | 2,525 | 3,194 |
| Net increase (decrease) in net assets resulting from operations | 5,141 | 9,752 |
| Distributions to shareholders from net investment income | (113) | (1,640) |
| Distributions to shareholders from net realized gain | (3,185) | (1,640) |
| Total distributions | (3,298) | (3,280) |
| Share transactions | | |
| Proceeds from sales of shares | – | 100,000 |
| Reinvestment of distributions | 3,298 | 3,280 |
| Net increase (decrease) in net assets resulting from share transactions | 3,298 | 103,280 |
| Total increase (decrease) in net assets | 5,141 | 109,752 |
| Net Assets | | |
| Beginning of period | 109,752 | – |
| End of period | $114,893 | $109,752 |
| Other Information | | |
| Undistributed net investment income end of period | $653 | $113 |
| Shares | | |
| Sold | – | 10,000 |
| Issued in reinvestment of distributions | 311 | 307 |
| Net increase (decrease) | 311 | 10,307 |
See accompanying notes which are an integral part of the financial statements.
Financial Highlights
Fidelity Flex Freedom 2035 Fund
| | Six months ended (Unaudited) September 30, | Years endedMarch 31, |
| | 2018 | 2018 A |
| Selected Per–Share Data | | |
| Net asset value, beginning of period | $10.65 | $10.00 |
| Income from Investment Operations | | |
| Net investment income (loss)B | .06 | .17 |
| Net realized and unrealized gain (loss) | .43 | .81 |
| Total from investment operations | .49 | .98 |
| Distributions from net investment income | (.01) | (.16) |
| Distributions from net realized gain | (.31) | (.16) |
| Total distributions | (.32) | (.33)C |
| Net asset value, end of period | $10.82 | $10.65 |
| Total ReturnD | 4.66% | 9.77% |
| Ratios to Average Net AssetsE,F | | |
| Expenses before reductions | - %G,H | - %G |
| Expenses net of fee waivers, if any | - %G,H | - %G |
| Expenses net of all reductions | - %G,H | - %G |
| Net investment income (loss) | 1.16%G | 2.02%G |
| Supplemental Data | | |
| Net assets, end of period (000 omitted) | $115 | $110 |
| Portfolio turnover rateE | 26%G | 14%G |
A For the period June 8, 2017 (commencement of operations) to March 31, 2018.
B Calculated based on average shares outstanding during the period.
C Total distributions of $.33 per share is comprised of distributions from net investment income of $.164 and distributions from net realized gain of $.164 per share.
D Total returns for periods of less than one year are not annualized.
E Amounts do not include the activity of the Underlying Funds.
F Expense ratios reflect operating expenses of the Fund. Expenses before reductions do not reflect amounts reimbursed by the investment adviser or reductions from expense offset arrangements and do not represent the amount paid by the Fund during periods when reimbursements or reductions occur. Expenses net of fee waivers reflect expenses after reimbursement by the investment adviser but prior to reductions from expense offset arrangements. Expenses net of all reductions represent the net expenses paid by the Fund but do not include expenses of the underlying funds in which the Fund invests.
G Annualized
H Amount represents less than .005%.
See accompanying notes which are an integral part of the financial statements.
Fidelity Flex℠ Freedom 2040 Fund
Investment Summary (Unaudited)
The information in the following tables is based on the direct investments of the Fund.
Top Holdings as of September 30, 2018
| | % of fund's net assets |
| Fidelity Series Intrinsic Opportunities Fund | 10.3 |
| Fidelity Series Large Cap Stock Fund | 9.2 |
| Fidelity Series International Growth Fund | 9.1 |
| Fidelity Series International Value Fund | 9.1 |
| Fidelity Series Growth Company Fund | 8.6 |
| Fidelity Series Emerging Markets Opportunities Fund | 8.5 |
| Fidelity Series Stock Selector Large Cap Value Fund | 7.0 |
| Fidelity Series Value Discovery Fund | 5.0 |
| Fidelity Series Opportunistic Insights Fund | 4.6 |
| Fidelity Series Blue Chip Growth Fund | 4.2 |
| | 75.6 |
Asset Allocation (% of fund's net assets)
| Period end |
| | Domestic Equity Funds | 61.0% |
| | International Equity Funds | 30.8% |
| | Bond Funds | 6.8% |
| | Short-Term Funds | 1.4% |

Domestic Equity Funds category includes Fidelity Series Commodity Strategy Fund which invests in commodity-related investments.
Fidelity Flex℠ Freedom 2040 Fund
Schedule of Investments September 30, 2018 (Unaudited)
Showing Percentage of Net Assets
| Domestic Equity Funds - 61.0% | | | |
| | | Shares | Value |
| Fidelity Series All-Sector Equity Fund (a) | | 200 | $2,719 |
| Fidelity Series Blue Chip Growth Fund (a) | | 320 | 4,894 |
| Fidelity Series Commodity Strategy Fund (a) | | 486 | 2,432 |
| Fidelity Series Growth Company Fund (a) | | 491 | 9,928 |
| Fidelity Series Intrinsic Opportunities Fund (a) | | 649 | 11,893 |
| Fidelity Series Large Cap Stock Fund (a) | | 663 | 10,569 |
| Fidelity Series Large Cap Value Index Fund (a) | | 224 | 2,959 |
| Fidelity Series Opportunistic Insights Fund (a) | | 268 | 5,327 |
| Fidelity Series Small Cap Discovery Fund (a) | | 118 | 1,434 |
| Fidelity Series Small Cap Opportunities Fund (a) | | 301 | 4,418 |
| Fidelity Series Stock Selector Large Cap Value Fund (a) | | 610 | 8,068 |
| Fidelity Series Value Discovery Fund (a) | | 419 | 5,729 |
| TOTAL DOMESTIC EQUITY FUNDS | | | |
| (Cost $65,068) | | | 70,370 |
|
| International Equity Funds - 30.8% | | | |
| Fidelity Series Canada Fund (a) | | 98 | 1,063 |
| Fidelity Series Emerging Markets Fund (a) | | 113 | 1,091 |
| Fidelity Series Emerging Markets Opportunities Fund (a) | | 511 | 9,805 |
| Fidelity Series International Growth Fund (a) | | 640 | 10,504 |
| Fidelity Series International Small Cap Fund (a) | | 141 | 2,530 |
| Fidelity Series International Value Fund (a) | | 994 | 10,459 |
| TOTAL INTERNATIONAL EQUITY FUNDS | | | |
| (Cost $34,397) | | | 35,452 |
|
| Bond Funds - 6.8% | | | |
| Fidelity Series Emerging Markets Debt Fund (a) | | 73 | 693 |
| Fidelity Series Floating Rate High Income Fund (a) | | 26 | 243 |
| Fidelity Series High Income Fund (a) | | 157 | 1,511 |
| Fidelity Series Inflation-Protected Bond Index Fund (a) | | 36 | 347 |
| Fidelity Series International Credit Fund (a) | | 5 | 46 |
| Fidelity Series Investment Grade Bond Fund (a) | | 47 | 509 |
| Fidelity Series Long-Term Treasury Bond Index Fund (a) | | 485 | 3,996 |
| Fidelity Series Real Estate Income Fund (a) | | 47 | 504 |
| TOTAL BOND FUNDS | | | |
| (Cost $8,133) | | | 7,849 |
|
| Short-Term Funds - 1.4% | | | |
| Fidelity Series Government Money Market Fund 2.12% (a)(b) | | 1,303 | 1,303 |
| Fidelity Series Short-Term Credit Fund (a) | | 33 | 325 |
| TOTAL SHORT-TERM FUNDS | | | |
| (Cost $1,628) | | | 1,628 |
| TOTAL INVESTMENT IN SECURITIES - 100.0% | | | |
| (Cost $109,226) | | | 115,299 |
| NET OTHER ASSETS (LIABILITIES) - 0.0% | | | 0 |
| NET ASSETS - 100% | | | $115,299 |
Legend
(a) Affiliated Fund
(b) The rate quoted is the annualized seven-day yield of the fund at period end.
Affiliated Underlying Funds
Fiscal year to date information regarding the Fund's investments in affiliated Underlying Funds, excluding any Money Market Central Funds, is presented below. Exchanges between classes of the same affiliated Underlying Funds may occur.
| Affiliate | Value, beginning of period | Purchases | Sales Proceeds | Dividend Income | Realized Gain (loss) | Change in Unrealized appreciation (depreciation) | Value, end of period |
| Fidelity Series 100 Index Fund | $2,185 | $-- | $2,280 | $-- | $246 | $(151) | $-- |
| Fidelity Series All-Sector Equity Fund | 4,191 | 82 | 2,029 | -- | 90 | 385 | 2,719 |
| Fidelity Series Blue Chip Growth Fund | 4,332 | 617 | 374 | 457 | 24 | 295 | 4,894 |
| Fidelity Series Canada Fund | 964 | 137 | 97 | -- | (1) | 60 | 1,063 |
| Fidelity Series Commodity Strategy Fund | 2,285 | 511 | 168 | 146 | (8) | (188) | 2,432 |
| Fidelity Series Emerging Markets Debt Fund | 710 | 22 | -- | 21 | -- | (39) | 693 |
| Fidelity Series Emerging Markets Fund | -- | 1,091 | -- | -- | -- | -- | 1,091 |
| Fidelity Series Emerging Markets Opportunities Fund | 9,958 | 2,635 | 1,534 | -- | (36) | (1,218) | 9,805 |
| Fidelity Series Floating Rate High Income Fund | 239 | 7 | 3 | 7 | -- | -- | 243 |
| Fidelity Series Government Money Market Fund 2.12% | 1,770 | 1,840 | 2,307 | 14 | -- | -- | 1,303 |
| Fidelity Series Growth Company Fund | 8,882 | 328 | 618 | -- | 57 | 1,279 | 9,928 |
| Fidelity Series High Income Fund | 1,530 | 44 | 76 | 45 | (1) | 14 | 1,511 |
| Fidelity Series Inflation-Protected Bond Index Fund | 906 | 70 | 633 | 1 | (9) | 13 | 347 |
| Fidelity Series International Credit Fund | 34 | 12 | -- | -- | -- | -- | 46 |
| Fidelity Series International Growth Fund | 9,706 | 1,024 | 380 | -- | 1 | 153 | 10,504 |
| Fidelity Series International Small Cap Fund | 2,422 | 262 | 61 | -- | 4 | (97) | 2,530 |
| Fidelity Series International Value Fund | 9,825 | 1,063 | 419 | -- | (2) | (8) | 10,459 |
| Fidelity Series Intrinsic Opportunities Fund | 10,607 | 1,463 | 318 | 527 | (3) | 144 | 11,893 |
| Fidelity Series Investment Grade Bond Fund | 523 | 32 | 40 | 7 | (1) | (5) | 509 |
| Fidelity Series Large Cap Stock Fund | 9,473 | 1,137 | 494 | 618 | 3 | 450 | 10,569 |
| Fidelity Series Large Cap Value Index Fund | 2,707 | 170 | 109 | -- | -- | 191 | 2,959 |
| Fidelity Series Long-Term Treasury Bond Index Fund | 2,486 | 2,571 | 922 | 50 | (36) | (103) | 3,996 |
| Fidelity Series Opportunistic Insights Fund | 4,882 | 193 | 372 | -- | 7 | 617 | 5,327 |
| Fidelity Series Real Estate Equity Fund | 801 | 83 | 920 | 13 | (42) | 78 | -- |
| Fidelity Series Real Estate Income Fund | 465 | 37 | -- | 21 | -- | 2 | 504 |
| Fidelity Series Short-Term Credit Fund | 349 | 511 | 535 | 4 | (4) | 4 | 325 |
| Fidelity Series Small Cap Discovery Fund | 1,292 | 204 | 43 | 77 | (1) | (18) | 1,434 |
| Fidelity Series Small Cap Opportunities Fund | 3,899 | 628 | 225 | 331 | 8 | 108 | 4,418 |
| Fidelity Series Stock Selector Large Cap Value Fund | 7,276 | 551 | 269 | -- | (1) | 511 | 8,068 |
| Fidelity Series Value Discovery Fund | 5,185 | 403 | 165 | -- | (1) | 307 | 5,729 |
| | $109,884 | $17,728 | $15,391 | $2,339 | $294 | $2,784 | $115,299 |
Amounts in the income column in the above table include any capital gain distributions from underlying funds, which are presented in the corresponding line-item in the Statement of Operations if applicable.
Investment Valuation
All investments are categorized as Level 1 under the Fair Value Hierarchy. The inputs or methodology used for valuing securities may not be an indication of the risk associated with investing in those securities. For more information on valuation inputs please refer to the Investment Valuation section in the accompanying Notes to Financial Statements.
See accompanying notes which are an integral part of the financial statements.
Fidelity Flex℠ Freedom 2040 Fund
Financial Statements
Statement of Assets and Liabilities
| | | September 30, 2018 (Unaudited) |
| Assets | | |
Investment in securities, at value — See accompanying schedule:
| | |
| Affiliated issuers (cost $109,226) | $115,299 | |
| Total Investment in Securities (cost $109,226) | | $115,299 |
| Receivable for investments sold | | 1,816 |
| Total assets | | 117,115 |
| Liabilities | | |
| Payable for investments purchased | $1,816 | |
| Total liabilities | | 1,816 |
| Net Assets | | $115,299 |
| Net Assets consist of: | | |
| Paid in capital | | $106,619 |
| Undistributed net investment income | | 625 |
| Accumulated undistributed net realized gain (loss) on investments | | 1,982 |
| Net unrealized appreciation (depreciation) on investments | | 6,073 |
| Net Assets, for 10,621.3 shares outstanding | | $115,299 |
| Net Asset Value, offering price and redemption price per share ($115,299 ÷ 10,621.3 shares) | | $10.86 |
See accompanying notes which are an integral part of the financial statements.
Statement of Operations
| | | Six months ended September 30, 2018 (Unaudited) |
| Investment Income | | |
| Dividends: | | |
| Affiliated issuers | | $627 |
| Expenses | | |
| Independent trustees' fees and expenses | $1 | |
| Total expenses | | 1 |
| Net investment income (loss) | | 626 |
| Realized and Unrealized Gain (Loss) | | |
| Net realized gain (loss) on: | | |
| Investment securities: | | |
| Affiliated issuers | 294 | |
| Capital gain distributions from underlying funds: | | |
| Affiliated issuers | 1,712 | |
| Total net realized gain (loss) | | 2,006 |
| Change in net unrealized appreciation (depreciation) on: | | |
| Investment securities: | | |
| Affiliated issuers | 2,784 | |
| Total change in net unrealized appreciation (depreciation) | | 2,784 |
| Net gain (loss) | | 4,790 |
| Net increase (decrease) in net assets resulting from operations | | $5,416 |
See accompanying notes which are an integral part of the financial statements.
Statement of Changes in Net Assets
| | Six months ended September 30, 2018 (Unaudited) | For the period
June 8, 2017 (commencement of operations) to March 31, 2018 |
| Increase (Decrease) in Net Assets | | |
| Operations | | |
| Net investment income (loss) | $626 | $1,742 |
| Net realized gain (loss) | 2,006 | 4,853 |
| Change in net unrealized appreciation (depreciation) | 2,784 | 3,289 |
| Net increase (decrease) in net assets resulting from operations | 5,416 | 9,884 |
| Distributions to shareholders from net investment income | (93) | (1,650) |
| Distributions to shareholders from net realized gain | (3,227) | (1,650) |
| Total distributions | (3,320) | (3,300) |
| Share transactions | | |
| Proceeds from sales of shares | – | 100,000 |
| Reinvestment of distributions | 3,319 | 3,300 |
| Net increase (decrease) in net assets resulting from share transactions | 3,319 | 103,300 |
| Total increase (decrease) in net assets | 5,415 | 109,884 |
| Net Assets | | |
| Beginning of period | 109,884 | – |
| End of period | $115,299 | $109,884 |
| Other Information | | |
| Undistributed net investment income end of period | $625 | $92 |
| Shares | | |
| Sold | – | 10,000 |
| Issued in reinvestment of distributions | 313 | 309 |
| Net increase (decrease) | 313 | 10,309 |
See accompanying notes which are an integral part of the financial statements.
Financial Highlights
Fidelity Flex Freedom 2040 Fund
| | Six months ended (Unaudited) September 30, | Years endedMarch 31, |
| | 2018 | 2018 A |
| Selected Per–Share Data | | |
| Net asset value, beginning of period | $10.66 | $10.00 |
| Income from Investment Operations | | |
| Net investment income (loss)B | .06 | .17 |
| Net realized and unrealized gain (loss) | .46 | .82 |
| Total from investment operations | .52 | .99 |
| Distributions from net investment income | (.01) | (.17) |
| Distributions from net realized gain | (.31) | (.17) |
| Total distributions | (.32) | (.33)C |
| Net asset value, end of period | $10.86 | $10.66 |
| Total ReturnD | 4.97% | 9.89% |
| Ratios to Average Net AssetsE,F | | |
| Expenses before reductions | - %G,H | - %G |
| Expenses net of fee waivers, if any | - %G,H | - %G |
| Expenses net of all reductions | - %G,H | - %G |
| Net investment income (loss) | 1.11%G | 2.01%G |
| Supplemental Data | | |
| Net assets, end of period (000 omitted) | $115 | $110 |
| Portfolio turnover rateE | 27%G | 13%G |
A For the period June 8, 2017 (commencement of operations) to March 31, 2018.
B Calculated based on average shares outstanding during the period.
C otal distributions of $.33 per share is comprised of distributions from net investment income of $.165 and distributions from net realized gain of $.165 per share.
D Total returns for periods of less than one year are not annualized.
E Amounts do not include the activity of the Underlying Funds.
F Expense ratios reflect operating expenses of the Fund. Expenses before reductions do not reflect amounts reimbursed by the investment adviser or reductions from expense offset arrangements and do not represent the amount paid by the Fund during periods when reimbursements or reductions occur. Expenses net of fee waivers reflect expenses after reimbursement by the investment adviser but prior to reductions from expense offset arrangements. Expenses net of all reductions represent the net expenses paid by the Fund but do not include expenses of the underlying funds in which the Fund invests.
G Annualized
H Amount represents less than .005%.
See accompanying notes which are an integral part of the financial statements.
Fidelity Flex℠ Freedom 2045 Fund
Investment Summary (Unaudited)
The information in the following tables is based on the direct investments of the Fund.
Top Holdings as of September 30, 2018
| | % of fund's net assets |
| Fidelity Series Intrinsic Opportunities Fund | 10.3 |
| Fidelity Series Large Cap Stock Fund | 9.2 |
| Fidelity Series International Growth Fund | 9.1 |
| Fidelity Series International Value Fund | 9.1 |
| Fidelity Series Growth Company Fund | 8.6 |
| Fidelity Series Emerging Markets Opportunities Fund | 8.5 |
| Fidelity Series Stock Selector Large Cap Value Fund | 7.0 |
| Fidelity Series Value Discovery Fund | 5.0 |
| Fidelity Series Opportunistic Insights Fund | 4.6 |
| Fidelity Series Blue Chip Growth Fund | 4.2 |
| | 75.6 |
Asset Allocation (% of fund's net assets)
| Period end |
| | Domestic Equity Funds | 61.0% |
| | International Equity Funds | 30.8% |
| | Bond Funds | 6.8% |
| | Short-Term Funds | 1.4% |

Domestic Equity Funds category includes Fidelity Series Commodity Strategy Fund which invests in commodity-related investments.
Fidelity Flex℠ Freedom 2045 Fund
Schedule of Investments September 30, 2018 (Unaudited)
Showing Percentage of Net Assets
| Domestic Equity Funds - 61.0% | | | |
| | | Shares | Value |
| Fidelity Series All-Sector Equity Fund (a) | | 200 | $2,719 |
| Fidelity Series Blue Chip Growth Fund (a) | | 320 | 4,894 |
| Fidelity Series Commodity Strategy Fund (a) | | 486 | 2,432 |
| Fidelity Series Growth Company Fund (a) | | 491 | 9,928 |
| Fidelity Series Intrinsic Opportunities Fund (a) | | 649 | 11,896 |
| Fidelity Series Large Cap Stock Fund (a) | | 663 | 10,568 |
| Fidelity Series Large Cap Value Index Fund (a) | | 224 | 2,959 |
| Fidelity Series Opportunistic Insights Fund (a) | | 268 | 5,327 |
| Fidelity Series Small Cap Discovery Fund (a) | | 118 | 1,434 |
| Fidelity Series Small Cap Opportunities Fund (a) | | 301 | 4,418 |
| Fidelity Series Stock Selector Large Cap Value Fund (a) | | 610 | 8,068 |
| Fidelity Series Value Discovery Fund (a) | | 419 | 5,729 |
| TOTAL DOMESTIC EQUITY FUNDS | | | |
| (Cost $65,056) | | | 70,372 |
|
| International Equity Funds - 30.8% | | | |
| Fidelity Series Canada Fund (a) | | 98 | 1,062 |
| Fidelity Series Emerging Markets Fund (a) | | 113 | 1,091 |
| Fidelity Series Emerging Markets Opportunities Fund (a) | | 511 | 9,807 |
| Fidelity Series International Growth Fund (a) | | 641 | 10,505 |
| Fidelity Series International Small Cap Fund (a) | | 141 | 2,530 |
| Fidelity Series International Value Fund (a) | | 994 | 10,460 |
| TOTAL INTERNATIONAL EQUITY FUNDS | | | |
| (Cost $34,401) | | | 35,455 |
|
| Bond Funds - 6.8% | | | |
| Fidelity Series Emerging Markets Debt Fund (a) | | 71 | 681 |
| Fidelity Series Floating Rate High Income Fund (a) | | 27 | 255 |
| Fidelity Series High Income Fund (a) | | 157 | 1,511 |
| Fidelity Series Inflation-Protected Bond Index Fund (a) | | 36 | 347 |
| Fidelity Series International Credit Fund (a) | | 5 | 46 |
| Fidelity Series Investment Grade Bond Fund (a) | | 47 | 509 |
| Fidelity Series Long-Term Treasury Bond Index Fund (a) | | 485 | 3,997 |
| Fidelity Series Real Estate Income Fund (a) | | 46 | 496 |
| TOTAL BOND FUNDS | | | |
| (Cost $8,127) | | | 7,842 |
|
| Short-Term Funds - 1.4% | | | |
| Fidelity Series Government Money Market Fund 2.12% (a)(b) | | 1,321 | 1,321 |
| Fidelity Series Short-Term Credit Fund (a) | | 33 | 328 |
| TOTAL SHORT-TERM FUNDS | | | |
| (Cost $1,649) | | | 1,649 |
| TOTAL INVESTMENT IN SECURITIES - 100.0% | | | |
| (Cost $109,233) | | | 115,318 |
| NET OTHER ASSETS (LIABILITIES) - 0.0% | | | 1 |
| NET ASSETS - 100% | | | $115,319 |
Legend
(a) Affiliated Fund
(b) The rate quoted is the annualized seven-day yield of the fund at period end.
Affiliated Underlying Funds
Fiscal year to date information regarding the Fund's investments in affiliated Underlying Funds, excluding any Money Market Central Funds, is presented below. Exchanges between classes of the same affiliated Underlying Funds may occur.
| Affiliate | Value, beginning of period | Purchases | Sales Proceeds | Dividend Income | Realized Gain (loss) | Change in Unrealized appreciation (depreciation) | Value, end of period |
| Fidelity Series 100 Index Fund | $2,185 | $-- | $2,281 | $-- | $247 | $(151) | $-- |
| Fidelity Series All-Sector Equity Fund | 4,192 | 81 | 2,029 | -- | 90 | 385 | 2,719 |
| Fidelity Series Blue Chip Growth Fund | 4,333 | 613 | 370 | 457 | 23 | 295 | 4,894 |
| Fidelity Series Canada Fund | 964 | 135 | 96 | -- | -- | 59 | 1,062 |
| Fidelity Series Commodity Strategy Fund | 2,288 | 508 | 168 | 146 | (8) | (188) | 2,432 |
| Fidelity Series Emerging Markets Debt Fund | 700 | 20 | 1 | 20 | -- | (38) | 681 |
| Fidelity Series Emerging Markets Fund | -- | 1,091 | -- | -- | -- | -- | 1,091 |
| Fidelity Series Emerging Markets Opportunities Fund | 9,968 | 2,627 | 1,534 | -- | (34) | (1,220) | 9,807 |
| Fidelity Series Floating Rate High Income Fund | 250 | 7 | 2 | 7 | -- | -- | 255 |
| Fidelity Series Government Money Market Fund 2.12% | 1,767 | 1,900 | 2,346 | 14 | -- | -- | 1,321 |
| Fidelity Series Growth Company Fund | 9,195 | 324 | 927 | -- | 75 | 1,261 | 9,928 |
| Fidelity Series High Income Fund | 1,519 | 44 | 66 | 44 | (1) | 15 | 1,511 |
| Fidelity Series Inflation-Protected Bond Index Fund | 907 | 67 | 630 | 1 | (10) | 13 | 347 |
| Fidelity Series International Credit Fund | 34 | 12 | -- | -- | -- | -- | 46 |
| Fidelity Series International Growth Fund | 9,708 | 1,032 | 389 | -- | 2 | 152 | 10,505 |
| Fidelity Series International Small Cap Fund | 2,422 | 267 | 66 | -- | 4 | (97) | 2,530 |
| Fidelity Series International Value Fund | 9,827 | 1,073 | 431 | -- | (2) | (7) | 10,460 |
| Fidelity Series Intrinsic Opportunities Fund | 10,448 | 1,629 | 318 | 527 | (3) | 140 | 11,896 |
| Fidelity Series Investment Grade Bond Fund | 524 | 31 | 40 | 7 | (1) | (5) | 509 |
| Fidelity Series Large Cap Stock Fund | 9,478 | 1,120 | 486 | 619 | 4 | 452 | 10,568 |
| Fidelity Series Large Cap Value Index Fund | 2,717 | 159 | 109 | -- | -- | 192 | 2,959 |
| Fidelity Series Long-Term Treasury Bond Index Fund | 2,487 | 2,568 | 918 | 50 | (37) | (103) | 3,997 |
| Fidelity Series Opportunistic Insights Fund | 4,748 | 187 | 230 | -- | 5 | 617 | 5,327 |
| Fidelity Series Real Estate Equity Fund | 783 | 100 | 920 | 13 | (39) | 76 | -- |
| Fidelity Series Real Estate Income Fund | 465 | 29 | -- | 21 | -- | 2 | 496 |
| Fidelity Series Short-Term Credit Fund | 349 | 522 | 543 | 5 | (4) | 4 | 328 |
| Fidelity Series Small Cap Discovery Fund | 1,267 | 229 | 43 | 76 | -- | (19) | 1,434 |
| Fidelity Series Small Cap Opportunities Fund | 3,900 | 621 | 218 | 331 | 7 | 108 | 4,418 |
| Fidelity Series Stock Selector Large Cap Value Fund | 7,305 | 523 | 270 | -- | (5) | 515 | 8,068 |
| Fidelity Series Value Discovery Fund | 5,174 | 415 | 166 | -- | -- | 306 | 5,729 |
| | $109,904 | $17,934 | $15,597 | $2,338 | $313 | $2,764 | $115,318 |
Amounts in the income column in the above table include any capital gain distributions from underlying funds, which are presented in the corresponding line-item in the Statement of Operations if applicable.
Investment Valuation
All investments are categorized as Level 1 under the Fair Value Hierarchy. The inputs or methodology used for valuing securities may not be an indication of the risk associated with investing in those securities. For more information on valuation inputs please refer to the Investment Valuation section in the accompanying Notes to Financial Statements.
See accompanying notes which are an integral part of the financial statements.
Fidelity Flex℠ Freedom 2045 Fund
Financial Statements
Statement of Assets and Liabilities
| | | September 30, 2018 (Unaudited) |
| Assets | | |
Investment in securities, at value — See accompanying schedule:
| | |
| Affiliated issuers (cost $109,233) | $115,318 | |
| Total Investment in Securities (cost $109,233) | | $115,318 |
| Receivable for investments sold | | 1,820 |
| Total assets | | 117,138 |
| Liabilities | | |
| Payable for investments purchased | $1,819 | |
| Total liabilities | | 1,819 |
| Net Assets | | $115,319 |
| Net Assets consist of: | | |
| Paid in capital | | $106,599 |
| Undistributed net investment income | | 624 |
| Accumulated undistributed net realized gain (loss) on investments | | 2,011 |
| Net unrealized appreciation (depreciation) on investments | | 6,085 |
| Net Assets, for 10,620 shares outstanding | | $115,319 |
| Net Asset Value, offering price and redemption price per share ($115,319 ÷ 10,620 shares) | | $10.86 |
See accompanying notes which are an integral part of the financial statements.
Statement of Operations
| | | Six months ended September 30, 2018 (Unaudited) |
| Investment Income | | |
| Dividends: | | |
| Affiliated issuers | | $627 |
| Expenses | | |
| Independent trustees' fees and expenses | $1 | |
| Total expenses | | 1 |
| Net investment income (loss) | | 626 |
| Realized and Unrealized Gain (Loss) | | |
| Net realized gain (loss) on: | | |
| Investment securities: | | |
| Affiliated issuers | 313 | |
| Capital gain distributions from underlying funds: | | |
| Affiliated issuers | 1,711 | |
| Total net realized gain (loss) | | 2,024 |
| Change in net unrealized appreciation (depreciation) on: | | |
| Investment securities: | | |
| Affiliated issuers | 2,764 | |
| Total change in net unrealized appreciation (depreciation) | | 2,764 |
| Net gain (loss) | | 4,788 |
| Net increase (decrease) in net assets resulting from operations | | $5,414 |
See accompanying notes which are an integral part of the financial statements.
Statement of Changes in Net Assets
| | Six months ended September 30, 2018 (Unaudited) | For the period
June 8, 2017 (commencement of operations) to March 31, 2018 |
| Increase (Decrease) in Net Assets | | |
| Operations | | |
| Net investment income (loss) | $626 | $1,740 |
| Net realized gain (loss) | 2,024 | 4,843 |
| Change in net unrealized appreciation (depreciation) | 2,764 | 3,321 |
| Net increase (decrease) in net assets resulting from operations | 5,414 | 9,904 |
| Distributions to shareholders from net investment income | (82) | (1,660) |
| Distributions to shareholders from net realized gain | (3,196) | (1,660) |
| Total distributions | (3,278) | (3,320) |
| Share transactions | | |
| Proceeds from sales of shares | – | 100,000 |
| Reinvestment of distributions | 3,279 | 3,320 |
| Net increase (decrease) in net assets resulting from share transactions | 3,279 | 103,320 |
| Total increase (decrease) in net assets | 5,415 | 109,904 |
| Net Assets | | |
| Beginning of period | 109,904 | – |
| End of period | $115,319 | $109,904 |
| Other Information | | |
| Undistributed net investment income end of period | $624 | $80 |
| Shares | | |
| Sold | – | 10,000 |
| Issued in reinvestment of distributions | 309 | 311 |
| Net increase (decrease) | 309 | 10,311 |
See accompanying notes which are an integral part of the financial statements.
Financial Highlights
Fidelity Flex Freedom 2045 Fund
| | Six months ended (Unaudited) September 30, | Years endedMarch 31, |
| | 2018 | 2018 A |
| Selected Per–Share Data | | |
| Net asset value, beginning of period | $10.66 | $10.00 |
| Income from Investment Operations | | |
| Net investment income (loss)B | .06 | .17 |
| Net realized and unrealized gain (loss) | .46 | .82 |
| Total from investment operations | .52 | .99 |
| Distributions from net investment income | (.01) | (.17) |
| Distributions from net realized gain | (.31) | (.17) |
| Total distributions | (.32) | (.33)C |
| Net asset value, end of period | $10.86 | $10.66 |
| Total ReturnD | 4.93% | 9.91% |
| Ratios to Average Net AssetsE,F | | |
| Expenses before reductions | - %G,H | - %G |
| Expenses net of fee waivers, if any | - %G,H | - %G |
| Expenses net of all reductions | - %G,H | - %G |
| Net investment income (loss) | 1.11%G | 2.00%G |
| Supplemental Data | | |
| Net assets, end of period (000 omitted) | $115 | $110 |
| Portfolio turnover rateE | 28%G | 13%G |
A For the period June 8, 2017 (commencement of operations) to March 31, 2018.
B Calculated based on average shares outstanding during the period.
C Total distributions of $.33 per share is comprised of distributions from net investment income of $.166 and distributions from net realized gain of $.166 per share.
D Total returns for periods of less than one year are not annualized.
E Amounts do not include the activity of the Underlying Funds.
F Expense ratios reflect operating expenses of the Fund. Expenses before reductions do not reflect amounts reimbursed by the investment adviser or reductions from expense offset arrangements and do not represent the amount paid by the Fund during periods when reimbursements or reductions occur. Expenses net of fee waivers reflect expenses after reimbursement by the investment adviser but prior to reductions from expense offset arrangements. Expenses net of all reductions represent the net expenses paid by the Fund but do not include expenses of the underlying funds in which the Fund invests.
G Annualized
H Amount represents less than .005%.
See accompanying notes which are an integral part of the financial statements.
Fidelity Flex℠ Freedom 2050 Fund
Investment Summary (Unaudited)
The information in the following tables is based on the direct investments of the Fund.
Top Holdings as of September 30, 2018
| | % of fund's net assets |
| Fidelity Series Intrinsic Opportunities Fund | 10.3 |
| Fidelity Series Large Cap Stock Fund | 9.2 |
| Fidelity Series International Growth Fund | 9.1 |
| Fidelity Series International Value Fund | 9.1 |
| Fidelity Series Growth Company Fund | 8.6 |
| Fidelity Series Emerging Markets Opportunities Fund | 8.5 |
| Fidelity Series Stock Selector Large Cap Value Fund | 7.0 |
| Fidelity Series Value Discovery Fund | 5.0 |
| Fidelity Series Opportunistic Insights Fund | 4.6 |
| Fidelity Series Blue Chip Growth Fund | 4.2 |
| | 75.6 |
Asset Allocation (% of fund's net assets)
| Period end |
| | Domestic Equity Funds | 61.0% |
| | International Equity Funds | 30.8% |
| | Bond Funds | 6.8% |
| | Short-Term Funds | 1.4% |

Domestic Equity Funds category includes Fidelity Series Commodity Strategy Fund which invests in commodity-related investments.
Fidelity Flex℠ Freedom 2050 Fund
Schedule of Investments September 30, 2018 (Unaudited)
Showing Percentage of Net Assets
| Domestic Equity Funds - 61.0% | | | |
| | | Shares | Value |
| Fidelity Series All-Sector Equity Fund (a) | | 200 | $2,718 |
| Fidelity Series Blue Chip Growth Fund (a) | | 320 | 4,892 |
| Fidelity Series Commodity Strategy Fund (a) | | 486 | 2,432 |
| Fidelity Series Growth Company Fund (a) | | 491 | 9,925 |
| Fidelity Series Intrinsic Opportunities Fund (a) | | 649 | 11,889 |
| Fidelity Series Large Cap Stock Fund (a) | | 663 | 10,566 |
| Fidelity Series Large Cap Value Index Fund (a) | | 224 | 2,958 |
| Fidelity Series Opportunistic Insights Fund (a) | | 268 | 5,325 |
| Fidelity Series Small Cap Discovery Fund (a) | | 118 | 1,434 |
| Fidelity Series Small Cap Opportunities Fund (a) | | 301 | 4,417 |
| Fidelity Series Stock Selector Large Cap Value Fund (a) | | 610 | 8,066 |
| Fidelity Series Value Discovery Fund (a) | | 418 | 5,728 |
| TOTAL DOMESTIC EQUITY FUNDS | | | |
| (Cost $65,029) | | | 70,350 |
|
| International Equity Funds - 30.8% | | | |
| Fidelity Series Canada Fund (a) | | 98 | 1,064 |
| Fidelity Series Emerging Markets Fund (a) | | 113 | 1,091 |
| Fidelity Series Emerging Markets Opportunities Fund (a) | | 511 | 9,806 |
| Fidelity Series International Growth Fund (a) | | 641 | 10,505 |
| Fidelity Series International Small Cap Fund (a) | | 141 | 2,531 |
| Fidelity Series International Value Fund (a) | | 994 | 10,460 |
| TOTAL INTERNATIONAL EQUITY FUNDS | | | |
| (Cost $34,404) | | | 35,457 |
|
| Bond Funds - 6.8% | | | |
| Fidelity Series Emerging Markets Debt Fund (a) | | 71 | 681 |
| Fidelity Series Floating Rate High Income Fund (a) | | 27 | 255 |
| Fidelity Series High Income Fund (a) | | 157 | 1,510 |
| Fidelity Series Inflation-Protected Bond Index Fund (a) | | 36 | 347 |
| Fidelity Series International Credit Fund (a) | | 5 | 46 |
| Fidelity Series Investment Grade Bond Fund (a) | | 47 | 509 |
| Fidelity Series Long-Term Treasury Bond Index Fund (a) | | 485 | 3,996 |
| Fidelity Series Real Estate Income Fund (a) | | 46 | 496 |
| TOTAL BOND FUNDS | | | |
| (Cost $8,125) | | | 7,840 |
|
| Short-Term Funds - 1.4% | | | |
| Fidelity Series Government Money Market Fund 2.12% (a)(b) | | 1,323 | 1,323 |
| Fidelity Series Short-Term Credit Fund (a) | | 34 | 331 |
| TOTAL SHORT-TERM FUNDS | | | |
| (Cost $1,654) | | | 1,654 |
| TOTAL INVESTMENT IN SECURITIES - 100.0% | | | |
| (Cost $109,212) | | | 115,301 |
| NET OTHER ASSETS (LIABILITIES) - 0.0% | | | 0 |
| NET ASSETS - 100% | | | $115,301 |
Legend
(a) Affiliated Fund
(b) The rate quoted is the annualized seven-day yield of the fund at period end.
Affiliated Underlying Funds
Fiscal year to date information regarding the Fund's investments in affiliated Underlying Funds, excluding any Money Market Central Funds, is presented below. Exchanges between classes of the same affiliated Underlying Funds may occur.
| Affiliate | Value, beginning of period | Purchases | Sales Proceeds | Dividend Income | Realized Gain (loss) | Change in Unrealized appreciation (depreciation) | Value, end of period |
| Fidelity Series 100 Index Fund | $2,186 | $-- | $2,281 | $-- | $244 | $(149) | $-- |
| Fidelity Series All-Sector Equity Fund | 4,192 | 80 | 2,025 | -- | 86 | 385 | 2,718 |
| Fidelity Series Blue Chip Growth Fund | 4,332 | 613 | 371 | 457 | 23 | 295 | 4,892 |
| Fidelity Series Canada Fund | 947 | 135 | 77 | -- | -- | 59 | 1,064 |
| Fidelity Series Commodity Strategy Fund | 2,285 | 511 | 168 | 146 | (8) | (188) | 2,432 |
| Fidelity Series Emerging Markets Debt Fund | 700 | 20 | 1 | 20 | -- | (38) | 681 |
| Fidelity Series Emerging Markets Fund | -- | 1,091 | -- | -- | -- | -- | 1,091 |
| Fidelity Series Emerging Markets Opportunities Fund | 9,967 | 2,594 | 1,501 | -- | (33) | (1,221) | 9,806 |
| Fidelity Series Floating Rate High Income Fund | 250 | 7 | 2 | 7 | -- | -- | 255 |
| Fidelity Series Government Money Market Fund 2.12% | 1,761 | 1,914 | 2,352 | 14 | -- | -- | 1,323 |
| Fidelity Series Growth Company Fund | 9,024 | 326 | 754 | -- | 57 | 1,272 | 9,925 |
| Fidelity Series High Income Fund | 1,519 | 44 | 66 | 44 | (1) | 14 | 1,510 |
| Fidelity Series Inflation-Protected Bond Index Fund | 907 | 72 | 635 | 1 | (10) | 13 | 347 |
| Fidelity Series International Credit Fund | 34 | 12 | -- | -- | -- | -- | 46 |
| Fidelity Series International Growth Fund | 9,706 | 1,034 | 389 | -- | 1 | 153 | 10,505 |
| Fidelity Series International Small Cap Fund | 2,422 | 262 | 60 | -- | 4 | (97) | 2,531 |
| Fidelity Series International Value Fund | 9,852 | 1,068 | 450 | -- | (2) | (8) | 10,460 |
| Fidelity Series Intrinsic Opportunities Fund | 10,562 | 1,508 | 320 | 527 | (4) | 143 | 11,889 |
| Fidelity Series Investment Grade Bond Fund | 524 | 26 | 35 | 7 | (1) | (5) | 509 |
| Fidelity Series Large Cap Stock Fund | 9,477 | 1,168 | 533 | 620 | 4 | 450 | 10,566 |
| Fidelity Series Large Cap Value Index Fund | 2,699 | 176 | 108 | -- | -- | 191 | 2,958 |
| Fidelity Series Long-Term Treasury Bond Index Fund | 2,486 | 2,561 | 911 | 50 | (36) | (104) | 3,996 |
| Fidelity Series Opportunistic Insights Fund | 4,748 | 189 | 234 | -- | 5 | 617 | 5,325 |
| Fidelity Series Real Estate Equity Fund | 801 | 75 | 912 | 13 | (42) | 78 | -- |
| Fidelity Series Real Estate Income Fund | 465 | 29 | -- | 21 | -- | 2 | 496 |
| Fidelity Series Short-Term Credit Fund | 349 | 529 | 547 | 4 | (4) | 4 | 331 |
| Fidelity Series Small Cap Discovery Fund | 1,292 | 204 | 43 | 77 | (1) | (18) | 1,434 |
| Fidelity Series Small Cap Opportunities Fund | 3,947 | 604 | 254 | 331 | 11 | 109 | 4,417 |
| Fidelity Series Stock Selector Large Cap Value Fund | 7,400 | 418 | 267 | -- | (5) | 520 | 8,066 |
| Fidelity Series Value Discovery Fund | 5,060 | 528 | 165 | -- | -- | 305 | 5,728 |
| | $109,894 | $17,798 | $15,461 | $2,339 | $288 | $2,782 | $115,301 |
Amounts in the income column in the above table include any capital gain distributions from underlying funds, which are presented in the corresponding line-item in the Statement of Operations if applicable.
Investment Valuation
All investments are categorized as Level 1 under the Fair Value Hierarchy. The inputs or methodology used for valuing securities may not be an indication of the risk associated with investing in those securities. For more information on valuation inputs please refer to the Investment Valuation section in the accompanying Notes to Financial Statements.
See accompanying notes which are an integral part of the financial statements.
Fidelity Flex℠ Freedom 2050 Fund
Financial Statements
Statement of Assets and Liabilities
| | | September 30, 2018 (Unaudited) |
| Assets | | |
Investment in securities, at value — See accompanying schedule:
| | |
| Affiliated issuers (cost $109,212) | $115,301 | |
| Total Investment in Securities (cost $109,212) | | $115,301 |
| Receivable for investments sold | | 1,833 |
| Total assets | | 117,134 |
| Liabilities | | |
| Payable for investments purchased | $1,833 | |
| Total liabilities | | 1,833 |
| Net Assets | | $115,301 |
| Net Assets consist of: | | |
| Paid in capital | | $106,609 |
| Undistributed net investment income | | 623 |
| Accumulated undistributed net realized gain (loss) on investments | | 1,980 |
| Net unrealized appreciation (depreciation) on investments | | 6,089 |
| Net Assets, for 10,621 shares outstanding | | $115,301 |
| Net Asset Value, offering price and redemption price per share ($115,301 ÷ 10,621 shares) | | $10.86 |
See accompanying notes which are an integral part of the financial statements.
Statement of Operations
| | | Six months ended September 30, 2018 (Unaudited) |
| Investment Income | | |
| Dividends: | | |
| Affiliated issuers | | $626 |
| Expenses | | |
| Independent trustees' fees and expenses | $1 | |
| Total expenses | | 1 |
| Net investment income (loss) | | 625 |
| Realized and Unrealized Gain (Loss) | | |
| Net realized gain (loss) on: | | |
| Investment securities: | | |
| Affiliated issuers | 288 | |
| Capital gain distributions from underlying funds: | | |
| Affiliated issuers | 1,713 | |
| Total net realized gain (loss) | | 2,001 |
| Change in net unrealized appreciation (depreciation) on: | | |
| Investment securities: | | |
| Affiliated issuers | 2,782 | |
| Total change in net unrealized appreciation (depreciation) | | 2,782 |
| Net gain (loss) | | 4,783 |
| Net increase (decrease) in net assets resulting from operations | | $5,408 |
See accompanying notes which are an integral part of the financial statements.
Statement of Changes in Net Assets
| | Six months ended September 30, 2018 (Unaudited) | For the period
June 8, 2017 (commencement of operations) to March 31, 2018 |
| Increase (Decrease) in Net Assets | | |
| Operations | | |
| Net investment income (loss) | $625 | $1,740 |
| Net realized gain (loss) | 2,001 | 4,846 |
| Change in net unrealized appreciation (depreciation) | 2,782 | 3,307 |
| Net increase (decrease) in net assets resulting from operations | 5,408 | 9,893 |
| Distributions to shareholders from net investment income | (82) | (1,660) |
| Distributions to shareholders from net realized gain | (3,227) | (1,640) |
| Total distributions | (3,309) | (3,300) |
| Share transactions | | |
| Proceeds from sales of shares | – | 100,000 |
| Reinvestment of distributions | 3,309 | 3,300 |
| Net increase (decrease) in net assets resulting from share transactions | 3,309 | 103,300 |
| Total increase (decrease) in net assets | 5,408 | 109,893 |
| Net Assets | | |
| Beginning of period | 109,893 | – |
| End of period | $115,301 | $109,893 |
| Other Information | | |
| Undistributed net investment income end of period | $623 | $80 |
| Shares | | |
| Sold | – | 10,000 |
| Issued in reinvestment of distributions | 312 | 309 |
| Net increase (decrease) | 312 | 10,309 |
See accompanying notes which are an integral part of the financial statements.
Financial Highlights
Fidelity Flex Freedom 2050 Fund
| | Six months ended (Unaudited) September 30, | Years endedMarch 31, |
| | 2018 | 2018 A |
| Selected Per–Share Data | | |
| Net asset value, beginning of period | $10.66 | $10.00 |
| Income from Investment Operations | | |
| Net investment income (loss)B | .06 | .17 |
| Net realized and unrealized gain (loss) | .46 | .82 |
| Total from investment operations | .52 | .99 |
| Distributions from net investment income | (.01) | (.17) |
| Distributions from net realized gain | (.31) | (.16) |
| Total distributions | (.32) | (.33) |
| Net asset value, end of period | $10.86 | $10.66 |
| Total ReturnC | 4.96% | 9.89% |
| Ratios to Average Net AssetsD,E | | |
| Expenses before reductions | - %F,G | - %F |
| Expenses net of fee waivers, if any | - %F,G | - %F |
| Expenses net of all reductions | - %F,G | - %F |
| Net investment income (loss) | 1.11%F | 2.00%F |
| Supplemental Data | | |
| Net assets, end of period (000 omitted) | $115 | $110 |
| Portfolio turnover rateD | 27%F | 13%F |
A For the period June 8, 2017 (commencement of operations) to March 31, 2018.
B Calculated based on average shares outstanding during the period.
C Total returns for periods of less than one year are not annualized.
D Amounts do not include the activity of the Underlying Funds.
E Expense ratios reflect operating expenses of the Fund. Expenses before reductions do not reflect amounts reimbursed by the investment adviser or reductions from expense offset arrangements and do not represent the amount paid by the Fund during periods when reimbursements or reductions occur. Expenses net of fee waivers reflect expenses after reimbursement by the investment adviser but prior to reductions from expense offset arrangements. Expenses net of all reductions represent the net expenses paid by the Fund but do not include expenses of the underlying funds in which the Fund invests.
F Annualized
G Amount represents less than .005%.
See accompanying notes which are an integral part of the financial statements.
Fidelity Flex℠ Freedom 2055 Fund
Investment Summary (Unaudited)
The information in the following tables is based on the direct investments of the Fund.
Top Holdings as of September 30, 2018
| | % of fund's net assets |
| Fidelity Series Intrinsic Opportunities Fund | 10.3 |
| Fidelity Series Large Cap Stock Fund | 9.2 |
| Fidelity Series International Growth Fund | 9.1 |
| Fidelity Series International Value Fund | 9.1 |
| Fidelity Series Growth Company Fund | 8.6 |
| Fidelity Series Emerging Markets Opportunities Fund | 8.5 |
| Fidelity Series Stock Selector Large Cap Value Fund | 7.0 |
| Fidelity Series Value Discovery Fund | 5.0 |
| Fidelity Series Opportunistic Insights Fund | 4.6 |
| Fidelity Series Blue Chip Growth Fund | 4.2 |
| | 75.6 |
Asset Allocation (% of fund's net assets)
| Period end |
| | Domestic Equity Funds | 61.0% |
| | International Equity Funds | 30.8% |
| | Bond Funds | 6.8% |
| | Short-Term Funds | 1.4% |

Domestic Equity Funds category includes Fidelity Series Commodity Strategy Fund which invests in commodity-related investments.
Fidelity Flex℠ Freedom 2055 Fund
Schedule of Investments September 30, 2018 (Unaudited)
Showing Percentage of Net Assets
| Domestic Equity Funds - 61.0% | | | |
| | | Shares | Value |
| Fidelity Series All-Sector Equity Fund (a) | | 200 | $2,719 |
| Fidelity Series Blue Chip Growth Fund (a) | | 320 | 4,895 |
| Fidelity Series Commodity Strategy Fund (a) | | 487 | 2,433 |
| Fidelity Series Growth Company Fund (a) | | 491 | 9,930 |
| Fidelity Series Intrinsic Opportunities Fund (a) | | 649 | 11,895 |
| Fidelity Series Large Cap Stock Fund (a) | | 664 | 10,571 |
| Fidelity Series Large Cap Value Index Fund (a) | | 224 | 2,959 |
| Fidelity Series Opportunistic Insights Fund (a) | | 268 | 5,328 |
| Fidelity Series Small Cap Discovery Fund (a) | | 118 | 1,434 |
| Fidelity Series Small Cap Opportunities Fund (a) | | 301 | 4,419 |
| Fidelity Series Stock Selector Large Cap Value Fund (a) | | 610 | 8,070 |
| Fidelity Series Value Discovery Fund (a) | | 419 | 5,731 |
| TOTAL DOMESTIC EQUITY FUNDS | | | |
| (Cost $65,064) | | | 70,384 |
|
| International Equity Funds - 30.8% | | | |
| Fidelity Series Canada Fund (a) | | 98 | 1,061 |
| Fidelity Series Emerging Markets Fund (a) | | 113 | 1,091 |
| Fidelity Series Emerging Markets Opportunities Fund (a) | | 511 | 9,807 |
| Fidelity Series International Growth Fund (a) | | 641 | 10,504 |
| Fidelity Series International Small Cap Fund (a) | | 141 | 2,529 |
| Fidelity Series International Value Fund (a) | | 994 | 10,459 |
| TOTAL INTERNATIONAL EQUITY FUNDS | | | |
| (Cost $34,397) | | | 35,451 |
|
| Bond Funds - 6.8% | | | |
| Fidelity Series Emerging Markets Debt Fund (a) | | 70 | 670 |
| Fidelity Series Floating Rate High Income Fund (a) | | 27 | 255 |
| Fidelity Series High Income Fund (a) | | 157 | 1,511 |
| Fidelity Series Inflation-Protected Bond Index Fund (a) | | 36 | 347 |
| Fidelity Series International Credit Fund (a) | | 3 | 34 |
| Fidelity Series Investment Grade Bond Fund (a) | | 47 | 509 |
| Fidelity Series Long-Term Treasury Bond Index Fund (a) | | 485 | 3,994 |
| Fidelity Series Real Estate Income Fund (a) | | 47 | 508 |
| TOTAL BOND FUNDS | | | |
| (Cost $8,114) | | | 7,828 |
|
| Short-Term Funds - 1.4% | | | |
| Fidelity Series Government Money Market Fund 2.12% (a)(b) | | 1,328 | 1,328 |
| Fidelity Series Short-Term Credit Fund (a) | | 33 | 328 |
| TOTAL SHORT-TERM FUNDS | | | |
| (Cost $1,656) | | | 1,656 |
| TOTAL INVESTMENT IN SECURITIES - 100.0% | | | |
| (Cost $109,231) | | | 115,319 |
| NET OTHER ASSETS (LIABILITIES) - 0.0% | | | 2 |
| NET ASSETS - 100% | | | $115,321 |
Legend
(a) Affiliated Fund
(b) The rate quoted is the annualized seven-day yield of the fund at period end.
Affiliated Underlying Funds
Fiscal year to date information regarding the Fund's investments in affiliated Underlying Funds, excluding any Money Market Central Funds, is presented below. Exchanges between classes of the same affiliated Underlying Funds may occur.
| Affiliate | Value, beginning of period | Purchases | Sales Proceeds | Dividend Income | Realized Gain (loss) | Change in Unrealized appreciation (depreciation) | Value, end of period |
| Fidelity Series 100 Index Fund | $2,186 | $-- | $2,282 | $-- | $245 | $(149) | $-- |
| Fidelity Series All-Sector Equity Fund | 4,192 | 82 | 2,030 | -- | 90 | 385 | 2,719 |
| Fidelity Series Blue Chip Growth Fund | 4,332 | 630 | 385 | 457 | 23 | 295 | 4,895 |
| Fidelity Series Canada Fund | 964 | 132 | 94 | -- | (1) | 60 | 1,061 |
| Fidelity Series Commodity Strategy Fund | 2,289 | 508 | 168 | 146 | (8) | (188) | 2,433 |
| Fidelity Series Emerging Markets Debt Fund | 690 | 20 | 2 | 20 | -- | (38) | 670 |
| Fidelity Series Emerging Markets Fund | -- | 1,091 | -- | -- | -- | -- | 1,091 |
| Fidelity Series Emerging Markets Opportunities Fund | 9,972 | 2,565 | 1,477 | -- | (32) | (1,221) | 9,807 |
| Fidelity Series Floating Rate High Income Fund | 250 | 7 | 2 | 7 | -- | -- | 255 |
| Fidelity Series Government Money Market Fund 2.12% | 1,759 | 1,996 | 2,427 | 15 | -- | -- | 1,328 |
| Fidelity Series Growth Company Fund | 9,180 | 358 | 942 | -- | 72 | 1,262 | 9,930 |
| Fidelity Series High Income Fund | 1,519 | 45 | 66 | 44 | (1) | 14 | 1,511 |
| Fidelity Series Inflation-Protected Bond Index Fund | 910 | 82 | 648 | 1 | (10) | 13 | 347 |
| Fidelity Series International Credit Fund | 34 | -- | -- | -- | -- | -- | 34 |
| Fidelity Series International Growth Fund | 9,708 | 1,030 | 388 | -- | 2 | 152 | 10,504 |
| Fidelity Series International Small Cap Fund | 2,422 | 260 | 61 | -- | 4 | (96) | 2,529 |
| Fidelity Series International Value Fund | 9,834 | 1,074 | 441 | -- | (2) | (6) | 10,459 |
| Fidelity Series Intrinsic Opportunities Fund | 10,472 | 1,641 | 353 | 527 | (5) | 140 | 11,895 |
| Fidelity Series Investment Grade Bond Fund | 524 | 31 | 39 | 7 | (2) | (5) | 509 |
| Fidelity Series Large Cap Stock Fund | 9,478 | 1,169 | 533 | 618 | 5 | 452 | 10,571 |
| Fidelity Series Large Cap Value Index Fund | 2,717 | 161 | 111 | -- | -- | 192 | 2,959 |
| Fidelity Series Long-Term Treasury Bond Index Fund | 2,489 | 2,487 | 841 | 50 | (34) | (107) | 3,994 |
| Fidelity Series Opportunistic Insights Fund | 4,749 | 211 | 254 | -- | 5 | 617 | 5,328 |
| Fidelity Series Real Estate Equity Fund | 783 | 100 | 920 | 13 | (39) | 76 | -- |
| Fidelity Series Real Estate Income Fund | 465 | 41 | -- | 21 | -- | 2 | 508 |
| Fidelity Series Short-Term Credit Fund | 350 | 545 | 567 | 4 | (4) | 4 | 328 |
| Fidelity Series Small Cap Discovery Fund | 1,267 | 231 | 45 | 76 | -- | (19) | 1,434 |
| Fidelity Series Small Cap Opportunities Fund | 3,900 | 632 | 230 | 331 | 8 | 109 | 4,419 |
| Fidelity Series Stock Selector Large Cap Value Fund | 7,305 | 529 | 275 | -- | (5) | 516 | 8,070 |
| Fidelity Series Value Discovery Fund | 5,166 | 428 | 169 | -- | -- | 306 | 5,731 |
| | $109,906 | $18,086 | $15,750 | $2,337 | $311 | $2,766 | $115,319 |
Amounts in the income column in the above table include any capital gain distributions from underlying funds, which are presented in the corresponding line-item in the Statement of Operations if applicable.
Investment Valuation
All investments are categorized as Level 1 under the Fair Value Hierarchy. The inputs or methodology used for valuing securities may not be an indication of the risk associated with investing in those securities. For more information on valuation inputs please refer to the Investment Valuation section in the accompanying Notes to Financial Statements.
See accompanying notes which are an integral part of the financial statements.
Fidelity Flex℠ Freedom 2055 Fund
Financial Statements
Statement of Assets and Liabilities
| | | September 30, 2018 (Unaudited) |
| Assets | | |
Investment in securities, at value — See accompanying schedule:
| | |
| Affiliated issuers (cost $109,231) | $115,319 | |
| Total Investment in Securities (cost $109,231) | | $115,319 |
| Receivable for investments sold | | 1,805 |
| Total assets | | 117,124 |
| Liabilities | | |
| Payable for investments purchased | $1,803 | |
| Total liabilities | | 1,803 |
| Net Assets | | $115,321 |
| Net Assets consist of: | | |
| Paid in capital | | $106,599 |
| Undistributed net investment income | | 624 |
| Accumulated undistributed net realized gain (loss) on investments | | 2,010 |
| Net unrealized appreciation (depreciation) on investments | | 6,088 |
| Net Assets, for 10,620 shares outstanding | | $115,321 |
| Net Asset Value, offering price and redemption price per share ($115,321 ÷ 10,620 shares) | | $10.86 |
See accompanying notes which are an integral part of the financial statements.
Statement of Operations
| | | Six months ended September 30, 2018 (Unaudited) |
| Investment Income | | |
| Dividends: | | |
| Affiliated issuers | | $627 |
| Expenses | | |
| Independent trustees' fees and expenses | $1 | |
| Total expenses | | 1 |
| Net investment income (loss) | | 626 |
| Realized and Unrealized Gain (Loss) | | |
| Net realized gain (loss) on: | | |
| Investment securities: | | |
| Affiliated issuers | 311 | |
| Capital gain distributions from underlying funds: | | |
| Affiliated issuers | 1,710 | |
| Total net realized gain (loss) | | 2,021 |
| Change in net unrealized appreciation (depreciation) on: | | |
| Investment securities: | | |
| Affiliated issuers | 2,766 | |
| Total change in net unrealized appreciation (depreciation) | | 2,766 |
| Net gain (loss) | | 4,787 |
| Net increase (decrease) in net assets resulting from operations | | $5,413 |
See accompanying notes which are an integral part of the financial statements.
Statement of Changes in Net Assets
| | Six months ended September 30, 2018 (Unaudited) | For the period
June 8, 2017 (commencement of operations) to March 31, 2018 |
| Increase (Decrease) in Net Assets | | |
| Operations | | |
| Net investment income (loss) | $626 | $1,740 |
| Net realized gain (loss) | 2,021 | 4,845 |
| Change in net unrealized appreciation (depreciation) | 2,766 | 3,322 |
| Net increase (decrease) in net assets resulting from operations | 5,413 | 9,907 |
| Distributions to shareholders from net investment income | (82) | (1,660) |
| Distributions to shareholders from net realized gain | (3,206) | (1,650) |
| Total distributions | (3,288) | (3,310) |
| Share transactions | | |
| Proceeds from sales of shares | – | 100,000 |
| Reinvestment of distributions | 3,289 | 3,310 |
| Net increase (decrease) in net assets resulting from share transactions | 3,289 | 103,310 |
| Total increase (decrease) in net assets | 5,414 | 109,907 |
| Net Assets | | |
| Beginning of period | 109,907 | – |
| End of period | $115,321 | $109,907 |
| Other Information | | |
| Undistributed net investment income end of period | $624 | $80 |
| Shares | | |
| Sold | – | 10,000 |
| Issued in reinvestment of distributions | 310 | 310 |
| Net increase (decrease) | 310 | 10,310 |
See accompanying notes which are an integral part of the financial statements.
Financial Highlights
Fidelity Flex Freedom 2055 Fund
| | Six months ended (Unaudited) September 30, | Years endedMarch 31, |
| | 2018 | 2018 A |
| Selected Per–Share Data | | |
| Net asset value, beginning of period | $10.66 | $10.00 |
| Income from Investment Operations | | |
| Net investment income (loss)B | .06 | .17 |
| Net realized and unrealized gain (loss) | .46 | .82 |
| Total from investment operations | .52 | .99 |
| Distributions from net investment income | (.01) | (.17) |
| Distributions from net realized gain | (.31) | (.17) |
| Total distributions | (.32) | (.33)C |
| Net asset value, end of period | $10.86 | $10.66 |
| Total ReturnD | 4.94% | 9.90% |
| Ratios to Average Net AssetsE,F | | |
| Expenses before reductions | - %G,H | - %G |
| Expenses net of fee waivers, if any | - %G,H | - %G |
| Expenses net of all reductions | - %G,H | - %G |
| Net investment income (loss) | 1.11%G | 2.00%G |
| Supplemental Data | | |
| Net assets, end of period (000 omitted) | $115 | $110 |
| Portfolio turnover rateE | 28%G | 13%G |
A For the period June 8, 2017 (commencement of operations) to March 31, 2018.
B Calculated based on average shares outstanding during the period.
C Total distributions of $.33 per share is comprised of distributions from net investment income of $.166 and distributions from net realized gain of $.165 per share.
D Total returns for periods of less than one year are not annualized.
E Amounts do not include the activity of the Underlying Funds.
F Expense ratios reflect operating expenses of the Fund. Expenses before reductions do not reflect amounts reimbursed by the investment adviser or reductions from expense offset arrangements and do not represent the amount paid by the Fund during periods when reimbursements or reductions occur. Expenses net of fee waivers reflect expenses after reimbursement by the investment adviser but prior to reductions from expense offset arrangements. Expenses net of all reductions represent the net expenses paid by the Fund but do not include expenses of the underlying funds in which the Fund invests.
G Annualized
H Amount represents less than .005%.
See accompanying notes which are an integral part of the financial statements.
Fidelity Flex℠ Freedom 2060 Fund
Investment Summary (Unaudited)
The information in the following tables is based on the direct investments of the Fund.
Top Holdings as of September 30, 2018
| | % of fund's net assets |
| Fidelity Series Intrinsic Opportunities Fund | 10.3 |
| Fidelity Series Large Cap Stock Fund | 9.2 |
| Fidelity Series International Growth Fund | 9.1 |
| Fidelity Series International Value Fund | 9.1 |
| Fidelity Series Growth Company Fund | 8.6 |
| Fidelity Series Emerging Markets Opportunities Fund | 8.5 |
| Fidelity Series Stock Selector Large Cap Value Fund | 7.0 |
| Fidelity Series Value Discovery Fund | 5.0 |
| Fidelity Series Opportunistic Insights Fund | 4.6 |
| Fidelity Series Blue Chip Growth Fund | 4.2 |
| | 75.6 |
Asset Allocation (% of fund's net assets)
| Period end |
| | Domestic Equity Funds | 61.0% |
| | International Equity Funds | 30.8% |
| | Bond Funds | 6.8% |
| | Short-Term Funds | 1.4% |

Domestic Equity Funds category includes Fidelity Series Commodity Strategy Fund which invests in commodity-related investments.
Fidelity Flex℠ Freedom 2060 Fund
Schedule of Investments September 30, 2018 (Unaudited)
Showing Percentage of Net Assets
| Domestic Equity Funds - 61.0% | | | |
| | | Shares | Value |
| Fidelity Series All-Sector Equity Fund (a) | | 200 | $2,718 |
| Fidelity Series Blue Chip Growth Fund (a) | | 320 | 4,894 |
| Fidelity Series Commodity Strategy Fund (a) | | 486 | 2,432 |
| Fidelity Series Growth Company Fund (a) | | 491 | 9,928 |
| Fidelity Series Intrinsic Opportunities Fund (a) | | 649 | 11,891 |
| Fidelity Series Large Cap Stock Fund (a) | | 663 | 10,569 |
| Fidelity Series Large Cap Value Index Fund (a) | | 224 | 2,959 |
| Fidelity Series Opportunistic Insights Fund (a) | | 268 | 5,327 |
| Fidelity Series Small Cap Discovery Fund (a) | | 118 | 1,434 |
| Fidelity Series Small Cap Opportunities Fund (a) | | 301 | 4,418 |
| Fidelity Series Stock Selector Large Cap Value Fund (a) | | 610 | 8,068 |
| Fidelity Series Value Discovery Fund (a) | | 418 | 5,729 |
| TOTAL DOMESTIC EQUITY FUNDS | | | |
| (Cost $65,029) | | | 70,367 |
|
| International Equity Funds - 30.8% | | | |
| Fidelity Series Canada Fund (a) | | 98 | 1,062 |
| Fidelity Series Emerging Markets Fund (a) | | 113 | 1,091 |
| Fidelity Series Emerging Markets Opportunities Fund (a) | | 511 | 9,807 |
| Fidelity Series International Growth Fund (a) | | 641 | 10,504 |
| Fidelity Series International Small Cap Fund (a) | | 141 | 2,529 |
| Fidelity Series International Value Fund (a) | | 994 | 10,459 |
| TOTAL INTERNATIONAL EQUITY FUNDS | | | |
| (Cost $34,398) | | | 35,452 |
|
| Bond Funds - 6.8% | | | |
| Fidelity Series Emerging Markets Debt Fund (a) | | 69 | 659 |
| Fidelity Series Floating Rate High Income Fund (a) | | 28 | 267 |
| Fidelity Series High Income Fund (a) | | 157 | 1,511 |
| Fidelity Series Inflation-Protected Bond Index Fund (a) | | 36 | 347 |
| Fidelity Series International Credit Fund (a) | | 3 | 34 |
| Fidelity Series Investment Grade Bond Fund (a) | | 47 | 509 |
| Fidelity Series Long-Term Treasury Bond Index Fund (a) | | 485 | 3,994 |
| Fidelity Series Real Estate Income Fund (a) | | 48 | 515 |
| TOTAL BOND FUNDS | | | |
| (Cost $8,128) | | | 7,836 |
|
| Short-Term Funds - 1.4% | | | |
| Fidelity Series Government Money Market Fund 2.12% (a)(b) | | 1,329 | 1,329 |
| Fidelity Series Short-Term Credit Fund (a) | | 33 | 329 |
| TOTAL SHORT-TERM FUNDS | | | |
| (Cost $1,658) | | | 1,658 |
| TOTAL INVESTMENT IN SECURITIES - 100.0% | | | |
| (Cost $109,213) | | | 115,313 |
| NET OTHER ASSETS (LIABILITIES) - 0.0% | | | (1) |
| NET ASSETS - 100% | | | $115,312 |
Legend
(a) Affiliated Fund
(b) The rate quoted is the annualized seven-day yield of the fund at period end.
Affiliated Underlying Funds
Fiscal year to date information regarding the Fund's investments in affiliated Underlying Funds, excluding any Money Market Central Funds, is presented below. Exchanges between classes of the same affiliated Underlying Funds may occur.
| Affiliate | Value, beginning of period | Purchases | Sales Proceeds | Dividend Income | Realized Gain (loss) | Change in Unrealized appreciation (depreciation) | Value, end of period |
| Fidelity Series 100 Index Fund | $2,207 | $-- | $2,303 | $-- | $245 | $(149) | $-- |
| Fidelity Series All-Sector Equity Fund | 4,192 | 66 | 2,015 | -- | 90 | 385 | 2,718 |
| Fidelity Series Blue Chip Growth Fund | 4,333 | 617 | 374 | 457 | 23 | 295 | 4,894 |
| Fidelity Series Canada Fund | 964 | 135 | 95 | -- | (1) | 59 | 1,062 |
| Fidelity Series Commodity Strategy Fund | 2,301 | 495 | 168 | 146 | (8) | (188) | 2,432 |
| Fidelity Series Emerging Markets Debt Fund | 648 | 47 | -- | 20 | -- | (36) | 659 |
| Fidelity Series Emerging Markets Fund | -- | 1,091 | -- | -- | -- | -- | 1,091 |
| Fidelity Series Emerging Markets Opportunities Fund | 9,996 | 2,529 | 1,466 | -- | (28) | (1,224) | 9,807 |
| Fidelity Series Floating Rate High Income Fund | 239 | 28 | -- | 7 | -- | -- | 267 |
| Fidelity Series Government Money Market Fund 2.12% | 1,758 | 1,875 | 2,304 | 14 | -- | -- | 1,329 |
| Fidelity Series Growth Company Fund | 9,193 | 368 | 961 | -- | 63 | 1,265 | 9,928 |
| Fidelity Series High Income Fund | 1,519 | 45 | 66 | 44 | (1) | 14 | 1,511 |
| Fidelity Series Inflation-Protected Bond Index Fund | 914 | 79 | 650 | 1 | (10) | 14 | 347 |
| Fidelity Series International Credit Fund | 49 | -- | 15 | 1 | -- | -- | 34 |
| Fidelity Series International Growth Fund | 9,708 | 1,018 | 376 | -- | 2 | 152 | 10,504 |
| Fidelity Series International Small Cap Fund | 2,422 | 265 | 65 | -- | 4 | (97) | 2,529 |
| Fidelity Series International Value Fund | 9,827 | 1,071 | 429 | -- | (1) | (9) | 10,459 |
| Fidelity Series Intrinsic Opportunities Fund | 10,528 | 1,585 | 360 | 527 | (4) | 142 | 11,891 |
| Fidelity Series Investment Grade Bond Fund | 524 | 26 | 35 | 7 | (1) | (5) | 509 |
| Fidelity Series Large Cap Stock Fund | 9,478 | 1,163 | 529 | 619 | 5 | 452 | 10,569 |
| Fidelity Series Large Cap Value Index Fund | 2,699 | 173 | 104 | -- | -- | 191 | 2,959 |
| Fidelity Series Long-Term Treasury Bond Index Fund | 2,493 | 2,338 | 695 | 50 | (28) | (114) | 3,994 |
| Fidelity Series Opportunistic Insights Fund | 4,749 | 211 | 255 | -- | 5 | 617 | 5,327 |
| Fidelity Series Real Estate Equity Fund | 805 | 78 | 920 | 13 | (41) | 78 | -- |
| Fidelity Series Real Estate Income Fund | 465 | 48 | -- | 21 | -- | 2 | 515 |
| Fidelity Series Short-Term Credit Fund | 350 | 511 | 532 | 4 | (4) | 4 | 329 |
| Fidelity Series Small Cap Discovery Fund | 1,267 | 227 | 41 | 76 | -- | (19) | 1,434 |
| Fidelity Series Small Cap Opportunities Fund | 3,900 | 616 | 214 | 331 | 7 | 109 | 4,418 |
| Fidelity Series Stock Selector Large Cap Value Fund | 7,305 | 505 | 254 | -- | (6) | 518 | 8,068 |
| Fidelity Series Value Discovery Fund | 5,072 | 506 | 153 | -- | (1) | 305 | 5,729 |
| | $109,905 | $17,716 | $15,379 | $2,338 | $310 | $2,761 | $115,313 |
Amounts in the income column in the above table include any capital gain distributions from underlying funds, which are presented in the corresponding line-item in the Statement of Operations if applicable.
Investment Valuation
All investments are categorized as Level 1 under the Fair Value Hierarchy. The inputs or methodology used for valuing securities may not be an indication of the risk associated with investing in those securities. For more information on valuation inputs please refer to the Investment Valuation section in the accompanying Notes to Financial Statements.
See accompanying notes which are an integral part of the financial statements.
Fidelity Flex℠ Freedom 2060 Fund
Financial Statements
Statement of Assets and Liabilities
| | | September 30, 2018 (Unaudited) |
| Assets | | |
Investment in securities, at value — See accompanying schedule:
| | |
| Affiliated issuers (cost $109,213) | $115,313 | |
| Total Investment in Securities (cost $109,213) | | $115,313 |
| Receivable for investments sold | | 1,836 |
| Total assets | | 117,149 |
| Liabilities | | |
| Payable for investments purchased | $1,837 | |
| Total liabilities | | 1,837 |
| Net Assets | | $115,312 |
| Net Assets consist of: | | |
| Paid in capital | | $106,588 |
| Undistributed net investment income | | 622 |
| Accumulated undistributed net realized gain (loss) on investments | | 2,002 |
| Net unrealized appreciation (depreciation) on investments | | 6,100 |
| Net Assets, for 10,619 shares outstanding | | $115,312 |
| Net Asset Value, offering price and redemption price per share ($115,312 ÷ 10,619 shares) | | $10.86 |
See accompanying notes which are an integral part of the financial statements.
Statement of Operations
| | | Six months ended September 30, 2018 (Unaudited) |
| Investment Income | | |
| Dividends: | | |
| Affiliated issuers | | $626 |
| Expenses | | |
| Independent trustees' fees and expenses | $1 | |
| Total expenses | | 1 |
| Net investment income (loss) | | 625 |
| Realized and Unrealized Gain (Loss) | | |
| Net realized gain (loss) on: | | |
| Investment securities: | | |
| Affiliated issuers | 310 | |
| Capital gain distributions from underlying funds: | | |
| Affiliated issuers | 1,712 | |
| Total net realized gain (loss) | | 2,022 |
| Change in net unrealized appreciation (depreciation) on: | | |
| Investment securities: | | |
| Affiliated issuers | 2,761 | |
| Total change in net unrealized appreciation (depreciation) | | 2,761 |
| Net gain (loss) | | 4,783 |
| Net increase (decrease) in net assets resulting from operations | | $5,408 |
See accompanying notes which are an integral part of the financial statements.
Statement of Changes in Net Assets
| | Six months ended September 30, 2018 (Unaudited) | For the period
June 8, 2017 (commencement of operations) to March 31, 2018 |
| Increase (Decrease) in Net Assets | | |
| Operations | | |
| Net investment income (loss) | $625 | $1,740 |
| Net realized gain (loss) | 2,022 | 4,826 |
| Change in net unrealized appreciation (depreciation) | 2,761 | 3,339 |
| Net increase (decrease) in net assets resulting from operations | 5,408 | 9,905 |
| Distributions to shareholders from net investment income | (93) | (1,650) |
| Distributions to shareholders from net realized gain | (3,196) | (1,650) |
| Total distributions | (3,289) | (3,300) |
| Share transactions | | |
| Proceeds from sales of shares | – | 100,000 |
| Reinvestment of distributions | 3,288 | 3,300 |
| Net increase (decrease) in net assets resulting from share transactions | 3,288 | 103,300 |
| Total increase (decrease) in net assets | 5,407 | 109,905 |
| Net Assets | | |
| Beginning of period | 109,905 | – |
| End of period | $115,312 | $109,905 |
| Other Information | | |
| Undistributed net investment income end of period | $622 | $90 |
| Shares | | |
| Sold | – | 10,000 |
| Issued in reinvestment of distributions | 310 | 309 |
| Net increase (decrease) | 310 | 10,309 |
See accompanying notes which are an integral part of the financial statements.
Financial Highlights
Fidelity Flex Freedom 2060 Fund
| | Six months ended (Unaudited) September 30, | Years endedMarch 31, |
| | 2018 | 2018 A |
| Selected Per–Share Data | | |
| Net asset value, beginning of period | $10.66 | $10.00 |
| Income from Investment Operations | | |
| Net investment income (loss)B | .06 | .17 |
| Net realized and unrealized gain (loss) | .46 | .82 |
| Total from investment operations | .52 | .99 |
| Distributions from net investment income | (.01) | (.17) |
| Distributions from net realized gain | (.31) | (.17) |
| Total distributions | (.32) | (.33)C |
| Net asset value, end of period | $10.86 | $10.66 |
| Total ReturnD | 4.94% | 9.89% |
| Ratios to Average Net AssetsE,F | | |
| Expenses before reductions | - %G,H | - %G |
| Expenses net of fee waivers, if any | - %G,H | - %G |
| Expenses net of all reductions | - %G,H | - %G |
| Net investment income (loss) | 1.11%G | 2.00%G |
| Supplemental Data | | |
| Net assets, end of period (000 omitted) | $115 | $110 |
| Portfolio turnover rateE | 27%G | 13%G |
A For the period June 8, 2017 (commencement of operations) to March 31, 2018.
B Calculated based on average shares outstanding during the period.
C Total distributions of $.33 per share is comprised of distributions from net investment income of $.165 and distributions from net realized gain of $.165 per share.
D Total returns for periods of less than one year are not annualized.
E Amounts do not include the activity of the Underlying Funds.
F Expense ratios reflect operating expenses of the Fund. Expenses before reductions do not reflect amounts reimbursed by the investment adviser or reductions from expense offset arrangements and do not represent the amount paid by the Fund during periods when reimbursements or reductions occur. Expenses net of fee waivers reflect expenses after reimbursement by the investment adviser but prior to reductions from expense offset arrangements. Expenses net of all reductions represent the net expenses paid by the Fund but do not include expenses of the underlying funds in which the Fund invests.
G Annualized
H Amount represents less than .005%.
See accompanying notes which are an integral part of the financial statements.
Notes to Financial Statements (Unaudited)
For the period ended September 30, 2018
1. Organization.
Fidelity Flex Freedom Income Fund, Fidelity Flex Freedom 2005 Fund, Fidelity Flex Freedom 2010 Fund, Fidelity Flex Freedom 2015 Fund, Fidelity Flex Freedom 2020 Fund, Fidelity Flex Freedom 2025 Fund, Fidelity Flex Freedom 2030 Fund, Fidelity Flex Freedom 2035 Fund, Fidelity Flex Freedom 2040 Fund, Fidelity Freedom Flex 2045 Fund, Fidelity Freedom Flex 2050 Fund, Fidelity Freedom Flex 2055 Fund and Fidelity Freedom Flex 2060 Fund (the Funds) are funds of Fidelity Aberdeen Street Trust (the Trust). The Trust is registered under the Investment Company Act of 1940, as amended (the 1940 Act), as an open-end management investment company organized as a Delaware statutory trust. Each Fund is authorized to issue an unlimited number of shares. The Funds are available only to certain fee-based accounts offered by Fidelity. Share transactions on the Statement of Changes in Net Assets may contain exchanges between affiliated funds. The Funds invest primarily in a combination of other Fidelity equity, bond, and short-term funds (the Underlying Funds) managed by Fidelity Management & Research Company (FMR). Certain Underlying Funds incurred name changes since their most recent shareholder report. The names of the Underlying Funds are those in effect at period end.
2. Significant Accounting Policies.
Each Fund is an investment company and applies the accounting and reporting guidance of the Financial Accounting Standards Board (FASB) Accounting Standards Codification Topic 946 Financial Services – Investments Companies. The financial statements have been prepared in conformity with accounting principles generally accepted in the United States of America (GAAP), which require management to make certain estimates and assumptions at the date of the financial statements. Actual results could differ from those estimates. Subsequent events, if any, through the date that the financial statements were issued have been evaluated in the preparation of the financial statements. The following summarizes the significant accounting policies of the Funds:
Investment Valuation. Investments are valued as of 4:00 p.m. Eastern time on the last calendar day of the period. Each Fund categorizes the inputs to valuation techniques used to value its investments into a disclosure hierarchy consisting of three levels as shown below:
- Level 1 – quoted prices in active markets for identical investments
- Level 2 – other significant observable inputs (including quoted prices for similar investments, interest rates, prepayment speeds, etc.)
- Level 3 – unobservable inputs (including the Fund's own assumptions based on the best information available)
Valuation techniques used to value each Fund's investments by major category are as follows. Investments in the Underlying Funds are valued at their closing net asset value (NAV) each business day and are categorized as Level 1 in the hierarchy.
Investment Transactions and Income. For financial reporting purposes, the Funds' investment holdings and NAV include trades executed through the end of the last business day of the period. The NAV per share for processing shareholder transactions is calculated as of the close of business of the New York Stock Exchange (NYSE), normally 4:00 p.m. Eastern time and includes trades executed through the end of the prior business day. Gains and losses on securities sold are determined on the basis of identified cost. Income and capital gain distributions from the Underlying Funds, if any, are recorded on the ex-dividend date.
Expenses. Expenses directly attributable to a fund are charged to that fund. Expenses attributable to more than one fund are allocated among the respective funds on the basis of relative net assets or other appropriate methods. Expenses included in the accompanying financial statements reflect the expenses of each Fund and do not include any expenses associated with the Underlying Funds. Although not included in each Fund's expenses, each Fund indirectly bears its proportionate share of the Underlying Funds' expenses through the impact of these expenses on each Underlying Fund's NAV. Expense estimates are accrued in the period to which they relate and adjustments are made when actual amounts are known.
Income Tax Information and Distributions to Shareholders. Each year, each Fund intends to qualify as a regulated investment company under Subchapter M of the Internal Revenue Code, including distributing substantially all of its taxable income and realized gains. As a result, no provision for U.S. Federal income taxes is required. Each Fund files a U.S. federal tax return, in addition to state and local tax returns as required. Each Fund's federal income tax returns are subject to examination by the Internal Revenue Service (IRS) for a period of three fiscal years after they are filed. State and local tax returns may be subject to examination for an additional fiscal year depending on the jurisdiction.
Distributions are declared and recorded on the ex-dividend date. Income and capital gain distributions are determined in accordance with income tax regulations, which may differ from GAAP.
Capital accounts within the financial statements are adjusted for permanent book-tax differences. These adjustments have no impact on net assets or the results of operations. Capital accounts are not adjusted for temporary book-tax differences which will reverse in a subsequent period.
Book-tax differences are primarily due to the short-term gain distributions from the Underlying Funds and losses deferred due to wash sales.
As of period end, the cost and unrealized appreciation (depreciation) in securities, and derivatives if applicable, for federal income tax purposes were as follows for each Fund:
| | Tax cost | Gross unrealized appreciation | Gross unrealized depreciation | Net unrealized appreciation (depreciation) |
| Fidelity Flex Freedom Income Fund | $105,137 | $1,016 | $(1,871) | $(855) |
| Fidelity Flex Freedom 2005 Fund | 105,898 | 1,668 | (1,757) | (89) |
| Fidelity Flex Freedom 2010 Fund | 106,502 | 2,356 | (1,631) | 725 |
| Fidelity Flex Freedom 2015 Fund | 107,092 | 3,062 | (1,480) | 1,582 |
| Fidelity Flex Freedom 2020 Fund | 107,466 | 3,639 | (1,360) | 2,279 |
| Fidelity Flex Freedom 2025 Fund | 107,821 | 4,153 | (1,226) | 2,927 |
| Fidelity Flex Freedom 2030 Fund | 108,717 | 5,149 | (1,017) | 4,132 |
| Fidelity Flex Freedom 2035 Fund | 109,194 | 6,210 | (512) | 5,698 |
| Fidelity Flex Freedom 2040 Fund | 109,288 | 6,460 | (449) | 6,011 |
| Fidelity Flex Freedom 2045 Fund | 109,293 | 6,471 | (446) | 6,025 |
| Fidelity Flex Freedom 2050 Fund | 109,276 | 6,469 | (444) | 6,025 |
| Fidelity Flex Freedom 2055 Fund | 109,291 | 6,473 | (445) | 6,028 |
| Fidelity Flex Freedom 2060 Fund | 109,266 | 6,486 | (439) | 6,047 |
3. Purchases and Redemptions of Underlying Fund Shares.
Purchases and redemptions of the Underlying Fund shares are noted in the table below.
| | Purchases ($) | Redemptions ($) |
| Fidelity Flex Freedom Income Fund | 20,142 | 18,733 |
| Fidelity Flex Freedom 2005 Fund | 19,139 | 17,611 |
| Fidelity Flex Freedom 2010 Fund | 18,274 | 16,624 |
| Fidelity Flex Freedom 2015 Fund | 17,648 | 15,873 |
| Fidelity Flex Freedom 2020 Fund | 17,091 | 15,212 |
| Fidelity Flex Freedom 2025 Fund | 16,857 | 14,883 |
| Fidelity Flex Freedom 2030 Fund | 15,571 | 13,426 |
| Fidelity Flex Freedom 2035 Fund | 16,950 | 14,655 |
| Fidelity Flex Freedom 2040 Fund | 17,728 | 15,391 |
| Fidelity Flex Freedom 2045 Fund | 17,934 | 15,597 |
| Fidelity Flex Freedom 2050 Fund | 17,798 | 15,461 |
| Fidelity Flex Freedom 2055 Fund | 18,086 | 15,750 |
| Fidelity Flex Freedom 2060 Fund | 17,716 | 15,379 |
4. Fees and Other Transactions with Affiliates.
Management Fee. FMR Co., Inc. (the investment adviser), an affiliate of FMR, and its affiliates provide the Funds with investment management related services and the Funds do not pay any fees for these services. Under the management contract, the investment adviser or an affiliate pays all other expenses of the Funds, excluding fees and expenses of the independent Trustees, and certain miscellaneous expenses such as proxy and shareholder meeting expenses.
Other Transactions. The investment adviser has entered into an administration agreement with FMR under which FMR provides management and administrative services (other than investment advisory services) necessary for the operation of each Fund. Pursuant to this agreement, FMR pays all expenses of each Fund, excluding compensation of the independent Trustees and certain miscellaneous expenses such as proxy and shareholder meeting expenses. FMR also contracts with other Fidelity companies to perform the services necessary for the operation of each Fund.
5. Other.
The Funds' organizational documents provide former and current trustees and officers with a limited indemnification against liabilities arising in connection with the performance of their duties to the Funds. In the normal course of business, the Funds may also enter into contracts that provide general indemnifications. The Funds' maximum exposure under these arrangements is unknown as this would be dependent on future claims that may be made against the Funds. The risk of material loss from such claims is considered remote.
At the end of the period, the investment adviser or its affiliates were owners of record of more than 10% of the outstanding shares of the following Funds:
| | Affiliated % |
| Fidelity Flex Freedom Income Fund | 100 |
| Fidelity Flex Freedom 2005 Fund | 100 |
| Fidelity Flex Freedom 2010 Fund | 100 |
| Fidelity Flex Freedom 2015 Fund | 100 |
| Fidelity Flex Freedom 2020 Fund | 100 |
| Fidelity Flex Freedom 2025 Fund | 100 |
| Fidelity Flex Freedom 2030 Fund | 100 |
| Fidelity Flex Freedom 2035 Fund | 100 |
| Fidelity Flex Freedom 2040 Fund | 100 |
| Fidelity Flex Freedom 2045 Fund | 100 |
| Fidelity Flex Freedom 2050 Fund | 100 |
| Fidelity Flex Freedom 2055 Fund | 100 |
| Fidelity Flex Freedom 2060 Fund | 100 |
Shareholder Expense Example
As a shareholder of a Fund, you incur two types of costs: (1) transaction costs and (2) ongoing costs and other Fund expenses. This Example is intended to help you understand your ongoing costs (in dollars) of investing in the Funds and to compare these costs with the ongoing costs of investing in other mutual funds.
The Example is based on an investment of $1,000 invested at the beginning of the period and held for the entire period (April 1, 2018 to September 30, 2018).
Actual Expenses
The first line of the accompanying table for each fund provides information about actual account values and actual expenses. You may use the information in this line, together with the amount you invested, to estimate the expenses that you paid over the period. Simply divide your account value by $1,000.00 (for example, an $8,600 account value divided by $1,000.00 = 8.6), then multiply the result by the number in the first line for a fund under the heading entitled "Expenses Paid During Period" to estimate the expenses you paid on your account during this period.
Hypothetical Example for Comparison Purposes
The second line of the accompanying table for each fund provides information about hypothetical account values and hypothetical expenses based on a fund's actual expense ratio and an assumed rate of return of 5% per year before expenses, which is not the Fund's actual return. The hypothetical account values and expenses may not be used to estimate the actual ending account balance or expenses you paid for the period. You may use this information to compare the ongoing costs of investing in the Fund and other funds. To do so, compare this 5% hypothetical example with the 5% hypothetical examples that appear in the shareholder reports of the other funds.
Please note that the expenses shown in the table are meant to highlight your ongoing costs only and do not reflect any transaction costs. Therefore, the second line of the table is useful in comparing ongoing costs only, and will not help you determine the relative total costs of owning different funds.
| | Annualized Expense Ratio-A,B | Beginning
Account Value
April 1, 2018 | Ending
Account Value
September 30, 2018 | Expenses Paid
During Period-
April 1, 2018
to September 30, 2018C,D |
| Fidelity Flex Freedom Income Fund | - % | | | |
| Actual | | $1,000.00 | $1,010.60 | $- |
| Hypothetical-E | | $1,000.00 | $1,025.07 | $- |
| Fidelity Flex Freedom 2005 Fund | - % | | | |
| Actual | | $1,000.00 | $1,014.30 | $- |
| Hypothetical-E | | $1,000.00 | $1,025.07 | $- |
| Fidelity Flex Freedom 2010 Fund | - % | | | |
| Actual | | $1,000.00 | $1,018.90 | $- |
| Hypothetical-E | | $1,000.00 | $1,025.07 | $- |
| Fidelity Flex Freedom 2015 Fund | - % | | | |
| Actual | | $1,000.00 | $1,024.20 | $- |
| Hypothetical-E | | $1,000.00 | $1,025.07 | $- |
| Fidelity Flex Freedom 2020 Fund | - % | | | |
| Actual | | $1,000.00 | $1,028.60 | $- |
| Hypothetical-E | | $1,000.00 | $1,025.07 | $- |
| Fidelity Flex Freedom 2025 Fund | - % | | | |
| Actual | | $1,000.00 | $1,033.00 | $- |
| Hypothetical-E | | $1,000.00 | $1,025.07 | $- |
| Fidelity Flex Freedom 2030 Fund | - % | | | |
| Actual | | $1,000.00 | $1,039.00 | $- |
| Hypothetical-E | | $1,000.00 | $1,025.07 | $- |
| Fidelity Flex Freedom 2035 Fund | - % | | | |
| Actual | | $1,000.00 | $1,046.60 | $- |
| Hypothetical-E | | $1,000.00 | $1,025.07 | $- |
| Fidelity Flex Freedom 2040 Fund | - % | | | |
| Actual | | $1,000.00 | $1,049.70 | $- |
| Hypothetical-E | | $1,000.00 | $1,025.07 | $- |
| Fidelity Flex Freedom 2045 Fund | - % | | | |
| Actual | | $1,000.00 | $1,049.30 | $- |
| Hypothetical-E | | $1,000.00 | $1,025.07 | $- |
| Fidelity Flex Freedom 2050 Fund | - % | | | |
| Actual | | $1,000.00 | $1,049.60 | $- |
| Hypothetical-E | | $1,000.00 | $1,025.07 | $- |
| Fidelity Flex Freedom 2055 Fund | - % | | | |
| Actual | | $1,000.00 | $1,049.40 | $- |
| Hypothetical-E | | $1,000.00 | $1,025.07 | $- |
| Fidelity Flex Freedom 2060 Fund | - % | | | |
| Actual | | $1,000.00 | $1,049.40 | $- |
| Hypothetical-E | | $1,000.00 | $1,025.07 | $- |
A Annualized expense ratio reflects expenses net of applicable fee waivers.
B Amounts represent less than .005%.
C Expenses are equal to each Class' annualized expense ratio, multiplied by the average account value over the period, multiplied by 183/365 (to reflect the one-half year period).
D Amounts represent less than $.005
E 5% return per year before expenses
Board Approval of Investment Advisory Contracts and Management Fees
Fidelity Flex Freedom Funds
Each year, the Board of Trustees, including the Independent Trustees (together, the Board), votes on the renewal of the management contract (the Advisory Contract) with FMR Co., Inc. (FMRC), an affiliate of Fidelity Management & Research Company (FMR), for each fund. The Board, assisted by the advice of fund counsel and Independent Trustees' counsel, requests and considers a broad range of information relevant to the renewal of the Advisory Contracts throughout the year.
The Board meets regularly and, at each of its meetings, covers an extensive agenda of topics and materials and considers factors that are relevant to its annual consideration of the renewal of each fund's Advisory Contract, including the services and support provided to each fund and its shareholders. The Board has established four standing committees (Committees) — Operations, Audit, Fair Valuation, and Governance and Nominating — each composed of and chaired by Independent Trustees with varying backgrounds, to which the Board has assigned specific subject matter responsibilities in order to enhance effective decision-making by the Board. The Operations Committee, of which all of the Independent Trustees are members, meets regularly throughout the year and considers, among other matters, information specifically related to the annual consideration of the renewal of each fund's Advisory Contract. The Board, acting directly and through its Committees, requests and receives information concerning the annual consideration of the renewal of each fund's Advisory Contract. The Board also meets as needed to review matters specifically related to the Board's annual consideration of the renewal of the Advisory Contracts. Members of the Board may also meet with trustees of other Fidelity funds through joint ad hoc committees to discuss certain matters relevant to all of the Fidelity funds.
At its September 2018 meeting, the Board unanimously determined to renew each fund's Advisory Contract. In considering whether to renew the Advisory Contract for each fund, the Board considered all factors it believed relevant and reached a determination, with the assistance of fund counsel and Independent Trustees' counsel and through the exercise of its business judgment, that the renewal of the Advisory Contract was in the best interests of each fund and its shareholders and the fact that no fee is payable under the management contract was fair and reasonable.
Nature, Extent, and Quality of Services Provided. The Board considered Fidelity's staffing as it relates to the funds, including the backgrounds of investment personnel of FMRC, and also considered the funds' investment objectives, strategies, and related investment philosophies. The Independent Trustees also had discussions with senior management of Fidelity's investment operations and investment groups with responsibility for the Series Funds. The Board considered the structure of the investment personnel compensation program and whether this structure provides appropriate incentives to act in the best interests of each fund. Additionally, the Board considered the portfolio managers' investments, if any, in the funds that they manage.
Resources Dedicated to Investment Management and Support Services. The Board reviewed the general qualifications and capabilities of Fidelity's investment staff, including its size, education, experience, and resources, as well as Fidelity's approach to recruiting, managing, and compensating investment personnel. The Board noted that Fidelity has continued to increase the resources devoted to non-U.S. offices, including expansion of Fidelity's global investment organization. The Board also noted that Fidelity's analysts have extensive resources, tools and capabilities that allow them to conduct sophisticated quantitative and fundamental analysis, as well as credit analysis of issuers, counterparties and guarantors. Further, the Board considered that Fidelity's investment professionals have sufficient access to global information and data so as to provide competitive investment results over time, and that those professionals also have access to sophisticated tools that permit them to assess portfolio construction and risk and performance attribution characteristics continuously, as well as to transmit new information and research conclusions rapidly around the world. Additionally, in its deliberations, the Board considered Fidelity's risk management, compliance, and technology and operations capabilities and resources, which are integral parts of the investment management process.
Shareholder and Administrative Services. The Board considered (i) the nature, extent, quality, and cost of advisory, administrative, and shareholder services performed by the Fidelity under the Advisory Contract and under separate agreements covering transfer agency and pricing and bookkeeping for each fund; (ii) the nature and extent of the supervision of third party service providers, principally custodians, subcustodians, and pricing vendors; and (iii) the resources devoted to, and the record of compliance with, each fund's compliance policies and procedures.
The Board noted that the growth of fund assets over time across the complex allows Fidelity to reinvest in the development of services designed to enhance the value and convenience of the Fidelity funds as investment vehicles. These services include 24-hour access to account information and market information through telephone representatives and over the Internet, investor education materials and asset allocation tools, and the expanded availability of Fidelity Investor Centers.
Investment in a Large Fund Family. The Board considered the benefits to shareholders of investing in a Fidelity fund, including the benefits of investing in a fund that is part of a large family of funds offering a variety of investment disciplines and providing a large variety of mutual fund investor services. The Board noted that Fidelity had taken, or had made recommendations that resulted in the Fidelity funds taking, a number of actions over the previous year that benefited particular funds, including: (i) continuing to dedicate additional resources to Fidelity's investment research process, which includes meetings with management of issuers of securities in which the funds invest, and to the support of the senior management team that oversees asset management; (ii) continuing efforts to enhance Fidelity's global research capabilities; (iii) launching new funds and making other enhancements to meet client needs; (iv) launching new share classes of existing funds; (v) eliminating purchase minimums and broadening eligibility requirements for certain funds and share classes; (vi) reducing management fees and total expenses for certain growth equity funds and index funds; (vii) lowering expense caps for certain existing funds and classes, and converting certain voluntary expense caps to contractual caps, to reduce expenses borne by shareholders; (viii) eliminating short-term redemption fees for funds that had such fees; (ix) rationalizing product lines and gaining increased efficiencies from fund mergers and share class consolidations; (x) continuing to develop, acquire and implement systems and technology to improve services to the funds and shareholders, strengthen information security, and increase efficiency; and (xi) continuing to implement enhancements to further strengthen Fidelity's product line to increase investors' probability of success in achieving their investment goals, including retirement income goals.
Investment Performance. The Board considered whether each fund has operated in accordance with its investment objective, as well as its record of compliance with its investment restrictions. As each fund recently commenced operations, the Board did not believe that it was appropriate to assign significant weight to its limited investment performance.
Based on its review, the Board concluded that the nature, extent, and quality of services provided to each fund under the Advisory Contracts should continue to benefit the shareholders of each fund.
Competitiveness of Management Fee and Total Expense Ratio. The Board noted that each fund is available exclusively to certain Fidelity fee-based programs. The Board considered that each fund does not pay FMRC a management fee for investment advisory services, but that FMRC is indirectly compensated for its services out of the program fees. The Board also noted that FMRC or an affiliate undertakes to pay all operating expenses of each fund, except Independent Trustee fees and expenses, proxy and shareholder meeting expenses, interest, taxes, brokerage expenses, and extraordinary expenses (such as litigation expenses).
Based on its review, the Board considered that each fund does not pay a management fee and concluded that the total expense ratio of each class of each fund was reasonable in light of the services that the fund and its shareholders receive and the other factors considered.
Costs of the Services and Profitability. The Board considered the level of Fidelity's profits in respect of all the Fidelity funds.
PricewaterhouseCoopers LLP (PwC), auditor to Fidelity and certain Fidelity funds, has been engaged annually by the Board as part of the Board's assessment of Fidelity's profitability analysis. PwC's engagement includes the review and assessment of the methodologies used by Fidelity in determining the revenues and expenses attributable to Fidelity's mutual fund business, and completion of agreed-upon procedures in respect of the mathematical accuracy of the fund profitability information and its conformity to established allocation methodologies. After considering PwC's reports issued under the engagement and information provided by Fidelity, the Board concluded that while other allocation methods may also be reasonable, Fidelity's profitability methodologies are reasonable in all material respects.
The Board also reviewed Fidelity's non-fund businesses and potential indirect benefits such businesses may have received as a result of their association with Fidelity's mutual fund business (i.e., fall-out benefits) as well as cases where Fidelity's affiliates may benefit from the funds' business. The Board noted that changes to fall-out benefits year-over-year reflect business developments at Fidelity's various businesses.
The Board concluded that the costs of the services provided by and the profits realized by Fidelity in connection with the operation of the funds were not relevant to the renewal of the Advisory Contracts because the funds pay no advisory fees and FMRC or an affiliate bears all expenses of the funds, with limited exceptions.
Economies of Scale. The Board concluded that because the funds pay no advisory fees and FMR bears all expenses of the funds with certain limited exceptions, the realization of economies of scale by the funds was not a material factor in the Board's decision to renew the funds' Advisory Contracts.
Additional Information Requested by the Board. In order to develop fully the factual basis for consideration of the Fidelity funds' advisory contracts, the Board requested and received additional information on certain topics, including: (i) Fidelity's fund profitability methodology, profitability trends for certain funds, the allocation of various costs to different funds, and the impact of certain factors on fund profitability results; (ii) portfolio manager changes that have occurred during the past year and the amount of the investment that each portfolio manager has made in the Fidelity fund(s) that he or she manages; (iii) Fidelity's compensation structure for portfolio managers, research analysts, and other key personnel, including its effects on fund profitability, the rationale for the compensation structure, and the extent to which current market conditions have affected retention and recruitment; (iv) the arrangements with and compensation paid to certain fund sub-advisers on behalf of the Fidelity funds and the treatment of such compensation within Fidelity's fund profitability methodology; (v) the terms of Fidelity's voluntary expense limitation agreements; (vi) the methodology with respect to competitive fund data and peer group classifications; (vii) Fidelity's transfer agent fee, expense, and service structures for different funds and classes relative to competitive trends, and the impact of the increased use of omnibus accounts; (viii) new developments in the retail and institutional marketplaces and the competitive positioning of the funds relative to other investment products and services; (ix) the impact of recent changes to the money market fund landscape, including the full implementation of money market fund reform and rising interest rates, on Fidelity's money market funds; (x) the funds' share class structures and distribution channels; and (xi) explanations regarding the relative total expense ratios of certain funds and classes, total expense competitive trends and methodologies for total expense competitive comparisons, and actions that might be taken by Fidelity to reduce total expense ratios for certain classes. In addition, the Board considered its discussions with Fidelity throughout the year regarding enhanced information security initiatives and the funds' fair valuation policies.
Based on its evaluation of all of the conclusions noted above, and after considering all factors it believed relevant, the Board concluded that the advisory fee arrangements are fair and reasonable, and that each fund's Advisory Contract should be renewed.
XFC-SANN-1118
1.9884227.101
Fidelity Advisor Freedom® Funds - Income, 2005, 2010, 2015, 2020, 2025, 2030, 2035, 2040, 2045, 2050, 2055, 2060 - Class Z6
Semi-Annual Report September 30, 2018 |
|
Contents
To view a fund's proxy voting guidelines and proxy voting record for the 12-month period ended June 30, visit http://www.fidelity.com/proxyvotingresults or visit the Securities and Exchange Commission's (SEC) web site at http://www.sec.gov.
You may also call 1-877-208-0098 to request a free copy of the proxy voting guidelines.
Standard & Poor's, S&P and S&P 500 are registered service marks of The McGraw-Hill Companies, Inc. and have been licensed for use by Fidelity Distributors Corporation.
Other third-party marks appearing herein are the property of their respective owners.
All other marks appearing herein are registered or unregistered trademarks or service marks of FMR LLC or an affiliated company. © 2018 FMR LLC. All rights reserved.
This report and the financial statements contained herein are submitted for the general information of the shareholders of the Funds. This report is not authorized for distribution to prospective investors in the Funds unless preceded or accompanied by an effective prospectus.
A fund files its complete schedule of portfolio holdings with the SEC for the first and third quarters of each fiscal year on Form N-Q. Forms N-Q are available on the SEC’s web site at http://www.sec.gov. A fund's Forms N-Q may be reviewed and copied at the SEC’s Public Reference Room in Washington, DC. Information regarding the operation of the SEC's Public Reference Room may be obtained by calling 1-800-SEC-0330.
For a complete list of a fund's portfolio holdings, view the most recent holdings listing, semiannual report, or annual report on Fidelity's web site at http://www.fidelity.com, http://www.institutional.fidelity.com, or http://www.401k.com, as applicable.
NOT FDIC INSURED •MAY LOSE VALUE •NO BANK GUARANTEE
Neither the Funds nor Fidelity Distributors Corporation is a bank.
Note to shareholders:
At its May 2018 meeting, the Board of Trustees approved incremental updates to the strategic asset allocation (i.e., glide path) of Fidelity Advisor Freedom Funds, adding U.S. Treasury Inflation-Protected Securities and long-term U.S. Treasury bonds as fixed exposures in the Funds’ bond allocations, and slightly reducing the equity and short-term debt allocations for shorter-dated Funds. These updates are expected to be fully implemented by the end of 2018.
Fidelity Advisor Freedom® Income Fund
Investment Summary (Unaudited)
The information in the following tables is based on the direct investments of the Fund.
Top Holdings as of September 30, 2018
| | % of fund's net assets |
| Fidelity Series Investment Grade Bond Fund | 37.0 |
| Fidelity Series Government Money Market Fund 2.12% | 18.5 |
| Fidelity Series Inflation-Protected Bond Index Fund | 12.8 |
| Fidelity Series Short-Term Credit Fund | 4.7 |
| Fidelity Series Long-Term Treasury Bond Index Fund | 4.4 |
| Fidelity Series Emerging Markets Opportunities Fund | 2.7 |
| Fidelity Series International Growth Fund | 2.2 |
| Fidelity Series International Value Fund | 2.2 |
| Fidelity Series Commodity Strategy Fund | 2.0 |
| Fidelity Series Large Cap Stock Fund | 2.0 |
| | 88.5 |
Asset Allocation (% of fund's net assets)
| Period end |
| | Domestic Equity Funds | 11.3% |
| | International Equity Funds | 8.2% |
| | Bond Funds | 57.1% |
| | Short-Term Funds | 23.3% |
| | Short-Term Investments | 0.1% |

Domestic Equity Funds category includes Fidelity Series Commodity Strategy Fund which invests in commodity-related investments.
Fidelity Advisor Freedom® Income Fund
Schedule of Investments September 30, 2018 (Unaudited)
Showing Percentage of Net Assets
| U.S. Treasury Obligations - 0.1% | | | |
| | | Principal Amount | Value |
| U.S. Treasury Bills, yield at date of purchase 1.97% to 2.09% 11/1/18 to 11/29/18 (a) | | | |
| (Cost $139,597) | | 140,000 | 139,587 |
| | | Shares | Value |
|
| Domestic Equity Funds - 11.3% | | | |
| Fidelity Advisor Series Equity Growth Fund (b) | | 165,767 | $2,562,760 |
| Fidelity Advisor Series Growth Opportunities Fund (b) | | 102,497 | 1,705,553 |
| Fidelity Advisor Series Small Cap Fund (b) | | 95,773 | 1,203,867 |
| Fidelity Series All-Sector Equity Fund (b) | | 76,141 | 1,036,276 |
| Fidelity Series Commodity Strategy Fund (b) | | 913,217 | 4,566,084 |
| Fidelity Series Large Cap Stock Fund (b) | | 279,220 | 4,447,967 |
| Fidelity Series Large Cap Value Index Fund (b) | | 36,247 | 478,461 |
| Fidelity Series Opportunistic Insights Fund (b) | | 119,930 | 2,380,602 |
| Fidelity Series Small Cap Opportunities Fund (b) | | 103,334 | 1,517,971 |
| Fidelity Series Stock Selector Large Cap Value Fund (b) | | 217,146 | 2,870,664 |
| Fidelity Series Value Discovery Fund (b) | | 206,877 | 2,832,143 |
| TOTAL DOMESTIC EQUITY FUNDS | | | |
| (Cost $19,783,979) | | | 25,602,348 |
|
| International Equity Funds - 8.2% | | | |
| Fidelity Series Canada Fund (b) | | 44,194 | 477,736 |
| Fidelity Series Emerging Markets Fund (b) | | 81,074 | 785,606 |
| Fidelity Series Emerging Markets Opportunities Fund (b) | | 319,827 | 6,137,471 |
| Fidelity Series International Growth Fund (b) | | 309,625 | 5,077,853 |
| Fidelity Series International Small Cap Fund (b) | | 64,191 | 1,149,021 |
| Fidelity Series International Value Fund (b) | | 479,684 | 5,046,280 |
| TOTAL INTERNATIONAL EQUITY FUNDS | | | |
| (Cost $13,718,992) | | | 18,673,967 |
|
| Bond Funds - 57.1% | | | |
| Fidelity Series Emerging Markets Debt Fund (b) | | 177,507 | 1,691,644 |
| Fidelity Series Floating Rate High Income Fund (b) | | 60,206 | 573,160 |
| Fidelity Series High Income Fund (b) | | 313,609 | 3,013,780 |
| Fidelity Series Inflation-Protected Bond Index Fund (b) | | 2,997,990 | 29,110,482 |
| Fidelity Series International Credit Fund (b) | | 11,350 | 111,566 |
| Fidelity Series Investment Grade Bond Fund (b) | | 7,704,272 | 83,899,517 |
| Fidelity Series Long-Term Treasury Bond Index Fund (b) | | 1,219,899 | 10,051,966 |
| Fidelity Series Real Estate Income Fund (b) | | 102,467 | 1,104,594 |
| TOTAL BOND FUNDS | | | |
| (Cost $130,353,290) | | | 129,556,709 |
|
| Short-Term Funds - 23.3% | | | |
| Fidelity Cash Central Fund, 2.11% (c) | | 271,895 | 271,950 |
| Fidelity Series Government Money Market Fund 2.12% (b)(d) | | 41,955,747 | 41,955,747 |
| Fidelity Series Short-Term Credit Fund (b) | | 1,084,441 | 10,692,591 |
| TOTAL SHORT-TERM FUNDS | | | |
| (Cost $53,008,512) | | | 52,920,288 |
| TOTAL INVESTMENT IN SECURITIES - 100.0% | | | |
| (Cost $217,004,370) | | | 226,892,899 |
| NET OTHER ASSETS (LIABILITIES) - 0.0% | | | (110,233) |
| NET ASSETS - 100% | | | $226,782,666 |
| Futures Contracts | | | | | |
| | Number of contracts | Expiration Date | Notional Amount | Value | Unrealized Appreciation/(Depreciation) |
| Purchased | | | | | |
| Equity Index Contracts | | | | | |
| ICE E-mini MSCI EAFE Index Contracts (United States) | 4 | Dec. 2018 | $395,100 | $378 | $378 |
| ICE E-mini MSCI Emerging Markets Index Contracts (United States) | 19 | Dec. 2018 | 997,215 | 19,053 | 19,053 |
| | | | | | 19,431 |
| Sold | | | | | |
| Equity Index Contracts | | | | | |
| CME E-mini S&P 500 Index Contracts (United States) | 6 | Dec. 2018 | 875,700 | (232) | (232) |
| TOTAL FUTURES CONTRACTS | | | | | $19,199 |
The notional amount of futures purchased as a percentage of Net Assets is 0.6%
The notional amount of futures sold as a percentage of Net Assets is 0.4%
Legend
(a) Security or a portion of the security was pledged to cover margin requirements for futures contracts. At period end, the value of securities pledged amounted to $119,656.
(b) Affiliated Fund
(c) Affiliated fund that is generally available only to investment companies and other accounts managed by Fidelity Investments. The rate quoted is the annualized seven-day yield of the fund at period end. A complete unaudited listing of the fund's holdings as of its most recent quarter end is available upon request. In addition, each Fidelity Central Fund's financial statements are available on the SEC's website or upon request.
(d) The rate quoted is the annualized seven-day yield of the fund at period end.
Affiliated Central Funds
Information regarding fiscal year to date income earned by the Fund from investments in Fidelity Central Funds is as follows:
| Fund | Income earned |
| Fidelity Cash Central Fund | $1,148 |
| Total | $1,148 |
Amounts in the income column in the above table include any capital gain distributions from underlying funds, which are presented in the corresponding line-item in the Statement of Operations if applicable.
Affiliated Underlying Funds
Fiscal year to date information regarding the Fund's investments in affiliated Underlying Funds, excluding any Money Market Central Funds, is presented below. Exchanges between classes of the same affiliated Underlying Funds may occur.
| Affiliate | Value, beginning of period | Purchases | Sales Proceeds | Dividend Income | Realized Gain (loss) | Change in Unrealized appreciation (depreciation) | Value, end of period |
| Fidelity Advisor Series Equity Growth Fund | $2,986,272 | $404,065 | $1,243,424 | $ - | $221,129 | $194,718 | $2,562,760 |
| Fidelity Advisor Series Equity Value Fund | 3,441,952 | 554,341 | 1,263,738 | 91,665 | 155,363 | (651,254) | - |
| Fidelity Advisor Series Growth & Income Fund | 5,267,197 | 1,126,410 | 2,094,596 | 408,911 | 147,730 | (1,111,601) | - |
| Fidelity Advisor Series Growth Opportunities Fund | 1,963,092 | 267,804 | 1,013,805 | - | 264,099 | 224,363 | 1,705,553 |
| Fidelity Advisor Series Opportunistic Insights Fund | 2,809,288 | 550,119 | 1,177,658 | 174,096 | 310,239 | (1,149,788) | - |
| Fidelity Advisor Series Small Cap Fund | 1,497,643 | 198,788 | 582,975 | - | 73,075 | 17,336 | 1,203,867 |
| Fidelity Advisor Series Stock Selector Large Cap Value Fund | 3,474,257 | 698,024 | 1,284,824 | 232,137 | 163,270 | (660,926) | - |
| Fidelity Series 100 Index Fund | 1,480,375 | - | 1,552,285 | - | 970,147 | (898,237) | - |
| Fidelity Series All-Sector Equity Fund | 2,050,720 | 273,716 | 1,507,380 | - | 341,462 | (122,242) | 1,036,276 |
| Fidelity Series Canada Fund | 536,118 | 70,669 | 162,912 | - | 2,657 | 31,204 | 477,736 |
| Fidelity Series Commodity Strategy Fund | 4,537,656 | 1,195,010 | 793,076 | 274,339 | (216,245) | (157,261) | 4,566,084 |
| Fidelity Series Emerging Markets Debt Fund | 1,670,287 | 217,522 | 103,012 | 50,757 | (2,133) | (91,020) | 1,691,644 |
| Fidelity Series Emerging Markets Fund | - | 787,669 | - | - | - | (2,063) | 785,606 |
| Fidelity Series Emerging Markets Opportunities Fund | 6,576,903 | 944,745 | 542,730 | - | (12,516) | (828,931) | 6,137,471 |
| Fidelity Series Floating Rate High Income Fund | 531,740 | 83,617 | 42,926 | 14,898 | (28) | 757 | 573,160 |
| Fidelity Series Government Money Market Fund 2.12% | 49,380,363 | 9,928,070 | 17,352,686 | 457,077 | - | - | 41,955,747 |
| Fidelity Series High Income Fund | 3,122,185 | 448,693 | 584,008 | 87,348 | (17,625) | 44,535 | 3,013,780 |
| Fidelity Series Inflation-Protected Bond Index Fund | 8,056,431 | 22,154,849 | 1,002,523 | 27,690 | (4,949) | (93,326) | 29,110,482 |
| Fidelity Series International Credit Fund | 111,314 | 1,372 | - | 1,372 | - | (1,120) | 111,566 |
| Fidelity Series International Growth Fund | 5,569,432 | 1,027,847 | 1,593,116 | - | 226,534 | (152,844) | 5,077,853 |
| Fidelity Series International Small Cap Fund | 1,385,201 | 200,768 | 383,353 | - | 36,940 | (90,535) | 1,149,021 |
| Fidelity Series International Value Fund | 5,462,228 | 898,069 | 1,273,777 | - | 43,620 | (83,860) | 5,046,280 |
| Fidelity Series Investment Grade Bond Fund | 81,183,581 | 11,575,978 | 7,892,375 | 1,194,751 | (19,148) | (948,519) | 83,899,517 |
| Fidelity Series Large Cap Stock Fund | - | 2,067 | 14,093 | - | (129) | 1,124,982 | 4,447,967 |
| Fidelity Series Large Cap Value Index Fund | 585,207 | 77,945 | 224,470 | - | 32,616 | 7,163 | 478,461 |
| Fidelity Series Long-Term Treasury Bond Index Fund | 4,509,835 | 7,231,307 | 1,370,904 | 85,312 | (44,834) | (273,438) | 10,051,966 |
| Fidelity Series Opportunistic Insights Fund | - | 1,142 | 7,550 | - | (9) | 1,044,819 | 2,380,602 |
| Fidelity Series Real Estate Equity Fund | 358,281 | 5,202 | 378,004 | 4,736 | 63,966 | (49,445) | - |
| Fidelity Series Real Estate Income Fund | 1,049,918 | 174,933 | 125,561 | 46,150 | (430) | 5,734 | 1,104,594 |
| Fidelity Series Short-Term Credit Fund | 12,143,757 | 1,793,460 | 3,245,178 | 142,729 | (22,892) | 23,444 | 10,692,591 |
| Fidelity Series Small Cap Opportunities Fund | 1,815,589 | 361,462 | 756,318 | 117,711 | 242,995 | (145,757) | 1,517,971 |
| Fidelity Series Stock Selector Large Cap Value Fund | - | 2,693 | 13,909 | - | (156) | 492,235 | 2,870,664 |
| Fidelity Series Value Discovery Fund | - | 1,335 | 9,060 | - | (88) | 603,292 | 2,832,143 |
| | $213,556,822 | $63,259,691 | $49,592,226 | $3,411,679 | $2,954,660 | $(3,697,585) | $226,481,362 |
Amounts in the income column in the above table include any capital gain distributions from underlying funds, which are presented in the corresponding line-item in the Statement of Operations if applicable.
Investment Valuation
The following is a summary of the inputs used, as of September 30, 2018, involving the Fund's assets and liabilities carried at fair value. The inputs or methodology used for valuing securities may not be an indication of the risk associated with investing in those securities. For more information on valuation inputs, and their aggregation into the levels used below, please refer to the Investment Valuation section in the accompanying Notes to Financial Statements.
| | Valuation Inputs at Reporting Date: |
| Description | Total | Level 1 | Level 2 | Level 3 |
| Investments in Securities: | | | | |
| Other Short-Term Investments | $139,587 | $-- | $139,587 | $-- |
| Domestic Equity Funds | 25,602,348 | 25,602,348 | -- | -- |
| International Equity Funds | 18,673,967 | 18,673,967 | -- | -- |
| Bond Funds | 129,556,709 | 129,556,709 | -- | -- |
| Short-Term Funds | 52,920,288 | 52,920,288 | -- | -- |
| Total Investments in Securities: | $226,892,899 | $226,753,312 | $139,587 | $-- |
| Derivative Instruments: | | | | |
| Assets | | | | |
| Futures Contracts | $19,431 | $19,431 | $-- | $-- |
| Total Assets | $19,431 | $19,431 | $-- | $-- |
| Liabilities | | | | |
| Futures Contracts | $(232) | $(232) | $-- | $-- |
| Total Liabilities | $(232) | $(232) | $-- | $-- |
| Total Derivative Instruments: | $19,199 | $19,199 | $-- | $-- |
Value of Derivative Instruments
The following table is a summary of the Fund's value of derivative instruments by primary risk exposure as of September 30, 2018. For additional information on derivative instruments, please refer to the Derivative Instruments section in the accompanying Notes to Financial Statements.
| Primary Risk Exposure / Derivative Type | Value |
| | Asset | Liability |
| Equity Risk | | |
| Futures Contracts(a) | $19,431 | $(232) |
| Total Equity Risk | 19,431 | (232) |
| Total Value of Derivatives | $19,431 | $(232) |
(a) Reflects gross cumulative appreciation (depreciation) on futures contracts as presented in the Schedule of Investments. In the Statement of Assets and Liabilities, the period end daily variation margin is included in receivable or payable for daily variation margin on futures contracts, and the net cumulative appreciation (depreciation) is included in net unrealized appreciation (depreciation).
See accompanying notes which are an integral part of the financial statements.
Fidelity Advisor Freedom® Income Fund
Financial Statements
Statement of Assets and Liabilities
| | | September 30, 2018 (Unaudited) |
| Assets | | |
Investment in securities, at value — See accompanying schedule:
Unaffiliated issuers (cost $139,597) | $139,587 | |
| Fidelity Central Funds (cost $271,950) | 271,950 | |
| Other affiliated issuers (cost $216,592,823) | 226,481,362 | |
| Total Investment in Securities (cost $217,004,370) | | $226,892,899 |
| Cash | | 24,980 |
| Receivable for investments sold | | 2,212,924 |
| Receivable for fund shares sold | | 80,585 |
| Distributions receivable from Fidelity Central Funds | | 395 |
| Total assets | | 229,211,783 |
| Liabilities | | |
| Payable for investments purchased | $1,858,464 | |
| Payable for fund shares redeemed | 435,020 | |
| Accrued management fee | 86,767 | |
| Distribution and service plan fees payable | 41,081 | |
| Payable for daily variation margin on futures contracts | 7,785 | |
| Total liabilities | | 2,429,117 |
| Net Assets | | $226,782,666 |
| Net Assets consist of: | | |
| Paid in capital | | $212,884,732 |
| Undistributed net investment income | | 728,725 |
| Accumulated undistributed net realized gain (loss) on investments | | 3,261,481 |
| Net unrealized appreciation (depreciation) on investments | | 9,907,728 |
| Net Assets | | $226,782,666 |
| Calculation of Maximum Offering Price | | |
| Class A: | | |
| Net Asset Value and redemption price per share ($71,071,968 ÷ 6,532,358 shares) | | $10.88 |
| Maximum offering price per share (100/94.25 of $10.88) | | $11.54 |
| Class M: | | |
| Net Asset Value and redemption price per share ($37,593,914 ÷ 3,458,670 shares) | | $10.87 |
| Maximum offering price per share (100/96.50 of $10.87) | | $11.26 |
| Class C: | | |
| Net Asset Value and offering price per share ($12,600,033 ÷ 1,161,571 shares)(a) | | $10.85 |
| Class I: | | |
| Net Asset Value, offering price and redemption price per share ($89,438,285 ÷ 8,195,320 shares) | | $10.91 |
| Class Z6: | | |
| Net Asset Value, offering price and redemption price per share ($16,078,466 ÷ 1,474,648 shares) | | $10.90 |
(a) Redemption price per share is equal to net asset value less any applicable contingent deferred sales charge.
See accompanying notes which are an integral part of the financial statements.
Statement of Operations
| | | Six months ended September 30, 2018 (Unaudited) |
| Investment Income | | |
| Dividends: | | |
| Affiliated issuers | | $2,567,653 |
| Interest | | 457 |
| Income from Fidelity Central Funds | | 1,148 |
| Total income | | 2,569,258 |
| Expenses | | |
| Management fee | $513,658 | |
| Distribution and service plan fees | 254,346 | |
| Independent trustees' fees and expenses | 534 | |
| Total expenses before reductions | 768,538 | |
| Expense reductions | (40) | |
| Total expenses after reductions | | 768,498 |
| Net investment income (loss) | | 1,800,760 |
| Realized and Unrealized Gain (Loss) | | |
| Net realized gain (loss) on: | | |
| Investment securities: | | |
| Fidelity Central Funds | (9) | |
| Other affiliated issuers | 2,954,660 | |
| Futures contracts | (18,771) | |
| Capital gain distributions from underlying funds: | | |
| Affiliated issuers | 844,026 | |
| Total net realized gain (loss) | | 3,779,906 |
| Change in net unrealized appreciation (depreciation) on: | | |
| Investment securities: | | |
| Unaffiliated issuers | (9) | |
| Affiliated issuers | (3,697,585) | |
| Futures contracts | 19,199 | |
| Total change in net unrealized appreciation (depreciation) | | (3,678,395) |
| Net gain (loss) | | 101,511 |
| Net increase (decrease) in net assets resulting from operations | | $1,902,271 |
See accompanying notes which are an integral part of the financial statements.
Statement of Changes in Net Assets
| | Six months ended September 30, 2018 (Unaudited) | Year ended March 31, 2018 |
| Increase (Decrease) in Net Assets | | |
| Operations | | |
| Net investment income (loss) | $1,800,760 | $3,029,100 |
| Net realized gain (loss) | 3,779,906 | 6,815,367 |
| Change in net unrealized appreciation (depreciation) | (3,678,395) | (240,746) |
| Net increase (decrease) in net assets resulting from operations | 1,902,271 | 9,603,721 |
| Distributions to shareholders from net investment income | (1,325,123) | (2,967,012) |
| Distributions to shareholders from net realized gain | (3,148,159) | (5,087,952) |
| Total distributions | (4,473,282) | (8,054,964) |
| Share transactions - net increase (decrease) | 15,866,157 | (10,830,864) |
| Total increase (decrease) in net assets | 13,295,146 | (9,282,107) |
| Net Assets | | |
| Beginning of period | 213,487,520 | 222,769,627 |
| End of period | $226,782,666 | $213,487,520 |
| Other Information | | |
| Undistributed net investment income end of period | $728,725 | $253,088 |
See accompanying notes which are an integral part of the financial statements.
Financial Highlights
Fidelity Advisor Freedom Income Fund Class A
| | Six months ended (Unaudited) September 30, | Years endedMarch 31, | | | | |
| | 2018 | 2018 | 2017 | 2016 | 2015 | 2014 |
| Selected Per–Share Data | | | | | | |
| Net asset value, beginning of period | $11.01 | $10.94 | $10.64 | $11.07 | $11.20 | $11.21 |
| Income from Investment Operations | | | | | | |
| Net investment income (loss)A | .09 | .15 | .16 | .18 | .16 | .12 |
| Net realized and unrealized gain (loss) | –B | .34 | .44 | (.25) | .24 | .28 |
| Total from investment operations | .09 | .49 | .60 | (.07) | .40 | .40 |
| Distributions from net investment income | (.06) | (.15) | (.16)C | (.18) | (.17) | (.12) |
| Distributions from net realized gain | (.16) | (.26) | (.14)C | (.19) | (.36) | (.29) |
| Total distributions | (.22) | (.42)D | (.30) | (.36)E | (.53) | (.41) |
| Net asset value, end of period | $10.88 | $11.01 | $10.94 | $10.64 | $11.07 | $11.20 |
| Total ReturnF,G,H | .83% | 4.47% | 5.74% | (.59)% | 3.65% | 3.65% |
| Ratios to Average Net AssetsI,J | | | | | | |
| Expenses before reductions | .71%K,L | .63% | .25% | .25% | .25% | .25% |
| Expenses net of fee waivers, if any | .71%K,L | .63% | .25% | .25% | .25% | .25% |
| Expenses net of all reductions | .71%K,L | .63% | .25% | .25% | .25% | .25% |
| Net investment income (loss) | 1.59%K | 1.38% | 1.47% | 1.63% | 1.48% | 1.10% |
| Supplemental Data | | | | | | |
| Net assets, end of period (000 omitted) | $71,072 | $76,141 | $87,983 | $99,211 | $124,755 | $147,818 |
| Portfolio turnover rateI | 45%K | 21% | 38% | 30% | 38% | 36% |
A Calculated based on average shares outstanding during the period.
B Amount represents less than $.005 per share.
C The amounts shown reflect certain reclassifications related to book to tax differences that were made in the year shown.
D Total distributions of $.42 per share is comprised of distributions from net investment income of $.153 and distributions from net realized gain of $.263 per share.
E Total distributions of $.36 per share is comprised of distributions from net investment income of $.176 and distributions from net realized gain of $.187 per share.
F Total returns for periods of less than one year are not annualized.
G Total returns would have been lower if certain expenses had not been reduced during the applicable periods shown.
H Total returns do not include the effect of the sales charges.
I Amounts do not include the activity of the Underlying Funds.
J Expense ratios reflect operating expenses of the class. Expenses before reductions do not reflect amounts reimbursed by the investment adviser or reductions from expense offset arrangements and do not represent the amount paid by the class during periods when reimbursements or reductions occur. Expenses net of fee waivers reflect expenses after reimbursement by the investment adviser but prior to reductions from expense offset arrangements. Expenses net of all reductions represent the net expenses paid by the class but do not include expenses of the underlying funds in which the Fund invests.
K Annualized
L On certain classes, the size and fluctuation of net assets and expense amounts may cause ratios to differ from contractual rates.
See accompanying notes which are an integral part of the financial statements.
Fidelity Advisor Freedom Income Fund Class M
| | Six months ended (Unaudited) September 30, | Years endedMarch 31, | | | | |
| | 2018 | 2018 | 2017 | 2016 | 2015 | 2014 |
| Selected Per–Share Data | | | | | | |
| Net asset value, beginning of period | $11.00 | $10.93 | $10.62 | $11.06 | $11.19 | $11.20 |
| Income from Investment Operations | | | | | | |
| Net investment income (loss)A | .07 | .13 | .13 | .15 | .14 | .09 |
| Net realized and unrealized gain (loss) | .01 | .33 | .45 | (.25) | .23 | .28 |
| Total from investment operations | .08 | .46 | .58 | (.10) | .37 | .37 |
| Distributions from net investment income | (.05) | (.13) | (.13)B | (.15) | (.14) | (.09) |
| Distributions from net realized gain | (.16) | (.26) | (.14)B | (.19) | (.36) | (.29) |
| Total distributions | (.21) | (.39) | (.27) | (.34) | (.50) | (.38) |
| Net asset value, end of period | $10.87 | $11.00 | $10.93 | $10.62 | $11.06 | $11.19 |
| Total ReturnC,D,E | .70% | 4.22% | 5.56% | (.93)% | 3.39% | 3.40% |
| Ratios to Average Net AssetsF,G | | | | | | |
| Expenses before reductions | .96%H,I | .89% | .50% | .50% | .50% | .50% |
| Expenses net of fee waivers, if any | .96%H,I | .89% | .50% | .50% | .50% | .50% |
| Expenses net of all reductions | .96%H,I | .89% | .50% | .50% | .50% | .50% |
| Net investment income (loss) | 1.34%H | 1.13% | 1.22% | 1.38% | 1.23% | .85% |
| Supplemental Data | | | | | | |
| Net assets, end of period (000 omitted) | $37,594 | $38,204 | $38,513 | $42,887 | $47,804 | $53,019 |
| Portfolio turnover rateF | 45%H | 21% | 38% | 30% | 38% | 36% |
A Calculated based on average shares outstanding during the period.
B The amounts shown reflect certain reclassifications related to book to tax differences that were made in the year shown.
C Total returns for periods of less than one year are not annualized.
D Total returns would have been lower if certain expenses had not been reduced during the applicable periods shown.
E Total returns do not include the effect of the sales charges.
F Amounts do not include the activity of the Underlying Funds.
G Expense ratios reflect operating expenses of the class. Expenses before reductions do not reflect amounts reimbursed by the investment adviser or reductions from expense offset arrangements and do not represent the amount paid by the class during periods when reimbursements or reductions occur. Expenses net of fee waivers reflect expenses after reimbursement by the investment adviser but prior to reductions from expense offset arrangements. Expenses net of all reductions represent the net expenses paid by the class but do not include expenses of the underlying funds in which the Fund invests.
H Annualized
I On certain classes, the size and fluctuation of net assets and expense amounts may cause ratios to differ from contractual rates.
See accompanying notes which are an integral part of the financial statements.
Fidelity Advisor Freedom Income Fund Class C
| | Six months ended (Unaudited) September 30, | Years endedMarch 31, | | | | |
| | 2018 | 2018 | 2017 | 2016 | 2015 | 2014 |
| Selected Per–Share Data | | | | | | |
| Net asset value, beginning of period | $10.98 | $10.91 | $10.61 | $11.04 | $11.17 | $11.18 |
| Income from Investment Operations | | | | | | |
| Net investment income (loss)A | .05 | .07 | .08 | .09 | .08 | .04 |
| Net realized and unrealized gain (loss) | –B | .33 | .44 | (.24) | .24 | .28 |
| Total from investment operations | .05 | .40 | .52 | (.15) | .32 | .32 |
| Distributions from net investment income | (.02) | (.07) | (.08)C | (.10) | (.09) | (.04) |
| Distributions from net realized gain | (.16) | (.26) | (.14)C | (.19) | (.36) | (.29) |
| Total distributions | (.18) | (.33) | (.22) | (.28)D | (.45) | (.33) |
| Net asset value, end of period | $10.85 | $10.98 | $10.91 | $10.61 | $11.04 | $11.17 |
| Total ReturnE,F,G | .46% | 3.69% | 4.99% | (1.35)% | 2.90% | 2.89% |
| Ratios to Average Net AssetsH,I | | | | | | |
| Expenses before reductions | 1.46%J,K | 1.39% | 1.00% | 1.00% | 1.00% | 1.00% |
| Expenses net of fee waivers, if any | 1.46%J,K | 1.39% | 1.00% | 1.00% | 1.00% | 1.00% |
| Expenses net of all reductions | 1.46%J,K | 1.39% | 1.00% | 1.00% | 1.00% | 1.00% |
| Net investment income (loss) | .84%J | .63% | .72% | .88% | .73% | .35% |
| Supplemental Data | | | | | | |
| Net assets, end of period (000 omitted) | $12,600 | $13,727 | $14,434 | $14,712 | $15,780 | $15,735 |
| Portfolio turnover rateH | 45%J | 21% | 38% | 30% | 38% | 36% |
A Calculated based on average shares outstanding during the period.
B Amount represents less than $.005 per share.
C The amounts shown reflect certain reclassifications related to book to tax differences that were made in the year shown.
D Total distributions of $.28 per share is comprised of distributions from net investment income of $.095 and distributions from net realized gain of $.187 per share.
E Total returns for periods of less than one year are not annualized.
F Total returns would have been lower if certain expenses had not been reduced during the applicable periods shown.
G Total returns do not include the effect of the contingent deferred sales charge.
H Amounts do not include the activity of the Underlying Funds.
I Expense ratios reflect operating expenses of the class. Expenses before reductions do not reflect amounts reimbursed by the investment adviser or reductions from expense offset arrangements and do not represent the amount paid by the class during periods when reimbursements or reductions occur. Expenses net of fee waivers reflect expenses after reimbursement by the investment adviser but prior to reductions from expense offset arrangements. Expenses net of all reductions represent the net expenses paid by the class but do not include expenses of the underlying funds in which the Fund invests.
J Annualized
K On certain classes, the size and fluctuation of net assets and expense amounts may cause ratios to differ from contractual rates.
See accompanying notes which are an integral part of the financial statements.
Fidelity Advisor Freedom Income Fund Class I
| | Six months ended (Unaudited) September 30, | Years endedMarch 31, | | | | |
| | 2018 | 2018 | 2017 | 2016 | 2015 | 2014 |
| Selected Per–Share Data | | | | | | |
| Net asset value, beginning of period | $11.05 | $10.98 | $10.67 | $11.10 | $11.23 | $11.23 |
| Income from Investment Operations | | | | | | |
| Net investment income (loss)A | .10 | .18 | .19 | .20 | .19 | .15 |
| Net realized and unrealized gain (loss) | –B | .33 | .45 | (.24) | .24 | .29 |
| Total from investment operations | .10 | .51 | .64 | (.04) | .43 | .44 |
| Distributions from net investment income | (.08) | (.18) | (.19)C | (.20) | (.19) | (.15) |
| Distributions from net realized gain | (.16) | (.26) | (.14)C | (.19) | (.36) | (.29) |
| Total distributions | (.24) | (.44) | (.33) | (.39) | (.56)D | (.44) |
| Net asset value, end of period | $10.91 | $11.05 | $10.98 | $10.67 | $11.10 | $11.23 |
| Total ReturnE,F | .89% | 4.70% | 6.07% | (.34)% | 3.89% | 3.98% |
| Ratios to Average Net AssetsG,H | | | | | | |
| Expenses before reductions | .47%I | .39% | - %J | - %J | - %J | - %J |
| Expenses net of fee waivers, if any | .47%I | .39% | -% | -% | -% | -% |
| Expenses net of all reductions | .47%I | .39% | -% | -% | -% | -% |
| Net investment income (loss) | 1.84%I | 1.63% | 1.72% | 1.88% | 1.73% | 1.35% |
| Supplemental Data | | | | | | |
| Net assets, end of period (000 omitted) | $89,438 | $83,723 | $81,839 | $83,497 | $83,253 | $71,933 |
| Portfolio turnover rateG | 45%I | 21% | 38% | 30% | 38% | 36% |
A Calculated based on average shares outstanding during the period.
B Amount represents less than $.005 per share.
C The amounts shown reflect certain reclassifications related to book to tax differences that were made in the year shown.
D Total distributions of $.56 per share is comprised of distributions from net investment income of $.194 and distributions from net realized gain of $.361 per share.
E Total returns for periods of less than one year are not annualized.
F Total returns would have been lower if certain expenses had not been reduced during the applicable periods shown.
G Amounts do not include the activity of the Underlying Funds.
H Expense ratios reflect operating expenses of the class. Expenses before reductions do not reflect amounts reimbursed by the investment adviser or reductions from expense offset arrangements and do not represent the amount paid by the class during periods when reimbursements or reductions occur. Expenses net of fee waivers reflect expenses after reimbursement by the investment adviser but prior to reductions from expense offset arrangements. Expenses net of all reductions represent the net expenses paid by the class but do not include expenses of the underlying funds in which the Fund invests.
I Annualized
J Amount represents less than .005%.
See accompanying notes which are an integral part of the financial statements.
Fidelity Advisor Freedom Income Fund Class Z6
| | Six months ended (Unaudited) September 30, | Years endedMarch 31, |
| | 2018 | 2018 A |
| Selected Per–Share Data | | |
| Net asset value, beginning of period | $11.04 | $11.09 |
| Income from Investment Operations | | |
| Net investment income (loss)B | .10 | .27 |
| Net realized and unrealized gain (loss) | .01 | .03 |
| Total from investment operations | .11 | .30 |
| Distributions from net investment income | (.09) | (.16) |
| Distributions from net realized gain | (.16) | (.19) |
| Total distributions | (.25) | (.35) |
| Net asset value, end of period | $10.90 | $11.04 |
| Total ReturnC,D | .98% | 2.69% |
| Ratios to Average Net AssetsE,F | | |
| Expenses before reductions | .37%G | .37%G |
| Expenses net of fee waivers, if any | .37%G | .37%G |
| Expenses net of all reductions | .37%G | .37%G |
| Net investment income (loss) | 1.93%G | 2.92%G |
| Supplemental Data | | |
| Net assets, end of period (000 omitted) | $16,078 | $1,693 |
| Portfolio turnover rateE | 45%G | 21% |
A For the period June 6, 2017 (commencement of sale of shares) to March 31, 2018.
B Calculated based on average shares outstanding during the period.
C Total returns for periods of less than one year are not annualized.
D Total returns would have been lower if certain expenses had not been reduced during the applicable periods shown.
E Amounts do not include the activity of the Underlying Funds.
F Expense ratios reflect operating expenses of the class. Expenses before reductions do not reflect amounts reimbursed by the investment adviser or reductions from expense offset arrangements and do not represent the amount paid by the class during periods when reimbursements or reductions occur. Expenses net of fee waivers reflect expenses after reimbursement by the investment adviser but prior to reductions from expense offset arrangements. Expenses net of all reductions represent the net expenses paid by the class but do not include expenses of the underlying funds in which the Fund invests.
G Annualized
See accompanying notes which are an integral part of the financial statements.
Fidelity Advisor Freedom® 2005 Fund
Investment Summary (Unaudited)
The information in the following tables is based on the direct investments of the Fund.
Top Holdings as of September 30, 2018
| | % of fund's net assets |
| Fidelity Series Investment Grade Bond Fund | 33.8 |
| Fidelity Series Government Money Market Fund 2.12% | 15.1 |
| Fidelity Series Inflation-Protected Bond Index Fund | 10.9 |
| Fidelity Series Long-Term Treasury Bond Index Fund | 4.6 |
| Fidelity Series Short-Term Credit Fund | 3.9 |
| Fidelity Series Emerging Markets Opportunities Fund | 3.6 |
| Fidelity Series Large Cap Stock Fund | 3.3 |
| Fidelity Series International Growth Fund | 3.0 |
| Fidelity Series International Value Fund | 3.0 |
| Fidelity Series Stock Selector Large Cap Value Fund | 2.1 |
| | 83.3 |
Asset Allocation (% of fund's net assets)
| Period end |
| | Domestic Equity Funds | 17.6% |
| | International Equity Funds | 11.1% |
| | Bond Funds | 52.2% |
| | Short-Term Funds | 19.1% |

Domestic Equity Funds category includes Fidelity Series Commodity Strategy Fund which invests in commodity-related investments.
Fidelity Advisor Freedom® 2005 Fund
Schedule of Investments September 30, 2018 (Unaudited)
Showing Percentage of Net Assets
| U.S. Treasury Obligations - 0.0% | | | |
| | | Principal Amount | Value |
| U.S. Treasury Bills, yield at date of purchase 1.97% to 2.09% 11/1/18 to 11/29/18 (a) | | | |
| (Cost $99,694) | | 100,000 | 99,687 |
| | | Shares | Value |
|
| Domestic Equity Funds - 17.6% | | | |
| Fidelity Advisor Series Equity Growth Fund (b) | | 229,426 | $3,546,925 |
| Fidelity Advisor Series Growth Opportunities Fund (b) | | 141,915 | 2,361,471 |
| Fidelity Advisor Series Small Cap Fund (b) | | 132,653 | 1,667,445 |
| Fidelity Series All-Sector Equity Fund (b) | | 109,609 | 1,491,777 |
| Fidelity Series Commodity Strategy Fund (b) | | 754,404 | 3,772,021 |
| Fidelity Series Large Cap Stock Fund (b) | | 386,585 | 6,158,296 |
| Fidelity Series Large Cap Value Index Fund (b) | | 50,261 | 663,448 |
| Fidelity Series Opportunistic Insights Fund (b) | | 166,032 | 3,295,726 |
| Fidelity Series Small Cap Opportunities Fund (b) | | 143,050 | 2,101,403 |
| Fidelity Series Stock Selector Large Cap Value Fund (b) | | 300,722 | 3,975,541 |
| Fidelity Series Value Discovery Fund (b) | | 286,498 | 3,922,154 |
| TOTAL DOMESTIC EQUITY FUNDS | | | |
| (Cost $24,512,831) | | | 32,956,207 |
|
| International Equity Funds - 11.1% | | | |
| Fidelity Series Canada Fund (b) | | 52,244 | 564,755 |
| Fidelity Series Emerging Markets Fund (b) | | 84,485 | 818,662 |
| Fidelity Series Emerging Markets Opportunities Fund (b) | | 353,779 | 6,789,016 |
| Fidelity Series International Growth Fund (b) | | 346,727 | 5,686,326 |
| Fidelity Series International Small Cap Fund (b) | | 74,922 | 1,341,109 |
| Fidelity Series International Value Fund (b) | | 539,625 | 5,676,850 |
| TOTAL INTERNATIONAL EQUITY FUNDS | | | |
| (Cost $15,017,120) | | | 20,876,718 |
|
| Bond Funds - 52.2% | | | |
| Fidelity Series Emerging Markets Debt Fund (b) | | 147,635 | 1,406,964 |
| Fidelity Series Floating Rate High Income Fund (b) | | 48,772 | 464,307 |
| Fidelity Series High Income Fund (b) | | 260,950 | 2,507,726 |
| Fidelity Series Inflation-Protected Bond Index Fund (b) | | 2,099,784 | 20,388,904 |
| Fidelity Series International Credit Fund (b) | | 10,786 | 106,030 |
| Fidelity Series Investment Grade Bond Fund (b) | | 5,818,186 | 63,360,042 |
| Fidelity Series Long-Term Treasury Bond Index Fund (b) | | 1,052,702 | 8,674,262 |
| Fidelity Series Real Estate Income Fund (b) | | 84,455 | 910,424 |
| TOTAL BOND FUNDS | | | |
| (Cost $98,781,996) | | | 97,818,659 |
|
| Short-Term Funds - 19.1% | | | |
| Fidelity Cash Central Fund, 2.11% (c) | | 298,745 | 298,805 |
| Fidelity Series Government Money Market Fund 2.12% (b)(d) | | 28,248,650 | 28,248,650 |
| Fidelity Series Short-Term Credit Fund (b) | | 741,578 | 7,311,963 |
| TOTAL SHORT-TERM FUNDS | | | |
| (Cost $35,929,504) | | | 35,859,418 |
| TOTAL INVESTMENT IN SECURITIES - 100.0% | | | |
| (Cost $174,341,145) | | | 187,610,689 |
| NET OTHER ASSETS (LIABILITIES) - 0.0% | | | (91,059) |
| NET ASSETS - 100% | | | $187,519,630 |
| Futures Contracts | | | | | |
| | Number of contracts | Expiration Date | Notional Amount | Value | Unrealized Appreciation/(Depreciation) |
| Purchased | | | | | |
| Equity Index Contracts | | | | | |
| ICE E-mini MSCI EAFE Index Contracts (United States) | 4 | Dec. 2018 | $395,100 | $378 | $378 |
| ICE E-mini MSCI Emerging Markets Index Contracts (United States) | 12 | Dec. 2018 | 629,820 | 12,547 | 12,547 |
| | | | | | 12,925 |
| Sold | | | | | |
| Equity Index Contracts | | | | | |
| CME E-mini S&P 500 Index Contracts (United States) | 6 | Dec. 2018 | 875,700 | (232) | (232) |
| TOTAL FUTURES CONTRACTS | | | | | $12,693 |
The notional amount of futures purchased as a percentage of Net Assets is 0.5%
The notional amount of futures sold as a percentage of Net Assets is 0.5%
Legend
(a) Security or a portion of the security was pledged to cover margin requirements for futures contracts. At period end, the value of securities pledged amounted to $89,721.
(b) Affiliated Fund
(c) Affiliated fund that is generally available only to investment companies and other accounts managed by Fidelity Investments. The rate quoted is the annualized seven-day yield of the fund at period end. A complete unaudited listing of the fund's holdings as of its most recent quarter end is available upon request. In addition, each Fidelity Central Fund's financial statements are available on the SEC's website or upon request.
(d) The rate quoted is the annualized seven-day yield of the fund at period end.
Affiliated Central Funds
Information regarding fiscal year to date income earned by the Fund from investments in Fidelity Central Funds is as follows:
| Fund | Income earned |
| Fidelity Cash Central Fund | $1,202 |
| Total | $1,202 |
Amounts in the income column in the above table include any capital gain distributions from underlying funds, which are presented in the corresponding line-item in the Statement of Operations if applicable.
Affiliated Underlying Funds
Fiscal year to date information regarding the Fund's investments in affiliated Underlying Funds, excluding any Money Market Central Funds, is presented below. Exchanges between classes of the same affiliated Underlying Funds may occur.
| Affiliate | Value, beginning of period | Purchases | Sales Proceeds | Dividend Income | Realized Gain (loss) | Change in Unrealized appreciation (depreciation) | Value, end of period |
| Fidelity Advisor Series Equity Growth Fund | $4,047,155 | $139,532 | $1,181,704 | $ - | $284,244 | $257,698 | $3,546,925 |
| Fidelity Advisor Series Equity Value Fund | 4,664,011 | 288,144 | 1,141,903 | 127,066 | 217,350 | (924,480) | - |
| Fidelity Advisor Series Growth & Income Fund | 7,130,190 | 795,871 | 1,935,101 | 545,542 | 186,602 | (1,576,253) | - |
| Fidelity Advisor Series Growth Opportunities Fund | 2,658,831 | 91,613 | 1,028,450 | - | 332,633 | 306,844 | 2,361,471 |
| Fidelity Advisor Series Opportunistic Insights Fund | 3,789,230 | 371,465 | 1,101,674 | 241,244 | 419,267 | (1,614,752) | - |
| Fidelity Advisor Series Small Cap Fund | 2,027,176 | 68,640 | 542,109 | - | 94,474 | 19,264 | 1,667,445 |
| Fidelity Advisor Series Stock Selector Large Cap Value Fund | 4,707,725 | 482,249 | 1,160,459 | 322,685 | 216,415 | (929,438) | - |
| Fidelity Series 100 Index Fund | 2,007,990 | - | 2,088,591 | - | 1,070,909 | (990,308) | - |
| Fidelity Series All-Sector Equity Fund | 2,777,333 | 92,723 | 1,664,062 | - | 357,643 | (71,860) | 1,491,777 |
| Fidelity Series Canada Fund | 653,217 | 21,460 | 149,325 | - | 1,921 | 37,482 | 564,755 |
| Fidelity Series Commodity Strategy Fund | 4,089,262 | 670,339 | 680,899 | 227,243 | (271,764) | (34,917) | 3,772,021 |
| Fidelity Series Emerging Markets Debt Fund | 1,503,577 | 81,821 | 96,690 | 43,406 | (2,589) | (79,155) | 1,406,964 |
| Fidelity Series Emerging Markets Fund | - | 821,372 | - | - | - | (2,710) | 818,662 |
| Fidelity Series Emerging Markets Opportunities Fund | 7,766,630 | 615,001 | 626,925 | - | 44,991 | (1,010,681) | 6,789,016 |
| Fidelity Series Floating Rate High Income Fund | 475,597 | 28,502 | 40,287 | 12,495 | (1,461) | 1,956 | 464,307 |
| Fidelity Series Government Money Market Fund 2.12% | 35,857,816 | 4,681,631 | 12,290,797 | 317,353 | - | - | 28,248,650 |
| Fidelity Series High Income Fund | 2,929,758 | 159,042 | 603,368 | 75,820 | (24,342) | 46,636 | 2,507,726 |
| Fidelity Series Inflation-Protected Bond Index Fund | 6,471,850 | 14,823,262 | 838,879 | 19,908 | (7,981) | (59,348) | 20,388,904 |
| Fidelity Series International Credit Fund | 105,791 | 1,303 | - | 1,304 | - | (1,064) | 106,030 |
| Fidelity Series International Growth Fund | 6,768,564 | 337,263 | 1,502,929 | - | 495,550 | (412,122) | 5,686,326 |
| Fidelity Series International Small Cap Fund | 1,676,957 | 67,126 | 342,123 | - | 116,021 | (176,872) | 1,341,109 |
| Fidelity Series International Value Fund | 6,654,429 | 211,468 | 1,148,534 | - | 117,198 | (157,711) | 5,676,850 |
| Fidelity Series Investment Grade Bond Fund | 67,757,886 | 2,950,937 | 6,561,473 | 933,237 | (110,358) | (676,950) | 63,360,042 |
| Fidelity Series Large Cap Stock Fund | - | 27 | 30,882 | - | (271) | 1,588,113 | 6,158,296 |
| Fidelity Series Large Cap Value Index Fund | 789,577 | 26,955 | 205,983 | - | 40,769 | 12,130 | 663,448 |
| Fidelity Series Long-Term Treasury Bond Index Fund | 4,133,151 | 5,849,401 | 1,028,891 | 77,011 | (35,404) | (243,995) | 8,674,262 |
| Fidelity Series Opportunistic Insights Fund | - | 41 | 16,493 | - | (16) | 1,448,658 | 3,295,726 |
| Fidelity Series Real Estate Equity Fund | 486,818 | 4,826 | 508,792 | 4,181 | 91,368 | (74,220) | - |
| Fidelity Series Real Estate Income Fund | 922,555 | 68,816 | 86,211 | 38,703 | 2,451 | 2,813 | 910,424 |
| Fidelity Series Short-Term Credit Fund | 8,765,987 | 390,850 | 1,844,723 | 97,451 | (17,081) | 16,930 | 7,311,963 |
| Fidelity Series Small Cap Opportunities Fund | 2,472,892 | 247,811 | 734,449 | 163,386 | 296,382 | (181,233) | 2,101,403 |
| Fidelity Series Stock Selector Large Cap Value Fund | - | 3,055 | 29,111 | - | 91 | 685,014 | 3,975,541 |
| Fidelity Series Value Discovery Fund | - | 21 | 19,800 | - | (202) | 839,013 | 3,922,154 |
| | $194,091,955 | $34,392,567 | $41,231,617 | $3,248,035 | $3,914,810 | $(3,955,518) | $187,212,197 |
Amounts in the income column in the above table include any capital gain distributions from underlying funds, which are presented in the corresponding line-item in the Statement of Operations if applicable.
Investment Valuation
The following is a summary of the inputs used, as of September 30, 2018, involving the Fund's assets and liabilities carried at fair value. The inputs or methodology used for valuing securities may not be an indication of the risk associated with investing in those securities. For more information on valuation inputs, and their aggregation into the levels used below, please refer to the Investment Valuation section in the accompanying Notes to Financial Statements.
| | Valuation Inputs at Reporting Date: |
| Description | Total | Level 1 | Level 2 | Level 3 |
| Investments in Securities: | | | | |
| Other Short-Term Investments | $99,687 | $-- | $99,687 | $-- |
| Domestic Equity Funds | 32,956,207 | 32,956,207 | -- | -- |
| International Equity Funds | 20,876,718 | 20,876,718 | -- | -- |
| Bond Funds | 97,818,659 | 97,818,659 | -- | -- |
| Short-Term Funds | 35,859,418 | 35,859,418 | -- | -- |
| Total Investments in Securities: | $187,610,689 | $187,511,002 | $99,687 | $-- |
| Derivative Instruments: | | | | |
| Assets | | | | |
| Futures Contracts | $12,925 | $12,925 | $-- | $-- |
| Total Assets | $12,925 | $12,925 | $-- | $-- |
| Liabilities | | | | |
| Futures Contracts | $(232) | $(232) | $-- | $-- |
| Total Liabilities | $(232) | $(232) | $-- | $-- |
| Total Derivative Instruments: | $12,693 | $12,693 | $-- | $-- |
Value of Derivative Instruments
The following table is a summary of the Fund's value of derivative instruments by primary risk exposure as of September 30, 2018. For additional information on derivative instruments, please refer to the Derivative Instruments section in the accompanying Notes to Financial Statements.
| Primary Risk Exposure / Derivative Type | Value |
| | Asset | Liability |
| Equity Risk | | |
| Futures Contracts(a) | $12,925 | $(232) |
| Total Equity Risk | 12,925 | (232) |
| Total Value of Derivatives | $12,925 | $(232) |
(a) Reflects gross cumulative appreciation (depreciation) on futures contracts as presented in the Schedule of Investments. In the Statement of Assets and Liabilities, the period end daily variation margin is included in receivable or payable for daily variation margin on futures contracts, and the net cumulative appreciation (depreciation) is included in net unrealized appreciation (depreciation).
See accompanying notes which are an integral part of the financial statements.
Fidelity Advisor Freedom® 2005 Fund
Financial Statements
Statement of Assets and Liabilities
| | | September 30, 2018 (Unaudited) |
| Assets | | |
Investment in securities, at value — See accompanying schedule:
Unaffiliated issuers (cost $99,694) | $99,687 | |
| Fidelity Central Funds (cost $298,805) | 298,805 | |
| Other affiliated issuers (cost $173,942,646) | 187,212,197 | |
| Total Investment in Securities (cost $174,341,145) | | $187,610,689 |
| Cash | | 31,750 |
| Receivable for investments sold | | 1,321,598 |
| Receivable for fund shares sold | | 79,773 |
| Distributions receivable from Fidelity Central Funds | | 456 |
| Total assets | | 189,044,266 |
| Liabilities | | |
| Payable for investments purchased | $1,097,133 | |
| Payable for fund shares redeemed | 309,088 | |
| Accrued management fee | 75,512 | |
| Distribution and service plan fees payable | 34,818 | |
| Payable for daily variation margin on futures contracts | 8,085 | |
| Total liabilities | | 1,524,636 |
| Net Assets | | $187,519,630 |
| Net Assets consist of: | | |
| Paid in capital | | $168,245,478 |
| Undistributed net investment income | | 1,427,142 |
| Accumulated undistributed net realized gain (loss) on investments | | 4,564,773 |
| Net unrealized appreciation (depreciation) on investments | | 13,282,237 |
| Net Assets | | $187,519,630 |
| Calculation of Maximum Offering Price | | |
| Class A: | | |
| Net Asset Value and redemption price per share ($93,168,916 ÷ 7,923,377 shares) | | $11.76 |
| Maximum offering price per share (100/94.25 of $11.76) | | $12.48 |
| Class M: | | |
| Net Asset Value and redemption price per share ($25,147,539 ÷ 2,142,751 shares) | | $11.74 |
| Maximum offering price per share (100/96.50 of $11.74) | | $12.17 |
| Class C: | | |
| Net Asset Value and offering price per share ($5,746,217 ÷ 490,500 shares)(a) | | $11.72 |
| Class I: | | |
| Net Asset Value, offering price and redemption price per share ($61,842,868 ÷ 5,220,863 shares) | | $11.85 |
| Class Z6: | | |
| Net Asset Value, offering price and redemption price per share ($1,614,090 ÷ 136,363 shares) | | $11.84 |
(a) Redemption price per share is equal to net asset value less any applicable contingent deferred sales charge.
See accompanying notes which are an integral part of the financial statements.
Statement of Operations
| | | Six months ended September 30, 2018 (Unaudited) |
| Investment Income | | |
| Dividends: | | |
| Affiliated issuers | | $2,101,126 |
| Interest | | 406 |
| Income from Fidelity Central Funds | | 1,202 |
| Total income | | 2,102,734 |
| Expenses | | |
| Management fee | $458,818 | |
| Distribution and service plan fees | 214,227 | |
| Independent trustees' fees and expenses | 467 | |
| Total expenses before reductions | 673,512 | |
| Expense reductions | (32) | |
| Total expenses after reductions | | 673,480 |
| Net investment income (loss) | | 1,429,254 |
| Realized and Unrealized Gain (Loss) | | |
| Net realized gain (loss) on: | | |
| Investment securities: | | |
| Fidelity Central Funds | (10) | |
| Other affiliated issuers | 3,914,810 | |
| Futures contracts | (27,701) | |
| Capital gain distributions from underlying funds: | | |
| Affiliated issuers | 1,146,909 | |
| Total net realized gain (loss) | | 5,034,008 |
| Change in net unrealized appreciation (depreciation) on: | | |
| Investment securities: | | |
| Unaffiliated issuers | (6) | |
| Affiliated issuers | (3,955,518) | |
| Futures contracts | 12,693 | |
| Total change in net unrealized appreciation (depreciation) | | (3,942,831) |
| Net gain (loss) | | 1,091,177 |
| Net increase (decrease) in net assets resulting from operations | | $2,520,431 |
See accompanying notes which are an integral part of the financial statements.
Statement of Changes in Net Assets
| | Six months ended September 30, 2018 (Unaudited) | Year ended March 31, 2018 |
| Increase (Decrease) in Net Assets | | |
| Operations | | |
| Net investment income (loss) | $1,429,254 | $2,777,359 |
| Net realized gain (loss) | 5,034,008 | 9,885,530 |
| Change in net unrealized appreciation (depreciation) | (3,942,831) | (528,591) |
| Net increase (decrease) in net assets resulting from operations | 2,520,431 | 12,134,298 |
| Distributions to shareholders from net investment income | (385,627) | (2,811,909) |
| Distributions to shareholders from net realized gain | (4,800,304) | (7,338,936) |
| Total distributions | (5,185,931) | (10,150,845) |
| Share transactions - net increase (decrease) | (3,846,376) | (18,509,645) |
| Total increase (decrease) in net assets | (6,511,876) | (16,526,192) |
| Net Assets | | |
| Beginning of period | 194,031,506 | 210,557,698 |
| End of period | $187,519,630 | $194,031,506 |
| Other Information | | |
| Undistributed net investment income end of period | $1,427,142 | $383,515 |
See accompanying notes which are an integral part of the financial statements.
Financial Highlights
Fidelity Advisor Freedom 2005 Fund Class A
| | Six months ended (Unaudited) September 30, | Years endedMarch 31, | | | | |
| | 2018 | 2018 | 2017 | 2016 | 2015 | 2014 |
| Selected Per–Share Data | | | | | | |
| Net asset value, beginning of period | $11.92 | $11.84 | $11.44 | $12.10 | $12.17 | $11.90 |
| Income from Investment Operations | | | | | | |
| Net investment income (loss)A | .09 | .16 | .17 | .19 | .19 | .13 |
| Net realized and unrealized gain (loss) | .07 | .53 | .67 | (.34) | .36 | .57 |
| Total from investment operations | .16 | .69 | .84 | (.15) | .55 | .70 |
| Distributions from net investment income | (.02) | (.17) | (.19)B | (.20) | (.19) | (.12) |
| Distributions from net realized gain | (.30) | (.44) | (.25)B | (.32) | (.42) | (.31) |
| Total distributions | (.32) | (.61) | (.44) | (.51)C | (.62)D | (.43) |
| Net asset value, end of period | $11.76 | $11.92 | $11.84 | $11.44 | $12.10 | $12.17 |
| Total ReturnE,F,G | 1.37% | 5.87% | 7.55% | (1.23)% | 4.60% | 5.98% |
| Ratios to Average Net AssetsH,I | | | | | | |
| Expenses before reductions | .73%J | .66% | .25% | .25% | .25% | .25% |
| Expenses net of fee waivers, if any | .73%J | .66% | .25% | .25% | .25% | .25% |
| Expenses net of all reductions | .73%J | .66% | .25% | .25% | .25% | .25% |
| Net investment income (loss) | 1.47%J | 1.34% | 1.46% | 1.62% | 1.54% | 1.10% |
| Supplemental Data | | | | | | |
| Net assets, end of period (000 omitted) | $93,169 | $101,642 | $118,902 | $134,262 | $162,069 | $187,224 |
| Portfolio turnover rateH | 36%J | 20% | 32% | 30% | 29% | 49% |
A Calculated based on average shares outstanding during the period.
B The amounts shown reflect certain reclassifications related to book to tax differences that were made in the year shown.
C Total distributions of $.51 per share is comprised of distributions from net investment income of $.196 and distributions from net realized gain of $.317 per share.
D Total distributions of $.62 per share is comprised of distributions from net investment income of $.193 and distributions from net realized gain of $.423 per share.
E Total returns for periods of less than one year are not annualized.
F Total returns would have been lower if certain expenses had not been reduced during the applicable periods shown.
G Total returns do not include the effect of the sales charges.
H Amounts do not include the activity of the Underlying Funds.
I Expense ratios reflect operating expenses of the class. Expenses before reductions do not reflect amounts reimbursed by the investment adviser or reductions from expense offset arrangements and do not represent the amount paid by the class during periods when reimbursements or reductions occur. Expenses net of fee waivers reflect expenses after reimbursement by the investment adviser but prior to reductions from expense offset arrangements. Expenses net of all reductions represent the net expenses paid by the class but do not include expenses of the underlying funds in which the Fund invests.
J Annualized
See accompanying notes which are an integral part of the financial statements.
Fidelity Advisor Freedom 2005 Fund Class M
| | Six months ended (Unaudited) September 30, | Years endedMarch 31, | | | | |
| | 2018 | 2018 | 2017 | 2016 | 2015 | 2014 |
| Selected Per–Share Data | | | | | | |
| Net asset value, beginning of period | $11.91 | $11.83 | $11.43 | $12.09 | $12.16 | $11.90 |
| Income from Investment Operations | | | | | | |
| Net investment income (loss)A | .07 | .13 | .14 | .16 | .16 | .10 |
| Net realized and unrealized gain (loss) | .07 | .53 | .67 | (.33) | .35 | .57 |
| Total from investment operations | .14 | .66 | .81 | (.17) | .51 | .67 |
| Distributions from net investment income | (.02) | (.14) | (.16)B | (.17) | (.16) | (.10) |
| Distributions from net realized gain | (.30) | (.44) | (.25)B | (.32) | (.42) | (.31) |
| Total distributions | (.31)C | (.58) | (.41) | (.49) | (.58) | (.41) |
| Net asset value, end of period | $11.74 | $11.91 | $11.83 | $11.43 | $12.09 | $12.16 |
| Total ReturnD,E,F | 1.22% | 5.64% | 7.29% | (1.45)% | 4.33% | 5.68% |
| Ratios to Average Net AssetsG,H | | | | | | |
| Expenses before reductions | .98%I | .91% | .50% | .50% | .50% | .50% |
| Expenses net of fee waivers, if any | .98%I | .91% | .50% | .50% | .50% | .50% |
| Expenses net of all reductions | .98%I | .91% | .50% | .50% | .50% | .50% |
| Net investment income (loss) | 1.22%I | 1.08% | 1.21% | 1.37% | 1.29% | .85% |
| Supplemental Data | | | | | | |
| Net assets, end of period (000 omitted) | $25,148 | $25,730 | $27,091 | $29,347 | $29,246 | $29,912 |
| Portfolio turnover rateG | 36%I | 20% | 32% | 30% | 29% | 49% |
A Calculated based on average shares outstanding during the period.
B The amounts shown reflect certain reclassifications related to book to tax differences that were made in the year shown.
C Total distributions of $.31 per share is comprised of distributions from net investment income of $.015 and distributions from net realized gain of $.298 per share.
D Total returns for periods of less than one year are not annualized.
E Total returns would have been lower if certain expenses had not been reduced during the applicable periods shown.
F Total returns do not include the effect of the sales charges.
G Amounts do not include the activity of the Underlying Funds.
H Expense ratios reflect operating expenses of the class. Expenses before reductions do not reflect amounts reimbursed by the investment adviser or reductions from expense offset arrangements and do not represent the amount paid by the class during periods when reimbursements or reductions occur. Expenses net of fee waivers reflect expenses after reimbursement by the investment adviser but prior to reductions from expense offset arrangements. Expenses net of all reductions represent the net expenses paid by the class but do not include expenses of the underlying funds in which the Fund invests.
I Annualized
See accompanying notes which are an integral part of the financial statements.
Fidelity Advisor Freedom 2005 Fund Class C
| | Six months ended (Unaudited) September 30, | Years endedMarch 31, | | | | |
| | 2018 | 2018 | 2017 | 2016 | 2015 | 2014 |
| Selected Per–Share Data | | | | | | |
| Net asset value, beginning of period | $11.91 | $11.81 | $11.41 | $12.06 | $12.14 | $11.87 |
| Income from Investment Operations | | | | | | |
| Net investment income (loss)A | .04 | .07 | .08 | .10 | .10 | .04 |
| Net realized and unrealized gain (loss) | .07 | .54 | .67 | (.33) | .34 | .58 |
| Total from investment operations | .11 | .61 | .75 | (.23) | .44 | .62 |
| Distributions from net investment income | –B | (.07) | (.10)C | (.10) | (.10) | (.04) |
| Distributions from net realized gain | (.30) | (.44) | (.25)C | (.32) | (.42) | (.31) |
| Total distributions | (.30) | (.51) | (.35) | (.42) | (.52) | (.35) |
| Net asset value, end of period | $11.72 | $11.91 | $11.81 | $11.41 | $12.06 | $12.14 |
| Total ReturnD,E,F | .86% | 5.21% | 6.75% | (1.98)% | 3.73% | 5.28% |
| Ratios to Average Net AssetsG,H | | | | | | |
| Expenses before reductions | 1.48%I | 1.41% | 1.00% | 1.00% | 1.00% | 1.00% |
| Expenses net of fee waivers, if any | 1.48%I | 1.41% | 1.00% | 1.00% | 1.00% | 1.00% |
| Expenses net of all reductions | 1.48%I | 1.41% | 1.00% | 1.00% | 1.00% | 1.00% |
| Net investment income (loss) | .72%I | .58% | .71% | .87% | .79% | .35% |
| Supplemental Data | | | | | | |
| Net assets, end of period (000 omitted) | $5,746 | $5,867 | $5,623 | $6,200 | $7,410 | $8,910 |
| Portfolio turnover rateG | 36%I | 20% | 32% | 30% | 29% | 49% |
A Calculated based on average shares outstanding during the period.
B Amount represents less than $.005 per share.
C The amounts shown reflect certain reclassifications related to book to tax differences that were made in the year shown.
D Total returns for periods of less than one year are not annualized.
E Total returns would have been lower if certain expenses had not been reduced during the applicable periods shown.
F Total returns do not include the effect of the contingent deferred sales charge.
G Amounts do not include the activity of the Underlying Funds.
H Expense ratios reflect operating expenses of the class. Expenses before reductions do not reflect amounts reimbursed by the investment adviser or reductions from expense offset arrangements and do not represent the amount paid by the class during periods when reimbursements or reductions occur. Expenses net of fee waivers reflect expenses after reimbursement by the investment adviser but prior to reductions from expense offset arrangements. Expenses net of all reductions represent the net expenses paid by the class but do not include expenses of the underlying funds in which the Fund invests.
I Annualized
See accompanying notes which are an integral part of the financial statements.
Fidelity Advisor Freedom 2005 Fund Class I
| | Six months ended (Unaudited) September 30, | Years endedMarch 31, | | | | |
| | 2018 | 2018 | 2017 | 2016 | 2015 | 2014 |
| Selected Per–Share Data | | | | | | |
| Net asset value, beginning of period | $12.00 | $11.92 | $11.51 | $12.18 | $12.25 | $11.97 |
| Income from Investment Operations | | | | | | |
| Net investment income (loss)A | .10 | .19 | .20 | .22 | .22 | .16 |
| Net realized and unrealized gain (loss) | .08 | .54 | .68 | (.34) | .36 | .58 |
| Total from investment operations | .18 | .73 | .88 | (.12) | .58 | .74 |
| Distributions from net investment income | (.03) | (.20) | (.22)B | (.23) | (.23) | (.15) |
| Distributions from net realized gain | (.30) | (.44) | (.25)B | (.32) | (.42) | (.31) |
| Total distributions | (.33) | (.65)C | (.47) | (.55) | (.65) | (.46) |
| Net asset value, end of period | $11.85 | $12.00 | $11.92 | $11.51 | $12.18 | $12.25 |
| Total ReturnD,E | 1.51% | 6.13% | 7.87% | (1.04)% | 4.85% | 6.29% |
| Ratios to Average Net AssetsF,G | | | | | | |
| Expenses before reductions | .48%H | .41% | - %I | - %I | - %I | - %I |
| Expenses net of fee waivers, if any | .48%H | .41% | -% | -% | -% | -% |
| Expenses net of all reductions | .48%H | .41% | -% | -% | -% | -% |
| Net investment income (loss) | 1.72%H | 1.58% | 1.71% | 1.87% | 1.79% | 1.35% |
| Supplemental Data | | | | | | |
| Net assets, end of period (000 omitted) | $61,843 | $59,386 | $58,940 | $61,440 | $66,255 | $67,435 |
| Portfolio turnover rateF | 36%H | 20% | 32% | 30% | 29% | 49% |
A Calculated based on average shares outstanding during the period.
B The amounts shown reflect certain reclassifications related to book to tax differences that were made in the year shown.
C Total distributions of $.65 per share is comprised of distributions from net investment income of $.203 and distributions from net realized gain of $.443 per share.
D Total returns for periods of less than one year are not annualized.
E Total returns would have been lower if certain expenses had not been reduced during the applicable periods shown.
F Amounts do not include the activity of the Underlying Funds.
G Expense ratios reflect operating expenses of the class. Expenses before reductions do not reflect amounts reimbursed by the investment adviser or reductions from expense offset arrangements and do not represent the amount paid by the class during periods when reimbursements or reductions occur. Expenses net of fee waivers reflect expenses after reimbursement by the investment adviser but prior to reductions from expense offset arrangements. Expenses net of all reductions represent the net expenses paid by the class but do not include expenses of the underlying funds in which the Fund invests.
H Annualized
I Amount represents less than .005%.
See accompanying notes which are an integral part of the financial statements.
Fidelity Advisor Freedom 2005 Fund Class Z6
| | Six months ended (Unaudited) September 30, | Years endedMarch 31, |
| | 2018 | 2018 A |
| Selected Per–Share Data | | |
| Net asset value, beginning of period | $12.00 | $12.04 |
| Income from Investment Operations | | |
| Net investment income (loss)B | .11 | .13 |
| Net realized and unrealized gain (loss) | .07 | .33 |
| Total from investment operations | .18 | .46 |
| Distributions from net investment income | (.04) | (.19) |
| Distributions from net realized gain | (.30) | (.31) |
| Total distributions | (.34) | (.50) |
| Net asset value, end of period | $11.84 | $12.00 |
| Total ReturnC,D | 1.49% | 3.78% |
| Ratios to Average Net AssetsE,F | | |
| Expenses before reductions | .37%G | .39%G,H |
| Expenses net of fee waivers, if any | .37%G | .39%G,H |
| Expenses net of all reductions | .37%G | .39%G,H |
| Net investment income (loss) | 1.83%G | 1.30%G |
| Supplemental Data | | |
| Net assets, end of period (000 omitted) | $1,614 | $1,408 |
| Portfolio turnover rateE | 36%G | 20% |
A For the period June 6, 2017 (commencement of sale of shares) to March 31, 2018.
B Calculated based on average shares outstanding during the period.
C Total returns for periods of less than one year are not annualized.
D Total returns would have been lower if certain expenses had not been reduced during the applicable periods shown.
E Amounts do not include the activity of the Underlying Funds.
F Expense ratios reflect operating expenses of the class. Expenses before reductions do not reflect amounts reimbursed by the investment adviser or reductions from expense offset arrangements and do not represent the amount paid by the class during periods when reimbursements or reductions occur. Expenses net of fee waivers reflect expenses after reimbursement by the investment adviser but prior to reductions from expense offset arrangements. Expenses net of all reductions represent the net expenses paid by the class but do not include expenses of the underlying funds in which the Fund invests.
G Annualized
H On certain classes, the size and fluctuation of net assets and expense amounts may cause ratios to differ from contractual rates.
See accompanying notes which are an integral part of the financial statements.
Fidelity Advisor Freedom® 2010 Fund
Investment Summary (Unaudited)
The information in the following tables is based on the direct investments of the Fund.
Top Holdings as of September 30, 2018
| | % of fund's net assets |
| Fidelity Series Investment Grade Bond Fund | 30.2 |
| Fidelity Series Government Money Market Fund 2.12% | 11.8 |
| Fidelity Series Inflation-Protected Bond Index Fund | 8.8 |
| Fidelity Series Long-Term Treasury Bond Index Fund | 4.8 |
| Fidelity Series Large Cap Stock Fund | 4.6 |
| Fidelity Series Emerging Markets Opportunities Fund | 4.5 |
| Fidelity Series International Value Fund | 3.9 |
| Fidelity Series International Growth Fund | 3.9 |
| Fidelity Series Short-Term Credit Fund | 3.1 |
| Fidelity Series Stock Selector Large Cap Value Fund | 3.0 |
| | 78.6 |
Asset Allocation (% of fund's net assets)
| Period end |
| | Domestic Equity Funds | 24.0% |
| | International Equity Funds | 14.2% |
| | Bond Funds | 46.7% |
| | Short-Term Funds | 15.1% |
| | Short-Term Investments | 0.1% |
| | Net Other Assets (Liabilities)* | (0.1)% |

* Net Other Assets (Liabilities) are not included in the pie chart
Domestic Equity Funds category includes Fidelity Series Commodity Strategy Fund which invests in commodity-related investments.
Fidelity Advisor Freedom® 2010 Fund
Schedule of Investments September 30, 2018 (Unaudited)
Showing Percentage of Net Assets
| U.S. Treasury Obligations - 0.1% | | | |
| | | Principal Amount | Value |
| U.S. Treasury Bills, yield at date of purchase 1.97% to 2.09% 11/1/18 to 11/29/18 (a) | | | |
| (Cost $269,116) | | 270,000 | 269,096 |
| | | Shares | Value |
|
| Domestic Equity Funds - 24.0% | | | |
| Fidelity Advisor Series Equity Growth Fund (b) | | 778,653 | $12,037,974 |
| Fidelity Advisor Series Growth Opportunities Fund (b) | | 481,546 | 8,012,931 |
| Fidelity Advisor Series Small Cap Fund (b) | | 450,218 | 5,659,236 |
| Fidelity Series All-Sector Equity Fund (b) | | 380,831 | 5,183,113 |
| Fidelity Series Commodity Strategy Fund (b) | | 1,810,978 | 9,054,892 |
| Fidelity Series Large Cap Stock Fund (b) | | 1,312,510 | 20,908,286 |
| Fidelity Series Large Cap Value Index Fund (b) | | 170,379 | 2,248,997 |
| Fidelity Series Opportunistic Insights Fund (b) | | 563,541 | 11,186,289 |
| Fidelity Series Small Cap Opportunities Fund (b) | | 485,390 | 7,130,381 |
| Fidelity Series Stock Selector Large Cap Value Fund (b) | | 1,020,993 | 13,497,532 |
| Fidelity Series Value Discovery Fund (b) | | 972,681 | 13,315,998 |
| TOTAL DOMESTIC EQUITY FUNDS | | | |
| (Cost $80,264,632) | | | 108,235,629 |
|
| International Equity Funds - 14.2% | | | |
| Fidelity Series Canada Fund (b) | | 162,310 | 1,754,567 |
| Fidelity Series Emerging Markets Fund (b) | | 245,677 | 2,380,615 |
| Fidelity Series Emerging Markets Opportunities Fund (b) | | 1,053,553 | 20,217,687 |
| Fidelity Series International Growth Fund (b) | | 1,077,241 | 17,666,746 |
| Fidelity Series International Small Cap Fund (b) | | 233,606 | 4,181,551 |
| Fidelity Series International Value Fund (b) | | 1,681,238 | 17,686,621 |
| TOTAL INTERNATIONAL EQUITY FUNDS | | | |
| (Cost $46,922,499) | | | 63,887,787 |
|
| Bond Funds - 46.7% | | | |
| Fidelity Series Emerging Markets Debt Fund (b) | | 351,870 | 3,353,321 |
| Fidelity Series Floating Rate High Income Fund (b) | | 115,124 | 1,095,979 |
| Fidelity Series High Income Fund (b) | | 625,176 | 6,007,945 |
| Fidelity Series Inflation-Protected Bond Index Fund (b) | | 4,093,385 | 39,746,764 |
| Fidelity Series International Credit Fund (b) | | 25,922 | 254,816 |
| Fidelity Series Investment Grade Bond Fund (b) | | 12,484,201 | 135,952,954 |
| Fidelity Series Long-Term Treasury Bond Index Fund (b) | | 2,639,863 | 21,752,473 |
| Fidelity Series Real Estate Income Fund (b) | | 202,097 | 2,178,606 |
| TOTAL BOND FUNDS | | | |
| (Cost $211,938,957) | | | 210,342,858 |
|
| Short-Term Funds - 15.1% | | | |
| Fidelity Cash Central Fund, 2.11% (c) | | 780,300 | 780,456 |
| Fidelity Series Government Money Market Fund 2.12% (b)(d) | | 53,513,501 | 53,513,501 |
| Fidelity Series Short-Term Credit Fund (b) | | 1,421,064 | 14,011,692 |
| TOTAL SHORT-TERM FUNDS | | | |
| (Cost $68,449,034) | | | 68,305,649 |
| TOTAL INVESTMENT IN SECURITIES - 100.1% | | | |
| (Cost $407,844,238) | | | 451,041,019 |
| NET OTHER ASSETS (LIABILITIES) - (0.1)% | | | (246,813) |
| NET ASSETS - 100% | | | $450,794,206 |
| Futures Contracts | | | | | |
| | Number of contracts | Expiration Date | Notional Amount | Value | Unrealized Appreciation/(Depreciation) |
| Purchased | | | | | |
| Equity Index Contracts | | | | | |
| ICE E-mini MSCI EAFE Index Contracts (United States) | 11 | Dec. 2018 | $1,086,525 | $1,039 | $1,039 |
| ICE E-mini MSCI Emerging Markets Index Contracts (United States) | 25 | Dec. 2018 | 1,312,125 | 27,226 | 27,226 |
| | | | | | 28,265 |
| Sold | | | | | |
| Equity Index Contracts | | | | | |
| CME E-mini S&P 500 Index Contracts (United States) | 17 | Dec. 2018 | 2,481,150 | (1,053) | (1,053) |
| TOTAL FUTURES CONTRACTS | | | | | $27,212 |
The notional amount of futures purchased as a percentage of Net Assets is 0.5%
The notional amount of futures sold as a percentage of Net Assets is 0.6%
Legend
(a) Security or a portion of the security was pledged to cover margin requirements for futures contracts. At period end, the value of securities pledged amounted to $239,201.
(b) Affiliated Fund
(c) Affiliated fund that is generally available only to investment companies and other accounts managed by Fidelity Investments. The rate quoted is the annualized seven-day yield of the fund at period end. A complete unaudited listing of the fund's holdings as of its most recent quarter end is available upon request. In addition, each Fidelity Central Fund's financial statements are available on the SEC's website or upon request.
(d) The rate quoted is the annualized seven-day yield of the fund at period end.
Affiliated Central Funds
Information regarding fiscal year to date income earned by the Fund from investments in Fidelity Central Funds is as follows:
| Fund | Income earned |
| Fidelity Cash Central Fund | $2,700 |
| Total | $2,700 |
Amounts in the income column in the above table include any capital gain distributions from underlying funds, which are presented in the corresponding line-item in the Statement of Operations if applicable.
Affiliated Underlying Funds
Fiscal year to date information regarding the Fund's investments in affiliated Underlying Funds, excluding any Money Market Central Funds, is presented below. Exchanges between classes of the same affiliated Underlying Funds may occur.
| Affiliate | Value, beginning of period | Purchases | Sales Proceeds | Dividend Income | Realized Gain (loss) | Change in Unrealized appreciation (depreciation) | Value, end of period |
| Fidelity Advisor Series Equity Growth Fund | $13,023,682 | $159,249 | $2,901,979 | $ - | $695,307 | $1,061,715 | $12,037,974 |
| Fidelity Advisor Series Equity Value Fund | 15,002,185 | 588,925 | 2,706,061 | 430,024 | 527,009 | (2,940,962) | - |
| Fidelity Advisor Series Growth & Income Fund | 22,959,845 | 2,050,281 | 4,728,608 | 1,822,417 | 237,531 | (5,119,432) | - |
| Fidelity Advisor Series Growth Opportunities Fund | 8,558,055 | 104,991 | 2,720,091 | - | 927,438 | 1,142,538 | 8,012,931 |
| Fidelity Advisor Series Opportunistic Insights Fund | 12,165,303 | 935,874 | 2,712,466 | 816,271 | 1,050,228 | (5,161,232) | - |
| Fidelity Advisor Series Small Cap Fund | 6,526,055 | 77,854 | 1,311,018 | - | 236,805 | 129,540 | 5,659,236 |
| Fidelity Advisor Series Stock Selector Large Cap Value Fund | 15,144,178 | 1,233,923 | 2,700,278 | 1,089,541 | 548,007 | (2,987,555) | - |
| Fidelity Series 100 Index Fund | 6,480,007 | - | 6,717,475 | - | 2,651,503 | (2,414,035) | - |
| Fidelity Series All-Sector Equity Fund | 8,936,502 | 105,106 | 4,787,644 | - | 1,048,111 | (118,962) | 5,183,113 |
| Fidelity Series Canada Fund | 1,983,826 | 23,183 | 372,930 | - | 5,894 | 114,594 | 1,754,567 |
| Fidelity Series Commodity Strategy Fund | 10,008,890 | 1,424,419 | 1,630,731 | 544,044 | (605,354) | (142,332) | 9,054,892 |
| Fidelity Series Emerging Markets Debt Fund | 3,656,577 | 138,457 | 243,933 | 104,444 | (8,575) | (189,205) | 3,353,321 |
| Fidelity Series Emerging Markets Fund | - | 2,374,526 | - | - | - | 6,089 | 2,380,615 |
| Fidelity Series Emerging Markets Opportunities Fund | 23,275,501 | 1,815,459 | 1,980,454 | - | 109,256 | (3,002,075) | 20,217,687 |
| Fidelity Series Floating Rate High Income Fund | 1,152,519 | 44,028 | 101,637 | 29,854 | (3,896) | 4,965 | 1,095,979 |
| Fidelity Series Government Money Market Fund 2.12% | 68,838,813 | 7,685,041 | 23,010,353 | 609,323 | - | - | 53,513,501 |
| Fidelity Series High Income Fund | 7,117,769 | 257,106 | 1,420,679 | 183,289 | (58,309) | 112,058 | 6,007,945 |
| Fidelity Series Inflation-Protected Bond Index Fund | 12,966,248 | 28,854,794 | 1,944,372 | 39,615 | (33,551) | (96,355) | 39,746,764 |
| Fidelity Series International Credit Fund | 254,240 | 3,134 | - | 3,133 | - | (2,558) | 254,816 |
| Fidelity Series International Growth Fund | 20,582,564 | 574,179 | 3,758,213 | - | 1,370,793 | (1,102,577) | 17,666,746 |
| Fidelity Series International Small Cap Fund | 5,097,991 | 145,755 | 877,156 | - | 305,769 | (490,808) | 4,181,551 |
| Fidelity Series International Value Fund | 20,222,495 | 233,309 | 2,666,518 | - | 322,055 | (424,720) | 17,686,621 |
| Fidelity Series Investment Grade Bond Fund | 150,574,589 | 3,774,734 | 16,714,209 | 2,033,159 | (434,918) | (1,247,242) | 135,952,954 |
| Fidelity Series Large Cap Stock Fund | - | 53,996 | 26,868 | - | (204) | 5,481,745 | 20,908,286 |
| Fidelity Series Large Cap Value Index Fund | 2,542,533 | 32,080 | 497,058 | - | 107,585 | 63,857 | 2,248,997 |
| Fidelity Series Long-Term Treasury Bond Index Fund | 10,266,228 | 13,874,429 | 1,684,245 | 207,104 | (53,817) | (650,122) | 21,752,473 |
| Fidelity Series Opportunistic Insights Fund | - | 28,930 | 15,169 | - | (72) | 4,894,893 | 11,186,289 |
| Fidelity Series Real Estate Equity Fund | 1,572,454 | 13,344 | 1,630,378 | 11,220 | 280,304 | (235,724) | - |
| Fidelity Series Real Estate Income Fund | 2,235,813 | 119,682 | 191,103 | 93,008 | 10,469 | 3,745 | 2,178,606 |
| Fidelity Series Short-Term Credit Fund | 16,750,769 | 380,920 | 3,120,266 | 183,715 | (34,792) | 35,061 | 14,011,692 |
| Fidelity Series Small Cap Opportunities Fund | 7,960,899 | 649,183 | 1,818,804 | 552,865 | 700,179 | (361,076) | 7,130,381 |
| Fidelity Series Stock Selector Large Cap Value Fund | - | 38,641 | 91,069 | - | 383 | 2,311,302 | 13,497,532 |
| Fidelity Series Value Discovery Fund | - | 34,670 | 17,365 | - | (155) | 2,827,752 | 13,315,998 |
| | $475,856,530 | $67,830,202 | $95,099,130 | $8,753,026 | $9,900,983 | $(8,497,118) | $449,991,467 |
Amounts in the income column in the above table include any capital gain distributions from underlying funds, which are presented in the corresponding line-item in the Statement of Operations if applicable.
Investment Valuation
The following is a summary of the inputs used, as of September 30, 2018, involving the Fund's assets and liabilities carried at fair value. The inputs or methodology used for valuing securities may not be an indication of the risk associated with investing in those securities. For more information on valuation inputs, and their aggregation into the levels used below, please refer to the Investment Valuation section in the accompanying Notes to Financial Statements.
| | Valuation Inputs at Reporting Date: |
| Description | Total | Level 1 | Level 2 | Level 3 |
| Investments in Securities: | | | | |
| Other Short-Term Investments | $269,096 | $-- | $269,096 | $-- |
| Domestic Equity Funds | 108,235,629 | 108,235,629 | -- | -- |
| International Equity Funds | 63,887,787 | 63,887,787 | -- | -- |
| Bond Funds | 210,342,858 | 210,342,858 | -- | -- |
| Short-Term Funds | 68,305,649 | 68,305,649 | -- | -- |
| Total Investments in Securities: | $451,041,019 | $450,771,923 | $269,096 | $-- |
| Derivative Instruments: | | | | |
| Assets | | | | |
| Futures Contracts | $28,265 | $28,265 | $-- | $-- |
| Total Assets | $28,265 | $28,265 | $-- | $-- |
| Liabilities | | | | |
| Futures Contracts | $(1,053) | $(1,053) | $-- | $-- |
| Total Liabilities | $(1,053) | $(1,053) | $-- | $-- |
| Total Derivative Instruments: | $27,212 | $27,212 | $-- | $-- |
Value of Derivative Instruments
The following table is a summary of the Fund's value of derivative instruments by primary risk exposure as of September 30, 2018. For additional information on derivative instruments, please refer to the Derivative Instruments section in the accompanying Notes to Financial Statements.
| Primary Risk Exposure / Derivative Type | Value |
| | Asset | Liability |
| Equity Risk | | |
| Futures Contracts(a) | $28,265 | $(1,053) |
| Total Equity Risk | 28,265 | (1,053) |
| Total Value of Derivatives | $28,265 | $(1,053) |
(a) Reflects gross cumulative appreciation (depreciation) on futures contracts as presented in the Schedule of Investments. In the Statement of Assets and Liabilities, the period end daily variation margin is included in receivable or payable for daily variation margin on futures contracts, and the net cumulative appreciation (depreciation) is included in net unrealized appreciation (depreciation).
See accompanying notes which are an integral part of the financial statements.
Fidelity Advisor Freedom® 2010 Fund
Financial Statements
Statement of Assets and Liabilities
| | | September 30, 2018 (Unaudited) |
| Assets | | |
Investment in securities, at value — See accompanying schedule:
Unaffiliated issuers (cost $269,116) | $269,096 | |
| Fidelity Central Funds (cost $780,456) | 780,456 | |
| Other affiliated issuers (cost $406,794,666) | 449,991,467 | |
| Total Investment in Securities (cost $407,844,238) | | $451,041,019 |
| Cash | | 25,475 |
| Receivable for investments sold | | 1,888,552 |
| Receivable for fund shares sold | | 360,122 |
| Distributions receivable from Fidelity Central Funds | | 1,159 |
| Total assets | | 453,316,327 |
| Liabilities | | |
| Payable for investments purchased | $1,902,072 | |
| Payable for fund shares redeemed | 312,009 | |
| Accrued management fee | 196,506 | |
| Distribution and service plan fees payable | 94,270 | |
| Payable for daily variation margin on futures contracts | 17,264 | |
| Total liabilities | | 2,522,121 |
| Net Assets | | $450,794,206 |
| Net Assets consist of: | | |
| Paid in capital | | $391,702,251 |
| Undistributed net investment income | | 3,120,956 |
| Accumulated undistributed net realized gain (loss) on investments | | 12,747,006 |
| Net unrealized appreciation (depreciation) on investments | | 43,223,993 |
| Net Assets | | $450,794,206 |
| Calculation of Maximum Offering Price | | |
| Class A: | | |
| Net Asset Value and redemption price per share ($207,131,694 ÷ 16,899,218 shares) | | $12.26 |
| Maximum offering price per share (100/94.25 of $12.26) | | $13.01 |
| Class M: | | |
| Net Asset Value and redemption price per share ($74,514,170 ÷ 6,107,574 shares) | | $12.20 |
| Maximum offering price per share (100/96.50 of $12.20) | | $12.64 |
| Class C: | | |
| Net Asset Value and offering price per share ($23,878,963 ÷ 1,973,147 shares)(a) | | $12.10 |
| Class I: | | |
| Net Asset Value, offering price and redemption price per share ($140,301,224 ÷ 11,393,341 shares) | | $12.31 |
| Class Z6: | | |
| Net Asset Value, offering price and redemption price per share ($4,968,155 ÷ 403,585 shares) | | $12.31 |
(a) Redemption price per share is equal to net asset value less any applicable contingent deferred sales charge.
See accompanying notes which are an integral part of the financial statements.
Statement of Operations
| | | Six months ended September 30, 2018 (Unaudited) |
| Investment Income | | |
| Dividends: | | |
| Affiliated issuers | | $4,901,205 |
| Interest | | 1,122 |
| Income from Fidelity Central Funds | | 2,700 |
| Total income | | 4,905,027 |
| Expenses | | |
| Management fee | $1,210,792 | |
| Distribution and service plan fees | 586,155 | |
| Independent trustees' fees and expenses | 1,142 | |
| Total expenses before reductions | 1,798,089 | |
| Expense reductions | (35) | |
| Total expenses after reductions | | 1,798,054 |
| Net investment income (loss) | | 3,106,973 |
| Realized and Unrealized Gain (Loss) | | |
| Net realized gain (loss) on: | | |
| Investment securities: | | |
| Fidelity Central Funds | (24) | |
| Other affiliated issuers | 9,900,983 | |
| Futures contracts | (46,257) | |
| Capital gain distributions from underlying funds: | | |
| Affiliated issuers | 3,851,821 | |
| Total net realized gain (loss) | | 13,706,523 |
| Change in net unrealized appreciation (depreciation) on: | | |
| Investment securities: | | |
| Unaffiliated issuers | (17) | |
| Affiliated issuers | (8,497,118) | |
| Futures contracts | 27,212 | |
| Total change in net unrealized appreciation (depreciation) | | (8,469,923) |
| Net gain (loss) | | 5,236,600 |
| Net increase (decrease) in net assets resulting from operations | | $8,343,573 |
See accompanying notes which are an integral part of the financial statements.
Statement of Changes in Net Assets
| | Six months ended September 30, 2018 (Unaudited) | Year ended March 31, 2018 |
| Increase (Decrease) in Net Assets | | |
| Operations | | |
| Net investment income (loss) | $3,106,973 | $6,311,536 |
| Net realized gain (loss) | 13,706,523 | 29,999,898 |
| Change in net unrealized appreciation (depreciation) | (8,469,923) | (1,539,645) |
| Net increase (decrease) in net assets resulting from operations | 8,343,573 | 34,771,789 |
| Distributions to shareholders from net investment income | (626,664) | (6,662,107) |
| Distributions to shareholders from net realized gain | (13,936,354) | (24,206,337) |
| Total distributions | (14,563,018) | (30,868,444) |
| Share transactions - net increase (decrease) | (18,597,246) | (36,175,930) |
| Total increase (decrease) in net assets | (24,816,691) | (32,272,585) |
| Net Assets | | |
| Beginning of period | 475,610,897 | 507,883,482 |
| End of period | $450,794,206 | $475,610,897 |
| Other Information | | |
| Undistributed net investment income end of period | $3,120,956 | $640,647 |
See accompanying notes which are an integral part of the financial statements.
Financial Highlights
Fidelity Advisor Freedom 2010 Fund Class A
| | Six months ended (Unaudited) September 30, | Years endedMarch 31, | | | | |
| | 2018 | 2018 | 2017 | 2016 | 2015 | 2014 |
| Selected Per–Share Data | | | | | | |
| Net asset value, beginning of period | $12.42 | $12.34 | $11.87 | $12.72 | $12.91 | $12.50 |
| Income from Investment Operations | | | | | | |
| Net investment income (loss)A | .08 | .16 | .18 | .20 | .20 | .15 |
| Net realized and unrealized gain (loss) | .15 | .72 | .84 | (.41) | .44 | .82 |
| Total from investment operations | .23 | .88 | 1.02 | (.21) | .64 | .97 |
| Distributions from net investment income | (.02) | (.17) | (.19) | (.21) | (.22) | (.14) |
| Distributions from net realized gain | (.37) | (.62) | (.36) | (.44) | (.61) | (.42) |
| Total distributions | (.39) | (.80)B | (.55) | (.64)C | (.83) | (.56) |
| Net asset value, end of period | $12.26 | $12.42 | $12.34 | $11.87 | $12.72 | $12.91 |
| Total ReturnD,E,F | 1.85% | 7.18% | 8.87% | (1.67)% | 5.08% | 7.86% |
| Ratios to Average Net AssetsG,H | | | | | | |
| Expenses before reductions | .77%I,J | .69% | .25% | .25% | .25% | .25% |
| Expenses net of fee waivers, if any | .77%I,J | .69% | .25% | .25% | .25% | .25% |
| Expenses net of all reductions | .77%I,J | .69% | .25% | .25% | .25% | .25% |
| Net investment income (loss) | 1.34%I | 1.29% | 1.45% | 1.63% | 1.55% | 1.15% |
| Supplemental Data | | | | | | |
| Net assets, end of period (000 omitted) | $207,132 | $230,553 | $263,496 | $328,232 | $431,498 | $502,834 |
| Portfolio turnover rateG | 29%I | 20% | 26% | 21% | 22% | 39% |
A Calculated based on average shares outstanding during the period.
B Total distributions of $.80 per share is comprised of distributions from net investment income of $.173 and distributions from net realized gain of $.624 per share.
C Total distributions of $.64 per share is comprised of distributions from net investment income of $.206 and distributions from net realized gain of $.437 per share.
D Total returns for periods of less than one year are not annualized.
E Total returns would have been lower if certain expenses had not been reduced during the applicable periods shown.
F Total returns do not include the effect of the sales charges.
G Amounts do not include the activity of the Underlying Funds.
H Expense ratios reflect operating expenses of the class. Expenses before reductions do not reflect amounts reimbursed by the investment adviser or reductions from expense offset arrangements and do not represent the amount paid by the class during periods when reimbursements or reductions occur. Expenses net of fee waivers reflect expenses after reimbursement by the investment adviser but prior to reductions from expense offset arrangements. Expenses net of all reductions represent the net expenses paid by the class but do not include expenses of the underlying funds in which the Fund invests.
I Annualized
J On certain classes, the size and fluctuation of net assets and expense amounts may cause ratios to differ from contractual rates
See accompanying notes which are an integral part of the financial statements.
Fidelity Advisor Freedom 2010 Fund Class M
| | Six months ended (Unaudited) September 30, | Years endedMarch 31, | | | | |
| | 2018 | 2018 | 2017 | 2016 | 2015 | 2014 |
| Selected Per–Share Data | | | | | | |
| Net asset value, beginning of period | $12.37 | $12.30 | $11.83 | $12.68 | $12.87 | $12.46 |
| Income from Investment Operations | | | | | | |
| Net investment income (loss)A | .07 | .13 | .14 | .17 | .17 | .11 |
| Net realized and unrealized gain (loss) | .14 | .71 | .85 | (.41) | .43 | .83 |
| Total from investment operations | .21 | .84 | .99 | (.24) | .60 | .94 |
| Distributions from net investment income | (.01) | (.15) | (.16) | (.18) | (.18) | (.11) |
| Distributions from net realized gain | (.37) | (.62) | (.36) | (.44) | (.61) | (.42) |
| Total distributions | (.38) | (.77) | (.52) | (.61)B | (.79) | (.53) |
| Net asset value, end of period | $12.20 | $12.37 | $12.30 | $11.83 | $12.68 | $12.87 |
| Total ReturnC,D,E | 1.70% | 6.89% | 8.63% | (1.92)% | 4.81% | 7.62% |
| Ratios to Average Net AssetsF,G | | | | | | |
| Expenses before reductions | 1.02%H,I | .94% | .50% | .50% | .50% | .50% |
| Expenses net of fee waivers, if any | 1.02%H,I | .94% | .50% | .50% | .50% | .50% |
| Expenses net of all reductions | 1.02%H,I | .94% | .50% | .50% | .50% | .50% |
| Net investment income (loss) | 1.09%H | 1.03% | 1.20% | 1.38% | 1.30% | .90% |
| Supplemental Data | | | | | | |
| Net assets, end of period (000 omitted) | $74,514 | $77,068 | $83,881 | $92,543 | $106,189 | $124,997 |
| Portfolio turnover rateF | 29%H | 20% | 26% | 21% | 22% | 39% |
A Calculated based on average shares outstanding during the period.
B Total distributions of $.61 per share is comprised of distributions from net investment income of $.176 and distributions from net realized gain of $.437 per share.
C Total returns for periods of less than one year are not annualized.
D Total returns would have been lower if certain expenses had not been reduced during the applicable periods shown.
E Total returns do not include the effect of the sales charges.
F Amounts do not include the activity of the Underlying Funds.
G Expense ratios reflect operating expenses of the class. Expenses before reductions do not reflect amounts reimbursed by the investment adviser or reductions from expense offset arrangements and do not represent the amount paid by the class during periods when reimbursements or reductions occur. Expenses net of fee waivers reflect expenses after reimbursement by the investment adviser but prior to reductions from expense offset arrangements. Expenses net of all reductions represent the net expenses paid by the class but do not include expenses of the underlying funds in which the Fund invests.
H Annualized
I On certain classes, the size and fluctuation of net assets and expense amounts may cause ratios to differ from contractual rates.
See accompanying notes which are an integral part of the financial statements.
Fidelity Advisor Freedom 2010 Fund Class C
| | Six months ended (Unaudited) September 30, | Years endedMarch 31, | | | | |
| | 2018 | 2018 | 2017 | 2016 | 2015 | 2014 |
| Selected Per–Share Data | | | | | | |
| Net asset value, beginning of period | $12.29 | $12.22 | $11.76 | $12.60 | $12.79 | $12.39 |
| Income from Investment Operations | | | | | | |
| Net investment income (loss)A | .04 | .07 | .08 | .11 | .10 | .05 |
| Net realized and unrealized gain (loss) | .13 | .70 | .84 | (.40) | .44 | .81 |
| Total from investment operations | .17 | .77 | .92 | (.29) | .54 | .86 |
| Distributions from net investment income | – | (.08) | (.10) | (.11) | (.12) | (.05) |
| Distributions from net realized gain | (.36) | (.62) | (.36) | (.44) | (.61) | (.41) |
| Total distributions | (.36) | (.70) | (.46) | (.55) | (.73) | (.46) |
| Net asset value, end of period | $12.10 | $12.29 | $12.22 | $11.76 | $12.60 | $12.79 |
| Total ReturnB,C,D | 1.42% | 6.37% | 8.07% | (2.39)% | 4.33% | 7.04% |
| Ratios to Average Net AssetsE,F | | | | | | |
| Expenses before reductions | 1.52%G,H | 1.44% | 1.00% | 1.00% | 1.00% | 1.00% |
| Expenses net of fee waivers, if any | 1.52%G,H | 1.44% | 1.00% | 1.00% | 1.00% | 1.00% |
| Expenses net of all reductions | 1.52%G,H | 1.44% | 1.00% | 1.00% | 1.00% | 1.00% |
| Net investment income (loss) | .59%G | .54% | .70% | .88% | .80% | .40% |
| Supplemental Data | | | | | | |
| Net assets, end of period (000 omitted) | $23,879 | $26,227 | $29,290 | $30,150 | $34,839 | $36,622 |
| Portfolio turnover rateE | 29%G | 20% | 26% | 21% | 22% | 39% |
A Calculated based on average shares outstanding during the period.
B Total returns for periods of less than one year are not annualized.
C Total returns would have been lower if certain expenses had not been reduced during the applicable periods shown.
D Total returns do not include the effect of the contingent deferred sales charge.
E Amounts do not include the activity of the Underlying Funds.
F Expense ratios reflect operating expenses of the class. Expenses before reductions do not reflect amounts reimbursed by the investment adviser or reductions from expense offset arrangements and do not represent the amount paid by the class during periods when reimbursements or reductions occur. Expenses net of fee waivers reflect expenses after reimbursement by the investment adviser but prior to reductions from expense offset arrangements. Expenses net of all reductions represent the net expenses paid by the class but do not include expenses of the underlying funds in which the Fund invests.
G Annualized
H On certain classes, the size and fluctuation of net assets and expense amounts may cause ratios to differ from contractual rates.
See accompanying notes which are an integral part of the financial statements.
Fidelity Advisor Freedom 2010 Fund Class I
| | Six months ended (Unaudited) September 30, | Years endedMarch 31, | | | | |
| | 2018 | 2018 | 2017 | 2016 | 2015 | 2014 |
| Selected Per–Share Data | | | | | | |
| Net asset value, beginning of period | $12.47 | $12.40 | $11.92 | $12.77 | $12.96 | $12.55 |
| Income from Investment Operations | | | | | | |
| Net investment income (loss)A | .10 | .19 | .21 | .23 | .23 | .18 |
| Net realized and unrealized gain (loss) | .14 | .72 | .85 | (.40) | .44 | .82 |
| Total from investment operations | .24 | .91 | 1.06 | (.17) | .67 | 1.00 |
| Distributions from net investment income | (.03) | (.21) | (.22) | (.24) | (.25) | (.17) |
| Distributions from net realized gain | (.37) | (.62) | (.36) | (.44) | (.61) | (.42) |
| Total distributions | (.40) | (.84)B | (.58) | (.68) | (.86) | (.59) |
| Net asset value, end of period | $12.31 | $12.47 | $12.40 | $11.92 | $12.77 | $12.96 |
| Total ReturnC,D | 1.91% | 7.39% | 9.22% | (1.40)% | 5.34% | 8.10% |
| Ratios to Average Net AssetsE,F | | | | | | |
| Expenses before reductions | .53%G | .45% | - %H | - %H | - %H | - %H |
| Expenses net of fee waivers, if any | .53%G | .45% | -% | -% | -% | -% |
| Expenses net of all reductions | .53%G | .45% | -% | -% | -% | -% |
| Net investment income (loss) | 1.59%G | 1.53% | 1.70% | 1.88% | 1.80% | 1.40% |
| Supplemental Data | | | | | | |
| Net assets, end of period (000 omitted) | $140,301 | $137,019 | $131,216 | $143,715 | $158,071 | $191,276 |
| Portfolio turnover rateE | 29%G | 20% | 26% | 21% | 22% | 39% |
A Calculated based on average shares outstanding during the period.
B Total distributions of $.84 per share is comprised of distributions from net investment income of $.212 and distributions from net realized gain of $.624 per share.
C Total returns for periods of less than one year are not annualized.
D Total returns would have been lower if certain expenses had not been reduced during the applicable periods shown.
E Amounts do not include the activity of the Underlying Funds.
F Expense ratios reflect operating expenses of the class. Expenses before reductions do not reflect amounts reimbursed by the investment adviser or reductions from expense offset arrangements and do not represent the amount paid by the class during periods when reimbursements or reductions occur. Expenses net of fee waivers reflect expenses after reimbursement by the investment adviser but prior to reductions from expense offset arrangements. Expenses net of all reductions represent the net expenses paid by the class but do not include expenses of the underlying funds in which the Fund invests.
G Annualized
H Amount represents less than .005%.
See accompanying notes which are an integral part of the financial statements.
Fidelity Advisor Freedom 2010 Fund Class Z6
| | Six months ended (Unaudited) September 30, | Years endedMarch 31, |
| | 2018 | 2018 A |
| Selected Per–Share Data | | |
| Net asset value, beginning of period | $12.47 | $12.50 |
| Income from Investment Operations | | |
| Net investment income (loss)B | .11 | .05 |
| Net realized and unrealized gain (loss) | .13 | .53 |
| Total from investment operations | .24 | .58 |
| Distributions from net investment income | (.03) | (.20) |
| Distributions from net realized gain | (.37) | (.42) |
| Total distributions | (.40) | (.61)C |
| Net asset value, end of period | $12.31 | $12.47 |
| Total ReturnD,E | 1.98% | 4.62% |
| Ratios to Average Net AssetsF,G | | |
| Expenses before reductions | .39%H | .41%H,I |
| Expenses net of fee waivers, if any | .39%H | .41%H,I |
| Expenses net of all reductions | .39%H | .41%H,I |
| Net investment income (loss) | 1.73%H | .45%H |
| Supplemental Data | | |
| Net assets, end of period (000 omitted) | $4,968 | $4,744 |
| Portfolio turnover rateF | 29%H | 20% |
A For the period June 6, 2017 (commencement of sale of shares) to March 31, 2018.
B Calculated based on average shares outstanding during the period.
C Total distributions of $.61 per share is comprised of distributions from net investment income of $.195 and distributions from net realized gain of $.416 per share.
D Total returns for periods of less than one year are not annualized.
E Total returns would have been lower if certain expenses had not been reduced during the applicable periods shown.
F Amounts do not include the activity of the Underlying Funds.
G Expense ratios reflect operating expenses of the class. Expenses before reductions do not reflect amounts reimbursed by the investment adviser or reductions from expense offset arrangements and do not represent the amount paid by the class during periods when reimbursements or reductions occur. Expenses net of fee waivers reflect expenses after reimbursement by the investment adviser but prior to reductions from expense offset arrangements. Expenses net of all reductions represent the net expenses paid by the class but do not include expenses of the underlying funds in which the Fund invests.
H Annualized
I On certain classes, the size and fluctuation of net assets and expense amounts may cause ratios to differ from contractual rates.
See accompanying notes which are an integral part of the financial statements.
Fidelity Advisor Freedom® 2015 Fund
Investment Summary (Unaudited)
The information in the following tables is based on the direct investments of the Fund.
Top Holdings as of September 30, 2018
| | % of fund's net assets |
| Fidelity Series Investment Grade Bond Fund | 26.5 |
| Fidelity Series Government Money Market Fund 2.12% | 8.9 |
| Fidelity Series Inflation-Protected Bond Index Fund | 6.9 |
| Fidelity Series Large Cap Stock Fund | 6.0 |
| Fidelity Series Emerging Markets Opportunities Fund | 5.1 |
| Fidelity Series Long-Term Treasury Bond Index Fund | 4.9 |
| Fidelity Series International Growth Fund | 4.9 |
| Fidelity Series International Value Fund | 4.9 |
| Fidelity Series Stock Selector Large Cap Value Fund | 3.9 |
| Fidelity Series Value Discovery Fund | 3.8 |
| | 75.8 |
Asset Allocation (% of fund's net assets)
| Period end |
| | Domestic Equity Funds | 30.6% |
| | International Equity Funds | 16.9% |
| | Bond Funds | 41.1% |
| | Short-Term Funds | 11.4% |
| | Short-Term Investments | 0.1% |
| | Net Other Assets (Liabilities)* | (0.1)% |

* Net Other Assets (Liabilities) are not included in the pie chart
Domestic Equity Funds category includes Fidelity Series Commodity Strategy Fund which invests in commodity-related investments.
Fidelity Advisor Freedom® 2015 Fund
Schedule of Investments September 30, 2018 (Unaudited)
Showing Percentage of Net Assets
| U.S. Treasury Obligations - 0.1% | | | |
| | | Principal Amount | Value |
| U.S. Treasury Bills, yield at date of purchase 1.97% to 2.09% 11/1/18 to 11/29/18 (a) | | | |
| (Cost $727,768) | | 730,000 | 727,716 |
| | | Shares | Value |
|
| Domestic Equity Funds - 30.6% | | | |
| Fidelity Advisor Series Equity Growth Fund (b) | | 2,380,504 | $36,802,593 |
| Fidelity Advisor Series Growth Opportunities Fund (b) | | 1,474,936 | 24,542,929 |
| Fidelity Advisor Series Small Cap Fund (b) | | 1,381,670 | 17,367,591 |
| Fidelity Series All-Sector Equity Fund (b) | | 1,174,373 | 15,983,211 |
| Fidelity Series Commodity Strategy Fund (b) | | 4,262,930 | 21,314,648 |
| Fidelity Series Large Cap Stock Fund (b) | | 4,007,165 | 63,834,138 |
| Fidelity Series Large Cap Value Index Fund (b) | | 528,940 | 6,982,009 |
| Fidelity Series Opportunistic Insights Fund (b) | | 1,723,400 | 34,209,493 |
| Fidelity Series Small Cap Opportunities Fund (b) | | 1,487,144 | 21,846,151 |
| Fidelity Series Stock Selector Large Cap Value Fund (b) | | 3,120,586 | 41,254,145 |
| Fidelity Series Value Discovery Fund (b) | | 2,973,028 | 40,700,750 |
| TOTAL DOMESTIC EQUITY FUNDS | | | |
| (Cost $237,758,390) | | | 324,837,658 |
|
| International Equity Funds - 16.9% | | | |
| Fidelity Series Canada Fund (b) | | 469,784 | 5,078,361 |
| Fidelity Series Emerging Markets Fund (b) | | 477,859 | 4,630,450 |
| Fidelity Series Emerging Markets Opportunities Fund (b) | | 2,833,564 | 54,376,086 |
| Fidelity Series International Growth Fund (b) | | 3,143,319 | 51,550,432 |
| Fidelity Series International Small Cap Fund (b) | | 677,941 | 12,135,145 |
| Fidelity Series International Value Fund (b) | | 4,895,921 | 51,505,093 |
| TOTAL INTERNATIONAL EQUITY FUNDS | | | |
| (Cost $128,482,828) | | | 179,275,567 |
|
| Bond Funds - 41.1% | | | |
| Fidelity Series Emerging Markets Debt Fund (b) | | 800,149 | 7,625,416 |
| Fidelity Series Floating Rate High Income Fund (b) | | 265,953 | 2,531,872 |
| Fidelity Series High Income Fund (b) | | 1,491,639 | 14,334,652 |
| Fidelity Series Inflation-Protected Bond Index Fund (b) | | 7,529,224 | 73,108,768 |
| Fidelity Series International Credit Fund (b) | | 61,699 | 606,505 |
| Fidelity Series Investment Grade Bond Fund (b) | | 25,836,693 | 281,361,590 |
| Fidelity Series Long-Term Treasury Bond Index Fund (b) | | 6,353,810 | 52,355,392 |
| Fidelity Series Real Estate Income Fund (b) | | 472,246 | 5,090,813 |
| TOTAL BOND FUNDS | | | |
| (Cost $440,260,965) | | | 437,015,008 |
|
| Short-Term Funds - 11.4% | | | |
| Fidelity Cash Central Fund, 2.11% (c) | | 1,548,501 | 1,548,811 |
| Fidelity Series Government Money Market Fund 2.12% (b)(d) | | 94,047,905 | 94,047,905 |
| Fidelity Series Short-Term Credit Fund (b) | | 2,596,030 | 25,596,854 |
| TOTAL SHORT-TERM FUNDS | | | |
| (Cost $121,479,616) | | | 121,193,570 |
| TOTAL INVESTMENT IN SECURITIES - 100.1% | | | |
| (Cost $928,709,567) | | | 1,063,049,519 |
| NET OTHER ASSETS (LIABILITIES) - (0.1)% | | | (749,484) |
| NET ASSETS - 100% | | | $1,062,300,035 |
| Futures Contracts | | | | | |
| | Number of contracts | Expiration Date | Notional Amount | Value | Unrealized Appreciation/(Depreciation) |
| Purchased | | | | | |
| Equity Index Contracts | | | | | |
| ICE E-mini MSCI Emerging Markets Index Contracts (United States) | 92 | Dec. 2018 | $4,828,620 | $95,080 | $95,080 |
| Sold | | | | | |
| Equity Index Contracts | | | | | |
| CME E-mini S&P 500 Index Contracts (United States) | 50 | Dec. 2018 | 7,297,500 | (6,296) | (6,296) |
| TOTAL FUTURES CONTRACTS | | | | | $88,784 |
The notional amount of futures purchased as a percentage of Net Assets is 0.5%
The notional amount of futures sold as a percentage of Net Assets is 0.7%
Legend
(a) Security or a portion of the security was pledged to cover margin requirements for futures contracts. At period end, the value of securities pledged amounted to $580,204.
(b) Affiliated Fund
(c) Affiliated fund that is generally available only to investment companies and other accounts managed by Fidelity Investments. The rate quoted is the annualized seven-day yield of the fund at period end. A complete unaudited listing of the fund's holdings as of its most recent quarter end is available upon request. In addition, each Fidelity Central Fund's financial statements are available on the SEC's website or upon request.
(d) The rate quoted is the annualized seven-day yield of the fund at period end.
Affiliated Central Funds
Information regarding fiscal year to date income earned by the Fund from investments in Fidelity Central Funds is as follows:
| Fund | Income earned |
| Fidelity Cash Central Fund | $5,410 |
| Total | $5,410 |
Amounts in the income column in the above table include any capital gain distributions from underlying funds, which are presented in the corresponding line-item in the Statement of Operations if applicable.
Affiliated Underlying Funds
Fiscal year to date information regarding the Fund's investments in affiliated Underlying Funds, excluding any Money Market Central Funds, is presented below. Exchanges between classes of the same affiliated Underlying Funds may occur.
| Affiliate | Value, beginning of period | Purchases | Sales Proceeds | Dividend Income | Realized Gain (loss) | Change in Unrealized appreciation (depreciation) | Value, end of period |
| Fidelity Advisor Series Equity Growth Fund | $37,891,446 | $282,916 | $6,552,137 | $ - | $1,438,268 | $3,742,100 | $36,802,593 |
| Fidelity Advisor Series Equity Value Fund | 43,651,783 | 1,656,198 | 5,722,681 | 1,314,556 | 1,056,853 | (8,551,333) | - |
| Fidelity Advisor Series Growth & Income Fund | 66,814,273 | 5,971,811 | 10,530,736 | 5,486,222 | 504,557 | (14,109,562) | - |
| Fidelity Advisor Series Growth Opportunities Fund | 24,894,051 | 186,011 | 6,639,321 | - | 2,269,083 | 3,833,105 | 24,542,929 |
| Fidelity Advisor Series Opportunistic Insights Fund | 35,344,528 | 2,747,572 | 6,063,396 | 2,496,531 | 2,234,625 | (15,007,785) | - |
| Fidelity Advisor Series Small Cap Fund | 18,976,799 | 138,686 | 2,813,462 | - | 498,158 | 567,410 | 17,367,591 |
| Fidelity Advisor Series Stock Selector Large Cap Value Fund | 44,062,046 | 3,642,226 | 5,808,563 | 3,336,667 | 1,101,002 | (8,686,915) | - |
| Fidelity Series 100 Index Fund | 18,832,089 | - | 19,671,736 | - | 9,254,652 | (8,415,005) | - |
| Fidelity Series All-Sector Equity Fund | 25,994,366 | 209,736 | 12,952,866 | - | 2,828,696 | (96,721) | 15,983,211 |
| Fidelity Series Canada Fund | 5,562,712 | 39,386 | 861,216 | - | 12,463 | 325,016 | 5,078,361 |
| Fidelity Series Commodity Strategy Fund | 23,427,565 | 3,190,650 | 3,547,750 | 1,279,772 | (1,344,245) | (411,572) | 21,314,648 |
| Fidelity Series Emerging Markets Debt Fund | 8,307,794 | 284,419 | 517,220 | 237,472 | (23,044) | (426,533) | 7,625,416 |
| Fidelity Series Emerging Markets Fund | - | 4,628,714 | - | - | - | 1,736 | 4,630,450 |
| Fidelity Series Emerging Markets Opportunities Fund | 62,250,067 | 4,603,856 | 4,695,710 | - | 219,527 | (8,001,654) | 54,376,086 |
| Fidelity Series Floating Rate High Income Fund | 2,656,415 | 88,481 | 215,508 | 74,384 | (7,746) | 10,230 | 2,531,872 |
| Fidelity Series Government Money Market Fund 2.12% | 119,493,654 | 14,190,732 | 39,636,481 | 1,082,585 | - | - | 94,047,905 |
| Fidelity Series High Income Fund | 16,441,680 | 535,080 | 2,768,715 | 433,303 | (110,798) | 237,405 | 14,334,652 |
| Fidelity Series Inflation-Protected Bond Index Fund | 21,521,301 | 54,561,039 | 2,714,760 | 70,716 | (21,960) | (236,852) | 73,108,768 |
| Fidelity Series International Credit Fund | 605,136 | 7,456 | - | 7,458 | - | (6,087) | 606,505 |
| Fidelity Series International Growth Fund | 57,433,691 | 1,143,703 | 7,810,945 | - | 2,836,992 | (2,053,009) | 51,550,432 |
| Fidelity Series International Small Cap Fund | 14,297,809 | 349,008 | 1,998,984 | - | 701,063 | (1,213,751) | 12,135,145 |
| Fidelity Series International Value Fund | 56,727,990 | 398,441 | 5,396,382 | - | 670,509 | (895,465) | 51,505,093 |
| Fidelity Series Investment Grade Bond Fund | 312,691,131 | 6,342,948 | 34,184,120 | 4,205,190 | (1,058,754) | (2,429,615) | 281,361,590 |
| Fidelity Series Large Cap Stock Fund | - | 23,151 | 94,036 | - | (765) | 15,255,445 | 63,834,138 |
| Fidelity Series Large Cap Value Index Fund | 7,381,653 | 75,212 | 972,223 | - | 199,354 | 298,013 | 6,982,009 |
| Fidelity Series Long-Term Treasury Bond Index Fund | 24,264,680 | 32,207,350 | 2,467,167 | 499,524 | (76,255) | (1,573,216) | 52,355,392 |
| Fidelity Series Opportunistic Insights Fund | - | 12,560 | 50,415 | - | 35 | 14,991,769 | 34,209,493 |
| Fidelity Series Real Estate Equity Fund | 4,572,433 | 35,205 | 4,731,454 | 31,043 | 793,797 | (669,981) | - |
| Fidelity Series Real Estate Income Fund | 5,209,016 | 254,685 | 405,241 | 217,809 | 21,220 | 11,133 | 5,090,813 |
| Fidelity Series Short-Term Credit Fund | 29,016,136 | 538,006 | 3,957,442 | 317,563 | (43,421) | 43,575 | 25,596,854 |
| Fidelity Series Small Cap Opportunities Fund | 23,153,614 | 1,863,688 | 4,072,758 | 1,692,787 | 1,549,644 | (648,037) | 21,846,151 |
| Fidelity Series Stock Selector Large Cap Value Fund | - | 22,392 | 156,406 | - | 205 | 7,078,158 | 41,254,145 |
| Fidelity Series Value Discovery Fund | - | 14,914 | 60,487 | - | (529) | 8,656,032 | 40,700,750 |
| | $1,111,475,858 | $140,246,232 | $198,070,318 | $22,783,582 | $25,503,186 | $(18,381,966) | $1,060,772,992 |
Amounts in the income column in the above table include any capital gain distributions from underlying funds, which are presented in the corresponding line-item in the Statement of Operations if applicable.
Investment Valuation
The following is a summary of the inputs used, as of September 30, 2018, involving the Fund's assets and liabilities carried at fair value. The inputs or methodology used for valuing securities may not be an indication of the risk associated with investing in those securities. For more information on valuation inputs, and their aggregation into the levels used below, please refer to the Investment Valuation section in the accompanying Notes to Financial Statements.
| | Valuation Inputs at Reporting Date: |
| Description | Total | Level 1 | Level 2 | Level 3 |
| Investments in Securities: | | | | |
| Other Short-Term Investments | $727,716 | $-- | $727,716 | $-- |
| Domestic Equity Funds | 324,837,658 | 324,837,658 | -- | -- |
| International Equity Funds | 179,275,567 | 179,275,567 | -- | -- |
| Bond Funds | 437,015,008 | 437,015,008 | -- | -- |
| Short-Term Funds | 121,193,570 | 121,193,570 | -- | -- |
| Total Investments in Securities: | $1,063,049,519 | $1,062,321,803 | $727,716 | $-- |
| Derivative Instruments: | | | | |
| Assets | | | | |
| Futures Contracts | $95,080 | $95,080 | $-- | $-- |
| Total Assets | $95,080 | $95,080 | $-- | $-- |
| Liabilities | | | | |
| Futures Contracts | $(6,296) | $(6,296) | $-- | $-- |
| Total Liabilities | $(6,296) | $(6,296) | $-- | $-- |
| Total Derivative Instruments: | $88,784 | $88,784 | $-- | $-- |
Value of Derivative Instruments
The following table is a summary of the Fund's value of derivative instruments by primary risk exposure as of September 30, 2018. For additional information on derivative instruments, please refer to the Derivative Instruments section in the accompanying Notes to Financial Statements.
| Primary Risk Exposure / Derivative Type | Value |
| | Asset | Liability |
| Equity Risk | | |
| Futures Contracts(a) | $95,080 | $(6,296) |
| Total Equity Risk | 95,080 | (6,296) |
| Total Value of Derivatives | $95,080 | $(6,296) |
(a) Reflects gross cumulative appreciation (depreciation) on futures contracts as presented in the Schedule of Investments. In the Statement of Assets and Liabilities, the period end daily variation margin is included in receivable or payable for daily variation margin on futures contracts, and the net cumulative appreciation (depreciation) is included in net unrealized appreciation (depreciation).
See accompanying notes which are an integral part of the financial statements.
Fidelity Advisor Freedom® 2015 Fund
Financial Statements
Statement of Assets and Liabilities
| | | September 30, 2018 (Unaudited) |
| Assets | | |
Investment in securities, at value — See accompanying schedule:
Unaffiliated issuers (cost $727,768) | $727,716 | |
| Fidelity Central Funds (cost $1,548,811) | 1,548,811 | |
| Other affiliated issuers (cost $926,432,988) | 1,060,772,992 | |
| Total Investment in Securities (cost $928,709,567) | | $1,063,049,519 |
| Receivable for investments sold | | 2,134,916 |
| Receivable for fund shares sold | | 404,571 |
| Distributions receivable from Fidelity Central Funds | | 2,172 |
| Total assets | | 1,065,591,178 |
| Liabilities | | |
| Payable for investments purchased | $1,529,099 | |
| Payable for fund shares redeemed | 998,696 | |
| Accrued management fee | 500,446 | |
| Distribution and service plan fees payable | 218,891 | |
| Payable for daily variation margin on futures contracts | 44,011 | |
| Total liabilities | | 3,291,143 |
| Net Assets | | $1,062,300,035 |
| Net Assets consist of: | | |
| Paid in capital | | $886,200,287 |
| Undistributed net investment income | | 6,647,686 |
| Accumulated undistributed net realized gain (loss) on investments | | 35,023,326 |
| Net unrealized appreciation (depreciation) on investments | | 134,428,736 |
| Net Assets | | $1,062,300,035 |
| Calculation of Maximum Offering Price | | |
| Class A: | | |
| Net Asset Value and redemption price per share ($513,320,745 ÷ 41,372,817 shares) | | $12.41 |
| Maximum offering price per share (100/94.25 of $12.41) | | $13.17 |
| Class M: | | |
| Net Asset Value and redemption price per share ($162,401,312 ÷ 13,127,259 shares) | | $12.37 |
| Maximum offering price per share (100/96.50 of $12.37) | | $12.82 |
| Class C: | | |
| Net Asset Value and offering price per share ($53,075,846 ÷ 4,325,968 shares)(a) | | $12.27 |
| Class I: | | |
| Net Asset Value, offering price and redemption price per share ($320,018,464 ÷ 25,563,015 shares) | | $12.52 |
| Class Z6: | | |
| Net Asset Value, offering price and redemption price per share ($13,483,668 ÷ 1,078,306 shares) | | $12.50 |
(a) Redemption price per share is equal to net asset value less any applicable contingent deferred sales charge.
See accompanying notes which are an integral part of the financial statements.
Statement of Operations
| | | Six months ended September 30, 2018 (Unaudited) |
| Investment Income | | |
| Dividends: | | |
| Affiliated issuers | | $11,065,298 |
| Interest | | 2,577 |
| Income from Fidelity Central Funds | | 5,410 |
| Total income | | 11,073,285 |
| Expenses | | |
| Management fee | $3,067,631 | |
| Distribution and service plan fees | 1,347,126 | |
| Independent trustees' fees and expenses | 2,676 | |
| Total expenses before reductions | 4,417,433 | |
| Expense reductions | (37) | |
| Total expenses after reductions | | 4,417,396 |
| Net investment income (loss) | | 6,655,889 |
| Realized and Unrealized Gain (Loss) | | |
| Net realized gain (loss) on: | | |
| Investment securities: | | |
| Fidelity Central Funds | (34) | |
| Other affiliated issuers | 25,503,186 | |
| Futures contracts | (215,546) | |
| Capital gain distributions from underlying funds: | | |
| Affiliated issuers | 11,718,284 | |
| Total net realized gain (loss) | | 37,005,890 |
| Change in net unrealized appreciation (depreciation) on: | | |
| Investment securities: | | |
| Unaffiliated issuers | (47) | |
| Affiliated issuers | (18,381,966) | |
| Futures contracts | 88,784 | |
| Total change in net unrealized appreciation (depreciation) | | (18,293,229) |
| Net gain (loss) | | 18,712,661 |
| Net increase (decrease) in net assets resulting from operations | | $25,368,550 |
See accompanying notes which are an integral part of the financial statements.
Statement of Changes in Net Assets
| | Six months ended September 30, 2018 (Unaudited) | Year ended March 31, 2018 |
| Increase (Decrease) in Net Assets | | |
| Operations | | |
| Net investment income (loss) | $6,655,889 | $14,255,743 |
| Net realized gain (loss) | 37,005,890 | 81,625,051 |
| Change in net unrealized appreciation (depreciation) | (18,293,229) | 210,738 |
| Net increase (decrease) in net assets resulting from operations | 25,368,550 | 96,091,532 |
| Distributions to shareholders from net investment income | (966,089) | (15,646,822) |
| Distributions to shareholders from net realized gain | (39,785,117) | (63,171,458) |
| Total distributions | (40,751,206) | (78,818,280) |
| Share transactions - net increase (decrease) | (33,153,413) | (118,085,087) |
| Total increase (decrease) in net assets | (48,536,069) | (100,811,835) |
| Net Assets | | |
| Beginning of period | 1,110,836,104 | 1,211,647,939 |
| End of period | $1,062,300,035 | $1,110,836,104 |
| Other Information | | |
| Undistributed net investment income end of period | $6,647,686 | $957,886 |
See accompanying notes which are an integral part of the financial statements.
Financial Highlights
Fidelity Advisor Freedom 2015 Fund Class A
| | Six months ended (Unaudited) September 30, | Years endedMarch 31, | | | | |
| | 2018 | 2018 | 2017 | 2016 | 2015 | 2014 |
| Selected Per–Share Data | | | | | | |
| Net asset value, beginning of period | $12.59 | $12.43 | $11.81 | $12.70 | $12.87 | $12.47 |
| Income from Investment Operations | | | | | | |
| Net investment income (loss)A | .08 | .16 | .18 | .20 | .20 | .15 |
| Net realized and unrealized gain (loss) | .21 | .87 | .99 | (.45) | .49 | .89 |
| Total from investment operations | .29 | 1.03 | 1.17 | (.25) | .69 | 1.04 |
| Distributions from net investment income | (.01) | (.18) | (.19) | (.21) | (.21) | (.15) |
| Distributions from net realized gain | (.46) | (.70) | (.36) | (.43) | (.64) | (.50) |
| Total distributions | (.47) | (.87)B | (.55) | (.64) | (.86)C | (.64)D |
| Net asset value, end of period | $12.41 | $12.59 | $12.43 | $11.81 | $12.70 | $12.87 |
| Total ReturnE,F,G | 2.34% | 8.42% | 10.23% | (2.07)% | 5.51% | 8.54% |
| Ratios to Average Net AssetsH,I | | | | | | |
| Expenses before reductions | .82%J | .72% | .25% | .25% | .25% | .25% |
| Expenses net of fee waivers, if any | .82%J | .72% | .25% | .25% | .25% | .25% |
| Expenses net of all reductions | .82%J | .72% | .25% | .25% | .25% | .25% |
| Net investment income (loss) | 1.22%J | 1.22% | 1.46% | 1.64% | 1.58% | 1.19% |
| Supplemental Data | | | | | | |
| Net assets, end of period (000 omitted) | $513,321 | $551,179 | $653,982 | $739,929 | $967,164 | $1,086,606 |
| Portfolio turnover rateH | 26%J | 19% | 22% | 20% | 21% | 37% |
A Calculated based on average shares outstanding during the period.
B Total distributions of $.87 per share is comprised of distributions from net investment income of $.175 and distributions from net realized gain of $.699 per share.
C Total distributions of $.86 per share is comprised of distributions from net investment income of $.214 and distributions from net realized gain of $.642 per share.
D Total distributions of $.64 per share is comprised of distributions from net investment income of $.146 and distributions from net realized gain of $.498 per share.
E Total returns for periods of less than one year are not annualized.
F Total returns would have been lower if certain expenses had not been reduced during the applicable periods shown.
G Total returns do not include the effect of the sales charges.
H Amounts do not include the activity of the Underlying Funds.
I Expense ratios reflect operating expenses of the class. Expenses before reductions do not reflect amounts reimbursed by the investment adviser or reductions from expense offset arrangements and do not represent the amount paid by the class during periods when reimbursements or reductions occur. Expenses net of fee waivers reflect expenses after reimbursement by the investment adviser but prior to reductions from expense offset arrangements. Expenses net of all reductions represent the net expenses paid by the class but do not include expenses of the underlying funds in which the Fund invests.
J Annualized
See accompanying notes which are an integral part of the financial statements.
Fidelity Advisor Freedom 2015 Fund Class M
| | Six months ended (Unaudited) September 30, | Years endedMarch 31, | | | | |
| | 2018 | 2018 | 2017 | 2016 | 2015 | 2014 |
| Selected Per–Share Data | | | | | | |
| Net asset value, beginning of period | $12.56 | $12.41 | $11.79 | $12.68 | $12.85 | $12.46 |
| Income from Investment Operations | | | | | | |
| Net investment income (loss)A | .06 | .12 | .15 | .17 | .17 | .12 |
| Net realized and unrealized gain (loss) | .21 | .87 | .99 | (.45) | .48 | .88 |
| Total from investment operations | .27 | .99 | 1.14 | (.28) | .65 | 1.00 |
| Distributions from net investment income | –B | (.15) | (.16) | (.18) | (.18) | (.11) |
| Distributions from net realized gain | (.46) | (.70) | (.36) | (.43) | (.64) | (.50) |
| Total distributions | (.46) | (.84)C | (.52) | (.61) | (.82) | (.61) |
| Net asset value, end of period | $12.37 | $12.56 | $12.41 | $11.79 | $12.68 | $12.85 |
| Total ReturnD,E,F | 2.19% | 8.10% | 9.98% | (2.32)% | 5.26% | 8.20% |
| Ratios to Average Net AssetsG,H | | | | | | |
| Expenses before reductions | 1.07%I | .98% | .50% | .50% | .50% | .50% |
| Expenses net of fee waivers, if any | 1.07%I | .98% | .50% | .50% | .50% | .50% |
| Expenses net of all reductions | 1.07%I | .98% | .50% | .50% | .50% | .50% |
| Net investment income (loss) | .97%I | .96% | 1.21% | 1.39% | 1.33% | .94% |
| Supplemental Data | | | | | | |
| Net assets, end of period (000 omitted) | $162,401 | $167,835 | $178,795 | $190,018 | $208,468 | $226,663 |
| Portfolio turnover rateG | 26%I | 19% | 22% | 20% | 21% | 37% |
A Calculated based on average shares outstanding during the period.
B Amount represents less than $.005 per share.
C Total distributions of $.84 per share is comprised of distributions from net investment income of $.145 and distributions from net realized gain of $.699 per share.
D Total returns for periods of less than one year are not annualized.
E Total returns would have been lower if certain expenses had not been reduced during the applicable periods shown.
F Total returns do not include the effect of the sales charges.
G Amounts do not include the activity of the Underlying Funds.
H Expense ratios reflect operating expenses of the class. Expenses before reductions do not reflect amounts reimbursed by the investment adviser or reductions from expense offset arrangements and do not represent the amount paid by the class during periods when reimbursements or reductions occur. Expenses net of fee waivers reflect expenses after reimbursement by the investment adviser but prior to reductions from expense offset arrangements. Expenses net of all reductions represent the net expenses paid by the class but do not include expenses of the underlying funds in which the Fund invests.
I Annualized
See accompanying notes which are an integral part of the financial statements.
Fidelity Advisor Freedom 2015 Fund Class C
| | Six months ended (Unaudited) September 30, | Years endedMarch 31, | | | | |
| | 2018 | 2018 | 2017 | 2016 | 2015 | 2014 |
| Selected Per–Share Data | | | | | | |
| Net asset value, beginning of period | $12.47 | $12.32 | $11.72 | $12.60 | $12.77 | $12.39 |
| Income from Investment Operations | | | | | | |
| Net investment income (loss)A | .03 | .06 | .08 | .11 | .11 | .05 |
| Net realized and unrealized gain (loss) | .22 | .86 | .98 | (.45) | .48 | .88 |
| Total from investment operations | .25 | .92 | 1.06 | (.34) | .59 | .93 |
| Distributions from net investment income | – | (.08) | (.10) | (.11) | (.12) | (.06) |
| Distributions from net realized gain | (.45) | (.70) | (.36) | (.43) | (.64) | (.49) |
| Total distributions | (.45) | (.77)B | (.46) | (.54) | (.76) | (.55) |
| Net asset value, end of period | $12.27 | $12.47 | $12.32 | $11.72 | $12.60 | $12.77 |
| Total ReturnC,D,E | 1.99% | 7.57% | 9.33% | (2.76)% | 4.75% | 7.65% |
| Ratios to Average Net AssetsF,G | | | | | | |
| Expenses before reductions | 1.57%H | 1.48% | 1.00% | 1.00% | 1.00% | 1.00% |
| Expenses net of fee waivers, if any | 1.57%H | 1.48% | 1.00% | 1.00% | 1.00% | 1.00% |
| Expenses net of all reductions | 1.57%H | 1.48% | 1.00% | 1.00% | 1.00% | 1.00% |
| Net investment income (loss) | .47%H | .47% | .71% | .89% | .83% | .44% |
| Supplemental Data | | | | | | |
| Net assets, end of period (000 omitted) | $53,076 | $54,730 | $61,332 | $63,443 | $72,725 | $75,682 |
| Portfolio turnover rateF | 26%H | 19% | 22% | 20% | 21% | 37% |
A Calculated based on average shares outstanding during the period.
B Total distributions of $.77 per share is comprised of distributions from net investment income of $.075 and distributions from net realized gain of $.699 per share.
C Total returns for periods of less than one year are not annualized.
D Total returns would have been lower if certain expenses had not been reduced during the applicable periods shown.
E Total returns do not include the effect of the contingent deferred sales charge.
F Amounts do not include the activity of the Underlying Funds.
G Expense ratios reflect operating expenses of the class. Expenses before reductions do not reflect amounts reimbursed by the investment adviser or reductions from expense offset arrangements and do not represent the amount paid by the class during periods when reimbursements or reductions occur. Expenses net of fee waivers reflect expenses after reimbursement by the investment adviser but prior to reductions from expense offset arrangements. Expenses net of all reductions represent the net expenses paid by the class but do not include expenses of the underlying funds in which the Fund invests.
H Annualized
See accompanying notes which are an integral part of the financial statements.
Fidelity Advisor Freedom 2015 Fund Class I
| | Six months ended (Unaudited) September 30, | Years endedMarch 31, | | | | |
| | 2018 | 2018 | 2017 | 2016 | 2015 | 2014 |
| Selected Per–Share Data | | | | | | |
| Net asset value, beginning of period | $12.69 | $12.53 | $11.90 | $12.79 | $12.96 | $12.56 |
| Income from Investment Operations | | | | | | |
| Net investment income (loss)A | .09 | .19 | .21 | .23 | .24 | .18 |
| Net realized and unrealized gain (loss) | .22 | .88 | 1.00 | (.45) | .48 | .90 |
| Total from investment operations | .31 | 1.07 | 1.21 | (.22) | .72 | 1.08 |
| Distributions from net investment income | (.02) | (.21) | (.22) | (.24) | (.25) | (.18) |
| Distributions from net realized gain | (.46) | (.70) | (.36) | (.43) | (.64) | (.50) |
| Total distributions | (.48) | (.91) | (.58) | (.67) | (.89) | (.68) |
| Net asset value, end of period | $12.52 | $12.69 | $12.53 | $11.90 | $12.79 | $12.96 |
| Total ReturnB,C | 2.47% | 8.66% | 10.53% | (1.80)% | 5.74% | 8.75% |
| Ratios to Average Net AssetsD,E | | | | | | |
| Expenses before reductions | .57%F | .48% | - %G | - %G | - %G | - %G |
| Expenses net of fee waivers, if any | .57%F | .48% | -% | -% | -% | -% |
| Expenses net of all reductions | .57%F | .48% | -% | -% | -% | -% |
| Net investment income (loss) | 1.47%F | 1.46% | 1.71% | 1.89% | 1.83% | 1.44% |
| Supplemental Data | | | | | | |
| Net assets, end of period (000 omitted) | $320,018 | $324,189 | $317,539 | $361,722 | $425,176 | $488,611 |
| Portfolio turnover rateD | 26%F | 19% | 22% | 20% | 21% | 37% |
A Calculated based on average shares outstanding during the period.
B Total returns for periods of less than one year are not annualized.
C Total returns would have been lower if certain expenses had not been reduced during the applicable periods shown.
D Amounts do not include the activity of the Underlying Funds.
E Expense ratios reflect operating expenses of the class. Expenses before reductions do not reflect amounts reimbursed by the investment adviser or reductions from expense offset arrangements and do not represent the amount paid by the class during periods when reimbursements or reductions occur. Expenses net of fee waivers reflect expenses after reimbursement by the investment adviser but prior to reductions from expense offset arrangements. Expenses net of all reductions represent the net expenses paid by the class but do not include expenses of the underlying funds in which the Fund invests.
F Annualized
G Amount represents less than .005%.
See accompanying notes which are an integral part of the financial statements.
Fidelity Advisor Freedom 2015 Fund Class Z6
| | Six months ended (Unaudited) September 30, | Years endedMarch 31, |
| | 2018 | 2018 A |
| Selected Per–Share Data | | |
| Net asset value, beginning of period | $12.67 | $12.66 |
| Income from Investment Operations | | |
| Net investment income (loss)B | .10 | .18 |
| Net realized and unrealized gain (loss) | .22 | .51 |
| Total from investment operations | .32 | .69 |
| Distributions from net investment income | (.03) | (.21) |
| Distributions from net realized gain | (.46) | (.47) |
| Total distributions | (.49) | (.68) |
| Net asset value, end of period | $12.50 | $12.67 |
| Total ReturnC,D | 2.55% | 5.42% |
| Ratios to Average Net AssetsE,F | | |
| Expenses before reductions | .41%G | .43%G,H |
| Expenses net of fee waivers, if any | .41%G | .43%G,H |
| Expenses net of all reductions | .41%G | .43%G,H |
| Net investment income (loss) | 1.63%G | 1.75%G |
| Supplemental Data | | |
| Net assets, end of period (000 omitted) | $13,484 | $12,903 |
| Portfolio turnover rateE | 26%G | 19% |
A For the period June 6, 2017 (commencement of sale of shares) to March 31, 2018.
B Calculated based on average shares outstanding during the period.
C Total returns for periods of less than one year are not annualized.
D Total returns would have been lower if certain expenses had not been reduced during the applicable periods shown.
E Amounts do not include the activity of the Underlying Funds.
F Expense ratios reflect operating expenses of the class. Expenses before reductions do not reflect amounts reimbursed by the investment adviser or reductions from expense offset arrangements and do not represent the amount paid by the class during periods when reimbursements or reductions occur. Expenses net of fee waivers reflect expenses after reimbursement by the investment adviser but prior to reductions from expense offset arrangements. Expenses net of all reductions represent the net expenses paid by the class but do not include expenses of the underlying funds in which the Fund invests.
G Annualized
H On certain classes, the size and fluctuation of net assets and expense amounts may cause ratios to differ from contractual rates.
See accompanying notes which are an integral part of the financial statements.
Fidelity Advisor Freedom® 2020 Fund
Investment Summary (Unaudited)
The information in the following tables is based on the direct investments of the Fund.
Top Holdings as of September 30, 2018
| | % of fund's net assets |
| Fidelity Series Investment Grade Bond Fund | 23.4 |
| Fidelity Series Large Cap Stock Fund | 7.1 |
| Fidelity Series Government Money Market Fund 2.12% | 6.7 |
| Fidelity Series Emerging Markets Opportunities Fund | 5.7 |
| Fidelity Series International Growth Fund | 5.6 |
| Fidelity Series International Value Fund | 5.6 |
| Fidelity Series Inflation-Protected Bond Index Fund | 5.1 |
| Fidelity Series Long-Term Treasury Bond Index Fund | 5.0 |
| Fidelity Series Stock Selector Large Cap Value Fund | 4.6 |
| Fidelity Series Value Discovery Fund | 4.6 |
| | 73.4 |
Asset Allocation (% of fund's net assets)
| Period end |
| | Domestic Equity Funds | 35.8% |
| | International Equity Funds | 19.1% |
| | Bond Funds | 36.4% |
| | Short-Term Funds | 8.7% |
| | Short-Term Investments | 0.1% |
| | Net Other Assets (Liabilities)* | (0.1)% |

* Net Other Assets (Liabilities) are not included in the pie chart
Domestic Equity Funds category includes Fidelity Series Commodity Strategy Fund which invests in commodity-related investments.
Fidelity Advisor Freedom® 2020 Fund
Schedule of Investments September 30, 2018 (Unaudited)
Showing Percentage of Net Assets
| U.S. Treasury Obligations - 0.1% | | | |
| | | Principal Amount | Value |
| U.S. Treasury Bills, yield at date of purchase 1.95% to 2.09% 10/4/18 to 11/29/18 (a) | | | |
| (Cost $1,555,215) | | 1,560,000 | 1,555,112 |
| | | Shares | Value |
|
| Domestic Equity Funds - 35.8% | | | |
| Fidelity Advisor Series Equity Growth Fund (b) | | 6,497,301 | $100,448,277 |
| Fidelity Advisor Series Growth Opportunities Fund (b) | | 4,025,902 | 66,991,017 |
| Fidelity Advisor Series Small Cap Fund (b) | | 3,760,308 | 47,267,071 |
| Fidelity Series All-Sector Equity Fund (b) | | 3,231,260 | 43,977,444 |
| Fidelity Series Commodity Strategy Fund (b) | | 9,823,537 | 49,117,685 |
| Fidelity Series Large Cap Stock Fund (b) | | 10,937,325 | 174,231,594 |
| Fidelity Series Large Cap Value Index Fund (b) | | 1,444,646 | 19,069,326 |
| Fidelity Series Opportunistic Insights Fund (b) | | 4,704,091 | 93,376,212 |
| Fidelity Series Small Cap Opportunities Fund (b) | | 4,059,610 | 59,635,670 |
| Fidelity Series Stock Selector Large Cap Value Fund (b) | | 8,518,141 | 112,609,828 |
| Fidelity Series Value Discovery Fund (b) | | 8,115,440 | 111,100,367 |
| TOTAL DOMESTIC EQUITY FUNDS | | | |
| (Cost $650,132,437) | | | 877,824,491 |
|
| International Equity Funds - 19.1% | | | |
| Fidelity Series Canada Fund (b) | | 1,317,370 | 14,240,764 |
| Fidelity Series Emerging Markets Fund (b) | | 696,051 | 6,744,733 |
| Fidelity Series Emerging Markets Opportunities Fund (b) | | 7,313,750 | 140,350,867 |
| Fidelity Series International Growth Fund (b) | | 8,331,063 | 136,629,428 |
| Fidelity Series International Small Cap Fund (b) | | 1,792,446 | 32,084,788 |
| Fidelity Series International Value Fund (b) | | 12,964,894 | 136,390,683 |
| TOTAL INTERNATIONAL EQUITY FUNDS | | | |
| (Cost $342,996,041) | | | 466,441,263 |
|
| Bond Funds - 36.4% | | | |
| Fidelity Series Emerging Markets Debt Fund (b) | | 1,766,007 | 16,830,048 |
| Fidelity Series Floating Rate High Income Fund (b) | | 599,079 | 5,703,232 |
| Fidelity Series High Income Fund (b) | | 3,533,325 | 33,955,253 |
| Fidelity Series Inflation-Protected Bond Index Fund (b) | | 12,864,535 | 124,914,631 |
| Fidelity Series International Credit Fund (b) | | 132,613 | 1,303,590 |
| Fidelity Series Investment Grade Bond Fund (b) | | 52,717,585 | 574,094,499 |
| Fidelity Series Long-Term Treasury Bond Index Fund (b) | | 14,956,434 | 123,241,015 |
| Fidelity Series Real Estate Income Fund (b) | | 1,068,440 | 11,517,787 |
| TOTAL BOND FUNDS | | | |
| (Cost $913,115,358) | | | 891,560,055 |
|
| Short-Term Funds - 8.7% | | | |
| Fidelity Cash Central Fund, 2.11% (c) | | 4,120,886 | 4,121,710 |
| Fidelity Series Government Money Market Fund 2.12% (b)(d) | | 164,261,368 | 164,261,368 |
| Fidelity Series Short-Term Credit Fund (b) | | 4,637,953 | 45,730,217 |
| TOTAL SHORT-TERM FUNDS | | | |
| (Cost $214,622,531) | | | 214,113,295 |
| TOTAL INVESTMENT IN SECURITIES - 100.1% | | | |
| (Cost $2,122,421,582) | | | 2,451,494,216 |
| NET OTHER ASSETS (LIABILITIES) - (0.1)% | | | (1,773,947) |
| NET ASSETS - 100% | | | $2,449,720,269 |
| Futures Contracts | | | | | |
| | Number of contracts | Expiration Date | Notional Amount | Value | Unrealized Appreciation/(Depreciation) |
| Purchased | | | | | |
| Equity Index Contracts | | | | | |
| ICE E-mini MSCI Emerging Markets Index Contracts (United States) | 287 | Dec. 2018 | $15,063,195 | $282,354 | $282,354 |
| Sold | | | | | |
| Equity Index Contracts | | | | | |
| CME E-mini S&P 500 Index Contracts (United States) | 112 | Dec. 2018 | 16,346,400 | (15,041) | (15,041) |
| TOTAL FUTURES CONTRACTS | | | | | $267,313 |
The notional amount of futures purchased as a percentage of Net Assets is 0.6%
The notional amount of futures sold as a percentage of Net Assets is 0.7%
Legend
(a) Security or a portion of the security was pledged to cover margin requirements for futures contracts. At period end, the value of securities pledged amounted to $1,097,705.
(b) Affiliated Fund
(c) Affiliated fund that is generally available only to investment companies and other accounts managed by Fidelity Investments. The rate quoted is the annualized seven-day yield of the fund at period end. A complete unaudited listing of the fund's holdings as of its most recent quarter end is available upon request. In addition, each Fidelity Central Fund's financial statements are available on the SEC's website or upon request.
(d) The rate quoted is the annualized seven-day yield of the fund at period end.
Affiliated Central Funds
Information regarding fiscal year to date income earned by the Fund from investments in Fidelity Central Funds is as follows:
| Fund | Income earned |
| Fidelity Cash Central Fund | $12,038 |
| Total | $12,038 |
Amounts in the income column in the above table include any capital gain distributions from underlying funds, which are presented in the corresponding line-item in the Statement of Operations if applicable.
Affiliated Underlying Funds
Fiscal year to date information regarding the Fund's investments in affiliated Underlying Funds, excluding any Money Market Central Funds, is presented below. Exchanges between classes of the same affiliated Underlying Funds may occur.
| Affiliate | Value, beginning of period | Purchases | Sales Proceeds | Dividend Income | Realized Gain (loss) | Change in Unrealized appreciation (depreciation) | Value, end of period |
| Fidelity Advisor Series Equity Growth Fund | $97,996,442 | $1,090,875 | $12,256,439 | $ - | $1,424,244 | $12,193,155 | $100,448,277 |
| Fidelity Advisor Series Equity Value Fund | 112,977,029 | 4,851,014 | 9,367,482 | 3,594,095 | 575,945 | (21,311,894) | - |
| Fidelity Advisor Series Growth & Income Fund | 172,970,500 | 16,688,509 | 19,127,430 | 14,743,256 | 964,547 | (32,886,455) | - |
| Fidelity Advisor Series Growth Opportunities Fund | 64,366,555 | 717,908 | 14,143,503 | - | 4,271,998 | 11,778,059 | 66,991,017 |
| Fidelity Advisor Series Opportunistic Insights Fund | 91,315,922 | 7,831,256 | 11,088,207 | 6,825,313 | 2,240,465 | (37,653,473) | - |
| Fidelity Advisor Series Small Cap Fund | 49,077,299 | 536,780 | 5,122,083 | - | 567,141 | 2,207,934 | 47,267,071 |
| Fidelity Advisor Series Stock Selector Large Cap Value Fund | 114,047,646 | 10,209,187 | 9,656,059 | 9,096,431 | 653,530 | (21,613,588) | - |
| Fidelity Series 100 Index Fund | 48,677,255 | - | 51,233,085 | - | 20,253,867 | (17,698,037) | - |
| Fidelity Series All-Sector Equity Fund | 67,245,550 | 782,700 | 31,298,111 | - | 6,358,973 | 888,332 | 43,977,444 |
| Fidelity Series Canada Fund | 14,121,725 | 148,784 | 892,176 | - | 6,338 | 856,093 | 14,240,764 |
| Fidelity Series Commodity Strategy Fund | 53,066,753 | 7,172,660 | 7,097,912 | 2,948,556 | (2,633,367) | (1,390,449) | 49,117,685 |
| Fidelity Series Emerging Markets Debt Fund | 18,075,963 | 678,981 | 941,619 | 521,431 | (39,369) | (943,908) | 16,830,048 |
| Fidelity Series Emerging Markets Fund | - | 6,751,163 | - | - | - | (6,430) | 6,744,733 |
| Fidelity Series Emerging Markets Opportunities Fund | 154,150,718 | 14,781,209 | 9,009,138 | - | 21,422 | (19,593,344) | 140,350,867 |
| Fidelity Series Floating Rate High Income Fund | 5,870,063 | 219,825 | 392,341 | 154,173 | (9,845) | 15,530 | 5,703,232 |
| Fidelity Series Government Money Market Fund 2.12% | 204,141,698 | 29,762,864 | 69,643,194 | 1,880,422 | - | - | 164,261,368 |
| Fidelity Series High Income Fund | 36,542,127 | 1,348,508 | 4,226,625 | 1,007,086 | (149,706) | 440,949 | 33,955,253 |
| Fidelity Series Inflation-Protected Bond Index Fund | 28,559,768 | 100,618,081 | 3,746,584 | 112,656 | (45,685) | (470,949) | 124,914,631 |
| Fidelity Series International Credit Fund | 1,300,646 | 16,029 | - | 16,029 | - | (13,085) | 1,303,590 |
| Fidelity Series International Growth Fund | 144,970,532 | 3,292,732 | 13,759,858 | - | 4,309,435 | (2,183,413) | 136,629,428 |
| Fidelity Series International Small Cap Fund | 36,256,739 | 1,346,054 | 4,201,866 | - | 988,822 | (2,304,961) | 32,084,788 |
| Fidelity Series International Value Fund | 143,946,261 | 1,813,703 | 8,884,599 | - | 720,698 | (1,205,380) | 136,390,683 |
| Fidelity Series Investment Grade Bond Fund | 637,028,192 | 14,871,185 | 70,656,747 | 8,602,340 | (2,824,683) | (4,323,448) | 574,094,499 |
| Fidelity Series Large Cap Stock Fund | - | 19,215 | 445,408 | - | (5,298) | 36,053,414 | 174,231,594 |
| Fidelity Series Large Cap Value Index Fund | 19,081,531 | 286,218 | 1,613,868 | - | 258,596 | 1,056,849 | 19,069,326 |
| Fidelity Series Long-Term Treasury Bond Index Fund | 55,292,489 | 76,121,780 | 4,187,581 | 1,195,989 | (43,260) | (3,942,413) | 123,241,015 |
| Fidelity Series Opportunistic Insights Fund | - | 10,298 | 240,426 | - | (937) | 40,961,314 | 93,376,212 |
| Fidelity Series Real Estate Equity Fund | 11,817,048 | 75,560 | 12,196,466 | 64,942 | 1,586,811 | (1,282,953) | - |
| Fidelity Series Real Estate Income Fund | 11,569,965 | 614,208 | 737,806 | 490,565 | 27,916 | 43,504 | 11,517,787 |
| Fidelity Series Short-Term Credit Fund | 49,294,490 | 1,096,467 | 4,660,858 | 548,805 | (39,152) | 39,270 | 45,730,217 |
| Fidelity Series Small Cap Opportunities Fund | 59,875,853 | 5,278,899 | 7,756,053 | 4,620,502 | 2,021,348 | 215,623 | 59,635,670 |
| Fidelity Series Stock Selector Large Cap Value Fund | - | 159,363 | 500,759 | - | (456) | 19,310,964 | 112,609,828 |
| Fidelity Series Value Discovery Fund | - | 12,330 | 286,087 | - | (3,761) | 23,653,273 | 111,100,367 |
| | $2,503,636,759 | $309,204,345 | $389,370,370 | $56,422,591 | $41,456,577 | $(19,109,917) | $2,445,817,394 |
Amounts in the income column in the above table include any capital gain distributions from underlying funds, which are presented in the corresponding line-item in the Statement of Operations if applicable.
Investment Valuation
The following is a summary of the inputs used, as of September 30, 2018, involving the Fund's assets and liabilities carried at fair value. The inputs or methodology used for valuing securities may not be an indication of the risk associated with investing in those securities. For more information on valuation inputs, and their aggregation into the levels used below, please refer to the Investment Valuation section in the accompanying Notes to Financial Statements.
| | Valuation Inputs at Reporting Date: |
| Description | Total | Level 1 | Level 2 | Level 3 |
| Investments in Securities: | | | | |
| Other Short-Term Investments | $1,555,112 | $-- | $1,555,112 | $-- |
| Domestic Equity Funds | 877,824,491 | 877,824,491 | -- | -- |
| International Equity Funds | 466,441,263 | 466,441,263 | -- | -- |
| Bond Funds | 891,560,055 | 891,560,055 | -- | -- |
| Short-Term Funds | 214,113,295 | 214,113,295 | -- | -- |
| Total Investments in Securities: | $2,451,494,216 | $2,449,939,104 | $1,555,112 | $-- |
| Derivative Instruments: | | | | |
| Assets | | | | |
| Futures Contracts | $282,354 | $282,354 | $-- | $-- |
| Total Assets | $282,354 | $282,354 | $-- | $-- |
| Liabilities | | | | |
| Futures Contracts | $(15,041) | $(15,041) | $-- | $-- |
| Total Liabilities | $(15,041) | $(15,041) | $-- | $-- |
| Total Derivative Instruments: | $267,313 | $267,313 | $-- | $-- |
Value of Derivative Instruments
The following table is a summary of the Fund's value of derivative instruments by primary risk exposure as of September 30, 2018. For additional information on derivative instruments, please refer to the Derivative Instruments section in the accompanying Notes to Financial Statements.
| Primary Risk Exposure / Derivative Type | Value |
| | Asset | Liability |
| Equity Risk | | |
| Futures Contracts(a) | $282,354 | $(15,041) |
| Total Equity Risk | 282,354 | (15,041) |
| Total Value of Derivatives | $282,354 | $(15,041) |
(a) Reflects gross cumulative appreciation (depreciation) on futures contracts as presented in the Schedule of Investments. In the Statement of Assets and Liabilities, the period end daily variation margin is included in receivable or payable for daily variation margin on futures contracts, and the net cumulative appreciation (depreciation) is included in net unrealized appreciation (depreciation).
See accompanying notes which are an integral part of the financial statements.
Fidelity Advisor Freedom® 2020 Fund
Financial Statements
Statement of Assets and Liabilities
| | | September 30, 2018 (Unaudited) |
| Assets | | |
Investment in securities, at value — See accompanying schedule:
Unaffiliated issuers (cost $1,555,215) | $1,555,112 | |
| Fidelity Central Funds (cost $4,121,710) | 4,121,710 | |
| Other affiliated issuers (cost $2,116,744,657) | 2,445,817,394 | |
| Total Investment in Securities (cost $2,122,421,582) | | $2,451,494,216 |
| Receivable for investments sold | | 6,415,339 |
| Receivable for fund shares sold | | 1,742,837 |
| Distributions receivable from Fidelity Central Funds | | 5,907 |
| Total assets | | 2,459,658,299 |
| Liabilities | | |
| Payable for investments purchased | $2,951,701 | |
| Payable for fund shares redeemed | 5,162,754 | |
| Accrued management fee | 1,239,415 | |
| Distribution and service plan fees payable | 467,537 | |
| Payable for daily variation margin on futures contracts | 116,623 | |
| Total liabilities | | 9,938,030 |
| Net Assets | | $2,449,720,269 |
| Net Assets consist of: | | |
| Paid in capital | | $2,038,672,935 |
| Undistributed net investment income | | 14,190,650 |
| Accumulated undistributed net realized gain (loss) on investments | | 67,516,737 |
| Net unrealized appreciation (depreciation) on investments | | 329,339,947 |
| Net Assets | | $2,449,720,269 |
| Calculation of Maximum Offering Price | | |
| Class A: | | |
| Net Asset Value and redemption price per share ($1,118,826,042 ÷ 82,304,950 shares) | | $13.59 |
| Maximum offering price per share (100/94.25 of $13.59) | | $14.42 |
| Class M: | | |
| Net Asset Value and redemption price per share ($367,155,036 ÷ 27,038,637 shares) | | $13.58 |
| Maximum offering price per share (100/96.50 of $13.58) | | $14.07 |
| Class C: | | |
| Net Asset Value and offering price per share ($97,906,837 ÷ 7,278,073 shares)(a) | | $13.45 |
| Class I: | | |
| Net Asset Value, offering price and redemption price per share ($829,133,332 ÷ 60,461,925 shares) | | $13.71 |
| Class Z6: | | |
| Net Asset Value, offering price and redemption price per share ($36,699,022 ÷ 2,679,584 shares) | | $13.70 |
(a) Redemption price per share is equal to net asset value less any applicable contingent deferred sales charge.
See accompanying notes which are an integral part of the financial statements.
Statement of Operations
| | | Six months ended September 30, 2018 (Unaudited) |
| Investment Income | | |
| Dividends: | | |
| Affiliated issuers | | $24,608,223 |
| Interest | | 6,273 |
| Income from Fidelity Central Funds | | 12,038 |
| Total income | | 24,626,534 |
| Expenses | | |
| Management fee | $7,539,185 | |
| Distribution and service plan fees | 2,866,648 | |
| Independent trustees' fees and expenses | 6,070 | |
| Total expenses before reductions | 10,411,903 | |
| Expense reductions | (39) | |
| Total expenses after reductions | | 10,411,864 |
| Net investment income (loss) | | 14,214,670 |
| Realized and Unrealized Gain (Loss) | | |
| Net realized gain (loss) on: | | |
| Investment securities: | | |
| Fidelity Central Funds | (35) | |
| Other affiliated issuers | 41,456,577 | |
| Futures contracts | (914,042) | |
| Capital gain distributions from underlying funds: | | |
| Affiliated issuers | 31,814,368 | |
| Total net realized gain (loss) | | 72,356,868 |
| Change in net unrealized appreciation (depreciation) on: | | |
| Investment securities: | | |
| Unaffiliated issuers | (91) | |
| Affiliated issuers | (19,109,917) | |
| Futures contracts | 267,313 | |
| Total change in net unrealized appreciation (depreciation) | | (18,842,695) |
| Net gain (loss) | | 53,514,173 |
| Net increase (decrease) in net assets resulting from operations | | $67,728,843 |
See accompanying notes which are an integral part of the financial statements.
Statement of Changes in Net Assets
| | Six months ended September 30, 2018 (Unaudited) | Year ended March 31, 2018 |
| Increase (Decrease) in Net Assets | | |
| Operations | | |
| Net investment income (loss) | $14,214,670 | $30,214,061 |
| Net realized gain (loss) | 72,356,868 | 162,690,491 |
| Change in net unrealized appreciation (depreciation) | (18,842,695) | 32,981,869 |
| Net increase (decrease) in net assets resulting from operations | 67,728,843 | 225,886,421 |
| Distributions to shareholders from net investment income | (1,169,226) | (33,576,472) |
| Distributions to shareholders from net realized gain | (87,706,280) | (112,956,333) |
| Total distributions | (88,875,506) | (146,532,805) |
| Share transactions - net increase (decrease) | (31,303,153) | (133,083,804) |
| Total increase (decrease) in net assets | (52,449,816) | (53,730,188) |
| Net Assets | | |
| Beginning of period | 2,502,170,085 | 2,555,900,273 |
| End of period | $2,449,720,269 | $2,502,170,085 |
| Other Information | | |
| Undistributed net investment income end of period | $14,190,650 | $1,145,206 |
See accompanying notes which are an integral part of the financial statements.
Financial Highlights
Fidelity Advisor Freedom 2020 Fund Class A
| | Six months ended (Unaudited) September 30, | Years endedMarch 31, | | | | |
| | 2018 | 2018 | 2017 | 2016 | 2015 | 2014 |
| Selected Per–Share Data | | | | | | |
| Net asset value, beginning of period | $13.71 | $13.31 | $12.51 | $13.44 | $13.54 | $13.05 |
| Income from Investment Operations | | | | | | |
| Net investment income (loss)A | .08 | .16 | .19 | .21 | .22 | .16 |
| Net realized and unrealized gain (loss) | .29 | 1.05 | 1.16 | (.51) | .55 | 1.04 |
| Total from investment operations | .37 | 1.21 | 1.35 | (.30) | .77 | 1.20 |
| Distributions from net investment income | –B | (.18) | (.19) | (.21) | (.23) | (.16) |
| Distributions from net realized gain | (.49) | (.62) | (.36) | (.41) | (.64) | (.55) |
| Total distributions | (.49) | (.81)C | (.55) | (.63)D | (.87) | (.71) |
| Net asset value, end of period | $13.59 | $13.71 | $13.31 | $12.51 | $13.44 | $13.54 |
| Total ReturnE,F,G | 2.74% | 9.15% | 11.17% | (2.35)% | 5.82% | 9.38% |
| Ratios to Average Net AssetsH,I | | | | | | |
| Expenses before reductions | .86%J | .76% | .25% | .25% | .25% | .25% |
| Expenses net of fee waivers, if any | .86%J | .76% | .25% | .25% | .25% | .25% |
| Expenses net of all reductions | .86%J | .76% | .25% | .25% | .25% | .25% |
| Net investment income (loss) | 1.12%J | 1.18% | 1.46% | 1.62% | 1.59% | 1.22% |
| Supplemental Data | | | | | | |
| Net assets, end of period (000 omitted) | $1,118,826 | $1,196,128 | $1,315,261 | $1,442,826 | $1,775,399 | $1,910,164 |
| Portfolio turnover rateH | 25%J | 20% | 19% | 20% | 21% | 40% |
A Calculated based on average shares outstanding during the period.
B Amount represents less than $.005 per share.
C Total distributions of $.81 per share is comprised of distributions from net investment income of $.184 and distributions from net realized gain of $.621 per share.
D Total distributions of $.63 per share is comprised of distributions from net investment income of $.214 and distributions from net realized gain of $.411 per share.
E Total returns for periods of less than one year are not annualized.
F Total returns would have been lower if certain expenses had not been reduced during the applicable periods shown.
G Total returns do not include the effect of the sales charges.
H Amounts do not include the activity of the Underlying Funds.
I Expense ratios reflect operating expenses of the class. Expenses before reductions do not reflect amounts reimbursed by the investment adviser or reductions from expense offset arrangements and do not represent the amount paid by the class during periods when reimbursements or reductions occur. Expenses net of fee waivers reflect expenses after reimbursement by the investment adviser but prior to reductions from expense offset arrangements. Expenses net of all reductions represent the net expenses paid by the class but do not include expenses of the underlying funds in which the Fund invests.
J Annualized
See accompanying notes which are an integral part of the financial statements.
Fidelity Advisor Freedom 2020 Fund Class M
| | Six months ended (Unaudited) September 30, | Years endedMarch 31, | | | | |
| | 2018 | 2018 | 2017 | 2016 | 2015 | 2014 |
| Selected Per–Share Data | | | | | | |
| Net asset value, beginning of period | $13.71 | $13.30 | $12.51 | $13.44 | $13.54 | $13.05 |
| Income from Investment Operations | | | | | | |
| Net investment income (loss)A | .06 | .13 | .15 | .18 | .18 | .13 |
| Net realized and unrealized gain (loss) | .29 | 1.05 | 1.16 | (.52) | .55 | 1.03 |
| Total from investment operations | .35 | 1.18 | 1.31 | (.34) | .73 | 1.16 |
| Distributions from net investment income | – | (.15) | (.16) | (.18) | (.19) | (.13) |
| Distributions from net realized gain | (.48) | (.62) | (.36) | (.41) | (.64) | (.55) |
| Total distributions | (.48) | (.77) | (.52) | (.59) | (.83) | (.67)B |
| Net asset value, end of period | $13.58 | $13.71 | $13.30 | $12.51 | $13.44 | $13.54 |
| Total ReturnC,D,E | 2.60% | 8.97% | 10.81% | (2.59)% | 5.56% | 9.11% |
| Ratios to Average Net AssetsF,G | | | | | | |
| Expenses before reductions | 1.11%H | 1.01% | .50% | .50% | .50% | .50% |
| Expenses net of fee waivers, if any | 1.11%H | 1.01% | .50% | .50% | .50% | .50% |
| Expenses net of all reductions | 1.11%H | 1.01% | .50% | .50% | .50% | .50% |
| Net investment income (loss) | .87%H | .92% | 1.21% | 1.37% | 1.34% | .97% |
| Supplemental Data | | | | | | |
| Net assets, end of period (000 omitted) | $367,155 | $374,470 | $396,330 | $394,406 | $440,674 | $465,828 |
| Portfolio turnover rateF | 25%H | 20% | 19% | 20% | 21% | 40% |
A Calculated based on average shares outstanding during the period.
B Total distributions of $.67 per share is comprised of distributions from net investment income of $.125 and distributions from net realized gain of $.549 per share.
C Total returns for periods of less than one year are not annualized.
D Total returns would have been lower if certain expenses had not been reduced during the applicable periods shown.
E Total returns do not include the effect of the sales charges.
F Amounts do not include the activity of the Underlying Funds.
G Expense ratios reflect operating expenses of the class. Expenses before reductions do not reflect amounts reimbursed by the investment adviser or reductions from expense offset arrangements and do not represent the amount paid by the class during periods when reimbursements or reductions occur. Expenses net of fee waivers reflect expenses after reimbursement by the investment adviser but prior to reductions from expense offset arrangements. Expenses net of all reductions represent the net expenses paid by the class but do not include expenses of the underlying funds in which the Fund invests.
H Annualized
See accompanying notes which are an integral part of the financial statements.
Fidelity Advisor Freedom 2020 Fund Class C
| | Six months ended (Unaudited) September 30, | Years endedMarch 31, | | | | |
| | 2018 | 2018 | 2017 | 2016 | 2015 | 2014 |
| Selected Per–Share Data | | | | | | |
| Net asset value, beginning of period | $13.60 | $13.20 | $12.42 | $13.35 | $13.45 | $12.97 |
| Income from Investment Operations | | | | | | |
| Net investment income (loss)A | .03 | .06 | .09 | .11 | .11 | .06 |
| Net realized and unrealized gain (loss) | .28 | 1.05 | 1.15 | (.51) | .55 | 1.03 |
| Total from investment operations | .31 | 1.11 | 1.24 | (.40) | .66 | 1.09 |
| Distributions from net investment income | – | (.09) | (.10) | (.12) | (.12) | (.07) |
| Distributions from net realized gain | (.46) | (.62) | (.36) | (.41) | (.64) | (.54) |
| Total distributions | (.46) | (.71) | (.46) | (.53) | (.76) | (.61) |
| Net asset value, end of period | $13.45 | $13.60 | $13.20 | $12.42 | $13.35 | $13.45 |
| Total ReturnB,C,D | 2.32% | 8.45% | 10.26% | (3.11)% | 5.07% | 8.57% |
| Ratios to Average Net AssetsE,F | | | | | | |
| Expenses before reductions | 1.61%G | 1.52% | 1.00% | 1.00% | 1.00% | 1.00% |
| Expenses net of fee waivers, if any | 1.61%G | 1.52% | 1.00% | 1.00% | 1.00% | 1.00% |
| Expenses net of all reductions | 1.61%G | 1.52% | 1.00% | 1.00% | 1.00% | 1.00% |
| Net investment income (loss) | .37%G | .42% | .71% | .87% | .84% | .47% |
| Supplemental Data | | | | | | |
| Net assets, end of period (000 omitted) | $97,907 | $98,878 | $101,268 | $105,128 | $112,535 | $113,194 |
| Portfolio turnover rateE | 25%G | 20% | 19% | 20% | 21% | 40% |
A Calculated based on average shares outstanding during the period.
B Total returns for periods of less than one year are not annualized.
C Total returns would have been lower if certain expenses had not been reduced during the applicable periods shown.
D Total returns do not include the effect of the contingent deferred sales charge.
E Amounts do not include the activity of the Underlying Funds.
F Expense ratios reflect operating expenses of the class. Expenses before reductions do not reflect amounts reimbursed by the investment adviser or reductions from expense offset arrangements and do not represent the amount paid by the class during periods when reimbursements or reductions occur. Expenses net of fee waivers reflect expenses after reimbursement by the investment adviser but prior to reductions from expense offset arrangements. Expenses net of all reductions represent the net expenses paid by the class but do not include expenses of the underlying funds in which the Fund invests.
G Annualized
See accompanying notes which are an integral part of the financial statements.
Fidelity Advisor Freedom 2020 Fund Class I
| | Six months ended (Unaudited) September 30, | Years endedMarch 31, | | | | |
| | 2018 | 2018 | 2017 | 2016 | 2015 | 2014 |
| Selected Per–Share Data | | | | | | |
| Net asset value, beginning of period | $13.82 | $13.41 | $12.61 | $13.54 | $13.63 | $13.14 |
| Income from Investment Operations | | | | | | |
| Net investment income (loss)A | .09 | .20 | .22 | .24 | .25 | .20 |
| Net realized and unrealized gain (loss) | .30 | 1.05 | 1.16 | (.51) | .56 | 1.03 |
| Total from investment operations | .39 | 1.25 | 1.38 | (.27) | .81 | 1.23 |
| Distributions from net investment income | (.01) | (.22) | (.22) | (.25) | (.26) | (.19) |
| Distributions from net realized gain | (.49) | (.62) | (.36) | (.41) | (.64) | (.55) |
| Total distributions | (.50) | (.84) | (.58) | (.66) | (.90) | (.74) |
| Net asset value, end of period | $13.71 | $13.82 | $13.41 | $12.61 | $13.54 | $13.63 |
| Total ReturnB,C | 2.86% | 9.45% | 11.36% | (2.07)% | 6.13% | 9.58% |
| Ratios to Average Net AssetsD,E | | | | | | |
| Expenses before reductions | .61%F | .52% | - %G | - %G | - %G | - %G |
| Expenses net of fee waivers, if any | .61%F | .52% | -% | -% | -% | -% |
| Expenses net of all reductions | .61%F | .52% | -% | -% | -% | -% |
| Net investment income (loss) | 1.37%F | 1.42% | 1.71% | 1.87% | 1.84% | 1.47% |
| Supplemental Data | | | | | | |
| Net assets, end of period (000 omitted) | $829,133 | $803,562 | $743,042 | $767,908 | $836,880 | $875,979 |
| Portfolio turnover rateD | 25%F | 20% | 19% | 20% | 21% | 40% |
A Calculated based on average shares outstanding during the period.
B Total returns for periods of less than one year are not annualized.
C Total returns would have been lower if certain expenses had not been reduced during the applicable periods shown.
D Amounts do not include the activity of the Underlying Funds.
E Expense ratios reflect operating expenses of the class. Expenses before reductions do not reflect amounts reimbursed by the investment adviser or reductions from expense offset arrangements and do not represent the amount paid by the class during periods when reimbursements or reductions occur. Expenses net of fee waivers reflect expenses after reimbursement by the investment adviser but prior to reductions from expense offset arrangements. Expenses net of all reductions represent the net expenses paid by the class but do not include expenses of the underlying funds in which the Fund invests.
F Annualized
G Amount represents less than .005%.
See accompanying notes which are an integral part of the financial statements.
Fidelity Advisor Freedom 2020 Fund Class Z6
| | Six months ended (Unaudited) September 30, | Years endedMarch 31, |
| | 2018 | 2018 A |
| Selected Per–Share Data | | |
| Net asset value, beginning of period | $13.81 | $13.62 |
| Income from Investment Operations | | |
| Net investment income (loss)B | .11 | .08 |
| Net realized and unrealized gain (loss) | .29 | .75 |
| Total from investment operations | .40 | .83 |
| Distributions from net investment income | (.03) | (.23) |
| Distributions from net realized gain | (.49) | (.41) |
| Total distributions | (.51)C | (.64) |
| Net asset value, end of period | $13.70 | $13.81 |
| Total ReturnD,E | 2.97% | 6.08% |
| Ratios to Average Net AssetsF,G | | |
| Expenses before reductions | .43%H | .45%H,I |
| Expenses net of fee waivers, if any | .43%H | .45%H,I |
| Expenses net of all reductions | .43%H | .45%H,I |
| Net investment income (loss) | 1.55%H | .71%H |
| Supplemental Data | | |
| Net assets, end of period (000 omitted) | $36,699 | $29,132 |
| Portfolio turnover rateF | 25%H | 20% |
A For the period June 6, 2017 (commencement of sale of shares) to March 31, 2018.
B Calculated based on average shares outstanding during the period.
C Total distributions of $.51 per share is comprised of distributions from net investment income of $.026 and distributions from net realized gain of $.486 per share.
D Total returns for periods of less than one year are not annualized.
E Total returns would have been lower if certain expenses had not been reduced during the applicable periods shown.
F Amounts do not include the activity of the Underlying Funds.
G Expense ratios reflect operating expenses of the class. Expenses before reductions do not reflect amounts reimbursed by the investment adviser or reductions from expense offset arrangements and do not represent the amount paid by the class during periods when reimbursements or reductions occur. Expenses net of fee waivers reflect expenses after reimbursement by the investment adviser but prior to reductions from expense offset arrangements. Expenses net of all reductions represent the net expenses paid by the class but do not include expenses of the underlying funds in which the Fund invests.
H Annualized
I On certain classes, the size and fluctuation of net assets and expense amounts may cause ratios to differ from contractual rates.
See accompanying notes which are an integral part of the financial statements.
Fidelity Advisor Freedom® 2025 Fund
Investment Summary (Unaudited)
The information in the following tables is based on the direct investments of the Fund.
Top Holdings as of September 30, 2018
| | % of fund's net assets |
| Fidelity Series Investment Grade Bond Fund | 19.8 |
| Fidelity Series Large Cap Stock Fund | 8.1 |
| Fidelity Series Emerging Markets Opportunities Fund | 6.2 |
| Fidelity Series International Value Fund | 6.2 |
| Fidelity Series International Growth Fund | 6.2 |
| Fidelity Series Long-Term Treasury Bond Index Fund | 5.5 |
| Fidelity Series Stock Selector Large Cap Value Fund | 5.2 |
| Fidelity Series Value Discovery Fund | 5.2 |
| Fidelity Advisor Series Equity Growth Fund | 4.6 |
| Fidelity Series Government Money Market Fund 2.12% | 4.6 |
| | 71.6 |
Asset Allocation (% of fund's net assets)
| Period end |
| | Domestic Equity Funds | 40.5% |
| | International Equity Funds | 21.3% |
| | Bond Funds | 32.1% |
| | Short-Term Funds | 6.1% |
| | Short-Term Investments | 0.1% |
| | Net Other Assets (Liabilities)* | (0.1)% |

* Net Other Assets (Liabilities) are not included in the pie chart
Domestic Equity Funds category includes Fidelity Series Commodity Strategy Fund which invests in commodity-related investments.
Fidelity Advisor Freedom® 2025 Fund
Schedule of Investments September 30, 2018 (Unaudited)
Showing Percentage of Net Assets
| U.S. Treasury Obligations - 0.1% | | | |
| | | Principal Amount | Value |
| U.S. Treasury Bills, yield at date of purchase 1.95% to 2.11% 10/4/18 to 12/6/18 (a) | | | |
| (Cost $2,004,370) | | 2,010,000 | 2,004,248 |
| | | Shares | Value |
|
| Domestic Equity Funds - 40.5% | | | |
| Fidelity Advisor Series Equity Growth Fund (b) | | 8,962,976 | $138,567,614 |
| Fidelity Advisor Series Growth Opportunities Fund (b) | | 5,567,135 | 92,637,122 |
| Fidelity Advisor Series Small Cap Fund (b) | | 5,185,545 | 65,182,303 |
| Fidelity Series All-Sector Equity Fund (b) | | 4,510,363 | 61,386,043 |
| Fidelity Series Commodity Strategy Fund (b) | | 11,942,352 | 59,711,760 |
| Fidelity Series Large Cap Stock Fund (b) | | 15,176,410 | 241,760,204 |
| Fidelity Series Large Cap Value Index Fund (b) | | 1,970,756 | 26,013,985 |
| Fidelity Series Opportunistic Insights Fund (b) | | 6,515,453 | 129,331,733 |
| Fidelity Series Small Cap Opportunities Fund (b) | | 5,610,672 | 82,420,778 |
| Fidelity Series Stock Selector Large Cap Value Fund (b) | | 11,806,647 | 156,083,873 |
| Fidelity Series Value Discovery Fund (b) | | 11,248,022 | 153,985,419 |
| TOTAL DOMESTIC EQUITY FUNDS | | | |
| (Cost $904,287,696) | | | 1,207,080,834 |
|
| International Equity Funds - 21.3% | | | |
| Fidelity Series Canada Fund (b) | | 1,685,104 | 18,215,975 |
| Fidelity Series Emerging Markets Fund (b) | | 1,910,303 | 18,510,841 |
| Fidelity Series Emerging Markets Opportunities Fund (b) | | 9,706,646 | 186,270,530 |
| Fidelity Series International Growth Fund (b) | | 11,216,552 | 183,951,453 |
| Fidelity Series International Small Cap Fund (b) | | 2,418,934 | 43,298,924 |
| Fidelity Series International Value Fund (b) | | 17,605,679 | 185,211,740 |
| TOTAL INTERNATIONAL EQUITY FUNDS | | | |
| (Cost $480,183,234) | | | 635,459,463 |
|
| Bond Funds - 32.1% | | | |
| Fidelity Series Emerging Markets Debt Fund (b) | | 2,087,846 | 19,897,168 |
| Fidelity Series Floating Rate High Income Fund (b) | | 717,666 | 6,832,178 |
| Fidelity Series High Income Fund (b) | | 4,223,265 | 40,585,577 |
| Fidelity Series Inflation-Protected Bond Index Fund (b) | | 12,106,914 | 117,558,134 |
| Fidelity Series International Credit Fund (b) | | 153,748 | 1,511,341 |
| Fidelity Series Investment Grade Bond Fund (b) | | 54,288,740 | 591,204,378 |
| Fidelity Series Long-Term Treasury Bond Index Fund (b) | | 20,015,204 | 164,925,285 |
| Fidelity Series Real Estate Income Fund (b) | | 1,271,840 | 13,710,439 |
| TOTAL BOND FUNDS | | | |
| (Cost $984,097,333) | | | 956,224,500 |
|
| Short-Term Funds - 6.1% | | | |
| Fidelity Cash Central Fund, 2.11% (c) | | 4,600,835 | 4,601,755 |
| Fidelity Series Government Money Market Fund 2.12% (b)(d) | | 137,293,397 | 137,293,397 |
| Fidelity Series Short-Term Credit Fund (b) | | 4,047,769 | 39,911,006 |
| TOTAL SHORT-TERM FUNDS | | | |
| (Cost $182,258,449) | | | 181,806,158 |
| TOTAL INVESTMENT IN SECURITIES - 100.1% | | | |
| (Cost $2,552,831,082) | | | 2,982,575,203 |
| NET OTHER ASSETS (LIABILITIES) - (0.1)% | | | (2,220,442) |
| NET ASSETS - 100% | | | $2,980,354,761 |
| Futures Contracts | | | | | |
| | Number of contracts | Expiration Date | Notional Amount | Value | Unrealized Appreciation/(Depreciation) |
| Purchased | | | | | |
| Equity Index Contracts | | | | | |
| ICE E-mini MSCI EAFE Index Contracts (United States) | 58 | Dec. 2018 | $5,728,950 | $5,480 | $5,480 |
| ICE E-mini MSCI Emerging Markets Index Contracts (United States) | 153 | Dec. 2018 | 8,030,205 | 170,078 | 170,078 |
| | | | | | 175,558 |
| Sold | | | | | |
| Equity Index Contracts | | | | | |
| CME E-mini S&P 500 Index Contracts (United States) | 109 | Dec. 2018 | 15,908,550 | (4,206) | (4,206) |
| TOTAL FUTURES CONTRACTS | | | | | $171,352 |
The notional amount of futures purchased as a percentage of Net Assets is 0.5%
The notional amount of futures sold as a percentage of Net Assets is 0.5%
Legend
(a) Security or a portion of the security was pledged to cover margin requirements for futures contracts. At period end, the value of securities pledged amounted to $740,306.
(b) Affiliated Fund
(c) Affiliated fund that is generally available only to investment companies and other accounts managed by Fidelity Investments. The rate quoted is the annualized seven-day yield of the fund at period end. A complete unaudited listing of the fund's holdings as of its most recent quarter end is available upon request. In addition, each Fidelity Central Fund's financial statements are available on the SEC's website or upon request.
(d) The rate quoted is the annualized seven-day yield of the fund at period end.
Affiliated Central Funds
Information regarding fiscal year to date income earned by the Fund from investments in Fidelity Central Funds is as follows:
| Fund | Income earned |
| Fidelity Cash Central Fund | $14,786 |
| Total | $14,786 |
Amounts in the income column in the above table include any capital gain distributions from underlying funds, which are presented in the corresponding line-item in the Statement of Operations if applicable.
Affiliated Underlying Funds
Fiscal year to date information regarding the Fund's investments in affiliated Underlying Funds, excluding any Money Market Central Funds, is presented below. Exchanges between classes of the same affiliated Underlying Funds may occur.
| Affiliate | Value, beginning of period | Purchases | Sales Proceeds | Dividend Income | Realized Gain (loss) | Change in Unrealized appreciation (depreciation) | Value, end of period |
| Fidelity Advisor Series Equity Growth Fund | $131,910,093 | $1,906,118 | $13,720,640 | $-- | $1,353,062 | $17,118,981 | $138,567,614 |
| Fidelity Advisor Series Equity Value Fund | 152,092,384 | 7,220,187 | 8,850,175 | 4,976,571 | 15,369 | (27,114,731) | -- |
| Fidelity Advisor Series Growth & Income Fund | 232,877,392 | 23,627,036 | 19,584,205 | 20,285,784 | 893,424 | (40,937,622) | -- |
| Fidelity Advisor Series Growth Opportunities Fund | 86,630,974 | 1,255,304 | 17,020,419 | -- | 4,688,601 | 17,082,662 | 92,637,122 |
| Fidelity Advisor Series Opportunistic Insights Fund | 122,841,576 | 11,177,854 | 11,719,625 | 9,444,437 | 1,028,545 | (49,877,717) | -- |
| Fidelity Advisor Series Small Cap Fund | 66,053,566 | 937,638 | 5,557,115 | -- | 287,842 | 3,460,372 | 65,182,303 |
| Fidelity Advisor Series Stock Selector Large Cap Value Fund | 153,544,687 | 14,783,410 | 9,378,406 | 12,607,884 | (25,500) | (27,284,594) | -- |
| Fidelity Series 100 Index Fund | 65,608,385 | -- | 69,164,114 | -- | 30,450,312 | (26,894,583) | -- |
| Fidelity Series All-Sector Equity Fund | 90,515,999 | 1,263,036 | 40,247,667 | -- | 7,778,618 | 2,076,057 | 61,386,043 |
| Fidelity Series Canada Fund | 18,652,399 | 254,674 | 1,835,091 | -- | 27,133 | 1,116,860 | 18,215,975 |
| Fidelity Series Commodity Strategy Fund | 64,190,392 | 8,481,873 | 8,069,668 | 3,582,275 | (2,974,263) | (1,916,574) | 59,711,760 |
| Fidelity Series Emerging Markets Debt Fund | 21,250,839 | 860,879 | 1,056,359 | 615,517 | (28,269) | (1,129,922) | 19,897,168 |
| Fidelity Series Emerging Markets Fund | -- | 18,467,053 | -- | -- | -- | 43,788 | 18,510,841 |
| Fidelity Series Emerging Markets Opportunities Fund | 200,253,721 | 21,710,096 | 10,098,220 | -- | (70,671) | (25,524,396) | 186,270,530 |
| Fidelity Series Floating Rate High Income Fund | 6,978,916 | 286,532 | 440,150 | 184,289 | (3,803) | 10,683 | 6,832,178 |
| Fidelity Series Government Money Market Fund 2.12% | 191,905,833 | 28,146,084 | 82,758,520 | 1,669,588 | -- | -- | 137,293,397 |
| Fidelity Series High Income Fund | 42,751,545 | 1,728,742 | 4,239,864 | 1,196,986 | (65,571) | 410,725 | 40,585,577 |
| Fidelity Series Inflation-Protected Bond Index Fund | 24,067,874 | 97,540,926 | 3,556,459 | 106,273 | (41,903) | (452,304) | 117,558,134 |
| Fidelity Series International Credit Fund | 1,507,928 | 18,583 | -- | 18,583 | -- | (15,170) | 1,511,341 |
| Fidelity Series International Growth Fund | 190,574,782 | 5,152,137 | 14,622,041 | -- | 3,657,893 | (811,318) | 183,951,453 |
| Fidelity Series International Small Cap Fund | 47,564,731 | 621,275 | 3,081,359 | -- | 627,587 | (2,433,310) | 43,298,924 |
| Fidelity Series International Value Fund | 190,117,014 | 6,494,697 | 10,837,314 | -- | 489,359 | (1,052,016) | 185,211,740 |
| Fidelity Series Investment Grade Bond Fund | 663,099,615 | 17,323,811 | 81,859,849 | 8,904,338 | (3,658,472) | (3,700,727) | 591,204,378 |
| Fidelity Series Large Cap Stock Fund | -- | 80,181 | 589,797 | -- | (3,153) | 45,396,948 | 241,760,204 |
| Fidelity Series Large Cap Value Index Fund | 25,669,107 | 423,625 | 1,855,837 | -- | 185,329 | 1,591,761 | 26,013,985 |
| Fidelity Series Long-Term Treasury Bond Index Fund | 67,087,281 | 108,763,652 | 5,565,664 | 1,664,628 | (107,210) | (5,252,774) | 164,925,285 |
| Fidelity Series Opportunistic Insights Fund | -- | 42,961 | 316,868 | -- | (877) | 56,155,884 | 129,331,733 |
| Fidelity Series Real Estate Equity Fund | 15,933,541 | 90,689 | 16,421,405 | 77,109 | 1,659,698 | (1,262,523) | -- |
| Fidelity Series Real Estate Income Fund | 13,677,837 | 775,479 | 827,566 | 583,159 | 2,689 | 82,000 | 13,710,439 |
| Fidelity Series Short-Term Credit Fund | 43,250,992 | 1,113,572 | 4,453,948 | 481,085 | (39,911) | 40,301 | 39,911,006 |
| Fidelity Series Small Cap Opportunities Fund | 80,597,666 | 7,534,245 | 8,566,615 | 6,381,676 | 1,515,335 | 1,340,147 | 82,420,778 |
| Fidelity Series Stock Selector Large Cap Value Fund | -- | 107,618 | 485,240 | -- | (24,840) | 24,846,738 | 156,083,873 |
| Fidelity Series Value Discovery Fund | -- | 51,574 | 379,486 | -- | (2,178) | 30,952,475 | 153,985,419 |
| | $3,011,207,069 | $388,241,541 | $457,159,686 | $72,780,182 | $47,614,175 | $(13,933,899) | $2,975,969,200 |
Amounts in the income column in the above table include any capital gain distributions from underlying funds, which are presented in the corresponding line-item in the Statement of Operations if applicable.
Investment Valuation
The following is a summary of the inputs used, as of September 30, 2018, involving the Fund's assets and liabilities carried at fair value. The inputs or methodology used for valuing securities may not be an indication of the risk associated with investing in those securities. For more information on valuation inputs, and their aggregation into the levels used below, please refer to the Investment Valuation section in the accompanying Notes to Financial Statements.
| | Valuation Inputs at Reporting Date: |
| Description | Total | Level 1 | Level 2 | Level 3 |
| Investments in Securities: | | | | |
| Other Short-Term Investments | $2,004,248 | $-- | $2,004,248 | $-- |
| Domestic Equity Funds | 1,207,080,834 | 1,207,080,834 | -- | -- |
| International Equity Funds | 635,459,463 | 635,459,463 | -- | -- |
| Bond Funds | 956,224,500 | 956,224,500 | -- | -- |
| Short-Term Funds | 181,806,158 | 181,806,158 | -- | -- |
| Total Investments in Securities: | $2,982,575,203�� | $2,980,570,955 | $2,004,248 | $-- |
| Derivative Instruments: | | | | |
| Assets | | | | |
| Futures Contracts | $175,558 | $175,558 | $-- | $-- |
| Total Assets | $175,558 | $175,558 | $-- | $-- |
| Liabilities | | | | |
| Futures Contracts | $(4,206) | $(4,206) | $-- | $-- |
| Total Liabilities | $(4,206) | $(4,206) | $-- | $-- |
| Total Derivative Instruments: | $171,352 | $171,352 | $-- | $-- |
Value of Derivative Instruments
The following table is a summary of the Fund's value of derivative instruments by primary risk exposure as of September 30, 2018. For additional information on derivative instruments, please refer to the Derivative Instruments section in the accompanying Notes to Financial Statements.
| Primary Risk Exposure / Derivative Type | Value |
| | Asset | Liability |
| Equity Risk | | |
| Futures Contracts(a) | $175,558 | $(4,206) |
| Total Equity Risk | 175,558 | (4,206) |
| Total Value of Derivatives | $175,558 | $(4,206) |
(a) Reflects gross cumulative appreciation (depreciation) on futures contracts as presented in the Schedule of Investments. In the Statement of Assets and Liabilities, the period end daily variation margin is included in receivable or payable for daily variation margin on futures contracts, and the net cumulative appreciation (depreciation) is included in net unrealized appreciation (depreciation).
See accompanying notes which are an integral part of the financial statements.
Fidelity Advisor Freedom® 2025 Fund
Financial Statements
Statement of Assets and Liabilities
| | | September 30, 2018 (Unaudited) |
| Assets | | |
Investment in securities, at value — See accompanying schedule:
Unaffiliated issuers (cost $2,004,370) | $2,004,248 | |
| Fidelity Central Funds (cost $4,601,755) | 4,601,755 | |
| Other affiliated issuers (cost $2,546,224,957) | 2,975,969,200 | |
| Total Investment in Securities (cost $2,552,831,082) | | $2,982,575,203 |
| Receivable for investments sold | | 3,821,643 |
| Receivable for fund shares sold | | 2,678,302 |
| Dividends receivable | | 6,303 |
| Distributions receivable from Fidelity Central Funds | | 6,611 |
| Total assets | | 2,989,088,062 |
| Liabilities | | |
| Payable for investments purchased | $2,803,230 | |
| Payable for fund shares redeemed | 3,664,577 | |
| Accrued management fee | 1,610,876 | |
| Distribution and service plan fees payable | 546,210 | |
| Payable for daily variation margin on futures contracts | 108,408 | |
| Total liabilities | | 8,733,301 |
| Net Assets | | $2,980,354,761 |
| Net Assets consist of: | | |
| Paid in capital | | $2,449,768,891 |
| Undistributed net investment income | | 15,744,231 |
| Accumulated undistributed net realized gain (loss) on investments | | 84,926,166 |
| Net unrealized appreciation (depreciation) on investments | | 429,915,473 |
| Net Assets | | $2,980,354,761 |
| Calculation of Maximum Offering Price | | |
| Class A: | | |
| Net Asset Value and redemption price per share ($1,372,451,670 ÷ 100,347,726 shares) | | $13.68 |
| Maximum offering price per share (100/94.25 of $13.68) | | $14.51 |
| Class M: | | |
| Net Asset Value and redemption price per share ($431,703,548 ÷ 31,525,839 shares) | | $13.69 |
| Maximum offering price per share (100/96.50 of $13.69) | | $14.19 |
| Class C: | | |
| Net Asset Value and offering price per share ($96,149,994 ÷ 7,153,113 shares)(a) | | $13.44 |
| Class I: | | |
| Net Asset Value, offering price and redemption price per share ($1,044,154,370 ÷ 75,607,024 shares) | | $13.81 |
| Class Z6: | | |
| Net Asset Value, offering price and redemption price per share ($35,895,179 ÷ 2,600,966 shares) | | $13.80 |
(a) Redemption price per share is equal to net asset value less any applicable contingent deferred sales charge.
See accompanying notes which are an integral part of the financial statements.
Statement of Operations
| | | Six months ended September 30, 2018 (Unaudited) |
| Investment Income | | |
| Dividends: | | |
| Affiliated issuers | | $28,833,830 |
| Interest | | 8,521 |
| Income from Fidelity Central Funds | | 14,786 |
| Total income | | 28,857,137 |
| Expenses | | |
| Management fee | $9,769,969 | |
| Distribution and service plan fees | 3,325,192 | |
| Independent trustees' fees and expenses | 7,338 | |
| Total expenses before reductions | 13,102,499 | |
| Expense reductions | (48) | |
| Total expenses after reductions | | 13,102,451 |
| Net investment income (loss) | | 15,754,686 |
| Realized and Unrealized Gain (Loss) | | |
| Net realized gain (loss) on: | | |
| Investment securities: | | |
| Fidelity Central Funds | (28) | |
| Other affiliated issuers | 47,614,175 | |
| Futures contracts | (595,667) | |
| Capital gain distributions from underlying funds: | | |
| Affiliated issuers | 43,946,352 | |
| Total net realized gain (loss) | | 90,964,832 |
| Change in net unrealized appreciation (depreciation) on: | | |
| Investment securities: | | |
| Unaffiliated issuers | (109) | |
| Affiliated issuers | (13,933,899) | |
| Futures contracts | 171,352 | |
| Total change in net unrealized appreciation (depreciation) | | (13,762,656) |
| Net gain (loss) | | 77,202,176 |
| Net increase (decrease) in net assets resulting from operations | | $92,956,862 |
See accompanying notes which are an integral part of the financial statements.
Statement of Changes in Net Assets
| | Six months ended September 30, 2018 (Unaudited) | Year ended March 31, 2018 |
| Increase (Decrease) in Net Assets | | |
| Operations | | |
| Net investment income (loss) | $15,754,686 | $33,835,159 |
| Net realized gain (loss) | 90,964,832 | 183,273,762 |
| Change in net unrealized appreciation (depreciation) | (13,762,656) | 66,482,962 |
| Net increase (decrease) in net assets resulting from operations | 92,956,862 | 283,591,883 |
| Distributions to shareholders from net investment income | (184,657) | (38,001,071) |
| Distributions to shareholders from net realized gain | (105,484,492) | (117,185,415) |
| Total distributions | (105,669,149) | (155,186,486) |
| Share transactions - net increase (decrease) | (16,299,612) | (18,870,598) |
| Total increase (decrease) in net assets | (29,011,899) | 109,534,799 |
| Net Assets | | |
| Beginning of period | 3,009,366,660 | 2,899,831,861 |
| End of period | $2,980,354,761 | $3,009,366,660 |
| Other Information | | |
| Undistributed net investment income end of period | $15,744,231 | $174,202 |
See accompanying notes which are an integral part of the financial statements.
Financial Highlights
Fidelity Advisor Freedom 2025 Fund Class A
| | Six months ended (Unaudited) September 30, | Years endedMarch 31, | | | | |
| | 2018 | 2018 | 2017 | 2016 | 2015 | 2014 |
| Selected Per–Share Data | | | | | | |
| Net asset value, beginning of period | $13.74 | $13.16 | $12.29 | $13.25 | $13.33 | $12.72 |
| Income from Investment Operations | | | | | | |
| Net investment income (loss)A | .07 | .15 | .18 | .19 | .21 | .16 |
| Net realized and unrealized gain (loss) | .35 | 1.15 | 1.24 | (.54) | .60 | 1.26 |
| Total from investment operations | .42 | 1.30 | 1.42 | (.35) | .81 | 1.42 |
| Distributions from net investment income | – | (.17) | (.18) | (.20) | (.22) | (.16) |
| Distributions from net realized gain | (.48) | (.55) | (.37) | (.42) | (.67) | (.66) |
| Total distributions | (.48) | (.72) | (.55) | (.61)B | (.89) | (.81)C |
| Net asset value, end of period | $13.68 | $13.74 | $13.16 | $12.29 | $13.25 | $13.33 |
| Total ReturnD,E,F | 3.14% | 9.96% | 12.00% | (2.72)% | 6.26% | 11.54% |
| Ratios to Average Net AssetsG,H | | | | | | |
| Expenses before reductions | .90%I | .80% | .25% | .25% | .25% | .25% |
| Expenses net of fee waivers, if any | .90%I | .80% | .25% | .25% | .25% | .25% |
| Expenses net of all reductions | .90%I | .80% | .25% | .25% | .25% | .25% |
| Net investment income (loss) | 1.02%I | 1.11% | 1.43% | 1.53% | 1.55% | 1.25% |
| Supplemental Data | | | | | | |
| Net assets, end of period (000 omitted) | $1,372,452 | $1,435,987 | $1,503,384 | $1,543,665 | $1,853,121 | $1,907,797 |
| Portfolio turnover rateH | 26%I | 23% | 20% | 24% | 23% | 41% |
A Calculated based on average shares outstanding during the period.
B Total distributions of $.61 per share is comprised of distributions from net investment income of $.195 and distributions from net realized gain of $.419 per share.
C Total distributions of $.81 per share is comprised of distributions from net investment income of $.157 and distributions from net realized gain of $.657 per share.
D Total returns for periods of less than one year are not annualized.
E Total returns would have been lower if certain expenses had not been reduced during the applicable periods shown.
F Total returns do not include the effect of the sales charges.
G Expense ratios reflect operating expenses of the class. Expenses before reductions do not reflect amounts reimbursed by the investment adviser or reductions from expense offset arrangements and do not represent the amount paid by the class during periods when reimbursements or reductions occur. Expenses net of fee waivers reflect expenses after reimbursement by the investment adviser but prior to reductions from expense offset arrangements. Expenses net of all reductions represent the net expenses paid by the class but do not include expenses of the underlying funds in which the Fund invests.
H Amounts do not include the activity of the Underlying Funds.
I Annualized
See accompanying notes which are an integral part of the financial statements.
Fidelity Advisor Freedom 2025 Fund Class M
| | Six months ended (Unaudited) September 30, | Years endedMarch 31, | | | | |
| | 2018 | 2018 | 2017 | 2016 | 2015 | 2014 |
| Selected Per–Share Data | | | | | | |
| Net asset value, beginning of period | $13.76 | $13.18 | $12.31 | $13.27 | $13.35 | $12.74 |
| Income from Investment Operations | | | | | | |
| Net investment income (loss)A | .05 | .12 | .15 | .16 | .17 | .13 |
| Net realized and unrealized gain (loss) | .36 | 1.15 | 1.24 | (.54) | .61 | 1.26 |
| Total from investment operations | .41 | 1.27 | 1.39 | (.38) | .78 | 1.39 |
| Distributions from net investment income | – | (.14) | (.15) | (.16) | (.19) | (.13) |
| Distributions from net realized gain | (.48) | (.55) | (.37) | (.42) | (.67) | (.66) |
| Total distributions | (.48) | (.69) | (.52) | (.58) | (.86) | (.78)B |
| Net asset value, end of period | $13.69 | $13.76 | $13.18 | $12.31 | $13.27 | $13.35 |
| Total ReturnC,D,E | 2.99% | 9.69% | 11.70% | (2.95)% | 6.00% | 11.27% |
| Ratios to Average Net AssetsF,G | | | | | | |
| Expenses before reductions | 1.15%H | 1.05% | .50% | .50% | .50% | .50% |
| Expenses net of fee waivers, if any | 1.15%H | 1.05% | .50% | .50% | .50% | .50% |
| Expenses net of all reductions | 1.15%H | 1.05% | .50% | .50% | .50% | .50% |
| Net investment income (loss) | .77%H | .86% | 1.18% | 1.28% | 1.30% | 1.00% |
| Supplemental Data | | | | | | |
| Net assets, end of period (000 omitted) | $431,704 | $432,227 | $418,713 | $399,088 | $405,224 | $387,919 |
| Portfolio turnover rateG | 26%H | 23% | 20% | 24% | 23% | 41% |
A Calculated based on average shares outstanding during the period.
B Total distributions of $.78 per share is comprised of distributions from net investment income of $.127 and distributions from net realized gain of $.657 per share.
C Total returns for periods of less than one year are not annualized.
D Total returns would have been lower if certain expenses had not been reduced during the applicable periods shown.
E Total returns do not include the effect of the sales charges.
F Expense ratios reflect operating expenses of the class. Expenses before reductions do not reflect amounts reimbursed by the investment adviser or reductions from expense offset arrangements and do not represent the amount paid by the class during periods when reimbursements or reductions occur. Expenses net of fee waivers reflect expenses after reimbursement by the investment adviser but prior to reductions from expense offset arrangements. Expenses net of all reductions represent the net expenses paid by the class but do not include expenses of the underlying funds in which the Fund invests.
G Amounts do not include the activity of the Underlying Funds.
H Annualized
See accompanying notes which are an integral part of the financial statements.
Fidelity Advisor Freedom 2025 Fund Class C
| | Six months ended (Unaudited) September 30, | Years endedMarch 31, | | | | |
| | 2018 | 2018 | 2017 | 2016 | 2015 | 2014 |
| Selected Per–Share Data | | | | | | |
| Net asset value, beginning of period | $13.54 | $12.98 | $12.14 | $13.09 | $13.19 | $12.60 |
| Income from Investment Operations | | | | | | |
| Net investment income (loss)A | .02 | .05 | .08 | .10 | .11 | .06 |
| Net realized and unrealized gain (loss) | .34 | 1.13 | 1.23 | (.53) | .59 | 1.25 |
| Total from investment operations | .36 | 1.18 | 1.31 | (.43) | .70 | 1.31 |
| Distributions from net investment income | – | (.08) | (.10) | (.11) | (.12) | (.07) |
| Distributions from net realized gain | (.46) | (.54) | (.37) | (.41) | (.67) | (.65) |
| Total distributions | (.46) | (.62) | (.47) | (.52) | (.80)B | (.72) |
| Net asset value, end of period | $13.44 | $13.54 | $12.98 | $12.14 | $13.09 | $13.19 |
| Total ReturnC,D,E | 2.73% | 9.14% | 11.13% | (3.40)% | 5.42% | 10.71% |
| Ratios to Average Net AssetsF,G | | | | | | |
| Expenses before reductions | 1.65%H | 1.55% | 1.00% | 1.00% | 1.00% | 1.00% |
| Expenses net of fee waivers, if any | 1.65%H | 1.55% | 1.00% | 1.00% | 1.00% | 1.00% |
| Expenses net of all reductions | 1.65%H | 1.55% | 1.00% | 1.00% | 1.00% | 1.00% |
| Net investment income (loss) | .27%H | .36% | .68% | .78% | .80% | .50% |
| Supplemental Data | | | | | | |
| Net assets, end of period (000 omitted) | $96,150 | $97,691 | $97,994 | $91,941 | $94,878 | $89,402 |
| Portfolio turnover rateG | 26%H | 23% | 20% | 24% | 23% | 41% |
A Calculated based on average shares outstanding during the period.
B Total distributions of $.80 per share is comprised of distributions from net investment income of $.124 and distributions from net realized gain of $.672 per share.
C Total returns for periods of less than one year are not annualized.
D Total returns would have been lower if certain expenses had not been reduced during the applicable periods shown.
E Total returns do not include the effect of the contingent deferred sales charge.
F Expense ratios reflect operating expenses of the class. Expenses before reductions do not reflect amounts reimbursed by the investment adviser or reductions from expense offset arrangements and do not represent the amount paid by the class during periods when reimbursements or reductions occur. Expenses net of fee waivers reflect expenses after reimbursement by the investment adviser but prior to reductions from expense offset arrangements. Expenses net of all reductions represent the net expenses paid by the class but do not include expenses of the underlying funds in which the Fund invests.
G Amounts do not include the activity of the Underlying Funds.
H Annualized
See accompanying notes which are an integral part of the financial statements.
Fidelity Advisor Freedom 2025 Fund Class I
| | Six months ended (Unaudited) September 30, | Years endedMarch 31, | | | | |
| | 2018 | 2018 | 2017 | 2016 | 2015 | 2014 |
| Selected Per–Share Data | | | | | | |
| Net asset value, beginning of period | $13.86 | $13.27 | $12.39 | $13.35 | $13.43 | $12.81 |
| Income from Investment Operations | | | | | | |
| Net investment income (loss)A | .09 | .19 | .21 | .23 | .24 | .19 |
| Net realized and unrealized gain (loss) | .35 | 1.16 | 1.26 | (.54) | .60 | 1.28 |
| Total from investment operations | .44 | 1.35 | 1.47 | (.31) | .84 | 1.47 |
| Distributions from net investment income | –B | (.21) | (.21) | (.23) | (.25) | (.19) |
| Distributions from net realized gain | (.49) | (.55) | (.37) | (.42) | (.67) | (.66) |
| Total distributions | (.49) | (.76) | (.59)C | (.65) | (.92) | (.85) |
| Net asset value, end of period | $13.81 | $13.86 | $13.27 | $12.39 | $13.35 | $13.43 |
| Total ReturnD,E | 3.26% | 10.26% | 12.26% | (2.44)% | 6.48% | 11.81% |
| Ratios to Average Net AssetsF,G | | | | | | |
| Expenses before reductions | .65%H | .56% | - %I | - %I | - %I | - %I |
| Expenses net of fee waivers, if any | .65%H | .56% | -% | -% | -% | -% |
| Expenses net of all reductions | .65%H | .56% | -% | -% | -% | -% |
| Net investment income (loss) | 1.27%H | 1.35% | 1.68% | 1.78% | 1.80% | 1.50% |
| Supplemental Data | | | | | | |
| Net assets, end of period (000 omitted) | $1,044,154 | $1,018,536 | $879,740 | $870,772 | $838,616 | $846,372 |
| Portfolio turnover rateG | 26%H | 23% | 20% | 24% | 23% | 41% |
A Calculated based on average shares outstanding during the period.
B Amount represents less than $.005 per share.
C Total distributions of $.59 per share is comprised of distributions from net investment income of $.212 and distributions from net realized gain of $.373 per share.
D Total returns for periods of less than one year are not annualized.
E Total returns would have been lower if certain expenses had not been reduced during the applicable periods shown.
F Expense ratios reflect operating expenses of the class. Expenses before reductions do not reflect amounts reimbursed by the investment adviser or reductions from expense offset arrangements and do not represent the amount paid by the class during periods when reimbursements or reductions occur. Expenses net of fee waivers reflect expenses after reimbursement by the investment adviser but prior to reductions from expense offset arrangements. Expenses net of all reductions represent the net expenses paid by the class but do not include expenses of the underlying funds in which the Fund invests.
G Amounts do not include the activity of the Underlying Funds.
H Annualized
I Amount represents less than .005%.
See accompanying notes which are an integral part of the financial statements.
Fidelity Advisor Freedom 2025 Fund Class Z6
| | Six months ended (Unaudited) September 30, | Years endedMarch 31, |
| | 2018 | 2018 A |
| Selected Per–Share Data | | |
| Net asset value, beginning of period | $13.85 | $13.53 |
| Income from Investment Operations | | |
| Net investment income (loss)B | .10 | .10 |
| Net realized and unrealized gain (loss) | .36 | .80 |
| Total from investment operations | .46 | .90 |
| Distributions from net investment income | (.02) | (.22) |
| Distributions from net realized gain | (.49) | (.36) |
| Total distributions | (.51) | (.58) |
| Net asset value, end of period | $13.80 | $13.85 |
| Total ReturnC,D | 3.36% | 6.61% |
| Ratios to Average Net AssetsE,F | | |
| Expenses before reductions | .45%G | .47%G,H |
| Expenses net of fee waivers, if any | .45%G | .47%G,H |
| Expenses net of all reductions | .45%G | .47%G,H |
| Net investment income (loss) | 1.47%G | .89%G |
| Supplemental Data | | |
| Net assets, end of period (000 omitted) | $35,895 | $24,926 |
| Portfolio turnover rateF | 26%G | 23% |
A For the period June 6, 2017 (commencement of sale of shares) to March 31, 2018.
B Calculated based on average shares outstanding during the period.
C Total returns for periods of less than one year are not annualized.
D Total returns would have been lower if certain expenses had not been reduced during the applicable periods shown.
E Expense ratios reflect operating expenses of the class. Expenses before reductions do not reflect amounts reimbursed by the investment adviser or reductions from expense offset arrangements and do not represent the amount paid by the class during periods when reimbursements or reductions occur. Expenses net of fee waivers reflect expenses after reimbursement by the investment adviser but prior to reductions from expense offset arrangements. Expenses net of all reductions represent the net expenses paid by the class but do not include expenses of the underlying funds in which the Fund invests.
F Amounts do not include the activity of the Underlying Funds.
G Annualized
H On certain classes, the size and fluctuation of net assets and expense amounts may cause ratios to differ from contractual rates.
See accompanying notes which are an integral part of the financial statements.
Fidelity Advisor Freedom® 2030 Fund
Investment Summary (Unaudited)
The information in the following tables is based on the direct investments of the Fund.
Top Holdings as of September 30, 2018
| | % of fund's net assets |
| Fidelity Series Investment Grade Bond Fund | 14.9 |
| Fidelity Series Large Cap Stock Fund | 9.9 |
| Fidelity Series International Value Fund | 7.4 |
| Fidelity Series International Growth Fund | 7.4 |
| Fidelity Series Emerging Markets Opportunities Fund | 7.2 |
| Fidelity Series Stock Selector Large Cap Value Fund | 6.4 |
| Fidelity Series Value Discovery Fund | 6.3 |
| Fidelity Series Long-Term Treasury Bond Index Fund | 5.7 |
| Fidelity Advisor Series Equity Growth Fund | 5.6 |
| Fidelity Series Opportunistic Insights Fund | 5.3 |
| | 76.1 |
Asset Allocation (% of fund's net assets)
| Period end |
| | Domestic Equity Funds | 49.0% |
| | International Equity Funds | 24.7% |
| | Bond Funds | 23.8% |
| | Short-Term Funds | 2.5% |
| | Short-Term Investments | 0.1% |
| | Net Other Assets (Liabilities)* | (0.1)% |

* Net Other Assets (Liabilities) are not included in the pie chart
Domestic Equity Funds category includes Fidelity Series Commodity Strategy Fund which invests in commodity-related investments.
Fidelity Advisor Freedom® 2030 Fund
Schedule of Investments September 30, 2018 (Unaudited)
Showing Percentage of Net Assets
| U.S. Treasury Obligations - 0.1% | | | |
| | | Principal Amount | Value |
| U.S. Treasury Bills, yield at date of purchase 1.95% to 2.11% 10/4/18 to 12/6/18 (a) | | | |
| (Cost $2,153,188) | | 2,160,000 | 2,153,045 |
| | | Shares | Value |
|
| Domestic Equity Funds - 49.0% | | | |
| Fidelity Advisor Series Equity Growth Fund (b) | | 11,148,580 | $172,357,049 |
| Fidelity Advisor Series Growth Opportunities Fund (b) | | 6,964,890 | 115,895,776 |
| Fidelity Advisor Series Small Cap Fund (b) | | 6,449,549 | 81,070,831 |
| Fidelity Series All-Sector Equity Fund (b) | | 5,662,337 | 77,064,405 |
| Fidelity Series Commodity Strategy Fund (b) | | 12,400,243 | 62,001,213 |
| Fidelity Series Large Cap Stock Fund (b) | | 18,937,306 | 301,671,286 |
| Fidelity Series Large Cap Value Index Fund (b) | | 2,463,800 | 32,522,158 |
| Fidelity Series Opportunistic Insights Fund (b) | | 8,129,477 | 161,370,127 |
| Fidelity Series Small Cap Opportunities Fund (b) | | 7,019,213 | 103,112,237 |
| Fidelity Series Stock Selector Large Cap Value Fund (b) | | 14,684,481 | 194,128,839 |
| Fidelity Series Value Discovery Fund (b) | | 13,938,082 | 190,812,349 |
| TOTAL DOMESTIC EQUITY FUNDS | | | |
| (Cost $1,136,008,030) | | | 1,492,006,270 |
|
| International Equity Funds - 24.7% | | | |
| Fidelity Series Canada Fund (b) | | 2,052,838 | 22,191,183 |
| Fidelity Series Emerging Markets Fund (b) | | 837,991 | 8,120,136 |
| Fidelity Series Emerging Markets Opportunities Fund (b) | | 11,475,427 | 220,213,450 |
| Fidelity Series International Growth Fund (b) | | 13,656,432 | 223,965,477 |
| Fidelity Series International Small Cap Fund (b) | | 2,910,557 | 52,098,969 |
| Fidelity Series International Value Fund (b) | | 21,444,746 | 225,598,731 |
| TOTAL INTERNATIONAL EQUITY FUNDS | | | |
| (Cost $577,085,125) | | | 752,187,946 |
|
| Bond Funds - 23.8% | | | |
| Fidelity Series Emerging Markets Debt Fund (b) | | 2,050,068 | 19,537,152 |
| Fidelity Series Floating Rate High Income Fund (b) | | 711,119 | 6,769,851 |
| Fidelity Series High Income Fund (b) | | 4,332,397 | 41,634,336 |
| Fidelity Series Inflation-Protected Bond Index Fund (b) | | 1,843,483 | 17,900,220 |
| Fidelity Series International Credit Fund (b) | | 150,745 | 1,481,821 |
| Fidelity Series Investment Grade Bond Fund (b) | | 41,541,109 | 452,382,676 |
| Fidelity Series Long-Term Treasury Bond Index Fund (b) | | 20,922,640 | 172,402,550 |
| Fidelity Series Real Estate Income Fund (b) | | 1,261,476 | 13,598,714 |
| TOTAL BOND FUNDS | | | |
| (Cost $746,100,743) | | | 725,707,320 |
|
| Short-Term Funds - 2.5% | | | |
| Fidelity Cash Central Fund, 2.11% (c) | | 6,848,744 | 6,850,114 |
| Fidelity Series Government Money Market Fund 2.12% (b)(d) | | 60,680,590 | 60,680,590 |
| Fidelity Series Short-Term Credit Fund (b) | | 856,434 | 8,444,443 |
| TOTAL SHORT-TERM FUNDS | | | |
| (Cost $76,052,275) | | | 75,975,147 |
| TOTAL INVESTMENT IN SECURITIES - 100.1% | | | |
| (Cost $2,537,399,361) | | | 3,048,029,728 |
| NET OTHER ASSETS (LIABILITIES) - (0.1)% | | | (2,412,036) |
| NET ASSETS - 100% | | | $3,045,617,692 |
| Futures Contracts | | | | | |
| | Number of contracts | Expiration Date | Notional Amount | Value | Unrealized Appreciation/(Depreciation) |
| Purchased | | | | | |
| Equity Index Contracts | | | | | |
| ICE E-mini MSCI Emerging Markets Index Contracts (United States) | 370 | Dec. 2018 | $19,419,450 | $361,216 | $361,216 |
| Sold | | | | | |
| Equity Index Contracts | | | | | |
| CME E-mini S&P 500 Index Contracts (United States) | 92 | Dec. 2018 | 13,427,400 | (3,550) | (3,550) |
| TOTAL FUTURES CONTRACTS | | | | | $357,666 |
The notional amount of futures purchased as a percentage of Net Assets is 0.6%
The notional amount of futures sold as a percentage of Net Assets is 0.4%
Legend
(a) Security or a portion of the security was pledged to cover margin requirements for futures contracts. At period end, the value of securities pledged amounted to $1,090,522.
(b) Affiliated Fund
(c) Affiliated fund that is generally available only to investment companies and other accounts managed by Fidelity Investments. The rate quoted is the annualized seven-day yield of the fund at period end. A complete unaudited listing of the fund's holdings as of its most recent quarter end is available upon request. In addition, each Fidelity Central Fund's financial statements are available on the SEC's website or upon request.
(d) The rate quoted is the annualized seven-day yield of the fund at period end.
Affiliated Central Funds
Information regarding fiscal year to date income earned by the Fund from investments in Fidelity Central Funds is as follows:
| Fund | Income earned |
| Fidelity Cash Central Fund | $26,805 |
| Total | $26,805 |
Amounts in the income column in the above table include any capital gain distributions from underlying funds, which are presented in the corresponding line-item in the Statement of Operations if applicable.
Affiliated Underlying Funds
Fiscal year to date information regarding the Fund's investments in affiliated Underlying Funds, excluding any Money Market Central Funds, is presented below. Exchanges between classes of the same affiliated Underlying Funds may occur.
| Affiliate | Value, beginning of period | Purchases | Sales Proceeds | Dividend Income | Realized Gain (loss) | Change in Unrealized appreciation (depreciation) | Value, end of period |
| Fidelity Advisor Series Equity Growth Fund | $160,105,288 | $3,828,101 | $14,252,362 | $ - | $1,204,438 | $21,471,584 | $172,357,049 |
| Fidelity Advisor Series Equity Value Fund | 184,673,886 | 10,441,310 | 8,856,983 | 6,157,923 | 50,845 | (29,651,736) | - |
| Fidelity Advisor Series Growth & Income Fund | 282,815,807 | 31,809,428 | 19,123,671 | 25,143,407 | 717,689 | (46,871,778) | - |
| Fidelity Advisor Series Growth Opportunities Fund | 105,130,031 | 2,508,205 | 18,447,881 | - | 4,204,450 | 22,500,971 | 115,895,776 |
| Fidelity Advisor Series Opportunistic Insights Fund | 148,960,609 | 15,259,900 | 11,514,929 | 11,766,897 | 826,448 | (59,487,019) | - |
| Fidelity Advisor Series Small Cap Fund | 80,158,042 | 1,874,035 | 5,547,359 | - | 181,742 | 4,404,371 | 81,070,831 |
| Fidelity Advisor Series Stock Selector Large Cap Value Fund | 186,438,157 | 19,697,824 | 8,899,130 | 15,631,435 | 18,504 | (29,303,322) | - |
| Fidelity Series 100 Index Fund | 79,553,910 | - | 83,647,944 | - | 32,125,582 | (28,031,548) | - |
| Fidelity Series All-Sector Equity Fund | 109,869,027 | 2,521,119 | 47,490,964 | - | 8,571,919 | 3,593,304 | 77,064,405 |
| Fidelity Series Canada Fund | 22,113,942 | 496,745 | 1,785,474 | - | 30,090 | 1,335,880 | 22,191,183 |
| Fidelity Series Commodity Strategy Fund | 63,089,625 | 9,073,291 | 5,100,580 | 3,708,801 | (1,477,355) | (3,583,768) | 62,001,213 |
| Fidelity Series Emerging Markets Debt Fund | 20,524,216 | 1,005,831 | 870,527 | 599,687 | (29,535) | (1,092,833) | 19,537,152 |
| Fidelity Series Emerging Markets Fund | - | 8,088,532 | - | - | - | 31,604 | 8,120,136 |
| Fidelity Series Emerging Markets Opportunities Fund | 229,181,656 | 30,055,815 | 9,603,350 | - | (308,867) | (29,111,804) | 220,213,450 |
| Fidelity Series Floating Rate High Income Fund | 6,775,351 | 350,047 | 362,578 | 180,870 | (1,684) | 8,715 | 6,769,851 |
| Fidelity Series Government Money Market Fund 2.12% | 43,596,913 | 34,638,798 | 17,555,121 | 474,689 | - | - | 60,680,590 |
| Fidelity Series High Income Fund | 42,436,867 | 2,097,185 | 3,246,489 | 1,217,336 | (47,605) | 394,378 | 41,634,336 |
| Fidelity Series Inflation-Protected Bond Index Fund | 23,288,678 | 5,178,316 | 10,639,250 | 36,902 | (189,300) | 261,776 | 17,900,220 |
| Fidelity Series International Credit Fund | 1,478,474 | 18,221 | - | 18,220 | - | (14,874) | 1,481,821 |
| Fidelity Series International Growth Fund | 223,420,738 | 8,007,878 | 10,875,013 | - | 1,254,496 | 2,157,378 | 223,965,477 |
| Fidelity Series International Small Cap Fund | 55,748,352 | 1,300,805 | 2,809,565 | - | 279,434 | (2,420,057) | 52,098,969 |
| Fidelity Series International Value Fund | 225,385,847 | 11,298,318 | 10,407,013 | - | (142,331) | (536,090) | 225,598,731 |
| Fidelity Series Investment Grade Bond Fund | 465,066,009 | 29,957,958 | 37,267,066 | 6,545,327 | (477,702) | (4,896,523) | 452,382,676 |
| Fidelity Series Large Cap Stock Fund | - | 142,454 | 339,365 | - | (1,369) | 52,522,091 | 301,671,286 |
| Fidelity Series Large Cap Value Index Fund | 31,129,323 | 734,196 | 1,521,453 | - | 14,960 | 2,165,132 | 32,522,158 |
| Fidelity Series Long-Term Treasury Bond Index Fund | 65,647,248 | 118,011,854 | 5,272,535 | 1,713,227 | (126,601) | (5,857,416) | 172,402,550 |
| Fidelity Series Opportunistic Insights Fund | - | 76,330 | 182,672 | - | (9,269) | 67,440,729 | 161,370,127 |
| Fidelity Series Real Estate Equity Fund | 19,318,083 | 264 | 19,796,788 | 154 | 1,704,398 | (1,225,957) | - |
| Fidelity Series Real Estate Income Fund | 13,306,628 | 892,465 | 681,768 | 574,265 | 2,204 | 79,185 | 13,598,714 |
| Fidelity Series Short-Term Credit Fund | 8,273,138 | 772,858 | 601,829 | 93,960 | (2,214) | 2,490 | 8,444,443 |
| Fidelity Series Small Cap Opportunities Fund | 97,802,834 | 10,262,280 | 8,270,812 | 7,960,953 | 1,039,216 | 2,278,719 | 103,112,237 |
| Fidelity Series Stock Selector Large Cap Value Fund | - | 351,554 | 264,467 | - | (14,970) | 26,104,689 | 194,128,839 |
| Fidelity Series Value Discovery Fund | - | 91,567 | 218,260 | - | (5,485) | 34,287,205 | 190,812,349 |
| | $2,995,288,679 | $360,843,484 | $365,453,198 | $81,824,053 | $49,392,128 | $(1,044,524) | $3,039,026,569 |
Amounts in the income column in the above table include any capital gain distributions from underlying funds, which are presented in the corresponding line-item in the Statement of Operations if applicable.
Investment Valuation
The following is a summary of the inputs used, as of September 30, 2018, involving the Fund's assets and liabilities carried at fair value. The inputs or methodology used for valuing securities may not be an indication of the risk associated with investing in those securities. For more information on valuation inputs, and their aggregation into the levels used below, please refer to the Investment Valuation section in the accompanying Notes to Financial Statements.
| | Valuation Inputs at Reporting Date: |
| Description | Total | Level 1 | Level 2 | Level 3 |
| Investments in Securities: | | | | |
| Other Short-Term Investments | $2,153,045 | $-- | $2,153,045 | $-- |
| Domestic Equity Funds | 1,492,006,270 | 1,492,006,270 | -- | -- |
| International Equity Funds | 752,187,946 | 752,187,946 | -- | -- |
| Bond Funds | 725,707,320 | 725,707,320 | -- | -- |
| Short-Term Funds | 75,975,147 | 75,975,147 | -- | -- |
| Total Investments in Securities: | $3,048,029,728 | $3,045,876,683 | $2,153,045 | $-- |
| Derivative Instruments: | | | | |
| Assets | | | | |
| Futures Contracts | $361,216 | $361,216 | $-- | $-- |
| Total Assets | $361,216 | $361,216 | $-- | $-- |
| Liabilities | | | | |
| Futures Contracts | $(3,550) | $(3,550) | $-- | $-- |
| Total Liabilities | $(3,550) | $(3,550) | $-- | $-- |
| Total Derivative Instruments: | $357,666 | $357,666 | $-- | $-- |
Value of Derivative Instruments
The following table is a summary of the Fund's value of derivative instruments by primary risk exposure as of September 30, 2018. For additional information on derivative instruments, please refer to the Derivative Instruments section in the accompanying Notes to Financial Statements.
| Primary Risk Exposure / Derivative Type | Value |
| | Asset | Liability |
| Equity Risk | | |
| Futures Contracts(a) | $361,216 | $(3,550) |
| Total Equity Risk | 361,216 | (3,550) |
| Total Value of Derivatives | $361,216 | $(3,550) |
(a) Reflects gross cumulative appreciation (depreciation) on futures contracts as presented in the Schedule of Investments. In the Statement of Assets and Liabilities, the period end daily variation margin is included in receivable or payable for daily variation margin on futures contracts, and the net cumulative appreciation (depreciation) is included in net unrealized appreciation (depreciation).
See accompanying notes which are an integral part of the financial statements.
Fidelity Advisor Freedom® 2030 Fund
Financial Statements
Statement of Assets and Liabilities
| | | September 30, 2018 (Unaudited) |
| Assets | | |
Investment in securities, at value — See accompanying schedule:
Unaffiliated issuers (cost $2,153,188) | $2,153,045 | |
| Fidelity Central Funds (cost $6,850,114) | 6,850,114 | |
| Other affiliated issuers (cost $2,528,396,059) | 3,039,026,569 | |
| Total Investment in Securities (cost $2,537,399,361) | | $3,048,029,728 |
| Receivable for investments sold | | 10,365,166 |
| Receivable for fund shares sold | | 2,214,391 |
| Distributions receivable from Fidelity Central Funds | | 10,200 |
| Total assets | | 3,060,619,485 |
| Liabilities | | |
| Payable for investments purchased | $7,902,050 | |
| Payable for fund shares redeemed | 4,646,771 | |
| Accrued management fee | 1,748,436 | |
| Distribution and service plan fees payable | 554,821 | |
| Payable for daily variation margin on futures contracts | 149,715 | |
| Total liabilities | | 15,001,793 |
| Net Assets | | $3,045,617,692 |
| Net Assets consist of: | | |
| Paid in capital | | $2,424,971,246 |
| Undistributed net investment income | | 13,452,907 |
| Accumulated undistributed net realized gain (loss) on investments | | 96,205,506 |
| Net unrealized appreciation (depreciation) on investments | | 510,988,033 |
| Net Assets | | $3,045,617,692 |
| Calculation of Maximum Offering Price | | |
| Class A: | | |
| Net Asset Value and redemption price per share ($1,343,871,152 ÷ 90,059,554 shares) | | $14.92 |
| Maximum offering price per share (100/94.25 of $14.92) | | $15.83 |
| Class M: | | |
| Net Asset Value and redemption price per share ($464,853,948 ÷ 31,328,481 shares) | | $14.84 |
| Maximum offering price per share (100/96.50 of $14.84) | | $15.38 |
| Class C: | | |
| Net Asset Value and offering price per share ($99,042,908 ÷ 6,770,002 shares)(a) | | $14.63 |
| Class I: | | |
| Net Asset Value, offering price and redemption price per share ($1,092,140,557 ÷ 72,702,203 shares) | | $15.02 |
| Class Z6: | | |
| Net Asset Value, offering price and redemption price per share ($45,709,127 ÷ 3,045,737 shares) | | $15.01 |
(a) Redemption price per share is equal to net asset value less any applicable contingent deferred sales charge.
See accompanying notes which are an integral part of the financial statements.
Statement of Operations
| | | Six months ended September 30, 2018 (Unaudited) |
| Investment Income | | |
| Dividends: | | |
| Affiliated issuers | | $27,265,404 |
| Interest | | 10,089 |
| Income from Fidelity Central Funds | | 26,805 |
| Total income | | 27,302,298 |
| Expenses | | |
| Management fee | $10,501,690 | |
| Distribution and service plan fees | 3,340,722 | |
| Independent trustees' fees and expenses | 7,356 | |
| Total expenses before reductions | 13,849,768 | |
| Expense reductions | (55) | |
| Total expenses after reductions | | 13,849,713 |
| Net investment income (loss) | | 13,452,585 |
| Realized and Unrealized Gain (Loss) | | |
| Net realized gain (loss) on: | | |
| Investment securities: | | |
| Fidelity Central Funds | (67) | |
| Other affiliated issuers | 49,392,128 | |
| Futures contracts | (955,929) | |
| Capital gain distributions from underlying funds: | | |
| Affiliated issuers | 54,558,649 | |
| Total net realized gain (loss) | | 102,994,781 |
| Change in net unrealized appreciation (depreciation) on: | | |
| Investment securities: | | |
| Unaffiliated issuers | (130) | |
| Affiliated issuers | (1,044,524) | |
| Futures contracts | 357,666 | |
| Total change in net unrealized appreciation (depreciation) | | (686,988) |
| Net gain (loss) | | 102,307,793 |
| Net increase (decrease) in net assets resulting from operations | | $115,760,378 |
See accompanying notes which are an integral part of the financial statements.
Statement of Changes in Net Assets
| | Six months ended September 30, 2018 (Unaudited) | Year ended March 31, 2018 |
| Increase (Decrease) in Net Assets | | |
| Operations | | |
| Net investment income (loss) | $13,452,585 | $29,589,232 |
| Net realized gain (loss) | 102,994,781 | 206,631,223 |
| Change in net unrealized appreciation (depreciation) | (686,988) | 87,525,917 |
| Net increase (decrease) in net assets resulting from operations | 115,760,378 | 323,746,372 |
| Distributions to shareholders from net investment income | – | (32,430,120) |
| Distributions to shareholders from net realized gain | (120,442,750) | (127,678,746) |
| Total distributions | (120,442,750) | (160,108,866) |
| Share transactions - net increase (decrease) | 56,965,527 | 6,442,311 |
| Total increase (decrease) in net assets | 52,283,155 | 170,079,817 |
| Net Assets | | |
| Beginning of period | 2,993,334,537 | 2,823,254,720 |
| End of period | $3,045,617,692 | $2,993,334,537 |
| Other Information | | |
| Undistributed net investment income end of period | $13,452,907 | $322 |
See accompanying notes which are an integral part of the financial statements.
Financial Highlights
Fidelity Advisor Freedom 2030 Fund Class A
| | Six months ended (Unaudited) September 30, | Years endedMarch 31, | | | | |
| | 2018 | 2018 | 2017 | 2016 | 2015 | 2014 |
| Selected Per–Share Data | | | | | | |
| Net asset value, beginning of period | $14.95 | $14.12 | $12.99 | $14.13 | $14.15 | $13.36 |
| Income from Investment Operations | | | | | | |
| Net investment income (loss)A | .06 | .15 | .18 | .19 | .20 | .17 |
| Net realized and unrealized gain (loss) | .51 | 1.50 | 1.57 | (.64) | .70 | 1.47 |
| Total from investment operations | .57 | 1.65 | 1.75 | (.45) | .90 | 1.64 |
| Distributions from net investment income | – | (.16) | (.18) | (.19) | (.21) | (.18) |
| Distributions from net realized gain | (.60) | (.66) | (.44) | (.50) | (.71) | (.67) |
| Total distributions | (.60) | (.82) | (.62) | (.69) | (.92) | (.85) |
| Net asset value, end of period | $14.92 | $14.95 | $14.12 | $12.99 | $14.13 | $14.15 |
| Total ReturnB,C,D | 3.88% | 11.80% | 14.02% | (3.36)% | 6.54% | 12.60% |
| Ratios to Average Net AssetsE,F | | | | | | |
| Expenses before reductions | .94%G,H | .84% | .25% | .25% | .25% | .25% |
| Expenses net of fee waivers, if any | .94%G,H | .84% | .25% | .25% | .25% | .25% |
| Expenses net of all reductions | .94%G,H | .84% | .25% | .25% | .25% | .25% |
| Net investment income (loss) | .85%G | .99% | 1.34% | 1.39% | 1.42% | 1.24% |
| Supplemental Data | | | | | | |
| Net assets, end of period (000 omitted) | $1,343,871 | $1,374,112 | $1,414,388 | $1,409,909 | $1,704,036 | $1,777,132 |
| Portfolio turnover rateE | 24%G | 25% | 18% | 22% | 24% | 53% |
A Calculated based on average shares outstanding during the period.
B Total returns for periods of less than one year are not annualized.
C Total returns would have been lower if certain expenses had not been reduced during the applicable periods shown.
D Total returns do not include the effect of the sales charges.
E Amounts do not include the activity of the Underlying Funds.
F Expense ratios reflect operating expenses of the class. Expenses before reductions do not reflect amounts reimbursed by the investment adviser or reductions from expense offset arrangements and do not represent the amount paid by the class during periods when reimbursements or reductions occur. Expenses net of fee waivers reflect expenses after reimbursement by the investment adviser but prior to reductions from expense offset arrangements. Expenses net of all reductions represent the net expenses paid by the class but do not include expenses of the underlying funds in which the Fund invests.
G Annualized
H On certain classes, the size and fluctuation of net assets and expense amounts may cause ratios to differ from contractual rates.
See accompanying notes which are an integral part of the financial statements.
Fidelity Advisor Freedom 2030 Fund Class M
| | Six months ended (Unaudited) September 30, | Years endedMarch 31, | | | | |
| | 2018 | 2018 | 2017 | 2016 | 2015 | 2014 |
| Selected Per–Share Data | | | | | | |
| Net asset value, beginning of period | $14.88 | $14.06 | $12.94 | $14.09 | $14.10 | $13.32 |
| Income from Investment Operations | | | | | | |
| Net investment income (loss)A | .04 | .11 | .15 | .15 | .17 | .14 |
| Net realized and unrealized gain (loss) | .51 | 1.50 | 1.56 | (.64) | .71 | 1.46 |
| Total from investment operations | .55 | 1.61 | 1.71 | (.49) | .88 | 1.60 |
| Distributions from net investment income | – | (.13) | (.15) | (.16) | (.18) | (.15) |
| Distributions from net realized gain | (.59) | (.66) | (.44) | (.50) | (.71) | (.67) |
| Total distributions | (.59) | (.79) | (.59) | (.66) | (.89) | (.82) |
| Net asset value, end of period | $14.84 | $14.88 | $14.06 | $12.94 | $14.09 | $14.10 |
| Total ReturnB,C,D | 3.77% | 11.53% | 13.74% | (3.67)% | 6.37% | 12.29% |
| Ratios to Average Net AssetsE,F | | | | | | |
| Expenses before reductions | 1.19%G,H | 1.09% | .50% | .50% | .50% | .50% |
| Expenses net of fee waivers, if any | 1.19%G,H | 1.09% | .50% | .50% | .50% | .50% |
| Expenses net of all reductions | 1.19%G,H | 1.09% | .50% | .50% | .50% | .50% |
| Net investment income (loss) | .60%G | .74% | 1.09% | 1.14% | 1.17% | .99% |
| Supplemental Data | | | | | | |
| Net assets, end of period (000 omitted) | $464,854 | $452,750 | $442,505 | $423,312 | $453,137 | $453,944 |
| Portfolio turnover rateE | 24%G | 25% | 18% | 22% | 24% | 53% |
A Calculated based on average shares outstanding during the period.
B Total returns for periods of less than one year are not annualized.
C Total returns would have been lower if certain expenses had not been reduced during the applicable periods shown.
D Total returns do not include the effect of the sales charges.
E Amounts do not include the activity of the Underlying Funds.
F Expense ratios reflect operating expenses of the class. Expenses before reductions do not reflect amounts reimbursed by the investment adviser or reductions from expense offset arrangements and do not represent the amount paid by the class during periods when reimbursements or reductions occur. Expenses net of fee waivers reflect expenses after reimbursement by the investment adviser but prior to reductions from expense offset arrangements. Expenses net of all reductions represent the net expenses paid by the class but do not include expenses of the underlying funds in which the Fund invests.
G Annualized
H On certain classes, the size and fluctuation of net assets and expense amounts may cause ratios to differ from contractual rates.
See accompanying notes which are an integral part of the financial statements.
Fidelity Advisor Freedom 2030 Fund Class C
| | Six months ended (Unaudited) September 30, | Years endedMarch 31, | | | | |
| | 2018 | 2018 | 2017 | 2016 | 2015 | 2014 |
| Selected Per–Share Data | | | | | | |
| Net asset value, beginning of period | $14.71 | $13.92 | $12.83 | $13.97 | $14.00 | $13.23 |
| Income from Investment Operations | | | | | | |
| Net investment income (loss)A | .01 | .03 | .08 | .08 | .09 | .07 |
| Net realized and unrealized gain (loss) | .49 | 1.48 | 1.55 | (.63) | .70 | 1.45 |
| Total from investment operations | .50 | 1.51 | 1.63 | (.55) | .79 | 1.52 |
| Distributions from net investment income | – | (.07) | (.10) | (.11) | (.12) | (.09) |
| Distributions from net realized gain | (.58) | (.65) | (.44) | (.48) | (.70) | (.66) |
| Total distributions | (.58) | (.72) | (.54) | (.59) | (.82) | (.75) |
| Net asset value, end of period | $14.63 | $14.71 | $13.92 | $12.83 | $13.97 | $14.00 |
| Total ReturnB,C,D | 3.48% | 10.97% | 13.21% | (4.10)% | 5.76% | 11.77% |
| Ratios to Average Net AssetsE,F | | | | | | |
| Expenses before reductions | 1.70%G | 1.59% | 1.00% | 1.00% | 1.00% | 1.00% |
| Expenses net of fee waivers, if any | 1.70%G | 1.59% | 1.00% | 1.00% | 1.00% | 1.00% |
| Expenses net of all reductions | 1.70%G | 1.59% | 1.00% | 1.00% | 1.00% | 1.00% |
| Net investment income (loss) | .10%G | .24% | .59% | .64% | .67% | .49% |
| Supplemental Data | | | | | | |
| Net assets, end of period (000 omitted) | $99,043 | $96,199 | $94,517 | $87,691 | $91,154 | $87,867 |
| Portfolio turnover rateE | 24%G | 25% | 18% | 22% | 24% | 53% |
A Calculated based on average shares outstanding during the period.
B Total returns for periods of less than one year are not annualized.
C Total returns would have been lower if certain expenses had not been reduced during the applicable periods shown.
D Total returns do not include the effect of the contingent deferred sales charge.
E Amounts do not include the activity of the Underlying Funds.
F Expense ratios reflect operating expenses of the class. Expenses before reductions do not reflect amounts reimbursed by the investment adviser or reductions from expense offset arrangements and do not represent the amount paid by the class during periods when reimbursements or reductions occur. Expenses net of fee waivers reflect expenses after reimbursement by the investment adviser but prior to reductions from expense offset arrangements. Expenses net of all reductions represent the net expenses paid by the class but do not include expenses of the underlying funds in which the Fund invests.
G Annualized
See accompanying notes which are an integral part of the financial statements.
Fidelity Advisor Freedom 2030 Fund Class I
| | Six months ended (Unaudited) September 30, | Years endedMarch 31, | | | | |
| | 2018 | 2018 | 2017 | 2016 | 2015 | 2014 |
| Selected Per–Share Data | | | | | | |
| Net asset value, beginning of period | $15.04 | $14.21 | $13.06 | $14.21 | $14.22 | $13.42 |
| Income from Investment Operations | | | | | | |
| Net investment income (loss)A | .08 | .18 | .21 | .22 | .24 | .20 |
| Net realized and unrealized gain (loss) | .51 | 1.51 | 1.59 | (.65) | .71 | 1.48 |
| Total from investment operations | .59 | 1.69 | 1.80 | (.43) | .95 | 1.68 |
| Distributions from net investment income | – | (.21) | (.21) | (.23) | (.25) | (.21) |
| Distributions from net realized gain | (.61) | (.66) | (.44) | (.50) | (.71) | (.67) |
| Total distributions | (.61) | (.86)B | (.65) | (.72)C | (.96) | (.88) |
| Net asset value, end of period | $15.02 | $15.04 | $14.21 | $13.06 | $14.21 | $14.22 |
| Total ReturnD,E | 4.00% | 12.04% | 14.38% | (3.16)% | 6.85% | 12.89% |
| Ratios to Average Net AssetsF,G | | | | | | |
| Expenses before reductions | .70%H | .60% | - %I | - %I | - %I | - %I |
| Expenses net of fee waivers, if any | .70%H | .60% | -% | -% | -% | -% |
| Expenses net of all reductions | .70%H | .60% | -% | -% | -% | -% |
| Net investment income (loss) | 1.10%H | 1.23% | 1.59% | 1.64% | 1.67% | 1.49% |
| Supplemental Data | | | | | | |
| Net assets, end of period (000 omitted) | $1,092,141 | $1,043,420 | $871,845 | $861,408 | $919,561 | $897,398 |
| Portfolio turnover rateF | 24%H | 25% | 18% | 22% | 24% | 53% |
A Calculated based on average shares outstanding during the period.
B Total distributions of $.86 per share is comprised of distributions from net investment income of $.205 and distributions from net realized gain of $.656 per share.
C Total distributions of $.72 per share is comprised of distributions from net investment income of $.225 and distributions from net realized gain of $.499 per share.
D Total returns for periods of less than one year are not annualized.
E Total returns would have been lower if certain expenses had not been reduced during the applicable periods shown.
F Amounts do not include the activity of the Underlying Funds.
G Expense ratios reflect operating expenses of the class. Expenses before reductions do not reflect amounts reimbursed by the investment adviser or reductions from expense offset arrangements and do not represent the amount paid by the class during periods when reimbursements or reductions occur. Expenses net of fee waivers reflect expenses after reimbursement by the investment adviser but prior to reductions from expense offset arrangements. Expenses net of all reductions represent the net expenses paid by the class but do not include expenses of the underlying funds in which the Fund invests.
H Annualized
I Amount represents less than .005%.
See accompanying notes which are an integral part of the financial statements.
Fidelity Advisor Freedom 2030 Fund Class Z6
| | Six months ended (Unaudited) September 30, | Years endedMarch 31, |
| | 2018 | 2018 A |
| Selected Per–Share Data | | |
| Net asset value, beginning of period | $15.03 | $14.53 |
| Income from Investment Operations | | |
| Net investment income (loss)B | .10 | .16 |
| Net realized and unrealized gain (loss) | .51 | .99 |
| Total from investment operations | .61 | 1.15 |
| Distributions from net investment income | – | (.23) |
| Distributions from net realized gain | (.63) | (.42) |
| Total distributions | (.63) | (.65) |
| Net asset value, end of period | $15.01 | $15.03 |
| Total ReturnC,D | 4.12% | 7.90% |
| Ratios to Average Net AssetsE,F | | |
| Expenses before reductions | .47%G | .49%G,H |
| Expenses net of fee waivers, if any | .47%G | .49%G,H |
| Expenses net of all reductions | .47%G | .49%G,H |
| Net investment income (loss) | 1.33%G | 1.29%G |
| Supplemental Data | | |
| Net assets, end of period (000 omitted) | $45,709 | $26,854 |
| Portfolio turnover rateE | 24%G | 25% |
A For the period June 6, 2017 (commencement of sale of shares) to March 31, 2018.
B Calculated based on average shares outstanding during the period.
C Total returns for periods of less than one year are not annualized.
D Total returns would have been lower if certain expenses had not been reduced during the applicable periods shown.
E Amounts do not include the activity of the Underlying Funds.
F Expense ratios reflect operating expenses of the class. Expenses before reductions do not reflect amounts reimbursed by the investment adviser or reductions from expense offset arrangements and do not represent the amount paid by the class during periods when reimbursements or reductions occur. Expenses net of fee waivers reflect expenses after reimbursement by the investment adviser but prior to reductions from expense offset arrangements. Expenses net of all reductions represent the net expenses paid by the class but do not include expenses of the underlying funds in which the Fund invests.
G Annualized
H On certain classes, the size and fluctuation of net assets and expense amounts may cause ratios to differ from contractual rates.
See accompanying notes which are an integral part of the financial statements.
Fidelity Advisor Freedom® 2035 Fund
Investment Summary (Unaudited)
The information in the following tables is based on the direct investments of the Fund.
Top Holdings as of September 30, 2018
| | % of fund's net assets |
| Fidelity Series Large Cap Stock Fund | 11.7 |
| Fidelity Series International Growth Fund | 8.9 |
| Fidelity Series International Value Fund | 8.8 |
| Fidelity Series Emerging Markets Opportunities Fund | 8.3 |
| Fidelity Series Stock Selector Large Cap Value Fund | 7.4 |
| Fidelity Series Value Discovery Fund | 7.3 |
| Fidelity Advisor Series Equity Growth Fund | 6.7 |
| Fidelity Series Opportunistic Insights Fund | 6.3 |
| Fidelity Series Long-Term Treasury Bond Index Fund | 5.7 |
| Fidelity Advisor Series Growth Opportunities Fund | 4.6 |
| | 75.7 |
Asset Allocation (% of fund's net assets)
| Period end |
| | Domestic Equity Funds | 57.6% |
| | International Equity Funds | 29.3% |
| | Bond Funds | 10.2% |
| | Short-Term Funds | 2.9% |
| | Short-Term Investments | 0.1% |
| | Net Other Assets (Liabilities)* | (0.1)% |

* Net Other Assets (Liabilities) are not included in the pie chart
Domestic Equity Funds category includes Fidelity Series Commodity Strategy Fund which invests in commodity-related investments.
Fidelity Advisor Freedom® 2035 Fund
Schedule of Investments September 30, 2018 (Unaudited)
Showing Percentage of Net Assets
| U.S. Treasury Obligations - 0.1% | | | |
| | | Principal Amount | Value |
| U.S. Treasury Bills, yield at date of purchase 2.03% to 2.11% 11/23/18 to 12/6/18 (a) | | | |
| (Cost $1,744,009) | | 1,750,000 | 1,743,850 |
| | | Shares | Value |
|
| Domestic Equity Funds - 57.6% | | | |
| Fidelity Advisor Series Equity Growth Fund (b) | | 10,706,056 | $165,515,633 |
| Fidelity Advisor Series Growth Opportunities Fund (b) | | 6,718,164 | 111,790,254 |
| Fidelity Advisor Series Small Cap Fund (b) | | 6,166,917 | 77,518,140 |
| Fidelity Series All-Sector Equity Fund (b) | | 5,514,649 | 75,054,369 |
| Fidelity Series Commodity Strategy Fund (b) | | 10,051,953 | 50,259,766 |
| Fidelity Series Large Cap Stock Fund (b) | | 18,107,156 | 288,446,994 |
| Fidelity Series Large Cap Value Index Fund (b) | | 2,289,043 | 30,215,367 |
| Fidelity Series Opportunistic Insights Fund (b) | | 7,807,140 | 154,971,727 |
| Fidelity Series Small Cap Opportunities Fund (b) | | 6,791,356 | 99,765,021 |
| Fidelity Series Stock Selector Large Cap Value Fund (b) | | 13,780,802 | 182,182,202 |
| Fidelity Series Value Discovery Fund (b) | | 13,070,393 | 178,933,681 |
| TOTAL DOMESTIC EQUITY FUNDS | | | |
| (Cost $1,091,451,772) | | | 1,414,653,154 |
|
| International Equity Funds - 29.3% | | | |
| Fidelity Series Canada Fund (b) | | 1,951,495 | 21,095,657 |
| Fidelity Series Emerging Markets Fund (b) | | 1,112,140 | 10,776,633 |
| Fidelity Series Emerging Markets Opportunities Fund (b) | | 10,614,120 | 203,684,958 |
| Fidelity Series International Growth Fund (b) | | 13,273,560 | 217,686,379 |
| Fidelity Series International Small Cap Fund (b) | | 2,855,713 | 51,117,271 |
| Fidelity Series International Value Fund (b) | | 20,560,234 | 216,293,659 |
| TOTAL INTERNATIONAL EQUITY FUNDS | | | |
| (Cost $566,136,596) | | | 720,654,557 |
|
| Bond Funds - 10.2% | | | |
| Fidelity Series Emerging Markets Debt Fund (b) | | 1,574,046 | 15,000,663 |
| Fidelity Series Floating Rate High Income Fund (b) | | 554,769 | 5,281,402 |
| Fidelity Series High Income Fund (b) | | 3,394,619 | 32,622,292 |
| Fidelity Series Inflation-Protected Bond Index Fund (b) | | 751,506 | 7,297,124 |
| Fidelity Series International Credit Fund (b) | | 118,992 | 1,169,694 |
| Fidelity Series Investment Grade Bond Fund (b) | | 3,618,784 | 39,408,552 |
| Fidelity Series Long-Term Treasury Bond Index Fund (b) | | 16,864,244 | 138,961,374 |
| Fidelity Series Real Estate Income Fund (b) | | 988,359 | 10,654,513 |
| TOTAL BOND FUNDS | | | |
| (Cost $257,712,928) | | | 250,395,614 |
|
| Short-Term Funds - 2.9% | | | |
| Fidelity Cash Central Fund, 2.11% (c) | | 5,643,649 | 5,644,777 |
| Fidelity Series Government Money Market Fund 2.12% (b)(d) | | 53,292,763 | 53,292,763 |
| Fidelity Series Short-Term Credit Fund (b) | | 1,127,113 | 11,113,338 |
| TOTAL SHORT-TERM FUNDS | | | |
| (Cost $70,114,170) | | | 70,050,878 |
| TOTAL INVESTMENT IN SECURITIES - 100.1% | | | |
| (Cost $1,987,159,475) | | | 2,457,498,053 |
| NET OTHER ASSETS (LIABILITIES) - (0.1)% | | | (2,006,693) |
| NET ASSETS - 100% | | | $2,455,491,360 |
| Futures Contracts | | | | | |
| | Number of contracts | Expiration Date | Notional Amount | Value | Unrealized Appreciation/(Depreciation) |
| Purchased | | | | | |
| Equity Index Contracts | | | | | |
| CME E-mini S&P 500 Index Contracts (United States) | 82 | Dec. 2018 | $11,967,900 | $2,322 | $2,322 |
| ICE E-mini MSCI Emerging Markets Index Contracts (United States) | 199 | Dec. 2018 | 10,444,515 | 200,745 | 200,744 |
| | | | | | 203,066 |
| Sold | | | | | |
| Equity Index Contracts | | | | | |
| ICE E-mini MSCI EAFE Index Contracts (United States) | 54 | Dec. 2018 | 5,333,850 | (10,417) | (10,417) |
| TOTAL FUTURES CONTRACTS | | | | | $192,649 |
The notional amount of futures purchased as a percentage of Net Assets is 0.9%
The notional amount of futures sold as a percentage of Net Assets is 0.2%
Legend
(a) Security or a portion of the security was pledged to cover margin requirements for futures contracts. At period end, the value of securities pledged amounted to $792,058.
(b) Affiliated Fund
(c) Affiliated fund that is generally available only to investment companies and other accounts managed by Fidelity Investments. The rate quoted is the annualized seven-day yield of the fund at period end. A complete unaudited listing of the fund's holdings as of its most recent quarter end is available upon request. In addition, each Fidelity Central Fund's financial statements are available on the SEC's website or upon request.
(d) The rate quoted is the annualized seven-day yield of the fund at period end.
Affiliated Central Funds
Information regarding fiscal year to date income earned by the Fund from investments in Fidelity Central Funds is as follows:
| Fund | Income earned |
| Fidelity Cash Central Fund | $19,904 |
| Total | $19,904 |
Amounts in the income column in the above table include any capital gain distributions from underlying funds, which are presented in the corresponding line-item in the Statement of Operations if applicable.
Affiliated Underlying Funds
Fiscal year to date information regarding the Fund's investments in affiliated Underlying Funds, excluding any Money Market Central Funds, is presented below. Exchanges between classes of the same affiliated Underlying Funds may occur.
| Affiliate | Value, beginning of period | Purchases | Sales Proceeds | Dividend Income | Realized Gain (loss) | Change in Unrealized appreciation (depreciation) | Value, end of period |
| Fidelity Advisor Series Equity Growth Fund | $150,443,525 | $3,861,007 | $10,272,360 | $-- | $725,919 | $20,757,542 | $165,515,633 |
| Fidelity Advisor Series Equity Value Fund | 173,506,004 | 10,161,919 | 8,970,095 | 5,777,955 | 19,833 | (24,184,445) | -- |
| Fidelity Advisor Series Growth & Income Fund | 265,948,888 | 30,860,979 | 13,869,398 | 24,005,982 | 268,512 | (40,994,581) | -- |
| Fidelity Advisor Series Growth Opportunities Fund | 98,717,003 | 2,543,351 | 14,771,726 | -- | 2,716,369 | 22,585,257 | 111,790,254 |
| Fidelity Advisor Series Opportunistic Insights Fund | 139,796,668 | 14,890,529 | 7,734,189 | 11,306,712 | 438,538 | (53,339,875) | -- |
| Fidelity Advisor Series Small Cap Fund | 75,222,187 | 1,894,112 | 3,906,447 | -- | 66,899 | 4,241,389 | 77,518,140 |
| Fidelity Advisor Series Stock Selector Large Cap Value Fund | 175,247,506 | 18,975,974 | 8,963,167 | 14,685,040 | (37,770) | (24,040,272) | -- |
| Fidelity Series 100 Index Fund | 74,585,869 | -- | 79,175,006 | -- | 32,848,621 | (28,259,484) | -- |
| Fidelity Series All-Sector Equity Fund | 103,183,521 | 2,531,388 | 42,362,534 | -- | 5,146,342 | 6,555,652 | 75,054,369 |
| Fidelity Series Canada Fund | 20,489,780 | 497,145 | 1,156,149 | -- | 13,554 | 1,251,327 | 21,095,657 |
| Fidelity Series Commodity Strategy Fund | 49,722,217 | 8,606,020 | 3,922,703 | 3,009,105 | (959,330) | (3,186,438) | 50,259,766 |
| Fidelity Series Emerging Markets Debt Fund | 15,939,875 | 808,644 | 881,526 | 462,253 | (22,353) | (843,977) | 15,000,663 |
| Fidelity Series Emerging Markets Fund | -- | 10,678,668 | -- | -- | -- | 97,965 | 10,776,633 |
| Fidelity Series Emerging Markets Opportunities Fund | 214,011,029 | 33,080,187 | 16,730,487 | -- | 1,048,553 | (27,724,324) | 203,684,958 |
| Fidelity Series Floating Rate High Income Fund | 5,296,327 | 286,557 | 306,892 | 141,506 | (1,123) | 6,533 | 5,281,402 |
| Fidelity Series Government Money Market Fund 2.12% | 39,244,766 | 33,602,186 | 19,554,189 | 385,990 | -- | -- | 53,292,763 |
| Fidelity Series High Income Fund | 33,209,545 | 1,709,379 | 2,567,866 | 955,104 | (57,360) | 328,594 | 32,622,292 |
| Fidelity Series Inflation-Protected Bond Index Fund | 18,823,072 | 1,476,389 | 13,105,678 | 26,737 | (130,789) | 234,130 | 7,297,124 |
| Fidelity Series International Credit Fund | 1,167,052 | 14,383 | -- | 14,383 | -- | (11,741) | 1,169,694 |
| Fidelity Series International Growth Fund | 205,931,630 | 18,848,924 | 10,259,122 | -- | 312,096 | 2,852,851 | 217,686,379 |
| Fidelity Series International Small Cap Fund | 51,382,631 | 4,503,034 | 2,769,846 | -- | 3,585 | (2,002,133) | 51,117,271 |
| Fidelity Series International Value Fund | 208,848,910 | 18,073,163 | 10,032,333 | -- | (159,512) | (436,569) | 216,293,659 |
| Fidelity Series Investment Grade Bond Fund | 67,616,932 | 9,982,081 | 37,487,403 | 895,466 | (986,222) | 283,164 | 39,408,552 |
| Fidelity Series Large Cap Stock Fund | -- | 28,237 | 285,618 | -- | (3,690) | 46,493,665 | 288,446,994 |
| Fidelity Series Large Cap Value Index Fund | 28,939,369 | 774,107 | 1,526,679 | -- | 17,205 | 2,011,365 | 30,215,367 |
| Fidelity Series Long-Term Treasury Bond Index Fund | 53,989,913 | 94,205,016 | 4,480,424 | 1,396,070 | (113,260) | (4,639,871) | 138,961,374 |
| Fidelity Series Opportunistic Insights Fund | -- | 16,884 | 152,994 | -- | (6,832) | 61,062,998 | 154,971,727 |
| Fidelity Series Real Estate Equity Fund | 18,057,338 | -- | 18,571,957 | -- | 1,255,944 | (741,325) | -- |
| Fidelity Series Real Estate Income Fund | 10,443,233 | 723,551 | 577,019 | 450,780 | 2,846 | 61,902 | 10,654,513 |
| Fidelity Series Short-Term Credit Fund | 6,886,600 | 4,737,927 | 511,490 | 78,873 | (2,364) | 2,665 | 11,113,338 |
| Fidelity Series Small Cap Opportunities Fund | 91,742,421 | 10,043,438 | 4,824,085 | 7,709,229 | 282,768 | 2,520,479 | 99,765,021 |
| Fidelity Series Stock Selector Large Cap Value Fund | -- | 153,922 | 236,475 | -- | (8,370) | 21,090,854 | 182,182,202 |
| Fidelity Series Value Discovery Fund | -- | 18,407 | 183,630 | -- | (3,898) | 28,569,586 | 178,933,681 |
| | $2,398,393,811 | $338,587,508 | $340,149,487 | $71,301,185 | $42,674,711 | $10,602,883 | $2,450,109,426 |
Amounts in the income column in the above table include any capital gain distributions from underlying funds, which are presented in the corresponding line-item in the Statement of Operations if applicable.
Investment Valuation
The following is a summary of the inputs used, as of September 30, 2018, involving the Fund's assets and liabilities carried at fair value. The inputs or methodology used for valuing securities may not be an indication of the risk associated with investing in those securities. For more information on valuation inputs, and their aggregation into the levels used below, please refer to the Investment Valuation section in the accompanying Notes to Financial Statements.
| | Valuation Inputs at Reporting Date: |
| Description | Total | Level 1 | Level 2 | Level 3 |
| Investments in Securities: | | | | |
| Other Short-Term Investments | $1,743,850 | $-- | $1,743,850 | $-- |
| Domestic Equity Funds | 1,414,653,154 | 1,414,653,154 | -- | -- |
| International Equity Funds | 720,654,557 | 720,654,557 | -- | -- |
| Bond Funds | 250,395,614 | 250,395,614 | -- | -- |
| Short-Term Funds | 70,050,878 | 70,050,878 | -- | -- |
| Total Investments in Securities: | $2,457,498,053 | $2,455,754,203 | $1,743,850 | $-- |
| Derivative Instruments: | | | | |
| Assets | | | | |
| Futures Contracts | $203,066 | $203,066 | $-- | $-- |
| Total Assets | $203,066 | $203,066 | $-- | $-- |
| Liabilities | | | | |
| Futures Contracts | $(10,417) | $(10,417) | $-- | $-- |
| Total Liabilities | $(10,417) | $(10,417) | $-- | $-- |
| Total Derivative Instruments: | $192,649 | $192,649 | $-- | $-- |
Value of Derivative Instruments
The following table is a summary of the Fund's value of derivative instruments by primary risk exposure as of September 30, 2018. For additional information on derivative instruments, please refer to the Derivative Instruments section in the accompanying Notes to Financial Statements.
| Primary Risk Exposure / Derivative Type | Value |
| | Asset | Liability |
| Equity Risk | | |
| Futures Contracts(a) | $203,066 | $(10,417) |
| Total Equity Risk | 203,066 | (10,417) |
| Total Value of Derivatives | $203,066 | $(10,417) |
(a) Reflects gross cumulative appreciation (depreciation) on futures contracts as presented in the Schedule of Investments. In the Statement of Assets and Liabilities, the period end daily variation margin is included in receivable or payable for daily variation margin on futures contracts, and the net cumulative appreciation (depreciation) is included in net unrealized appreciation (depreciation).
See accompanying notes which are an integral part of the financial statements.
Fidelity Advisor Freedom® 2035 Fund
Financial Statements
Statement of Assets and Liabilities
| | | September 30, 2018 (Unaudited) |
| Assets | | |
Investment in securities, at value — See accompanying schedule:
Unaffiliated issuers (cost $1,744,009) | $1,743,850 | |
| Fidelity Central Funds (cost $5,644,777) | 5,644,777 | |
| Other affiliated issuers (cost $1,979,770,689) | 2,450,109,426 | |
| Total Investment in Securities (cost $1,987,159,475) | | $2,457,498,053 |
| Receivable for investments sold | | 29,704,586 |
| Receivable for fund shares sold | | 3,420,673 |
| Distributions receivable from Fidelity Central Funds | | 8,646 |
| Other receivables | | 3,750 |
| Total assets | | 2,490,635,708 |
| Liabilities | | |
| Payable for investments purchased | $29,259,638 | |
| Payable for fund shares redeemed | 3,840,438 | |
| Accrued management fee | 1,494,810 | |
| Distribution and service plan fees payable | 434,578 | |
| Payable for daily variation margin on futures contracts | 114,884 | |
| Total liabilities | | 35,144,348 |
| Net Assets | | $2,455,491,360 |
| Net Assets consist of: | | |
| Paid in capital | | $1,889,139,455 |
| Undistributed net investment income | | 6,850,855 |
| Accumulated undistributed net realized gain (loss) on investments | | 88,969,823 |
| Net unrealized appreciation (depreciation) on investments | | 470,531,227 |
| Net Assets | | $2,455,491,360 |
| Calculation of Maximum Offering Price | | |
| Class A: | | |
| Net Asset Value and redemption price per share ($1,075,820,898 ÷ 73,194,057 shares) | | $14.70 |
| Maximum offering price per share (100/94.25 of $14.70) | | $15.60 |
| Class M: | | |
| Net Asset Value and redemption price per share ($376,028,609 ÷ 25,845,641 shares) | | $14.55 |
| Maximum offering price per share (100/96.50 of $14.55) | | $15.08 |
| Class C: | | |
| Net Asset Value and offering price per share ($67,668,725 ÷ 4,744,306 shares)(a) | | $14.26 |
| Class I: | | |
| Net Asset Value, offering price and redemption price per share ($904,297,090 ÷ 61,012,992 shares) | | $14.82 |
| Class Z6: | | |
| Net Asset Value, offering price and redemption price per share ($31,676,038 ÷ 2,135,765 shares) | | $14.83 |
(a) Redemption price per share is equal to net asset value less any applicable contingent deferred sales charge.
See accompanying notes which are an integral part of the financial statements.
Statement of Operations
| | | Six months ended September 30, 2018 (Unaudited) |
| Investment Income | | |
| Dividends: | | |
| Affiliated issuers | | $19,282,508 |
| Interest | | 9,244 |
| Income from Fidelity Central Funds | | 19,904 |
| Total income | | 19,311,656 |
| Expenses | | |
| Management fee | $8,968,328 | |
| Distribution and service plan fees | 2,608,877 | |
| Independent trustees' fees and expenses | 5,915 | |
| Total expenses before reductions | 11,583,120 | |
| Expense reductions | (5) | |
| Total expenses after reductions | | 11,583,115 |
| Net investment income (loss) | | 7,728,541 |
| Realized and Unrealized Gain (Loss) | | |
| Net realized gain (loss) on: | | |
| Investment securities: | | |
| Fidelity Central Funds | (15) | |
| Other affiliated issuers | 42,674,711 | |
| Futures contracts | (1,049,722) | |
| Capital gain distributions from underlying funds: | | |
| Affiliated issuers | 52,018,677 | |
| Total net realized gain (loss) | | 93,643,651 |
| Change in net unrealized appreciation (depreciation) on: | | |
| Investment securities: | | |
| Unaffiliated issuers | (159) | |
| Affiliated issuers | 10,602,883 | |
| Futures contracts | 192,649 | |
| Total change in net unrealized appreciation (depreciation) | | 10,795,373 |
| Net gain (loss) | | 104,439,024 |
| Net increase (decrease) in net assets resulting from operations | | $112,167,565 |
See accompanying notes which are an integral part of the financial statements.
Statement of Changes in Net Assets
| | Six months ended September 30, 2018 (Unaudited) | Year ended March 31, 2018 |
| Increase (Decrease) in Net Assets | | |
| Operations | | |
| Net investment income (loss) | $7,728,541 | $19,282,132 |
| Net realized gain (loss) | 93,643,651 | 167,323,622 |
| Change in net unrealized appreciation (depreciation) | 10,795,373 | 99,438,855 |
| Net increase (decrease) in net assets resulting from operations | 112,167,565 | 286,044,609 |
| Distributions to shareholders from net investment income | – | (22,868,765) |
| Distributions to shareholders from net realized gain | (102,902,472) | (96,748,987) |
| Total distributions | (102,902,472) | (119,617,752) |
| Share transactions - net increase (decrease) | 49,777,837 | 25,065,653 |
| Total increase (decrease) in net assets | 59,042,930 | 191,492,510 |
| Net Assets | | |
| Beginning of period | 2,396,448,430 | 2,204,955,920 |
| End of period | $2,455,491,360 | $2,396,448,430 |
| Other Information | | |
| Undistributed net investment income end of period | $6,850,855 | $– |
| Distributions in excess of net investment income end of period | $– | $(877,686) |
See accompanying notes which are an integral part of the financial statements.
Financial Highlights
Fidelity Advisor Freedom 2035 Fund Class A
| | Six months ended (Unaudited) September 30, | Years endedMarch 31, | | | | |
| | 2018 | 2018 | 2017 | 2016 | 2015 | 2014 |
| Selected Per–Share Data | | | | | | |
| Net asset value, beginning of period | $14.65 | $13.61 | $12.37 | $13.51 | $13.54 | $12.74 |
| Income from Investment Operations | | | | | | |
| Net investment income (loss)A | .04 | .12 | .16 | .16 | .19 | .15 |
| Net realized and unrealized gain (loss) | .64 | 1.67 | 1.68 | (.66) | .71 | 1.59 |
| Total from investment operations | .68 | 1.79 | 1.84 | (.50) | .90 | 1.74 |
| Distributions from net investment income | – | (.14) | (.16) | (.17) | (.19) | (.15) |
| Distributions from net realized gain | (.63) | (.61) | (.44) | (.47) | (.73) | (.79) |
| Total distributions | (.63) | (.75) | (.60) | (.64) | (.93)B | (.94) |
| Net asset value, end of period | $14.70 | $14.65 | $13.61 | $12.37 | $13.51 | $13.54 |
| Total ReturnC,D,E | 4.72% | 13.26% | 15.51% | (3.92)% | 6.81% | 14.15% |
| Ratios to Average Net AssetsF,G | | | | | | |
| Expenses before reductions | .99%H | .87% | .25% | .25% | .25% | .25% |
| Expenses net of fee waivers, if any | .99%H | .87% | .25% | .25% | .25% | .25% |
| Expenses net of all reductions | .99%H | .87% | .25% | .25% | .25% | .25% |
| Net investment income (loss) | .59%H | .80% | 1.22% | 1.28% | 1.36% | 1.13% |
| Supplemental Data | | | | | | |
| Net assets, end of period (000 omitted) | $1,075,821 | $1,082,982 | $1,117,175 | $1,094,459 | $1,313,452 | $1,348,500 |
| Portfolio turnover rateG | 28%H | 23% | 18% | 22% | 25% | 48% |
A Calculated based on average shares outstanding during the period.
B Total distributions of $.93 per share is comprised of distributions from net investment income of $.194 and distributions from net realized gain of $.733 per share.
C Total returns for periods of less than one year are not annualized.
D Total returns would have been lower if certain expenses had not been reduced during the applicable periods shown.
E Total returns do not include the effect of the sales charges.
F Expense ratios reflect operating expenses of the class. Expenses before reductions do not reflect amounts reimbursed by the investment adviser or reductions from expense offset arrangements and do not represent the amount paid by the class during periods when reimbursements or reductions occur. Expenses net of fee waivers reflect expenses after reimbursement by the investment adviser but prior to reductions from expense offset arrangements. Expenses net of all reductions represent the net expenses paid by the class but do not include expenses of the underlying funds in which the Fund invests.
G Amounts do not include the activity of the Underlying Funds.
H Annualized
See accompanying notes which are an integral part of the financial statements.
Fidelity Advisor Freedom 2035 Fund Class M
| | Six months ended (Unaudited) September 30, | Years endedMarch 31, | | | | |
| | 2018 | 2018 | 2017 | 2016 | 2015 | 2014 |
| Selected Per–Share Data | | | | | | |
| Net asset value, beginning of period | $14.53 | $13.51 | $12.29 | $13.42 | $13.46 | $12.68 |
| Income from Investment Operations | | | | | | |
| Net investment income (loss)A | .02 | .08 | .12 | .13 | .15 | .11 |
| Net realized and unrealized gain (loss) | .63 | 1.66 | 1.68 | (.65) | .71 | 1.58 |
| Total from investment operations | .65 | 1.74 | 1.80 | (.52) | .86 | 1.69 |
| Distributions from net investment income | – | (.12) | (.14) | (.14) | (.16) | (.12) |
| Distributions from net realized gain | (.63) | (.60) | (.44) | (.46) | (.73) | (.79) |
| Total distributions | (.63) | (.72) | (.58) | (.61)B | (.90)C | (.91) |
| Net asset value, end of period | $14.55 | $14.53 | $13.51 | $12.29 | $13.42 | $13.46 |
| Total ReturnD,E,F | 4.55% | 12.98% | 15.24% | (4.08)% | 6.52% | 13.81% |
| Ratios to Average Net AssetsG,H | | | | | | |
| Expenses before reductions | 1.24%I | 1.13% | .50% | .50% | .50% | .50% |
| Expenses net of fee waivers, if any | 1.24%I | 1.13% | .50% | .50% | .50% | .50% |
| Expenses net of all reductions | 1.24%I | 1.13% | .50% | .50% | .50% | .50% |
| Net investment income (loss) | .34%I | .55% | .97% | 1.03% | 1.11% | .88% |
| Supplemental Data | | | | | | |
| Net assets, end of period (000 omitted) | $376,029 | $364,455 | $336,939 | $299,952 | $303,711 | $276,113 |
| Portfolio turnover rateH | 28%I | 23% | 18% | 22% | 25% | 48% |
A Calculated based on average shares outstanding during the period.
B Total distributions of $.61 per share is comprised of distributions from net investment income of $.143 and distributions from net realized gain of $.464 per share.
C Total distributions of $.90 per share is comprised of distributions from net investment income of $.162 and distributions from net realized gain of $.733 per share.
D Total returns for periods of less than one year are not annualized.
E Total returns would have been lower if certain expenses had not been reduced during the applicable periods shown.
F Total returns do not include the effect of the sales charges.
G Expense ratios reflect operating expenses of the class. Expenses before reductions do not reflect amounts reimbursed by the investment adviser or reductions from expense offset arrangements and do not represent the amount paid by the class during periods when reimbursements or reductions occur. Expenses net of fee waivers reflect expenses after reimbursement by the investment adviser but prior to reductions from expense offset arrangements. Expenses net of all reductions represent the net expenses paid by the class but do not include expenses of the underlying funds in which the Fund invests.
H Amounts do not include the activity of the Underlying Funds.
I Annualized
See accompanying notes which are an integral part of the financial statements.
Fidelity Advisor Freedom 2035 Fund Class C
| | Six months ended (Unaudited) September 30, | Years endedMarch 31, | | | | |
| | 2018 | 2018 | 2017 | 2016 | 2015 | 2014 |
| Selected Per–Share Data | | | | | | |
| Net asset value, beginning of period | $14.29 | $13.32 | $12.14 | $13.27 | $13.32 | $12.56 |
| Income from Investment Operations | | | | | | |
| Net investment income (loss)A | (.01) | .01 | .06 | .07 | .08 | .05 |
| Net realized and unrealized gain (loss) | .61 | 1.62 | 1.65 | (.65) | .70 | 1.56 |
| Total from investment operations | .60 | 1.63 | 1.71 | (.58) | .78 | 1.61 |
| Distributions from net investment income | – | (.07) | (.09) | (.10) | (.11) | (.07) |
| Distributions from net realized gain | (.63) | (.60) | (.44) | (.45) | (.72) | (.78) |
| Total distributions | (.63) | (.66)B | (.53) | (.55) | (.83) | (.85) |
| Net asset value, end of period | $14.26 | $14.29 | $13.32 | $12.14 | $13.27 | $13.32 |
| Total ReturnC,D,E | 4.27% | 12.40% | 14.69% | (4.58)% | 6.01% | 13.27% |
| Ratios to Average Net AssetsF,G | | | | | | |
| Expenses before reductions | 1.74%H | 1.63% | 1.00% | 1.00% | 1.00% | 1.00% |
| Expenses net of fee waivers, if any | 1.74%H | 1.63% | 1.00% | 1.00% | 1.00% | 1.00% |
| Expenses net of all reductions | 1.74%H | 1.63% | 1.00% | 1.00% | 1.00% | 1.00% |
| Net investment income (loss) | (.16)%H | .05% | .47% | .53% | .61% | .38% |
| Supplemental Data | | | | | | |
| Net assets, end of period (000 omitted) | $67,669 | $65,519 | $61,581 | $54,813 | $56,318 | $51,931 |
| Portfolio turnover rateG | 28%H | 23% | 18% | 22% | 25% | 48% |
A Calculated based on average shares outstanding during the period.
B Total distributions of $.66 per share is comprised of distributions from net investment income of $.066 and distributions from net realized gain of $.598 per share.
C Total returns for periods of less than one year are not annualized.
D Total returns would have been lower if certain expenses had not been reduced during the applicable periods shown.
E Total returns do not include the effect of the contingent deferred sales charge.
F Expense ratios reflect operating expenses of the class. Expenses before reductions do not reflect amounts reimbursed by the investment adviser or reductions from expense offset arrangements and do not represent the amount paid by the class during periods when reimbursements or reductions occur. Expenses net of fee waivers reflect expenses after reimbursement by the investment adviser but prior to reductions from expense offset arrangements. Expenses net of all reductions represent the net expenses paid by the class but do not include expenses of the underlying funds in which the Fund invests.
G Amounts do not include the activity of the Underlying Funds.
H Annualized
See accompanying notes which are an integral part of the financial statements.
Fidelity Advisor Freedom 2035 Fund Class I
| | Six months ended (Unaudited) September 30, | Years endedMarch 31, | | | | |
| | 2018 | 2018 | 2017 | 2016 | 2015 | 2014 |
| Selected Per–Share Data | | | | | | |
| Net asset value, beginning of period | $14.75 | $13.71 | $12.45 | $13.59 | $13.61 | $12.80 |
| Income from Investment Operations | | | | | | |
| Net investment income (loss)A | .06 | .15 | .19 | .20 | .22 | .18 |
| Net realized and unrealized gain (loss) | .64 | 1.68 | 1.70 | (.67) | .72 | 1.60 |
| Total from investment operations | .70 | 1.83 | 1.89 | (.47) | .94 | 1.78 |
| Distributions from net investment income | – | (.17) | (.19) | (.20) | (.23) | (.18) |
| Distributions from net realized gain | (.63) | (.62) | (.44) | (.47) | (.73) | (.79) |
| Total distributions | (.63) | (.79) | (.63) | (.67) | (.96) | (.97) |
| Net asset value, end of period | $14.82 | $14.75 | $13.71 | $12.45 | $13.59 | $13.61 |
| Total ReturnB,C | 4.83% | 13.50% | 15.79% | (3.63)% | 7.11% | 14.44% |
| Ratios to Average Net AssetsD,E | | | | | | |
| Expenses before reductions | .74%F | .64% | - %G | - %G | - %G | - %G |
| Expenses net of fee waivers, if any | .74%F | .64% | -% | -% | -% | -% |
| Expenses net of all reductions | .74%F | .64% | -% | -% | -% | -% |
| Net investment income (loss) | .84%F | 1.04% | 1.47% | 1.53% | 1.61% | 1.38% |
| Supplemental Data | | | | | | |
| Net assets, end of period (000 omitted) | $904,297 | $867,707 | $689,261 | $684,976 | $710,667 | $695,092 |
| Portfolio turnover rateE | 28%F | 23% | 18% | 22% | 25% | 48% |
A Calculated based on average shares outstanding during the period.
B Total returns for periods of less than one year are not annualized.
C Total returns would have been lower if certain expenses had not been reduced during the applicable periods shown.
D Expense ratios reflect operating expenses of the class. Expenses before reductions do not reflect amounts reimbursed by the investment adviser or reductions from expense offset arrangements and do not represent the amount paid by the class during periods when reimbursements or reductions occur. Expenses net of fee waivers reflect expenses after reimbursement by the investment adviser but prior to reductions from expense offset arrangements. Expenses net of all reductions represent the net expenses paid by the class but do not include expenses of the underlying funds in which the Fund invests.
E Amounts do not include the activity of the Underlying Funds.
F Annualized
G Amount represents less than .005%.
See accompanying notes which are an integral part of the financial statements.
Fidelity Advisor Freedom 2035 Fund Class Z6
| | Six months ended (Unaudited) September 30, | Years endedMarch 31, |
| | 2018 | 2018 A |
| Selected Per–Share Data | | |
| Net asset value, beginning of period | $14.75 | $14.07 |
| Income from Investment Operations | | |
| Net investment income (loss)B | .08 | .12 |
| Net realized and unrealized gain (loss) | .63 | 1.15 |
| Total from investment operations | .71 | 1.27 |
| Distributions from net investment income | – | (.22) |
| Distributions from net realized gain | (.63) | (.38) |
| Total distributions | (.63) | (.59)C |
| Net asset value, end of period | $14.83 | $14.75 |
| Total ReturnD,E | 4.90% | 9.03% |
| Ratios to Average Net AssetsF,G | | |
| Expenses before reductions | .49%H | .51%H,I |
| Expenses net of fee waivers, if any | .49%H | .51%H,I |
| Expenses net of all reductions | .49%H | .51%H,I |
| Net investment income (loss) | 1.09%H | .97%H |
| Supplemental Data | | |
| Net assets, end of period (000 omitted) | $31,676 | $15,784 |
| Portfolio turnover rateG | 28%H | 23% |
A For the period June 6, 2017 (commencement of sale of shares) to March 31, 2018.
B Calculated based on average shares outstanding during the period.
C Total distributions of $.59 per share is comprised of distributions from net investment income of $.216 and distributions from net realized gain of $.378 per share.
D Total returns for periods of less than one year are not annualized.
E Total returns would have been lower if certain expenses had not been reduced during the applicable periods shown.
F Expense ratios reflect operating expenses of the class. Expenses before reductions do not reflect amounts reimbursed by the investment adviser or reductions from expense offset arrangements and do not represent the amount paid by the class during periods when reimbursements or reductions occur. Expenses net of fee waivers reflect expenses after reimbursement by the investment adviser but prior to reductions from expense offset arrangements. Expenses net of all reductions represent the net expenses paid by the class but do not include expenses of the underlying funds in which the Fund invests.
G Amounts do not include the activity of the Underlying Funds.
H Annualized
I On certain classes, the size and fluctuation of net assets and expense amounts may cause ratios to differ from contractual rates.
See accompanying notes which are an integral part of the financial statements.
Fidelity Advisor Freedom® 2040 Fund
Investment Summary (Unaudited)
The information in the following tables is based on the direct investments of the Fund.
Top Holdings as of September 30, 2018
| | % of fund's net assets |
| Fidelity Series Large Cap Stock Fund | 12.3 |
| Fidelity Series International Growth Fund | 9.3 |
| Fidelity Series International Value Fund | 9.2 |
| Fidelity Series Emerging Markets Opportunities Fund | 8.6 |
| Fidelity Series Stock Selector Large Cap Value Fund | 7.8 |
| Fidelity Series Value Discovery Fund | 7.7 |
| Fidelity Advisor Series Equity Growth Fund | 7.1 |
| Fidelity Series Opportunistic Insights Fund | 6.6 |
| Fidelity Advisor Series Growth Opportunities Fund | 4.7 |
| Fidelity Series Small Cap Opportunities Fund | 4.2 |
| | 77.5 |
Asset Allocation (% of fund's net assets)
| Period end |
| | Domestic Equity Funds | 60.5% |
| | International Equity Funds | 30.8% |
| | Bond Funds | 6.8% |
| | Short-Term Funds | 1.9% |
| | Short-Term Investments | 0.1% |
| | Net Other Assets (Liabilities)* | (0.1)% |

* Net Other Assets (Liabilities) are not included in the pie chart
Domestic Equity Funds category includes Fidelity Series Commodity Strategy Fund which invests in commodity-related investments.
Fidelity Advisor Freedom® 2040 Fund
Schedule of Investments September 30, 2018 (Unaudited)
Showing Percentage of Net Assets
| U.S. Treasury Obligations - 0.1% | | | |
| | | Principal Amount | Value |
| U.S. Treasury Bills, yield at date of purchase 2.07% to 2.09% 11/23/18 to 11/29/18 (a) | | | |
| (Cost $1,425,202) | | 1,430,000 | 1,425,094 |
| | | Shares | Value |
|
| Domestic Equity Funds - 60.5% | | | |
| Fidelity Advisor Series Equity Growth Fund (b) | | 10,255,360 | $158,547,859 |
| Fidelity Advisor Series Growth Opportunities Fund (b) | | 6,417,737 | 106,791,139 |
| Fidelity Advisor Series Small Cap Fund (b) | | 5,778,599 | 72,636,990 |
| Fidelity Series All-Sector Equity Fund (b) | | 5,810,391 | 79,079,422 |
| Fidelity Series Commodity Strategy Fund (b) | | 9,441,930 | 47,209,648 |
| Fidelity Series Large Cap Stock Fund (b) | | 17,296,748 | 275,537,193 |
| Fidelity Series Large Cap Value Index Fund (b) | | 2,156,107 | 28,460,607 |
| Fidelity Series Opportunistic Insights Fund (b) | | 7,424,358 | 147,373,500 |
| Fidelity Series Small Cap Opportunities Fund (b) | | 6,370,737 | 93,586,120 |
| Fidelity Series Stock Selector Large Cap Value Fund (b) | | 13,326,200 | 176,172,364 |
| Fidelity Series Value Discovery Fund (b) | | 12,674,091 | 173,508,307 |
| TOTAL DOMESTIC EQUITY FUNDS | | | |
| (Cost $1,056,601,209) | | | 1,358,903,149 |
|
| International Equity Funds - 30.8% | | | |
| Fidelity Series Canada Fund (b) | | 1,863,449 | 20,143,879 |
| Fidelity Series Emerging Markets Fund (b) | | 1,428,867 | 13,845,725 |
| Fidelity Series Emerging Markets Opportunities Fund (b) | | 10,068,549 | 193,215,450 |
| Fidelity Series International Growth Fund (b) | | 12,694,933 | 208,196,902 |
| Fidelity Series International Small Cap Fund (b) | | 2,737,719 | 49,005,173 |
| Fidelity Series International Value Fund (b) | | 19,664,231 | 206,867,714 |
| TOTAL INTERNATIONAL EQUITY FUNDS | | | |
| (Cost $544,755,307) | | | 691,274,843 |
|
| Bond Funds - 6.8% | | | |
| Fidelity Series Emerging Markets Debt Fund (b) | | 1,450,466 | 13,822,938 |
| Fidelity Series Floating Rate High Income Fund (b) | | 505,287 | 4,810,336 |
| Fidelity Series High Income Fund (b) | | 3,045,509 | 29,267,344 |
| Fidelity Series Inflation-Protected Bond Index Fund (b) | | 697,996 | 6,777,538 |
| Fidelity Series International Credit Fund (b) | | 108,372 | 1,065,296 |
| Fidelity Series Investment Grade Bond Fund (b) | | 916,047 | 9,975,750 |
| Fidelity Series Long-Term Treasury Bond Index Fund (b) | | 9,483,964 | 78,147,860 |
| Fidelity Series Real Estate Income Fund (b) | | 901,559 | 9,718,804 |
| TOTAL BOND FUNDS | | | |
| (Cost $158,083,976) | | | 153,585,866 |
|
| Short-Term Funds - 1.9% | | | |
| Fidelity Cash Central Fund, 2.11% (c) | | 5,084,769 | 5,085,786 |
| Fidelity Series Government Money Market Fund 2.12% (b)(d) | | 31,273,503 | 31,273,503 |
| Fidelity Series Short-Term Credit Fund (b) | | 686,097 | 6,764,917 |
| TOTAL SHORT-TERM FUNDS | | | |
| (Cost $43,182,727) | | | 43,124,206 |
| TOTAL INVESTMENT IN SECURITIES - 100.1% | | | |
| (Cost $1,804,048,421) | | | 2,248,313,158 |
| NET OTHER ASSETS (LIABILITIES) - (0.1)% | | | (1,868,108) |
| NET ASSETS - 100% | | | $2,246,445,050 |
| Futures Contracts | | | | | |
| | Number of contracts | Expiration Date | Notional Amount | Value | Unrealized Appreciation/(Depreciation) |
| Purchased | | | | | |
| Equity Index Contracts | | | | | |
| CME E-mini S&P 500 Index Contracts (United States) | 88 | Dec. 2018 | $12,843,600 | $2,491 | $2,491 |
| ICE E-mini MSCI Emerging Markets Index Contracts (United States) | 108 | Dec. 2018 | 5,668,380 | 114,414 | 114,414 |
| | | | | | 116,905 |
| Sold | | | | | |
| Equity Index Contracts | | | | | |
| ICE E-mini MSCI EAFE Index Contracts (United States) | 52 | Dec. 2018 | 5,136,300 | (11,896) | (11,896) |
| TOTAL FUTURES CONTRACTS | | | | | $105,009 |
The notional amount of futures purchased as a percentage of Net Assets is 0.8%
The notional amount of futures sold as a percentage of Net Assets is 0.2%
Legend
(a) Security or a portion of the security was pledged to cover margin requirements for futures contracts. At period end, the value of securities pledged amounted to $577,002.
(b) Affiliated Fund
(c) Affiliated fund that is generally available only to investment companies and other accounts managed by Fidelity Investments. The rate quoted is the annualized seven-day yield of the fund at period end. A complete unaudited listing of the fund's holdings as of its most recent quarter end is available upon request. In addition, each Fidelity Central Fund's financial statements are available on the SEC's website or upon request.
(d) The rate quoted is the annualized seven-day yield of the fund at period end.
Affiliated Central Funds
Information regarding fiscal year to date income earned by the Fund from investments in Fidelity Central Funds is as follows:
| Fund | Income earned |
| Fidelity Cash Central Fund | $13,272 |
| Total | $13,272 |
Amounts in the income column in the above table include any capital gain distributions from underlying funds, which are presented in the corresponding line-item in the Statement of Operations if applicable.
Affiliated Underlying Funds
Fiscal year to date information regarding the Fund's investments in affiliated Underlying Funds, excluding any Money Market Central Funds, is presented below. Exchanges between classes of the same affiliated Underlying Funds may occur.
| Affiliate | Value, beginning of period | Purchases | Sales Proceeds | Dividend Income | Realized Gain (loss) | Change in Unrealized appreciation (depreciation) | Value, end of period |
| Fidelity Advisor Series Equity Growth Fund | $140,682,362 | $4,356,454 | $6,697,608 | $ - | $295,809 | $19,910,842 | $158,547,859 |
| Fidelity Advisor Series Equity Value Fund | 162,239,363 | 14,846,287 | 7,538,784 | 5,595,859 | (57,730) | (23,785,932) | - |
| Fidelity Advisor Series Growth & Income Fund | 248,668,633 | 33,284,770 | 11,706,553 | 22,620,219 | 188,101 | (38,338,164) | - |
| Fidelity Advisor Series Growth Opportunities Fund | 92,316,051 | 2,429,246 | 11,738,103 | - | 1,746,136 | 22,037,809 | 106,791,139 |
| Fidelity Advisor Series Opportunistic Insights Fund | 130,719,494 | 15,285,834 | 6,147,582 | 10,739,473 | 234,454 | (50,881,217) | - |
| Fidelity Advisor Series Small Cap Fund | 70,269,615 | 1,804,278 | 3,455,371 | - | 41,440 | 3,977,028 | 72,636,990 |
| Fidelity Advisor Series Stock Selector Large Cap Value Fund | 163,792,386 | 23,058,659 | 7,605,464 | 14,178,371 | (65,106) | (23,665,293) | - |
| Fidelity Series 100 Index Fund | 69,719,202 | - | 75,057,597 | - | 30,843,158 | (25,504,763) | - |
| Fidelity Series All-Sector Equity Fund | 96,485,101 | 2,422,458 | 30,804,417 | - | 2,529,546 | 8,446,734 | 79,079,422 |
| Fidelity Series Canada Fund | 19,115,913 | 755,952 | 911,015 | - | 6,578 | 1,176,451 | 20,143,879 |
| Fidelity Series Commodity Strategy Fund | 45,218,312 | 7,964,420 | 2,129,699 | 2,823,231 | (186,366) | (3,657,019) | 47,209,648 |
| Fidelity Series Emerging Markets Debt Fund | 14,499,809 | 743,482 | 627,621 | 423,785 | (20,626) | (772,106) | 13,822,938 |
| Fidelity Series Emerging Markets Fund | - | 13,861,376 | - | - | - | (15,651) | 13,845,725 |
| Fidelity Series Emerging Markets Opportunities Fund | 198,131,267 | 39,862,316 | 19,702,113 | - | 452,540 | (25,528,560) | 193,215,450 |
| Fidelity Series Floating Rate High Income Fund | 4,805,312 | 261,478 | 261,447 | 128,329 | (791) | 5,784 | 4,810,336 |
| Fidelity Series Government Money Market Fund 2.12% | 35,343,924 | 28,913,154 | 32,983,575 | 284,356 | - | - | 31,273,503 |
| Fidelity Series High Income Fund | 30,392,696 | 1,553,520 | 2,922,355 | 860,993 | (82,215) | 325,698 | 29,267,344�� |
| Fidelity Series Inflation-Protected Bond Index Fund | 17,270,143 | 2,322,726 | 12,895,773 | 25,607 | (133,235) | 213,677 | 6,777,538 |
| Fidelity Series International Credit Fund | 1,062,890 | 13,099 | - | 13,099 | - | (10,693) | 1,065,296 |
| Fidelity Series International Growth Fund | 192,586,304 | 21,667,959 | 9,082,300 | - | 115,189 | 2,909,750 | 208,196,902 |
| Fidelity Series International Small Cap Fund | 48,053,368 | 5,099,574 | 2,269,882 | - | (1,384) | (1,876,503) | 49,005,173 |
| Fidelity Series International Value Fund | 194,847,297 | 21,438,373 | 8,969,172 | - | (86,198) | (362,586) | 206,867,714 |
| Fidelity Series Investment Grade Bond Fund | 10,253,916 | 938,885 | 1,098,114 | 141,265 | (14,125) | (104,812) | 9,975,750 |
| Fidelity Series Large Cap Stock Fund | - | 194,788 | 185,220 | - | (221) | 43,431,059 | 275,537,193 |
| Fidelity Series Large Cap Value Index Fund | 27,203,330 | 706,505 | 1,354,271 | - | 2,944 | 1,902,099 | 28,460,607 |
| Fidelity Series Long-Term Treasury Bond Index Fund | 48,736,296 | 50,742,939 | 18,752,565 | 990,434 | (572,638) | (2,006,172) | 78,147,860 |
| Fidelity Series Opportunistic Insights Fund | - | 107,165 | 99,177 | - | (2,279) | 58,156,808 | 147,373,500 |
| Fidelity Series Real Estate Equity Fund | 16,888,409 | 140,814 | 17,708,456 | 89,155 | 1,454,060 | (774,827) | - |
| Fidelity Series Real Estate Income Fund | 9,492,141 | 660,157 | 491,615 | 409,722 | (2,482) | 60,603 | 9,718,804 |
| Fidelity Series Short-Term Credit Fund | 6,224,937 | 906,283 | 366,460 | 70,991 | (1,183) | 1,340 | 6,764,917 |
| Fidelity Series Small Cap Opportunities Fund | 85,799,818 | 9,450,271 | 4,263,385 | 7,222,923 | 194,810 | 2,404,606 | 93,586,120 |
| Fidelity Series Stock Selector Large Cap Value Fund | - | 268,916 | 128,166 | - | (5,293) | 20,521,725 | 176,172,364 |
| Fidelity Series Value Discovery Fund | - | 125,518 | 118,954 | - | (1,491) | 27,800,030 | 173,508,307 |
| | $2,180,818,289 | $306,187,656 | $298,072,814 | $66,617,812 | $36,871,402 | $15,997,745 | $2,241,802,278 |
Amounts in the income column in the above table include any capital gain distributions from underlying funds, which are presented in the corresponding line-item in the Statement of Operations if applicable.
Investment Valuation
The following is a summary of the inputs used, as of September 30, 2018, involving the Fund's assets and liabilities carried at fair value. The inputs or methodology used for valuing securities may not be an indication of the risk associated with investing in those securities. For more information on valuation inputs, and their aggregation into the levels used below, please refer to the Investment Valuation section in the accompanying Notes to Financial Statements.
| | Valuation Inputs at Reporting Date: |
| Description | Total | Level 1 | Level 2 | Level 3 |
| Investments in Securities: | | | | |
| Other Short-Term Investments | $1,425,094 | $-- | $1,425,094 | $-- |
| Domestic Equity Funds | 1,358,903,149 | 1,358,903,149 | -- | -- |
| International Equity Funds | 691,274,843 | 691,274,843 | -- | -- |
| Bond Funds | 153,585,866 | 153,585,866 | -- | -- |
| Short-Term Funds | 43,124,206 | 43,124,206 | -- | -- |
| Total Investments in Securities: | $2,248,313,158 | $2,246,888,064 | $1,425,094 | $-- |
| Derivative Instruments: | | | | |
| Assets | | | | |
| Futures Contracts | $116,905 | $116,905 | $-- | $-- |
| Total Assets | $116,905 | $116,905 | $-- | $-- |
| Liabilities | | | | |
| Futures Contracts | $(11,896) | $(11,896) | $-- | $-- |
| Total Liabilities | $(11,896) | $(11,896) | $-- | $-- |
| Total Derivative Instruments: | $105,009 | $105,009 | $-- | $-- |
Value of Derivative Instruments
The following table is a summary of the Fund's value of derivative instruments by primary risk exposure as of September 30, 2018. For additional information on derivative instruments, please refer to the Derivative Instruments section in the accompanying Notes to Financial Statements.
| Primary Risk Exposure / Derivative Type | Value |
| | Asset | Liability |
| Equity Risk | | |
| Futures Contracts(a) | $116,905 | $(11,896) |
| Total Equity Risk | 116,905 | (11,896) |
| Total Value of Derivatives | $116,905 | $(11,896) |
(a) Reflects gross cumulative appreciation (depreciation) on futures contracts as presented in the Schedule of Investments. In the Statement of Assets and Liabilities, the period end daily variation margin is included in receivable or payable for daily variation margin on futures contracts, and the net cumulative appreciation (depreciation) is included in net unrealized appreciation (depreciation).
See accompanying notes which are an integral part of the financial statements.
Fidelity Advisor Freedom® 2040 Fund
Financial Statements
Statement of Assets and Liabilities
| | | September 30, 2018 (Unaudited) |
| Assets | | |
Investment in securities, at value — See accompanying schedule:
Unaffiliated issuers (cost $1,425,202) | $1,425,094 | |
| Fidelity Central Funds (cost $5,085,786) | 5,085,786 | |
| Other affiliated issuers (cost $1,797,537,433) | 2,241,802,278 | |
| Total Investment in Securities (cost $1,804,048,421) | | $2,248,313,158 |
| Cash | | 153 |
| Receivable for investments sold | | 25,835,086 |
| Receivable for fund shares sold | | 2,367,688 |
| Distributions receivable from Fidelity Central Funds | | 7,655 |
| Total assets | | 2,276,523,740 |
| Liabilities | | |
| Payable for investments purchased | $26,202,171 | |
| Payable for fund shares redeemed | 1,993,369 | |
| Accrued management fee | 1,381,737 | |
| Distribution and service plan fees payable | 414,846 | |
| Payable for daily variation margin on futures contracts | 86,567 | |
| Total liabilities | | 30,078,690 |
| Net Assets | | $2,246,445,050 |
| Net Assets consist of: | | |
| Paid in capital | | $1,716,426,747 |
| Undistributed net investment income | | 4,700,386 |
| Accumulated undistributed net realized gain (loss) on investments | | 80,948,171 |
| Net unrealized appreciation (depreciation) on investments | | 444,369,746 |
| Net Assets | | $2,246,445,050 |
| Calculation of Maximum Offering Price | | |
| Class A: | | |
| Net Asset Value and redemption price per share ($942,738,091 ÷ 59,758,448 shares) | | $15.78 |
| Maximum offering price per share (100/94.25 of $15.78) | | $16.74 |
| Class M: | | |
| Net Asset Value and redemption price per share ($357,953,503 ÷ 22,820,756 shares) | | $15.69 |
| Maximum offering price per share (100/96.50 of $15.69) | | $16.26 |
| Class C: | | |
| Net Asset Value and offering price per share ($85,766,642 ÷ 5,591,783 shares)(a) | | $15.34 |
| Class I: | | |
| Net Asset Value, offering price and redemption price per share ($829,235,065 ÷ 52,176,043 shares) | | $15.89 |
| Class Z6: | | |
| Net Asset Value, offering price and redemption price per share ($30,751,749 ÷ 1,934,716 shares) | | $15.89 |
(a) Redemption price per share is equal to net asset value less any applicable contingent deferred sales charge.
See accompanying notes which are an integral part of the financial statements.
Statement of Operations
| | | Six months ended September 30, 2018 (Unaudited) |
| Investment Income | | |
| Dividends: | | |
| Affiliated issuers | | $17,201,976 |
| Interest | | 9,470 |
| Income from Fidelity Central Funds | | 13,272 |
| Total income | | 17,224,718 |
| Expenses | | |
| Management fee | $8,259,097 | |
| Distribution and service plan fees | 2,483,934 | |
| Independent trustees' fees and expenses | 5,379 | |
| Total expenses before reductions | 10,748,410 | |
| Expense reductions | (1) | |
| Total expenses after reductions | | 10,748,409 |
| Net investment income (loss) | | 6,476,309 |
| Realized and Unrealized Gain (Loss) | | |
| Net realized gain (loss) on: | | |
| Investment securities: | | |
| Fidelity Central Funds | (4) | |
| Other affiliated issuers | 36,871,402 | |
| Futures contracts | (875,983) | |
| Capital gain distributions from underlying funds: | | |
| Affiliated issuers | 49,415,836 | |
| Total net realized gain (loss) | | 85,411,251 |
| Change in net unrealized appreciation (depreciation) on: | | |
| Investment securities: | | |
| Unaffiliated issuers | (108) | |
| Affiliated issuers | 15,997,745 | |
| Futures contracts | 105,009 | |
| Total change in net unrealized appreciation (depreciation) | | 16,102,646 |
| Net gain (loss) | | 101,513,897 |
| Net increase (decrease) in net assets resulting from operations | | $107,990,206 |
See accompanying notes which are an integral part of the financial statements.
Statement of Changes in Net Assets
| | Six months ended September 30, 2018 (Unaudited) | Year ended March 31, 2018 |
| Increase (Decrease) in Net Assets | | |
| Operations | | |
| Net investment income (loss) | $6,476,309 | $16,946,945 |
| Net realized gain (loss) | 85,411,251 | 154,265,342 |
| Change in net unrealized appreciation (depreciation) | 16,102,646 | 91,725,502 |
| Net increase (decrease) in net assets resulting from operations | 107,990,206 | 262,937,789 |
| Distributions to shareholders from net investment income | – | (20,779,436) |
| Distributions to shareholders from net realized gain | (93,540,540) | (90,229,747) |
| Total distributions | (93,540,540) | (111,009,183) |
| Share transactions - net increase (decrease) | 52,968,089 | 7,294,311 |
| Total increase (decrease) in net assets | 67,417,755 | 159,222,917 |
| Net Assets | | |
| Beginning of period | 2,179,027,295 | 2,019,804,378 |
| End of period | $2,246,445,050 | $2,179,027,295 |
| Other Information | | |
| Undistributed net investment income end of period | $4,700,386 | $– |
| Distributions in excess of net investment income end of period | $– | $(1,775,923) |
See accompanying notes which are an integral part of the financial statements.
Financial Highlights
Fidelity Advisor Freedom 2040 Fund Class A
| | Six months ended (Unaudited) September 30, | Years endedMarch 31, | | | | |
| | 2018 | 2018 | 2017 | 2016 | 2015 | 2014 |
| Selected Per–Share Data | | | | | | |
| Net asset value, beginning of period | $15.69 | $14.57 | $13.25 | $14.49 | $14.51 | $13.61 |
| Income from Investment Operations | | | | | | |
| Net investment income (loss)A | .04 | .12 | .17 | .17 | .20 | .15 |
| Net realized and unrealized gain (loss) | .72 | 1.81 | 1.80 | (.69) | .76 | 1.74 |
| Total from investment operations | .76 | 1.93 | 1.97 | (.52) | .96 | 1.89 |
| Distributions from net investment income | – | (.15) | (.17) | (.18) | (.21) | (.16) |
| Distributions from net realized gain | (.67) | (.66) | (.48) | (.54) | (.77) | (.83) |
| Total distributions | (.67) | (.81) | (.65) | (.72) | (.98) | (.99) |
| Net asset value, end of period | $15.78 | $15.69 | $14.57 | $13.25 | $14.49 | $14.51 |
| Total ReturnB,C,D | 4.97% | 13.42% | 15.53% | (3.82)% | 6.76% | 14.37% |
| Ratios to Average Net AssetsE,F | | | | | | |
| Expenses before reductions | 1.00%G | .87% | .25% | .25% | .25% | .25% |
| Expenses net of fee waivers, if any | 1.00%G | .87% | .25% | .25% | .25% | .25% |
| Expenses net of all reductions | 1.00%G | .87% | .25% | .25% | .25% | .25% |
| Net investment income (loss) | .55%G | .78% | 1.22% | 1.27% | 1.35% | 1.10% |
| Supplemental Data | | | | | | |
| Net assets, end of period (000 omitted) | $942,738 | $948,970 | $965,401 | $950,816 | $1,154,277 | $1,195,641 |
| Portfolio turnover rateE | 27%G | 23% | 18% | 21% | 24% | 47% |
A Calculated based on average shares outstanding during the period.
B Total returns for periods of less than one year are not annualized.
C Total returns would have been lower if certain expenses had not been reduced during the applicable periods shown.
D Total returns do not include the effect of the sales charges.
E Amounts do not include the activity of the Underlying Funds.
F Expense ratios reflect operating expenses of the class. Expenses before reductions do not reflect amounts reimbursed by the investment adviser or reductions from expense offset arrangements and do not represent the amount paid by the class during periods when reimbursements or reductions occur. Expenses net of fee waivers reflect expenses after reimbursement by the investment adviser but prior to reductions from expense offset arrangements. Expenses net of all reductions represent the net expenses paid by the class but do not include expenses of the underlying funds in which the Fund invests.
G Annualized
See accompanying notes which are an integral part of the financial statements.
Fidelity Advisor Freedom 2040 Fund Class M
| | Six months ended (Unaudited) September 30, | Years endedMarch 31, | | | | |
| | 2018 | 2018 | 2017 | 2016 | 2015 | 2014 |
| Selected Per–Share Data | | | | | | |
| Net asset value, beginning of period | $15.62 | $14.52 | $13.21 | $14.45 | $14.47 | $13.58 |
| Income from Investment Operations | | | | | | |
| Net investment income (loss)A | .02 | .08 | .13 | .14 | .16 | .12 |
| Net realized and unrealized gain (loss) | .72 | 1.80 | 1.81 | (.70) | .76 | 1.73 |
| Total from investment operations | .74 | 1.88 | 1.94 | (.56) | .92 | 1.85 |
| Distributions from net investment income | – | (.12) | (.15) | (.15) | (.17) | (.13) |
| Distributions from net realized gain | (.67) | (.66) | (.48) | (.53) | (.77) | (.83) |
| Total distributions | (.67) | (.78) | (.63) | (.68) | (.94) | (.96) |
| Net asset value, end of period | $15.69 | $15.62 | $14.52 | $13.21 | $14.45 | $14.47 |
| Total ReturnB,C,D | 4.86% | 13.11% | 15.26% | (4.07)% | 6.51% | 14.06% |
| Ratios to Average Net AssetsE,F | | | | | | |
| Expenses before reductions | 1.25%G | 1.13% | .50% | .50% | .50% | .50% |
| Expenses net of fee waivers, if any | 1.25%G | 1.13% | .50% | .50% | .50% | .50% |
| Expenses net of all reductions | 1.25%G | 1.13% | .50% | .50% | .50% | .50% |
| Net investment income (loss) | .30%G | .53% | .97% | 1.02% | 1.10% | .85% |
| Supplemental Data | | | | | | |
| Net assets, end of period (000 omitted) | $357,954 | $343,164 | $324,990 | $310,107 | $333,069 | $341,608 |
| Portfolio turnover rateE | 27%G | 23% | 18% | 21% | 24% | 47% |
A Calculated based on average shares outstanding during the period.
B Total returns for periods of less than one year are not annualized.
C Total returns would have been lower if certain expenses had not been reduced during the applicable periods shown.
D Total returns do not include the effect of the sales charges.
E Amounts do not include the activity of the Underlying Funds.
F Expense ratios reflect operating expenses of the class. Expenses before reductions do not reflect amounts reimbursed by the investment adviser or reductions from expense offset arrangements and do not represent the amount paid by the class during periods when reimbursements or reductions occur. Expenses net of fee waivers reflect expenses after reimbursement by the investment adviser but prior to reductions from expense offset arrangements. Expenses net of all reductions represent the net expenses paid by the class but do not include expenses of the underlying funds in which the Fund invests.
G Annualized
See accompanying notes which are an integral part of the financial statements.
Fidelity Advisor Freedom 2040 Fund Class C
| | Six months ended (Unaudited) September 30, | Years endedMarch 31, | | | | |
| | 2018 | 2018 | 2017 | 2016 | 2015 | 2014 |
| Selected Per–Share Data | | | | | | |
| Net asset value, beginning of period | $15.32 | $14.28 | $13.02 | $14.27 | $14.30 | $13.43 |
| Income from Investment Operations | | | | | | |
| Net investment income (loss)A | (.01) | –B | .06 | .07 | .09 | .05 |
| Net realized and unrealized gain (loss) | .70 | 1.77 | 1.78 | (.70) | .75 | 1.71 |
| Total from investment operations | .69 | 1.77 | 1.84 | (.63) | .84 | 1.76 |
| Distributions from net investment income | – | (.07) | (.10) | (.10) | (.12) | (.07) |
| Distributions from net realized gain | (.67) | (.66) | (.48) | (.52) | (.75) | (.82) |
| Total distributions | (.67) | (.73) | (.58) | (.62) | (.87) | (.89) |
| Net asset value, end of period | $15.34 | $15.32 | $14.28 | $13.02 | $14.27 | $14.30 |
| Total ReturnC,D,E | 4.62% | 12.52% | 14.70% | (4.63)% | 6.01% | 13.57% |
| Ratios to Average Net AssetsF,G | | | | | | |
| Expenses before reductions | 1.75%H | 1.63% | 1.00% | 1.00% | 1.00% | 1.00% |
| Expenses net of fee waivers, if any | 1.75%H | 1.63% | 1.00% | 1.00% | 1.00% | 1.00% |
| Expenses net of all reductions | 1.75%H | 1.63% | 1.00% | 1.00% | 1.00% | 1.00% |
| Net investment income (loss) | (.20)%H | .03% | .48% | .52% | .60% | .35% |
| Supplemental Data | | | | | | |
| Net assets, end of period (000 omitted) | $85,767 | $84,365 | $79,480 | $73,036 | $77,130 | $72,247 |
| Portfolio turnover rateF | 27%H | 23% | 18% | 21% | 24% | 47% |
A Calculated based on average shares outstanding during the period.
B Amount represents less than $.005 per share.
C Total returns for periods of less than one year are not annualized.
D Total returns would have been lower if certain expenses had not been reduced during the applicable periods shown.
E Total returns do not include the effect of the contingent deferred sales charge.
F Amounts do not include the activity of the Underlying Funds.
G Expense ratios reflect operating expenses of the class. Expenses before reductions do not reflect amounts reimbursed by the investment adviser or reductions from expense offset arrangements and do not represent the amount paid by the class during periods when reimbursements or reductions occur. Expenses net of fee waivers reflect expenses after reimbursement by the investment adviser but prior to reductions from expense offset arrangements. Expenses net of all reductions represent the net expenses paid by the class but do not include expenses of the underlying funds in which the Fund invests.
H Annualized
See accompanying notes which are an integral part of the financial statements.
Fidelity Advisor Freedom 2040 Fund Class I
| | Six months ended (Unaudited) September 30, | Years endedMarch 31, | | | | |
| | 2018 | 2018 | 2017 | 2016 | 2015 | 2014 |
| Selected Per–Share Data | | | | | | |
| Net asset value, beginning of period | $15.78 | $14.65 | $13.32 | $14.57 | $14.59 | $13.67 |
| Income from Investment Operations | | | | | | |
| Net investment income (loss)A | .06 | .16 | .20 | .21 | .23 | .19 |
| Net realized and unrealized gain (loss) | .72 | 1.83 | 1.82 | (.71) | .76 | 1.75 |
| Total from investment operations | .78 | 1.99 | 2.02 | (.50) | .99 | 1.94 |
| Distributions from net investment income | – | (.19) | (.20) | (.22) | (.24) | (.19) |
| Distributions from net realized gain | (.67) | (.67) | (.49) | (.54) | (.77) | (.83) |
| Total distributions | (.67) | (.86) | (.69) | (.75)B | (1.01) | (1.02) |
| Net asset value, end of period | $15.89 | $15.78 | $14.65 | $13.32 | $14.57 | $14.59 |
| Total ReturnC,D | 5.07% | 13.74% | 15.82% | (3.62)% | 6.99% | 14.73% |
| Ratios to Average Net AssetsE,F | | | | | | |
| Expenses before reductions | .75%G | .63% | - %H | - %H | - %H | - %H |
| Expenses net of fee waivers, if any | .75%G | .63% | -% | -% | -% | -% |
| Expenses net of all reductions | .75%G | .63% | -% | -% | -% | -% |
| Net investment income (loss) | .80%G | 1.02% | 1.47% | 1.52% | 1.60% | 1.35% |
| Supplemental Data | | | | | | |
| Net assets, end of period (000 omitted) | $829,235 | $790,667 | $649,934 | $629,599 | $688,278 | $664,689 |
| Portfolio turnover rateE | 27%G | 23% | 18% | 21% | 24% | 47% |
A Calculated based on average shares outstanding during the period.
B Total distributions of $.75 per share is comprised of distributions from net investment income of $.216 and distributions from net realized gain of $.535 per share.
C Total returns for periods of less than one year are not annualized.
D Total returns would have been lower if certain expenses had not been reduced during the applicable periods shown.
E Amounts do not include the activity of the Underlying Funds.
F Expense ratios reflect operating expenses of the class. Expenses before reductions do not reflect amounts reimbursed by the investment adviser or reductions from expense offset arrangements and do not represent the amount paid by the class during periods when reimbursements or reductions occur. Expenses net of fee waivers reflect expenses after reimbursement by the investment adviser but prior to reductions from expense offset arrangements. Expenses net of all reductions represent the net expenses paid by the class but do not include expenses of the underlying funds in which the Fund invests.
G Annualized
H Amount represents less than .005%.
See accompanying notes which are an integral part of the financial statements.
Fidelity Advisor Freedom 2040 Fund Class Z6
| | Six months ended (Unaudited) September 30, | Years endedMarch 31, |
| | 2018 | 2018 A |
| Selected Per–Share Data | | |
| Net asset value, beginning of period | $15.76 | $15.04 |
| Income from Investment Operations | | |
| Net investment income (loss)B | .08 | .18 |
| Net realized and unrealized gain (loss) | .72 | 1.20 |
| Total from investment operations | .80 | 1.38 |
| Distributions from net investment income | – | (.23) |
| Distributions from net realized gain | (.67) | (.42) |
| Total distributions | (.67) | (.66)C |
| Net asset value, end of period | $15.89 | $15.76 |
| Total ReturnD,E | 5.21% | 9.12% |
| Ratios to Average Net AssetsF,G | | |
| Expenses before reductions | .49%H | .51%H,I |
| Expenses net of fee waivers, if any | .49%H | .51%H,I |
| Expenses net of all reductions | .49%H | .51%H,I |
| Net investment income (loss) | 1.05%H | 1.39%H |
| Supplemental Data | | |
| Net assets, end of period (000 omitted) | $30,752 | $11,861 |
| Portfolio turnover rateF | 27%H | 23% |
A For the period June 6, 2017 (commencement of sale of shares) to March 31, 2018.
B Calculated based on average shares outstanding during the period.
C Total distributions of $.66 per share is comprised of distributions from net investment income of $.234 and distributions from net realized gain of $.421 per share.
D Total returns for periods of less than one year are not annualized.
E Total returns would have been lower if certain expenses had not been reduced during the applicable periods shown.
F Amounts do not include the activity of the Underlying Funds.
G Expense ratios reflect operating expenses of the class. Expenses before reductions do not reflect amounts reimbursed by the investment adviser or reductions from expense offset arrangements and do not represent the amount paid by the class during periods when reimbursements or reductions occur. Expenses net of fee waivers reflect expenses after reimbursement by the investment adviser but prior to reductions from expense offset arrangements. Expenses net of all reductions represent the net expenses paid by the class but do not include expenses of the underlying funds in which the Fund invests.
H Annualized
I On certain classes, the size and fluctuation of net assets and expense amounts may cause ratios to differ from contractual rates.
See accompanying notes which are an integral part of the financial statements.
Fidelity Advisor Freedom® 2045 Fund
Investment Summary (Unaudited)
The information in the following tables is based on the direct investments of the Fund.
Top Holdings as of September 30, 2018
| | % of fund's net assets |
| Fidelity Series Large Cap Stock Fund | 12.3 |
| Fidelity Series International Growth Fund | 9.3 |
| Fidelity Series International Value Fund | 9.2 |
| Fidelity Series Emerging Markets Opportunities Fund | 8.6 |
| Fidelity Series Stock Selector Large Cap Value Fund | 7.8 |
| Fidelity Series Value Discovery Fund | 7.7 |
| Fidelity Advisor Series Equity Growth Fund | 7.1 |
| Fidelity Series Opportunistic Insights Fund | 6.6 |
| Fidelity Advisor Series Growth Opportunities Fund | 4.7 |
| Fidelity Series Small Cap Opportunities Fund | 4.2 |
| | 77.5 |
Asset Allocation (% of fund's net assets)
| Period end |
| | Domestic Equity Funds | 60.5% |
| | International Equity Funds | 30.8% |
| | Bond Funds | 6.8% |
| | Short-Term Funds | 1.9% |
| | Short-Term Investments | 0.1% |
| | Net Other Assets (Liabilities)* | (0.1)% |

* Net Other Assets (Liabilities) are not included in the pie chart
Domestic Equity Funds category includes Fidelity Series Commodity Strategy Fund which invests in commodity-related investments.
Fidelity Advisor Freedom® 2045 Fund
Schedule of Investments September 30, 2018 (Unaudited)
Showing Percentage of Net Assets
| U.S. Treasury Obligations - 0.1% | | | |
| | | Principal Amount | Value |
| U.S. Treasury Bills, yield at date of purchase 2.07% to 2.09% 11/23/18 to 11/29/18 (a) | | | |
| (Cost $906,938) | | 910,000 | 906,870 |
| | | Shares | Value |
|
| Domestic Equity Funds - 60.5% | | | |
| Fidelity Advisor Series Equity Growth Fund (b) | | 6,508,750 | $100,625,282 |
| Fidelity Advisor Series Growth Opportunities Fund (b) | | 4,074,026 | 67,791,796 |
| Fidelity Advisor Series Small Cap Fund (b) | | 3,671,361 | 46,149,002 |
| Fidelity Series All-Sector Equity Fund (b) | | 3,691,793 | 50,245,301 |
| Fidelity Series Commodity Strategy Fund (b) | | 6,003,511 | 30,017,553 |
| Fidelity Series Large Cap Stock Fund (b) | | 10,978,430 | 174,886,391 |
| Fidelity Series Large Cap Value Index Fund (b) | | 1,368,359 | 18,062,344 |
| Fidelity Series Opportunistic Insights Fund (b) | | 4,711,968 | 93,532,569 |
| Fidelity Series Small Cap Opportunities Fund (b) | | 4,045,428 | 59,427,335 |
| Fidelity Series Stock Selector Large Cap Value Fund (b) | | 8,458,016 | 111,814,966 |
| Fidelity Series Value Discovery Fund (b) | | 8,044,132 | 110,124,168 |
| TOTAL DOMESTIC EQUITY FUNDS | | | |
| (Cost $687,201,053) | | | 862,676,707 |
|
| International Equity Funds - 30.8% | | | |
| Fidelity Series Canada Fund (b) | | 1,182,901 | 12,787,161 |
| Fidelity Series Emerging Markets Fund (b) | | 912,624 | 8,843,324 |
| Fidelity Series Emerging Markets Opportunities Fund (b) | | 6,391,479 | 122,652,479 |
| Fidelity Series International Growth Fund (b) | | 8,059,877 | 132,181,990 |
| Fidelity Series International Small Cap Fund (b) | | 1,738,915 | 31,126,585 |
| Fidelity Series International Value Fund (b) | | 12,484,627 | 131,338,271 |
| TOTAL INTERNATIONAL EQUITY FUNDS | | | |
| (Cost $357,217,826) | | | 438,929,810 |
|
| Bond Funds - 6.8% | | | |
| Fidelity Series Emerging Markets Debt Fund (b) | | 907,496 | 8,648,436 |
| Fidelity Series Floating Rate High Income Fund (b) | | 323,474 | 3,079,471 |
| Fidelity Series High Income Fund (b) | | 1,923,544 | 18,485,263 |
| Fidelity Series Inflation-Protected Bond Index Fund (b) | | 443,117 | 4,302,663 |
| Fidelity Series International Credit Fund (b) | | 65,291 | 641,811 |
| Fidelity Series Investment Grade Bond Fund (b) | | 581,526 | 6,332,823 |
| Fidelity Series Long-Term Treasury Bond Index Fund (b) | | 6,019,876 | 49,603,774 |
| Fidelity Series Real Estate Income Fund (b) | | 569,895 | 6,143,467 |
| TOTAL BOND FUNDS | | | |
| (Cost $99,788,212) | | | 97,237,708 |
|
| Short-Term Funds - 1.9% | | | |
| Fidelity Cash Central Fund, 2.11% (c) | | 3,274,206 | 3,274,861 |
| Fidelity Series Government Money Market Fund 2.12% (b)(d) | | 19,881,121 | 19,881,121 |
| Fidelity Series Short-Term Credit Fund (b) | | 438,291 | 4,321,544 |
| TOTAL SHORT-TERM FUNDS | | | |
| (Cost $27,514,339) | | | 27,477,526 |
| TOTAL INVESTMENT IN SECURITIES - 100.1% | | | |
| (Cost $1,172,628,368) | | | 1,427,228,621 |
| NET OTHER ASSETS (LIABILITIES) - (0.1)% | | | (1,154,239) |
| NET ASSETS - 100% | | | $1,426,074,382 |
| Futures Contracts | | | | | |
| | Number of contracts | Expiration Date | Notional Amount | Value | Unrealized Appreciation/(Depreciation) |
| Purchased | | | | | |
| Equity Index Contracts | | | | | |
| CME E-mini S&P 500 Index Contracts (United States) | 56 | Dec. 2018 | $8,173,200 | $1,585 | $1,585 |
| ICE E-mini MSCI Emerging Markets Index Contracts (United States) | 68 | Dec. 2018 | 3,568,980 | 72,066 | 72,067 |
| | | | | | 73,652 |
| Sold | | | | | |
| Equity Index Contracts | | | | | |
| ICE E-mini MSCI EAFE Index Contracts (United States) | 33 | Dec. 2018 | 3,259,575 | (8,296) | (8,296) |
| TOTAL FUTURES CONTRACTS | | | | | $65,356 |
The notional amount of futures purchased as a percentage of Net Assets is 0.8%
The notional amount of futures sold as a percentage of Net Assets is 0.2%
Legend
(a) Security or a portion of the security was pledged to cover margin requirements for futures contracts. At period end, the value of securities pledged amounted to $363,743.
(b) Affiliated Fund
(c) Affiliated fund that is generally available only to investment companies and other accounts managed by Fidelity Investments. The rate quoted is the annualized seven-day yield of the fund at period end. A complete unaudited listing of the fund's holdings as of its most recent quarter end is available upon request. In addition, each Fidelity Central Fund's financial statements are available on the SEC's website or upon request.
(d) The rate quoted is the annualized seven-day yield of the fund at period end.
Affiliated Central Funds
Information regarding fiscal year to date income earned by the Fund from investments in Fidelity Central Funds is as follows:
| Fund | Income earned |
| Fidelity Cash Central Fund | $8,471 |
| Total | $8,471 |
Amounts in the income column in the above table include any capital gain distributions from underlying funds, which are presented in the corresponding line-item in the Statement of Operations if applicable.
Affiliated Underlying Funds
Fiscal year to date information regarding the Fund's investments in affiliated Underlying Funds, excluding any Money Market Central Funds, is presented below. Exchanges between classes of the same affiliated Underlying Funds may occur.
| Affiliate | Value, beginning of period | Purchases | Sales Proceeds | Dividend Income | Realized Gain (loss) | Change in Unrealized appreciation (depreciation) | Value, end of period |
| Fidelity Advisor Series Equity Growth Fund | $87,585,095 | $4,097,740 | $3,771,237 | $-- | $71,867 | $12,641,817 | $100,625,282 |
| Fidelity Advisor Series Equity Value Fund | 101,062,304 | 10,772,182 | 4,243,501 | 3,549,420 | (13,968) | (11,254,877) | -- |
| Fidelity Advisor Series Growth & Income Fund | 154,913,386 | 23,199,677 | 6,588,966 | 14,317,406 | 71,885 | (21,854,702) | -- |
| Fidelity Advisor Series Growth Opportunities Fund | 57,467,634 | 2,409,665 | 7,046,137 | -- | 944,697 | 14,015,937 | 67,791,796 |
| Fidelity Advisor Series Opportunistic Insights Fund | 81,384,078 | 10,890,542 | 3,463,613 | 6,811,697 | 50,151 | (27,571,504) | -- |
| Fidelity Advisor Series Small Cap Fund | 43,759,112 | 1,790,518 | 1,925,176 | -- | 24,337 | 2,500,211 | 46,149,002 |
| Fidelity Advisor Series Stock Selector Large Cap Value Fund | 102,033,097 | 15,983,029 | 4,260,772 | 8,994,303 | (37,896) | (11,088,764) | -- |
| Fidelity Series 100 Index Fund | 43,308,860 | -- | 46,620,020 | -- | 20,937,928 | (17,626,768) | -- |
| Fidelity Series All-Sector Equity Fund | 60,085,583 | 2,386,488 | 19,142,545 | -- | 1,370,501 | 5,545,274 | 50,245,301 |
| Fidelity Series Canada Fund | 11,904,189 | 652,968 | 511,312 | -- | 6,028 | 735,288 | 12,787,161 |
| Fidelity Series Commodity Strategy Fund | 28,249,093 | 5,387,177 | 1,184,249 | 1,794,332 | (14,615) | (2,419,853) | 30,017,553 |
| Fidelity Series Emerging Markets Debt Fund | 8,907,300 | 580,337 | 349,548 | 262,993 | (12,035) | (477,618) | 8,648,436 |
| Fidelity Series Emerging Markets Fund | -- | 8,853,279 | -- | -- | -- | (9,955) | 8,843,324 |
| Fidelity Series Emerging Markets Opportunities Fund | 123,530,365 | 26,811,607 | 11,946,239 | -- | 668 | (15,743,922) | 122,652,479 |
| Fidelity Series Floating Rate High Income Fund | 3,008,295 | 213,514 | 145,615 | 81,347 | (156) | 3,433 | 3,079,471 |
| Fidelity Series Government Money Market Fund 2.12% | 21,893,886 | 18,776,169 | 20,788,934 | 178,623 | -- | -- | 19,881,121 |
| Fidelity Series High Income Fund | 18,707,935 | 1,225,224 | 1,600,870 | 537,818 | (28,498) | 181,472 | 18,485,263 |
| Fidelity Series Inflation-Protected Bond Index Fund | 10,812,378 | 1,525,400 | 8,084,321 | 16,213 | (97,547) | 146,753 | 4,302,663 |
| Fidelity Series International Credit Fund | 640,362 | 7,891 | -- | 7,892 | -- | (6,442) | 641,811 |
| Fidelity Series International Growth Fund | 119,909,466 | 15,483,652 | 5,119,452 | -- | 10,204 | 1,898,120 | 132,181,990 |
| Fidelity Series International Small Cap Fund | 29,918,661 | 3,690,753 | 1,302,876 | -- | (10,086) | (1,169,867) | 31,126,585 |
| Fidelity Series International Value Fund | 121,339,335 | 15,374,305 | 5,107,705 | -- | (112,290) | (155,374) | 131,338,271 |
| Fidelity Series Investment Grade Bond Fund | 6,440,580 | 655,670 | 688,904 | 89,174 | (9,532) | (64,991) | 6,332,823 |
| Fidelity Series Large Cap Stock Fund | -- | 205,681 | 100,843 | -- | (496) | 25,040,769 | 174,886,391 |
| Fidelity Series Large Cap Value Index Fund | 16,906,145 | 711,093 | 754,528 | -- | 892 | 1,198,742 | 18,062,344 |
| Fidelity Series Long-Term Treasury Bond Index Fund | 30,339,836 | 32,511,347 | 11,615,972 | 624,178 | (356,464) | (1,274,973) | 49,603,774 |
| Fidelity Series Opportunistic Insights Fund | -- | 110,891 | 54,001 | -- | (3,741) | 32,189,766 | 93,532,569 |
| Fidelity Series Real Estate Equity Fund | 10,477,062 | 88,288 | 10,987,257 | 55,604 | 580,263 | (158,356) | -- |
| Fidelity Series Real Estate Income Fund | 5,876,043 | 506,044 | 273,754 | 257,563 | (2,041) | 37,175 | 6,143,467 |
| Fidelity Series Short-Term Credit Fund | 3,944,220 | 580,861 | 203,667 | 45,618 | (483) | 613 | 4,321,544 |
| Fidelity Series Small Cap Opportunities Fund | 53,422,944 | 6,792,908 | 2,375,810 | 4,584,423 | 59,971 | 1,527,322 | 59,427,335 |
| Fidelity Series Stock Selector Large Cap Value Fund | -- | 232,057 | 91,242 | -- | (4,923) | 9,050,380 | 111,814,966 |
| Fidelity Series Value Discovery Fund | -- | 132,205 | 64,765 | -- | (1,149) | 13,735,737 | 110,124,168 |
| | $1,357,827,244 | $212,639,162 | $180,413,831 | $42,208,604 | $23,423,472 | $9,570,843 | $1,423,046,890 |
Amounts in the income column in the above table include any capital gain distributions from underlying funds, which are presented in the corresponding line-item in the Statement of Operations if applicable.
Investment Valuation
The following is a summary of the inputs used, as of September 30, 2018, involving the Fund's assets and liabilities carried at fair value. The inputs or methodology used for valuing securities may not be an indication of the risk associated with investing in those securities. For more information on valuation inputs, and their aggregation into the levels used below, please refer to the Investment Valuation section in the accompanying Notes to Financial Statements.
| | Valuation Inputs at Reporting Date: |
| Description | Total | Level 1 | Level 2 | Level 3 |
| Investments in Securities: | | | | |
| Other Short-Term Investments | $906,870 | $-- | $906,870 | $-- |
| Domestic Equity Funds | 862,676,707 | 862,676,707 | -- | -- |
| International Equity Funds | 438,929,810 | 438,929,810 | -- | -- |
| Bond Funds | 97,237,708 | 97,237,708 | -- | -- |
| Short-Term Funds | 27,477,526 | 27,477,526 | -- | -- |
| Total Investments in Securities: | $1,427,228,621 | $1,426,321,751 | $906,870 | $-- |
| Derivative Instruments: | | | | |
| Assets | | | | |
| Futures Contracts | $73,652 | $73,652 | $-- | $-- |
| Total Assets | $73,652 | $73,652 | $-- | $-- |
| Liabilities | | | | |
| Futures Contracts | $(8,296) | $(8,296) | $-- | $-- |
| Total Liabilities | $(8,296) | $(8,296) | $-- | $-- |
| Total Derivative Instruments: | $65,356 | $65,356 | $-- | $-- |
Value of Derivative Instruments
The following table is a summary of the Fund's value of derivative instruments by primary risk exposure as of September 30, 2018. For additional information on derivative instruments, please refer to the Derivative Instruments section in the accompanying Notes to Financial Statements.
| Primary Risk Exposure / Derivative Type | Value |
| | Asset | Liability |
| Equity Risk | | |
| Futures Contracts(a) | $73,652 | $(8,296) |
| Total Equity Risk | 73,652 | (8,296) |
| Total Value of Derivatives | $73,652 | $(8,296) |
(a) Reflects gross cumulative appreciation (depreciation) on futures contracts as presented in the Schedule of Investments. In the Statement of Assets and Liabilities, the period end daily variation margin is included in receivable or payable for daily variation margin on futures contracts, and the net cumulative appreciation (depreciation) is included in net unrealized appreciation (depreciation).
See accompanying notes which are an integral part of the financial statements.
Fidelity Advisor Freedom® 2045 Fund
Financial Statements
Statement of Assets and Liabilities
| | | September 30, 2018 (Unaudited) |
| Assets | | |
Investment in securities, at value — See accompanying schedule:
Unaffiliated issuers (cost $906,938) | $906,870 | |
| Fidelity Central Funds (cost $3,274,861) | 3,274,861 | |
| Other affiliated issuers (cost $1,168,446,569) | 1,423,046,890 | |
| Total Investment in Securities (cost $1,172,628,368) | | $1,427,228,621 |
| Cash | | 988 |
| Receivable for investments sold | | 16,611,346 |
| Receivable for fund shares sold | | 2,035,006 |
| Distributions receivable from Fidelity Central Funds | | 4,930 |
| Total assets | | 1,445,880,891 |
| Liabilities | | |
| Payable for investments purchased | $16,906,646 | |
| Payable for fund shares redeemed | 1,735,551 | |
| Accrued management fee | 875,939 | |
| Distribution and service plan fees payable | 234,732 | |
| Payable for daily variation margin on futures contracts | 53,641 | |
| Total liabilities | | 19,806,509 |
| Net Assets | | $1,426,074,382 |
| Net Assets consist of: | | |
| Paid in capital | | $1,117,738,127 |
| Undistributed net investment income | | 3,529,113 |
| Accumulated undistributed net realized gain (loss) on investments | | 50,141,533 |
| Net unrealized appreciation (depreciation) on investments | | 254,665,609 |
| Net Assets | | $1,426,074,382 |
| Calculation of Maximum Offering Price | | |
| Class A: | | |
| Net Asset Value and redemption price per share ($570,258,333 ÷ 46,347,081 shares) | | $12.30 |
| Maximum offering price per share (100/94.25 of $12.30) | | $13.05 |
| Class M: | | |
| Net Asset Value and redemption price per share ($217,117,388 ÷ 17,808,017 shares) | | $12.19 |
| Maximum offering price per share (100/96.50 of $12.19) | | $12.63 |
| Class C: | | |
| Net Asset Value and offering price per share ($32,196,061 ÷ 2,680,361 shares)(a) | | $12.01 |
| Class I: | | |
| Net Asset Value, offering price and redemption price per share ($584,234,593 ÷ 47,123,864 shares) | | $12.40 |
| Class Z6: | | |
| Net Asset Value, offering price and redemption price per share ($22,268,007 ÷ 1,794,914 shares) | | $12.41 |
(a) Redemption price per share is equal to net asset value less any applicable contingent deferred sales charge.
See accompanying notes which are an integral part of the financial statements.
Statement of Operations
| | | Six months ended September 30, 2018 (Unaudited) |
| Investment Income | | |
| Dividends: | | |
| Affiliated issuers | | $10,874,315 |
| Interest | | 6,025 |
| Income from Fidelity Central Funds | | 8,471 |
| Total income | | 10,888,811 |
| Expenses | | |
| Management fee | $5,195,656 | |
| Distribution and service plan fees | 1,399,519 | |
| Independent trustees' fees and expenses | 3,366 | |
| Total expenses | | 6,598,541 |
| Net investment income (loss) | | 4,290,270 |
| Realized and Unrealized Gain (Loss) | | |
| Net realized gain (loss) on: | | |
| Investment securities: | | |
| Fidelity Central Funds | 1 | |
| Other affiliated issuers | 23,423,472 | |
| Futures contracts | (547,794) | |
| Capital gain distributions from underlying funds: | | |
| Affiliated issuers | 31,334,289 | |
| Total net realized gain (loss) | | 54,209,968 |
| Change in net unrealized appreciation (depreciation) on: | | |
| Investment securities: | | |
| Unaffiliated issuers | (68) | |
| Affiliated issuers | 9,570,843 | |
| Futures contracts | 65,356 | |
| Total change in net unrealized appreciation (depreciation) | | 9,636,131 |
| Net gain (loss) | | 63,846,099 |
| Net increase (decrease) in net assets resulting from operations | | $68,136,369 |
See accompanying notes which are an integral part of the financial statements.
Statement of Changes in Net Assets
| | Six months ended September 30, 2018 (Unaudited) | Year ended March 31, 2018 |
| Increase (Decrease) in Net Assets | | |
| Operations | | |
| Net investment income (loss) | $4,290,270 | $10,671,463 |
| Net realized gain (loss) | 54,209,968 | 86,422,686 |
| Change in net unrealized appreciation (depreciation) | 9,636,131 | 61,790,750 |
| Net increase (decrease) in net assets resulting from operations | 68,136,369 | 158,884,899 |
| Distributions to shareholders from net investment income | – | (12,899,292) |
| Distributions to shareholders from net realized gain | (55,973,793) | (46,138,745) |
| Total distributions | (55,973,793) | (59,038,037) |
| Share transactions - net increase (decrease) | 57,166,729 | 66,150,547 |
| Total increase (decrease) in net assets | 69,329,305 | 165,997,409 |
| Net Assets | | |
| Beginning of period | 1,356,745,077 | 1,190,747,668 |
| End of period | $1,426,074,382 | $1,356,745,077 |
| Other Information | | |
| Undistributed net investment income end of period | $3,529,113 | $– |
| Distributions in excess of net investment income end of period | $– | $(761,157) |
See accompanying notes which are an integral part of the financial statements.
Financial Highlights
Fidelity Advisor Freedom 2045 Fund Class A
| | Six months ended (Unaudited) September 30, | Years endedMarch 31, | | | | |
| | 2018 | 2018 | 2017 | 2016 | 2015 | 2014 |
| Selected Per–Share Data | | | | | | |
| Net asset value, beginning of period | $12.21 | $11.26 | $10.23 | $11.15 | $11.31 | $10.46 |
| Income from Investment Operations | | | | | | |
| Net investment income (loss)A | .03 | .10 | .13 | .13 | .15 | .12 |
| Net realized and unrealized gain (loss) | .56 | 1.40 | 1.39 | (.54) | .59 | 1.39 |
| Total from investment operations | .59 | 1.50 | 1.52 | (.41) | .74 | 1.51 |
| Distributions from net investment income | – | (.12) | (.13) | (.14) | (.16) | (.12) |
| Distributions from net realized gain | (.50) | (.43) | (.36) | (.37) | (.74) | (.54) |
| Total distributions | (.50) | (.55) | (.49) | (.51) | (.90) | (.66) |
| Net asset value, end of period | $12.30 | $12.21 | $11.26 | $10.23 | $11.15 | $11.31 |
| Total ReturnB,C,D | 4.93% | 13.44% | 15.50% | (3.85)% | 6.80% | 14.74% |
| Ratios to Average Net AssetsE,F | | | | | | |
| Expenses before reductions | 1.00%G | .87% | .25% | .25% | .25% | .25% |
| Expenses net of fee waivers, if any | 1.00%G | .87% | .25% | .25% | .25% | .25% |
| Expenses net of all reductions | 1.00%G | .87% | .25% | .25% | .25% | .25% |
| Net investment income (loss) | .56%G | .79% | 1.22% | 1.27% | 1.37% | 1.12% |
| Supplemental Data | | | | | | |
| Net assets, end of period (000 omitted) | $570,258 | $566,474 | $556,090 | $531,510 | $623,734 | $612,735 |
| Portfolio turnover rateF | 26%G | 21% | 22% | 26% | 27% | 46% |
A Calculated based on average shares outstanding during the period.
B Total returns for periods of less than one year are not annualized.
C Total returns would have been lower if certain expenses had not been reduced during the applicable periods shown.
D Total returns do not include the effect of the sales charges.
E Expense ratios reflect operating expenses of the class. Expenses before reductions do not reflect amounts reimbursed by the investment adviser or reductions from expense offset arrangements and do not represent the amount paid by the class during periods when reimbursements or reductions occur. Expenses net of fee waivers reflect expenses after reimbursement by the investment adviser but prior to reductions from expense offset arrangements. Expenses net of all reductions represent the net expenses paid by the class but do not include expenses of the underlying funds in which the Fund invests.
F Amounts do not include the activity of the Underlying Funds.
G Annualized
See accompanying notes which are an integral part of the financial statements.
Fidelity Advisor Freedom 2045 Fund Class M
| | Six months ended (Unaudited) September 30, | Years endedMarch 31, | | | | |
| | 2018 | 2018 | 2017 | 2016 | 2015 | 2014 |
| Selected Per–Share Data | | | | | | |
| Net asset value, beginning of period | $12.12 | $11.19 | $10.17 | $11.09 | $11.26 | $10.42 |
| Income from Investment Operations | | | | | | |
| Net investment income (loss)A | .02 | .06 | .10 | .11 | .13 | .09 |
| Net realized and unrealized gain (loss) | .55 | 1.39 | 1.39 | (.54) | .57 | 1.39 |
| Total from investment operations | .57 | 1.45 | 1.49 | (.43) | .70 | 1.48 |
| Distributions from net investment income | – | (.10) | (.11) | (.12) | (.13) | (.10) |
| Distributions from net realized gain | (.50) | (.43) | (.36) | (.37) | (.74) | (.54) |
| Total distributions | (.50) | (.52)B | (.47) | (.49) | (.87) | (.64) |
| Net asset value, end of period | $12.19 | $12.12 | $11.19 | $10.17 | $11.09 | $11.26 |
| Total ReturnC,D,E | 4.80% | 13.12% | 15.29% | (4.10)% | 6.50% | 14.45% |
| Ratios to Average Net AssetsF,G | | | | | | |
| Expenses before reductions | 1.25%H | 1.13% | .50% | .50% | .50% | .50% |
| Expenses net of fee waivers, if any | 1.25%H | 1.13% | .50% | .50% | .50% | .50% |
| Expenses net of all reductions | 1.25%H | 1.13% | .50% | .50% | .50% | .50% |
| Net investment income (loss) | .31%H | .54% | .97% | 1.02% | 1.12% | .87% |
| Supplemental Data | | | | | | |
| Net assets, end of period (000 omitted) | $217,117 | $207,442 | $186,200 | $158,557 | $153,677 | $128,619 |
| Portfolio turnover rateG | 26%H | 21% | 22% | 26% | 27% | 46% |
A Calculated based on average shares outstanding during the period.
B Total distributions of $.52 per share is comprised of distributions from net investment income of $.096 and distributions from net realized gain of $.428 per share.
C Total returns for periods of less than one year are not annualized.
D Total returns would have been lower if certain expenses had not been reduced during the applicable periods shown.
E Total returns do not include the effect of the sales charges.
F Expense ratios reflect operating expenses of the class. Expenses before reductions do not reflect amounts reimbursed by the investment adviser or reductions from expense offset arrangements and do not represent the amount paid by the class during periods when reimbursements or reductions occur. Expenses net of fee waivers reflect expenses after reimbursement by the investment adviser but prior to reductions from expense offset arrangements. Expenses net of all reductions represent the net expenses paid by the class but do not include expenses of the underlying funds in which the Fund invests.
G Amounts do not include the activity of the Underlying Funds.
H Annualized
See accompanying notes which are an integral part of the financial statements.
Fidelity Advisor Freedom 2045 Fund Class C
| | Six months ended (Unaudited) September 30, | Years endedMarch 31, | | | | |
| | 2018 | 2018 | 2017 | 2016 | 2015 | 2014 |
| Selected Per–Share Data | | | | | | |
| Net asset value, beginning of period | $11.98 | $11.08 | $10.09 | $11.01 | $11.19 | $10.36 |
| Income from Investment Operations | | | | | | |
| Net investment income (loss)A | (.01) | –B | .05 | .05 | .07 | .04 |
| Net realized and unrealized gain (loss) | .54 | 1.38 | 1.38 | (.53) | .57 | 1.38 |
| Total from investment operations | .53 | 1.38 | 1.43 | (.48) | .64 | 1.42 |
| Distributions from net investment income | – | (.05) | (.08) | (.08) | (.09) | (.06) |
| Distributions from net realized gain | (.50) | (.43) | (.36) | (.36) | (.73) | (.53) |
| Total distributions | (.50) | (.48) | (.44) | (.44) | (.82) | (.59) |
| Net asset value, end of period | $12.01 | $11.98 | $11.08 | $10.09 | $11.01 | $11.19 |
| Total ReturnC,D,E | 4.51% | 12.59% | 14.71% | (4.59)% | 5.95% | 13.95% |
| Ratios to Average Net AssetsF,G | | | | | | |
| Expenses before reductions | 1.75%H | 1.63% | 1.00% | 1.00% | 1.00% | 1.00% |
| Expenses net of fee waivers, if any | 1.75%H | 1.63% | 1.00% | 1.00% | 1.00% | 1.00% |
| Expenses net of all reductions | 1.75%H | 1.63% | 1.00% | 1.00% | 1.00% | 1.00% |
| Net investment income (loss) | (.19)%H | .04% | .47% | .53% | .62% | .37% |
| Supplemental Data | | | | | | |
| Net assets, end of period (000 omitted) | $32,196 | $30,549 | $27,491 | $23,423 | $22,493 | $18,457 |
| Portfolio turnover rateG | 26%H | 21% | 22% | 26% | 27% | 46% |
A Calculated based on average shares outstanding during the period.
B Amount represents less than $.005 per share.
C Total returns for periods of less than one year are not annualized.
D Total returns would have been lower if certain expenses had not been reduced during the applicable periods shown.
E Total returns do not include the effect of the contingent deferred sales charge.
F Expense ratios reflect operating expenses of the class. Expenses before reductions do not reflect amounts reimbursed by the investment adviser or reductions from expense offset arrangements and do not represent the amount paid by the class during periods when reimbursements or reductions occur. Expenses net of fee waivers reflect expenses after reimbursement by the investment adviser but prior to reductions from expense offset arrangements. Expenses net of all reductions represent the net expenses paid by the class but do not include expenses of the underlying funds in which the Fund invests.
G Amounts do not include the activity of the Underlying Funds.
H Annualized
See accompanying notes which are an integral part of the financial statements.
Fidelity Advisor Freedom 2045 Fund Class I
| �� | Six months ended (Unaudited) September 30, | Years endedMarch 31, | | | | |
| | 2018 | 2018 | 2017 | 2016 | 2015 | 2014 |
| Selected Per–Share Data | | | | | | |
| Net asset value, beginning of period | $12.29 | $11.33 | $10.28 | $11.21 | $11.37 | $10.50 |
| Income from Investment Operations | | | | | | |
| Net investment income (loss)A | .05 | .12 | .16 | .16 | .18 | .15 |
| Net realized and unrealized gain (loss) | .56 | 1.42 | 1.40 | (.55) | .59 | 1.41 |
| Total from investment operations | .61 | 1.54 | 1.56 | (.39) | .77 | 1.56 |
| Distributions from net investment income | – | (.14) | (.15) | (.17) | (.19) | (.15) |
| Distributions from net realized gain | (.50) | (.44) | (.36) | (.37) | (.74) | (.54) |
| Total distributions | (.50) | (.58) | (.51) | (.54) | (.93) | (.69) |
| Net asset value, end of period | $12.40 | $12.29 | $11.33 | $10.28 | $11.21 | $11.37 |
| Total ReturnB,C | 5.07% | 13.77% | 15.83% | (3.66)% | 7.03% | 15.14% |
| Ratios to Average Net AssetsD,E | | | | | | |
| Expenses before reductions | .75%F | .64% | - %G | - %G | - %G | - %G |
| Expenses net of fee waivers, if any | .75%F | .64% | -% | -% | -% | -% |
| Expenses net of all reductions | .75%F | .64% | -% | -% | -% | -% |
| Net investment income (loss) | .81%F | 1.03% | 1.47% | 1.52% | 1.62% | 1.37% |
| Supplemental Data | | | | | | |
| Net assets, end of period (000 omitted) | $584,235 | $543,170 | $420,967 | $390,675 | $400,667 | $378,776 |
| Portfolio turnover rateE | 26%F | 21% | 22% | 26% | 27% | 46% |
A Calculated based on average shares outstanding during the period.
B Total returns for periods of less than one year are not annualized.
C Total returns would have been lower if certain expenses had not been reduced during the applicable periods shown.
D Expense ratios reflect operating expenses of the class. Expenses before reductions do not reflect amounts reimbursed by the investment adviser or reductions from expense offset arrangements and do not represent the amount paid by the class during periods when reimbursements or reductions occur. Expenses net of fee waivers reflect expenses after reimbursement by the investment adviser but prior to reductions from expense offset arrangements. Expenses net of all reductions represent the net expenses paid by the class but do not include expenses of the underlying funds in which the Fund invests.
E Amounts do not include the activity of the Underlying Funds.
F Annualized
G Amount represents less than .005%.
See accompanying notes which are an integral part of the financial statements.
Fidelity Advisor Freedom 2045 Fund Class Z6
| | Six months ended (Unaudited) September 30, | Years endedMarch 31, |
| | 2018 | 2018 A |
| Selected Per–Share Data | | |
| Net asset value, beginning of period | $12.28 | $11.65 |
| Income from Investment Operations | | |
| Net investment income (loss)B | .06 | .15 |
| Net realized and unrealized gain (loss) | .57 | .92 |
| Total from investment operations | .63 | 1.07 |
| Distributions from net investment income | – | (.18) |
| Distributions from net realized gain | (.50) | (.26) |
| Total distributions | (.50) | (.44) |
| Net asset value, end of period | $12.41 | $12.28 |
| Total ReturnC,D | 5.24% | 9.15% |
| Ratios to Average Net AssetsE,F | | |
| Expenses before reductions | .49%G | .51%G,H |
| Expenses net of fee waivers, if any | .49%G | .51%G,H |
| Expenses net of all reductions | .49%G | .51%G,H |
| Net investment income (loss) | 1.06%G | 1.50%G |
| Supplemental Data | | |
| Net assets, end of period (000 omitted) | $22,268 | $9,112 |
| Portfolio turnover rateF | 26%G | 21% |
A For the period June 6, 2017 (commencement of sale of shares) to March 31, 2018.
B Calculated based on average shares outstanding during the period.
C Total returns for periods of less than one year are not annualized.
D Total returns would have been lower if certain expenses had not been reduced during the applicable periods shown.
E Expense ratios reflect operating expenses of the class. Expenses before reductions do not reflect amounts reimbursed by the investment adviser or reductions from expense offset arrangements and do not represent the amount paid by the class during periods when reimbursements or reductions occur. Expenses net of fee waivers reflect expenses after reimbursement by the investment adviser but prior to reductions from expense offset arrangements. Expenses net of all reductions represent the net expenses paid by the class but do not include expenses of the underlying funds in which the Fund invests.
F Amounts do not include the activity of the Underlying Funds.
G Annualized
H On certain classes, the size and fluctuation of net assets and expense amounts may cause ratios to differ from contractual rates.
See accompanying notes which are an integral part of the financial statements.
Fidelity Advisor Freedom® 2050 Fund
Investment Summary (Unaudited)
The information in the following tables is based on the direct investments of the Fund.
Top Holdings as of September 30, 2018
| | % of fund's net assets |
| Fidelity Series Large Cap Stock Fund | 12.3 |
| Fidelity Series International Growth Fund | 9.3 |
| Fidelity Series International Value Fund | 9.2 |
| Fidelity Series Emerging Markets Opportunities Fund | 8.6 |
| Fidelity Series Stock Selector Large Cap Value Fund | 7.8 |
| Fidelity Series Value Discovery Fund | 7.7 |
| Fidelity Advisor Series Equity Growth Fund | 7.1 |
| Fidelity Series Opportunistic Insights Fund | 6.6 |
| Fidelity Advisor Series Growth Opportunities Fund | 4.7 |
| Fidelity Series Small Cap Opportunities Fund | 4.2 |
| | 77.5 |
Asset Allocation (% of fund's net assets)
| Period end |
| | Domestic Equity Funds | 60.5% |
| | International Equity Funds | 30.8% |
| | Bond Funds | 6.8% |
| | Short-Term Funds | 1.9% |
| | Short-Term Investments | 0.1% |
| | Net Other Assets (Liabilities)* | (0.1)% |

* Net Other Assets (Liabilities) are not included in the pie chart
Domestic Equity Funds category includes Fidelity Series Commodity Strategy Fund which invests in commodity-related investments.
Fidelity Advisor Freedom® 2050 Fund
Schedule of Investments September 30, 2018 (Unaudited)
Showing Percentage of Net Assets
| U.S. Treasury Obligations - 0.1% | | | |
| | | Principal Amount | Value |
| U.S. Treasury Bills, yield at date of purchase 2.07% to 2.09% 11/23/18 to 11/29/18 (a) | | | |
| (Cost $727,547) | | 730,000 | 727,491 |
| | | Shares | Value |
|
| Domestic Equity Funds - 60.5% | | | |
| Fidelity Advisor Series Equity Growth Fund (b) | | 5,289,533 | $81,776,182 |
| Fidelity Advisor Series Growth Opportunities Fund (b) | | 3,310,972 | 55,094,573 |
| Fidelity Advisor Series Small Cap Fund (b) | | 2,984,443 | 37,514,451 |
| Fidelity Series All-Sector Equity Fund (b) | | 2,998,758 | 40,813,090 |
| Fidelity Series Commodity Strategy Fund (b) | | 4,880,788 | 24,403,940 |
| Fidelity Series Large Cap Stock Fund (b) | | 8,921,878 | 142,125,510 |
| Fidelity Series Large Cap Value Index Fund (b) | | 1,112,453 | 14,684,377 |
| Fidelity Series Opportunistic Insights Fund (b) | | 3,829,348 | 76,012,567 |
| Fidelity Series Small Cap Opportunities Fund (b) | | 3,287,681 | 48,296,040 |
| Fidelity Series Stock Selector Large Cap Value Fund (b) | | 6,873,786 | 90,871,445 |
| Fidelity Series Value Discovery Fund (b) | | 6,537,530 | 89,498,785 |
| TOTAL DOMESTIC EQUITY FUNDS | | | |
| (Cost $562,804,299) | | | 701,090,960 |
|
| International Equity Funds - 30.8% | | | |
| Fidelity Series Canada Fund (b) | | 961,283 | 10,391,470 |
| Fidelity Series Emerging Markets Fund (b) | | 743,432 | 7,203,859 |
| Fidelity Series Emerging Markets Opportunities Fund (b) | | 5,194,080 | 99,674,389 |
| Fidelity Series International Growth Fund (b) | | 6,550,170 | 107,422,787 |
| Fidelity Series International Small Cap Fund (b) | | 1,413,588 | 25,303,220 |
| Fidelity Series International Value Fund (b) | | 10,146,147 | 106,737,471 |
| TOTAL INTERNATIONAL EQUITY FUNDS | | | |
| (Cost $292,574,631) | | | 356,733,196 |
|
| Bond Funds - 6.8% | | | |
| Fidelity Series Emerging Markets Debt Fund (b) | | 734,669 | 7,001,393 |
| Fidelity Series Floating Rate High Income Fund (b) | | 264,373 | 2,516,835 |
| Fidelity Series High Income Fund (b) | | 1,559,960 | 14,991,216 |
| Fidelity Series Inflation-Protected Bond Index Fund (b) | | 360,108 | 3,496,646 |
| Fidelity Series International Credit Fund (b) | | 51,312 | 504,395 |
| Fidelity Series Investment Grade Bond Fund (b) | | 472,603 | 5,146,642 |
| Fidelity Series Long-Term Treasury Bond Index Fund (b) | | 4,892,358 | 40,313,026 |
| Fidelity Series Real Estate Income Fund (b) | | 464,015 | 5,002,081 |
| TOTAL BOND FUNDS | | | |
| (Cost $81,264,483) | | | 78,972,234 |
|
| Short-Term Funds - 1.9% | | | |
| Fidelity Cash Central Fund, 2.11% (c) | | 2,629,194 | 2,629,720 |
| Fidelity Series Government Money Market Fund 2.12% (b)(d) | | 16,163,327 | 16,163,327 |
| Fidelity Series Short-Term Credit Fund (b) | | 357,394 | 3,523,909 |
| TOTAL SHORT-TERM FUNDS | | | |
| (Cost $22,346,101) | | | 22,316,956 |
| TOTAL INVESTMENT IN SECURITIES - 100.1% | | | |
| (Cost $959,717,061) | | | 1,159,840,837 |
| NET OTHER ASSETS (LIABILITIES) - (0.1)% | | | (934,072) |
| NET ASSETS - 100% | | | $1,158,906,765 |
| Futures Contracts | | | | | |
| | Number of contracts | Expiration Date | Notional Amount | Value | Unrealized Appreciation/(Depreciation) |
| Purchased | | | | | |
| Equity Index Contracts | | | | | |
| CME E-mini S&P 500 Index Contracts (United States) | 45 | Dec. 2018 | $6,567,750 | $1,274 | $1,274 |
| ICE E-mini MSCI Emerging Markets Index Contracts (United States) | 55 | Dec. 2018 | 2,886,675 | 58,311 | 58,311 |
| | | | | | 59,585 |
| Sold | | | | | |
| Equity Index Contracts | | | | | |
| ICE E-mini MSCI EAFE Index Contracts (United States) | 27 | Dec. 2018 | 2,666,925 | (6,089) | (6,089) |
| TOTAL FUTURES CONTRACTS | | | | | $53,496 |
The notional amount of futures purchased as a percentage of Net Assets is 0.8%
The notional amount of futures sold as a percentage of Net Assets is 0.2%
Legend
(a) Security or a portion of the security was pledged to cover margin requirements for futures contracts. At period end, the value of securities pledged amounted to $296,973.
(b) Affiliated Fund
(c) Affiliated fund that is generally available only to investment companies and other accounts managed by Fidelity Investments. The rate quoted is the annualized seven-day yield of the fund at period end. A complete unaudited listing of the fund's holdings as of its most recent quarter end is available upon request. In addition, each Fidelity Central Fund's financial statements are available on the SEC's website or upon request.
(d) The rate quoted is the annualized seven-day yield of the fund at period end.
Affiliated Central Funds
Information regarding fiscal year to date income earned by the Fund from investments in Fidelity Central Funds is as follows:
| Fund | Income earned |
| Fidelity Cash Central Fund | $6,739 |
| Total | $6,739 |
Amounts in the income column in the above table include any capital gain distributions from underlying funds, which are presented in the corresponding line-item in the Statement of Operations if applicable.
Affiliated Underlying Funds
Fiscal year to date information regarding the Fund's investments in affiliated Underlying Funds, excluding any Money Market Central Funds, is presented below. Exchanges between classes of the same affiliated Underlying Funds may occur.
| Affiliate | Value, beginning of period | Purchases | Sales Proceeds | Dividend Income | Realized Gain (loss) | Change in Unrealized appreciation (depreciation) | Value, end of period |
| Fidelity Advisor Series Equity Growth Fund | $70,351,965 | $4,450,685 | $3,292,165 | $-- | $52,411 | $10,213,286 | $81,776,182 |
| Fidelity Advisor Series Equity Value Fund | 81,184,995 | 9,855,105 | 3,708,775 | 2,879,441 | (35,683) | (8,589,666) | -- |
| Fidelity Advisor Series Growth & Income Fund | 124,458,830 | 20,534,452 | 5,760,026 | 11,601,729 | 44,166 | (16,838,229) | -- |
| Fidelity Advisor Series Growth Opportunities Fund | 46,159,904 | 2,760,227 | 5,910,475 | -- | 857,310 | 11,227,607 | 55,094,573 |
| Fidelity Advisor Series Opportunistic Insights Fund | 65,364,078 | 9,792,962 | 3,042,075 | 5,525,925 | 27,726 | (21,284,157) | -- |
| Fidelity Advisor Series Small Cap Fund | 35,146,093 | 2,051,377 | 1,716,777 | -- | 14,426 | 2,019,332 | 37,514,451 |
| Fidelity Advisor Series Stock Selector Large Cap Value Fund | 81,966,944 | 13,879,105 | 3,743,822 | 7,276,804 | (37,495) | (8,311,521) | -- |
| Fidelity Series 100 Index Fund | 34,748,219 | -- | 37,407,729 | -- | 16,279,802 | (13,620,292) | -- |
| Fidelity Series All-Sector Equity Fund | 48,267,467 | 2,717,986 | 15,759,364 | -- | 1,092,117 | 4,494,884 | 40,813,090 |
| Fidelity Series Canada Fund | 9,565,126 | 690,876 | 461,910 | -- | 2,751 | 594,627 | 10,391,470 |
| Fidelity Series Commodity Strategy Fund | 22,713,854 | 4,722,322 | 1,058,249 | 1,453,518 | (159,442) | (1,814,545) | 24,403,940 |
| Fidelity Series Emerging Markets Debt Fund | 7,129,561 | 575,050 | 310,227 | 211,756 | (11,924) | (381,067) | 7,001,393 |
| Fidelity Series Emerging Markets Fund | -- | 7,211,913 | -- | -- | -- | (8,054) | 7,203,859 |
| Fidelity Series Emerging Markets Opportunities Fund | 99,246,751 | 23,286,825 | 10,151,629 | -- | (197,829) | (12,509,729) | 99,674,389 |
| Fidelity Series Floating Rate High Income Fund | 2,426,049 | 217,337 | 129,251 | 66,063 | (941) | 3,641 | 2,516,835 |
| Fidelity Series Government Money Market Fund 2.12% | 17,563,064 | 15,459,704 | 16,859,441 | 144,239 | -- | -- | 16,163,327 |
| Fidelity Series High Income Fund | 14,946,932 | 1,220,044 | 1,299,159 | 433,148 | (10,922) | 134,321 | 14,991,216 |
| Fidelity Series Inflation-Protected Bond Index Fund | 8,708,325 | 1,326,280 | 6,577,531 | 13,139 | (82,396) | 121,968 | 3,496,646 |
| Fidelity Series International Credit Fund | 503,256 | 6,201 | -- | 6,202 | -- | (5,062) | 504,395 |
| Fidelity Series International Growth Fund | 96,317,039 | 14,186,811 | 4,618,877 | -- | 4,945 | 1,532,869 | 107,422,787 |
| Fidelity Series International Small Cap Fund | 24,031,703 | 3,406,054 | 1,180,174 | -- | (17,157) | (937,206) | 25,303,220 |
| Fidelity Series International Value Fund | 97,470,380 | 14,102,701 | 4,618,877 | -- | (113,007) | (103,726) | 106,737,471 |
| Fidelity Series Investment Grade Bond Fund | 5,182,457 | 610,454 | 586,304 | 72,160 | (8,433) | (51,532) | 5,146,642 |
| Fidelity Series Large Cap Stock Fund | -- | 352,315 | 55,085 | -- | 125 | 19,388,962 | 142,125,510 |
| Fidelity Series Large Cap Value Index Fund | 13,577,147 | 809,817 | 671,520 | -- | (339) | 969,272 | 14,684,377 |
| Fidelity Series Long-Term Treasury Bond Index Fund | 24,382,002 | 26,839,597 | 9,589,393 | 506,091 | (288,636) | (1,030,544) | 40,313,026 |
| Fidelity Series Opportunistic Insights Fund | -- | 190,726 | 29,496 | -- | (2,296) | 24,995,099 | 76,012,567 |
| Fidelity Series Real Estate Equity Fund | 8,433,757 | 71,694 | 8,845,995 | 45,364 | 399,314 | (58,770) | -- |
| Fidelity Series Real Estate Income Fund | 4,723,812 | 492,783 | 242,977 | 208,381 | (3,940) | 32,403 | 5,002,081 |
| Fidelity Series Short-Term Credit Fund | 3,186,925 | 513,834 | 176,978 | 37,176 | (925) | 1,053 | 3,523,909 |
| Fidelity Series Small Cap Opportunities Fund | 42,907,982 | 6,247,521 | 2,124,913 | 3,711,430 | 49,938 | 1,215,512 | 48,296,040 |
| Fidelity Series Stock Selector Large Cap Value Fund | -- | 501,328 | 38,854 | -- | (2,736) | 6,658,496 | 90,871,445 |
| Fidelity Series Value Discovery Fund | -- | 226,565 | 35,377 | -- | (734) | 10,602,355 | 89,498,785 |
| | $1,090,664,617 | $189,310,651 | $150,003,425 | $34,192,566 | $17,850,196 | $8,661,587 | $1,156,483,626 |
Amounts in the income column in the above table include any capital gain distributions from underlying funds, which are presented in the corresponding line-item in the Statement of Operations if applicable.
Investment Valuation
The following is a summary of the inputs used, as of September 30, 2018, involving the Fund's assets and liabilities carried at fair value. The inputs or methodology used for valuing securities may not be an indication of the risk associated with investing in those securities. For more information on valuation inputs, and their aggregation into the levels used below, please refer to the Investment Valuation section in the accompanying Notes to Financial Statements.
| | Valuation Inputs at Reporting Date: |
| Description | Total | Level 1 | Level 2 | Level 3 |
| Investments in Securities: | | | | |
| Other Short-Term Investments | $727,491 | $-- | $727,491 | $-- |
| Domestic Equity Funds | 701,090,960 | 701,090,960 | -- | -- |
| International Equity Funds | 356,733,196 | 356,733,196 | -- | -- |
| Bond Funds | 78,972,234 | 78,972,234 | -- | -- |
| Short-Term Funds | 22,316,956 | 22,316,956 | -- | -- |
| Total Investments in Securities: | $1,159,840,837 | $1,159,113,346 | $727,491 | $-- |
| Derivative Instruments: | | | | |
| Assets | | | | |
| Futures Contracts | $59,585 | $59,585 | $-- | $-- |
| Total Assets | $59,585 | $59,585 | $-- | $-- |
| Liabilities | | | | |
| Futures Contracts | $(6,089) | $(6,089) | $-- | $-- |
| Total Liabilities | $(6,089) | $(6,089) | $-- | $-- |
| Total Derivative Instruments: | $53,496 | $53,496 | $-- | $-- |
Value of Derivative Instruments
The following table is a summary of the Fund's value of derivative instruments by primary risk exposure as of September 30, 2018. For additional information on derivative instruments, please refer to the Derivative Instruments section in the accompanying Notes to Financial Statements.
| Primary Risk Exposure / Derivative Type | Value |
| | Asset | Liability |
| Equity Risk | | |
| Futures Contracts(a) | $59,585 | $(6,089) |
| Total Equity Risk | 59,585 | (6,089) |
| Total Value of Derivatives | $59,585 | $(6,089) |
(a) Reflects gross cumulative appreciation (depreciation) on futures contracts as presented in the Schedule of Investments. In the Statement of Assets and Liabilities, the period end daily variation margin is included in receivable or payable for daily variation margin on futures contracts, and the net cumulative appreciation (depreciation) is included in net unrealized appreciation (depreciation).
See accompanying notes which are an integral part of the financial statements.
Fidelity Advisor Freedom® 2050 Fund
Financial Statements
Statement of Assets and Liabilities
| | | September 30, 2018 (Unaudited) |
| Assets | | |
Investment in securities, at value — See accompanying schedule:
Unaffiliated issuers (cost $727,547) | $727,491 | |
| Fidelity Central Funds (cost $2,629,720) | 2,629,720 | |
| Other affiliated issuers (cost $956,359,794) | 1,156,483,626 | |
| Total Investment in Securities (cost $959,717,061) | | $1,159,840,837 |
| Receivable for investments sold | | 13,468,826 |
| Receivable for fund shares sold | | 1,674,695 |
| Distributions receivable from Fidelity Central Funds | | 3,956 |
| Total assets | | 1,174,988,314 |
| Liabilities | | |
| Payable for investments purchased | $13,914,511 | |
| Payable for fund shares redeemed | 1,224,347 | |
| Accrued management fee | 710,239 | |
| Distribution and service plan fees payable | 188,525 | |
| Payable for daily variation margin on futures contracts | 43,927 | |
| Total liabilities | | 16,081,549 |
| Net Assets | | $1,158,906,765 |
| Net Assets consist of: | | |
| Paid in capital | | $916,402,251 |
| Undistributed net investment income | | 2,586,760 |
| Accumulated undistributed net realized gain (loss) on investments | | 39,740,482 |
| Net unrealized appreciation (depreciation) on investments | | 200,177,272 |
| Net Assets | | $1,158,906,765 |
| Calculation of Maximum Offering Price | | |
| Class A: | | |
| Net Asset Value and redemption price per share ($420,053,311 ÷ 34,211,307 shares) | | $12.28 |
| Maximum offering price per share (100/94.25 of $12.28) | | $13.03 |
| Class M: | | |
| Net Asset Value and redemption price per share ($177,208,406 ÷ 14,530,809 shares) | | $12.20 |
| Maximum offering price per share (100/96.50 of $12.20) | | $12.64 |
| Class C: | | |
| Net Asset Value and offering price per share ($34,382,252 ÷ 2,858,390 shares)(a) | | $12.03 |
| Class I: | | |
| Net Asset Value, offering price and redemption price per share ($512,069,781 ÷ 41,392,604 shares) | | $12.37 |
| Class Z6: | | |
| Net Asset Value, offering price and redemption price per share ($15,193,015 ÷ 1,227,419 shares) | | $12.38 |
(a) Redemption price per share is equal to net asset value less any applicable contingent deferred sales charge.
See accompanying notes which are an integral part of the financial statements.
Statement of Operations
| | | Six months ended September 30, 2018 (Unaudited) |
| Investment Income | | |
| Dividends: | | |
| Affiliated issuers | | $8,803,080 |
| Interest | | 4,884 |
| Income from Fidelity Central Funds | | 6,739 |
| Total income | | 8,814,703 |
| Expenses | | |
| Management fee | $4,201,296 | |
| Distribution and service plan fees | 1,125,460 | |
| Independent trustees' fees and expenses | 2,712 | |
| Total expenses before reductions | 5,329,468 | |
| Expense reductions | (2) | |
| Total expenses after reductions | | 5,329,466 |
| Net investment income (loss) | | 3,485,237 |
| Realized and Unrealized Gain (Loss) | | |
| Net realized gain (loss) on: | | |
| Investment securities: | | |
| Fidelity Central Funds | 1 | |
| Other affiliated issuers | 17,850,196 | |
| Futures contracts | (442,546) | |
| Capital gain distributions from underlying funds: | | |
| Affiliated issuers | 25,389,486 | |
| Total net realized gain (loss) | | 42,797,137 |
| Change in net unrealized appreciation (depreciation) on: | | |
| Investment securities: | | |
| Unaffiliated issuers | (56) | |
| Affiliated issuers | 8,661,587 | |
| Futures contracts | 53,496 | |
| Total change in net unrealized appreciation (depreciation) | | 8,715,027 |
| Net gain (loss) | | 51,512,164 |
| Net increase (decrease) in net assets resulting from operations | | $54,997,401 |
See accompanying notes which are an integral part of the financial statements.
Statement of Changes in Net Assets
| | Six months ended September 30, 2018 (Unaudited) | Year ended March 31, 2018 |
| Increase (Decrease) in Net Assets | | |
| Operations | | |
| Net investment income (loss) | $3,485,237 | $8,457,626 |
| Net realized gain (loss) | 42,797,137 | 66,828,415 |
| Change in net unrealized appreciation (depreciation) | 8,715,027 | 49,404,768 |
| Net increase (decrease) in net assets resulting from operations | 54,997,401 | 124,690,809 |
| Distributions to shareholders from net investment income | – | (10,251,675) |
| Distributions to shareholders from net realized gain | (43,902,951) | (34,153,397) |
| Total distributions | (43,902,951) | (44,405,072) |
| Share transactions - net increase (decrease) | 58,015,509 | 79,870,312 |
| Total increase (decrease) in net assets | 69,109,959 | 160,156,049 |
| Net Assets | | |
| Beginning of period | 1,089,796,806 | 929,640,757 |
| End of period | $1,158,906,765 | $1,089,796,806 |
| Other Information | | |
| Undistributed net investment income end of period | $2,586,760 | $– |
| Distributions in excess of net investment income end of period | $– | $(898,477) |
See accompanying notes which are an integral part of the financial statements.
Financial Highlights
Fidelity Advisor Freedom 2050 Fund Class A
| | Six months ended (Unaudited) September 30, | Years endedMarch 31, | | | | |
| | 2018 | 2018 | 2017 | 2016 | 2015 | 2014 |
| Selected Per–Share Data | | | | | | |
| Net asset value, beginning of period | $12.17 | $11.20 | $10.16 | $11.06 | $11.24 | $10.39 |
| Income from Investment Operations | | | | | | |
| Net investment income (loss)A | .03 | .09 | .13 | .13 | .15 | .12 |
| Net realized and unrealized gain (loss) | .57 | 1.40 | 1.39 | (.53) | .58 | 1.40 |
| Total from investment operations | .60 | 1.49 | 1.52 | (.40) | .73 | 1.52 |
| Distributions from net investment income | – | (.12) | (.13) | (.14) | (.16) | (.12) |
| Distributions from net realized gain | (.49) | (.40) | (.34) | (.36) | (.76) | (.55) |
| Total distributions | (.49) | (.52) | (.48)B | (.50) | (.91)C | (.67) |
| Net asset value, end of period | $12.28 | $12.17 | $11.20 | $10.16 | $11.06 | $11.24 |
| Total ReturnD,E,F | 5.00% | 13.42% | 15.52% | (3.84)% | 6.77% | 14.91% |
| Ratios to Average Net AssetsG,H | | | | | | |
| Expenses before reductions | 1.00%I | .88% | .25% | .25% | .25% | .25% |
| Expenses net of fee waivers, if any | 1.00%I | .88% | .25% | .25% | .25% | .25% |
| Expenses net of all reductions | 1.00%I | .88% | .25% | .25% | .25% | .25% |
| Net investment income (loss) | .56%I | .79% | 1.22% | 1.28% | 1.37% | 1.10% |
| Supplemental Data | | | | | | |
| Net assets, end of period (000 omitted) | $420,053 | $418,313 | $396,373 | $363,199 | $415,103 | $401,589 |
| Portfolio turnover rateH | 27%I | 20% | 25% | 24% | 30% | 47% |
A Calculated based on average shares outstanding during the period.
B Total distributions of $.48 per share is comprised of distributions from net investment income of $.131 and distributions from net realized gain of $.344 per share.
C Total distributions of $.91 per share is comprised of distributions from net investment income of $.155 and distributions from net realized gain of $.755 per share.
D Total returns for periods of less than one year are not annualized.
E Total returns would have been lower if certain expenses had not been reduced during the applicable periods shown.
F Total returns do not include the effect of the sales charges.
G Expense ratios reflect operating expenses of the class. Expenses before reductions do not reflect amounts reimbursed by the investment adviser or reductions from expense offset arrangements and do not represent the amount paid by the class during periods when reimbursements or reductions occur. Expenses net of fee waivers reflect expenses after reimbursement by the investment adviser but prior to reductions from expense offset arrangements. Expenses net of all reductions represent the net expenses paid by the class but do not include expenses of the underlying funds in which the Fund invests.
H Amounts do not include the activity of the Underlying Funds.
I Annualized
See accompanying notes which are an integral part of the financial statements.
Fidelity Advisor Freedom 2050 Fund Class M
| | Six months ended (Unaudited) September 30, | Years endedMarch 31, | | | | |
| | 2018 | 2018 | 2017 | 2016 | 2015 | 2014 |
| Selected Per–Share Data | | | | | | |
| Net asset value, beginning of period | $12.11 | $11.15 | $10.12 | $11.02 | $11.20 | $10.36 |
| Income from Investment Operations | | | | | | |
| Net investment income (loss)A | .02 | .06 | .10 | .11 | .12 | .09 |
| Net realized and unrealized gain (loss) | .56 | 1.39 | 1.38 | (.54) | .58 | 1.39 |
| Total from investment operations | .58 | 1.45 | 1.48 | (.43) | .70 | 1.48 |
| Distributions from net investment income | – | (.10) | (.11) | (.12) | (.13) | (.10) |
| Distributions from net realized gain | (.49) | (.40) | (.34) | (.36) | (.76) | (.55) |
| Total distributions | (.49) | (.49)B | (.45) | (.47)C | (.88)D | (.64)E |
| Net asset value, end of period | $12.20 | $12.11 | $11.15 | $10.12 | $11.02 | $11.20 |
| Total ReturnF,G,H | 4.85% | 13.16% | 15.22% | (4.08)% | 6.54% | 14.61% |
| Ratios to Average Net AssetsI,J | | | | | | |
| Expenses before reductions | 1.25%K | 1.13% | .50% | .50% | .50% | .50% |
| Expenses net of fee waivers, if any | 1.25%K | 1.13% | .50% | .50% | .50% | .50% |
| Expenses net of all reductions | 1.25%K | 1.13% | .50% | .50% | .50% | .50% |
| Net investment income (loss) | .31%K | .54% | .97% | 1.04% | 1.12% | .85% |
| Supplemental Data | | | | | | |
| Net assets, end of period (000 omitted) | $177,208 | $166,634 | $147,601 | $127,842 | $126,987 | $115,391 |
| Portfolio turnover rateJ | 27%K | 20% | 25% | 24% | 30% | 47% |
A Calculated based on average shares outstanding during the period.
B Total distributions of $.49 per share is comprised of distributions from net investment income of $.096 and distributions from net realized gain of $.398 per share.
C Total distributions of $.47 per share is comprised of distributions from net investment income of $.115 and distributions from net realized gain of $.355 per share.
D Total distributions of $.88 per share is comprised of distributions from net investment income of $.128 and distributions from net realized gain of $.755 per share.
E Total distributions of $.64 per share is comprised of distributions from net investment income of $.097 and distributions from net realized gain of $.546 per share.
F Total returns for periods of less than one year are not annualized.
G Total returns would have been lower if certain expenses had not been reduced during the applicable periods shown.
H Total returns do not include the effect of the sales charges.
I Expense ratios reflect operating expenses of the class. Expenses before reductions do not reflect amounts reimbursed by the investment adviser or reductions from expense offset arrangements and do not represent the amount paid by the class during periods when reimbursements or reductions occur. Expenses net of fee waivers reflect expenses after reimbursement by the investment adviser but prior to reductions from expense offset arrangements. Expenses net of all reductions represent the net expenses paid by the class but do not include expenses of the underlying funds in which the Fund invests.
J Amounts do not include the activity of the Underlying Funds.
K Annualized
See accompanying notes which are an integral part of the financial statements.
Fidelity Advisor Freedom 2050 Fund Class C
| | Six months ended (Unaudited) September 30, | Years endedMarch 31, | | | | |
| | 2018 | 2018 | 2017 | 2016 | 2015 | 2014 |
| Selected Per–Share Data | | | | | | |
| Net asset value, beginning of period | $11.98 | $11.05 | $10.04 | $10.95 | $11.14 | $10.31 |
| Income from Investment Operations | | | | | | |
| Net investment income (loss)A | (.01) | –B | .05 | .06 | .07 | .04 |
| Net realized and unrealized gain (loss) | .55 | 1.38 | 1.37 | (.55) | .57 | 1.38 |
| Total from investment operations | .54 | 1.38 | 1.42 | (.49) | .64 | 1.42 |
| Distributions from net investment income | – | (.06) | (.08) | (.08) | (.09) | (.06) |
| Distributions from net realized gain | (.49) | (.39) | (.34) | (.34) | (.74) | (.54) |
| Total distributions | (.49) | (.45) | (.41)C | (.42) | (.83) | (.59)D |
| Net asset value, end of period | $12.03 | $11.98 | $11.05 | $10.04 | $10.95 | $11.14 |
| Total ReturnE,F,G | 4.56% | 12.59% | 14.73% | (4.67)% | 6.01% | 14.06% |
| Ratios to Average Net AssetsH,I | | | | | | |
| Expenses before reductions | 1.75%J | 1.63% | 1.00% | 1.00% | 1.00% | 1.00% |
| Expenses net of fee waivers, if any | 1.75%J | 1.63% | 1.00% | 1.00% | 1.00% | 1.00% |
| Expenses net of all reductions | 1.75%J | 1.63% | 1.00% | 1.00% | 1.00% | 1.00% |
| Net investment income (loss) | (.19)%J | .04% | .47% | .54% | .63% | .35% |
| Supplemental Data | | | | | | |
| Net assets, end of period (000 omitted) | $34,382 | $32,763 | $28,268 | $24,460 | $24,652 | $21,190 |
| Portfolio turnover rateI | 27%J | 20% | 25% | 24% | 30% | 47% |
A Calculated based on average shares outstanding during the period.
B Amount represents less than $.005 per share.
C Total distributions of $.41 per share is comprised of distributions from net investment income of $.075 and distributions from net realized gain of $.339 per share.
D Total distributions of $.59 per share is comprised of distributions from net investment income of $.056 and distributions from net realized gain of $.536 per share.
E Total returns for periods of less than one year are not annualized.
F Total returns would have been lower if certain expenses had not been reduced during the applicable periods shown.
G Total returns do not include the effect of the contingent deferred sales charge.
H Expense ratios reflect operating expenses of the class. Expenses before reductions do not reflect amounts reimbursed by the investment adviser or reductions from expense offset arrangements and do not represent the amount paid by the class during periods when reimbursements or reductions occur. Expenses net of fee waivers reflect expenses after reimbursement by the investment adviser but prior to reductions from expense offset arrangements. Expenses net of all reductions represent the net expenses paid by the class but do not include expenses of the underlying funds in which the Fund invests.
I Amounts do not include the activity of the Underlying Funds.
J Annualized
See accompanying notes which are an integral part of the financial statements.
Fidelity Advisor Freedom 2050 Fund Class I
| | Six months ended (Unaudited) September 30, | Years endedMarch 31, | | | | |
| | 2018 | 2018 | 2017 | 2016 | 2015 | 2014 |
| Selected Per–Share Data | | | | | | |
| Net asset value, beginning of period | $12.25 | $11.27 | $10.22 | $11.13 | $11.30 | $10.44 |
| Income from Investment Operations | | | | | | |
| Net investment income (loss)A | .05 | .12 | .16 | .16 | .18 | .15 |
| Net realized and unrealized gain (loss) | .56 | 1.41 | 1.39 | (.55) | .59 | 1.40 |
| Total from investment operations | .61 | 1.53 | 1.55 | (.39) | .77 | 1.55 |
| Distributions from net investment income | – | (.14) | (.15) | (.16) | (.18) | (.15) |
| Distributions from net realized gain | (.49) | (.41) | (.35) | (.36) | (.76) | (.55) |
| Total distributions | (.49) | (.55) | (.50) | (.52) | (.94) | (.69)B |
| Net asset value, end of period | $12.37 | $12.25 | $11.27 | $10.22 | $11.13 | $11.30 |
| Total ReturnC,D | 5.05% | 13.74% | 15.81% | (3.65)% | 7.10% | 15.20% |
| Ratios to Average Net AssetsE,F | | | | | | |
| Expenses before reductions | .75%G | .64% | - %H | - %H | - %H | - %H |
| Expenses net of fee waivers, if any | .75%G | .64% | -% | -% | -% | -% |
| Expenses net of all reductions | .75%G | .64% | -% | -% | -% | -% |
| Net investment income (loss) | .81%G | 1.03% | 1.47% | 1.53% | 1.62% | 1.35% |
| Supplemental Data | | | | | | |
| Net assets, end of period (000 omitted) | $512,070 | $466,677 | $357,398 | $320,449 | $303,017 | $282,594 |
| Portfolio turnover rateF | 27%G | 20% | 25% | 24% | 30% | 47% |
A Calculated based on average shares outstanding during the period.
B Total distributions of $.69 per share is comprised of distributions from net investment income of $.147 and distributions from net realized gain of $.546 per share.
C Total returns for periods of less than one year are not annualized.
D Total returns would have been lower if certain expenses had not been reduced during the applicable periods shown.
E Expense ratios reflect operating expenses of the class. Expenses before reductions do not reflect amounts reimbursed by the investment adviser or reductions from expense offset arrangements and do not represent the amount paid by the class during periods when reimbursements or reductions occur. Expenses net of fee waivers reflect expenses after reimbursement by the investment adviser but prior to reductions from expense offset arrangements. Expenses net of all reductions represent the net expenses paid by the class but do not include expenses of the underlying funds in which the Fund invests.
F Amounts do not include the activity of the Underlying Funds.
G Annualized
H Amount represents less than .005%.
See accompanying notes which are an integral part of the financial statements.
Fidelity Advisor Freedom 2050 Fund Class Z6
| | Six months ended (Unaudited) September 30, | Years endedMarch 31, |
| | 2018 | 2018 A |
| Selected Per–Share Data | | |
| Net asset value, beginning of period | $12.24 | $11.59 |
| Income from Investment Operations | | |
| Net investment income (loss)B | .06 | .23 |
| Net realized and unrealized gain (loss) | .57 | .83 |
| Total from investment operations | .63 | 1.06 |
| Distributions from net investment income | – | (.17) |
| Distributions from net realized gain | (.49) | (.24) |
| Total distributions | (.49) | (.41) |
| Net asset value, end of period | $12.38 | $12.24 |
| Total ReturnC,D | 5.22% | 9.15% |
| Ratios to Average Net AssetsE,F | | |
| Expenses before reductions | .49%G | .51%G,H |
| Expenses net of fee waivers, if any | .49%G | .51%G,H |
| Expenses net of all reductions | .49%G | .51%G,H |
| Net investment income (loss) | 1.06%G | 2.27%G |
| Supplemental Data | | |
| Net assets, end of period (000 omitted) | $15,193 | $5,410 |
| Portfolio turnover rateF | 27%G | 20% |
A For the period June 6, 2017 (commencement of sale of shares) to March 31, 2018.
B Calculated based on average shares outstanding during the period.
C Total returns for periods of less than one year are not annualized.
D Total returns would have been lower if certain expenses had not been reduced during the applicable periods shown.
E Expense ratios reflect operating expenses of the class. Expenses before reductions do not reflect amounts reimbursed by the investment adviser or reductions from expense offset arrangements and do not represent the amount paid by the class during periods when reimbursements or reductions occur. Expenses net of fee waivers reflect expenses after reimbursement by the investment adviser but prior to reductions from expense offset arrangements. Expenses net of all reductions represent the net expenses paid by the class but do not include expenses of the underlying funds in which the Fund invests.
F Amounts do not include the activity of the Underlying Funds.
G Annualized
H On certain classes, the size and fluctuation of net assets and expense amounts may cause ratios to differ from contractual rates.
See accompanying notes which are an integral part of the financial statements.
Fidelity Advisor Freedom® 2055 Fund
Investment Summary (Unaudited)
The information in the following tables is based on the direct investments of the Fund.
Top Holdings as of September 30, 2018
| | % of fund's net assets |
| Fidelity Series Large Cap Stock Fund | 12.3 |
| Fidelity Series International Growth Fund | 9.3 |
| Fidelity Series International Value Fund | 9.2 |
| Fidelity Series Emerging Markets Opportunities Fund | 8.6 |
| Fidelity Series Stock Selector Large Cap Value Fund | 7.8 |
| Fidelity Series Value Discovery Fund | 7.7 |
| Fidelity Advisor Series Equity Growth Fund | 7.0 |
| Fidelity Series Opportunistic Insights Fund | 6.5 |
| Fidelity Advisor Series Growth Opportunities Fund | 4.8 |
| Fidelity Series Small Cap Opportunities Fund | 4.2 |
| | 77.4 |
Asset Allocation (% of fund's net assets)
| Period end |
| | Domestic Equity Funds | 60.5% |
| | International Equity Funds | 30.8% |
| | Bond Funds | 6.8% |
| | Short-Term Funds | 1.9% |
| | Short-Term Investments | 0.1% |
| | Net Other Assets (Liabilities)* | (0.1)% |

* Net Other Assets (Liabilities) are not included in the pie chart
Domestic Equity Funds category includes Fidelity Series Commodity Strategy Fund which invests in commodity-related investments.
Fidelity Advisor Freedom® 2055 Fund
Schedule of Investments September 30, 2018 (Unaudited)
Showing Percentage of Net Assets
| U.S. Treasury Obligations - 0.1% | | | |
| | | Principal Amount | Value |
| U.S. Treasury Bills, yield at date of purchase 2.07% to 2.09% 11/23/18 to 11/29/18 (a) | | | |
| (Cost $398,663) | | 400,000 | 398,633 |
| | | Shares | Value |
|
| Domestic Equity Funds - 60.5% | | | |
| Fidelity Advisor Series Equity Growth Fund (b) | | 2,828,444 | $43,727,744 |
| Fidelity Advisor Series Growth Opportunities Fund (b) | | 1,773,103 | 29,504,429 |
| Fidelity Advisor Series Small Cap Fund (b) | | 1,606,291 | 20,191,075 |
| Fidelity Series All-Sector Equity Fund (b) | | 1,612,743 | 21,949,435 |
| Fidelity Series Commodity Strategy Fund (b) | | 2,615,040 | 13,075,201 |
| Fidelity Series Large Cap Stock Fund (b) | | 4,773,579 | 76,043,116 |
| Fidelity Series Large Cap Value Index Fund (b) | | 598,823 | 7,904,465 |
| Fidelity Series Opportunistic Insights Fund (b) | | 2,047,405 | 40,640,987 |
| Fidelity Series Small Cap Opportunities Fund (b) | | 1,766,852 | 25,955,055 |
| Fidelity Series Stock Selector Large Cap Value Fund (b) | | 3,676,161 | 48,598,854 |
| Fidelity Series Value Discovery Fund (b) | | 3,496,292 | 47,864,234 |
| TOTAL DOMESTIC EQUITY FUNDS | | | |
| (Cost $328,027,130) | | | 375,454,595 |
|
| International Equity Funds - 30.8% | | | |
| Fidelity Series Canada Fund (b) | | 514,750 | 5,564,449 |
| Fidelity Series Emerging Markets Fund (b) | | 400,700 | 3,882,779 |
| Fidelity Series Emerging Markets Opportunities Fund (b) | | 2,781,364 | 53,374,380 |
| Fidelity Series International Growth Fund (b) | | 3,507,997 | 57,531,157 |
| Fidelity Series International Small Cap Fund (b) | | 757,604 | 13,561,117 |
| Fidelity Series International Value Fund (b) | | 5,433,943 | 57,165,076 |
| TOTAL INTERNATIONAL EQUITY FUNDS | | | |
| (Cost $170,343,008) | | | 191,078,958 |
|
| Bond Funds - 6.8% | | | |
| Fidelity Series Emerging Markets Debt Fund (b) | | 380,409 | 3,625,302 |
| Fidelity Series Floating Rate High Income Fund (b) | | 144,630 | 1,376,882 |
| Fidelity Series High Income Fund (b) | | 845,208 | 8,122,447 |
| Fidelity Series Inflation-Protected Bond Index Fund (b) | | 192,828 | 1,872,358 |
| Fidelity Series International Credit Fund (b) | | 23,435 | 230,370 |
| Fidelity Series Investment Grade Bond Fund (b) | | 253,088 | 2,756,128 |
| Fidelity Series Long-Term Treasury Bond Index Fund (b) | | 2,620,888 | 21,596,118 |
| Fidelity Series Real Estate Income Fund (b) | | 248,404 | 2,677,791 |
| TOTAL BOND FUNDS | | | |
| (Cost $43,349,269) | | | 42,257,396 |
|
| Short-Term Funds - 1.9% | | | |
| Fidelity Cash Central Fund, 2.11% (c) | | 1,268,631 | 1,268,885 |
| Fidelity Series Government Money Market Fund 2.12% (b)(d) | | 8,668,157 | 8,668,157 |
| Fidelity Series Short-Term Credit Fund (b) | | 193,123 | 1,904,195 |
| TOTAL SHORT-TERM FUNDS | | | |
| (Cost $11,855,230) | | | 11,841,237 |
| TOTAL INVESTMENT IN SECURITIES - 100.1% | | | |
| (Cost $553,973,300) | | | 621,030,819 |
| NET OTHER ASSETS (LIABILITIES) - (0.1)% | | | (427,278) |
| NET ASSETS - 100% | | | $620,603,541 |
| Futures Contracts | | | | | |
| | Number of contracts | Expiration Date | Notional Amount | Value | Unrealized Appreciation/(Depreciation) |
| Purchased | | | | | |
| Equity Index Contracts | | | | | |
| CME E-mini S&P 500 Index Contracts (United States) | 23 | Dec. 2018 | $3,356,850 | $651 | $651 |
| ICE E-mini MSCI Emerging Markets Index Contracts (United States) | 29 | Dec. 2018 | 1,522,065 | 30,662 | 30,662 |
| | | | | | 31,313 |
| Sold | | | | | |
| Equity Index Contracts | | | | | |
| ICE E-mini MSCI EAFE Index Contracts (United States) | 14 | Dec. 2018 | 1,382,850 | (3,095) | (3,095) |
| TOTAL FUTURES CONTRACTS | | | | | $28,218 |
The notional amount of futures purchased as a percentage of Net Assets is 0.8%
The notional amount of futures sold as a percentage of Net Assets is 0.2%
Legend
(a) Security or a portion of the security was pledged to cover margin requirements for futures contracts. At period end, the value of securities pledged amounted to $264,088.
(b) Affiliated Fund
(c) Affiliated fund that is generally available only to investment companies and other accounts managed by Fidelity Investments. The rate quoted is the annualized seven-day yield of the fund at period end. A complete unaudited listing of the fund's holdings as of its most recent quarter end is available upon request. In addition, each Fidelity Central Fund's financial statements are available on the SEC's website or upon request.
(d) The rate quoted is the annualized seven-day yield of the fund at period end.
Affiliated Central Funds
Information regarding fiscal year to date income earned by the Fund from investments in Fidelity Central Funds is as follows:
| Fund | Income earned |
| Fidelity Cash Central Fund | $3,312 |
| Total | $3,312 |
Amounts in the income column in the above table include any capital gain distributions from underlying funds, which are presented in the corresponding line-item in the Statement of Operations if applicable.
Affiliated Underlying Funds
Fiscal year to date information regarding the Fund's investments in affiliated Underlying Funds, excluding any Money Market Central Funds, is presented below. Exchanges between classes of the same affiliated Underlying Funds may occur.
| Affiliate | Value, beginning of period | Purchases | Sales Proceeds | Dividend Income | Realized Gain (loss) | Change in Unrealized appreciation (depreciation) | Value, end of period |
| Fidelity Advisor Series Equity Growth Fund | $35,257,766 | $5,673,939 | $2,552,914 | $-- | $27,365 | $5,321,588 | $43,727,744 |
| Fidelity Advisor Series Equity Value Fund | 40,711,563 | 8,794,623 | 2,954,979 | 1,532,713 | (29,410) | (1,526,372) | -- |
| Fidelity Advisor Series Growth & Income Fund | 62,431,831 | 16,416,685 | 4,551,923 | 6,157,448 | (18,915) | (5,700,139) | -- |
| Fidelity Advisor Series Growth Opportunities Fund | 23,131,051 | 3,685,629 | 3,612,709 | -- | 184,974 | 6,115,484 | 29,504,429 |
| Fidelity Advisor Series Opportunistic Insights Fund | 32,751,801 | 8,132,560 | 2,378,126 | 2,940,841 | 3,433 | (6,223,305) | -- |
| Fidelity Advisor Series Small Cap Fund | 17,635,097 | 2,775,555 | 1,274,847 | -- | (2,665) | 1,057,935 | 20,191,075 |
| Fidelity Advisor Series Stock Selector Large Cap Value Fund | 41,106,481 | 10,891,588 | 2,948,553 | 3,870,324 | (26,490) | (856,706) | -- |
| Fidelity Series 100 Index Fund | 17,322,149 | -- | 18,596,135 | -- | 5,457,697 | (4,183,711) | -- |
| Fidelity Series All-Sector Equity Fund | 24,199,576 | 3,731,040 | 8,906,089 | -- | 85,913 | 2,838,995 | 21,949,435 |
| Fidelity Series Canada Fund | 4,795,728 | 806,349 | 344,215 | -- | (1,243) | 307,830 | 5,564,449 |
| Fidelity Series Commodity Strategy Fund | 11,380,188 | 3,563,579 | 814,815 | 775,141 | (2,208) | (1,051,543) | 13,075,201 |
| Fidelity Series Emerging Markets Debt Fund | 3,454,885 | 598,854 | 233,347 | 106,817 | (11,520) | (183,570) | 3,625,302 |
| Fidelity Series Emerging Markets Fund | -- | 3,887,052 | -- | -- | -- | (4,273) | 3,882,779 |
| Fidelity Series Emerging Markets Opportunities Fund | 49,716,265 | 16,743,332 | 6,489,655 | -- | (293,133) | (6,302,429) | 53,374,380 |
| Fidelity Series Floating Rate High Income Fund | 1,232,572 | 239,988 | 97,233 | 35,120 | (501) | 2,056 | 1,376,882 |
| Fidelity Series Government Money Market Fund 2.12% | 8,792,437 | 8,986,486 | 9,110,766 | 74,905 | -- | -- | 8,668,157 |
| Fidelity Series High Income Fund | 7,612,274 | 1,281,935 | 837,192 | 228,848 | (8,027) | 73,457 | 8,122,447 |
| Fidelity Series Inflation-Protected Bond Index Fund | 4,372,056 | 1,075,001 | 3,595,642 | 6,866 | (47,656) | 68,599 | 1,872,358 |
| Fidelity Series International Credit Fund | 229,849 | 2,833 | -- | 2,833 | -- | (2,312) | 230,370 |
| Fidelity Series International Growth Fund | 48,270,376 | 11,939,972 | 3,483,903 | -- | (5,375) | 810,087 | 57,531,157 |
| Fidelity Series International Small Cap Fund | 12,042,724 | 2,898,075 | 882,170 | -- | (15,086) | (482,426) | 13,561,117 |
| Fidelity Series International Value Fund | 48,858,175 | 11,892,966 | 3,483,904 | -- | (109,509) | 7,348 | 57,165,076 |
| Fidelity Series Investment Grade Bond Fund | 2,594,775 | 537,311 | 345,265 | 37,887 | (3,555) | (27,138) | 2,756,128 |
| Fidelity Series Large Cap Stock Fund | -- | 483,771 | 3,981 | -- | 9 | 6,985,778 | 76,043,116 |
| Fidelity Series Large Cap Value Index Fund | 6,806,286 | 1,090,274 | 501,342 | -- | (3,153) | 512,400 | 7,904,465 |
| Fidelity Series Long-Term Treasury Bond Index Fund | 12,223,528 | 15,504,720 | 5,442,783 | 264,962 | (161,226) | (528,121) | 21,596,118 |
| Fidelity Series Opportunistic Insights Fund | -- | 260,165 | 2,131 | -- | (162) | 8,096,752 | 40,640,987 |
| Fidelity Series Real Estate Equity Fund | 4,170,084 | 90,949 | 4,430,923 | 21,233 | (113,492) | 283,382 | -- |
| Fidelity Series Real Estate Income Fund | 2,352,341 | 494,540 | 182,786 | 109,384 | (2,072) | 15,768 | 2,677,791 |
| Fidelity Series Short-Term Credit Fund | 1,606,596 | 432,304 | 134,821 | 19,746 | (1,016) | 1,132 | 1,904,195 |
| Fidelity Series Small Cap Opportunities Fund | 21,522,309 | 5,397,564 | 1,566,865 | 1,984,601 | 9,196 | 592,851 | 25,955,055 |
| Fidelity Series Stock Selector Large Cap Value Fund | -- | 506,297 | 13,197 | -- | (762) | (59,804) | 48,598,854 |
| Fidelity Series Value Discovery Fund | -- | 310,858 | 2,556 | -- | (52) | 2,560,559 | 47,864,234 |
| | $546,580,763 | $149,126,794 | $89,775,767 | $18,169,669 | $4,911,359 | $8,520,152 | $619,363,301 |
Amounts in the income column in the above table include any capital gain distributions from underlying funds, which are presented in the corresponding line-item in the Statement of Operations if applicable.
Investment Valuation
The following is a summary of the inputs used, as of September 30, 2018, involving the Fund's assets and liabilities carried at fair value. The inputs or methodology used for valuing securities may not be an indication of the risk associated with investing in those securities. For more information on valuation inputs, and their aggregation into the levels used below, please refer to the Investment Valuation section in the accompanying Notes to Financial Statements.
| | Valuation Inputs at Reporting Date: |
| Description | Total | Level 1 | Level 2 | Level 3 |
| Investments in Securities: | | | | |
| Other Short-Term Investments | $398,633 | $-- | $398,633 | $-- |
| Domestic Equity Funds | 375,454,595 | 375,454,595 | -- | -- |
| International Equity Funds | 191,078,958 | 191,078,958 | -- | -- |
| Bond Funds | 42,257,396 | 42,257,396 | -- | -- |
| Short-Term Funds | 11,841,237 | 11,841,237 | -- | -- |
| Total Investments in Securities: | $621,030,819 | $620,632,186 | $398,633 | $-- |
| Derivative Instruments: | | | | |
| Assets | | | | |
| Futures Contracts | $31,313 | $31,313 | $-- | $-- |
| Total Assets | $31,313 | $31,313 | $-- | $-- |
| Liabilities | | | | |
| Futures Contracts | $(3,095) | $(3,095) | $-- | $-- |
| Total Liabilities | $(3,095) | $(3,095) | $-- | $-- |
| Total Derivative Instruments: | $28,218 | $28,218 | $-- | $-- |
Value of Derivative Instruments
The following table is a summary of the Fund's value of derivative instruments by primary risk exposure as of September 30, 2018. For additional information on derivative instruments, please refer to the Derivative Instruments section in the accompanying Notes to Financial Statements.
| Primary Risk Exposure / Derivative Type | Value |
| | Asset | Liability |
| Equity Risk | | |
| Futures Contracts(a) | $31,313 | $(3,095) |
| Total Equity Risk | 31,313 | (3,095) |
| Total Value of Derivatives | $31,313 | $(3,095) |
(a) Reflects gross cumulative appreciation (depreciation) on futures contracts as presented in the Schedule of Investments. In the Statement of Assets and Liabilities, the period end daily variation margin is included in receivable or payable for daily variation margin on futures contracts, and the net cumulative appreciation (depreciation) is included in net unrealized appreciation (depreciation).
See accompanying notes which are an integral part of the financial statements.
Fidelity Advisor Freedom® 2055 Fund
Financial Statements
Statement of Assets and Liabilities
| | | September 30, 2018 (Unaudited) |
| Assets | | |
Investment in securities, at value — See accompanying schedule:
Unaffiliated issuers (cost $398,663) | $398,633 | |
| Fidelity Central Funds (cost $1,268,885) | 1,268,885 | |
| Other affiliated issuers (cost $552,305,752) | 619,363,301 | |
| Total Investment in Securities (cost $553,973,300) | | $621,030,819 |
| Cash | | 43,463 |
| Receivable for investments sold | | 7,134,844 |
| Receivable for fund shares sold | | 1,967,107 |
| Distributions receivable from Fidelity Central Funds | | 1,947 |
| Total assets | | 630,178,180 |
| Liabilities | | |
| Payable for investments purchased | $8,749,393 | |
| Payable for fund shares redeemed | 337,048 | |
| Accrued management fee | 378,482 | |
| Distribution and service plan fees payable | 86,284 | |
| Payable for daily variation margin on futures contracts | 23,432 | |
| Total liabilities | | 9,574,639 |
| Net Assets | | $620,603,541 |
| Net Assets consist of: | | |
| Paid in capital | | $535,690,935 |
| Undistributed net investment income | | 1,493,957 |
| Accumulated undistributed net realized gain (loss) on investments | | 16,332,912 |
| Net unrealized appreciation (depreciation) on investments | | 67,085,737 |
| Net Assets | | $620,603,541 |
| Calculation of Maximum Offering Price | | |
| Class A: | | |
| Net Asset Value and redemption price per share ($210,307,449 ÷ 15,539,155 shares) | | $13.53 |
| Maximum offering price per share (100/94.25 of $13.53) | | $14.36 |
| Class M: | | |
| Net Asset Value and redemption price per share ($81,488,450 ÷ 6,058,237 shares) | | $13.45 |
| Maximum offering price per share (100/96.50 of $13.45) | | $13.94 |
| Class C: | | |
| Net Asset Value and offering price per share ($11,503,687 ÷ 861,033 shares)(a) | | $13.36 |
| Class I: | | |
| Net Asset Value, offering price and redemption price per share ($308,853,712 ÷ 22,700,966 shares) | | $13.61 |
| Class Z6: | | |
| Net Asset Value, offering price and redemption price per share ($8,450,243 ÷ 620,759 shares) | | $13.61 |
(a) Redemption price per share is equal to net asset value less any applicable contingent deferred sales charge.
See accompanying notes which are an integral part of the financial statements.
Statement of Operations
| | | Six months ended September 30, 2018 (Unaudited) |
| Investment Income | | |
| Dividends: | | |
| Affiliated issuers | | $4,646,931 |
| Interest | | 2,520 |
| Income from Fidelity Central Funds | | 3,312 |
| Total income | | 4,652,763 |
| Expenses | | |
| Management fee | $2,192,734 | |
| Distribution and service plan fees | 512,882 | |
| Independent trustees' fees and expenses | 1,392 | |
| Total expenses before reductions | 2,707,008 | |
| Expense reductions | (2) | |
| Total expenses after reductions | | 2,707,006 |
| Net investment income (loss) | | 1,945,757 |
| Realized and Unrealized Gain (Loss) | | |
| Net realized gain (loss) on: | | |
| Investment securities: | | |
| Fidelity Central Funds | 2 | |
| Other affiliated issuers | 4,911,359 | |
| Futures contracts | (217,834) | |
| Capital gain distributions from underlying funds: | | |
| Affiliated issuers | 13,522,738 | |
| Total net realized gain (loss) | | 18,216,265 |
| Change in net unrealized appreciation (depreciation) on: | | |
| Investment securities: | | |
| Unaffiliated issuers | (30) | |
| Affiliated issuers | 8,520,152 | |
| Futures contracts | 28,218 | |
| Total change in net unrealized appreciation (depreciation) | | 8,548,340 |
| Net gain (loss) | | 26,764,605 |
| Net increase (decrease) in net assets resulting from operations | | $28,710,362 |
See accompanying notes which are an integral part of the financial statements.
Statement of Changes in Net Assets
| | Six months ended September 30, 2018 (Unaudited) | Year ended March 31, 2018 |
| Increase (Decrease) in Net Assets | | |
| Operations | | |
| Net investment income (loss) | $1,945,757 | $4,172,517 |
| Net realized gain (loss) | 18,216,265 | 28,526,248 |
| Change in net unrealized appreciation (depreciation) | 8,548,340 | 24,677,049 |
| Net increase (decrease) in net assets resulting from operations | 28,710,362 | 57,375,814 |
| Distributions to shareholders from net investment income | – | (5,050,072) |
| Distributions to shareholders from net realized gain | (20,742,895) | (11,461,480) |
| Total distributions | (20,742,895) | (16,511,552) |
| Share transactions - net increase (decrease) | 66,477,792 | 102,640,679 |
| Total increase (decrease) in net assets | 74,445,259 | 143,504,941 |
| Net Assets | | |
| Beginning of period | 546,158,282 | 402,653,341 |
| End of period | $620,603,541 | $546,158,282 |
| Other Information | | |
| Undistributed net investment income end of period | $1,493,957 | $– |
| Distributions in excess of net investment income end of period | $– | $(451,800) |
See accompanying notes which are an integral part of the financial statements.
Financial Highlights
Fidelity Advisor Freedom 2055 Fund Class A
| | Six months ended (Unaudited) September 30, | Years endedMarch 31, | | | | |
| | 2018 | 2018 | 2017 | 2016 | 2015 | 2014 |
| Selected Per–Share Data | | | | | | |
| Net asset value, beginning of period | $13.37 | $12.19 | $11.02 | $11.92 | $11.71 | $10.56 |
| Income from Investment Operations | | | | | | |
| Net investment income (loss)A | .04 | .11 | .14 | .15 | .16 | .12 |
| Net realized and unrealized gain (loss) | .61 | 1.51 | 1.51 | (.59) | .62 | 1.49 |
| Total from investment operations | .65 | 1.62 | 1.65 | (.44) | .78 | 1.61 |
| Distributions from net investment income | – | (.13) | (.14) | (.14) | (.15) | (.11) |
| Distributions from net realized gain | (.49) | (.32) | (.34) | (.31) | (.42) | (.36) |
| Total distributions | (.49) | (.44)B | (.48) | (.46)C | (.57) | (.46)D |
| Net asset value, end of period | $13.53 | $13.37 | $12.19 | $11.02 | $11.92 | $11.71 |
| Total ReturnE,F,G | 4.96% | 13.40% | 15.49% | (3.89)% | 6.85% | 15.45% |
| Ratios to Average Net AssetsH,I | | | | | | |
| Expenses before reductions | 1.00%J | .88% | .25% | .25% | .25% | .25% |
| Expenses net of fee waivers, if any | 1.00%J | .88% | .25% | .25% | .25% | .25% |
| Expenses net of all reductions | 1.00%J | .88% | .25% | .25% | .25% | .25% |
| Net investment income (loss) | .58%J | .81% | 1.24% | 1.31% | 1.39% | 1.11% |
| Supplemental Data | | | | | | |
| Net assets, end of period (000 omitted) | $210,307 | $209,824 | $170,352 | $130,309 | $115,666 | $81,217 |
| Portfolio turnover rateI | 30%J | 18% | 24% | 24% | 29% | 43% |
A Calculated based on average shares outstanding during the period.
B Total distributions of $.44 per share is comprised of distributions from net investment income of $.125 and distributions from net realized gain of $.317 per share.
C Total distributions of $.46 per share is comprised of distributions from net investment income of $.141 and distributions from net realized gain of $.314 per share.
D Total distributions of $.46 per share is comprised of distributions from net investment income of $.106 and distributions from net realized gain of $.355 per share.
E Total returns for periods of less than one year are not annualized.
F Total returns would have been lower if certain expenses had not been reduced during the applicable periods shown.
G Total returns do not include the effect of the sales charges.
H Expense ratios reflect operating expenses of the class. Expenses before reductions do not reflect amounts reimbursed by the investment adviser or reductions from expense offset arrangements and do not represent the amount paid by the class during periods when reimbursements or reductions occur. Expenses net of fee waivers reflect expenses after reimbursement by the investment adviser but prior to reductions from expense offset arrangements. Expenses net of all reductions represent the net expenses paid by the class but do not include expenses of the underlying funds in which the Fund invests.
I Amounts do not include the activity of the Underlying Funds.
J Annualized
See accompanying notes which are an integral part of the financial statements.
Fidelity Advisor Freedom 2055 Fund Class M
| | Six months ended (Unaudited) September 30, | Years endedMarch 31, | | | | |
| | 2018 | 2018 | 2017 | 2016 | 2015 | 2014 |
| Selected Per–Share Data | | | | | | |
| Net asset value, beginning of period | $13.31 | $12.14 | $10.98 | $11.88 | $11.68 | $10.55 |
| Income from Investment Operations | | | | | | |
| Net investment income (loss)A | .02 | .07 | .11 | .12 | .13 | .10 |
| Net realized and unrealized gain (loss) | .61 | 1.52 | 1.51 | (.59) | .62 | 1.47 |
| Total from investment operations | .63 | 1.59 | 1.62 | (.47) | .75 | 1.57 |
| Distributions from net investment income | – | (.11) | (.12) | (.12) | (.13) | (.09) |
| Distributions from net realized gain | (.49) | (.31) | (.34) | (.31) | (.42) | (.36) |
| Total distributions | (.49) | (.42) | (.46) | (.43) | (.55) | (.44)B |
| Net asset value, end of period | $13.45 | $13.31 | $12.14 | $10.98 | $11.88 | $11.68 |
| Total ReturnC,D,E | 4.83% | 13.15% | 15.27% | (4.11)% | 6.55% | 15.07% |
| Ratios to Average Net AssetsF,G | | | | | | |
| Expenses before reductions | 1.25%H | 1.14% | .50% | .50% | .50% | .50% |
| Expenses net of fee waivers, if any | 1.25%H | 1.14% | .50% | .50% | .50% | .50% |
| Expenses net of all reductions | 1.25%H | 1.14% | .50% | .50% | .50% | .50% |
| Net investment income (loss) | .33%H | .56% | .99% | 1.06% | 1.14% | .86% |
| Supplemental Data | | | | | | |
| Net assets, end of period (000 omitted) | $81,488 | $73,101 | $58,052 | $41,956 | $33,436 | $19,134 |
| Portfolio turnover rateG | 30%H | 18% | 24% | 24% | 29% | 43% |
A Calculated based on average shares outstanding during the period.
B Total distributions of $.44 per share is comprised of distributions from net investment income of $.086 and distributions from net realized gain of $.355 per share.
C Total returns for periods of less than one year are not annualized.
D Total returns would have been lower if certain expenses had not been reduced during the applicable periods shown.
E Total returns do not include the effect of the sales charges.
F Expense ratios reflect operating expenses of the class. Expenses before reductions do not reflect amounts reimbursed by the investment adviser or reductions from expense offset arrangements and do not represent the amount paid by the class during periods when reimbursements or reductions occur. Expenses net of fee waivers reflect expenses after reimbursement by the investment adviser but prior to reductions from expense offset arrangements. Expenses net of all reductions represent the net expenses paid by the class but do not include expenses of the underlying funds in which the Fund invests.
G Amounts do not include the activity of the Underlying Funds.
H Annualized
See accompanying notes which are an integral part of the financial statements.
Fidelity Advisor Freedom 2055 Fund Class C
| | Six months ended (Unaudited) September 30, | Years endedMarch 31, | | | | |
| | 2018 | 2018 | 2017 | 2016 | 2015 | 2014 |
| Selected Per–Share Data | | | | | | |
| Net asset value, beginning of period | $13.26 | $12.11 | $10.98 | $11.88 | $11.69 | $10.57 |
| Income from Investment Operations | | | | | | |
| Net investment income (loss)A | (.01) | .01 | .06 | .06 | .08 | .04 |
| Net realized and unrealized gain (loss) | .60 | 1.51 | 1.49 | (.58) | .61 | 1.47 |
| Total from investment operations | .59 | 1.52 | 1.55 | (.52) | .69 | 1.51 |
| Distributions from net investment income | – | (.06) | (.08) | (.08) | (.09) | (.05) |
| Distributions from net realized gain | (.49) | (.31) | (.34) | (.30) | (.41) | (.35) |
| Total distributions | (.49) | (.37) | (.42) | (.38) | (.50) | (.39)B |
| Net asset value, end of period | $13.36 | $13.26 | $12.11 | $10.98 | $11.88 | $11.69 |
| Total ReturnC,D,E | 4.55% | 12.62% | 14.62% | (4.53)% | 6.01% | 14.46% |
| Ratios to Average Net AssetsF,G | | | | | | |
| Expenses before reductions | 1.75%H | 1.64% | 1.00% | 1.00% | 1.00% | 1.00% |
| Expenses net of fee waivers, if any | 1.75%H | 1.64% | 1.00% | 1.00% | 1.00% | 1.00% |
| Expenses net of all reductions | 1.75%H | 1.64% | 1.00% | 1.00% | 1.00% | 1.00% |
| Net investment income (loss) | (.17)%H | .05% | .49% | .56% | .65% | .36% |
| Supplemental Data | | | | | | |
| Net assets, end of period (000 omitted) | $11,504 | $10,685 | $8,529 | $5,671 | $4,180 | $2,491 |
| Portfolio turnover rateG | 30%H | 18% | 24% | 24% | 29% | 43% |
A Calculated based on average shares outstanding during the period.
B Total distributions of $.39 per share is comprised of distributions from net investment income of $.048 and distributions from net realized gain of $.345 per share.
C Total returns for periods of less than one year are not annualized.
D Total returns would have been lower if certain expenses had not been reduced during the applicable periods shown.
E Total returns do not include the effect of the contingent deferred sales charge.
F Expense ratios reflect operating expenses of the class. Expenses before reductions do not reflect amounts reimbursed by the investment adviser or reductions from expense offset arrangements and do not represent the amount paid by the class during periods when reimbursements or reductions occur. Expenses net of fee waivers reflect expenses after reimbursement by the investment adviser but prior to reductions from expense offset arrangements. Expenses net of all reductions represent the net expenses paid by the class but do not include expenses of the underlying funds in which the Fund invests.
G Amounts do not include the activity of the Underlying Funds.
H Annualized
See accompanying notes which are an integral part of the financial statements.
Fidelity Advisor Freedom 2055 Fund Class I
| | Six months ended (Unaudited) September 30, | Years endedMarch 31, | | | | |
| | 2018 | 2018 | 2017 | 2016 | 2015 | 2014 |
| Selected Per–Share Data | | | | | | |
| Net asset value, beginning of period | $13.43 | $12.24 | $11.06 | $11.96 | $11.74 | $10.59 |
| Income from Investment Operations | | | | | | |
| Net investment income (loss)A | .06 | .14 | .17 | .18 | .19 | .15 |
| Net realized and unrealized gain (loss) | .61 | 1.53 | 1.51 | (.60) | .63 | 1.48 |
| Total from investment operations | .67 | 1.67 | 1.68 | (.42) | .82 | 1.63 |
| Distributions from net investment income | – | (.16) | (.16) | (.17) | (.18) | (.13) |
| Distributions from net realized gain | (.49) | (.32) | (.34) | (.31) | (.42) | (.36) |
| Total distributions | (.49) | (.48) | (.50) | (.48) | (.60) | (.48)B |
| Net asset value, end of period | $13.61 | $13.43 | $12.24 | $11.06 | $11.96 | $11.74 |
| Total ReturnC,D | 5.10% | 13.74% | 15.81% | (3.64)% | 7.15% | 15.61% |
| Ratios to Average Net AssetsE,F | | | | | | |
| Expenses before reductions | .75%G | .64% | - %H | - %H | - %H | - %H |
| Expenses net of fee waivers, if any | .75%G | .64% | -% | -% | -% | -% |
| Expenses net of all reductions | .75%G | .64% | -% | -% | -% | -% |
| Net investment income (loss) | .83%G | 1.05% | 1.49% | 1.56% | 1.64% | 1.36% |
| Supplemental Data | | | | | | |
| Net assets, end of period (000 omitted) | $308,854 | $249,432 | $165,720 | $119,597 | $87,769 | $54,490 |
| Portfolio turnover rateF | 30%G | 18% | 24% | 24% | 29% | 43% |
A Calculated based on average shares outstanding during the period.
B Total distributions of $.48 per share is comprised of distributions from net investment income of $.127 and distributions from net realized gain of $.355 per share.
C Total returns for periods of less than one year are not annualized.
D Total returns would have been lower if certain expenses had not been reduced during the applicable periods shown.
E Expense ratios reflect operating expenses of the class. Expenses before reductions do not reflect amounts reimbursed by the investment adviser or reductions from expense offset arrangements and do not represent the amount paid by the class during periods when reimbursements or reductions occur. Expenses net of fee waivers reflect expenses after reimbursement by the investment adviser but prior to reductions from expense offset arrangements. Expenses net of all reductions represent the net expenses paid by the class but do not include expenses of the underlying funds in which the Fund invests.
F Amounts do not include the activity of the Underlying Funds.
G Annualized
H Amount represents less than .005%.
See accompanying notes which are an integral part of the financial statements.
Fidelity Advisor Freedom 2055 Fund Class Z6
| | Six months ended (Unaudited) September 30, | Years endedMarch 31, |
| | 2018 | 2018 A |
| Selected Per–Share Data | | |
| Net asset value, beginning of period | $13.42 | $12.63 |
| Income from Investment Operations | | |
| Net investment income (loss)B | .07 | .47 |
| Net realized and unrealized gain (loss) | .61 | .69 |
| Total from investment operations | .68 | 1.16 |
| Distributions from net investment income | – | (.19) |
| Distributions from net realized gain | (.49) | (.18) |
| Total distributions | (.49) | (.37) |
| Net asset value, end of period | $13.61 | $13.42 |
| Total ReturnC,D | 5.18% | 9.16% |
| Ratios to Average Net AssetsE,F | | |
| Expenses before reductions | .49%G | .50%G,H |
| Expenses net of fee waivers, if any | .49%G | .50%G,H |
| Expenses net of all reductions | .49%G | .50%G,H |
| Net investment income (loss) | 1.08%G | 4.26%G |
| Supplemental Data | | |
| Net assets, end of period (000 omitted) | $8,450 | $3,116 |
| Portfolio turnover rateF | 30%G | 18% |
A For the period June 6, 2017 (commencement of sale of shares) to March 31, 2018.
B Calculated based on average shares outstanding during the period.
C Total returns for periods of less than one year are not annualized.
D Total returns would have been lower if certain expenses had not been reduced during the applicable periods shown.
E Expense ratios reflect operating expenses of the class. Expenses before reductions do not reflect amounts reimbursed by the investment adviser or reductions from expense offset arrangements and do not represent the amount paid by the class during periods when reimbursements or reductions occur. Expenses net of fee waivers reflect expenses after reimbursement by the investment adviser but prior to reductions from expense offset arrangements. Expenses net of all reductions represent the net expenses paid by the class but do not include expenses of the underlying funds in which the Fund invests.
F Amounts do not include the activity of the Underlying Funds.
G Annualized
H On certain classes, the size and fluctuation of net assets and expense amounts may cause ratios to differ from contractual rates.
See accompanying notes which are an integral part of the financial statements.
Fidelity Advisor Freedom® 2060 Fund
Investment Summary (Unaudited)
The information in the following tables is based on the direct investments of the Fund.
Top Holdings as of September 30, 2018
| | % of fund's net assets |
| Fidelity Series Large Cap Stock Fund | 12.2 |
| Fidelity Series International Growth Fund | 9.3 |
| Fidelity Series International Value Fund | 9.2 |
| Fidelity Series Emerging Markets Opportunities Fund | 8.6 |
| Fidelity Series Stock Selector Large Cap Value Fund | 7.8 |
| Fidelity Series Value Discovery Fund | 7.7 |
| Fidelity Advisor Series Equity Growth Fund | 7.0 |
| Fidelity Series Opportunistic Insights Fund | 6.5 |
| Fidelity Advisor Series Growth Opportunities Fund | 4.8 |
| Fidelity Series Small Cap Opportunities Fund | 4.2 |
| | 77.3 |
Asset Allocation (% of fund's net assets)
| Period end |
| | Domestic Equity Funds | 60.5% |
| | International Equity Funds | 30.8% |
| | Bond Funds | 6.8% |
| | Short-Term Funds | 1.9% |
| | Short-Term Investments | 0.1% |
| | Net Other Assets (Liabilities)* | (0.1)% |

* Net Other Assets (Liabilities) are not included in the pie chart
Domestic Equity Funds category includes Fidelity Series Commodity Strategy Fund which invests in commodity-related investments.
Fidelity Advisor Freedom® 2060 Fund
Schedule of Investments September 30, 2018 (Unaudited)
Showing Percentage of Net Assets
| U.S. Treasury Obligations - 0.1% | | | |
| | | Principal Amount | Value |
| U.S. Treasury Bills, yield at date of purchase 2.07% to 2.09% 11/23/18 to 11/29/18 (a) | | | |
| (Cost $89,701) | | 90,000 | 89,695 |
| | | Shares | Value |
|
| Domestic Equity Funds - 60.5% | | | |
| Fidelity Advisor Series Equity Growth Fund (b) | | 586,688 | $9,070,193 |
| Fidelity Advisor Series Growth Opportunities Fund (b) | | 367,926 | 6,122,290 |
| Fidelity Advisor Series Small Cap Fund (b) | | 334,785 | 4,208,247 |
| Fidelity Series All-Sector Equity Fund (b) | | 335,985 | 4,572,761 |
| Fidelity Series Commodity Strategy Fund (b) | | 541,488 | 2,707,439 |
| Fidelity Series Large Cap Stock Fund (b) | | 990,361 | 15,776,445 |
| Fidelity Series Large Cap Value Index Fund (b) | | 125,604 | 1,657,976 |
| Fidelity Series Opportunistic Insights Fund (b) | | 424,641 | 8,429,122 |
| Fidelity Series Small Cap Opportunities Fund (b) | | 366,518 | 5,384,152 |
| Fidelity Series Stock Selector Large Cap Value Fund (b) | | 762,844 | 10,084,798 |
| Fidelity Series Value Discovery Fund (b) | | 725,590 | 9,933,325 |
| TOTAL DOMESTIC EQUITY FUNDS | | | |
| (Cost $72,445,463) | | | 77,946,748 |
|
| International Equity Funds - 30.8% | | | |
| Fidelity Series Canada Fund (b) | | 106,877 | 1,155,342 |
| Fidelity Series Emerging Markets Fund (b) | | 83,753 | 811,570 |
| Fidelity Series Emerging Markets Opportunities Fund (b) | | 577,403 | 11,080,356 |
| Fidelity Series International Growth Fund (b) | | 728,343 | 11,944,823 |
| Fidelity Series International Small Cap Fund (b) | | 157,421 | 2,817,832 |
| Fidelity Series International Value Fund (b) | | 1,128,233 | 11,869,008 |
| TOTAL INTERNATIONAL EQUITY FUNDS | | | |
| (Cost $37,314,098) | | | 39,678,931 |
|
| Bond Funds - 6.8% | | | |
| Fidelity Series Emerging Markets Debt Fund (b) | | 76,517 | 729,211 |
| Fidelity Series Floating Rate High Income Fund (b) | | 31,843 | 303,142 |
| Fidelity Series High Income Fund (b) | | 176,190 | 1,693,187 |
| Fidelity Series Inflation-Protected Bond Index Fund (b) | | 40,034 | 388,729 |
| Fidelity Series International Credit Fund (b) | | 3,119 | 30,657 |
| Fidelity Series Investment Grade Bond Fund (b) | | 52,551 | 572,284 |
| Fidelity Series Long-Term Treasury Bond Index Fund (b) | | 543,456 | 4,478,075 |
| Fidelity Series Real Estate Income Fund (b) | | 53,004 | 571,381 |
| TOTAL BOND FUNDS | | | |
| (Cost $8,928,677) | | | 8,766,666 |
|
| Short-Term Funds - 1.9% | | | |
| Fidelity Cash Central Fund, 2.11% (c) | | 221,452 | 221,497 |
| Fidelity Series Government Money Market Fund 2.12% (b)(d) | | 1,801,252 | 1,801,252 |
| Fidelity Series Short-Term Credit Fund (b) | | 40,481 | 399,145 |
| TOTAL SHORT-TERM FUNDS | | | |
| (Cost $2,424,346) | | | 2,421,894 |
| TOTAL INVESTMENT IN SECURITIES - 100.1% | | | |
| (Cost $121,202,285) | | | 128,903,934 |
| NET OTHER ASSETS (LIABILITIES) - (0.1)% | | | (68,430) |
| NET ASSETS - 100% | | | $128,835,504 |
| Futures Contracts | | | | | |
| | Number of contracts | Expiration Date | Notional Amount | Value | Unrealized Appreciation/(Depreciation) |
| Purchased | | | | | |
| Equity Index Contracts | | | | | |
| CME E-mini S&P 500 Index Contracts (United States) | 4 | Dec. 2018 | $583,800 | $113 | $113 |
| ICE E-mini MSCI Emerging Markets Index Contracts (United States) | 7 | Dec. 2018 | 367,395 | 7,311 | 7,311 |
| | | | | | 7,424 |
| Sold | | | | | |
| Equity Index Contracts | | | | | |
| ICE E-mini MSCI EAFE Index Contracts (United States) | 2 | Dec. 2018 | 197,550 | (202) | (202) |
| TOTAL FUTURES CONTRACTS | | | | | $7,222 |
The notional amount of futures purchased as a percentage of Net Assets is 0.7%
The notional amount of futures sold as a percentage of Net Assets is 0.2%
Legend
(a) Security or a portion of the security was pledged to cover margin requirements for futures contracts. At period end, the value of securities pledged amounted to $89,695.
(b) Affiliated Fund
(c) Affiliated fund that is generally available only to investment companies and other accounts managed by Fidelity Investments. The rate quoted is the annualized seven-day yield of the fund at period end. A complete unaudited listing of the fund's holdings as of its most recent quarter end is available upon request. In addition, each Fidelity Central Fund's financial statements are available on the SEC's website or upon request.
(d) The rate quoted is the annualized seven-day yield of the fund at period end.
Affiliated Central Funds
Information regarding fiscal year to date income earned by the Fund from investments in Fidelity Central Funds is as follows:
| Fund | Income earned |
| Fidelity Cash Central Fund | $564 |
| Total | $564 |
Amounts in the income column in the above table include any capital gain distributions from underlying funds, which are presented in the corresponding line-item in the Statement of Operations if applicable.
Affiliated Underlying Funds
Fiscal year to date information regarding the Fund's investments in affiliated Underlying Funds, excluding any Money Market Central Funds, is presented below. Exchanges between classes of the same affiliated Underlying Funds may occur.
| Affiliate | Value, beginning of period | Purchases | Sales Proceeds | Dividend Income | Realized Gain (loss) | Change in Unrealized appreciation (depreciation) | Value, end of period |
| Fidelity Advisor Series Equity Growth Fund | $6,288,635 | $2,206,223 | $446,808 | $-- | $2,256 | $1,019,887 | $9,070,193 |
| Fidelity Advisor Series Equity Value Fund | 7,280,061 | 2,863,215 | 506,547 | 315,375 | (6,329) | 30,552 | -- |
| Fidelity Advisor Series Growth & Income Fund | 11,166,059 | 4,992,960 | 775,814 | 1,232,411 | (8,249) | (462,261) | -- |
| Fidelity Advisor Series Growth Opportunities Fund | 4,124,065 | 1,448,488 | 656,216 | -- | 11,431 | 1,194,522 | 6,122,290 |
| Fidelity Advisor Series Opportunistic Insights Fund | 5,834,760 | 2,587,956 | 411,083 | 604,806 | (1,541) | (483,852) | -- |
| Fidelity Advisor Series Small Cap Fund | 3,146,914 | 1,083,172 | 218,027 | -- | 128 | 196,060 | 4,208,247 |
| Fidelity Advisor Series Stock Selector Large Cap Value Fund | 7,352,294 | 3,217,852 | 506,995 | 790,396 | (7,650) | 80,511 | -- |
| Fidelity Series 100 Index Fund | 3,048,825 | -- | 3,273,763 | -- | 568,572 | (343,634) | -- |
| Fidelity Series All-Sector Equity Fund | 4,321,439 | 1,455,852 | 1,768,067 | -- | 3,874 | 559,663 | 4,572,761 |
| Fidelity Series Canada Fund | 856,840 | 299,526 | 58,514 | -- | (418) | 57,908 | 1,155,342 |
| Fidelity Series Commodity Strategy Fund | 2,033,402 | 1,021,578 | 135,360 | 158,317 | (4,006) | (208,175) | 2,707,439 |
| Fidelity Series Emerging Markets Debt Fund | 582,422 | 220,386 | 39,360 | 19,825 | (2,307) | (31,930) | 729,211 |
| Fidelity Series Emerging Markets Fund | -- | 812,093 | -- | -- | -- | (523) | 811,570 |
| Fidelity Series Emerging Markets Opportunities Fund | 8,861,174 | 4,576,915 | 1,107,121 | -- | (74,022) | (1,176,590) | 11,080,356 |
| Fidelity Series Floating Rate High Income Fund | 232,073 | 87,089 | 16,401 | 7,171 | (177) | 558 | 303,142 |
| Fidelity Series Government Money Market Fund 2.12% | 1,561,672 | 2,198,795 | 1,959,215 | 14,278 | -- | -- | 1,801,252 |
| Fidelity Series High Income Fund | 1,351,010 | 457,047 | 127,616 | 44,166 | (222) | 12,968 | 1,693,187 |
| Fidelity Series Inflation-Protected Bond Index Fund | 790,717 | 312,709 | 718,437 | 1,334 | (8,182) | 11,922 | 388,729 |
| Fidelity Series International Credit Fund | 30,588 | 377 | -- | 377 | -- | (308) | 30,657 |
| Fidelity Series International Growth Fund | 8,611,222 | 3,764,896 | 586,906 | -- | (4,978) | 160,589 | 11,944,823 |
| Fidelity Series International Small Cap Fund | 2,147,956 | 917,282 | 152,569 | -- | (4,760) | (90,077) | 2,817,832 |
| Fidelity Series International Value Fund | 8,722,314 | 3,741,094 | 586,906 | -- | (27,911) | 20,417 | 11,869,008 |
| Fidelity Series Investment Grade Bond Fund | 462,499 | 235,670 | 120,176 | 7,648 | (1,540) | (4,169) | 572,284 |
| Fidelity Series Large Cap Stock Fund | -- | 196,365 | -- | -- | -- | 667,385 | 15,776,445 |
| Fidelity Series Large Cap Value Index Fund | 1,220,452 | 423,676 | 85,217 | -- | (454) | 99,519 | 1,657,976 |
| Fidelity Series Long-Term Treasury Bond Index Fund | 2,189,125 | 3,427,720 | 999,279 | 51,073 | (29,790) | (109,701) | 4,478,075 |
| Fidelity Series Opportunistic Insights Fund | -- | 105,781 | -- | -- | -- | 797,101 | 8,429,122 |
| Fidelity Series Real Estate Equity Fund | 730,473 | 46,531 | 807,279 | 3,914 | (29,795) | 60,070 | -- |
| Fidelity Series Real Estate Income Fund | 427,825 | 172,507 | 30,831 | 22,262 | (204) | 2,084 | 571,381 |
| Fidelity Series Short-Term Credit Fund | 295,984 | 125,546 | 22,417 | 4,008 | (160) | 192 | 399,145 |
| Fidelity Series Small Cap Opportunities Fund | 3,829,440 | 1,744,809 | 270,161 | 405,740 | 1,079 | 78,985 | 5,384,152 |
| Fidelity Series Stock Selector Large Cap Value Fund | -- | 248,981 | 1,449 | -- | (99) | (298,647) | 10,084,798 |
| Fidelity Series Value Discovery Fund | -- | 126,204 | -- | -- | -- | 146,169 | 9,933,325 |
| | $97,500,240 | $45,119,295 | $16,388,534 | $3,683,101 | $374,546 | $1,987,195 | $128,592,742 |
Amounts in the income column in the above table include any capital gain distributions from underlying funds, which are presented in the corresponding line-item in the Statement of Operations if applicable.
Investment Valuation
The following is a summary of the inputs used, as of September 30, 2018, involving the Fund's assets and liabilities carried at fair value. The inputs or methodology used for valuing securities may not be an indication of the risk associated with investing in those securities. For more information on valuation inputs, and their aggregation into the levels used below, please refer to the Investment Valuation section in the accompanying Notes to Financial Statements.
| | Valuation Inputs at Reporting Date: |
| Description | Total | Level 1 | Level 2 | Level 3 |
| Investments in Securities: | | | | |
| Other Short-Term Investments | $89,695 | $-- | $89,695 | $-- |
| Domestic Equity Funds | 77,946,748 | 77,946,748 | -- | -- |
| International Equity Funds | 39,678,931 | 39,678,931 | -- | -- |
| Bond Funds | 8,766,666 | 8,766,666 | -- | -- |
| Short-Term Funds | 2,421,894 | 2,421,894 | -- | -- |
| Total Investments in Securities: | $128,903,934 | $128,814,239 | $89,695 | $-- |
| Derivative Instruments: | | | | |
| Assets | | | | |
| Futures Contracts | $7,424 | $7,424 | $-- | $-- |
| Total Assets | $7,424 | $7,424 | $-- | $-- |
| Liabilities | | | | |
| Futures Contracts | $(202) | $(202) | $-- | $-- |
| Total Liabilities | $(202) | $(202) | $-- | $-- |
| Total Derivative Instruments: | $7,222 | $7,222 | $-- | $-- |
Value of Derivative Instruments
The following table is a summary of the Fund's value of derivative instruments by primary risk exposure as of September 30, 2018. For additional information on derivative instruments, please refer to the Derivative Instruments section in the accompanying Notes to Financial Statements.
| Primary Risk Exposure / Derivative Type | Value |
| | Asset | Liability |
| Equity Risk | | |
| Futures Contracts(a) | $7,424 | $(202) |
| Total Equity Risk | 7,424 | (202) |
| Total Value of Derivatives | $7,424 | $(202) |
(a) Reflects gross cumulative appreciation (depreciation) on futures contracts as presented in the Schedule of Investments. In the Statement of Assets and Liabilities, the period end daily variation margin is included in receivable or payable for daily variation margin on futures contracts, and the net cumulative appreciation (depreciation) is included in net unrealized appreciation (depreciation).
See accompanying notes which are an integral part of the financial statements.
Fidelity Advisor Freedom® 2060 Fund
Financial Statements
Statement of Assets and Liabilities
| | | September 30, 2018 (Unaudited) |
| Assets | | |
Investment in securities, at value — See accompanying schedule:
Unaffiliated issuers (cost $89,701) | $89,695 | |
| Fidelity Central Funds (cost $221,497) | 221,497 | |
| Other affiliated issuers (cost $120,891,087) | 128,592,742 | |
| Total Investment in Securities (cost $121,202,285) | | $128,903,934 |
| Cash | | 32,588 |
| Receivable for investments sold | | 1,427,979 |
| Receivable for fund shares sold | | 580,468 |
| Distributions receivable from Fidelity Central Funds | | 353 |
| Total assets | | 130,945,322 |
| Liabilities | | |
| Payable for investments purchased | $1,935,480 | |
| Payable for fund shares redeemed | 72,883 | |
| Accrued management fee | 77,565 | |
| Distribution and service plan fees payable | 19,105 | |
| Payable for daily variation margin on futures contracts | 4,785 | |
| Total liabilities | | 2,109,818 |
| Net Assets | | $128,835,504 |
| Net Assets consist of: | | |
| Paid in capital | | $118,073,601 |
| Undistributed net investment income | | 312,168 |
| Accumulated undistributed net realized gain (loss) on investments | | 2,740,864 |
| Net unrealized appreciation (depreciation) on investments | | 7,708,871 |
| Net Assets | | $128,835,504 |
| Calculation of Maximum Offering Price | | |
| Class A: | | |
| Net Asset Value and redemption price per share ($47,044,037 ÷ 3,896,952 shares) | | $12.07 |
| Maximum offering price per share (100/94.25 of $12.07) | | $12.81 |
| Class M: | | |
| Net Asset Value and redemption price per share ($16,676,187 ÷ 1,383,939 shares) | | $12.05 |
| Maximum offering price per share (100/96.50 of $12.05) | | $12.49 |
| Class C: | | |
| Net Asset Value and offering price per share ($3,385,937 ÷ 281,214 shares)(a) | | $12.04 |
| Class I: | | |
| Net Asset Value, offering price and redemption price per share ($59,972,753 ÷ 4,944,269 shares) | | $12.13 |
| Class Z6: | | |
| Net Asset Value, offering price and redemption price per share ($1,756,590 ÷ 144,654 shares) | | $12.14 |
(a) Redemption price per share is equal to net asset value less any applicable contingent deferred sales charge.
See accompanying notes which are an integral part of the financial statements.
Statement of Operations
| | | Six months ended September 30, 2018 (Unaudited) |
| Investment Income | | |
| Dividends: | | |
| Affiliated issuers | | $930,564 |
| Interest | | 490 |
| Income from Fidelity Central Funds | | 564 |
| Total income | | 931,618 |
| Expenses | | |
| Management fee | $423,105 | |
| Distribution and service plan fees | 103,973 | |
| Independent trustees' fees and expenses | 258 | |
| Total expenses | | 527,336 |
| Net investment income (loss) | | 404,282 |
| Realized and Unrealized Gain (Loss) | | |
| Net realized gain (loss) on: | | |
| Investment securities: | | |
| Affiliated issuers | 374,546 | |
| Futures contracts | (28,440) | |
| Capital gain distributions from underlying funds: | | |
| Affiliated issuers | 2,752,537 | |
| Total net realized gain (loss) | | 3,098,643 |
| Change in net unrealized appreciation (depreciation) on: | | |
| Investment securities: | | |
| Unaffiliated issuers | (6) | |
| Affiliated issuers | 1,987,195 | |
| Futures contracts | 7,222 | |
| Total change in net unrealized appreciation (depreciation) | | 1,994,411 |
| Net gain (loss) | | 5,093,054 |
| Net increase (decrease) in net assets resulting from operations | | $5,497,336 |
See accompanying notes which are an integral part of the financial statements.
Statement of Changes in Net Assets
| | Six months ended September 30, 2018 (Unaudited) | Year ended March 31, 2018 |
| Increase (Decrease) in Net Assets | | |
| Operations | | |
| Net investment income (loss) | $404,282 | $632,280 |
| Net realized gain (loss) | 3,098,643 | 4,117,080 |
| Change in net unrealized appreciation (depreciation) | 1,994,411 | 2,766,010 |
| Net increase (decrease) in net assets resulting from operations | 5,497,336 | 7,515,370 |
| Distributions to shareholders from net investment income | – | (781,225) |
| Distributions to shareholders from net realized gain | (3,236,416) | (1,302,479) |
| Total distributions | (3,236,416) | (2,083,704) |
| Share transactions - net increase (decrease) | 29,148,448 | 48,422,056 |
| Total increase (decrease) in net assets | 31,409,368 | 53,853,722 |
| Net Assets | | |
| Beginning of period | 97,426,136 | 43,572,414 |
| End of period | $128,835,504 | $97,426,136 |
| Other Information | | |
| Undistributed net investment income end of period | $312,168 | $– |
| Distributions in excess of net investment income end of period | $– | $(92,114) |
See accompanying notes which are an integral part of the financial statements.
Financial Highlights
Fidelity Advisor Freedom 2060 Fund Class A
| | Six months ended (Unaudited) September 30, | Years endedMarch 31, | | | |
| | 2018 | 2018 | 2017 | 2016 | 2015 A |
| Selected Per–Share Data | | | | | |
| Net asset value, beginning of period | $11.86 | $10.76 | $9.62 | $10.34 | $10.00 |
| Income from Investment Operations | | | | | |
| Net investment income (loss)B | .04 | .10 | .13 | .12 | .15 |
| Net realized and unrealized gain (loss) | .54 | 1.34 | 1.33 | (.51) | .37 |
| Total from investment operations | .58 | 1.44 | 1.46 | (.39) | .52 |
| Distributions from net investment income | – | (.11) | (.12) | (.11) | (.10) |
| Distributions from net realized gain | (.37) | (.23) | (.20) | (.22) | (.08) |
| Total distributions | (.37) | (.34) | (.32) | (.33) | (.18) |
| Net asset value, end of period | $12.07 | $11.86 | $10.76 | $9.62 | $10.34 |
| Total ReturnC,D,E | 4.95% | 13.44% | 15.55% | (3.89)% | 5.24% |
| Ratios to Average Net AssetsF,G | | | | | |
| Expenses before reductions | 1.00%H | .91% | .25% | .25% | .25%H |
| Expenses net of fee waivers, if any | 1.00%H | .91% | .25% | .25% | .25%H |
| Expenses net of all reductions | 1.00%H | .91% | .25% | .25% | .25%H |
| Net investment income (loss) | .64%H | .84% | 1.30% | 1.29% | 2.24%H |
| Supplemental Data | | | | | |
| Net assets, end of period (000 omitted) | $47,044 | $37,880 | $18,482 | $9,058 | $2,267 |
| Portfolio turnover rateG | 29%H | 16% | 32% | 64% | 47%H |
A For the period August 5, 2014 (commencement of operations) to March 31, 2015.
B Calculated based on average shares outstanding during the period.
C Total returns for periods of less than one year are not annualized.
D Total returns would have been lower if certain expenses had not been reduced during the applicable periods shown.
E Total returns do not include the effect of the sales charges.
F Expense ratios reflect operating expenses of the class. Expenses before reductions do not reflect amounts reimbursed by the investment adviser or reductions from expense offset arrangements and do not represent the amount paid by the class during periods when reimbursements or reductions occur. Expenses net of fee waivers reflect expenses after reimbursement by the investment adviser but prior to reductions from expense offset arrangements. Expenses net of all reductions represent the net expenses paid by the class but do not include expenses of the underlying funds in which the Fund invests.
G Amounts do not include the activity of the Underlying Funds.
H Annualized
See accompanying notes which are an integral part of the financial statements.
Fidelity Advisor Freedom 2060 Fund Class M
| | Six months ended (Unaudited) September 30, | Years endedMarch 31, | | | |
| | 2018 | 2018 | 2017 | 2016 | 2015 A |
| Selected Per–Share Data | | | | | |
| Net asset value, beginning of period | $11.85 | $10.77 | $9.63 | $10.33 | $10.00 |
| Income from Investment Operations | | | | | |
| Net investment income (loss)B | .02 | .07 | .11 | .10 | .13 |
| Net realized and unrealized gain (loss) | .55 | 1.33 | 1.33 | (.51) | .38 |
| Total from investment operations | .57 | 1.40 | 1.44 | (.41) | .51 |
| Distributions from net investment income | – | (.10) | (.10) | (.08) | (.09) |
| Distributions from net realized gain | (.37) | (.22) | (.20) | (.21) | (.08) |
| Total distributions | (.37) | (.32) | (.30) | (.29) | (.18)C |
| Net asset value, end of period | $12.05 | $11.85 | $10.77 | $9.63 | $10.33 |
| Total ReturnD,E,F | 4.87% | 13.04% | 15.29% | (4.09)% | 5.07% |
| Ratios to Average Net AssetsG,H | | | | | |
| Expenses before reductions | 1.25%I | 1.16% | .50% | .50% | .51%I,J |
| Expenses net of fee waivers, if any | 1.25%I | 1.16% | .50% | .50% | .51%I,J |
| Expenses net of all reductions | 1.25%I | 1.16% | .50% | .50% | .51%I,J |
| Net investment income (loss) | .39%I | .59% | 1.05% | 1.04% | 1.98%I |
| Supplemental Data | | | | | |
| Net assets, end of period (000 omitted) | $16,676 | $12,628 | $5,719 | $3,189 | $2,062 |
| Portfolio turnover rateH | 29%I | 16% | 32% | 64% | 47%I |
A For the period August 5, 2014 (commencement of operations) to March 31, 2015.
B Calculated based on average shares outstanding during the period.
C Total distributions of $.18 per share is comprised of distributions from net investment income of $.094 and distributions from net realized gain of $.081 per share.
D Total returns for periods of less than one year are not annualized.
E Total returns would have been lower if certain expenses had not been reduced during the applicable periods shown.
F Total returns do not include the effect of the sales charges.
G Expense ratios reflect operating expenses of the class. Expenses before reductions do not reflect amounts reimbursed by the investment adviser or reductions from expense offset arrangements and do not represent the amount paid by the class during periods when reimbursements or reductions occur. Expenses net of fee waivers reflect expenses after reimbursement by the investment adviser but prior to reductions from expense offset arrangements. Expenses net of all reductions represent the net expenses paid by the class but do not include expenses of the underlying funds in which the Fund invests.
H Amounts do not include the activity of the Underlying Funds.
I Annualized
J On certain classes, the size and fluctuation of net assets and expense amounts may cause ratios to differ from contractual rates.
See accompanying notes which are an integral part of the financial statements.
Fidelity Advisor Freedom 2060 Fund Class C
| | Six months ended (Unaudited) September 30, | Years endedMarch 31, | | | |
| | 2018 | 2018 | 2017 | 2016 | 2015 A |
| Selected Per–Share Data | | | | | |
| Net asset value, beginning of period | $11.87 | $10.81 | $9.68 | $10.31 | $10.00 |
| Income from Investment Operations | | | | | |
| Net investment income (loss)B | (.01) | .01 | .06 | .05 | .10 |
| Net realized and unrealized gain (loss) | .55 | 1.34 | 1.33 | (.51) | .38 |
| Total from investment operations | .54 | 1.35 | 1.39 | (.46) | .48 |
| Distributions from net investment income | – | (.07) | (.06) | – | (.08) |
| Distributions from net realized gain | (.37) | (.22) | (.20) | (.17) | (.08) |
| Total distributions | (.37) | (.29) | (.26) | (.17) | (.17)C |
| Net asset value, end of period | $12.04 | $11.87 | $10.81 | $9.68 | $10.31 |
| Total ReturnD,E,F | 4.60% | 12.53% | 14.65% | (4.60)% | 4.77% |
| Ratios to Average Net AssetsG,H | | | | | |
| Expenses before reductions | 1.75%I | 1.66% | 1.00% | .99%J | 1.02%I,J |
| Expenses net of fee waivers, if any | 1.75%I | 1.66% | 1.00% | .99%J | 1.02%I,J |
| Expenses net of all reductions | 1.75%I | 1.66% | 1.00% | .99%J | 1.02%I,J |
| Net investment income (loss) | (.11)%I | .09% | .55% | .55% | 1.47%I |
| Supplemental Data | | | | | |
| Net assets, end of period (000 omitted) | $3,386 | $2,604 | $1,209 | $1,292 | $1,322 |
| Portfolio turnover rateH | 29%I | 16% | 32% | 64% | 47%I |
A For the period August 5, 2014 (commencement of operations) to March 31, 2015.
B Calculated based on average shares outstanding during the period.
C Total distributions of $.17 per share is comprised of distributions from net investment income of $.084 and distributions from net realized gain of $.081 per share.
D Total returns for periods of less than one year are not annualized.
E Total returns would have been lower if certain expenses had not been reduced during the applicable periods shown.
F Total returns do not include the effect of the contingent deferred sales charge.
G Expense ratios reflect operating expenses of the class. Expenses before reductions do not reflect amounts reimbursed by the investment adviser or reductions from expense offset arrangements and do not represent the amount paid by the class during periods when reimbursements or reductions occur. Expenses net of fee waivers reflect expenses after reimbursement by the investment adviser but prior to reductions from expense offset arrangements. Expenses net of all reductions represent the net expenses paid by the class but do not include expenses of the underlying funds in which the Fund invests.
H Amounts do not include the activity of the Underlying Funds.
I Annualized
J On certain classes, the size and fluctuation of net assets and expense amounts may cause ratios to differ from contractual rates.
See accompanying notes which are an integral part of the financial statements.
Fidelity Advisor Freedom 2060 Fund Class I
| | Six months ended (Unaudited) September 30, | Years endedMarch 31, | | | |
| | 2018 | 2018 | 2017 | 2016 | 2015 A |
| Selected Per–Share Data | | | | | |
| Net asset value, beginning of period | $11.90 | $10.80 | $9.65 | $10.35 | $10.00 |
| Income from Investment Operations | | | | | |
| Net investment income (loss)B | .05 | .13 | .16 | .15 | .17 |
| Net realized and unrealized gain (loss) | .55 | 1.33 | 1.33 | (.50) | .37 |
| Total from investment operations | .60 | 1.46 | 1.49 | (.35) | .54 |
| Distributions from net investment income | – | (.13) | (.13) | (.12) | (.10) |
| Distributions from net realized gain | (.37) | (.23) | (.20) | (.23) | (.08) |
| Total distributions | (.37) | (.36) | (.34)C | (.35) | (.19)D |
| Net asset value, end of period | $12.13 | $11.90 | $10.80 | $9.65 | $10.35 |
| Total ReturnE,F | 5.11% | 13.63% | 15.82% | (3.54)% | 5.38% |
| Ratios to Average Net AssetsG,H | | | | | |
| Expenses before reductions | .75%I | .66% | - %J | - %J | - %I,J |
| Expenses net of fee waivers, if any | .75%I | .66% | -% | -% | - %I |
| Expenses net of all reductions | .75%I | .66% | -% | -% | - %I |
| Net investment income (loss) | .89%I | 1.09% | 1.55% | 1.54% | 2.49%I |
| Supplemental Data | | | | | |
| Net assets, end of period (000 omitted) | $59,973 | $43,513 | $18,162 | $5,845 | $399 |
| Portfolio turnover rateH | 29%I | 16% | 32% | 64% | 47%I |
A For the period August 5, 2014 (commencement of operations) to March 31, 2015.
B Calculated based on average shares outstanding during the period.
C Total distributions of $.34 per share is comprised of distributions from net investment income of $.132 and distributions from net realized gain of $.204 per share.
D Total distributions of $.19 per share is comprised of distributions from net investment income of $.104 and distributions from net realized gain of $.081 per share.
E Total returns for periods of less than one year are not annualized.
F Total returns would have been lower if certain expenses had not been reduced during the applicable periods shown.
G Expense ratios reflect operating expenses of the class. Expenses before reductions do not reflect amounts reimbursed by the investment adviser or reductions from expense offset arrangements and do not represent the amount paid by the class during periods when reimbursements or reductions occur. Expenses net of fee waivers reflect expenses after reimbursement by the investment adviser but prior to reductions from expense offset arrangements. Expenses net of all reductions represent the net expenses paid by the class but do not include expenses of the underlying funds in which the Fund invests.
H Amounts do not include the activity of the Underlying Funds.
I Annualized
J Amount represents less than .005%.
See accompanying notes which are an integral part of the financial statements.
Fidelity Advisor Freedom 2060 Fund Class Z6
| | Six months ended (Unaudited) September 30, | Years endedMarch 31, |
| | 2018 | 2018 A |
| Selected Per–Share Data | | |
| Net asset value, beginning of period | $11.90 | $11.16 |
| Income from Investment Operations | | |
| Net investment income (loss)B | .07 | .33 |
| Net realized and unrealized gain (loss) | .54 | .69 |
| Total from investment operations | .61 | 1.02 |
| Distributions from net investment income | – | (.16) |
| Distributions from net realized gain | (.37) | (.13) |
| Total distributions | (.37) | (.28)C |
| Net asset value, end of period | $12.14 | $11.90 |
| Total ReturnD,E | 5.19% | 9.14% |
| Ratios to Average Net AssetsF,G | | |
| Expenses before reductions | .49%H | .50%H,I |
| Expenses net of fee waivers, if any | .49%H | .50%H,I |
| Expenses net of all reductions | .49%H | .50%H,I |
| Net investment income (loss) | 1.14%H | 3.41%H |
| Supplemental Data | | |
| Net assets, end of period (000 omitted) | $1,757 | $802 |
| Portfolio turnover rateG | 29%H | 16% |
A For the period June 6, 2017 (commencement of sale of shares) to March 31, 2018.
B Calculated based on average shares outstanding during the period.
C Total distributions of $.28 per share is comprised of distributions from net investment income of $.155 and distributions from net realized gain of $.127 per share.
D Total returns for periods of less than one year are not annualized.
E Total returns would have been lower if certain expenses had not been reduced during the applicable periods shown.
F Expense ratios reflect operating expenses of the class. Expenses before reductions do not reflect amounts reimbursed by the investment adviser or reductions from expense offset arrangements and do not represent the amount paid by the class during periods when reimbursements or reductions occur. Expenses net of fee waivers reflect expenses after reimbursement by the investment adviser but prior to reductions from expense offset arrangements. Expenses net of all reductions represent the net expenses paid by the class but do not include expenses of the underlying funds in which the Fund invests.
G Amounts do not include the activity of the Underlying Funds.
H Annualized
I On certain classes, the size and fluctuation of net assets and expense amounts may cause ratios to differ from contractual rates.
See accompanying notes which are an integral part of the financial statements.
Notes to Financial Statements (Unaudited)
For the period ended September 30, 2018
1. Organization.
Fidelity Advisor Freedom Income Fund, Fidelity Advisor Freedom 2005 Fund, Fidelity Advisor Freedom 2010 Fund, Fidelity Advisor Freedom 2015 Fund, Fidelity Advisor Freedom 2020 Fund, Fidelity Advisor Freedom 2025 Fund, Fidelity Advisor Freedom 2030 Fund, Fidelity Advisor Freedom 2035 Fund, Fidelity Advisor Freedom 2040 Fund, Fidelity Advisor Freedom 2045 Fund, Fidelity Advisor Freedom 2050 Fund, Fidelity Advisor Freedom 2055 Fund and Fidelity Advisor Freedom 2060 Fund (the Funds) are funds of Fidelity Aberdeen Street Trust (the Trust). The Trust is registered under the Investment Company Act of 1940, as amended (the 1940 Act), as an open-end management investment company organized as a Delaware statutory trust. Each Fund is authorized to issue an unlimited number of shares. Each Fund offers Class A, Class M, Class C, Class I and Class Z6 shares, each of which has equal rights as to assets and voting privileges. Each class has exclusive voting rights with respect to matters that affect that class. The Funds invest primarily in a combination of other Fidelity equity, bond, and short-term funds (the Underlying Funds) managed by Fidelity Management & Research Company (FMR). Certain Underlying Funds incurred name changes since their most recent shareholder report. The names of the Underlying Funds are those in effect at period end. In the prior year, the Funds transitioned their portfolios to invest exclusively in classes of the Fidelity Series funds, offered only to certain other Fidelity funds advised by FMR or its affiliates.
2. Investments in Fidelity Central Funds.
The Funds invest in Fidelity Central Funds, which are open-end investment companies generally available only to other investment companies and accounts managed by the investment adviser and its affiliates. The Funds' Schedules of Investments list each of the Fidelity Central Funds held as of period end, if any, as an investment of each Fund, but does not include the underlying holdings of each Fidelity Central Fund. As an Investing Fund, each Fund indirectly bears its proportionate share of the expenses of the underlying Fidelity Central Funds.
The Money Market Central Funds seek preservation of capital and current income and are managed by Fidelity Investments Money Management, Inc. (FIMM), an affiliate of the investment adviser. Annualized expenses of the Money Market Central Funds as of their most recent shareholder report date are less than .005%.
A complete unaudited list of holdings for each Fidelity Central Fund is available upon request or at the Securities and Exchange Commission (the SEC) website at www.sec.gov. In addition, the financial statements of the Fidelity Central Funds are available on the SEC website or upon request.
3. Significant Accounting Policies.
Each Fund is an investment company and applies the accounting and reporting guidance of the Financial Accounting Standards Board (FASB) Accounting Standards Codification Topic 946 Financial Services – Investments Companies. The financial statements have been prepared in conformity with accounting principles generally accepted in the United States of America (GAAP), which require management to make certain estimates and assumptions at the date of the financial statements. Actual results could differ from those estimates. Subsequent events, if any, through the date that the financial statements were issued have been evaluated in the preparation of the financial statements. The following summarizes the significant accounting policies of the Funds:
Investment Valuation. Investments are valued as of 4:00 p.m. Eastern time on the last calendar day of the period. The Board of Trustees (the Board) has delegated the day to day responsibility for the valuation of each Fund's investments to the Fair Value Committee (the Committee) established by the each Fund's investment adviser. In accordance with valuation policies and procedures approved by the Board, each Fund attempts to obtain prices from one or more third party pricing vendors or brokers to value its investments. When current market prices, quotations or currency exchange rates are not readily available or reliable, investments will be fair valued in good faith by the Committee, in accordance with procedures adopted by the Board. Factors used in determining fair value vary by investment type and may include market or investment specific events, changes in interest rates and credit quality. The frequency with which these procedures are used cannot be predicted and they may be utilized to a significant extent. The Committee oversees each Fund's valuation policies and procedures and reports to the Board on the Committee's activities and fair value determinations. The Board monitors the appropriateness of the procedures used in valuing each Fund's investments and ratifies the fair value determinations of the Committee. Each Fund categorizes the inputs to valuation techniques used to value its investments into a disclosure hierarchy consisting of three levels as shown below:
- Level 1 – quoted prices in active markets for identical investments
- Level 2 – other significant observable inputs (including quoted prices for similar investments, interest rates, prepayment speeds, etc.)
- Level 3 – unobservable inputs (including the Fund's own assumptions based on the best information available)
Valuation techniques used to value each Fund's investments by major category are as follows. Investments in the Underlying Funds are valued at their closing net asset value (NAV) each business day and are categorized as Level 1 in the hierarchy. Debt securities, including restricted securities, are valued based on evaluated prices received from third party pricing vendors or from brokers who make markets in such securities. U.S. government and government agency obligations are valued by pricing vendors who utilize matrix pricing which considers yield or price of bonds of comparable quality, coupon, maturity and type or by broker-supplied prices. When independent prices are unavailable or unreliable, debt securities may be valued utilizing pricing methodologies which consider similar factors that would be used by third party pricing vendors. Debt securities are generally categorized as Level 2 in the hierarchy but may be Level 3 depending on the circumstances.
Futures contracts are valued at the settlement price established each day by the board of trade or exchange on which they are traded and are categorized as Level 1 in the hierarchy.
Investment Transactions and Income. For financial reporting purposes, the Funds' investment holdings and NAV include trades executed through the end of the last business day of the period. The NAV per share for processing shareholder transactions is calculated as of the close of business of the New York Stock Exchange (NYSE), normally 4:00 p.m. Eastern time and includes trades executed through the end of the prior business day. Gains and losses on securities sold are determined on the basis of identified cost. Income and capital gain distributions from the Underlying Funds, if any, are recorded on the ex-dividend date. Interest income is accrued as earned. Interest income includes coupon interest and amortization of premium and accretion of discount on debt securities as applicable.
Class Allocations and Expenses. Investment income, realized and unrealized capital gains and losses, common expenses of each Fund, and certain fund-level expense reductions, if any, are allocated daily on a pro-rata basis to each class based on the relative net assets of each class to the total net assets of each Fund. Each class differs with respect to distribution and service plan fees incurred. Certain expense reductions may also differ by class. For the reporting period, the allocated portion of income and expenses to each class as a percent of its average net assets may vary due to the timing of recording these transactions in relation to fluctuating net assets of the classes. Expenses directly attributable to a fund are charged to that fund. Expenses attributable to more than one fund are allocated among the respective funds on the basis of relative net assets or other appropriate methods. Expenses included in the accompanying financial statements reflect the expenses of each Fund and do not include any expenses associated with the Underlying Funds. Although not included in each Fund's expenses, each Fund indirectly bears its proportionate share of the Underlying Funds' expenses through the impact of these expenses on each Underlying Fund's NAV. Expense estimates are accrued in the period to which they relate and adjustments are made when actual amounts are known.
Income Tax Information and Distributions to Shareholders. Each year, each Fund intends to qualify as a regulated investment company under Subchapter M of the Internal Revenue Code, including distributing substantially all of its taxable income and realized gains. As a result, no provision for U.S. Federal income taxes is required. Each Fund files a U.S. federal tax return, in addition to state and local tax returns as required. Each Fund's federal income tax returns are subject to examination by the Internal Revenue Service (IRS) for a period of three fiscal years after they are filed. State and local tax returns may be subject to examination for an additional fiscal year depending on the jurisdiction.
Distributions are declared and recorded on the ex-dividend date. Income and capital gain distributions are declared separately for each class. Income and capital gain distributions are determined in accordance with income tax regulations, which may differ from GAAP.
Capital accounts within the financial statements are adjusted for permanent book-tax differences. These adjustments have no impact on net assets or the results of operations. Capital accounts are not adjusted for temporary book-tax differences which will reverse in a subsequent period.
Book-tax differences are primarily due to the short-term gain distributions from the Underlying Funds, futures contracts, market discount and losses deferred due to wash sales and excise tax regulations.
As of period end, the cost and unrealized appreciation (depreciation) in securities, and derivatives if applicable, for federal income tax purposes were as follows for each Fund:
| | Tax cost | Gross unrealized appreciation | Gross unrealized depreciation | Net unrealized appreciation (depreciation) |
| Advisor Freedom Income | $217,546,224 | $12,693,876 | $(3,328,002) | $9,365,874 |
| Advisor Freedom 2005 | 174,696,002 | 15,371,237 | (2,443,857) | 12,927,380 |
| Advisor Freedom 2010 | 408,526,262 | 47,426,523 | (4,884,554) | 42,541,969 |
| Advisor Freedom 2015 | 930,053,617 | 144,973,140 | (11,888,454) | 133,084,686 |
| Advisor Freedom 2020 | 2,124,994,731 | 361,101,254 | (34,334,456) | 326,766,798 |
| Advisor Freedom 2025 | 2,556,407,055 | 470,031,565 | (43,692,065) | 426,339,500 |
| Advisor Freedom 2030 | 2,542,150,551 | 543,512,062 | (37,275,219) | 506,236,843 |
| Advisor Freedom 2035 | 1,990,909,385 | 487,530,271 | (20,748,954) | 466,781,317 |
| Advisor Freedom 2040 | 1,808,464,369 | 457,994,813 | (18,041,015) | 439,953,798 |
| Advisor Freedom 2045 | 1,176,720,994 | 262,756,329 | (12,183,346) | 250,572,983 |
| Advisor Freedom 2050 | 962,959,480 | 207,052,309 | (10,117,456) | 196,934,853 |
| Advisor Freedom 2055 | 556,050,807 | 71,525,873 | (6,517,643) | 65,008,230 |
| Advisor Freedom 2060 | 121,617,270 | 9,016,654 | (1,722,768) | 7,293,886 |
4. Derivative Instruments.
Risk Exposures and the Use of Derivative Instruments. The Funds' investment objective allows the Funds to enter into various types of derivative contracts, including futures contracts. Derivatives are investments whose value is primarily derived from underlying assets, indices or reference rates and may be transacted on an exchange or over-the-counter (OTC). Derivatives may involve a future commitment to buy or sell a specified asset based on specified terms, to exchange future cash flows at periodic intervals based on a notional principal amount, or for one party to make one or more payments upon the occurrence of specified events in exchange for periodic payments from the other party.
The Funds used derivatives to increase returns and to manage exposure to certain risks as defined below. The success of any strategy involving derivatives depends on analysis of numerous economic factors, and if the strategies for investment do not work as intended, the Funds may not achieve their objectives.
The Funds' use of derivatives increased or decreased their exposure to the following risk:
| Equity Risk | Equity risk relates to the fluctuations in the value of financial instruments as a result of changes in market prices (other than those arising from interest rate risk or foreign exchange risk), whether caused by factors specific to an individual investment, its issuer, or all factors affecting all instruments traded in a market or market segment.
|
The Funds are also exposed to additional risks from investing in derivatives, such as liquidity risk and counterparty credit risk. Liquidity risk is the risk that the Funds will be unable to close out the derivative in the open market in a timely manner. Counterparty credit risk is the risk that the counterparty will not be able to fulfill its obligation to the Funds. Counterparty credit risk related to exchange-traded futures contracts may be mitigated by the protection provided by the exchange on which they trade.
Investing in derivatives may involve greater risks than investing in the underlying assets directly and, to varying degrees, may involve risk of loss in excess of any initial investment and collateral received and amounts recognized in the Statement of Assets and Liabilities. In addition, there may be the risk that the change in value of the derivative contract does not correspond to the change in value of the underlying instrument.
Futures Contracts. A futures contract is an agreement between two parties to buy or sell a specified underlying instrument for a fixed price at a specified future date. The Funds used futures contracts to manage their exposure to the stock market.
Upon entering into a futures contract, a fund is required to deposit either cash or securities (initial margin) with a clearing broker in an amount equal to a certain percentage of the face value of the contract. Futures contracts are marked-to-market daily and subsequent daily payments (variation margin) are made or received by a fund depending on the daily fluctuations in the value of the futures contracts and are recorded as unrealized appreciation or (depreciation). This receivable and/or payable, if any, is included in daily variation margin on futures contracts in the Statement of Assets and Liabilities. Realized gain or (loss) is recorded upon the expiration or closing of a futures contract. The net realized gain (loss) and change in net unrealized appreciation (depreciation) on futures contracts during the period is presented in the Statement of Operations.
Any open futures contracts at period end are presented in the Schedule of Investments under the caption "Futures Contracts". The notional amount at value reflects each contract's exposure to the underlying instrument or index at period end and is representative of volume of activity during the period. Securities deposited to meet initial margin requirements are identified in the Schedule of Investments.
5. Purchases and Sales of Investments.
Purchases and sales of securities including the Underlying Fund shares, other than short-term securities, are noted in the table below.
| | Purchases ($) | Sales ($) |
| Advisor Freedom Income | 63,259,691 | 49,592,226 |
| Advisor Freedom 2005 | 34,392,567 | 41,231,617 |
| Advisor Freedom 2010 | 67,830,202 | 95,099,130 |
| Advisor Freedom 2015 | 140,246,232 | 198,070,318 |
| Advisor Freedom 2020 | 309,204,345 | 389,370,370 |
| Advisor Freedom 2025 | 388,241,541 | 457,159,686 |
| Advisor Freedom 2030 | 360,843,484 | 365,453,198 |
| Advisor Freedom 2035 | 338,587,508 | 340,149,487 |
| Advisor Freedom 2040 | 306,187,656 | 298,072,814 |
| Advisor Freedom 2045 | 212,639,162 | 180,413,831 |
| Advisor Freedom 2050 | 189,310,651 | 150,003,425 |
| Advisor Freedom 2055 | 149,126,794 | 89,775,767 |
| Advisor Freedom 2060 | 45,119,295 | 16,388,534 |
6. Fees and Other Transactions with Affiliates.
Management Fee and Expense Contract. FMR Co., Inc. (the investment adviser), an affiliate of FMR, and its affiliates provide the Funds with investment management related services. Under the management contract, effective June 1, 2017, each Class of each Fund pays a monthly management fee that is set at an annual rate by referring to each Fund's target date, indicated by its name, such that the management fee rate applicable to each Class of each Fund is reduced as the fund approaches, and then passes, its target date. In addition, under the management contract, the investment adviser pays all ordinary operating expenses of each Fund, except distribution and service plan fees, fees and expenses of the independent Trustees, and certain miscellaneous expenses such as proxy and shareholder meeting expenses. The management fee is reduced by an amount equal to the fees and expenses paid by each Fund to the independent Trustees. Prior to June 1, 2017, the investment adviser provided the Funds with investment management related services. The Funds did not pay any fees for these services. For the reporting period, the total annual management fee rate for each Class of each Fund was as follows:
| | Annual % of Class-Level Average Net Assets (Classes A, M, C, I) | Annual % of Class-Level Average Net Assets
(Class Z6) |
| Fidelity Advisor Freedom Income Fund | .465% | .415% |
| Fidelity Advisor Freedom 2005 Fund | .482% | .428% |
| Fidelity Advisor Freedom 2010 Fund | .525% | .461% |
| Fidelity Advisor Freedom 2015 Fund | .567% | .496% |
| Fidelity Advisor Freedom 2020 Fund | .610% | .531% |
| Fidelity Advisor Freedom 2025 Fund | .652% | .566% |
| Fidelity Advisor Freedom 2030 Fund | .695% | .601% |
| Fidelity Advisor Freedom 2035 Fund | .737% | .636% |
| Fidelity Advisor Freedom 2040 Fund | .746% | .643% |
| Fidelity Advisor Freedom 2045 Fund | .746% | .643% |
| Fidelity Advisor Freedom 2050 Fund | .746% | .643% |
| Fidelity Advisor Freedom 2055 Fund | .746% | .643% |
| Fidelity Advisor Freedom 2060 Fund | .746% | .643% |
Under the expense contract, the investment adviser pays class-level expenses for Class Z6 of each Fund as necessary so that Class Z6 total expenses do not exceed certain amounts of Class Z6 average net assets on an annual basis with certain exceptions, as noted in the following table:
| | Annual % of Class-Level Average Net Assets (Class Z6) |
| Fidelity Advisor Freedom Income Fund | .365% |
| Fidelity Advisor Freedom 2005 Fund | .373% |
| Fidelity Advisor Freedom 2010 Fund | .392% |
| Fidelity Advisor Freedom 2015 Fund | .412% |
| Fidelity Advisor Freedom 2020 Fund | .431% |
| Fidelity Advisor Freedom 2025 Fund | .450% |
| Fidelity Advisor Freedom 2030 Fund | .470% |
| Fidelity Advisor Freedom 2035 Fund | .489% |
| Fidelity Advisor Freedom 2040 Fund | .493% |
| Fidelity Advisor Freedom 2045 Fund | .493% |
| Fidelity Advisor Freedom 2050 Fund | .493% |
| Fidelity Advisor Freedom 2055 Fund | .493% |
| Fidelity Advisor Freedom 2060 Fund | .493% |
Other Transactions. The investment adviser has entered into an administration agreement with FMR under which FMR provides management and administrative services (other than investment advisory services) necessary for the operation of each Fund. Pursuant to this agreement, FMR pays all expenses of each Fund, excluding distribution and service plan fees, compensation of the independent Trustees and certain miscellaneous expenses such as proxy and shareholder meeting expenses. FMR also contracts with other Fidelity companies to perform the services necessary for the operation of each Fund. The Funds do not pay any fees for these services.
Distribution and Service Plan Fees. In accordance with Rule 12b-1 of the 1940 Act, each Fund has adopted separate Distribution and Service Plans for each class of shares. Certain classes pay Fidelity Distributors Corporation (FDC), an affiliate of the investment adviser, separate Distribution and Service Fees, each of which is based on an annual percentage of each class' average net assets. In addition, FDC may pay financial intermediaries for selling shares of each Fund and providing shareholder support services. For the period, the Distribution and Service Fee rates, total fees and amounts retained by FDC were as follows:
| | Distribution Fee | Service Fee | Total Fees | Retained by FDC |
| Advisor Freedom Income | | | | |
| Class A | -% | .25% | $92,936 | $2,036 |
| Class M | .25% | .25% | 95,674 | – |
| Class C | .75% | .25% | 65,736 | 4,317 |
| | | | $254,346 | $6,353 |
| Advisor Freedom 2005 | | | | |
| Class A | -% | .25% | $121,736 | $3,067 |
| Class M | .25% | .25% | 63,534 | 116 |
| Class C | .75% | .25% | 28,957 | 794 |
| | | | $214,227 | $3,977 |
| Advisor Freedom 2010 | | | | |
| Class A | -% | .25% | $270,934 | $8,345 |
| Class M | .25% | .25% | 189,410 | 4,354 |
| Class C | .75% | .25% | 125,811 | – |
| | | | $586,155 | $12,699 |
| Advisor Freedom 2015 | | | | |
| Class A | -% | .25% | $666,214 | $15,612 |
| Class M | .25% | .25% | 410,540 | 931 |
| Class C | .75% | .25% | 270,372 | 2,694 |
| | | | $1,347,126 | $19,237 |
| Advisor Freedom 2020 | | | | |
| Class A | -% | .25% | $1,442,192 | $31,218 |
| Class M | .25% | .25% | 930,756 | 2,149 |
| Class C | .75% | .25% | 493,700 | 36,481 |
| | | | $2,866,648 | $69,848 |
| Advisor Freedom 2025 | | | | |
| Class A | -% | .25% | $1,753,532 | $48,612 |
| Class M | .25% | .25% | 1,085,076 | 3,237 |
| Class C | .75% | .25% | 486,584 | 46,012 |
| | | | $3,325,192 | $97,861 |
| Advisor Freedom 2030 | | | | |
| Class A | -% | .25% | $1,700,779 | $34,744 |
| Class M | .25% | .25% | 1,152,156 | 1,939 |
| Class C | .75% | .25% | 487,787 | 49,263 |
| | | | $3,340,722 | $85,946 |
| Advisor Freedom 2035 | | | | |
| Class A | -% | .25% | $1,354,313 | $31,398 |
| Class M | .25% | .25% | 921,192 | 4,709 |
| Class C | .75% | .25% | 333,372 | 35,655 |
| | | | $2,608,877 | $71,762 |
| Advisor Freedom 2040 | | | | |
| Class A | -% | .25% | $1,183,873 | $26,801 |
| Class M | .25% | .25% | 878,106 | 763 |
| Class C | .75% | .25% | 421,955 | 34,877 |
| | | | $2,483,934 | $62,441 |
| Advisor Freedom 2045 | | | | |
| Class A | -% | .25% | $713,037 | $17,244 |
| Class M | .25% | .25% | 528,795 | 3,924 |
| Class C | .75% | .25% | 157,687 | 23,971 |
| | | | $1,399,519 | $45,139 |
| Advisor Freedom 2050 | | | | |
| Class A | -% | .25% | $527,349 | $7,795 |
| Class M | .25% | .25% | 429,854 | 2,179 |
| Class C | .75% | .25% | 168,257 | 25,667 |
| | | | $1,125,460 | $35,641 |
| Advisor Freedom 2055 | | | | |
| Class A | -% | .25% | $263,653 | $4,137 |
| Class M | .25% | .25% | 193,044 | 163 |
| Class C | .75% | .25% | 56,185 | 11,590 |
| | | | $512,882 | $15,890 |
| Advisor Freedom 2060 | | | | |
| Class A | -% | .25% | $52,834 | $27,374 |
| Class M | .25% | .25% | 36,616 | 22 |
| Class C | .75% | .25% | 14,523 | 7,314 |
| | | | $103,973 | $34,710 |
Sales Load. FDC may receive a front-end sales charge of up to 5.75% for selling Class A shares and 3.50% for selling Class M shares, some of which is paid to financial intermediaries for selling shares of each Fund. Depending on the holding period, FDC may receive contingent deferred sales charges levied on Class A, Class M and Class C redemptions. The deferred sales charges are 1.00% for Class C shares, 1.00% for certain purchases of Class A shares and .25% for certain purchases of Class M shares.
For the period, sales charge amounts retained by FDC were as follows:
| | Retained by FDC |
| Advisor Freedom Income | |
| Class A | $6,948 |
| Class M | 528 |
| Class C(a) | 901 |
| | $8,377 |
| Advisor Freedom 2005 | |
| Class A | $1,569 |
| Class M | 446 |
| Class C(a) | 268 |
| | $2,283 |
| Advisor Freedom 2010 | |
| Class A | $2,755 |
| Class M | 738 |
| Class C(a) | 396 |
| | $3,889 |
| Advisor Freedom 2015 | |
| Class A | $9,530 |
| Class M | 3,344 |
| Class C(a) | 902 |
| | $13,776 |
| Advisor Freedom 2020 | |
| Class A | $23,113 |
| Class M | 8,535 |
| Class C(a) | 2,865 |
| | $34,513 |
| Advisor Freedom 2025 | |
| Class A | $31,911 |
| Class M | 16,304 |
| Class C(a) | 3,568 |
| | $51,783 |
| Advisor Freedom 2030 | |
| Class A | $41,912 |
| Class M | 15,037 |
| Class C(a) | 5,366 |
| | $62,315 |
| Advisor Freedom 2035 | |
| Class A | $32,966 |
| Class M | 14,253 |
| Class C(a) | 7,666 |
| | $54,885 |
| Advisor Freedom 2040 | |
| Class A | $40,641 |
| Class M | 12,199 |
| Class C(a) | 3,372 |
| | $56,212 |
| Advisor Freedom 2045 | |
| Class A | $29,981 |
| Class M | 8,409 |
| Class C(a) | 2,210 |
| | $40,600 |
| Advisor Freedom 2050 | |
| Class A | $31,588 |
| Class M | 6,851 |
| Class C(a) | 2,726 |
| | $41,165 |
| Advisor Freedom 2055 | |
| Class A | $16,257 |
| Class M | 5,000 |
| Class C(a) | 1,702 |
| | $22,959 |
| Advisor Freedom 2060 | |
| Class A | $5,852 |
| Class M | 1,005 |
| Class C(a) | 597 |
| | $7,454 |
(a) When Class C shares are initially sold, FDC pays commissions from its own resources to financial intermediaries through which the sales are made.
Prior Fiscal Year Reallocation of Underlying Fund Investments. During the prior period, the investment adviser reallocated investments of the Funds. This involved taxable redemptions of the Funds' interest in Fidelity Advisor Series Equity Value Fund ("selected Underlying Fund") for investments and cash and non-taxable exchanges of those investments and cash for shares of Fidelity Advisor Series Growth & Income Fund which is an affiliated investment company managed by FMR.
Details of these transactions with the related net gain (loss) for the Funds are presented in the accompanying table:
| | Value of Investments and Cash reallocated | Net realized Gain (Loss) on redemptions of selected Underlying Funds |
| Advisor Freedom Income | $1,835,460 | $263,976 |
| Advisor Freedom 2005 | 2,600,106 | 473,487 |
| Advisor Freedom 2010 | 8,110,167 | 1,996,669 |
| Advisor Freedom 2015 | 23,603,334 | 4,562,791 |
| Advisor Freedom 2020 | 57,172,267 | 5,489,085 |
| Advisor Freedom 2025 | 73,263,952 | 6,487,561 |
| Advisor Freedom 2030 | 87,711,735 | 7,386,714 |
| Advisor Freedom 2035 | 79,733,333 | 5,964,782 |
| Advisor Freedom 2040 | 74,045,368 | 5,798,888 |
| Advisor Freedom 2045 | 44,156,583 | 3,196,466 |
| Advisor Freedom 2050 | 34,515,108 | 2,535,731 |
| Advisor Freedom 2055 | 15,452,315 | 540,986 |
| Advisor Freedom 2060 | 1,885,573 | 23,858 |
7. Expense Reductions.
Through arrangements with each applicable Fund's custodian, credits realized as a result of certain uninvested cash balances were used to reduce each applicable Fund's management fee. During the period, these credits reduced management fee by the following amounts:
| Advisor Freedom Income | $40 |
| Advisor Freedom 2005 | 32 |
| Advisor Freedom 2010 | 35 |
| Advisor Freedom 2015 | 37 |
| Advisor Freedom 2020 | 39 |
| Advisor Freedom 2025 | 48 |
| Advisor Freedom 2030 | 55 |
| Advisor Freedom 2035 | 5 |
| Advisor Freedom 2040 | 1 |
| Advisor Freedom 2045 | - |
| Advisor Freedom 2050 | 2 |
| Advisor Freedom 2055 | 2 |
| Advisor Freedom 2060 | - |
8. Distributions to Shareholders.
Distributions to shareholders of each class were as follows:
| | Six months ended
September 30, 2018 | Year ended
March 31, 2018(a) |
| Advisor Freedom Income | | |
| From net investment income | | |
| Class A | $423,372 | $1,099,143 |
| Class M | 168,162 | 434,009 |
| Class C | 25,475 | 84,788 |
| Class I | 620,590 | 1,334,162 |
| Class Z6 | 87,524 | 14,910 |
| Total | $1,325,123 | $2,967,012 |
| From net realized gain | | |
| Class A | $1,083,510 | $1,878,730 |
| Class M | 556,845 | 905,373 |
| Class C | 194,302 | 326,433 |
| Class I | 1,221,176 | 1,957,623 |
| Class Z6 | 92,326 | 19,793 |
| Total | $3,148,159 | $5,087,952 |
| Advisor Freedom 2005 | | |
| From net investment income | | |
| Class A | $192,361 | $1,499,668 |
| Class M | 32,014 | 314,597 |
| Class C | 1,456 | 29,260 |
| Class I | 154,860 | 965,073 |
| Class Z6 | 4,936 | 3,311 |
| Total | $385,627 | $2,811,909 |
| From net realized gain | | |
| Class A | $2,492,331 | $4,027,753 |
| Class M | 636,019 | 991,902 |
| Class C | 144,594 | 192,899 |
| Class I | 1,488,653 | 2,120,987 |
| Class Z6 | 38,707 | 5,395 |
| Total | $4,800,304 | $7,338,936 |
| Advisor Freedom 2010 | | |
| From net investment income | | |
| Class A | $289,119 | $3,281,846 |
| Class M | 49,134 | 928,807 |
| Class C | – | 171,747 |
| Class I | 275,688 | 2,274,695 |
| Class Z6 | 12,723 | 5,012 |
| Total | $626,664 | $6,662,107 |
| From net realized gain | | |
| Class A | $6,685,870 | $12,108,352 |
| Class M | 2,272,428 | 4,030,464 |
| Class C | 755,232 | 1,392,028 |
| Class I | 4,080,167 | 6,664,800 |
| Class Z6 | 142,657 | 10,693 |
| Total | $13,936,354 | $24,206,337 |
| Advisor Freedom 2015 | | |
| From net investment income | | |
| Class A | $430,803 | $7,973,130 |
| Class M | 26,211 | 1,948,902 |
| Class C | – | 332,783 |
| Class I | 479,046 | 5,348,653 |
| Class Z6 | 30,029 | 43,354 |
| Total | $966,089 | $15,646,822 |
| From net realized gain | | |
| Class A | $19,773,366 | $32,654,337 |
| Class M | 6,015,445 | 9,539,452 |
| Class C | 1,933,936 | 3,208,781 |
| Class I | 11,570,107 | 17,671,857 |
| Class Z6 | 492,263 | 97,031 |
| Total | $39,785,117 | $63,171,458 |
| Advisor Freedom 2020 | | |
| From net investment income | | |
| Class A | $343,382 | $16,243,820 |
| Class M | – | 4,166,252 |
| Class C | – | 631,334 |
| Class I | 757,966 | 12,480,682 |
| Class Z6 | 67,878 | 54,384 |
| Total | $1,169,226 | $33,576,472 |
| From net realized gain | | |
| Class A | $41,713,997 | $56,102,883 |
| Class M | 13,057,503 | 17,427,080 |
| Class C | 3,333,696 | 4,617,388 |
| Class I | 28,332,284 | 34,710,233 |
| Class Z6 | 1,268,800 | 98,749 |
| Total | $87,706,280 | $112,956,333 |
| Advisor Freedom 2025 | | |
| From net investment income | | |
| Class A | $– | $18,093,765 |
| Class M | – | 4,378,723 |
| Class C | – | 563,682 |
| Class I | 148,305 | 14,900,347 |
| Class Z6 | 36,352 | 64,554 |
| Total | $184,657 | $38,001,071 |
| From net realized gain | | |
| Class A | $49,671,068 | $58,214,610 |
| Class M | 14,872,667 | 17,087,190 |
| Class C | 3,319,289 | 3,945,982 |
| Class I | 36,429,132 | 37,833,645 |
| Class Z6 | 1,192,336 | 103,988 |
| Total | $105,484,492 | $117,185,415 |
| Advisor Freedom 2030 | | |
| From net investment income | | |
| Class A | $– | $14,665,530 |
| Class M | – | 3,839,299 |
| Class C | – | 484,808 |
| Class I | – | 13,363,681 |
| Class Z6 | – | 76,802 |
| Total | $– | $32,430,120 |
| From net realized gain | | |
| Class A | $54,443,227 | $61,142,849 |
| Class M | 17,958,623 | 19,943,569 |
| Class C | 3,791,454 | 4,240,085 |
| Class I | 42,674,754 | 42,210,713 |
| Class Z6 | 1,574,692 | 141,530 |
| Total | $120,442,750 | $127,678,746 |
| Advisor Freedom 2035 | | |
| From net investment income | | |
| Class A | $– | $10,040,682 |
| Class M | – | 2,832,544 |
| Class C | – | 299,727 |
| Class I | – | 9,653,819 |
| Class Z6 | – | 41,993 |
| Total | $– | $22,868,765 |
| From net realized gain | | |
| Class A | $46,028,719 | $46,063,469 |
| Class M | 15,636,386 | 14,617,860 |
| Class C | 2,884,159 | 2,740,366 |
| Class I | 37,198,863 | 33,253,804 |
| Class Z6 | 1,154,345 | 73,488 |
| Total | $102,902,472 | $96,748,987 |
| Advisor Freedom 2040 | | |
| From net investment income | | |
| Class A | $– | $8,881,190 |
| Class M | – | 2,655,243 |
| Class C | – | 390,961 |
| Class I | – | 8,816,392 |
| Class Z6 | – | 35,650 |
| Total | $– | $20,779,436 |
| From net realized gain | | |
| Class A | $40,182,941 | $40,808,993 |
| Class M | 14,775,205 | 14,342,170 |
| Class C | 3,650,217 | 3,641,921 |
| Class I | 33,884,549 | 31,372,523 |
| Class Z6 | 1,047,628 | 64,140 |
| Total | $93,540,540 | $90,229,747 |
| Advisor Freedom 2045 | | |
| From net investment income | | |
| Class A | $– | $5,219,007 |
| Class M | – | 1,576,055 |
| Class C | – | 129,725 |
| Class I | – | 5,947,360 |
| Class Z6 | – | 27,145 |
| Total | $– | $12,899,292 |
| From net realized gain | | |
| Class A | $23,066,720 | $20,301,003 |
| Class M | 8,519,585 | 7,111,464 |
| Class C | 1,280,087 | 1,051,413 |
| Class I | 22,361,223 | 17,635,957 |
| Class Z6 | 746,178 | 38,908 |
| Total | $55,973,793 | $46,138,745 |
| Advisor Freedom 2050 | | |
| From net investment income | | |
| Class A | $– | $3,857,081 |
| Class M | – | 1,283,517 |
| Class C | – | 145,803 |
| Class I | – | 4,942,896 |
| Class Z6 | – | 22,378 |
| Total | $– | $10,251,675 |
| From net realized gain | | |
| Class A | $16,599,749 | $13,859,582 |
| Class M | 6,720,507 | 5,314,395 |
| Class C | 1,333,297 | 1,032,638 |
| Class I | 18,744,933 | 13,916,045 |
| Class Z6 | 504,465 | 30,737 |
| Total | $43,902,951 | $34,153,397 |
| Advisor Freedom 2055 | | |
| From net investment income | | |
| Class A | $– | $1,844,591 |
| Class M | – | 555,719 |
| Class C | – | 45,985 |
| Class I | – | 2,580,264 |
| Class Z6 | – | 23,513 |
| Total | $– | $5,050,072 |
| From net realized gain | | |
| Class A | $7,394,439 | $4,611,171 |
| Class M | 2,760,331 | 1,578,617 |
| Class C | 408,582 | 232,494 |
| Class I | 9,950,581 | 5,016,561 |
| Class Z6 | 228,962 | 22,637 |
| Total | $20,742,895 | $11,461,480 |
| Advisor Freedom 2060 | | |
| From net investment income | | |
| Class A | $– | $303,602 |
| Class M | – | 87,416 |
| Class C | – | 11,911 |
| Class I | – | 372,369 |
| Class Z6 | – | 5,927 |
| Total | $– | $781,225 |
| From net realized gain | | |
| Class A | $1,198,775 | $536,013 |
| Class M | 420,164 | 172,103 |
| Class C | 83,471 | 34,235 |
| Class I | 1,487,383 | 555,272 |
| Class Z6 | 46,623 | 4,856 |
| Total | $3,236,416 | $1,302,479 |
(a) Distributions for Class Z6 are for the period June 6, 2017 (commencement of sale of shares) to March 31, 2018 .
9. Share Transactions.
Share transactions for each class were as follows and may contain automatic conversions between classes or exchanges between affiliated funds:
| | Shares | Shares | Dollars | Dollars |
| | Six months ended September 30, 2018 | Year ended March 31, 2018 (a) | Six months ended September 30, 2018 | Year endedMarch 31, 2018(a) |
| Advisor Freedom Income | | | | |
| Class A | | | | |
| Shares sold | 996,835 | 1,561,114 | $10,859,784 | $17,372,724 |
| Reinvestment of distributions | 136,668 | 267,313 | 1,480,997 | 2,956,413 |
| Shares redeemed | (1,515,915) | (2,954,671) | (16,513,977) | (32,858,285) |
| Net increase (decrease) | (382,412) | (1,126,244) | $(4,173,196) | $(12,529,148) |
| Class M | | | | |
| Shares sold | 338,494 | 1,231,544 | $3,687,532 | $13,671,270 |
| Reinvestment of distributions | 65,936 | 119,232 | 713,657 | 1,317,819 |
| Shares redeemed | (418,695) | (1,400,766) | (4,556,059) | (15,542,444) |
| Net increase (decrease) | (14,265) | (49,990) | $(154,870) | $(553,355) |
| Class C | | | | |
| Shares sold | 60,295 | 273,309 | $655,111 | $3,025,706 |
| Reinvestment of distributions | 19,254 | 33,546 | 207,871 | 370,253 |
| Shares redeemed | (168,288) | (379,554) | (1,827,961) | (4,206,642) |
| Net increase (decrease) | (88,739) | (72,699) | $(964,979) | $(810,683) |
| Class I | | | | |
| Shares sold | 1,760,317 | 2,536,795 | $19,232,847 | $28,278,478 |
| Reinvestment of distributions | 167,416 | 293,632 | 1,819,876 | 3,259,663 |
| Shares redeemed | (1,311,227) | (2,708,353) | (14,316,892) | (30,196,704) |
| Net increase (decrease) | 616,506 | 122,074 | $6,735,831 | $1,341,437 |
| Class Z6 | | | | |
| Shares sold | 1,435,123 | 206,804 | $15,663,682 | $2,315,726 |
| Reinvestment of distributions | 16,553 | 3,119 | 179,850 | 34,703 |
| Shares redeemed | (130,333) | (56,618) | (1,420,161) | (629,544) |
| Net increase (decrease) | 1,321,343 | 153,305 | $14,423,371 | $1,720,885 |
| Advisor Freedom 2005 | | | | |
| Class A | | | | |
| Shares sold | 619,381 | 1,335,163 | $7,312,002 | $16,124,405 |
| Reinvestment of distributions | 224,250 | 452,684 | 2,619,237 | 5,409,480 |
| Shares redeemed | (1,444,052) | (3,307,757) | (16,990,243) | (40,042,858) |
| Net increase (decrease) | (600,421) | (1,519,910) | $(7,059,004) | $(18,508,973) |
| Class M | | | | |
| Shares sold | 151,500 | 594,769 | $1,781,908 | $7,157,573 |
| Reinvestment of distributions | 57,123 | 108,652 | 666,621 | 1,298,447 |
| Shares redeemed | (226,431) | (833,574) | (2,663,126) | (10,035,595) |
| Net increase (decrease) | (17,808) | (130,153) | $(214,597) | $(1,579,575) |
| Class C | | | | |
| Shares sold | 10,732 | 112,314 | $126,233 | $1,348,518 |
| Reinvestment of distributions | 12,248 | 17,487 | 142,930 | 209,035 |
| Shares redeemed | (25,275) | (113,001) | (297,964) | (1,365,341) |
| Net increase (decrease) | (2,295) | 16,800 | $(28,801) | $192,212 |
| Class I | | | | |
| Shares sold | 837,759 | 1,578,344 | $9,916,811 | $19,235,581 |
| Reinvestment of distributions | 139,245 | 255,470 | 1,637,523 | 3,073,797 |
| Shares redeemed | (703,631) | (1,832,308) | (8,323,173) | (22,354,226) |
| Net increase (decrease) | 273,373 | 1,506 | $3,231,161 | $(44,848) |
| Class Z6 | | | | |
| Shares sold | 34,344 | 122,579 | $406,387 | $1,494,714 |
| Reinvestment of distributions | 3,717 | 722 | 43,643 | 8,706 |
| Shares redeemed | (19,048) | (5,951) | (225,165) | (71,881) |
| Net increase (decrease) | 19,013 | 117,350 | $224,865 | $1,431,539 |
| Advisor Freedom 2010 | | | | |
| Class A | | | | |
| Shares sold | 931,903 | 3,564,998 | $11,418,305 | $44,943,820 |
| Reinvestment of distributions | 567,867 | 1,224,022 | 6,899,587 | 15,229,168 |
| Shares redeemed | (3,161,825) | (7,574,224) | (38,667,927) | (95,614,997) |
| Net increase (decrease) | (1,662,055) | (2,785,204) | $(20,350,035) | $(35,442,009) |
| Class M | | | | |
| Shares sold | 399,815 | 1,361,175 | $4,869,856 | $17,164,227 |
| Reinvestment of distributions | 191,054 | 398,510 | 2,313,669 | 4,940,676 |
| Shares redeemed | (712,121) | (2,349,250) | (8,691,799) | (29,490,893) |
| Net increase (decrease) | (121,252) | (589,565) | $(1,508,274) | $(7,385,990) |
| Class C | | | | |
| Shares sold | 32,114 | 116,566 | $388,639 | $1,455,262 |
| Reinvestment of distributions | 61,598 | 120,905 | 741,019 | 1,491,052 |
| Shares redeemed | (254,529) | (499,934) | (3,084,191) | (6,234,706) |
| Net increase (decrease) | (160,817) | (262,463) | $(1,954,533) | $(3,288,392) |
| Class I | | | | |
| Shares sold | 1,349,440 | 3,628,003 | $16,570,718 | $46,034,277 |
| Reinvestment of distributions | 349,791 | 704,786 | 4,267,451 | 8,802,985 |
| Shares redeemed | (1,292,673) | (3,930,369) | (15,902,986) | (49,731,898) |
| Net increase (decrease) | 406,558 | 402,420 | $4,935,183 | $5,105,364 |
| Class Z6 | | | | |
| Shares sold | 106,088 | 425,699 | $1,307,738 | $5,402,891 |
| Reinvestment of distributions | 12,747 | 1,253 | 155,380 | 15,705 |
| Shares redeemed | (95,769) | (46,433) | (1,182,705) | (583,499) |
| Net increase (decrease) | 23,066 | 380,519 | $280,413 | $4,835,097 |
| Advisor Freedom 2015 | | | | |
| Class A | | | | |
| Shares sold | 2,125,583 | 6,359,677 | $26,370,386 | $81,015,805 |
| Reinvestment of distributions | 1,633,203 | 3,202,904 | 20,039,405 | 40,291,135 |
| Shares redeemed | (6,181,255) | (18,372,028) | (76,502,045) | (233,983,987) |
| Net increase (decrease) | (2,422,469) | (8,809,447) | $(30,092,254) | $(112,677,047) |
| Class M | | | | |
| Shares sold | 874,111 | 2,736,122 | $10,796,661 | $34,744,143 |
| Reinvestment of distributions | 490,432 | 907,945 | 6,007,786 | 11,406,069 |
| Shares redeemed | (1,602,424) | (4,687,987) | (19,798,178) | (59,601,397) |
| Net increase (decrease) | (237,881) | (1,043,920) | $(2,993,731) | $(13,451,185) |
| Class C | | | | |
| Shares sold | 177,394 | 430,509 | $2,171,246 | $5,422,977 |
| Reinvestment of distributions | 157,787 | 276,036 | 1,920,259 | 3,447,300 |
| Shares redeemed | (397,366) | (1,295,042) | (4,873,446) | (16,430,837) |
| Net increase (decrease) | (62,185) | (588,497) | $(781,941) | $(7,560,560) |
| Class I | | | | |
| Shares sold | 2,551,840 | 8,187,613 | $31,803,684 | $105,325,150 |
| Reinvestment of distributions | 960,336 | 1,790,662 | 11,879,368 | 22,716,014 |
| Shares redeemed | (3,500,071) | (9,768,474) | (43,717,096) | (125,622,049) |
| Net increase (decrease) | 12,105 | 209,801 | $(34,044) | $2,419,115 |
| Class Z6 | | | | |
| Shares sold | 222,505 | 1,089,010 | $2,778,094 | $14,093,662 |
| Reinvestment of distributions | 42,124 | 11,019 | 520,233 | 140,385 |
| Shares redeemed | (204,441) | (81,911) | (2,549,770) | (1,049,457) |
| Net increase (decrease) | 60,188 | 1,018,118 | $748,557 | $13,184,590 |
| Advisor Freedom 2020 | | | | |
| Class A | | | | |
| Shares sold | 5,757,426 | 15,638,670 | $77,974,056 | $215,678,977 |
| Reinvestment of distributions | 3,104,795 | 5,240,623 | 41,666,350 | 71,580,589 |
| Shares redeemed | (13,782,495) | (32,501,753) | (186,221,150) | (448,248,436) |
| Net increase (decrease) | (4,920,274) | (11,622,460) | $(66,580,744) | $(160,988,870) |
| Class M | | | | |
| Shares sold | 2,252,794 | 5,929,123 | $30,484,330 | $81,613,945 |
| Reinvestment of distributions | 964,675 | 1,564,174 | 12,945,948 | 21,368,634 |
| Shares redeemed | (3,499,342) | (9,968,053) | (47,335,011) | (137,166,621) |
| Net increase (decrease) | (281,873) | (2,474,756) | $(3,904,733) | $(34,184,042) |
| Class C | | | | |
| Shares sold | 392,761 | 948,078 | $5,273,161 | $12,932,083 |
| Reinvestment of distributions | 246,491 | 375,317 | 3,283,259 | 5,093,860 |
| Shares redeemed | (633,452) | (1,720,609) | (8,506,351) | (23,548,361) |
| Net increase (decrease) | 5,800 | (397,214) | $50,069 | $(5,522,418) |
| Class I | | | | |
| Shares sold | 7,749,708 | 18,997,484 | $105,514,474 | $264,269,563 |
| Reinvestment of distributions | 2,116,930 | 3,388,242 | 28,642,068 | 46,653,405 |
| Shares redeemed | (7,542,493) | (19,661,892) | (102,892,785) | (273,240,745) |
| Net increase (decrease) | 2,324,145 | 2,723,834 | $31,263,757 | $37,682,223 |
| Class Z6 | | | | |
| Shares sold | 1,008,219 | 2,198,548 | $13,779,911 | $31,162,379 |
| Reinvestment of distributions | 99,013 | 11,033 | 1,336,679 | 153,133 |
| Shares redeemed | (537,840) | (99,389) | (7,248,092) | (1,386,209) |
| Net increase (decrease) | 569,392 | 2,110,192 | $7,868,498 | $29,929,303 |
| Advisor Freedom 2025 | | | | |
| Class A | | | | |
| Shares sold | 7,727,707 | 21,155,632 | $105,082,687 | $291,258,604 |
| Reinvestment of distributions | 3,666,825 | 5,553,494 | 49,465,488 | 75,773,123 |
| Shares redeemed | (15,563,912) | (36,469,562) | (211,387,330) | (500,742,895) |
| Net increase (decrease) | (4,169,380) | (9,760,436) | $(56,839,155) | $(133,711,168) |
| Class M | | | | |
| Shares sold | 2,761,700 | 7,381,740 | $37,640,089 | $101,335,661 |
| Reinvestment of distributions | 1,089,369 | 1,551,203 | 14,717,379 | 21,218,934 |
| Shares redeemed | (3,729,447) | (9,297,407) | (50,776,113) | (127,887,305) |
| Net increase (decrease) | 121,622 | (364,464) | $1,581,355 | $(5,332,710) |
| Class C | | | | |
| Shares sold | 374,310 | 1,054,413 | $5,014,018 | $14,230,748 |
| Reinvestment of distributions | 246,159 | 326,578 | 3,271,448 | 4,400,480 |
| Shares redeemed | (681,904) | (1,717,786) | (9,127,365) | (23,308,720) |
| Net increase (decrease) | (61,435) | (336,795) | $(841,899) | $(4,677,492) |
| Class I | | | | |
| Shares sold | 9,891,281 | 25,378,468 | $135,551,153 | $351,808,654 |
| Reinvestment of distributions | 2,638,201 | 3,774,323 | 35,879,552 | 51,976,785 |
| Shares redeemed | (10,401,600) | (21,969,142) | (142,757,344) | (304,482,920) |
| Net increase (decrease) | 2,127,882 | 7,183,649 | $28,673,361 | $99,302,519 |
| Class Z6 | | | | |
| Shares sold | 1,306,665 | 1,889,983 | $17,972,239 | $26,814,303 |
| Reinvestment of distributions | 90,478 | 12,099 | 1,228,688 | 168,542 |
| Shares redeemed | (595,690) | (102,569) | (8,074,201) | (1,434,592) |
| Net increase (decrease) | 801,453 | 1,799,513 | $11,126,726 | $25,548,253 |
| Advisor Freedom 2030 | | | | |
| Class A | | | | |
| Shares sold | 7,312,686 | 18,673,471 | $108,244,266 | $278,431,607 |
| Reinvestment of distributions | 3,688,448 | 5,074,757 | 54,109,564 | 75,068,077 |
| Shares redeemed | (12,829,139) | (31,998,170) | (189,677,578) | (475,713,945) |
| Net increase (decrease) | (1,828,005) | (8,249,942) | $(27,323,748) | $(122,214,261) |
| Class M | | | | |
| Shares sold | 2,940,850 | 6,811,790 | $43,327,842 | $100,640,388 |
| Reinvestment of distributions | 1,216,232 | 1,596,336 | 17,757,001 | 23,510,770 |
| Shares redeemed | (3,249,829) | (9,448,868) | (47,850,527) | (139,471,738) |
| Net increase (decrease) | 907,253 | (1,040,742) | $13,234,316 | $(15,320,580) |
| Class C | | | | |
| Shares sold | 475,900 | 964,743 | $6,914,339 | $14,139,943 |
| Reinvestment of distributions | 260,314 | 315,301 | 3,753,725 | 4,593,826 |
| Shares redeemed | (506,080) | (1,529,804) | (7,365,341) | (22,415,105) |
| Net increase (decrease) | 230,134 | (249,760) | $3,302,723 | $(3,681,336) |
| Class I | | | | |
| Shares sold | 9,897,405 | 24,584,566 | $147,134,579 | $367,677,762 |
| Reinvestment of distributions | 2,819,129 | 3,663,231 | 41,582,158 | 54,563,348 |
| Shares redeemed | (9,380,308) | (20,246,824) | (139,734,381) | (302,278,371) |
| Net increase (decrease) | 3,336,226 | 8,000,973 | $48,982,356 | $119,962,739 |
| Class Z6 | | | | |
| Shares sold | 1,393,458 | 1,841,365 | $20,792,658 | $28,526,620 |
| Reinvestment of distributions | 106,976 | 14,449 | 1,574,692 | 218,332 |
| Shares redeemed | (241,551) | (68,960) | (3,597,470) | (1,049,203) |
| Net increase (decrease) | 1,258,883 | 1,786,854 | $18,769,880 | $27,695,749 |
| Advisor Freedom 2035 | | | | |
| Class A | | | | |
| Shares sold | 6,617,634 | 16,076,305 | $96,202,015 | $233,388,018 |
| Reinvestment of distributions | 3,183,186 | 3,857,946 | 45,837,907 | 55,595,824 |
| Shares redeemed | (10,509,089) | (28,095,944) | (152,546,370) | (406,790,784) |
| Net increase (decrease) | (708,269) | (8,161,693) | $(10,506,448) | $(117,806,942) |
| Class M | | | | |
| Shares sold | 2,701,510 | 6,398,268 | $38,940,620 | $91,831,716 |
| Reinvestment of distributions | 1,087,369 | 1,206,444 | 15,516,791 | 17,272,407 |
| Shares redeemed | (3,027,363) | (7,462,512) | (43,588,981) | (106,846,943) |
| Net increase (decrease) | 761,516 | 142,200 | $10,868,430 | $2,257,180 |
| Class C | | | | |
| Shares sold | 302,357 | 693,842 | $4,282,581 | $9,794,664 |
| Reinvestment of distributions | 203,626 | 212,457 | 2,852,804 | 2,989,811 |
| Shares redeemed | (346,677) | (945,420) | (4,890,074) | (13,367,741) |
| Net increase (decrease) | 159,306 | (39,121) | $2,245,311 | $(583,266) |
| Class I | | | | |
| Shares sold | 8,876,110 | 21,843,836 | $129,750,617 | $318,376,949 |
| Reinvestment of distributions | 2,493,002 | 2,892,062 | 36,173,457 | 42,049,701 |
| Shares redeemed | (9,167,571) | (16,207,972) | (134,377,707) | (235,522,368) |
| Net increase (decrease) | 2,201,541 | 8,527,926 | $31,546,367 | $124,904,282 |
| Class Z6 | | | | |
| Shares sold | 1,119,601 | 1,087,189 | $16,435,157 | $16,548,830 |
| Reinvestment of distributions | 79,580 | 7,787 | 1,153,912 | 115,481 |
| Shares redeemed | (133,843) | (24,549) | (1,964,892) | (369,912) |
| Net increase (decrease) | 1,065,338 | 1,070,427 | $15,624,177 | $16,294,399 |
| Advisor Freedom 2040 | | | | |
| Class A | | | | |
| Shares sold | 5,291,321 | 13,534,093 | $82,421,615 | $210,888,429 |
| Reinvestment of distributions | 2,591,702 | 3,189,871 | 39,989,970 | 49,256,170 |
| Shares redeemed | (8,620,917) | (22,500,034) | (134,165,834) | (348,416,945) |
| Net increase (decrease) | (737,894) | (5,776,070) | $(11,754,249) | $(88,272,346) |
| Class M | | | | |
| Shares sold | 2,264,833 | 5,361,973 | $35,114,373 | $82,647,592 |
| Reinvestment of distributions | 954,523 | 1,095,300 | 14,651,940 | 16,854,754 |
| Shares redeemed | (2,369,247) | (6,875,453) | (36,711,065) | (106,016,831) |
| Net increase (decrease) | 850,109 | (418,180) | $13,055,248 | $(6,514,485) |
| Class C | | | | |
| Shares sold | 318,813 | 663,291 | $4,842,094 | $10,055,292 |
| Reinvestment of distributions | 241,780 | 263,236 | 3,636,371 | 3,975,590 |
| Shares redeemed | (473,956) | (987,718) | (7,211,474) | (15,051,497) |
| Net increase (decrease) | 86,637 | (61,191) | $1,266,991 | $(1,020,615) |
| Class I | | | | |
| Shares sold | 7,283,415 | 18,668,939 | $114,098,178 | $291,013,150 |
| Reinvestment of distributions | 2,127,525 | 2,537,951 | 33,040,481 | 39,478,312 |
| Shares redeemed | (7,343,745) | (15,449,375) | (115,187,547) | (239,687,652) |
| Net increase (decrease) | 2,067,195 | 5,757,515 | $31,951,112 | $90,803,810 |
| Class Z6 | | | | |
| Shares sold | 1,237,560 | 794,020 | $19,344,195 | $12,962,617 |
| Reinvestment of distributions | 67,539 | 6,296 | 1,047,531 | 99,790 |
| Shares redeemed | (122,933) | (47,766) | (1,942,739) | (764,460) |
| Net increase (decrease) | 1,182,166 | 752,550 | $18,448,987 | $12,297,947 |
| Advisor Freedom 2045 | | | | |
| Class A | | | | |
| Shares sold | 5,540,787 | 13,727,303 | $67,280,091 | $165,419,383 |
| Reinvestment of distributions | 1,916,259 | 2,111,307 | 23,052,622 | 25,306,735 |
| Shares redeemed | (7,501,670) | (18,819,577) | (91,007,898) | (226,166,494) |
| Net increase (decrease) | (44,624) | (2,980,967) | $(675,185) | $(35,440,376) |
| Class M | | | | |
| Shares sold | 2,216,052 | 5,337,435 | $26,687,806 | $63,538,185 |
| Reinvestment of distributions | 710,078 | 725,117 | 8,471,240 | 8,629,046 |
| Shares redeemed | (2,235,640) | (5,588,094) | (26,920,363) | (66,670,324) |
| Net increase (decrease) | 690,490 | 474,458 | $8,238,683 | $5,496,907 |
| Class C | | | | |
| Shares sold | 235,030 | 538,892 | $2,794,542 | $6,337,359 |
| Reinvestment of distributions | 108,295 | 100,141 | 1,275,718 | 1,176,826 |
| Shares redeemed | (213,850) | (569,666) | (2,547,234) | (6,680,355) |
| Net increase (decrease) | 129,475 | 69,367 | $1,523,026 | $833,830 |
| Class I | | | | |
| Shares sold | 7,637,522 | 18,230,130 | $93,291,481 | $220,391,466 |
| Reinvestment of distributions | 1,788,223 | 1,909,984 | 21,655,388 | 23,065,247 |
| Shares redeemed | (6,515,473) | (13,073,999) | (79,729,403) | (157,647,342) |
| Net increase (decrease) | 2,910,272 | 7,066,115 | $35,217,466 | $85,809,371 |
| Class Z6 | | | | |
| Shares sold | 1,149,345 | 773,539 | $14,051,844 | $9,848,378 |
| Reinvestment of distributions | 61,617 | 5,348 | 746,178 | 66,053 |
| Shares redeemed | (158,151) | (36,784) | (1,935,283) | (463,616) |
| Net increase (decrease) | 1,052,811 | 742,103 | $12,862,739 | $9,450,815 |
| Advisor Freedom 2050 | | | | |
| Class A | | | | |
| Shares sold | 5,073,711 | 11,534,676 | $61,462,990 | $138,373,199 |
| Reinvestment of distributions | 1,380,223 | 1,468,363 | 16,576,501 | 17,545,962 |
| Shares redeemed | (6,609,335) | (14,017,700) | (80,032,798) | (167,648,735) |
| Net increase (decrease) | (155,401) | (1,014,661) | $(1,993,307) | $(11,729,574) |
| Class M | | | | |
| Shares sold | 2,062,217 | 4,567,158 | $24,835,580 | $54,283,581 |
| Reinvestment of distributions | 556,145 | 548,964 | 6,640,384 | 6,528,163 |
| Shares redeemed | (1,850,058) | (4,589,984) | (22,258,225) | (54,563,744) |
| Net increase (decrease) | 768,304 | 526,138 | $9,217,739 | $6,248,000 |
| Class C | | | | |
| Shares sold | 227,524 | 549,763 | $2,706,833 | $6,479,431 |
| Reinvestment of distributions | 112,829 | 99,910 | 1,331,387 | 1,175,213 |
| Shares redeemed | (217,352) | (472,463) | (2,579,111) | (5,565,541) |
| Net increase (decrease) | 123,001 | 177,210 | $1,459,109 | $2,089,103 |
| Class I | | | | |
| Shares sold | 7,551,921 | 15,917,116 | $92,061,405 | $191,830,629 |
| Reinvestment of distributions | 1,504,665 | 1,535,401 | 18,191,406 | 18,474,731 |
| Shares redeemed | (5,773,584) | (11,055,908) | (70,455,685) | (132,614,886) |
| Net increase (decrease) | 3,283,002 | 6,396,609 | $39,797,126 | $77,690,474 |
| Class Z6 | | | | |
| Shares sold | 844,980 | 472,741 | $10,268,898 | $5,954,232 |
| Reinvestment of distributions | 41,760 | 4,315 | 504,465 | 53,115 |
| Shares redeemed | (101,432) | (34,945) | (1,238,521) | (435,038) |
| Net increase (decrease) | 785,308 | 442,111 | $9,534,842 | $5,572,309 |
| Advisor Freedom 2055 | | | | |
| Class A | | | | |
| Shares sold | 3,573,122 | 7,389,570 | $47,678,222 | $97,025,975 |
| Reinvestment of distributions | 558,186 | 464,392 | 7,390,389 | 6,094,883 |
| Shares redeemed | (4,280,792) | (6,137,615) | (57,286,182) | (80,819,354) |
| Net increase (decrease) | (149,484) | 1,716,347 | $(2,217,571) | $22,301,504 |
| Class M | | | | |
| Shares sold | 1,173,618 | 2,572,643 | $15,592,036 | $33,545,253 |
| Reinvestment of distributions | 208,976 | 162,770 | 2,752,216 | 2,128,319 |
| Shares redeemed | (816,055) | (2,024,835) | (10,812,735) | (26,432,101) |
| Net increase (decrease) | 566,539 | 710,578 | $7,531,517 | $9,241,471 |
| Class C | | | | |
| Shares sold | 104,713 | 234,550 | $1,383,317 | $3,032,224 |
| Reinvestment of distributions | 31,189 | 21,409 | 408,573 | 278,373 |
| Shares redeemed | (80,806) | (154,192) | (1,063,909) | (2,007,723) |
| Net increase (decrease) | 55,096 | 101,767 | $727,981 | $1,302,874 |
| Class I | | | | |
| Shares sold | 6,388,305 | 9,490,266 | $85,734,442 | $125,145,410 |
| Reinvestment of distributions | 712,867 | 575,059 | 9,473,996 | 7,595,782 |
| Shares redeemed | (2,978,672) | (5,026,424) | (39,965,891) | (66,081,707) |
| Net increase (decrease) | 4,122,500 | 5,038,901 | $55,242,547 | $66,659,485 |
| Class Z6 | | | | |
| Shares sold | 423,615 | 249,882 | $5,669,060 | $3,376,620 |
| Reinvestment of distributions | 17,228 | 3,421 | 228,962 | 46,150 |
| Shares redeemed | (52,366) | (21,021) | (704,704) | (287,425) |
| Net increase (decrease) | 388,477 | 232,282 | $5,193,318 | $3,135,345 |
| Advisor Freedom 2060 | | | | |
| Class A | | | | |
| Shares sold | 1,409,138 | 2,518,107 | $16,755,217 | $29,318,657 |
| Reinvestment of distributions | 101,462 | 69,940 | 1,198,268 | 818,159 |
| Shares redeemed | (807,527) | (1,111,272) | (9,601,382) | (13,053,777) |
| Net increase (decrease) | 703,073 | 1,476,775 | $8,352,103 | $17,083,039 |
| Class M | | | | |
| Shares sold | 531,130 | 853,066 | $6,318,556 | $9,913,922 |
| Reinvestment of distributions | 35,607 | 22,158 | 420,164 | 259,519 |
| Shares redeemed | (248,149) | (341,132) | (2,949,070) | (4,020,381) |
| Net increase (decrease) | 318,588 | 534,092 | $3,789,650 | $6,153,060 |
| Class C | | | | |
| Shares sold | 89,752 | 143,405 | $1,067,443 | $1,675,744 |
| Reinvestment of distributions | 7,067 | 3,926 | 83,466 | 46,030 |
| Shares redeemed | (34,893) | (39,845) | (412,410) | (460,687) |
| Net increase (decrease) | 61,926 | 107,486 | $738,499 | $1,261,087 |
| Class I | | | | |
| Shares sold | 2,046,344 | 2,852,854 | $24,436,879 | $33,462,097 |
| Reinvestment of distributions | 122,001 | 78,919 | 1,445,706 | 927,618 |
| Shares redeemed | (880,429) | (957,855) | (10,533,837) | (11,278,135) |
| Net increase (decrease) | 1,287,916 | 1,973,918 | $15,348,748 | $23,111,580 |
| Class Z6 | | | | |
| Shares sold | 116,143 | 137,048 | $1,386,144 | $1,670,098 |
| Reinvestment of distributions | 3,934 | 901 | 46,623 | 10,783 |
| Shares redeemed | (42,819) | (70,553) | (513,319) | (867,591) |
| Net increase (decrease) | 77,258 | 67,396 | $919,448 | $813,290 |
(a) Share transactions for Class Z6 are for the period June 6, 2017 (commencement of sale of shares) to March 31, 2018
10. Other.
The Funds' organizational documents provide former and current trustees and officers with a limited indemnification against liabilities arising in connection with the performance of their duties to the Funds. In the normal course of business, the Funds may also enter into contracts that provide general indemnifications. The Funds' maximum exposure under these arrangements is unknown as this would be dependent on future claims that may be made against the Funds. The risk of material loss from such claims is considered remote.
The Funds do not invest in the Underlying Funds for the purpose of exercising management or control; however, investments by the Funds within their principal investment strategies may represent a significant portion of the Underlying Fund's net assets. At the end of the period, the following Funds were the owners of record of 10% or more of the total outstanding shares of the Underlying Funds.
| Fund | Fidelity Advisor Freedom 2020 Fund | Fidelity Advisor Freedom 2025 Fund | Fidelity Advisor Freedom 2030 Fund | Fidelity Advisor Freedom 2035 Fund | Fidelity Advisor Freedom 2040 Fund | Fidelity Advisor Freedom 2045 Fund |
| Fidelity Advisor Series Equity Growth Fund | 10% | 14% | 17% | 16% | 15% | 10% |
| Fidelity Advisor Series Growth Opportunities Fund | 10% | 14% | 17% | 16% | 15% | 10% |
| Fidelity Advisor Series Small Cap Fund | 10% | 14% | 17% | 16% | 15% | 10% |
The Funds, in aggregate, were the owners of record of more than 20% of the total outstanding shares of the following Underlying Funds.
| Fund | % of shares held |
| Fidelity Advisor Series Equity Growth Fund | 99% |
| Fidelity Advisor Series Growth Opportunities Fund | 99% |
| Fidelity Advisor Series Small Cap Fund | 99% |
Shareholder Expense Example
As a shareholder of a Fund, you incur two types of costs: (1) transaction costs, including sales charges (loads) on purchase payments or redemption proceeds, and (2) ongoing costs, including distribution and/or service (12b-1) fees and other Fund expenses. This Example is intended to help you understand your ongoing costs (in dollars) of investing in the Funds and to compare these costs with the ongoing costs of investing in other mutual funds.
The Example is based on an investment of $1,000 invested at the beginning of the period and held for the entire period (April 1, 2018 to September 30, 2018).
Actual Expenses
The first line of the accompanying table for each Class of each fund provides information about actual account values and actual expenses. You may use the information in this line, together with the amount you invested, to estimate the expenses that you paid over the period. Simply divide your account value by $1,000.00 (for example, an $8,600 account value divided by $1,000.00 = 8.6), then multiply the result by the number in the first line for a Class of the fund under the heading entitled "Expenses Paid During Period" to estimate the expenses you paid on your account during this period. In addition, each Fund, as a shareholder in underlying Fidelity Funds, will indirectly bear its pro-rata share of the fees and expenses incurred by the underlying Fidelity Funds. These fees and expenses are not included in each Fund's annualized expense ratio used to calculate the expense estimates in the table below.
Hypothetical Example for Comparison Purposes
The second line of the accompanying table for each Class of each fund provides information about hypothetical account values and hypothetical expenses based on a Class' actual expense ratio and an assumed rate of return of 5% per year before expenses, which is not the Class' actual return. The hypothetical account values and expenses may not be used to estimate the actual ending account balance or expenses you paid for the period. You may use this information to compare the ongoing costs of investing in the Fund and other funds. To do so, compare this 5% hypothetical example with the 5% hypothetical examples that appear in the shareholder reports of the other funds. In addition, each Fund, as a shareholder in underlying Fidelity Funds, will indirectly bear its pro-rata share of the fees and expenses incurred by the underlying Fidelity Funds. These fees and expenses are not included in each Fund's annualized expense ratio used to calculate the expense estimates in the table below.
Please note that the expenses shown in the table are meant to highlight your ongoing costs only and do not reflect any transaction costs. Therefore, the second line of the table is useful in comparing ongoing costs only, and will not help you determine the relative total costs of owning different funds. In addition, if these transactional costs were included, your costs would have been higher.
| | Annualized Expense Ratio-A | Beginning
Account Value
April 1, 2018 | Ending
Account Value
September 30, 2018 | Expenses Paid
During Period-B
April 1, 2018
to September 30, 2018 |
| Advisor Freedom Income | | | | |
| Class A | .71% | | | |
| Actual | | $1,000.00 | $1,008.30 | $3.57 |
| Hypothetical-C | | $1,000.00 | $1,021.51 | $3.60 |
| Class M | .96% | | | |
| Actual | | $1,000.00 | $1,007.00 | $4.83 |
| Hypothetical-C | | $1,000.00 | $1,020.26 | $4.86 |
| Class C | 1.46% | | | |
| Actual | | $1,000.00 | $1,004.60 | $7.34 |
| Hypothetical-C | | $1,000.00 | $1,017.75 | $7.39 |
| Class I | .47% | | | |
| Actual | | $1,000.00 | $1,008.90 | $2.37 |
| Hypothetical-C | | $1,000.00 | $1,022.71 | $2.38 |
| Class Z6 | .37% | | | |
| Actual | | $1,000.00 | $1,009.80 | $1.86 |
| Hypothetical-C | | $1,000.00 | $1,023.21 | $1.88 |
| Advisor Freedom 2005 | | | | |
| Class A | .73% | | | |
| Actual | | $1,000.00 | $1,013.70 | $3.69 |
| Hypothetical-C | | $1,000.00 | $1,021.41 | $3.70 |
| Class M | .98% | | | |
| Actual | | $1,000.00 | $1,012.20 | $4.94 |
| Hypothetical-C | | $1,000.00 | $1,020.16 | $4.96 |
| Class C | 1.48% | | | |
| Actual | | $1,000.00 | $1,008.60 | $7.45 |
| Hypothetical-C | | $1,000.00 | $1,017.65 | $7.49 |
| Class I | .48% | | | |
| Actual | | $1,000.00 | $1,015.10 | $2.42 |
| Hypothetical-C | | $1,000.00 | $1,022.66 | $2.43 |
| Class Z6 | .37% | | | |
| Actual | | $1,000.00 | $1,014.90 | $1.87 |
| Hypothetical-C | | $1,000.00 | $1,023.21 | $1.88 |
| Advisor Freedom 2010 | | | | |
| Class A | .77% | | | |
| Actual | | $1,000.00 | $1,018.50 | $3.90 |
| Hypothetical-C | | $1,000.00 | $1,021.21 | $3.90 |
| Class M | 1.02% | | | |
| Actual | | $1,000.00 | $1,017.00 | $5.16 |
| Hypothetical-C | | $1,000.00 | $1,019.95 | $5.17 |
| Class C | 1.52% | | | |
| Actual | | $1,000.00 | $1,014.20 | $7.67 |
| Hypothetical-C | | $1,000.00 | $1,017.45 | $7.69 |
| Class I | .53% | | | |
| Actual | | $1,000.00 | $1,019.10 | $2.68 |
| Hypothetical-C | | $1,000.00 | $1,022.41 | $2.69 |
| Class Z6 | .39% | | | |
| Actual | | $1,000.00 | $1,019.80 | $1.97 |
| Hypothetical-C | | $1,000.00 | $1,023.11 | $1.98 |
| Advisor Freedom 2015 | | | | |
| Class A | .82% | | | |
| Actual | | $1,000.00 | $1,023.40 | $4.16 |
| Hypothetical-C | | $1,000.00 | $1,020.96 | $4.15 |
| Class M | 1.07% | | | |
| Actual | | $1,000.00 | $1,021.90 | $5.42 |
| Hypothetical-C | | $1,000.00 | $1,019.70 | $5.42 |
| Class C | 1.57% | | | |
| Actual | | $1,000.00 | $1,019.90 | $7.95 |
| Hypothetical-C | | $1,000.00 | $1,017.20 | $7.94 |
| Class I | .57% | | | |
| Actual | | $1,000.00 | $1,024.70 | $2.89 |
| Hypothetical-C | | $1,000.00 | $1,022.21 | $2.89 |
| Class Z6 | .41% | | | |
| Actual | | $1,000.00 | $1,025.50 | $2.08 |
| Hypothetical-C | | $1,000.00 | $1,023.01 | $2.08 |
| Advisor Freedom 2020 | | | | |
| Class A | .86% | | | |
| Actual | | $1,000.00 | $1,027.40 | $4.37 |
| Hypothetical-C | | $1,000.00 | $1,020.76 | $4.36 |
| Class M | 1.11% | | | |
| Actual | | $1,000.00 | $1,026.00 | $5.64 |
| Hypothetical-C | | $1,000.00 | $1,019.50 | $5.62 |
| Class C | 1.61% | | | |
| Actual | | $1,000.00 | $1,023.20 | $8.17 |
| Hypothetical-C | | $1,000.00 | $1,017.00 | $8.14 |
| Class I | .61% | | | |
| Actual | | $1,000.00 | $1,028.60 | $3.10 |
| Hypothetical-C | | $1,000.00 | $1,022.01 | $3.09 |
| Class Z6 | .43% | | | |
| Actual | | $1,000.00 | $1,029.70 | $2.19 |
| Hypothetical-C | | $1,000.00 | $1,022.91 | $2.18 |
| Advisor Freedom 2025 | | | | |
| Class A | .90% | | | |
| Actual | | $1,000.00 | $1,031.40 | $4.58 |
| Hypothetical-C | | $1,000.00 | $1,020.56 | $4.56 |
| Class M | 1.15% | | | |
| Actual | | $1,000.00 | $1,029.90 | $5.85 |
| Hypothetical-C | | $1,000.00 | $1,019.30 | $5.82 |
| Class C | 1.65% | | | |
| Actual | | $1,000.00 | $1,027.30 | $8.39 |
| Hypothetical-C | | $1,000.00 | $1,016.80 | $8.34 |
| Class I | .65% | | | |
| Actual | | $1,000.00 | $1,032.60 | $3.31 |
| Hypothetical-C | | $1,000.00 | $1,021.81 | $3.29 |
| Class Z6 | .45% | | | |
| Actual | | $1,000.00 | $1,033.60 | $2.29 |
| Hypothetical-C | | $1,000.00 | $1,022.81 | $2.28 |
| Advisor Freedom 2030 | | | | |
| Class A | .94% | | | |
| Actual | | $1,000.00 | $1,038.80 | $4.80 |
| Hypothetical-C | | $1,000.00 | $1,020.36 | $4.76 |
| Class M | 1.19% | | | |
| Actual | | $1,000.00 | $1,037.70 | $6.08 |
| Hypothetical-C | | $1,000.00 | $1,019.10 | $6.02 |
| Class C | 1.70% | | | |
| Actual | | $1,000.00 | $1,034.80 | $8.67 |
| Hypothetical-C | | $1,000.00 | $1,016.55 | $8.59 |
| Class I | .70% | | | |
| Actual | | $1,000.00 | $1,040.00 | $3.58 |
| Hypothetical-C | | $1,000.00 | $1,021.56 | $3.55 |
| Class Z6 | .47% | | | |
| Actual | | $1,000.00 | $1,041.20 | $2.40 |
| Hypothetical-C | | $1,000.00 | $1,022.71 | $2.38 |
| Advisor Freedom 2035 | | | | |
| Class A | .99% | | | |
| Actual | | $1,000.00 | $1,047.20 | $5.08 |
| Hypothetical-C | | $1,000.00 | $1,020.10 | $5.01 |
| Class M | 1.24% | | | |
| Actual | | $1,000.00 | $1,045.50 | $6.36 |
| Hypothetical-C | | $1,000.00 | $1,018.85 | $6.28 |
| Class C | 1.74% | | | |
| Actual | | $1,000.00 | $1,042.70 | $8.91 |
| Hypothetical-C | | $1,000.00 | $1,016.34 | $8.80 |
| Class I | .74% | | | |
| Actual | | $1,000.00 | $1,048.30 | $3.80 |
| Hypothetical-C | | $1,000.00 | $1,021.36 | $3.75 |
| Class Z6 | .49% | | | |
| Actual | | $1,000.00 | $1,049.00 | $2.52 |
| Hypothetical-C | | $1,000.00 | $1,022.61 | $2.48 |
| Advisor Freedom 2040 | | | | |
| Class A | 1.00% | | | |
| Actual | | $1,000.00 | $1,049.70 | $5.14 |
| Hypothetical-C | | $1,000.00 | $1,020.05 | $5.06 |
| Class M | 1.25% | | | |
| Actual | | $1,000.00 | $1,048.60 | $6.42 |
| Hypothetical-C | | $1,000.00 | $1,018.80 | $6.33 |
| Class C | 1.75% | | | |
| Actual | | $1,000.00 | $1,046.20 | $8.98 |
| Hypothetical-C | | $1,000.00 | $1,016.29 | $8.85 |
| Class I | .75% | | | |
| Actual | | $1,000.00 | $1,050.70 | $3.86 |
| Hypothetical-C | | $1,000.00 | $1,021.31 | $3.80 |
| Class Z6 | .49% | | | |
| Actual | | $1,000.00 | $1,052.10 | $2.52 |
| Hypothetical-C | | $1,000.00 | $1,022.61 | $2.48 |
| Advisor Freedom 2045 | | | | |
| Class A | 1.00% | | | |
| Actual | | $1,000.00 | $1,049.30 | $5.14 |
| Hypothetical-C | | $1,000.00 | $1,020.05 | $5.06 |
| Class M | 1.25% | | | |
| Actual | | $1,000.00 | $1,048.00 | $6.42 |
| Hypothetical-C | | $1,000.00 | $1,018.80 | $6.33 |
| Class C | 1.75% | | | |
| Actual | | $1,000.00 | $1,045.10 | $8.97 |
| Hypothetical-C | | $1,000.00 | $1,016.29 | $8.85 |
| Class I | .75% | | | |
| Actual | | $1,000.00 | $1,050.70 | $3.86 |
| Hypothetical-C | | $1,000.00 | $1,021.31 | $3.80 |
| Class Z6 | .49% | | | |
| Actual | | $1,000.00 | $1,052.40 | $2.52 |
| Hypothetical-C | | $1,000.00 | $1,022.61 | $2.48 |
| Advisor Freedom 2050 | | | | |
| Class A | 1.00% | | | |
| Actual | | $1,000.00 | $1,050.00 | $5.14 |
| Hypothetical-C | | $1,000.00 | $1,020.05 | $5.06 |
| Class M | 1.25% | | | |
| Actual | | $1,000.00 | $1,048.50 | $6.42 |
| Hypothetical-C | | $1,000.00 | $1,018.80 | $6.33 |
| Class C | 1.75% | | | |
| Actual | | $1,000.00 | $1,045.60 | $8.97 |
| Hypothetical-C | | $1,000.00 | $1,016.29 | $8.85 |
| Class I | .75% | | | |
| Actual | | $1,000.00 | $1,050.50 | $3.86 |
| Hypothetical-C | | $1,000.00 | $1,021.31 | $3.80 |
| Class Z6 | .49% | | | |
| Actual | | $1,000.00 | $1,052.20 | $2.52 |
| Hypothetical-C | | $1,000.00 | $1,022.61 | $2.48 |
| Advisor Freedom 2055 | | | | |
| Class A | 1.00% | | | |
| Actual | | $1,000.00 | $1,049.60 | $5.14 |
| Hypothetical-C | | $1,000.00 | $1,020.05 | $5.06 |
| Class M | 1.25% | | | |
| Actual | | $1,000.00 | $1,048.30 | $6.42 |
| Hypothetical-C | | $1,000.00 | $1,018.80 | $6.33 |
| Class C | 1.75% | | | |
| Actual | | $1,000.00 | $1,045.50 | $8.97 |
| Hypothetical-C | | $1,000.00 | $1,016.29 | $8.85 |
| Class I | .75% | | | |
| Actual | | $1,000.00 | $1,051.00 | $3.86 |
| Hypothetical-C | | $1,000.00 | $1,021.31 | $3.80 |
| Class Z6 | .49% | | | |
| Actual | | $1,000.00 | $1,051.80 | $2.52 |
| Hypothetical-C | | $1,000.00 | $1,022.61 | $2.48 |
| Advisor Freedom 2060 | | | | |
| Class A | 1.00% | | | |
| Actual | | $1,000.00 | $1,049.50 | $5.14 |
| Hypothetical-C | | $1,000.00 | $1,020.05 | $5.06 |
| Class M | 1.25% | | | |
| Actual | | $1,000.00 | $1,048.70 | $6.42 |
| Hypothetical-C | | $1,000.00 | $1,018.80 | $6.33 |
| Class C | 1.75% | | | |
| Actual | | $1,000.00 | $1,046.00 | $8.98 |
| Hypothetical-C | | $1,000.00 | $1,016.29 | $8.85 |
| Class I | .75% | | | |
| Actual | | $1,000.00 | $1,051.10 | $3.86 |
| Hypothetical-C | | $1,000.00 | $1,021.31 | $3.80 |
| Class Z6 | .49% | | | |
| Actual | | $1,000.00 | $1,051.90 | $2.52 |
| Hypothetical-C | | $1,000.00 | $1,022.61 | $2.48 |
A Annualized expense ratio reflects expenses net of applicable fee waivers.
B Expenses are equal to each Class' annualized expense ratio, multiplied by the average account value over the period, multiplied by 183/ 365 (to reflect the one-half year period). The fees and expenses of the underlying Fidelity Funds in which each Fund invests are not included in each Class' annualized expense ratio.
C 5% return per year before expenses
Board Approval of Investment Advisory Contracts and Management Fees
Fidelity Advisor Freedom Funds
Each year, the Board of Trustees, including the Independent Trustees (together, the Board), votes on the renewal of the management contract (the Advisory Contract) with FMR Co., Inc. (FMRC), an affiliate of Fidelity Management & Research Company (FMR), for each fund. The Board, assisted by the advice of fund counsel and Independent Trustees' counsel, requests and considers a broad range of information relevant to the renewal of the Advisory Contracts throughout the year.
The Board meets regularly and, at each of its meetings, covers an extensive agenda of topics and materials and considers factors that are relevant to its annual consideration of the renewal of each fund's Advisory Contract, including the services and support provided to each fund and its shareholders. The Board has established four standing committees (Committees) — Operations, Audit, Fair Valuation, and Governance and Nominating — each composed of and chaired by Independent Trustees with varying backgrounds, to which the Board has assigned specific subject matter responsibilities in order to enhance effective decision-making by the Board. The Operations Committee, of which all of the Independent Trustees are members, meets regularly throughout the year and considers, among other matters, information specifically related to the annual consideration of the renewal of each fund's Advisory Contract. The Board, acting directly and through its Committees, requests and receives information concerning the annual consideration of the renewal of each fund's Advisory Contract. The Board also meets as needed to review matters specifically related to the Board's annual consideration of the renewal of the Advisory Contracts. Members of the Board may also meet with trustees of other Fidelity funds through joint ad hoc committees to discuss certain matters relevant to all of the Fidelity funds.
At its September 2018 meeting, the Board unanimously determined to renew each fund's Advisory Contract. In reaching its determination, the Board considered all factors it believed relevant, including (i) the nature, extent, and quality of the services to be provided to each fund and its shareholders (including the investment performance of each fund); (ii) the competitiveness of each fund's management fee and total expense ratio relative to peer funds; (iii) the total costs of the services to be provided by and the profits to be realized by Fidelity from its relationships with each fund; and (iv) the extent to which, if any, economies of scale exist and would be realized as each fund grows, and whether any economies of scale are appropriately shared with fund shareholders. The Board also considered that, effective June 1, 2017, each fund had implemented a new fee structure whereby it pays an all-inclusive management fee that covers all operating expenses of the fund, subject to certain exceptions, and varies by class (unified fee) and the underlying Fidelity funds in which the fund invests (Series Funds) no longer pay expenses, with certain limited exceptions. In connection with the renewal of the Advisory Contracts for the funds, the Board and the board of other funds that invest their assets in Series Funds and the boards of the Series Funds formed a joint ad hoc committee to review the responsibilities of each board related to the consideration of the renewal of the Advisory Contracts for the funds, other funds that invest substantially all of their assets in Series Funds, and the Series Funds.
In considering whether to renew the Advisory Contract for each fund, the Board reached a determination, with the assistance of fund counsel and Independent Trustees' counsel and through the exercise of its business judgment, that the renewal of the Advisory Contract was in the best interests of each fund and its shareholders and that the compensation payable under the Advisory Contracts was fair and reasonable. The Board's decision to renew the Advisory Contracts was not based on any single factor, but rather was based on a comprehensive consideration of all the information provided to the Board at its meetings throughout the year. The Board, in reaching its determination to renew the Advisory Contracts, was aware that shareholders of each fund have a broad range of investment choices available to them, including a wide choice among funds offered by Fidelity's competitors, and that each fund's shareholders, who have the opportunity to review and weigh the disclosure provided by the fund in its prospectus and other public disclosures, have chosen to invest in that fund, which is part of the Fidelity family of funds.
Nature, Extent, and Quality of Services Provided. The Board considered Fidelity's staffing as it relates to the funds, including the backgrounds of investment personnel of FMRC, and also considered the funds' investment objectives, strategies, and related investment philosophies. The Independent Trustees also had discussions with senior management of Fidelity's investment operations and investment groups with responsibility for the Series Funds. The Board considered the structure of the investment personnel compensation program and whether this structure provides appropriate incentives to act in the best interests of each fund. Additionally, the Board considered the portfolio managers' investments, if any, in the funds that they manage.
Resources Dedicated to Investment Management and Support Services. The Board reviewed the general qualifications and capabilities of Fidelity's investment staff, including its size, education, experience, and resources, as well as Fidelity's approach to recruiting, managing, and compensating investment personnel. The Board noted that Fidelity has continued to increase the resources devoted to non-U.S. offices, including expansion of Fidelity's global investment organization. The Board also noted that Fidelity's analysts have extensive resources, tools and capabilities that allow them to conduct sophisticated quantitative and fundamental analysis, as well as credit analysis of issuers, counterparties and guarantors. Further, the Board considered that Fidelity's investment professionals have sufficient access to global information and data so as to provide competitive investment results over time, and that those professionals also have access to sophisticated tools that permit them to assess portfolio construction and risk and performance attribution characteristics continuously, as well as to transmit new information and research conclusions rapidly around the world. Additionally, in its deliberations, the Board considered Fidelity's risk management, compliance, and technology and operations capabilities and resources, which are integral parts of the investment management process.
Shareholder and Administrative Services. The Board considered (i) the nature, extent, quality, and cost of advisory, administrative, and shareholder services performed by Fidelity under the Advisory Contract and under separate agreements covering transfer agency and pricing and bookkeeping services for each fund; (ii) the nature and extent of the supervision of third party service providers, principally custodians, subcustodians, and pricing vendors; and (iii) the resources devoted to, and the record of compliance with, each fund's compliance policies and procedures.
The Board noted that the growth of fund assets over time across the complex allows Fidelity to reinvest in the development of services designed to enhance the value and convenience of the Fidelity funds as investment vehicles. These services include 24-hour access to account information and market information through telephone representatives and over the Internet, investor education materials and asset allocation tools, and the expanded availability of Fidelity Investor Centers.
Investment in a Large Fund Family. The Board considered the benefits to shareholders of investing in a Fidelity fund, including the benefits of investing in a fund that is part of a large family of funds offering a variety of investment disciplines and providing a large variety of mutual fund investor services. The Board noted that Fidelity had taken, or had made recommendations that resulted in the Fidelity funds taking, a number of actions over the previous year that benefited particular funds, including: (i) continuing to dedicate additional resources to Fidelity's investment research process, which includes meetings with management of issuers of securities in which the funds invest, and to the support of the senior management team that oversees asset management; (ii) continuing efforts to enhance Fidelity's global research capabilities; (iii) launching new funds and making other enhancements to meet client needs; (iv) launching new share classes of existing funds; (v) eliminating purchase minimums and broadening eligibility requirements for certain funds and share classes; (vi) reducing management fees and total expenses for certain growth equity funds and index funds; (vii) lowering expense caps for certain existing funds and classes, and converting certain voluntary expense caps to contractual caps, to reduce expenses borne by shareholders; (viii) eliminating short-term redemption fees for funds that had such fees; (ix) rationalizing product lines and gaining increased efficiencies from fund mergers and share class consolidations; (x) continuing to develop, acquire and implement systems and technology to improve services to the funds and shareholders, strengthen information security, and increase efficiency; and (xi) continuing to implement enhancements to further strengthen Fidelity's product line to increase investors' probability of success in achieving their investment goals, including retirement income goals.
Investment Performance. The Board considered whether each fund has operated in accordance with its investment objective, as well as its record of compliance with its investment restrictions and its performance history.
The Board took into account discussions that occur at Board meetings throughout the year with representatives of the investment adviser about fund investment performance. In this regard the Board noted that as part of regularly scheduled fund reviews and other reports to the Board on fund performance, the Board considers annualized return information for each fund for different time periods, measured against one or more appropriate securities market indices, including a customized blended index that reflects the respective weights of the fund's asset classes (each a "benchmark index") and a peer group of funds with similar objectives ("peer group"), if any. In its evaluation of fund investment performance at meetings throughout the year, the Board gave particular attention to information indicating underperformance of certain Fidelity funds for specific time periods and discussed with the investment adviser the reasons for such underperformance.
In addition to reviewing absolute and relative fund performance, the Independent Trustees periodically consider the appropriateness of fund performance metrics in evaluating the results achieved. In general, the Independent Trustees believe that fund performance should be evaluated based on gross performance (before fees and expenses, including acquired fund fees and expenses, but after transaction costs, if any) compared to appropriate benchmark indices, over appropriate time periods that may include full market cycles, and on net performance (after fees and expenses, including acquired fund fees and expenses, if any) compared to peer groups, as applicable, over the same periods, taking into account relevant factors including the following: general market conditions; the extent to which particular underlying funds affected performance; and fund cash flows and other factors. Depending on the circumstances, the Independent Trustees may be satisfied with a fund's performance notwithstanding that it lags its benchmark index or peer group for certain periods.
The Independent Trustees recognize that shareholders evaluate performance on a net basis over their own holding periods, for which one-, three-, and five-year periods are often used as a proxy. For this reason, the performance information reviewed by the Board also included net cumulative calendar year total return information for each fund and an appropriate benchmark index for the most recent one-, three-, and five-year periods (for the most recent one- and three-year periods for Fidelity Advisor Freedom 2060 Fund).
Based on its review, the Board concluded that the nature, extent, and quality of services provided to each fund under the Advisory Contracts should continue to benefit the shareholders of each fund.
Competitiveness of Management Fee and Total Expense Ratio. The Board considered each fund's management fee and total expense ratio compared to "mapped groups" of competitive funds and classes created for the purpose of facilitating the Trustees' competitive analysis of management fees and total expenses. Fidelity creates "mapped groups" by combining similar Lipper investment objective categories that have comparable investment mandates. Combining Lipper investment objective categories aids the Board's management fee and total expense ratio comparisons by broadening the competitive group used for comparison.
Management Fee. The Board considered two proprietary management fee comparisons for the 12-month periods shown in basis points (BP) in the charts below. The group of Lipper funds used by the Board for management fee comparisons is referred to below as the "Total Mapped Group." The Total Mapped Group comparison focuses on a fund's standing in terms of gross management fees before expense reimbursements or caps relative to the total universe of funds with comparable investment mandates, regardless of whether their management fee structures also are comparable. Funds with comparable investment mandates offer exposure to similar types of securities. Funds with comparable management fee structures have similar management fee contractual arrangements (
e.g., flat rate charged for advisory services, all-inclusive fee rate,
etc.). "TMG %" represents the percentage of funds in the Total Mapped Group that had management fees that were lower than a fund's. For example, a hypothetical TMG % of 20% would mean that 80% of the funds in the Total Mapped Group had higher, and 20% had lower, management fees than a fund. The funds' actual TMG %s and the number of funds in the Total Mapped Group are in the charts below. The "Asset-Size Peer Group" (ASPG) comparison focuses on a fund's standing relative to a subset of non-Fidelity funds within the Total Mapped Group that are similar in size and management fee structure. For example, if a fund is in the first quartile of the ASPG, the fund's management fee ranks in the least expensive or lowest 25% of funds in the ASPG. The ASPG represents at least 15% of the funds in the Total Mapped Group with comparable asset size and management fee structures, subject to a minimum of 50 funds (or all funds in the Total Mapped Group if fewer than 50). Additional information, such as the ASPG quartile in which a fund's management fee rate ranked, is also included in the charts and was considered by the Board. The Board considered that the charts below reflect the funds' fee structure effective June 1, 2017, as if it was in effect for the entire year.
Fidelity Advisor Freedom 2005 Fund
Fidelity Advisor Freedom 2010 Fund
Fidelity Advisor Freedom 2015 Fund
Fidelity Advisor Freedom 2020 Fund
Fidelity Advisor Freedom 2025 Fund
Fidelity Advisor Freedom 2030 Fund
Fidelity Advisor Freedom 2035 Fund
Fidelity Advisor Freedom 2040 Fund
Fidelity Advisor Freedom 2045 Fund
Fidelity Advisor Freedom 2050 Fund
Fidelity Advisor Freedom 2055 Fund
Fidelity Advisor Freedom 2060 Fund
Fidelity Advisor Freedom Income Fund
The Board compared each fund's class-level management fee rate for the current fiscal year relative to the median of its competitor funds in the applicable Total Mapped Group based on competitive data for 2017. The Board noted that each fund's class-level management fee rate ranks above the median of its competitor funds in the applicable Total Mapped Group based on competitive data for 2017. The Board noted that the majority of peer funds do not have top-level management fees, similar to the funds' fee structure prior to June 1, 2017. The Board also noted that the funds' total expense comparisons, which include the expenses of the Series Funds, facilitate better comparisons with funds and classes that use different expense structures and that the funds' total expense ratio comparisons to competitors generally were more favorable.
Based on its review, the Board concluded that each fund's management fee is fair and reasonable in light of the services that the fund receives and the other factors considered.
Total Expense Ratio. In its review of the total expense ratio of each class of each fund, the Board considered the fund's class-level management fee rate under the Advisory Contract. The Board also considered other expenses, such as transfer agent fees, pricing and bookkeeping fees, and custodial, legal, and audit fees, paid by FMR under the unified fee arrangement. The Board also noted that Fidelity may agree to waive fees and expenses from time to time, and the extent to which, if any, it has done so for each fund. As part of its review, the Board considered the total expense ratio of each class of each fund compared to the median total expenses for competitor funds (including expenses of underlying funds) based on competitive data for 2017. Each class of each fund is compared to those funds and classes in the Total Mapped Group (used by the Board for management fee comparisons) that have a similar sales load structure.
The Board noted that each fund offers multiple classes, each of which has a different sales load and 12b-1 fee structure, and that the multiple structures are intended to offer a range of pricing options for the intermediary market. The Board also noted that the total expense ratios of the classes of each fund vary primarily by the level of their 12b-1 fees. The Board considered that, in general, various factors can affect total expense ratios.
The Board noted that the total expense ratio of Class A (including expenses of the Series Funds): (i) ranked below the competitive median for 2017 for Fidelity Advisor Freedom 2005 Fund, Fidelity Advisor Freedom 2010 Fund, Fidelity Advisor Freedom 2015 Fund, Fidelity Advisor Freedom 2020 Fund, Fidelity Advisor Freedom 2025 Fund, and Fidelity Advisor Freedom Income Fund; (ii) ranked equal to the competitive median for 2017 for Fidelity Advisor Freedom 2030 Fund; and (iii) ranked above the competitive median for 2017 for Fidelity Advisor Freedom 2035 Fund, Fidelity Advisor Freedom 2040 Fund, Fidelity Advisor Freedom 2045 Fund, Fidelity Advisor Freedom 2050 Fund, Fidelity Advisor Freedom 2055 Fund, and Fidelity Advisor Freedom 2060. The Board noted that for each fund for which the total expense ratio of Class A was above the competitive median, the class was above the competitive median because a number of competitor target date funds are classified by Lipper as active, even though their underlying holdings are primarily passive. The Board considered that, when the Total Mapped Group is adjusted to remove funds that invest primarily in passive products, the total expense ratio of Class A of each such fund ranks below the competitive median.
The Board noted that the total expense ratio of Class M of each fund (including expenses of the Series Funds) ranked above the competitive median for 2017. The Board noted that the total expense ratio of Class M was above the competitive median primarily because of higher 12b-1 fees on Class M as compared to most competitor funds. Class M has a higher 12b-1 fee, but a lower front-end sales charge, than traditionally priced front-end sales charge classes. The Board considered that Class M is primarily sold load-waived to retirement plans and intermediary wrap programs where its 0.50% 12b-1 fee is comparable to competing no-load, higher 12b-1 fee classes designed specifically for retirement plans and wrap programs. The Board noted that, when compared with institutional load funds with a 0.50% 12b-1 fee, the total expense ratio of Class M of certain funds is below median and the total expense ratio of Class M of the remaining funds is above median.
The Board noted that the total expense ratio of Class C (including expenses of the Series Funds): (i) ranked below the competitive median for 2017 for Fidelity Advisor Freedom 2005 Fund and Fidelity Advisor Freedom Income Fund; and (ii) ranked above the competitive median for 2017 for all other funds. The Board noted that the total expense ratio of Class C was above the competitive median primarily because of its 1.00% 12b-1 fee. The Board noted that, when compared with competitor funds that charge a 1.00% 12b-1 fee, the total expense ratio of Class C of certain funds is below median and the total expense ratio of Class C of the remaining funds is above the median.
The Board noted that the total expense ratio of Class I (including expenses of the Series Funds): (i) ranked below the competitive median for 2017 for Fidelity Advisor Freedom 2005 Fund, Fidelity Advisor Freedom 2010 Fund, Fidelity Advisor Freedom 2015 Fund, Fidelity Advisor Freedom 2020 Fund, Fidelity Advisor Freedom 2025 Fund, and Fidelity Advisor Freedom Income Fund; and (ii) ranked above the competitive median for 2017 for Fidelity Advisor Freedom 2030 Fund, Fidelity Advisor Freedom 2035 Fund, Fidelity Advisor Freedom 2040 Fund, Fidelity Advisor Freedom 2045 Fund, Fidelity Advisor Freedom 2050 Fund, Fidelity Advisor Freedom 2055 Fund, and Fidelity Advisor Freedom 2060 Fund. The Board noted that, for each fund for which the total expense ratio of Class I was above the competitive median, the class was above the competitive median because a number of competitor target date funds are classified by Lipper as active, even though their underlying holdings are primarily passive. The Board considered that, when the Total Mapped Group is adjusted to remove funds that invest primarily in passive products, the total expense ratio of Class I of each such fund ranks below the competitive median.
The Board noted that the total expense ratio of Class Z6 (including expenses of the Series Funds) for each fund ranked below the competitive median for 2017.
The Board considered that current contractual arrangements for the fund oblige FMR to pay all "class-level" expenses of Class Z6 of each fund to the extent necessary to limit total operating expenses, with certain exceptions, to an amount specified in the applicable expense contract.
These contractual arrangements may not be amended to increase the fees or expenses payable by Class Z6 of a fund except by a vote of a majority of the Board of Trustees and by a vote of a majority of the outstanding voting securities of Class Z6 of the applicable fund.
Fees Charged to Other Fidelity Clients. The Board also considered Fidelity fee structures and other information with respect to clients of Fidelity, such as other funds advised or subadvised by Fidelity, pension plan clients, and other institutional clients with similar mandates. The Board noted that a joint ad hoc committee created by it and the boards of other Fidelity funds periodically reviews and compares Fidelity's institutional investment advisory business with its business of providing services to the Fidelity funds and also noted the most recent findings of the committee. The Board noted that the committee's review included a consideration of the differences in services provided, fees charged, and costs incurred, as well as competition in the markets serving the different categories of clients.
Based on its review of total expense ratios and fees charged to other Fidelity clients, the Board concluded that the total expense ratio of each class of each fund was reasonable in light of the services that the fund and its shareholders receive and the other factors considered.
Costs of the Services and Profitability. The Board considered the revenues earned and the expenses incurred by Fidelity in conducting the business of developing, marketing, distributing, managing, administering and servicing each fund and the Series Funds in which each fund invests and in servicing each fund's shareholders. The Board also considered the level of Fidelity's profits in respect of all the Fidelity funds.
On an annual basis, Fidelity presents to the Board information about the profitability of its relationships with each fund. Fidelity calculates profitability information for each fund, as well as aggregate profitability information for groups of Fidelity funds and all Fidelity funds, using a series of detailed revenue and cost allocation methodologies which originate with the books and records of Fidelity on which Fidelity's audited financial statements are based. The Audit Committee of the Board reviews any significant changes from the prior year's methodologies.
PricewaterhouseCoopers LLP (PwC), auditor to Fidelity and certain Fidelity funds, has been engaged annually by the Board as part of the Board's assessment of Fidelity's profitability analysis. PwC's engagement includes the review and assessment of the methodologies used by Fidelity in determining the revenues and expenses attributable to Fidelity's mutual fund business, and completion of agreed-upon procedures in respect of the mathematical accuracy of the fund profitability information and its conformity to established allocation methodologies. After considering PwC's reports issued under the engagement and information provided by Fidelity, the Board concluded that while other allocation methods may also be reasonable, Fidelity's profitability methodologies are reasonable in all material respects.
The Board also reviewed Fidelity's non-fund businesses and potential indirect benefits such businesses may have received as a result of their association with Fidelity's mutual fund business (i.e., fall-out benefits) as well as cases where Fidelity's affiliates may benefit from the funds' business. The Board noted that changes to fall-out benefits year-over-year reflect business developments at Fidelity's various businesses.
The Board considered the costs of the services provided by and the profits realized by Fidelity in connection with the operation of each fund and was satisfied that the profitability was not excessive.
Economies of Scale. The Board considered whether there have been economies of scale in respect of the management of the Fidelity funds, whether the Fidelity funds (including each fund) have appropriately benefited from any such economies of scale, and whether there is potential for realization of any further economies of scale. The Board considered the extent to which each fund will benefit from economies of scale as assets grow through increased services to the fund, through waivers or reimbursements, or through fee or expense ratio reductions. The Board recognized that, due to each fund's current contractual arrangements, its expense ratio will not decline if the fund's operating costs decrease as assets grow, or rise as assets decrease. The Board also noted that a committee (the Economies of Scale Committee) created by it and the boards of other Fidelity funds periodically analyzes whether Fidelity attains economies of scale in respect of the management and servicing of the Fidelity funds, whether the Fidelity funds have appropriately benefited from such economies of scale, and whether there is potential for realization of any further economies of scale.
The Board concluded, taking into account the analysis of the Economies of Scale Committee, that economies of scale, if any, are being appropriately shared between fund shareholders and Fidelity.
Additional Information Requested by the Board. In order to develop fully the factual basis for consideration of the Fidelity funds' advisory contracts, the Board requested and received additional information on certain topics, including: (i) Fidelity's fund profitability methodology, profitability trends for certain funds, the allocation of various costs to different funds, and the impact of certain factors on fund profitability results; (ii) portfolio manager changes that have occurred during the past year and the amount of the investment that each portfolio manager has made in the Fidelity fund(s) that he or she manages; (iii) Fidelity's compensation structure for portfolio managers, research analysts, and other key personnel, including its effects on fund profitability, the rationale for the compensation structure, and the extent to which current market conditions have affected retention and recruitment; (iv) the arrangements with and compensation paid to certain fund sub-advisers on behalf of the Fidelity funds and the treatment of such compensation within Fidelity's fund profitability methodology; (v) the terms of Fidelity's voluntary expense limitation agreements; (vi) the methodology with respect to competitive fund data and peer group classifications; (vii) Fidelity's transfer agent fee, expense, and service structures for different funds and classes relative to competitive trends, and the impact of the increased use of omnibus accounts; (viii) new developments in the retail and institutional marketplaces and the competitive positioning of the funds relative to other investment products and services; (ix) the impact of recent changes to the money market fund landscape, including the full implementation of money market fund reform and rising interest rates, on Fidelity's money market funds; (x) the funds' share class structures and distribution channels; and (xi) explanations regarding the relative total expense ratios of certain funds and classes, total expense competitive trends and methodologies for total expense competitive comparisons, and actions that might be taken by Fidelity to reduce total expense ratios for certain classes. In addition, the Board considered its discussions with Fidelity throughout the year regarding enhanced information security initiatives and the funds' fair valuation policies.
Based on its evaluation of all of the conclusions noted above, and after considering all factors it believed relevant, the Board concluded that the advisory fee arrangements are fair and reasonable, and that each fund's Advisory Contract should be renewed.
AFFZ6-SANN-1118
1.9885871.101
Fidelity Freedom® Funds - Income, 2005, 2010, 2015, 2020, 2025, 2030, 2035, 2040, 2045, 2050, 2055, 2060 - Class K6
Semi-Annual Report September 30, 2018 |
|
Contents
To view a fund's proxy voting guidelines and proxy voting record for the 12-month period ended June 30, visit http://www.fidelity.com/proxyvotingresults or visit the Securities and Exchange Commission's (SEC) web site at http://www.sec.gov.
You may also call 1-800-835-5092 to request a free copy of the proxy voting guidelines.
Standard & Poor's, S&P and S&P 500 are registered service marks of The McGraw-Hill Companies, Inc. and have been licensed for use by Fidelity Distributors Corporation.
Other third-party marks appearing herein are the property of their respective owners.
All other marks appearing herein are registered or unregistered trademarks or service marks of FMR LLC or an affiliated company. © 2018 FMR LLC. All rights reserved.
This report and the financial statements contained herein are submitted for the general information of the shareholders of the Funds. This report is not authorized for distribution to prospective investors in the Funds unless preceded or accompanied by an effective prospectus.
A fund files its complete schedule of portfolio holdings with the SEC for the first and third quarters of each fiscal year on Form N-Q. Forms N-Q are available on the SEC’s web site at http://www.sec.gov. A fund's Forms N-Q may be reviewed and copied at the SEC’s Public Reference Room in Washington, DC. Information regarding the operation of the SEC's Public Reference Room may be obtained by calling 1-800-SEC-0330.
For a complete list of a fund's portfolio holdings, view the most recent holdings listing, semiannual report, or annual report on Fidelity's web site at http://www.fidelity.com, http://www.institutional.fidelity.com, or http://www.401k.com, as applicable.
NOT FDIC INSURED •MAY LOSE VALUE •NO BANK GUARANTEE
Neither the Funds nor Fidelity Distributors Corporation is a bank.
Note to shareholders:
At its May 2018 meeting, the Board of Trustees approved incremental updates to the strategic asset allocation (i.e., glide path) of Fidelity Freedom Funds, adding U.S. Treasury Inflation-Protected Securities and long-term U.S. Treasury bonds as fixed exposures in the Funds’ bond allocations, and slightly reducing the equity and short-term debt allocations for shorter-dated Funds. These updates are expected to be fully implemented by the end of 2018.
Fidelity Freedom® Income Fund
Investment Summary (Unaudited)
The information in the following tables is based on the direct investments of the Fund.
Top Holdings as of September 30, 2018
| | % of fund's net assets |
| Fidelity Series Investment Grade Bond Fund | 37.0 |
| Fidelity Series Government Money Market Fund 2.12% | 18.5 |
| Fidelity Series Inflation-Protected Bond Index Fund | 12.9 |
| Fidelity Series Short-Term Credit Fund | 4.7 |
| Fidelity Series Long-Term Treasury Bond Index Fund | 4.5 |
| Fidelity Series Emerging Markets Opportunities Fund | 2.7 |
| Fidelity Series International Growth Fund | 2.2 |
| Fidelity Series International Value Fund | 2.2 |
| Fidelity Series Commodity Strategy Fund | 1.9 |
| Fidelity Series Intrinsic Opportunities Fund | 1.7 |
| | 88.3 |
Asset Allocation (% of fund's net assets)
| Period end |
| | Domestic Equity Funds | 11.2% |
| | International Equity Funds | 8.2% |
| | Bond Funds | 57.2% |
| | Short-Term Funds | 23.4% |

Domestic Equity Funds category includes Fidelity Series Commodity Strategy Fund which invests in commodity-related investments.
Fidelity Freedom® Income Fund
Schedule of Investments September 30, 2018 (Unaudited)
Showing Percentage of Net Assets
| U.S. Treasury Obligations - 0.0% | | | |
| | | Principal Amount | Value |
| U.S. Treasury Bills, yield at date of purchase 1.97% to 2.07% 11/1/18 to 11/29/18 (a) | | | |
| (Cost $2,046,120) | | 2,050,000 | 2,045,940 |
| | | Shares | Value |
|
| Domestic Equity Funds - 11.2% | | | |
| Fidelity Series All-Sector Equity Fund (b) | | 858,243 | $11,680,686 |
| Fidelity Series Blue Chip Growth Fund (b) | | 1,560,696 | 23,878,651 |
| Fidelity Series Commodity Strategy Fund (b) | | 13,244,322 | 66,221,611 |
| Fidelity Series Growth Company Fund (b) | | 2,389,870 | 48,299,268 |
| Fidelity Series Intrinsic Opportunities Fund (b) | | 3,192,734 | 58,522,811 |
| Fidelity Series Large Cap Stock Fund (b) | | 3,223,063 | 51,343,391 |
| Fidelity Series Large Cap Value Index Fund (b) | | 1,082,077 | 14,283,418 |
| Fidelity Series Opportunistic Insights Fund (b) | | 1,306,853 | 25,941,035 |
| Fidelity Series Small Cap Discovery Fund (b) | | 556,478 | 6,761,204 |
| Fidelity Series Small Cap Opportunities Fund (b) | | 1,423,282 | 20,908,009 |
| Fidelity Series Stock Selector Large Cap Value Fund (b) | | 2,935,156 | 38,802,766 |
| Fidelity Series Value Discovery Fund (b) | | 2,009,660 | 27,512,252 |
| TOTAL DOMESTIC EQUITY FUNDS | | | |
| (Cost $276,504,143) | | | 394,155,102 |
|
| International Equity Funds - 8.2% | | | |
| Fidelity Series Canada Fund (b) | | 694,311 | 7,505,503 |
| Fidelity Series Emerging Markets Fund (b) | | 1,256,778 | 12,178,180 |
| Fidelity Series Emerging Markets Opportunities Fund (b) | | 4,889,313 | 93,825,908 |
| Fidelity Series International Growth Fund (b) | | 4,785,578 | 78,483,481 |
| Fidelity Series International Small Cap Fund (b) | | 995,982 | 17,828,076 |
| Fidelity Series International Value Fund (b) | | 7,413,802 | 77,993,198 |
| TOTAL INTERNATIONAL EQUITY FUNDS | | | |
| (Cost $211,566,464) | | | 287,814,346 |
|
| Bond Funds - 57.2% | | | |
| Fidelity Series Emerging Markets Debt Fund (b) | | 2,751,836 | 26,224,993 |
| Fidelity Series Floating Rate High Income Fund (b) | | 923,890 | 8,795,428 |
| Fidelity Series High Income Fund (b) | | 4,996,399 | 48,015,395 |
| Fidelity Series Inflation-Protected Bond Index Fund (b) | | 46,587,298 | 452,362,667 |
| Fidelity Series International Credit Fund (b) | | 189,327 | 1,861,080 |
| Fidelity Series Investment Grade Bond Fund (b) | | 119,477,891 | 1,301,114,228 |
| Fidelity Series Long-Term Treasury Bond Index Fund (b) | | 19,022,011 | 156,741,370 |
| Fidelity Series Real Estate Income Fund (b) | | 1,582,236 | 17,056,501 |
| TOTAL BOND FUNDS | | | |
| (Cost $2,027,662,368) | | | 2,012,171,662 |
|
| Short-Term Funds - 23.4% | | | |
| Fidelity Cash Central Fund, 2.11% (c) | | 6,323,103 | 6,324,368 |
| Fidelity Series Government Money Market Fund 2.12% (b)(d) | | 650,644,590 | 650,644,590 |
| Fidelity Series Short-Term Credit Fund (b) | | 16,816,160 | 165,807,334 |
| TOTAL SHORT-TERM FUNDS | | | |
| (Cost $824,593,524) | | | 822,776,292 |
| TOTAL INVESTMENT IN SECURITIES - 100.0% | | | |
| (Cost $3,342,372,619) | | | 3,518,963,342 |
| NET OTHER ASSETS (LIABILITIES) - 0.0% | | | (1,365,656) |
| NET ASSETS - 100% | | | $3,517,597,686 |
| Futures Contracts | | | | | |
| | Number of contracts | Expiration Date | Notional Amount | Value | Unrealized Appreciation/(Depreciation) |
| Purchased | | | | | |
| Equity Index Contracts | | | | | |
| ICE E-mini MSCI EAFE Index Contracts (United States) | 74 | Dec. 2018 | $7,309,350 | $6,992 | $6,992 |
| ICE E-mini MSCI Emerging Markets Index Contracts (United States) | 302 | Dec. 2018 | 15,850,470 | 306,292 | 306,292 |
|
| TOTAL PURCHASED | | | | | 313,284 |
|
| Sold | | | | | |
| Equity Index Contracts | | | | | |
| CME E-mini S&P 500 Index Contracts (United States) | 120 | Dec. 2018 | 17,514,000 | (5,821) | (5,821) |
| TOTAL FUTURES CONTRACTS | | | | | $307,463 |
The notional amount of futures purchased as a percentage of Net Assets is 0.7%
The notional amount of futures sold as a percentage of Net Assets is 0.5%
Legend
(a) Security or a portion of the security was pledged to cover margin requirements for futures contracts. At period end, the value of securities pledged amounted to $960,279.
(b) Affiliated Fund
(c) Affiliated fund that is generally available only to investment companies and other accounts managed by Fidelity Investments. The rate quoted is the annualized seven-day yield of the fund at period end. A complete unaudited listing of the fund's holdings as of its most recent quarter end is available upon request. In addition, each Fidelity Central Fund's financial statements are available on the SEC's website or upon request.
(d) The rate quoted is the annualized seven-day yield of the fund at period end.
Affiliated Central Funds
Information regarding fiscal year to date income earned by the Fund from investments in Fidelity Central Funds is as follows:
| Fund | Income earned |
| Fidelity Cash Central Fund | $22,227 |
| Total | $22,227 |
Amounts in the income column in the above table include any capital gain distributions from underlying funds, which are presented in the corresponding line-item in the Statement of Operations if applicable.
Affiliated Underlying Funds
Fiscal year to date information regarding the Fund's investments in affiliated Underlying Funds, excluding any Money Market Central Funds, is presented below. Exchanges between classes of the same affiliated Underlying Funds may occur.
| Affiliate | Value, beginning of period | Purchases | Sales Proceeds | Dividend Income | Realized Gain (loss) | Change in Unrealized appreciation (depreciation) | Value, end of period |
| Fidelity Series 100 Index Fund | $15,916,073 | $-- | $16,684,277 | $-- | $6,617,339 | $(5,849,135) | $-- |
| Fidelity Series All-Sector Equity Fund | 30,551,376 | 115,455 | 21,947,241 | -- | 4,831,585 | (1,870,489) | 11,680,686 |
| Fidelity Series Blue Chip Growth Fund | 31,582,362 | 2,352,394 | 13,043,656 | 2,230,117 | 4,900,631 | (1,913,080) | 23,878,651 |
| Fidelity Series Canada Fund | 9,334,390 | 35,276 | 2,424,341 | -- | 38,184 | 521,994 | 7,505,503 |
| Fidelity Series Commodity Strategy Fund | 79,034,933 | 9,548,706 | 16,818,873 | 3,986,945 | (7,468,813) | 1,925,658 | 66,221,611 |
| Fidelity Series Emerging Markets Debt Fund | 28,508,764 | 902,235 | 1,638,828 | 816,946 | (60,408) | (1,486,770) | 26,224,993 |
| Fidelity Series Emerging Markets Fund | -- | 12,208,821 | -- | -- | -- | (30,641) | 12,178,180 |
| Fidelity Series Emerging Markets Opportunities Fund | 114,600,734 | 420,188 | 7,342,008 | - | 1,620,303 | (15,473,309) | 93,825,908 |
| Fidelity Series Floating Rate High Income Fund | 9,147,819 | 274,285 | 635,291 | 238,738 | (20,985) | 29,600 | 8,795,428 |
| Fidelity Series Government Money Market Fund 2.12% | 859,951,401 | 69,275,671 | 278,582,482 | 7,435,363 | -- | -- | 650,644,590 |
| Fidelity Series Growth Company Fund | 67,193,973 | 245,130 | 28,224,982 | -- | 12,524,066 | (3,438,919) | 48,299,268 |
| Fidelity Series High Income Fund | 56,045,887 | 1,643,209 | 10,098,549 | 1,457,553 | (391,510) | 816,358 | 48,015,395 |
| Fidelity Series Inflation-Protected Bond Index Fund | 140,449,749 | 324,353,975 | 10,956,858 | 440,347 | (194,602) | (1,289,597) | 452,362,667 |
| Fidelity Series International Credit Fund | 1,872,196 | 23,073 | 15,354 | 23,073 | (207) | (18,628) | 1,861,080 |
| Fidelity Series International Growth Fund | 97,009,280 | 4,906,227 | 24,528,224 | -- | 5,569,188 | (4,472,990) | 78,483,481 |
| Fidelity Series International Small Cap Fund | 24,130,987 | 722,091 | 6,131,344 | -- | 1,086,699 | (1,980,357) | 17,828,076 |
| Fidelity Series International Value Fund | 95,143,387 | 2,872,788 | 19,256,243 | -- | 2,026,684 | (2,793,418) | 77,993,198 |
| Fidelity Series Intrinsic Opportunities Fund | 78,260,126 | 2,885,114 | 24,344,665 | 2,589,390 | 6,363,540 | (4,641,304) | 58,522,811 |
| Fidelity Series Investment Grade Bond Fund | 1,414,325,467 | 30,307,343 | 127,389,060 | 19,355,296 | (4,842,803) | (11,286,719) | 1,301,114,228 |
| Fidelity Series Large Cap Stock Fund | 69,040,943 | 4,047,231 | 24,920,395 | 3,779,653 | 4,311,623 | (1,136,011) | 51,343,391 |
| Fidelity Series Large Cap Value Index Fund | 19,791,623 | 73,996 | 6,783,122 | -- | 782,291 | 418,630 | 14,283,418 |
| Fidelity Series Long-Term Treasury Bond Index Fund | 78,600,027 | 106,098,031 | 22,416,953 | 1,345,713 | (967,598) | (4,572,137) | 156,741,370 |
| Fidelity Series Opportunistic Insights Fund | 34,616,831 | 133,023 | 12,971,038 | -- | 5,678,589 | (1,516,370) | 25,941,035 |
| Fidelity Series Real Estate Equity Fund | 6,171,500 | 89,767 | 6,510,092 | 82,424 | 1,186,459 | (937,634) | -- |
| Fidelity Series Real Estate Income Fund | 17,355,440 | 796,611 | 1,202,716 | 729,693 | 1,034 | 106,132 | 17,056,501 |
| Fidelity Series Short-Term Credit Fund | 211,429,964 | 3,118,161 | 48,731,013 | 2,306,640 | (675,183) | 665,405 | 165,807,334 |
| Fidelity Series Small Cap Discovery Fund | 9,419,231 | 587,510 | 3,144,728 | 551,769 | 470,284 | (571,093) | 6,761,204 |
| Fidelity Series Small Cap Opportunities Fund | 28,758,372 | 1,735,904 | 11,073,522 | 1,625,936 | 3,635,064 | (2,147,809) | 20,908,009 |
| Fidelity Series Stock Selector Large Cap Value Fund | 53,907,465 | 202,727 | 18,643,449 | -- | 3,992,165 | (656,142) | 38,802,766 |
| Fidelity Series Value Discovery Fund | 38,314,030 | 143,770 | 12,952,582 | -- | 3,272,501 | (1,265,467) | 27,512,252 |
| | $3,720,464,330 | $580,118,712 | $779,411,886 | $48,995,596 | $54,286,120 | $(64,864,242) | $3,510,593,034 |
Amounts in the income column in the above table include any capital gain distributions from underlying funds, which are presented in the corresponding line-item in the Statement of Operations if applicable.
Investment Valuation
The following is a summary of the inputs used, as of September 30, 2018, involving the Fund's assets and liabilities carried at fair value. The inputs or methodology used for valuing securities may not be an indication of the risk associated with investing in those securities. For more information on valuation inputs, and their aggregation into the levels used below, please refer to the Investment Valuation section in the accompanying Notes to Financial Statements.
| | Valuation Inputs at Reporting Date: |
| Description | Total | Level 1 | Level 2 | Level 3 |
| Investments in Securities: | | | | |
| Other Short-Term Investments | $2,045,940 | $-- | $2,045,940 | $-- |
| Domestic Equity Funds | 394,155,102 | 394,155,102 | -- | -- |
| International Equity Funds | 287,814,346 | 287,814,346 | -- | -- |
| Bond Funds | 2,012,171,662 | 2,012,171,662 | -- | -- |
| Short-Term Funds | 822,776,292 | 822,776,292 | -- | -- |
| Total Investments in Securities: | $3,518,963,342 | $3,516,917,402 | $2,045,940 | $-- |
| Derivative Instruments: | | | | |
| Assets | | | | |
| Futures Contracts | $313,284 | $313,284 | $-- | $-- |
| Total Assets | $313,284 | $313,284 | $-- | $-- |
| Liabilities | | | | |
| Futures Contracts | $(5,821) | $(5,821) | $-- | $-- |
| Total Liabilities | $(5,821) | $(5,821) | $-- | $-- |
| Total Derivative Instruments: | $307,463 | $307,463 | $-- | $-- |
Value of Derivative Instruments
The following table is a summary of the Fund's value of derivative instruments by primary risk exposure as of September 30, 2018. For additional information on derivative instruments, please refer to the Derivative Instruments section in the accompanying Notes to Financial Statements.
| Primary Risk Exposure / Derivative Type | Value |
| | Asset | Liability |
| Equity Risk | | |
| Futures Contracts(a) | $313,284 | $(5,821) |
| Total Equity Risk | 313,284 | (5,821) |
| Total Value of Derivatives | $313,284 | $(5,821) |
(a) Reflects gross cumulative appreciation (depreciation) on futures contracts as presented in the Schedule of Investments. In the Statement of Assets and Liabilities, the period end daily variation margin is included in receivable or payable for daily variation margin on futures contracts, and the net cumulative appreciation (depreciation) is included in net unrealized appreciation (depreciation).
See accompanying notes which are an integral part of the financial statements.
Fidelity Freedom® Income Fund
Financial Statements
Statement of Assets and Liabilities
| | | September 30, 2018 (Unaudited) |
| Assets | | |
Investment in securities, at value — See accompanying schedule:
Unaffiliated issuers (cost $2,046,120) | $2,045,940 | |
| Fidelity Central Funds (cost $6,324,368) | 6,324,368 | |
| Other affiliated issuers (cost $3,334,002,131) | 3,510,593,034 | |
| Total Investment in Securities (cost $3,342,372,619) | | $3,518,963,342 |
| Receivable for investments sold | | 28,842,301 |
| Receivable for fund shares sold | | 15,793,947 |
| Distributions receivable from Fidelity Central Funds | | 9,284 |
| Total assets | | 3,563,608,874 |
| Liabilities | | |
| Payable for investments purchased | $26,867,605 | |
| Payable for fund shares redeemed | 17,720,285 | |
| Accrued management fee | 1,301,864 | |
| Payable for daily variation margin on futures contracts | 121,434 | |
| Total liabilities | | 46,011,188 |
| Net Assets | | $3,517,597,686 |
| Net Assets consist of: | | |
| Paid in capital | | $3,277,238,597 |
| Undistributed net investment income | | 10,820,928 |
| Accumulated undistributed net realized gain (loss) on investments | | 52,639,975 |
| Net unrealized appreciation (depreciation) on investments | | 176,898,186 |
| Net Assets | | $3,517,597,686 |
| Fidelity Freedom Income Fund: | | |
| Net Asset Value, offering price and redemption price per share ($2,040,849,966 ÷ 176,249,126 shares) | | $11.58 |
| Class K: | | |
| Net Asset Value, offering price and redemption price per share ($1,388,227,944 ÷ 120,056,290 shares) | | $11.56 |
| Class K6: | | |
| Net Asset Value, offering price and redemption price per share ($88,519,776 ÷ 7,654,695 shares) | | $11.56 |
See accompanying notes which are an integral part of the financial statements.
Statement of Operations
| | | Six months ended September 30, 2018 (Unaudited) |
| Investment Income | | |
| Dividends: | | |
| Affiliated issuers | | $39,690,637 |
| Interest | | 8,225 |
| Income from Fidelity Central Funds | | 22,227 |
| Total income | | 39,721,089 |
| Expenses | | |
| Management fee | $8,016,172 | |
| Independent trustees' fees and expenses | 8,900 | |
| Total expenses before reductions | 8,025,072 | |
| Expense reductions | (54) | |
| Total expenses after reductions | | 8,025,018 |
| Net investment income (loss) | | 31,696,071 |
| Realized and Unrealized Gain (Loss) | | |
| Net realized gain (loss) on: | | |
| Investment securities: | | |
| Fidelity Central Funds | (161) | |
| Other affiliated issuers | 54,286,120 | |
| Futures contracts | (909,660) | |
| Capital gain distributions from underlying funds: | | |
| Affiliated issuers | 9,304,959 | |
| Total net realized gain (loss) | | 62,681,258 |
| Change in net unrealized appreciation (depreciation) on: | | |
| Investment securities: | | |
| Unaffiliated issuers | (163) | |
| Affiliated issuers | (64,864,242) | |
| Futures contracts | 307,463 | |
| Total change in net unrealized appreciation (depreciation) | | (64,556,942) |
| Net gain (loss) | | (1,875,684) |
| Net increase (decrease) in net assets resulting from operations | | $29,820,387 |
See accompanying notes which are an integral part of the financial statements.
Statement of Changes in Net Assets
| | Six months ended September 30, 2018 (Unaudited) | Year ended March 31, 2018 |
| Increase (Decrease) in Net Assets | | |
| Operations | | |
| Net investment income (loss) | $31,696,071 | $54,568,700 |
| Net realized gain (loss) | 62,681,258 | 90,451,426 |
| Change in net unrealized appreciation (depreciation) | (64,556,942) | (21,703,503) |
| Net increase (decrease) in net assets resulting from operations | 29,820,387 | 123,316,623 |
| Distributions to shareholders from net investment income | (26,350,776) | (51,949,454) |
| Distributions to shareholders from net realized gain | (38,860,177) | (67,440,706) |
| Total distributions | (65,210,953) | (119,390,160) |
| Share transactions - net increase (decrease) | (166,581,803) | 1,577,891,442 |
| Total increase (decrease) in net assets | (201,972,369) | 1,581,817,905 |
| Net Assets | | |
| Beginning of period | 3,719,570,055 | 2,137,752,150 |
| End of period | $3,517,597,686 | $3,719,570,055 |
| Other Information | | |
| Undistributed net investment income end of period | $10,820,928 | $5,475,633 |
See accompanying notes which are an integral part of the financial statements.
Financial Highlights
Fidelity Freedom Income Fund
| | Six months ended (Unaudited) September 30, | Years endedMarch 31, | | | | |
| | 2018 | 2018 | 2017 | 2016 | 2015 | 2014 |
| Selected Per–Share Data | | | | | | |
| Net asset value, beginning of period | $11.69 | $11.57 | $11.26 | $11.75 | $11.86 | $11.91 |
| Income from Investment Operations | | | | | | |
| Net investment income (loss)A | .10 | .18 | .19 | .21 | .21 | .16 |
| Net realized and unrealized gain (loss) | –B | .38 | .49 | (.27) | .28 | .30 |
| Total from investment operations | .10 | .56 | .68 | (.06) | .49 | .46 |
| Distributions from net investment income | (.08) | (.19) | (.20)C | (.21) | (.20) | (.16) |
| Distributions from net realized gain | (.12) | (.25) | (.17)C | (.22) | (.40) | (.35) |
| Total distributions | (.21)D | (.44) | (.37) | (.43) | (.60) | (.51) |
| Net asset value, end of period | $11.58 | $11.69 | $11.57 | $11.26 | $11.75 | $11.86 |
| Total ReturnE,F | .83% | 4.86% | 6.16% | (.45)% | 4.31% | 3.95% |
| Ratios to Average Net AssetsG,H | | | | | | |
| Expenses before reductions | .46%I,J | .39% | - %K | - %K | - %K | - %K |
| Expenses net of fee waivers, if any | .46%I,J | .39% | -% | -% | -% | -% |
| Expenses net of all reductions | .46%I,J | .39% | -% | -% | -% | -% |
| Net investment income (loss) | 1.73%I | 1.57% | 1.70% | 1.86% | 1.77% | 1.37% |
| Supplemental Data | | | | | | |
| Net assets, end of period (000 omitted) | $2,040,850 | $2,111,741 | $2,137,752 | $2,184,994 | $2,483,848 | $1,935,210 |
| Portfolio turnover rateH | 32%I | 17%L | 31% | 20% | 26%L | 31% |
A Calculated based on average shares outstanding during the period.
B Amount represents less than $.005 per share.
C The amounts shown reflect certain reclassifications related to book to tax differences that were made in the year shown.
D Total distributions of $.21 per share is comprised of distributions from net investment income of $.083 and distributions from net realized gain of $.123 per share.
E Total returns for periods of less than one year are not annualized.
F Total returns would have been lower if certain expenses had not been reduced during the applicable periods shown.
G Expense ratios reflect operating expenses of the class. Expenses before reductions do not reflect amounts reimbursed by the investment adviser or reductions from expense offset arrangements and do not represent the amount paid by the class during periods when reimbursements or reductions occur. Expenses net of fee waivers reflect expenses after reimbursement by the investment adviser but prior to reductions from expense offset arrangements. Expenses net of all reductions represent the net expenses paid by the class but do not include expenses of the underlying funds in which the Fund invests.
H Amounts do not include the activity of the Underlying Funds.
I Annualized
J On certain classes, the size and fluctuation of net assets and expense amounts may cause ratios to differ from contractual rates.
K Amount represents less than .005%.
L The portfolio turnover rate does not include the assets acquired in the merger.
See accompanying notes which are an integral part of the financial statements.
Fidelity Freedom Income Fund Class K
| | Six months ended (Unaudited) September 30, | Years endedMarch 31, |
| | 2018 | 2018 A |
| Selected Per–Share Data | | |
| Net asset value, beginning of period | $11.68 | $11.76 |
| Income from Investment Operations | | |
| Net investment income (loss)B | .10 | .19 |
| Net realized and unrealized gain (loss) | (.01) | .05 |
| Total from investment operations | .09 | .24 |
| Distributions from net investment income | (.09) | (.16) |
| Distributions from net realized gain | (.12) | (.17) |
| Total distributions | (.21) | (.32)C |
| Net asset value, end of period | $11.56 | $11.68 |
| Total ReturnD,E | .78% | 2.06% |
| Ratios to Average Net AssetsF,G | | |
| Expenses before reductions | .41%H,I | .42%H |
| Expenses net of fee waivers, if any | .41%H,I | .42%H |
| Expenses net of all reductions | .41%H,I | .42%H |
| Net investment income (loss) | 1.78%H | 2.32%H |
| Supplemental Data | | |
| Net assets, end of period (000 omitted) | $1,388,228 | $1,568,576 |
| Portfolio turnover rateG | 32%H | 17%J |
A For the period July 20, 2017 (commencement of sale of shares) to March 31, 2018.
B Calculated based on average shares outstanding during the period.
C Total distributions of $.32 per share is comprised of distributions from net investment income of $.157 and distributions from net realized gain of $.166 per share.
D Total returns for periods of less than one year are not annualized.
E Total returns would have been lower if certain expenses had not been reduced during the applicable periods shown.
F Expense ratios reflect operating expenses of the class. Expenses before reductions do not reflect amounts reimbursed by the investment adviser or reductions from expense offset arrangements and do not represent the amount paid by the class during periods when reimbursements or reductions occur. Expense ratios before reductions for start-up periods may not be representative of longer-term operating periods. Expenses net of fee waivers reflect expenses after reimbursement by the investment adviser but prior to reductions from expense offset arrangements. Expenses net of all reductions represent the net expenses paid by the class but do not include expenses of the underlying funds in which the Fund invests.
G Amounts do not include the activity of the Underlying Funds.
H Annualized
I On certain classes, the size and fluctuation of net assets and expense amounts may cause ratios to differ from contractual rates.
J The portfolio turnover rate does not include the assets acquired in the merger.
See accompanying notes which are an integral part of the financial statements.
Fidelity Freedom Income Fund Class K6
| | Six months ended (Unaudited) September 30, | Years endedMarch 31, |
| | 2018 | 2018 A |
| Selected Per–Share Data | | |
| Net asset value, beginning of period | $11.68 | $11.68 |
| Income from Investment Operations | | |
| Net investment income (loss)B | .11 | .18 |
| Net realized and unrealized gain (loss) | (.01) | .15 |
| Total from investment operations | .10 | .33 |
| Distributions from net investment income | (.09) | (.17) |
| Distributions from net realized gain | (.12) | (.17) |
| Total distributions | (.22)C | (.33)D |
| Net asset value, end of period | $11.56 | $11.68 |
| Total ReturnE,F | .83% | 2.86% |
| Ratios to Average Net AssetsG,H | | |
| Expenses before reductions | .37%I | .37%I |
| Expenses net of fee waivers, if any | .37%I | .37%I |
| Expenses net of all reductions | .37%I | .37%I |
| Net investment income (loss) | 1.83%I | 1.91%I |
| Supplemental Data | | |
| Net assets, end of period (000 omitted) | $88,520 | $39,253 |
| Portfolio turnover rateH | 32%I | 17%J |
A For the period June 7, 2017 (commencement of sale of shares) to March 31, 2018.
B Calculated based on average shares outstanding during the period.
C Total distributions of $.22 per share is comprised of distributions from net investment income of $.092 and distributions from net realized gain of $.123 per share.
D Total distributions of $.33 per share is comprised of distributions from net investment income of $.168 and distributions from net realized gain of $.166 per share.
E Total returns for periods of less than one year are not annualized.
F Total returns would have been lower if certain expenses had not been reduced during the applicable periods shown.
G Expense ratios reflect operating expenses of the class. Expenses before reductions do not reflect amounts reimbursed by the investment adviser or reductions from expense offset arrangements and do not represent the amount paid by the class during periods when reimbursements or reductions occur. Expense ratios before reductions for start-up periods may not be representative of longer-term operating periods. Expenses net of fee waivers reflect expenses after reimbursement by the investment adviser but prior to reductions from expense offset arrangements. Expenses net of all reductions represent the net expenses paid by the class but do not include expenses of the underlying funds in which the Fund invests.
H Amounts do not include the activity of the Underlying Funds.
I Annualized
J The portfolio turnover rate does not include the assets acquired in the merger.
See accompanying notes which are an integral part of the financial statements.
Fidelity Freedom® 2005 Fund
Investment Summary (Unaudited)
The information in the following tables is based on the direct investments of the Fund.
Top Holdings as of September 30, 2018
| | % of fund's net assets |
| Fidelity Series Investment Grade Bond Fund | 33.8 |
| Fidelity Series Government Money Market Fund 2.12% | 15.0 |
| Fidelity Series Inflation-Protected Bond Index Fund | 11.0 |
| Fidelity Series Long-Term Treasury Bond Index Fund | 4.6 |
| Fidelity Series Short-Term Credit Fund | 3.9 |
| Fidelity Series Emerging Markets Opportunities Fund | 3.5 |
| Fidelity Series International Growth Fund | 3.1 |
| Fidelity Series International Value Fund | 3.0 |
| Fidelity Series Intrinsic Opportunities Fund | 2.8 |
| Fidelity Series Large Cap Stock Fund | 2.5 |
| | 83.2 |
Asset Allocation (% of fund's net assets)
| Period end |
| | Domestic Equity Funds | 17.7% |
| | International Equity Funds | 11.0% |
| | Bond Funds | 52.2% |
| | Short-Term Funds | 19.1% |

Domestic Equity Funds category includes Fidelity Series Commodity Strategy Fund which invests in commodity-related investments.
Fidelity Freedom® 2005 Fund
Schedule of Investments September 30, 2018 (Unaudited)
Showing Percentage of Net Assets
| U.S. Treasury Obligations - 0.0% | | | |
| | | Principal Amount | Value |
| U.S. Treasury Bills, yield at date of purchase 1.97% to 2.11% 11/1/18 to 12/6/18 (a) | | | |
| (Cost $548,923) | | 550,000 | 548,875 |
| | | Shares | Value |
|
| Domestic Equity Funds - 17.7% | | | |
| Fidelity Series All-Sector Equity Fund (b) | | 419,751 | $5,712,814 |
| Fidelity Series Blue Chip Growth Fund (b) | | 739,407 | 11,312,923 |
| Fidelity Series Commodity Strategy Fund (b) | | 3,872,246 | 19,361,232 |
| Fidelity Series Growth Company Fund (b) | | 1,126,383 | 22,764,204 |
| Fidelity Series Intrinsic Opportunities Fund (b) | | 1,504,862 | 27,584,116 |
| Fidelity Series Large Cap Stock Fund (b) | | 1,520,594 | 24,223,069 |
| Fidelity Series Large Cap Value Index Fund (b) | | 515,832 | 6,808,987 |
| Fidelity Series Opportunistic Insights Fund (b) | | 618,895 | 12,285,070 |
| Fidelity Series Small Cap Discovery Fund (b) | | 269,538 | 3,274,882 |
| Fidelity Series Small Cap Opportunities Fund (b) | | 674,973 | 9,915,352 |
| Fidelity Series Stock Selector Large Cap Value Fund (b) | | 1,386,991 | 18,336,026 |
| Fidelity Series Value Discovery Fund (b) | | 951,661 | 13,028,244 |
| TOTAL DOMESTIC EQUITY FUNDS | | | |
| (Cost $125,280,107) | | | 174,606,919 |
|
| International Equity Funds - 11.0% | | | |
| Fidelity Series Canada Fund (b) | | 275,001 | 2,972,756 |
| Fidelity Series Emerging Markets Fund (b) | | 444,311 | 4,305,378 |
| Fidelity Series Emerging Markets Opportunities Fund (b) | | 1,777,470 | 34,109,656 |
| Fidelity Series International Growth Fund (b) | | 1,835,426 | 30,100,992 |
| Fidelity Series International Small Cap Fund (b) | | 394,580 | 7,062,991 |
| Fidelity Series International Value Fund (b) | | 2,855,208 | 30,036,787 |
| TOTAL INTERNATIONAL EQUITY FUNDS | | | |
| (Cost $82,972,590) | | | 108,588,560 |
|
| Bond Funds - 52.2% | | | |
| Fidelity Series Emerging Markets Debt Fund (b) | | 743,824 | 7,088,641 |
| Fidelity Series Floating Rate High Income Fund (b) | | 254,282 | 2,420,762 |
| Fidelity Series High Income Fund (b) | | 1,416,745 | 13,614,918 |
| Fidelity Series Inflation-Protected Bond Index Fund (b) | | 11,164,173 | 108,404,115 |
| Fidelity Series International Credit Fund (b) | | 51,571 | 506,942 |
| Fidelity Series Investment Grade Bond Fund (b) | | 30,629,278 | 333,552,834 |
| Fidelity Series Long-Term Treasury Bond Index Fund (b) | | 5,545,446 | 45,694,477 |
| Fidelity Series Real Estate Income Fund (b) | | 440,833 | 4,752,178 |
| TOTAL BOND FUNDS | | | |
| (Cost $534,508,047) | | | 516,034,867 |
|
| Short-Term Funds - 19.1% | | | |
| Fidelity Cash Central Fund, 2.11% (c) | | 1,659,283 | 1,659,615 |
| Fidelity Series Government Money Market Fund 2.12% (b)(d) | | 148,326,056 | 148,326,056 |
| Fidelity Series Short-Term Credit Fund (b) | | 3,905,275 | 38,506,009 |
| TOTAL SHORT-TERM FUNDS | | | |
| (Cost $188,946,883) | | | 188,491,680 |
| TOTAL INVESTMENT IN SECURITIES - 100.0% | | | |
| (Cost $932,256,550) | | | 988,270,901 |
| NET OTHER ASSETS (LIABILITIES) - 0.0% | | | (389,601) |
| NET ASSETS - 100% | | | $987,881,300 |
| Futures Contracts | | | | | |
| | Number of contracts | Expiration Date | Notional Amount | Value | Unrealized Appreciation/(Depreciation) |
| Purchased | | | | | |
| Equity Index Contracts | | | | | |
| ICE E-mini MSCI EAFE Index Contracts (United States) | 24 | Dec. 2018 | $2,370,600 | $2,268 | $2,268 |
| ICE E-mini MSCI Emerging Markets Index Contracts (United States) | 88 | Dec. 2018 | 4,618,680 | 90,385 | 90,384 |
|
| TOTAL PURCHASED | | | | | 92,652 |
|
| Sold | | | | | |
| Equity Index Contracts | | | | | |
| CME E-mini S&P 500 Index Contracts (United States) | 48 | Dec. 2018 | 7,005,600 | (5,028) | (5,028) |
| TOTAL FUTURES CONTRACTS | | | | | $87,624 |
The notional amount of futures purchased as a percentage of Net Assets is 0.7%
The notional amount of futures sold as a percentage of Net Assets is 0.7%
Legend
(a) Security or a portion of the security was pledged to cover margin requirements for futures contracts. At period end, the value of securities pledged amounted to $548,875.
(b) Affiliated Fund
(c) Affiliated fund that is generally available only to investment companies and other accounts managed by Fidelity Investments. The rate quoted is the annualized seven-day yield of the fund at period end. A complete unaudited listing of the fund's holdings as of its most recent quarter end is available upon request. In addition, each Fidelity Central Fund's financial statements are available on the SEC's website or upon request.
(d) The rate quoted is the annualized seven-day yield of the fund at period end.
Affiliated Central Funds
Information regarding fiscal year to date income earned by the Fund from investments in Fidelity Central Funds is as follows:
| Fund | Income earned |
| Fidelity Cash Central Fund | $6,098 |
| Total | $6,098 |
Amounts in the income column in the above table include any capital gain distributions from underlying funds, which are presented in the corresponding line-item in the Statement of Operations if applicable.
Affiliated Underlying Funds
Fiscal year to date information regarding the Fund's investments in affiliated Underlying Funds, excluding any Money Market Central Funds, is presented below. Exchanges between classes of the same affiliated Underlying Funds may occur.
| Affiliate | Value, beginning of period | Purchases | Sales Proceeds | Dividend Income | Realized Gain (loss) | Change in Unrealized appreciation (depreciation) | Value, end of period |
| Fidelity Series 100 Index Fund | $6,515,325 | $-- | $6,766,231 | $-- | $3,060,458 | $(2,809,552) | $-- |
| Fidelity Series All-Sector Equity Fund | 12,530,153 | 323,580 | 8,401,825 | -- | 638,590 | 622,316 | 5,712,814 |
| Fidelity Series Blue Chip Growth Fund | 12,953,358 | 1,402,783 | 4,184,724 | 1,047,213 | 1,473,388 | (331,882) | 11,312,923 |
| Fidelity Series Canada Fund | 3,443,587 | 90,826 | 769,911 | -- | 11,026 | 197,228 | 2,972,756 |
| Fidelity Series Commodity Strategy Fund | 21,665,200 | 3,277,306 | 3,988,960 | 1,155,570 | (3,206,008) | 1,613,694 | 19,361,232 |
| Fidelity Series Emerging Markets Debt Fund | 7,599,846 | 385,829 | 483,923 | 219,233 | (12,852) | (400,259) | 7,088,641 |
| Fidelity Series Emerging Markets Fund | -- | 4,318,466 | -- | -- | -- | (13,088) | 4,305,378 |
| Fidelity Series Emerging Markets Opportunities Fund | 40,950,004 | 1,179,316 | 3,026,645 | -- | 334,133 | (5,327,152) | 34,109,656 |
| Fidelity Series Floating Rate High Income Fund | 2,476,054 | 134,554 | 192,296 | 65,135 | (1,837) | 4,287 | 2,420,762 |
| Fidelity Series Government Money Market Fund 2.12% | 188,891,827 | 24,156,237 | 64,722,008 | 1,675,943 | -- | -- | 148,326,056 |
| Fidelity Series Growth Company Fund | 27,067,672 | 709,266 | 8,781,193 | -- | 3,637,097 | 131,362 | 22,764,204 |
| Fidelity Series High Income Fund | 15,273,504 | 768,359 | 2,545,845 | 407,388 | (93,139) | 212,039 | 13,614,918 |
| Fidelity Series Inflation-Protected Bond Index Fund | 34,330,025 | 77,720,594 | 3,292,577 | 104,461 | (109,818) | (244,109) | 108,404,115 |
| Fidelity Series International Credit Fund | 511,877 | 6,308 | 6,093 | 6,308 | (80) | (5,070) | 506,942 |
| Fidelity Series International Growth Fund | 35,653,275 | 1,361,049 | 7,353,311 | -- | 1,843,979 | (1,404,000) | 30,100,992 |
| Fidelity Series International Small Cap Fund | 8,838,106 | 321,958 | 1,773,378 | -- | 370,877 | (694,572) | 7,062,991 |
| Fidelity Series International Value Fund | 35,085,401 | 929,268 | 5,760,831 | -- | 447 | (217,498) | 30,036,787 |
| Fidelity Series Intrinsic Opportunities Fund | 32,312,650 | 2,084,749 | 7,442,081 | 1,214,527 | 733,664 | (104,866) | 27,584,116 |
| Fidelity Series Investment Grade Bond Fund | 357,195,577 | 15,703,190 | 35,256,473 | 4,918,970 | (1,215,834) | (2,873,626) | 333,552,834 |
| Fidelity Series Large Cap Stock Fund | 28,318,570 | 2,429,949 | 7,842,568 | 1,641,583 | 909,822 | 407,296 | 24,223,069 |
| Fidelity Series Large Cap Value Index Fund | 8,118,267 | 221,652 | 2,054,428 | -- | 175,759 | 347,737 | 6,808,987 |
| Fidelity Series Long-Term Treasury Bond Index Fund | 21,896,394 | 30,282,437 | 4,886,938 | 392,361 | (169,455) | (1,427,961) | 45,694,477 |
| Fidelity Series Opportunistic Insights Fund | 14,197,365 | 387,487 | 4,045,102 | -- | 1,535,896 | 209,424 | 12,285,070 |
| Fidelity Series Real Estate Equity Fund | 2,522,653 | 22,552 | 2,634,464 | 19,427 | 352,087 | (262,828) | -- |
| Fidelity Series Real Estate Income Fund | 4,756,952 | 332,037 | 366,115 | 201,476 | (833) | 30,137 | 4,752,178 |
| Fidelity Series Short-Term Credit Fund | 46,349,875 | 1,780,739 | 9,623,590 | 515,426 | (116,864) | 115,849 | 38,506,009 |
| Fidelity Series Small Cap Discovery Fund | 3,862,917 | 331,020 | 870,333 | 226,894 | 97,568 | (146,290) | 3,274,882 |
| Fidelity Series Small Cap Opportunities Fund | 11,795,128 | 1,081,023 | 3,484,539 | 764,275 | 694,276 | (170,536) | 9,915,352 |
| Fidelity Series Stock Selector Large Cap Value Fund | 22,112,603 | 604,742 | 5,803,995 | -- | 791,480 | 631,196 | 18,336,026 |
| Fidelity Series Value Discovery Fund | 15,714,129 | 429,039 | 3,972,779 | -- | 449,096 | 408,759 | 13,028,244 |
| | $1,022,938,294 | $172,776,315 | $210,333,156 | $14,576,190 | $12,182,923 | $(11,501,965) | $986,062,411 |
Amounts in the income column in the above table include any capital gain distributions from underlying funds, which are presented in the corresponding line-item in the Statement of Operations if applicable.
Investment Valuation
The following is a summary of the inputs used, as of September 30, 2018, involving the Fund's assets and liabilities carried at fair value. The inputs or methodology used for valuing securities may not be an indication of the risk associated with investing in those securities. For more information on valuation inputs, and their aggregation into the levels used below, please refer to the Investment Valuation section in the accompanying Notes to Financial Statements.
| | Valuation Inputs at Reporting Date: |
| Description | Total | Level 1 | Level 2 | Level 3 |
| Investments in Securities: | | | | |
| Other Short-Term Investments | $548,875 | $-- | $548,875 | $-- |
| Domestic Equity Funds | 174,606,919 | 174,606,919 | -- | -- |
| International Equity Funds | 108,588,560 | 108,588,560 | -- | -- |
| Bond Funds | 516,034,867 | 516,034,867 | -- | -- |
| Short-Term Funds | 188,491,680 | 188,491,680 | -- | -- |
| Total Investments in Securities: | $988,270,901 | $987,722,026 | $548,875 | $-- |
| Derivative Instruments: | | | | |
| Assets | | | | |
| Futures Contracts | $92,652 | $92,652 | $-- | $-- |
| Total Assets | $92,652 | $92,652 | $-- | $-- |
| Liabilities | | | | |
| Futures Contracts | $(5,028) | $(5,028) | $-- | $-- |
| Total Liabilities | $(5,028) | $(5,028) | $-- | $-- |
| Total Derivative Instruments: | $87,624 | $87,624 | $-- | $-- |
Value of Derivative Instruments
The following table is a summary of the Fund's value of derivative instruments by primary risk exposure as of September 30, 2018. For additional information on derivative instruments, please refer to the Derivative Instruments section in the accompanying Notes to Financial Statements.
| Primary Risk Exposure / Derivative Type | Value |
| | Asset | Liability |
| Equity Risk | | |
| Futures Contracts(a) | $92,652 | $(5,028) |
| Total Equity Risk | 92,652 | (5,028) |
| Total Value of Derivatives | $92,652 | $(5,028) |
(a) Reflects gross cumulative appreciation (depreciation) on futures contracts as presented in the Schedule of Investments. In the Statement of Assets and Liabilities, the period end daily variation margin is included in receivable or payable for daily variation margin on futures contracts, and the net cumulative appreciation (depreciation) is included in net unrealized appreciation (depreciation).
See accompanying notes which are an integral part of the financial statements.
Fidelity Freedom® 2005 Fund
Financial Statements
Statement of Assets and Liabilities
| | | September 30, 2018 (Unaudited) |
| Assets | | |
Investment in securities, at value — See accompanying schedule:
Unaffiliated issuers (cost $548,923) | $548,875 | |
| Fidelity Central Funds (cost $1,659,615) | 1,659,615 | |
| Other affiliated issuers (cost $930,048,012) | 986,062,411 | |
| Total Investment in Securities (cost $932,256,550) | | $988,270,901 |
| Cash | | 27,686 |
| Receivable for investments sold | | 6,172,493 |
| Receivable for fund shares sold | | 9,845,821 |
| Distributions receivable from Fidelity Central Funds | | 2,443 |
| Total assets | | 1,004,319,344 |
| Liabilities | | |
| Payable for investments purchased | $5,482,681 | |
| Payable for fund shares redeemed | 10,532,505 | |
| Accrued management fee | 376,240 | |
| Payable for daily variation margin on futures contracts | 46,618 | |
| Total liabilities | | 16,438,044 |
| Net Assets | | $987,881,300 |
| Net Assets consist of: | | |
| Paid in capital | | $910,955,558 |
| Undistributed net investment income | | 8,096,776 |
| Accumulated undistributed net realized gain (loss) on investments | | 12,726,991 |
| Net unrealized appreciation (depreciation) on investments | | 56,101,975 |
| Net Assets | | $987,881,300 |
| Fidelity Freedom 2005 Fund: | | |
| Net Asset Value, offering price and redemption price per share ($571,564,332 ÷ 45,945,798 shares) | | $12.44 |
| Class K: | | |
| Net Asset Value, offering price and redemption price per share ($386,290,515 ÷ 31,090,455 shares) | | $12.42 |
| Class K6: | | |
| Net Asset Value, offering price and redemption price per share ($30,026,453 ÷ 2,415,955 shares) | | $12.43 |
See accompanying notes which are an integral part of the financial statements.
Statement of Operations
| | | Six months ended September 30, 2018 (Unaudited) |
| Investment Income | | |
| Dividends: | | |
| Affiliated issuers | | $10,376,153 |
| Interest | | 2,543 |
| Income from Fidelity Central Funds | | 6,098 |
| Total income | | 10,384,794 |
| Expenses | | |
| Management fee | $2,305,748 | |
| Independent trustees' fees and expenses | 2,463 | |
| Total expenses before reductions | 2,308,211 | |
| Expense reductions | (70) | |
| Total expenses after reductions | | 2,308,141 |
| Net investment income (loss) | | 8,076,653 |
| Realized and Unrealized Gain (Loss) | | |
| Net realized gain (loss) on: | | |
| Investment securities: | | |
| Fidelity Central Funds | (32) | |
| Other affiliated issuers | 12,182,923 | |
| Futures contracts | (373,350) | |
| Capital gain distributions from underlying funds: | | |
| Affiliated issuers | 4,200,037 | |
| Total net realized gain (loss) | | 16,009,578 |
| Change in net unrealized appreciation (depreciation) on: | | |
| Investment securities: | | |
| Unaffiliated issuers | (43) | |
| Affiliated issuers | (11,501,965) | |
| Futures contracts | 87,624 | |
| Total change in net unrealized appreciation (depreciation) | | (11,414,384) |
| Net gain (loss) | | 4,595,194 |
| Net increase (decrease) in net assets resulting from operations | | $12,671,847 |
See accompanying notes which are an integral part of the financial statements.
Statement of Changes in Net Assets
| | Six months ended September 30, 2018 (Unaudited) | Year ended March 31, 2018 |
| Increase (Decrease) in Net Assets | | |
| Operations | | |
| Net investment income (loss) | $8,076,653 | $14,738,670 |
| Net realized gain (loss) | 16,009,578 | 30,625,628 |
| Change in net unrealized appreciation (depreciation) | (11,414,384) | 1,018,991 |
| Net increase (decrease) in net assets resulting from operations | 12,671,847 | 46,383,289 |
| Distributions to shareholders from net investment income | (2,637,248) | (13,671,334) |
| Distributions to shareholders from net realized gain | (15,179,078) | (20,759,680) |
| Total distributions | (17,816,326) | (34,431,014) |
| Share transactions - net increase (decrease) | (29,634,052) | 426,953,870 |
| Total increase (decrease) in net assets | (34,778,531) | 438,906,145 |
| Net Assets | | |
| Beginning of period | 1,022,659,831 | 583,753,686 |
| End of period | $987,881,300 | $1,022,659,831 |
| Other Information | | |
| Undistributed net investment income end of period | $8,096,776 | $2,657,371 |
See accompanying notes which are an integral part of the financial statements.
Financial Highlights
Fidelity Freedom 2005 Fund
| | Six months ended (Unaudited) September 30, | Years endedMarch 31, | | | | |
| | 2018 | 2018 | 2017 | 2016 | 2015 | 2014 |
| Selected Per–Share Data | | | | | | |
| Net asset value, beginning of period | $12.50 | $12.20 | $11.66 | $12.24 | $12.01 | $11.53 |
| Income from Investment Operations | | | | | | |
| Net investment income (loss)A | .10 | .19 | .20 | .22 | .22 | .16 |
| Net realized and unrealized gain (loss) | .06 | .59 | .71 | (.34) | .40 | .58 |
| Total from investment operations | .16 | .78 | .91 | (.12) | .62 | .74 |
| Distributions from net investment income | (.03) | (.18) | (.22)B | (.22) | (.23) | (.15) |
| Distributions from net realized gain | (.19) | (.30) | (.15)B | (.23) | (.17) | (.10) |
| Total distributions | (.22) | (.48) | (.37) | (.46)C | (.39)D | (.26)E |
| Net asset value, end of period | $12.44 | $12.50 | $12.20 | $11.66 | $12.24 | $12.01 |
| Total ReturnF,G | 1.28% | 6.43% | 7.91% | (1.01)% | 5.26% | 6.43% |
| Ratios to Average Net AssetsH,I | | | | | | |
| Expenses before reductions | .48%J | .41% | - %K | - %K | - %K | - %K |
| Expenses net of fee waivers, if any | .48%J | .41% | -% | -% | -% | -% |
| Expenses net of all reductions | .48%J | .41% | -% | -% | -% | -% |
| Net investment income (loss) | 1.58%J | 1.52% | 1.70% | 1.87% | 1.79% | 1.38% |
| Supplemental Data | | | | | | |
| Net assets, end of period (000 omitted) | $571,564 | $590,056 | $583,754 | $580,726 | $639,723 | $668,987 |
| Portfolio turnover rateI | 34%J | 23%L | 31% | 22% | 23% | 44% |
A Calculated based on average shares outstanding during the period.
B The amounts shown reflect certain reclassifications related to book to tax differences that were made in the year shown.
C Total distributions of $.46 per share is comprised of distributions from net investment income of $.223 and distributions from net realized gain of $.234 per share.
D Total distributions of $.39 per share is comprised of distributions from net investment income of $.225 and distributions from net realized gain of $.168 per share.
E Total distributions of $.26 per share is comprised of distributions from net investment income of $.153 and distributions from net realized gain of $.103 per share.
F Total returns for periods of less than one year are not annualized.
G Total returns would have been lower if certain expenses had not been reduced during the applicable periods shown.
H Expense ratios reflect operating expenses of the class. Expenses before reductions do not reflect amounts reimbursed by the investment adviser or reductions from expense offset arrangements and do not represent the amount paid by the class during periods when reimbursements or reductions occur. Expenses net of fee waivers reflect expenses after reimbursement by the investment adviser but prior to reductions from expense offset arrangements. Expenses net of all reductions represent the net expenses paid by the class but do not include expenses of the underlying funds in which the Fund invests.
I Amounts do not include the activity of the Underlying Funds.
J Annualized
K Amount represents less than $.005 per share.
L The portfolio turnover rate does not include the assets acquired in the merger.
See accompanying notes which are an integral part of the financial statements.
Fidelity Freedom 2005 Fund Class K
| | Six months ended (Unaudited) September 30, | Years endedMarch 31, |
| | 2018 | 2018 A |
| Selected Per–Share Data | | |
| Net asset value, beginning of period | $12.49 | $12.48 |
| Income from Investment Operations | | |
| Net investment income (loss)B | .10 | .21 |
| Net realized and unrealized gain (loss) | .05 | .15 |
| Total from investment operations | .15 | .36 |
| Distributions from net investment income | (.03) | (.16) |
| Distributions from net realized gain | (.19) | (.19) |
| Total distributions | (.22) | (.35) |
| Net asset value, end of period | $12.42 | $12.49 |
| Total ReturnC,D | 1.21% | 2.89% |
| Ratios to Average Net AssetsE,F | | |
| Expenses before reductions | .43%G | .44%G |
| Expenses net of fee waivers, if any | .43%G | .44%G |
| Expenses net of all reductions | .43%G | .44%G |
| Net investment income (loss) | 1.64%G | 2.37%G |
| Supplemental Data | | |
| Net assets, end of period (000 omitted) | $386,291 | $422,622 |
| Portfolio turnover rateF | 34%G | 23%H |
A For the period July 20, 2017 (commencement of sale of shares) to March 31, 2018.
B Calculated based on average shares outstanding during the period.
C Total returns for periods of less than one year are not annualized.
D Total returns would have been lower if certain expenses had not been reduced during the applicable periods shown.
E Expense ratios reflect operating expenses of the class. Expenses before reductions do not reflect amounts reimbursed by the investment adviser or reductions from expense offset arrangements and do not represent the amount paid by the class during periods when reimbursements or reductions occur. Expense ratios before reductions for start-up periods may not be representative of longer-term operating periods. Expenses net of fee waivers reflect expenses after reimbursement by the investment adviser but prior to reductions from expense offset arrangements. Expenses net of all reductions represent the net expenses paid by the class but do not include expenses of the underlying funds in which the Fund invests.
F Amounts do not include the activity of the Underlying Funds.
G Annualized
H The portfolio turnover rate does not include the assets acquired in the merger.
See accompanying notes which are an integral part of the financial statements.
Fidelity Freedom 2005 Fund Class K6
| | Six months ended (Unaudited) September 30, | Years endedMarch 31, |
| | 2018 | 2018 A |
| Selected Per–Share Data | | |
| Net asset value, beginning of period | $12.49 | $12.36 |
| Income from Investment Operations | | |
| Net investment income (loss)B | .10 | .20 |
| Net realized and unrealized gain (loss) | .07 | .29 |
| Total from investment operations | .17 | .49 |
| Distributions from net investment income | (.04) | (.16) |
| Distributions from net realized gain | (.19) | (.19) |
| Total distributions | (.23) | (.36)C |
| Net asset value, end of period | $12.43 | $12.49 |
| Total ReturnD,E | 1.34% | 3.92% |
| Ratios to Average Net AssetsF,G | | |
| Expenses before reductions | .37%H | .38%H |
| Expenses net of fee waivers, if any | .37%H | .38%H |
| Expenses net of all reductions | .37%H | .38%H |
| Net investment income (loss) | 1.69%H | 1.93%H |
| Supplemental Data | | |
| Net assets, end of period (000 omitted) | $30,026 | $9,983 |
| Portfolio turnover rateG | 34%H | 23%I |
A For the period June 7, 2017 (commencement of sale of shares) to March 31, 2018.
B Calculated based on average shares outstanding during the period.
C Total distributions of $.36 per share is comprised of distributions from net investment income of $.164 and distributions from net realized gain of $.192 per share.
D Total returns for periods of less than one year are not annualized.
E Total returns would have been lower if certain expenses had not been reduced during the applicable periods shown.
F Expense ratios reflect operating expenses of the class. Expenses before reductions do not reflect amounts reimbursed by the investment adviser or reductions from expense offset arrangements and do not represent the amount paid by the class during periods when reimbursements or reductions occur. Expense ratios before reductions for start-up periods may not be representative of longer-term operating periods. Expenses net of fee waivers reflect expenses after reimbursement by the investment adviser but prior to reductions from expense offset arrangements. Expenses net of all reductions represent the net expenses paid by the class but do not include expenses of the underlying funds in which the Fund invests.
G Amounts do not include the activity of the Underlying Funds.
H Annualized
I The portfolio turnover rate does not include the assets acquired in the merger.
See accompanying notes which are an integral part of the financial statements.
Fidelity Freedom® 2010 Fund
Investment Summary (Unaudited)
The information in the following tables is based on the direct investments of the Fund.
Top Holdings as of September 30, 2018
| | % of fund's net assets |
| Fidelity Series Investment Grade Bond Fund | 30.1 |
| Fidelity Series Government Money Market Fund 2.12% | 11.7 |
| Fidelity Series Inflation-Protected Bond Index Fund | 9.1 |
| Fidelity Series Long-Term Treasury Bond Index Fund | 4.8 |
| Fidelity Series Emerging Markets Opportunities Fund | 4.3 |
| Fidelity Series Intrinsic Opportunities Fund | 4.0 |
| Fidelity Series International Value Fund | 3.9 |
| Fidelity Series International Growth Fund | 3.9 |
| Fidelity Series Large Cap Stock Fund | 3.5 |
| Fidelity Series Growth Company Fund | 3.2 |
| | 78.5 |
Asset Allocation (% of fund's net assets)
| Period end |
| | Domestic Equity Funds | 24.3% |
| | International Equity Funds | 13.8% |
| | Bond Funds | 46.9% |
| | Short-Term Funds | 14.9% |
| | Short-Term Investments | 0.1% |

Domestic Equity Funds category includes Fidelity Series Commodity Strategy Fund which invests in commodity-related investments.
Fidelity Freedom® 2010 Fund
Schedule of Investments September 30, 2018 (Unaudited)
Showing Percentage of Net Assets
| U.S. Treasury Obligations - 0.1% | | | |
| | | Principal Amount | Value |
| U.S. Treasury Bills, yield at date of purchase 1.97% to 2.11% 11/1/18 to 12/6/18 (a) | | | |
| (Cost $4,309,407) | | 4,320,000 | 4,309,070 |
| | | Shares | Value |
|
| Domestic Equity Funds - 24.3% | | | |
| Fidelity Series All-Sector Equity Fund (b) | | 3,812,876 | $51,893,237 |
| Fidelity Series Blue Chip Growth Fund (b) | | 6,597,640 | 100,943,885 |
| Fidelity Series Commodity Strategy Fund (b) | | 24,645,939 | 123,229,693 |
| Fidelity Series Growth Company Fund (b) | | 10,020,378 | 202,511,830 |
| Fidelity Series Intrinsic Opportunities Fund (b) | | 13,428,098 | 246,137,030 |
| Fidelity Series Large Cap Stock Fund (b) | | 13,535,206 | 215,615,835 |
| Fidelity Series Large Cap Value Index Fund (b) | | 4,622,485 | 61,016,805 |
| Fidelity Series Opportunistic Insights Fund (b) | | 5,521,417 | 109,600,136 |
| Fidelity Series Small Cap Discovery Fund (b) | | 2,429,120 | 29,513,812 |
| Fidelity Series Small Cap Opportunities Fund (b) | | 6,027,343 | 88,541,674 |
| Fidelity Series Stock Selector Large Cap Value Fund (b) | | 12,356,692 | 163,355,472 |
| Fidelity Series Value Discovery Fund (b) | | 8,489,413 | 116,220,062 |
| TOTAL DOMESTIC EQUITY FUNDS | | | |
| (Cost $1,034,501,591) | | | 1,508,579,471 |
|
| International Equity Funds - 13.8% | | | |
| Fidelity Series Canada Fund (b) | | 2,237,101 | 24,183,067 |
| Fidelity Series Emerging Markets Fund (b) | | 2,676,477 | 25,935,067 |
| Fidelity Series Emerging Markets Opportunities Fund (b) | | 13,889,539 | 266,540,245 |
| Fidelity Series International Growth Fund (b) | | 14,717,387 | 241,365,148 |
| Fidelity Series International Small Cap Fund (b) | | 3,217,762 | 57,597,941 |
| Fidelity Series International Value Fund (b) | | 23,261,039 | 244,706,131 |
| TOTAL INTERNATIONAL EQUITY FUNDS | | | |
| (Cost $645,578,380) | | | 860,327,599 |
|
| Bond Funds - 46.9% | | | |
| Fidelity Series Emerging Markets Debt Fund (b) | | 4,671,644 | 44,520,764 |
| Fidelity Series Floating Rate High Income Fund (b) | | 1,560,283 | 14,853,890 |
| Fidelity Series High Income Fund (b) | | 8,986,621 | 86,361,428 |
| Fidelity Series Inflation-Protected Bond Index Fund (b) | | 57,872,983 | 561,946,665 |
| Fidelity Series International Credit Fund (b) | | 347,035 | 3,411,358 |
| Fidelity Series Investment Grade Bond Fund (b) | | 171,882,124 | 1,871,796,329 |
| Fidelity Series Long-Term Treasury Bond Index Fund (b) | | 36,342,844 | 299,465,037 |
| Fidelity Series Real Estate Income Fund (b) | | 2,720,658 | 29,328,693 |
| TOTAL BOND FUNDS | | | |
| (Cost $3,013,964,424) | | | 2,911,684,164 |
|
| Short-Term Funds - 14.9% | | | |
| Fidelity Cash Central Fund, 2.11% (c) | | 10,449,674 | 10,451,764 |
| Fidelity Series Government Money Market Fund 2.12% (b)(d) | | 725,083,274 | 725,083,274 |
| Fidelity Series Short-Term Credit Fund (b) | | 19,574,073 | 193,000,357 |
| TOTAL SHORT-TERM FUNDS | | | |
| (Cost $930,862,691) | | | 928,535,395 |
| TOTAL INVESTMENT IN SECURITIES - 100.0% | | | |
| (Cost $5,629,216,493) | | | 6,213,435,699 |
| NET OTHER ASSETS (LIABILITIES) - 0.0% | | | (2,837,036) |
| NET ASSETS - 100% | | | $6,210,598,663 |
| Futures Contracts | | | | | |
| | Number of contracts | Expiration Date | Notional Amount | Value | Unrealized Appreciation/(Depreciation) |
| Purchased | | | | | |
| Equity Index Contracts | | | | | |
| ICE E-mini MSCI EAFE Index Contracts (United States) | 170 | Dec. 2018 | $16,791,750 | $16,062 | $16,062 |
| ICE E-mini MSCI Emerging Markets Index Contracts (United States) | 690 | Dec. 2018 | 36,214,650 | 701,623 | 701,623 |
| TOTAL PURCHASED | | | | | 717,685 |
| Sold | | | | | |
| Equity Index Contracts | | | | | |
| CME E-mini S&P 500 Index Contracts (United States) | 373 | Dec. 2018 | 54,439,350 | (56,078) | (56,078) |
| TOTAL FUTURES CONTRACTS | | | | | $661,607 |
The notional amount of futures purchased as a percentage of Net Assets is 0.9%
The notional amount of futures sold as a percentage of Net Assets is 0.9%
Legend
(a) Security or a portion of the security was pledged to cover margin requirements for futures contracts. At period end, the value of securities pledged amounted to $3,246,959.
(b) Affiliated Fund
(c) Affiliated fund that is generally available only to investment companies and other accounts managed by Fidelity Investments. The rate quoted is the annualized seven-day yield of the fund at period end. A complete unaudited listing of the fund's holdings as of its most recent quarter end is available upon request. In addition, each Fidelity Central Fund's financial statements are available on the SEC's website or upon request.
(d) The rate quoted is the annualized seven-day yield of the fund at period end.
Affiliated Central Funds
Information regarding fiscal year to date income earned by the Fund from investments in Fidelity Central Funds is as follows:
| Fund | Income earned |
| Fidelity Cash Central Fund | $41,034 |
| Total | $41,034 |
Amounts in the income column in the above table include any capital gain distributions from underlying funds, which are presented in the corresponding line-item in the Statement of Operations if applicable.
Affiliated Underlying Funds
Fiscal year to date information regarding the Fund's investments in affiliated Underlying Funds, excluding any Money Market Central Funds, is presented below. Exchanges between classes of the same affiliated Underlying Funds may occur.
| Affiliate | Value, beginning of period | Purchases | Sales Proceeds | Dividend Income | Realized Gain (loss) | Change in Unrealized appreciation (depreciation) | Value, end of period |
| Fidelity Series 100 Index Fund | $54,376,498 | $2 | $56,567,080 | $-- | $23,146,601 | $(20,956,021) | $-- |
| Fidelity Series All-Sector Equity Fund | 104,338,689 | 142,565 | 63,245,555 | -- | 6,739,679 | 3,917,859 | 51,893,237 |
| Fidelity Series Blue Chip Growth Fund | 107,885,174 | 9,571,563 | 25,469,308 | 9,418,055 | 9,382,474 | (426,018) | 100,943,885 |
| Fidelity Series Canada Fund | 27,093,349 | 35,848 | 4,597,144 | -- | 80,354 | 1,570,660 | 24,183,067 |
| Fidelity Series Commodity Strategy Fund | 137,197,589 | 17,628,555 | 21,424,243 | 7,411,479 | (12,115,316) | 1,943,108 | 123,229,693 |
| Fidelity Series Emerging Markets Debt Fund | 48,296,926 | 1,438,936 | 2,591,766 | 1,387,040 | (109,787) | (2,513,545) | 44,520,764 |
| Fidelity Series Emerging Markets Fund | -- | 26,014,737 | -- | -- | -- | (79,670) | 25,935,067 |
| Fidelity Series Emerging Markets Opportunities Fund | 317,936,755 | 7,629,394 | 20,111,703 | -- | 2,800,779 | (41,714,980) | 266,540,245 |
| Fidelity Series Floating Rate High Income Fund | 15,446,698 | 425,382 | 1,033,012 | 403,743 | (42,046) | 56,868 | 14,853,890 |
| Fidelity Series Government Money Market Fund 2.12% | 939,655,611 | 101,925,082 | 316,497,419 | 8,361,044 | -- | -- | 725,083,274 |
| Fidelity Series Growth Company Fund | 223,906,115 | 299,703 | 53,389,773 | -- | 25,688,430 | 6,007,355 | 202,511,830 |
| Fidelity Series High Income Fund | 96,454,868 | 2,706,830 | 13,554,009 | 2,594,305 | (561,419) | 1,315,158 | 86,361,428 |
| Fidelity Series Inflation-Protected Bond Index Fund | 178,194,874 | 401,025,758 | 15,393,845 | 540,807 | (725,022) | (1,155,100) | 561,946,665 |
| Fidelity Series International Credit Fund | 3,431,541 | 42,292 | 27,952 | 42,290 | (375) | (34,148) | 3,411,358 |
| Fidelity Series International Growth Fund | 280,934,996 | 364,682 | 43,632,249 | -- | 14,316,017 | (10,618,298) | 241,365,148 |
| Fidelity Series International Small Cap Fund | 69,606,079 | 1,327,875 | 10,790,607 | -- | 3,208,646 | (5,754,052) | 57,597,941 |
| Fidelity Series International Value Fund | 276,230,918 | 364,680 | 30,540,985 | -- | 1,301,162 | (2,649,644) | 244,706,131 |
| Fidelity Series Intrinsic Opportunities Fund | 270,386,197 | 11,254,573 | 40,362,721 | 10,890,050 | 3,820,323 | 1,038,658 | 246,137,030 |
| Fidelity Series Investment Grade Bond Fund | 2,054,586,502 | 31,367,263 | 190,897,443 | 27,937,353 | (7,420,763) | (15,839,230) | 1,871,796,329 |
| Fidelity Series Large Cap Stock Fund | 237,596,786 | 14,375,642 | 47,469,959 | 14,042,007 | 5,646,648 | 5,466,718 | 215,615,835 |
| Fidelity Series Large Cap Value Index Fund | 67,588,086 | 91,972 | 11,119,800 | -- | 1,037,885 | 3,418,662 | 61,016,805 |
| Fidelity Series Long-Term Treasury Bond Index Fund | 140,751,002 | 187,086,796 | 17,807,500 | 2,801,879 | (514,079) | (10,051,182) | 299,465,037 |
| Fidelity Series Opportunistic Insights Fund | 118,254,820 | 162,955 | 23,557,539 | -- | 10,352,028 | 4,387,872 | 109,600,136 |
| Fidelity Series Real Estate Equity Fund | 20,792,626 | 142,266 | 21,515,609 | 117,176 | 3,933,001 | (3,352,284) | -- |
| Fidelity Series Real Estate Income Fund | 29,805,115 | 1,295,676 | 1,957,655 | 1,254,330 | 101,713 | 83,844 | 29,328,693 |
| Fidelity Series Short-Term Credit Fund | 230,191,316 | 2,867,077 | 40,055,309 | 2,546,712 | (564,132) | 561,405 | 193,000,357 |
| Fidelity Series Small Cap Discovery Fund | 32,169,764 | 1,928,944 | 4,176,144 | 1,883,849 | 405,377 | (814,129) | 29,513,812 |
| Fidelity Series Small Cap Opportunities Fund | 98,250,232 | 7,014,990 | 20,651,145 | 6,878,847 | 5,002,322 | (1,074,725) | 88,541,674 |
| Fidelity Series Stock Selector Large Cap Value Fund | 184,075,787 | 251,770 | 33,072,920 | -- | 7,257,308 | 4,843,527 | 163,355,472 |
| Fidelity Series Value Discovery Fund | 130,831,369 | 178,467 | 22,070,434 | -- | 5,600,160 | 1,680,500 | 116,220,062 |
| | $6,496,266,282 | $828,962,275 | $1,153,580,828 | $98,510,966 | $107,767,968 | $(80,740,832) | $6,198,674,865 |
Amounts in the income column in the above table include any capital gain distributions from underlying funds, which are presented in the corresponding line-item in the Statement of Operations if applicable.
Investment Valuation
The following is a summary of the inputs used, as of September 30, 2018, involving the Fund's assets and liabilities carried at fair value. The inputs or methodology used for valuing securities may not be an indication of the risk associated with investing in those securities. For more information on valuation inputs, and their aggregation into the levels used below, please refer to the Investment Valuation section in the accompanying Notes to Financial Statements.
| | Valuation Inputs at Reporting Date: |
| Description | Total | Level 1 | Level 2 | Level 3 |
| Investments in Securities: | | | | |
| Other Short-Term Investments | $4,309,070 | $-- | $4,309,070 | $-- |
| Domestic Equity Funds | 1,508,579,471 | 1,508,579,471 | -- | -- |
| International Equity Funds | 860,327,599 | 860,327,599 | -- | -- |
| Bond Funds | 2,911,684,164 | 2,911,684,164 | -- | -- |
| Short-Term Funds | 928,535,395 | 928,535,395 | -- | -- |
| Total Investments in Securities: | $6,213,435,699 | $6,209,126,629 | $4,309,070 | $-- |
| Derivative Instruments: | | | | |
| Assets | | | | |
| Futures Contracts | $717,685 | $717,685 | $-- | $-- |
| Total Assets | $717,685 | $717,685 | $-- | $-- |
| Liabilities | | | | |
| Futures Contracts | $(56,078) | $(56,078) | $-- | $-- |
| Total Liabilities | $(56,078) | $(56,078) | $-- | $-- |
| Total Derivative Instruments: | $661,607 | $661,607 | $-- | $-- |
Value of Derivative Instruments
The following table is a summary of the Fund's value of derivative instruments by primary risk exposure as of September 30, 2018. For additional information on derivative instruments, please refer to the Derivative Instruments section in the accompanying Notes to Financial Statements.
| Primary Risk Exposure / Derivative Type | Value |
| | Asset | Liability |
| Equity Risk | | |
| Futures Contracts(a) | $717,685 | $(56,078) |
| Total Equity Risk | 717,685 | (56,078) |
| Total Value of Derivatives | $717,685 | $(56,078) |
(a) Reflects gross cumulative appreciation (depreciation) on futures contracts as presented in the Schedule of Investments. In the Statement of Assets and Liabilities, the period end daily variation margin is included in receivable or payable for daily variation margin on futures contracts, and the net cumulative appreciation (depreciation) is included in net unrealized appreciation (depreciation).
See accompanying notes which are an integral part of the financial statements.
Fidelity Freedom® 2010 Fund
Financial Statements
Statement of Assets and Liabilities
| | | September 30, 2018 (Unaudited) |
| Assets | | |
Investment in securities, at value — See accompanying schedule:
Unaffiliated issuers (cost $4,309,407) | $4,309,070 | |
| Fidelity Central Funds (cost $10,451,764) | 10,451,764 | |
| Other affiliated issuers (cost $5,614,455,322) | 6,198,674,865 | |
| Total Investment in Securities (cost $5,629,216,493) | | $6,213,435,699 |
| Receivable for investments sold | | 25,395,869 |
| Receivable for fund shares sold | | 43,423,852 |
| Distributions receivable from Fidelity Central Funds | | 15,258 |
| Other receivables | | 93,931 |
| Total assets | | 6,282,364,609 |
| Liabilities | | |
| Payable for investments purchased | $23,412,225 | |
| Payable for fund shares redeemed | 45,312,623 | |
| Accrued management fee | 2,592,155 | |
| Payable for daily variation margin on futures contracts | 355,010 | |
| Other payables and accrued expenses | 93,933 | |
| Total liabilities | | 71,765,946 |
| Net Assets | | $6,210,598,663 |
| Net Assets consist of: | | |
| Paid in capital | | $5,453,599,612 |
| Undistributed net investment income | | 45,776,812 |
| Accumulated undistributed net realized gain (loss) on investments | | 126,341,426 |
| Net unrealized appreciation (depreciation) on investments | | 584,880,813 |
| Net Assets | | $6,210,598,663 |
| Fidelity Freedom 2010 Fund: | | |
| Net Asset Value, offering price and redemption price per share ($3,912,850,518 ÷ 246,545,650 shares) | | $15.87 |
| Class K: | | |
| Net Asset Value, offering price and redemption price per share ($2,141,312,975 ÷ 135,032,714 shares) | | $15.86 |
| Class K6: | | |
| Net Asset Value, offering price and redemption price per share ($156,435,170 ÷ 9,869,361 shares) | | $15.85 |
See accompanying notes which are an integral part of the financial statements.
Statement of Operations
| | | Six months ended September 30, 2018 (Unaudited) |
| Investment Income | | |
| Dividends: | | |
| Affiliated issuers | | $61,624,998 |
| Interest | | 17,873 |
| Income from Fidelity Central Funds | | 41,034 |
| Total income | | 61,683,905 |
| Expenses | | |
| Management fee | $15,920,645 | |
| Independent trustees' fees and expenses | 15,661 | |
| Total expenses before reductions | 15,936,306 | |
| Expense reductions | (38) | |
| Total expenses after reductions | | 15,936,268 |
| Net investment income (loss) | | 45,747,637 |
| Realized and Unrealized Gain (Loss) | | |
| Net realized gain (loss) on: | | |
| Investment securities: | | |
| Fidelity Central Funds | (160) | |
| Other affiliated issuers | 107,767,968 | |
| Futures contracts | (2,468,390) | |
| Capital gain distributions from underlying funds: | | |
| Affiliated issuers | 36,885,968 | |
| Total net realized gain (loss) | | 142,185,386 |
| Change in net unrealized appreciation (depreciation) on: | | |
| Investment securities: | | |
| Unaffiliated issuers | (308) | |
| Affiliated issuers | (80,740,832) | |
| Futures contracts | 661,607 | |
| Total change in net unrealized appreciation (depreciation) | | (80,079,533) |
| Net gain (loss) | | 62,105,853 |
| Net increase (decrease) in net assets resulting from operations | | $107,853,490 |
See accompanying notes which are an integral part of the financial statements.
Statement of Changes in Net Assets
| | Six months ended September 30, 2018 (Unaudited) | Year ended March 31, 2018 |
| Increase (Decrease) in Net Assets | | |
| Operations | | |
| Net investment income (loss) | $45,747,637 | $95,597,195 |
| Net realized gain (loss) | 142,185,386 | 280,325,462 |
| Change in net unrealized appreciation (depreciation) | (80,079,533) | 13,024,260 |
| Net increase (decrease) in net assets resulting from operations | 107,853,490 | 388,946,917 |
| Distributions to shareholders from net investment income | (13,644,925) | (93,275,651) |
| Distributions to shareholders from net realized gain | (139,801,282) | (192,908,815) |
| Total distributions | (153,446,207) | (286,184,466) |
| Share transactions - net increase (decrease) | (238,158,638) | 2,254,227,956 |
| Total increase (decrease) in net assets | (283,751,355) | 2,356,990,407 |
| Net Assets | | |
| Beginning of period | 6,494,350,018 | 4,137,359,611 |
| End of period | $6,210,598,663 | $6,494,350,018 |
| Other Information | | |
| Undistributed net investment income end of period | $45,776,812 | $13,674,100 |
See accompanying notes which are an integral part of the financial statements.
Financial Highlights
Fidelity Freedom 2010 Fund
| | Six months ended (Unaudited) September 30, | Years endedMarch 31, | | | | |
| | 2018 | 2018 | 2017 | 2016 | 2015 | 2014 |
| Selected Per–Share Data | | | | | | |
| Net asset value, beginning of period | $15.98 | $15.56 | $14.75 | $15.75 | $15.51 | $14.67 |
| Income from Investment Operations | | | | | | |
| Net investment income (loss)A | .11 | .24 | .26 | .28 | .28 | .22 |
| Net realized and unrealized gain (loss) | .16 | .95 | 1.08 | (.50) | .62 | .99 |
| Total from investment operations | .27 | 1.19 | 1.34 | (.22) | .90 | 1.21 |
| Distributions from net investment income | (.03) | (.23) | (.26) | (.29) | (.29) | (.21) |
| Distributions from net realized gain | (.35) | (.54) | (.26) | (.49) | (.36) | (.16) |
| Total distributions | (.38) | (.77) | (.53)B | (.78) | (.66)C | (.37) |
| Net asset value, end of period | $15.87 | $15.98 | $15.56 | $14.75 | $15.75 | $15.51 |
| Total ReturnD,E | 1.71% | 7.74% | 9.27% | (1.42)% | 5.91% | 8.31% |
| Ratios to Average Net AssetsF,G | | | | | | |
| Expenses before reductions | .52%H,I | .44% | - %J | - %J | - %J | - %J |
| Expenses net of fee waivers, if any | .52%H,I | .44% | -% | -% | -% | -% |
| Expenses net of all reductions | .52%H,I | .44% | -% | -% | -% | -% |
| Net investment income (loss) | 1.41%H | 1.47% | 1.69% | 1.86% | 1.81% | 1.43% |
| Supplemental Data | | | | | | |
| Net assets, end of period (000 omitted) | $3,912,851 | $4,038,370 | $4,137,360 | $4,271,151 | $4,940,590 | $5,419,921 |
| Portfolio turnover rateG | 26%H | 19%K | 23% | 17% | 18% | 35% |
A Calculated based on average shares outstanding during the period.
B Total distributions of $.53 per share is comprised of distributions from net investment income of $.262 and distributions from net realized gain of $.264 per share.
C Total distributions of $.66 per share is comprised of distributions from net investment income of $.294 and distributions from net realized gain of $.361 per share.
D Total returns for periods of less than one year are not annualized.
E Total returns would have been lower if certain expenses had not been reduced during the applicable periods shown.
F Expense ratios reflect operating expenses of the class. Expenses before reductions do not reflect amounts reimbursed by the investment adviser or reductions from expense offset arrangements and do not represent the amount paid by the class during periods when reimbursements or reductions occur. Expenses net of fee waivers reflect expenses after reimbursement by the investment adviser but prior to reductions from expense offset arrangements. Expenses net of all reductions represent the net expenses paid by the class but do not include expenses of the underlying funds in which the Fund invests.
G Amounts do not include the activity of the Underlying Funds.
H Annualized
I On certain classes, the size and fluctuation of net assets and expense amounts may cause ratios to differ from contractual rates.
J Amount represents less than .005%.
K The portfolio turnover rate does not include the assets acquired in the merger.
See accompanying notes which are an integral part of the financial statements.
Fidelity Freedom 2010 Fund Class K
| | Six months ended (Unaudited) September 30, | Years endedMarch 31, |
| | 2018 | 2018 A |
| Selected Per–Share Data | | |
| Net asset value, beginning of period | $15.97 | $15.96 |
| Income from Investment Operations | | |
| Net investment income (loss)B | .12 | .27 |
| Net realized and unrealized gain (loss) | .15 | .31 |
| Total from investment operations | .27 | .58 |
| Distributions from net investment income | (.04) | (.22) |
| Distributions from net realized gain | (.35) | (.35) |
| Total distributions | (.38)C | (.57) |
| Net asset value, end of period | $15.86 | $15.97 |
| Total ReturnD,E | 1.72% | 3.59% |
| Ratios to Average Net AssetsF,G | | |
| Expenses before reductions | .46%H | .47%H |
| Expenses net of fee waivers, if any | .46%H | .47%H |
| Expenses net of all reductions | .46%H | .47%H |
| Net investment income (loss) | 1.48%H | 2.42%H |
| Supplemental Data | | |
| Net assets, end of period (000 omitted) | $2,141,313 | $2,396,182 |
| Portfolio turnover rateG | 26%H | 19%I |
A For the period July 20, 2017 (commencement of sale of shares) to March 31, 2018.
B Calculated based on average shares outstanding during the period.
C Total distributions of $.38 per share is comprised of distributions from net investment income of $.035 and distributions from net realized gain of $.347 per share.
D Total returns for periods of less than one year are not annualized.
E Total returns would have been lower if certain expenses had not been reduced during the applicable periods shown.
F Expense ratios reflect operating expenses of the class. Expenses before reductions do not reflect amounts reimbursed by the investment adviser or reductions from expense offset arrangements and do not represent the amount paid by the class during periods when reimbursements or reductions occur. Expense ratios before reductions for start-up periods may not be representative of longer-term operating periods. Expenses net of fee waivers reflect expenses after reimbursement by the investment adviser but prior to reductions from expense offset arrangements. Expenses net of all reductions represent the net expenses paid by the class but do not include expenses of the underlying funds in which the Fund invests.
G Amounts do not include the activity of the Underlying Funds.
H Annualized
I The portfolio turnover rate does not include the assets acquired in the merger.
See accompanying notes which are an integral part of the financial statements.
Fidelity Freedom 2010 Fund Class K6
| | Six months ended (Unaudited) September 30, | Years endedMarch 31, |
| | 2018 | 2018 A |
| Selected Per–Share Data | | |
| Net asset value, beginning of period | $15.97 | $15.77 |
| Income from Investment Operations | | |
| Net investment income (loss)B | .12 | .27 |
| Net realized and unrealized gain (loss) | .15 | .50 |
| Total from investment operations | .27 | .77 |
| Distributions from net investment income | (.05) | (.22) |
| Distributions from net realized gain | (.35) | (.35) |
| Total distributions | (.39)C | (.57) |
| Net asset value, end of period | $15.85 | $15.97 |
| Total ReturnD,E | 1.72% | 4.89% |
| Ratios to Average Net AssetsF,G | | |
| Expenses before reductions | .39%H | .40%H |
| Expenses net of fee waivers, if any | .39%H | .40%H |
| Expenses net of all reductions | .39%H | .40%H |
| Net investment income (loss) | 1.54%H | 2.07%H |
| Supplemental Data | | |
| Net assets, end of period (000 omitted) | $156,435 | $59,797 |
| Portfolio turnover rateG | 26%H | 19%I |
A For the period June 7, 2017 (commencement of sale of shares) to March 31, 2018.
B Calculated based on average shares outstanding during the period.
C Total distributions of $.39 per share is comprised of distributions from net investment income of $.045 and distributions from net realized gain of $.347 per share.
D Total returns for periods of less than one year are not annualized.
E Total returns would have been lower if certain expenses had not been reduced during the applicable periods shown.
F Expense ratios reflect operating expenses of the class. Expenses before reductions do not reflect amounts reimbursed by the investment adviser or reductions from expense offset arrangements and do not represent the amount paid by the class during periods when reimbursements or reductions occur. Expense ratios before reductions for start-up periods may not be representative of longer-term operating periods. Expenses net of fee waivers reflect expenses after reimbursement by the investment adviser but prior to reductions from expense offset arrangements. Expenses net of all reductions represent the net expenses paid by the class but do not include expenses of the underlying funds in which the Fund invests.
G Amounts do not include the activity of the Underlying Funds.
H Annualized
I The portfolio turnover rate does not include the assets acquired in the merger.
See accompanying notes which are an integral part of the financial statements.
Fidelity Freedom® 2015 Fund
Investment Summary (Unaudited)
The information in the following tables is based on the direct investments of the Fund.
Top Holdings as of September 30, 2018
| | % of fund's net assets |
| Fidelity Series Investment Grade Bond Fund | 26.4 |
| Fidelity Series Government Money Market Fund 2.12% | 8.9 |
| Fidelity Series Inflation-Protected Bond Index Fund | 7.1 |
| Fidelity Series Intrinsic Opportunities Fund | 5.1 |
| Fidelity Series Emerging Markets Opportunities Fund | 5.0 |
| Fidelity Series Long-Term Treasury Bond Index Fund | 4.9 |
| Fidelity Series International Value Fund | 4.8 |
| Fidelity Series International Growth Fund | 4.8 |
| Fidelity Series Large Cap Stock Fund | 4.5 |
| Fidelity Series Growth Company Fund | 4.2 |
| | 75.7 |
Asset Allocation (% of fund's net assets)
| Period end |
| | Domestic Equity Funds | 30.8% |
| | International Equity Funds | 16.4% |
| | Bond Funds | 41.3% |
| | Short-Term Funds | 11.4% |
| | Short-Term Investments | 0.1% |

Domestic Equity Funds category includes Fidelity Series Commodity Strategy Fund which invests in commodity-related investments.
Fidelity Freedom® 2015 Fund
Schedule of Investments September 30, 2018 (Unaudited)
Showing Percentage of Net Assets
| U.S. Treasury Obligations - 0.1% | | | |
| | | Principal Amount | Value |
| U.S. Treasury Bills, yield at date of purchase 1.97% to 2.11% 11/1/18 to 12/6/18 (a) | | | |
| (Cost $6,963,454) | | 6,980,000 | 6,962,914 |
| | | Shares | Value |
|
| Domestic Equity Funds - 30.8% | | | |
| Fidelity Series All-Sector Equity Fund (b) | | 7,658,881 | $104,237,365 |
| Fidelity Series Blue Chip Growth Fund (b) | | 13,099,158 | 200,417,110 |
| Fidelity Series Commodity Strategy Fund (b) | | 38,185,260 | 190,926,300 |
| Fidelity Series Growth Company Fund (b) | | 19,881,835 | 401,811,889 |
| Fidelity Series Intrinsic Opportunities Fund (b) | | 26,628,510 | 488,100,596 |
| Fidelity Series Large Cap Stock Fund (b) | | 26,863,876 | 427,941,546 |
| Fidelity Series Large Cap Value Index Fund (b) | | 9,184,646 | 121,237,328 |
| Fidelity Series Opportunistic Insights Fund (b) | | 10,962,366 | 217,602,974 |
| Fidelity Series Small Cap Discovery Fund (b) | | 4,752,915 | 57,747,920 |
| Fidelity Series Small Cap Opportunities Fund (b) | | 11,968,751 | 175,820,954 |
| Fidelity Series Stock Selector Large Cap Value Fund (b) | | 24,529,834 | 324,284,401 |
| Fidelity Series Value Discovery Fund (b) | | 16,856,316 | 230,762,968 |
| TOTAL DOMESTIC EQUITY FUNDS | | | |
| (Cost $2,013,102,833) | | | 2,940,891,351 |
|
| International Equity Funds - 16.4% | | | |
| Fidelity Series Canada Fund (b) | | 4,212,192 | 45,533,790 |
| Fidelity Series Emerging Markets Fund (b) | | 2,124,534 | 20,586,736 |
| Fidelity Series Emerging Markets Opportunities Fund (b) | | 24,635,965 | 472,764,169 |
| Fidelity Series International Growth Fund (b) | | 27,776,770 | 455,539,033 |
| Fidelity Series International Small Cap Fund (b) | | 6,080,028 | 108,832,500 |
| Fidelity Series International Value Fund (b) | | 43,901,453 | 461,843,287 |
| TOTAL INTERNATIONAL EQUITY FUNDS | | | |
| (Cost $1,161,992,869) | | | 1,565,099,515 |
|
| Bond Funds - 41.3% | | | |
| Fidelity Series Emerging Markets Debt Fund (b) | | 6,862,234 | 65,397,088 |
| Fidelity Series Floating Rate High Income Fund (b) | | 2,348,381 | 22,356,586 |
| Fidelity Series High Income Fund (b) | | 14,013,876 | 134,673,346 |
| Fidelity Series Inflation-Protected Bond Index Fund (b) | | 69,490,388 | 674,751,670 |
| Fidelity Series International Credit Fund (b) | | 527,686 | 5,187,152 |
| Fidelity Series Investment Grade Bond Fund (b) | | 231,533,682 | 2,521,401,798 |
| Fidelity Series Long-Term Treasury Bond Index Fund (b) | | 56,905,913 | 468,904,720 |
| Fidelity Series Real Estate Income Fund (b) | | 4,047,514 | 43,632,202 |
| TOTAL BOND FUNDS | | | |
| (Cost $4,044,757,529) | | | 3,936,304,562 |
|
| Short-Term Funds - 11.4% | | | |
| Fidelity Cash Central Fund, 2.11% (c) | | 13,952,759 | 13,955,550 |
| Fidelity Series Government Money Market Fund 2.12% (b)(d) | | 843,781,001 | 843,781,001 |
| Fidelity Series Short-Term Credit Fund (b) | | 23,286,742 | 229,607,272 |
| TOTAL SHORT-TERM FUNDS | | | |
| (Cost $1,090,261,051) | | | 1,087,343,823 |
| TOTAL INVESTMENT IN SECURITIES - 100.0% | | | |
| (Cost $8,317,077,736) | | | 9,536,602,165 |
| NET OTHER ASSETS (LIABILITIES) - 0.0% | | | (4,222,720) |
| NET ASSETS - 100% | | | $9,532,379,445 |
| Futures Contracts | | | | | |
| | Number of contracts | Expiration Date | Notional Amount | Value | Unrealized Appreciation/(Depreciation) |
| Purchased | | | | | |
| Equity Index Contracts | | | | | |
| ICE E-mini MSCI Emerging Markets Index Contracts (United States) | 1,504 | Dec. 2018 | $78,937,440 | $1,452,217 | $1,452,217 |
| Sold | | | | | |
| Equity Index Contracts | | | | | |
| CME E-mini S&P 500 Index Contracts (United States) | 633 | Dec. 2018 | 92,386,350 | (110,178) | (110,178) |
| TOTAL FUTURES CONTRACTS | | | | | $1,342,039 |
The notional amount of futures purchased as a percentage of Net Assets is 0.8%
The notional amount of futures sold as a percentage of Net Assets is 1.0%
Legend
(a) Security or a portion of the security was pledged to cover margin requirements for futures contracts. At period end, the value of securities pledged amounted to $5,755,063.
(b) Affiliated Fund
(c) Affiliated fund that is generally available only to investment companies and other accounts managed by Fidelity Investments. The rate quoted is the annualized seven-day yield of the fund at period end. A complete unaudited listing of the fund's holdings as of its most recent quarter end is available upon request. In addition, each Fidelity Central Fund's financial statements are available on the SEC's website or upon request.
(d) The rate quoted is the annualized seven-day yield of the fund at period end.
Affiliated Central Funds
Information regarding fiscal year to date income earned by the Fund from investments in Fidelity Central Funds is as follows:
| Fund | Income earned |
| Fidelity Cash Central Fund | $56,713 |
| Total | $56,713 |
Amounts in the income column in the above table include any capital gain distributions from underlying funds, which are presented in the corresponding line-item in the Statement of Operations if applicable.
Affiliated Underlying Funds
Fiscal year to date information regarding the Fund's investments in affiliated Underlying Funds, excluding any Money Market Central Funds, is presented below. Exchanges between classes of the same affiliated Underlying Funds may occur.
| Affiliate | Value, beginning of period | Purchases | Sales Proceeds | Dividend Income | Realized Gain (loss) | Change in Unrealized appreciation (depreciation) | Value, end of period |
| Fidelity Series 100 Index Fund | $105,566,561 | $1 | $109,407,302 | $-- | $40,106,846 | $(36,266,106) | $-- |
| Fidelity Series All-Sector Equity Fund | 202,550,169 | 165,642 | 119,273,752 | -- | 17,821,865 | 2,973,441 | 104,237,365 |
| Fidelity Series Blue Chip Growth Fund | 209,424,941 | 18,861,866 | 44,822,850 | 18,683,697 | 16,415,893 | 537,260 | 200,417,110 |
| Fidelity Series Canada Fund | 50,695,921 | 44,480 | 8,302,451 | -- | 150,419 | 2,945,421 | 45,533,790 |
| Fidelity Series Commodity Strategy Fund | 214,500,126 | 26,473,497 | 34,262,949 | 11,474,253 | (14,531,977) | (1,252,397) | 190,926,300 |
| Fidelity Series Emerging Markets Debt Fund | 72,411,618 | 2,115,267 | 5,219,690 | 2,061,854 | (192,210) | (3,717,897) | 65,397,088 |
| Fidelity Series Emerging Markets Fund | -- | 20,647,008 | -- | -- | -- | (60,272) | 20,586,736 |
| Fidelity Series Emerging Markets Opportunities Fund | 567,323,168 | 19,277,116 | 44,269,796 | -- | 4,838,181 | (74,404,500) | 472,764,169 |
| Fidelity Series Floating Rate High Income Fund | 23,739,962 | 637,234 | 2,042,272 | 614,954 | (82,549) | 104,211 | 22,356,586 |
| Fidelity Series Government Money Market Fund 2.12% | 1,087,835,535 | 130,846,320 | 374,900,854 | 9,813,245 | -- | -- | 843,781,001 |
| Fidelity Series Growth Company Fund | 432,334,504 | 327,473 | 92,082,102 | -- | 42,975,194 | 18,256,820 | 401,811,889 |
| Fidelity Series High Income Fund | 148,415,499 | 4,173,453 | 19,083,941 | 4,057,611 | (765,770) | 1,934,105 | 134,673,346 |
| Fidelity Series Inflation-Protected Bond Index Fund | 199,093,014 | 500,074,055 | 21,995,353 | 632,749 | (549,352) | (1,870,694) | 674,751,670 |
| Fidelity Series International Credit Fund | 5,270,239 | 64,952 | 95,017 | 64,949 | (1,322) | (51,700) | 5,187,152 |
| Fidelity Series International Growth Fund | 522,861,176 | 447,505 | 74,893,359 | -- | 24,509,876 | (17,386,165) | 455,539,033 |
| Fidelity Series International Small Cap Fund | 130,259,302 | 2,410,977 | 19,170,077 | -- | 5,779,036 | (10,446,738) | 108,832,500 |
| Fidelity Series International Value Fund | 517,007,350 | 447,500 | 53,572,606 | -- | 3,710,775 | (5,749,732) | 461,843,287 |
| Fidelity Series Intrinsic Opportunities Fund | 526,008,710 | 21,994,978 | 69,121,942 | 21,592,356 | 6,511,770 | 2,707,080 | 488,100,596 |
| Fidelity Series Investment Grade Bond Fund | 2,839,330,215 | 40,597,523 | 326,746,479 | 38,121,432 | (14,687,457) | (17,092,004) | 2,521,401,798 |
| Fidelity Series Large Cap Stock Fund | 468,089,078 | 27,655,756 | 89,839,128 | 27,279,056 | 6,297,421 | 15,738,419 | 427,941,546 |
| Fidelity Series Large Cap Value Index Fund | 131,206,403 | 101,894 | 18,797,821 | -- | 2,088,173 | 6,638,679 | 121,237,328 |
| Fidelity Series Long-Term Treasury Bond Index Fund | 222,582,675 | 287,217,527 | 24,286,590 | 4,814,374 | (548,000) | (16,060,892) | 468,904,720 |
| Fidelity Series Opportunistic Insights Fund | 229,538,880 | 178,725 | 40,742,237 | -- | 16,518,077 | 12,109,529 | 217,602,974 |
| Fidelity Series Real Estate Equity Fund | 40,229,865 | 286,682 | 41,604,622 | 251,884 | 6,843,030 | (5,754,955) | -- |
| Fidelity Series Real Estate Income Fund | 45,268,860 | 1,945,253 | 3,877,160 | 1,878,975 | 225,064 | 70,185 | 43,632,202 |
| Fidelity Series Short-Term Credit Fund | 266,092,890 | 3,150,871 | 39,632,397 | 2,916,475 | (544,484) | 540,392 | 229,607,272 |
| Fidelity Series Small Cap Discovery Fund | 62,450,884 | 3,708,234 | 7,624,147 | 3,648,644 | 713,232 | (1,500,283) | 57,747,920 |
| Fidelity Series Small Cap Opportunities Fund | 190,744,879 | 13,804,967 | 36,025,212 | 13,648,437 | 8,560,808 | (1,264,488) | 175,820,954 |
| Fidelity Series Stock Selector Large Cap Value Fund | 357,360,316 | 278,813 | 56,973,360 | -- | 11,923,124 | 11,695,508 | 324,284,401 |
| Fidelity Series Value Discovery Fund | 253,985,129 | 197,475 | 37,652,579 | -- | 9,584,673 | 4,648,270 | 230,762,968 |
| | $10,122,177,869 | $1,128,133,044 | $1,816,318,045 | $161,554,945 | $193,670,336 | $(111,979,503) | $9,515,683,701 |
Amounts in the income column in the above table include any capital gain distributions from underlying funds, which are presented in the corresponding line-item in the Statement of Operations if applicable.
Investment Valuation
The following is a summary of the inputs used, as of September 30, 2018, involving the Fund's assets and liabilities carried at fair value. The inputs or methodology used for valuing securities may not be an indication of the risk associated with investing in those securities. For more information on valuation inputs, and their aggregation into the levels used below, please refer to the Investment Valuation section in the accompanying Notes to Financial Statements.
| | Valuation Inputs at Reporting Date: |
| Description | Total | Level 1 | Level 2 | Level 3 |
| Investments in Securities: | | | | |
| Other Short-Term Investments | $6,962,914 | $-- | $6,962,914 | $-- |
| Domestic Equity Funds | 2,940,891,351 | 2,940,891,351 | -- | -- |
| International Equity Funds | 1,565,099,515 | 1,565,099,515 | -- | -- |
| Bond Funds | 3,936,304,562 | 3,936,304,562 | -- | -- |
| Short-Term Funds | 1,087,343,823 | 1,087,343,823 | -- | -- |
| Total Investments in Securities: | $9,536,602,165 | $9,529,639,251 | $6,962,914 | $-- |
| Derivative Instruments: | | | | |
| Assets | | | | |
| Futures Contracts | $1,452,217 | $1,452,217 | $-- | $-- |
| Total Assets | $1,452,217 | $1,452,217 | $-- | $-- |
| Liabilities | | | | |
| Futures Contracts | $(110,178) | $(110,178) | $-- | $-- |
| Total Liabilities | $(110,178) | $(110,178) | $-- | $-- |
| Total Derivative Instruments: | $1,342,039 | $1,342,039 | $-- | $-- |
Value of Derivative Instruments
The following table is a summary of the Fund's value of derivative instruments by primary risk exposure as of September 30, 2018. For additional information on derivative instruments, please refer to the Derivative Instruments section in the accompanying Notes to Financial Statements.
| Primary Risk Exposure / Derivative Type | Value |
| | Asset | Liability |
| Equity Risk | | |
| Futures Contracts(a) | $1,452,217 | $(110,178) |
| Total Equity Risk | 1,452,217 | (110,178) |
| Total Value of Derivatives | $1,452,217 | $(110,178) |
(a) Reflects gross cumulative appreciation (depreciation) on futures contracts as presented in the Schedule of Investments. In the Statement of Assets and Liabilities, the period end daily variation margin is included in receivable or payable for daily variation margin on futures contracts, and the net cumulative appreciation (depreciation) is included in net unrealized appreciation (depreciation).
See accompanying notes which are an integral part of the financial statements.
Fidelity Freedom® 2015 Fund
Financial Statements
Statement of Assets and Liabilities
| | | September 30, 2018 (Unaudited) |
| Assets | | |
Investment in securities, at value — See accompanying schedule:
Unaffiliated issuers (cost $6,963,454) | $6,962,914 | |
| Fidelity Central Funds (cost $13,955,550) | 13,955,550 | |
| Other affiliated issuers (cost $8,296,158,732) | 9,515,683,701 | |
| Total Investment in Securities (cost $8,317,077,736) | | $9,536,602,165 |
| Receivable for investments sold | | 19,451,157 |
| Receivable for fund shares sold | | 151,139,181 |
| Distributions receivable from Fidelity Central Funds | | 20,143 |
| Total assets | | 9,707,212,646 |
| Liabilities | | |
| Payable for investments purchased | $15,312,677 | |
| Payable for fund shares redeemed | 154,742,851 | |
| Accrued management fee | 4,235,571 | |
| Payable for daily variation margin on futures contracts | 542,102 | |
| Total liabilities | | 174,833,201 |
| Net Assets | | $9,532,379,445 |
| Net Assets consist of: | | |
| Paid in capital | | $8,004,819,143 |
| Undistributed net investment income | | 62,789,082 |
| Accumulated undistributed net realized gain (loss) on investments | | 243,904,752 |
| Net unrealized appreciation (depreciation) on investments | | 1,220,866,468 |
| Net Assets | | $9,532,379,445 |
| Fidelity Freedom 2015 Fund: | | |
| Net Asset Value, offering price and redemption price per share ($5,221,028,753 ÷ 393,516,799 shares) | | $13.27 |
| Class K: | | |
| Net Asset Value, offering price and redemption price per share ($3,944,021,176 ÷ 297,621,143 shares) | | $13.25 |
| Class K6: | | |
| Net Asset Value, offering price and redemption price per share ($367,329,516 ÷ 27,706,572 shares) | | $13.26 |
See accompanying notes which are an integral part of the financial statements.
Statement of Operations
| | | Six months ended September 30, 2018 (Unaudited) |
| Investment Income | | |
| Dividends: | | |
| Affiliated issuers | | $89,189,405 |
| Interest | | 27,693 |
| Income from Fidelity Central Funds | | 56,713 |
| Total income | | 89,273,811 |
| Expenses | | |
| Management fee | $26,301,567 | |
| Independent trustees' fees and expenses | 24,338 | |
| Total expenses before reductions | 26,325,905 | |
| Expense reductions | (55) | |
| Total expenses after reductions | | 26,325,850 |
| Net investment income (loss) | | 62,947,961 |
| Realized and Unrealized Gain (Loss) | | |
| Net realized gain (loss) on: | | |
| Investment securities: | | |
| Fidelity Central Funds | (192) | |
| Other affiliated issuers | 193,670,336 | |
| Futures contracts | (4,911,076) | |
| Capital gain distributions from underlying funds: | | |
| Affiliated issuers | 72,365,540 | |
| Total net realized gain (loss) | | 261,124,608 |
| Change in net unrealized appreciation (depreciation) on: | | |
| Investment securities: | | |
| Unaffiliated issuers | (496) | |
| Affiliated issuers | (111,979,503) | |
| Futures contracts | 1,342,039 | |
| Total change in net unrealized appreciation (depreciation) | | (110,637,960) |
| Net gain (loss) | | 150,486,648 |
| Net increase (decrease) in net assets resulting from operations | | $213,434,609 |
See accompanying notes which are an integral part of the financial statements.
Statement of Changes in Net Assets
| | Six months ended September 30, 2018 (Unaudited) | Year ended March 31, 2018 |
| Increase (Decrease) in Net Assets | | |
| Operations | | |
| Net investment income (loss) | $62,947,961 | $141,540,775 |
| Net realized gain (loss) | 261,124,608 | 463,661,846 |
| Change in net unrealized appreciation (depreciation) | (110,637,960) | 46,350,154 |
| Net increase (decrease) in net assets resulting from operations | 213,434,609 | 651,552,775 |
| Distributions to shareholders from net investment income | (16,218,290) | (138,935,375) |
| Distributions to shareholders from net realized gain | (243,245,554) | (291,414,799) |
| Total distributions | (259,463,844) | (430,350,174) |
| Share transactions - net increase (decrease) | (540,504,439) | 4,570,397,075 |
| Total increase (decrease) in net assets | (586,533,674) | 4,791,599,676 |
| Net Assets | | |
| Beginning of period | 10,118,913,119 | 5,327,313,443 |
| End of period | $9,532,379,445 | $10,118,913,119 |
| Other Information | | |
| Undistributed net investment income end of period | $62,789,082 | $16,059,411 |
See accompanying notes which are an integral part of the financial statements.
Financial Highlights
Fidelity Freedom 2015 Fund
| | Six months ended (Unaudited) September 30, | Years endedMarch 31, | | | | |
| | 2018 | 2018 | 2017 | 2016 | 2015 | 2014 |
| Selected Per–Share Data | | | | | | |
| Net asset value, beginning of period | $13.33 | $12.82 | $12.03 | $12.92 | $12.91 | $12.28 |
| Income from Investment Operations | | | | | | |
| Net investment income (loss)A | .08 | .19 | .21 | .23 | .23 | .18 |
| Net realized and unrealized gain (loss) | .21 | .97 | 1.04 | (.46) | .57 | .91 |
| Total from investment operations | .29 | 1.16 | 1.25 | (.23) | .80 | 1.09 |
| Distributions from net investment income | (.02) | (.19) | (.21) | (.23) | (.25) | (.18) |
| Distributions from net realized gain | (.32) | (.46) | (.24) | (.43) | (.54) | (.28) |
| Total distributions | (.35)B | (.65) | (.46)C | (.66) | (.79) | (.46) |
| Net asset value, end of period | $13.27 | $13.33 | $12.82 | $12.03 | $12.92 | $12.91 |
| Total ReturnD,E | 2.16% | 9.15% | 10.63% | (1.83)% | 6.42% | 8.95% |
| Ratios to Average Net AssetsF,G | | | | | | |
| Expenses before reductions | .57%H | .48% | - %I | - %I | - %I | - %I |
| Expenses net of fee waivers, if any | .57%H | .48% | -% | -% | -% | -% |
| Expenses net of all reductions | .57%H | .48% | -% | -% | -% | -% |
| Net investment income (loss) | 1.24%H | 1.40% | 1.69% | 1.87% | 1.83% | 1.47% |
| Supplemental Data | | | | | | |
| Net assets, end of period (000 omitted) | $5,221,029 | $5,380,580 | $5,327,313 | $5,354,142 | $6,056,161 | $6,388,485 |
| Portfolio turnover rateG | 23%H | 23%J | 21% | 17% | 18% | 39% |
A Calculated based on average shares outstanding during the period.
B Total distributions of $.35 per share is comprised of distributions from net investment income of $.021 and distributions from net realized gain of $.324 per share.
C Total distributions of $.46 per share is comprised of distributions from net investment income of $.214 and distributions from net realized gain of $.243 per share.
D Total returns for periods of less than one year are not annualized.
E Total returns would have been lower if certain expenses had not been reduced during the applicable periods shown.
F Expense ratios reflect operating expenses of the class. Expenses before reductions do not reflect amounts reimbursed by the investment adviser or reductions from expense offset arrangements and do not represent the amount paid by the class during periods when reimbursements or reductions occur. Expenses net of fee waivers reflect expenses after reimbursement by the investment adviser but prior to reductions from expense offset arrangements. Expenses net of all reductions represent the net expenses paid by the class but do not include expenses of the underlying funds in which the Fund invests.
G Amounts do not include the activity of the Underlying Funds.
H Annualized
I Amount represents less than $.005 per share.
J The portfolio turnover rate does not include the assets acquired in the merger.
See accompanying notes which are an integral part of the financial statements.
Fidelity Freedom 2015 Fund Class K
| | Six months ended (Unaudited) September 30, | Years endedMarch 31, |
| | 2018 | 2018 A |
| Selected Per–Share Data | | |
| Net asset value, beginning of period | $13.31 | $13.21 |
| Income from Investment Operations | | |
| Net investment income (loss)B | .09 | .22 |
| Net realized and unrealized gain (loss) | .20 | .34 |
| Total from investment operations | .29 | .56 |
| Distributions from net investment income | (.02) | (.18) |
| Distributions from net realized gain | (.32) | (.29) |
| Total distributions | (.35)C | (.46)D |
| Net asset value, end of period | $13.25 | $13.31 |
| Total ReturnE,F | 2.17% | 4.25% |
| Ratios to Average Net AssetsG,H | | |
| Expenses before reductions | .50%I | .51%I,J |
| Expenses net of fee waivers, if any | .50%I | .51%I,J |
| Expenses net of all reductions | .50%I | .51%I,J |
| Net investment income (loss) | 1.31%I | 2.39%I |
| Supplemental Data | | |
| Net assets, end of period (000 omitted) | $3,944,021 | $4,624,065 |
| Portfolio turnover rateH | 23%I | 23%K |
A For the period July 20, 2017 (commencement of sale of shares) to March 31, 2018.
B Calculated based on average shares outstanding during the period.
C Total distributions of $.35 per share is comprised of distributions from net investment income of $.022 and distributions from net realized gain of $.324 per share.
D Total distributions of $.46 per share is comprised of distributions from net investment income of $.176 and distributions from net realized gain of $.288 per share.
E Total returns for periods of less than one year are not annualized.
F Total returns would have been lower if certain expenses had not been reduced during the applicable periods shown.
G Expense ratios reflect operating expenses of the class. Expenses before reductions do not reflect amounts reimbursed by the investment adviser or reductions from expense offset arrangements and do not represent the amount paid by the class during periods when reimbursements or reductions occur. Expense ratios before reductions for start-up periods may not be representative of longer-term operating periods. Expenses net of fee waivers reflect expenses after reimbursement by the investment adviser but prior to reductions from expense offset arrangements. Expenses net of all reductions represent the net expenses paid by the class but do not include expenses of the underlying funds in which the Fund invests.
H Amounts do not include the activity of the Underlying Funds.
I Annualized
J On certain classes, the size and fluctuation of net assets and expense amounts may cause ratios to differ from contractual rates.
K The portfolio turnover rate does not include the assets acquired in the merger.
See accompanying notes which are an integral part of the financial statements.
Fidelity Freedom 2015 Fund Class K6
| | Six months ended (Unaudited) September 30, | Years endedMarch 31, |
| | 2018 | 2018 A |
| Selected Per–Share Data | | |
| Net asset value, beginning of period | $13.32 | $13.03 |
| Income from Investment Operations | | |
| Net investment income (loss)B | .09 | .21 |
| Net realized and unrealized gain (loss) | .21 | .55 |
| Total from investment operations | .30 | .76 |
| Distributions from net investment income | (.03) | (.18) |
| Distributions from net realized gain | (.32) | (.29) |
| Total distributions | (.36)C | (.47) |
| Net asset value, end of period | $13.26 | $13.32 |
| Total ReturnD,E | 2.24% | 5.80% |
| Ratios to Average Net AssetsF,G | | |
| Expenses before reductions | .41%H | .42%H |
| Expenses net of fee waivers, if any | .41%H | .42%H |
| Expenses net of all reductions | .41%H | .42%H |
| Net investment income (loss) | 1.40%H | 1.88%H |
| Supplemental Data | | |
| Net assets, end of period (000 omitted) | $367,330 | $114,268 |
| Portfolio turnover rateG | 23%H | 23%I |
A For the period June 7, 2017 (commencement of sale of shares) to March 31, 2018.
B Calculated based on average shares outstanding during the period.
C Total distributions of $.36 per share is comprised of distributions from net investment income of $.031 and distributions from net realized gain of $.324 per share.
D Total returns for periods of less than one year are not annualized.
E Total returns would have been lower if certain expenses had not been reduced during the applicable periods shown.
F Expense ratios reflect operating expenses of the class. Expenses before reductions do not reflect amounts reimbursed by the investment adviser or reductions from expense offset arrangements and do not represent the amount paid by the class during periods when reimbursements or reductions occur. Expense ratios before reductions for start-up periods may not be representative of longer-term operating periods. Expenses net of fee waivers reflect expenses after reimbursement by the investment adviser but prior to reductions from expense offset arrangements. Expenses net of all reductions represent the net expenses paid by the class but do not include expenses of the underlying funds in which the Fund invests.
G Amounts do not include the activity of the Underlying Funds.
H Annualized
I The portfolio turnover rate does not include the assets acquired in the merger.
See accompanying notes which are an integral part of the financial statements.
Fidelity Freedom® 2020 Fund
Investment Summary (Unaudited)
The information in the following tables is based on the direct investments of the Fund.
Top Holdings as of September 30, 2018
| | % of fund's net assets |
| Fidelity Series Investment Grade Bond Fund | 23.4 |
| Fidelity Series Government Money Market Fund 2.12% | 6.7 |
| Fidelity Series Intrinsic Opportunities Fund | 6.0 |
| Fidelity Series Emerging Markets Opportunities Fund | 5.6 |
| Fidelity Series International Value Fund | 5.6 |
| Fidelity Series International Growth Fund | 5.5 |
| Fidelity Series Large Cap Stock Fund | 5.3 |
| Fidelity Series Inflation-Protected Bond Index Fund | 5.2 |
| Fidelity Series Long-Term Treasury Bond Index Fund | 5.0 |
| Fidelity Series Growth Company Fund | 5.0 |
| | 73.3 |
Asset Allocation (% of fund's net assets)
| Period end |
| | Domestic Equity Funds | 36.0% |
| | International Equity Funds | 18.8% |
| | Bond Funds | 36.5% |
| | Short-Term Funds | 8.7% |
| | Short-Term Investments | 0.1% |
| | Net Other Assets (Liabilities)* | (0.1)% |
* Net Other Assets (Liabilities) are not included in the pie chart
Domestic Equity Funds category includes Fidelity Series Commodity Strategy Fund which invests in commodity-related investments.
Fidelity Freedom® 2020 Fund
Schedule of Investments September 30, 2018 (Unaudited)
Showing Percentage of Net Assets
| U.S. Treasury Obligations - 0.1% | | | |
| | | Principal Amount | Value |
| U.S. Treasury Bills, yield at date of purchase 1.97% to 2.11% 11/1/18 to 12/6/18 (a) | | | |
| (Cost $20,684,518) | | 20,740,000 | 20,682,973 |
| | | Shares | Value |
|
| Domestic Equity Funds - 36.0% | | | |
| Fidelity Series All-Sector Equity Fund (b) | | 27,901,675 | $379,741,798 |
| Fidelity Series Blue Chip Growth Fund (b) | | 47,180,854 | 721,867,065 |
| Fidelity Series Commodity Strategy Fund (b) | | 115,360,190 | 576,800,948 |
| Fidelity Series Growth Company Fund (b) | | 71,744,072 | 1,449,947,705 |
| Fidelity Series Intrinsic Opportunities Fund (b) | | 95,774,150 | 1,755,540,176 |
| Fidelity Series Large Cap Stock Fund (b) | | 96,968,323 | 1,544,705,386 |
| Fidelity Series Large Cap Value Index Fund (b) | | 33,002,026 | 435,626,739 |
| Fidelity Series Opportunistic Insights Fund (b) | | 39,499,537 | 784,065,805 |
| Fidelity Series Small Cap Discovery Fund (b) | | 16,912,504 | 205,486,924 |
| Fidelity Series Small Cap Opportunities Fund (b) | | 43,090,956 | 633,006,149 |
| Fidelity Series Stock Selector Large Cap Value Fund (b) | | 88,498,465 | 1,169,949,712 |
| Fidelity Series Value Discovery Fund (b) | | 60,755,485 | 831,742,593 |
| TOTAL DOMESTIC EQUITY FUNDS | | | |
| (Cost $7,381,363,828) | | | 10,488,481,000 |
|
| International Equity Funds - 18.8% | | | |
| Fidelity Series Canada Fund (b) | | 15,702,480 | 169,743,805 |
| Fidelity Series Emerging Markets Fund (b) | | 4,980,307 | 48,259,173 |
| Fidelity Series Emerging Markets Opportunities Fund (b) | | 85,388,757 | 1,638,610,256 |
| Fidelity Series International Growth Fund (b) | | 97,581,000 | 1,600,328,399 |
| Fidelity Series International Small Cap Fund (b) | | 21,324,242 | 381,703,938 |
| Fidelity Series International Value Fund (b) | | 154,295,465 | 1,623,188,288 |
| TOTAL INTERNATIONAL EQUITY FUNDS | | | |
| (Cost $4,160,105,513) | | | 5,461,833,859 |
|
| Bond Funds - 36.5% | | | |
| Fidelity Series Emerging Markets Debt Fund (b) | | 20,245,743 | 192,941,935 |
| Fidelity Series Floating Rate High Income Fund (b) | | 7,073,863 | 67,343,177 |
| Fidelity Series High Income Fund (b) | | 43,144,010 | 414,613,939 |
| Fidelity Series Inflation-Protected Bond Index Fund (b) | | 155,310,033 | 1,508,060,418 |
| Fidelity Series International Credit Fund (b) | | 1,792,036 | 17,615,710 |
| Fidelity Series Investment Grade Bond Fund (b) | | 625,929,878 | 6,816,376,369 |
| Fidelity Series Long-Term Treasury Bond Index Fund (b) | | 177,442,343 | 1,462,124,903 |
| Fidelity Series Real Estate Income Fund (b) | | 12,447,953 | 134,188,936 |
| TOTAL BOND FUNDS | | | |
| (Cost $10,980,191,105) | | | 10,613,265,387 |
|
| Short-Term Funds - 8.7% | | | |
| Fidelity Cash Central Fund, 2.11% (c) | | 42,140,236 | 42,148,664 |
| Fidelity Series Government Money Market Fund 2.12% (b)(d) | | 1,944,540,655 | 1,944,540,655 |
| Fidelity Series Short-Term Credit Fund (b) | | 55,059,947 | 542,891,082 |
| TOTAL SHORT-TERM FUNDS | | | |
| (Cost $2,536,671,980) | | | 2,529,580,401 |
| TOTAL INVESTMENT IN SECURITIES - 100.1% | | | |
| (Cost $25,079,016,944) | | | 29,113,843,620 |
| NET OTHER ASSETS (LIABILITIES) - (0.1)% | | | (14,640,031) |
| NET ASSETS - 100% | | | $29,099,203,589 |
| Futures Contracts | | | | | |
| | Number of contracts | Expiration Date | Notional Amount | Value | Unrealized Appreciation/(Depreciation) |
| Purchased | | | | | |
| Equity Index Contracts | | | | | |
| ICE E-mini MSCI Emerging Markets Index Contracts (United States) | 4,535 | Dec. 2018 | $238,019,475 | $4,376,008 | $4,376,008 |
| Sold | | | | | |
| Equity Index Contracts | | | | | |
| CME E-mini S&P 500 Index Contracts (United States) | 1,796 | Dec. 2018 | 262,126,200 | (307,900) | (307,900) |
| TOTAL FUTURES CONTRACTS | | | | | $4,068,108 |
The notional amount of futures purchased as a percentage of Net Assets is 0.8%
The notional amount of futures sold as a percentage of Net Assets is 0.9%
Legend
(a) Security or a portion of the security was pledged to cover margin requirements for futures contracts. At period end, the value of securities pledged amounted to $17,053,430.
(b) Affiliated Fund
(c) Affiliated fund that is generally available only to investment companies and other accounts managed by Fidelity Investments. The rate quoted is the annualized seven-day yield of the fund at period end. A complete unaudited listing of the fund's holdings as of its most recent quarter end is available upon request. In addition, each Fidelity Central Fund's financial statements are available on the SEC's website or upon request.
(d) The rate quoted is the annualized seven-day yield of the fund at period end.
Affiliated Central Funds
Information regarding fiscal year to date income earned by the Fund from investments in Fidelity Central Funds is as follows:
| Fund | Income earned |
| Fidelity Cash Central Fund | $162,964 |
| Total | $162,964 |
Amounts in the income column in the above table include any capital gain distributions from underlying funds, which are presented in the corresponding line-item in the Statement of Operations if applicable.
Affiliated Underlying Funds
Fiscal year to date information regarding the Fund's investments in affiliated Underlying Funds, excluding any Money Market Central Funds, is presented below. Exchanges between classes of the same affiliated Underlying Funds may occur.
| Affiliate | Value, beginning of period | Purchases | Sales Proceeds | Dividend Income | Realized Gain (loss) | Change in Unrealized appreciation (depreciation) | Value, end of period |
| Fidelity Series 100 Index Fund | $360,400,417 | $18 | $373,452,465 | $-- | $134,660,262 | $(121,608,232) | $-- |
| Fidelity Series All-Sector Equity Fund | 691,515,664 | 5,912,990 | 390,346,648 | -- | 47,833,809 | 24,825,983 | 379,741,798 |
| Fidelity Series Blue Chip Growth Fund | 714,854,503 | 73,434,189 | 123,409,663 | 67,214,282 | 43,462,382 | 13,525,654 | 721,867,065 |
| Fidelity Series Canada Fund | 169,349,670 | 648,026 | 10,636,089 | -- | 129,982 | 10,252,216 | 169,743,805 |
| Fidelity Series Commodity Strategy Fund | 638,248,050 | 78,993,185 | 92,859,241 | 34,628,683 | (45,876,779) | (1,704,267) | 576,800,948 |
| Fidelity Series Emerging Markets Debt Fund | 209,218,641 | 6,706,916 | 11,624,759 | 6,022,733 | (499,589) | (10,859,274) | 192,941,935 |
| Fidelity Series Emerging Markets Fund | -- | 48,402,903 | -- | -- | -- | (143,730) | 48,259,173 |
| Fidelity Series Emerging Markets Opportunities Fund | 1,848,959,268 | 123,491,002 | 102,599,769 | -- | (746,065) | (230,494,180) | 1,638,610,256 |
| Fidelity Series Floating Rate High Income Fund | 69,635,549 | 2,114,433 | 4,473,612 | 1,829,305 | (122,884) | 189,691 | 67,343,177 |
| Fidelity Series Government Money Market Fund 2.12% | 2,454,122,385 | 321,786,452 | 831,368,182 | 22,641,479 | -- | -- | 1,944,540,655 |
| Fidelity Series Growth Company Fund | 1,469,022,731 | 5,359,767 | 237,023,800 | -- | 93,373,769 | 119,215,238 | 1,449,947,705 |
| Fidelity Series High Income Fund | 434,030,687 | 13,681,073 | 36,622,814 | 12,260,125 | (1,265,562) | 4,790,555 | 414,613,939 |
| Fidelity Series Inflation-Protected Bond Index Fund | 347,776,727 | 1,194,769,059 | 28,339,402 | 1,379,976 | (648,563) | (5,497,403) | 1,508,060,418 |
| Fidelity Series International Credit Fund | 17,926,241 | 220,920 | 351,103 | 220,920 | (4,832) | (175,516) | 17,615,710 |
| Fidelity Series International Growth Fund | 1,737,696,795 | 6,165,398 | 168,803,959 | -- | 43,054,241 | (17,784,076) | 1,600,328,399 |
| Fidelity Series International Small Cap Fund | 434,859,065 | 12,224,124 | 49,635,188 | -- | 9,108,149 | (24,852,212) | 381,703,938 |
| Fidelity Series International Value Fund | 1,726,630,081 | 6,581,315 | 104,401,927 | -- | 3,185,545 | (8,806,726) | 1,623,188,288 |
| Fidelity Series Intrinsic Opportunities Fund | 1,772,722,653 | 84,228,130 | 130,872,669 | 77,651,229 | 11,980,201 | 17,481,861 | 1,755,540,176 |
| Fidelity Series Investment Grade Bond Fund | 7,589,645,384 | 130,699,952 | 818,830,011 | 102,923,588 | (43,165,455) | (41,973,501) | 6,816,376,369 |
| Fidelity Series Large Cap Stock Fund | 1,614,989,603 | 102,266,670 | 248,681,205 | 96,277,444 | 10,554,794 | 65,575,524 | 1,544,705,386 |
| Fidelity Series Large Cap Value Index Fund | 448,080,326 | 1,673,594 | 44,586,413 | -- | 4,293,345 | 26,165,887 | 435,626,739 |
| Fidelity Series Long-Term Treasury Bond Index Fund | 665,667,185 | 883,693,252 | 35,609,154 | 13,856,674 | (144,171) | (51,482,209) | 1,462,124,903 |
| Fidelity Series Opportunistic Insights Fund | 783,485,090 | 2,927,703 | 101,693,495 | -- | 27,776,159 | 71,570,348 | 784,065,805 |
| Fidelity Series Real Estate Equity Fund | 138,627,411 | 1,050,429 | 143,649,574 | 919,961 | 17,526,868 | (13,555,134) | -- |
| Fidelity Series Real Estate Income Fund | 135,680,911 | 6,271,124 | 8,623,823 | 5,733,380 | (24,741) | 885,465 | 134,188,936 |
| Fidelity Series Short-Term Credit Fund | 587,623,481 | 8,924,659 | 53,652,115 | 6,544,973 | (659,181) | 654,238 | 542,891,082 |
| Fidelity Series Small Cap Discovery Fund | 213,189,712 | 13,443,747 | 18,319,251 | 12,594,460 | 814,202 | (3,641,486) | 205,486,924 |
| Fidelity Series Small Cap Opportunities Fund | 651,074,180 | 51,481,288 | 92,958,343 | 49,078,326 | 15,604,718 | 7,804,306 | 633,006,149 |
| Fidelity Series Stock Selector Large Cap Value Fund | 1,220,429,926 | 4,574,271 | 137,418,773 | -- | 5,123,409 | 77,240,879 | 1,169,949,712 |
| Fidelity Series Value Discovery Fund | 867,290,850 | 5,047,119 | 90,171,026 | -- | 16,315,887 | 33,259,763 | 831,742,593 |
| | $30,012,753,186 | $3,196,773,708 | $4,491,014,473 | $511,777,538 | $391,639,900 | $(59,140,338) | $29,051,011,983 |
Amounts in the income column in the above table include any capital gain distributions from underlying funds, which are presented in the corresponding line-item in the Statement of Operations if applicable.
Investment Valuation
The following is a summary of the inputs used, as of September 30, 2018, involving the Fund's assets and liabilities carried at fair value. The inputs or methodology used for valuing securities may not be an indication of the risk associated with investing in those securities. For more information on valuation inputs, and their aggregation into the levels used below, please refer to the Investment Valuation section in the accompanying Notes to Financial Statements.
| | Valuation Inputs at Reporting Date: |
| Description | Total | Level 1 | Level 2 | Level 3 |
| Investments in Securities: | | | | |
| Other Short-Term Investments | $20,682,973 | $-- | $20,682,973 | $-- |
| Domestic Equity Funds | 10,488,481,000 | 10,488,481,000 | -- | -- |
| International Equity Funds | 5,461,833,859 | 5,461,833,859 | -- | -- |
| Bond Funds | 10,613,265,387 | 10,613,265,387 | -- | -- |
| Short-Term Funds | 2,529,580,401 | 2,529,580,401 | -- | -- |
| Total Investments in Securities: | $29,113,843,620 | $29,093,160,647 | $20,682,973 | $-- |
| Derivative Instruments: | | | | |
| Assets | | | | |
| Futures Contracts | $4,376,008 | $4,376,008 | $-- | $-- |
| Total Assets | $4,376,008 | $4,376,008 | $-- | $-- |
| Liabilities | | | | |
| Futures Contracts | $(307,900) | $(307,900) | $-- | $-- |
| Total Liabilities | $(307,900) | $(307,900) | $-- | $-- |
| Total Derivative Instruments: | $4,068,108 | $4,068,108 | $-- | $-- |
Value of Derivative Instruments
The following table is a summary of the Fund's value of derivative instruments by primary risk exposure as of September 30, 2018. For additional information on derivative instruments, please refer to the Derivative Instruments section in the accompanying Notes to Financial Statements.
| Primary Risk Exposure / Derivative Type(a) | Value |
| | Asset | Liability |
| Equity Risk | | |
| Futures Contracts(a) | $4,376,008 | $(307,900) |
| Total Equity Risk | 4,376,008 | (307,900) |
| Total Value of Derivatives | $4,376,008 | $(307,900) |
(a) Reflects gross cumulative appreciation (depreciation) on futures contracts as presented in the Schedule of Investments. In the Statement of Assets and Liabilities, the period end daily variation margin is included in receivable or payable for daily variation margin on futures contracts, and the net cumulative appreciation (depreciation) is included in net unrealized appreciation (depreciation).
See accompanying notes which are an integral part of the financial statements.
Fidelity Freedom® 2020 Fund
Financial Statements
Statement of Assets and Liabilities
| | | September 30, 2018 (Unaudited) |
| Assets | | |
Investment in securities, at value — See accompanying schedule:
Unaffiliated issuers (cost $20,684,518) | $20,682,973 | |
| Fidelity Central Funds (cost $42,148,664) | 42,148,664 | |
| Other affiliated issuers (cost $25,016,183,762) | 29,051,011,983 | |
| Total Investment in Securities (cost $25,079,016,944) | | $29,113,843,620 |
| Receivable for investments sold | | 37,923,786 |
| Receivable for fund shares sold | | 514,747,929 |
| Distributions receivable from Fidelity Central Funds | | 60,894 |
| Other receivables | | 212,156 |
| Total assets | | 29,666,788,385 |
| Liabilities | | |
| Payable for investments purchased | $33,203,900 | |
| Payable for fund shares redeemed | 518,888,158 | |
| Accrued management fee | 13,626,759 | |
| Payable for daily variation margin on futures contracts | 1,653,823 | |
| Other payables and accrued expenses | 212,156 | |
| Total liabilities | | 567,584,796 |
| Net Assets | | $29,099,203,589 |
| Net Assets consist of: | | |
| Paid in capital | | $24,306,599,649 |
| Undistributed net investment income | | 169,346,562 |
| Accumulated undistributed net realized gain (loss) on investments | | 584,362,594 |
| Net unrealized appreciation (depreciation) on investments | | 4,038,894,784 |
| Net Assets | | $29,099,203,589 |
| Fidelity Freedom 2020 Fund: | | |
| Net Asset Value, offering price and redemption price per share ($12,864,323,624 ÷ 779,070,636 shares) | | $16.51 |
| Class K: | | |
| Net Asset Value, offering price and redemption price per share ($14,833,133,079 ÷ 899,112,347 shares) | | $16.50 |
| Class K6: | | |
| Net Asset Value, offering price and redemption price per share ($1,401,746,886 ÷ 84,913,068 shares) | | $16.51 |
See accompanying notes which are an integral part of the financial statements.
Statement of Operations
| | | Six months ended September 30, 2018 (Unaudited) |
| Investment Income | | |
| Dividends: | | |
| Affiliated issuers | | $253,523,770 |
| Interest | | 86,552 |
| Income from Fidelity Central Funds | | 162,964 |
| Total income | | 253,773,286 |
| Expenses | | |
| Management fee | $83,688,050 | |
| Independent trustees' fees and expenses | 72,715 | |
| Total expenses before reductions | 83,760,765 | |
| Expense reductions | (13) | |
| Total expenses after reductions | | 83,760,752 |
| Net investment income (loss) | | 170,012,534 |
| Realized and Unrealized Gain (Loss) | | |
| Net realized gain (loss) on: | | |
| Investment securities: | | |
| Fidelity Central Funds | (181) | |
| Other affiliated issuers | 391,639,900 | |
| Futures contracts | (15,516,827) | |
| Capital gain distributions from underlying funds: | | |
| Affiliated issuers | 258,253,768 | |
| Total net realized gain (loss) | | 634,376,660 |
| Change in net unrealized appreciation (depreciation) on: | | |
| Investment securities: | | |
| Unaffiliated issuers | (1,416) | |
| Affiliated issuers | (59,140,338) | |
| Futures contracts | 4,068,108 | |
| Total change in net unrealized appreciation (depreciation) | | (55,073,646) |
| Net gain (loss) | | 579,303,014 |
| Net increase (decrease) in net assets resulting from operations | | $749,315,548 |
See accompanying notes which are an integral part of the financial statements.
Statement of Changes in Net Assets
| | Six months ended September 30, 2018 (Unaudited) | Year ended March 31, 2018 |
| Increase (Decrease) in Net Assets | | |
| Operations | | |
| Net investment income (loss) | $170,012,534 | $395,829,727 |
| Net realized gain (loss) | 634,376,660 | 1,249,079,495 |
| Change in net unrealized appreciation (depreciation) | (55,073,646) | 265,229,829 |
| Net increase (decrease) in net assets resulting from operations | 749,315,548 | 1,910,139,051 |
| Distributions to shareholders from net investment income | (35,844,885) | (388,661,235) |
| Distributions to shareholders from net realized gain | (703,638,216) | (719,753,000) |
| Total distributions | (739,483,101) | (1,108,414,235) |
| Share transactions - net increase (decrease) | (912,760,404) | 16,921,166,403 |
| Total increase (decrease) in net assets | (902,927,957) | 17,722,891,219 |
| Net Assets | | |
| Beginning of period | 30,002,131,546 | 12,279,240,327 |
| End of period | $29,099,203,589 | $30,002,131,546 |
| Other Information | | |
| Undistributed net investment income end of period | $169,346,562 | $35,178,913 |
See accompanying notes which are an integral part of the financial statements.
Financial Highlights
Fidelity Freedom 2020 Fund
| | Six months ended (Unaudited) September 30, | Years endedMarch 31, | | | | |
| | 2018 | 2018 | 2017 | 2016 | 2015 | 2014 |
| Selected Per–Share Data | | | | | | |
| Net asset value, beginning of period | $16.51 | $15.70 | $14.63 | $15.76 | $15.81 | $14.94 |
| Income from Investment Operations | | | | | | |
| Net investment income (loss)A | .09 | .22 | .25 | .28 | .28 | .23 |
| Net realized and unrealized gain (loss) | .32 | 1.34 | 1.40 | (.60) | .73 | 1.22 |
| Total from investment operations | .41 | 1.56 | 1.65 | (.32) | 1.01 | 1.45 |
| Distributions from net investment income | (.02) | (.22) | (.26) | (.28) | (.29) | (.23) |
| Distributions from net realized gain | (.39) | (.52) | (.32) | (.53) | (.77) | (.36) |
| Total distributions | (.41) | (.75)B | (.58) | (.81) | (1.06) | (.58)C |
| Net asset value, end of period | $16.51 | $16.51 | $15.70 | $14.63 | $15.76 | $15.81 |
| Total ReturnD,E | 2.50% | 10.01% | 11.57% | (2.10)% | 6.71% | 9.83% |
| Ratios to Average Net AssetsF,G | | | | | | |
| Expenses before reductions | .61%H | .52% | - %I | - %I | - %I | - %I |
| Expenses net of fee waivers, if any | .61%H | .52% | -% | -% | -% | -% |
| Expenses net of all reductions | .61%H | .52% | -% | -% | -% | -% |
| Net investment income (loss) | 1.10%H | 1.34% | 1.69% | 1.83% | 1.83% | 1.49% |
| Supplemental Data | | | | | | |
| Net assets, end of period (000 omitted) | $12,864,324 | $12,916,078 | $12,279,240 | $11,732,980 | $12,868,898 | $13,343,983 |
| Portfolio turnover rateG | 22%H | 21%J | 19% | 17% | 17% | 39% |
A Calculated based on average shares outstanding during the period.
B Total distributions of $.75 per share is comprised of distributions from net investment income of $.221 and distributions from net realized gain of $.524 per share.
C Total distributions of $.58 per share is comprised of distributions from net investment income of $.228 and distributions from net realized gain of $.356 per share.
D Total returns for periods of less than one year are not annualized.
E Total returns would have been lower if certain expenses had not been reduced during the applicable periods shown.
F Expense ratios reflect operating expenses of the class. Expenses before reductions do not reflect amounts reimbursed by the investment adviser or reductions from expense offset arrangements and do not represent the amount paid by the class during periods when reimbursements or reductions occur. Expenses net of fee waivers reflect expenses after reimbursement by the investment adviser but prior to reductions from expense offset arrangements. Expenses net of all reductions represent the net expenses paid by the class but do not include expenses of the underlying funds in which the Fund invests.
G Amounts do not include the activity of the Underlying Funds.
H Annualized
I Amount represents less than .005%.
J The portfolio turnover rate does not include the assets acquired in the merger.
See accompanying notes which are an integral part of the financial statements.
Fidelity Freedom 2020 Fund Class K
| | Six months ended (Unaudited) September 30, | Years endedMarch 31, |
| | 2018 | 2018 A |
| Selected Per–Share Data | | |
| Net asset value, beginning of period | $16.49 | $16.24 |
| Income from Investment Operations | | |
| Net investment income (loss)B | .10 | .27 |
| Net realized and unrealized gain (loss) | .32 | .50 |
| Total from investment operations | .42 | .77 |
| Distributions from net investment income | (.02) | (.21) |
| Distributions from net realized gain | (.39) | (.31) |
| Total distributions | (.41) | (.52) |
| Net asset value, end of period | $16.50 | $16.49 |
| Total ReturnC,D | 2.57% | 4.73% |
| Ratios to Average Net AssetsE,F | | |
| Expenses before reductions | .53%G | .54%G |
| Expenses net of fee waivers, if any | .53%G | .54%G |
| Expenses net of all reductions | .53%G | .54%G |
| Net investment income (loss) | 1.18%G | 2.34%G |
| Supplemental Data | | |
| Net assets, end of period (000 omitted) | $14,833,133 | $16,611,072 |
| Portfolio turnover rateF | 22%G | 21%H |
A For the period July 20, 2017 (commencement of sale of shares) to March 31, 2018.
B Calculated based on average shares outstanding during the period.
C Total returns for periods of less than one year are not annualized.
D Total returns would have been lower if certain expenses had not been reduced during the applicable periods shown.
E Expense ratios reflect operating expenses of the class. Expenses before reductions do not reflect amounts reimbursed by the investment adviser or reductions from expense offset arrangements and do not represent the amount paid by the class during periods when reimbursements or reductions occur. Expense ratios before reductions for start-up periods may not be representative of longer-term operating periods. Expenses net of fee waivers reflect expenses after reimbursement by the investment adviser but prior to reductions from expense offset arrangements. Expenses net of all reductions represent the net expenses paid by the class but do not include expenses of the underlying funds in which the Fund invests.
F Amounts do not include the activity of the Underlying Funds.
G Annualized
H The portfolio turnover rate does not include the assets acquired in the merger.
See accompanying notes which are an integral part of the financial statements.
Fidelity Freedom 2020 Fund Class K6
| | Six months ended (Unaudited) September 30, | Years endedMarch 31, |
| | 2018 | 2018 A |
| Selected Per–Share Data | | |
| Net asset value, beginning of period | $16.50 | $16.00 |
| Income from Investment Operations | | |
| Net investment income (loss)B | .10 | .24 |
| Net realized and unrealized gain (loss) | .33 | .79 |
| Total from investment operations | .43 | 1.03 |
| Distributions from net investment income | (.03) | (.22) |
| Distributions from net realized gain | (.39) | (.31) |
| Total distributions | (.42) | (.53) |
| Net asset value, end of period | $16.51 | $16.50 |
| Total ReturnC,D | 2.64% | 6.40% |
| Ratios to Average Net AssetsE,F | | |
| Expenses before reductions | .43%G | .44%G |
| Expenses net of fee waivers, if any | .43%G | .44%G |
| Expenses net of all reductions | .43%G | .44%G |
| Net investment income (loss) | 1.28%G | 1.79%G |
| Supplemental Data | | |
| Net assets, end of period (000 omitted) | $1,401,747 | $474,981 |
| Portfolio turnover rateF | 22%G | 21%H |
A For the period June 7, 2017 (commencement of sale of shares) to March 31, 2018.
B Calculated based on average shares outstanding during the period.
C Total returns for periods of less than one year are not annualized.
D Total returns would have been lower if certain expenses had not been reduced during the applicable periods shown.
E Expense ratios reflect operating expenses of the class. Expenses before reductions do not reflect amounts reimbursed by the investment adviser or reductions from expense offset arrangements and do not represent the amount paid by the class during periods when reimbursements or reductions occur. Expense ratios before reductions for start-up periods may not be representative of longer-term operating periods. Expenses net of fee waivers reflect expenses after reimbursement by the investment adviser but prior to reductions from expense offset arrangements. Expenses net of all reductions represent the net expenses paid by the class but do not include expenses of the underlying funds in which the Fund invests.
F Amounts do not include the activity of the Underlying Funds.
G Annualized
H The portfolio turnover rate does not include the assets acquired in the merger.
See accompanying notes which are an integral part of the financial statements.
Fidelity Freedom® 2025 Fund
Investment Summary (Unaudited)
The information in the following tables is based on the direct investments of the Fund.
Top Holdings as of September 30, 2018
| | % of fund's net assets |
| Fidelity Series Investment Grade Bond Fund | 19.8 |
| Fidelity Series Intrinsic Opportunities Fund | 6.8 |
| Fidelity Series Emerging Markets Opportunities Fund | 6.2 |
| Fidelity Series International Value Fund | 6.2 |
| Fidelity Series International Growth Fund | 6.2 |
| Fidelity Series Large Cap Stock Fund | 6.1 |
| Fidelity Series Growth Company Fund | 5.7 |
| Fidelity Series Long-Term Treasury Bond Index Fund | 5.5 |
| Fidelity Series Stock Selector Large Cap Value Fund | 4.6 |
| Fidelity Series Government Money Market Fund 2.12% | 4.6 |
| | 71.7 |
Asset Allocation (% of fund's net assets)
| Period end |
| | Domestic Equity Funds | 40.9% |
| | International Equity Funds | 20.9% |
| | Bond Funds | 32.2% |
| | Short-Term Funds | 6.0% |
| | Short-Term Investments | 0.1% |
| | Net Other Assets (Liabilities)* | (0.1)% |
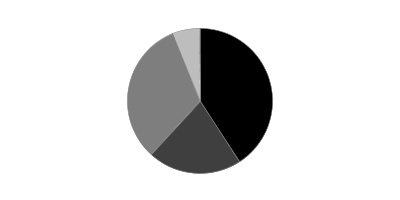
* Net Other Assets (Liabilities) are not included in the pie chart
Domestic Equity Funds category includes Fidelity Series Commodity Strategy Fund which invests in commodity-related investments.
Fidelity Freedom® 2025 Fund
Schedule of Investments September 30, 2018 (Unaudited)
Showing Percentage of Net Assets
| U.S. Treasury Obligations - 0.1% | | | |
| | | Principal Amount | Value |
| U.S. Treasury Bills, yield at date of purchase 1.97% to 2.11% 11/1/18 to 12/6/18 (a) | | | |
| (Cost $19,442,444) | | 19,490,000 | 19,440,982 |
| | | Shares | Value |
|
| Domestic Equity Funds - 40.9% | | | |
| Fidelity Series All-Sector Equity Fund (b) | | 30,302,311 | $412,414,456 |
| Fidelity Series Blue Chip Growth Fund (b) | | 50,976,342 | 779,938,038 |
| Fidelity Series Commodity Strategy Fund (b) | | 110,170,047 | 550,850,234 |
| Fidelity Series Growth Company Fund (b) | | 77,589,531 | 1,568,084,421 |
| Fidelity Series Intrinsic Opportunities Fund (b) | | 102,930,239 | 1,886,711,284 |
| Fidelity Series Large Cap Stock Fund (b) | | 104,879,975 | 1,670,737,995 |
| Fidelity Series Large Cap Value Index Fund (b) | | 35,606,853 | 470,010,462 |
| Fidelity Series Opportunistic Insights Fund (b) | | 42,684,373 | 847,284,803 |
| Fidelity Series Small Cap Discovery Fund (b) | | 18,261,335 | 221,875,223 |
| Fidelity Series Small Cap Opportunities Fund (b) | | 46,547,929 | 683,789,084 |
| Fidelity Series Stock Selector Large Cap Value Fund (b) | | 95,699,550 | 1,265,148,047 |
| Fidelity Series Value Discovery Fund (b) | | 65,662,320 | 898,917,161 |
| TOTAL DOMESTIC EQUITY FUNDS | | | |
| (Cost $8,187,698,363) | | | 11,255,761,208 |
|
| International Equity Funds - 20.9% | | | |
| Fidelity Series Canada Fund (b) | | 16,156,197 | 174,648,485 |
| Fidelity Series Emerging Markets Fund (b) | | 5,764,656 | 55,859,521 |
| Fidelity Series Emerging Markets Opportunities Fund (b) | | 89,442,930 | 1,716,409,834 |
| Fidelity Series International Growth Fund (b) | | 103,044,534 | 1,689,930,355 |
| Fidelity Series International Small Cap Fund (b) | | 22,449,718 | 401,849,944 |
| Fidelity Series International Value Fund (b) | | 162,577,898 | 1,710,319,490 |
| TOTAL INTERNATIONAL EQUITY FUNDS | | | |
| (Cost $4,533,831,290) | | | 5,749,017,629 |
|
| Bond Funds - 32.2% | | | |
| Fidelity Series Emerging Markets Debt Fund (b) | | 18,481,956 | 176,133,041 |
| Fidelity Series Floating Rate High Income Fund (b) | | 6,637,878 | 63,192,596 |
| Fidelity Series High Income Fund (b) | | 40,188,331 | 386,209,861 |
| Fidelity Series Inflation-Protected Bond Index Fund (b) | | 115,530,452 | 1,121,800,684 |
| Fidelity Series International Credit Fund (b) | | 1,540,231 | 15,140,469 |
| Fidelity Series Investment Grade Bond Fund (b) | | 501,829,516 | 5,464,923,433 |
| Fidelity Series Long-Term Treasury Bond Index Fund (b) | | 184,541,040 | 1,520,618,174 |
| Fidelity Series Real Estate Income Fund (b) | | 11,609,758 | 125,153,191 |
| TOTAL BOND FUNDS | | | |
| (Cost $9,171,160,909) | | | 8,873,171,449 |
|
| Short-Term Funds - 6.0% | | | |
| Fidelity Cash Central Fund, 2.11% (c) | | 41,037,700 | 41,045,907 |
| Fidelity Series Government Money Market Fund 2.12% (b)(d) | | 1,253,497,910 | 1,253,497,910 |
| Fidelity Series Short-Term Credit Fund (b) | | 37,391,811 | 368,683,260 |
| TOTAL SHORT-TERM FUNDS | | | |
| (Cost $1,668,019,128) | | | 1,663,227,077 |
| TOTAL INVESTMENT IN SECURITIES - 100.1% | | | |
| (Cost $23,580,152,134) | | | 27,560,618,345 |
| NET OTHER ASSETS (LIABILITIES) - (0.1)% | | | (14,682,467) |
| NET ASSETS - 100% | | | $27,545,935,878 |
| Futures Contracts | | | | | |
| | Number of contracts | Expiration Date | Notional Amount | Value | Unrealized Appreciation/(Depreciation) |
| Purchased | | | | | |
| Equity Index Contracts | | | | | |
| ICE E-mini MSCI Emerging Markets Index Contracts (United States) | 3,728 | Dec. 2018 | $195,664,080 | $3,633,712 | $3,633,712 |
| Sold | | | | | |
| Equity Index Contracts | | | | | |
| CME E-mini S&P 500 Index Contracts (United States) | 1,696 | Dec. 2018 | 247,531,200 | (288,162) | (288,162) |
| TOTAL FUTURES CONTRACTS | | | | | $3,345,550 |
The notional amount of futures purchased as a percentage of Net Assets is 0.7%
The notional amount of futures sold as a percentage of Net Assets is 0.9%
Legend
(a) Security or a portion of the security was pledged to cover margin requirements for futures contracts. At period end, the value of securities pledged amounted to $15,876,324.
(b) Affiliated Fund
(c) Affiliated fund that is generally available only to investment companies and other accounts managed by Fidelity Investments. The rate quoted is the annualized seven-day yield of the fund at period end. A complete unaudited listing of the fund's holdings as of its most recent quarter end is available upon request. In addition, each Fidelity Central Fund's financial statements are available on the SEC's website or upon request.
(d) The rate quoted is the annualized seven-day yield of the fund at period end.
Affiliated Central Funds
Information regarding fiscal year to date income earned by the Fund from investments in Fidelity Central Funds is as follows:
| Fund | Income earned |
| Fidelity Cash Central Fund | $153,942 |
| Total | $153,942 |
Amounts in the income column in the above table include any capital gain distributions from underlying funds, which are presented in the corresponding line-item in the Statement of Operations if applicable.
Affiliated Underlying Funds
Fiscal year to date information regarding the Fund's investments in affiliated Underlying Funds, excluding any Money Market Central Funds, is presented below. Exchanges between classes of the same affiliated Underlying Funds may occur.
| Affiliate | Value, beginning of period | Purchases | Sales Proceeds | Dividend Income | Realized Gain (loss) | Change in Unrealized appreciation (depreciation) | Value, end of period |
| Fidelity Series 100 Index Fund | $366,746,530 | $384 | $382,199,252 | $-- | $139,134,622 | $(123,682,284) | $-- |
| Fidelity Series All-Sector Equity Fund | 705,221,492 | 15,551,846 | 384,070,279 | -- | 36,458,834 | 39,252,563 | 412,414,456 |
| Fidelity Series Blue Chip Growth Fund | 728,890,637 | 88,795,941 | 94,156,576 | 72,350,827 | 22,684,036 | 33,724,000 | 779,938,038 |
| Fidelity Series Canada Fund | 169,257,716 | 3,477,368 | 8,571,760 | -- | 116,918 | 10,368,243 | 174,648,485 |
| Fidelity Series Commodity Strategy Fund | 582,964,326 | 81,295,478 | 68,462,613 | 32,961,333 | (28,404,874) | (16,542,083) | 550,850,234 |
| Fidelity Series Emerging Markets Debt Fund | 184,835,032 | 8,877,984 | 7,483,112 | 5,408,566 | (411,653) | (9,685,210) | 176,133,041 |
| Fidelity Series Emerging Markets Fund | -- | 55,960,024 | -- | -- | -- | (100,503) | 55,859,521 |
| Fidelity Series Emerging Markets Opportunities Fund | 1,817,196,161 | 193,452,530 | 63,823,094 | -- | (3,018,174) | (227,397,589) | 1,716,409,834 |
| Fidelity Series Floating Rate High Income Fund | 62,801,027 | 3,130,310 | 2,803,707 | 1,683,568 | (63,140) | 128,106 | 63,192,596 |
| Fidelity Series Government Money Market Fund 2.12% | 1,735,916,271 | 172,279,209 | 654,697,570 | 15,253,300 | -- | -- | 1,253,497,910 |
| Fidelity Series Growth Company Fund | 1,493,068,097 | 31,322,027 | 177,032,286 | -- | 36,615,397 | 184,111,186 | 1,568,084,421 |
| Fidelity Series High Income Fund | 387,878,745 | 18,504,114 | 23,389,205 | 11,220,336 | (589,516) | 3,805,723 | 386,209,861 |
| Fidelity Series Inflation-Protected Bond Index Fund | 222,364,297 | 911,178,259 | 6,827,308 | 988,660 | (23,267) | (4,891,297) | 1,121,800,684 |
| Fidelity Series International Credit Fund | 15,496,785 | 191,690 | 392,105 | 190,980 | (5,113) | (150,788) | 15,140,469 |
| Fidelity Series International Growth Fund | 1,728,455,734 | 43,212,609 | 108,064,363 | -- | 15,054,172 | 11,272,203 | 1,689,930,355 |
| Fidelity Series International Small Cap Fund | 431,342,797 | 8,755,526 | 21,742,015 | -- | 1,443,936 | (17,950,300) | 401,849,944 |
| Fidelity Series International Value Fund | 1,725,207,204 | 62,987,330 | 73,295,750 | -- | (538,505) | (4,040,789) | 1,710,319,490 |
| Fidelity Series Intrinsic Opportunities Fund | 1,796,627,752 | 121,591,534 | 59,030,567 | 83,401,306 | 1,578,802 | 25,943,763 | 1,886,711,284 |
| Fidelity Series Investment Grade Bond Fund | 5,978,177,564 | 195,897,113 | 641,768,213 | 81,796,113 | (28,536,206) | (38,846,825) | 5,464,923,433 |
| Fidelity Series Large Cap Stock Fund | 1,631,361,660 | 135,740,643 | 174,727,221 | 101,329,164 | 6,575,880 | 71,787,033 | 1,670,737,995 |
| Fidelity Series Large Cap Value Index Fund | 457,041,989 | 9,676,985 | 28,662,009 | -- | 999,171 | 30,954,326 | 470,010,462 |
| Fidelity Series Long-Term Treasury Bond Index Fund | 610,405,640 | 976,089,648 | 14,154,094 | 14,920,890 | (230,741) | (51,492,279) | 1,520,618,174 |
| Fidelity Series Opportunistic Insights Fund | 798,825,062 | 17,066,251 | 71,713,173 | -- | 5,365,848 | 97,740,815 | 847,284,803 |
| Fidelity Series Real Estate Equity Fund | 142,057,130 | 1,088,209 | 147,363,842 | 964,911 | 10,969,915 | (6,751,412) | -- |
| Fidelity Series Real Estate Income Fund | 121,846,965 | 8,009,657 | 5,442,189 | 5,285,335 | (80,098) | 818,856 | 125,153,191 |
| Fidelity Series Short-Term Credit Fund | 397,592,784 | 13,176,053 | 42,081,652 | 4,455,640 | (495,834) | 491,909 | 368,683,260 |
| Fidelity Series Small Cap Discovery Fund | 217,412,216 | 17,811,259 | 10,236,357 | 13,071,975 | (155,699) | (2,956,196) | 221,875,223 |
| Fidelity Series Small Cap Opportunities Fund | 663,854,507 | 66,759,576 | 69,193,679 | 52,816,971 | 8,136,431 | 14,232,249 | 683,789,084 |
| Fidelity Series Stock Selector Large Cap Value Fund | 1,244,944,162 | 26,153,549 | 91,381,663 | -- | 9,787 | 85,422,212 | 1,265,148,047 |
| Fidelity Series Value Discovery Fund | 884,624,024 | 18,724,436 | 56,090,981 | -- | 716,663 | 50,943,019 | 898,917,161 |
| Total | $27,302,414,306 | $3,306,757,542 | $3,488,856,635 | $498,099,875 | $223,307,592 | $156,508,651 | $27,500,131,456 |
Amounts in the income column in the above table include any capital gain distributions from underlying funds, which are presented in the corresponding line-item in the Statement of Operations if applicable.
Investment Valuation
The following is a summary of the inputs used, as of September 30, 2018, involving the Fund's assets and liabilities carried at fair value. The inputs or methodology used for valuing securities may not be an indication of the risk associated with investing in those securities. For more information on valuation inputs, and their aggregation into the levels used below, please refer to the Investment Valuation section in the accompanying Notes to Financial Statements.
| | Valuation Inputs at Reporting Date: |
| Description | Total | Level 1 | Level 2 | Level 3 |
| Investments in Securities: | | | | |
| Other Short-Term Investments | $19,440,982 | $-- | $19,440,982 | $-- |
| Domestic Equity Funds | 11,255,761,208 | 11,255,761,208 | -- | -- |
| International Equity Funds | 5,749,017,629 | 5,749,017,629 | -- | -- |
| Bond Funds | 8,873,171,449 | 8,873,171,449 | -- | -- |
| Short-Term Funds | 1,663,227,077 | 1,663,227,077 | -- | -- |
| Total Investments in Securities: | $27,560,618,345 | $27,541,177,363 | $19,440,982 | $-- |
| Derivative Instruments: | | | | |
| Assets | | | | |
| Futures Contracts | $3,633,712 | $3,633,712 | $-- | $-- |
| Total Assets | $3,633,712 | $3,633,712 | $-- | $-- |
| Liabilities | | | | |
| Futures Contracts | $(288,162) | $(288,162) | $-- | $-- |
| Total Liabilities | $(288,162) | $(288,162) | $-- | $-- |
| Total Derivative Instruments: | $3,345,550 | $3,345,550 | $-- | $-- |
Value of Derivative Instruments
The following table is a summary of the Fund's value of derivative instruments by primary risk exposure as of September 30, 2018. For additional information on derivative instruments, please refer to the Derivative Instruments section in the accompanying Notes to Financial Statements.
| Primary Risk Exposure / Derivative Type | Value |
| | Asset | Liability |
| Equity Risk | | |
| Futures Contracts(a) | $3,633,712 | $(288,162) |
| Total Equity Risk | 3,633,712 | (288,162) |
| Total Value of Derivatives | $3,633,712 | $(288,162) |
(a) Reflects gross cumulative appreciation (depreciation) on futures contracts as presented in the Schedule of Investments. In the Statement of Assets and Liabilities, the period end daily variation margin is included in receivable or payable for daily variation margin on futures contracts, and the net cumulative appreciation (depreciation) is included in net unrealized appreciation (depreciation).
See accompanying notes which are an integral part of the financial statements.
Fidelity Freedom® 2025 Fund
Financial Statements
Statement of Assets and Liabilities
| | | September 30, 2018 (Unaudited) |
| Assets | | |
Investment in securities, at value — See accompanying schedule:
Unaffiliated issuers (cost $19,442,444) | $19,440,982 | |
| Fidelity Central Funds (cost $41,045,907) | 41,045,907 | |
| Other affiliated issuers (cost $23,519,663,783) | 27,500,131,456 | |
| Total Investment in Securities (cost $23,580,152,134) | | $27,560,618,345 |
| Receivable for investments sold | | 45,676,268 |
| Receivable for fund shares sold | | 629,791,752 |
| Distributions receivable from Fidelity Central Funds | | 58,853 |
| Total assets | | 28,236,145,218 |
| Liabilities | | |
| Payable for investments purchased | $52,497,661 | |
| Payable for fund shares redeemed | 622,403,206 | |
| Accrued management fee | 13,618,137 | |
| Payable for daily variation margin on futures contracts | 1,690,336 | |
| Total liabilities | | 690,209,340 |
| Net Assets | | $27,545,935,878 |
| Net Assets consist of: | | |
| Paid in capital | | $22,983,958,524 |
| Undistributed net investment income | | 140,625,726 |
| Accumulated undistributed net realized gain (loss) on investments | | 437,539,867 |
| Net unrealized appreciation (depreciation) on investments | | 3,983,811,761 |
| Net Assets | | $27,545,935,878 |
| Fidelity Freedom 2025 Fund: | | |
| Net Asset Value, offering price and redemption price per share ($11,181,853,747 ÷ 775,112,675 shares) | | $14.43 |
| Class K: | | |
| Net Asset Value, offering price and redemption price per share ($14,621,522,701 ÷ 1,014,803,262 shares) | | $14.41 |
| Class K6: | | |
| Net Asset Value, offering price and redemption price per share ($1,742,559,430 ÷ 120,774,335 shares) | | $14.43 |
See accompanying notes which are an integral part of the financial statements.
Statement of Operations
| | | Six months ended September 30, 2018 (Unaudited) |
| Investment Income | | |
| Dividends: | | |
| Affiliated issuers | | $222,419,803 |
| Interest | | 86,188 |
| Income from Fidelity Central Funds | | 153,942 |
| Total income | | 222,659,933 |
| Expenses | | |
| Management fee | $82,393,147 | |
| Independent trustees' fees and expenses | 66,851 | |
| Total expenses before reductions | 82,459,998 | |
| Expense reductions | (12) | |
| Total expenses after reductions | | 82,459,986 |
| Net investment income (loss) | | 140,199,947 |
| Realized and Unrealized Gain (Loss) | | |
| Net realized gain (loss) on: | | |
| Investment securities: | | |
| Fidelity Central Funds | 153 | |
| Other affiliated issuers | 223,307,592 | |
| Futures contracts | (16,107,477) | |
| Capital gain distributions from underlying funds: | | |
| Affiliated issuers | 275,680,072 | |
| Total net realized gain (loss) | | 482,880,340 |
| Change in net unrealized appreciation (depreciation) on: | | |
| Investment securities: | | |
| Unaffiliated issuers | (1,345) | |
| Affiliated issuers | 156,508,651 | |
| Futures contracts | 3,345,550 | |
| Total change in net unrealized appreciation (depreciation) | | 159,852,856 |
| Net gain (loss) | | 642,733,196 |
| Net increase (decrease) in net assets resulting from operations | | $782,933,143 |
See accompanying notes which are an integral part of the financial statements.
Statement of Changes in Net Assets
| | Six months ended September 30, 2018 (Unaudited) | Year ended March 31, 2018 |
| Increase (Decrease) in Net Assets | | |
| Operations | | |
| Net investment income (loss) | $140,199,947 | $338,806,701 |
| Net realized gain (loss) | 482,880,340 | 1,044,395,111 |
| Change in net unrealized appreciation (depreciation) | 159,852,856 | 390,546,666 |
| Net increase (decrease) in net assets resulting from operations | 782,933,143 | 1,773,748,478 |
| Distributions to shareholders from net investment income | (20,792,240) | (337,178,441) |
| Distributions to shareholders from net realized gain | (610,170,349) | (559,307,494) |
| Total distributions | (630,962,589) | (896,485,935) |
| Share transactions - net increase (decrease) | 102,036,675 | 16,650,118,805 |
| Total increase (decrease) in net assets | 254,007,229 | 17,527,381,348 |
| Net Assets | | |
| Beginning of period | 27,291,928,649 | 9,764,547,301 |
| End of period | $27,545,935,878 | $27,291,928,649 |
| Other Information | | |
| Undistributed net investment income end of period | $140,625,726 | $21,218,019 |
See accompanying notes which are an integral part of the financial statements.
Financial Highlights
Fidelity Freedom 2025 Fund
| | Six months ended (Unaudited) September 30, | Years endedMarch 31, | | | | |
| | 2018 | 2018 | 2017 | 2016 | 2015 | 2014 |
| Selected Per–Share Data | | | | | | |
| Net asset value, beginning of period | $14.35 | $13.50 | $12.49 | $13.51 | $13.49 | $12.58 |
| Income from Investment Operations | | | | | | |
| Net investment income (loss)A | .07 | .18 | .21 | .22 | .24 | .20 |
| Net realized and unrealized gain (loss) | .34 | 1.26 | 1.30 | (.54) | .69 | 1.30 |
| Total from investment operations | .41 | 1.44 | 1.51 | (.32) | .93 | 1.50 |
| Distributions from net investment income | (.01) | (.18) | (.21) | (.23) | (.25) | (.20) |
| Distributions from net realized gain | (.32) | (.41) | (.29) | (.47) | (.66) | (.39) |
| Total distributions | (.33) | (.59) | (.50) | (.70) | (.91) | (.59) |
| Net asset value, end of period | $14.43 | $14.35 | $13.50 | $12.49 | $13.51 | $13.49 |
| Total ReturnB,C | 2.88% | 10.81% | 12.46% | (2.50)% | 7.23% | 12.08% |
| Ratios to Average Net AssetsD,E | | | | | | |
| Expenses before reductions | .65%F | .56%G | - %H | - %H | - %H | - %H |
| Expenses net of fee waivers, if any | .65%F | .56%G | -% | -% | -% | -% |
| Expenses net of all reductions | .65%F | .56%G | -% | -% | -% | -% |
| Net investment income (loss) | .96%F | 1.28% | 1.66% | 1.75% | 1.81% | 1.53% |
| Supplemental Data | | | | | | |
| Net assets, end of period (000 omitted) | $11,181,854 | $10,923,217 | $9,764,547 | $8,717,568 | $9,054,681 | $8,865,153 |
| Portfolio turnover rateD | 24%F | 18%I | 19% | 17% | 19% | 46% |
A Calculated based on average shares outstanding during the period.
B Total returns for periods of less than one year are not annualized.
C Total returns would have been lower if certain expenses had not been reduced during the applicable periods shown.
D Amounts do not include the activity of the Underlying Funds.
E Expense ratios reflect operating expenses of the class. Expenses before reductions do not reflect amounts reimbursed by the investment adviser or reductions from expense offset arrangements and do not represent the amount paid by the class during periods when reimbursements or reductions occur. Expenses net of fee waivers reflect expenses after reimbursement by the investment adviser but prior to reductions from expense offset arrangements. Expenses net of all reductions represent the net expenses paid by the class but do not include expenses of the underlying funds in which the Fund invests.
F Annualized
G On certain classes, the size and fluctuation of net assets and expense amounts may cause ratios to differ from contractual rates.
H Amount represents less than .005%.
I The portfolio turnover rate does not include the assets acquired in the merger.
See accompanying notes which are an integral part of the financial statements.
Fidelity Freedom 2025 Fund Class K
| | Six months ended (Unaudited) September 30, | Years endedMarch 31, |
| | 2018 | 2018 A |
| Selected Per–Share Data | | |
| Net asset value, beginning of period | $14.33 | $14.02 |
| Income from Investment Operations | | |
| Net investment income (loss)B | .08 | .23 |
| Net realized and unrealized gain (loss) | .33 | .50 |
| Total from investment operations | .41 | .73 |
| Distributions from net investment income | (.01) | (.18) |
| Distributions from net realized gain | (.32) | (.24) |
| Total distributions | (.33) | (.42) |
| Net asset value, end of period | $14.41 | $14.33 |
| Total ReturnC,D | 2.89% | 5.18% |
| Ratios to Average Net AssetsE,F | | |
| Expenses before reductions | .57%G | .58%G,H |
| Expenses net of fee waivers, if any | .57%G | .58%G,H |
| Expenses net of all reductions | .57%G | .58%G,H |
| Net investment income (loss) | 1.05%G | 2.28%G |
| Supplemental Data | | |
| Net assets, end of period (000 omitted) | $14,621,523 | $15,743,238 |
| Portfolio turnover rateE | 24%G | 18%I |
A For the period July 20, 2017 (commencement of sale of shares) to March 31, 2018.
B Calculated based on average shares outstanding during the period.
C Total returns for periods of less than one year are not annualized.
D Total returns would have been lower if certain expenses had not been reduced during the applicable periods shown.
E Amounts do not include the activity of the Underlying Funds.
F Expense ratios reflect operating expenses of the class. Expenses before reductions do not reflect amounts reimbursed by the investment adviser or reductions from expense offset arrangements and do not represent the amount paid by the class during periods when reimbursements or reductions occur. Expense ratios before reductions for start-up periods may not be representative of longer-term operating periods. Expenses net of fee waivers reflect expenses after reimbursement by the investment adviser but prior to reductions from expense offset arrangements. Expenses net of all reductions represent the net expenses paid by the class but do not include expenses of the underlying funds in which the Fund invests.
G Annualized
H On certain classes, the size and fluctuation of net assets and expense amounts may cause ratios to differ from contractual rates.
I The portfolio turnover rate does not include the assets acquired in the merger.
See accompanying notes which are an integral part of the financial statements.
Fidelity Freedom 2025 Fund Class K6
| | Six months ended (Unaudited) September 30, | Years endedMarch 31, |
| | 2018 | 2018 A |
| Selected Per–Share Data | | |
| Net asset value, beginning of period | $14.35 | $13.80 |
| Income from Investment Operations | | |
| Net investment income (loss)B | .08 | .21 |
| Net realized and unrealized gain (loss) | .34 | .76 |
| Total from investment operations | .42 | .97 |
| Distributions from net investment income | (.02) | (.19) |
| Distributions from net realized gain | (.32) | (.24) |
| Total distributions | (.34) | (.42)C |
| Net asset value, end of period | $14.43 | $14.35 |
| Total ReturnD,E | 2.96% | 7.02% |
| Ratios to Average Net AssetsF,G | | |
| Expenses before reductions | .45%H | .46%H,I |
| Expenses net of fee waivers, if any | .45%H | .46%H,I |
| Expenses net of all reductions | .45%H | .46%H,I |
| Net investment income (loss) | 1.16%H | 1.78%H |
| Supplemental Data | | |
| Net assets, end of period (000 omitted) | $1,742,559 | $625,475 |
| Portfolio turnover rateF | 24%H | 18%J |
A For the period June 7, 2017 (commencement of sale of shares) to March 31, 2018.
B Calculated based on average shares outstanding during the period.
C Total distributions of $.42 per share is comprised of distributions from net investment income of $.186 and distributions from net realized gain of $.235 per share.
D Total returns for periods of less than one year are not annualized.
E Total returns would have been lower if certain expenses had not been reduced during the applicable periods shown.
F Amounts do not include the activity of the Underlying Funds.
G Expense ratios reflect operating expenses of the class. Expenses before reductions do not reflect amounts reimbursed by the investment adviser or reductions from expense offset arrangements and do not represent the amount paid by the class during periods when reimbursements or reductions occur. Expense ratios before reductions for start-up periods may not be representative of longer-term operating periods. Expenses net of fee waivers reflect expenses after reimbursement by the investment adviser but prior to reductions from expense offset arrangements. Expenses net of all reductions represent the net expenses paid by the class but do not include expenses of the underlying funds in which the Fund invests.
H Annualized
I On certain classes, the size and fluctuation of net assets and expense amounts may cause ratios to differ from contractual rates.
J The portfolio turnover rate does not include the assets acquired in the merger.
See accompanying notes which are an integral part of the financial statements.
Fidelity Freedom® 2030 Fund
Investment Summary (Unaudited)
The information in the following tables is based on the direct investments of the Fund.
Top Holdings as of September 30, 2018
| | % of fund's net assets |
| Fidelity Series Investment Grade Bond Fund | 14.8 |
| Fidelity Series Intrinsic Opportunities Fund | 8.3 |
| Fidelity Series Large Cap Stock Fund | 7.5 |
| Fidelity Series International Value Fund | 7.4 |
| Fidelity Series International Growth Fund | 7.3 |
| Fidelity Series Emerging Markets Opportunities Fund | 7.2 |
| Fidelity Series Growth Company Fund | 7.0 |
| Fidelity Series Long-Term Treasury Bond Index Fund | 5.7 |
| Fidelity Series Stock Selector Large Cap Value Fund | 5.6 |
| Fidelity Series Value Discovery Fund | 4.0 |
| | 74.8 |
Asset Allocation (% of fund's net assets)
| Period end |
| | Domestic Equity Funds | 49.7% |
| | International Equity Funds | 24.4% |
| | Bond Funds | 23.8% |
| | Short-Term Funds | 2.1% |
| | Short-Term Investments | 0.1% |
| | Net Other Assets (Liabilities)* | (0.1)% |

* Net Other Assets (Liabilities) are not included in the pie chart
Domestic Equity Funds category includes Fidelity Series Commodity Strategy Fund which invests in commodity-related investments.
Fidelity Freedom® 2030 Fund
Schedule of Investments September 30, 2018 (Unaudited)
Showing Percentage of Net Assets
| U.S. Treasury Obligations - 0.1% | | | |
| | | Principal Amount | Value |
| U.S. Treasury Bills, yield at date of purchase 1.95% to 2.11% 10/4/18 to 12/6/18 (a) | | | |
| (Cost $25,205,940) | | 25,260,000 | 25,204,030 |
| | | Shares | Value |
|
| Domestic Equity Funds - 49.7% | | | |
| Fidelity Series All-Sector Equity Fund (b) | | 44,050,276 | $599,524,254 |
| Fidelity Series Blue Chip Growth Fund (b) | | 74,555,783 | 1,140,703,474 |
| Fidelity Series Commodity Strategy Fund (b) | | 130,252,240 | 651,261,198 |
| Fidelity Series Growth Company Fund (b) | | 112,903,677 | 2,281,783,314 |
| Fidelity Series Intrinsic Opportunities Fund (b) | | 148,507,834 | 2,722,148,603 |
| Fidelity Series Large Cap Stock Fund (b) | | 152,593,102 | 2,430,808,108 |
| Fidelity Series Large Cap Value Index Fund (b) | | 51,897,098 | 685,041,696 |
| Fidelity Series Opportunistic Insights Fund (b) | | 62,381,585 | 1,238,274,464 |
| Fidelity Series Small Cap Discovery Fund (b) | | 26,055,621 | 316,575,795 |
| Fidelity Series Small Cap Opportunities Fund (b) | | 68,156,053 | 1,001,212,413 |
| Fidelity Series Stock Selector Large Cap Value Fund (b) | | 138,308,669 | 1,828,440,603 |
| Fidelity Series Value Discovery Fund (b) | | 95,556,105 | 1,308,163,072 |
| TOTAL DOMESTIC EQUITY FUNDS | | | |
| (Cost $11,819,275,843) | | | 16,203,936,994 |
|
| International Equity Funds - 24.4% | | | |
| Fidelity Series Canada Fund (b) | | 21,948,698 | 237,265,422 |
| Fidelity Series Emerging Markets Fund (b) | | 3,400,900 | 32,954,720 |
| Fidelity Series Emerging Markets Opportunities Fund (b) | | 121,836,204 | 2,338,036,755 |
| Fidelity Series International Growth Fund (b) | | 144,054,803 | 2,362,498,763 |
| Fidelity Series International Small Cap Fund (b) | | 31,288,983 | 560,072,787 |
| Fidelity Series International Value Fund (b) | | 229,310,702 | 2,412,348,583 |
| TOTAL INTERNATIONAL EQUITY FUNDS | | | |
| (Cost $6,346,733,407) | | | 7,943,177,030 |
|
| Bond Funds - 23.8% | | | |
| Fidelity Series Emerging Markets Debt Fund (b) | | 21,165,377 | 201,706,044 |
| Fidelity Series Floating Rate High Income Fund (b) | | 7,555,495 | 71,928,312 |
| Fidelity Series High Income Fund (b) | | 46,272,752 | 444,681,144 |
| Fidelity Series Inflation-Protected Bond Index Fund (b) | | 20,070,118 | 194,880,847 |
| Fidelity Series International Credit Fund (b) | | 1,508,083 | 14,824,460 |
| Fidelity Series Investment Grade Bond Fund (b) | | 444,336,171 | 4,838,820,902 |
| Fidelity Series Long-Term Treasury Bond Index Fund (b) | | 223,360,988 | 1,840,494,539 |
| Fidelity Series Real Estate Income Fund (b) | | 13,346,860 | 143,879,149 |
| TOTAL BOND FUNDS | | | |
| (Cost $8,004,673,099) | | | 7,751,215,397 |
|
| Short-Term Funds - 2.1% | | | |
| Fidelity Cash Central Fund, 2.11% (c) | | 54,688,497 | 54,699,435 |
| Fidelity Series Government Money Market Fund 2.12% (b)(d) | | 547,321,333 | 547,321,333 |
| Fidelity Series Short-Term Credit Fund (b) | | 8,973,065 | 88,474,421 |
| TOTAL SHORT-TERM FUNDS | | | |
| (Cost $691,463,657) | | | 690,495,189 |
| TOTAL INVESTMENT IN SECURITIES - 100.1% | | | |
| (Cost $26,887,351,946) | | | 32,614,028,640 |
| NET OTHER ASSETS (LIABILITIES) - (0.1)% | | | (18,581,786) |
| NET ASSETS - 100% | | | $32,595,446,854 |
| Futures Contracts | | | | | |
| | Number of contracts | Expiration Date | Notional Amount | Value | Unrealized Appreciation/(Depreciation) |
| Purchased | | | | | |
| Equity Index Contracts | | | | | |
| ICE E-mini MSCI EAFE Index Contracts (United States) | 773 | Dec. 2018 | $76,353,075 | $73,036 | $73,036 |
| ICE E-mini MSCI Emerging Markets Index Contracts (United States) | 5,316 | Dec. 2018 | 279,010,260 | 4,533,104 | 4,533,104 |
|
| TOTAL PURCHASED | | | | | 4,606,140 |
|
| Sold | | | | | |
| Equity Index Contracts | | | | | |
| CME E-mini S&P 500 Index Contracts (United States) | 2,691 | Dec. 2018 | 392,751,450 | (576,670) | (576,670) |
| TOTAL FUTURES CONTRACTS | | | | | $4,029,470 |
The notional amount of futures purchased as a percentage of Net Assets is 1.1%
The notional amount of futures sold as a percentage of Net Assets is 1.2%
Legend
(a) Security or a portion of the security was pledged to cover margin requirements for futures contracts. At period end, the value of securities pledged amounted to $20,259,827.
(b) Affiliated Fund
(c) Affiliated fund that is generally available only to investment companies and other accounts managed by Fidelity Investments. The rate quoted is the annualized seven-day yield of the fund at period end. A complete unaudited listing of the fund's holdings as of its most recent quarter end is available upon request. In addition, each Fidelity Central Fund's financial statements are available on the SEC's website or upon request.
(d) The rate quoted is the annualized seven-day yield of the fund at period end.
Affiliated Central Funds
Information regarding fiscal year to date income earned by the Fund from investments in Fidelity Central Funds is as follows:
| Fund | Income earned |
| Fidelity Cash Central Fund | $221,630 |
| Total | $221,630 |
Amounts in the income column in the above table include any capital gain distributions from underlying funds, which are presented in the corresponding line-item in the Statement of Operations if applicable.
Affiliated Underlying Funds
Fiscal year to date information regarding the Fund's investments in affiliated Underlying Funds, excluding any Money Market Central Funds, is presented below. Exchanges between classes of the same affiliated Underlying Funds may occur.
| Affiliate | Value, beginning of period | Purchases | Sales Proceeds | Dividend Income | Realized Gain (loss) | Change in Unrealized appreciation (depreciation) | Value, end of period |
| Fidelity Series 100 Index Fund | $523,652,000 | $24 | $549,343,064 | $-- | $200,853,736 | $(175,162,696) | $-- |
| Fidelity Series All-Sector Equity Fund | 1,006,674,195 | 22,105,224 | 537,576,734 | -- | 51,276,421 | 57,045,148 | 599,524,254 |
| Fidelity Series Blue Chip Growth Fund | 1,040,466,499 | 129,307,574 | 107,580,334 | 105,831,273 | 22,646,957 | 55,862,778 | 1,140,703,474 |
| Fidelity Series Canada Fund | 235,908,154 | 5,112,459 | 18,402,531 | -- | 335,871 | 14,311,469 | 237,265,422 |
| Fidelity Series Commodity Strategy Fund | 678,337,536 | 83,335,244 | 57,285,341 | 38,971,319 | (23,483,368) | (29,642,873) | 651,261,198 |
| Fidelity Series Emerging Markets Debt Fund | 210,639,143 | 10,437,695 | 7,837,060 | 6,179,255 | (361,124) | (11,172,610) | 201,706,044 |
| Fidelity Series Emerging Markets Fund | -- | 32,487,281 | -- | -- | -- | 467,439 | 32,954,720 |
| Fidelity Series Emerging Markets Opportunities Fund | 2,446,367,661 | 279,033,917 | 77,551,712 | -- | (3,375,147) | (306,437,964) | 2,338,036,755 |
| Fidelity Series Floating Rate High Income Fund | 71,095,281 | 3,685,608 | 2,927,236 | 1,911,057 | (32,913) | 107,572 | 71,928,312 |
| Fidelity Series Government Money Market Fund 2.12% | 457,362,031 | 226,160,805 | 136,201,503 | 4,916,975 | -- | -- | 547,321,333 |
| Fidelity Series Growth Company Fund | 2,122,560,480 | 47,163,873 | 203,105,725 | -- | 28,314,903 | 286,849,783 | 2,281,783,314 |
| Fidelity Series High Income Fund | 444,355,054 | 22,105,175 | 25,461,784 | 12,910,808 | (746,610) | 4,429,309 | 444,681,144 |
| Fidelity Series Inflation-Protected Bond Index Fund | 247,162,137 | 53,553,459 | 106,574,704 | 394,032 | (2,173,611) | 2,913,566 | 194,880,847 |
| Fidelity Series International Credit Fund | 15,086,864 | 185,988 | 296,613 | 185,928 | (4,075) | (147,704) | 14,824,460 |
| Fidelity Series International Growth Fund | 2,382,946,699 | 51,248,291 | 108,273,033 | -- | 11,295,639 | 25,281,167 | 2,362,498,763 |
| Fidelity Series International Small Cap Fund | 594,583,372 | 12,662,974 | 24,214,228 | -- | 1,226,184 | (24,185,515) | 560,072,787 |
| Fidelity Series International Value Fund | 2,404,694,160 | 106,423,632 | 92,694,257 | -- | (1,050,685) | (5,024,267) | 2,412,348,583 |
| Fidelity Series Intrinsic Opportunities Fund | 2,568,837,729 | 182,683,247 | 68,157,071 | 120,288,014 | 727,007 | 38,057,691 | 2,722,148,603 |
| Fidelity Series Investment Grade Bond Fund | 4,977,920,975 | 278,109,296 | 359,592,418 | 69,992,733 | (9,544,137) | (48,072,814) | 4,838,820,902 |
| Fidelity Series Large Cap Stock Fund | 2,275,914,375 | 199,919,997 | 154,232,033 | 145,485,860 | 3,965,440 | 105,240,329 | 2,430,808,108 |
| Fidelity Series Large Cap Value Index Fund | 652,413,502 | 14,841,575 | 28,013,720 | -- | 274,413 | 45,525,926 | 685,041,696 |
| Fidelity Series Long-Term Treasury Bond Index Fund | 706,504,608 | 1,224,965,093 | 25,227,049 | 17,613,147 | (626,000) | (65,122,113) | 1,840,494,539 |
| Fidelity Series Opportunistic Insights Fund | 1,140,294,140 | 25,645,066 | 75,420,844 | -- | 4,699,953 | 143,056,149 | 1,238,274,464 |
| Fidelity Series Real Estate Equity Fund | 205,077,929 | 680,015 | 212,531,811 | 485,076 | 14,711,673 | (7,937,806) | -- |
| Fidelity Series Real Estate Income Fund | 139,377,400 | 9,402,509 | 5,741,598 | 6,065,896 | (40,571) | 881,409 | 143,879,149 |
| Fidelity Series Short-Term Credit Fund | 88,680,442 | 3,874,426 | 4,079,896 | 1,018,804 | (25,923) | 25,372 | 88,474,421 |
| Fidelity Series Small Cap Discovery Fund | 310,348,477 | 26,328,041 | 15,638,080 | 18,659,360 | (237,639) | (4,225,004) | 316,575,795 |
| Fidelity Series Small Cap Opportunities Fund | 947,696,222 | 98,306,995 | 74,534,789 | 77,345,038 | 7,513,985 | 22,230,000 | 1,001,212,413 |
| Fidelity Series Stock Selector Large Cap Value Fund | 1,777,139,590 | 40,439,055 | 110,604,134 | -- | (703,827) | 122,169,919 | 1,828,440,603 |
| Fidelity Series Value Discovery Fund | 1,262,780,275 | 28,774,334 | 57,181,244 | -- | 348,018 | 73,441,689 | 1,308,163,072 |
| | $31,934,876,930 | $3,218,978,872 | $3,246,280,546 | $628,254,575 | $305,784,570 | $320,765,349 | $32,534,125,175 |
Amounts in the income column in the above table include any capital gain distributions from underlying funds, which are presented in the corresponding line-item in the Statement of Operations if applicable.
Investment Valuation
The following is a summary of the inputs used, as of September 30, 2018, involving the Fund's assets and liabilities carried at fair value. The inputs or methodology used for valuing securities may not be an indication of the risk associated with investing in those securities. For more information on valuation inputs, and their aggregation into the levels used below, please refer to the Investment Valuation section in the accompanying Notes to Financial Statements.
| | Valuation Inputs at Reporting Date: |
| Description | Total | Level 1 | Level 2 | Level 3 |
| Investments in Securities: | | | | |
| Other Short-Term Investments | $25,204,030 | $-- | $25,204,030 | $-- |
| Domestic Equity Funds | 16,203,936,994 | 16,203,936,994 | -- | -- |
| International Equity Funds | 7,943,177,030 | 7,943,177,030 | -- | -- |
| Bond Funds | 7,751,215,397 | 7,751,215,397 | -- | -- |
| Short-Term Funds | 690,495,189 | 690,495,189 | -- | -- |
| Total Investments in Securities: | $32,614,028,640 | $32,588,824,610 | $25,204,030 | $-- |
| Derivative Instruments: | | | | |
| Assets | | | | |
| Futures Contracts | $4,606,140 | $4,606,140 | $-- | $-- |
| Total Assets | $4,606,140 | $4,606,140 | $-- | $-- |
| Liabilities | | | | |
| Futures Contracts | $(576,670) | $(576,670) | $-- | $-- |
| Total Liabilities | $(576,670) | $(576,670) | $-- | $-- |
| Total Derivative Instruments: | $4,029,470 | $4,029,470 | $-- | $-- |
Value of Derivative Instruments
The following table is a summary of the Fund's value of derivative instruments by primary risk exposure as of September 30, 2018. For additional information on derivative instruments, please refer to the Derivative Instruments section in the accompanying Notes to Financial Statements.
| Primary Risk Exposure / Derivative Type | Value |
| | Asset | Liability |
| Equity Risk | | |
| Futures Contracts(a) | $4,606,140 | $(576,670) |
| Total Equity Risk | 4,606,140 | (576,670) |
| Total Value of Derivatives | $4,606,140 | $(576,670) |
(a) Reflects gross cumulative appreciation (depreciation) on futures contracts as presented in the Schedule of Investments. In the Statement of Assets and Liabilities, the period end daily variation margin is included in receivable or payable for daily variation margin on futures contracts, and the net cumulative appreciation (depreciation) is included in net unrealized appreciation (depreciation).
See accompanying notes which are an integral part of the financial statements.
Fidelity Freedom® 2030 Fund
Financial Statements
Statement of Assets and Liabilities
| | | September 30, 2018 (Unaudited) |
| Assets | | |
Investment in securities, at value — See accompanying schedule:
Unaffiliated issuers (cost $25,205,940) | $25,204,030 | |
| Fidelity Central Funds (cost $54,699,435) | 54,699,435 | |
| Other affiliated issuers (cost $26,807,446,571) | 32,534,125,175 | |
| Total Investment in Securities (cost $26,887,351,946) | | $32,614,028,640 |
| Receivable for investments sold | | 28,439,597 |
| Receivable for fund shares sold | | 584,248,775 |
| Distributions receivable from Fidelity Central Funds | | 79,961 |
| Other receivables | | 174,805 |
| Total assets | | 33,226,971,778 |
| Liabilities | | |
| Payable for investments purchased | $37,076,575 | |
| Payable for fund shares redeemed | 575,563,524 | |
| Accrued management fee | 17,106,352 | |
| Payable for daily variation margin on futures contracts | 1,603,663 | |
| Other payables and accrued expenses | 174,810 | |
| Total liabilities | | 631,524,924 |
| Net Assets | | $32,595,446,854 |
| Net Assets consist of: | | |
| Paid in capital | | $26,117,842,770 |
| Undistributed net investment income | | 126,011,784 |
| Accumulated undistributed net realized gain (loss) on investments | | 620,886,136 |
| Net unrealized appreciation (depreciation) on investments | | 5,730,706,164 |
| Net Assets | | $32,595,446,854 |
| Fidelity Freedom 2030 Fund: | | |
| Net Asset Value, offering price and redemption price per share ($13,154,661,716 ÷ 724,774,267 shares) | | $18.15 |
| Class K: | | |
| Net Asset Value, offering price and redemption price per share ($17,523,373,807 ÷ 966,301,913 shares) | | $18.13 |
| Class K6: | | |
| Net Asset Value, offering price and redemption price per share ($1,917,411,331 ÷ 105,627,135 shares) | | $18.15 |
See accompanying notes which are an integral part of the financial statements.
Statement of Operations
| | | Six months ended September 30, 2018 (Unaudited) |
| Investment Income | | |
| Dividends: | | |
| Affiliated issuers | | $228,866,659 |
| Interest | | 127,831 |
| Income from Fidelity Central Funds | | 221,630 |
| Total income | | 229,216,120 |
| Expenses | | |
| Management fee | $102,979,239 | |
| Independent trustees' fees and expenses | 78,558 | |
| Total expenses before reductions | 103,057,797 | |
| Expense reductions | (25) | |
| Total expenses after reductions | | 103,057,772 |
| Net investment income (loss) | | 126,158,348 |
| Realized and Unrealized Gain (Loss) | | |
| Net realized gain (loss) on: | | |
| Investment securities: | | |
| Fidelity Central Funds | 611 | |
| Other affiliated issuers | 305,784,570 | |
| Futures contracts | (26,433,469) | |
| Capital gain distributions from underlying funds: | | |
| Affiliated issuers | 399,387,916 | |
| Total net realized gain (loss) | | 678,739,628 |
| Change in net unrealized appreciation (depreciation) on: | | |
| Investment securities: | | |
| Unaffiliated issuers | (1,773) | |
| Affiliated issuers | 320,765,349 | |
| Futures contracts | 4,029,470 | |
| Total change in net unrealized appreciation (depreciation) | | 324,793,046 |
| Net gain (loss) | | 1,003,532,674 |
| Net increase (decrease) in net assets resulting from operations | | $1,129,691,022 |
See accompanying notes which are an integral part of the financial statements.
Statement of Changes in Net Assets
| | Six months ended September 30, 2018 (Unaudited) | Year ended March 31, 2018 |
| Increase (Decrease) in Net Assets | | |
| Operations | | |
| Net investment income (loss) | $126,158,348 | $381,629,218 |
| Net realized gain (loss) | 678,739,628 | 1,448,536,874 |
| Change in net unrealized appreciation (depreciation) | 324,793,046 | 643,449,189 |
| Net increase (decrease) in net assets resulting from operations | 1,129,691,022 | 2,473,615,281 |
| Distributions to shareholders from net investment income | – | (396,775,824) |
| Distributions to shareholders from net realized gain | (851,354,197) | (769,505,029) |
| Total distributions | (851,354,197) | (1,166,280,853) |
| Share transactions - net increase (decrease) | 395,481,166 | 19,308,625,938 |
| Total increase (decrease) in net assets | 673,817,991 | 20,615,960,366 |
| Net Assets | | |
| Beginning of period | 31,921,628,863 | 11,305,668,497 |
| End of period | $32,595,446,854 | $31,921,628,863 |
| Other Information | | |
| Undistributed net investment income end of period | $126,011,784 | $– |
| Distributions in excess of net investment income end of period | $– | $(146,564) |
See accompanying notes which are an integral part of the financial statements.
Financial Highlights
Fidelity Freedom 2030 Fund
| | Six months ended (Unaudited) September 30, | Years endedMarch 31, | | | | |
| | 2018 | 2018 | 2017 | 2016 | 2015 | 2014 |
| Selected Per–Share Data | | | | | | |
| Net asset value, beginning of period | $18.00 | $16.72 | $15.20 | $16.62 | $16.47 | $15.02 |
| Income from Investment Operations | | | | | | |
| Net investment income (loss)A | .06 | .21 | .25 | .25 | .27 | .24 |
| Net realized and unrealized gain (loss) | .57 | 1.90 | 1.90 | (.75) | .95 | 1.71 |
| Total from investment operations | .63 | 2.11 | 2.15 | (.50) | 1.22 | 1.95 |
| Distributions from net investment income | – | (.22) | (.25) | (.26) | (.28) | (.25) |
| Distributions from net realized gain | (.48) | (.61) | (.38) | (.67) | (.79) | (.25) |
| Total distributions | (.48) | (.83) | (.63) | (.92)B | (1.07) | (.50) |
| Net asset value, end of period | $18.15 | $18.00 | $16.72 | $15.20 | $16.62 | $16.47 |
| Total ReturnC,D | 3.52% | 12.78% | 14.58% | (3.17)% | 7.76% | 13.08% |
| Ratios to Average Net AssetsE,F | | | | | | |
| Expenses before reductions | .70%G | .59% | - %H | - %H | - %H | - %H |
| Expenses net of fee waivers, if any | .70%G | .59% | -% | -% | -% | -% |
| Expenses net of all reductions | .70%G | .59% | -% | -% | -% | -% |
| Net investment income (loss) | .72%G | 1.20% | 1.57% | 1.59% | 1.68% | 1.50% |
| Supplemental Data | | | | | | |
| Net assets, end of period (000 omitted) | $13,154,662 | $12,684,794 | $11,305,668 | $10,150,137 | $10,883,658 | $10,933,549 |
| Portfolio turnover rateF | 20%G | 18%I | 17% | 16% | 17% | 54% |
A Calculated based on average shares outstanding during the period.
B Total distributions of $.92 per share is comprised of distributions from net investment income of $.257 and distributions from net realized gain of $.665 per share.
C Total returns for periods of less than one year are not annualized.
D Total returns would have been lower if certain expenses had not been reduced during the applicable periods shown.
E Expense ratios reflect operating expenses of the class. Expenses before reductions do not reflect amounts reimbursed by the investment adviser or reductions from expense offset arrangements and do not represent the amount paid by the class during periods when reimbursements or reductions occur. Expenses net of fee waivers reflect expenses after reimbursement by the investment adviser but prior to reductions from expense offset arrangements. Expenses net of all reductions represent the net expenses paid by the class but do not include expenses of the underlying funds in which the Fund invests.
F Amounts do not include the activity of the Underlying Funds.
G Annualized
H Amount represents less than $.005 per share.
I The portfolio turnover rate does not include the assets acquired in the merger.
See accompanying notes which are an integral part of the financial statements.
Fidelity Freedom 2030 Fund Class K
| | Six months ended (Unaudited) September 30, | Years endedMarch 31, |
| | 2018 | 2018 A |
| Selected Per–Share Data | | |
| Net asset value, beginning of period | $17.98 | $17.47 |
| Income from Investment Operations | | |
| Net investment income (loss)B | .07 | .28 |
| Net realized and unrealized gain (loss) | .56 | .81 |
| Total from investment operations | .63 | 1.09 |
| Distributions from net investment income | – | (.24) |
| Distributions from net realized gain | (.48) | (.35) |
| Total distributions | (.48) | (.58)C |
| Net asset value, end of period | $18.13 | $17.98 |
| Total ReturnD,E | 3.53% | 6.24% |
| Ratios to Average Net AssetsF,G | | |
| Expenses before reductions | .60%H | .62%H,I |
| Expenses net of fee waivers, if any | .60%H | .62%H,I |
| Expenses net of all reductions | .60%H | .62%H,I |
| Net investment income (loss) | .81%H | 2.23%H |
| Supplemental Data | | |
| Net assets, end of period (000 omitted) | $17,523,374 | $18,414,961 |
| Portfolio turnover rateG | 20%H | 18%J |
A For the period July 20, 2017 (commencement of sale of shares) to March 31, 2018.
B Calculated based on average shares outstanding during the period.
C Total distributions of $.58 per share is comprised of distributions from net investment income of $.237 and distributions from net realized gain of $.345 per share.
D Total returns for periods of less than one year are not annualized.
E Total returns would have been lower if certain expenses had not been reduced during the applicable periods shown.
F Expense ratios reflect operating expenses of the class. Expenses before reductions do not reflect amounts reimbursed by the investment adviser or reductions from expense offset arrangements and do not represent the amount paid by the class during periods when reimbursements or reductions occur. Expense ratios before reductions for start-up periods may not be representative of longer-term operating periods. Expenses net of fee waivers reflect expenses after reimbursement by the investment adviser but prior to reductions from expense offset arrangements. Expenses net of all reductions represent the net expenses paid by the class but do not include expenses of the underlying funds in which the Fund invests.
G Amounts do not include the activity of the Underlying Funds.
H Annualized
I On certain classes, the size and fluctuation of net assets and expense amounts may cause ratios to differ from contractual rates.
J The portfolio turnover rate does not include the assets acquired in the merger.
See accompanying notes which are an integral part of the financial statements.
Fidelity Freedom 2030 Fund Class K6
| | Six months ended (Unaudited) September 30, | Years endedMarch 31, |
| | 2018 | 2018 A |
| Selected Per–Share Data | | |
| Net asset value, beginning of period | $18.00 | $17.15 |
| Income from Investment Operations | | |
| Net investment income (loss)B | .08 | .26 |
| Net realized and unrealized gain (loss) | .56 | 1.18 |
| Total from investment operations | .64 | 1.44 |
| Distributions from net investment income | – | (.24) |
| Distributions from net realized gain | (.49) | (.35) |
| Total distributions | (.49) | (.59) |
| Net asset value, end of period | $18.15 | $18.00 |
| Total ReturnC,D | 3.60% | 8.35% |
| Ratios to Average Net AssetsE,F | | |
| Expenses before reductions | .47%G | .48%G,H |
| Expenses net of fee waivers, if any | .47%G | .48%G,H |
| Expenses net of all reductions | .47%G | .48%G,H |
| Net investment income (loss) | .94%G | 1.76%G |
| Supplemental Data | | |
| Net assets, end of period (000 omitted) | $1,917,411 | $821,874 |
| Portfolio turnover rateF | 20%G | 18%I |
A For the period June 7, 2017 (commencement of sale of shares) to March 31, 2018.
B Calculated based on average shares outstanding during the period.
C Total returns for periods of less than one year are not annualized.
D Total returns would have been lower if certain expenses had not been reduced during the applicable periods shown.
E Expense ratios reflect operating expenses of the class. Expenses before reductions do not reflect amounts reimbursed by the investment adviser or reductions from expense offset arrangements and do not represent the amount paid by the class during periods when reimbursements or reductions occur. Expense ratios before reductions for start-up periods may not be representative of longer-term operating periods. Expenses net of fee waivers reflect expenses after reimbursement by the investment adviser but prior to reductions from expense offset arrangements. Expenses net of all reductions represent the net expenses paid by the class but do not include expenses of the underlying funds in which the Fund invests.
F Amounts do not include the activity of the Underlying Funds.
G Annualized
H On certain classes, the size and fluctuation of net assets and expense amounts may cause ratios to differ from contractual rates.
I The portfolio turnover rate does not include the assets acquired in the merger.
See accompanying notes which are an integral part of the financial statements.
Fidelity Freedom® 2035 Fund
Investment Summary (Unaudited)
The information in the following tables is based on the direct investments of the Fund.
Top Holdings as of September 30, 2018
| | % of fund's net assets |
| Fidelity Series Intrinsic Opportunities Fund | 9.9 |
| Fidelity Series Large Cap Stock Fund | 8.9 |
| Fidelity Series International Growth Fund | 8.8 |
| Fidelity Series International Value Fund | 8.7 |
| Fidelity Series Growth Company Fund | 8.3 |
| Fidelity Series Emerging Markets Opportunities Fund | 8.1 |
| Fidelity Series Stock Selector Large Cap Value Fund | 6.6 |
| Fidelity Series Long-Term Treasury Bond Index Fund | 5.7 |
| Fidelity Series Value Discovery Fund | 4.7 |
| Fidelity Series Opportunistic Insights Fund | 4.5 |
| | 74.2 |
Asset Allocation (% of fund's net assets)
| Period end |
| | Domestic Equity Funds | 58.4% |
| | International Equity Funds | 28.9% |
| | Bond Funds | 10.2% |
| | Short-Term Funds | 2.5% |
| | Short-Term Investments | 0.1% |
| | Net Other Assets (Liabilities)* | (0.1)% |

* Net Other Assets (Liabilities) are not included in the pie chart
Domestic Equity Funds category includes Fidelity Series Commodity Strategy Fund which invests in commodity-related investments.
Fidelity Freedom® 2035 Fund
Schedule of Investments September 30, 2018 (Unaudited)
Showing Percentage of Net Assets
| U.S. Treasury Obligations - 0.1% | | | |
| | | Principal Amount | Value |
| U.S. Treasury Bills, yield at date of purchase 1.99% to 2.11% 11/1/18 to 12/6/18 (a) | | | |
| (Cost $17,577,887) | | 17,640,000 | 17,576,708 |
| | | Shares | Value |
|
| Domestic Equity Funds - 58.4% | | | |
| Fidelity Series All-Sector Equity Fund (b) | | 36,814,673 | $501,047,694 |
| Fidelity Series Blue Chip Growth Fund (b) | | 60,663,209 | 928,147,102 |
| Fidelity Series Commodity Strategy Fund (b) | | 89,911,671 | 449,558,355 |
| Fidelity Series Growth Company Fund (b) | | 92,790,382 | 1,875,293,611 |
| Fidelity Series Intrinsic Opportunities Fund (b) | | 121,998,296 | 2,236,228,763 |
| Fidelity Series Large Cap Stock Fund (b) | | 125,505,222 | 1,999,298,183 |
| Fidelity Series Large Cap Value Index Fund (b) | | 41,863,738 | 552,601,343 |
| Fidelity Series Opportunistic Insights Fund (b) | | 50,841,038 | 1,009,194,608 |
| Fidelity Series Small Cap Discovery Fund (b) | | 20,977,180 | 254,872,740 |
| Fidelity Series Small Cap Opportunities Fund (b) | | 55,328,429 | 812,774,628 |
| Fidelity Series Stock Selector Large Cap Value Fund (b) | | 112,814,009 | 1,491,401,198 |
| Fidelity Series Value Discovery Fund (b) | | 76,860,403 | 1,052,218,913 |
| TOTAL DOMESTIC EQUITY FUNDS | | | |
| (Cost $9,840,507,082) | | | 13,162,637,138 |
|
| International Equity Funds - 28.9% | | | |
| Fidelity Series Canada Fund (b) | | 17,897,494 | 193,471,907 |
| Fidelity Series Emerging Markets Fund (b) | | 8,343,172 | 80,845,337 |
| Fidelity Series Emerging Markets Opportunities Fund (b) | | 95,777,119 | 1,837,962,916 |
| Fidelity Series International Growth Fund (b) | | 120,789,387 | 1,980,945,950 |
| Fidelity Series International Small Cap Fund (b) | | 25,267,369 | 452,285,906 |
| Fidelity Series International Value Fund (b) | | 187,089,755 | 1,968,184,226 |
| TOTAL INTERNATIONAL EQUITY FUNDS | | | |
| (Cost $5,341,147,046) | | | 6,513,696,242 |
|
| Bond Funds - 10.2% | | | |
| Fidelity Series Emerging Markets Debt Fund (b) | | 14,217,374 | 135,491,577 |
| Fidelity Series Floating Rate High Income Fund (b) | | 5,130,279 | 48,840,256 |
| Fidelity Series High Income Fund (b) | | 31,321,943 | 301,003,871 |
| Fidelity Series Inflation-Protected Bond Index Fund (b) | | 6,991,725 | 67,889,646 |
| Fidelity Series International Credit Fund (b) | | 1,004,298 | 9,872,251 |
| Fidelity Series Investment Grade Bond Fund (b) | | 33,211,964 | 361,678,292 |
| Fidelity Series Long-Term Treasury Bond Index Fund (b) | | 154,389,770 | 1,272,171,704 |
| Fidelity Series Real Estate Income Fund (b) | | 8,986,146 | 96,870,657 |
| TOTAL BOND FUNDS | | | |
| (Cost $2,366,856,425) | | | 2,293,818,254 |
|
| Short-Term Funds - 2.5% | | | |
| Fidelity Cash Central Fund, 2.11% (c) | | 38,244,331 | 38,251,980 |
| Fidelity Series Government Money Market Fund 2.12% (b)(d) | | 462,174,903 | 462,174,903 |
| Fidelity Series Short-Term Credit Fund (b) | | 7,762,794 | 76,541,145 |
| TOTAL SHORT-TERM FUNDS | | | |
| (Cost $577,645,636) | | | 576,968,028 |
| TOTAL INVESTMENT IN SECURITIES - 100.1% | | | |
| (Cost $18,143,734,076) | | | 22,564,696,370 |
| NET OTHER ASSETS (LIABILITIES) - (0.1)% | | | (13,410,204) |
| NET ASSETS - 100% | | | $22,551,286,166 |
| Futures Contracts | | | | | |
| | Number of contracts | Expiration Date | Notional Amount | Value | Unrealized Appreciation/(Depreciation) |
| Purchased | | | | | |
| Equity Index Contracts | | | | | |
| ICE E-mini MSCI Emerging Markets Index Contracts (United States) | 2,751 | Dec. 2018 | $144,386,235 | $2,627,144 | $2,627,144 |
| Sold | | | | | |
| Equity Index Contracts | | | | | |
| CME E-mini S&P 500 Index Contracts (United States) | 494 | Dec. 2018 | 72,099,300 | (19,060) | (19,060) |
| TOTAL FUTURES CONTRACTS | | | | | $2,608,084 |
The notional amount of futures purchased as a percentage of Net Assets is 0.6%
The notional amount of futures sold as a percentage of Net Assets is 0.3%
Legend
(a) Security or a portion of the security was pledged to cover margin requirements for futures contracts. At period end, the value of securities pledged amounted to $7,887,391.
(b) Affiliated Fund
(c) Affiliated fund that is generally available only to investment companies and other accounts managed by Fidelity Investments. The rate quoted is the annualized seven-day yield of the fund at period end. A complete unaudited listing of the fund's holdings as of its most recent quarter end is available upon request. In addition, each Fidelity Central Fund's financial statements are available on the SEC's website or upon request.
(d) The rate quoted is the annualized seven-day yield of the fund at period end.
Affiliated Central Funds
Information regarding fiscal year to date income earned by the Fund from investments in Fidelity Central Funds is as follows:
| Fund | Income earned |
| Fidelity Cash Central Fund | $145,928 |
| Total | $145,928 |
Amounts in the income column in the above table include any capital gain distributions from underlying funds, which are presented in the corresponding line-item in the Statement of Operations if applicable.
Affiliated Underlying Funds
Fiscal year to date information regarding the Fund's investments in affiliated Underlying Funds, excluding any Money Market Central Funds, is presented below. Exchanges between classes of the same affiliated Underlying Funds may occur.
| Affiliate | Value, beginning of period | Purchases | Sales Proceeds | Dividend Income | Realized Gain (loss) | Change in Unrealized appreciation (depreciation) | Value, end of period |
| Fidelity Series 100 Index Fund | $418,817,851 | $3,601 | $440,838,264 | $-- | $160,376,149 | $(138,359,337) | $-- |
| Fidelity Series All-Sector Equity Fund | 805,615,379 | 27,361,544 | 420,827,419 | -- | 36,027,949 | 52,870,241 | 501,047,694 |
| Fidelity Series Blue Chip Growth Fund | 832,667,609 | 114,383,257 | 81,570,449 | 85,894,267 | 9,683,702 | 52,982,983 | 928,147,102 |
| Fidelity Series Canada Fund | 185,991,221 | 6,149,793 | 10,250,918 | -- | (11,650) | 11,593,461 | 193,471,907 |
| Fidelity Series Commodity Strategy Fund | 453,122,550 | 76,772,936 | 43,332,261 | 26,837,691 | (17,353,739) | (19,651,131) | 449,558,355 |
| Fidelity Series Emerging Markets Debt Fund | 140,311,483 | 8,610,723 | 5,742,203 | 4,137,287 | (307,279) | (7,381,147) | 135,491,577 |
| Fidelity Series Emerging Markets Fund | -- | 80,275,959 | -- | -- | -- | 569,378 | 80,845,337 |
| Fidelity Series Emerging Markets | 1,945,942,220 | 223,499,911 | 88,001,466 | -- | 10,448,933 | (253,926,682) | 1,837,962,916 |
| Fidelity Series Floating Rate High Income | 47,711,855 | 3,153,791 | 2,076,272 | 1,290,502 | (79,995) | 130,877 | 48,840,256 |
| Fidelity Series Government Money Market | 352,943,664 | 270,920,162 | 161,688,923 | 3,578,741 | -- | -- | 462,174,903 |
| Fidelity Series Growth Company Fund | 1,693,158,763 | 57,557,267 | 128,860,040 | -- | 11,147,470 | 242,290,151 | 1,875,293,611 |
| Fidelity Series High Income Fund | 298,102,772 | 18,339,807 | 17,915,862 | 8,705,548 | (470,083) | 2,947,237 | 301,003,871 |
| Fidelity Series Inflation-Protected Bond | 174,598,700 | 9,342,620 | 117,010,764 | 246,475 | (1,578,931) | 2,538,021 | 67,889,646 |
| Fidelity Series International Credit Fund | 10,076,621 | 125,758 | 228,757 | 124,183 | (3,046) | (98,325) | 9,872,251 |
| Fidelity Series International Growth Fund | 1,868,762,602 | 153,379,972 | 70,470,184 | -- | 1,300,738 | 27,972,822 | 1,980,945,950 |
| Fidelity Series International Small Cap Fund | 466,280,560 | 20,569,472 | 16,553,692 | -- | 107,215 | (18,117,649) | 452,285,906 |
| Fidelity Series International Value Fund | 1,895,917,767 | 107,796,187 | 31,170,945 | -- | (349,328) | (4,009,455) | 1,968,184,226 |
| Fidelity Series Intrinsic Opportunities Fund | 2,060,082,541 | 219,240,215 | 72,729,681 | 98,684,642 | (594,625) | 30,230,313 | 2,236,228,763 |
| Fidelity Series Investment Grade Bond Fund | 615,546,408 | 88,212,235 | 335,643,559 | 8,174,344 | (9,336,344) | 2,899,552 | 361,678,292 |
| Fidelity Series Large Cap Stock Fund | 1,821,590,263 | 180,934,692 | 91,419,252 | 116,769,390 | 2,891,183 | 85,301,297 | 1,999,298,183 |
| Fidelity Series Large Cap Value Index Fund | 522,138,865 | 18,247,259 | 24,557,870 | -- | 237,831 | 36,535,258 | 552,601,343 |
| Fidelity Series Long-Term Treasury Bond | 491,792,423 | 833,013,935 | 7,929,947 | 12,300,551 | (65,252) | (44,639,455) | 1,272,171,704 |
| Fidelity Series Opportunistic Insights Fund | 912,528,026 | 31,309,395 | 53,789,259 | -- | 2,647,348 | 116,499,098 | 1,009,194,608 |
| Fidelity Series Real Estate Equity Fund | 164,451,251 | 839,371 | 170,955,908 | 599,773 | 6,052,433 | (387,147) | -- |
| Fidelity Series Real Estate Income Fund | 92,891,573 | 7,575,464 | 4,153,955 | 4,070,012 | (76,837) | 634,412 | 96,870,657 |
| Fidelity Series Short-Term Credit Fund | 63,956,869 | 15,567,312 | 2,982,244 | 741,324 | (24,635) | 23,843 | 76,541,145 |
| Fidelity Series Small Cap Discovery Fund | 246,110,044 | 23,650,443 | 11,286,557 | 14,889,900 | (235,397) | (3,365,793) | 254,872,740 |
| Fidelity Series Small Cap Opportunities Fund | 755,904,140 | 88,219,698 | 54,776,548 | 62,629,639 | 3,398,567 | 20,028,771 | 812,774,628 |
| Fidelity Series Stock Selector Large Cap | 1,415,005,805 | 65,512,938 | 86,527,858 | -- | (219,711) | 97,630,024 | 1,491,401,198 |
| Fidelity Series Value Discovery Fund | 1,003,212,077 | 35,601,371 | 45,578,684 | -- | 59,606 | 58,924,543 | 1,052,218,913 |
| | $21,755,231,902 | $2,786,167,088 | $2,598,869,741 | $449,674,269 | $213,672,272 | $352,666,161 | $22,508,867,682 |
Amounts in the income column in the above table include any capital gain distributions from underlying funds, which are presented in the corresponding line-item in the Statement of Operations if applicable.
Investment Valuation
The following is a summary of the inputs used, as of September 30, 2018, involving the Fund's assets and liabilities carried at fair value. The inputs or methodology used for valuing securities may not be an indication of the risk associated with investing in those securities. For more information on valuation inputs, and their aggregation into the levels used below, please refer to the Investment Valuation section in the accompanying Notes to Financial Statements.
| | Valuation Inputs at Reporting Date: |
| Description | Total | Level 1 | Level 2 | Level 3 |
| Investments in Securities: | | | | |
| Other Short-Term Investments | $17,576,708 | $-- | $17,576,708 | $-- |
| Domestic Equity Funds | 13,162,637,138 | 13,162,637,138 | -- | -- |
| International Equity Funds | 6,513,696,242 | 6,513,696,242 | -- | -- |
| Bond Funds | 2,293,818,254 | 2,293,818,254 | -- | -- |
| Short-Term Funds | 576,968,028 | 576,968,028 | -- | -- |
| Total Investments in Securities: | $22,564,696,370 | $22,547,119,662 | $17,576,708 | $-- |
| Derivative Instruments: | | | | |
| Assets | | | | |
| Futures Contracts | $2,627,144 | $2,627,144 | $-- | $-- |
| Total Assets | $2,627,144 | $2,627,144 | $-- | $-- |
| Liabilities | | | | |
| Futures Contracts | $(19,060) | $(19,060) | $-- | $-- |
| Total Liabilities | $(19,060) | $(19,060) | $-- | $-- |
| Total Derivative Instruments: | $2,608,084 | $2,608,084 | $-- | $-- |
Value of Derivative Instruments
The following table is a summary of the Fund's value of derivative instruments by primary risk exposure as of September 30, 2018. For additional information on derivative instruments, please refer to the Derivative Instruments section in the accompanying Notes to Financial Statements.
| Primary Risk Exposure / Derivative Type | Value |
| | Asset | Liability |
| Equity Risk | | |
| Futures Contracts(a) | $2,627,144 | $(19,060) |
| Total Equity Risk | 2,627,144 | (19,060) |
| Total Value of Derivatives | $2,627,144 | $(19,060) |
(a) Reflects gross cumulative appreciation (depreciation) on futures contracts as presented in the Schedule of Investments. In the Statement of Assets and Liabilities, the period end daily variation margin is included in receivable or payable for daily variation margin on futures contracts, and the net cumulative appreciation (depreciation) is included in net unrealized appreciation (depreciation).
See accompanying notes which are an integral part of the financial statements.
Fidelity Freedom® 2035 Fund
Financial Statements
Statement of Assets and Liabilities
| | | September 30, 2018 (Unaudited) |
| Assets | | |
Investment in securities, at value — See accompanying schedule:
Unaffiliated issuers (cost $17,577,887) | $17,576,708 | |
| Fidelity Central Funds (cost $38,251,980) | 38,251,980 | |
| Other affiliated issuers (cost $18,087,904,209) | 22,508,867,682 | |
| Total Investment in Securities (cost $18,143,734,076) | | $22,564,696,370 |
| Receivable for investments sold | | 124,362,252 |
| Receivable for fund shares sold | | 531,751,543 |
| Distributions receivable from Fidelity Central Funds | | 56,169 |
| Total assets | | 23,220,866,334 |
| Liabilities | | |
| Payable for investments purchased | $136,895,830 | |
| Payable for fund shares redeemed | 519,193,278 | |
| Accrued management fee | 12,417,868 | |
| Payable for daily variation margin on futures contracts | 1,073,192 | |
| Total liabilities | | 669,580,168 |
| Net Assets | | $22,551,286,166 |
| Net Assets consist of: | | |
| Paid in capital | | $17,589,345,001 |
| Undistributed net investment income | | 52,160,426 |
| Accumulated undistributed net realized gain (loss) on investments | | 486,210,361 |
| Net unrealized appreciation (depreciation) on investments | | 4,423,570,378 |
| Net Assets | | $22,551,286,166 |
| Fidelity Freedom 2035 Fund: | | |
| Net Asset Value, offering price and redemption price per share ($8,454,366,057 ÷ 547,781,227 shares) | | $15.43 |
| Class K: | | |
| Net Asset Value, offering price and redemption price per share ($12,449,643,168 ÷ 807,585,097 shares) | | $15.42 |
| Class K6: | | |
| Net Asset Value, offering price and redemption price per share ($1,647,276,941 ÷ 106,684,812 shares) | | $15.44 |
See accompanying notes which are an integral part of the financial statements.
Statement of Operations
| | | Six months ended September 30, 2018 (Unaudited) |
| Investment Income | | |
| Dividends: | | |
| Affiliated issuers | | $126,493,352 |
| Interest | | 82,705 |
| Income from Fidelity Central Funds | | 145,928 |
| Total income | | 126,721,985 |
| Expenses | | |
| Management fee | $74,507,738 | |
| Independent trustees' fees and expenses | 53,821 | |
| Total expenses | | 74,561,559 |
| Net investment income (loss) | | 52,160,426 |
| Realized and Unrealized Gain (Loss) | | |
| Net realized gain (loss) on: | | |
| Investment securities: | | |
| Fidelity Central Funds | 103 | |
| Other affiliated issuers | 213,672,272 | |
| Futures contracts | (12,173,716) | |
| Capital gain distributions from underlying funds: | | |
| Affiliated issuers | 323,180,917 | |
| Total net realized gain (loss) | | 524,679,576 |
| Change in net unrealized appreciation (depreciation) on: | | |
| Investment securities: | | |
| Unaffiliated issuers | (1,179) | |
| Affiliated issuers | 352,666,161 | |
| Futures contracts | 2,608,084 | |
| Total change in net unrealized appreciation (depreciation) | | 355,273,066 |
| Net gain (loss) | | 879,952,642 |
| Net increase (decrease) in net assets resulting from operations | | $932,113,068 |
See accompanying notes which are an integral part of the financial statements.
Statement of Changes in Net Assets
| | Six months ended September 30, 2018 (Unaudited) | Year ended March 31, 2018 |
| Increase (Decrease) in Net Assets | | |
| Operations | | |
| Net investment income (loss) | $52,160,426 | $234,969,726 |
| Net realized gain (loss) | 524,679,576 | 967,655,889 |
| Change in net unrealized appreciation (depreciation) | 355,273,066 | 651,152,594 |
| Net increase (decrease) in net assets resulting from operations | 932,113,068 | 1,853,778,209 |
| Distributions to shareholders from net investment income | – | (255,443,857) |
| Distributions to shareholders from net realized gain | (589,171,303) | (469,405,267) |
| Total distributions | (589,171,303) | (724,849,124) |
| Share transactions - net increase (decrease) | 465,511,100 | 13,724,076,087 |
| Total increase (decrease) in net assets | 808,452,865 | 14,853,005,172 |
| Net Assets | | |
| Beginning of period | 21,742,833,301 | 6,889,828,129 |
| End of period | $22,551,286,166 | $21,742,833,301 |
| Other Information | | |
| Undistributed net investment income end of period | $52,160,426 | $– |
See accompanying notes which are an integral part of the financial statements.
Financial Highlights
Fidelity Freedom 2035 Fund
| | Six months ended (Unaudited) September 30, | Years endedMarch 31, | | | | |
| | 2018 | 2018 | 2017 | 2016 | 2015 | 2014 |
| Selected Per–Share Data | | | | | | |
| Net asset value, beginning of period | $15.20 | $13.88 | $12.46 | $13.67 | $13.62 | $12.57 |
| Income from Investment Operations | | | | | | |
| Net investment income (loss)A | .03 | .16 | .19 | .19 | .22 | .18 |
| Net realized and unrealized gain (loss) | .61 | 1.81 | 1.75 | (.65) | .80 | 1.63 |
| Total from investment operations | .64 | 1.97 | 1.94 | (.46) | 1.02 | 1.81 |
| Distributions from net investment income | – | (.17) | (.18) | (.20) | (.23) | (.19) |
| Distributions from net realized gain | (.41) | (.47) | (.34) | (.55) | (.75) | (.57) |
| Total distributions | (.41) | (.65)B | (.52) | (.75) | (.97)C | (.76) |
| Net asset value, end of period | $15.43 | $15.20 | $13.88 | $12.46 | $13.67 | $13.62 |
| Total ReturnD,E | 4.24% | 14.32% | 16.09% | (3.59)% | 7.90% | 14.76% |
| Ratios to Average Net AssetsF,G | | | | | | |
| Expenses before reductions | .74%H | .63%I | - %J | - %J | - %J | - %J |
| Expenses net of fee waivers, if any | .74%H | .63%I | -% | -% | -% | -% |
| Expenses net of all reductions | .74%H | .63%I | -% | -% | -% | -% |
| Net investment income (loss) | .40%H | 1.06% | 1.45% | 1.48% | 1.62% | 1.42% |
| Supplemental Data | | | | | | |
| Net assets, end of period (000 omitted) | $8,454,366 | $8,050,659 | $6,889,828 | $5,961,088 | $6,289,345 | $6,183,144 |
| Portfolio turnover rateF | 23%H | 17%K | 16% | 15% | 18% | 54% |
A Calculated based on average shares outstanding during the period.
B Total distributions of $.65 per share is comprised of distributions from net investment income of $.171 and distributions from net realized gain of $.474 per share.
C Total distributions of $.97 per share is comprised of distributions from net investment income of $.226 and distributions from net realized gain of $.746 per share.
D Total returns for periods of less than one year are not annualized.
E Total returns would have been lower if certain expenses had not been reduced during the applicable periods shown.
F Amounts do not include the activity of the Underlying Funds.
G Expense ratios reflect operating expenses of the class. Expenses before reductions do not reflect amounts reimbursed by the investment adviser or reductions from expense offset arrangements and do not represent the amount paid by the class during periods when reimbursements or reductions occur. Expenses net of fee waivers reflect expenses after reimbursement by the investment adviser but prior to reductions from expense offset arrangements. Expenses net of all reductions represent the net expenses paid by the class but do not include expenses of the underlying funds in which the Fund invests.
H Annualized
I On certain classes, the size and fluctuation of net assets and expense amounts may cause ratios to differ from contractual rates.
J Amount represents less than .005%.
K The portfolio turnover rate does not include the assets acquired in the merger.
See accompanying notes which are an integral part of the financial statements.
Fidelity Freedom 2035 Fund Class K
| | Six months ended (Unaudited) September 30, | Years endedMarch 31, |
| | 2018 | 2018 A |
| Selected Per–Share Data | | |
| Net asset value, beginning of period | $15.18 | $14.60 |
| Income from Investment Operations | | |
| Net investment income (loss)B | .04 | .22 |
| Net realized and unrealized gain (loss) | .61 | .82 |
| Total from investment operations | .65 | 1.04 |
| Distributions from net investment income | – | (.19) |
| Distributions from net realized gain | (.41) | (.26) |
| Total distributions | (.41) | (.46)C |
| Net asset value, end of period | $15.42 | $15.18 |
| Total ReturnD,E | 4.32% | 7.09% |
| Ratios to Average Net AssetsF,G | | |
| Expenses before reductions | .64%H | .65%H,I |
| Expenses net of fee waivers, if any | .64%H | .65%H,I |
| Expenses net of all reductions | .64%H | .65%H,I |
| Net investment income (loss) | .50%H | 2.07%H |
| Supplemental Data | | |
| Net assets, end of period (000 omitted) | $12,449,643 | $12,979,898 |
| Portfolio turnover rateF | 23%H | 17%J |
A For the period July 20, 2017 (commencement of sale of shares) to March 31, 2018.
B Calculated based on average shares outstanding during the period.
C Total distributions of $.46 per share is comprised of distributions from net investment income of $.193 and distributions from net realized gain of $.264 per share.
D Total returns for periods of less than one year are not annualized.
E Total returns would have been lower if certain expenses had not been reduced during the applicable periods shown.
F Amounts do not include the activity of the Underlying Funds.
G Expense ratios reflect operating expenses of the class. Expenses before reductions do not reflect amounts reimbursed by the investment adviser or reductions from expense offset arrangements and do not represent the amount paid by the class during periods when reimbursements or reductions occur. Expense ratios before reductions for start-up periods may not be representative of longer-term operating periods. Expenses net of fee waivers reflect expenses after reimbursement by the investment adviser but prior to reductions from expense offset arrangements. Expenses net of all reductions represent the net expenses paid by the class but do not include expenses of the underlying funds in which the Fund invests.
H Annualized
I On certain classes, the size and fluctuation of net assets and expense amounts may cause ratios to differ from contractual rates.
J The portfolio turnover rate does not include the assets acquired in the merger.
See accompanying notes which are an integral part of the financial statements.
Fidelity Freedom 2035 Fund Class K6
| | Six months ended (Unaudited) September 30, | Years endedMarch 31, |
| | 2018 | 2018 A |
| Selected Per–Share Data | | |
| Net asset value, beginning of period | $15.20 | $14.30 |
| Income from Investment Operations | | |
| Net investment income (loss)B | .05 | .20 |
| Net realized and unrealized gain (loss) | .61 | 1.16 |
| Total from investment operations | .66 | 1.36 |
| Distributions from net investment income | – | (.20) |
| Distributions from net realized gain | (.42) | (.26) |
| Total distributions | (.42) | (.46) |
| Net asset value, end of period | $15.44 | $15.20 |
| Total ReturnC,D | 4.38% | 9.50% |
| Ratios to Average Net AssetsE,F | | |
| Expenses before reductions | .49%G | .50%G,H |
| Expenses net of fee waivers, if any | .49%G | .50%G,H |
| Expenses net of all reductions | .49%G | .50%G,H |
| Net investment income (loss) | .65%G | 1.61%G |
| Supplemental Data | | |
| Net assets, end of period (000 omitted) | $1,647,277 | $712,276 |
| Portfolio turnover rateE | 23%G | 17%I |
A For the period June 7, 2017 (commencement of sale of shares) to March 31, 2018.
B Calculated based on average shares outstanding during the period.
C Total returns for periods of less than one year are not annualized.
D Total returns would have been lower if certain expenses had not been reduced during the applicable periods shown.
E Amounts do not include the activity of the Underlying Funds.
F Expense ratios reflect operating expenses of the class. Expenses before reductions do not reflect amounts reimbursed by the investment adviser or reductions from expense offset arrangements and do not represent the amount paid by the class during periods when reimbursements or reductions occur. Expense ratios before reductions for start-up periods may not be representative of longer-term operating periods. Expenses net of fee waivers reflect expenses after reimbursement by the investment adviser but prior to reductions from expense offset arrangements. Expenses net of all reductions represent the net expenses paid by the class but do not include expenses of the underlying funds in which the Fund invests.
G Annualized
H On certain classes, the size and fluctuation of net assets and expense amounts may cause ratios to differ from contractual rates.
I The portfolio turnover rate does not include the assets acquired in the merger.
See accompanying notes which are an integral part of the financial statements.
Fidelity Freedom® 2040 Fund
Investment Summary (Unaudited)
The information in the following tables is based on the direct investments of the Fund.
Top Holdings as of September 30, 2018
| | % of fund's net assets |
| Fidelity Series Intrinsic Opportunities Fund | 10.0 |
| Fidelity Series International Growth Fund | 9.2 |
| Fidelity Series International Value Fund | 9.2 |
| Fidelity Series Large Cap Stock Fund | 9.1 |
| Fidelity Series Growth Company Fund | 8.7 |
| Fidelity Series Emerging Markets Opportunities Fund | 8.6 |
| Fidelity Series Stock Selector Large Cap Value Fund | 6.8 |
| Fidelity Series Value Discovery Fund | 4.8 |
| Fidelity Series Opportunistic Insights Fund | 4.6 |
| Fidelity Series Blue Chip Growth Fund | 4.3 |
| | 75.3 |
Asset Allocation (% of fund's net assets)
| Period end |
| | Domestic Equity Funds | 60.5% |
| | International Equity Funds | 30.7% |
| | Bond Funds | 6.8% |
| | Short-Term Funds | 2.0% |
| | Short-Term Investments | 0.1% |
| | Net Other Assets (Liabilities)* | (0.1)% |

* Net Other Assets (Liabilities) are not included in the pie chart
Domestic Equity Funds category includes Fidelity Series Commodity Strategy Fund which invests in commodity-related investments.
Fidelity Freedom® 2040 Fund
Schedule of Investments September 30, 2018 (Unaudited)
Showing Percentage of Net Assets
| U.S. Treasury Obligations - 0.1% | | | |
| | | Principal Amount | Value |
| U.S. Treasury Bills, yield at date of purchase 2.07% to 2.11% 11/23/18 to 12/6/18 (a) | | | |
| (Cost $16,082,704) | | 16,140,000 | 16,081,594 |
| | | Shares | Value |
|
| Domestic Equity Funds - 60.5% | | | |
| Fidelity Series All-Sector Equity Fund (b) | | 43,938,325 | $598,000,603 |
| Fidelity Series Blue Chip Growth Fund (b) | | 65,050,428 | 995,271,542 |
| Fidelity Series Commodity Strategy Fund (b) | | 97,318,133 | 486,590,666 |
| Fidelity Series Growth Company Fund (b) | | 99,485,793 | 2,010,607,877 |
| Fidelity Series Intrinsic Opportunities Fund (b) | | 126,314,507 | 2,315,344,903 |
| Fidelity Series Large Cap Stock Fund (b) | | 132,332,398 | 2,108,055,106 |
| Fidelity Series Large Cap Value Index Fund (b) | | 43,740,787 | 577,378,392 |
| Fidelity Series Opportunistic Insights Fund (b) | | 53,951,887 | 1,070,944,952 |
| Fidelity Series Small Cap Discovery Fund (b) | | 21,787,669 | 264,720,180 |
| Fidelity Series Small Cap Opportunities Fund (b) | | 58,943,997 | 865,887,311 |
| Fidelity Series Stock Selector Large Cap Value Fund (b) | | 118,097,827 | 1,561,253,269 |
| Fidelity Series Value Discovery Fund (b) | | 80,836,457 | 1,106,651,100 |
| TOTAL DOMESTIC EQUITY FUNDS | | | |
| (Cost $10,380,676,631) | | | 13,960,705,901 |
|
| International Equity Funds - 30.7% | | | |
| Fidelity Series Canada Fund (b) | | 19,115,204 | 206,635,357 |
| Fidelity Series Emerging Markets Fund (b) | | 13,541,799 | 131,220,029 |
| Fidelity Series Emerging Markets Opportunities Fund (b) | | 103,283,200 | 1,982,004,603 |
| Fidelity Series International Growth Fund (b) | | 130,397,487 | 2,138,518,788 |
| Fidelity Series International Small Cap Fund (b) | | 28,191,793 | 504,633,094 |
| Fidelity Series International Value Fund (b) | | 201,985,694 | 2,124,889,501 |
| TOTAL INTERNATIONAL EQUITY FUNDS | | | |
| (Cost $5,833,211,429) | | | 7,087,901,372 |
|
| Bond Funds - 6.8% | | | |
| Fidelity Series Emerging Markets Debt Fund (b) | | 14,522,240 | 138,396,945 |
| Fidelity Series Floating Rate High Income Fund (b) | | 5,213,336 | 49,630,963 |
| Fidelity Series High Income Fund (b) | | 31,434,469 | 302,085,249 |
| Fidelity Series Inflation-Protected Bond Index Fund (b) | | 7,166,130 | 69,583,120 |
| Fidelity Series International Credit Fund (b) | | 976,302 | 9,597,049 |
| Fidelity Series Investment Grade Bond Fund (b) | | 9,401,599 | 102,383,409 |
| Fidelity Series Long-Term Treasury Bond Index Fund (b) | | 97,224,848 | 801,132,751 |
| Fidelity Series Real Estate Income Fund (b) | | 9,264,875 | 99,875,358 |
| TOTAL BOND FUNDS | | | |
| (Cost $1,618,063,599) | | | 1,572,684,844 |
|
| Short-Term Funds - 2.0% | | | |
| Fidelity Cash Central Fund, 2.11% (c) | | 37,819,990 | 37,827,554 |
| Fidelity Series Government Money Market Fund 2.12% (b)(d) | | 340,006,298 | 340,006,298 |
| Fidelity Series Short-Term Credit Fund (b) | | 7,287,247 | 71,852,258 |
| TOTAL SHORT-TERM FUNDS | | | |
| (Cost $450,381,363) | | | 449,686,110 |
| TOTAL INVESTMENT IN SECURITIES - 100.1% | | | |
| (Cost $18,298,415,726) | | | 23,087,059,821 |
| NET OTHER ASSETS (LIABILITIES) - (0.1)% | | | (13,477,224) |
| NET ASSETS - 100% | | | $23,073,582,597 |
| Futures Contracts | | | | | |
| | Number of contracts | Expiration Date | Notional Amount | Value | Unrealized Appreciation/(Depreciation) |
| Purchased | | | | | |
| Equity Index Contracts | | | | | |
| CME E-mini S&P 500 Index Contracts (United States) | 892 | Dec. 2018 | $130,187,400 | $25,254 | $25,254 |
| ICE E-mini MSCI Emerging Markets Index Contracts (United States) | 1,348 | Dec. 2018 | 70,749,780 | 1,391,164 | 1,391,164 |
|
| TOTAL PURCHASED | | | | | 1,416,418 |
|
| Sold | | | | | |
| Equity Index Contracts | | | | | |
| ICE E-mini MSCI EAFE Index Contracts (United States) | 579 | Dec. 2018 | 57,190,725 | (109,951) | (109,951) |
| TOTAL FUTURES CONTRACTS | | | | | $1,306,467 |
The notional amount of futures purchased as a percentage of Net Assets is 0.9%
The notional amount of futures sold as a percentage of Net Assets is 0.2%
Legend
(a) Security or a portion of the security was pledged to cover margin requirements for futures contracts. At period end, the value of securities pledged amounted to $4,626,926.
(b) Affiliated Fund
(c) Affiliated fund that is generally available only to investment companies and other accounts managed by Fidelity Investments. The rate quoted is the annualized seven-day yield of the fund at period end. A complete unaudited listing of the fund's holdings as of its most recent quarter end is available upon request. In addition, each Fidelity Central Fund's financial statements are available on the SEC's website or upon request.
(d) The rate quoted is the annualized seven-day yield of the fund at period end.
Affiliated Central Funds
Information regarding fiscal year to date income earned by the Fund from investments in Fidelity Central Funds is as follows:
| Fund | Income earned |
| Fidelity Cash Central Fund | $108,550 |
| Total | $108,550 |
Amounts in the income column in the above table include any capital gain distributions from underlying funds, which are presented in the corresponding line-item in the Statement of Operations if applicable.
Affiliated Underlying Funds
Fiscal year to date information regarding the Fund's investments in affiliated Underlying Funds, excluding any Money Market Central Funds, is presented below. Exchanges between classes of the same affiliated Underlying Funds may occur.
| Affiliate | Value, beginning of period | Purchases | Sales Proceeds | Dividend Income | Realized Gain (loss) | Change in Unrealized appreciation (depreciation) | Value, end of period |
| Fidelity Series 100 Index Fund | $443,201,000 | $27,501 | $474,621,171 | $-- | $177,785,602 | $(146,392,932) | $-- |
| Fidelity Series All-Sector Equity Fund | 852,293,455 | 24,197,249 | 374,915,415 | -- | 31,443,706 | 64,981,608 | 598,000,603 |
| Fidelity Series Blue Chip Growth Fund | 880,936,658 | 117,426,287 | 68,058,169 | 92,264,868 | 7,111,070 | 57,855,696 | 995,271,542 |
| Fidelity Series Canada Fund | 196,369,345 | 6,501,630 | 8,450,552 | -- | 88,964 | 12,125,970 | 206,635,357 |
| Fidelity Series Commodity Strategy Fund | 466,509,085 | 77,353,445 | 17,904,068 | 29,095,323 | (1,935,730) | (37,432,066) | 486,590,666 |
| Fidelity Series Emerging Markets Debt Fund | 144,474,691 | 8,021,063 | 6,181,522 | 4,243,910 | (293,676) | (7,623,611) | 138,396,945 |
| Fidelity Series Emerging Markets Fund | -- | 129,520,127 | -- | -- | -- | 1,699,902 | 131,220,029 |
| Fidelity Series Emerging Markets Opportunities Fund | 2,040,911,915 | 294,103,418 | 93,230,305 | -- | 9,288,341 | (269,068,766) | 1,982,004,603 |
| Fidelity Series Floating Rate High Income Fund | 48,961,247 | 2,892,013 | 2,273,354 | 1,318,733 | (76,825) | 127,882 | 49,630,963 |
| Fidelity Series Government Money Market Fund 2.12% | 359,251,220 | 335,374,530 | 354,619,452 | 2,952,239 | -- | -- | 340,006,298 |
| Fidelity Series Growth Company Fund | 1,792,770,541 | 50,554,267 | 99,878,731 | -- | 5,854,361 | 261,307,439 | 2,010,607,877 |
| Fidelity Series High Income Fund | 309,170,419 | 16,972,033 | 26,552,474 | 8,855,688 | (920,483) | 3,415,754 | 302,085,249 |
| Fidelity Series Inflation-Protected Bond Index Fund | 179,663,816 | 17,824,120 | 128,620,481 | 268,259 | (1,799,563) | 2,515,228 | 69,583,120 |
| Fidelity Series International Credit Fund | 9,784,897 | 121,452 | 210,862 | 120,588 | (2,839) | (95,599) | 9,597,049 |
| Fidelity Series International Growth Fund | 1,977,736,139 | 205,266,391 | 75,652,385 | -- | 556,482 | 30,612,161 | 2,138,518,788 |
| Fidelity Series International Small Cap Fund | 493,473,677 | 39,166,053 | 8,672,381 | -- | (190,415) | (19,143,840) | 504,633,094 |
| Fidelity Series International Value Fund | 2,001,758,300 | 156,532,720 | 28,980,633 | -- | (441,746) | (3,979,140) | 2,124,889,501 |
| Fidelity Series Intrinsic Opportunities Fund | 2,182,350,576 | 172,205,101 | 72,183,411 | 102,232,148 | (722,382) | 33,695,019 | 2,315,344,903 |
| Fidelity Series Investment Grade Bond Fund | 106,425,476 | 8,154,992 | 10,972,404 | 1,464,336 | (228,115) | (996,540) | 102,383,409 |
| Fidelity Series Large Cap Stock Fund | 1,927,084,035 | 184,317,739 | 96,464,157 | 123,283,869 | 3,084,014 | 90,033,475 | 2,108,055,106 |
| Fidelity Series Large Cap Value Index Fund | 549,397,749 | 16,102,234 | 26,742,399 | -- | 237,872 | 38,382,936 | 577,378,392 |
| Fidelity Series Long-Term Treasury Bond Index Fund | 501,632,815 | 510,802,067 | 184,480,090 | 10,136,286 | (6,059,591) | (20,762,450) | 801,132,751 |
| Fidelity Series Opportunistic Insights Fund | 965,411,695 | 28,548,166 | 48,692,488 | -- | 1,973,431 | 123,704,148 | 1,070,944,952 |
| Fidelity Series Real Estate Equity Fund | 176,406,153 | 1,945,989 | 185,854,727 | 1,804,383 | 8,722,617 | (1,220,032) | -- |
| Fidelity Series Real Estate Income Fund | 96,629,351 | 7,170,921 | 4,513,145 | 4,212,008 | (60,648) | 648,879 | 99,875,358 |
| Fidelity Series Short-Term Credit Fund | 65,675,427 | 9,328,493 | 3,151,127 | 756,431 | (20,266) | 19,731 | 71,852,258 |
| Fidelity Series Small Cap Discovery Fund | 257,910,452 | 23,251,638 | 12,711,314 | 15,566,375 | (208,305) | (3,522,291) | 264,720,180 |
| Fidelity Series Small Cap Opportunities Fund | 796,470,742 | 90,162,268 | 44,855,532 | 66,836,804 | 2,311,957 | 21,797,876 | 865,887,311 |
| Fidelity Series Stock Selector Large Cap Value Fund | 1,499,209,905 | 44,063,467 | 85,412,611 | -- | (1,027,241) | 104,419,749 | 1,561,253,269 |
| Fidelity Series Value Discovery Fund | 1,063,662,736 | 32,345,134 | 51,751,101 | -- | (309,483) | 62,703,814 | 1,106,651,100 |
| | $22,385,533,517 | $2,610,252,508 | $2,596,606,461 | $465,412,248 | $234,161,109 | $399,810,000 | $23,033,150,673 |
Amounts in the income column in the above table include any capital gain distributions from underlying funds, which are presented in the corresponding line-item in the Statement of Operations if applicable.
Investment Valuation
The following is a summary of the inputs used, as of September 30, 2018, involving the Fund's assets and liabilities carried at fair value. The inputs or methodology used for valuing securities may not be an indication of the risk associated with investing in those securities. For more information on valuation inputs, and their aggregation into the levels used below, please refer to the Investment Valuation section in the accompanying Notes to Financial Statements.
| | Valuation Inputs at Reporting Date: |
| Description | Total | Level 1 | Level 2 | Level 3 |
| Investments in Securities: | | | | |
| Other Short-Term Investments | $16,081,594 | $-- | $16,081,594 | $-- |
| Domestic Equity Funds | 13,960,705,901 | 13,960,705,901 | -- | -- |
| International Equity Funds | 7,087,901,372 | 7,087,901,372 | -- | -- |
| Bond Funds | 1,572,684,844 | 1,572,684,844 | -- | -- |
| Short-Term Funds | 449,686,110 | 449,686,110 | -- | -- |
| Total Investments in Securities: | $23,087,059,821 | $23,070,978,227 | $16,081,594 | $-- |
| Derivative Instruments: | | | | |
| Assets | | | | |
| Futures Contracts | $1,416,418 | $1,416,418 | $-- | $-- |
| Total Assets | $1,416,418 | $1,416,418 | $-- | $-- |
| Liabilities | | | | |
| Futures Contracts | $(109,951) | $(109,951) | $-- | $-- |
| Total Liabilities | $(109,951) | $(109,951) | $-- | $-- |
| Total Derivative Instruments: | $1,306,467 | $1,306,467 | $-- | $-- |
Value of Derivative Instruments
The following table is a summary of the Fund's value of derivative instruments by primary risk exposure as of September 30, 2018. For additional information on derivative instruments, please refer to the Derivative Instruments section in the accompanying Notes to Financial Statements.
| Primary Risk Exposure / Derivative Type | Value |
| | Asset | Liability |
| Equity Risk | | |
| Futures Contracts(a) | $1,416,418 | $(109,951) |
| Total Equity Risk | 1,416,418 | (109,951) |
| Total Value of Derivatives | $1,416,418 | $(109,951) |
(a) Reflects gross cumulative appreciation (depreciation) on futures contracts as presented in the Schedule of Investments. In the Statement of Assets and Liabilities, the period end daily variation margin is included in receivable or payable for daily variation margin on futures contracts, and the net cumulative appreciation (depreciation) is included in net unrealized appreciation (depreciation).
See accompanying notes which are an integral part of the financial statements.
Fidelity Freedom® 2040 Fund
Financial Statements
Statement of Assets and Liabilities
| | | September 30, 2018 (Unaudited) |
| Assets | | |
Investment in securities, at value — See accompanying schedule:
Unaffiliated issuers (cost $16,082,704) | $16,081,594 | |
| Fidelity Central Funds (cost $37,827,554) | 37,827,554 | |
| Other affiliated issuers (cost $18,244,505,468) | 23,033,150,673 | |
| Total Investment in Securities (cost $18,298,415,726) | | $23,087,059,821 |
| Receivable for investments sold | | 248,367,537 |
| Receivable for fund shares sold | | 486,204,460 |
| Distributions receivable from Fidelity Central Funds | | 57,793 |
| Total assets | | 23,821,689,611 |
| Liabilities | | |
| Payable for investments purchased | $258,377,839 | |
| Payable for fund shares redeemed | 476,105,038 | |
| Accrued management fee | 12,873,523 | |
| Payable for daily variation margin on futures contracts | 750,614 | |
| Total liabilities | | 748,107,014 |
| Net Assets | | $23,073,582,597 |
| Net Assets consist of: | | |
| Paid in capital | | $17,714,232,439 |
| Undistributed net investment income | | 46,346,812 |
| Accumulated undistributed net realized gain (loss) on investments | | 523,052,784 |
| Net unrealized appreciation (depreciation) on investments | | 4,789,950,562 |
| Net Assets | | $23,073,582,597 |
| Fidelity Freedom 2040 Fund: | | |
| Net Asset Value, offering price and redemption price per share ($8,675,308,806 ÷ 799,343,174 shares) | | $10.85 |
| Class K: | | |
| Net Asset Value, offering price and redemption price per share ($12,883,091,744 ÷ 1,187,775,379 shares) | | $10.85 |
| Class K6: | | |
| Net Asset Value, offering price and redemption price per share ($1,515,182,047 ÷ 139,638,273 shares) | | $10.85 |
See accompanying notes which are an integral part of the financial statements.
Statement of Operations
| | | Six months ended September 30, 2018 (Unaudited) |
| Investment Income | | |
| Dividends: | | |
| Affiliated issuers | | $123,622,532 |
| Interest | | 89,185 |
| Income from Fidelity Central Funds | | 108,550 |
| Total income | | 123,820,267 |
| Expenses | | |
| Management fee | $77,418,111 | |
| Independent trustees' fees and expenses | 55,344 | |
| Total expenses | | 77,473,455 |
| Net investment income (loss) | | 46,346,812 |
| Realized and Unrealized Gain (Loss) | | |
| Net realized gain (loss) on: | | |
| Investment securities: | | |
| Fidelity Central Funds | 64 | |
| Other affiliated issuers | 234,161,109 | |
| Futures contracts | (11,626,230) | |
| Capital gain distributions from underlying funds: | | |
| Affiliated issuers | 341,789,716 | |
| Total net realized gain (loss) | | 564,324,659 |
| Change in net unrealized appreciation (depreciation) on: | | |
| Investment securities: | | |
| Unaffiliated issuers | (1,110) | |
| Affiliated issuers | 399,810,000 | |
| Futures contracts | 1,306,467 | |
| Total change in net unrealized appreciation (depreciation) | | 401,115,357 |
| Net gain (loss) | | 965,440,016 |
| Net increase (decrease) in net assets resulting from operations | | $1,011,786,828 |
See accompanying notes which are an integral part of the financial statements.
Statement of Changes in Net Assets
| | Six months ended September 30, 2018 (Unaudited) | Year ended March 31, 2018 |
| Increase (Decrease) in Net Assets | | |
| Operations | | |
| Net investment income (loss) | $46,346,812 | $241,539,734 |
| Net realized gain (loss) | 564,324,659 | 1,033,195,358 |
| Change in net unrealized appreciation (depreciation) | 401,115,357 | 685,250,223 |
| Net increase (decrease) in net assets resulting from operations | 1,011,786,828 | 1,959,985,315 |
| Distributions to shareholders from net investment income | – | (266,263,160) |
| Distributions to shareholders from net realized gain | (621,028,991) | (509,942,580) |
| Total distributions | (621,028,991) | (776,205,740) |
| Share transactions - net increase (decrease) | 310,072,638 | 13,924,513,839 |
| Total increase (decrease) in net assets | 700,830,475 | 15,108,293,414 |
| Net Assets | | |
| Beginning of period | 22,372,752,122 | 7,264,458,708 |
| End of period | $23,073,582,597 | $22,372,752,122 |
| Other Information | | |
| Undistributed net investment income end of period | $46,346,812 | $– |
See accompanying notes which are an integral part of the financial statements.
Financial Highlights
Fidelity Freedom 2040 Fund
| | Six months ended (Unaudited) September 30, | Years endedMarch 31, | | | | |
| | 2018 | 2018 | 2017 | 2016 | 2015 | 2014 |
| Selected Per–Share Data | | | | | �� | |
| Net asset value, beginning of period | $10.67 | $9.74 | $8.75 | $9.63 | $9.62 | $8.78 |
| Income from Investment Operations | | | | | | |
| Net investment income (loss)A | .02 | .11 | .13 | .13 | .15 | .13 |
| Net realized and unrealized gain (loss) | .45 | 1.29 | 1.24 | (.46) | .57 | 1.17 |
| Total from investment operations | .47 | 1.40 | 1.37 | (.33) | .72 | 1.30 |
| Distributions from net investment income | – | (.12) | (.13) | (.14) | (.16) | (.13) |
| Distributions from net realized gain | (.29) | (.35) | (.24) | (.41) | (.55) | (.33) |
| Total distributions | (.29) | (.47) | (.38)B | (.55) | (.71) | (.46) |
| Net asset value, end of period | $10.85 | $10.67 | $9.74 | $8.75 | $9.63 | $9.62 |
| Total ReturnC,D | 4.48% | 14.52% | 16.14% | (3.62)% | 7.86% | 15.08% |
| Ratios to Average Net AssetsE,F | | | | | | |
| Expenses before reductions | .75%G | .63%H | - %I | - %I | - %I | - %I |
| Expenses net of fee waivers, if any | .75%G | .63%H | -% | -% | -% | -% |
| Expenses net of all reductions | .75%G | .63%H | -% | -% | -% | -% |
| Net investment income (loss) | .34%G | 1.04% | 1.44% | 1.47% | 1.61% | 1.40% |
| Supplemental Data | | | | | | |
| Net assets, end of period (000 omitted) | $8,675,309 | $8,285,660 | $7,264,459 | $6,388,566 | $6,901,191 | $7,016,128 |
| Portfolio turnover rateF | 23%G | 16%J | 15% | 16% | 17% | 49% |
A Calculated based on average shares outstanding during the period.
B Total distributions of $.38 per share is comprised of distributions from net investment income of $.132 and distributions from net realized gain of $.244 per share.
C Total returns for periods of less than one year are not annualized.
D Total returns would have been lower if certain expenses had not been reduced during the applicable periods shown.
E Expense ratios reflect operating expenses of the class. Expenses before reductions do not reflect amounts reimbursed by the investment adviser or reductions from expense offset arrangements and do not represent the amount paid by the class during periods when reimbursements or reductions occur. Expenses net of fee waivers reflect expenses after reimbursement by the investment adviser but prior to reductions from expense offset arrangements. Expenses net of all reductions represent the net expenses paid by the class but do not include expenses of the underlying funds in which the Fund invests.
F Amounts do not include the activity of the Underlying Funds.
G Annualized
H On certain classes, the size and fluctuation of net assets and expense amounts may cause ratios to differ from contractual rates.
I Amount represents less than $.005 per share.
J The portfolio turnover rate does not include the assets acquired in the merger.
See accompanying notes which are an integral part of the financial statements.
Fidelity Freedom 2040 Fund Class K
| | Six months ended (Unaudited) September 30, | Years endedMarch 31, |
| | 2018 | 2018 A |
| Selected Per–Share Data | | |
| Net asset value, beginning of period | $10.66 | $10.25 |
| Income from Investment Operations | | |
| Net investment income (loss)B | .02 | .15 |
| Net realized and unrealized gain (loss) | .46 | .59 |
| Total from investment operations | .48 | .74 |
| Distributions from net investment income | – | (.14) |
| Distributions from net realized gain | (.29) | (.19) |
| Total distributions | (.29) | (.33) |
| Net asset value, end of period | $10.85 | $10.66 |
| Total ReturnC,D | 4.59% | 7.21% |
| Ratios to Average Net AssetsE,F | | |
| Expenses before reductions | .64%G | .65%G,H |
| Expenses net of fee waivers, if any | .64%G | .65%G,H |
| Expenses net of all reductions | .64%G | .65%G,H |
| Net investment income (loss) | .44%G | 2.06%G |
| Supplemental Data | | |
| Net assets, end of period (000 omitted) | $12,883,092 | $13,434,642 |
| Portfolio turnover rateF | 23%G | 16%I |
A For the period July 20, 2017 (commencement of sale of shares) to March 31, 2018.
B Calculated based on average shares outstanding during the period.
C Total returns for periods of less than one year are not annualized.
D Total returns would have been lower if certain expenses had not been reduced during the applicable periods shown.
E Expense ratios reflect operating expenses of the class. Expenses before reductions do not reflect amounts reimbursed by the investment adviser or reductions from expense offset arrangements and do not represent the amount paid by the class during periods when reimbursements or reductions occur. Expense ratios before reductions for start-up periods may not be representative of longer-term operating periods. Expenses net of fee waivers reflect expenses after reimbursement by the investment adviser but prior to reductions from expense offset arrangements. Expenses net of all reductions represent the net expenses paid by the class but do not include expenses of the underlying funds in which the Fund invests.
F Amounts do not include the activity of the Underlying Funds.
G Annualized
H On certain classes, the size and fluctuation of net assets and expense amounts may cause ratios to differ from contractual rates.
I The portfolio turnover rate does not include the assets acquired in the merger.
See accompanying notes which are an integral part of the financial statements.
Fidelity Freedom 2040 Fund Class K6
| | Six months ended (Unaudited) September 30, | Years endedMarch 31, |
| | 2018 | 2018 A |
| Selected Per–Share Data | | |
| Net asset value, beginning of period | $10.66 | $10.03 |
| Income from Investment Operations | | |
| Net investment income (loss)B | .03 | .13 |
| Net realized and unrealized gain (loss) | .46 | .83 |
| Total from investment operations | .49 | .96 |
| Distributions from net investment income | – | (.14) |
| Distributions from net realized gain | (.30) | (.19) |
| Total distributions | (.30) | (.33) |
| Net asset value, end of period | $10.85 | $10.66 |
| Total ReturnC,D | 4.67% | 9.60% |
| Ratios to Average Net AssetsE,F | | |
| Expenses before reductions | .49%G | .50%G,H |
| Expenses net of fee waivers, if any | .49%G | .50%G,H |
| Expenses net of all reductions | .49%G | .50%G,H |
| Net investment income (loss) | .59%G | 1.55%G |
| Supplemental Data | | |
| Net assets, end of period (000 omitted) | $1,515,182 | $652,451 |
| Portfolio turnover rateF | 23%G | 16%I |
A For the period June 7, 2017 (commencement of sale of shares) to March 31, 2018.
B Calculated based on average shares outstanding during the period.
C Total returns for periods of less than one year are not annualized.
D Total returns would have been lower if certain expenses had not been reduced during the applicable periods shown.
E Expense ratios reflect operating expenses of the class. Expenses before reductions do not reflect amounts reimbursed by the investment adviser or reductions from expense offset arrangements and do not represent the amount paid by the class during periods when reimbursements or reductions occur. Expense ratios before reductions for start-up periods may not be representative of longer-term operating periods. Expenses net of fee waivers reflect expenses after reimbursement by the investment adviser but prior to reductions from expense offset arrangements. Expenses net of all reductions represent the net expenses paid by the class but do not include expenses of the underlying funds in which the Fund invests.
F Amounts do not include the activity of the Underlying Funds.
G Annualized
H On certain classes, the size and fluctuation of net assets and expense amounts may cause ratios to differ from contractual rates.
I The portfolio turnover rate does not include the assets acquired in the merger.
See accompanying notes which are an integral part of the financial statements.
Fidelity Freedom® 2045 Fund
Investment Summary (Unaudited)
The information in the following tables is based on the direct investments of the Fund.
Top Holdings as of September 30, 2018
| | % of fund's net assets |
| Fidelity Series Intrinsic Opportunities Fund | 10.0 |
| Fidelity Series International Growth Fund | 9.3 |
| Fidelity Series International Value Fund | 9.2 |
| Fidelity Series Large Cap Stock Fund | 9.2 |
| Fidelity Series Growth Company Fund | 8.7 |
| Fidelity Series Emerging Markets Opportunities Fund | 8.6 |
| Fidelity Series Stock Selector Large Cap Value Fund | 6.8 |
| Fidelity Series Value Discovery Fund | 4.8 |
| Fidelity Series Opportunistic Insights Fund | 4.6 |
| Fidelity Series Blue Chip Growth Fund | 4.3 |
| | 75.5 |
Asset Allocation (% of fund's net assets)
| Period end |
| | Domestic Equity Funds | 60.5% |
| | International Equity Funds | 30.7% |
| | Bond Funds | 6.8% |
| | Short-Term Funds | 2.0% |
| | Short-Term Investments | 0.1% |
| | Net Other Assets (Liabilities)* | (0.1)% |

* Net Other Assets (Liabilities) are not included in the pie chart
Domestic Equity Funds category includes Fidelity Series Commodity Strategy Fund which invests in commodity-related investments.
Fidelity Freedom® 2045 Fund
Schedule of Investments September 30, 2018 (Unaudited)
Showing Percentage of Net Assets
| U.S. Treasury Obligations - 0.1% | | | |
| | | Principal Amount | Value |
| U.S. Treasury Bills, yield at date of purchase 2.07% to 2.11% 11/23/18 to 12/6/18 (a) | | | |
| (Cost $9,735,283) | | 9,770,000 | 9,734,611 |
| | | Shares | Value |
|
| Domestic Equity Funds - 60.5% | | | |
| Fidelity Series All-Sector Equity Fund (b) | | 26,590,695 | $361,899,353 |
| Fidelity Series Blue Chip Growth Fund (b) | | 39,340,323 | 601,906,944 |
| Fidelity Series Commodity Strategy Fund (b) | | 58,878,930 | 294,394,650 |
| Fidelity Series Growth Company Fund (b) | | 60,165,742 | 1,215,949,643 |
| Fidelity Series Intrinsic Opportunities Fund (b) | | 75,872,561 | 1,390,744,043 |
| Fidelity Series Large Cap Stock Fund (b) | | 80,167,106 | 1,277,061,994 |
| Fidelity Series Large Cap Value Index Fund (b) | | 26,501,754 | 349,823,158 |
| Fidelity Series Opportunistic Insights Fund (b) | | 32,668,157 | 648,462,908 |
| Fidelity Series Small Cap Discovery Fund (b) | | 13,196,321 | 160,335,301 |
| Fidelity Series Small Cap Opportunities Fund (b) | | 35,672,838 | 524,033,991 |
| Fidelity Series Stock Selector Large Cap Value Fund (b) | | 71,642,465 | 947,113,392 |
| Fidelity Series Value Discovery Fund (b) | | 48,964,904 | 670,329,533 |
| TOTAL DOMESTIC EQUITY FUNDS | | | |
| (Cost $6,431,635,018) | | | 8,442,054,910 |
|
| International Equity Funds - 30.7% | | | |
| Fidelity Series Canada Fund (b) | | 11,558,671 | 124,949,235 |
| Fidelity Series Emerging Markets Fund (b) | | 8,194,082 | 79,400,651 |
| Fidelity Series Emerging Markets Opportunities Fund (b) | | 62,480,406 | 1,198,998,998 |
| Fidelity Series International Growth Fund (b) | | 78,861,334 | 1,293,325,876 |
| Fidelity Series International Small Cap Fund (b) | | 17,061,172 | 305,394,985 |
| Fidelity Series International Value Fund (b) | | 122,157,013 | 1,285,091,775 |
| TOTAL INTERNATIONAL EQUITY FUNDS | | | |
| (Cost $3,585,281,459) | | | 4,287,161,520 |
|
| Bond Funds - 6.8% | | | |
| Fidelity Series Emerging Markets Debt Fund (b) | | 8,666,418 | 82,590,966 |
| Fidelity Series Floating Rate High Income Fund (b) | | 3,193,051 | 30,397,841 |
| Fidelity Series High Income Fund (b) | | 18,962,277 | 182,227,485 |
| Fidelity Series Inflation-Protected Bond Index Fund (b) | | 4,333,400 | 42,077,311 |
| Fidelity Series International Credit Fund (b) | | 580,874 | 5,709,994 |
| Fidelity Series Investment Grade Bond Fund (b) | | 5,685,095 | 61,910,683 |
| Fidelity Series Long-Term Treasury Bond Index Fund (b) | | 58,781,722 | 484,361,389 |
| Fidelity Series Real Estate Income Fund (b) | | 5,527,798 | 59,589,661 |
| TOTAL BOND FUNDS | | | |
| (Cost $974,494,789) | | | 948,865,330 |
|
| Short-Term Funds - 2.0% | | | |
| Fidelity Cash Central Fund, 2.11% (c) | | 22,418,427 | 22,422,911 |
| Fidelity Series Government Money Market Fund 2.12% (b)(d) | | 206,170,237 | 206,170,237 |
| Fidelity Series Short-Term Credit Fund (b) | | 4,445,351 | 43,831,163 |
| TOTAL SHORT-TERM FUNDS | | | |
| (Cost $272,833,074) | | | 272,424,311 |
| TOTAL INVESTMENT IN SECURITIES - 100.1% | | | |
| (Cost $11,273,979,623) | | | 13,960,240,682 |
| NET OTHER ASSETS (LIABILITIES) - (0.1)% | | | (8,051,180) |
| NET ASSETS - 100% | | | $13,952,189,502 |
| Futures Contracts | | | | | |
| | Number of contracts | Expiration Date | Notional Amount | Value | Unrealized Appreciation/(Depreciation) |
| Purchased | | | | | |
| Equity Index Contracts | | | | | |
| CME E-mini S&P 500 Index Contracts (United States) | 538 | Dec. 2018 | $78,521,100 | $15,232 | $15,232 |
| ICE E-mini MSCI Emerging Markets Index Contracts (United States) | 805 | Dec. 2018 | 42,250,425 | 831,292 | 831,291 |
|
| TOTAL PURCHASED | | | | | 846,523 |
|
| Sold | | | | | |
| Equity Index Contracts | | | | | |
| ICE E-mini MSCI EAFE Index Contracts (United States) | 357 | Dec. 2018 | 35,262,675 | (65,996) | (65,996) |
| TOTAL FUTURES CONTRACTS | | | | | $780,527 |
The notional amount of futures purchased as a percentage of Net Assets is 0.9%
The notional amount of futures sold as a percentage of Net Assets is 0.3%
Legend
(a) Security or a portion of the security was pledged to cover margin requirements for futures contracts. At period end, the value of securities pledged amounted to $3,063,229.
(b) Affiliated Fund
(c) Affiliated fund that is generally available only to investment companies and other accounts managed by Fidelity Investments. The rate quoted is the annualized seven-day yield of the fund at period end. A complete unaudited listing of the fund's holdings as of its most recent quarter end is available upon request. In addition, each Fidelity Central Fund's financial statements are available on the SEC's website or upon request.
(d) The rate quoted is the annualized seven-day yield of the fund at period end.
Affiliated Central Funds
Information regarding fiscal year to date income earned by the Fund from investments in Fidelity Central Funds is as follows:
| Fund | Income earned |
| Fidelity Cash Central Fund | $64,023 |
| Total | $64,023 |
Amounts in the income column in the above table include any capital gain distributions from underlying funds, which are presented in the corresponding line-item in the Statement of Operations if applicable.
Affiliated Underlying Funds
Fiscal year to date information regarding the Fund's investments in affiliated Underlying Funds, excluding any Money Market Central Funds, is presented below. Exchanges between classes of the same affiliated Underlying Funds may occur.
| Affiliate | Value, beginning of period | Purchases | Sales Proceeds | Dividend Income | Realized Gain (loss) | Change in Unrealized appreciation (depreciation) | Value, end of period |
| Fidelity Series 100 Index Fund | $263,182,195 | $35,408 | $281,858,315 | $-- | $118,503,464 | $(99,862,752) | $-- |
| Fidelity Series All-Sector Equity Fund | 507,057,960 | 24,353,815 | 227,413,942 | -- | 18,530,840 | 39,370,680 | 361,899,353 |
| Fidelity Series Blue Chip Growth Fund | 524,034,296 | 81,496,149 | 42,346,463 | 55,573,624 | 3,493,846 | 35,229,116 | 601,906,944 |
| Fidelity Series Canada Fund | 116,819,435 | 6,299,081 | 5,482,303 | -- | 71,714 | 7,241,308 | 124,949,235 |
| Fidelity Series Commodity Strategy Fund | 278,070,063 | 51,506,286 | 11,487,190 | 17,538,017 | (3,602,850) | (20,091,659) | 294,394,650 |
| Fidelity Series Emerging Markets Debt Fund | 84,775,451 | 6,393,438 | 3,923,165 | 2,511,531 | (224,211) | (4,430,547) | 82,590,966 |
| Fidelity Series Emerging Markets Fund | -- | 78,363,361 | -- | -- | -- | 1,037,290 | 79,400,651 |
| Fidelity Series Emerging Markets | 1,214,195,749 | 188,564,627 | 48,629,828 | -- | 3,819,543 | (158,951,093) | 1,198,998,998 |
| Fidelity Series Floating Rate High Income | 29,413,979 | 2,417,035 | 1,464,882 | 800,443 | (17,991) | 49,700 | 30,397,841 |
| Fidelity Series Government Money Market | 212,944,275 | 206,857,434 | 213,631,472 | 1,768,652 | -- | -- | 206,170,237 |
| Fidelity Series Growth Company Fund | 1,066,317,020 | 52,635,966 | 63,084,957 | -- | 2,632,734 | 157,448,880 | 1,215,949,643 |
| Fidelity Series High Income Fund | 182,802,662 | 13,621,170 | 15,687,741 | 5,292,179 | (529,000) | 2,020,394 | 182,227,485 |
| Fidelity Series Inflation-Protected Bond | 107,538,333 | 12,390,610 | 78,265,538 | 161,549 | (1,138,569) | 1,552,475 | 42,077,311 |
| Fidelity Series International Credit Fund | 5,867,034 | 73,386 | 171,403 | 72,304 | (2,180) | (56,843) | 5,709,994 |
| Fidelity Series International Growth Fund | 1,176,177,691 | 146,185,242 | 47,854,051 | -- | 315,125 | 18,501,869 | 1,293,325,876 |
| Fidelity Series International Small Cap Fund | 293,469,300 | 27,090,346 | 3,600,391 | -- | (84,294) | (11,479,976) | 305,394,985 |
| Fidelity Series International Value Fund | 1,190,569,587 | 110,110,678 | 13,284,283 | -- | (231,909) | (2,072,298) | 1,285,091,775 |
| Fidelity Series Intrinsic Opportunities Fund | 1,296,043,058 | 130,912,741 | 55,737,519 | 61,226,029 | (316,164) | 19,841,927 | 1,390,744,043 |
| Fidelity Series Investment Grade Bond Fund | 63,493,715 | 6,095,948 | 6,945,249 | 876,834 | (125,745) | (607,986) | 61,910,683 |
| Fidelity Series Large Cap Stock Fund | 1,146,756,357 | 134,528,542 | 60,233,607 | 73,856,655 | 1,837,134 | 54,173,568 | 1,277,061,994 |
| Fidelity Series Large Cap Value Index Fund | 326,476,656 | 16,808,742 | 16,647,296 | -- | 178,547 | 23,006,509 | 349,823,158 |
| Fidelity Series Long-Term Treasury Bond | 298,749,888 | 313,580,010 | 111,834,803 | 6,088,342 | (3,635,195) | (12,498,511) | 484,361,389 |
| Fidelity Series Opportunistic Insights Fund | 574,264,670 | 29,391,946 | 30,526,169 | -- | 968,168 | 74,364,293 | 648,462,908 |
| Fidelity Series Real Estate Equity Fund | 104,846,888 | 1,163,810 | 110,503,750 | 1,022,178 | 2,026,500 | 2,466,552 | -- |
| Fidelity Series Real Estate Income Fund | 56,559,805 | 5,536,640 | 2,846,803 | 2,495,998 | (45,685) | 385,704 | 59,589,661 |
| Fidelity Series Short-Term Credit Fund | 39,780,377 | 6,044,691 | 1,993,471 | 463,472 | (18,313) | 17,879 | 43,831,163 |
| Fidelity Series Small Cap Discovery Fund | 153,285,060 | 17,243,463 | 7,896,625 | 9,343,718 | (199,374) | (2,097,223) | 160,335,301 |
| Fidelity Series Small Cap Opportunities Fund | 473,946,400 | 64,311,717 | 28,349,478 | 40,284,725 | 1,187,258 | 12,938,094 | 524,033,991 |
| Fidelity Series Stock Selector Large Cap | 892,343,372 | 45,059,942 | 52,400,911 | -- | (838,495) | 62,949,484 | 947,113,392 |
| Fidelity Series Value Discovery Fund | 633,054,295 | 32,049,251 | 32,196,070 | -- | (234,814) | 37,656,871 | 670,329,533 |
| | 13,312,835,571 | 1,811,121,475 | 1,576,297,675 | 279,376,250 | 142,320,084 | 238,103,705 | 13,928,083,160 |
Amounts in the income column in the above table include any capital gain distributions from underlying funds, which are presented in the corresponding line-item in the Statement of Operations if applicable.
Investment Valuation
The following is a summary of the inputs used, as of September 30, 2018, involving the Fund's assets and liabilities carried at fair value. The inputs or methodology used for valuing securities may not be an indication of the risk associated with investing in those securities. For more information on valuation inputs, and their aggregation into the levels used below, please refer to the Investment Valuation section in the accompanying Notes to Financial Statements.
| | Valuation Inputs at Reporting Date: |
| Description | Total | Level 1 | Level 2 | Level 3 |
| Investments in Securities: | | | | |
| Other Short-Term Investments | $9,734,611 | $-- | $9,734,611 | $-- |
| Domestic Equity Funds | 8,442,054,910 | 8,442,054,910 | -- | -- |
| International Equity Funds | 4,287,161,520 | 4,287,161,520 | -- | -- |
| Bond Funds | 948,865,330 | 948,865,330 | -- | -- |
| Short-Term Funds | 272,424,311 | 272,424,311 | -- | -- |
| Total Investments in Securities: | $13,960,240,682 | $13,950,506,071 | $9,734,611 | $-- |
| Derivative Instruments: | | | | |
| Assets | | | | |
| Futures Contracts | $846,523 | $846,523 | $-- | $-- |
| Total Assets | $846,523 | $846,523 | $-- | $-- |
| Liabilities | | | | |
| Futures Contracts | $(65,996) | $(65,996) | $-- | $-- |
| Total Liabilities | $(65,996) | $(65,996) | $-- | $-- |
| Total Derivative Instruments: | $780,527 | $780,527 | $-- | $-- |
Value of Derivative Instruments
The following table is a summary of the Fund's value of derivative instruments by primary risk exposure as of September 30, 2018. For additional information on derivative instruments, please refer to the Derivative Instruments section in the accompanying Notes to Financial Statements.
| Primary Risk Exposure / Derivative Type | Value |
| | Asset | Liability |
| Equity Risk | | |
| Futures Contracts(a) | $846,523 | $(65,996) |
| Total Equity Risk | 846,523 | (65,996) |
| Total Value of Derivatives | $846,523 | $(65,996) |
(a) Reflects gross cumulative appreciation (depreciation) on futures contracts as presented in the Schedule of Investments. In the Statement of Assets and Liabilities, the period end daily variation margin is included in receivable or payable for daily variation margin on futures contracts, and the net cumulative appreciation (depreciation) is included in net unrealized appreciation (depreciation).
See accompanying notes which are an integral part of the financial statements.
Fidelity Freedom® 2045 Fund
Financial Statements
Statement of Assets and Liabilities
| | | September 30, 2018 (Unaudited) |
| Assets | | |
Investment in securities, at value — See accompanying schedule:
Unaffiliated issuers (cost $9,735,283) | $9,734,611 | |
| Fidelity Central Funds (cost $22,422,911) | 22,422,911 | |
| Other affiliated issuers (cost $11,241,821,429) | 13,928,083,160 | |
| Total Investment in Securities (cost $11,273,979,623) | | $13,960,240,682 |
| Receivable for investments sold | | 151,576,786 |
| Receivable for fund shares sold | | 427,176,820 |
| Distributions receivable from Fidelity Central Funds | | 34,252 |
| Total assets | | 14,539,028,540 |
| Liabilities | | |
| Payable for investments purchased | $167,584,241 | |
| Payable for fund shares redeemed | 411,118,337 | |
| Accrued management fee | 7,686,377 | |
| Payable for daily variation margin on futures contracts | 450,083 | |
| Total liabilities | | 586,839,038 |
| Net Assets | | $13,952,189,502 |
| Net Assets consist of: | | |
| Paid in capital | | $10,919,127,495 |
| Undistributed net investment income | | 28,158,063 |
| Accumulated undistributed net realized gain (loss) on investments | | 317,862,358 |
| Net unrealized appreciation (depreciation) on investments | | 2,687,041,586 |
| Net Assets | | $13,952,189,502 |
| Fidelity Freedom 2045 Fund: | | |
| Net Asset Value, offering price and redemption price per share ($4,406,664,525 ÷ 357,974,618 shares) | | $12.31 |
| Class K: | | |
| Net Asset Value, offering price and redemption price per share ($8,465,002,997 ÷ 688,288,075 shares) | | $12.30 |
| Class K6: | | |
| Net Asset Value, offering price and redemption price per share ($1,080,521,980 ÷ 87,784,470 shares) | | $12.31 |
See accompanying notes which are an integral part of the financial statements.
Statement of Operations
| | | Six months ended September 30, 2018 (Unaudited) |
| Investment Income | | |
| Dividends: | | |
| Affiliated issuers | | $74,110,475 |
| Interest | | 53,658 |
| Income from Fidelity Central Funds | | 64,023 |
| Total income | | 74,228,156 |
| Expenses | | |
| Management fee | $46,037,061 | |
| Independent trustees' fees and expenses | 33,061 | |
| Total expenses before reductions | 46,070,122 | |
| Expense reductions | (29) | |
| Total expenses after reductions | | 46,070,093 |
| Net investment income (loss) | | 28,158,063 |
| Realized and Unrealized Gain (Loss) | | |
| Net realized gain (loss) on: | | |
| Investment securities: | | |
| Fidelity Central Funds | 38 | |
| Other affiliated issuers | 142,320,084 | |
| Futures contracts | (6,976,326) | |
| Capital gain distributions from underlying funds: | | |
| Affiliated issuers | 205,265,775 | |
| Total net realized gain (loss) | | 340,609,571 |
| Change in net unrealized appreciation (depreciation) on: | | |
| Investment securities: | | |
| Unaffiliated issuers | (672) | |
| Affiliated issuers | 238,103,705 | |
| Futures contracts | 780,527 | |
| Total change in net unrealized appreciation (depreciation) | | 238,883,560 |
| Net gain (loss) | | 579,493,131 |
| Net increase (decrease) in net assets resulting from operations | | $607,651,194 |
See accompanying notes which are an integral part of the financial statements.
Statement of Changes in Net Assets
| | Six months ended September 30, 2018 (Unaudited) | Year ended March 31, 2018 |
| Increase (Decrease) in Net Assets | | |
| Operations | | |
| Net investment income (loss) | $28,158,063 | $142,234,368 |
| Net realized gain (loss) | 340,609,571 | 576,736,884 |
| Change in net unrealized appreciation (depreciation) | 238,883,560 | 374,497,649 |
| Net increase (decrease) in net assets resulting from operations | 607,651,194 | 1,093,468,901 |
| Distributions to shareholders from net investment income | – | (156,078,537) |
| Distributions to shareholders from net realized gain | (360,127,155) | (256,279,773) |
| Total distributions | (360,127,155) | (412,358,310) |
| Share transactions - net increase (decrease) | 399,339,193 | 9,128,031,725 |
| Total increase (decrease) in net assets | 646,863,232 | 9,809,142,316 |
| Net Assets | | |
| Beginning of period | 13,305,326,270 | 3,496,183,954 |
| End of period | $13,952,189,502 | $13,305,326,270 |
| Other Information | | |
| Undistributed net investment income end of period | $28,158,063 | $– |
See accompanying notes which are an integral part of the financial statements.
Financial Highlights
Fidelity Freedom 2045 Fund
| | Six months ended (Unaudited) September 30, | Years endedMarch 31, | | | | |
| | 2018 | 2018 | 2017 | 2016 | 2015 | 2014 |
| Selected Per–Share Data | | | | | | |
| Net asset value, beginning of period | $12.09 | $11.00 | $9.89 | $10.84 | $11.09 | $10.42 |
| Income from Investment Operations | | | | | | |
| Net investment income (loss)A | .02 | .12 | .15 | .15 | .17 | .15 |
| Net realized and unrealized gain (loss) | .52 | 1.46 | 1.39 | (.52) | .64 | 1.39 |
| Total from investment operations | .54 | 1.58 | 1.54 | (.37) | .81 | 1.54 |
| Distributions from net investment income | – | (.13) | (.15) | (.16) | (.18) | (.15) |
| Distributions from net realized gain | (.32) | (.35) | (.28) | (.43) | (.89) | (.72) |
| Total distributions | (.32) | (.49)B | (.43) | (.58)C | (1.06)D | (.87) |
| Net asset value, end of period | $12.31 | $12.09 | $11.00 | $9.89 | $10.84 | $11.09 |
| Total ReturnE,F | 4.53% | 14.48% | 16.08% | (3.59)% | 7.93% | 15.38% |
| Ratios to Average Net AssetsG,H | | | | | | |
| Expenses before reductions | .75%I | .63%J | - %K | - %K | - %K | - %K |
| Expenses net of fee waivers, if any | .75%I | .63%J | -% | -% | -% | -% |
| Expenses net of all reductions | .75%I | .63%J | -% | -% | -% | -% |
| Net investment income (loss) | .34%I | 1.04% | 1.45% | 1.48% | 1.62% | 1.42% |
| Supplemental Data | | | | | | |
| Net assets, end of period (000 omitted) | $4,406,665 | $4,144,152 | $3,496,184 | $2,912,972 | $2,993,926 | $2,885,106 |
| Portfolio turnover rateG | 23%I | 17%L | 15% | 17% | 21% | 53% |
A Calculated based on average shares outstanding during the period.
B Total distributions of $.49 per share is comprised of distributions from net investment income of $.134 and distributions from net realized gain of $.352 per share.
C Total distributions of $.58 per share is comprised of distributions from net investment income of $.155 and distributions from net realized gain of $.427 per share.
D Total distributions of $1.06 per share is comprised of distributions from net investment income of $.178 and distributions from net realized gain of $.886 per share.
E Total returns for periods of less than one year are not annualized.
F Total returns would have been lower if certain expenses had not been reduced during the applicable periods shown.
G Amounts do not include the activity of the Underlying Funds.
H Expense ratios reflect operating expenses of the class. Expenses before reductions do not reflect amounts reimbursed by the investment adviser or reductions from expense offset arrangements and do not represent the amount paid by the class during periods when reimbursements or reductions occur. Expenses net of fee waivers reflect expenses after reimbursement by the investment adviser but prior to reductions from expense offset arrangements. Expenses net of all reductions represent the net expenses paid by the class but do not include expenses of the underlying funds in which the Fund invests.
I Annualized
J On certain classes, the size and fluctuation of net assets and expense amounts may cause ratios to differ from contractual rates.
K Amount represents less than .005%.
L The portfolio turnover rate does not include the assets acquired in the merger.
See accompanying notes which are an integral part of the financial statements.
Fidelity Freedom 2045 Fund Class K
| | Six months ended (Unaudited) September 30, | Years endedMarch 31, |
| | 2018 | 2018 A |
| Selected Per–Share Data | | |
| Net asset value, beginning of period | $12.08 | $11.59 |
| Income from Investment Operations | | |
| Net investment income (loss)B | .03 | .17 |
| Net realized and unrealized gain (loss) | .51 | .67 |
| Total from investment operations | .54 | .84 |
| Distributions from net investment income | – | (.15) |
| Distributions from net realized gain | (.32) | (.19) |
| Total distributions | (.32) | (.35)C |
| Net asset value, end of period | $12.30 | $12.08 |
| Total ReturnD,E | 4.55% | 7.21% |
| Ratios to Average Net AssetsF,G | | |
| Expenses before reductions | .64%H | .65%H,I |
| Expenses net of fee waivers, if any | .64%H | .65%H,I |
| Expenses net of all reductions | .64%H | .65%H,I |
| Net investment income (loss) | .44%H | 2.05%H |
| Supplemental Data | | |
| Net assets, end of period (000 omitted) | $8,465,003 | $8,748,416 |
| Portfolio turnover rateF | 23%H | 17%J |
A For the period July 20, 2017 (commencement of sale of shares) to March 31, 2018.
B Calculated based on average shares outstanding during the period.
C Total distributions of $.35 per share is comprised of distributions from net investment income of $.153 and distributions from net realized gain of $.194 per share.
D Total returns for periods of less than one year are not annualized.
E Total returns would have been lower if certain expenses had not been reduced during the applicable periods shown.
F Amounts do not include the activity of the Underlying Funds.
G Expense ratios reflect operating expenses of the class. Expenses before reductions do not reflect amounts reimbursed by the investment adviser or reductions from expense offset arrangements and do not represent the amount paid by the class during periods when reimbursements or reductions occur. Expense ratios before reductions for start-up periods may not be representative of longer-term operating periods. Expenses net of fee waivers reflect expenses after reimbursement by the investment adviser but prior to reductions from expense offset arrangements. Expenses net of all reductions represent the net expenses paid by the class but do not include expenses of the underlying funds in which the Fund invests.
H Annualized
I On certain classes, the size and fluctuation of net assets and expense amounts may cause ratios to differ from contractual rates.
J The portfolio turnover rate does not include the assets acquired in the merger.
See accompanying notes which are an integral part of the financial statements.
Fidelity Freedom 2045 Fund Class K6
| | Six months ended (Unaudited) September 30, | Years endedMarch 31, |
| | 2018 | 2018 A |
| Selected Per–Share Data | | |
| Net asset value, beginning of period | $12.09 | $11.34 |
| Income from Investment Operations | | |
| Net investment income (loss)B | .04 | .14 |
| Net realized and unrealized gain (loss) | .51 | .96 |
| Total from investment operations | .55 | 1.10 |
| Distributions from net investment income | – | (.16) |
| Distributions from net realized gain | (.33) | (.19) |
| Total distributions | (.33) | (.35) |
| Net asset value, end of period | $12.31 | $12.09 |
| Total ReturnC,D | 4.61% | 9.70% |
| Ratios to Average Net AssetsE,F | | |
| Expenses before reductions | .49%G | .50%G,H |
| Expenses net of fee waivers, if any | .49%G | .50%G,H |
| Expenses net of all reductions | .49%G | .50%G,H |
| Net investment income (loss) | .59%G | 1.45%G |
| Supplemental Data | | |
| Net assets, end of period (000 omitted) | $1,080,522 | $412,758 |
| Portfolio turnover rateE | 23%G | 17%I |
A For the period June 7, 2017 (commencement of sale of shares) to March 31, 2018.
B Calculated based on average shares outstanding during the period.
C Total returns for periods of less than one year are not annualized.
D Total returns would have been lower if certain expenses had not been reduced during the applicable periods shown.
E Amounts do not include the activity of the Underlying Funds.
F Expense ratios reflect operating expenses of the class. Expenses before reductions do not reflect amounts reimbursed by the investment adviser or reductions from expense offset arrangements and do not represent the amount paid by the class during periods when reimbursements or reductions occur. Expense ratios before reductions for start-up periods may not be representative of longer-term operating periods. Expenses net of fee waivers reflect expenses after reimbursement by the investment adviser but prior to reductions from expense offset arrangements. Expenses net of all reductions represent the net expenses paid by the class but do not include expenses of the underlying funds in which the Fund invests.
G Annualized
H On certain classes, the size and fluctuation of net assets and expense amounts may cause ratios to differ from contractual rates.
I The portfolio turnover rate does not include the assets acquired in the merger.
See accompanying notes which are an integral part of the financial statements.
Fidelity Freedom® 2050 Fund
Investment Summary (Unaudited)
The information in the following tables is based on the direct investments of the Fund.
Top Holdings as of September 30, 2018
| | % of fund's net assets |
| Fidelity Series Intrinsic Opportunities Fund | 10.0 |
| Fidelity Series International Growth Fund | 9.3 |
| Fidelity Series International Value Fund | 9.2 |
| Fidelity Series Large Cap Stock Fund | 9.1 |
| Fidelity Series Growth Company Fund | 8.7 |
| Fidelity Series Emerging Markets Opportunities Fund | 8.6 |
| Fidelity Series Stock Selector Large Cap Value Fund | 6.8 |
| Fidelity Series Value Discovery Fund | 4.8 |
| Fidelity Series Opportunistic Insights Fund | 4.6 |
| Fidelity Series Blue Chip Growth Fund | 4.3 |
| | 75.4 |
Asset Allocation (% of fund's net assets)
| Period end |
| | Domestic Equity Funds | 60.5% |
| | International Equity Funds | 30.7% |
| | Bond Funds | 6.8% |
| | Short-Term Funds | 2.0% |
| | Short-Term Investments | 0.1% |
| | Net Other Assets (Liabilities)* | (0.1)% |

* Net Other Assets (Liabilities) are not included in the pie chart
Domestic Equity Funds category includes Fidelity Series Commodity Strategy Fund which invests in commodity-related investments.
Fidelity Freedom® 2050 Fund
Schedule of Investments September 30, 2018 (Unaudited)
Showing Percentage of Net Assets
| U.S. Treasury Obligations - 0.1% | | | |
| | | Principal Amount | Value |
| U.S. Treasury Bills, yield at date of purchase 2.07% to 2.11% 11/23/18 to 12/6/18 (a) | | | |
| (Cost $9,595,334) | | 9,630,000 | 9,594,688 |
| | | Shares | Value |
|
| Domestic Equity Funds - 60.5% | | | |
| Fidelity Series All-Sector Equity Fund (b) | | 22,515,292 | $306,433,123 |
| Fidelity Series Blue Chip Growth Fund (b) | | 33,464,933 | 512,013,480 |
| Fidelity Series Commodity Strategy Fund (b) | | 50,104,202 | 250,521,009 |
| Fidelity Series Growth Company Fund (b) | | 51,179,943 | 1,034,346,656 |
| Fidelity Series Intrinsic Opportunities Fund (b) | | 64,781,043 | 1,187,436,516 |
| Fidelity Series Large Cap Stock Fund (b) | | 68,157,030 | 1,085,741,494 |
| Fidelity Series Large Cap Value Index Fund (b) | | 22,542,698 | 297,563,612 |
| Fidelity Series Opportunistic Insights Fund (b) | | 27,775,224 | 551,338,197 |
| Fidelity Series Small Cap Discovery Fund (b) | | 11,221,790 | 136,344,747 |
| Fidelity Series Small Cap Opportunities Fund (b) | | 30,337,217 | 445,653,721 |
| Fidelity Series Stock Selector Large Cap Value Fund (b) | | 60,924,097 | 805,416,567 |
| Fidelity Series Value Discovery Fund (b) | | 41,636,845 | 570,008,406 |
| TOTAL DOMESTIC EQUITY FUNDS | | | |
| (Cost $5,504,813,976) | | | 7,182,817,528 |
|
| International Equity Funds - 30.7% | | | |
| Fidelity Series Canada Fund (b) | | 9,834,409 | 106,309,962 |
| Fidelity Series Emerging Markets Fund (b) | | 6,933,301 | 67,183,687 |
| Fidelity Series Emerging Markets Opportunities Fund (b) | | 53,162,111 | 1,020,180,919 |
| Fidelity Series International Growth Fund (b) | | 67,097,861 | 1,100,404,913 |
| Fidelity Series International Small Cap Fund (b) | | 14,516,948 | 259,853,377 |
| Fidelity Series International Value Fund (b) | | 103,935,372 | 1,093,400,112 |
| TOTAL INTERNATIONAL EQUITY FUNDS | | | |
| (Cost $3,060,959,152) | | | 3,647,332,970 |
|
| Bond Funds - 6.8% | | | |
| Fidelity Series Emerging Markets Debt Fund (b) | | 7,358,488 | 70,126,390 |
| Fidelity Series Floating Rate High Income Fund (b) | | 2,739,712 | 26,082,060 |
| Fidelity Series High Income Fund (b) | | 16,127,528 | 154,985,547 |
| Fidelity Series Inflation-Protected Bond Index Fund (b) | | 3,686,975 | 35,800,531 |
| Fidelity Series International Credit Fund (b) | | 491,100 | 4,827,510 |
| Fidelity Series Investment Grade Bond Fund (b) | | 4,837,109 | 52,676,120 |
| Fidelity Series Long-Term Treasury Bond Index Fund (b) | | 50,008,589 | 412,070,773 |
| Fidelity Series Real Estate Income Fund (b) | | 4,707,019 | 50,741,661 |
| TOTAL BOND FUNDS | | | |
| (Cost $829,868,479) | | | 807,310,592 |
|
| Short-Term Funds - 2.0% | | | |
| Fidelity Cash Central Fund, 2.11% (c) | | 17,576,469 | 17,579,984 |
| Fidelity Series Government Money Market Fund 2.12% (b)(d) | | 175,810,970 | 175,810,970 |
| Fidelity Series Short-Term Credit Fund (b) | | 3,784,431 | 37,314,486 |
| TOTAL SHORT-TERM FUNDS | | | |
| (Cost $231,050,030) | | | 230,705,440 |
| TOTAL INVESTMENT IN SECURITIES - 100.1% | | | |
| (Cost $9,636,286,971) | | | 11,877,761,218 |
| NET OTHER ASSETS (LIABILITIES) - (0.1)% | | | (6,842,419) |
| NET ASSETS - 100% | | | $11,870,918,799 |
| Futures Contracts | | | | | |
| | Number of contracts | Expiration Date | Notional Amount | Value | Unrealized Appreciation/(Depreciation) |
| Purchased | | | | | |
| Equity Index Contracts | | | | | |
| CME E-mini S&P 500 Index Contracts (United States) | 458 | Dec. 2018 | $66,845,100 | $12,967 | $12,967 |
| ICE E-mini MSCI Emerging Markets Index Contracts (United States) | 690 | Dec. 2018 | 36,214,650 | 713,671 | 713,671 |
|
| TOTAL PURCHASED | | | | | 726,638 |
|
| Sold | | | | | |
| Equity Index Contracts | | | | | |
| ICE E-mini MSCI EAFE Index Contracts (United States) | 304 | Dec. 2018 | 30,027,600 | (57,281) | (57,281) |
| TOTAL FUTURES CONTRACTS | | | | | $669,357 |
The notional amount of futures purchased as a percentage of Net Assets is 0.9%
The notional amount of futures sold as a percentage of Net Assets is 0.3%
Legend
(a) Security or a portion of the security was pledged to cover margin requirements for futures contracts. At period end, the value of securities pledged amounted to $2,627,720.
(b) Affiliated Fund
(c) Affiliated fund that is generally available only to investment companies and other accounts managed by Fidelity Investments. The rate quoted is the annualized seven-day yield of the fund at period end. A complete unaudited listing of the fund's holdings as of its most recent quarter end is available upon request. In addition, each Fidelity Central Fund's financial statements are available on the SEC's website or upon request.
(d) The rate quoted is the annualized seven-day yield of the fund at period end.
Affiliated Central Funds
Information regarding fiscal year to date income earned by the Fund from investments in Fidelity Central Funds is as follows:
| Fund | Income earned |
| Fidelity Cash Central Fund | $52,191 |
| Total | $52,191 |
Amounts in the income column in the above table include any capital gain distributions from underlying funds, which are presented in the corresponding line-item in the Statement of Operations if applicable.
Affiliated Underlying Funds
Fiscal year to date information regarding the Fund's investments in affiliated Underlying Funds, excluding any Money Market Central Funds, is presented below. Exchanges between classes of the same affiliated Underlying Funds may occur.
| Affiliate | Value, beginning of period | Purchases | Sales Proceeds | Dividend Income | Realized Gain (loss) | Change in Unrealized appreciation (depreciation) | Value, end of period |
| Fidelity Series 100 Index Fund | $222,464,053 | $56,827 | $238,274,425 | $-- | $97,847,141 | $(82,093,596) | $-- |
| Fidelity Series All-Sector Equity Fund | 429,071,816 | 23,203,101 | 195,029,830 | -- | 15,206,670 | 33,981,366 | 306,433,123 |
| Fidelity Series Blue Chip Growth Fund | 443,402,520 | 71,874,053 | 36,006,249 | 47,308,816 | 2,066,813 | 30,676,343 | 512,013,480 |
| Fidelity Series Canada Fund | 98,832,496 | 5,930,275 | 4,654,623 | -- | 49,720 | 6,152,094 | 106,309,962 |
| Fidelity Series Commodity Strategy Fund | 235,237,103 | 45,065,827 | 9,591,708 | 14,932,723 | (2,403,843) | (17,786,370) | 250,521,009 |
| Fidelity Series Emerging Markets Debt Fund | 71,582,940 | 5,817,711 | 3,327,094 | 2,128,234 | (173,741) | (3,773,426) | 70,126,390 |
| Fidelity Series Emerging Markets Fund | -- | 66,268,976 | -- | -- | -- | 914,711 | 67,183,687 |
| Fidelity Series Emerging Markets | 1,027,149,604 | 171,335,113 | 46,443,815 | -- | 1,447,820 | (133,307,803) | 1,020,180,919 |
| Fidelity Series Floating Rate High Income | 25,093,502 | 2,221,355 | 1,260,070 | 685,282 | (27,263) | 54,536 | 26,082,060 |
| Fidelity Series Government Money Market | 180,118,828 | 177,577,132 | 181,884,990 | 1,502,022 | -- | -- | 175,810,970 |
| Fidelity Series Growth Company Fund | 902,132,390 | 50,611,056 | 54,335,090 | -- | 927,756 | 135,010,544 | 1,034,346,656 |
| Fidelity Series High Income Fund | 154,489,571 | 12,376,379 | 13,147,475 | 4,489,822 | (380,771) | 1,647,843 | 154,985,547 |
| Fidelity Series Inflation-Protected Bond | 90,992,656 | 10,995,849 | 66,540,392 | 137,196 | (954,534) | 1,306,952 | 35,800,531 |
| Fidelity Series International Credit Fund | 4,937,865 | 62,671 | 123,351 | 60,853 | (1,612) | (48,063) | 4,827,510 |
| Fidelity Series International Growth Fund | 995,013,836 | 129,843,691 | 40,354,120 | -- | 168,830 | 15,732,676 | 1,100,404,913 |
| Fidelity Series International Small Cap Fund | 248,264,939 | 25,685,853 | 4,248,837 | -- | (138,481) | (9,710,097) | 259,853,377 |
| Fidelity Series International Value Fund | 1,007,232,591 | 101,308,164 | 13,049,891 | -- | (417,648) | (1,673,104) | 1,093,400,112 |
| Fidelity Series Intrinsic Opportunities Fund | 1,095,273,542 | 117,261,037 | 41,405,597 | 52,267,409 | (393,442) | 16,700,976 | 1,187,436,516 |
| Fidelity Series Investment Grade Bond Fund | 53,699,737 | 5,477,301 | 5,879,050 | 743,427 | (96,326) | (525,542) | 52,676,120 |
| Fidelity Series Large Cap Stock Fund | 970,491,938 | 120,229,598 | 52,258,201 | 63,018,374 | 734,823 | 46,543,336 | 1,085,741,494 |
| Fidelity Series Large Cap Value Index Fund | 276,330,213 | 15,997,436 | 14,478,986 | -- | 109,664 | 19,605,285 | 297,563,612 |
| Fidelity Series Long-Term Treasury Bond | 252,756,420 | 267,096,767 | 94,079,575 | 5,190,693 | (3,100,499) | (10,602,340) | 412,070,773 |
| Fidelity Series Opportunistic Insights Fund | 485,903,915 | 27,930,559 | 26,437,478 | -- | 356,244 | 63,584,957 | 551,338,197 |
| Fidelity Series Real Estate Equity Fund | 88,578,147 | 981,590 | 93,370,139 | 825,806 | 1,459,039 | 2,351,363 | -- |
| Fidelity Series Real Estate Income Fund | 47,880,196 | 5,011,646 | 2,437,954 | 2,122,902 | (18,325) | 306,098 | 50,741,661 |
| Fidelity Series Short-Term Credit Fund | 33,678,083 | 5,344,509 | 1,707,854 | 394,128 | (13,639) | 13,387 | 37,314,486 |
| Fidelity Series Small Cap Discovery Fund | 129,743,700 | 15,429,674 | 6,877,644 | 7,926,368 | (178,694) | (1,772,289) | 136,344,747 |
| Fidelity Series Small Cap Opportunities Fund | 401,012,829 | 57,117,828 | 24,405,892 | 34,284,495 | 695,328 | 11,233,628 | 445,653,721 |
| Fidelity Series Stock Selector Large Cap | 755,175,216 | 42,865,141 | 45,413,304 | -- | (760,392) | 53,549,906 | 805,416,567 |
| Fidelity Series Value Discovery Fund | 535,725,735 | 30,443,623 | 27,957,249 | -- | (226,486) | 32,022,783 | 570,008,406 |
| | $11,262,266,381 | $1,611,420,742 | $1,344,980,883 | $238,018,550 | $111,784,152 | $210,096,154 | $11,850,586,546 |
Amounts in the income column in the above table include any capital gain distributions from underlying funds, which are presented in the corresponding line-item in the Statement of Operations if applicable.
Investment Valuation
The following is a summary of the inputs used, as of September 30, 2018, involving the Fund's assets and liabilities carried at fair value. The inputs or methodology used for valuing securities may not be an indication of the risk associated with investing in those securities. For more information on valuation inputs, and their aggregation into the levels used below, please refer to the Investment Valuation section in the accompanying Notes to Financial Statements.
| | Valuation Inputs at Reporting Date: |
| Description | Total | Level 1 | Level 2 | Level 3 |
| Investments in Securities: | | | | |
| Other Short-Term Investments | $9,594,688 | $-- | $9,594,688 | $-- |
| Domestic Equity Funds | 7,182,817,528 | 7,182,817,528 | -- | -- |
| International Equity Funds | 3,647,332,970 | 3,647,332,970 | -- | -- |
| Bond Funds | 807,310,592 | 807,310,592 | -- | -- |
| Short-Term Funds | 230,705,440 | 230,705,440 | -- | -- |
| Total Investments in Securities: | $11,877,761,218 | $11,868,166,530 | $9,594,688 | $-- |
| Derivative Instruments: | | | | |
| Assets | | | | |
| Futures Contracts | $726,638 | $726,638 | $-- | $-- |
| Total Assets | $726,638 | $726,638 | $-- | $-- |
| Liabilities | | | | |
| Futures Contracts | $(57,281) | $(57,281) | $-- | $-- |
| Total Liabilities | $(57,281) | $(57,281) | $-- | $-- |
| Total Derivative Instruments: | $669,357 | $669,357 | $-- | $-- |
Value of Derivative Instruments
The following table is a summary of the Fund's value of derivative instruments by primary risk exposure as of September 30, 2018. For additional information on derivative instruments, please refer to the Derivative Instruments section in the accompanying Notes to Financial Statements.
| Primary Risk Exposure / Derivative Type | Value |
| | Asset | Liability |
| Equity Risk | | |
| Futures Contracts(a) | $726,638 | $(57,281) |
| Total Equity Risk | 726,638 | (57,281) |
| Total Value of Derivatives | $726,638 | $(57,281) |
(a) Reflects gross cumulative appreciation (depreciation) on futures contracts as presented in the Schedule of Investments. In the Statement of Assets and Liabilities, the period end daily variation margin is included in receivable or payable for daily variation margin on futures contracts, and the net cumulative appreciation (depreciation) is included in net unrealized appreciation (depreciation).
See accompanying notes which are an integral part of the financial statements.
Fidelity Freedom® 2050 Fund
Financial Statements
Statement of Assets and Liabilities
| | | September 30, 2018 (Unaudited) |
| Assets | | |
Investment in securities, at value — See accompanying schedule:
Unaffiliated issuers (cost $9,595,334) | $9,594,688 | |
| Fidelity Central Funds (cost $17,579,984) | 17,579,984 | |
| Other affiliated issuers (cost $9,609,111,653) | 11,850,586,546 | |
| Total Investment in Securities (cost $9,636,286,971) | | $11,877,761,218 |
| Receivable for investments sold | | 129,841,397 |
| Receivable for fund shares sold | | 347,764,386 |
| Distributions receivable from Fidelity Central Funds | | 27,111 |
| Total assets | | 12,355,394,112 |
| Liabilities | | |
| Payable for investments purchased | $144,898,700 | |
| Payable for fund shares redeemed | 332,652,271 | |
| Accrued management fee | 6,538,783 | |
| Payable for daily variation margin on futures contracts | 385,559 | |
| Total liabilities | | 484,475,313 |
| Net Assets | | $11,870,918,799 |
| Net Assets consist of: | | |
| Paid in capital | | $9,344,212,215 |
| Undistributed net investment income | | 22,952,456 |
| Accumulated undistributed net realized gain (loss) on investments | | 261,610,524 |
| Net unrealized appreciation (depreciation) on investments | | 2,242,143,604 |
| Net Assets | | $11,870,918,799 |
| Fidelity Freedom 2050 Fund: | | |
| Net Asset Value, offering price and redemption price per share ($3,699,609,000 ÷ 298,791,260 shares) | | $12.38 |
| Class K: | | |
| Net Asset Value, offering price and redemption price per share ($7,287,972,236 ÷ 589,203,351 shares) | | $12.37 |
| Class K6: | | |
| Net Asset Value, offering price and redemption price per share ($883,337,563 ÷ 71,295,771 shares) | | $12.39 |
See accompanying notes which are an integral part of the financial statements.
Statement of Operations
| | | Six months ended September 30, 2018 (Unaudited) |
| Investment Income | | |
| Dividends: | | |
| Affiliated issuers | | $63,019,629 |
| Interest | | 47,268 |
| Income from Fidelity Central Funds | | 52,191 |
| Total income | | 63,119,088 |
| Expenses | | |
| Management fee | $39,062,176 | |
| Independent trustees' fees and expenses | 28,016 | |
| Total expenses before reductions | 39,090,192 | |
| Expense reductions | (6) | |
| Total expenses after reductions | | 39,090,186 |
| Net investment income (loss) | | 24,028,902 |
| Realized and Unrealized Gain (Loss) | | |
| Net realized gain (loss) on: | | |
| Investment securities: | | |
| Fidelity Central Funds | 33 | |
| Other affiliated issuers | 111,784,152 | |
| Futures contracts | (5,971,111) | |
| Capital gain distributions from underlying funds: | | |
| Affiliated issuers | 174,998,921 | |
| Total net realized gain (loss) | | 280,811,995 |
| Change in net unrealized appreciation (depreciation) on: | | |
| Investment securities: | | |
| Unaffiliated issuers | (646) | |
| Affiliated issuers | 210,096,154 | |
| Futures contracts | 669,357 | |
| Total change in net unrealized appreciation (depreciation) | | 210,764,865 |
| Net gain (loss) | | 491,576,860 |
| Net increase (decrease) in net assets resulting from operations | | $515,605,762 |
See accompanying notes which are an integral part of the financial statements.
Statement of Changes in Net Assets
| | Six months ended September 30, 2018 (Unaudited) | Year ended March 31, 2018 |
| Increase (Decrease) in Net Assets | | |
| Operations | | |
| Net investment income (loss) | $24,028,902 | $119,339,449 |
| Net realized gain (loss) | 280,811,995 | 479,169,493 |
| Change in net unrealized appreciation (depreciation) | 210,764,865 | 312,072,760 |
| Net increase (decrease) in net assets resulting from operations | 515,605,762 | 910,581,702 |
| Distributions to shareholders from net investment income | – | (131,450,258) |
| Distributions to shareholders from net realized gain | (299,795,085) | (213,055,694) |
| Total distributions | (299,795,085) | (344,505,952) |
| Share transactions - net increase (decrease) | 399,180,447 | 7,805,021,541 |
| Total increase (decrease) in net assets | 614,991,124 | 8,371,097,291 |
| Net Assets | | |
| Beginning of period | 11,255,927,675 | 2,884,830,384 |
| End of period | $11,870,918,799 | $11,255,927,675 |
| Other Information | | |
| Undistributed net investment income end of period | $22,952,456 | $– |
| Distributions in excess of net investment income end of period | $– | $(1,076,446) |
See accompanying notes which are an integral part of the financial statements.
Financial Highlights
Fidelity Freedom 2050 Fund
| | Six months ended (Unaudited) September 30, | Years endedMarch 31, | | | | |
| | 2018 | 2018 | 2017 | 2016 | 2015 | 2014 |
| Selected Per–Share Data | | | | | | |
| Net asset value, beginning of period | $12.16 | $11.05 | $9.93 | $10.90 | $11.15 | $10.28 |
| Income from Investment Operations | | | | | | |
| Net investment income (loss)A | .02 | .12 | .15 | .15 | .17 | .15 |
| Net realized and unrealized gain (loss) | .52 | 1.48 | 1.40 | (.52) | .65 | 1.41 |
| Total from investment operations | .54 | 1.60 | 1.55 | (.37) | .82 | 1.56 |
| Distributions from net investment income | – | (.14) | (.15) | (.16) | (.18) | (.15) |
| Distributions from net realized gain | (.32) | (.35) | (.28) | (.44) | (.89) | (.54) |
| Total distributions | (.32) | (.49) | (.43) | (.60) | (1.07) | (.69) |
| Net asset value, end of period | $12.38 | $12.16 | $11.05 | $9.93 | $10.90 | $11.15 |
| Total ReturnB,C | 4.48% | 14.59% | 16.11% | (3.65)% | 7.91% | 15.53% |
| Ratios to Average Net AssetsD,E | | | | | | |
| Expenses before reductions | .75%F | .63%G | - %H | - %H | - %H | - %H |
| Expenses net of fee waivers, if any | .75%F | .63%G | -% | -% | -% | -% |
| Expenses net of all reductions | .75%F | .63%G | -% | -% | -% | -% |
| Net investment income (loss) | .34%F | 1.04% | 1.45% | 1.49% | 1.62% | 1.41% |
| Supplemental Data | | | | | | |
| Net assets, end of period (000 omitted) | $3,699,609 | $3,452,997 | $2,884,830 | $2,363,381 | $2,375,308 | $2,297,832 |
| Portfolio turnover rateD | 23%F | 16%I | 15% | 17% | 23% | 57% |
A Calculated based on average shares outstanding during the period.
B Total returns for periods of less than one year are not annualized.
C Total returns would have been lower if certain expenses had not been reduced during the applicable periods shown.
D Amounts do not include the activity of the Underlying Funds.
E Expense ratios reflect operating expenses of the class. Expenses before reductions do not reflect amounts reimbursed by the investment adviser or reductions from expense offset arrangements and do not represent the amount paid by the class during periods when reimbursements or reductions occur. Expenses net of fee waivers reflect expenses after reimbursement by the investment adviser but prior to reductions from expense offset arrangements. Expenses net of all reductions represent the net expenses paid by the class but do not include expenses of the underlying funds in which the Fund invests.
F Annualized
G On certain classes, the size and fluctuation of net assets and expense amounts may cause ratios to differ from contractual rates.
H Amount represents less than .005%.
I The portfolio turnover rate does not include the assets acquired in the merger.
See accompanying notes which are an integral part of the financial statements.
Fidelity Freedom 2050 Fund Class K
| | Six months ended (Unaudited) September 30, | Years endedMarch 31, |
| | 2018 | 2018 A |
| Selected Per–Share Data | | |
| Net asset value, beginning of period | $12.14 | $11.65 |
| Income from Investment Operations | | |
| Net investment income (loss)B | .03 | .17 |
| Net realized and unrealized gain (loss) | .52 | .67 |
| Total from investment operations | .55 | .84 |
| Distributions from net investment income | – | (.15) |
| Distributions from net realized gain | (.32) | (.19) |
| Total distributions | (.32) | (.35)C |
| Net asset value, end of period | $12.37 | $12.14 |
| Total ReturnD,E | 4.57% | 7.18% |
| Ratios to Average Net AssetsF,G | | |
| Expenses before reductions | .64%H | .65%H,I |
| Expenses net of fee waivers, if any | .64%H | .65%H,I |
| Expenses net of all reductions | .64%H | .65%H,I |
| Net investment income (loss) | .44%H | 2.04%H |
| Supplemental Data | | |
| Net assets, end of period (000 omitted) | $7,287,972 | $7,475,339 |
| Portfolio turnover rateF | 23%H | 16%J |
A For the period July 20, 2017 (commencement of sale of shares) to March 31, 2018.
B Calculated based on average shares outstanding during the period.
C Total distributions of $.35 per share is comprised of distributions from net investment income of $.154 and distributions from net realized gain of $.194 per share.
D Total returns for periods of less than one year are not annualized.
E Total returns would have been lower if certain expenses had not been reduced during the applicable periods shown.
F Amounts do not include the activity of the Underlying Funds.
G Expense ratios reflect operating expenses of the class. Expenses before reductions do not reflect amounts reimbursed by the investment adviser or reductions from expense offset arrangements and do not represent the amount paid by the class during periods when reimbursements or reductions occur. Expense ratios before reductions for start-up periods may not be representative of longer-term operating periods. Expenses net of fee waivers reflect expenses after reimbursement by the investment adviser but prior to reductions from expense offset arrangements. Expenses net of all reductions represent the net expenses paid by the class but do not include expenses of the underlying funds in which the Fund invests.
H Annualized
I On certain classes, the size and fluctuation of net assets and expense amounts may cause ratios to differ from contractual rates.
J The portfolio turnover rate does not include the assets acquired in the merger.
See accompanying notes which are an integral part of the financial statements.
Fidelity Freedom 2050 Fund Class K6
| | Six months ended (Unaudited) September 30, | Years endedMarch 31, |
| | 2018 | 2018 A |
| Selected Per–Share Data | | |
| Net asset value, beginning of period | $12.15 | $11.40 |
| Income from Investment Operations | | |
| Net investment income (loss)B | .04 | .14 |
| Net realized and unrealized gain (loss) | .52 | .96 |
| Total from investment operations | .56 | 1.10 |
| Distributions from net investment income | – | (.16) |
| Distributions from net realized gain | (.32) | (.19) |
| Total distributions | (.32) | (.35) |
| Net asset value, end of period | $12.39 | $12.15 |
| Total ReturnC,D | 4.65% | 9.65% |
| Ratios to Average Net AssetsE,F | | |
| Expenses before reductions | .49%G | .50%G,H |
| Expenses net of fee waivers, if any | .49%G | .50%G,H |
| Expenses net of all reductions | .49%G | .50%G,H |
| Net investment income (loss) | .59%G | 1.42%G |
| Supplemental Data | | |
| Net assets, end of period (000 omitted) | $883,338 | $327,591 |
| Portfolio turnover rateE | 23%G | 16%I |
A For the period June 7, 2017 (commencement of sale of shares) to March 31, 2018.
B Calculated based on average shares outstanding during the period.
C Total returns for periods of less than one year are not annualized.
D Total returns would have been lower if certain expenses had not been reduced during the applicable periods shown.
E Amounts do not include the activity of the Underlying Funds.
F Expense ratios reflect operating expenses of the class. Expenses before reductions do not reflect amounts reimbursed by the investment adviser or reductions from expense offset arrangements and do not represent the amount paid by the class during periods when reimbursements or reductions occur. Expense ratios before reductions for start-up periods may not be representative of longer-term operating periods. Expenses net of fee waivers reflect expenses after reimbursement by the investment adviser but prior to reductions from expense offset arrangements. Expenses net of all reductions represent the net expenses paid by the class but do not include expenses of the underlying funds in which the Fund invests.
G Annualized
H On certain classes, the size and fluctuation of net assets and expense amounts may cause ratios to differ from contractual rates.
I The portfolio turnover rate does not include the assets acquired in the merger.
See accompanying notes which are an integral part of the financial statements.
Fidelity Freedom® 2055 Fund
Investment Summary (Unaudited)
The information in the following tables is based on the direct investments of the Fund.
Top Holdings as of September 30, 2018
| | % of fund's net assets |
| Fidelity Series Intrinsic Opportunities Fund | 10.0 |
| Fidelity Series International Growth Fund | 9.3 |
| Fidelity Series International Value Fund | 9.2 |
| Fidelity Series Large Cap Stock Fund | 9.2 |
| Fidelity Series Growth Company Fund | 8.7 |
| Fidelity Series Emerging Markets Opportunities Fund | 8.6 |
| Fidelity Series Stock Selector Large Cap Value Fund | 6.8 |
| Fidelity Series Value Discovery Fund | 4.8 |
| Fidelity Series Opportunistic Insights Fund | 4.6 |
| Fidelity Series Blue Chip Growth Fund | 4.3 |
| | 75.5 |
Asset Allocation (% of fund's net assets)
| Period end |
| | Domestic Equity Funds | 60.5% |
| | International Equity Funds | 30.7% |
| | Bond Funds | 6.8% |
| | Short-Term Funds | 2.0% |
| | Short-Term Investments | 0.1% |
| | Net Other Assets (Liabilities)* | (0.1)% |

* Net Other Assets (Liabilities) are not included in the pie chart
Domestic Equity Funds category includes Fidelity Series Commodity Strategy Fund which invests in commodity-related investments.
Fidelity Freedom® 2055 Fund
Schedule of Investments September 30, 2018 (Unaudited)
Showing Percentage of Net Assets
| U.S. Treasury Obligations - 0.1% | | | |
| | | Principal Amount | Value |
| U.S. Treasury Bills, yield at date of purchase 2.09% to 2.11% 11/29/18 to 12/6/18 (a) | | | |
| (Cost $3,706,510) | | 3,720,000 | 3,706,269 |
| | | Shares | Value |
|
| Domestic Equity Funds - 60.5% | | | |
| Fidelity Series All-Sector Equity Fund (b) | | 9,105,100 | $123,920,415 |
| Fidelity Series Blue Chip Growth Fund (b) | | 13,918,412 | 212,951,704 |
| Fidelity Series Commodity Strategy Fund (b) | | 20,839,020 | 104,195,101 |
| Fidelity Series Growth Company Fund (b) | | 21,286,614 | 430,202,477 |
| Fidelity Series Intrinsic Opportunities Fund (b) | | 26,849,368 | 492,148,917 |
| Fidelity Series Large Cap Stock Fund (b) | | 28,430,084 | 452,891,238 |
| Fidelity Series Large Cap Value Index Fund (b) | | 9,421,404 | 124,362,536 |
| Fidelity Series Opportunistic Insights Fund (b) | | 11,575,672 | 229,777,087 |
| Fidelity Series Small Cap Discovery Fund (b) | | 4,689,690 | 56,979,736 |
| Fidelity Series Small Cap Opportunities Fund (b) | | 12,651,242 | 185,846,750 |
| Fidelity Series Stock Selector Large Cap Value Fund (b) | | 25,485,771 | 336,921,888 |
| Fidelity Series Value Discovery Fund (b) | | 17,396,737 | 238,161,325 |
| TOTAL DOMESTIC EQUITY FUNDS | | | |
| (Cost $2,505,455,575) | | | 2,988,359,174 |
|
| International Equity Funds - 30.7% | | | |
| Fidelity Series Canada Fund (b) | | 4,096,017 | 44,277,940 |
| Fidelity Series Emerging Markets Fund (b) | | 2,889,271 | 27,997,039 |
| Fidelity Series Emerging Markets Opportunities Fund (b) | | 22,099,529 | 424,089,956 |
| Fidelity Series International Growth Fund(b) | | 27,919,825 | 457,885,133 |
| Fidelity Series International Small Cap Fund (b) | | 6,045,264 | 108,210,220 |
| Fidelity Series International Value Fund (b) | | 43,248,584 | 454,975,106 |
| TOTAL INTERNATIONAL EQUITY FUNDS | | | |
| (Cost $1,361,572,493) | | | 1,517,435,394 |
|
| Bond Funds - 6.8% | | | |
| Fidelity Series Emerging Markets Debt Fund (b) | | 2,990,132 | 28,495,959 |
| Fidelity Series Floating Rate High Income Fund (b) | | 1,171,446 | 11,152,165 |
| Fidelity Series High Income Fund (b) | | 6,716,711 | 64,547,595 |
| Fidelity Series Inflation-Protected Bond Index Fund (b) | | 1,533,598 | 14,891,240 |
| Fidelity Series International Credit Fund (b) | | 165,944 | 1,631,234 |
| Fidelity Series Investment Grade Bond Fund (b) | | 2,012,097 | 21,911,734 |
| Fidelity Series Long-Term Treasury Bond Index Fund (b) | | 20,791,298 | 171,320,295 |
| Fidelity Series Real Estate Income Fund (b) | | 1,993,634 | 21,491,371 |
| TOTAL BOND FUNDS | | | |
| (Cost $344,257,444) | | | 335,441,593 |
|
| Short-Term Funds - 2.0% | | | |
| Fidelity Cash Central Fund, 2.11% (c) | | 6,950,741 | 6,952,131 |
| Fidelity Series Government Money Market Fund 2.12% (b)(d) | | 73,977,592 | 73,977,592 |
| Fidelity Series Short-Term Credit Fund (b) | | 1,592,464 | 15,701,695 |
| TOTAL SHORT-TERM FUNDS | | | |
| (Cost $96,762,701) | | | 96,631,418 |
| TOTAL INVESTMENT IN SECURITIES - 100.1% | | | |
| (Cost $4,311,754,723) | | | 4,941,573,848 |
| NET OTHER ASSETS (LIABILITIES) - (0.1)% | | | (2,809,177) |
| NET ASSETS - 100% | | | $4,938,764,671 |
| Futures Contracts | | | | | |
| | Number of contracts | Expiration Date | Notional Amount | Value | Unrealized Appreciation/(Depreciation) |
| Purchased | | | | | |
| Equity Index Contracts | | | | | |
| CME E-mini S&P 500 Index Contracts (United States) | 190 | Dec. 2018 | $27,730,500 | $5,379 | $5,379 |
| ICE E-mini MSCI Emerging Markets Index Contracts (United States) | 294 | Dec. 2018 | 15,430,590 | 303,896 | 303,896 |
|
| TOTAL PURCHASED | | | | | 309,275 |
|
| Sold | | | | | |
| Equity Index Contracts | | | | | |
| ICE E-mini MSCI EAFE Index Contracts (United States) | 130 | Dec. 2018 | 12,840,750 | (24,737) | (24,737) |
| TOTAL FUTURES CONTRACTS | | | | | $284,538 |
The notional amount of futures purchased as a percentage of Net Assets is 0.9%
The notional amount of futures sold as a percentage of Net Assets is 0.3%
Legend
(a) Security or a portion of the security was pledged to cover margin requirements for futures contracts. At period end, the value of securities pledged amounted to $1,012,037.
(b) Affiliated Fund
(c) Affiliated fund that is generally available only to investment companies and other accounts managed by Fidelity Investments. The rate quoted is the annualized seven-day yield of the fund at period end. A complete unaudited listing of the fund's holdings as of its most recent quarter end is available upon request. In addition, each Fidelity Central Fund's financial statements are available on the SEC's website or upon request.
(d) The rate quoted is the annualized seven-day yield of the fund at period end.
Affiliated Central Funds
Information regarding fiscal year to date income earned by the Fund from investments in Fidelity Central Funds is as follows:
| Fund | Income earned |
| Fidelity Cash Central Fund | $20,640 |
| Total | $20,640 |
Amounts in the income column in the above table include any capital gain distributions from underlying funds, which are presented in the corresponding line-item in the Statement of Operations if applicable.
Affiliated Underlying Funds
Fiscal year to date information regarding the Fund's investments in affiliated Underlying Funds, excluding any Money Market Central Funds, is presented below. Exchanges between classes of the same affiliated Underlying Funds may occur.
| Affiliate | Value, beginning of period | Purchases | Sales Proceeds | Dividend Income | Realized Gain (loss) | Change in Unrealized appreciation (depreciation) | Value, end of period |
| Fidelity Series 100 Index Fund | $86,342,541 | $40,265 | $92,405,409 | $-- | $25,419,336 | $(19,396,733) | $-- |
| Fidelity Series All-Sector Equity Fund | 167,584,790 | 19,623,829 | 83,103,942 | -- | 1,590,789 | 18,224,949 | 123,920,415 |
| Fidelity Series Blue Chip Growth Fund | 173,114,503 | 40,669,813 | 13,494,103 | 19,514,468 | 325,897 | 12,335,594 | 212,951,704 |
| Fidelity Series Canada Fund | 38,606,833 | 4,913,985 | 1,709,856 | -- | 5,757 | 2,461,221 | 44,277,940 |
| Fidelity Series Commodity Strategy Fund | 91,934,990 | 24,165,924 | 3,631,640 | 6,162,495 | (725,531) | (7,548,642) | 104,195,101 |
| Fidelity Series Emerging Markets Debt Fund | 27,209,763 | 3,986,873 | 1,183,395 | 835,394 | (78,112) | (1,439,170) | 28,495,959 |
| Fidelity Series Emerging Markets Fund | -- | 27,521,583 | -- | -- | -- | 475,456 | 27,997,039 |
| Fidelity Series Emerging Markets | 400,892,549 | 91,268,462 | 15,514,228 | -- | (555,073) | (52,001,754) | 424,089,956 |
| Fidelity Series Floating Rate High Income | 10,002,475 | 1,595,128 | 457,856 | 282,755 | (18,646) | 31,064 | 11,152,165 |
| Fidelity Series Government Money Market | 70,121,042 | 79,169,095 | 75,312,545 | 602,092 | -- | -- | 73,977,592 |
| Fidelity Series Growth Company Fund | 351,980,935 | 42,863,477 | 19,396,307 | -- | (194,061) | 54,948,433 | 430,202,477 |
| Fidelity Series High Income Fund | 60,175,196 | 8,543,861 | 4,685,695 | 1,807,339 | (48,275) | 562,508 | 64,547,595 |
| Fidelity Series Inflation-Protected Bond | 35,675,631 | 6,468,769 | 27,409,696 | 54,689 | (391,567) | 548,103 | 14,891,240 |
| Fidelity Series International Credit Fund | 1,668,964 | 21,592 | 42,533 | 20,568 | (554) | (16,235) | 1,631,234 |
| Fidelity Series International Growth Fund | 388,374,374 | 78,177,947 | 15,142,246 | -- | 14,193 | 6,460,865 | 457,885,133 |
| Fidelity Series International Small Cap Fund | 96,898,872 | 16,002,322 | 760,708 | -- | (23,665) | (3,906,601) | 108,210,220 |
| Fidelity Series International Value Fund | 393,238,509 | 65,652,903 | 3,359,381 | -- | (70,422) | (486,503) | 454,975,106 |
| Fidelity Series Intrinsic Opportunities Fund | 427,000,743 | 76,843,928 | 17,728,133 | 21,499,702 | (225,687) | 6,258,066 | 492,148,917 |
| Fidelity Series Investment Grade Bond Fund | 20,925,164 | 3,446,720 | 2,211,247 | 299,154 | (32,344) | (216,559) | 21,911,734 |
| Fidelity Series Large Cap Stock Fund | 379,289,030 | 73,469,947 | 18,701,835 | 25,555,321 | 131,364 | 18,702,732 | 452,891,238 |
| Fidelity Series Large Cap Value Index Fund | 107,932,581 | 13,647,427 | 5,184,343 | -- | (13,108) | 7,979,979 | 124,362,536 |
| Fidelity Series Long-Term Treasury Bond | 98,801,847 | 112,745,472 | 34,624,345 | 2,093,100 | (1,147,844) | (4,454,835) | 171,320,295 |
| Fidelity Series Opportunistic Insights Fund | 189,694,018 | 23,880,844 | 9,477,035 | -- | (22,574) | 25,701,834 | 229,777,087 |
| Fidelity Series Real Estate Equity Fund | 34,294,713 | 463,365 | 36,252,452 | 286,222 | (1,538,115) | 3,032,489 | -- |
| Fidelity Series Real Estate Income Fund | 18,928,290 | 3,346,298 | 886,958 | 878,372 | (14,904) | 118,645 | 21,491,371 |
| Fidelity Series Short-Term Credit Fund | 13,333,440 | 3,001,184 | 632,860 | 162,173 | (7,214) | 7,145 | 15,701,695 |
| Fidelity Series Small Cap Discovery Fund | 50,681,737 | 9,590,504 | 2,456,218 | 3,177,393 | (108,252) | (728,035) | 56,979,736 |
| Fidelity Series Small Cap Opportunities Fund | 156,598,303 | 33,707,367 | 8,734,827 | 14,178,837 | 48,666 | 4,227,241 | 185,846,750 |
| Fidelity Series Stock Selector Large Cap | 295,167,577 | 36,472,682 | 16,018,928 | -- | (352,721) | 21,653,278 | 336,921,888 |
| Fidelity Series Value Discovery Fund | 209,366,384 | 26,003,717 | 9,998,819 | -- | (168,652) | 12,958,695 | 238,161,325 |
| | $4,395,835,794 | $927,305,283 | $520,517,540 | $97,410,074 | $21,798,681 | $106,493,230 | $4,930,915,448 |
Amounts in the income column in the above table include any capital gain distributions from underlying funds, which are presented in the corresponding line-item in the Statement of Operations if applicable.
Investment Valuation
The following is a summary of the inputs used, as of September 30, 2018, involving the Fund's assets and liabilities carried at fair value. The inputs or methodology used for valuing securities may not be an indication of the risk associated with investing in those securities. For more information on valuation inputs, and their aggregation into the levels used below, please refer to the Investment Valuation section in the accompanying Notes to Financial Statements.
| | Valuation Inputs at Reporting Date: |
| Description | Total | Level 1 | Level 2 | Level 3 |
| Investments in Securities: | | | | |
| Other Short-Term Investments | $3,706,269 | $-- | $3,706,269 | $-- |
| Domestic Equity Funds | 2,988,359,174 | 2,988,359,174 | -- | -- |
| International Equity Funds | 1,517,435,394 | 1,517,435,394 | -- | -- |
| Bond Funds | 335,441,593 | 335,441,593 | -- | -- |
| Short-Term Funds | 96,631,418 | 96,631,418 | -- | -- |
| Total Investments in Securities: | $4,941,573,848 | $4,937,867,579 | $3,706,269 | $-- |
| Derivative Instruments: | | | | |
| Assets | | | | |
| Futures Contracts | $309,275 | $309,275 | $-- | $-- |
| Total Assets | $309,275 | $309,275 | $-- | $-- |
| Liabilities | | | | |
| Futures Contracts | $(24,737) | $(24,737) | $-- | $-- |
| Total Liabilities | $(24,737) | $(24,737) | $-- | $-- |
| Total Derivative Instruments: | $284,538 | $284,538 | $-- | $-- |
Value of Derivative Instruments
The following table is a summary of the Fund's value of derivative instruments by primary risk exposure as of September 30, 2018. For additional information on derivative instruments, please refer to the Derivative Instruments section in the accompanying Notes to Financial Statements.
| Primary Risk Exposure / Derivative Type | Value |
| | Asset | Liability |
| Equity Risk | | |
| Futures Contracts(a) | $309,275 | $(24,737) |
| Total Equity Risk | 309,275 | (24,737) |
| Total Value of Derivatives | $309,275 | $(24,737) |
(a) Reflects gross cumulative appreciation (depreciation) on futures contracts as presented in the Schedule of Investments. In the Statement of Assets and Liabilities, the period end daily variation margin is included in receivable or payable for daily variation margin on futures contracts, and the net cumulative appreciation (depreciation) is included in net unrealized appreciation (depreciation).
See accompanying notes which are an integral part of the financial statements.
Fidelity Freedom® 2055 Fund
Financial Statements
Statement of Assets and Liabilities
| | | September 30, 2018 (Unaudited) |
| Assets | | |
Investment in securities, at value — See accompanying schedule:
Unaffiliated issuers (cost $3,706,510) | $3,706,269 | |
| Fidelity Central Funds (cost $6,952,131) | 6,952,131 | |
| Other affiliated issuers (cost $4,301,096,082) | 4,930,915,448 | |
| Total Investment in Securities (cost $4,311,754,723) | | $4,941,573,848 |
| Receivable for investments sold | | 54,262,972 |
| Receivable for fund shares sold | | 174,703,171 |
| Distributions receivable from Fidelity Central Funds | | 10,704 |
| Total assets | | 5,170,550,695 |
| Liabilities | | |
| Payable for investments purchased | $63,768,967 | |
| Payable for fund shares redeemed | 165,180,564 | |
| Accrued management fee | 2,691,672 | |
| Payable for daily variation margin on futures contracts | 144,821 | |
| Total liabilities | | 231,786,024 |
| Net Assets | | $4,938,764,671 |
| Net Assets consist of: | | |
| Paid in capital | | $4,220,697,866 |
| Undistributed net investment income | | 8,115,432 |
| Accumulated undistributed net realized gain (loss) on investments | | 79,847,710 |
| Net unrealized appreciation (depreciation) on investments | | 630,103,663 |
| Net Assets | | $4,938,764,671 |
| Fidelity Freedom 2055 Fund: | | |
| Net Asset Value, offering price and redemption price per share ($1,428,045,930 ÷ 102,125,383 shares) | | $13.98 |
| Class K: | | |
| Net Asset Value, offering price and redemption price per share ($3,114,215,499 ÷ 222,803,681 shares) | | $13.98 |
| Class K6: | | |
| Net Asset Value, offering price and redemption price per share ($396,503,242 ÷ 28,326,689 shares) | �� | $14.00 |
See accompanying notes which are an integral part of the financial statements.
Statement of Operations
| | | Six months ended September 30, 2018 (Unaudited) |
| Investment Income | | |
| Dividends: | | |
| Affiliated issuers | | $25,605,821 |
| Interest | | 18,667 |
| Income from Fidelity Central Funds | | 20,640 |
| Total income | | 25,645,128 |
| Expenses | | |
| Management fee | $15,687,234 | |
| Independent trustees' fees and expenses | 11,101 | |
| Total expenses before reductions | 15,698,335 | |
| Expense reductions | (6) | |
| Total expenses after reductions | | 15,698,329 |
| Net investment income (loss) | | 9,946,799 |
| Realized and Unrealized Gain (Loss) | | |
| Net realized gain (loss) on: | | |
| Investment securities: | | |
| Fidelity Central Funds | 12 | |
| Other affiliated issuers | 21,798,681 | |
| Futures contracts | (2,541,532) | |
| Capital gain distributions from underlying funds: | | |
| Affiliated issuers | 71,804,253 | |
| Total net realized gain (loss) | | 91,061,414 |
| Change in net unrealized appreciation (depreciation) on: | | |
| Investment securities: | | |
| Unaffiliated issuers | (241) | |
| Affiliated issuers | 106,493,230 | |
| Futures contracts | 284,538 | |
| Total change in net unrealized appreciation (depreciation) | | 106,777,527 |
| Net gain (loss) | | 197,838,941 |
| Net increase (decrease) in net assets resulting from operations | | $207,785,740 |
See accompanying notes which are an integral part of the financial statements.
Statement of Changes in Net Assets
| | Six months ended September 30, 2018 (Unaudited) | Year ended March 31, 2018 |
| Increase (Decrease) in Net Assets | | |
| Operations | | |
| Net investment income (loss) | $9,946,799 | $44,165,758 |
| Net realized gain (loss) | 91,061,414 | 169,529,579 |
| Change in net unrealized appreciation (depreciation) | 106,777,527 | 107,945,915 |
| Net increase (decrease) in net assets resulting from operations | 207,785,740 | 321,641,252 |
| Distributions to shareholders from net investment income | – | (48,627,128) |
| Distributions to shareholders from net realized gain | (108,392,501) | (70,153,488) |
| Total distributions | (108,392,501) | (118,780,616) |
| Share transactions - net increase (decrease) | 445,979,420 | 3,268,247,071 |
| Total increase (decrease) in net assets | 545,372,659 | 3,471,107,707 |
| Net Assets | | |
| Beginning of period | 4,393,392,012 | 922,284,305 |
| End of period | $4,938,764,671 | $4,393,392,012 |
| Other Information | | |
| Undistributed net investment income end of period | $8,115,432 | $– |
| Distributions in excess of net investment income end of period | $– | $(1,831,367) |
See accompanying notes which are an integral part of the financial statements.
Financial Highlights
Fidelity Freedom 2055 Fund
| | Six months ended (Unaudited) September 30, | Years endedMarch 31, | | | | |
| | 2018 | 2018 | 2017 | 2016 | 2015 | 2014 |
| Selected Per–Share Data | | | | | | |
| Net asset value, beginning of period | $13.70 | $12.41 | $11.08 | $12.06 | $11.73 | $10.56 |
| Income from Investment Operations | | | | | | |
| Net investment income (loss)A | .02 | .14 | .17 | .17 | .19 | .16 |
| Net realized and unrealized gain (loss) | .59 | 1.64 | 1.57 | (.59) | .72 | 1.51 |
| Total from investment operations | .61 | 1.78 | 1.74 | (.42) | .91 | 1.67 |
| Distributions from net investment income | – | (.15) | (.16) | (.17) | (.18) | (.14) |
| Distributions from net realized gain | (.33) | (.34) | (.25) | (.39) | (.39) | (.36) |
| Total distributions | (.33) | (.49) | (.41) | (.56) | (.58)B | (.50) |
| Net asset value, end of period | $13.98 | $13.70 | $12.41 | $11.08 | $12.06 | $11.73 |
| Total ReturnC,D | 4.48% | 14.49% | 16.17% | (3.69)% | 7.98% | 16.00% |
| Ratios to Average Net AssetsE,F | | | | | | |
| Expenses before reductions | .75%G | .64%H | - %I | - %I | - %I | - %I |
| Expenses net of fee waivers, if any | .75%G | .64%H | -% | -% | -% | -% |
| Expenses net of all reductions | .75%G | .64%H | -% | -% | -% | -% |
| Net investment income (loss) | .35%G | 1.06% | 1.46% | 1.51% | 1.64% | 1.40% |
| Supplemental Data | | | | | | |
| Net assets, end of period (000 omitted) | $1,428,046 | $1,265,311 | $922,284 | $649,621 | $527,231 | $350,647 |
| Portfolio turnover rateE | 22%G | 15%J | 18% | 20% | 21% | 47% |
A Calculated based on average shares outstanding during the period.
B Total distributions of $.58 per share is comprised of distributions from net investment income of $.184 and distributions from net realized gain of $.394 per share.
C Total returns for periods of less than one year are not annualized.
D Total returns would have been lower if certain expenses had not been reduced during the applicable periods shown.
E Amounts do not include the activity of the Underlying Funds.
F Expense ratios reflect operating expenses of the class. Expenses before reductions do not reflect amounts reimbursed by the investment adviser or reductions from expense offset arrangements and do not represent the amount paid by the class during periods when reimbursements or reductions occur. Expenses net of fee waivers reflect expenses after reimbursement by the investment adviser but prior to reductions from expense offset arrangements. Expenses net of all reductions represent the net expenses paid by the class but do not include expenses of the underlying funds in which the Fund invests.
G Annualized
H On certain classes, the size and fluctuation of net assets and expense amounts may cause ratios to differ from contractual rates.
I Amount represents less than .005%.
J The portfolio turnover rate does not include the assets acquired in the merger.
See accompanying notes which are an integral part of the financial statements.
Fidelity Freedom 2055 Fund Class K
| | Six months ended (Unaudited) September 30, | Years endedMarch 31, |
| | 2018 | 2018 A |
| Selected Per–Share Data | | |
| Net asset value, beginning of period | $13.69 | $13.11 |
| Income from Investment Operations | | |
| Net investment income (loss)B | .03 | .19 |
| Net realized and unrealized gain (loss) | .59 | .76 |
| Total from investment operations | .62 | .95 |
| Distributions from net investment income | – | (.17) |
| Distributions from net realized gain | (.33) | (.20) |
| Total distributions | (.33) | (.37) |
| Net asset value, end of period | $13.98 | $13.69 |
| Total ReturnC,D | 4.56% | 7.26% |
| Ratios to Average Net AssetsE,F | | |
| Expenses before reductions | .64%G | .65%G,H |
| Expenses net of fee waivers, if any | .64%G | .65%G,H |
| Expenses net of all reductions | .64%G | .65%G,H |
| Net investment income (loss) | .45%G | 2.01%G |
| Supplemental Data | | |
| Net assets, end of period (000 omitted) | $3,114,215 | $2,992,599 |
| Portfolio turnover rateE | 22%G | 15%I |
A For the period July 20, 2017 (commencement of sale of shares) to March 31, 2018.
B Calculated based on average shares outstanding during the period.
C Total returns for periods of less than one year are not annualized.
D Total returns would have been lower if certain expenses had not been reduced during the applicable periods shown.
E Amounts do not include the activity of the Underlying Funds.
F Expense ratios reflect operating expenses of the class. Expenses before reductions do not reflect amounts reimbursed by the investment adviser or reductions from expense offset arrangements and do not represent the amount paid by the class during periods when reimbursements or reductions occur. Expense ratios before reductions for start-up periods may not be representative of longer-term operating periods. Expenses net of fee waivers reflect expenses after reimbursement by the investment adviser but prior to reductions from expense offset arrangements. Expenses net of all reductions represent the net expenses paid by the class but do not include expenses of the underlying funds in which the Fund invests.
G Annualized
H On certain classes, the size and fluctuation of net assets and expense amounts may cause ratios to differ from contractual rates.
I The portfolio turnover rate does not include the assets acquired in the merger.
See accompanying notes which are an integral part of the financial statements.
Fidelity Freedom 2055 Fund Class K6
| | Six months ended (Unaudited) September 30, | Years endedMarch 31, |
| | 2018 | 2018 A |
| Selected Per–Share Data | | |
| Net asset value, beginning of period | $13.70 | $12.83 |
| Income from Investment Operations | | |
| Net investment income (loss)B | .04 | .16 |
| Net realized and unrealized gain (loss) | .59 | 1.09 |
| Total from investment operations | .63 | 1.25 |
| Distributions from net investment income | – | (.17) |
| Distributions from net realized gain | (.33) | (.20) |
| Total distributions | (.33) | (.38)C |
| Net asset value, end of period | $14.00 | $13.70 |
| Total ReturnD,E | 4.63% | 9.70% |
| Ratios to Average Net AssetsF,G | | |
| Expenses before reductions | .49%H | .50%H,I |
| Expenses net of fee waivers, if any | .49%H | .50%H,I |
| Expenses net of all reductions | .49%H | .50%H,I |
| Net investment income (loss) | .60%H | 1.43%H |
| Supplemental Data | | |
| Net assets, end of period (000 omitted) | $396,503 | $135,481 |
| Portfolio turnover rateF | 22%H | 15%J |
A For the period June 7, 2017 (commencement of sale of shares) to March 31, 2018.
B Calculated based on average shares outstanding during the period.
C Total distributions of $.38 per share is comprised of distributions from net investment income of $.174 and distributions from net realized gain of $.202 per share.
D Total returns for periods of less than one year are not annualized.
E Total returns would have been lower if certain expenses had not been reduced during the applicable periods shown.
F Amounts do not include the activity of the Underlying Funds.
G Expense ratios reflect operating expenses of the class. Expenses before reductions do not reflect amounts reimbursed by the investment adviser or reductions from expense offset arrangements and do not represent the amount paid by the class during periods when reimbursements or reductions occur. Expense ratios before reductions for start-up periods may not be representative of longer-term operating periods. Expenses net of fee waivers reflect expenses after reimbursement by the investment adviser but prior to reductions from expense offset arrangements. Expenses net of all reductions represent the net expenses paid by the class but do not include expenses of the underlying funds in which the Fund invests.
H Annualized
I On certain classes, the size and fluctuation of net assets and expense amounts may cause ratios to differ from contractual rates.
J The portfolio turnover rate does not include the assets acquired in the merger.
See accompanying notes which are an integral part of the financial statements.
Fidelity Freedom® 2060 Fund
Investment Summary (Unaudited)
The information in the following tables is based on the direct investments of the Fund.
Top Holdings as of September 30, 2018
| | % of fund's net assets |
| Fidelity Series Intrinsic Opportunities Fund | 10.0 |
| Fidelity Series International Growth Fund | 9.3 |
| Fidelity Series International Value Fund | 9.2 |
| Fidelity Series Large Cap Stock Fund | 9.2 |
| Fidelity Series Growth Company Fund | 8.7 |
| Fidelity Series Emerging Markets Opportunities Fund | 8.6 |
| Fidelity Series Stock Selector Large Cap Value Fund | 6.9 |
| Fidelity Series Value Discovery Fund | 4.8 |
| Fidelity Series Opportunistic Insights Fund | 4.6 |
| Fidelity Series Blue Chip Growth Fund | 4.3 |
| | 75.6 |
Asset Allocation (% of fund's net assets)
| Period end |
| | Domestic Equity Funds | 60.5% |
| | International Equity Funds | 30.7% |
| | Bond Funds | 6.8% |
| | Short-Term Funds | 2.0% |
| | Short-Term Investments | 0.1% |
| | Net Other Assets (Liabilities)* | (0.1)% |

* Net Other Assets (Liabilities) are not included in the pie chart
Domestic Equity Funds category includes Fidelity Series Commodity Strategy Fund which invests in commodity-related investments.
Fidelity Freedom® 2060 Fund
Schedule of Investments September 30, 2018 (Unaudited)
Showing Percentage of Net Assets
| U.S. Treasury Obligations - 0.1% | | | |
| | | Principal Amount | Value |
| U.S. Treasury Bills, yield at date of purchase 2.07% to 2.11% 11/29/18 to 12/6/18 (a) | | | |
| (Cost $797,085) | | 800,000 | 797,034 |
| | | Shares | Value |
|
| Domestic Equity Funds - 60.5% | | | |
| Fidelity Series All-Sector Equity Fund (b) | | 1,838,644 | $25,023,944 |
| Fidelity Series Blue Chip Growth Fund (b) | | 2,975,684 | 45,527,971 |
| Fidelity Series Commodity Strategy Fund (b) | | 4,443,106 | 22,215,528 |
| Fidelity Series Growth Company Fund (b) | | 4,550,993 | 91,975,570 |
| Fidelity Series Intrinsic Opportunities Fund (b) | | 5,755,511 | 105,498,519 |
| Fidelity Series Large Cap Stock Fund (b) | | 6,104,939 | 97,251,673 |
| Fidelity Series Large Cap Value Index Fund (b) | | 2,020,457 | 26,670,027 |
| Fidelity Series Opportunistic Insights Fund (b) | | 2,477,154 | 49,171,512 |
| Fidelity Series Small Cap Discovery Fund (b) | | 1,011,206 | 12,286,156 |
| Fidelity Series Small Cap Opportunities Fund (b) | | 2,710,144 | 39,812,021 |
| Fidelity Series Stock Selector Large Cap Value Fund (b) | | 5,477,758 | 72,415,966 |
| Fidelity Series Value Discovery Fund (b) | | 3,730,125 | 51,065,405 |
| TOTAL DOMESTIC EQUITY FUNDS | | | |
| (Cost $576,230,099) | | | 638,914,292 |
|
| International Equity Funds - 30.7% | | | |
| Fidelity Series Canada Fund (b) | | 877,904 | 9,490,147 |
| Fidelity Series Emerging Markets Fund (b) | | 606,572 | 5,877,687 |
| Fidelity Series Emerging Markets Opportunities Fund (b) | | 4,731,379 | 90,795,162 |
| Fidelity Series International Growth Fund (b) | | 5,970,220 | 97,911,608 |
| Fidelity Series International Small Cap Fund (b) | | 1,293,735 | 23,157,854 |
| Fidelity Series International Value Fund (b) | | 9,248,206 | 97,291,122 |
| TOTAL INTERNATIONAL EQUITY FUNDS | | | |
| (Cost $305,822,397) | | | 324,523,580 |
|
| Bond Funds - 6.8% | | | |
| Fidelity Series Emerging Markets Debt Fund (b) | | 630,546 | 6,009,107 |
| Fidelity Series Floating Rate High Income Fund (b) | | 256,242 | 2,439,422 |
| Fidelity Series High Income Fund (b) | | 1,440,033 | 13,838,718 |
| Fidelity Series Inflation-Protected Bond Index Fund (b) | | 327,898 | 3,183,891 |
| Fidelity Series International Credit Fund (b) | | 24,341 | 239,271 |
| Fidelity Series Investment Grade Bond Fund (b) | | 430,423 | 4,687,309 |
| Fidelity Series Long-Term Treasury Bond Index Fund (b) | | 4,442,787 | 36,608,565 |
| Fidelity Series Real Estate Income Fund (b) | | 435,539 | 4,695,111 |
| TOTAL BOND FUNDS | | | |
| (Cost $73,129,110) | | | 71,701,394 |
|
| Short-Term Funds - 2.0% | | | |
| Fidelity Cash Central Fund, 2.11% (c) | | 1,236,628 | 1,236,876 |
| Fidelity Series Government Money Market Fund 2.12% (b)(d) | | 15,937,406 | 15,937,406 |
| Fidelity Series Short-Term Credit Fund (b) | | 344,943 | 3,401,134 |
| TOTAL SHORT-TERM FUNDS | | | |
| (Cost $20,599,005) | | | 20,575,416 |
| TOTAL INVESTMENT IN SECURITIES - 100.1% | | | |
| (Cost $976,577,696) | | | 1,056,511,716 |
| NET OTHER ASSETS (LIABILITIES) - (0.1)% | | | (551,752) |
| NET ASSETS - 100% | | | $1,055,959,964 |
| Futures Contracts | | | | | |
| | Number of contracts | Expiration Date | Notional Amount | Value | Unrealized Appreciation/(Depreciation) |
| Purchased | | | | | |
| Equity Index Contracts | | | | | |
| CME E-mini S&P 500 Index Contracts (United States) | 40 | Dec. 2018 | $5,838,000 | $1,132 | $1,132 |
| ICE E-mini MSCI Emerging Markets Index Contracts (United States) | 63 | Dec. 2018 | 3,306,555 | 65,214 | 65,214 |
|
| TOTAL PURCHASED | | | | | 66,346 |
|
| Sold | | | | | |
| Equity Index Contracts | | | | | |
| ICE E-mini MSCI EAFE Index Contracts (United States) | 28 | Dec. 2018 | 2,765,700 | (4,509) | (4,509) |
| TOTAL FUTURES CONTRACTS | | | | | $61,837 |
The notional amount of futures purchased as a percentage of Net Assets is 0.9%
The notional amount of futures sold as a percentage of Net Assets is 0.3%
Legend
(a) Security or a portion of the security was pledged to cover margin requirements for futures contracts. At period end, the value of securities pledged amounted to $239,064.
(b) Affiliated Fund
(c) Affiliated fund that is generally available only to investment companies and other accounts managed by Fidelity Investments. The rate quoted is the annualized seven-day yield of the fund at period end. A complete unaudited listing of the fund's holdings as of its most recent quarter end is available upon request. In addition, each Fidelity Central Fund's financial statements are available on the SEC's website or upon request.
(d) The rate quoted is the annualized seven-day yield of the fund at period end.
Affiliated Central Funds
Information regarding fiscal year to date income earned by the Fund from investments in Fidelity Central Funds is as follows:
| Fund | Income earned |
| Fidelity Cash Central Fund | $3,858 |
| Total | $3,858 |
Amounts in the income column in the above table include any capital gain distributions from underlying funds, which are presented in the corresponding line-item in the Statement of Operations if applicable.
Affiliated Underlying Funds
Fiscal year to date information regarding the Fund's investments in affiliated Underlying Funds, excluding any Money Market Central Funds, is presented below. Exchanges between classes of the same affiliated Underlying Funds may occur.
| Affiliate | Value, beginning of period | Purchases | Sales Proceeds | Dividend Income | Realized Gain (loss) | Change in Unrealized appreciation (depreciation) | Value, end of period |
| Fidelity Series 100 Index Fund | $15,904,680 | $26,022 | $17,014,627 | $-- | $2,869,723 | $(1,785,798) | $-- |
| Fidelity Series All-Sector Equity Fund | 31,253,568 | 8,281,207 | 18,450,077 | -- | 331,215 | 3,608,031 | 25,023,944 |
| Fidelity Series Blue Chip Growth Fund | 32,253,565 | 13,299,443 | 2,291,558 | 4,121,215 | (27,941) | 2,294,462 | 45,527,971 |
| Fidelity Series Canada Fund | 7,202,539 | 2,080,748 | 271,469 | -- | (3,918) | 482,247 | 9,490,147 |
| Fidelity Series Commodity Strategy Fund | 17,145,686 | 7,426,851 | 641,267 | 1,298,303 | (15,376) | (1,700,366) | 22,215,528 |
| Fidelity Series Emerging Markets Debt Fund | 4,840,852 | 1,635,292 | 183,184 | 163,432 | (13,354) | (270,499) | 6,009,107 |
| Fidelity Series Emerging Markets Fund | -- | 5,783,206 | -- | -- | -- | 94,481 | 5,877,687 |
| Fidelity Series Emerging Markets Opportunities Fund | 74,428,681 | 29,507,460 | 2,800,586 | -- | (171,091) | (10,169,302) | 90,795,162 |
| Fidelity Series Floating Rate High Income Fund | 1,890,315 | 620,513 | 74,436 | 57,613 | (915) | 3,945 | 2,439,422 |
| Fidelity Series Government Money Market Fund 2.12% | 13,009,017 | 18,108,826 | 15,180,437 | 118,221 | -- | -- | 15,937,406 |
| Fidelity Series Growth Company Fund | 65,444,549 | 18,545,105 | 2,958,205 | -- | (69,744) | 11,013,865 | 91,975,570 |
| Fidelity Series High Income Fund | 11,127,742 | 3,246,886 | 640,430 | 360,558 | (6,771) | 111,291 | 13,838,718 |
| Fidelity Series Inflation-Protected Bond Index Fund | 6,768,528 | 2,198,589 | 5,813,413 | 10,958 | (73,455) | 103,642 | 3,183,891 |
| Fidelity Series International Credit Fund | 244,476 | 3,750 | 6,496 | 3,013 | (83) | (2,376) | 239,271 |
| Fidelity Series International Growth Fund | 72,306,514 | 26,958,054 | 2,671,371 | -- | (269) | 1,318,680 | 97,911,608 |
| Fidelity Series International Small Cap Fund | 18,039,162 | 6,212,841 | 324,152 | -- | (6,710) | (763,287) | 23,157,854 |
| Fidelity Series International Value Fund | 73,255,562 | 24,797,563 | 743,071 | -- | (38,882) | 19,950 | 97,291,122 |
| Fidelity Series Intrinsic Opportunities Fund | 79,157,527 | 27,884,606 | 2,480,933 | 4,550,343 | (51,985) | 989,304 | 105,498,519 |
| Fidelity Series Investment Grade Bond Fund | 3,875,761 | 1,226,939 | 366,110 | 59,786 | (5,123) | (44,158) | 4,687,309 |
| Fidelity Series Large Cap Stock Fund | 70,836,746 | 25,776,696 | 2,991,297 | 5,233,170 | (40,706) | 3,670,234 | 97,251,673 |
| Fidelity Series Large Cap Value Index Fund | 20,224,908 | 5,727,431 | 880,618 | -- | (14,018) | 1,612,324 | 26,670,027 |
| Fidelity Series Long-Term Treasury Bond Index Fund | 18,521,138 | 24,874,281 | 5,632,143 | 417,397 | (191,191) | (963,520) | 36,608,565 |
| Fidelity Series Opportunistic Insights Fund | 35,335,440 | 10,245,532 | 1,506,699 | -- | (25,768) | 5,123,007 | 49,171,512 |
| Fidelity Series Real Estate Equity Fund | 6,272,892 | 370,736 | 6,935,358 | 55,732 | (243,095) | 534,825 | -- |
| Fidelity Series Real Estate Income Fund | 3,580,706 | 1,242,001 | 142,212 | 183,543 | (3,786) | 18,402 | 4,695,111 |
| Fidelity Series Short-Term Credit Fund | 2,622,315 | 910,408 | 131,568 | 34,374 | (1,629) | 1,608 | 3,401,134 |
| Fidelity Series Small Cap Discovery Fund | 9,487,528 | 3,377,568 | 393,631 | 626,810 | (21,529) | (163,780) | 12,286,156 |
| Fidelity Series Small Cap Opportunities Fund | 29,169,642 | 11,379,312 | 1,357,623 | 3,000,140 | (8,998) | 629,688 | 39,812,021 |
| Fidelity Series Stock Selector Large Cap Value Fund | 55,114,043 | 15,634,527 | 2,594,313 | -- | (85,780) | 4,347,489 | 72,415,966 |
| Fidelity Series Value Discovery Fund | 39,075,165 | 11,108,650 | 1,659,297 | -- | (39,722) | 2,580,609 | 51,065,405 |
| | $818,389,247 | $308,491,043 | $97,136,581 | $20,294,608 | $2,039,099 | $22,694,998 | $1,054,477,806 |
Amounts in the income column in the above table include any capital gain distributions from underlying funds, which are presented in the corresponding line-item in the Statement of Operations if applicable.
Investment Valuation
The following is a summary of the inputs used, as of September 30, 2018, involving the Fund's assets and liabilities carried at fair value. The inputs or methodology used for valuing securities may not be an indication of the risk associated with investing in those securities. For more information on valuation inputs, and their aggregation into the levels used below, please refer to the Investment Valuation section in the accompanying Notes to Financial Statements.
| | Valuation Inputs at Reporting Date: |
| Description | Total | Level 1 | Level 2 | Level 3 |
| Investments in Securities: | | | | |
| Other Short-Term Investments | $797,034 | $-- | $797,034 | $-- |
| Domestic Equity Funds | 638,914,292 | 638,914,292 | -- | -- |
| International Equity Funds | 324,523,580 | 324,523,580 | -- | -- |
| Bond Funds | 71,701,394 | 71,701,394 | -- | -- |
| Short-Term Funds | 20,575,416 | 20,575,416 | -- | -- |
| Total Investments in Securities: | $1,056,511,716 | $1,055,714,682 | $797,034 | $-- |
| Derivative Instruments: | | | | |
| Assets | | | | |
| Futures Contracts | $66,346 | $66,346 | $-- | $-- |
| Total Assets | $66,346 | $66,346 | $-- | $-- |
| Liabilities | | | | |
| Futures Contracts | $(4,509) | $(4,509) | $-- | $-- |
| Total Liabilities | $(4,509) | $(4,509) | $-- | $-- |
| Total Derivative Instruments: | $61,837 | $61,837 | $-- | $-- |
Value of Derivative Instruments
The following table is a summary of the Fund's value of derivative instruments by primary risk exposure as of September 30, 2018. For additional information on derivative instruments, please refer to the Derivative Instruments section in the accompanying Notes to Financial Statements.
| Primary Risk Exposure / Derivative Type | Value |
| | Asset | Liability |
| Equity Risk | | |
| Futures Contracts(a) | $66,346 | $(4,509) |
| Total Equity Risk | 66,346 | (4,509) |
| Total Value of Derivatives | $66,346 | $(4,509) |
(a) Reflects gross cumulative appreciation (depreciation) on futures contracts as presented in the Schedule of Investments. In the Statement of Assets and Liabilities, the period end daily variation margin is included in receivable or payable for daily variation margin on futures contracts, and the net cumulative appreciation (depreciation) is included in net unrealized appreciation (depreciation).
See accompanying notes which are an integral part of the financial statements.
Fidelity Freedom® 2060 Fund
Financial Statements
Statement of Assets and Liabilities
| | | September 30, 2018 (Unaudited) |
| Assets | | |
Investment in securities, at value — See accompanying schedule:
Unaffiliated issuers (cost $797,085) | $797,034 | |
| Fidelity Central Funds (cost $1,236,876) | 1,236,876 | |
| Other affiliated issuers (cost $974,543,735) | 1,054,477,806 | |
| Total Investment in Securities (cost $976,577,696) | | $1,056,511,716 |
| Cash | | 49,000 |
| Receivable for investments sold | | 11,995,418 |
| Receivable for fund shares sold | | 38,486,998 |
| Distributions receivable from Fidelity Central Funds | | 1,950 |
| Total assets | | 1,107,045,082 |
| Liabilities | | |
| Payable for investments purchased | $16,921,506 | |
| Payable for fund shares redeemed | 33,560,005 | |
| Accrued management fee | 569,739 | |
| Payable for daily variation margin on futures contracts | 33,868 | |
| Total liabilities | | 51,085,118 |
| Net Assets | | $1,055,959,964 |
| Net Assets consist of: | | |
| Paid in capital | | $959,240,324 |
| Undistributed net investment income | | 1,465,439 |
| Accumulated undistributed net realized gain (loss) on investments | | 15,258,344 |
| Net unrealized appreciation (depreciation) on investments | | 79,995,857 |
| Net Assets | | $1,055,959,964 |
| Fidelity Freedom 2060 Fund: | | |
| Net Asset Value, offering price and redemption price per share ($308,416,621 ÷ 24,683,601 shares) | | $12.49 |
| Class K: | | |
| Net Asset Value, offering price and redemption price per share ($665,459,435 ÷ 53,288,428 shares) | | $12.49 |
| Class K6: | | |
| Net Asset Value, offering price and redemption price per share ($82,083,908 ÷ 6,561,514 shares) | | $12.51 |
See accompanying notes which are an integral part of the financial statements.
Statement of Operations
| | | Six months ended September 30, 2018 (Unaudited) |
| Investment Income | | |
| Dividends: | | |
| Affiliated issuers | | $5,251,724 |
| Interest | | 3,695 |
| Income from Fidelity Central Funds | | 3,858 |
| Total income | | 5,259,277 |
| Expenses | | |
| Management fee | $3,136,166 | |
| Independent trustees' fees and expenses | 2,137 | |
| Total expenses | | 3,138,303 |
| Net investment income (loss) | | 2,120,974 |
| Realized and Unrealized Gain (Loss) | | |
| Net realized gain (loss) on: | | |
| Investment securities: | | |
| Fidelity Central Funds | 3 | |
| Other affiliated issuers | 2,039,099 | |
| Futures contracts | (525,815) | |
| Capital gain distributions from underlying funds: | | |
| Affiliated issuers | 15,042,884 | |
| Total net realized gain (loss) | | 16,556,171 |
| Change in net unrealized appreciation (depreciation) on: | | |
| Investment securities: | | |
| Unaffiliated issuers | (51) | |
| Affiliated issuers | 22,694,998 | |
| Futures contracts | 61,837 | |
| Total change in net unrealized appreciation (depreciation) | | 22,756,784 |
| Net gain (loss) | | 39,312,955 |
| Net increase (decrease) in net assets resulting from operations | | $41,433,929 |
See accompanying notes which are an integral part of the financial statements.
Statement of Changes in Net Assets
| | Six months ended September 30, 2018 (Unaudited) | Year ended March 31, 2018 |
| Increase (Decrease) in Net Assets | | |
| Operations | | |
| Net investment income (loss) | $2,120,974 | $6,919,637 |
| Net realized gain (loss) | 16,556,171 | 26,038,634 |
| Change in net unrealized appreciation (depreciation) | 22,756,784 | 12,512,816 |
| Net increase (decrease) in net assets resulting from operations | 41,433,929 | 45,471,087 |
| Distributions to shareholders from net investment income | – | (7,703,403) |
| Distributions to shareholders from net realized gain | (18,081,222) | (9,428,917) |
| Total distributions | (18,081,222) | (17,132,320) |
| Share transactions - net increase (decrease) | 214,665,548 | 673,447,954 |
| Total increase (decrease) in net assets | 238,018,255 | 701,786,721 |
| Net Assets | | |
| Beginning of period | 817,941,709 | 116,154,988 |
| End of period | $1,055,959,964 | $817,941,709 |
| Other Information | | |
| Undistributed net investment income end of period | $1,465,439 | $– |
| Distributions in excess of net investment income end of period | $– | $(655,535) |
See accompanying notes which are an integral part of the financial statements.
Financial Highlights
Fidelity Freedom 2060 Fund
| | Six months ended (Unaudited) September 30, | Years endedMarch 31, | | | |
| | 2018 | 2018 | 2017 | 2016 | 2015 A |
| Selected Per–Share Data | | | | | |
| Net asset value, beginning of period | $12.20 | $11.01 | $9.78 | $10.45 | $10.00 |
| Income from Investment Operations | | | | | |
| Net investment income (loss)B | .02 | .13 | .16 | .16 | .10 |
| Net realized and unrealized gain (loss) | .52 | 1.46 | 1.37 | (.53) | .52 |
| Total from investment operations | .54 | 1.59 | 1.53 | (.37) | .62 |
| Distributions from net investment income | – | (.13) | (.13) | (.12) | (.10) |
| Distributions from net realized gain | (.25) | (.26) | (.17) | (.17) | (.07) |
| Total distributions | (.25) | (.40)C | (.30) | (.30)D | (.17) |
| Net asset value, end of period | $12.49 | $12.20 | $11.01 | $9.78 | $10.45 |
| Total ReturnE,F | 4.49% | 14.50% | 16.01% | (3.67)% | 6.22% |
| Ratios to Average Net AssetsG,H | | | | | |
| Expenses before reductions | .75%I | .66%J | - %K | - %K | - %I,K |
| Expenses net of fee waivers, if any | .75%I | .66%J | -% | -% | - %I |
| Expenses net of all reductions | .75%I | .66%J | -% | -% | - %I |
| Net investment income (loss) | .38%I | 1.09% | 1.54% | 1.67% | 1.54%I |
| Supplemental Data | | | | | |
| Net assets, end of period (000 omitted) | $308,417 | $241,896 | $116,155 | $47,019 | $8,968 |
| Portfolio turnover rateG | 21%I | 11%L | 21% | 31% | 28%I |
A For the period August 5, 2014 (commencement of operations) to March 31, 2015.
B Calculated based on average shares outstanding during the period.
C Total distributions of $.40 per share is comprised of distributions from net investment income of $.132 and distributions from net realized gain of $.263 per share.
D Total distributions of $.30 per share is comprised of distributions from net investment income of $.121 and distributions from net realized gain of $.174 per share.
E Total returns for periods of less than one year are not annualized.
F Total returns would have been lower if certain expenses had not been reduced during the applicable periods shown.
G Amounts do not include the activity of the Underlying Funds.
H Expense ratios reflect operating expenses of the class. Expenses before reductions do not reflect amounts reimbursed by the investment adviser or reductions from expense offset arrangements and do not represent the amount paid by the class during periods when reimbursements or reductions occur. Expenses net of fee waivers reflect expenses after reimbursement by the investment adviser but prior to reductions from expense offset arrangements. Expenses net of all reductions represent the net expenses paid by the class but do not include expenses of the underlying funds in which the Fund invests.
I Annualized
J On certain classes, the size and fluctuation of net assets and expense amounts may cause ratios to differ from contractual rates.
K Amount represents less than .005%.
L The portfolio turnover rate does not include the assets acquired in the merger.
See accompanying notes which are an integral part of the financial statements.
Fidelity Freedom 2060 Fund Class K
| | Six months ended (Unaudited) September 30, | Years endedMarch 31, |
| | 2018 | 2018 A |
| Selected Per–Share Data | | |
| Net asset value, beginning of period | $12.19 | $11.65 |
| Income from Investment Operations | | |
| Net investment income (loss)B | .03 | .16 |
| Net realized and unrealized gain (loss) | .52 | .68 |
| Total from investment operations | .55 | .84 |
| Distributions from net investment income | – | (.15) |
| Distributions from net realized gain | (.25) | (.15) |
| Total distributions | (.25) | (.30) |
| Net asset value, end of period | $12.49 | $12.19 |
| Total ReturnC,D | 4.58% | 7.19% |
| Ratios to Average Net AssetsE,F | | |
| Expenses before reductions | .64%G | .65%G,H |
| Expenses net of fee waivers, if any | .64%G | .65%G,H |
| Expenses net of all reductions | .64%G | .65%G,H |
| Net investment income (loss) | .48%G | 1.92%G |
| Supplemental Data | | |
| Net assets, end of period (000 omitted) | $665,459 | $549,158 |
| Portfolio turnover rateE | 21%G | 11%I |
A For the period July 20, 2017 (commencement of sale of shares) to March 31, 2018.
B Calculated based on average shares outstanding during the period.
C Total returns for periods of less than one year are not annualized.
D Total returns would have been lower if certain expenses had not been reduced during the applicable periods shown.
E Amounts do not include the activity of the Underlying Funds.
F Expense ratios reflect operating expenses of the class. Expenses before reductions do not reflect amounts reimbursed by the investment adviser or reductions from expense offset arrangements and do not represent the amount paid by the class during periods when reimbursements or reductions occur. Expense ratios before reductions for start-up periods may not be representative of longer-term operating periods. Expenses net of fee waivers reflect expenses after reimbursement by the investment adviser but prior to reductions from expense offset arrangements. Expenses net of all reductions represent the net expenses paid by the class but do not include expenses of the underlying funds in which the Fund invests.
G Annualized
H On certain classes, the size and fluctuation of net assets and expense amounts may cause ratios to differ from contractual rates.
I The portfolio turnover rate does not include the assets acquired in the merger.
See accompanying notes which are an integral part of the financial statements.
Fidelity Freedom 2060 Fund Class K6
| | Six months ended (Unaudited) September 30, | Years endedMarch 31, |
| | 2018 | 2018 A |
| Selected Per–Share Data | | |
| Net asset value, beginning of period | $12.20 | $11.40 |
| Income from Investment Operations | | |
| Net investment income (loss)B | .04 | .14 |
| Net realized and unrealized gain (loss) | .52 | .96 |
| Total from investment operations | .56 | 1.10 |
| Distributions from net investment income | – | (.15) |
| Distributions from net realized gain | (.25) | (.15) |
| Total distributions | (.25) | (.30) |
| Net asset value, end of period | $12.51 | $12.20 |
| Total ReturnC,D | 4.66% | 9.65% |
| Ratios to Average Net AssetsE,F | | |
| Expenses before reductions | .49%G | .50%G,H |
| Expenses net of fee waivers, if any | .49%G | .50%G,H |
| Expenses net of all reductions | .49%G | .50%G,H |
| Net investment income (loss) | .63%G | 1.44%G |
| Supplemental Data | | |
| Net assets, end of period (000 omitted) | $82,084 | $26,888 |
| Portfolio turnover rateE | 21%G | 11%I |
A For the period June 7, 2017 (commencement of sale of shares) to March 31, 2018.
B Calculated based on average shares outstanding during the period.
C Total returns for periods of less than one year are not annualized.
D Total returns would have been lower if certain expenses had not been reduced during the applicable periods shown.
E Amounts do not include the activity of the Underlying Funds.
F Expense ratios reflect operating expenses of the class. Expenses before reductions do not reflect amounts reimbursed by the investment adviser or reductions from expense offset arrangements and do not represent the amount paid by the class during periods when reimbursements or reductions occur. Expense ratios before reductions for start-up periods may not be representative of longer-term operating periods. Expenses net of fee waivers reflect expenses after reimbursement by the investment adviser but prior to reductions from expense offset arrangements. Expenses net of all reductions represent the net expenses paid by the class but do not include expenses of the underlying funds in which the Fund invests.
G Annualized
H On certain classes, the size and fluctuation of net assets and expense amounts may cause ratios to differ from contractual rates.
I The portfolio turnover rate does not include the assets acquired in the merger.
See accompanying notes which are an integral part of the financial statements.
Notes to Financial Statements (Unaudited)
For the period ended September 30, 2018
1. Organization.
Fidelity Freedom Income Fund, Fidelity Freedom 2005 Fund, Fidelity Freedom 2010 Fund, Fidelity Freedom 2015 Fund, Fidelity Freedom 2020 Fund, Fidelity Freedom 2025 Fund, Fidelity Freedom 2030 Fund, Fidelity Freedom 2035 Fund, Fidelity Freedom 2040 Fund, Fidelity Freedom 2045 Fund, Fidelity Freedom 2050 Fund, Fidelity Freedom 2055 Fund and Fidelity Freedom 2060 Fund (the Funds) are funds of Fidelity Aberdeen Street Trust (the Trust). The Trust is registered under the Investment Company Act of 1940, as amended (the 1940 Act), as an open-end management investment company organized as a Delaware statutory trust. Each Fund is authorized to issue an unlimited number of shares. Each Fund offers Fidelity Freedom, Class K and Class K6 shares, each of which has equal rights as to assets and voting privileges. Each class has exclusive voting rights with respect to matters that affect that class. The Funds invest primarily in a combination of other Fidelity equity, bond, and short-term funds (the Underlying Funds) managed by Fidelity Management & Research Company (FMR). Certain Underlying Funds incurred name changes since their most recent shareholder report. The names of the Underlying Funds are those in effect at period end. In the prior year, the Funds transitioned their portfolios to invest exclusively in classes of the Fidelity Series funds, offered only to certain other Fidelity funds advised by FMR or its affiliates.
2. Investments in Fidelity Central Funds.
The Funds may invest in Fidelity Central Funds, which are open-end investment companies generally available only to other investment companies and accounts managed by the investment adviser and its affiliates. The Funds' Schedules of Investments list each of the Fidelity Central Funds held as of period end, if any, as an investment of each Fund, but do not include the underlying holdings of each Fidelity Central Fund. As an Investing Fund, each Fund indirectly bears its proportionate share of the expenses of the underlying Fidelity Central Funds.
The Money Market Central Funds seek preservation of capital and current income and are managed by Fidelity Investments Money Management, Inc. (FIMM), an affiliate of the investment adviser. Annualized expenses of the Money Market Central Funds as of their most recent shareholder report date are less than .005%.
A complete unaudited list of holdings for each Fidelity Central Fund is available upon request or at the Securities and Exchange Commission (the SEC) website at www.sec.gov. In addition, the financial statements of the Fidelity Central Funds are available on the SEC website or upon request.
3. Significant Accounting Policies.
Each Fund is an investment company and applies the accounting and reporting guidance of the Financial Accounting Standards Board (FASB) Accounting Standards Codification Topic 946 Financial Services – Investments Companies. The financial statements have been prepared in conformity with accounting principles generally accepted in the United States of America (GAAP), which require management to make certain estimates and assumptions at the date of the financial statements. Actual results could differ from those estimates. Subsequent events, if any, through the date that the financial statements were issued have been evaluated in the preparation of the financial statements. The following summarizes the significant accounting policies of the Funds:
Investment Valuation. Investments are valued as of 4:00 p.m. Eastern time on the last calendar day of the period. The Board of Trustees (the Board) has delegated the day to day responsibility for the valuation of each Fund's investments to the Fair Value Committee (the Committee) established by each Fund's investment adviser. In accordance with valuation policies and procedures approved by the Board, each Fund attempts to obtain prices from one or more third party pricing vendors or brokers to value its investments. When current market prices, quotations or currency exchange rates are not readily available or reliable, investments will be fair valued in good faith by the Committee, in accordance with procedures adopted by the Board. Factors used in determining fair value vary by investment type and may include market or investment specific events, changes in interest rates and credit quality. The frequency with which these procedures are used cannot be predicted and they may be utilized to a significant extent. The Committee oversees each Fund's valuation policies and procedures and reports to the Board on the Committee's activities and fair value determinations. The Board monitors the appropriateness of the procedures used in valuing each Fund's investments and ratifies the fair value determinations of the Committee. Each Fund categorizes the inputs to valuation techniques used to value its investments into a disclosure hierarchy consisting of three levels as shown below:
- Level 1 – quoted prices in active markets for identical investments
- Level 2 – other significant observable inputs (including quoted prices for similar investments, interest rates, prepayment speeds, etc.)
- Level 3 – unobservable inputs (including the Fund's own assumptions based on the best information available)
Valuation techniques used to value each Fund's investments by major category are as follows. Investments in the Underlying Funds are valued at their closing net asset value (NAV) each business day and are categorized as Level 1 in the hierarchy. Debt securities, including restricted securities, are valued based on evaluated prices received from third party pricing vendors or from brokers who make markets in such securities. U.S. government and government agency obligations are valued by pricing vendors who utilize matrix pricing which considers yield or price of bonds of comparable quality, coupon, maturity and type or by broker-supplied prices. When independent prices are unavailable or unreliable, debt securities may be valued utilizing pricing methodologies which consider similar factors that would be used by third party pricing vendors. Debt securities are generally categorized as Level 2 in the hierarchy but may be Level 3 depending on the circumstances.
Futures contracts are valued at the settlement price established each day by the board of trade or exchange on which they are traded and are categorized as Level 1 in the hierarchy.
The aggregate value of investments by input level as of September 30, 2018 is included at the end of each applicable Fund's Schedule of Investments.
Investment Transactions and Income. For financial reporting purposes, the Funds' investment holdings and NAV include trades executed through the end of the last business day of the period. The NAV per share for processing shareholder transactions is calculated as of the close of business of the New York Stock Exchange (NYSE), normally 4:00 p.m. Eastern time and includes trades executed through the end of the prior business day. Gains and losses on securities sold are determined on the basis of identified cost. Income and capital gain distributions from the Underlying Funds, if any, are recorded on the ex-dividend date. Interest income is accrued as earned. Interest income includes coupon interest and amortization of premium and accretion of discount on debt securities as applicable.
Class Allocations and Expenses. Investment income, realized and unrealized capital gains and losses, common expenses of each Fund, and certain fund-level expense reductions, if any, are allocated daily on a pro-rata basis to each class based on the relative net assets of each class to the total net assets of each Fund. Each class differs with respect to fees incurred. Certain expense reductions may also differ by class. For the reporting period, the allocated portion of income and expenses to each class as a percent of its average net assets may vary due to the timing of recording these transactions in relation to fluctuating net assets of the classes. Expenses directly attributable to a fund are charged to that fund. Expenses attributable to more than one fund are allocated among the respective funds on the basis of relative net assets or other appropriate methods. Expenses included in the accompanying financial statements reflect the expenses of each Fund and do not include any expenses associated with the Underlying Funds. Although not included in each Fund's expenses, each Fund indirectly bears its proportionate share of the Underlying Funds' expenses through the impact of these expenses on each Underlying Fund's NAV. Expense estimates are accrued in the period to which they relate and adjustments are made when actual amounts are known.
Deferred Trustee Compensation. Under a Deferred Compensation Plan (the Plan) for Fidelity Freedom 2010 Fund, Fidelity Freedom 2020 Fund and Fidelity Freedom 2030 Fund, certain independent Trustees have elected to defer receipt of a portion of their annual compensation. Deferred amounts are invested in a cross-section of Fidelity funds, are marked-to-market and remain in each Fund until distributed in accordance with the Plan. The investment of deferred amounts and the offsetting payable to the Trustees presented below are included in each accompanying Statement of Assets and Liabilities in other receivables and other payables and accrued expenses, respectively.
| Fidelity Freedom 2010 Fund | $93,931 |
| Fidelity Freedom 2020 Fund | 212,156 |
| Fidelity Freedom 2030 Fund | 174,805 |
Income Tax Information and Distributions to Shareholders. Each year, each Fund intends to qualify as a regulated investment company under Subchapter M of the Internal Revenue Code, including distributing substantially all of its taxable income and realized gains. As a result, no provision for U.S. Federal income taxes is required. Each Fund files a U.S. federal tax return, in addition to state and local tax returns as required. Each Fund's federal income tax returns are subject to examination by the Internal Revenue Service (IRS) for a period of three fiscal years after they are filed. State and local tax returns may be subject to examination for an additional fiscal year depending on the jurisdiction.
Distributions are declared and recorded on the ex-dividend date. Income and capital gain distributions are declared separately for each class. Income and capital gain distributions are determined in accordance with income tax regulations, which may differ from GAAP.
Capital accounts within the financial statements are adjusted for permanent book-tax differences. These adjustments have no impact on net assets or the results of operations. Capital accounts are not adjusted for temporary book-tax differences which will reverse in a subsequent period.
Book-tax differences are primarily due to the short-term gain distributions from the Underlying Funds, futures contracts, market discount, deferred trustees compensation, losses deferred due to wash sales, and excise tax regulations.
As of period end, the cost and unrealized appreciation (depreciation) in securities, and derivatives if applicable, for federal income tax purposes were as follows for each Fund:
| | Tax cost | Gross unrealized appreciation | Gross unrealized depreciation | Net unrealized appreciation (depreciation) |
| Fidelity Freedom Income Fund | $3,348,077,971 | $219,688,827 | $(48,495,993) | $171,192,834 |
| Fidelity Freedom 2005 Fund | 934,442,654 | 77,482,242 | (23,566,371) | 53,915,871 |
| Fidelity Freedom 2010 Fund | 5,637,412,521 | 704,900,587 | (128,215,802) | 576,684,785 |
| Fidelity Freedom 2015 Fund | 8,327,269,154 | 1,359,749,262 | (149,074,212) | 1,210,675,050 |
| Fidelity Freedom 2020 Fund | 25,108,681,386 | 4,480,786,893 | (471,556,551) | 4,009,230,342 |
| Fidelity Freedom 2025 Fund | 23,618,026,776 | 4,344,409,295 | (398,472,176) | 3,945,937,119 |
| Fidelity Freedom 2030 Fund | 26,942,964,282 | 6,063,148,062 | (388,054,234) | 5,675,093,828 |
| Fidelity Freedom 2035 Fund | 18,177,492,824 | 4,546,451,869 | (156,640,239) | 4,389,811,630 |
| Fidelity Freedom 2040 Fund | 18,340,202,614 | 4,904,765,625 | (156,601,951) | 4,748,163,674 |
| Fidelity Freedom 2045 Fund | 11,299,537,650 | 2,751,964,841 | (90,481,282) | 2,661,483,559 |
| Fidelity Freedom 2050 Fund | 9,660,653,843 | 2,295,466,260 | (77,689,528) | 2,217,776,732 |
| Fidelity Freedom 2055 Fund | 4,325,199,677 | 654,003,691 | (37,344,982) | 616,658,709 |
| Fidelity Freedom 2060 Fund | 978,408,082 | 88,105,095 | (9,939,624) | 78,165,471 |
Certain of the Funds elected to defer to the next fiscal year ordinary losses recognized during the period January 1, 2018 to March 31, 2018. Loss deferrals were as follows:
| | Ordinary losses |
| Fidelity Freedom 2050 Fund | $1,076,447 |
| Fidelity Freedom 2055 Fund | 1,831,366 |
| Fidelity Freedom 2060 Fund | 655,535 |
4. Derivative Instruments.
Risk Exposures and the Use of Derivative Instruments. The Funds' investment objective allows the Funds to enter into various types of derivative contracts, including futures contracts. Derivatives are investments whose value is primarily derived from underlying assets, indices or reference rates and may be transacted on an exchange or over-the-counter (OTC). Derivatives may involve a future commitment to buy or sell a specified asset based on specified terms, to exchange future cash flows at periodic intervals based on a notional principal amount, or for one party to make one or more payments upon the occurrence of specified events in exchange for periodic payments from the other party.
The Funds used derivatives to increase returns and to manage exposure to certain risks as defined below. The success of any strategy involving derivatives depends on analysis of numerous economic factors, and if the strategies for investment do not work as intended, the Funds may not achieve their objectives.
The Funds' use of derivatives increased or decreased their exposure to the following risk:
| Equity Risk | Equity risk relates to the fluctuations in the value of financial instruments as a result of changes in market prices (other than those arising from interest rate risk or foreign exchange risk), whether caused by factors specific to an individual investment, its issuer, or all factors affecting all instruments traded in a market or market segment.
|
The Funds are also exposed to additional risks from investing in derivatives, such as liquidity risk and counterparty credit risk. Liquidity risk is the risk that the Funds will be unable to close out the derivative in the open market in a timely manner. Counterparty credit risk is the risk that the counterparty will not be able to fulfill its obligation to the Funds. Counterparty credit risk related to exchange-traded futures contracts may be mitigated by the protection provided by the exchange on which they trade.
Investing in derivatives may involve greater risks than investing in the underlying assets directly and, to varying degrees, may involve risk of loss in excess of any initial investment and collateral received and amounts recognized in the Statement of Assets and Liabilities. In addition, there may be the risk that the change in value of the derivative contract does not correspond to the change in value of the underlying instrument.
Futures Contracts. A futures contract is an agreement between two parties to buy or sell a specified underlying instrument for a fixed price at a specified future date. The Funds used futures contracts to manage their exposure to the stock market.
Upon entering into a futures contract, a fund is required to deposit either cash or securities (initial margin) with a clearing broker in an amount equal to a certain percentage of the face value of the contract. Futures contracts are marked-to-market daily and subsequent daily payments (variation margin) are made or received by a fund depending on the daily fluctuations in the value of the futures contracts and are recorded as unrealized appreciation or (depreciation). This receivable and/or payable, if any, is included in daily variation margin on futures contracts in the Statement of Assets and Liabilities. Realized gain or (loss) is recorded upon the expiration or closing of a futures contract. The net realized gain (loss) and change in net unrealized appreciation (depreciation) on futures contracts during the period is presented in the Statement of Operations.
Any open futures contracts at period end are presented in the Schedule of Investments under the caption "Futures Contracts". The notional amount at value reflects each contract's exposure to the underlying instrument or index at period end.
5. Purchases and Sales of Investments.
Purchases and sales of securities, other than short-term securities, are noted in the table below.
| | Purchases ($) | Sales ($) |
| Fidelity Freedom Income Fund | 580,118,712 | 779,411,886 |
| Fidelity Freedom 2005 Fund | 172,776,315 | 210,333,156 |
| Fidelity Freedom 2010 Fund | 828,962,275 | 1,153,580,828 |
| Fidelity Freedom 2015 Fund | 1,128,133,044 | 1,816,318,045 |
| Fidelity Freedom 2020 Fund | 3,196,773,708 | 4,491,014,473 |
| Fidelity Freedom 2025 Fund | 3,306,757,542 | 3,488,856,635 |
| Fidelity Freedom 2030 Fund | 3,218,978,872 | 3,246,280,546 |
| Fidelity Freedom 2035 Fund | 2,786,167,088 | 2,598,869,741 |
| Fidelity Freedom 2040 Fund | 2,610,252,508 | 2,596,606,461 |
| Fidelity Freedom 2045 Fund | 1,811,121,475 | 1,576,297,675 |
| Fidelity Freedom 2050 Fund | 1,611,420,742 | 1,344,980,883 |
| Fidelity Freedom 2055 Fund | 927,305,283 | 520,517,490 |
| Fidelity Freedom 2060 Fund | 308,491,043 | 97,136,581 |
6. Fees and Other Transactions with Affiliates.
Management Fee and Expense Contract. FMR Co., Inc. (the investment adviser), an affiliate of FMR, and its affiliates provide the Funds with investment management related services. Under the management contract, effective June 1, 2017, each Class of each Fund pays a monthly management fee that is set at an annual rate by referring to each Fund's target date, indicated by its name, such that the management fee rate applicable to each Class of each Fund is reduced as the fund approaches, and then passes, its target date. In addition, under the management contract, the investment adviser pays all ordinary operating expenses of each Fund, except fees and expenses of the independent Trustees, and certain miscellaneous expenses such as proxy and shareholder meeting expenses. The management fee is reduced by an amount equal to the fees and expenses paid by each Fund to the independent Trustees. Prior to June 1, 2017, the investment advisor provided the Funds with investment management related services. The Funds did not pay any fees for these services. For the reporting period, the total annual management fee rate for each Class of each Fund was as follows:
| | Annual % of Class-Level Average Net Assets (Fidelity Freedom Class) | Annual % of Class-Level Average Net Assets (Class K) |
| Fidelity Freedom Income Fund | .465% | .415% |
| Fidelity Freedom 2005 Fund | .482% | .428% |
| Fidelity Freedom 2010 Fund | .525% | .461% |
| Fidelity Freedom 2015 Fund | .567% | .496% |
| Fidelity Freedom 2020 Fund | .610% | .531% |
| Fidelity Freedom 2025 Fund | .652% | .566% |
| Fidelity Freedom 2030 Fund | .695% | .601% |
| Fidelity Freedom 2035 Fund | .737% | .636% |
| Fidelity Freedom 2040 Fund | .746% | .643% |
| Fidelity Freedom 2045 Fund | .746% | .643% |
| Fidelity Freedom 2050 Fund | .746% | .643% |
| Fidelity Freedom 2055 Fund | .746% | .643% |
| Fidelity Freedom 2060 Fund | .746% | .643% |
Under the expense contract, the investment adviser pays class-level expenses for Class K6 of each Fund as necessary so that Class K6 total expenses do not exceed certain amounts of Class K6 average net assets on an annual basis with certain exceptions, as noted in the following table:
| | Annual % of Class-Level Average Net Assets (Class K6) |
| Fidelity Freedom Income Fund | .365% |
| Fidelity Freedom 2005 Fund | .373% |
| Fidelity Freedom 2010 Fund | .392% |
| Fidelity Freedom 2015 Fund | .412% |
| Fidelity Freedom 2020 Fund | .431% |
| Fidelity Freedom 2025 Fund | .450% |
| Fidelity Freedom 2030 Fund | .470% |
| Fidelity Freedom 2035 Fund | .489% |
| Fidelity Freedom 2040 Fund | .493% |
| Fidelity Freedom 2045 Fund | .493% |
| Fidelity Freedom 2050 Fund | .493% |
| Fidelity Freedom 2055 Fund | .493% |
| Fidelity Freedom 2060 Fund | .493% |
Other Transactions. The investment adviser has entered into an administration agreement with FMR under which FMR provides management and administrative services (other than investment advisory services) necessary for the operation of each Fund. Pursuant to this agreement, FMR pays all expenses of each Fund, excluding compensation of the independent Trustees and certain miscellaneous expenses such as proxy and shareholder meeting expenses. FMR also contracts with other Fidelity companies to perform the services necessary for the operation of each Fund. The Funds do not pay any fees for these services.
Prior Fiscal Year Reallocation of Underlying Fund Investments. During the prior period, the investment adviser reallocated investments of the Funds. This involved taxable redemptions of the Funds' interest in Fidelity Series Value Discovery Fund, ("selected Underlying Fund") for investments and cash and non-taxable exchanges of those investments and cash for shares of Fidelity Series Intrinsic Opportunities Fund and Fidelity Series Growth & Income Fund which are affiliated investment companies managed by FMR.
Details of these transactions with the net related gain (loss) for the Funds are presented in the accompanying table:
| | Value of Investments and Cash reallocated | Net realized Gain (Loss) on redemptions of selected Underlying Fund |
| Freedom Income Fund | $ 21,943,732 | $ 5,248,386 |
| Freedom 2005 Fund | 9,132,913 | 818,016 |
| Freedom 2010 Fund | 82,938,352 | 17,423,248 |
| Freedom 2015 Fund | 132,300,852 | 26,218,924 |
| Freedom 2020 Fund | 349,185,809 | 55,046,914 |
| Freedom 2025 Fund | 312,149,126 | 36,476,750 |
| Freedom 2030 Fund | 443,448,822 | 45,658,987 |
| Freedom 2035 Fund | 315,567,651 | 25,385,650 |
| Freedom 2040 Fund | 341,654,429 | 31,022,107 |
| Freedom 2045 Fund | 165,214,747 | 12,941,012 |
| Freedom 2050 Fund | 136,449,649 | 10,462,773 |
| Freedom 2055 Fund | 44,625,815 | 2,684,111 |
| Freedom 2060 Fund | 6,196,209 | 137,579 |
7. Expense Reductions.
Through arrangements with each applicable Fund's custodian, credits realized as a result of certain uninvested cash balances were used to reduce the Fund's expenses. All of the applicable expense reductions are noted in the table below.
| | Expense reduction |
| Fidelity Freedom Income Fund | $54 |
| Fidelity Freedom 2005 Fund | 70 |
| Fidelity Freedom 2010 Fund | 38 |
| Fidelity Freedom 2015 Fund | 55 |
| Fidelity Freedom 2020 Fund | 13 |
| Fidelity Freedom 2025 Fund | 12 |
| Fidelity Freedom 2030 Fund | 25 |
| Fidelity Freedom 2045 Fund | 29 |
| Fidelity Freedom 2050 Fund | 6 |
| Fidelity Freedom 2055 Fund | 6 |
8. Distributions to Shareholders.
Distributions to shareholders of each class were as follows:
| | Six months ended
September 30, 2018 | Year ended
March 31, 2018(a) |
| Fidelity Freedom Income Fund | | |
| From net investment income | | |
| Fidelity Freedom Income Fund | $14,984,465 | $34,335,271 |
| Class K | 10,910,977 | 17,390,446 |
| Class K6 | 455,334 | 223,737 |
| Total | $26,350,776 | $51,949,454 |
| From net realized gain | | |
| Fidelity Freedom Income Fund | $22,330,640 | $44,712,535 |
| Class K | 16,009,200 | 22,488,873 |
| Class K6 | 520,337 | 239,298 |
| Total | $38,860,177 | $67,440,706 |
| Fidelity Freedom 2005 Fund | | |
| From net investment income | | |
| Fidelity Freedom 2005 Fund | $1,524,497 | $8,256,167 |
| Class K | 1,072,276 | 5,348,186 |
| Class K6 | 40,475 | 66,981 |
| Total | $2,637,248 | $13,671,334 |
| From net realized gain | | |
| Fidelity Freedom 2005 Fund | $8,908,779 | $14,263,444 |
| Class K | 6,076,226 | 6,417,819 |
| Class K6 | 194,073 | 78,417 |
| Total | $15,179,078 | $20,759,680 |
| Fidelity Freedom 2010 Fund | | |
| From net investment income | | |
| Fidelity Freedom 2010 Fund | $8,368,166 | $59,450,122 |
| Class K | 5,046,887 | 33,379,063 |
| Class K6 | 229,872 | 446,466 |
| Total | $13,644,925 | $93,275,651 |
| From net realized gain | | |
| Fidelity Freedom 2010 Fund | $87,992,475 | $138,121,654 |
| Class K | 50,036,243 | 54,086,430 |
| Class K6 | 1,772,564 | 700,731 |
| Total | $139,801,282 | $192,908,815 |
| Fidelity Freedom 2015 Fund | | |
| From net investment income | | |
| Fidelity Freedom 2015 Fund | $8,688,870 | $75,356,851 |
| Class K | 7,132,266 | 62,744,245 |
| Class K6 | 397,154 | 834,279 |
| Total | $16,218,290 | $138,935,375 |
| From net realized gain | | |
| Fidelity Freedom 2015 Fund | $134,055,986 | $187,400,162 |
| Class K | 105,038,677 | 102,672,333 |
| Class K6 | 4,150,891 | 1,342,304 |
| Total | $243,245,554 | $291,414,799 |
| Fidelity Freedom 2020 Fund | | |
| From net investment income | | |
| Fidelity Freedom 2020 Fund | $15,444,745 | $170,977,599 |
| Class K | 19,118,065 | 214,523,078 |
| Class K6 | 1,282,075 | 3,160,558 |
| Total | $35,844,885 | $388,661,235 |
| From net realized gain | | |
| Fidelity Freedom 2020 Fund | $316,208,644 | $406,127,361 |
| Class K | 371,844,368 | 309,195,087 |
| Class K6 | 15,585,204 | 4,430,552 |
| Total | $703,638,216 | $719,753,000 |
| Fidelity Freedom 2025 Fund | | |
| From net investment income | | |
| Fidelity Freedom 2025 Fund | $8,064,374 | $135,746,842 |
| Class K | 11,556,354 | 196,874,291 |
| Class K6 | 1,171,512 | 4,557,308 |
| Total | $20,792,240 | $337,178,441 |
| From net realized gain | | |
| Fidelity Freedom 2025 Fund | $257,242,278 | $300,732,953 |
| Class K | 335,132,279 | 252,816,654 |
| Class K6 | 17,795,792 | 5,757,887 |
| Total | $610,170,349 | $559,307,494 |
| Fidelity Freedom 2030 Fund | | |
| From net investment income | | |
| Fidelity Freedom 2030 Fund | $– | $152,399,042 |
| Class K | – | 237,812,270 |
| Class K6 | – | 6,564,512 |
| Total | $– | $396,775,824 |
| From net realized gain | | |
| Fidelity Freedom 2030 Fund | $350,600,239 | $413,872,411 |
| Class K | 473,811,407 | 346,196,136 |
| Class K6 | 26,942,551 | 9,436,482 |
| Total | $851,354,197 | $769,505,029 |
| Fidelity Freedom 2035 Fund | | |
| From net investment income | | |
| Fidelity Freedom 2035 Fund | $– | $87,722,896 |
| Class K | – | 162,011,402 |
| Class K6 | – | 5,709,559 |
| Total | $– | $255,443,857 |
| From net realized gain | | |
| Fidelity Freedom 2035 Fund | $230,445,861 | $240,142,544 |
| Class K | 335,955,382 | 221,611,338 |
| Class K6 | 22,770,060 | 7,651,385 |
| Total | $589,171,303 | $469,405,267 |
| Fidelity Freedom 2040 Fund | | |
| From net investment income | | |
| Fidelity Freedom 2040 Fund | $– | $90,536,406 |
| Class K | – | 170,937,500 |
| Class K6 | – | 4,789,254 |
| Total | $– | $266,263,160 |
| From net realized gain | | |
| Fidelity Freedom 2040 Fund | $241,363,664 | $261,248,683 |
| Class K | 357,897,586 | 242,057,363 |
| Class K6 | 21,767,741 | 6,636,534 |
| Total | $621,028,991 | $509,942,580 |
| Fidelity Freedom 2045 Fund | | |
| From net investment income | | |
| Fidelity Freedom 2045 Fund | $– | $44,250,979 |
| Class K | – | 109,126,440 |
| Class K6 | – | 2,701,118 |
| Total | $– | $156,078,537 |
| From net realized gain | | |
| Fidelity Freedom 2045 Fund | $121,573,693 | $114,572,629 |
| Class K | 225,623,203 | 138,369,458 |
| Class K6 | 12,930,259 | 3,337,686 |
| Total | $360,127,155 | $256,279,773 |
| Fidelity Freedom 2050 Fund | | |
| From net investment income | | |
| Fidelity Freedom 2050 Fund | $– | $36,777,044 |
| Class K | – | 92,715,220 |
| Class K6 | – | 1,957,994 |
| Total | $– | $131,450,258 |
| From net realized gain | | |
| Fidelity Freedom 2050 Fund | $98,786,680 | $93,839,199 |
| Class K | 191,006,262 | 116,797,064 |
| Class K6 | 10,002,143 | 2,419,431 |
| Total | $299,795,085 | $213,055,694 |
| Fidelity Freedom 2055 Fund | | |
| From net investment income | | |
| Fidelity Freedom 2055 Fund | $– | $12,886,343 |
| Class K | – | 34,941,200 |
| Class K6 | – | 799,585 |
| Total | $– | $48,627,128 |
| From net realized gain | | |
| Fidelity Freedom 2055 Fund | $34,080,234 | $27,949,675 |
| Class K | 70,641,422 | 41,275,560 |
| Class K6 | 3,670,845 | 928,253 |
| Total | $108,392,501 | $70,153,488 |
| Fidelity Freedom 2060 Fund | | |
| From net investment income | | |
| Fidelity Freedom 2060 Fund | $– | $2,107,103 |
| Class K | – | 5,444,764 |
| Class K6 | – | 151,536 |
| Total | $– | $7,703,403 |
| From net realized gain | | |
| Fidelity Freedom 2060 Fund | $5,777,935 | $3,721,242 |
| Class K | 11,676,178 | 5,555,128 |
| Class K6 | 627,109 | 152,547 |
| Total | $18,081,222 | $9,428,917 |
(a) Amounts for Class K and Class K6 are for the period July 20, 2017 and June 7, 2017, respectively, (commencement of sale of shares) to March 31, 2018.
9. Share Transactions.
Share transactions for each class were as follows and may contain automatic conversions between classes or exchanges between affiliated funds:
| | Shares | Shares | Dollars | Dollars |
| | Six months ended September 30, 2018 | Year ended March 31, 2018 (a) | Six months ended September 30, 2018 | Year ended March 31, 2018 (a) |
| Fidelity Freedom Income Fund | | | | |
| Fidelity Freedom Income Fund | | | | |
| Shares sold | 12,814,841 | 27,221,111 | $148,674,954 | $320,765,917 |
| Reinvestment of distributions | 3,164,229 | 6,605,290 | 36,540,585 | 77,395,265 |
| Shares redeemed | (20,352,135) | (38,028,513) | (235,957,475) | (447,668,101) |
| Net increase (decrease) | (4,373,065) | (4,202,112) | $(50,741,936) | $(49,506,919) |
| Class K | | | | |
| Shares sold | 12,517,953 | 23,453,639 | $144,956,112 | $277,296,475 |
| Issued in exchange for the shares of Fidelity Freedom K Income Fund | – | 136,520,990 | – | 1,613,678,107 |
| Reinvestment of distributions | 2,334,978 | 3,392,232 | 26,920,177 | 39,879,319 |
| Shares redeemed | (29,145,944) | (29,017,558) | (337,442,532) | (343,144,692) |
| Net increase (decrease) | (14,293,013) | 134,349,303 | $(165,566,243) | $1,587,709,209 |
| Class K6 | | | | |
| Shares sold | 4,888,043 | 3,890,192 | $56,611,838 | $45,935,962 |
| Reinvestment of distributions | 84,555 | 39,381 | 975,671 | 463,035 |
| Shares redeemed | (678,423) | (569,053) | (7,861,133) | (6,709,845) |
| Net increase (decrease) | 4,294,175 | 3,360,520 | $49,726,376 | $39,689,152 |
| Fidelity Freedom 2005 Fund | | | | |
| Fidelity Freedom 2005 Fund | | | | |
| Shares sold | 3,686,723 | 7,378,209 | $45,792,236 | $92,645,422 |
| Reinvestment of distributions | 835,563 | 1,791,008 | 10,335,921 | 22,315,999 |
| Shares redeemed | (5,768,683) | (9,828,104) | (71,645,766) | (123,356,983) |
| Net increase (decrease) | (1,246,397) | (658,887) | $(15,517,609) | $(8,395,562) |
| Class K | | | | |
| Shares sold | 4,893,445 | 9,369,547 | $60,658,371 | $118,391,743 |
| Issued in exchange for the shares of Fidelity Freedom K 2005 Fund | – | 32,823,330 | – | 412,589,249 |
| Reinvestment of distributions | 578,826 | 938,278 | 7,148,502 | 11,766,005 |
| Shares redeemed | (8,230,204) | (9,282,767) | (102,006,836) | (117,477,612) |
| Net increase (decrease) | (2,757,933) | 33,848,388 | $(34,199,963) | $425,269,385 |
| Class K6 | | | | |
| Shares sold | 1,771,969 | 893,756 | $22,013,023 | $11,275,207 |
| Reinvestment of distributions | 18,992 | 11,585 | 234,548 | 145,398 |
| Shares redeemed | (174,160) | (106,187) | (2,164,051) | (1,340,558) |
| Net increase (decrease) | 1,616,801 | 799,154 | $20,083,520 | $10,080,047 |
| Fidelity Freedom 2010 Fund | | | | |
| Fidelity Freedom 2010 Fund | | | | |
| Shares sold | 12,416,194 | 23,767,583 | $196,634,359 | $381,761,384 |
| Reinvestment of distributions | 6,029,770 | 12,229,853 | 94,968,861 | 194,626,240 |
| Shares redeemed | (24,565,366) | (49,294,217) | (388,720,220) | (791,146,041) |
| Net increase (decrease) | (6,119,402) | (13,296,781) | $(97,117,000) | $(214,758,417) |
| Class K | | | | |
| Shares sold | 9,503,819 | 20,322,144 | $150,402,768 | $328,782,786 |
| Issued in exchange for the shares of Fidelity Freedom K 2010 Fund | – | 158,527,428 | – | 2,547,535,809 |
| Reinvestment of distributions | 3,501,788 | 5,452,961 | 55,083,130 | 87,465,493 |
| Shares redeemed | (28,041,001) | (34,234,425) | (443,557,450) | (555,204,634) |
| Net increase (decrease) | (15,035,394) | 150,068,108 | $(238,071,552) | $2,408,579,454 |
| Class K6 | | | | |
| Shares sold | 6,624,451 | 4,164,658 | $104,974,043 | $67,215,211 |
| Reinvestment of distributions | 127,381 | 71,521 | 2,002,436 | 1,147,196 |
| Shares redeemed | (627,780) | (490,870) | (9,946,565) | (7,955,488) |
| Net increase (decrease) | 6,124,052 | 3,745,309 | $97,029,914 | $60,406,919 |
| Fidelity Freedom 2015 Fund | | | | |
| Fidelity Freedom 2015 Fund | | | | |
| Shares sold | 42,069,204 | 72,616,042 | $555,702,088 | $968,356,768 |
| Reinvestment of distributions | 10,754,160 | 19,682,696 | 141,309,668 | 260,136,127 |
| Shares redeemed | (63,033,983) | (104,001,992) | (832,380,628) | (1,384,215,146) |
| Net increase (decrease) | (10,210,619) | (11,703,254) | $(135,368,872) | $(155,722,251) |
| Class K | | | | |
| Shares sold | 24,763,747 | 57,486,192 | $326,582,470 | $773,133,070 |
| Issued in exchange for the shares of Fidelity Freedom K 2015 Fund | – | 357,299,109 | – | 4,748,505,056 |
| Reinvestment of distributions | 8,549,615 | 12,372,220 | 112,170,943 | 165,416,578 |
| Shares redeemed | (83,158,645) | (79,691,095) | (1,097,577,183) | (1,075,934,728) |
| Net increase (decrease) | (49,845,283) | 347,466,426 | $(658,823,770) | $4,611,119,976 |
| Class K6 | | | | |
| Shares sold | 21,150,472 | 10,514,183 | $280,449,664 | $140,899,779 |
| Reinvestment of distributions | 346,650 | 162,796 | 4,548,045 | 2,176,583 |
| Shares redeemed | (2,371,453) | (2,096,076) | (31,309,506) | (28,077,012) |
| Net increase (decrease) | 19,125,669 | 8,580,903 | $253,688,203 | $114,999,350 |
| Fidelity Freedom 2020 Fund | | | | |
| Fidelity Freedom 2020 Fund | | | | |
| Shares sold | 100,964,511 | 152,441,221 | $1,654,474,680 | $2,504,940,140 |
| Reinvestment of distributions | 20,131,258 | 35,050,498 | 328,743,442 | 571,436,446 |
| Shares redeemed | (124,487,003) | (187,167,034) | (2,042,470,360) | (3,072,056,561) |
| Net increase (decrease) | (3,391,234) | 324,685 | $(59,252,238) | $4,320,025 |
| Class K | | | | |
| Shares sold | 81,218,328 | 159,801,375 | $1,331,407,311 | $2,656,458,207 |
| Issued in exchange for the shares of Fidelity Freedom K 2020 Fund | – | 997,191,746 | – | 16,284,141,352 |
| Reinvestment of distributions | 23,970,719 | 31,625,493 | 390,962,433 | 523,718,165 |
| Shares redeemed | (213,603,512) | (181,091,802) | (3,500,766,327) | (3,024,255,229) |
| Net increase (decrease) | (108,414,465) | 1,007,526,812 | $(1,778,396,583) | $16,440,062,495 |
| Class K6 | | | | |
| Shares sold | 59,778,897 | 31,475,610 | $984,841,647 | $521,683,894 |
| Reinvestment of distributions | 1,033,534 | 458,124 | 16,867,279 | 7,591,110 |
| Shares redeemed | (4,685,421) | (3,147,676) | (76,820,509) | (52,491,121) |
| Net increase (decrease) | 56,127,010 | 28,786,058 | $924,888,417 | $476,783,883 |
| Fidelity Freedom 2025 Fund | | | | |
| Fidelity Freedom 2025 Fund | | | | |
| Shares sold | 115,752,184 | 158,726,717 | $1,650,321,426 | $2,259,361,477 |
| Reinvestment of distributions | 18,499,634 | 30,656,487 | 263,619,804 | 433,261,289 |
| Shares redeemed | (120,383,751) | (151,675,334) | (1,722,482,523) | (2,154,686,419) |
| Net increase (decrease) | 13,868,067 | 37,707,870 | $191,458,707 | $537,936,347 |
| Class K | | | | |
| Shares sold | 110,517,604 | 199,976,963 | $1,578,994,350 | $2,881,263,698 |
| Issued in exchange for the shares of Fidelity Freedom K 2025 Fund | – | 1,039,138,058 | – | 14,641,455,337 |
| Reinvestment of distributions | 24,363,221 | 31,228,538 | 346,688,633 | 449,690,945 |
| Shares redeemed | (218,947,438) | (171,473,684) | (3,125,322,228) | (2,483,694,512) |
| Net increase (decrease) | (84,066,613) | 1,098,869,875 | $(1,199,639,245) | $15,488,715,468 |
| Class K6 | | | | |
| Shares sold | 80,963,256 | 47,051,793 | $1,164,521,730 | $673,422,348 |
| Reinvestment of distributions | 1,331,974 | 715,836 | 18,967,304 | 10,315,195 |
| Shares redeemed | (5,116,200) | (4,172,324) | (73,271,821) | (60,270,553) |
| Net increase (decrease) | 77,179,030 | 43,595,305 | $1,110,217,213 | $623,466,990 |
| Fidelity Freedom 2030 Fund | | | | |
| Fidelity Freedom 2030 Fund | | | | |
| Shares sold | 89,856,024 | 123,266,681 | $1,607,142,710 | $2,193,032,389 |
| Reinvestment of distributions | 19,465,688 | 31,803,918 | 348,046,505 | 561,630,140 |
| Shares redeemed | (89,285,758) | (126,546,656) | (1,604,093,908) | (2,245,714,755) |
| Net increase (decrease) | 20,035,954 | 28,523,943 | $351,095,307 | $508,947,774 |
| Class K | | | | |
| Shares sold | 93,910,114 | 159,214,941 | $1,684,872,969 | $2,878,963,957 |
| Issued in exchange for the shares of Fidelity Freedom K 2030 Fund | – | 980,848,240 | –�� | 17,213,886,716 |
| Reinvestment of distributions | 26,529,194 | 32,337,117 | 473,811,407 | 584,008,406 |
| Shares redeemed | (178,456,993) | (148,080,700) | (3,197,204,014) | (2,692,845,198) |
| Net increase (decrease) | (58,017,685) | 1,024,319,598 | $(1,038,519,638) | $17,984,013,881 |
| Class K6 | | | | |
| Shares sold | 62,570,300 | 47,995,734 | $1,130,087,929 | $858,334,852 |
| Reinvestment of distributions | 1,507,697 | 885,011 | 26,942,551 | 16,000,993 |
| Shares redeemed | (4,118,136) | (3,213,471) | (74,124,983) | (58,671,562) |
| Net increase (decrease) | 59,959,861 | 45,667,274 | $1,082,905,497 | $815,664,283 |
| Fidelity Freedom 2035 Fund | | | | |
| Fidelity Freedom 2035 Fund | | | | |
| Shares sold | 86,025,453 | 110,962,220 | $1,299,965,870 | $1,654,304,549 |
| Reinvestment of distributions | 15,107,462 | 21,957,182 | 229,180,205 | 325,960,643 |
| Shares redeemed | (82,917,707) | (99,897,658) | (1,262,836,996) | (1,486,838,456) |
| Net increase (decrease) | 18,215,208 | 33,021,744 | $266,309,079 | $493,426,736 |
| Class K | | | | |
| Shares sold | 93,071,804 | 152,904,028 | $1,414,570,724 | $2,323,823,499 |
| Issued in exchange for the shares of Fidelity Freedom K 2035 Fund | – | 810,190,579 | – | 11,861,189,816 |
| Reinvestment of distributions | 22,189,920 | 25,155,590 | 335,955,382 | 383,622,740 |
| Shares redeemed | (162,819,808) | (133,107,016) | (2,469,554,267) | (2,040,612,137) |
| Net increase (decrease) | (47,558,084) | 855,143,181 | $(719,028,161) | $12,528,023,918 |
| Class K6 | | | | |
| Shares sold | 61,962,222 | 48,428,487 | $950,919,386 | $727,016,849 |
| Reinvestment of distributions | 1,501,983 | 875,553 | 22,770,060 | 13,360,944 |
| Shares redeemed | (3,635,653) | (2,447,780) | (55,459,264) | (37,752,360) |
| Net increase (decrease) | 59,828,552 | 46,856,260 | $918,230,182 | $702,625,433 |
| Fidelity Freedom 2040 Fund | | | | |
| Fidelity Freedom 2040 Fund | | | | |
| Shares sold | 114,357,824 | 136,619,831 | $1,212,979,858 | $1,431,492,061 |
| Reinvestment of distributions | 22,477,411 | 33,488,676 | 239,384,409 | 348,747,375 |
| Shares redeemed | (113,943,932) | (139,529,622) | (1,218,390,159) | (1,457,941,134) |
| Net increase (decrease) | 22,891,303 | 30,578,885 | $233,974,108 | $322,298,302 |
| Class K | | | | |
| Shares sold | 127,998,063 | 204,272,570 | $1,366,553,863 | $2,180,144,652 |
| Issued in exchange for the shares of Fidelity Freedom K 2040 Fund | – | 1,209,417,175 | – | 12,432,808,583 |
| Reinvestment of distributions | 33,636,990 | 38,561,612 | 357,897,586 | 412,994,864 |
| Shares redeemed | (234,086,037) | (192,024,994) | (2,494,022,833) | (2,069,340,268) |
| Net increase (decrease) | (72,450,984) | 1,260,226,363 | $(769,571,384) | $12,956,607,831 |
| Class K6 | | | | |
| Shares sold | 81,192,591 | 63,538,724 | $875,001,916 | $671,238,294 |
| Reinvestment of distributions | 2,045,840 | 1,066,834 | 21,767,741 | 11,425,788 |
| Shares redeemed | (4,778,362) | (3,427,354) | (51,099,743) | (37,056,376) |
| Net increase (decrease) | 78,460,069 | 61,178,204 | $845,669,914 | $645,607,706 |
| Fidelity Freedom 2045 Fund | | | | |
| Fidelity Freedom 2045 Fund | | | | |
| Shares sold | 75,278,694 | 83,678,942 | $904,770,311 | $990,525,865 |
| Reinvestment of distributions | 9,991,436 | 13,350,262 | 120,696,554 | 157,549,317 |
| Shares redeemed | (69,963,161) | (72,278,251) | (848,390,338) | (853,762,795) |
| Net increase (decrease) | 15,306,969 | 24,750,953 | $177,076,527 | $294,312,387 |
| Class K | | | | |
| Shares sold | 90,594,687 | 138,438,372 | $1,096,330,973 | $1,672,115,670 |
| Issued in exchange for the shares of Fidelity Freedom K 2045 Fund | – | 680,392,245 | – | 7,906,157,717 |
| Reinvestment of distributions | 18,708,391 | 20,403,619 | 225,623,203 | 247,495,898 |
| Shares redeemed | (145,350,988) | (114,898,251) | (1,756,100,626) | (1,401,257,211) |
| Net increase (decrease) | (36,047,910) | 724,335,985 | $(434,146,450) | $8,424,512,074 |
| Class K6 | | | | |
| Shares sold | 55,104,850 | 35,416,332 | $674,338,014 | $424,716,328 |
| Reinvestment of distributions | 1,072,161 | 497,430 | 12,930,259 | 6,038,804 |
| Shares redeemed | (2,544,483) | (1,761,820) | (30,859,157) | (21,547,868) |
| Net increase (decrease) | 53,632,528 | 34,151,942 | $656,409,116 | $409,207,264 |
| Fidelity Freedom 2050 Fund | | | | |
| Fidelity Freedom 2050 Fund | | | | |
| Shares sold | 62,676,941 | 75,824,728 | $758,627,978 | $902,647,093 |
| Reinvestment of distributions | 8,041,120 | 10,861,802 | 97,699,616 | 128,951,626 |
| Shares redeemed | (55,905,302) | (63,697,605) | (681,837,559) | (756,367,850) |
| Net increase (decrease) | 14,812,759 | 22,988,925 | $174,490,035 | $275,230,869 |
| Class K | | | | |
| Shares sold | 85,023,890 | 122,562,514 | $1,034,677,925 | $1,491,197,304 |
| Issued in exchange for the shares of Fidelity Freedom K 2050 Fund | – | 572,849,516 | – | 6,690,882,218 |
| Reinvestment of distributions | 15,746,600 | 17,173,138 | 191,006,262 | 209,512,284 |
| Shares redeemed | (127,274,019) | (96,878,288) | (1,546,685,578) | (1,187,384,579) |
| Net increase (decrease) | (26,503,529) | 615,706,880 | $(321,001,391) | $7,204,207,227 |
| Class K6 | | | | |
| Shares sold | 46,171,269 | 28,136,620 | $568,148,027 | $340,101,592 |
| Reinvestment of distributions | 823,900 | 358,805 | 10,002,143 | 4,377,425 |
| Shares redeemed | (2,658,062) | (1,536,761) | (32,458,367) | (18,895,572) |
| Net increase (decrease) | 44,337,107 | 26,958,664 | $545,691,803 | $325,583,445 |
| Fidelity Freedom 2055 Fund | | | | |
| Fidelity Freedom 2055 Fund | | | | |
| Shares sold | 30,143,474 | 38,370,551 | $412,297,361 | $515,078,307 |
| Reinvestment of distributions | 2,447,312 | 2,987,887 | 33,577,117 | 40,144,179 |
| Shares redeemed | (22,821,438) | (23,349,667) | (314,192,707) | (313,087,284) |
| Net increase (decrease) | 9,769,348 | 18,008,771 | $131,681,771 | $242,135,202 |
| Class K | | | | |
| Shares sold | 46,944,626 | 61,914,305 | $645,358,663 | $850,947,947 |
| Issued in exchange for the shares of Fidelity Freedom K 2055 Fund | – | 187,145,598 | – | 2,460,964,568 |
| Reinvestment of distributions | 5,152,547 | 5,543,037 | 70,641,422 | 76,216,759 |
| Shares redeemed | (47,923,670) | (35,972,762) | (658,081,760) | (496,645,456) |
| Net increase (decrease) | 4,173,503 | 218,630,178 | $57,918,325 | $2,891,483,818 |
| Class K6 | | | | |
| Shares sold | 19,370,629 | 10,467,862 | $269,291,987 | $142,591,736 |
| Reinvestment of distributions | 267,554 | 125,661 | 3,670,845 | 1,727,838 |
| Shares redeemed | (1,203,845) | (701,172) | (16,583,508) | (9,691,523) |
| Net increase (decrease) | 18,434,338 | 9,892,351 | $256,379,324 | $134,628,051 |
| Fidelity Freedom 2060 Fund | | | | |
| Fidelity Freedom 2060 Fund | | | | |
| Shares sold | 9,862,313 | 13,553,573 | $120,757,734 | $162,527,190 |
| Reinvestment of distributions | 460,211 | 472,322 | 5,642,179 | 5,668,501 |
| Shares redeemed | (5,461,471) | (4,749,212) | (67,177,088) | (56,963,732) |
| Net increase (decrease) | 4,861,053 | 9,276,683 | $59,222,825 | $111,231,959 |
| Class K | | | | |
| Shares sold | 19,320,842 | 21,671,635 | $237,336,253 | $266,499,060 |
| Issued in exchange for the shares of Fidelity Freedom K 2060 Fund | – | 30,017,564 | – | 350,605,136 |
| Reinvestment of distributions | 953,157 | 897,950 | 11,676,178 | 10,999,891 |
| Shares redeemed | (12,034,179) | (7,538,541) | (147,707,053) | (92,630,473) |
| Net increase (decrease) | 8,239,820 | 45,048,608 | $101,305,378 | $535,473,614 |
| Class K6 | | | | |
| Shares sold | 4,634,350 | 2,364,906 | $57,544,228 | $28,724,895 |
| Reinvestment of distributions | 51,151 | 24,823 | 627,109 | 304,083 |
| Shares redeemed | (327,504) | (186,212) | (4,033,992) | (2,286,597) |
| Net increase (decrease) | 4,357,997 | 2,203,517 | $54,137,345 | $26,742,381 |
(a) Amounts for Class K and Class K6 are for the period July 20, 2017 and June 7, 2017, respectively, (commencement of sale of shares) to March 31, 2018.
10. Other.
The Funds' organizational documents provide former and current trustees and officers with a limited indemnification against liabilities arising in connection with the performance of their duties to the Funds. In the normal course of business, the Funds may also enter into contracts that provide general indemnifications. The Funds' maximum exposure under these arrangements is unknown as this would be dependent on future claims that may be made against the Funds. The risk of material loss from such claims is considered remote.
The Funds do not invest in the Underlying Funds for the purpose of exercising management or control; however, investments by the Funds within their principal investment strategies may represent a significant portion of the Underlying Fund's net assets. At the end of the period, the following Funds were the owners of record of 10% or more of the total outstanding shares of the Underlying Funds.
| | Fidelity Freedom 2010 Fund | Fidelity Freedom 2015 Fund | Fidelity Freedom 2025 Fund | Fidelity Freedom 2030 Fund | Fidelity Freedom 2035 Fund | Fidelity Freedom 2040 Fund | Fidelity Freedom 2045 Fund |
| Fidelity Series Small Cap Opportunities Fund | – | – | 11% | 16% | 13% | 14% | – |
| Fidelity Series Investment Grade Bond Fund | – | 10% | 21% | 19% | 1% | – | – |
| Fidelity Series All-Sector Equity Fund | – | – | 10% | 15% | 13% | 15% | – |
| Fidelity Series Emerging Markets Opportunities Fund | – | – | 12% | 16% | 13% | 14% | – |
| Fidelity Series Inflation-Protected Bond Index Fund | 10% | 12% | 19% | – | – | – | – |
| Fidelity Series High Income Fund | – | – | 14% | 16% | 11% | 11% | – |
| Fidelity Series Floating Rate High Income Fund | – | – | 14% | 16% | 11% | 11% | – |
| Fidelity Series Real Estate Income Fund | – | – | 14% | 16% | 11% | 11% | – |
| Fidelity Series Commodity Strategy Fund | – | – | 13% | 16% | 11% | 12% | – |
| Fidelity Series International Growth Fund | – | – | 11% | 16% | 13% | 14% | – |
| Fidelity Series International Value Fund | – | – | 11% | 16% | 13% | 14% | – |
| Fidelity Series International Small Cap Fund | – | – | 11% | 16% | 13% | 14% | – |
| Fidelity Series Emerging Markets Debt Fund | – | – | 14% | 16% | 10% | 11% | – |
| Fidelity Series Value Discovery Fund | – | – | 11% | 16% | 13% | 13% | – |
| Fidelity Series Intrinsic Opportunities Fund | – | – | 13% | 18% | 15% | 16% | – |
| Fidelity Series Large Cap Stock Fund | – | – | 11% | 16% | 13% | 14% | – |
| Fidelity Series Opportunistic Insights Fund | – | – | 11% | 16% | 13% | 14% | – |
| Fidelity Series Stock Selector Large Cap Value Fund | – | – | 11% | 16% | 13% | 14% | – |
| Fidelity Series Growth Company Fund | – | – | 12% | 18% | 15% | 16% | 10% |
| Fidelity Series Blue Chip Growth Fund | – | – | 12% | 18% | 15% | 16% | 10% |
| Fidelity Series Large Cap Value Index Fund | – | – | 12% | 18% | 14% | 15% | – |
| Fidelity Series Small Cap Discovery Fund | – | – | 13% | 18% | 15% | 15% | – |
| Fidelity Series Short-Term Credit Fund | – | 11% | 18% | – | – | – | – |
| Fidelity Series Government Money Market Fund | – | 10% | 15% | – | – | – | – |
| Fidelity Series Long-Term Treasury Bond Index Fund | – | – | 14% | 17% | 12% | – | – |
| Fidelity Series International Credit Fund | – | – | 15% | 15% | 10% | 10% | – |
| Fidelity Series Canada Fund | – | – | 12% | 16% | 13% | 14% | – |
| Fidelity Series Emerging Markets Fund | – | – | – | – | – | 15% | – |
The Funds, in aggregate, were the owners of record of more than 20% of the total outstanding shares of the following Underlying Funds.
| Fund | % of shares held |
| Fidelity Series Small Cap Opportunities Fund | 89% |
| Fidelity Series Investment Grade Bond Fund | 91% |
| Fidelity Series All-Sector Equity Fund | 87% |
| Fidelity Series Emerging Markets Opportunities Fund | 90% |
| Fidelity Series Inflation-Protected Bond Index Fund | 83% |
| Fidelity Series High Income Fund | 91% |
| Fidelity Series Floating Rate High Income Fund | 90% |
| Fidelity Series Real Estate Income Fund | 90% |
| Fidelity Series Commodity Strategy Fund | 90% |
| Fidelity Series International Growth Fund | 90% |
| Fidelity Series International Value Fund | 90% |
| Fidelity Series International Small Cap Fund | 90% |
| Fidelity Series Emerging Markets Debt Fund | 90% |
| Fidelity Series Value Discovery Fund | 86% |
| Fidelity Series Intrinsic Opportunities Fund | 99% |
| Fidelity Series Large Cap Stock Fund | 88% |
| Fidelity Series Opportunistic Insights Fund | 87% |
| Fidelity Series Stock Selector Large Cap Value Fund | 89% |
| Fidelity Series Growth Company Fund | 99% |
| Fidelity Series Blue Chip Growth Fund | 99% |
| Fidelity Series Large Cap Value Index Fund | 94% |
| Fidelity Series Small Cap Discovery Fund | 99% |
| Fidelity Series Short-Term Credit Fund | 91% |
| Fidelity Series Government Money Market Fund | 91% |
| Fidelity Series Long-Term Treasury Bond Index Fund | 83% |
| Fidelity Series International Credit Fund | 91% |
| Fidelity Series Canada Fund | 90% |
| Fidelity Series Emerging Markets Fund | 67% |
11. Prior Year Merger Information.
On September 8, 2017, each Surviving Fund acquired all of the assets and assumed all of the liabilities of each Target Fund pursuant to each Agreement and Plan of Reorganization approved by the Board of Trustees ("The Board"). Each acquisition was accomplished by an exchange of Class K shares of each Surviving Fund for corresponding shares then outstanding of each Target Fund, at their respective net asset value on the acquisition date. In addition, the Board approved the creation of additional classes of shares that commenced sale of shares on July 20, 2017. The reorganization provided shareholders of each Target Fund access to a larger portfolio with a similar investment objective and lower expenses. The reorganization qualified as a tax-free reorganization for federal income tax purposes with no gain or loss recognized to the funds or their shareholders.
Combined total net assets after the acquisition are as follows:
| Target Funds | Securities | Unrealized appreciation (depreciation) | Net Assets | Surviving Funds | Net assets | Total net assets after the acquisition |
| Fidelity Freedom K 2005 Fund | $412,419,889 | $40,449,279 | $412,589,249 | Fidelity Freedom 2005 Fund | $610,614,214 | $1,023,203,463 |
| Fidelity Freedom K 2010 Fund | 2,546,556,623 | 329,226,460 | 2,547,535,809 | Fidelity Freedom 2010 Fund | 4,238,458,400 | 6,785,994,209 |
| Fidelity Freedom K 2015 Fund | 4,746,815,623 | 696,286,166 | 4,748,505,056 | Fidelity Freedom 2015 Fund | 5,645,731,933 | 10,394,236,989 |
| Fidelity Freedom K 2020 Fund | 16,278,675,415 | 2,424,773,804 | 16,284,141,352 | Fidelity Freedom 2020 Fund | 13,414,449,646 | 29,698,590,998 |
| Fidelity Freedom K 2025 Fund | 14,636,906,056 | 2,237,270,202 | 14,641,455,337 | Fidelity Freedom 2025 Fund | 11,194,758,422 | 25,836,213,759 |
| Fidelity Freedom K 2030 Fund | 17,209,401,290 | 3,150,938,702 | 17,213,886,716 | Fidelity Freedom 2030 Fund | 12,912,345,253 | 30,126,231,969 |
| Fidelity Freedom K 2035 Fund | 11,858,805,237 | 2,326,083,837 | 11,861,189,816 | Fidelity Freedom 2035 Fund | 8,269,361,979 | 20,130,551,795 |
| Fidelity Freedom K 2040 Fund | 12,430,342,176 | 2,512,607,175 | 12,432,808,583 | Fidelity Freedom 2040 Fund | 8,489,396,048 | 20,922,204,631 |
| Fidelity Freedom K 2045 Fund | 7,904,615,516 | 1,469,965,780 | 7,906,157,717 | Fidelity Freedom 2045 Fund | 4,301,147,363 | 12,207,305,080 |
| Fidelity Freedom K 2050 Fund | 6,689,588,035 | 1,219,930,995 | 6,690,882,218 | Fidelity Freedom 2050 Fund | 3,509,123,170 | 10,200,005,388 |
| Fidelity Freedom K 2055 Fund | 2,460,473,831 | 326,647,894 | 2,460,964,568 | Fidelity Freedom 2055 Fund | 1,221,516,226 | 3,682,480,794 |
| Fidelity Freedom K 2060 Fund | 350,535,702 | 37,076,005 | 350,605,136 | Fidelity Freedom 2060 Fund | 184,982,168 | 535,587,304 |
| Fidelity Freedom K Income Fund | 1,612,974,652 | 111,654,038 | 1,613,678,107 | Fidelity Freedom Income Fund | 2,180,776,091 | 3,794,454,198 |
Pro forma results of operations of the combined entity for the entire period ended March 31, 2018, as though the acquisition had occurred as of the beginning of the year (rather than on the actual acquisition date), are as follows:
| Surviving Funds | Net investment income (loss) | Total net realized gain (loss) | Total change in net unrealized appreciation (depreciation) | Net increase (decrease) in net assets resulting from operations |
| Fidelity Freedom 2005 Fund | $16,728,029 | $35,389,643 | $11,609,337 | $63,727,009 |
| Fidelity Freedom 2010 Fund | 106,763,939 | 333,966,494 | 71,884,105 | 512,614,538 |
| Fidelity Freedom 2015 Fund | 159,942,201 | 586,125,932 | 165,934,516 | 912,002,649 |
| Fidelity Freedom 2020 Fund | 450,417,256 | 1,534,035,495 | 849,346,252 | 2,833,799,003 |
| Fidelity Freedom 2025 Fund | 380,268,141 | 1,245,869,247 | 1,016,040,300 | 2,642,177,688 |
| Fidelity Freedom 2030 Fund | 412,091,376 | 1,721,922,624 | 1,479,580,811 | 3,613,594,811 |
| Fidelity Freedom 2035 Fund | 242,223,907 | 1,155,921,037 | 1,298,580,090 | 2,696,725,034 |
| Fidelity Freedom 2040 Fund | 248,017,447 | 1,233,803,836 | 1,365,296,048 | 2,847,117,331 |
| Fidelity Freedom 2045 Fund | 146,215,610 | 672,902,843 | 832,531,991 | 1,651,650,444 |
| Fidelity Freedom 2050 Fund | 122,703,111 | 561,458,056 | 703,867,025 | 1,388,028,192 |
| Fidelity Freedom 2055 Fund | 45,262,250 | 182,494,227 | 254,156,558 | 481,913,035 |
| Fidelity Freedom 2060 Fund | 7,044,354 | 27,215,638 | 32,045,178 | 66,305,170 |
| Fidelity Freedom Income Fund | 63,379,287 | 104,507,706 | 13,301,658 | 181,188,651 |
Because each combined investment portfolio have been managed as a single portfolio since each acquisition was completed, it is not practicable to separate the amounts of revenue and earnings of each Target Fund that have been included in the Surviving Fund's accompanying Statement of Operations since September 8, 2017.
Shareholder Expense Example
As a shareholder of a Fund, you incur two types of costs: (1) transaction costs and (2) ongoing costs, including other Fund expenses. This Example is intended to help you understand your ongoing costs (in dollars) of investing in the Funds and to compare these costs with the ongoing costs of investing in other mutual funds.
The Example is based on an investment of $1,000 invested at the beginning of the period and held for the entire period (April 1, 2018 to September 30, 2018).
Actual Expenses
The first line of the accompanying table for each Class of each fund provides information about actual account values and actual expenses. You may use the information in this line, together with the amount you invested, to estimate the expenses that you paid over the period. Simply divide your account value by $1,000.00 (for example, an $8,600 account value divided by $1,000.00 = 8.6), then multiply the result by the number in the first line for a Class of the fund under the heading entitled "Expenses Paid During Period" to estimate the expenses you paid on your account during this period. A small balance maintenance fee of $12.00 that is charged once a year may apply for certain accounts with a value of less than $2,000. This fee, which was eliminated effective August 1, 2018, is not included in the table below. If it was, the estimate of expenses you paid during the period would be higher, and your ending account value lower, by this amount. In addition, each Fund, as a shareholder in underlying Fidelity Funds, will indirectly bear its pro-rata share of the fees and expenses incurred by the underlying Fidelity Funds. These fees and expenses are not included in each Fund's annualized expense ratio used to calculate the expense estimates in the table below.
Hypothetical Example for Comparison Purposes
The second line of the accompanying table for each Class of each fund provides information about hypothetical account values and hypothetical expenses based on a Class' actual expense ratio and an assumed rate of return of 5% per year before expenses, which is not the Class' actual return. The hypothetical account values and expenses may not be used to estimate the actual ending account balance or expenses you paid for the period. You may use this information to compare the ongoing costs of investing in the Fund and other funds. To do so, compare this 5% hypothetical example with the 5% hypothetical examples that appear in the shareholder reports of the other funds. A small balance maintenance fee of $12.00 that is charged once a year may apply for certain accounts with a value of less than $2,000. This fee, which was eliminated effective August 1, 2018, is not included in the table below. If it was, the estimate of expenses you paid during the period would be higher, and your ending account value lower, by this amount. In addition, each Fund, as a shareholder in underlying Fidelity Funds, will indirectly bear its pro-rata share of the fees and expenses incurred by the underlying Fidelity Funds. These fees and expenses are not included in each Fund's annualized expense ratio used to calculate the expense estimates in the table below.
Please note that the expenses shown in the table are meant to highlight your ongoing costs only and do not reflect any transaction costs. Therefore, the second line of the table is useful in comparing ongoing costs only, and will not help you determine the relative total costs of owning different funds.
| | Annualized Expense Ratio-A | Beginning
Account Value
April 1, 2018 | Ending
Account Value
September 30, 2018 | Expenses Paid
During Period-B
April 1, 2018
to September 30, 2018 |
| Fidelity Freedom Income Fund | | | | |
| Fidelity Freedom Income Fund | .46% | | | |
| Actual | | $1,000.00 | $1,008.30 | $2.32 |
| Hypothetical-C | | $1,000.00 | $1,022.76 | $2.33 |
| Class K | .41% | | | |
| Actual | | $1,000.00 | $1,007.80 | $2.06 |
| Hypothetical-C | | $1,000.00 | $1,023.01 | $2.08 |
| Class K6 | .37% | | | |
| Actual | | $1,000.00 | $1,008.30 | $1.86 |
| Hypothetical-C | | $1,000.00 | $1,023.21 | $1.88 |
| Fidelity Freedom 2005 Fund | | | | |
| Fidelity Freedom 2005 Fund | .48% | | | |
| Actual | | $1,000.00 | $1,012.80 | $2.42 |
| Hypothetical-C | | $1,000.00 | $1,022.66 | $2.43 |
| Class K | .43% | | | |
| Actual | | $1,000.00 | $1,012.10 | $2.17 |
| Hypothetical-C | | $1,000.00 | $1,022.91 | $2.18 |
| Class K6 | .37% | | | |
| Actual | | $1,000.00 | $1,013.40 | $1.87 |
| Hypothetical-C | | $1,000.00 | $1,023.21 | $1.88 |
| Fidelity Freedom 2010 Fund | | | | |
| Fidelity Freedom 2010 Fund | .52% | | | |
| Actual | | $1,000.00 | $1,017.10 | $2.63 |
| Hypothetical-C | | $1,000.00 | $1,022.46 | $2.64 |
| Class K | .46% | | | |
| Actual | | $1,000.00 | $1,017.20 | $2.33 |
| Hypothetical-C | | $1,000.00 | $1,022.76 | $2.33 |
| Class K6 | .39% | | | |
| Actual | | $1,000.00 | $1,017.20 | $1.97 |
| Hypothetical-C | | $1,000.00 | $1,023.11 | $1.98 |
| Fidelity Freedom 2015 Fund | | | | |
| Fidelity Freedom 2015 Fund | .57% | | | |
| Actual | | $1,000.00 | $1,021.60 | $2.89 |
| Hypothetical-C | | $1,000.00 | $1,022.21 | $2.89 |
| Class K | .50% | | | |
| Actual | | $1,000.00 | $1,021.70 | $2.53 |
| Hypothetical-C | | $1,000.00 | $1,022.56 | $2.54 |
| Class K6 | .41% | | | |
| Actual | | $1,000.00 | $1,022.40 | $2.08 |
| Hypothetical-C | | $1,000.00 | $1,023.01 | $2.08 |
| Fidelity Freedom 2020 Fund | | | | |
| Fidelity Freedom 2020 Fund | .61% | | | |
| Actual | | $1,000.00 | $1,025.00 | $3.10 |
| Hypothetical-C | | $1,000.00 | $1,022.01 | $3.09 |
| Class K | .53% | | | |
| Actual | | $1,000.00 | $1,025.70 | $2.69 |
| Hypothetical-C | | $1,000.00 | $1,022.41 | $2.69 |
| Class K6 | .43% | | | |
| Actual | | $1,000.00 | $1,026.40 | $2.18 |
| Hypothetical-C | | $1,000.00 | $1,022.91 | $2.18 |
| Fidelity Freedom 2025 Fund | | | | |
| Fidelity Freedom 2025 Fund | .65% | | | |
| Actual | | $1,000.00 | $1,028.80 | $3.31 |
| Hypothetical-C | | $1,000.00 | $1,021.81 | $3.29 |
| Class K | .57% | | | |
| Actual | | $1,000.00 | $1,028.90 | $2.90 |
| Hypothetical-C | | $1,000.00 | $1,022.21 | $2.89 |
| Class K6 | .45% | | | |
| Actual | | $1,000.00 | $1,029.60 | $2.29 |
| Hypothetical-C | | $1,000.00 | $1,022.81 | $2.28 |
| Fidelity Freedom 2030 Fund | | | | |
| Fidelity Freedom 2030 Fund | .70% | | | |
| Actual | | $1,000.00 | $1,035.20 | $3.57 |
| Hypothetical-C | | $1,000.00 | $1,021.56 | $3.55 |
| Class K | .60% | | | |
| Actual | | $1,000.00 | $1,035.30 | $3.06 |
| Hypothetical-C | | $1,000.00 | $1,022.06 | $3.04 |
| Class K6 | .47% | | | |
| Actual | | $1,000.00 | $1,036.00 | $2.40 |
| Hypothetical-C | | $1,000.00 | $1,022.71 | $2.38 |
| Fidelity Freedom 2035 Fund | | | | |
| Fidelity Freedom 2035 Fund | .74% | | | |
| Actual | | $1,000.00 | $1,042.40 | $3.79 |
| Hypothetical-C | | $1,000.00 | $1,021.36 | $3.75 |
| Class K | .64% | | | |
| Actual | | $1,000.00 | $1,043.20 | $3.28 |
| Hypothetical-C | | $1,000.00 | $1,021.86 | $3.24 |
| Class K6 | .49% | | | |
| Actual | | $1,000.00 | $1,043.80 | $2.51 |
| Hypothetical-C | | $1,000.00 | $1,022.61 | $2.48 |
| Fidelity Freedom 2040 Fund | | | | |
| Fidelity Freedom 2040 Fund | .75% | | | |
| Actual | | $1,000.00 | $1,044.80 | $3.84 |
| Hypothetical-C | | $1,000.00 | $1,021.31 | $3.80 |
| Class K | .64% | | | |
| Actual | | $1,000.00 | $1,045.90 | $3.28 |
| Hypothetical-C | | $1,000.00 | $1,021.86 | $3.24 |
| Class K6 | .49% | | | |
| Actual | | $1,000.00 | $1,046.70 | $2.51 |
| Hypothetical-C | | $1,000.00 | $1,022.61 | $2.48 |
| Fidelity Freedom 2045 Fund | | | | |
| Fidelity Freedom 2045 Fund | .75% | | | |
| Actual | | $1,000.00 | $1,045.30 | $3.85 |
| Hypothetical-C | | $1,000.00 | $1,021.31 | $3.80 |
| Class K | .64% | | | |
| Actual | | $1,000.00 | $1,045.50 | $3.28 |
| Hypothetical-C | | $1,000.00 | $1,021.86 | $3.24 |
| Class K6 | .49% | | | |
| Actual | | $1,000.00 | $1,046.10 | $2.51 |
| Hypothetical-C | | $1,000.00 | $1,022.61 | $2.48 |
| Fidelity Freedom 2050 Fund | | | | |
| Fidelity Freedom 2050 Fund | .75% | | | |
| Actual | | $1,000.00 | $1,044.80 | $3.84 |
| Hypothetical-C | | $1,000.00 | $1,021.31 | $3.80 |
| Class K | .64% | | | |
| Actual | | $1,000.00 | $1,045.70 | $3.28 |
| Hypothetical-C | | $1,000.00 | $1,021.86 | $3.24 |
| Class K6 | .49% | | | |
| Actual | | $1,000.00 | $1,046.50 | $2.51 |
| Hypothetical-C | | $1,000.00 | $1,022.61 | $2.48 |
| Fidelity Freedom 2055 Fund | | | | |
| Fidelity Freedom 2055 Fund | .75% | | | |
| Actual | | $1,000.00 | $1,044.80 | $3.84 |
| Hypothetical-C | | $1,000.00 | $1,021.31 | $3.80 |
| Class K | .64% | | | |
| Actual | | $1,000.00 | $1,045.60 | $3.28 |
| Hypothetical-C | | $1,000.00 | $1,021.86 | $3.24 |
| Class K6 | .49% | | | |
| Actual | | $1,000.00 | $1,046.30 | $2.51 |
| Hypothetical-C | | $1,000.00 | $1,022.61 | $2.48 |
| Fidelity Freedom 2060 Fund | | | | |
| Fidelity Freedom 2060 Fund | .75% | | | |
| Actual | | $1,000.00 | $1,044.90 | $3.84 |
| Hypothetical-C | | $1,000.00 | $1,021.31 | $3.80 |
| Class K | .64% | | | |
| Actual | | $1,000.00 | $1,045.80 | $3.28 |
| Hypothetical-C | | $1,000.00 | $1,021.86 | $3.24 |
| Class K6 | .49% | | | |
| Actual | | $1,000.00 | $1,046.60 | $2.51 |
| Hypothetical-C | | $1,000.00 | $1,022.61 | $2.48 |
A Annualized expense ratio reflects expenses net of applicable fee waivers.
B Expenses are equal to each Class' annualized expense ratio, multiplied by the average account value over the period, multiplied by 183/ 365 (to reflect the one-half year period). The fees and expenses of the underlying Fidelity Funds in which each Fund invests are not included in each Fund's annualized expense ratio.
C 5% return per year before expenses
Board Approval of Investment Advisory Contracts and Management Fees
Fidelity Freedom Funds
Each year, the Board of Trustees, including the Independent Trustees (together, the Board), votes on the renewal of the management contract (the Advisory Contract) with FMR Co., Inc. (FMRC), an affiliate of Fidelity Management & Research Company (FMR), for each fund. The Board, assisted by the advice of fund counsel and Independent Trustees' counsel, requests and considers a broad range of information relevant to the renewal of the Advisory Contracts throughout the year.
The Board meets regularly and, at each of its meetings, covers an extensive agenda of topics and materials and considers factors that are relevant to its annual consideration of the renewal of each fund's Advisory Contract, including the services and support provided to each fund and its shareholders. The Board has established four standing committees (Committees) — Operations, Audit, Fair Valuation, and Governance and Nominating — each composed of and chaired by Independent Trustees with varying backgrounds, to which the Board has assigned specific subject matter responsibilities in order to enhance effective decision-making by the Board. The Operations Committee, of which all of the Independent Trustees are members, meets regularly throughout the year and considers, among other matters, information specifically related to the annual consideration of the renewal of each fund's Advisory Contract. The Board, acting directly and through its Committees, requests and receives information concerning the annual consideration of the renewal of each fund's Advisory Contract. The Board also meets as needed to review matters specifically related to the Board's annual consideration of the renewal of the Advisory Contracts. Members of the Board may also meet with trustees of other Fidelity funds through joint ad hoc committees to discuss certain matters relevant to all of the Fidelity funds.
At its September 2018 meeting, the Board unanimously determined to renew each fund's Advisory Contract. In reaching its determination, the Board considered all factors it believed relevant, including (i) the nature, extent, and quality of the services to be provided to each fund and its shareholders (including the investment performance of each fund); (ii) the competitiveness of each fund's management fee and total expense ratio relative to peer funds; (iii) the total costs of the services to be provided by and the profits to be realized by Fidelity from its relationships with each fund; and (iv) the extent to which, if any, economies of scale exist and would be realized as each fund grows, and whether any economies of scale are appropriately shared with fund shareholders. The Board also considered that, effective June 1, 2017, each fund had implemented a new fee structure whereby it pays an all-inclusive management fee that covers all operating expenses of the fund, subject to certain exceptions, and varies by class (unified fee) and the underlying Fidelity funds in which the fund invests (Series Funds) no longer pay expenses, with certain limited exceptions. In connection with the renewal of the Advisory Contracts for the funds, the Board and the board of other funds that invest their assets in Series Funds and the boards of the Series Funds formed a joint ad hoc committee to review the responsibilities of each board related to the consideration of the renewal of the Advisory Contracts for the funds, other funds that invest substantially all of their assets in Series Funds, and the Series Funds.
In considering whether to renew the Advisory Contract for each fund, the Board reached a determination, with the assistance of fund counsel and Independent Trustees' counsel and through the exercise of its business judgment, that the renewal of the Advisory Contract was in the best interests of each fund and its shareholders and that the compensation payable under the Advisory Contracts was fair and reasonable. The Board's decision to renew the Advisory Contracts was not based on any single factor, but rather was based on a comprehensive consideration of all the information provided to the Board at its meetings throughout the year. The Board, in reaching its determination to renew the Advisory Contracts, was aware that shareholders of each fund have a broad range of investment choices available to them, including a wide choice among funds offered by Fidelity's competitors, and that each fund's shareholders, who have the opportunity to review and weigh the disclosure provided by the fund in its prospectus and other public disclosures, have chosen to invest in that fund, which is part of the Fidelity family of funds.
Nature, Extent, and Quality of Services Provided. The Board considered Fidelity's staffing as it relates to the funds, including the backgrounds of investment personnel of FMRC, and also considered the funds' investment objectives, strategies, and related investment philosophies. The Independent Trustees also had discussions with senior management of Fidelity's investment operations and investment groups with responsibility for the Series Funds. The Board considered the structure of the investment personnel compensation program and whether this structure provides appropriate incentives to act in the best interests of each fund. Additionally, the Board considered the portfolio managers' investments, if any, in the funds that they manage.
Resources Dedicated to Investment Management and Support Services. The Board reviewed the general qualifications and capabilities of Fidelity's investment staff, including its size, education, experience, and resources, as well as Fidelity's approach to recruiting, managing, and compensating investment personnel. The Board noted that Fidelity has continued to increase the resources devoted to non-U.S. offices, including expansion of Fidelity's global investment organization. The Board also noted that Fidelity's analysts have extensive resources, tools and capabilities that allow them to conduct sophisticated quantitative and fundamental analysis, as well as credit analysis of issuers, counterparties and guarantors. Further, the Board considered that Fidelity's investment professionals have sufficient access to global information and data so as to provide competitive investment results over time, and that those professionals also have access to sophisticated tools that permit them to assess portfolio construction and risk and performance attribution characteristics continuously, as well as to transmit new information and research conclusions rapidly around the world. Additionally, in its deliberations, the Board considered Fidelity's risk management, compliance, and technology and operations capabilities and resources, which are integral parts of the investment management process.
Shareholder and Administrative Services. The Board considered (i) the nature, extent, quality, and cost of advisory, administrative, and shareholder services performed by Fidelity under the Advisory Contract and under separate agreements covering transfer agency and pricing and bookkeeping services for each fund; (ii) the nature and extent of the supervision of third party service providers, principally custodians, subcustodians, and pricing vendors; and (iii) the resources devoted to, and the record of compliance with, each fund's compliance policies and procedures.
The Board noted that the growth of fund assets over time across the complex allows Fidelity to reinvest in the development of services designed to enhance the value and convenience of the Fidelity funds as investment vehicles. These services include 24-hour access to account information and market information through telephone representatives and over the Internet, investor education materials and asset allocation tools, and the expanded availability of Fidelity Investor Centers.
Investment in a Large Fund Family. The Board considered the benefits to shareholders of investing in a Fidelity fund, including the benefits of investing in a fund that is part of a large family of funds offering a variety of investment disciplines and providing a large variety of mutual fund investor services. The Board noted that Fidelity had taken, or had made recommendations that resulted in the Fidelity funds taking, a number of actions over the previous year that benefited particular funds, including: (i) continuing to dedicate additional resources to Fidelity's investment research process, which includes meetings with management of issuers of securities in which the funds invest, and to the support of the senior management team that oversees asset management; (ii) continuing efforts to enhance Fidelity's global research capabilities; (iii) launching new funds and making other enhancements to meet client needs; (iv) launching new share classes of existing funds; (v) eliminating purchase minimums and broadening eligibility requirements for certain funds and share classes; (vi) reducing management fees and total expenses for certain growth equity funds and index funds; (vii) lowering expense caps for certain existing funds and classes, and converting certain voluntary expense caps to contractual caps, to reduce expenses borne by shareholders; (viii) eliminating short-term redemption fees for funds that had such fees; (ix) rationalizing product lines and gaining increased efficiencies from fund mergers and share class consolidations; (x) continuing to develop, acquire and implement systems and technology to improve services to the funds and shareholders, strengthen information security, and increase efficiency; and (xi) continuing to implement enhancements to further strengthen Fidelity's product line to increase investors' probability of success in achieving their investment goals, including retirement income goals.
Investment Performance. The Board considered whether each fund has operated in accordance with its investment objective, as well as its record of compliance with its investment restrictions and its performance history.
The Board took into account discussions that occur at Board meetings throughout the year with representatives of the investment adviser about fund investment performance. In this regard the Board noted that as part of regularly scheduled fund reviews and other reports to the Board on fund performance, the Board considers annualized return information for each fund for different time periods, measured against one or more appropriate securities market indices, including a customized blended index that reflects the respective weights of the fund's asset classes (each a "benchmark index") and a peer group of funds with similar objectives ("peer group"), if any. In its evaluation of fund investment performance at meetings throughout the year, the Board gave particular attention to information indicating underperformance of certain Fidelity funds for specific time periods and discussed with the investment adviser the reasons for such underperformance.
In addition to reviewing absolute and relative fund performance, the Independent Trustees periodically consider the appropriateness of fund performance metrics in evaluating the results achieved. In general, the Independent Trustees believe that fund performance should be evaluated based on gross performance (before fees and expenses, including acquired fund fees and expenses, but after transaction costs, if any) compared to appropriate benchmark indices, over appropriate time periods that may include full market cycles, and on net performance (after fees and expenses, including acquired fund fees and expenses, if any) compared to peer groups, as applicable, over the same periods, taking into account relevant factors including the following: general market conditions; the extent to which particular underlying funds affected performance; and fund cash flows and other factors. Depending on the circumstances, the Independent Trustees may be satisfied with a fund's performance notwithstanding that it lags its benchmark index or peer group for certain periods.
The Independent Trustees recognize that shareholders evaluate performance on a net basis over their own holding periods, for which one-, three-, and five-year periods are often used as a proxy. For this reason, the performance information reviewed by the Board also included net cumulative calendar year total return information for each fund and an appropriate benchmark index for the most recent one-, three-, and five-year periods (for the most recent one- and three-year periods for Freedom 2060 Fund).
Based on its review, the Board concluded that the nature, extent, and quality of services provided to each fund under the Advisory Contracts should continue to benefit the shareholders of each fund.
Competitiveness of Management Fee and Total Expense Ratio. The Board considered each fund's management fee and total expense ratio compared to "mapped groups" of competitive funds and classes created for the purpose of facilitating the Trustees' competitive analysis of management fees and total expenses. Fidelity creates "mapped groups" by combining similar Lipper investment objective categories that have comparable investment mandates. Combining Lipper investment objective categories aids the Board's management fee and total expense ratio comparisons by broadening the competitive group used for comparison.
Management Fee. The Board considered two proprietary management fee comparisons for the 12-month periods shown in basis points (BP) in the charts below. The group of Lipper funds used by the Board for management fee comparisons is referred to below as the "Total Mapped Group." The Total Mapped Group comparison focuses on a fund's standing in terms of gross management fees before expense reimbursements or caps relative to the total universe of funds with comparable investment mandates, regardless of whether their management fee structures also are comparable. Funds with comparable investment mandates offer exposure to similar types of securities. Funds with comparable management fee structures have similar management fee contractual arrangements (
e.g., flat rate charged for advisory services, all-inclusive fee rate,
etc.). "TMG %" represents the percentage of funds in the Total Mapped Group that had management fees that were lower than a fund's. For example, a hypothetical TMG % of 20% would mean that 80% of the funds in the Total Mapped Group had higher, and 20% had lower, management fees than a fund. The funds' actual TMG %s and the number of funds in the Total Mapped Group are in the charts below. The "Asset-Size Peer Group" (ASPG) comparison focuses on a fund's standing relative to a subset of non-Fidelity funds within the Total Mapped Group that are similar in size and management fee structure. For example, if a fund is in the first quartile of the ASPG, the fund's management fee ranks in the least expensive or lowest 25% of funds in the ASPG. The ASPG represents at least 15% of the funds in the Total Mapped Group with comparable asset size and management fee structures, subject to a minimum of 50 funds (or all funds in the Total Mapped Group if fewer than 50). Additional information, such as the ASPG quartile in which a fund's management fee rate ranked, is also included in the charts and was considered by the Board. The Board considered that the charts below reflect the funds' fee structure effective June 1, 2017, as if it was in effect for the entire year.
Fidelity Freedom 2005 Fund
Fidelity Freedom 2010 Fund
Fidelity Freedom 2015 Fund
Fidelity Freedom 2020 Fund
Fidelity Freedom 2025 Fund
Fidelity Freedom 2030 Fund
Fidelity Freedom 2035 Fund
Fidelity Freedom 2040 Fund
Fidelity Freedom 2045 Fund
Fidelity Freedom 2050 Fund
Fidelity Freedom 2055 Fund
Fidelity Freedom 2060 Fund
Fidelity Freedom Income Fund
The Board compared each fund's class-level management fee rate for the current fiscal year relative to the median of its competitor funds in the applicable Total Mapped Group based on competitive data for 2017. The Board noted that each fund's class-level management fee rate ranks above the median of its competitor funds in the applicable Total Mapped Group based on competitive data for 2017. The Board noted that the majority of peer funds do not have top-level management fees, similar to the funds' fee structure prior to June 1, 2017. The Board also noted that the funds' total expense comparisons, which include the expenses of the Series Funds, facilitate better comparisons with funds and classes that use different expense structures and that the funds' total expense ratio comparisons to competitors generally were more favorable.
Based on its review, the Board concluded that each fund's management fee is fair and reasonable in light of the services that the fund receives and the other factors considered.
Total Expense Ratio. In its review of the total expense ratio of each class of each fund, the Board considered the fund's class-level management fee rate under the Advisory Contract. The Board also considered other expenses, such as transfer agent fees, pricing and bookkeeping fees, and custodial, legal, and audit fees, paid by FMR under the unified fee arrangement. The Board also noted that Fidelity may agree to waive fees and expenses from time to time, and the extent to which, if any, it has done so for each fund. As part of its review, the Board considered the total expense ratio of each class of each fund compared to the median total expenses for competitor funds (including expenses of underlying funds) based on competitive data for 2017. Each class of each fund is compared to those funds and classes in the Total Mapped Group (used by the Board for management fee comparisons) that have a similar sales load structure.
The Board noted that each fund offers multiple classes and that the multiple structures are intended to offer pricing options for the intermediary market. The Board also noted that the total expense ratios of the classes of each fund vary primarily due to differences in transfer agent fees. The Board considered that, in general, various factors can affect total expense ratios.
The Board noted that the total expense ratio of the retail class (including expenses of the Series Funds): (i) ranked below the competitive median for 2017 for Freedom 2005 Fund, Freedom 2010 Fund, Freedom 2015 Fund, Freedom 2025 Fund, Freedom 2030 Fund, Freedom 2035 Fund, and Freedom Income Fund; (ii) ranked equal to the competitive median for 2017 for Freedom 2040 Fund, Freedom 2045 Fund, Freedom 2050 Fund, Freedom 2055 Fund, and Freedom 2060 Fund; and (iii) ranked above the competitive median for 2017 for Freedom 2020 Fund. The Board noted that for Freedom 2020 Fund, the total expense ratio of the retail class is above the competitive median because a number of competitor target date funds are classified by Lipper as active, even though their underlying holdings are primarily passive. The Board considered that, when the Total Mapped Group is adjusted to remove funds that invest primarily in passive products, the total expense ratio of the retail class of Freedom 2020 Fund ranks below the competitive median.
The Board noted that the total expense ratio of each of Class K and Class K6 (including expenses of the Series Funds) for each fund ranked below the competitive median for 2017.
The Board considered that current contractual arrangements for the fund oblige FMR to pay all "class-level" expenses of Class K6 of each fund to the extent necessary to limit total operating expenses, with certain exceptions, to an amount specified in the applicable expense contract.
These contractual arrangements may not be amended to increase the fees or expenses payable by Class K6 of a fund except by a vote of a majority of the Board of Trustees and by a vote of a majority of the outstanding voting securities of Class K6 of the applicable fund.
Fees Charged to Other Fidelity Clients. The Board also considered Fidelity fee structures and other information with respect to clients of Fidelity, such as other funds advised or subadvised by Fidelity, pension plan clients, and other institutional clients with similar mandates. The Board noted that a joint ad hoc committee created by it and the boards of other Fidelity funds periodically reviews and compares Fidelity's institutional investment advisory business with its business of providing services to the Fidelity funds and also noted the most recent findings of the committee. The Board noted that the committee's review included a consideration of the differences in services provided, fees charged, and costs incurred, as well as competition in the markets serving the different categories of clients.
Based on its review of total expense ratios and fees charged to other Fidelity clients, the Board concluded that the total expense ratio of each class of each fund was reasonable in light of the services that the fund and its shareholders receive and the other factors considered.
Costs of the Services and Profitability. The Board considered the revenues earned and the expenses incurred by Fidelity in conducting the business of developing, marketing, distributing, managing, administering and servicing each fund and the Series Funds in which each fund invests and in servicing each fund's shareholders. The Board also considered the level of Fidelity's profits in respect of all the Fidelity funds.
On an annual basis, Fidelity presents to the Board information about the profitability of its relationships with each fund. Fidelity calculates profitability information for each fund, as well as aggregate profitability information for groups of Fidelity funds and all Fidelity funds, using a series of detailed revenue and cost allocation methodologies which originate with the books and records of Fidelity on which Fidelity's audited financial statements are based. The Audit Committee of the Board reviews any significant changes from the prior year's methodologies.
PricewaterhouseCoopers LLP (PwC), auditor to Fidelity and certain Fidelity funds, has been engaged annually by the Board as part of the Board's assessment of Fidelity's profitability analysis. PwC's engagement includes the review and assessment of the methodologies used by Fidelity in determining the revenues and expenses attributable to Fidelity's mutual fund business, and completion of agreed-upon procedures in respect of the mathematical accuracy of the fund profitability information and its conformity to established allocation methodologies. After considering PwC's reports issued under the engagement and information provided by Fidelity, the Board concluded that while other allocation methods may also be reasonable, Fidelity's profitability methodologies are reasonable in all material respects.
The Board also reviewed Fidelity's non-fund businesses and potential indirect benefits such businesses may have received as a result of their association with Fidelity's mutual fund business (i.e., fall-out benefits) as well as cases where Fidelity's affiliates may benefit from the funds' business. The Board noted that changes to fall-out benefits year-over-year reflect business developments at Fidelity's various businesses.
The Board considered the costs of the services provided by and the profits realized by Fidelity in connection with the operation of each fund and was satisfied that the profitability was not excessive.
Economies of Scale. The Board considered whether there have been economies of scale in respect of the management of the Fidelity funds, whether the Fidelity funds (including each fund) have appropriately benefited from any such economies of scale, and whether there is potential for realization of any further economies of scale. The Board considered the extent to which each fund will benefit from economies of scale as assets grow through increased services to the fund, through waivers or reimbursements, or through fee or expense ratio reductions. The Board recognized that, due to each fund's current contractual arrangements, its expense ratio will not decline if the fund's operating costs decrease as assets grow, or rise as assets decrease. The Board also noted that a committee (the Economies of Scale Committee) created by it and the boards of other Fidelity funds periodically analyzes whether Fidelity attains economies of scale in respect of the management and servicing of the Fidelity funds, whether the Fidelity funds have appropriately benefited from such economies of scale, and whether there is potential for realization of any further economies of scale.
The Board concluded, taking into account the analysis of the Economies of Scale Committee, that economies of scale, if any, are being appropriately shared between fund shareholders and Fidelity.
Additional Information Requested by the Board. In order to develop fully the factual basis for consideration of the Fidelity funds' advisory contracts, the Board requested and received additional information on certain topics, including: (i) Fidelity's fund profitability methodology, profitability trends for certain funds, the allocation of various costs to different funds, and the impact of certain factors on fund profitability results; (ii) portfolio manager changes that have occurred during the past year and the amount of the investment that each portfolio manager has made in the Fidelity fund(s) that he or she manages; (iii) Fidelity's compensation structure for portfolio managers, research analysts, and other key personnel, including its effects on fund profitability, the rationale for the compensation structure, and the extent to which current market conditions have affected retention and recruitment; (iv) the arrangements with and compensation paid to certain fund sub-advisers on behalf of the Fidelity funds and the treatment of such compensation within Fidelity's fund profitability methodology; (v) the terms of Fidelity's voluntary expense limitation agreements; (vi) the methodology with respect to competitive fund data and peer group classifications; (vii) Fidelity's transfer agent fee, expense, and service structures for different funds and classes relative to competitive trends, and the impact of the increased use of omnibus accounts; (viii) new developments in the retail and institutional marketplaces and the competitive positioning of the funds relative to other investment products and services; (ix) the impact of recent changes to the money market fund landscape, including the full implementation of money market fund reform and rising interest rates, on Fidelity's money market funds; (x) the funds' share class structures and distribution channels; and (xi) explanations regarding the relative total expense ratios of certain funds and classes, total expense competitive trends and methodologies for total expense competitive comparisons, and actions that might be taken by Fidelity to reduce total expense ratios for certain classes. In addition, the Board considered its discussions with Fidelity throughout the year regarding enhanced information security initiatives and the funds' fair valuation policies.
Based on its evaluation of all of the conclusions noted above, and after considering all factors it believed relevant, the Board concluded that the advisory fee arrangements are fair and reasonable, and that each fund's Advisory Contract should be renewed.
FF-K6-SANN-1118
1.9885888.101
Fidelity Freedom® Funds - Income, 2005, 2010, 2015, 2020, 2025, 2030, 2035, 2040, 2045, 2050, 2055, 2060 - Class K
Semi-Annual Report September 30, 2018 |
|
Contents
To view a fund's proxy voting guidelines and proxy voting record for the 12-month period ended June 30, visit http://www.fidelity.com/proxyvotingresults or visit the Securities and Exchange Commission's (SEC) web site at http://www.sec.gov.
You may also call 1-800-835-5092 to request a free copy of the proxy voting guidelines.
Standard & Poor's, S&P and S&P 500 are registered service marks of The McGraw-Hill Companies, Inc. and have been licensed for use by Fidelity Distributors Corporation.
Other third-party marks appearing herein are the property of their respective owners.
All other marks appearing herein are registered or unregistered trademarks or service marks of FMR LLC or an affiliated company. © 2018 FMR LLC. All rights reserved.
This report and the financial statements contained herein are submitted for the general information of the shareholders of the Funds. This report is not authorized for distribution to prospective investors in the Funds unless preceded or accompanied by an effective prospectus.
A fund files its complete schedule of portfolio holdings with the SEC for the first and third quarters of each fiscal year on Form N-Q. Forms N-Q are available on the SEC’s web site at http://www.sec.gov. A fund's Forms N-Q may be reviewed and copied at the SEC’s Public Reference Room in Washington, DC. Information regarding the operation of the SEC's Public Reference Room may be obtained by calling 1-800-SEC-0330.
For a complete list of a fund's portfolio holdings, view the most recent holdings listing, semiannual report, or annual report on Fidelity's web site at http://www.fidelity.com, http://www.institutional.fidelity.com, or http://www.401k.com, as applicable.
NOT FDIC INSURED •MAY LOSE VALUE •NO BANK GUARANTEE
Neither the Funds nor Fidelity Distributors Corporation is a bank.
Note to shareholders:
At its May 2018 meeting, the Board of Trustees approved incremental updates to the strategic asset allocation (i.e., glide path) of Fidelity Freedom Funds, adding U.S. Treasury Inflation-Protected Securities and long-term U.S. Treasury bonds as fixed exposures in the Funds’ bond allocations, and slightly reducing the equity and short-term debt allocations for shorter-dated Funds. These updates are expected to be fully implemented by the end of 2018.
Fidelity Freedom® Income Fund
Investment Summary (Unaudited)
The information in the following tables is based on the direct investments of the Fund.
Top Holdings as of September 30, 2018
| | % of fund's net assets |
| Fidelity Series Investment Grade Bond Fund | 37.0 |
| Fidelity Series Government Money Market Fund 2.12% | 18.5 |
| Fidelity Series Inflation-Protected Bond Index Fund | 12.9 |
| Fidelity Series Short-Term Credit Fund | 4.7 |
| Fidelity Series Long-Term Treasury Bond Index Fund | 4.5 |
| Fidelity Series Emerging Markets Opportunities Fund | 2.7 |
| Fidelity Series International Growth Fund | 2.2 |
| Fidelity Series International Value Fund | 2.2 |
| Fidelity Series Commodity Strategy Fund | 1.9 |
| Fidelity Series Intrinsic Opportunities Fund | 1.7 |
| | 88.3 |
Asset Allocation (% of fund's net assets)
| Period end |
| | Domestic Equity Funds | 11.2% |
| | International Equity Funds | 8.2% |
| | Bond Funds | 57.2% |
| | Short-Term Funds | 23.4% |

Domestic Equity Funds category includes Fidelity Series Commodity Strategy Fund which invests in commodity-related investments.
Fidelity Freedom® Income Fund
Schedule of Investments September 30, 2018 (Unaudited)
Showing Percentage of Net Assets
| U.S. Treasury Obligations - 0.0% | | | |
| | | Principal Amount | Value |
| U.S. Treasury Bills, yield at date of purchase 1.97% to 2.07% 11/1/18 to 11/29/18 (a) | | | |
| (Cost $2,046,120) | | 2,050,000 | 2,045,940 |
| | | Shares | Value |
|
| Domestic Equity Funds - 11.2% | | | |
| Fidelity Series All-Sector Equity Fund (b) | | 858,243 | $11,680,686 |
| Fidelity Series Blue Chip Growth Fund (b) | | 1,560,696 | 23,878,651 |
| Fidelity Series Commodity Strategy Fund (b) | | 13,244,322 | 66,221,611 |
| Fidelity Series Growth Company Fund (b) | | 2,389,870 | 48,299,268 |
| Fidelity Series Intrinsic Opportunities Fund (b) | | 3,192,734 | 58,522,811 |
| Fidelity Series Large Cap Stock Fund (b) | | 3,223,063 | 51,343,391 |
| Fidelity Series Large Cap Value Index Fund (b) | | 1,082,077 | 14,283,418 |
| Fidelity Series Opportunistic Insights Fund (b) | | 1,306,853 | 25,941,035 |
| Fidelity Series Small Cap Discovery Fund (b) | | 556,478 | 6,761,204 |
| Fidelity Series Small Cap Opportunities Fund (b) | | 1,423,282 | 20,908,009 |
| Fidelity Series Stock Selector Large Cap Value Fund (b) | | 2,935,156 | 38,802,766 |
| Fidelity Series Value Discovery Fund (b) | | 2,009,660 | 27,512,252 |
| TOTAL DOMESTIC EQUITY FUNDS | | | |
| (Cost $276,504,143) | | | 394,155,102 |
|
| International Equity Funds - 8.2% | | | |
| Fidelity Series Canada Fund (b) | | 694,311 | 7,505,503 |
| Fidelity Series Emerging Markets Fund (b) | | 1,256,778 | 12,178,180 |
| Fidelity Series Emerging Markets Opportunities Fund (b) | | 4,889,313 | 93,825,908 |
| Fidelity Series International Growth Fund (b) | | 4,785,578 | 78,483,481 |
| Fidelity Series International Small Cap Fund (b) | | 995,982 | 17,828,076 |
| Fidelity Series International Value Fund (b) | | 7,413,802 | 77,993,198 |
| TOTAL INTERNATIONAL EQUITY FUNDS | | | |
| (Cost $211,566,464) | | | 287,814,346 |
|
| Bond Funds - 57.2% | | | |
| Fidelity Series Emerging Markets Debt Fund (b) | | 2,751,836 | 26,224,993 |
| Fidelity Series Floating Rate High Income Fund (b) | | 923,890 | 8,795,428 |
| Fidelity Series High Income Fund (b) | | 4,996,399 | 48,015,395 |
| Fidelity Series Inflation-Protected Bond Index Fund (b) | | 46,587,298 | 452,362,667 |
| Fidelity Series International Credit Fund (b) | | 189,327 | 1,861,080 |
| Fidelity Series Investment Grade Bond Fund (b) | | 119,477,891 | 1,301,114,228 |
| Fidelity Series Long-Term Treasury Bond Index Fund (b) | | 19,022,011 | 156,741,370 |
| Fidelity Series Real Estate Income Fund (b) | | 1,582,236 | 17,056,501 |
| TOTAL BOND FUNDS | | | |
| (Cost $2,027,662,368) | | | 2,012,171,662 |
|
| Short-Term Funds - 23.4% | | | |
| Fidelity Cash Central Fund, 2.11% (c) | | 6,323,103 | 6,324,368 |
| Fidelity Series Government Money Market Fund 2.12% (b)(d) | | 650,644,590 | 650,644,590 |
| Fidelity Series Short-Term Credit Fund (b) | | 16,816,160 | 165,807,334 |
| TOTAL SHORT-TERM FUNDS | | | |
| (Cost $824,593,524) | | | 822,776,292 |
| TOTAL INVESTMENT IN SECURITIES - 100.0% | | | |
| (Cost $3,342,372,619) | | | 3,518,963,342 |
| NET OTHER ASSETS (LIABILITIES) - 0.0% | | | (1,365,656) |
| NET ASSETS - 100% | | | $3,517,597,686 |
| Futures Contracts | | | | | |
| | Number of contracts | Expiration Date | Notional Amount | Value | Unrealized Appreciation/(Depreciation) |
| Purchased | | | | | |
| Equity Index Contracts | | | | | |
| ICE E-mini MSCI EAFE Index Contracts (United States) | 74 | Dec. 2018 | $7,309,350 | $6,992 | $6,992 |
| ICE E-mini MSCI Emerging Markets Index Contracts (United States) | 302 | Dec. 2018 | 15,850,470 | 306,292 | 306,292 |
|
| TOTAL PURCHASED | | | | | 313,284 |
|
| Sold | | | | | |
| Equity Index Contracts | | | | | |
| CME E-mini S&P 500 Index Contracts (United States) | 120 | Dec. 2018 | 17,514,000 | (5,821) | (5,821) |
| TOTAL FUTURES CONTRACTS | | | | | $307,463 |
The notional amount of futures purchased as a percentage of Net Assets is 0.7%
The notional amount of futures sold as a percentage of Net Assets is 0.5%
Legend
(a) Security or a portion of the security was pledged to cover margin requirements for futures contracts. At period end, the value of securities pledged amounted to $960,279.
(b) Affiliated Fund
(c) Affiliated fund that is generally available only to investment companies and other accounts managed by Fidelity Investments. The rate quoted is the annualized seven-day yield of the fund at period end. A complete unaudited listing of the fund's holdings as of its most recent quarter end is available upon request. In addition, each Fidelity Central Fund's financial statements are available on the SEC's website or upon request.
(d) The rate quoted is the annualized seven-day yield of the fund at period end.
Affiliated Central Funds
Information regarding fiscal year to date income earned by the Fund from investments in Fidelity Central Funds is as follows:
| Fund | Income earned |
| Fidelity Cash Central Fund | $22,227 |
| Total | $22,227 |
Amounts in the income column in the above table include any capital gain distributions from underlying funds, which are presented in the corresponding line-item in the Statement of Operations if applicable.
Affiliated Underlying Funds
Fiscal year to date information regarding the Fund's investments in affiliated Underlying Funds, excluding any Money Market Central Funds, is presented below. Exchanges between classes of the same affiliated Underlying Funds may occur.
| Affiliate | Value, beginning of period | Purchases | Sales Proceeds | Dividend Income | Realized Gain (loss) | Change in Unrealized appreciation (depreciation) | Value, end of period |
| Fidelity Series 100 Index Fund | $15,916,073 | $-- | $16,684,277 | $-- | $6,617,339 | $(5,849,135) | $-- |
| Fidelity Series All-Sector Equity Fund | 30,551,376 | 115,455 | 21,947,241 | -- | 4,831,585 | (1,870,489) | 11,680,686 |
| Fidelity Series Blue Chip Growth Fund | 31,582,362 | 2,352,394 | 13,043,656 | 2,230,117 | 4,900,631 | (1,913,080) | 23,878,651 |
| Fidelity Series Canada Fund | 9,334,390 | 35,276 | 2,424,341 | -- | 38,184 | 521,994 | 7,505,503 |
| Fidelity Series Commodity Strategy Fund | 79,034,933 | 9,548,706 | 16,818,873 | 3,986,945 | (7,468,813) | 1,925,658 | 66,221,611 |
| Fidelity Series Emerging Markets Debt Fund | 28,508,764 | 902,235 | 1,638,828 | 816,946 | (60,408) | (1,486,770) | 26,224,993 |
| Fidelity Series Emerging Markets Fund | -- | 12,208,821 | -- | -- | -- | (30,641) | 12,178,180 |
| Fidelity Series Emerging Markets Opportunities Fund | 114,600,734 | 420,188 | 7,342,008 | - | 1,620,303 | (15,473,309) | 93,825,908 |
| Fidelity Series Floating Rate High Income Fund | 9,147,819 | 274,285 | 635,291 | 238,738 | (20,985) | 29,600 | 8,795,428 |
| Fidelity Series Government Money Market Fund 2.12% | 859,951,401 | 69,275,671 | 278,582,482 | 7,435,363 | -- | -- | 650,644,590 |
| Fidelity Series Growth Company Fund | 67,193,973 | 245,130 | 28,224,982 | -- | 12,524,066 | (3,438,919) | 48,299,268 |
| Fidelity Series High Income Fund | 56,045,887 | 1,643,209 | 10,098,549 | 1,457,553 | (391,510) | 816,358 | 48,015,395 |
| Fidelity Series Inflation-Protected Bond Index Fund | 140,449,749 | 324,353,975 | 10,956,858 | 440,347 | (194,602) | (1,289,597) | 452,362,667 |
| Fidelity Series International Credit Fund | 1,872,196 | 23,073 | 15,354 | 23,073 | (207) | (18,628) | 1,861,080 |
| Fidelity Series International Growth Fund | 97,009,280 | 4,906,227 | 24,528,224 | -- | 5,569,188 | (4,472,990) | 78,483,481 |
| Fidelity Series International Small Cap Fund | 24,130,987 | 722,091 | 6,131,344 | -- | 1,086,699 | (1,980,357) | 17,828,076 |
| Fidelity Series International Value Fund | 95,143,387 | 2,872,788 | 19,256,243 | -- | 2,026,684 | (2,793,418) | 77,993,198 |
| Fidelity Series Intrinsic Opportunities Fund | 78,260,126 | 2,885,114 | 24,344,665 | 2,589,390 | 6,363,540 | (4,641,304) | 58,522,811 |
| Fidelity Series Investment Grade Bond Fund | 1,414,325,467 | 30,307,343 | 127,389,060 | 19,355,296 | (4,842,803) | (11,286,719) | 1,301,114,228 |
| Fidelity Series Large Cap Stock Fund | 69,040,943 | 4,047,231 | 24,920,395 | 3,779,653 | 4,311,623 | (1,136,011) | 51,343,391 |
| Fidelity Series Large Cap Value Index Fund | 19,791,623 | 73,996 | 6,783,122 | -- | 782,291 | 418,630 | 14,283,418 |
| Fidelity Series Long-Term Treasury Bond Index Fund | 78,600,027 | 106,098,031 | 22,416,953 | 1,345,713 | (967,598) | (4,572,137) | 156,741,370 |
| Fidelity Series Opportunistic Insights Fund | 34,616,831 | 133,023 | 12,971,038 | -- | 5,678,589 | (1,516,370) | 25,941,035 |
| Fidelity Series Real Estate Equity Fund | 6,171,500 | 89,767 | 6,510,092 | 82,424 | 1,186,459 | (937,634) | -- |
| Fidelity Series Real Estate Income Fund | 17,355,440 | 796,611 | 1,202,716 | 729,693 | 1,034 | 106,132 | 17,056,501 |
| Fidelity Series Short-Term Credit Fund | 211,429,964 | 3,118,161 | 48,731,013 | 2,306,640 | (675,183) | 665,405 | 165,807,334 |
| Fidelity Series Small Cap Discovery Fund | 9,419,231 | 587,510 | 3,144,728 | 551,769 | 470,284 | (571,093) | 6,761,204 |
| Fidelity Series Small Cap Opportunities Fund | 28,758,372 | 1,735,904 | 11,073,522 | 1,625,936 | 3,635,064 | (2,147,809) | 20,908,009 |
| Fidelity Series Stock Selector Large Cap Value Fund | 53,907,465 | 202,727 | 18,643,449 | -- | 3,992,165 | (656,142) | 38,802,766 |
| Fidelity Series Value Discovery Fund | 38,314,030 | 143,770 | 12,952,582 | -- | 3,272,501 | (1,265,467) | 27,512,252 |
| | $3,720,464,330 | $580,118,712 | $779,411,886 | $48,995,596 | $54,286,120 | $(64,864,242) | $3,510,593,034 |
Amounts in the income column in the above table include any capital gain distributions from underlying funds, which are presented in the corresponding line-item in the Statement of Operations if applicable.
Investment Valuation
The following is a summary of the inputs used, as of September 30, 2018, involving the Fund's assets and liabilities carried at fair value. The inputs or methodology used for valuing securities may not be an indication of the risk associated with investing in those securities. For more information on valuation inputs, and their aggregation into the levels used below, please refer to the Investment Valuation section in the accompanying Notes to Financial Statements.
| | Valuation Inputs at Reporting Date: |
| Description | Total | Level 1 | Level 2 | Level 3 |
| Investments in Securities: | | | | |
| Other Short-Term Investments | $2,045,940 | $-- | $2,045,940 | $-- |
| Domestic Equity Funds | 394,155,102 | 394,155,102 | -- | -- |
| International Equity Funds | 287,814,346 | 287,814,346 | -- | -- |
| Bond Funds | 2,012,171,662 | 2,012,171,662 | -- | -- |
| Short-Term Funds | 822,776,292 | 822,776,292 | -- | -- |
| Total Investments in Securities: | $3,518,963,342 | $3,516,917,402 | $2,045,940 | $-- |
| Derivative Instruments: | | | | |
| Assets | | | | |
| Futures Contracts | $313,284 | $313,284 | $-- | $-- |
| Total Assets | $313,284 | $313,284 | $-- | $-- |
| Liabilities | | | | |
| Futures Contracts | $(5,821) | $(5,821) | $-- | $-- |
| Total Liabilities | $(5,821) | $(5,821) | $-- | $-- |
| Total Derivative Instruments: | $307,463 | $307,463 | $-- | $-- |
Value of Derivative Instruments
The following table is a summary of the Fund's value of derivative instruments by primary risk exposure as of September 30, 2018. For additional information on derivative instruments, please refer to the Derivative Instruments section in the accompanying Notes to Financial Statements.
| Primary Risk Exposure / Derivative Type | Value |
| | Asset | Liability |
| Equity Risk | | |
| Futures Contracts(a) | $313,284 | $(5,821) |
| Total Equity Risk | 313,284 | (5,821) |
| Total Value of Derivatives | $313,284 | $(5,821) |
(a) Reflects gross cumulative appreciation (depreciation) on futures contracts as presented in the Schedule of Investments. In the Statement of Assets and Liabilities, the period end daily variation margin is included in receivable or payable for daily variation margin on futures contracts, and the net cumulative appreciation (depreciation) is included in net unrealized appreciation (depreciation).
See accompanying notes which are an integral part of the financial statements.
Fidelity Freedom® Income Fund
Financial Statements
Statement of Assets and Liabilities
| | | September 30, 2018 (Unaudited) |
| Assets | | |
Investment in securities, at value — See accompanying schedule:
Unaffiliated issuers (cost $2,046,120) | $2,045,940 | |
| Fidelity Central Funds (cost $6,324,368) | 6,324,368 | |
| Other affiliated issuers (cost $3,334,002,131) | 3,510,593,034 | |
| Total Investment in Securities (cost $3,342,372,619) | | $3,518,963,342 |
| Receivable for investments sold | | 28,842,301 |
| Receivable for fund shares sold | | 15,793,947 |
| Distributions receivable from Fidelity Central Funds | | 9,284 |
| Total assets | | 3,563,608,874 |
| Liabilities | | |
| Payable for investments purchased | $26,867,605 | |
| Payable for fund shares redeemed | 17,720,285 | |
| Accrued management fee | 1,301,864 | |
| Payable for daily variation margin on futures contracts | 121,434 | |
| Total liabilities | | 46,011,188 |
| Net Assets | | $3,517,597,686 |
| Net Assets consist of: | | |
| Paid in capital | | $3,277,238,597 |
| Undistributed net investment income | | 10,820,928 |
| Accumulated undistributed net realized gain (loss) on investments | | 52,639,975 |
| Net unrealized appreciation (depreciation) on investments | | 176,898,186 |
| Net Assets | | $3,517,597,686 |
| Fidelity Freedom Income Fund: | | |
| Net Asset Value, offering price and redemption price per share ($2,040,849,966 ÷ 176,249,126 shares) | | $11.58 |
| Class K: | | |
| Net Asset Value, offering price and redemption price per share ($1,388,227,944 ÷ 120,056,290 shares) | | $11.56 |
| Class K6: | | |
| Net Asset Value, offering price and redemption price per share ($88,519,776 ÷ 7,654,695 shares) | | $11.56 |
See accompanying notes which are an integral part of the financial statements.
Statement of Operations
| | | Six months ended September 30, 2018 (Unaudited) |
| Investment Income | | |
| Dividends: | | |
| Affiliated issuers | | $39,690,637 |
| Interest | | 8,225 |
| Income from Fidelity Central Funds | | 22,227 |
| Total income | | 39,721,089 |
| Expenses | | |
| Management fee | $8,016,172 | |
| Independent trustees' fees and expenses | 8,900 | |
| Total expenses before reductions | 8,025,072 | |
| Expense reductions | (54) | |
| Total expenses after reductions | | 8,025,018 |
| Net investment income (loss) | | 31,696,071 |
| Realized and Unrealized Gain (Loss) | | |
| Net realized gain (loss) on: | | |
| Investment securities: | | |
| Fidelity Central Funds | (161) | |
| Other affiliated issuers | 54,286,120 | |
| Futures contracts | (909,660) | |
| Capital gain distributions from underlying funds: | | |
| Affiliated issuers | 9,304,959 | |
| Total net realized gain (loss) | | 62,681,258 |
| Change in net unrealized appreciation (depreciation) on: | | |
| Investment securities: | | |
| Unaffiliated issuers | (163) | |
| Affiliated issuers | (64,864,242) | |
| Futures contracts | 307,463 | |
| Total change in net unrealized appreciation (depreciation) | | (64,556,942) |
| Net gain (loss) | | (1,875,684) |
| Net increase (decrease) in net assets resulting from operations | | $29,820,387 |
See accompanying notes which are an integral part of the financial statements.
Statement of Changes in Net Assets
| | Six months ended September 30, 2018 (Unaudited) | Year ended March 31, 2018 |
| Increase (Decrease) in Net Assets | | |
| Operations | | |
| Net investment income (loss) | $31,696,071 | $54,568,700 |
| Net realized gain (loss) | 62,681,258 | 90,451,426 |
| Change in net unrealized appreciation (depreciation) | (64,556,942) | (21,703,503) |
| Net increase (decrease) in net assets resulting from operations | 29,820,387 | 123,316,623 |
| Distributions to shareholders from net investment income | (26,350,776) | (51,949,454) |
| Distributions to shareholders from net realized gain | (38,860,177) | (67,440,706) |
| Total distributions | (65,210,953) | (119,390,160) |
| Share transactions - net increase (decrease) | (166,581,803) | 1,577,891,442 |
| Total increase (decrease) in net assets | (201,972,369) | 1,581,817,905 |
| Net Assets | | |
| Beginning of period | 3,719,570,055 | 2,137,752,150 |
| End of period | $3,517,597,686 | $3,719,570,055 |
| Other Information | | |
| Undistributed net investment income end of period | $10,820,928 | $5,475,633 |
See accompanying notes which are an integral part of the financial statements.
Financial Highlights
Fidelity Freedom Income Fund
| | Six months ended (Unaudited) September 30, | Years endedMarch 31, | | | | |
| | 2018 | 2018 | 2017 | 2016 | 2015 | 2014 |
| Selected Per–Share Data | | | | | | |
| Net asset value, beginning of period | $11.69 | $11.57 | $11.26 | $11.75 | $11.86 | $11.91 |
| Income from Investment Operations | | | | | | |
| Net investment income (loss)A | .10 | .18 | .19 | .21 | .21 | .16 |
| Net realized and unrealized gain (loss) | –B | .38 | .49 | (.27) | .28 | .30 |
| Total from investment operations | .10 | .56 | .68 | (.06) | .49 | .46 |
| Distributions from net investment income | (.08) | (.19) | (.20)C | (.21) | (.20) | (.16) |
| Distributions from net realized gain | (.12) | (.25) | (.17)C | (.22) | (.40) | (.35) |
| Total distributions | (.21)D | (.44) | (.37) | (.43) | (.60) | (.51) |
| Net asset value, end of period | $11.58 | $11.69 | $11.57 | $11.26 | $11.75 | $11.86 |
| Total ReturnE,F | .83% | 4.86% | 6.16% | (.45)% | 4.31% | 3.95% |
| Ratios to Average Net AssetsG,H | | | | | | |
| Expenses before reductions | .46%I,J | .39% | - %K | - %K | - %K | - %K |
| Expenses net of fee waivers, if any | .46%I,J | .39% | -% | -% | -% | -% |
| Expenses net of all reductions | .46%I,J | .39% | -% | -% | -% | -% |
| Net investment income (loss) | 1.73%I | 1.57% | 1.70% | 1.86% | 1.77% | 1.37% |
| Supplemental Data | | | | | | |
| Net assets, end of period (000 omitted) | $2,040,850 | $2,111,741 | $2,137,752 | $2,184,994 | $2,483,848 | $1,935,210 |
| Portfolio turnover rateH | 32%I | 17%L | 31% | 20% | 26%L | 31% |
A Calculated based on average shares outstanding during the period.
B Amount represents less than $.005 per share.
C The amounts shown reflect certain reclassifications related to book to tax differences that were made in the year shown.
D Total distributions of $.21 per share is comprised of distributions from net investment income of $.083 and distributions from net realized gain of $.123 per share.
E Total returns for periods of less than one year are not annualized.
F Total returns would have been lower if certain expenses had not been reduced during the applicable periods shown.
G Expense ratios reflect operating expenses of the class. Expenses before reductions do not reflect amounts reimbursed by the investment adviser or reductions from expense offset arrangements and do not represent the amount paid by the class during periods when reimbursements or reductions occur. Expenses net of fee waivers reflect expenses after reimbursement by the investment adviser but prior to reductions from expense offset arrangements. Expenses net of all reductions represent the net expenses paid by the class but do not include expenses of the underlying funds in which the Fund invests.
H Amounts do not include the activity of the Underlying Funds.
I Annualized
J On certain classes, the size and fluctuation of net assets and expense amounts may cause ratios to differ from contractual rates.
K Amount represents less than .005%.
L The portfolio turnover rate does not include the assets acquired in the merger.
See accompanying notes which are an integral part of the financial statements.
Fidelity Freedom Income Fund Class K
| | Six months ended (Unaudited) September 30, | Years endedMarch 31, |
| | 2018 | 2018 A |
| Selected Per–Share Data | | |
| Net asset value, beginning of period | $11.68 | $11.76 |
| Income from Investment Operations | | |
| Net investment income (loss)B | .10 | .19 |
| Net realized and unrealized gain (loss) | (.01) | .05 |
| Total from investment operations | .09 | .24 |
| Distributions from net investment income | (.09) | (.16) |
| Distributions from net realized gain | (.12) | (.17) |
| Total distributions | (.21) | (.32)C |
| Net asset value, end of period | $11.56 | $11.68 |
| Total ReturnD,E | .78% | 2.06% |
| Ratios to Average Net AssetsF,G | | |
| Expenses before reductions | .41%H,I | .42%H |
| Expenses net of fee waivers, if any | .41%H,I | .42%H |
| Expenses net of all reductions | .41%H,I | .42%H |
| Net investment income (loss) | 1.78%H | 2.32%H |
| Supplemental Data | | |
| Net assets, end of period (000 omitted) | $1,388,228 | $1,568,576 |
| Portfolio turnover rateG | 32%H | 17%J |
A For the period July 20, 2017 (commencement of sale of shares) to March 31, 2018.
B Calculated based on average shares outstanding during the period.
C Total distributions of $.32 per share is comprised of distributions from net investment income of $.157 and distributions from net realized gain of $.166 per share.
D Total returns for periods of less than one year are not annualized.
E Total returns would have been lower if certain expenses had not been reduced during the applicable periods shown.
F Expense ratios reflect operating expenses of the class. Expenses before reductions do not reflect amounts reimbursed by the investment adviser or reductions from expense offset arrangements and do not represent the amount paid by the class during periods when reimbursements or reductions occur. Expense ratios before reductions for start-up periods may not be representative of longer-term operating periods. Expenses net of fee waivers reflect expenses after reimbursement by the investment adviser but prior to reductions from expense offset arrangements. Expenses net of all reductions represent the net expenses paid by the class but do not include expenses of the underlying funds in which the Fund invests.
G Amounts do not include the activity of the Underlying Funds.
H Annualized
I On certain classes, the size and fluctuation of net assets and expense amounts may cause ratios to differ from contractual rates.
J The portfolio turnover rate does not include the assets acquired in the merger.
See accompanying notes which are an integral part of the financial statements.
Fidelity Freedom Income Fund Class K6
| | Six months ended (Unaudited) September 30, | Years endedMarch 31, |
| | 2018 | 2018 A |
| Selected Per–Share Data | | |
| Net asset value, beginning of period | $11.68 | $11.68 |
| Income from Investment Operations | | |
| Net investment income (loss)B | .11 | .18 |
| Net realized and unrealized gain (loss) | (.01) | .15 |
| Total from investment operations | .10 | .33 |
| Distributions from net investment income | (.09) | (.17) |
| Distributions from net realized gain | (.12) | (.17) |
| Total distributions | (.22)C | (.33)D |
| Net asset value, end of period | $11.56 | $11.68 |
| Total ReturnE,F | .83% | 2.86% |
| Ratios to Average Net AssetsG,H | | |
| Expenses before reductions | .37%I | .37%I |
| Expenses net of fee waivers, if any | .37%I | .37%I |
| Expenses net of all reductions | .37%I | .37%I |
| Net investment income (loss) | 1.83%I | 1.91%I |
| Supplemental Data | | |
| Net assets, end of period (000 omitted) | $88,520 | $39,253 |
| Portfolio turnover rateH | 32%I | 17%J |
A For the period June 7, 2017 (commencement of sale of shares) to March 31, 2018.
B Calculated based on average shares outstanding during the period.
C Total distributions of $.22 per share is comprised of distributions from net investment income of $.092 and distributions from net realized gain of $.123 per share.
D Total distributions of $.33 per share is comprised of distributions from net investment income of $.168 and distributions from net realized gain of $.166 per share.
E Total returns for periods of less than one year are not annualized.
F Total returns would have been lower if certain expenses had not been reduced during the applicable periods shown.
G Expense ratios reflect operating expenses of the class. Expenses before reductions do not reflect amounts reimbursed by the investment adviser or reductions from expense offset arrangements and do not represent the amount paid by the class during periods when reimbursements or reductions occur. Expense ratios before reductions for start-up periods may not be representative of longer-term operating periods. Expenses net of fee waivers reflect expenses after reimbursement by the investment adviser but prior to reductions from expense offset arrangements. Expenses net of all reductions represent the net expenses paid by the class but do not include expenses of the underlying funds in which the Fund invests.
H Amounts do not include the activity of the Underlying Funds.
I Annualized
J The portfolio turnover rate does not include the assets acquired in the merger.
See accompanying notes which are an integral part of the financial statements.
Fidelity Freedom® 2005 Fund
Investment Summary (Unaudited)
The information in the following tables is based on the direct investments of the Fund.
Top Holdings as of September 30, 2018
| | % of fund's net assets |
| Fidelity Series Investment Grade Bond Fund | 33.8 |
| Fidelity Series Government Money Market Fund 2.12% | 15.0 |
| Fidelity Series Inflation-Protected Bond Index Fund | 11.0 |
| Fidelity Series Long-Term Treasury Bond Index Fund | 4.6 |
| Fidelity Series Short-Term Credit Fund | 3.9 |
| Fidelity Series Emerging Markets Opportunities Fund | 3.5 |
| Fidelity Series International Growth Fund | 3.1 |
| Fidelity Series International Value Fund | 3.0 |
| Fidelity Series Intrinsic Opportunities Fund | 2.8 |
| Fidelity Series Large Cap Stock Fund | 2.5 |
| | 83.2 |
Asset Allocation (% of fund's net assets)
| Period end |
| | Domestic Equity Funds | 17.7% |
| | International Equity Funds | 11.0% |
| | Bond Funds | 52.2% |
| | Short-Term Funds | 19.1% |

Domestic Equity Funds category includes Fidelity Series Commodity Strategy Fund which invests in commodity-related investments.
Fidelity Freedom® 2005 Fund
Schedule of Investments September 30, 2018 (Unaudited)
Showing Percentage of Net Assets
| U.S. Treasury Obligations - 0.0% | | | |
| | | Principal Amount | Value |
| U.S. Treasury Bills, yield at date of purchase 1.97% to 2.11% 11/1/18 to 12/6/18 (a) | | | |
| (Cost $548,923) | | 550,000 | 548,875 |
| | | Shares | Value |
|
| Domestic Equity Funds - 17.7% | | | |
| Fidelity Series All-Sector Equity Fund (b) | | 419,751 | $5,712,814 |
| Fidelity Series Blue Chip Growth Fund (b) | | 739,407 | 11,312,923 |
| Fidelity Series Commodity Strategy Fund (b) | | 3,872,246 | 19,361,232 |
| Fidelity Series Growth Company Fund (b) | | 1,126,383 | 22,764,204 |
| Fidelity Series Intrinsic Opportunities Fund (b) | | 1,504,862 | 27,584,116 |
| Fidelity Series Large Cap Stock Fund (b) | | 1,520,594 | 24,223,069 |
| Fidelity Series Large Cap Value Index Fund (b) | | 515,832 | 6,808,987 |
| Fidelity Series Opportunistic Insights Fund (b) | | 618,895 | 12,285,070 |
| Fidelity Series Small Cap Discovery Fund (b) | | 269,538 | 3,274,882 |
| Fidelity Series Small Cap Opportunities Fund (b) | | 674,973 | 9,915,352 |
| Fidelity Series Stock Selector Large Cap Value Fund (b) | | 1,386,991 | 18,336,026 |
| Fidelity Series Value Discovery Fund (b) | | 951,661 | 13,028,244 |
| TOTAL DOMESTIC EQUITY FUNDS | | | |
| (Cost $125,280,107) | | | 174,606,919 |
|
| International Equity Funds - 11.0% | | | |
| Fidelity Series Canada Fund (b) | | 275,001 | 2,972,756 |
| Fidelity Series Emerging Markets Fund (b) | | 444,311 | 4,305,378 |
| Fidelity Series Emerging Markets Opportunities Fund (b) | | 1,777,470 | 34,109,656 |
| Fidelity Series International Growth Fund (b) | | 1,835,426 | 30,100,992 |
| Fidelity Series International Small Cap Fund (b) | | 394,580 | 7,062,991 |
| Fidelity Series International Value Fund (b) | | 2,855,208 | 30,036,787 |
| TOTAL INTERNATIONAL EQUITY FUNDS | | | |
| (Cost $82,972,590) | | | 108,588,560 |
|
| Bond Funds - 52.2% | | | |
| Fidelity Series Emerging Markets Debt Fund (b) | | 743,824 | 7,088,641 |
| Fidelity Series Floating Rate High Income Fund (b) | | 254,282 | 2,420,762 |
| Fidelity Series High Income Fund (b) | | 1,416,745 | 13,614,918 |
| Fidelity Series Inflation-Protected Bond Index Fund (b) | | 11,164,173 | 108,404,115 |
| Fidelity Series International Credit Fund (b) | | 51,571 | 506,942 |
| Fidelity Series Investment Grade Bond Fund (b) | | 30,629,278 | 333,552,834 |
| Fidelity Series Long-Term Treasury Bond Index Fund (b) | | 5,545,446 | 45,694,477 |
| Fidelity Series Real Estate Income Fund (b) | | 440,833 | 4,752,178 |
| TOTAL BOND FUNDS | | | |
| (Cost $534,508,047) | | | 516,034,867 |
|
| Short-Term Funds - 19.1% | | | |
| Fidelity Cash Central Fund, 2.11% (c) | | 1,659,283 | 1,659,615 |
| Fidelity Series Government Money Market Fund 2.12% (b)(d) | | 148,326,056 | 148,326,056 |
| Fidelity Series Short-Term Credit Fund (b) | | 3,905,275 | 38,506,009 |
| TOTAL SHORT-TERM FUNDS | | | |
| (Cost $188,946,883) | | | 188,491,680 |
| TOTAL INVESTMENT IN SECURITIES - 100.0% | | | |
| (Cost $932,256,550) | | | 988,270,901 |
| NET OTHER ASSETS (LIABILITIES) - 0.0% | | | (389,601) |
| NET ASSETS - 100% | | | $987,881,300 |
| Futures Contracts | | | | | |
| | Number of contracts | Expiration Date | Notional Amount | Value | Unrealized Appreciation/(Depreciation) |
| Purchased | | | | | |
| Equity Index Contracts | | | | | |
| ICE E-mini MSCI EAFE Index Contracts (United States) | 24 | Dec. 2018 | $2,370,600 | $2,268 | $2,268 |
| ICE E-mini MSCI Emerging Markets Index Contracts (United States) | 88 | Dec. 2018 | 4,618,680 | 90,385 | 90,384 |
|
| TOTAL PURCHASED | | | | | 92,652 |
|
| Sold | | | | | |
| Equity Index Contracts | | | | | |
| CME E-mini S&P 500 Index Contracts (United States) | 48 | Dec. 2018 | 7,005,600 | (5,028) | (5,028) |
| TOTAL FUTURES CONTRACTS | | | | | $87,624 |
The notional amount of futures purchased as a percentage of Net Assets is 0.7%
The notional amount of futures sold as a percentage of Net Assets is 0.7%
Legend
(a) Security or a portion of the security was pledged to cover margin requirements for futures contracts. At period end, the value of securities pledged amounted to $548,875.
(b) Affiliated Fund
(c) Affiliated fund that is generally available only to investment companies and other accounts managed by Fidelity Investments. The rate quoted is the annualized seven-day yield of the fund at period end. A complete unaudited listing of the fund's holdings as of its most recent quarter end is available upon request. In addition, each Fidelity Central Fund's financial statements are available on the SEC's website or upon request.
(d) The rate quoted is the annualized seven-day yield of the fund at period end.
Affiliated Central Funds
Information regarding fiscal year to date income earned by the Fund from investments in Fidelity Central Funds is as follows:
| Fund | Income earned |
| Fidelity Cash Central Fund | $6,098 |
| Total | $6,098 |
Amounts in the income column in the above table include any capital gain distributions from underlying funds, which are presented in the corresponding line-item in the Statement of Operations if applicable.
Affiliated Underlying Funds
Fiscal year to date information regarding the Fund's investments in affiliated Underlying Funds, excluding any Money Market Central Funds, is presented below. Exchanges between classes of the same affiliated Underlying Funds may occur.
| Affiliate | Value, beginning of period | Purchases | Sales Proceeds | Dividend Income | Realized Gain (loss) | Change in Unrealized appreciation (depreciation) | Value, end of period |
| Fidelity Series 100 Index Fund | $6,515,325 | $-- | $6,766,231 | $-- | $3,060,458 | $(2,809,552) | $-- |
| Fidelity Series All-Sector Equity Fund | 12,530,153 | 323,580 | 8,401,825 | -- | 638,590 | 622,316 | 5,712,814 |
| Fidelity Series Blue Chip Growth Fund | 12,953,358 | 1,402,783 | 4,184,724 | 1,047,213 | 1,473,388 | (331,882) | 11,312,923 |
| Fidelity Series Canada Fund | 3,443,587 | 90,826 | 769,911 | -- | 11,026 | 197,228 | 2,972,756 |
| Fidelity Series Commodity Strategy Fund | 21,665,200 | 3,277,306 | 3,988,960 | 1,155,570 | (3,206,008) | 1,613,694 | 19,361,232 |
| Fidelity Series Emerging Markets Debt Fund | 7,599,846 | 385,829 | 483,923 | 219,233 | (12,852) | (400,259) | 7,088,641 |
| Fidelity Series Emerging Markets Fund | -- | 4,318,466 | -- | -- | -- | (13,088) | 4,305,378 |
| Fidelity Series Emerging Markets Opportunities Fund | 40,950,004 | 1,179,316 | 3,026,645 | -- | 334,133 | (5,327,152) | 34,109,656 |
| Fidelity Series Floating Rate High Income Fund | 2,476,054 | 134,554 | 192,296 | 65,135 | (1,837) | 4,287 | 2,420,762 |
| Fidelity Series Government Money Market Fund 2.12% | 188,891,827 | 24,156,237 | 64,722,008 | 1,675,943 | -- | -- | 148,326,056 |
| Fidelity Series Growth Company Fund | 27,067,672 | 709,266 | 8,781,193 | -- | 3,637,097 | 131,362 | 22,764,204 |
| Fidelity Series High Income Fund | 15,273,504 | 768,359 | 2,545,845 | 407,388 | (93,139) | 212,039 | 13,614,918 |
| Fidelity Series Inflation-Protected Bond Index Fund | 34,330,025 | 77,720,594 | 3,292,577 | 104,461 | (109,818) | (244,109) | 108,404,115 |
| Fidelity Series International Credit Fund | 511,877 | 6,308 | 6,093 | 6,308 | (80) | (5,070) | 506,942 |
| Fidelity Series International Growth Fund | 35,653,275 | 1,361,049 | 7,353,311 | -- | 1,843,979 | (1,404,000) | 30,100,992 |
| Fidelity Series International Small Cap Fund | 8,838,106 | 321,958 | 1,773,378 | -- | 370,877 | (694,572) | 7,062,991 |
| Fidelity Series International Value Fund | 35,085,401 | 929,268 | 5,760,831 | -- | 447 | (217,498) | 30,036,787 |
| Fidelity Series Intrinsic Opportunities Fund | 32,312,650 | 2,084,749 | 7,442,081 | 1,214,527 | 733,664 | (104,866) | 27,584,116 |
| Fidelity Series Investment Grade Bond Fund | 357,195,577 | 15,703,190 | 35,256,473 | 4,918,970 | (1,215,834) | (2,873,626) | 333,552,834 |
| Fidelity Series Large Cap Stock Fund | 28,318,570 | 2,429,949 | 7,842,568 | 1,641,583 | 909,822 | 407,296 | 24,223,069 |
| Fidelity Series Large Cap Value Index Fund | 8,118,267 | 221,652 | 2,054,428 | -- | 175,759 | 347,737 | 6,808,987 |
| Fidelity Series Long-Term Treasury Bond Index Fund | 21,896,394 | 30,282,437 | 4,886,938 | 392,361 | (169,455) | (1,427,961) | 45,694,477 |
| Fidelity Series Opportunistic Insights Fund | 14,197,365 | 387,487 | 4,045,102 | -- | 1,535,896 | 209,424 | 12,285,070 |
| Fidelity Series Real Estate Equity Fund | 2,522,653 | 22,552 | 2,634,464 | 19,427 | 352,087 | (262,828) | -- |
| Fidelity Series Real Estate Income Fund | 4,756,952 | 332,037 | 366,115 | 201,476 | (833) | 30,137 | 4,752,178 |
| Fidelity Series Short-Term Credit Fund | 46,349,875 | 1,780,739 | 9,623,590 | 515,426 | (116,864) | 115,849 | 38,506,009 |
| Fidelity Series Small Cap Discovery Fund | 3,862,917 | 331,020 | 870,333 | 226,894 | 97,568 | (146,290) | 3,274,882 |
| Fidelity Series Small Cap Opportunities Fund | 11,795,128 | 1,081,023 | 3,484,539 | 764,275 | 694,276 | (170,536) | 9,915,352 |
| Fidelity Series Stock Selector Large Cap Value Fund | 22,112,603 | 604,742 | 5,803,995 | -- | 791,480 | 631,196 | 18,336,026 |
| Fidelity Series Value Discovery Fund | 15,714,129 | 429,039 | 3,972,779 | -- | 449,096 | 408,759 | 13,028,244 |
| | $1,022,938,294 | $172,776,315 | $210,333,156 | $14,576,190 | $12,182,923 | $(11,501,965) | $986,062,411 |
Amounts in the income column in the above table include any capital gain distributions from underlying funds, which are presented in the corresponding line-item in the Statement of Operations if applicable.
Investment Valuation
The following is a summary of the inputs used, as of September 30, 2018, involving the Fund's assets and liabilities carried at fair value. The inputs or methodology used for valuing securities may not be an indication of the risk associated with investing in those securities. For more information on valuation inputs, and their aggregation into the levels used below, please refer to the Investment Valuation section in the accompanying Notes to Financial Statements.
| | Valuation Inputs at Reporting Date: |
| Description | Total | Level 1 | Level 2 | Level 3 |
| Investments in Securities: | | | | |
| Other Short-Term Investments | $548,875 | $-- | $548,875 | $-- |
| Domestic Equity Funds | 174,606,919 | 174,606,919 | -- | -- |
| International Equity Funds | 108,588,560 | 108,588,560 | -- | -- |
| Bond Funds | 516,034,867 | 516,034,867 | -- | -- |
| Short-Term Funds | 188,491,680 | 188,491,680 | -- | -- |
| Total Investments in Securities: | $988,270,901 | $987,722,026 | $548,875 | $-- |
| Derivative Instruments: | | | | |
| Assets | | | | |
| Futures Contracts | $92,652 | $92,652 | $-- | $-- |
| Total Assets | $92,652 | $92,652 | $-- | $-- |
| Liabilities | | | | |
| Futures Contracts | $(5,028) | $(5,028) | $-- | $-- |
| Total Liabilities | $(5,028) | $(5,028) | $-- | $-- |
| Total Derivative Instruments: | $87,624 | $87,624 | $-- | $-- |
Value of Derivative Instruments
The following table is a summary of the Fund's value of derivative instruments by primary risk exposure as of September 30, 2018. For additional information on derivative instruments, please refer to the Derivative Instruments section in the accompanying Notes to Financial Statements.
| Primary Risk Exposure / Derivative Type | Value |
| | Asset | Liability |
| Equity Risk | | |
| Futures Contracts(a) | $92,652 | $(5,028) |
| Total Equity Risk | 92,652 | (5,028) |
| Total Value of Derivatives | $92,652 | $(5,028) |
(a) Reflects gross cumulative appreciation (depreciation) on futures contracts as presented in the Schedule of Investments. In the Statement of Assets and Liabilities, the period end daily variation margin is included in receivable or payable for daily variation margin on futures contracts, and the net cumulative appreciation (depreciation) is included in net unrealized appreciation (depreciation).
See accompanying notes which are an integral part of the financial statements.
Fidelity Freedom® 2005 Fund
Financial Statements
Statement of Assets and Liabilities
| | | September 30, 2018 (Unaudited) |
| Assets | | |
Investment in securities, at value — See accompanying schedule:
Unaffiliated issuers (cost $548,923) | $548,875 | |
| Fidelity Central Funds (cost $1,659,615) | 1,659,615 | |
| Other affiliated issuers (cost $930,048,012) | 986,062,411 | |
| Total Investment in Securities (cost $932,256,550) | | $988,270,901 |
| Cash | | 27,686 |
| Receivable for investments sold | | 6,172,493 |
| Receivable for fund shares sold | | 9,845,821 |
| Distributions receivable from Fidelity Central Funds | | 2,443 |
| Total assets | | 1,004,319,344 |
| Liabilities | | |
| Payable for investments purchased | $5,482,681 | |
| Payable for fund shares redeemed | 10,532,505 | |
| Accrued management fee | 376,240 | |
| Payable for daily variation margin on futures contracts | 46,618 | |
| Total liabilities | | 16,438,044 |
| Net Assets | | $987,881,300 |
| Net Assets consist of: | | |
| Paid in capital | | $910,955,558 |
| Undistributed net investment income | | 8,096,776 |
| Accumulated undistributed net realized gain (loss) on investments | | 12,726,991 |
| Net unrealized appreciation (depreciation) on investments | | 56,101,975 |
| Net Assets | | $987,881,300 |
| Fidelity Freedom 2005 Fund: | | |
| Net Asset Value, offering price and redemption price per share ($571,564,332 ÷ 45,945,798 shares) | | $12.44 |
| Class K: | | |
| Net Asset Value, offering price and redemption price per share ($386,290,515 ÷ 31,090,455 shares) | | $12.42 |
| Class K6: | | |
| Net Asset Value, offering price and redemption price per share ($30,026,453 ÷ 2,415,955 shares) | | $12.43 |
See accompanying notes which are an integral part of the financial statements.
Statement of Operations
| | | Six months ended September 30, 2018 (Unaudited) |
| Investment Income | | |
| Dividends: | | |
| Affiliated issuers | | $10,376,153 |
| Interest | | 2,543 |
| Income from Fidelity Central Funds | | 6,098 |
| Total income | | 10,384,794 |
| Expenses | | |
| Management fee | $2,305,748 | |
| Independent trustees' fees and expenses | 2,463 | |
| Total expenses before reductions | 2,308,211 | |
| Expense reductions | (70) | |
| Total expenses after reductions | | 2,308,141 |
| Net investment income (loss) | | 8,076,653 |
| Realized and Unrealized Gain (Loss) | | |
| Net realized gain (loss) on: | | |
| Investment securities: | | |
| Fidelity Central Funds | (32) | |
| Other affiliated issuers | 12,182,923 | |
| Futures contracts | (373,350) | |
| Capital gain distributions from underlying funds: | | |
| Affiliated issuers | 4,200,037 | |
| Total net realized gain (loss) | | 16,009,578 |
| Change in net unrealized appreciation (depreciation) on: | | |
| Investment securities: | | |
| Unaffiliated issuers | (43) | |
| Affiliated issuers | (11,501,965) | |
| Futures contracts | 87,624 | |
| Total change in net unrealized appreciation (depreciation) | | (11,414,384) |
| Net gain (loss) | | 4,595,194 |
| Net increase (decrease) in net assets resulting from operations | | $12,671,847 |
See accompanying notes which are an integral part of the financial statements.
Statement of Changes in Net Assets
| | Six months ended September 30, 2018 (Unaudited) | Year ended March 31, 2018 |
| Increase (Decrease) in Net Assets | | |
| Operations | | |
| Net investment income (loss) | $8,076,653 | $14,738,670 |
| Net realized gain (loss) | 16,009,578 | 30,625,628 |
| Change in net unrealized appreciation (depreciation) | (11,414,384) | 1,018,991 |
| Net increase (decrease) in net assets resulting from operations | 12,671,847 | 46,383,289 |
| Distributions to shareholders from net investment income | (2,637,248) | (13,671,334) |
| Distributions to shareholders from net realized gain | (15,179,078) | (20,759,680) |
| Total distributions | (17,816,326) | (34,431,014) |
| Share transactions - net increase (decrease) | (29,634,052) | 426,953,870 |
| Total increase (decrease) in net assets | (34,778,531) | 438,906,145 |
| Net Assets | | |
| Beginning of period | 1,022,659,831 | 583,753,686 |
| End of period | $987,881,300 | $1,022,659,831 |
| Other Information | | |
| Undistributed net investment income end of period | $8,096,776 | $2,657,371 |
See accompanying notes which are an integral part of the financial statements.
Financial Highlights
Fidelity Freedom 2005 Fund
| | Six months ended (Unaudited) September 30, | Years endedMarch 31, | | | | |
| | 2018 | 2018 | 2017 | 2016 | 2015 | 2014 |
| Selected Per–Share Data | | | | | | |
| Net asset value, beginning of period | $12.50 | $12.20 | $11.66 | $12.24 | $12.01 | $11.53 |
| Income from Investment Operations | | | | | | |
| Net investment income (loss)A | .10 | .19 | .20 | .22 | .22 | .16 |
| Net realized and unrealized gain (loss) | .06 | .59 | .71 | (.34) | .40 | .58 |
| Total from investment operations | .16 | .78 | .91 | (.12) | .62 | .74 |
| Distributions from net investment income | (.03) | (.18) | (.22)B | (.22) | (.23) | (.15) |
| Distributions from net realized gain | (.19) | (.30) | (.15)B | (.23) | (.17) | (.10) |
| Total distributions | (.22) | (.48) | (.37) | (.46)C | (.39)D | (.26)E |
| Net asset value, end of period | $12.44 | $12.50 | $12.20 | $11.66 | $12.24 | $12.01 |
| Total ReturnF,G | 1.28% | 6.43% | 7.91% | (1.01)% | 5.26% | 6.43% |
| Ratios to Average Net AssetsH,I | | | | | | |
| Expenses before reductions | .48%J | .41% | - %K | - %K | - %K | - %K |
| Expenses net of fee waivers, if any | .48%J | .41% | -% | -% | -% | -% |
| Expenses net of all reductions | .48%J | .41% | -% | -% | -% | -% |
| Net investment income (loss) | 1.58%J | 1.52% | 1.70% | 1.87% | 1.79% | 1.38% |
| Supplemental Data | | | | | | |
| Net assets, end of period (000 omitted) | $571,564 | $590,056 | $583,754 | $580,726 | $639,723 | $668,987 |
| Portfolio turnover rateI | 34%J | 23%L | 31% | 22% | 23% | 44% |
A Calculated based on average shares outstanding during the period.
B The amounts shown reflect certain reclassifications related to book to tax differences that were made in the year shown.
C Total distributions of $.46 per share is comprised of distributions from net investment income of $.223 and distributions from net realized gain of $.234 per share.
D Total distributions of $.39 per share is comprised of distributions from net investment income of $.225 and distributions from net realized gain of $.168 per share.
E Total distributions of $.26 per share is comprised of distributions from net investment income of $.153 and distributions from net realized gain of $.103 per share.
F Total returns for periods of less than one year are not annualized.
G Total returns would have been lower if certain expenses had not been reduced during the applicable periods shown.
H Expense ratios reflect operating expenses of the class. Expenses before reductions do not reflect amounts reimbursed by the investment adviser or reductions from expense offset arrangements and do not represent the amount paid by the class during periods when reimbursements or reductions occur. Expenses net of fee waivers reflect expenses after reimbursement by the investment adviser but prior to reductions from expense offset arrangements. Expenses net of all reductions represent the net expenses paid by the class but do not include expenses of the underlying funds in which the Fund invests.
I Amounts do not include the activity of the Underlying Funds.
J Annualized
K Amount represents less than $.005 per share.
L The portfolio turnover rate does not include the assets acquired in the merger.
See accompanying notes which are an integral part of the financial statements.
Fidelity Freedom 2005 Fund Class K
| | Six months ended (Unaudited) September 30, | Years endedMarch 31, |
| | 2018 | 2018 A |
| Selected Per–Share Data | | |
| Net asset value, beginning of period | $12.49 | $12.48 |
| Income from Investment Operations | | |
| Net investment income (loss)B | .10 | .21 |
| Net realized and unrealized gain (loss) | .05 | .15 |
| Total from investment operations | .15 | .36 |
| Distributions from net investment income | (.03) | (.16) |
| Distributions from net realized gain | (.19) | (.19) |
| Total distributions | (.22) | (.35) |
| Net asset value, end of period | $12.42 | $12.49 |
| Total ReturnC,D | 1.21% | 2.89% |
| Ratios to Average Net AssetsE,F | | |
| Expenses before reductions | .43%G | .44%G |
| Expenses net of fee waivers, if any | .43%G | .44%G |
| Expenses net of all reductions | .43%G | .44%G |
| Net investment income (loss) | 1.64%G | 2.37%G |
| Supplemental Data | | |
| Net assets, end of period (000 omitted) | $386,291 | $422,622 |
| Portfolio turnover rateF | 34%G | 23%H |
A For the period July 20, 2017 (commencement of sale of shares) to March 31, 2018.
B Calculated based on average shares outstanding during the period.
C Total returns for periods of less than one year are not annualized.
D Total returns would have been lower if certain expenses had not been reduced during the applicable periods shown.
E Expense ratios reflect operating expenses of the class. Expenses before reductions do not reflect amounts reimbursed by the investment adviser or reductions from expense offset arrangements and do not represent the amount paid by the class during periods when reimbursements or reductions occur. Expense ratios before reductions for start-up periods may not be representative of longer-term operating periods. Expenses net of fee waivers reflect expenses after reimbursement by the investment adviser but prior to reductions from expense offset arrangements. Expenses net of all reductions represent the net expenses paid by the class but do not include expenses of the underlying funds in which the Fund invests.
F Amounts do not include the activity of the Underlying Funds.
G Annualized
H The portfolio turnover rate does not include the assets acquired in the merger.
See accompanying notes which are an integral part of the financial statements.
Fidelity Freedom 2005 Fund Class K6
| | Six months ended (Unaudited) September 30, | Years endedMarch 31, |
| | 2018 | 2018 A |
| Selected Per–Share Data | | |
| Net asset value, beginning of period | $12.49 | $12.36 |
| Income from Investment Operations | | |
| Net investment income (loss)B | .10 | .20 |
| Net realized and unrealized gain (loss) | .07 | .29 |
| Total from investment operations | .17 | .49 |
| Distributions from net investment income | (.04) | (.16) |
| Distributions from net realized gain | (.19) | (.19) |
| Total distributions | (.23) | (.36)C |
| Net asset value, end of period | $12.43 | $12.49 |
| Total ReturnD,E | 1.34% | 3.92% |
| Ratios to Average Net AssetsF,G | | |
| Expenses before reductions | .37%H | .38%H |
| Expenses net of fee waivers, if any | .37%H | .38%H |
| Expenses net of all reductions | .37%H | .38%H |
| Net investment income (loss) | 1.69%H | 1.93%H |
| Supplemental Data | | |
| Net assets, end of period (000 omitted) | $30,026 | $9,983 |
| Portfolio turnover rateG | 34%H | 23%I |
A For the period June 7, 2017 (commencement of sale of shares) to March 31, 2018.
B Calculated based on average shares outstanding during the period.
C Total distributions of $.36 per share is comprised of distributions from net investment income of $.164 and distributions from net realized gain of $.192 per share.
D Total returns for periods of less than one year are not annualized.
E Total returns would have been lower if certain expenses had not been reduced during the applicable periods shown.
F Expense ratios reflect operating expenses of the class. Expenses before reductions do not reflect amounts reimbursed by the investment adviser or reductions from expense offset arrangements and do not represent the amount paid by the class during periods when reimbursements or reductions occur. Expense ratios before reductions for start-up periods may not be representative of longer-term operating periods. Expenses net of fee waivers reflect expenses after reimbursement by the investment adviser but prior to reductions from expense offset arrangements. Expenses net of all reductions represent the net expenses paid by the class but do not include expenses of the underlying funds in which the Fund invests.
G Amounts do not include the activity of the Underlying Funds.
H Annualized
I The portfolio turnover rate does not include the assets acquired in the merger.
See accompanying notes which are an integral part of the financial statements.
Fidelity Freedom® 2010 Fund
Investment Summary (Unaudited)
The information in the following tables is based on the direct investments of the Fund.
Top Holdings as of September 30, 2018
| | % of fund's net assets |
| Fidelity Series Investment Grade Bond Fund | 30.1 |
| Fidelity Series Government Money Market Fund 2.12% | 11.7 |
| Fidelity Series Inflation-Protected Bond Index Fund | 9.1 |
| Fidelity Series Long-Term Treasury Bond Index Fund | 4.8 |
| Fidelity Series Emerging Markets Opportunities Fund | 4.3 |
| Fidelity Series Intrinsic Opportunities Fund | 4.0 |
| Fidelity Series International Value Fund | 3.9 |
| Fidelity Series International Growth Fund | 3.9 |
| Fidelity Series Large Cap Stock Fund | 3.5 |
| Fidelity Series Growth Company Fund | 3.2 |
| | 78.5 |
Asset Allocation (% of fund's net assets)
| Period end |
| | Domestic Equity Funds | 24.3% |
| | International Equity Funds | 13.8% |
| | Bond Funds | 46.9% |
| | Short-Term Funds | 14.9% |
| | Short-Term Investments | 0.1% |

Domestic Equity Funds category includes Fidelity Series Commodity Strategy Fund which invests in commodity-related investments.
Fidelity Freedom® 2010 Fund
Schedule of Investments September 30, 2018 (Unaudited)
Showing Percentage of Net Assets
| U.S. Treasury Obligations - 0.1% | | | |
| | | Principal Amount | Value |
| U.S. Treasury Bills, yield at date of purchase 1.97% to 2.11% 11/1/18 to 12/6/18 (a) | | | |
| (Cost $4,309,407) | | 4,320,000 | 4,309,070 |
| | | Shares | Value |
|
| Domestic Equity Funds - 24.3% | | | |
| Fidelity Series All-Sector Equity Fund (b) | | 3,812,876 | $51,893,237 |
| Fidelity Series Blue Chip Growth Fund (b) | | 6,597,640 | 100,943,885 |
| Fidelity Series Commodity Strategy Fund (b) | | 24,645,939 | 123,229,693 |
| Fidelity Series Growth Company Fund (b) | | 10,020,378 | 202,511,830 |
| Fidelity Series Intrinsic Opportunities Fund (b) | | 13,428,098 | 246,137,030 |
| Fidelity Series Large Cap Stock Fund (b) | | 13,535,206 | 215,615,835 |
| Fidelity Series Large Cap Value Index Fund (b) | | 4,622,485 | 61,016,805 |
| Fidelity Series Opportunistic Insights Fund (b) | | 5,521,417 | 109,600,136 |
| Fidelity Series Small Cap Discovery Fund (b) | | 2,429,120 | 29,513,812 |
| Fidelity Series Small Cap Opportunities Fund (b) | | 6,027,343 | 88,541,674 |
| Fidelity Series Stock Selector Large Cap Value Fund (b) | | 12,356,692 | 163,355,472 |
| Fidelity Series Value Discovery Fund (b) | | 8,489,413 | 116,220,062 |
| TOTAL DOMESTIC EQUITY FUNDS | | | |
| (Cost $1,034,501,591) | | | 1,508,579,471 |
|
| International Equity Funds - 13.8% | | | |
| Fidelity Series Canada Fund (b) | | 2,237,101 | 24,183,067 |
| Fidelity Series Emerging Markets Fund (b) | | 2,676,477 | 25,935,067 |
| Fidelity Series Emerging Markets Opportunities Fund (b) | | 13,889,539 | 266,540,245 |
| Fidelity Series International Growth Fund (b) | | 14,717,387 | 241,365,148 |
| Fidelity Series International Small Cap Fund (b) | | 3,217,762 | 57,597,941 |
| Fidelity Series International Value Fund (b) | | 23,261,039 | 244,706,131 |
| TOTAL INTERNATIONAL EQUITY FUNDS | | | |
| (Cost $645,578,380) | | | 860,327,599 |
|
| Bond Funds - 46.9% | | | |
| Fidelity Series Emerging Markets Debt Fund (b) | | 4,671,644 | 44,520,764 |
| Fidelity Series Floating Rate High Income Fund (b) | | 1,560,283 | 14,853,890 |
| Fidelity Series High Income Fund (b) | | 8,986,621 | 86,361,428 |
| Fidelity Series Inflation-Protected Bond Index Fund (b) | | 57,872,983 | 561,946,665 |
| Fidelity Series International Credit Fund (b) | | 347,035 | 3,411,358 |
| Fidelity Series Investment Grade Bond Fund (b) | | 171,882,124 | 1,871,796,329 |
| Fidelity Series Long-Term Treasury Bond Index Fund (b) | | 36,342,844 | 299,465,037 |
| Fidelity Series Real Estate Income Fund (b) | | 2,720,658 | 29,328,693 |
| TOTAL BOND FUNDS | | | |
| (Cost $3,013,964,424) | | | 2,911,684,164 |
|
| Short-Term Funds - 14.9% | | | |
| Fidelity Cash Central Fund, 2.11% (c) | | 10,449,674 | 10,451,764 |
| Fidelity Series Government Money Market Fund 2.12% (b)(d) | | 725,083,274 | 725,083,274 |
| Fidelity Series Short-Term Credit Fund (b) | | 19,574,073 | 193,000,357 |
| TOTAL SHORT-TERM FUNDS | | | |
| (Cost $930,862,691) | | | 928,535,395 |
| TOTAL INVESTMENT IN SECURITIES - 100.0% | | | |
| (Cost $5,629,216,493) | | | 6,213,435,699 |
| NET OTHER ASSETS (LIABILITIES) - 0.0% | | | (2,837,036) |
| NET ASSETS - 100% | | | $6,210,598,663 |
| Futures Contracts | | | | | |
| | Number of contracts | Expiration Date | Notional Amount | Value | Unrealized Appreciation/(Depreciation) |
| Purchased | | | | | |
| Equity Index Contracts | | | | | |
| ICE E-mini MSCI EAFE Index Contracts (United States) | 170 | Dec. 2018 | $16,791,750 | $16,062 | $16,062 |
| ICE E-mini MSCI Emerging Markets Index Contracts (United States) | 690 | Dec. 2018 | 36,214,650 | 701,623 | 701,623 |
|
| TOTAL PURCHASED | | | | | 717,685 |
|
| Sold | | | | | |
| Equity Index Contracts | | | | | |
| CME E-mini S&P 500 Index Contracts (United States) | 373 | Dec. 2018 | 54,439,350 | (56,078) | (56,078) |
| TOTAL FUTURES CONTRACTS | | | | | $661,607 |
The notional amount of futures purchased as a percentage of Net Assets is 0.9%
The notional amount of futures sold as a percentage of Net Assets is 0.9%
Legend
(a) Security or a portion of the security was pledged to cover margin requirements for futures contracts. At period end, the value of securities pledged amounted to $3,246,959.
(b) Affiliated Fund
(c) Affiliated fund that is generally available only to investment companies and other accounts managed by Fidelity Investments. The rate quoted is the annualized seven-day yield of the fund at period end. A complete unaudited listing of the fund's holdings as of its most recent quarter end is available upon request. In addition, each Fidelity Central Fund's financial statements are available on the SEC's website or upon request.
(d) The rate quoted is the annualized seven-day yield of the fund at period end.
Affiliated Central Funds
Information regarding fiscal year to date income earned by the Fund from investments in Fidelity Central Funds is as follows:
| Fund | Income earned |
| Fidelity Cash Central Fund | $41,034 |
| Total | $41,034 |
Amounts in the income column in the above table include any capital gain distributions from underlying funds, which are presented in the corresponding line-item in the Statement of Operations if applicable.
Affiliated Underlying Funds
Fiscal year to date information regarding the Fund's investments in affiliated Underlying Funds, excluding any Money Market Central Funds, is presented below. Exchanges between classes of the same affiliated Underlying Funds may occur.
| Affiliate | Value, beginning of period | Purchases | Sales Proceeds | Dividend Income | Realized Gain (loss) | Change in Unrealized appreciation (depreciation) | Value, end of period |
| Fidelity Series 100 Index Fund | $54,376,498 | $2 | $56,567,080 | $-- | $23,146,601 | $(20,956,021) | $-- |
| Fidelity Series All-Sector Equity Fund | 104,338,689 | 142,565 | 63,245,555 | -- | 6,739,679 | 3,917,859 | 51,893,237 |
| Fidelity Series Blue Chip Growth Fund | 107,885,174 | 9,571,563 | 25,469,308 | 9,418,055 | 9,382,474 | (426,018) | 100,943,885 |
| Fidelity Series Canada Fund | 27,093,349 | 35,848 | 4,597,144 | -- | 80,354 | 1,570,660 | 24,183,067 |
| Fidelity Series Commodity Strategy Fund | 137,197,589 | 17,628,555 | 21,424,243 | 7,411,479 | (12,115,316) | 1,943,108 | 123,229,693 |
| Fidelity Series Emerging Markets Debt Fund | 48,296,926 | 1,438,936 | 2,591,766 | 1,387,040 | (109,787) | (2,513,545) | 44,520,764 |
| Fidelity Series Emerging Markets Fund | -- | 26,014,737 | -- | -- | -- | (79,670) | 25,935,067 |
| Fidelity Series Emerging Markets Opportunities Fund | 317,936,755 | 7,629,394 | 20,111,703 | -- | 2,800,779 | (41,714,980) | 266,540,245 |
| Fidelity Series Floating Rate High Income Fund | 15,446,698 | 425,382 | 1,033,012 | 403,743 | (42,046) | 56,868 | 14,853,890 |
| Fidelity Series Government Money Market Fund 2.12% | 939,655,611 | 101,925,082 | 316,497,419 | 8,361,044 | -- | -- | 725,083,274 |
| Fidelity Series Growth Company Fund | 223,906,115 | 299,703 | 53,389,773 | -- | 25,688,430 | 6,007,355 | 202,511,830 |
| Fidelity Series High Income Fund | 96,454,868 | 2,706,830 | 13,554,009 | 2,594,305 | (561,419) | 1,315,158 | 86,361,428 |
| Fidelity Series Inflation-Protected Bond Index Fund | 178,194,874 | 401,025,758 | 15,393,845 | 540,807 | (725,022) | (1,155,100) | 561,946,665 |
| Fidelity Series International Credit Fund | 3,431,541 | 42,292 | 27,952 | 42,290 | (375) | (34,148) | 3,411,358 |
| Fidelity Series International Growth Fund | 280,934,996 | 364,682 | 43,632,249 | -- | 14,316,017 | (10,618,298) | 241,365,148 |
| Fidelity Series International Small Cap Fund | 69,606,079 | 1,327,875 | 10,790,607 | -- | 3,208,646 | (5,754,052) | 57,597,941 |
| Fidelity Series International Value Fund | 276,230,918 | 364,680 | 30,540,985 | -- | 1,301,162 | (2,649,644) | 244,706,131 |
| Fidelity Series Intrinsic Opportunities Fund | 270,386,197 | 11,254,573 | 40,362,721 | 10,890,050 | 3,820,323 | 1,038,658 | 246,137,030 |
| Fidelity Series Investment Grade Bond Fund | 2,054,586,502 | 31,367,263 | 190,897,443 | 27,937,353 | (7,420,763) | (15,839,230) | 1,871,796,329 |
| Fidelity Series Large Cap Stock Fund | 237,596,786 | 14,375,642 | 47,469,959 | 14,042,007 | 5,646,648 | 5,466,718 | 215,615,835 |
| Fidelity Series Large Cap Value Index Fund | 67,588,086 | 91,972 | 11,119,800 | -- | 1,037,885 | 3,418,662 | 61,016,805 |
| Fidelity Series Long-Term Treasury Bond Index Fund | 140,751,002 | 187,086,796 | 17,807,500 | 2,801,879 | (514,079) | (10,051,182) | 299,465,037 |
| Fidelity Series Opportunistic Insights Fund | 118,254,820 | 162,955 | 23,557,539 | -- | 10,352,028 | 4,387,872 | 109,600,136 |
| Fidelity Series Real Estate Equity Fund | 20,792,626 | 142,266 | 21,515,609 | 117,176 | 3,933,001 | (3,352,284) | -- |
| Fidelity Series Real Estate Income Fund | 29,805,115 | 1,295,676 | 1,957,655 | 1,254,330 | 101,713 | 83,844 | 29,328,693 |
| Fidelity Series Short-Term Credit Fund | 230,191,316 | 2,867,077 | 40,055,309 | 2,546,712 | (564,132) | 561,405 | 193,000,357 |
| Fidelity Series Small Cap Discovery Fund | 32,169,764 | 1,928,944 | 4,176,144 | 1,883,849 | 405,377 | (814,129) | 29,513,812 |
| Fidelity Series Small Cap Opportunities Fund | 98,250,232 | 7,014,990 | 20,651,145 | 6,878,847 | 5,002,322 | (1,074,725) | 88,541,674 |
| Fidelity Series Stock Selector Large Cap Value Fund | 184,075,787 | 251,770 | 33,072,920 | -- | 7,257,308 | 4,843,527 | 163,355,472 |
| Fidelity Series Value Discovery Fund | 130,831,369 | 178,467 | 22,070,434 | -- | 5,600,160 | 1,680,500 | 116,220,062 |
| | $6,496,266,282 | $828,962,275 | $1,153,580,828 | $98,510,966 | $107,767,968 | $(80,740,832) | $6,198,674,865 |
Amounts in the income column in the above table include any capital gain distributions from underlying funds, which are presented in the corresponding line-item in the Statement of Operations if applicable.
Investment Valuation
The following is a summary of the inputs used, as of September 30, 2018, involving the Fund's assets and liabilities carried at fair value. The inputs or methodology used for valuing securities may not be an indication of the risk associated with investing in those securities. For more information on valuation inputs, and their aggregation into the levels used below, please refer to the Investment Valuation section in the accompanying Notes to Financial Statements.
| | Valuation Inputs at Reporting Date: |
| Description | Total | Level 1 | Level 2 | Level 3 |
| Investments in Securities: | | | | |
| Other Short-Term Investments | $4,309,070 | $-- | $4,309,070 | $-- |
| Domestic Equity Funds | 1,508,579,471 | 1,508,579,471 | -- | -- |
| International Equity Funds | 860,327,599 | 860,327,599 | -- | -- |
| Bond Funds | 2,911,684,164 | 2,911,684,164 | -- | -- |
| Short-Term Funds | 928,535,395 | 928,535,395 | -- | -- |
| Total Investments in Securities: | $6,213,435,699 | $6,209,126,629 | $4,309,070 | $-- |
| Derivative Instruments: | | | | |
| Assets | | | | |
| Futures Contracts | $717,685 | $717,685 | $-- | $-- |
| Total Assets | $717,685 | $717,685 | $-- | $-- |
| Liabilities | | | | |
| Futures Contracts | $(56,078) | $(56,078) | $-- | $-- |
| Total Liabilities | $(56,078) | $(56,078) | $-- | $-- |
| Total Derivative Instruments: | $661,607 | $661,607 | $-- | $-- |
Value of Derivative Instruments
The following table is a summary of the Fund's value of derivative instruments by primary risk exposure as of September 30, 2018. For additional information on derivative instruments, please refer to the Derivative Instruments section in the accompanying Notes to Financial Statements.
| Primary Risk Exposure / Derivative Type | Value |
| | Asset | Liability |
| Equity Risk | | |
| Futures Contracts(a) | $717,685 | $(56,078) |
| Total Equity Risk | 717,685 | (56,078) |
| Total Value of Derivatives | $717,685 | $(56,078) |
(a) Reflects gross cumulative appreciation (depreciation) on futures contracts as presented in the Schedule of Investments. In the Statement of Assets and Liabilities, the period end daily variation margin is included in receivable or payable for daily variation margin on futures contracts, and the net cumulative appreciation (depreciation) is included in net unrealized appreciation (depreciation).
See accompanying notes which are an integral part of the financial statements.
Fidelity Freedom® 2010 Fund
Financial Statements
Statement of Assets and Liabilities
| | | September 30, 2018 (Unaudited) |
| Assets | | |
Investment in securities, at value — See accompanying schedule:
Unaffiliated issuers (cost $4,309,407) | $4,309,070 | |
| Fidelity Central Funds (cost $10,451,764) | 10,451,764 | |
| Other affiliated issuers (cost $5,614,455,322) | 6,198,674,865 | |
| Total Investment in Securities (cost $5,629,216,493) | | $6,213,435,699 |
| Receivable for investments sold | | 25,395,869 |
| Receivable for fund shares sold | | 43,423,852 |
| Distributions receivable from Fidelity Central Funds | | 15,258 |
| Other receivables | | 93,931 |
| Total assets | | 6,282,364,609 |
| Liabilities | | |
| Payable for investments purchased | $23,412,225 | |
| Payable for fund shares redeemed | 45,312,623 | |
| Accrued management fee | 2,592,155 | |
| Payable for daily variation margin on futures contracts | 355,010 | |
| Other payables and accrued expenses | 93,933 | |
| Total liabilities | | 71,765,946 |
| Net Assets | | $6,210,598,663 |
| Net Assets consist of: | | |
| Paid in capital | | $5,453,599,612 |
| Undistributed net investment income | | 45,776,812 |
| Accumulated undistributed net realized gain (loss) on investments | | 126,341,426 |
| Net unrealized appreciation (depreciation) on investments | | 584,880,813 |
| Net Assets | | $6,210,598,663 |
| Fidelity Freedom 2010 Fund: | | |
| Net Asset Value, offering price and redemption price per share ($3,912,850,518 ÷ 246,545,650 shares) | | $15.87 |
| Class K: | | |
| Net Asset Value, offering price and redemption price per share ($2,141,312,975 ÷ 135,032,714 shares) | | $15.86 |
| Class K6: | | |
| Net Asset Value, offering price and redemption price per share ($156,435,170 ÷ 9,869,361 shares) | | $15.85 |
See accompanying notes which are an integral part of the financial statements.
Statement of Operations
| | | Six months ended September 30, 2018 (Unaudited) |
| Investment Income | | |
| Dividends: | | |
| Affiliated issuers | | $61,624,998 |
| Interest | | 17,873 |
| Income from Fidelity Central Funds | | 41,034 |
| Total income | | 61,683,905 |
| Expenses | | |
| Management fee | $15,920,645 | |
| Independent trustees' fees and expenses | 15,661 | |
| Total expenses before reductions | 15,936,306 | |
| Expense reductions | (38) | |
| Total expenses after reductions | | 15,936,268 |
| Net investment income (loss) | | 45,747,637 |
| Realized and Unrealized Gain (Loss) | | |
| Net realized gain (loss) on: | | |
| Investment securities: | | |
| Fidelity Central Funds | (160) | |
| Other affiliated issuers | 107,767,968 | |
| Futures contracts | (2,468,390) | |
| Capital gain distributions from underlying funds: | | |
| Affiliated issuers | 36,885,968 | |
| Total net realized gain (loss) | | 142,185,386 |
| Change in net unrealized appreciation (depreciation) on: | | |
| Investment securities: | | |
| Unaffiliated issuers | (308) | |
| Affiliated issuers | (80,740,832) | |
| Futures contracts | 661,607 | |
| Total change in net unrealized appreciation (depreciation) | | (80,079,533) |
| Net gain (loss) | | 62,105,853 |
| Net increase (decrease) in net assets resulting from operations | | $107,853,490 |
See accompanying notes which are an integral part of the financial statements.
Statement of Changes in Net Assets
| | Six months ended September 30, 2018 (Unaudited) | Year ended March 31, 2018 |
| Increase (Decrease) in Net Assets | | |
| Operations | | |
| Net investment income (loss) | $45,747,637 | $95,597,195 |
| Net realized gain (loss) | 142,185,386 | 280,325,462 |
| Change in net unrealized appreciation (depreciation) | (80,079,533) | 13,024,260 |
| Net increase (decrease) in net assets resulting from operations | 107,853,490 | 388,946,917 |
| Distributions to shareholders from net investment income | (13,644,925) | (93,275,651) |
| Distributions to shareholders from net realized gain | (139,801,282) | (192,908,815) |
| Total distributions | (153,446,207) | (286,184,466) |
| Share transactions - net increase (decrease) | (238,158,638) | 2,254,227,956 |
| Total increase (decrease) in net assets | (283,751,355) | 2,356,990,407 |
| Net Assets | | |
| Beginning of period | 6,494,350,018 | 4,137,359,611 |
| End of period | $6,210,598,663 | $6,494,350,018 |
| Other Information | | |
| Undistributed net investment income end of period | $45,776,812 | $13,674,100 |
See accompanying notes which are an integral part of the financial statements.
Financial Highlights
Fidelity Freedom 2010 Fund
| | Six months ended (Unaudited) September 30, | Years endedMarch 31, | | | | |
| | 2018 | 2018 | 2017 | 2016 | 2015 | 2014 |
| Selected Per–Share Data | | | | | | |
| Net asset value, beginning of period | $15.98 | $15.56 | $14.75 | $15.75 | $15.51 | $14.67 |
| Income from Investment Operations | | | | | | |
| Net investment income (loss)A | .11 | .24 | .26 | .28 | .28 | .22 |
| Net realized and unrealized gain (loss) | .16 | .95 | 1.08 | (.50) | .62 | .99 |
| Total from investment operations | .27 | 1.19 | 1.34 | (.22) | .90 | 1.21 |
| Distributions from net investment income | (.03) | (.23) | (.26) | (.29) | (.29) | (.21) |
| Distributions from net realized gain | (.35) | (.54) | (.26) | (.49) | (.36) | (.16) |
| Total distributions | (.38) | (.77) | (.53)B | (.78) | (.66)C | (.37) |
| Net asset value, end of period | $15.87 | $15.98 | $15.56 | $14.75 | $15.75 | $15.51 |
| Total ReturnD,E | 1.71% | 7.74% | 9.27% | (1.42)% | 5.91% | 8.31% |
| Ratios to Average Net AssetsF,G | | | | | | |
| Expenses before reductions | .52%H,I | .44% | - %J | - %J | - %J | - %J |
| Expenses net of fee waivers, if any | .52%H,I | .44% | -% | -% | -% | -% |
| Expenses net of all reductions | .52%H,I | .44% | -% | -% | -% | -% |
| Net investment income (loss) | 1.41%H | 1.47% | 1.69% | 1.86% | 1.81% | 1.43% |
| Supplemental Data | | | | | | |
| Net assets, end of period (000 omitted) | $3,912,851 | $4,038,370 | $4,137,360 | $4,271,151 | $4,940,590 | $5,419,921 |
| Portfolio turnover rateG | 26%H | 19%K | 23% | 17% | 18% | 35% |
A Calculated based on average shares outstanding during the period.
B Total distributions of $.53 per share is comprised of distributions from net investment income of $.262 and distributions from net realized gain of $.264 per share.
C Total distributions of $.66 per share is comprised of distributions from net investment income of $.294 and distributions from net realized gain of $.361 per share.
D Total returns for periods of less than one year are not annualized.
E Total returns would have been lower if certain expenses had not been reduced during the applicable periods shown.
F Expense ratios reflect operating expenses of the class. Expenses before reductions do not reflect amounts reimbursed by the investment adviser or reductions from expense offset arrangements and do not represent the amount paid by the class during periods when reimbursements or reductions occur. Expenses net of fee waivers reflect expenses after reimbursement by the investment adviser but prior to reductions from expense offset arrangements. Expenses net of all reductions represent the net expenses paid by the class but do not include expenses of the underlying funds in which the Fund invests.
G Amounts do not include the activity of the Underlying Funds.
H Annualized
I On certain classes, the size and fluctuation of net assets and expense amounts may cause ratios to differ from contractual rates.
J Amount represents less than .005%.
K The portfolio turnover rate does not include the assets acquired in the merger.
See accompanying notes which are an integral part of the financial statements.
Fidelity Freedom 2010 Fund Class K
| | Six months ended (Unaudited) September 30, | Years endedMarch 31, |
| | 2018 | 2018 A |
| Selected Per–Share Data | | |
| Net asset value, beginning of period | $15.97 | $15.96 |
| Income from Investment Operations | | |
| Net investment income (loss)B | .12 | .27 |
| Net realized and unrealized gain (loss) | .15 | .31 |
| Total from investment operations | .27 | .58 |
| Distributions from net investment income | (.04) | (.22) |
| Distributions from net realized gain | (.35) | (.35) |
| Total distributions | (.38)C | (.57) |
| Net asset value, end of period | $15.86 | $15.97 |
| Total ReturnD,E | 1.72% | 3.59% |
| Ratios to Average Net AssetsF,G | | |
| Expenses before reductions | .46%H | .47%H |
| Expenses net of fee waivers, if any | .46%H | .47%H |
| Expenses net of all reductions | .46%H | .47%H |
| Net investment income (loss) | 1.48%H | 2.42%H |
| Supplemental Data | | |
| Net assets, end of period (000 omitted) | $2,141,313 | $2,396,182 |
| Portfolio turnover rateG | 26%H | 19%I |
A For the period July 20, 2017 (commencement of sale of shares) to March 31, 2018.
B Calculated based on average shares outstanding during the period.
C Total distributions of $.38 per share is comprised of distributions from net investment income of $.035 and distributions from net realized gain of $.347 per share.
D Total returns for periods of less than one year are not annualized.
E Total returns would have been lower if certain expenses had not been reduced during the applicable periods shown.
F Expense ratios reflect operating expenses of the class. Expenses before reductions do not reflect amounts reimbursed by the investment adviser or reductions from expense offset arrangements and do not represent the amount paid by the class during periods when reimbursements or reductions occur. Expense ratios before reductions for start-up periods may not be representative of longer-term operating periods. Expenses net of fee waivers reflect expenses after reimbursement by the investment adviser but prior to reductions from expense offset arrangements. Expenses net of all reductions represent the net expenses paid by the class but do not include expenses of the underlying funds in which the Fund invests.
G Amounts do not include the activity of the Underlying Funds.
H Annualized
I The portfolio turnover rate does not include the assets acquired in the merger.
See accompanying notes which are an integral part of the financial statements.
Fidelity Freedom 2010 Fund Class K6
| | Six months ended (Unaudited) September 30, | Years endedMarch 31, |
| | 2018 | 2018 A |
| Selected Per–Share Data | | |
| Net asset value, beginning of period | $15.97 | $15.77 |
| Income from Investment Operations | | |
| Net investment income (loss)B | .12 | .27 |
| Net realized and unrealized gain (loss) | .15 | .50 |
| Total from investment operations | .27 | .77 |
| Distributions from net investment income | (.05) | (.22) |
| Distributions from net realized gain | (.35) | (.35) |
| Total distributions | (.39)C | (.57) |
| Net asset value, end of period | $15.85 | $15.97 |
| Total ReturnD,E | 1.72% | 4.89% |
| Ratios to Average Net AssetsF,G | | |
| Expenses before reductions | .39%H | .40%H |
| Expenses net of fee waivers, if any | .39%H | .40%H |
| Expenses net of all reductions | .39%H | .40%H |
| Net investment income (loss) | 1.54%H | 2.07%H |
| Supplemental Data | | |
| Net assets, end of period (000 omitted) | $156,435 | $59,797 |
| Portfolio turnover rateG | 26%H | 19%I |
A For the period June 7, 2017 (commencement of sale of shares) to March 31, 2018.
B Calculated based on average shares outstanding during the period.
C Total distributions of $.39 per share is comprised of distributions from net investment income of $.045 and distributions from net realized gain of $.347 per share.
D Total returns for periods of less than one year are not annualized.
E Total returns would have been lower if certain expenses had not been reduced during the applicable periods shown.
F Expense ratios reflect operating expenses of the class. Expenses before reductions do not reflect amounts reimbursed by the investment adviser or reductions from expense offset arrangements and do not represent the amount paid by the class during periods when reimbursements or reductions occur. Expense ratios before reductions for start-up periods may not be representative of longer-term operating periods. Expenses net of fee waivers reflect expenses after reimbursement by the investment adviser but prior to reductions from expense offset arrangements. Expenses net of all reductions represent the net expenses paid by the class but do not include expenses of the underlying funds in which the Fund invests.
G Amounts do not include the activity of the Underlying Funds.
H Annualized
I The portfolio turnover rate does not include the assets acquired in the merger.
See accompanying notes which are an integral part of the financial statements.
Fidelity Freedom® 2015 Fund
Investment Summary (Unaudited)
The information in the following tables is based on the direct investments of the Fund.
Top Holdings as of September 30, 2018
| | % of fund's net assets |
| Fidelity Series Investment Grade Bond Fund | 26.4 |
| Fidelity Series Government Money Market Fund 2.12% | 8.9 |
| Fidelity Series Inflation-Protected Bond Index Fund | 7.1 |
| Fidelity Series Intrinsic Opportunities Fund | 5.1 |
| Fidelity Series Emerging Markets Opportunities Fund | 5.0 |
| Fidelity Series Long-Term Treasury Bond Index Fund | 4.9 |
| Fidelity Series International Value Fund | 4.8 |
| Fidelity Series International Growth Fund | 4.8 |
| Fidelity Series Large Cap Stock Fund | 4.5 |
| Fidelity Series Growth Company Fund | 4.2 |
| | 75.7 |
Asset Allocation (% of fund's net assets)
| Period end |
| | Domestic Equity Funds | 30.8% |
| | International Equity Funds | 16.4% |
| | Bond Funds | 41.3% |
| | Short-Term Funds | 11.4% |
| | Short-Term Investments | 0.1% |

Domestic Equity Funds category includes Fidelity Series Commodity Strategy Fund which invests in commodity-related investments.
Fidelity Freedom® 2015 Fund
Schedule of Investments September 30, 2018 (Unaudited)
Showing Percentage of Net Assets
| U.S. Treasury Obligations - 0.1% | | | |
| | | Principal Amount | Value |
| U.S. Treasury Bills, yield at date of purchase 1.97% to 2.11% 11/1/18 to 12/6/18 (a) | | | |
| (Cost $6,963,454) | | 6,980,000 | 6,962,914 |
| | | Shares | Value |
|
| Domestic Equity Funds - 30.8% | | | |
| Fidelity Series All-Sector Equity Fund (b) | | 7,658,881 | $104,237,365 |
| Fidelity Series Blue Chip Growth Fund (b) | | 13,099,158 | 200,417,110 |
| Fidelity Series Commodity Strategy Fund (b) | | 38,185,260 | 190,926,300 |
| Fidelity Series Growth Company Fund (b) | | 19,881,835 | 401,811,889 |
| Fidelity Series Intrinsic Opportunities Fund (b) | | 26,628,510 | 488,100,596 |
| Fidelity Series Large Cap Stock Fund (b) | | 26,863,876 | 427,941,546 |
| Fidelity Series Large Cap Value Index Fund (b) | | 9,184,646 | 121,237,328 |
| Fidelity Series Opportunistic Insights Fund (b) | | 10,962,366 | 217,602,974 |
| Fidelity Series Small Cap Discovery Fund (b) | | 4,752,915 | 57,747,920 |
| Fidelity Series Small Cap Opportunities Fund (b) | | 11,968,751 | 175,820,954 |
| Fidelity Series Stock Selector Large Cap Value Fund (b) | | 24,529,834 | 324,284,401 |
| Fidelity Series Value Discovery Fund (b) | | 16,856,316 | 230,762,968 |
| TOTAL DOMESTIC EQUITY FUNDS | | | |
| (Cost $2,013,102,833) | | | 2,940,891,351 |
|
| International Equity Funds - 16.4% | | | |
| Fidelity Series Canada Fund (b) | | 4,212,192 | 45,533,790 |
| Fidelity Series Emerging Markets Fund (b) | | 2,124,534 | 20,586,736 |
| Fidelity Series Emerging Markets Opportunities Fund (b) | | 24,635,965 | 472,764,169 |
| Fidelity Series International Growth Fund (b) | | 27,776,770 | 455,539,033 |
| Fidelity Series International Small Cap Fund (b) | | 6,080,028 | 108,832,500 |
| Fidelity Series International Value Fund (b) | | 43,901,453 | 461,843,287 |
| TOTAL INTERNATIONAL EQUITY FUNDS | | | |
| (Cost $1,161,992,869) | | | 1,565,099,515 |
|
| Bond Funds - 41.3% | | | |
| Fidelity Series Emerging Markets Debt Fund (b) | | 6,862,234 | 65,397,088 |
| Fidelity Series Floating Rate High Income Fund (b) | | 2,348,381 | 22,356,586 |
| Fidelity Series High Income Fund (b) | | 14,013,876 | 134,673,346 |
| Fidelity Series Inflation-Protected Bond Index Fund (b) | | 69,490,388 | 674,751,670 |
| Fidelity Series International Credit Fund (b) | | 527,686 | 5,187,152 |
| Fidelity Series Investment Grade Bond Fund (b) | | 231,533,682 | 2,521,401,798 |
| Fidelity Series Long-Term Treasury Bond Index Fund (b) | | 56,905,913 | 468,904,720 |
| Fidelity Series Real Estate Income Fund (b) | | 4,047,514 | 43,632,202 |
| TOTAL BOND FUNDS | | | |
| (Cost $4,044,757,529) | | | 3,936,304,562 |
|
| Short-Term Funds - 11.4% | | | |
| Fidelity Cash Central Fund, 2.11% (c) | | 13,952,759 | 13,955,550 |
| Fidelity Series Government Money Market Fund 2.12% (b)(d) | | 843,781,001 | 843,781,001 |
| Fidelity Series Short-Term Credit Fund (b) | | 23,286,742 | 229,607,272 |
| TOTAL SHORT-TERM FUNDS | | | |
| (Cost $1,090,261,051) | | | 1,087,343,823 |
| TOTAL INVESTMENT IN SECURITIES - 100.0% | | | |
| (Cost $8,317,077,736) | | | 9,536,602,165 |
| NET OTHER ASSETS (LIABILITIES) - 0.0% | | | (4,222,720) |
| NET ASSETS - 100% | | | $9,532,379,445 |
| Futures Contracts | | | | | |
| | Number of contracts | Expiration Date | Notional Amount | Value | Unrealized Appreciation/(Depreciation) |
| Purchased | | | | | |
| Equity Index Contracts | | | | | |
| ICE E-mini MSCI Emerging Markets Index Contracts (United States) | 1,504 | Dec. 2018 | $78,937,440 | $1,452,217 | $1,452,217 |
| Sold | | | | | |
| Equity Index Contracts | | | | | |
| CME E-mini S&P 500 Index Contracts (United States) | 633 | Dec. 2018 | 92,386,350 | (110,178) | (110,178) |
| TOTAL FUTURES CONTRACTS | | | | | $1,342,039 |
The notional amount of futures purchased as a percentage of Net Assets is 0.8%
The notional amount of futures sold as a percentage of Net Assets is 1.0%
Legend
(a) Security or a portion of the security was pledged to cover margin requirements for futures contracts. At period end, the value of securities pledged amounted to $5,755,063.
(b) Affiliated Fund
(c) Affiliated fund that is generally available only to investment companies and other accounts managed by Fidelity Investments. The rate quoted is the annualized seven-day yield of the fund at period end. A complete unaudited listing of the fund's holdings as of its most recent quarter end is available upon request. In addition, each Fidelity Central Fund's financial statements are available on the SEC's website or upon request.
(d) The rate quoted is the annualized seven-day yield of the fund at period end.
Affiliated Central Funds
Information regarding fiscal year to date income earned by the Fund from investments in Fidelity Central Funds is as follows:
| Fund | Income earned |
| Fidelity Cash Central Fund | $56,713 |
| Total | $56,713 |
Amounts in the income column in the above table include any capital gain distributions from underlying funds, which are presented in the corresponding line-item in the Statement of Operations if applicable.
Affiliated Underlying Funds
Fiscal year to date information regarding the Fund's investments in affiliated Underlying Funds, excluding any Money Market Central Funds, is presented below. Exchanges between classes of the same affiliated Underlying Funds may occur.
| Affiliate | Value, beginning of period | Purchases | Sales Proceeds | Dividend Income | Realized Gain (loss) | Change in Unrealized appreciation (depreciation) | Value, end of period |
| Fidelity Series 100 Index Fund | $105,566,561 | $1 | $109,407,302 | $-- | $40,106,846 | $(36,266,106) | $-- |
| Fidelity Series All-Sector Equity Fund | 202,550,169 | 165,642 | 119,273,752 | -- | 17,821,865 | 2,973,441 | 104,237,365 |
| Fidelity Series Blue Chip Growth Fund | 209,424,941 | 18,861,866 | 44,822,850 | 18,683,697 | 16,415,893 | 537,260 | 200,417,110 |
| Fidelity Series Canada Fund | 50,695,921 | 44,480 | 8,302,451 | -- | 150,419 | 2,945,421 | 45,533,790 |
| Fidelity Series Commodity Strategy Fund | 214,500,126 | 26,473,497 | 34,262,949 | 11,474,253 | (14,531,977) | (1,252,397) | 190,926,300 |
| Fidelity Series Emerging Markets Debt Fund | 72,411,618 | 2,115,267 | 5,219,690 | 2,061,854 | (192,210) | (3,717,897) | 65,397,088 |
| Fidelity Series Emerging Markets Fund | -- | 20,647,008 | -- | -- | -- | (60,272) | 20,586,736 |
| Fidelity Series Emerging Markets Opportunities Fund | 567,323,168 | 19,277,116 | 44,269,796 | -- | 4,838,181 | (74,404,500) | 472,764,169 |
| Fidelity Series Floating Rate High Income Fund | 23,739,962 | 637,234 | 2,042,272 | 614,954 | (82,549) | 104,211 | 22,356,586 |
| Fidelity Series Government Money Market Fund 2.12% | 1,087,835,535 | 130,846,320 | 374,900,854 | 9,813,245 | -- | -- | 843,781,001 |
| Fidelity Series Growth Company Fund | 432,334,504 | 327,473 | 92,082,102 | -- | 42,975,194 | 18,256,820 | 401,811,889 |
| Fidelity Series High Income Fund | 148,415,499 | 4,173,453 | 19,083,941 | 4,057,611 | (765,770) | 1,934,105 | 134,673,346 |
| Fidelity Series Inflation-Protected Bond Index Fund | 199,093,014 | 500,074,055 | 21,995,353 | 632,749 | (549,352) | (1,870,694) | 674,751,670 |
| Fidelity Series International Credit Fund | 5,270,239 | 64,952 | 95,017 | 64,949 | (1,322) | (51,700) | 5,187,152 |
| Fidelity Series International Growth Fund | 522,861,176 | 447,505 | 74,893,359 | -- | 24,509,876 | (17,386,165) | 455,539,033 |
| Fidelity Series International Small Cap Fund | 130,259,302 | 2,410,977 | 19,170,077 | -- | 5,779,036 | (10,446,738) | 108,832,500 |
| Fidelity Series International Value Fund | 517,007,350 | 447,500 | 53,572,606 | -- | 3,710,775 | (5,749,732) | 461,843,287 |
| Fidelity Series Intrinsic Opportunities Fund | 526,008,710 | 21,994,978 | 69,121,942 | 21,592,356 | 6,511,770 | 2,707,080 | 488,100,596 |
| Fidelity Series Investment Grade Bond Fund | 2,839,330,215 | 40,597,523 | 326,746,479 | 38,121,432 | (14,687,457) | (17,092,004) | 2,521,401,798 |
| Fidelity Series Large Cap Stock Fund | 468,089,078 | 27,655,756 | 89,839,128 | 27,279,056 | 6,297,421 | 15,738,419 | 427,941,546 |
| Fidelity Series Large Cap Value Index Fund | 131,206,403 | 101,894 | 18,797,821 | -- | 2,088,173 | 6,638,679 | 121,237,328 |
| Fidelity Series Long-Term Treasury Bond Index Fund | 222,582,675 | 287,217,527 | 24,286,590 | 4,814,374 | (548,000) | (16,060,892) | 468,904,720 |
| Fidelity Series Opportunistic Insights Fund | 229,538,880 | 178,725 | 40,742,237 | -- | 16,518,077 | 12,109,529 | 217,602,974 |
| Fidelity Series Real Estate Equity Fund | 40,229,865 | 286,682 | 41,604,622 | 251,884 | 6,843,030 | (5,754,955) | -- |
| Fidelity Series Real Estate Income Fund | 45,268,860 | 1,945,253 | 3,877,160 | 1,878,975 | 225,064 | 70,185 | 43,632,202 |
| Fidelity Series Short-Term Credit Fund | 266,092,890 | 3,150,871 | 39,632,397 | 2,916,475 | (544,484) | 540,392 | 229,607,272 |
| Fidelity Series Small Cap Discovery Fund | 62,450,884 | 3,708,234 | 7,624,147 | 3,648,644 | 713,232 | (1,500,283) | 57,747,920 |
| Fidelity Series Small Cap Opportunities Fund | 190,744,879 | 13,804,967 | 36,025,212 | 13,648,437 | 8,560,808 | (1,264,488) | 175,820,954 |
| Fidelity Series Stock Selector Large Cap Value Fund | 357,360,316 | 278,813 | 56,973,360 | -- | 11,923,124 | 11,695,508 | 324,284,401 |
| Fidelity Series Value Discovery Fund | 253,985,129 | 197,475 | 37,652,579 | -- | 9,584,673 | 4,648,270 | 230,762,968 |
| | $10,122,177,869 | $1,128,133,044 | $1,816,318,045 | $161,554,945 | $193,670,336 | $(111,979,503) | $9,515,683,701 |
Amounts in the income column in the above table include any capital gain distributions from underlying funds, which are presented in the corresponding line-item in the Statement of Operations if applicable.
Investment Valuation
The following is a summary of the inputs used, as of September 30, 2018, involving the Fund's assets and liabilities carried at fair value. The inputs or methodology used for valuing securities may not be an indication of the risk associated with investing in those securities. For more information on valuation inputs, and their aggregation into the levels used below, please refer to the Investment Valuation section in the accompanying Notes to Financial Statements.
| | Valuation Inputs at Reporting Date: |
| Description | Total | Level 1 | Level 2 | Level 3 |
| Investments in Securities: | | | | |
| Other Short-Term Investments | $6,962,914 | $-- | $6,962,914 | $-- |
| Domestic Equity Funds | 2,940,891,351 | 2,940,891,351 | -- | -- |
| International Equity Funds | 1,565,099,515 | 1,565,099,515 | -- | -- |
| Bond Funds | 3,936,304,562 | 3,936,304,562 | -- | -- |
| Short-Term Funds | 1,087,343,823 | 1,087,343,823 | -- | -- |
| Total Investments in Securities: | $9,536,602,165 | $9,529,639,251 | $6,962,914 | $-- |
| Derivative Instruments: | | | | |
| Assets | | | | |
| Futures Contracts | $1,452,217 | $1,452,217 | $-- | $-- |
| Total Assets | $1,452,217 | $1,452,217 | $-- | $-- |
| Liabilities | | | | |
| Futures Contracts | $(110,178) | $(110,178) | $-- | $-- |
| Total Liabilities | $(110,178) | $(110,178) | $-- | $-- |
| Total Derivative Instruments: | $1,342,039 | $1,342,039 | $-- | $-- |
Value of Derivative Instruments
The following table is a summary of the Fund's value of derivative instruments by primary risk exposure as of September 30, 2018. For additional information on derivative instruments, please refer to the Derivative Instruments section in the accompanying Notes to Financial Statements.
| Primary Risk Exposure / Derivative Type | Value |
| | Asset | Liability |
| Equity Risk | | |
| Futures Contracts(a) | $1,452,217 | $(110,178) |
| Total Equity Risk | 1,452,217 | (110,178) |
| Total Value of Derivatives | $1,452,217 | $(110,178) |
(a) Reflects gross cumulative appreciation (depreciation) on futures contracts as presented in the Schedule of Investments. In the Statement of Assets and Liabilities, the period end daily variation margin is included in receivable or payable for daily variation margin on futures contracts, and the net cumulative appreciation (depreciation) is included in net unrealized appreciation (depreciation).
See accompanying notes which are an integral part of the financial statements.
Fidelity Freedom® 2015 Fund
Financial Statements
Statement of Assets and Liabilities
| | | September 30, 2018 (Unaudited) |
| Assets | | |
Investment in securities, at value — See accompanying schedule:
Unaffiliated issuers (cost $6,963,454) | $6,962,914 | |
| Fidelity Central Funds (cost $13,955,550) | 13,955,550 | |
| Other affiliated issuers (cost $8,296,158,732) | 9,515,683,701 | |
| Total Investment in Securities (cost $8,317,077,736) | | $9,536,602,165 |
| Receivable for investments sold | | 19,451,157 |
| Receivable for fund shares sold | | 151,139,181 |
| Distributions receivable from Fidelity Central Funds | | 20,143 |
| Total assets | | 9,707,212,646 |
| Liabilities | | |
| Payable for investments purchased | $15,312,677 | |
| Payable for fund shares redeemed | 154,742,851 | |
| Accrued management fee | 4,235,571 | |
| Payable for daily variation margin on futures contracts | 542,102 | |
| Total liabilities | | 174,833,201 |
| Net Assets | | $9,532,379,445 |
| Net Assets consist of: | | |
| Paid in capital | | $8,004,819,143 |
| Undistributed net investment income | | 62,789,082 |
| Accumulated undistributed net realized gain (loss) on investments | | 243,904,752 |
| Net unrealized appreciation (depreciation) on investments | | 1,220,866,468 |
| Net Assets | | $9,532,379,445 |
| Fidelity Freedom 2015 Fund: | | |
| Net Asset Value, offering price and redemption price per share ($5,221,028,753 ÷ 393,516,799 shares) | | $13.27 |
| Class K: | | |
| Net Asset Value, offering price and redemption price per share ($3,944,021,176 ÷ 297,621,143 shares) | | $13.25 |
| Class K6: | | |
| Net Asset Value, offering price and redemption price per share ($367,329,516 ÷ 27,706,572 shares) | | $13.26 |
See accompanying notes which are an integral part of the financial statements.
Statement of Operations
| | | Six months ended September 30, 2018 (Unaudited) |
| Investment Income | | |
| Dividends: | | |
| Affiliated issuers | | $89,189,405 |
| Interest | | 27,693 |
| Income from Fidelity Central Funds | | 56,713 |
| Total income | | 89,273,811 |
| Expenses | | |
| Management fee | $26,301,567 | |
| Independent trustees' fees and expenses | 24,338 | |
| Total expenses before reductions | 26,325,905 | |
| Expense reductions | (55) | |
| Total expenses after reductions | | 26,325,850 |
| Net investment income (loss) | | 62,947,961 |
| Realized and Unrealized Gain (Loss) | | |
| Net realized gain (loss) on: | | |
| Investment securities: | | |
| Fidelity Central Funds | (192) | |
| Other affiliated issuers | 193,670,336 | |
| Futures contracts | (4,911,076) | |
| Capital gain distributions from underlying funds: | | |
| Affiliated issuers | 72,365,540 | |
| Total net realized gain (loss) | | 261,124,608 |
| Change in net unrealized appreciation (depreciation) on: | | |
| Investment securities: | | |
| Unaffiliated issuers | (496) | |
| Affiliated issuers | (111,979,503) | |
| Futures contracts | 1,342,039 | |
| Total change in net unrealized appreciation (depreciation) | | (110,637,960) |
| Net gain (loss) | | 150,486,648 |
| Net increase (decrease) in net assets resulting from operations | | $213,434,609 |
See accompanying notes which are an integral part of the financial statements.
Statement of Changes in Net Assets
| | Six months ended September 30, 2018 (Unaudited) | Year ended March 31, 2018 |
| Increase (Decrease) in Net Assets | | |
| Operations | | |
| Net investment income (loss) | $62,947,961 | $141,540,775 |
| Net realized gain (loss) | 261,124,608 | 463,661,846 |
| Change in net unrealized appreciation (depreciation) | (110,637,960) | 46,350,154 |
| Net increase (decrease) in net assets resulting from operations | 213,434,609 | 651,552,775 |
| Distributions to shareholders from net investment income | (16,218,290) | (138,935,375) |
| Distributions to shareholders from net realized gain | (243,245,554) | (291,414,799) |
| Total distributions | (259,463,844) | (430,350,174) |
| Share transactions - net increase (decrease) | (540,504,439) | 4,570,397,075 |
| Total increase (decrease) in net assets | (586,533,674) | 4,791,599,676 |
| Net Assets | | |
| Beginning of period | 10,118,913,119 | 5,327,313,443 |
| End of period | $9,532,379,445 | $10,118,913,119 |
| Other Information | | |
| Undistributed net investment income end of period | $62,789,082 | $16,059,411 |
See accompanying notes which are an integral part of the financial statements.
Financial Highlights
Fidelity Freedom 2015 Fund
| | Six months ended (Unaudited) September 30, | Years endedMarch 31, | | | | |
| | 2018 | 2018 | 2017 | 2016 | 2015 | 2014 |
| Selected Per–Share Data | | | | | | |
| Net asset value, beginning of period | $13.33 | $12.82 | $12.03 | $12.92 | $12.91 | $12.28 |
| Income from Investment Operations | | | | | | |
| Net investment income (loss)A | .08 | .19 | .21 | .23 | .23 | .18 |
| Net realized and unrealized gain (loss) | .21 | .97 | 1.04 | (.46) | .57 | .91 |
| Total from investment operations | .29 | 1.16 | 1.25 | (.23) | .80 | 1.09 |
| Distributions from net investment income | (.02) | (.19) | (.21) | (.23) | (.25) | (.18) |
| Distributions from net realized gain | (.32) | (.46) | (.24) | (.43) | (.54) | (.28) |
| Total distributions | (.35)B | (.65) | (.46)C | (.66) | (.79) | (.46) |
| Net asset value, end of period | $13.27 | $13.33 | $12.82 | $12.03 | $12.92 | $12.91 |
| Total ReturnD,E | 2.16% | 9.15% | 10.63% | (1.83)% | 6.42% | 8.95% |
| Ratios to Average Net AssetsF,G | | | | | | |
| Expenses before reductions | .57%H | .48% | - %I | - %I | - %I | - %I |
| Expenses net of fee waivers, if any | .57%H | .48% | -% | -% | -% | -% |
| Expenses net of all reductions | .57%H | .48% | -% | -% | -% | -% |
| Net investment income (loss) | 1.24%H | 1.40% | 1.69% | 1.87% | 1.83% | 1.47% |
| Supplemental Data | | | | | | |
| Net assets, end of period (000 omitted) | $5,221,029 | $5,380,580 | $5,327,313 | $5,354,142 | $6,056,161 | $6,388,485 |
| Portfolio turnover rateG | 23%H | 23%J | 21% | 17% | 18% | 39% |
A Calculated based on average shares outstanding during the period.
B Total distributions of $.35 per share is comprised of distributions from net investment income of $.021 and distributions from net realized gain of $.324 per share.
C Total distributions of $.46 per share is comprised of distributions from net investment income of $.214 and distributions from net realized gain of $.243 per share.
D Total returns for periods of less than one year are not annualized.
E Total returns would have been lower if certain expenses had not been reduced during the applicable periods shown.
F Expense ratios reflect operating expenses of the class. Expenses before reductions do not reflect amounts reimbursed by the investment adviser or reductions from expense offset arrangements and do not represent the amount paid by the class during periods when reimbursements or reductions occur. Expenses net of fee waivers reflect expenses after reimbursement by the investment adviser but prior to reductions from expense offset arrangements. Expenses net of all reductions represent the net expenses paid by the class but do not include expenses of the underlying funds in which the Fund invests.
G Amounts do not include the activity of the Underlying Funds.
H Annualized
I Amount represents less than $.005 per share.
J The portfolio turnover rate does not include the assets acquired in the merger.
See accompanying notes which are an integral part of the financial statements.
Fidelity Freedom 2015 Fund Class K
| | Six months ended (Unaudited) September 30, | Years endedMarch 31, |
| | 2018 | 2018 A |
| Selected Per–Share Data | | |
| Net asset value, beginning of period | $13.31 | $13.21 |
| Income from Investment Operations | | |
| Net investment income (loss)B | .09 | .22 |
| Net realized and unrealized gain (loss) | .20 | .34 |
| Total from investment operations | .29 | .56 |
| Distributions from net investment income | (.02) | (.18) |
| Distributions from net realized gain | (.32) | (.29) |
| Total distributions | (.35)C | (.46)D |
| Net asset value, end of period | $13.25 | $13.31 |
| Total ReturnE,F | 2.17% | 4.25% |
| Ratios to Average Net AssetsG,H | | |
| Expenses before reductions | .50%I | .51%I,J |
| Expenses net of fee waivers, if any | .50%I | .51%I,J |
| Expenses net of all reductions | .50%I | .51%I,J |
| Net investment income (loss) | 1.31%I | 2.39%I |
| Supplemental Data | | |
| Net assets, end of period (000 omitted) | $3,944,021 | $4,624,065 |
| Portfolio turnover rateH | 23%I | 23%K |
A For the period July 20, 2017 (commencement of sale of shares) to March 31, 2018.
B Calculated based on average shares outstanding during the period.
C Total distributions of $.35 per share is comprised of distributions from net investment income of $.022 and distributions from net realized gain of $.324 per share.
D Total distributions of $.46 per share is comprised of distributions from net investment income of $.176 and distributions from net realized gain of $.288 per share.
E Total returns for periods of less than one year are not annualized.
F Total returns would have been lower if certain expenses had not been reduced during the applicable periods shown.
G Expense ratios reflect operating expenses of the class. Expenses before reductions do not reflect amounts reimbursed by the investment adviser or reductions from expense offset arrangements and do not represent the amount paid by the class during periods when reimbursements or reductions occur. Expense ratios before reductions for start-up periods may not be representative of longer-term operating periods. Expenses net of fee waivers reflect expenses after reimbursement by the investment adviser but prior to reductions from expense offset arrangements. Expenses net of all reductions represent the net expenses paid by the class but do not include expenses of the underlying funds in which the Fund invests.
H Amounts do not include the activity of the Underlying Funds.
I Annualized
J On certain classes, the size and fluctuation of net assets and expense amounts may cause ratios to differ from contractual rates.
K The portfolio turnover rate does not include the assets acquired in the merger.
See accompanying notes which are an integral part of the financial statements.
Fidelity Freedom 2015 Fund Class K6
| | Six months ended (Unaudited) September 30, | Years endedMarch 31, |
| | 2018 | 2018 A |
| Selected Per–Share Data | | |
| Net asset value, beginning of period | $13.32 | $13.03 |
| Income from Investment Operations | | |
| Net investment income (loss)B | .09 | .21 |
| Net realized and unrealized gain (loss) | .21 | .55 |
| Total from investment operations | .30 | .76 |
| Distributions from net investment income | (.03) | (.18) |
| Distributions from net realized gain | (.32) | (.29) |
| Total distributions | (.36)C | (.47) |
| Net asset value, end of period | $13.26 | $13.32 |
| Total ReturnD,E | 2.24% | 5.80% |
| Ratios to Average Net AssetsF,G | | |
| Expenses before reductions | .41%H | .42%H |
| Expenses net of fee waivers, if any | .41%H | .42%H |
| Expenses net of all reductions | .41%H | .42%H |
| Net investment income (loss) | 1.40%H | 1.88%H |
| Supplemental Data | | |
| Net assets, end of period (000 omitted) | $367,330 | $114,268 |
| Portfolio turnover rateG | 23%H | 23%I |
A For the period June 7, 2017 (commencement of sale of shares) to March 31, 2018.
B Calculated based on average shares outstanding during the period.
C Total distributions of $.36 per share is comprised of distributions from net investment income of $.031 and distributions from net realized gain of $.324 per share.
D Total returns for periods of less than one year are not annualized.
E Total returns would have been lower if certain expenses had not been reduced during the applicable periods shown.
F Expense ratios reflect operating expenses of the class. Expenses before reductions do not reflect amounts reimbursed by the investment adviser or reductions from expense offset arrangements and do not represent the amount paid by the class during periods when reimbursements or reductions occur. Expense ratios before reductions for start-up periods may not be representative of longer-term operating periods. Expenses net of fee waivers reflect expenses after reimbursement by the investment adviser but prior to reductions from expense offset arrangements. Expenses net of all reductions represent the net expenses paid by the class but do not include expenses of the underlying funds in which the Fund invests.
G Amounts do not include the activity of the Underlying Funds.
H Annualized
I The portfolio turnover rate does not include the assets acquired in the merger.
See accompanying notes which are an integral part of the financial statements.
Fidelity Freedom® 2020 Fund
Investment Summary (Unaudited)
The information in the following tables is based on the direct investments of the Fund.
Top Holdings as of September 30, 2018
| | % of fund's net assets |
| Fidelity Series Investment Grade Bond Fund | 23.4 |
| Fidelity Series Government Money Market Fund 2.12% | 6.7 |
| Fidelity Series Intrinsic Opportunities Fund | 6.0 |
| Fidelity Series Emerging Markets Opportunities Fund | 5.6 |
| Fidelity Series International Value Fund | 5.6 |
| Fidelity Series International Growth Fund | 5.5 |
| Fidelity Series Large Cap Stock Fund | 5.3 |
| Fidelity Series Inflation-Protected Bond Index Fund | 5.2 |
| Fidelity Series Long-Term Treasury Bond Index Fund | 5.0 |
| Fidelity Series Growth Company Fund | 5.0 |
| | 73.3 |
Asset Allocation (% of fund's net assets)
| Period end |
| | Domestic Equity Funds | 36.0% |
| | International Equity Funds | 18.8% |
| | Bond Funds | 36.5% |
| | Short-Term Funds | 8.7% |
| | Short-Term Investments | 0.1% |
| | Net Other Assets (Liabilities)* | (0.1)% |

* Net Other Assets (Liabilities) are not included in the pie chart
Domestic Equity Funds category includes Fidelity Series Commodity Strategy Fund which invests in commodity-related investments.
Fidelity Freedom® 2020 Fund
Schedule of Investments September 30, 2018 (Unaudited)
Showing Percentage of Net Assets
| U.S. Treasury Obligations - 0.1% | | | |
| | | Principal Amount | Value |
| U.S. Treasury Bills, yield at date of purchase 1.97% to 2.11% 11/1/18 to 12/6/18 (a) | | | |
| (Cost $20,684,518) | | 20,740,000 | 20,682,973 |
| | | Shares | Value |
|
| Domestic Equity Funds - 36.0% | | | |
| Fidelity Series All-Sector Equity Fund (b) | | 27,901,675 | $379,741,798 |
| Fidelity Series Blue Chip Growth Fund (b) | | 47,180,854 | 721,867,065 |
| Fidelity Series Commodity Strategy Fund (b) | | 115,360,190 | 576,800,948 |
| Fidelity Series Growth Company Fund (b) | | 71,744,072 | 1,449,947,705 |
| Fidelity Series Intrinsic Opportunities Fund (b) | | 95,774,150 | 1,755,540,176 |
| Fidelity Series Large Cap Stock Fund (b) | | 96,968,323 | 1,544,705,386 |
| Fidelity Series Large Cap Value Index Fund (b) | | 33,002,026 | 435,626,739 |
| Fidelity Series Opportunistic Insights Fund (b) | | 39,499,537 | 784,065,805 |
| Fidelity Series Small Cap Discovery Fund (b) | | 16,912,504 | 205,486,924 |
| Fidelity Series Small Cap Opportunities Fund (b) | | 43,090,956 | 633,006,149 |
| Fidelity Series Stock Selector Large Cap Value Fund (b) | | 88,498,465 | 1,169,949,712 |
| Fidelity Series Value Discovery Fund (b) | | 60,755,485 | 831,742,593 |
| TOTAL DOMESTIC EQUITY FUNDS | | | |
| (Cost $7,381,363,828) | | | 10,488,481,000 |
|
| International Equity Funds - 18.8% | | | |
| Fidelity Series Canada Fund (b) | | 15,702,480 | 169,743,805 |
| Fidelity Series Emerging Markets Fund (b) | | 4,980,307 | 48,259,173 |
| Fidelity Series Emerging Markets Opportunities Fund (b) | | 85,388,757 | 1,638,610,256 |
| Fidelity Series International Growth Fund (b) | | 97,581,000 | 1,600,328,399 |
| Fidelity Series International Small Cap Fund (b) | | 21,324,242 | 381,703,938 |
| Fidelity Series International Value Fund (b) | | 154,295,465 | 1,623,188,288 |
| TOTAL INTERNATIONAL EQUITY FUNDS | | | |
| (Cost $4,160,105,513) | | | 5,461,833,859 |
|
| Bond Funds - 36.5% | | | |
| Fidelity Series Emerging Markets Debt Fund (b) | | 20,245,743 | 192,941,935 |
| Fidelity Series Floating Rate High Income Fund (b) | | 7,073,863 | 67,343,177 |
| Fidelity Series High Income Fund (b) | | 43,144,010 | 414,613,939 |
| Fidelity Series Inflation-Protected Bond Index Fund (b) | | 155,310,033 | 1,508,060,418 |
| Fidelity Series International Credit Fund (b) | | 1,792,036 | 17,615,710 |
| Fidelity Series Investment Grade Bond Fund (b) | | 625,929,878 | 6,816,376,369 |
| Fidelity Series Long-Term Treasury Bond Index Fund (b) | | 177,442,343 | 1,462,124,903 |
| Fidelity Series Real Estate Income Fund (b) | | 12,447,953 | 134,188,936 |
| TOTAL BOND FUNDS | | | |
| (Cost $10,980,191,105) | | | 10,613,265,387 |
|
| Short-Term Funds - 8.7% | | | |
| Fidelity Cash Central Fund, 2.11% (c) | | 42,140,236 | 42,148,664 |
| Fidelity Series Government Money Market Fund 2.12% (b)(d) | | 1,944,540,655 | 1,944,540,655 |
| Fidelity Series Short-Term Credit Fund (b) | | 55,059,947 | 542,891,082 |
| TOTAL SHORT-TERM FUNDS | | | |
| (Cost $2,536,671,980) | | | 2,529,580,401 |
| TOTAL INVESTMENT IN SECURITIES - 100.1% | | | |
| (Cost $25,079,016,944) | | | 29,113,843,620 |
| NET OTHER ASSETS (LIABILITIES) - (0.1)% | | | (14,640,031) |
| NET ASSETS - 100% | | | $29,099,203,589 |
| Futures Contracts | | | | | |
| | Number of contracts | Expiration Date | Notional Amount | Value | Unrealized Appreciation/(Depreciation) |
| Purchased | | | | | |
| Equity Index Contracts | | | | | |
| ICE E-mini MSCI Emerging Markets Index Contracts (United States) | 4,535 | Dec. 2018 | $238,019,475 | $4,376,008 | $4,376,008�� |
| Sold | | | | | |
| Equity Index Contracts | | | | | |
| CME E-mini S&P 500 Index Contracts (United States) | 1,796 | Dec. 2018 | 262,126,200 | (307,900) | (307,900) |
| TOTAL FUTURES CONTRACTS | | | | | $4,068,108 |
The notional amount of futures purchased as a percentage of Net Assets is 0.8%
The notional amount of futures sold as a percentage of Net Assets is 0.9%
Legend
(a) Security or a portion of the security was pledged to cover margin requirements for futures contracts. At period end, the value of securities pledged amounted to $17,053,430.
(b) Affiliated Fund
(c) Affiliated fund that is generally available only to investment companies and other accounts managed by Fidelity Investments. The rate quoted is the annualized seven-day yield of the fund at period end. A complete unaudited listing of the fund's holdings as of its most recent quarter end is available upon request. In addition, each Fidelity Central Fund's financial statements are available on the SEC's website or upon request.
(d) The rate quoted is the annualized seven-day yield of the fund at period end.
Affiliated Central Funds
Information regarding fiscal year to date income earned by the Fund from investments in Fidelity Central Funds is as follows:
| Fund | Income earned |
| Fidelity Cash Central Fund | $162,964 |
| Total | $162,964 |
Amounts in the income column in the above table include any capital gain distributions from underlying funds, which are presented in the corresponding line-item in the Statement of Operations if applicable.
Affiliated Underlying Funds
Fiscal year to date information regarding the Fund's investments in affiliated Underlying Funds, excluding any Money Market Central Funds, is presented below. Exchanges between classes of the same affiliated Underlying Funds may occur.
| Affiliate | Value, beginning of period | Purchases | Sales Proceeds | Dividend Income | Realized Gain (loss) | Change in Unrealized appreciation (depreciation) | Value, end of period |
| Fidelity Series 100 Index Fund | $360,400,417 | $18 | $373,452,465 | $-- | $134,660,262 | $(121,608,232) | $-- |
| Fidelity Series All-Sector Equity Fund | 691,515,664 | 5,912,990 | 390,346,648 | -- | 47,833,809 | 24,825,983 | 379,741,798 |
| Fidelity Series Blue Chip Growth Fund | 714,854,503 | 73,434,189 | 123,409,663 | 67,214,282 | 43,462,382 | 13,525,654 | 721,867,065 |
| Fidelity Series Canada Fund | 169,349,670 | 648,026 | 10,636,089 | -- | 129,982 | 10,252,216 | 169,743,805 |
| Fidelity Series Commodity Strategy Fund | 638,248,050 | 78,993,185 | 92,859,241 | 34,628,683 | (45,876,779) | (1,704,267) | 576,800,948 |
| Fidelity Series Emerging Markets Debt Fund | 209,218,641 | 6,706,916 | 11,624,759 | 6,022,733 | (499,589) | (10,859,274) | 192,941,935 |
| Fidelity Series Emerging Markets Fund | -- | 48,402,903 | -- | -- | -- | (143,730) | 48,259,173 |
| Fidelity Series Emerging Markets Opportunities Fund | 1,848,959,268 | 123,491,002 | 102,599,769 | -- | (746,065) | (230,494,180) | 1,638,610,256 |
| Fidelity Series Floating Rate High Income Fund | 69,635,549 | 2,114,433 | 4,473,612 | 1,829,305 | (122,884) | 189,691 | 67,343,177 |
| Fidelity Series Government Money Market Fund 2.12% | 2,454,122,385 | 321,786,452 | 831,368,182 | 22,641,479 | -- | -- | 1,944,540,655 |
| Fidelity Series Growth Company Fund | 1,469,022,731 | 5,359,767 | 237,023,800 | -- | 93,373,769 | 119,215,238 | 1,449,947,705 |
| Fidelity Series High Income Fund | 434,030,687 | 13,681,073 | 36,622,814 | 12,260,125 | (1,265,562) | 4,790,555 | 414,613,939 |
| Fidelity Series Inflation-Protected Bond Index Fund | 347,776,727 | 1,194,769,059 | 28,339,402 | 1,379,976 | (648,563) | (5,497,403) | 1,508,060,418 |
| Fidelity Series International Credit Fund | 17,926,241 | 220,920 | 351,103 | 220,920 | (4,832) | (175,516) | 17,615,710 |
| Fidelity Series International Growth Fund | 1,737,696,795 | 6,165,398 | 168,803,959 | -- | 43,054,241 | (17,784,076) | 1,600,328,399 |
| Fidelity Series International Small Cap Fund | 434,859,065 | 12,224,124 | 49,635,188 | -- | 9,108,149 | (24,852,212) | 381,703,938 |
| Fidelity Series International Value Fund | 1,726,630,081 | 6,581,315 | 104,401,927 | -- | 3,185,545 | (8,806,726) | 1,623,188,288 |
| Fidelity Series Intrinsic Opportunities Fund | 1,772,722,653 | 84,228,130 | 130,872,669 | 77,651,229 | 11,980,201 | 17,481,861 | 1,755,540,176 |
| Fidelity Series Investment Grade Bond Fund | 7,589,645,384 | 130,699,952 | 818,830,011 | 102,923,588 | (43,165,455) | (41,973,501) | 6,816,376,369 |
| Fidelity Series Large Cap Stock Fund | 1,614,989,603 | 102,266,670 | 248,681,205 | 96,277,444 | 10,554,794 | 65,575,524 | 1,544,705,386 |
| Fidelity Series Large Cap Value Index Fund | 448,080,326 | 1,673,594 | 44,586,413 | -- | 4,293,345 | 26,165,887 | 435,626,739 |
| Fidelity Series Long-Term Treasury Bond Index Fund | 665,667,185 | 883,693,252 | 35,609,154 | 13,856,674 | (144,171) | (51,482,209) | 1,462,124,903 |
| Fidelity Series Opportunistic Insights Fund | 783,485,090 | 2,927,703 | 101,693,495 | -- | 27,776,159 | 71,570,348 | 784,065,805 |
| Fidelity Series Real Estate Equity Fund | 138,627,411 | 1,050,429 | 143,649,574 | 919,961 | 17,526,868 | (13,555,134) | -- |
| Fidelity Series Real Estate Income Fund | 135,680,911 | 6,271,124 | 8,623,823 | 5,733,380 | (24,741) | 885,465 | 134,188,936 |
| Fidelity Series Short-Term Credit Fund | 587,623,481 | 8,924,659 | 53,652,115 | 6,544,973 | (659,181) | 654,238 | 542,891,082 |
| Fidelity Series Small Cap Discovery Fund | 213,189,712 | 13,443,747 | 18,319,251 | 12,594,460 | 814,202 | (3,641,486) | 205,486,924 |
| Fidelity Series Small Cap Opportunities Fund | 651,074,180 | 51,481,288 | 92,958,343 | 49,078,326 | 15,604,718 | 7,804,306 | 633,006,149 |
| Fidelity Series Stock Selector Large Cap Value Fund | 1,220,429,926 | 4,574,271 | 137,418,773 | -- | 5,123,409 | 77,240,879 | 1,169,949,712 |
| Fidelity Series Value Discovery Fund | 867,290,850 | 5,047,119 | 90,171,026 | -- | 16,315,887 | 33,259,763 | 831,742,593 |
| | $30,012,753,186 | $3,196,773,708 | $4,491,014,473 | $511,777,538 | $391,639,900 | $(59,140,338) | $29,051,011,983 |
Amounts in the income column in the above table include any capital gain distributions from underlying funds, which are presented in the corresponding line-item in the Statement of Operations if applicable.
Investment Valuation
The following is a summary of the inputs used, as of September 30, 2018, involving the Fund's assets and liabilities carried at fair value. The inputs or methodology used for valuing securities may not be an indication of the risk associated with investing in those securities. For more information on valuation inputs, and their aggregation into the levels used below, please refer to the Investment Valuation section in the accompanying Notes to Financial Statements.
| | Valuation Inputs at Reporting Date: |
| Description | Total | Level 1 | Level 2 | Level 3 |
| Investments in Securities: | | | | |
| Other Short-Term Investments | $20,682,973 | $-- | $20,682,973 | $-- |
| Domestic Equity Funds | 10,488,481,000 | 10,488,481,000 | -- | -- |
| International Equity Funds | 5,461,833,859 | 5,461,833,859 | -- | -- |
| Bond Funds | 10,613,265,387 | 10,613,265,387 | -- | -- |
| Short-Term Funds | 2,529,580,401 | 2,529,580,401 | -- | -- |
| Total Investments in Securities: | $29,113,843,620 | $29,093,160,647 | $20,682,973 | $-- |
| Derivative Instruments: | | | | |
| Assets | | | | |
| Futures Contracts | $4,376,008 | $4,376,008 | $-- | $-- |
| Total Assets | $4,376,008 | $4,376,008 | $-- | $-- |
| Liabilities | | | | |
| Futures Contracts | $(307,900) | $(307,900) | $-- | $-- |
| Total Liabilities | $(307,900) | $(307,900) | $-- | $-- |
| Total Derivative Instruments: | $4,068,108 | $4,068,108 | $-- | $-- |
Value of Derivative Instruments
The following table is a summary of the Fund's value of derivative instruments by primary risk exposure as of September 30, 2018. For additional information on derivative instruments, please refer to the Derivative Instruments section in the accompanying Notes to Financial Statements.
| Primary Risk Exposure / Derivative Type | Value |
| | Asset | Liability |
| Equity Risk | | |
| Futures Contracts(a) | $4,376,008 | $(307,900) |
| Total Equity Risk | 4,376,008 | (307,900) |
| Total Value of Derivatives | $4,376,008 | $(307,900) |
(a) Reflects gross cumulative appreciation (depreciation) on futures contracts as presented in the Schedule of Investments. In the Statement of Assets and Liabilities, the period end daily variation margin is included in receivable or payable for daily variation margin on futures contracts, and the net cumulative appreciation (depreciation) is included in net unrealized appreciation (depreciation).
See accompanying notes which are an integral part of the financial statements.
Fidelity Freedom® 2020 Fund
Financial Statements
Statement of Assets and Liabilities
| | | September 30, 2018 (Unaudited) |
| Assets | | |
Investment in securities, at value — See accompanying schedule:
Unaffiliated issuers (cost $20,684,518) | $20,682,973 | |
| Fidelity Central Funds (cost $42,148,664) | 42,148,664 | |
| Other affiliated issuers (cost $25,016,183,762) | 29,051,011,983 | |
| Total Investment in Securities (cost $25,079,016,944) | | $29,113,843,620 |
| Receivable for investments sold | | 37,923,786 |
| Receivable for fund shares sold | | 514,747,929 |
| Distributions receivable from Fidelity Central Funds | | 60,894 |
| Other receivables | | 212,156 |
| Total assets | | 29,666,788,385 |
| Liabilities | | |
| Payable for investments purchased | $33,203,900 | |
| Payable for fund shares redeemed | 518,888,158 | |
| Accrued management fee | 13,626,759 | |
| Payable for daily variation margin on futures contracts | 1,653,823 | |
| Other payables and accrued expenses | 212,156 | |
| Total liabilities | | 567,584,796 |
| Net Assets | | $29,099,203,589 |
| Net Assets consist of: | | |
| Paid in capital | | $24,306,599,649 |
| Undistributed net investment income | | 169,346,562 |
| Accumulated undistributed net realized gain (loss) on investments | | 584,362,594 |
| Net unrealized appreciation (depreciation) on investments | | 4,038,894,784 |
| Net Assets | | $29,099,203,589 |
| Fidelity Freedom 2020 Fund: | | |
| Net Asset Value, offering price and redemption price per share ($12,864,323,624 ÷ 779,070,636 shares) | | $16.51 |
| Class K: | | |
| Net Asset Value, offering price and redemption price per share ($14,833,133,079 ÷ 899,112,347 shares) | | $16.50 |
| Class K6: | | |
| Net Asset Value, offering price and redemption price per share ($1,401,746,886 ÷ 84,913,068 shares) | | $16.51 |
See accompanying notes which are an integral part of the financial statements.
Statement of Operations
| | | Six months ended September 30, 2018 (Unaudited) |
| Investment Income | | |
| Dividends: | | |
| Affiliated issuers | | $253,523,770 |
| Interest | | 86,552 |
| Income from Fidelity Central Funds | | 162,964 |
| Total income | | 253,773,286 |
| Expenses | | |
| Management fee | $83,688,050 | |
| Independent trustees' fees and expenses | 72,715 | |
| Total expenses before reductions | 83,760,765 | |
| Expense reductions | (13) | |
| Total expenses after reductions | | 83,760,752 |
| Net investment income (loss) | | 170,012,534 |
| Realized and Unrealized Gain (Loss) | | |
| Net realized gain (loss) on: | | |
| Investment securities: | | |
| Fidelity Central Funds | (181) | |
| Other affiliated issuers | 391,639,900 | |
| Futures contracts | (15,516,827) | |
| Capital gain distributions from underlying funds: | | |
| Affiliated issuers | 258,253,768 | |
| Total net realized gain (loss) | | 634,376,660 |
| Change in net unrealized appreciation (depreciation) on: | | |
| Investment securities: | | |
| Unaffiliated issuers | (1,416) | |
| Affiliated issuers | (59,140,338) | |
| Futures contracts | 4,068,108 | |
| Total change in net unrealized appreciation (depreciation) | | (55,073,646) |
| Net gain (loss) | | 579,303,014 |
| Net increase (decrease) in net assets resulting from operations | | $749,315,548 |
See accompanying notes which are an integral part of the financial statements.
Statement of Changes in Net Assets
| | Six months ended September 30, 2018 (Unaudited) | Year ended March 31, 2018 |
| Increase (Decrease) in Net Assets | | |
| Operations | | |
| Net investment income (loss) | $170,012,534 | $395,829,727 |
| Net realized gain (loss) | 634,376,660 | 1,249,079,495 |
| Change in net unrealized appreciation (depreciation) | (55,073,646) | 265,229,829 |
| Net increase (decrease) in net assets resulting from operations | 749,315,548 | 1,910,139,051 |
| Distributions to shareholders from net investment income | (35,844,885) | (388,661,235) |
| Distributions to shareholders from net realized gain | (703,638,216) | (719,753,000) |
| Total distributions | (739,483,101) | (1,108,414,235) |
| Share transactions - net increase (decrease) | (912,760,404) | 16,921,166,403 |
| Total increase (decrease) in net assets | (902,927,957) | 17,722,891,219 |
| Net Assets | | |
| Beginning of period | 30,002,131,546 | 12,279,240,327 |
| End of period | $29,099,203,589 | $30,002,131,546 |
| Other Information | | |
| Undistributed net investment income end of period | $169,346,562 | $35,178,913 |
See accompanying notes which are an integral part of the financial statements.
Financial Highlights
Fidelity Freedom 2020 Fund
| | Six months ended (Unaudited) September 30, | Years endedMarch 31, | | | | |
| | 2018 | 2018 | 2017 | 2016 | 2015 | 2014 |
| Selected Per–Share Data | | | | | | |
| Net asset value, beginning of period | $16.51 | $15.70 | $14.63 | $15.76 | $15.81 | $14.94 |
| Income from Investment Operations | | | | | | |
| Net investment income (loss)A | .09 | .22 | .25 | .28 | .28 | .23 |
| Net realized and unrealized gain (loss) | .32 | 1.34 | 1.40 | (.60) | .73 | 1.22 |
| Total from investment operations | .41 | 1.56 | 1.65 | (.32) | 1.01 | 1.45 |
| Distributions from net investment income | (.02) | (.22) | (.26) | (.28) | (.29) | (.23) |
| Distributions from net realized gain | (.39) | (.52) | (.32) | (.53) | (.77) | (.36) |
| Total distributions | (.41) | (.75)B | (.58) | (.81) | (1.06) | (.58)C |
| Net asset value, end of period | $16.51 | $16.51 | $15.70 | $14.63 | $15.76 | $15.81 |
| Total ReturnD,E | 2.50% | 10.01% | 11.57% | (2.10)% | 6.71% | 9.83% |
| Ratios to Average Net AssetsF,G | | | | | | |
| Expenses before reductions | .61%H | .52% | - %I | - %I | - %I | - %I |
| Expenses net of fee waivers, if any | .61%H | .52% | -% | -% | -% | -% |
| Expenses net of all reductions | .61%H | .52% | -% | -% | -% | -% |
| Net investment income (loss) | 1.10%H | 1.34% | 1.69% | 1.83% | 1.83% | 1.49% |
| Supplemental Data | | | | | | |
| Net assets, end of period (000 omitted) | $12,864,324 | $12,916,078 | $12,279,240 | $11,732,980 | $12,868,898 | $13,343,983 |
| Portfolio turnover rateG | 22%H | 21%J | 19% | 17% | 17% | 39% |
A Calculated based on average shares outstanding during the period.
B Total distributions of $.75 per share is comprised of distributions from net investment income of $.221 and distributions from net realized gain of $.524 per share.
C Total distributions of $.58 per share is comprised of distributions from net investment income of $.228 and distributions from net realized gain of $.356 per share.
D Total returns for periods of less than one year are not annualized.
E Total returns would have been lower if certain expenses had not been reduced during the applicable periods shown.
F Expense ratios reflect operating expenses of the class. Expenses before reductions do not reflect amounts reimbursed by the investment adviser or reductions from expense offset arrangements and do not represent the amount paid by the class during periods when reimbursements or reductions occur. Expenses net of fee waivers reflect expenses after reimbursement by the investment adviser but prior to reductions from expense offset arrangements. Expenses net of all reductions represent the net expenses paid by the class but do not include expenses of the underlying funds in which the Fund invests.
G Amounts do not include the activity of the Underlying Funds.
H Annualized
I Amount represents less than .005%.
J The portfolio turnover rate does not include the assets acquired in the merger.
See accompanying notes which are an integral part of the financial statements.
Fidelity Freedom 2020 Fund Class K
| | Six months ended (Unaudited) September 30, | Years endedMarch 31, |
| | 2018 | 2018 A |
| Selected Per–Share Data | | |
| Net asset value, beginning of period | $16.49 | $16.24 |
| Income from Investment Operations | | |
| Net investment income (loss)B | .10 | .27 |
| Net realized and unrealized gain (loss) | .32 | .50 |
| Total from investment operations | .42 | .77 |
| Distributions from net investment income | (.02) | (.21) |
| Distributions from net realized gain | (.39) | (.31) |
| Total distributions | (.41) | (.52) |
| Net asset value, end of period | $16.50 | $16.49 |
| Total ReturnC,D | 2.57% | 4.73% |
| Ratios to Average Net AssetsE,F | | |
| Expenses before reductions | .53%G | .54%G |
| Expenses net of fee waivers, if any | .53%G | .54%G |
| Expenses net of all reductions | .53%G | .54%G |
| Net investment income (loss) | 1.18%G | 2.34%G |
| Supplemental Data | | |
| Net assets, end of period (000 omitted) | $14,833,133 | $16,611,072 |
| Portfolio turnover rateF | 22%G | 21%H |
A For the period July 20, 2017 (commencement of sale of shares) to March 31, 2018.
B Calculated based on average shares outstanding during the period.
C Total returns for periods of less than one year are not annualized.
D Total returns would have been lower if certain expenses had not been reduced during the applicable periods shown.
E Expense ratios reflect operating expenses of the class. Expenses before reductions do not reflect amounts reimbursed by the investment adviser or reductions from expense offset arrangements and do not represent the amount paid by the class during periods when reimbursements or reductions occur. Expense ratios before reductions for start-up periods may not be representative of longer-term operating periods. Expenses net of fee waivers reflect expenses after reimbursement by the investment adviser but prior to reductions from expense offset arrangements. Expenses net of all reductions represent the net expenses paid by the class but do not include expenses of the underlying funds in which the Fund invests.
F Amounts do not include the activity of the Underlying Funds.
G Annualized
H The portfolio turnover rate does not include the assets acquired in the merger.
See accompanying notes which are an integral part of the financial statements.
Fidelity Freedom 2020 Fund Class K6
| | Six months ended (Unaudited) September 30, | Years endedMarch 31, |
| | 2018 | 2018 A |
| Selected Per–Share Data | | |
| Net asset value, beginning of period | $16.50 | $16.00 |
| Income from Investment Operations | | |
| Net investment income (loss)B | .10 | .24 |
| Net realized and unrealized gain (loss) | .33 | .79 |
| Total from investment operations | .43 | 1.03 |
| Distributions from net investment income | (.03) | (.22) |
| Distributions from net realized gain | (.39) | (.31) |
| Total distributions | (.42) | (.53) |
| Net asset value, end of period | $16.51 | $16.50 |
| Total ReturnC,D | 2.64% | 6.40% |
| Ratios to Average Net AssetsE,F | | |
| Expenses before reductions | .43%G | .44%G |
| Expenses net of fee waivers, if any | .43%G | .44%G |
| Expenses net of all reductions | .43%G | .44%G |
| Net investment income (loss) | 1.28%G | 1.79%G |
| Supplemental Data | | |
| Net assets, end of period (000 omitted) | $1,401,747 | $474,981 |
| Portfolio turnover rateF | 22%G | 21%H |
A For the period June 7, 2017 (commencement of sale of shares) to March 31, 2018.
B Calculated based on average shares outstanding during the period.
C Total returns for periods of less than one year are not annualized.
D Total returns would have been lower if certain expenses had not been reduced during the applicable periods shown.
E Expense ratios reflect operating expenses of the class. Expenses before reductions do not reflect amounts reimbursed by the investment adviser or reductions from expense offset arrangements and do not represent the amount paid by the class during periods when reimbursements or reductions occur. Expense ratios before reductions for start-up periods may not be representative of longer-term operating periods. Expenses net of fee waivers reflect expenses after reimbursement by the investment adviser but prior to reductions from expense offset arrangements. Expenses net of all reductions represent the net expenses paid by the class but do not include expenses of the underlying funds in which the Fund invests.
F Amounts do not include the activity of the Underlying Funds.
G Annualized
H The portfolio turnover rate does not include the assets acquired in the merger.
See accompanying notes which are an integral part of the financial statements.
Fidelity Freedom® 2025 Fund
Investment Summary (Unaudited)
The information in the following tables is based on the direct investments of the Fund.
Top Holdings as of September 30, 2018
| | % of fund's net assets |
| Fidelity Series Investment Grade Bond Fund | 19.8 |
| Fidelity Series Intrinsic Opportunities Fund | 6.8 |
| Fidelity Series Emerging Markets Opportunities Fund | 6.2 |
| Fidelity Series International Value Fund | 6.2 |
| Fidelity Series International Growth Fund | 6.2 |
| Fidelity Series Large Cap Stock Fund | 6.1 |
| Fidelity Series Growth Company Fund | 5.7 |
| Fidelity Series Long-Term Treasury Bond Index Fund | 5.5 |
| Fidelity Series Stock Selector Large Cap Value Fund | 4.6 |
| Fidelity Series Government Money Market Fund 2.12% | 4.6 |
| | 71.7 |
Asset Allocation (% of fund's net assets)
| Period end |
| | Domestic Equity Funds | 40.9% |
| | International Equity Funds | 20.9% |
| | Bond Funds | 32.2% |
| | Short-Term Funds | 6.0% |
| | Short-Term Investments | 0.1% |
| | Net Other Assets (Liabilities)* | (0.1)% |

* Net Other Assets (Liabilities) are not included in the pie chart
Domestic Equity Funds category includes Fidelity Series Commodity Strategy Fund which invests in commodity-related investments.
Fidelity Freedom® 2025 Fund
Schedule of Investments September 30, 2018 (Unaudited)
Showing Percentage of Net Assets
| U.S. Treasury Obligations - 0.1% | | | |
| | | Principal Amount | Value |
| U.S. Treasury Bills, yield at date of purchase 1.97% to 2.11% 11/1/18 to 12/6/18 (a) | | | |
| (Cost $19,442,444) | | 19,490,000 | 19,440,982 |
| | | Shares | Value |
|
| Domestic Equity Funds - 40.9% | | | |
| Fidelity Series All-Sector Equity Fund (b) | | 30,302,311 | $412,414,456 |
| Fidelity Series Blue Chip Growth Fund (b) | | 50,976,342 | 779,938,038 |
| Fidelity Series Commodity Strategy Fund (b) | | 110,170,047 | 550,850,234 |
| Fidelity Series Growth Company Fund (b) | | 77,589,531 | 1,568,084,421 |
| Fidelity Series Intrinsic Opportunities Fund (b) | | 102,930,239 | 1,886,711,284 |
| Fidelity Series Large Cap Stock Fund (b) | | 104,879,975 | 1,670,737,995 |
| Fidelity Series Large Cap Value Index Fund (b) | | 35,606,853 | 470,010,462 |
| Fidelity Series Opportunistic Insights Fund (b) | | 42,684,373 | 847,284,803 |
| Fidelity Series Small Cap Discovery Fund (b) | | 18,261,335 | 221,875,223 |
| Fidelity Series Small Cap Opportunities Fund (b) | | 46,547,929 | 683,789,084 |
| Fidelity Series Stock Selector Large Cap Value Fund (b) | | 95,699,550 | 1,265,148,047 |
| Fidelity Series Value Discovery Fund (b) | | 65,662,320 | 898,917,161 |
| TOTAL DOMESTIC EQUITY FUNDS | | | |
| (Cost $8,187,698,363) | | | 11,255,761,208 |
|
| International Equity Funds - 20.9% | | | |
| Fidelity Series Canada Fund (b) | | 16,156,197 | 174,648,485 |
| Fidelity Series Emerging Markets Fund (b) | | 5,764,656 | 55,859,521 |
| Fidelity Series Emerging Markets Opportunities Fund (b) | | 89,442,930 | 1,716,409,834 |
| Fidelity Series International Growth Fund (b) | | 103,044,534 | 1,689,930,355 |
| Fidelity Series International Small Cap Fund (b) | | 22,449,718 | 401,849,944 |
| Fidelity Series International Value Fund (b) | | 162,577,898 | 1,710,319,490 |
| TOTAL INTERNATIONAL EQUITY FUNDS | | | |
| (Cost $4,533,831,290) | | | 5,749,017,629 |
|
| Bond Funds - 32.2% | | | |
| Fidelity Series Emerging Markets Debt Fund (b) | | 18,481,956 | 176,133,041 |
| Fidelity Series Floating Rate High Income Fund (b) | | 6,637,878 | 63,192,596 |
| Fidelity Series High Income Fund (b) | | 40,188,331 | 386,209,861 |
| Fidelity Series Inflation-Protected Bond Index Fund (b) | | 115,530,452 | 1,121,800,684 |
| Fidelity Series International Credit Fund (b) | | 1,540,231 | 15,140,469 |
| Fidelity Series Investment Grade Bond Fund (b) | | 501,829,516 | 5,464,923,433 |
| Fidelity Series Long-Term Treasury Bond Index Fund (b) | | 184,541,040 | 1,520,618,174 |
| Fidelity Series Real Estate Income Fund (b) | | 11,609,758 | 125,153,191 |
| TOTAL BOND FUNDS | | | |
| (Cost $9,171,160,909) | | | 8,873,171,449 |
|
| Short-Term Funds - 6.0% | | | |
| Fidelity Cash Central Fund, 2.11% (c) | | 41,037,700 | 41,045,907 |
| Fidelity Series Government Money Market Fund 2.12% (b)(d) | | 1,253,497,910 | 1,253,497,910 |
| Fidelity Series Short-Term Credit Fund (b) | | 37,391,811 | 368,683,260 |
| TOTAL SHORT-TERM FUNDS | | | |
| (Cost $1,668,019,128) | | | 1,663,227,077 |
| TOTAL INVESTMENT IN SECURITIES - 100.1% | | | |
| (Cost $23,580,152,134) | | | 27,560,618,345 |
| NET OTHER ASSETS (LIABILITIES) - (0.1)% | | | (14,682,467) |
| NET ASSETS - 100% | | | $27,545,935,878 |
| Futures Contracts | | | | | |
| | Number of contracts | Expiration Date | Notional Amount | Value | Unrealized Appreciation/(Depreciation) |
| Purchased | | | | | |
| Equity Index Contracts | | | | | |
| ICE E-mini MSCI Emerging Markets Index Contracts (United States) | 3,728 | Dec. 2018 | $195,664,080 | $3,633,712 | $3,633,712 |
| Sold | | | | | |
| Equity Index Contracts | | | | | |
| CME E-mini S&P 500 Index Contracts (United States) | 1,696 | Dec. 2018 | 247,531,200 | (288,162) | (288,162) |
| TOTAL FUTURES CONTRACTS | | | | | $3,345,550 |
The notional amount of futures purchased as a percentage of Net Assets is 0.7%
The notional amount of futures sold as a percentage of Net Assets is 0.9%
Legend
(a) Security or a portion of the security was pledged to cover margin requirements for futures contracts. At period end, the value of securities pledged amounted to $15,876,324.
(b) Affiliated Fund
(c) Affiliated fund that is generally available only to investment companies and other accounts managed by Fidelity Investments. The rate quoted is the annualized seven-day yield of the fund at period end. A complete unaudited listing of the fund's holdings as of its most recent quarter end is available upon request. In addition, each Fidelity Central Fund's financial statements are available on the SEC's website or upon request.
(d) The rate quoted is the annualized seven-day yield of the fund at period end.
Affiliated Central Funds
Information regarding fiscal year to date income earned by the Fund from investments in Fidelity Central Funds is as follows:
| Fund | Income earned |
| Fidelity Cash Central Fund | $153,942 |
| Total | $153,942 |
Amounts in the income column in the above table include any capital gain distributions from underlying funds, which are presented in the corresponding line-item in the Statement of Operations if applicable.
Affiliated Underlying Funds
Fiscal year to date information regarding the Fund's investments in affiliated Underlying Funds, excluding any Money Market Central Funds, is presented below. Exchanges between classes of the same affiliated Underlying Funds may occur.
| Affiliate | Value, beginning of period | Purchases | Sales Proceeds | Dividend Income | Realized Gain (loss) | Change in Unrealized appreciation (depreciation) | Value, end of period |
| Fidelity Series 100 Index Fund | $366,746,530 | $384 | $382,199,252 | $-- | $139,134,622 | $(123,682,284) | $-- |
| Fidelity Series All-Sector Equity Fund | 705,221,492 | 15,551,846 | 384,070,279 | -- | 36,458,834 | 39,252,563 | 412,414,456 |
| Fidelity Series Blue Chip Growth Fund | 728,890,637 | 88,795,941 | 94,156,576 | 72,350,827 | 22,684,036 | 33,724,000 | 779,938,038 |
| Fidelity Series Canada Fund | 169,257,716 | 3,477,368 | 8,571,760 | -- | 116,918 | 10,368,243 | 174,648,485 |
| Fidelity Series Commodity Strategy Fund | 582,964,326 | 81,295,478 | 68,462,613 | 32,961,333 | (28,404,874) | (16,542,083) | 550,850,234 |
| Fidelity Series Emerging Markets Debt Fund | 184,835,032 | 8,877,984 | 7,483,112 | 5,408,566 | (411,653) | (9,685,210) | 176,133,041 |
| Fidelity Series Emerging Markets Fund | -- | 55,960,024 | -- | -- | -- | (100,503) | 55,859,521 |
| Fidelity Series Emerging Markets Opportunities Fund | 1,817,196,161 | 193,452,530 | 63,823,094 | -- | (3,018,174) | (227,397,589) | 1,716,409,834 |
| Fidelity Series Floating Rate High Income Fund | 62,801,027 | 3,130,310 | 2,803,707 | 1,683,568 | (63,140) | 128,106 | 63,192,596 |
| Fidelity Series Government Money Market Fund 2.12% | 1,735,916,271 | 172,279,209 | 654,697,570 | 15,253,300 | -- | -- | 1,253,497,910 |
| Fidelity Series Growth Company Fund | 1,493,068,097 | 31,322,027 | 177,032,286 | -- | 36,615,397 | 184,111,186 | 1,568,084,421 |
| Fidelity Series High Income Fund | 387,878,745 | 18,504,114 | 23,389,205 | 11,220,336 | (589,516) | 3,805,723 | 386,209,861 |
| Fidelity Series Inflation-Protected Bond Index Fund | 222,364,297 | 911,178,259 | 6,827,308 | 988,660 | (23,267) | (4,891,297) | 1,121,800,684 |
| Fidelity Series International Credit Fund | 15,496,785 | 191,690 | 392,105 | 190,980 | (5,113) | (150,788) | 15,140,469 |
| Fidelity Series International Growth Fund | 1,728,455,734 | 43,212,609 | 108,064,363 | -- | 15,054,172 | 11,272,203 | 1,689,930,355 |
| Fidelity Series International Small Cap Fund | 431,342,797 | 8,755,526 | 21,742,015 | -- | 1,443,936 | (17,950,300) | 401,849,944 |
| Fidelity Series International Value Fund | 1,725,207,204 | 62,987,330 | 73,295,750 | -- | (538,505) | (4,040,789) | 1,710,319,490 |
| Fidelity Series Intrinsic Opportunities Fund | 1,796,627,752 | 121,591,534 | 59,030,567 | 83,401,306 | 1,578,802 | 25,943,763 | 1,886,711,284 |
| Fidelity Series Investment Grade Bond Fund | 5,978,177,564 | 195,897,113 | 641,768,213 | 81,796,113 | (28,536,206) | (38,846,825) | 5,464,923,433 |
| Fidelity Series Large Cap Stock Fund | 1,631,361,660 | 135,740,643 | 174,727,221 | 101,329,164 | 6,575,880 | 71,787,033 | 1,670,737,995 |
| Fidelity Series Large Cap Value Index Fund | 457,041,989 | 9,676,985 | 28,662,009 | -- | 999,171 | 30,954,326 | 470,010,462 |
| Fidelity Series Long-Term Treasury Bond Index Fund | 610,405,640 | 976,089,648 | 14,154,094 | 14,920,890 | (230,741) | (51,492,279) | 1,520,618,174 |
| Fidelity Series Opportunistic Insights Fund | 798,825,062 | 17,066,251 | 71,713,173 | -- | 5,365,848 | 97,740,815 | 847,284,803 |
| Fidelity Series Real Estate Equity Fund | 142,057,130 | 1,088,209 | 147,363,842 | 964,911 | 10,969,915 | (6,751,412) | -- |
| Fidelity Series Real Estate Income Fund | 121,846,965 | 8,009,657 | 5,442,189 | 5,285,335 | (80,098) | 818,856 | 125,153,191 |
| Fidelity Series Short-Term Credit Fund | 397,592,784 | 13,176,053 | 42,081,652 | 4,455,640 | (495,834) | 491,909 | 368,683,260 |
| Fidelity Series Small Cap Discovery Fund | 217,412,216 | 17,811,259 | 10,236,357 | 13,071,975 | (155,699) | (2,956,196) | 221,875,223 |
| Fidelity Series Small Cap Opportunities Fund | 663,854,507 | 66,759,576 | 69,193,679 | 52,816,971 | 8,136,431 | 14,232,249 | 683,789,084 |
| Fidelity Series Stock Selector Large Cap Value Fund | 1,244,944,162 | 26,153,549 | 91,381,663 | -- | 9,787 | 85,422,212 | 1,265,148,047 |
| Fidelity Series Value Discovery Fund | 884,624,024 | 18,724,436 | 56,090,981 | -- | 716,663 | 50,943,019 | 898,917,161 |
| Total | $27,302,414,306 | $3,306,757,542 | $3,488,856,635 | $498,099,875 | $223,307,592 | $156,508,651 | $27,500,131,456 |
Amounts in the income column in the above table include any capital gain distributions from underlying funds, which are presented in the corresponding line-item in the Statement of Operations if applicable.
Investment Valuation
The following is a summary of the inputs used, as of September 30, 2018, involving the Fund's assets and liabilities carried at fair value. The inputs or methodology used for valuing securities may not be an indication of the risk associated with investing in those securities. For more information on valuation inputs, and their aggregation into the levels used below, please refer to the Investment Valuation section in the accompanying Notes to Financial Statements.
| | Valuation Inputs at Reporting Date: |
| Description | Total | Level 1 | Level 2 | Level 3 |
| Investments in Securities: | | | | |
| Other Short-Term Investments | $19,440,982 | $-- | $19,440,982 | $-- |
| Domestic Equity Funds | 11,255,761,208 | 11,255,761,208 | -- | -- |
| International Equity Funds | 5,749,017,629 | 5,749,017,629 | -- | -- |
| Bond Funds | 8,873,171,449 | 8,873,171,449 | -- | -- |
| Short-Term Funds | 1,663,227,077 | 1,663,227,077 | -- | -- |
| Total Investments in Securities: | $27,560,618,345 | $27,541,177,363 | $19,440,982 | $-- |
| Derivative Instruments: | | | | |
| Assets | | | | |
| Futures Contracts | $3,633,712 | $3,633,712 | $-- | $-- |
| Total Assets | $3,633,712 | $3,633,712 | $-- | $-- |
| Liabilities | | | | |
| Futures Contracts | $(288,162) | $(288,162) | $-- | $-- |
| Total Liabilities | $(288,162) | $(288,162) | $-- | $-- |
| Total Derivative Instruments: | $3,345,550 | $3,345,550 | $-- | $-- |
Value of Derivative Instruments
The following table is a summary of the Fund's value of derivative instruments by primary risk exposure as of September 30, 2018. For additional information on derivative instruments, please refer to the Derivative Instruments section in the accompanying Notes to Financial Statements.
| Primary Risk Exposure / Derivative Type | Value |
| | Asset | Liability |
| Equity Risk | | |
| Futures Contracts(a) | $3,633,712 | $(288,162) |
| Total Equity Risk | 3,633,712 | (288,162) |
| Total Value of Derivatives | $3,633,712 | $(288,162) |
(a) Reflects gross cumulative appreciation (depreciation) on futures contracts as presented in the Schedule of Investments. In the Statement of Assets and Liabilities, the period end daily variation margin is included in receivable or payable for daily variation margin on futures contracts, and the net cumulative appreciation (depreciation) is included in net unrealized appreciation (depreciation).
See accompanying notes which are an integral part of the financial statements.
Fidelity Freedom® 2025 Fund
Financial Statements
Statement of Assets and Liabilities
| | | September 30, 2018 (Unaudited) |
| Assets | | |
Investment in securities, at value — See accompanying schedule:
Unaffiliated issuers (cost $19,442,444) | $19,440,982 | |
| Fidelity Central Funds (cost $41,045,907) | 41,045,907 | |
| Other affiliated issuers (cost $23,519,663,783) | 27,500,131,456 | |
| Total Investment in Securities (cost $23,580,152,134) | | $27,560,618,345 |
| Receivable for investments sold | | 45,676,268 |
| Receivable for fund shares sold | | 629,791,752 |
| Distributions receivable from Fidelity Central Funds | | 58,853 |
| Total assets | | 28,236,145,218 |
| Liabilities | | |
| Payable for investments purchased | $52,497,661 | |
| Payable for fund shares redeemed | 622,403,206 | |
| Accrued management fee | 13,618,137 | |
| Payable for daily variation margin on futures contracts | 1,690,336 | |
| Total liabilities | | 690,209,340 |
| Net Assets | | $27,545,935,878 |
| Net Assets consist of: | | |
| Paid in capital | | $22,983,958,524 |
| Undistributed net investment income | | 140,625,726 |
| Accumulated undistributed net realized gain (loss) on investments | | 437,539,867 |
| Net unrealized appreciation (depreciation) on investments | | 3,983,811,761 |
| Net Assets | | $27,545,935,878 |
| Fidelity Freedom 2025 Fund: | | |
| Net Asset Value, offering price and redemption price per share ($11,181,853,747 ÷ 775,112,675 shares) | | $14.43 |
| Class K: | | |
| Net Asset Value, offering price and redemption price per share ($14,621,522,701 ÷ 1,014,803,262 shares) | | $14.41 |
| Class K6: | | |
| Net Asset Value, offering price and redemption price per share ($1,742,559,430 ÷ 120,774,335 shares) | | $14.43 |
See accompanying notes which are an integral part of the financial statements.
Statement of Operations
| | | Six months ended September 30, 2018 (Unaudited) |
| Investment Income | | |
| Dividends: | | |
| Affiliated issuers | | $222,419,803 |
| Interest | | 86,188 |
| Income from Fidelity Central Funds | | 153,942 |
| Total income | | 222,659,933 |
| Expenses | | |
| Management fee | $82,393,147 | |
| Independent trustees' fees and expenses | 66,851 | |
| Total expenses before reductions | 82,459,998 | |
| Expense reductions | (12) | |
| Total expenses after reductions | | 82,459,986 |
| Net investment income (loss) | | 140,199,947 |
| Realized and Unrealized Gain (Loss) | | |
| Net realized gain (loss) on: | | |
| Investment securities: | | |
| Fidelity Central Funds | 153 | |
| Other affiliated issuers | 223,307,592 | |
| Futures contracts | (16,107,477) | |
| Capital gain distributions from underlying funds: | | |
| Affiliated issuers | 275,680,072 | |
| Total net realized gain (loss) | | 482,880,340 |
| Change in net unrealized appreciation (depreciation) on: | | |
| Investment securities: | | |
| Unaffiliated issuers | (1,345) | |
| Affiliated issuers | 156,508,651 | |
| Futures contracts | 3,345,550 | |
| Total change in net unrealized appreciation (depreciation) | | 159,852,856 |
| Net gain (loss) | | 642,733,196 |
| Net increase (decrease) in net assets resulting from operations | | $782,933,143 |
See accompanying notes which are an integral part of the financial statements.
Statement of Changes in Net Assets
| | Six months ended September 30, 2018 (Unaudited) | Year ended March 31, 2018 |
| Increase (Decrease) in Net Assets | | |
| Operations | | |
| Net investment income (loss) | $140,199,947 | $338,806,701 |
| Net realized gain (loss) | 482,880,340 | 1,044,395,111 |
| Change in net unrealized appreciation (depreciation) | 159,852,856 | 390,546,666 |
| Net increase (decrease) in net assets resulting from operations | 782,933,143 | 1,773,748,478 |
| Distributions to shareholders from net investment income | (20,792,240) | (337,178,441) |
| Distributions to shareholders from net realized gain | (610,170,349) | (559,307,494) |
| Total distributions | (630,962,589) | (896,485,935) |
| Share transactions - net increase (decrease) | 102,036,675 | 16,650,118,805 |
| Total increase (decrease) in net assets | 254,007,229 | 17,527,381,348 |
| Net Assets | | |
| Beginning of period | 27,291,928,649 | 9,764,547,301 |
| End of period | $27,545,935,878 | $27,291,928,649 |
| Other Information | | |
| Undistributed net investment income end of period | $140,625,726 | $21,218,019 |
See accompanying notes which are an integral part of the financial statements.
Financial Highlights
Fidelity Freedom 2025 Fund
| | Six months ended (Unaudited) September 30, | Years endedMarch 31, | | | | |
| | 2018 | 2018 | 2017 | 2016 | 2015 | 2014 |
| Selected Per–Share Data | | | | | | |
| Net asset value, beginning of period | $14.35 | $13.50 | $12.49 | $13.51 | $13.49 | $12.58 |
| Income from Investment Operations | | | | | | |
| Net investment income (loss)A | .07 | .18 | .21 | .22 | .24 | .20 |
| Net realized and unrealized gain (loss) | .34 | 1.26 | 1.30 | (.54) | .69 | 1.30 |
| Total from investment operations | .41 | 1.44 | 1.51 | (.32) | .93 | 1.50 |
| Distributions from net investment income | (.01) | (.18) | (.21) | (.23) | (.25) | (.20) |
| Distributions from net realized gain | (.32) | (.41) | (.29) | (.47) | (.66) | (.39) |
| Total distributions | (.33) | (.59) | (.50) | (.70) | (.91) | (.59) |
| Net asset value, end of period | $14.43 | $14.35 | $13.50 | $12.49 | $13.51 | $13.49 |
| Total ReturnB,C | 2.88% | 10.81% | 12.46% | (2.50)% | 7.23% | 12.08% |
| Ratios to Average Net AssetsD,E | | | | | | |
| Expenses before reductions | .65%F | .56%G | - %H | - %H | - %H | - %H |
| Expenses net of fee waivers, if any | .65%F | .56%G | -% | -% | -% | -% |
| Expenses net of all reductions | .65%F | .56%G | -% | -% | -% | -% |
| Net investment income (loss) | .96%F | 1.28% | 1.66% | 1.75% | 1.81% | 1.53% |
| Supplemental Data | | | | | | |
| Net assets, end of period (000 omitted) | $11,181,854 | $10,923,217 | $9,764,547 | $8,717,568 | $9,054,681 | $8,865,153 |
| Portfolio turnover rateD | 24%F | 18%I | 19% | 17% | 19% | 46% |
A Calculated based on average shares outstanding during the period.
B Total returns for periods of less than one year are not annualized.
C Total returns would have been lower if certain expenses had not been reduced during the applicable periods shown.
D Amounts do not include the activity of the Underlying Funds.
E Expense ratios reflect operating expenses of the class. Expenses before reductions do not reflect amounts reimbursed by the investment adviser or reductions from expense offset arrangements and do not represent the amount paid by the class during periods when reimbursements or reductions occur. Expenses net of fee waivers reflect expenses after reimbursement by the investment adviser but prior to reductions from expense offset arrangements. Expenses net of all reductions represent the net expenses paid by the class but do not include expenses of the underlying funds in which the Fund invests.
F Annualized
G On certain classes, the size and fluctuation of net assets and expense amounts may cause ratios to differ from contractual rates.
H Amount represents less than .005%.
I The portfolio turnover rate does not include the assets acquired in the merger.
See accompanying notes which are an integral part of the financial statements.
Fidelity Freedom 2025 Fund Class K
| | Six months ended (Unaudited) September 30, | Years endedMarch 31, |
| | 2018 | 2018 A |
| Selected Per–Share Data | | |
| Net asset value, beginning of period | $14.33 | $14.02 |
| Income from Investment Operations | | |
| Net investment income (loss)B | .08 | .23 |
| Net realized and unrealized gain (loss) | .33 | .50 |
| Total from investment operations | .41 | .73 |
| Distributions from net investment income | (.01) | (.18) |
| Distributions from net realized gain | (.32) | (.24) |
| Total distributions | (.33) | (.42) |
| Net asset value, end of period | $14.41 | $14.33 |
| Total ReturnC,D | 2.89% | 5.18% |
| Ratios to Average Net AssetsE,F | | |
| Expenses before reductions | .57%G | .58%G,H |
| Expenses net of fee waivers, if any | .57%G | .58%G,H |
| Expenses net of all reductions | .57%G | .58%G,H |
| Net investment income (loss) | 1.05%G | 2.28%G |
| Supplemental Data | | |
| Net assets, end of period (000 omitted) | $14,621,523 | $15,743,238 |
| Portfolio turnover rateE | 24%G | 18%I |
A For the period July 20, 2017 (commencement of sale of shares) to March 31, 2018.
B Calculated based on average shares outstanding during the period.
C Total returns for periods of less than one year are not annualized.
D Total returns would have been lower if certain expenses had not been reduced during the applicable periods shown.
E Amounts do not include the activity of the Underlying Funds.
F Expense ratios reflect operating expenses of the class. Expenses before reductions do not reflect amounts reimbursed by the investment adviser or reductions from expense offset arrangements and do not represent the amount paid by the class during periods when reimbursements or reductions occur. Expense ratios before reductions for start-up periods may not be representative of longer-term operating periods. Expenses net of fee waivers reflect expenses after reimbursement by the investment adviser but prior to reductions from expense offset arrangements. Expenses net of all reductions represent the net expenses paid by the class but do not include expenses of the underlying funds in which the Fund invests.
G Annualized
H On certain classes, the size and fluctuation of net assets and expense amounts may cause ratios to differ from contractual rates.
I The portfolio turnover rate does not include the assets acquired in the merger.
See accompanying notes which are an integral part of the financial statements.
Fidelity Freedom 2025 Fund Class K6
| | Six months ended (Unaudited) September 30, | Years endedMarch 31, |
| | 2018 | 2018 A |
| Selected Per–Share Data | | |
| Net asset value, beginning of period | $14.35 | $13.80 |
| Income from Investment Operations | | |
| Net investment income (loss)B | .08 | .21 |
| Net realized and unrealized gain (loss) | .34 | .76 |
| Total from investment operations | .42 | .97 |
| Distributions from net investment income | (.02) | (.19) |
| Distributions from net realized gain | (.32) | (.24) |
| Total distributions | (.34) | (.42)C |
| Net asset value, end of period | $14.43 | $14.35 |
| Total ReturnD,E | 2.96% | 7.02% |
| Ratios to Average Net AssetsF,G | | |
| Expenses before reductions | .45%H | .46%H,I |
| Expenses net of fee waivers, if any | .45%H | .46%H,I |
| Expenses net of all reductions | .45%H | .46%H,I |
| Net investment income (loss) | 1.16%H | 1.78%H |
| Supplemental Data | | |
| Net assets, end of period (000 omitted) | $1,742,559 | $625,475 |
| Portfolio turnover rateF | 24%H | 18%J |
A For the period June 7, 2017 (commencement of sale of shares) to March 31, 2018.
B Calculated based on average shares outstanding during the period.
C Total distributions of $.42 per share is comprised of distributions from net investment income of $.186 and distributions from net realized gain of $.235 per share.
D Total returns for periods of less than one year are not annualized.
E Total returns would have been lower if certain expenses had not been reduced during the applicable periods shown.
F Amounts do not include the activity of the Underlying Funds.
G Expense ratios reflect operating expenses of the class. Expenses before reductions do not reflect amounts reimbursed by the investment adviser or reductions from expense offset arrangements and do not represent the amount paid by the class during periods when reimbursements or reductions occur. Expense ratios before reductions for start-up periods may not be representative of longer-term operating periods. Expenses net of fee waivers reflect expenses after reimbursement by the investment adviser but prior to reductions from expense offset arrangements. Expenses net of all reductions represent the net expenses paid by the class but do not include expenses of the underlying funds in which the Fund invests.
H Annualized
I On certain classes, the size and fluctuation of net assets and expense amounts may cause ratios to differ from contractual rates.
J The portfolio turnover rate does not include the assets acquired in the merger.
See accompanying notes which are an integral part of the financial statements.
Fidelity Freedom® 2030 Fund
Investment Summary (Unaudited)
The information in the following tables is based on the direct investments of the Fund.
Top Holdings as of September 30, 2018
| | % of fund's net assets |
| Fidelity Series Investment Grade Bond Fund | 14.8 |
| Fidelity Series Intrinsic Opportunities Fund | 8.3 |
| Fidelity Series Large Cap Stock Fund | 7.5 |
| Fidelity Series International Value Fund | 7.4 |
| Fidelity Series International Growth Fund | 7.3 |
| Fidelity Series Emerging Markets Opportunities Fund | 7.2 |
| Fidelity Series Growth Company Fund | 7.0 |
| Fidelity Series Long-Term Treasury Bond Index Fund | 5.7 |
| Fidelity Series Stock Selector Large Cap Value Fund | 5.6 |
| Fidelity Series Value Discovery Fund | 4.0 |
| | 74.8 |
Asset Allocation (% of fund's net assets)
| Period end |
| | Domestic Equity Funds | 49.7% |
| | International Equity Funds | 24.4% |
| | Bond Funds | 23.8% |
| | Short-Term Funds | 2.1% |
| | Short-Term Investments | 0.1% |
| | Net Other Assets (Liabilities)* | (0.1)% |

* Net Other Assets (Liabilities) are not included in the pie chart
Domestic Equity Funds category includes Fidelity Series Commodity Strategy Fund which invests in commodity-related investments.
Fidelity Freedom® 2030 Fund
Schedule of Investments September 30, 2018 (Unaudited)
Showing Percentage of Net Assets
| U.S. Treasury Obligations - 0.1% | | | |
| | | Principal Amount | Value |
| U.S. Treasury Bills, yield at date of purchase 1.95% to 2.11% 10/4/18 to 12/6/18 (a) | | | |
| (Cost $25,205,940) | | 25,260,000 | 25,204,030 |
| | | Shares | Value |
|
| Domestic Equity Funds - 49.7% | | | |
| Fidelity Series All-Sector Equity Fund (b) | | 44,050,276 | $599,524,254 |
| Fidelity Series Blue Chip Growth Fund (b) | | 74,555,783 | 1,140,703,474 |
| Fidelity Series Commodity Strategy Fund (b) | | 130,252,240 | 651,261,198 |
| Fidelity Series Growth Company Fund (b) | | 112,903,677 | 2,281,783,314 |
| Fidelity Series Intrinsic Opportunities Fund (b) | | 148,507,834 | 2,722,148,603 |
| Fidelity Series Large Cap Stock Fund (b) | | 152,593,102 | 2,430,808,108 |
| Fidelity Series Large Cap Value Index Fund (b) | | 51,897,098 | 685,041,696 |
| Fidelity Series Opportunistic Insights Fund (b) | | 62,381,585 | 1,238,274,464 |
| Fidelity Series Small Cap Discovery Fund (b) | | 26,055,621 | 316,575,795 |
| Fidelity Series Small Cap Opportunities Fund (b) | | 68,156,053 | 1,001,212,413 |
| Fidelity Series Stock Selector Large Cap Value Fund (b) | | 138,308,669 | 1,828,440,603 |
| Fidelity Series Value Discovery Fund (b) | | 95,556,105 | 1,308,163,072 |
| TOTAL DOMESTIC EQUITY FUNDS | | | |
| (Cost $11,819,275,843) | | | 16,203,936,994 |
|
| International Equity Funds - 24.4% | | | |
| Fidelity Series Canada Fund (b) | | 21,948,698 | 237,265,422 |
| Fidelity Series Emerging Markets Fund (b) | | 3,400,900 | 32,954,720 |
| Fidelity Series Emerging Markets Opportunities Fund (b) | | 121,836,204 | 2,338,036,755 |
| Fidelity Series International Growth Fund (b) | | 144,054,803 | 2,362,498,763 |
| Fidelity Series International Small Cap Fund (b) | | 31,288,983 | 560,072,787 |
| Fidelity Series International Value Fund (b) | | 229,310,702 | 2,412,348,583 |
| TOTAL INTERNATIONAL EQUITY FUNDS | | | |
| (Cost $6,346,733,407) | | | 7,943,177,030 |
|
| Bond Funds - 23.8% | | | |
| Fidelity Series Emerging Markets Debt Fund (b) | | 21,165,377 | 201,706,044 |
| Fidelity Series Floating Rate High Income Fund (b) | | 7,555,495 | 71,928,312 |
| Fidelity Series High Income Fund (b) | | 46,272,752 | 444,681,144 |
| Fidelity Series Inflation-Protected Bond Index Fund (b) | | 20,070,118 | 194,880,847 |
| Fidelity Series International Credit Fund (b) | | 1,508,083 | 14,824,460 |
| Fidelity Series Investment Grade Bond Fund (b) | | 444,336,171 | 4,838,820,902 |
| Fidelity Series Long-Term Treasury Bond Index Fund (b) | | 223,360,988 | 1,840,494,539 |
| Fidelity Series Real Estate Income Fund (b) | | 13,346,860 | 143,879,149 |
| TOTAL BOND FUNDS | | | |
| (Cost $8,004,673,099) | | | 7,751,215,397 |
|
| Short-Term Funds - 2.1% | | | |
| Fidelity Cash Central Fund, 2.11% (c) | | 54,688,497 | 54,699,435 |
| Fidelity Series Government Money Market Fund 2.12% (b)(d) | | 547,321,333 | 547,321,333 |
| Fidelity Series Short-Term Credit Fund (b) | | 8,973,065 | 88,474,421 |
| TOTAL SHORT-TERM FUNDS | | | |
| (Cost $691,463,657) | | | 690,495,189 |
| TOTAL INVESTMENT IN SECURITIES - 100.1% | | | |
| (Cost $26,887,351,946) | | | 32,614,028,640 |
| NET OTHER ASSETS (LIABILITIES) - (0.1)% | | | (18,581,786) |
| NET ASSETS - 100% | | | $32,595,446,854 |
| Futures Contracts | | | | | |
| | Number of contracts | Expiration Date | Notional Amount | Value | Unrealized Appreciation/(Depreciation) |
| Purchased | | | | | |
| Equity Index Contracts | | | | | |
| ICE E-mini MSCI EAFE Index Contracts (United States) | 773 | Dec. 2018 | $76,353,075 | $73,036 | $73,036 |
| ICE E-mini MSCI Emerging Markets Index Contracts (United States) | 5,316 | Dec. 2018 | 279,010,260 | 4,533,104 | 4,533,104 |
|
| TOTAL PURCHASED | | | | | 4,606,140 |
|
| Sold | | | | | |
| Equity Index Contracts | | | | | |
| CME E-mini S&P 500 Index Contracts (United States) | 2,691 | Dec. 2018 | 392,751,450 | (576,670) | (576,670) |
| TOTAL FUTURES CONTRACTS | | | | | $4,029,470 |
The notional amount of futures purchased as a percentage of Net Assets is 1.1%
The notional amount of futures sold as a percentage of Net Assets is 1.2%
Legend
(a) Security or a portion of the security was pledged to cover margin requirements for futures contracts. At period end, the value of securities pledged amounted to $20,259,827.
(b) Affiliated Fund
(c) Affiliated fund that is generally available only to investment companies and other accounts managed by Fidelity Investments. The rate quoted is the annualized seven-day yield of the fund at period end. A complete unaudited listing of the fund's holdings as of its most recent quarter end is available upon request. In addition, each Fidelity Central Fund's financial statements are available on the SEC's website or upon request.
(d) The rate quoted is the annualized seven-day yield of the fund at period end.
Affiliated Central Funds
Information regarding fiscal year to date income earned by the Fund from investments in Fidelity Central Funds is as follows:
| Fund | Income earned |
| Fidelity Cash Central Fund | $221,630 |
| Total | $221,630 |
Amounts in the income column in the above table include any capital gain distributions from underlying funds, which are presented in the corresponding line-item in the Statement of Operations if applicable.
Affiliated Underlying Funds
Fiscal year to date information regarding the Fund's investments in affiliated Underlying Funds, excluding any Money Market Central Funds, is presented below. Exchanges between classes of the same affiliated Underlying Funds may occur.
| Affiliate | Value, beginning of period | Purchases | Sales Proceeds | Dividend Income | Realized Gain (loss) | Change in Unrealized appreciation (depreciation) | Value, end of period |
| Fidelity Series 100 Index Fund | $523,652,000 | $24 | $549,343,064 | $-- | $200,853,736 | $(175,162,696) | $-- |
| Fidelity Series All-Sector Equity Fund | 1,006,674,195 | 22,105,224 | 537,576,734 | -- | 51,276,421 | 57,045,148 | 599,524,254 |
| Fidelity Series Blue Chip Growth Fund | 1,040,466,499 | 129,307,574 | 107,580,334 | 105,831,273 | 22,646,957 | 55,862,778 | 1,140,703,474 |
| Fidelity Series Canada Fund | 235,908,154 | 5,112,459 | 18,402,531 | -- | 335,871 | 14,311,469 | 237,265,422 |
| Fidelity Series Commodity Strategy Fund | 678,337,536 | 83,335,244 | 57,285,341 | 38,971,319 | (23,483,368) | (29,642,873) | 651,261,198 |
| Fidelity Series Emerging Markets Debt Fund | 210,639,143 | 10,437,695 | 7,837,060 | 6,179,255 | (361,124) | (11,172,610) | 201,706,044 |
| Fidelity Series Emerging Markets Fund | -- | 32,487,281 | -- | -- | -- | 467,439 | 32,954,720 |
| Fidelity Series Emerging Markets Opportunities Fund | 2,446,367,661 | 279,033,917 | 77,551,712 | -- | (3,375,147) | (306,437,964) | 2,338,036,755 |
| Fidelity Series Floating Rate High Income Fund | 71,095,281 | 3,685,608 | 2,927,236 | 1,911,057 | (32,913) | 107,572 | 71,928,312 |
| Fidelity Series Government Money Market Fund 2.12% | 457,362,031 | 226,160,805 | 136,201,503 | 4,916,975 | -- | -- | 547,321,333 |
| Fidelity Series Growth Company Fund | 2,122,560,480 | 47,163,873 | 203,105,725 | -- | 28,314,903 | 286,849,783 | 2,281,783,314 |
| Fidelity Series High Income Fund | 444,355,054 | 22,105,175 | 25,461,784 | 12,910,808 | (746,610) | 4,429,309 | 444,681,144 |
| Fidelity Series Inflation-Protected Bond Index Fund | 247,162,137 | 53,553,459 | 106,574,704 | 394,032 | (2,173,611) | 2,913,566 | 194,880,847 |
| Fidelity Series International Credit Fund | 15,086,864 | 185,988 | 296,613 | 185,928 | (4,075) | (147,704) | 14,824,460 |
| Fidelity Series International Growth Fund | 2,382,946,699 | 51,248,291 | 108,273,033 | -- | 11,295,639 | 25,281,167 | 2,362,498,763 |
| Fidelity Series International Small Cap Fund | 594,583,372 | 12,662,974 | 24,214,228 | -- | 1,226,184 | (24,185,515) | 560,072,787 |
| Fidelity Series International Value Fund | 2,404,694,160 | 106,423,632 | 92,694,257 | -- | (1,050,685) | (5,024,267) | 2,412,348,583 |
| Fidelity Series Intrinsic Opportunities Fund | 2,568,837,729 | 182,683,247 | 68,157,071 | 120,288,014 | 727,007 | 38,057,691 | 2,722,148,603 |
| Fidelity Series Investment Grade Bond Fund | 4,977,920,975 | 278,109,296 | 359,592,418 | 69,992,733 | (9,544,137) | (48,072,814) | 4,838,820,902 |
| Fidelity Series Large Cap Stock Fund | 2,275,914,375 | 199,919,997 | 154,232,033 | 145,485,860 | 3,965,440 | 105,240,329 | 2,430,808,108 |
| Fidelity Series Large Cap Value Index Fund | 652,413,502 | 14,841,575 | 28,013,720 | -- | 274,413 | 45,525,926 | 685,041,696 |
| Fidelity Series Long-Term Treasury Bond Index Fund | 706,504,608 | 1,224,965,093 | 25,227,049 | 17,613,147 | (626,000) | (65,122,113) | 1,840,494,539 |
| Fidelity Series Opportunistic Insights Fund | 1,140,294,140 | 25,645,066 | 75,420,844 | -- | 4,699,953 | 143,056,149 | 1,238,274,464 |
| Fidelity Series Real Estate Equity Fund | 205,077,929 | 680,015 | 212,531,811 | 485,076 | 14,711,673 | (7,937,806) | -- |
| Fidelity Series Real Estate Income Fund | 139,377,400 | 9,402,509 | 5,741,598 | 6,065,896 | (40,571) | 881,409 | 143,879,149 |
| Fidelity Series Short-Term Credit Fund | 88,680,442 | 3,874,426 | 4,079,896 | 1,018,804 | (25,923) | 25,372 | 88,474,421 |
| Fidelity Series Small Cap Discovery Fund | 310,348,477 | 26,328,041 | 15,638,080 | 18,659,360 | (237,639) | (4,225,004) | 316,575,795 |
| Fidelity Series Small Cap Opportunities Fund | 947,696,222 | 98,306,995 | 74,534,789 | 77,345,038 | 7,513,985 | 22,230,000 | 1,001,212,413 |
| Fidelity Series Stock Selector Large Cap Value Fund | 1,777,139,590 | 40,439,055 | 110,604,134 | -- | (703,827) | 122,169,919 | 1,828,440,603 |
| Fidelity Series Value Discovery Fund | 1,262,780,275 | 28,774,334 | 57,181,244 | -- | 348,018 | 73,441,689 | 1,308,163,072 |
| | $31,934,876,930 | $3,218,978,872 | $3,246,280,546 | $628,254,575 | $305,784,570 | $320,765,349 | $32,534,125,175 |
Amounts in the income column in the above table include any capital gain distributions from underlying funds, which are presented in the corresponding line-item in the Statement of Operations if applicable.
Investment Valuation
The following is a summary of the inputs used, as of September 30, 2018, involving the Fund's assets and liabilities carried at fair value. The inputs or methodology used for valuing securities may not be an indication of the risk associated with investing in those securities. For more information on valuation inputs, and their aggregation into the levels used below, please refer to the Investment Valuation section in the accompanying Notes to Financial Statements.
| | Valuation Inputs at Reporting Date: |
| Description | Total | Level 1 | Level 2 | Level 3 |
| Investments in Securities: | | | | |
| Other Short-Term Investments | $25,204,030 | $-- | $25,204,030 | $-- |
| Domestic Equity Funds | 16,203,936,994 | 16,203,936,994 | -- | -- |
| International Equity Funds | 7,943,177,030 | 7,943,177,030 | -- | -- |
| Bond Funds | 7,751,215,397 | 7,751,215,397 | -- | -- |
| Short-Term Funds | 690,495,189 | 690,495,189 | -- | -- |
| Total Investments in Securities: | $32,614,028,640 | $32,588,824,610 | $25,204,030 | $-- |
| Derivative Instruments: | | | | |
| Assets | | | | |
| Futures Contracts | $4,606,140 | $4,606,140 | $-- | $-- |
| Total Assets | $4,606,140 | $4,606,140 | $-- | $-- |
| Liabilities | | | | |
| Futures Contracts | $(576,670) | $(576,670) | $-- | $-- |
| Total Liabilities | $(576,670) | $(576,670) | $-- | $-- |
| Total Derivative Instruments: | $4,029,470 | $4,029,470 | $-- | $-- |
Value of Derivative Instruments
The following table is a summary of the Fund's value of derivative instruments by primary risk exposure as of September 30, 2018. For additional information on derivative instruments, please refer to the Derivative Instruments section in the accompanying Notes to Financial Statements.
| Primary Risk Exposure / Derivative Type | Value |
| | Asset | Liability |
| Equity Risk | | |
| Futures Contracts(a) | $4,606,140 | $(576,670) |
| Total Equity Risk | 4,606,140 | (576,670) |
| Total Value of Derivatives | $4,606,140 | $(576,670) |
(a) Reflects gross cumulative appreciation (depreciation) on futures contracts as presented in the Schedule of Investments. In the Statement of Assets and Liabilities, the period end daily variation margin is included in receivable or payable for daily variation margin on futures contracts, and the net cumulative appreciation (depreciation) is included in net unrealized appreciation (depreciation).
See accompanying notes which are an integral part of the financial statements.
Fidelity Freedom® 2030 Fund
Financial Statements
Statement of Assets and Liabilities
| | | September 30, 2018 (Unaudited) |
| Assets | | |
Investment in securities, at value — See accompanying schedule:
Unaffiliated issuers (cost $25,205,940) | $25,204,030 | |
| Fidelity Central Funds (cost $54,699,435) | 54,699,435 | |
| Other affiliated issuers (cost $26,807,446,571) | 32,534,125,175 | |
| Total Investment in Securities (cost $26,887,351,946) | | $32,614,028,640 |
| Receivable for investments sold | | 28,439,597 |
| Receivable for fund shares sold | | 584,248,775 |
| Distributions receivable from Fidelity Central Funds | | 79,961 |
| Other receivables | | 174,805 |
| Total assets | | 33,226,971,778 |
| Liabilities | | |
| Payable for investments purchased | $37,076,575 | |
| Payable for fund shares redeemed | 575,563,524 | |
| Accrued management fee | 17,106,352 | |
| Payable for daily variation margin on futures contracts | 1,603,663 | |
| Other payables and accrued expenses | 174,810 | |
| Total liabilities | | 631,524,924 |
| Net Assets | | $32,595,446,854 |
| Net Assets consist of: | | |
| Paid in capital | | $26,117,842,770 |
| Undistributed net investment income | | 126,011,784 |
| Accumulated undistributed net realized gain (loss) on investments | | 620,886,136 |
| Net unrealized appreciation (depreciation) on investments | | 5,730,706,164 |
| Net Assets | | $32,595,446,854 |
| Fidelity Freedom 2030 Fund: | | |
| Net Asset Value, offering price and redemption price per share ($13,154,661,716 ÷ 724,774,267 shares) | | $18.15 |
| Class K: | | |
| Net Asset Value, offering price and redemption price per share ($17,523,373,807 ÷ 966,301,913 shares) | | $18.13 |
| Class K6: | | |
| Net Asset Value, offering price and redemption price per share ($1,917,411,331 ÷ 105,627,135 shares) | | $18.15 |
See accompanying notes which are an integral part of the financial statements.
Statement of Operations
| | | Six months ended September 30, 2018 (Unaudited) |
| Investment Income | | |
| Dividends: | | |
| Affiliated issuers | | $228,866,659 |
| Interest | | 127,831 |
| Income from Fidelity Central Funds | | 221,630 |
| Total income | | 229,216,120 |
| Expenses | | |
| Management fee | $102,979,239 | |
| Independent trustees' fees and expenses | 78,558 | |
| Total expenses before reductions | 103,057,797 | |
| Expense reductions | (25) | |
| Total expenses after reductions | | 103,057,772 |
| Net investment income (loss) | | 126,158,348 |
| Realized and Unrealized Gain (Loss) | | |
| Net realized gain (loss) on: | | |
| Investment securities: | | |
| Fidelity Central Funds | 611 | |
| Other affiliated issuers | 305,784,570 | |
| Futures contracts | (26,433,469) | |
| Capital gain distributions from underlying funds: | | |
| Affiliated issuers | 399,387,916 | |
| Total net realized gain (loss) | | 678,739,628 |
| Change in net unrealized appreciation (depreciation) on: | | |
| Investment securities: | | |
| Unaffiliated issuers | (1,773) | |
| Affiliated issuers | 320,765,349 | |
| Futures contracts | 4,029,470 | |
| Total change in net unrealized appreciation (depreciation) | | 324,793,046 |
| Net gain (loss) | | 1,003,532,674 |
| Net increase (decrease) in net assets resulting from operations | | $1,129,691,022 |
See accompanying notes which are an integral part of the financial statements.
Statement of Changes in Net Assets
| | Six months ended September 30, 2018 (Unaudited) | Year ended March 31, 2018 |
| Increase (Decrease) in Net Assets | | |
| Operations | | |
| Net investment income (loss) | $126,158,348 | $381,629,218 |
| Net realized gain (loss) | 678,739,628 | 1,448,536,874 |
| Change in net unrealized appreciation (depreciation) | 324,793,046 | 643,449,189 |
| Net increase (decrease) in net assets resulting from operations | 1,129,691,022 | 2,473,615,281 |
| Distributions to shareholders from net investment income | – | (396,775,824) |
| Distributions to shareholders from net realized gain | (851,354,197) | (769,505,029) |
| Total distributions | (851,354,197) | (1,166,280,853) |
| Share transactions - net increase (decrease) | 395,481,166 | 19,308,625,938 |
| Total increase (decrease) in net assets | 673,817,991 | 20,615,960,366 |
| Net Assets | | |
| Beginning of period | 31,921,628,863 | 11,305,668,497 |
| End of period | $32,595,446,854 | $31,921,628,863 |
| Other Information | | |
| Undistributed net investment income end of period | $126,011,784 | $– |
| Distributions in excess of net investment income end of period | $– | $(146,564) |
See accompanying notes which are an integral part of the financial statements.
Financial Highlights
Fidelity Freedom 2030 Fund
| | Six months ended (Unaudited) September 30, | Years endedMarch 31, | | | | |
| | 2018 | 2018 | 2017 | 2016 | 2015 | 2014 |
| Selected Per–Share Data | | | | | | |
| Net asset value, beginning of period | $18.00 | $16.72 | $15.20 | $16.62 | $16.47 | $15.02 |
| Income from Investment Operations | | | | | | |
| Net investment income (loss)A | .06 | .21 | .25 | .25 | .27 | .24 |
| Net realized and unrealized gain (loss) | .57 | 1.90 | 1.90 | (.75) | .95 | 1.71 |
| Total from investment operations | .63 | 2.11 | 2.15 | (.50) | 1.22 | 1.95 |
| Distributions from net investment income | – | (.22) | (.25) | (.26) | (.28) | (.25) |
| Distributions from net realized gain | (.48) | (.61) | (.38) | (.67) | (.79) | (.25) |
| Total distributions | (.48) | (.83) | (.63) | (.92)B | (1.07) | (.50) |
| Net asset value, end of period | $18.15 | $18.00 | $16.72 | $15.20 | $16.62 | $16.47 |
| Total ReturnC,D | 3.52% | 12.78% | 14.58% | (3.17)% | 7.76% | 13.08% |
| Ratios to Average Net AssetsE,F | | | | | | |
| Expenses before reductions | .70%G | .59% | - %H | - %H | - %H | - %H |
| Expenses net of fee waivers, if any | .70%G | .59% | -% | -% | -% | -% |
| Expenses net of all reductions | .70%G | .59% | -% | -% | -% | -% |
| Net investment income (loss) | .72%G | 1.20% | 1.57% | 1.59% | 1.68% | 1.50% |
| Supplemental Data | | | | | | |
| Net assets, end of period (000 omitted) | $13,154,662 | $12,684,794 | $11,305,668 | $10,150,137 | $10,883,658 | $10,933,549 |
| Portfolio turnover rateF | 20%G | 18%I | 17% | 16% | 17% | 54% |
A Calculated based on average shares outstanding during the period.
B Total distributions of $.92 per share is comprised of distributions from net investment income of $.257 and distributions from net realized gain of $.665 per share.
C Total returns for periods of less than one year are not annualized.
D Total returns would have been lower if certain expenses had not been reduced during the applicable periods shown.
E Expense ratios reflect operating expenses of the class. Expenses before reductions do not reflect amounts reimbursed by the investment adviser or reductions from expense offset arrangements and do not represent the amount paid by the class during periods when reimbursements or reductions occur. Expenses net of fee waivers reflect expenses after reimbursement by the investment adviser but prior to reductions from expense offset arrangements. Expenses net of all reductions represent the net expenses paid by the class but do not include expenses of the underlying funds in which the Fund invests.
F Amounts do not include the activity of the Underlying Funds.
G Annualized
H Amount represents less than $.005 per share.
I The portfolio turnover rate does not include the assets acquired in the merger.
See accompanying notes which are an integral part of the financial statements.
Fidelity Freedom 2030 Fund Class K
| | Six months ended (Unaudited) September 30, | Years endedMarch 31, |
| | 2018 | 2018 A |
| Selected Per–Share Data | | |
| Net asset value, beginning of period | $17.98 | $17.47 |
| Income from Investment Operations | | |
| Net investment income (loss)B | .07 | .28 |
| Net realized and unrealized gain (loss) | .56 | .81 |
| Total from investment operations | .63 | 1.09 |
| Distributions from net investment income | – | (.24) |
| Distributions from net realized gain | (.48) | (.35) |
| Total distributions | (.48) | (.58)C |
| Net asset value, end of period | $18.13 | $17.98 |
| Total ReturnD,E | 3.53% | 6.24% |
| Ratios to Average Net AssetsF,G | | |
| Expenses before reductions | .60%H | .62%H,I |
| Expenses net of fee waivers, if any | .60%H | .62%H,I |
| Expenses net of all reductions | .60%H | .62%H,I |
| Net investment income (loss) | .81%H | 2.23%H |
| Supplemental Data | | |
| Net assets, end of period (000 omitted) | $17,523,374 | $18,414,961 |
| Portfolio turnover rateG | 20%H | 18%J |
A For the period July 20, 2017 (commencement of sale of shares) to March 31, 2018.
B Calculated based on average shares outstanding during the period.
C Total distributions of $.58 per share is comprised of distributions from net investment income of $.237 and distributions from net realized gain of $.345 per share.
D Total returns for periods of less than one year are not annualized.
E Total returns would have been lower if certain expenses had not been reduced during the applicable periods shown.
F Expense ratios reflect operating expenses of the class. Expenses before reductions do not reflect amounts reimbursed by the investment adviser or reductions from expense offset arrangements and do not represent the amount paid by the class during periods when reimbursements or reductions occur. Expense ratios before reductions for start-up periods may not be representative of longer-term operating periods. Expenses net of fee waivers reflect expenses after reimbursement by the investment adviser but prior to reductions from expense offset arrangements. Expenses net of all reductions represent the net expenses paid by the class but do not include expenses of the underlying funds in which the Fund invests.
G Amounts do not include the activity of the Underlying Funds.
H Annualized
I On certain classes, the size and fluctuation of net assets and expense amounts may cause ratios to differ from contractual rates.
J The portfolio turnover rate does not include the assets acquired in the merger.
See accompanying notes which are an integral part of the financial statements.
Fidelity Freedom 2030 Fund Class K6
| | Six months ended (Unaudited) September 30, | Years endedMarch 31, |
| | 2018 | 2018 A |
| Selected Per–Share Data | | |
| Net asset value, beginning of period | $18.00 | $17.15 |
| Income from Investment Operations | | |
| Net investment income (loss)B | .08 | .26 |
| Net realized and unrealized gain (loss) | .56 | 1.18 |
| Total from investment operations | .64 | 1.44 |
| Distributions from net investment income | – | (.24) |
| Distributions from net realized gain | (.49) | (.35) |
| Total distributions | (.49) | (.59) |
| Net asset value, end of period | $18.15 | $18.00 |
| Total ReturnC,D | 3.60% | 8.35% |
| Ratios to Average Net AssetsE,F | | |
| Expenses before reductions | .47%G | .48%G,H |
| Expenses net of fee waivers, if any | .47%G | .48%G,H |
| Expenses net of all reductions | .47%G | .48%G,H |
| Net investment income (loss) | .94%G | 1.76%G |
| Supplemental Data | | |
| Net assets, end of period (000 omitted) | $1,917,411 | $821,874 |
| Portfolio turnover rateF | 20%G | 18%I |
A For the period June 7, 2017 (commencement of sale of shares) to March 31, 2018.
B Calculated based on average shares outstanding during the period.
C Total returns for periods of less than one year are not annualized.
D Total returns would have been lower if certain expenses had not been reduced during the applicable periods shown.
E Expense ratios reflect operating expenses of the class. Expenses before reductions do not reflect amounts reimbursed by the investment adviser or reductions from expense offset arrangements and do not represent the amount paid by the class during periods when reimbursements or reductions occur. Expense ratios before reductions for start-up periods may not be representative of longer-term operating periods. Expenses net of fee waivers reflect expenses after reimbursement by the investment adviser but prior to reductions from expense offset arrangements. Expenses net of all reductions represent the net expenses paid by the class but do not include expenses of the underlying funds in which the Fund invests.
F Amounts do not include the activity of the Underlying Funds.
G Annualized
H On certain classes, the size and fluctuation of net assets and expense amounts may cause ratios to differ from contractual rates.
I The portfolio turnover rate does not include the assets acquired in the merger.
See accompanying notes which are an integral part of the financial statements.
Fidelity Freedom® 2035 Fund
Investment Summary (Unaudited)
The information in the following tables is based on the direct investments of the Fund.
Top Holdings as of September 30, 2018
| | % of fund's net assets |
| Fidelity Series Intrinsic Opportunities Fund | 9.9 |
| Fidelity Series Large Cap Stock Fund | 8.9 |
| Fidelity Series International Growth Fund | 8.8 |
| Fidelity Series International Value Fund | 8.7 |
| Fidelity Series Growth Company Fund | 8.3 |
| Fidelity Series Emerging Markets Opportunities Fund | 8.1 |
| Fidelity Series Stock Selector Large Cap Value Fund | 6.6 |
| Fidelity Series Long-Term Treasury Bond Index Fund | 5.7 |
| Fidelity Series Value Discovery Fund | 4.7 |
| Fidelity Series Opportunistic Insights Fund | 4.5 |
| | 74.2 |
Asset Allocation (% of fund's net assets)
| Period end |
| | Domestic Equity Funds | 58.4% |
| | International Equity Funds | 28.9% |
| | Bond Funds | 10.2% |
| | Short-Term Funds | 2.5% |
| | Short-Term Investments | 0.1% |
| | Net Other Assets (Liabilities)* | (0.1)% |

* Net Other Assets (Liabilities) are not included in the pie chart
Domestic Equity Funds category includes Fidelity Series Commodity Strategy Fund which invests in commodity-related investments.
Fidelity Freedom® 2035 Fund
Schedule of Investments September 30, 2018 (Unaudited)
Showing Percentage of Net Assets
| U.S. Treasury Obligations - 0.1% | | | |
| | | Principal Amount | Value |
| U.S. Treasury Bills, yield at date of purchase 1.99% to 2.11% 11/1/18 to 12/6/18 (a) | | | |
| (Cost $17,577,887) | | 17,640,000 | 17,576,708 |
| | | Shares | Value |
|
| Domestic Equity Funds - 58.4% | | | |
| Fidelity Series All-Sector Equity Fund (b) | | 36,814,673 | $501,047,694 |
| Fidelity Series Blue Chip Growth Fund (b) | | 60,663,209 | 928,147,102 |
| Fidelity Series Commodity Strategy Fund (b) | | 89,911,671 | 449,558,355 |
| Fidelity Series Growth Company Fund (b) | | 92,790,382 | 1,875,293,611 |
| Fidelity Series Intrinsic Opportunities Fund (b) | | 121,998,296 | 2,236,228,763 |
| Fidelity Series Large Cap Stock Fund (b) | | 125,505,222 | 1,999,298,183 |
| Fidelity Series Large Cap Value Index Fund (b) | | 41,863,738 | 552,601,343 |
| Fidelity Series Opportunistic Insights Fund (b) | | 50,841,038 | 1,009,194,608 |
| Fidelity Series Small Cap Discovery Fund (b) | | 20,977,180 | 254,872,740 |
| Fidelity Series Small Cap Opportunities Fund (b) | | 55,328,429 | 812,774,628 |
| Fidelity Series Stock Selector Large Cap Value Fund (b) | | 112,814,009 | 1,491,401,198 |
| Fidelity Series Value Discovery Fund (b) | | 76,860,403 | 1,052,218,913 |
| TOTAL DOMESTIC EQUITY FUNDS | | | |
| (Cost $9,840,507,082) | | | 13,162,637,138 |
|
| International Equity Funds - 28.9% | | | |
| Fidelity Series Canada Fund (b) | | 17,897,494 | 193,471,907 |
| Fidelity Series Emerging Markets Fund (b) | | 8,343,172 | 80,845,337 |
| Fidelity Series Emerging Markets Opportunities Fund (b) | | 95,777,119 | 1,837,962,916 |
| Fidelity Series International Growth Fund (b) | | 120,789,387 | 1,980,945,950 |
| Fidelity Series International Small Cap Fund (b) | | 25,267,369 | 452,285,906 |
| Fidelity Series International Value Fund (b) | | 187,089,755 | 1,968,184,226 |
| TOTAL INTERNATIONAL EQUITY FUNDS | | | |
| (Cost $5,341,147,046) | | | 6,513,696,242 |
|
| Bond Funds - 10.2% | | | |
| Fidelity Series Emerging Markets Debt Fund (b) | | 14,217,374 | 135,491,577 |
| Fidelity Series Floating Rate High Income Fund (b) | | 5,130,279 | 48,840,256 |
| Fidelity Series High Income Fund (b) | | 31,321,943 | 301,003,871 |
| Fidelity Series Inflation-Protected Bond Index Fund (b) | | 6,991,725 | 67,889,646 |
| Fidelity Series International Credit Fund (b) | | 1,004,298 | 9,872,251 |
| Fidelity Series Investment Grade Bond Fund (b) | | 33,211,964 | 361,678,292 |
| Fidelity Series Long-Term Treasury Bond Index Fund (b) | | 154,389,770 | 1,272,171,704 |
| Fidelity Series Real Estate Income Fund (b) | | 8,986,146 | 96,870,657 |
| TOTAL BOND FUNDS | | | |
| (Cost $2,366,856,425) | | | 2,293,818,254 |
|
| Short-Term Funds - 2.5% | | | |
| Fidelity Cash Central Fund, 2.11% (c) | | 38,244,331 | 38,251,980 |
| Fidelity Series Government Money Market Fund 2.12% (b)(d) | | 462,174,903 | 462,174,903 |
| Fidelity Series Short-Term Credit Fund (b) | | 7,762,794 | 76,541,145 |
| TOTAL SHORT-TERM FUNDS | | | |
| (Cost $577,645,636) | | | 576,968,028 |
| TOTAL INVESTMENT IN SECURITIES - 100.1% | | | |
| (Cost $18,143,734,076) | | | 22,564,696,370 |
| NET OTHER ASSETS (LIABILITIES) - (0.1)% | | | (13,410,204) |
| NET ASSETS - 100% | | | $22,551,286,166 |
| Futures Contracts | | | | | |
| | Number of contracts | Expiration Date | Notional Amount | Value | Unrealized Appreciation/(Depreciation) |
| Purchased | | | | | |
| Equity Index Contracts | | | | | |
| ICE E-mini MSCI Emerging Markets Index Contracts (United States) | 2,751 | Dec. 2018 | $144,386,235 | $2,627,144 | $2,627,144 |
| Sold | | | | | |
| Equity Index Contracts | | | | | |
| CME E-mini S&P 500 Index Contracts (United States) | 494 | Dec. 2018 | 72,099,300 | (19,060) | (19,060) |
| TOTAL FUTURES CONTRACTS | | | | | $2,608,084 |
The notional amount of futures purchased as a percentage of Net Assets is 0.6%
The notional amount of futures sold as a percentage of Net Assets is 0.3%
Legend
(a) Security or a portion of the security was pledged to cover margin requirements for futures contracts. At period end, the value of securities pledged amounted to $7,887,391.
(b) Affiliated Fund
(c) Affiliated fund that is generally available only to investment companies and other accounts managed by Fidelity Investments. The rate quoted is the annualized seven-day yield of the fund at period end. A complete unaudited listing of the fund's holdings as of its most recent quarter end is available upon request. In addition, each Fidelity Central Fund's financial statements are available on the SEC's website or upon request.
(d) The rate quoted is the annualized seven-day yield of the fund at period end.
Affiliated Central Funds
Information regarding fiscal year to date income earned by the Fund from investments in Fidelity Central Funds is as follows:
| Fund | Income earned |
| Fidelity Cash Central Fund | $145,928 |
| Total | $145,928 |
Amounts in the income column in the above table include any capital gain distributions from underlying funds, which are presented in the corresponding line-item in the Statement of Operations if applicable.
Affiliated Underlying Funds
Fiscal year to date information regarding the Fund's investments in affiliated Underlying Funds, excluding any Money Market Central Funds, is presented below. Exchanges between classes of the same affiliated Underlying Funds may occur.
| Affiliate | Value, beginning of period | Purchases | Sales Proceeds | Dividend Income | Realized Gain (loss) | Change in Unrealized appreciation (depreciation) | Value, end of period |
| Fidelity Series 100 Index Fund | $418,817,851 | $3,601 | $440,838,264 | $-- | $160,376,149 | $(138,359,337) | $-- |
| Fidelity Series All-Sector Equity Fund | 805,615,379 | 27,361,544 | 420,827,419 | -- | 36,027,949 | 52,870,241 | 501,047,694 |
| Fidelity Series Blue Chip Growth Fund | 832,667,609 | 114,383,257 | 81,570,449 | 85,894,267 | 9,683,702 | 52,982,983 | 928,147,102 |
| Fidelity Series Canada Fund | 185,991,221 | 6,149,793 | 10,250,918 | -- | (11,650) | 11,593,461 | 193,471,907 |
| Fidelity Series Commodity Strategy Fund | 453,122,550 | 76,772,936 | 43,332,261 | 26,837,691 | (17,353,739) | (19,651,131) | 449,558,355 |
| Fidelity Series Emerging Markets Debt Fund | 140,311,483 | 8,610,723 | 5,742,203 | 4,137,287 | (307,279) | (7,381,147) | 135,491,577 |
| Fidelity Series Emerging Markets Fund | -- | 80,275,959 | -- | -- | -- | 569,378 | 80,845,337 |
| Fidelity Series Emerging Markets | 1,945,942,220 | 223,499,911 | 88,001,466 | -- | 10,448,933 | (253,926,682) | 1,837,962,916 |
| Fidelity Series Floating Rate High Income | 47,711,855 | 3,153,791 | 2,076,272 | 1,290,502 | (79,995) | 130,877 | 48,840,256 |
| Fidelity Series Government Money Market | 352,943,664 | 270,920,162 | 161,688,923 | 3,578,741 | -- | -- | 462,174,903 |
| Fidelity Series Growth Company Fund | 1,693,158,763 | 57,557,267 | 128,860,040 | -- | 11,147,470 | 242,290,151 | 1,875,293,611 |
| Fidelity Series High Income Fund | 298,102,772 | 18,339,807 | 17,915,862 | 8,705,548 | (470,083) | 2,947,237 | 301,003,871 |
| Fidelity Series Inflation-Protected Bond | 174,598,700 | 9,342,620 | 117,010,764 | 246,475 | (1,578,931) | 2,538,021 | 67,889,646 |
| Fidelity Series International Credit Fund | 10,076,621 | 125,758 | 228,757 | 124,183 | (3,046) | (98,325) | 9,872,251 |
| Fidelity Series International Growth Fund | 1,868,762,602 | 153,379,972 | 70,470,184 | -- | 1,300,738 | 27,972,822 | 1,980,945,950 |
| Fidelity Series International Small Cap Fund | 466,280,560 | 20,569,472 | 16,553,692 | -- | 107,215 | (18,117,649) | 452,285,906 |
| Fidelity Series International Value Fund | 1,895,917,767 | 107,796,187 | 31,170,945 | -- | (349,328) | (4,009,455) | 1,968,184,226 |
| Fidelity Series Intrinsic Opportunities Fund | 2,060,082,541 | 219,240,215 | 72,729,681 | 98,684,642 | (594,625) | 30,230,313 | 2,236,228,763 |
| Fidelity Series Investment Grade Bond Fund | 615,546,408 | 88,212,235 | 335,643,559 | 8,174,344 | (9,336,344) | 2,899,552 | 361,678,292 |
| Fidelity Series Large Cap Stock Fund | 1,821,590,263 | 180,934,692 | 91,419,252 | 116,769,390 | 2,891,183 | 85,301,297 | 1,999,298,183 |
| Fidelity Series Large Cap Value Index Fund | 522,138,865 | 18,247,259 | 24,557,870 | -- | 237,831 | 36,535,258 | 552,601,343 |
| Fidelity Series Long-Term Treasury Bond | 491,792,423 | 833,013,935 | 7,929,947 | 12,300,551 | (65,252) | (44,639,455) | 1,272,171,704 |
| Fidelity Series Opportunistic Insights Fund | 912,528,026 | 31,309,395 | 53,789,259 | -- | 2,647,348 | 116,499,098 | 1,009,194,608 |
| Fidelity Series Real Estate Equity Fund | 164,451,251 | 839,371 | 170,955,908 | 599,773 | 6,052,433 | (387,147) | -- |
| Fidelity Series Real Estate Income Fund | 92,891,573 | 7,575,464 | 4,153,955 | 4,070,012 | (76,837) | 634,412 | 96,870,657 |
| Fidelity Series Short-Term Credit Fund | 63,956,869 | 15,567,312 | 2,982,244 | 741,324 | (24,635) | 23,843 | 76,541,145 |
| Fidelity Series Small Cap Discovery Fund | 246,110,044 | 23,650,443 | 11,286,557 | 14,889,900 | (235,397) | (3,365,793) | 254,872,740 |
| Fidelity Series Small Cap Opportunities Fund | 755,904,140 | 88,219,698 | 54,776,548 | 62,629,639 | 3,398,567 | 20,028,771 | 812,774,628 |
| Fidelity Series Stock Selector Large Cap | 1,415,005,805 | 65,512,938 | 86,527,858 | -- | (219,711) | 97,630,024 | 1,491,401,198 |
| Fidelity Series Value Discovery Fund | 1,003,212,077 | 35,601,371 | 45,578,684 | -- | 59,606 | 58,924,543 | 1,052,218,913 |
| | $21,755,231,902 | $2,786,167,088 | $2,598,869,741 | $449,674,269 | $213,672,272 | $352,666,161 | $22,508,867,682 |
Amounts in the income column in the above table include any capital gain distributions from underlying funds, which are presented in the corresponding line-item in the Statement of Operations if applicable.
Investment Valuation
The following is a summary of the inputs used, as of September 30, 2018, involving the Fund's assets and liabilities carried at fair value. The inputs or methodology used for valuing securities may not be an indication of the risk associated with investing in those securities. For more information on valuation inputs, and their aggregation into the levels used below, please refer to the Investment Valuation section in the accompanying Notes to Financial Statements.
| | Valuation Inputs at Reporting Date: |
| Description | Total | Level 1 | Level 2 | Level 3 |
| Investments in Securities: | | | | |
| Other Short-Term Investments | $17,576,708 | $-- | $17,576,708 | $-- |
| Domestic Equity Funds | 13,162,637,138 | 13,162,637,138 | -- | -- |
| International Equity Funds | 6,513,696,242 | 6,513,696,242 | -- | -- |
| Bond Funds | 2,293,818,254 | 2,293,818,254 | -- | -- |
| Short-Term Funds | 576,968,028 | 576,968,028 | -- | -- |
| Total Investments in Securities: | $22,564,696,370 | $22,547,119,662 | $17,576,708 | $-- |
| Derivative Instruments: | | | | |
| Assets | | | | |
| Futures Contracts | $2,627,144 | $2,627,144 | $-- | $-- |
| Total Assets | $2,627,144 | $2,627,144 | $-- | $-- |
| Liabilities | | | | |
| Futures Contracts | $(19,060) | $(19,060) | $-- | $-- |
| Total Liabilities | $(19,060) | $(19,060) | $-- | $-- |
| Total Derivative Instruments: | $2,608,084 | $2,608,084 | $-- | $-- |
Value of Derivative Instruments
The following table is a summary of the Fund's value of derivative instruments by primary risk exposure as of September 30, 2018. For additional information on derivative instruments, please refer to the Derivative Instruments section in the accompanying Notes to Financial Statements.
| Primary Risk Exposure / Derivative Type | Value |
| | Asset | Liability |
| Equity Risk | | |
| Futures Contracts(a) | $2,627,144 | $(19,060) |
| Total Equity Risk | 2,627,144 | (19,060) |
| Total Value of Derivatives | $2,627,144 | $(19,060) |
(a) Reflects gross cumulative appreciation (depreciation) on futures contracts as presented in the Schedule of Investments. In the Statement of Assets and Liabilities, the period end daily variation margin is included in receivable or payable for daily variation margin on futures contracts, and the net cumulative appreciation (depreciation) is included in net unrealized appreciation (depreciation).
See accompanying notes which are an integral part of the financial statements.
Fidelity Freedom® 2035 Fund
Financial Statements
Statement of Assets and Liabilities
| | | September 30, 2018 (Unaudited) |
| Assets | | |
Investment in securities, at value — See accompanying schedule:
Unaffiliated issuers (cost $17,577,887) | $17,576,708 | |
| Fidelity Central Funds (cost $38,251,980) | 38,251,980 | |
| Other affiliated issuers (cost $18,087,904,209) | 22,508,867,682 | |
| Total Investment in Securities (cost $18,143,734,076) | | $22,564,696,370 |
| Receivable for investments sold | | 124,362,252 |
| Receivable for fund shares sold | | 531,751,543 |
| Distributions receivable from Fidelity Central Funds | | 56,169 |
| Total assets | | 23,220,866,334 |
| Liabilities | | |
| Payable for investments purchased | $136,895,830 | |
| Payable for fund shares redeemed | 519,193,278 | |
| Accrued management fee | 12,417,868 | |
| Payable for daily variation margin on futures contracts | 1,073,192 | |
| Total liabilities | | 669,580,168 |
| Net Assets | | $22,551,286,166 |
| Net Assets consist of: | | |
| Paid in capital | | $17,589,345,001 |
| Undistributed net investment income | | 52,160,426 |
| Accumulated undistributed net realized gain (loss) on investments | | 486,210,361 |
| Net unrealized appreciation (depreciation) on investments | | 4,423,570,378 |
| Net Assets | | $22,551,286,166 |
| Fidelity Freedom 2035 Fund: | | |
| Net Asset Value, offering price and redemption price per share ($8,454,366,057 ÷ 547,781,227 shares) | | $15.43 |
| Class K: | | |
| Net Asset Value, offering price and redemption price per share ($12,449,643,168 ÷ 807,585,097 shares) | | $15.42 |
| Class K6: | | |
| Net Asset Value, offering price and redemption price per share ($1,647,276,941 ÷ 106,684,812 shares) | | $15.44 |
See accompanying notes which are an integral part of the financial statements.
Statement of Operations
| | | Six months ended September 30, 2018 (Unaudited) |
| Investment Income | | |
| Dividends: | | |
| Affiliated issuers | | $126,493,352 |
| Interest | | 82,705 |
| Income from Fidelity Central Funds | | 145,928 |
| Total income | | 126,721,985 |
| Expenses | | |
| Management fee | $74,507,738 | |
| Independent trustees' fees and expenses | 53,821 | |
| Total expenses | | 74,561,559 |
| Net investment income (loss) | | 52,160,426 |
| Realized and Unrealized Gain (Loss) | | |
| Net realized gain (loss) on: | | |
| Investment securities: | | |
| Fidelity Central Funds | 103 | |
| Other affiliated issuers | 213,672,272 | |
| Futures contracts | (12,173,716) | |
| Capital gain distributions from underlying funds: | | |
| Affiliated issuers | 323,180,917 | |
| Total net realized gain (loss) | | 524,679,576 |
| Change in net unrealized appreciation (depreciation) on: | | |
| Investment securities: | | |
| Unaffiliated issuers | (1,179) | |
| Affiliated issuers | 352,666,161 | |
| Futures contracts | 2,608,084 | |
| Total change in net unrealized appreciation (depreciation) | | 355,273,066 |
| Net gain (loss) | | 879,952,642 |
| Net increase (decrease) in net assets resulting from operations | | $932,113,068 |
See accompanying notes which are an integral part of the financial statements.
Statement of Changes in Net Assets
| | Six months ended September 30, 2018 (Unaudited) | Year ended March 31, 2018 |
| Increase (Decrease) in Net Assets | | |
| Operations | | |
| Net investment income (loss) | $52,160,426 | $234,969,726 |
| Net realized gain (loss) | 524,679,576 | 967,655,889 |
| Change in net unrealized appreciation (depreciation) | 355,273,066 | 651,152,594 |
| Net increase (decrease) in net assets resulting from operations | 932,113,068 | 1,853,778,209 |
| Distributions to shareholders from net investment income | – | (255,443,857) |
| Distributions to shareholders from net realized gain | (589,171,303) | (469,405,267) |
| Total distributions | (589,171,303) | (724,849,124) |
| Share transactions - net increase (decrease) | 465,511,100 | 13,724,076,087 |
| Total increase (decrease) in net assets | 808,452,865 | 14,853,005,172 |
| Net Assets | | |
| Beginning of period | 21,742,833,301 | 6,889,828,129 |
| End of period | $22,551,286,166 | $21,742,833,301 |
| Other Information | | |
| Undistributed net investment income end of period | $52,160,426 | $– |
See accompanying notes which are an integral part of the financial statements.
Financial Highlights
Fidelity Freedom 2035 Fund
| | Six months ended (Unaudited) September 30, | Years endedMarch 31, | | | | |
| | 2018 | 2018 | 2017 | 2016 | 2015 | 2014 |
| Selected Per–Share Data | | | | | | |
| Net asset value, beginning of period | $15.20 | $13.88 | $12.46 | $13.67 | $13.62 | $12.57 |
| Income from Investment Operations | | | | | | |
| Net investment income (loss)A | .03 | .16 | .19 | .19 | .22 | .18 |
| Net realized and unrealized gain (loss) | .61 | 1.81 | 1.75 | (.65) | .80 | 1.63 |
| Total from investment operations | .64 | 1.97 | 1.94 | (.46) | 1.02 | 1.81 |
| Distributions from net investment income | – | (.17) | (.18) | (.20) | (.23) | (.19) |
| Distributions from net realized gain | (.41) | (.47) | (.34) | (.55) | (.75) | (.57) |
| Total distributions | (.41) | (.65)B | (.52) | (.75) | (.97)C | (.76) |
| Net asset value, end of period | $15.43 | $15.20 | $13.88 | $12.46 | $13.67 | $13.62 |
| Total ReturnD,E | 4.24% | 14.32% | 16.09% | (3.59)% | 7.90% | 14.76% |
| Ratios to Average Net AssetsF,G | | | | | | |
| Expenses before reductions | .74%H | .63%I | - %J | - %J | - %J | - %J |
| Expenses net of fee waivers, if any | .74%H | .63%I | -% | -% | -% | -% |
| Expenses net of all reductions | .74%H | .63%I | -% | -% | -% | -% |
| Net investment income (loss) | .40%H | 1.06% | 1.45% | 1.48% | 1.62% | 1.42% |
| Supplemental Data | | | | | | |
| Net assets, end of period (000 omitted) | $8,454,366 | $8,050,659 | $6,889,828 | $5,961,088 | $6,289,345 | $6,183,144 |
| Portfolio turnover rateF | 23%H | 17%K | 16% | 15% | 18% | 54% |
A Calculated based on average shares outstanding during the period.
B Total distributions of $.65 per share is comprised of distributions from net investment income of $.171 and distributions from net realized gain of $.474 per share.
C Total distributions of $.97 per share is comprised of distributions from net investment income of $.226 and distributions from net realized gain of $.746 per share.
D Total returns for periods of less than one year are not annualized.
E Total returns would have been lower if certain expenses had not been reduced during the applicable periods shown.
F Amounts do not include the activity of the Underlying Funds.
G Expense ratios reflect operating expenses of the class. Expenses before reductions do not reflect amounts reimbursed by the investment adviser or reductions from expense offset arrangements and do not represent the amount paid by the class during periods when reimbursements or reductions occur. Expenses net of fee waivers reflect expenses after reimbursement by the investment adviser but prior to reductions from expense offset arrangements. Expenses net of all reductions represent the net expenses paid by the class but do not include expenses of the underlying funds in which the Fund invests.
H Annualized
I On certain classes, the size and fluctuation of net assets and expense amounts may cause ratios to differ from contractual rates.
J Amount represents less than .005%.
K The portfolio turnover rate does not include the assets acquired in the merger.
See accompanying notes which are an integral part of the financial statements.
Fidelity Freedom 2035 Fund Class K
| | Six months ended (Unaudited) September 30, | Years endedMarch 31, |
| | 2018 | 2018 A |
| Selected Per–Share Data | | |
| Net asset value, beginning of period | $15.18 | $14.60 |
| Income from Investment Operations | | |
| Net investment income (loss)B | .04 | .22 |
| Net realized and unrealized gain (loss) | .61 | .82 |
| Total from investment operations | .65 | 1.04 |
| Distributions from net investment income | – | (.19) |
| Distributions from net realized gain | (.41) | (.26) |
| Total distributions | (.41) | (.46)C |
| Net asset value, end of period | $15.42 | $15.18 |
| Total ReturnD,E | 4.32% | 7.09% |
| Ratios to Average Net AssetsF,G | | |
| Expenses before reductions | .64%H | .65%H,I |
| Expenses net of fee waivers, if any | .64%H | .65%H,I |
| Expenses net of all reductions | .64%H | .65%H,I |
| Net investment income (loss) | .50%H | 2.07%H |
| Supplemental Data | | |
| Net assets, end of period (000 omitted) | $12,449,643 | $12,979,898 |
| Portfolio turnover rateF | 23%H | 17%J |
A For the period July 20, 2017 (commencement of sale of shares) to March 31, 2018.
B Calculated based on average shares outstanding during the period.
C Total distributions of $.46 per share is comprised of distributions from net investment income of $.193 and distributions from net realized gain of $.264 per share.
D Total returns for periods of less than one year are not annualized.
E Total returns would have been lower if certain expenses had not been reduced during the applicable periods shown.
F Amounts do not include the activity of the Underlying Funds.
G Expense ratios reflect operating expenses of the class. Expenses before reductions do not reflect amounts reimbursed by the investment adviser or reductions from expense offset arrangements and do not represent the amount paid by the class during periods when reimbursements or reductions occur. Expense ratios before reductions for start-up periods may not be representative of longer-term operating periods. Expenses net of fee waivers reflect expenses after reimbursement by the investment adviser but prior to reductions from expense offset arrangements. Expenses net of all reductions represent the net expenses paid by the class but do not include expenses of the underlying funds in which the Fund invests.
H Annualized
I On certain classes, the size and fluctuation of net assets and expense amounts may cause ratios to differ from contractual rates.
J The portfolio turnover rate does not include the assets acquired in the merger.
See accompanying notes which are an integral part of the financial statements.
Fidelity Freedom 2035 Fund Class K6
| | Six months ended (Unaudited) September 30, | Years endedMarch 31, |
| | 2018 | 2018 A |
| Selected Per–Share Data | | |
| Net asset value, beginning of period | $15.20 | $14.30 |
| Income from Investment Operations | | |
| Net investment income (loss)B | .05 | .20 |
| Net realized and unrealized gain (loss) | .61 | 1.16 |
| Total from investment operations | .66 | 1.36 |
| Distributions from net investment income | – | (.20) |
| Distributions from net realized gain | (.42) | (.26) |
| Total distributions | (.42) | (.46) |
| Net asset value, end of period | $15.44 | $15.20 |
| Total ReturnC,D | 4.38% | 9.50% |
| Ratios to Average Net AssetsE,F | | |
| Expenses before reductions | .49%G | .50%G,H |
| Expenses net of fee waivers, if any | .49%G | .50%G,H |
| Expenses net of all reductions | .49%G | .50%G,H |
| Net investment income (loss) | .65%G | 1.61%G |
| Supplemental Data | | |
| Net assets, end of period (000 omitted) | $1,647,277 | $712,276 |
| Portfolio turnover rateE | 23%G | 17%I |
A For the period June 7, 2017 (commencement of sale of shares) to March 31, 2018.
B Calculated based on average shares outstanding during the period.
C Total returns for periods of less than one year are not annualized.
D Total returns would have been lower if certain expenses had not been reduced during the applicable periods shown.
E Amounts do not include the activity of the Underlying Funds.
F Expense ratios reflect operating expenses of the class. Expenses before reductions do not reflect amounts reimbursed by the investment adviser or reductions from expense offset arrangements and do not represent the amount paid by the class during periods when reimbursements or reductions occur. Expense ratios before reductions for start-up periods may not be representative of longer-term operating periods. Expenses net of fee waivers reflect expenses after reimbursement by the investment adviser but prior to reductions from expense offset arrangements. Expenses net of all reductions represent the net expenses paid by the class but do not include expenses of the underlying funds in which the Fund invests.
G Annualized
H On certain classes, the size and fluctuation of net assets and expense amounts may cause ratios to differ from contractual rates.
I The portfolio turnover rate does not include the assets acquired in the merger.
See accompanying notes which are an integral part of the financial statements.
Fidelity Freedom® 2040 Fund
Investment Summary (Unaudited)
The information in the following tables is based on the direct investments of the Fund.
Top Holdings as of September 30, 2018
| | % of fund's net assets |
| Fidelity Series Intrinsic Opportunities Fund | 10.0 |
| Fidelity Series International Growth Fund | 9.2 |
| Fidelity Series International Value Fund | 9.2 |
| Fidelity Series Large Cap Stock Fund | 9.1 |
| Fidelity Series Growth Company Fund | 8.7 |
| Fidelity Series Emerging Markets Opportunities Fund | 8.6 |
| Fidelity Series Stock Selector Large Cap Value Fund | 6.8 |
| Fidelity Series Value Discovery Fund | 4.8 |
| Fidelity Series Opportunistic Insights Fund | 4.6 |
| Fidelity Series Blue Chip Growth Fund | 4.3 |
| | 75.3 |
Asset Allocation (% of fund's net assets)
| Period end |
| | Domestic Equity Funds | 60.5% |
| | International Equity Funds | 30.7% |
| | Bond Funds | 6.8% |
| | Short-Term Funds | 2.0% |
| | Short-Term Investments | 0.1% |
| | Net Other Assets (Liabilities)* | (0.1)% |

* Net Other Assets (Liabilities) are not included in the pie chart
Domestic Equity Funds category includes Fidelity Series Commodity Strategy Fund which invests in commodity-related investments.
Fidelity Freedom® 2040 Fund
Schedule of Investments September 30, 2018 (Unaudited)
Showing Percentage of Net Assets
| U.S. Treasury Obligations - 0.1% | | | |
| | | Principal Amount | Value |
| U.S. Treasury Bills, yield at date of purchase 2.07% to 2.11% 11/23/18 to 12/6/18 (a) | | | |
| (Cost $16,082,704) | | 16,140,000 | 16,081,594 |
| | | Shares | Value |
|
| Domestic Equity Funds - 60.5% | | | |
| Fidelity Series All-Sector Equity Fund (b) | | 43,938,325 | $598,000,603 |
| Fidelity Series Blue Chip Growth Fund (b) | | 65,050,428 | 995,271,542 |
| Fidelity Series Commodity Strategy Fund (b) | | 97,318,133 | 486,590,666 |
| Fidelity Series Growth Company Fund (b) | | 99,485,793 | 2,010,607,877 |
| Fidelity Series Intrinsic Opportunities Fund (b) | | 126,314,507 | 2,315,344,903 |
| Fidelity Series Large Cap Stock Fund (b) | | 132,332,398 | 2,108,055,106 |
| Fidelity Series Large Cap Value Index Fund (b) | | 43,740,787 | 577,378,392 |
| Fidelity Series Opportunistic Insights Fund (b) | | 53,951,887 | 1,070,944,952 |
| Fidelity Series Small Cap Discovery Fund (b) | | 21,787,669 | 264,720,180 |
| Fidelity Series Small Cap Opportunities Fund (b) | | 58,943,997 | 865,887,311 |
| Fidelity Series Stock Selector Large Cap Value Fund (b) | | 118,097,827 | 1,561,253,269 |
| Fidelity Series Value Discovery Fund (b) | | 80,836,457 | 1,106,651,100 |
| TOTAL DOMESTIC EQUITY FUNDS | | | |
| (Cost $10,380,676,631) | | | 13,960,705,901 |
|
| International Equity Funds - 30.7% | | | |
| Fidelity Series Canada Fund (b) | | 19,115,204 | 206,635,357 |
| Fidelity Series Emerging Markets Fund (b) | | 13,541,799 | 131,220,029 |
| Fidelity Series Emerging Markets Opportunities Fund (b) | | 103,283,200 | 1,982,004,603 |
| Fidelity Series International Growth Fund (b) | | 130,397,487 | 2,138,518,788 |
| Fidelity Series International Small Cap Fund (b) | | 28,191,793 | 504,633,094 |
| Fidelity Series International Value Fund (b) | | 201,985,694 | 2,124,889,501 |
| TOTAL INTERNATIONAL EQUITY FUNDS | | | |
| (Cost $5,833,211,429) | | | 7,087,901,372 |
|
| Bond Funds - 6.8% | | | |
| Fidelity Series Emerging Markets Debt Fund (b) | | 14,522,240 | 138,396,945 |
| Fidelity Series Floating Rate High Income Fund (b) | | 5,213,336 | 49,630,963 |
| Fidelity Series High Income Fund (b) | | 31,434,469 | 302,085,249 |
| Fidelity Series Inflation-Protected Bond Index Fund (b) | | 7,166,130 | 69,583,120 |
| Fidelity Series International Credit Fund (b) | | 976,302 | 9,597,049 |
| Fidelity Series Investment Grade Bond Fund (b) | | 9,401,599 | 102,383,409 |
| Fidelity Series Long-Term Treasury Bond Index Fund (b) | | 97,224,848 | 801,132,751 |
| Fidelity Series Real Estate Income Fund (b) | | 9,264,875 | 99,875,358 |
| TOTAL BOND FUNDS | | | |
| (Cost $1,618,063,599) | | | 1,572,684,844 |
|
| Short-Term Funds - 2.0% | | | |
| Fidelity Cash Central Fund, 2.11% (c) | | 37,819,990 | 37,827,554 |
| Fidelity Series Government Money Market Fund 2.12% (b)(d) | | 340,006,298 | 340,006,298 |
| Fidelity Series Short-Term Credit Fund (b) | | 7,287,247 | 71,852,258 |
| TOTAL SHORT-TERM FUNDS | | | |
| (Cost $450,381,363) | | | 449,686,110 |
| TOTAL INVESTMENT IN SECURITIES - 100.1% | | | |
| (Cost $18,298,415,726) | | | 23,087,059,821 |
| NET OTHER ASSETS (LIABILITIES) - (0.1)% | | | (13,477,224) |
| NET ASSETS - 100% | | | $23,073,582,597 |
| Futures Contracts | | | | | |
| | Number of contracts | Expiration Date | Notional Amount | Value | Unrealized Appreciation/(Depreciation) |
| Purchased | | | | | |
| Equity Index Contracts | | | | | |
| CME E-mini S&P 500 Index Contracts (United States) | 892 | Dec. 2018 | $130,187,400 | $25,254 | $25,254 |
| ICE E-mini MSCI Emerging Markets Index Contracts (United States) | 1,348 | Dec. 2018 | 70,749,780 | 1,391,164 | 1,391,164 |
| TOTAL PURCHASED | | | | | 1,416,418 |
| Sold | | | | | |
| Equity Index Contracts | | | | | |
| ICE E-mini MSCI EAFE Index Contracts (United States) | 579 | Dec. 2018 | 57,190,725 | (109,951) | (109,951) |
| TOTAL FUTURES CONTRACTS | | | | | $1,306,467 |
The notional amount of futures purchased as a percentage of Net Assets is 0.9%
The notional amount of futures sold as a percentage of Net Assets is 0.2%
Legend
(a) Security or a portion of the security was pledged to cover margin requirements for futures contracts. At period end, the value of securities pledged amounted to $4,626,926.
(b) Affiliated Fund
(c) Affiliated fund that is generally available only to investment companies and other accounts managed by Fidelity Investments. The rate quoted is the annualized seven-day yield of the fund at period end. A complete unaudited listing of the fund's holdings as of its most recent quarter end is available upon request. In addition, each Fidelity Central Fund's financial statements are available on the SEC's website or upon request.
(d) The rate quoted is the annualized seven-day yield of the fund at period end.
Affiliated Central Funds
Information regarding fiscal year to date income earned by the Fund from investments in Fidelity Central Funds is as follows:
| Fund | Income earned |
| Fidelity Cash Central Fund | $108,550 |
| Total | $108,550 |
Amounts in the income column in the above table include any capital gain distributions from underlying funds, which are presented in the corresponding line-item in the Statement of Operations if applicable.
Affiliated Underlying Funds
Fiscal year to date information regarding the Fund's investments in affiliated Underlying Funds, excluding any Money Market Central Funds, is presented below. Exchanges between classes of the same affiliated Underlying Funds may occur.
| Affiliate | Value, beginning of period | Purchases | Sales Proceeds | Dividend Income | Realized Gain (loss) | Change in Unrealized appreciation (depreciation) | Value, end of period |
| Fidelity Series 100 Index Fund | $443,201,000 | $27,501 | $474,621,171 | $-- | $177,785,602 | $(146,392,932) | $-- |
| Fidelity Series All-Sector Equity Fund | 852,293,455 | 24,197,249 | 374,915,415 | -- | 31,443,706 | 64,981,608 | 598,000,603 |
| Fidelity Series Blue Chip Growth Fund | 880,936,658 | 117,426,287 | 68,058,169 | 92,264,868 | 7,111,070 | 57,855,696 | 995,271,542 |
| Fidelity Series Canada Fund | 196,369,345 | 6,501,630 | 8,450,552 | -- | 88,964 | 12,125,970 | 206,635,357 |
| Fidelity Series Commodity Strategy Fund | 466,509,085 | 77,353,445 | 17,904,068 | 29,095,323 | (1,935,730) | (37,432,066) | 486,590,666 |
| Fidelity Series Emerging Markets Debt Fund | 144,474,691 | 8,021,063 | 6,181,522 | 4,243,910 | (293,676) | (7,623,611) | 138,396,945 |
| Fidelity Series Emerging Markets Fund | -- | 129,520,127 | -- | -- | -- | 1,699,902 | 131,220,029 |
| Fidelity Series Emerging Markets Opportunities Fund | 2,040,911,915 | 294,103,418 | 93,230,305 | -- | 9,288,341 | (269,068,766) | 1,982,004,603 |
| Fidelity Series Floating Rate High Income Fund | 48,961,247 | 2,892,013 | 2,273,354 | 1,318,733 | (76,825) | 127,882 | 49,630,963 |
| Fidelity Series Government Money Market Fund 2.12% | 359,251,220 | 335,374,530 | 354,619,452 | 2,952,239 | -- | -- | 340,006,298 |
| Fidelity Series Growth Company Fund | 1,792,770,541 | 50,554,267 | 99,878,731 | -- | 5,854,361 | 261,307,439 | 2,010,607,877 |
| Fidelity Series High Income Fund | 309,170,419 | 16,972,033 | 26,552,474 | 8,855,688 | (920,483) | 3,415,754 | 302,085,249 |
| Fidelity Series Inflation-Protected Bond Index Fund | 179,663,816 | 17,824,120 | 128,620,481 | 268,259 | (1,799,563) | 2,515,228 | 69,583,120 |
| Fidelity Series International Credit Fund | 9,784,897 | 121,452 | 210,862 | 120,588 | (2,839) | (95,599) | 9,597,049 |
| Fidelity Series International Growth Fund | 1,977,736,139 | 205,266,391 | 75,652,385 | -- | 556,482 | 30,612,161 | 2,138,518,788 |
| Fidelity Series International Small Cap Fund | 493,473,677 | 39,166,053 | 8,672,381 | -- | (190,415) | (19,143,840) | 504,633,094 |
| Fidelity Series International Value Fund | 2,001,758,300 | 156,532,720 | 28,980,633 | -- | (441,746) | (3,979,140) | 2,124,889,501 |
| Fidelity Series Intrinsic Opportunities Fund | 2,182,350,576 | 172,205,101 | 72,183,411 | 102,232,148 | (722,382) | 33,695,019 | 2,315,344,903 |
| Fidelity Series Investment Grade Bond Fund | 106,425,476 | 8,154,992 | 10,972,404 | 1,464,336 | (228,115) | (996,540) | 102,383,409 |
| Fidelity Series Large Cap Stock Fund | 1,927,084,035 | 184,317,739 | 96,464,157 | 123,283,869 | 3,084,014 | 90,033,475 | 2,108,055,106 |
| Fidelity Series Large Cap Value Index Fund | 549,397,749 | 16,102,234 | 26,742,399 | -- | 237,872 | 38,382,936 | 577,378,392 |
| Fidelity Series Long-Term Treasury Bond Index Fund | 501,632,815 | 510,802,067 | 184,480,090 | 10,136,286 | (6,059,591) | (20,762,450) | 801,132,751 |
| Fidelity Series Opportunistic Insights Fund | 965,411,695 | 28,548,166 | 48,692,488 | -- | 1,973,431 | 123,704,148 | 1,070,944,952 |
| Fidelity Series Real Estate Equity Fund | 176,406,153 | 1,945,989 | 185,854,727 | 1,804,383 | 8,722,617 | (1,220,032) | -- |
| Fidelity Series Real Estate Income Fund | 96,629,351 | 7,170,921 | 4,513,145 | 4,212,008 | (60,648) | 648,879 | 99,875,358 |
| Fidelity Series Short-Term Credit Fund | 65,675,427 | 9,328,493 | 3,151,127 | 756,431 | (20,266) | 19,731 | 71,852,258 |
| Fidelity Series Small Cap Discovery Fund | 257,910,452 | 23,251,638 | 12,711,314 | 15,566,375 | (208,305) | (3,522,291) | 264,720,180 |
| Fidelity Series Small Cap Opportunities Fund | 796,470,742 | 90,162,268 | 44,855,532 | 66,836,804 | 2,311,957 | 21,797,876 | 865,887,311 |
| Fidelity Series Stock Selector Large Cap Value Fund | 1,499,209,905 | 44,063,467 | 85,412,611 | -- | (1,027,241) | 104,419,749 | 1,561,253,269 |
| Fidelity Series Value Discovery Fund | 1,063,662,736 | 32,345,134 | 51,751,101 | -- | (309,483) | 62,703,814 | 1,106,651,100 |
| | $22,385,533,517 | $2,610,252,508 | $2,596,606,461 | $465,412,248 | $234,161,109 | $399,810,000 | $23,033,150,673 |
Amounts in the income column in the above table include any capital gain distributions from underlying funds, which are presented in the corresponding line-item in the Statement of Operations if applicable.
Investment Valuation
The following is a summary of the inputs used, as of September 30, 2018, involving the Fund's assets and liabilities carried at fair value. The inputs or methodology used for valuing securities may not be an indication of the risk associated with investing in those securities. For more information on valuation inputs, and their aggregation into the levels used below, please refer to the Investment Valuation section in the accompanying Notes to Financial Statements.
| | Valuation Inputs at Reporting Date: |
| Description | Total | Level 1 | Level 2 | Level 3 |
| Investments in Securities: | | | | |
| Other Short-Term Investments | $16,081,594 | $-- | $16,081,594 | $-- |
| Domestic Equity Funds | 13,960,705,901 | 13,960,705,901 | -- | -- |
| International Equity Funds | 7,087,901,372 | 7,087,901,372 | -- | -- |
| Bond Funds | 1,572,684,844 | 1,572,684,844 | -- | -- |
| Short-Term Funds | 449,686,110 | 449,686,110 | -- | -- |
| Total Investments in Securities: | $23,087,059,821 | $23,070,978,227 | $16,081,594 | $-- |
| Derivative Instruments: | | | | |
| Assets | | | | |
| Futures Contracts | $1,416,418 | $1,416,418 | $-- | $-- |
| Total Assets | $1,416,418 | $1,416,418 | $-- | $-- |
| Liabilities | | | | |
| Futures Contracts | $(109,951) | $(109,951) | $-- | $-- |
| Total Liabilities | $(109,951) | $(109,951) | $-- | $-- |
| Total Derivative Instruments: | $1,306,467 | $1,306,467 | $-- | $-- |
Value of Derivative Instruments
The following table is a summary of the Fund's value of derivative instruments by primary risk exposure as of September 30, 2018. For additional information on derivative instruments, please refer to the Derivative Instruments section in the accompanying Notes to Financial Statements.
| Primary Risk Exposure / Derivative Type | Value |
| | Asset | Liability |
| Equity Risk | | |
| Futures Contracts(a) | $1,416,418 | $(109,951) |
| Total Equity Risk | 1,416,418 | (109,951) |
| Total Value of Derivatives | $1,416,418 | $(109,951) |
(a) Reflects gross cumulative appreciation (depreciation) on futures contracts as presented in the Schedule of Investments. In the Statement of Assets and Liabilities, the period end daily variation margin is included in receivable or payable for daily variation margin on futures contracts, and the net cumulative appreciation (depreciation) is included in net unrealized appreciation (depreciation).
See accompanying notes which are an integral part of the financial statements.
Fidelity Freedom® 2040 Fund
Financial Statements
Statement of Assets and Liabilities
| | | September 30, 2018 (Unaudited) |
| Assets | | |
Investment in securities, at value — See accompanying schedule:
Unaffiliated issuers (cost $16,082,704) | $16,081,594 | |
| Fidelity Central Funds (cost $37,827,554) | 37,827,554 | |
| Other affiliated issuers (cost $18,244,505,468) | 23,033,150,673 | |
| Total Investment in Securities (cost $18,298,415,726) | | $23,087,059,821 |
| Receivable for investments sold | | 248,367,537 |
| Receivable for fund shares sold | | 486,204,460 |
| Distributions receivable from Fidelity Central Funds | | 57,793 |
| Total assets | | 23,821,689,611 |
| Liabilities | | |
| Payable for investments purchased | $258,377,839 | |
| Payable for fund shares redeemed | 476,105,038 | |
| Accrued management fee | 12,873,523 | |
| Payable for daily variation margin on futures contracts | 750,614 | |
| Total liabilities | | 748,107,014 |
| Net Assets | | $23,073,582,597 |
| Net Assets consist of: | | |
| Paid in capital | | $17,714,232,439 |
| Undistributed net investment income | | 46,346,812 |
| Accumulated undistributed net realized gain (loss) on investments | | 523,052,784 |
| Net unrealized appreciation (depreciation) on investments | | 4,789,950,562 |
| Net Assets | | $23,073,582,597 |
| Fidelity Freedom 2040 Fund: | | |
| Net Asset Value, offering price and redemption price per share ($8,675,308,806 ÷ 799,343,174 shares) | | $10.85 |
| Class K: | | |
| Net Asset Value, offering price and redemption price per share ($12,883,091,744 ÷ 1,187,775,379 shares) | | $10.85 |
| Class K6: | | |
| Net Asset Value, offering price and redemption price per share ($1,515,182,047 ÷ 139,638,273 shares) | | $10.85 |
See accompanying notes which are an integral part of the financial statements.
Statement of Operations
| | | Six months ended September 30, 2018 (Unaudited) |
| Investment Income | | |
| Dividends: | | |
| Affiliated issuers | | $123,622,532 |
| Interest | | 89,185 |
| Income from Fidelity Central Funds | | 108,550 |
| Total income | | 123,820,267 |
| Expenses | | |
| Management fee | $77,418,111 | |
| Independent trustees' fees and expenses | 55,344 | |
| Total expenses | | 77,473,455 |
| Net investment income (loss) | | 46,346,812 |
| Realized and Unrealized Gain (Loss) | | |
| Net realized gain (loss) on: | | |
| Investment securities: | | |
| Fidelity Central Funds | 64 | |
| Other affiliated issuers | 234,161,109 | |
| Futures contracts | (11,626,230) | |
| Capital gain distributions from underlying funds: | | |
| Affiliated issuers | 341,789,716 | |
| Total net realized gain (loss) | | 564,324,659 |
| Change in net unrealized appreciation (depreciation) on: | | |
| Investment securities: | | |
| Unaffiliated issuers | (1,110) | |
| Affiliated issuers | 399,810,000 | |
| Futures contracts | 1,306,467 | |
| Total change in net unrealized appreciation (depreciation) | | 401,115,357 |
| Net gain (loss) | | 965,440,016 |
| Net increase (decrease) in net assets resulting from operations | | $1,011,786,828 |
See accompanying notes which are an integral part of the financial statements.
Statement of Changes in Net Assets
| | Six months ended September 30, 2018 (Unaudited) | Year ended March 31, 2018 |
| Increase (Decrease) in Net Assets | | |
| Operations | | |
| Net investment income (loss) | $46,346,812 | $241,539,734 |
| Net realized gain (loss) | 564,324,659 | 1,033,195,358 |
| Change in net unrealized appreciation (depreciation) | 401,115,357 | 685,250,223 |
| Net increase (decrease) in net assets resulting from operations | 1,011,786,828 | 1,959,985,315 |
| Distributions to shareholders from net investment income | – | (266,263,160) |
| Distributions to shareholders from net realized gain | (621,028,991) | (509,942,580) |
| Total distributions | (621,028,991) | (776,205,740) |
| Share transactions - net increase (decrease) | 310,072,638 | 13,924,513,839 |
| Total increase (decrease) in net assets | 700,830,475 | 15,108,293,414 |
| Net Assets | | |
| Beginning of period | 22,372,752,122 | 7,264,458,708 |
| End of period | $23,073,582,597 | $22,372,752,122 |
| Other Information | | |
| Undistributed net investment income end of period | $46,346,812 | $– |
See accompanying notes which are an integral part of the financial statements.
Financial Highlights
Fidelity Freedom 2040 Fund
| | Six months ended (Unaudited) September 30, | Years endedMarch 31, | | | | |
| | 2018 | 2018 | 2017 | 2016 | 2015 | 2014 |
| Selected Per–Share Data | | | | | | |
| Net asset value, beginning of period | $10.67 | $9.74 | $8.75 | $9.63 | $9.62 | $8.78 |
| Income from Investment Operations | | | | | | |
| Net investment income (loss)A | .02 | .11 | .13 | .13 | .15 | .13 |
| Net realized and unrealized gain (loss) | .45 | 1.29 | 1.24 | (.46) | .57 | 1.17 |
| Total from investment operations | .47 | 1.40 | 1.37 | (.33) | .72 | 1.30 |
| Distributions from net investment income | – | (.12) | (.13) | (.14) | (.16) | (.13) |
| Distributions from net realized gain | (.29) | (.35) | (.24) | (.41) | (.55) | (.33) |
| Total distributions | (.29) | (.47) | (.38)B | (.55) | (.71) | (.46) |
| Net asset value, end of period | $10.85 | $10.67 | $9.74 | $8.75 | $9.63 | $9.62 |
| Total ReturnC,D | 4.48% | 14.52% | 16.14% | (3.62)% | 7.86% | 15.08% |
| Ratios to Average Net AssetsE,F | | | | | | |
| Expenses before reductions | .75%G | .63%H | - %I | - %I | - %I | - %I |
| Expenses net of fee waivers, if any | .75%G | .63%H | -% | -% | -% | -% |
| Expenses net of all reductions | .75%G | .63%H | -% | -% | -% | -% |
| Net investment income (loss) | .34%G | 1.04% | 1.44% | 1.47% | 1.61% | 1.40% |
| Supplemental Data | | | | | | |
| Net assets, end of period (000 omitted) | $8,675,309 | $8,285,660 | $7,264,459 | $6,388,566 | $6,901,191 | $7,016,128 |
| Portfolio turnover rateF | 23%G | 16%J | 15% | 16% | 17% | 49% |
A Calculated based on average shares outstanding during the period.
B Total distributions of $.38 per share is comprised of distributions from net investment income of $.132 and distributions from net realized gain of $.244 per share.
C Total returns for periods of less than one year are not annualized.
D Total returns would have been lower if certain expenses had not been reduced during the applicable periods shown.
E Expense ratios reflect operating expenses of the class. Expenses before reductions do not reflect amounts reimbursed by the investment adviser or reductions from expense offset arrangements and do not represent the amount paid by the class during periods when reimbursements or reductions occur. Expenses net of fee waivers reflect expenses after reimbursement by the investment adviser but prior to reductions from expense offset arrangements. Expenses net of all reductions represent the net expenses paid by the class but do not include expenses of the underlying funds in which the Fund invests.
F Amounts do not include the activity of the Underlying Funds.
G Annualized
H On certain classes, the size and fluctuation of net assets and expense amounts may cause ratios to differ from contractual rates.
I Amount represents less than $.005 per share.
J The portfolio turnover rate does not include the assets acquired in the merger.
See accompanying notes which are an integral part of the financial statements.
Fidelity Freedom 2040 Fund Class K
| | Six months ended (Unaudited) September 30, | Years endedMarch 31, |
| | 2018 | 2018 A |
| Selected Per–Share Data | | |
| Net asset value, beginning of period | $10.66 | $10.25 |
| Income from Investment Operations | | |
| Net investment income (loss)B | .02 | .15 |
| Net realized and unrealized gain (loss) | .46 | .59 |
| Total from investment operations | .48 | .74 |
| Distributions from net investment income | – | (.14) |
| Distributions from net realized gain | (.29) | (.19) |
| Total distributions | (.29) | (.33) |
| Net asset value, end of period | $10.85 | $10.66 |
| Total ReturnC,D | 4.59% | 7.21% |
| Ratios to Average Net AssetsE,F | | |
| Expenses before reductions | .64%G | .65%G,H |
| Expenses net of fee waivers, if any | .64%G | .65%G,H |
| Expenses net of all reductions | .64%G | .65%G,H |
| Net investment income (loss) | .44%G | 2.06%G |
| Supplemental Data | | |
| Net assets, end of period (000 omitted) | $12,883,092 | $13,434,642 |
| Portfolio turnover rateF | 23%G | 16%I |
A For the period July 20, 2017 (commencement of sale of shares) to March 31, 2018.
B Calculated based on average shares outstanding during the period.
C Total returns for periods of less than one year are not annualized.
D Total returns would have been lower if certain expenses had not been reduced during the applicable periods shown.
E Expense ratios reflect operating expenses of the class. Expenses before reductions do not reflect amounts reimbursed by the investment adviser or reductions from expense offset arrangements and do not represent the amount paid by the class during periods when reimbursements or reductions occur. Expense ratios before reductions for start-up periods may not be representative of longer-term operating periods. Expenses net of fee waivers reflect expenses after reimbursement by the investment adviser but prior to reductions from expense offset arrangements. Expenses net of all reductions represent the net expenses paid by the class but do not include expenses of the underlying funds in which the Fund invests.
F Amounts do not include the activity of the Underlying Funds.
G Annualized
H On certain classes, the size and fluctuation of net assets and expense amounts may cause ratios to differ from contractual rates.
I The portfolio turnover rate does not include the assets acquired in the merger.
See accompanying notes which are an integral part of the financial statements.
Fidelity Freedom 2040 Fund Class K6
| | Six months ended (Unaudited) September 30, | Years endedMarch 31, |
| | 2018 | 2018 A |
| Selected Per–Share Data | | |
| Net asset value, beginning of period | $10.66 | $10.03 |
| Income from Investment Operations | | |
| Net investment income (loss)B | .03 | .13 |
| Net realized and unrealized gain (loss) | .46 | .83 |
| Total from investment operations | .49 | .96 |
| Distributions from net investment income | – | (.14) |
| Distributions from net realized gain | (.30) | (.19) |
| Total distributions | (.30) | (.33) |
| Net asset value, end of period | $10.85 | $10.66 |
| Total ReturnC,D | 4.67% | 9.60% |
| Ratios to Average Net AssetsE,F | | |
| Expenses before reductions | .49%G | .50%G,H |
| Expenses net of fee waivers, if any | .49%G | .50%G,H |
| Expenses net of all reductions | .49%G | .50%G,H |
| Net investment income (loss) | .59%G | 1.55%G |
| Supplemental Data | | |
| Net assets, end of period (000 omitted) | $1,515,182 | $652,451 |
| Portfolio turnover rateF | 23%G | 16%I |
A For the period June 7, 2017 (commencement of sale of shares) to March 31, 2018.
B Calculated based on average shares outstanding during the period.
C Total returns for periods of less than one year are not annualized.
D Total returns would have been lower if certain expenses had not been reduced during the applicable periods shown.
E Expense ratios reflect operating expenses of the class. Expenses before reductions do not reflect amounts reimbursed by the investment adviser or reductions from expense offset arrangements and do not represent the amount paid by the class during periods when reimbursements or reductions occur. Expense ratios before reductions for start-up periods may not be representative of longer-term operating periods. Expenses net of fee waivers reflect expenses after reimbursement by the investment adviser but prior to reductions from expense offset arrangements. Expenses net of all reductions represent the net expenses paid by the class but do not include expenses of the underlying funds in which the Fund invests.
F Amounts do not include the activity of the Underlying Funds.
G Annualized
H On certain classes, the size and fluctuation of net assets and expense amounts may cause ratios to differ from contractual rates.
I The portfolio turnover rate does not include the assets acquired in the merger.
See accompanying notes which are an integral part of the financial statements.
Fidelity Freedom® 2045 Fund
Investment Summary (Unaudited)
The information in the following tables is based on the direct investments of the Fund.
Top Holdings as of September 30, 2018
| | % of fund's net assets |
| Fidelity Series Intrinsic Opportunities Fund | 10.0 |
| Fidelity Series International Growth Fund | 9.3 |
| Fidelity Series International Value Fund | 9.2 |
| Fidelity Series Large Cap Stock Fund | 9.2 |
| Fidelity Series Growth Company Fund | 8.7 |
| Fidelity Series Emerging Markets Opportunities Fund | 8.6 |
| Fidelity Series Stock Selector Large Cap Value Fund | 6.8 |
| Fidelity Series Value Discovery Fund | 4.8 |
| Fidelity Series Opportunistic Insights Fund | 4.6 |
| Fidelity Series Blue Chip Growth Fund | 4.3 |
| | 75.5 |
Asset Allocation (% of fund's net assets)
| Period end |
| | Domestic Equity Funds | 60.5% |
| | International Equity Funds | 30.7% |
| | Bond Funds | 6.8% |
| | Short-Term Funds | 2.0% |
| | Short-Term Investments | 0.1% |
| | Net Other Assets (Liabilities)* | (0.1)% |

* Net Other Assets (Liabilities) are not included in the pie chart
Domestic Equity Funds category includes Fidelity Series Commodity Strategy Fund which invests in commodity-related investments.
Fidelity Freedom® 2045 Fund
Schedule of Investments September 30, 2018 (Unaudited)
Showing Percentage of Net Assets
| U.S. Treasury Obligations - 0.1% | | | |
| | | Principal Amount | Value |
| U.S. Treasury Bills, yield at date of purchase 2.07% to 2.11% 11/23/18 to 12/6/18 (a) | | | |
| (Cost $9,735,283) | | 9,770,000 | 9,734,611 |
| | | Shares | Value |
|
| Domestic Equity Funds - 60.5% | | | |
| Fidelity Series All-Sector Equity Fund (b) | | 26,590,695 | $361,899,353 |
| Fidelity Series Blue Chip Growth Fund (b) | | 39,340,323 | 601,906,944 |
| Fidelity Series Commodity Strategy Fund (b) | | 58,878,930 | 294,394,650 |
| Fidelity Series Growth Company Fund (b) | | 60,165,742 | 1,215,949,643 |
| Fidelity Series Intrinsic Opportunities Fund (b) | | 75,872,561 | 1,390,744,043 |
| Fidelity Series Large Cap Stock Fund (b) | | 80,167,106 | 1,277,061,994 |
| Fidelity Series Large Cap Value Index Fund (b) | | 26,501,754 | 349,823,158 |
| Fidelity Series Opportunistic Insights Fund (b) | | 32,668,157 | 648,462,908 |
| Fidelity Series Small Cap Discovery Fund (b) | | 13,196,321 | 160,335,301 |
| Fidelity Series Small Cap Opportunities Fund (b) | | 35,672,838 | 524,033,991 |
| Fidelity Series Stock Selector Large Cap Value Fund (b) | | 71,642,465 | 947,113,392 |
| Fidelity Series Value Discovery Fund (b) | | 48,964,904 | 670,329,533 |
| TOTAL DOMESTIC EQUITY FUNDS | | | |
| (Cost $6,431,635,018) | | | 8,442,054,910 |
|
| International Equity Funds - 30.7% | | | |
| Fidelity Series Canada Fund (b) | | 11,558,671 | 124,949,235 |
| Fidelity Series Emerging Markets Fund (b) | | 8,194,082 | 79,400,651 |
| Fidelity Series Emerging Markets Opportunities Fund (b) | | 62,480,406 | 1,198,998,998 |
| Fidelity Series International Growth Fund (b) | | 78,861,334 | 1,293,325,876 |
| Fidelity Series International Small Cap Fund (b) | | 17,061,172 | 305,394,985 |
| Fidelity Series International Value Fund (b) | | 122,157,013 | 1,285,091,775 |
| TOTAL INTERNATIONAL EQUITY FUNDS | | | |
| (Cost $3,585,281,459) | | | 4,287,161,520 |
|
| Bond Funds - 6.8% | | | |
| Fidelity Series Emerging Markets Debt Fund (b) | | 8,666,418 | 82,590,966 |
| Fidelity Series Floating Rate High Income Fund (b) | | 3,193,051 | 30,397,841 |
| Fidelity Series High Income Fund (b) | | 18,962,277 | 182,227,485 |
| Fidelity Series Inflation-Protected Bond Index Fund (b) | | 4,333,400 | 42,077,311 |
| Fidelity Series International Credit Fund (b) | | 580,874 | 5,709,994 |
| Fidelity Series Investment Grade Bond Fund (b) | | 5,685,095 | 61,910,683 |
| Fidelity Series Long-Term Treasury Bond Index Fund (b) | | 58,781,722 | 484,361,389 |
| Fidelity Series Real Estate Income Fund (b) | | 5,527,798 | 59,589,661 |
| TOTAL BOND FUNDS | | | |
| (Cost $974,494,789) | | | 948,865,330 |
|
| Short-Term Funds - 2.0% | | | |
| Fidelity Cash Central Fund, 2.11% (c) | | 22,418,427 | 22,422,911 |
| Fidelity Series Government Money Market Fund 2.12% (b)(d) | | 206,170,237 | 206,170,237 |
| Fidelity Series Short-Term Credit Fund (b) | | 4,445,351 | 43,831,163 |
| TOTAL SHORT-TERM FUNDS | | | |
| (Cost $272,833,074) | | | 272,424,311 |
| TOTAL INVESTMENT IN SECURITIES - 100.1% | | | |
| (Cost $11,273,979,623) | | | 13,960,240,682 |
| NET OTHER ASSETS (LIABILITIES) - (0.1)% | | | (8,051,180) |
| NET ASSETS - 100% | | | $13,952,189,502 |
| Futures Contracts | | | | | |
| | Number of contracts | Expiration Date | Notional Amount | Value | Unrealized Appreciation/(Depreciation) |
| Purchased | | | | | |
| Equity Index Contracts | | | | | |
| CME E-mini S&P 500 Index Contracts (United States) | 538 | Dec. 2018 | $78,521,100 | $15,232 | $15,232 |
| ICE E-mini MSCI Emerging Markets Index Contracts (United States) | 805 | Dec. 2018 | 42,250,425 | 831,292 | 831,291 |
|
| TOTAL PURCHASED | | | | | 846,523 |
|
| Sold | | | | | |
| Equity Index Contracts | | | | | |
| ICE E-mini MSCI EAFE Index Contracts (United States) | 357 | Dec. 2018 | 35,262,675 | (65,996) | (65,996) |
| TOTAL FUTURES CONTRACTS | | | | | $780,527 |
The notional amount of futures purchased as a percentage of Net Assets is 0.9%
The notional amount of futures sold as a percentage of Net Assets is 0.3%
Legend
(a) Security or a portion of the security was pledged to cover margin requirements for futures contracts. At period end, the value of securities pledged amounted to $3,063,229.
(b) Affiliated Fund
(c) Affiliated fund that is generally available only to investment companies and other accounts managed by Fidelity Investments. The rate quoted is the annualized seven-day yield of the fund at period end. A complete unaudited listing of the fund's holdings as of its most recent quarter end is available upon request. In addition, each Fidelity Central Fund's financial statements are available on the SEC's website or upon request.
(d) The rate quoted is the annualized seven-day yield of the fund at period end.
Affiliated Central Funds
Information regarding fiscal year to date income earned by the Fund from investments in Fidelity Central Funds is as follows:
| Fund | Income earned |
| Fidelity Cash Central Fund | $64,023 |
| Total | $64,023 |
Amounts in the income column in the above table include any capital gain distributions from underlying funds, which are presented in the corresponding line-item in the Statement of Operations if applicable.
Affiliated Underlying Funds
Fiscal year to date information regarding the Fund's investments in affiliated Underlying Funds, excluding any Money Market Central Funds, is presented below. Exchanges between classes of the same affiliated Underlying Funds may occur.
| Affiliate | Value, beginning of period | Purchases | Sales Proceeds | Dividend Income | Realized Gain (loss) | Change in Unrealized appreciation (depreciation) | Value, end of period |
| Fidelity Series 100 Index Fund | $263,182,195 | $35,408 | $281,858,315 | $-- | $118,503,464 | $(99,862,752) | $-- |
| Fidelity Series All-Sector Equity Fund | 507,057,960 | 24,353,815 | 227,413,942 | -- | 18,530,840 | 39,370,680 | 361,899,353 |
| Fidelity Series Blue Chip Growth Fund | 524,034,296 | 81,496,149 | 42,346,463 | 55,573,624 | 3,493,846 | 35,229,116 | 601,906,944 |
| Fidelity Series Canada Fund | 116,819,435 | 6,299,081 | 5,482,303 | -- | 71,714 | 7,241,308 | 124,949,235 |
| Fidelity Series Commodity Strategy Fund | 278,070,063 | 51,506,286 | 11,487,190 | 17,538,017 | (3,602,850) | (20,091,659) | 294,394,650 |
| Fidelity Series Emerging Markets Debt Fund | 84,775,451 | 6,393,438 | 3,923,165 | 2,511,531 | (224,211) | (4,430,547) | 82,590,966 |
| Fidelity Series Emerging Markets Fund | -- | 78,363,361 | -- | -- | -- | 1,037,290 | 79,400,651 |
| Fidelity Series Emerging Markets | 1,214,195,749 | 188,564,627 | 48,629,828 | -- | 3,819,543 | (158,951,093) | 1,198,998,998 |
| Fidelity Series Floating Rate High Income | 29,413,979 | 2,417,035 | 1,464,882 | 800,443 | (17,991) | 49,700 | 30,397,841 |
| Fidelity Series Government Money Market | 212,944,275 | 206,857,434 | 213,631,472 | 1,768,652 | -- | -- | 206,170,237 |
| Fidelity Series Growth Company Fund | 1,066,317,020 | 52,635,966 | 63,084,957 | -- | 2,632,734 | 157,448,880 | 1,215,949,643 |
| Fidelity Series High Income Fund | 182,802,662 | 13,621,170 | 15,687,741 | 5,292,179 | (529,000) | 2,020,394 | 182,227,485 |
| Fidelity Series Inflation-Protected Bond | 107,538,333 | 12,390,610 | 78,265,538 | 161,549 | (1,138,569) | 1,552,475 | 42,077,311 |
| Fidelity Series International Credit Fund | 5,867,034 | 73,386 | 171,403 | 72,304 | (2,180) | (56,843) | 5,709,994 |
| Fidelity Series International Growth Fund | 1,176,177,691 | 146,185,242 | 47,854,051 | -- | 315,125 | 18,501,869 | 1,293,325,876 |
| Fidelity Series International Small Cap Fund | 293,469,300 | 27,090,346 | 3,600,391 | -- | (84,294) | (11,479,976) | 305,394,985 |
| Fidelity Series International Value Fund | 1,190,569,587 | 110,110,678 | 13,284,283 | -- | (231,909) | (2,072,298) | 1,285,091,775 |
| Fidelity Series Intrinsic Opportunities Fund | 1,296,043,058 | 130,912,741 | 55,737,519 | 61,226,029 | (316,164) | 19,841,927 | 1,390,744,043 |
| Fidelity Series Investment Grade Bond Fund | 63,493,715 | 6,095,948 | 6,945,249 | 876,834 | (125,745) | (607,986) | 61,910,683 |
| Fidelity Series Large Cap Stock Fund | 1,146,756,357 | 134,528,542 | 60,233,607 | 73,856,655 | 1,837,134 | 54,173,568 | 1,277,061,994 |
| Fidelity Series Large Cap Value Index Fund | 326,476,656 | 16,808,742 | 16,647,296 | -- | 178,547 | 23,006,509 | 349,823,158 |
| Fidelity Series Long-Term Treasury Bond | 298,749,888 | 313,580,010 | 111,834,803 | 6,088,342 | (3,635,195) | (12,498,511) | 484,361,389 |
| Fidelity Series Opportunistic Insights Fund | 574,264,670 | 29,391,946 | 30,526,169 | -- | 968,168 | 74,364,293 | 648,462,908 |
| Fidelity Series Real Estate Equity Fund | 104,846,888 | 1,163,810 | 110,503,750 | 1,022,178 | 2,026,500 | 2,466,552 | -- |
| Fidelity Series Real Estate Income Fund | 56,559,805 | 5,536,640 | 2,846,803 | 2,495,998 | (45,685) | 385,704 | 59,589,661 |
| Fidelity Series Short-Term Credit Fund | 39,780,377 | 6,044,691 | 1,993,471 | 463,472 | (18,313) | 17,879 | 43,831,163 |
| Fidelity Series Small Cap Discovery Fund | 153,285,060 | 17,243,463 | 7,896,625 | 9,343,718 | (199,374) | (2,097,223) | 160,335,301 |
| Fidelity Series Small Cap Opportunities Fund | 473,946,400 | 64,311,717 | 28,349,478 | 40,284,725 | 1,187,258 | 12,938,094 | 524,033,991 |
| Fidelity Series Stock Selector Large Cap | 892,343,372 | 45,059,942 | 52,400,911 | -- | (838,495) | 62,949,484 | 947,113,392 |
| Fidelity Series Value Discovery Fund | 633,054,295 | 32,049,251 | 32,196,070 | -- | (234,814) | 37,656,871 | 670,329,533 |
| | 13,312,835,571 | 1,811,121,475 | 1,576,297,675 | 279,376,250 | 142,320,084 | 238,103,705 | 13,928,083,160 |
Amounts in the income column in the above table include any capital gain distributions from underlying funds, which are presented in the corresponding line-item in the Statement of Operations if applicable.
Investment Valuation
The following is a summary of the inputs used, as of September 30, 2018, involving the Fund's assets and liabilities carried at fair value. The inputs or methodology used for valuing securities may not be an indication of the risk associated with investing in those securities. For more information on valuation inputs, and their aggregation into the levels used below, please refer to the Investment Valuation section in the accompanying Notes to Financial Statements.
| | Valuation Inputs at Reporting Date: |
| Description | Total | Level 1 | Level 2 | Level 3 |
| Investments in Securities: | | | | |
| Other Short-Term Investments | $9,734,611 | $-- | $9,734,611 | $-- |
| Domestic Equity Funds | 8,442,054,910 | 8,442,054,910 | -- | -- |
| International Equity Funds | 4,287,161,520 | 4,287,161,520 | -- | -- |
| Bond Funds | 948,865,330 | 948,865,330 | -- | -- |
| Short-Term Funds | 272,424,311 | 272,424,311 | -- | -- |
| Total Investments in Securities: | $13,960,240,682 | $13,950,506,071 | $9,734,611 | $-- |
| Derivative Instruments: | | | | |
| Assets | | | | |
| Futures Contracts | $846,523 | $846,523 | $-- | $-- |
| Total Assets | $846,523 | $846,523 | $-- | $-- |
| Liabilities | | | | |
| Futures Contracts | $(65,996) | $(65,996) | $-- | $-- |
| Total Liabilities | $(65,996) | $(65,996) | $-- | $-- |
| Total Derivative Instruments: | $780,527 | $780,527 | $-- | $-- |
Value of Derivative Instruments
The following table is a summary of the Fund's value of derivative instruments by primary risk exposure as of September 30, 2018. For additional information on derivative instruments, please refer to the Derivative Instruments section in the accompanying Notes to Financial Statements.
| Primary Risk Exposure / Derivative Type | Value |
| | Asset | Liability |
| Equity Risk | | |
| Futures Contracts(a) | $846,523 | $(65,996) |
| Total Equity Risk | 846,523 | (65,996) |
| Total Value of Derivatives | $846,523 | $(65,996) |
(a) Reflects gross cumulative appreciation (depreciation) on futures contracts as presented in the Schedule of Investments. In the Statement of Assets and Liabilities, the period end daily variation margin is included in receivable or payable for daily variation margin on futures contracts, and the net cumulative appreciation (depreciation) is included in net unrealized appreciation (depreciation).
See accompanying notes which are an integral part of the financial statements.
Fidelity Freedom® 2045 Fund
Financial Statements
Statement of Assets and Liabilities
| | | September 30, 2018 (Unaudited) |
| Assets | | |
Investment in securities, at value — See accompanying schedule:
Unaffiliated issuers (cost $9,735,283) | $9,734,611 | |
| Fidelity Central Funds (cost $22,422,911) | 22,422,911 | |
| Other affiliated issuers (cost $11,241,821,429) | 13,928,083,160 | |
| Total Investment in Securities (cost $11,273,979,623) | | $13,960,240,682 |
| Receivable for investments sold | | 151,576,786 |
| Receivable for fund shares sold | | 427,176,820 |
| Distributions receivable from Fidelity Central Funds | | 34,252 |
| Total assets | | 14,539,028,540 |
| Liabilities | | |
| Payable for investments purchased | $167,584,241 | |
| Payable for fund shares redeemed | 411,118,337 | |
| Accrued management fee | 7,686,377 | |
| Payable for daily variation margin on futures contracts | 450,083 | |
| Total liabilities | | 586,839,038 |
| Net Assets | | $13,952,189,502 |
| Net Assets consist of: | | |
| Paid in capital | | $10,919,127,495 |
| Undistributed net investment income | | 28,158,063 |
| Accumulated undistributed net realized gain (loss) on investments | | 317,862,358 |
| Net unrealized appreciation (depreciation) on investments | | 2,687,041,586 |
| Net Assets | | $13,952,189,502 |
| Fidelity Freedom 2045 Fund: | | |
| Net Asset Value, offering price and redemption price per share ($4,406,664,525 ÷ 357,974,618 shares) | | $12.31 |
| Class K: | | |
| Net Asset Value, offering price and redemption price per share ($8,465,002,997 ÷ 688,288,075 shares) | | $12.30 |
| Class K6: | | |
| Net Asset Value, offering price and redemption price per share ($1,080,521,980 ÷ 87,784,470 shares) | | $12.31 |
See accompanying notes which are an integral part of the financial statements.
Statement of Operations
| | | Six months ended September 30, 2018 (Unaudited) |
| Investment Income | | |
| Dividends: | | |
| Affiliated issuers | | $74,110,475 |
| Interest | | 53,658 |
| Income from Fidelity Central Funds | | 64,023 |
| Total income | | 74,228,156 |
| Expenses | | |
| Management fee | $46,037,061 | |
| Independent trustees' fees and expenses | 33,061 | |
| Total expenses before reductions | 46,070,122 | |
| Expense reductions | (29) | |
| Total expenses after reductions | | 46,070,093 |
| Net investment income (loss) | | 28,158,063 |
| Realized and Unrealized Gain (Loss) | | |
| Net realized gain (loss) on: | | |
| Investment securities: | | |
| Fidelity Central Funds | 38 | |
| Other affiliated issuers | 142,320,084 | |
| Futures contracts | (6,976,326) | |
| Capital gain distributions from underlying funds: | | |
| Affiliated issuers | 205,265,775 | |
| Total net realized gain (loss) | | 340,609,571 |
| Change in net unrealized appreciation (depreciation) on: | | |
| Investment securities: | | |
| Unaffiliated issuers | (672) | |
| Affiliated issuers | 238,103,705 | |
| Futures contracts | 780,527 | |
| Total change in net unrealized appreciation (depreciation) | | 238,883,560 |
| Net gain (loss) | | 579,493,131 |
| Net increase (decrease) in net assets resulting from operations | | $607,651,194 |
See accompanying notes which are an integral part of the financial statements.
Statement of Changes in Net Assets
| | Six months ended September 30, 2018 (Unaudited) | Year ended March 31, 2018 |
| Increase (Decrease) in Net Assets | | |
| Operations | | |
| Net investment income (loss) | $28,158,063 | $142,234,368 |
| Net realized gain (loss) | 340,609,571 | 576,736,884 |
| Change in net unrealized appreciation (depreciation) | 238,883,560 | 374,497,649 |
| Net increase (decrease) in net assets resulting from operations | 607,651,194 | 1,093,468,901 |
| Distributions to shareholders from net investment income | – | (156,078,537) |
| Distributions to shareholders from net realized gain | (360,127,155) | (256,279,773) |
| Total distributions | (360,127,155) | (412,358,310) |
| Share transactions - net increase (decrease) | 399,339,193 | 9,128,031,725 |
| Total increase (decrease) in net assets | 646,863,232 | 9,809,142,316 |
| Net Assets | | |
| Beginning of period | 13,305,326,270 | 3,496,183,954 |
| End of period | $13,952,189,502 | $13,305,326,270 |
| Other Information | | |
| Undistributed net investment income end of period | $28,158,063 | $– |
See accompanying notes which are an integral part of the financial statements.
Financial Highlights
Fidelity Freedom 2045 Fund
| | Six months ended (Unaudited) September 30, | Years endedMarch 31, | | | | |
| | 2018 | 2018 | 2017 | 2016 | 2015 | 2014 |
| Selected Per–Share Data | | | | | | |
| Net asset value, beginning of period | $12.09 | $11.00 | $9.89 | $10.84 | $11.09 | $10.42 |
| Income from Investment Operations | | | | | | |
| Net investment income (loss)A | .02 | .12 | .15 | .15 | .17 | .15 |
| Net realized and unrealized gain (loss) | .52 | 1.46 | 1.39 | (.52) | .64 | 1.39 |
| Total from investment operations | .54 | 1.58 | 1.54 | (.37) | .81 | 1.54 |
| Distributions from net investment income | – | (.13) | (.15) | (.16) | (.18) | (.15) |
| Distributions from net realized gain | (.32) | (.35) | (.28) | (.43) | (.89) | (.72) |
| Total distributions | (.32) | (.49)B | (.43) | (.58)C | (1.06)D | (.87) |
| Net asset value, end of period | $12.31 | $12.09 | $11.00 | $9.89 | $10.84 | $11.09 |
| Total ReturnE,F | 4.53% | 14.48% | 16.08% | (3.59)% | 7.93% | 15.38% |
| Ratios to Average Net AssetsG,H | | | | | | |
| Expenses before reductions | .75%I | .63%J | - %K | - %K | - %K | - %K |
| Expenses net of fee waivers, if any | .75%I | .63%J | -% | -% | -% | -% |
| Expenses net of all reductions | .75%I | .63%J | -% | -% | -% | -% |
| Net investment income (loss) | .34%I | 1.04% | 1.45% | 1.48% | 1.62% | 1.42% |
| Supplemental Data | | | | | | |
| Net assets, end of period (000 omitted) | $4,406,665 | $4,144,152 | $3,496,184 | $2,912,972 | $2,993,926 | $2,885,106 |
| Portfolio turnover rateG | 23%I | 17%L | 15% | 17% | 21% | 53% |
A Calculated based on average shares outstanding during the period.
B Total distributions of $.49 per share is comprised of distributions from net investment income of $.134 and distributions from net realized gain of $.352 per share.
C Total distributions of $.58 per share is comprised of distributions from net investment income of $.155 and distributions from net realized gain of $.427 per share.
D Total distributions of $1.06 per share is comprised of distributions from net investment income of $.178 and distributions from net realized gain of $.886 per share.
E Total returns for periods of less than one year are not annualized.
F Total returns would have been lower if certain expenses had not been reduced during the applicable periods shown.
G Amounts do not include the activity of the Underlying Funds.
H Expense ratios reflect operating expenses of the class. Expenses before reductions do not reflect amounts reimbursed by the investment adviser or reductions from expense offset arrangements and do not represent the amount paid by the class during periods when reimbursements or reductions occur. Expenses net of fee waivers reflect expenses after reimbursement by the investment adviser but prior to reductions from expense offset arrangements. Expenses net of all reductions represent the net expenses paid by the class but do not include expenses of the underlying funds in which the Fund invests.
I Annualized
J On certain classes, the size and fluctuation of net assets and expense amounts may cause ratios to differ from contractual rates.
K Amount represents less than .005%.
L The portfolio turnover rate does not include the assets acquired in the merger.
See accompanying notes which are an integral part of the financial statements.
Fidelity Freedom 2045 Fund Class K
| | Six months ended (Unaudited) September 30, | Years endedMarch 31, |
| | 2018 | 2018 A |
| Selected Per–Share Data | | |
| Net asset value, beginning of period | $12.08 | $11.59 |
| Income from Investment Operations | | |
| Net investment income (loss)B | .03 | .17 |
| Net realized and unrealized gain (loss) | .51 | .67 |
| Total from investment operations | .54 | .84 |
| Distributions from net investment income | – | (.15) |
| Distributions from net realized gain | (.32) | (.19) |
| Total distributions | (.32) | (.35)C |
| Net asset value, end of period | $12.30 | $12.08 |
| Total ReturnD,E | 4.55% | 7.21% |
| Ratios to Average Net AssetsF,G | | |
| Expenses before reductions | .64%H | .65%H,I |
| Expenses net of fee waivers, if any | .64%H | .65%H,I |
| Expenses net of all reductions | .64%H | .65%H,I |
| Net investment income (loss) | .44%H | 2.05%H |
| Supplemental Data | | |
| Net assets, end of period (000 omitted) | $8,465,003 | $8,748,416 |
| Portfolio turnover rateF | 23%H | 17%J |
A For the period July 20, 2017 (commencement of sale of shares) to March 31, 2018.
B Calculated based on average shares outstanding during the period.
C Total distributions of $.35 per share is comprised of distributions from net investment income of $.153 and distributions from net realized gain of $.194 per share.
D Total returns for periods of less than one year are not annualized.
E Total returns would have been lower if certain expenses had not been reduced during the applicable periods shown.
F Amounts do not include the activity of the Underlying Funds.
G Expense ratios reflect operating expenses of the class. Expenses before reductions do not reflect amounts reimbursed by the investment adviser or reductions from expense offset arrangements and do not represent the amount paid by the class during periods when reimbursements or reductions occur. Expense ratios before reductions for start-up periods may not be representative of longer-term operating periods. Expenses net of fee waivers reflect expenses after reimbursement by the investment adviser but prior to reductions from expense offset arrangements. Expenses net of all reductions represent the net expenses paid by the class but do not include expenses of the underlying funds in which the Fund invests.
H Annualized
I On certain classes, the size and fluctuation of net assets and expense amounts may cause ratios to differ from contractual rates.
J The portfolio turnover rate does not include the assets acquired in the merger.
See accompanying notes which are an integral part of the financial statements.
Fidelity Freedom 2045 Fund Class K6
| | Six months ended (Unaudited) September 30, | Years endedMarch 31, |
| | 2018 | 2018 A |
| Selected Per–Share Data | | |
| Net asset value, beginning of period | $12.09 | $11.34 |
| Income from Investment Operations | | |
| Net investment income (loss)B | .04 | .14 |
| Net realized and unrealized gain (loss) | .51 | .96 |
| Total from investment operations | .55 | 1.10 |
| Distributions from net investment income | – | (.16) |
| Distributions from net realized gain | (.33) | (.19) |
| Total distributions | (.33) | (.35) |
| Net asset value, end of period | $12.31 | $12.09 |
| Total ReturnC,D | 4.61% | 9.70% |
| Ratios to Average Net AssetsE,F | | |
| Expenses before reductions | .49%G | .50%G,H |
| Expenses net of fee waivers, if any | .49%G | .50%G,H |
| Expenses net of all reductions | .49%G | .50%G,H |
| Net investment income (loss) | .59%G | 1.45%G |
| Supplemental Data | | |
| Net assets, end of period (000 omitted) | $1,080,522 | $412,758 |
| Portfolio turnover rateE | 23%G | 17%I |
A For the period June 7, 2017 (commencement of sale of shares) to March 31, 2018.
B Calculated based on average shares outstanding during the period.
C Total returns for periods of less than one year are not annualized.
D Total returns would have been lower if certain expenses had not been reduced during the applicable periods shown.
E Amounts do not include the activity of the Underlying Funds.
F Expense ratios reflect operating expenses of the class. Expenses before reductions do not reflect amounts reimbursed by the investment adviser or reductions from expense offset arrangements and do not represent the amount paid by the class during periods when reimbursements or reductions occur. Expense ratios before reductions for start-up periods may not be representative of longer-term operating periods. Expenses net of fee waivers reflect expenses after reimbursement by the investment adviser but prior to reductions from expense offset arrangements. Expenses net of all reductions represent the net expenses paid by the class but do not include expenses of the underlying funds in which the Fund invests.
G Annualized
H On certain classes, the size and fluctuation of net assets and expense amounts may cause ratios to differ from contractual rates.
I The portfolio turnover rate does not include the assets acquired in the merger.
See accompanying notes which are an integral part of the financial statements.
Fidelity Freedom® 2050 Fund
Investment Summary (Unaudited)
The information in the following tables is based on the direct investments of the Fund.
Top Holdings as of September 30, 2018
| | % of fund's net assets |
| Fidelity Series Intrinsic Opportunities Fund | 10.0 |
| Fidelity Series International Growth Fund | 9.3 |
| Fidelity Series International Value Fund | 9.2 |
| Fidelity Series Large Cap Stock Fund | 9.1 |
| Fidelity Series Growth Company Fund | 8.7 |
| Fidelity Series Emerging Markets Opportunities Fund | 8.6 |
| Fidelity Series Stock Selector Large Cap Value Fund | 6.8 |
| Fidelity Series Value Discovery Fund | 4.8 |
| Fidelity Series Opportunistic Insights Fund | 4.6 |
| Fidelity Series Blue Chip Growth Fund | 4.3 |
| | 75.4 |
Asset Allocation (% of fund's net assets)
| Period end |
| | Domestic Equity Funds | 60.5% |
| | International Equity Funds | 30.7% |
| | Bond Funds | 6.8% |
| | Short-Term Funds | 2.0% |
| | Short-Term Investments | 0.1% |
| | Net Other Assets (Liabilities)* | (0.1)% |

* Net Other Assets (Liabilities) are not included in the pie chart
Domestic Equity Funds category includes Fidelity Series Commodity Strategy Fund which invests in commodity-related investments.
Fidelity Freedom® 2050 Fund
Schedule of Investments September 30, 2018 (Unaudited)
Showing Percentage of Net Assets
| U.S. Treasury Obligations - 0.1% | | | |
| | | Principal Amount | Value |
| U.S. Treasury Bills, yield at date of purchase 2.07% to 2.11% 11/23/18 to 12/6/18 (a) | | | |
| (Cost $9,595,334) | | 9,630,000 | 9,594,688 |
| | | Shares | Value |
|
| Domestic Equity Funds - 60.5% | | | |
| Fidelity Series All-Sector Equity Fund (b) | | 22,515,292 | $306,433,123 |
| Fidelity Series Blue Chip Growth Fund (b) | | 33,464,933 | 512,013,480 |
| Fidelity Series Commodity Strategy Fund (b) | | 50,104,202 | 250,521,009 |
| Fidelity Series Growth Company Fund (b) | | 51,179,943 | 1,034,346,656 |
| Fidelity Series Intrinsic Opportunities Fund (b) | | 64,781,043 | 1,187,436,516 |
| Fidelity Series Large Cap Stock Fund (b) | | 68,157,030 | 1,085,741,494 |
| Fidelity Series Large Cap Value Index Fund (b) | | 22,542,698 | 297,563,612 |
| Fidelity Series Opportunistic Insights Fund (b) | | 27,775,224 | 551,338,197 |
| Fidelity Series Small Cap Discovery Fund (b) | | 11,221,790 | 136,344,747 |
| Fidelity Series Small Cap Opportunities Fund (b) | | 30,337,217 | 445,653,721 |
| Fidelity Series Stock Selector Large Cap Value Fund (b) | | 60,924,097 | 805,416,567 |
| Fidelity Series Value Discovery Fund (b) | | 41,636,845 | 570,008,406 |
| TOTAL DOMESTIC EQUITY FUNDS | | | |
| (Cost $5,504,813,976) | | | 7,182,817,528 |
|
| International Equity Funds - 30.7% | | | |
| Fidelity Series Canada Fund (b) | | 9,834,409 | 106,309,962 |
| Fidelity Series Emerging Markets Fund (b) | | 6,933,301 | 67,183,687 |
| Fidelity Series Emerging Markets Opportunities Fund (b) | | 53,162,111 | 1,020,180,919 |
| Fidelity Series International Growth Fund (b) | | 67,097,861 | 1,100,404,913 |
| Fidelity Series International Small Cap Fund (b) | | 14,516,948 | 259,853,377 |
| Fidelity Series International Value Fund (b) | | 103,935,372 | 1,093,400,112 |
| TOTAL INTERNATIONAL EQUITY FUNDS | | | |
| (Cost $3,060,959,152) | | | 3,647,332,970 |
|
| Bond Funds - 6.8% | | | |
| Fidelity Series Emerging Markets Debt Fund (b) | | 7,358,488 | 70,126,390 |
| Fidelity Series Floating Rate High Income Fund (b) | | 2,739,712 | 26,082,060 |
| Fidelity Series High Income Fund (b) | | 16,127,528 | 154,985,547 |
| Fidelity Series Inflation-Protected Bond Index Fund (b) | | 3,686,975 | 35,800,531 |
| Fidelity Series International Credit Fund (b) | | 491,100 | 4,827,510 |
| Fidelity Series Investment Grade Bond Fund (b) | | 4,837,109 | 52,676,120 |
| Fidelity Series Long-Term Treasury Bond Index Fund (b) | | 50,008,589 | 412,070,773 |
| Fidelity Series Real Estate Income Fund (b) | | 4,707,019 | 50,741,661 |
| TOTAL BOND FUNDS | | | |
| (Cost $829,868,479) | | | 807,310,592 |
|
| Short-Term Funds - 2.0% | | | |
| Fidelity Cash Central Fund, 2.11% (c) | | 17,576,469 | 17,579,984 |
| Fidelity Series Government Money Market Fund 2.12% (b)(d) | | 175,810,970 | 175,810,970 |
| Fidelity Series Short-Term Credit Fund (b) | | 3,784,431 | 37,314,486 |
| TOTAL SHORT-TERM FUNDS | | | |
| (Cost $231,050,030) | | | 230,705,440 |
| TOTAL INVESTMENT IN SECURITIES - 100.1% | | | |
| (Cost $9,636,286,971) | | | 11,877,761,218 |
| NET OTHER ASSETS (LIABILITIES) - (0.1)% | | | (6,842,419) |
| NET ASSETS - 100% | | | $11,870,918,799 |
| Futures Contracts | | | | | |
| | Number of contracts | Expiration Date | Notional Amount | Value | Unrealized Appreciation/(Depreciation) |
| Purchased | | | | | |
| Equity Index Contracts | | | | | |
| CME E-mini S&P 500 Index Contracts (United States) | 458 | Dec. 2018 | $66,845,100 | $12,967 | $12,967 |
| ICE E-mini MSCI Emerging Markets Index Contracts (United States) | 690 | Dec. 2018 | 36,214,650 | 713,671 | 713,671 |
|
| TOTAL PURCHASED | | | | | 726,638 |
|
| Sold | | | | | |
| Equity Index Contracts | | | | | |
| ICE E-mini MSCI EAFE Index Contracts (United States) | 304 | Dec. 2018 | 30,027,600 | (57,281) | (57,281) |
| TOTAL FUTURES CONTRACTS | | | | | $669,357 |
The notional amount of futures purchased as a percentage of Net Assets is 0.9%
The notional amount of futures sold as a percentage of Net Assets is 0.3%
Legend
(a) Security or a portion of the security was pledged to cover margin requirements for futures contracts. At period end, the value of securities pledged amounted to $2,627,720.
(b) Affiliated Fund
(c) Affiliated fund that is generally available only to investment companies and other accounts managed by Fidelity Investments. The rate quoted is the annualized seven-day yield of the fund at period end. A complete unaudited listing of the fund's holdings as of its most recent quarter end is available upon request. In addition, each Fidelity Central Fund's financial statements are available on the SEC's website or upon request.
(d) The rate quoted is the annualized seven-day yield of the fund at period end.
Affiliated Central Funds
Information regarding fiscal year to date income earned by the Fund from investments in Fidelity Central Funds is as follows:
| Fund | Income earned |
| Fidelity Cash Central Fund | $52,191 |
| Total | $52,191 |
Amounts in the income column in the above table include any capital gain distributions from underlying funds, which are presented in the corresponding line-item in the Statement of Operations if applicable.
Affiliated Underlying Funds
Fiscal year to date information regarding the Fund's investments in affiliated Underlying Funds, excluding any Money Market Central Funds, is presented below. Exchanges between classes of the same affiliated Underlying Funds may occur.
| Affiliate | Value, beginning of period | Purchases | Sales Proceeds | Dividend Income | Realized Gain (loss) | Change in Unrealized appreciation (depreciation) | Value, end of period |
| Fidelity Series 100 Index Fund | $222,464,053 | $56,827 | $238,274,425 | $-- | $97,847,141 | $(82,093,596) | $-- |
| Fidelity Series All-Sector Equity Fund | 429,071,816 | 23,203,101 | 195,029,830 | -- | 15,206,670 | 33,981,366 | 306,433,123 |
| Fidelity Series Blue Chip Growth Fund | 443,402,520 | 71,874,053 | 36,006,249 | 47,308,816 | 2,066,813 | 30,676,343 | 512,013,480 |
| Fidelity Series Canada Fund | 98,832,496 | 5,930,275 | 4,654,623 | -- | 49,720 | 6,152,094 | 106,309,962 |
| Fidelity Series Commodity Strategy Fund | 235,237,103 | 45,065,827 | 9,591,708 | 14,932,723 | (2,403,843) | (17,786,370) | 250,521,009 |
| Fidelity Series Emerging Markets Debt Fund | 71,582,940 | 5,817,711 | 3,327,094 | 2,128,234 | (173,741) | (3,773,426) | 70,126,390 |
| Fidelity Series Emerging Markets Fund | -- | 66,268,976 | -- | -- | -- | 914,711 | 67,183,687 |
| Fidelity Series Emerging Markets | 1,027,149,604 | 171,335,113 | 46,443,815 | -- | 1,447,820 | (133,307,803) | 1,020,180,919 |
| Fidelity Series Floating Rate High Income | 25,093,502 | 2,221,355 | 1,260,070 | 685,282 | (27,263) | 54,536 | 26,082,060 |
| Fidelity Series Government Money Market | 180,118,828 | 177,577,132 | 181,884,990 | 1,502,022 | -- | -- | 175,810,970 |
| Fidelity Series Growth Company Fund | 902,132,390 | 50,611,056 | 54,335,090 | -- | 927,756 | 135,010,544 | 1,034,346,656 |
| Fidelity Series High Income Fund | 154,489,571 | 12,376,379 | 13,147,475 | 4,489,822 | (380,771) | 1,647,843 | 154,985,547 |
| Fidelity Series Inflation-Protected Bond | 90,992,656 | 10,995,849 | 66,540,392 | 137,196 | (954,534) | 1,306,952 | 35,800,531 |
| Fidelity Series International Credit Fund | 4,937,865 | 62,671 | 123,351 | 60,853 | (1,612) | (48,063) | 4,827,510 |
| Fidelity Series International Growth Fund | 995,013,836 | 129,843,691 | 40,354,120 | -- | 168,830 | 15,732,676 | 1,100,404,913 |
| Fidelity Series International Small Cap Fund | 248,264,939 | 25,685,853 | 4,248,837 | -- | (138,481) | (9,710,097) | 259,853,377 |
| Fidelity Series International Value Fund | 1,007,232,591 | 101,308,164 | 13,049,891 | -- | (417,648) | (1,673,104) | 1,093,400,112 |
| Fidelity Series Intrinsic Opportunities Fund | 1,095,273,542 | 117,261,037 | 41,405,597 | 52,267,409 | (393,442) | 16,700,976 | 1,187,436,516 |
| Fidelity Series Investment Grade Bond Fund | 53,699,737 | 5,477,301 | 5,879,050 | 743,427 | (96,326) | (525,542) | 52,676,120 |
| Fidelity Series Large Cap Stock Fund | 970,491,938 | 120,229,598 | 52,258,201 | 63,018,374 | 734,823 | 46,543,336 | 1,085,741,494 |
| Fidelity Series Large Cap Value Index Fund | 276,330,213 | 15,997,436 | 14,478,986 | -- | 109,664 | 19,605,285 | 297,563,612 |
| Fidelity Series Long-Term Treasury Bond | 252,756,420 | 267,096,767 | 94,079,575 | 5,190,693 | (3,100,499) | (10,602,340) | 412,070,773 |
| Fidelity Series Opportunistic Insights Fund | 485,903,915 | 27,930,559 | 26,437,478 | -- | 356,244 | 63,584,957 | 551,338,197 |
| Fidelity Series Real Estate Equity Fund | 88,578,147 | 981,590 | 93,370,139 | 825,806 | 1,459,039 | 2,351,363 | -- |
| Fidelity Series Real Estate Income Fund | 47,880,196 | 5,011,646 | 2,437,954 | 2,122,902 | (18,325) | 306,098 | 50,741,661 |
| Fidelity Series Short-Term Credit Fund | 33,678,083 | 5,344,509 | 1,707,854 | 394,128 | (13,639) | 13,387 | 37,314,486 |
| Fidelity Series Small Cap Discovery Fund | 129,743,700 | 15,429,674 | 6,877,644 | 7,926,368 | (178,694) | (1,772,289) | 136,344,747 |
| Fidelity Series Small Cap Opportunities Fund | 401,012,829 | 57,117,828 | 24,405,892 | 34,284,495 | 695,328 | 11,233,628 | 445,653,721 |
| Fidelity Series Stock Selector Large Cap | 755,175,216 | 42,865,141 | 45,413,304 | -- | (760,392) | 53,549,906 | 805,416,567 |
| Fidelity Series Value Discovery Fund | 535,725,735 | 30,443,623 | 27,957,249 | -- | (226,486) | 32,022,783 | 570,008,406 |
| | $11,262,266,381 | $1,611,420,742 | $1,344,980,883 | $238,018,550 | $111,784,152 | $210,096,154 | $11,850,586,546 |
Amounts in the income column in the above table include any capital gain distributions from underlying funds, which are presented in the corresponding line-item in the Statement of Operations if applicable.
Investment Valuation
The following is a summary of the inputs used, as of September 30, 2018, involving the Fund's assets and liabilities carried at fair value. The inputs or methodology used for valuing securities may not be an indication of the risk associated with investing in those securities. For more information on valuation inputs, and their aggregation into the levels used below, please refer to the Investment Valuation section in the accompanying Notes to Financial Statements.
| | Valuation Inputs at Reporting Date: |
| Description | Total | Level 1 | Level 2 | Level 3 |
| Investments in Securities: | | | | |
| Other Short-Term Investments | $9,594,688 | $-- | $9,594,688 | $-- |
| Domestic Equity Funds | 7,182,817,528 | 7,182,817,528 | -- | -- |
| International Equity Funds | 3,647,332,970 | 3,647,332,970 | -- | -- |
| Bond Funds | 807,310,592 | 807,310,592 | -- | -- |
| Short-Term Funds | 230,705,440 | 230,705,440 | -- | -- |
| Total Investments in Securities: | $11,877,761,218 | $11,868,166,530 | $9,594,688 | $-- |
| Derivative Instruments: | | | | |
| Assets | | | | |
| Futures Contracts | $726,638 | $726,638 | $-- | $-- |
| Total Assets | $726,638 | $726,638 | $-- | $-- |
| Liabilities | | | | |
| Futures Contracts | $(57,281) | $(57,281) | $-- | $-- |
| Total Liabilities | $(57,281) | $(57,281) | $-- | $-- |
| Total Derivative Instruments: | $669,357 | $669,357 | $-- | $-- |
Value of Derivative Instruments
The following table is a summary of the Fund's value of derivative instruments by primary risk exposure as of September 30, 2018. For additional information on derivative instruments, please refer to the Derivative Instruments section in the accompanying Notes to Financial Statements.
| Primary Risk Exposure / Derivative Type | Value |
| | Asset | Liability |
| Equity Risk | | |
| Futures Contracts(a) | $726,638 | $(57,281) |
| Total Equity Risk | 726,638 | (57,281) |
| Total Value of Derivatives | $726,638 | $(57,281) |
(a) Reflects gross cumulative appreciation (depreciation) on futures contracts as presented in the Schedule of Investments. In the Statement of Assets and Liabilities, the period end daily variation margin is included in receivable or payable for daily variation margin on futures contracts, and the net cumulative appreciation (depreciation) is included in net unrealized appreciation (depreciation).
See accompanying notes which are an integral part of the financial statements.
Fidelity Freedom® 2050 Fund
Financial Statements
Statement of Assets and Liabilities
| | | September 30, 2018 (Unaudited) |
| Assets | | |
Investment in securities, at value — See accompanying schedule:
Unaffiliated issuers (cost $9,595,334) | $9,594,688 | |
| Fidelity Central Funds (cost $17,579,984) | 17,579,984 | |
| Other affiliated issuers (cost $9,609,111,653) | 11,850,586,546 | |
| Total Investment in Securities (cost $9,636,286,971) | | $11,877,761,218 |
| Receivable for investments sold | | 129,841,397 |
| Receivable for fund shares sold | | 347,764,386 |
| Distributions receivable from Fidelity Central Funds | | 27,111 |
| Total assets | | 12,355,394,112 |
| Liabilities | | |
| Payable for investments purchased | $144,898,700 | |
| Payable for fund shares redeemed | 332,652,271 | |
| Accrued management fee | 6,538,783 | |
| Payable for daily variation margin on futures contracts | 385,559 | |
| Total liabilities | | 484,475,313 |
| Net Assets | | $11,870,918,799 |
| Net Assets consist of: | | |
| Paid in capital | | $9,344,212,215 |
| Undistributed net investment income | | 22,952,456 |
| Accumulated undistributed net realized gain (loss) on investments | | 261,610,524 |
| Net unrealized appreciation (depreciation) on investments | | 2,242,143,604 |
| Net Assets | | $11,870,918,799 |
| Fidelity Freedom 2050 Fund: | | |
| Net Asset Value, offering price and redemption price per share ($3,699,609,000 ÷ 298,791,260 shares) | | $12.38 |
| Class K: | | |
| Net Asset Value, offering price and redemption price per share ($7,287,972,236 ÷ 589,203,351 shares) | | $12.37 |
| Class K6: | | |
| Net Asset Value, offering price and redemption price per share ($883,337,563 ÷ 71,295,771 shares) | | $12.39 |
See accompanying notes which are an integral part of the financial statements.
Statement of Operations
| | | Six months ended September 30, 2018 (Unaudited) |
| Investment Income | | |
| Dividends: | | |
| Affiliated issuers | | $63,019,629 |
| Interest | | 47,268 |
| Income from Fidelity Central Funds | | 52,191 |
| Total income | | 63,119,088 |
| Expenses | | |
| Management fee | $39,062,176 | |
| Independent trustees' fees and expenses | 28,016 | |
| Total expenses before reductions | 39,090,192 | |
| Expense reductions | (6) | |
| Total expenses after reductions | | 39,090,186 |
| Net investment income (loss) | | 24,028,902 |
| Realized and Unrealized Gain (Loss) | | |
| Net realized gain (loss) on: | | |
| Investment securities: | | |
| Fidelity Central Funds | 33 | |
| Other affiliated issuers | 111,784,152 | |
| Futures contracts | (5,971,111) | |
| Capital gain distributions from underlying funds: | | |
| Affiliated issuers | 174,998,921 | |
| Total net realized gain (loss) | | 280,811,995 |
| Change in net unrealized appreciation (depreciation) on: | | |
| Investment securities: | | |
| Unaffiliated issuers | (646) | |
| Affiliated issuers | 210,096,154 | |
| Futures contracts | 669,357 | |
| Total change in net unrealized appreciation (depreciation) | | 210,764,865 |
| Net gain (loss) | | 491,576,860 |
| Net increase (decrease) in net assets resulting from operations | | $515,605,762 |
See accompanying notes which are an integral part of the financial statements.
Statement of Changes in Net Assets
| | Six months ended September 30, 2018 (Unaudited) | Year ended March 31, 2018 |
| Increase (Decrease) in Net Assets | | |
| Operations | | |
| Net investment income (loss) | $24,028,902 | $119,339,449 |
| Net realized gain (loss) | 280,811,995 | 479,169,493 |
| Change in net unrealized appreciation (depreciation) | 210,764,865 | 312,072,760 |
| Net increase (decrease) in net assets resulting from operations | 515,605,762 | 910,581,702 |
| Distributions to shareholders from net investment income | – | (131,450,258) |
| Distributions to shareholders from net realized gain | (299,795,085) | (213,055,694) |
| Total distributions | (299,795,085) | (344,505,952) |
| Share transactions - net increase (decrease) | 399,180,447 | 7,805,021,541 |
| Total increase (decrease) in net assets | 614,991,124 | 8,371,097,291 |
| Net Assets | | |
| Beginning of period | 11,255,927,675 | 2,884,830,384 |
| End of period | $11,870,918,799 | $11,255,927,675 |
| Other Information | | |
| Undistributed net investment income end of period | $22,952,456 | $– |
| Distributions in excess of net investment income end of period | $– | $(1,076,446) |
See accompanying notes which are an integral part of the financial statements.
Financial Highlights
Fidelity Freedom 2050 Fund
| | Six months ended (Unaudited) September 30, | Years endedMarch 31, | | | | |
| | 2018 | 2018 | 2017 | 2016 | 2015 | 2014 |
| Selected Per–Share Data | | | | | | |
| Net asset value, beginning of period | $12.16 | $11.05 | $9.93 | $10.90 | $11.15 | $10.28 |
| Income from Investment Operations | | | | | | |
| Net investment income (loss)A | .02 | .12 | .15 | .15 | .17 | .15 |
| Net realized and unrealized gain (loss) | .52 | 1.48 | 1.40 | (.52) | .65 | 1.41 |
| Total from investment operations | .54 | 1.60 | 1.55 | (.37) | .82 | 1.56 |
| Distributions from net investment income | – | (.14) | (.15) | (.16) | (.18) | (.15) |
| Distributions from net realized gain | (.32) | (.35) | (.28) | (.44) | (.89) | (.54) |
| Total distributions | (.32) | (.49) | (.43) | (.60) | (1.07) | (.69) |
| Net asset value, end of period | $12.38 | $12.16 | $11.05 | $9.93 | $10.90 | $11.15 |
| Total ReturnB,C | 4.48% | 14.59% | 16.11% | (3.65)% | 7.91% | 15.53% |
| Ratios to Average Net AssetsD,E | | | | | | |
| Expenses before reductions | .75%F | .63%G | - %H | - %H | - %H | - %H |
| Expenses net of fee waivers, if any | .75%F | .63%G | -% | -% | -% | -% |
| Expenses net of all reductions | .75%F | .63%G | -% | -% | -% | -% |
| Net investment income (loss) | .34%F | 1.04% | 1.45% | 1.49% | 1.62% | 1.41% |
| Supplemental Data | | | | | | |
| Net assets, end of period (000 omitted) | $3,699,609 | $3,452,997 | $2,884,830 | $2,363,381 | $2,375,308 | $2,297,832 |
| Portfolio turnover rateD | 23%F | 16%I | 15% | 17% | 23% | 57% |
A Calculated based on average shares outstanding during the period.
B Total returns for periods of less than one year are not annualized.
C Total returns would have been lower if certain expenses had not been reduced during the applicable periods shown.
D Amounts do not include the activity of the Underlying Funds.
E Expense ratios reflect operating expenses of the class. Expenses before reductions do not reflect amounts reimbursed by the investment adviser or reductions from expense offset arrangements and do not represent the amount paid by the class during periods when reimbursements or reductions occur. Expenses net of fee waivers reflect expenses after reimbursement by the investment adviser but prior to reductions from expense offset arrangements. Expenses net of all reductions represent the net expenses paid by the class but do not include expenses of the underlying funds in which the Fund invests.
F Annualized
G On certain classes, the size and fluctuation of net assets and expense amounts may cause ratios to differ from contractual rates.
H Amount represents less than .005%.
I The portfolio turnover rate does not include the assets acquired in the merger.
See accompanying notes which are an integral part of the financial statements.
Fidelity Freedom 2050 Fund Class K
| | Six months ended (Unaudited) September 30, | Years endedMarch 31, |
| | 2018 | 2018 A |
| Selected Per–Share Data | | |
| Net asset value, beginning of period | $12.14 | $11.65 |
| Income from Investment Operations | | |
| Net investment income (loss)B | .03 | .17 |
| Net realized and unrealized gain (loss) | .52 | .67 |
| Total from investment operations | .55 | .84 |
| Distributions from net investment income | – | (.15) |
| Distributions from net realized gain | (.32) | (.19) |
| Total distributions | (.32) | (.35)C |
| Net asset value, end of period | $12.37 | $12.14 |
| Total ReturnD,E | 4.57% | 7.18% |
| Ratios to Average Net AssetsF,G | | |
| Expenses before reductions | .64%H | .65%H,I |
| Expenses net of fee waivers, if any | .64%H | .65%H,I |
| Expenses net of all reductions | .64%H | .65%H,I |
| Net investment income (loss) | .44%H | 2.04%H |
| Supplemental Data | | |
| Net assets, end of period (000 omitted) | $7,287,972 | $7,475,339 |
| Portfolio turnover rateF | 23%H | 16%J |
A For the period July 20, 2017 (commencement of sale of shares) to March 31, 2018.
B Calculated based on average shares outstanding during the period.
C Total distributions of $.35 per share is comprised of distributions from net investment income of $.154 and distributions from net realized gain of $.194 per share.
D Total returns for periods of less than one year are not annualized.
E Total returns would have been lower if certain expenses had not been reduced during the applicable periods shown.
F Amounts do not include the activity of the Underlying Funds.
G Expense ratios reflect operating expenses of the class. Expenses before reductions do not reflect amounts reimbursed by the investment adviser or reductions from expense offset arrangements and do not represent the amount paid by the class during periods when reimbursements or reductions occur. Expense ratios before reductions for start-up periods may not be representative of longer-term operating periods. Expenses net of fee waivers reflect expenses after reimbursement by the investment adviser but prior to reductions from expense offset arrangements. Expenses net of all reductions represent the net expenses paid by the class but do not include expenses of the underlying funds in which the Fund invests.
H Annualized
I On certain classes, the size and fluctuation of net assets and expense amounts may cause ratios to differ from contractual rates.
J The portfolio turnover rate does not include the assets acquired in the merger.
See accompanying notes which are an integral part of the financial statements.
Fidelity Freedom 2050 Fund Class K6
| | Six months ended (Unaudited) September 30, | Years endedMarch 31, |
| | 2018 | 2018 A |
| Selected Per–Share Data | | |
| Net asset value, beginning of period | $12.15 | $11.40 |
| Income from Investment Operations | | |
| Net investment income (loss)B | .04 | .14 |
| Net realized and unrealized gain (loss) | .52 | .96 |
| Total from investment operations | .56 | 1.10 |
| Distributions from net investment income | – | (.16) |
| Distributions from net realized gain | (.32) | (.19) |
| Total distributions | (.32) | (.35) |
| Net asset value, end of period | $12.39 | $12.15 |
| Total ReturnC,D | 4.65% | 9.65% |
| Ratios to Average Net AssetsE,F | | |
| Expenses before reductions | .49%G | .50%G,H |
| Expenses net of fee waivers, if any | .49%G | .50%G,H |
| Expenses net of all reductions | .49%G | .50%G,H |
| Net investment income (loss) | .59%G | 1.42%G |
| Supplemental Data | | |
| Net assets, end of period (000 omitted) | $883,338 | $327,591 |
| Portfolio turnover rateE | 23%G | 16%I |
A For the period June 7, 2017 (commencement of sale of shares) to March 31, 2018.
B Calculated based on average shares outstanding during the period.
C Total returns for periods of less than one year are not annualized.
D Total returns would have been lower if certain expenses had not been reduced during the applicable periods shown.
E Amounts do not include the activity of the Underlying Funds.
F Expense ratios reflect operating expenses of the class. Expenses before reductions do not reflect amounts reimbursed by the investment adviser or reductions from expense offset arrangements and do not represent the amount paid by the class during periods when reimbursements or reductions occur. Expense ratios before reductions for start-up periods may not be representative of longer-term operating periods. Expenses net of fee waivers reflect expenses after reimbursement by the investment adviser but prior to reductions from expense offset arrangements. Expenses net of all reductions represent the net expenses paid by the class but do not include expenses of the underlying funds in which the Fund invests.
G Annualized
H On certain classes, the size and fluctuation of net assets and expense amounts may cause ratios to differ from contractual rates.
I The portfolio turnover rate does not include the assets acquired in the merger.
See accompanying notes which are an integral part of the financial statements.
Fidelity Freedom® 2055 Fund
Investment Summary (Unaudited)
The information in the following tables is based on the direct investments of the Fund.
Top Holdings as of September 30, 2018
| | % of fund's net assets |
| Fidelity Series Intrinsic Opportunities Fund | 10.0 |
| Fidelity Series International Growth Fund | 9.3 |
| Fidelity Series International Value Fund | 9.2 |
| Fidelity Series Large Cap Stock Fund | 9.2 |
| Fidelity Series Growth Company Fund | 8.7 |
| Fidelity Series Emerging Markets Opportunities Fund | 8.6 |
| Fidelity Series Stock Selector Large Cap Value Fund | 6.8 |
| Fidelity Series Value Discovery Fund | 4.8 |
| Fidelity Series Opportunistic Insights Fund | 4.6 |
| Fidelity Series Blue Chip Growth Fund | 4.3 |
| | 75.5 |
Asset Allocation (% of fund's net assets)
| Period end |
| | Domestic Equity Funds | 60.5% |
| | International Equity Funds | 30.7% |
| | Bond Funds | 6.8% |
| | Short-Term Funds | 2.0% |
| | Short-Term Investments | 0.1% |
| | Net Other Assets (Liabilities)* | (0.1)% |

* Net Other Assets (Liabilities) are not included in the pie chart
Domestic Equity Funds category includes Fidelity Series Commodity Strategy Fund which invests in commodity-related investments.
Fidelity Freedom® 2055 Fund
Schedule of Investments September 30, 2018 (Unaudited)
Showing Percentage of Net Assets
| U.S. Treasury Obligations - 0.1% | | | |
| | | Principal Amount | Value |
| U.S. Treasury Bills, yield at date of purchase 2.09% to 2.11% 11/29/18 to 12/6/18 (a) | | | |
| (Cost $3,706,510) | | 3,720,000 | 3,706,269 |
| | | Shares | Value |
|
| Domestic Equity Funds - 60.5% | | | |
| Fidelity Series All-Sector Equity Fund (b) | | 9,105,100 | $123,920,415 |
| Fidelity Series Blue Chip Growth Fund (b) | | 13,918,412 | 212,951,704 |
| Fidelity Series Commodity Strategy Fund (b) | | 20,839,020 | 104,195,101 |
| Fidelity Series Growth Company Fund (b) | | 21,286,614 | 430,202,477 |
| Fidelity Series Intrinsic Opportunities Fund (b) | | 26,849,368 | 492,148,917 |
| Fidelity Series Large Cap Stock Fund (b) | | 28,430,084 | 452,891,238 |
| Fidelity Series Large Cap Value Index Fund (b) | | 9,421,404 | 124,362,536 |
| Fidelity Series Opportunistic Insights Fund (b) | | 11,575,672 | 229,777,087 |
| Fidelity Series Small Cap Discovery Fund (b) | | 4,689,690 | 56,979,736 |
| Fidelity Series Small Cap Opportunities Fund (b) | | 12,651,242 | 185,846,750 |
| Fidelity Series Stock Selector Large Cap Value Fund (b) | | 25,485,771 | 336,921,888 |
| Fidelity Series Value Discovery Fund (b) | | 17,396,737 | 238,161,325 |
| TOTAL DOMESTIC EQUITY FUNDS | | | |
| (Cost $2,505,455,575) | | | 2,988,359,174 |
|
| International Equity Funds - 30.7% | | | |
| Fidelity Series Canada Fund (b) | | 4,096,017 | 44,277,940 |
| Fidelity Series Emerging Markets Fund (b) | | 2,889,271 | 27,997,039 |
| Fidelity Series Emerging Markets Opportunities Fund (b) | | 22,099,529 | 424,089,956 |
| Fidelity Series International Growth Fund(b) | | 27,919,825 | 457,885,133 |
| Fidelity Series International Small Cap Fund (b) | | 6,045,264 | 108,210,220 |
| Fidelity Series International Value Fund (b) | | 43,248,584 | 454,975,106 |
| TOTAL INTERNATIONAL EQUITY FUNDS | | | |
| (Cost $1,361,572,493) | | | 1,517,435,394 |
|
| Bond Funds - 6.8% | | | |
| Fidelity Series Emerging Markets Debt Fund (b) | | 2,990,132 | 28,495,959 |
| Fidelity Series Floating Rate High Income Fund (b) | | 1,171,446 | 11,152,165 |
| Fidelity Series High Income Fund (b) | | 6,716,711 | 64,547,595 |
| Fidelity Series Inflation-Protected Bond Index Fund (b) | | 1,533,598 | 14,891,240 |
| Fidelity Series International Credit Fund (b) | | 165,944 | 1,631,234 |
| Fidelity Series Investment Grade Bond Fund (b) | | 2,012,097 | 21,911,734 |
| Fidelity Series Long-Term Treasury Bond Index Fund (b) | | 20,791,298 | 171,320,295 |
| Fidelity Series Real Estate Income Fund (b) | | 1,993,634 | 21,491,371 |
| TOTAL BOND FUNDS | | | |
| (Cost $344,257,444) | | | 335,441,593 |
|
| Short-Term Funds - 2.0% | | | |
| Fidelity Cash Central Fund, 2.11% (c) | | 6,950,741 | 6,952,131 |
| Fidelity Series Government Money Market Fund 2.12% (b)(d) | | 73,977,592 | 73,977,592 |
| Fidelity Series Short-Term Credit Fund (b) | | 1,592,464 | 15,701,695 |
| TOTAL SHORT-TERM FUNDS | | | |
| (Cost $96,762,701) | | | 96,631,418 |
| TOTAL INVESTMENT IN SECURITIES - 100.1% | | | |
| (Cost $4,311,754,723) | | | 4,941,573,848 |
| NET OTHER ASSETS (LIABILITIES) - (0.1)% | | | (2,809,177) |
| NET ASSETS - 100% | | | $4,938,764,671 |
| Futures Contracts | | | | | |
| | Number of contracts | Expiration Date | Notional Amount | Value | Unrealized Appreciation/(Depreciation) |
| Purchased | | | | | |
| Equity Index Contracts | | | | | |
| CME E-mini S&P 500 Index Contracts (United States) | 190 | Dec. 2018 | $27,730,500 | $5,379 | $5,379 |
| ICE E-mini MSCI Emerging Markets Index Contracts (United States) | 294 | Dec. 2018 | 15,430,590 | 303,896 | 303,896 |
|
| TOTAL PURCHASED | | | | | 309,275 |
|
| Sold | | | | | |
| Equity Index Contracts | | | | | |
| ICE E-mini MSCI EAFE Index Contracts (United States) | 130 | Dec. 2018 | 12,840,750 | (24,737) | (24,737) |
| TOTAL FUTURES CONTRACTS | | | | | $284,538 |
The notional amount of futures purchased as a percentage of Net Assets is 0.9%
The notional amount of futures sold as a percentage of Net Assets is 0.3%
Legend
(a) Security or a portion of the security was pledged to cover margin requirements for futures contracts. At period end, the value of securities pledged amounted to $1,012,037.
(b) Affiliated Fund
(c) Affiliated fund that is generally available only to investment companies and other accounts managed by Fidelity Investments. The rate quoted is the annualized seven-day yield of the fund at period end. A complete unaudited listing of the fund's holdings as of its most recent quarter end is available upon request. In addition, each Fidelity Central Fund's financial statements are available on the SEC's website or upon request.
(d) The rate quoted is the annualized seven-day yield of the fund at period end.
Affiliated Central Funds
Information regarding fiscal year to date income earned by the Fund from investments in Fidelity Central Funds is as follows:
| Fund | Income earned |
| Fidelity Cash Central Fund | $20,640 |
| Total | $20,640 |
Amounts in the income column in the above table include any capital gain distributions from underlying funds, which are presented in the corresponding line-item in the Statement of Operations if applicable.
Affiliated Underlying Funds
Fiscal year to date information regarding the Fund's investments in affiliated Underlying Funds, excluding any Money Market Central Funds, is presented below. Exchanges between classes of the same affiliated Underlying Funds may occur.
| Affiliate | Value, beginning of period | Purchases | Sales Proceeds | Dividend Income | Realized Gain (loss) | Change in Unrealized appreciation (depreciation) | Value, end of period |
| Fidelity Series 100 Index Fund | $86,342,541 | $40,265 | $92,405,409 | $-- | $25,419,336 | $(19,396,733) | $-- |
| Fidelity Series All-Sector Equity Fund | 167,584,790 | 19,623,829 | 83,103,942 | -- | 1,590,789 | 18,224,949 | 123,920,415 |
| Fidelity Series Blue Chip Growth Fund | 173,114,503 | 40,669,813 | 13,494,103 | 19,514,468 | 325,897 | 12,335,594 | 212,951,704 |
| Fidelity Series Canada Fund | 38,606,833 | 4,913,985 | 1,709,856 | -- | 5,757 | 2,461,221 | 44,277,940 |
| Fidelity Series Commodity Strategy Fund | 91,934,990 | 24,165,924 | 3,631,640 | 6,162,495 | (725,531) | (7,548,642) | 104,195,101 |
| Fidelity Series Emerging Markets Debt Fund | 27,209,763 | 3,986,873 | 1,183,395 | 835,394 | (78,112) | (1,439,170) | 28,495,959 |
| Fidelity Series Emerging Markets Fund | -- | 27,521,583 | -- | -- | -- | 475,456 | 27,997,039 |
| Fidelity Series Emerging Markets | 400,892,549 | 91,268,462 | 15,514,228 | -- | (555,073) | (52,001,754) | 424,089,956 |
| Fidelity Series Floating Rate High Income | 10,002,475 | 1,595,128 | 457,856 | 282,755 | (18,646) | 31,064 | 11,152,165 |
| Fidelity Series Government Money Market | 70,121,042 | 79,169,095 | 75,312,545 | 602,092 | -- | -- | 73,977,592 |
| Fidelity Series Growth Company Fund | 351,980,935 | 42,863,477 | 19,396,307 | -- | (194,061) | 54,948,433 | 430,202,477 |
| Fidelity Series High Income Fund | 60,175,196 | 8,543,861 | 4,685,695 | 1,807,339 | (48,275) | 562,508 | 64,547,595 |
| Fidelity Series Inflation-Protected Bond | 35,675,631 | 6,468,769 | 27,409,696 | 54,689 | (391,567) | 548,103 | 14,891,240 |
| Fidelity Series International Credit Fund | 1,668,964 | 21,592 | 42,533 | 20,568 | (554) | (16,235) | 1,631,234 |
| Fidelity Series International Growth Fund | 388,374,374 | 78,177,947 | 15,142,246 | -- | 14,193 | 6,460,865 | 457,885,133 |
| Fidelity Series International Small Cap Fund | 96,898,872 | 16,002,322 | 760,708 | -- | (23,665) | (3,906,601) | 108,210,220 |
| Fidelity Series International Value Fund | 393,238,509 | 65,652,903 | 3,359,381 | -- | (70,422) | (486,503) | 454,975,106 |
| Fidelity Series Intrinsic Opportunities Fund | 427,000,743 | 76,843,928 | 17,728,133 | 21,499,702 | (225,687) | 6,258,066 | 492,148,917 |
| Fidelity Series Investment Grade Bond Fund | 20,925,164 | 3,446,720 | 2,211,247 | 299,154 | (32,344) | (216,559) | 21,911,734 |
| Fidelity Series Large Cap Stock Fund | 379,289,030 | 73,469,947 | 18,701,835 | 25,555,321 | 131,364 | 18,702,732 | 452,891,238 |
| Fidelity Series Large Cap Value Index Fund | 107,932,581 | 13,647,427 | 5,184,343 | -- | (13,108) | 7,979,979 | 124,362,536 |
| Fidelity Series Long-Term Treasury Bond | 98,801,847 | 112,745,472 | 34,624,345 | 2,093,100 | (1,147,844) | (4,454,835) | 171,320,295 |
| Fidelity Series Opportunistic Insights Fund | 189,694,018 | 23,880,844 | 9,477,035 | -- | (22,574) | 25,701,834 | 229,777,087 |
| Fidelity Series Real Estate Equity Fund | 34,294,713 | 463,365 | 36,252,452 | 286,222 | (1,538,115) | 3,032,489 | -- |
| Fidelity Series Real Estate Income Fund | 18,928,290 | 3,346,298 | 886,958 | 878,372 | (14,904) | 118,645 | 21,491,371 |
| Fidelity Series Short-Term Credit Fund | 13,333,440 | 3,001,184 | 632,860 | 162,173 | (7,214) | 7,145 | 15,701,695 |
| Fidelity Series Small Cap Discovery Fund | 50,681,737 | 9,590,504 | 2,456,218 | 3,177,393 | (108,252) | (728,035) | 56,979,736 |
| Fidelity Series Small Cap Opportunities Fund | 156,598,303 | 33,707,367 | 8,734,827 | 14,178,837 | 48,666 | 4,227,241 | 185,846,750 |
| Fidelity Series Stock Selector Large Cap | 295,167,577 | 36,472,682 | 16,018,928 | -- | (352,721) | 21,653,278 | 336,921,888 |
| Fidelity Series Value Discovery Fund | 209,366,384 | 26,003,717 | 9,998,819 | -- | (168,652) | 12,958,695 | 238,161,325 |
| | $4,395,835,794 | $927,305,283 | $520,517,540 | $97,410,074 | $21,798,681 | $106,493,230 | $4,930,915,448 |
Amounts in the income column in the above table include any capital gain distributions from underlying funds, which are presented in the corresponding line-item in the Statement of Operations if applicable.
Investment Valuation
The following is a summary of the inputs used, as of September 30, 2018, involving the Fund's assets and liabilities carried at fair value. The inputs or methodology used for valuing securities may not be an indication of the risk associated with investing in those securities. For more information on valuation inputs, and their aggregation into the levels used below, please refer to the Investment Valuation section in the accompanying Notes to Financial Statements.
| | Valuation Inputs at Reporting Date: |
| Description | Total | Level 1 | Level 2 | Level 3 |
| Investments in Securities: | | | | |
| Other Short-Term Investments | $3,706,269 | $-- | $3,706,269 | $-- |
| Domestic Equity Funds | 2,988,359,174 | 2,988,359,174 | -- | -- |
| International Equity Funds | 1,517,435,394 | 1,517,435,394 | -- | -- |
| Bond Funds | 335,441,593 | 335,441,593 | -- | -- |
| Short-Term Funds | 96,631,418 | 96,631,418 | -- | -- |
| Total Investments in Securities: | $4,941,573,848 | $4,937,867,579 | $3,706,269 | $-- |
| Derivative Instruments: | | | | |
| Assets | | | | |
| Futures Contracts | $309,275 | $309,275 | $-- | $-- |
| Total Assets | $309,275 | $309,275 | $-- | $-- |
| Liabilities | | | | |
| Futures Contracts | $(24,737) | $(24,737) | $-- | $-- |
| Total Liabilities | $(24,737) | $(24,737) | $-- | $-- |
| Total Derivative Instruments: | $284,538 | $284,538 | $-- | $-- |
Value of Derivative Instruments
The following table is a summary of the Fund's value of derivative instruments by primary risk exposure as of September 30, 2018. For additional information on derivative instruments, please refer to the Derivative Instruments section in the accompanying Notes to Financial Statements.
| Primary Risk Exposure / Derivative Type | Value |
| | Asset | Liability |
| Equity Risk | | |
| Futures Contracts(a) | $309,275 | $(24,737) |
| Total Equity Risk | 309,275 | (24,737) |
| Total Value of Derivatives | $309,275 | $(24,737) |
(a) Reflects gross cumulative appreciation (depreciation) on futures contracts as presented in the Schedule of Investments. In the Statement of Assets and Liabilities, the period end daily variation margin is included in receivable or payable for daily variation margin on futures contracts, and the net cumulative appreciation (depreciation) is included in net unrealized appreciation (depreciation).
See accompanying notes which are an integral part of the financial statements.
Fidelity Freedom® 2055 Fund
Financial Statements
Statement of Assets and Liabilities
| | | September 30, 2018 (Unaudited) |
| Assets | | |
Investment in securities, at value — See accompanying schedule:
Unaffiliated issuers (cost $3,706,510) | $3,706,269 | |
| Fidelity Central Funds (cost $6,952,131) | 6,952,131 | |
| Other affiliated issuers (cost $4,301,096,082) | 4,930,915,448 | |
| Total Investment in Securities (cost $4,311,754,723) | | $4,941,573,848 |
| Receivable for investments sold | | 54,262,972 |
| Receivable for fund shares sold | | 174,703,171 |
| Distributions receivable from Fidelity Central Funds | | 10,704 |
| Total assets | | 5,170,550,695 |
| Liabilities | | |
| Payable for investments purchased | $63,768,967 | |
| Payable for fund shares redeemed | 165,180,564 | |
| Accrued management fee | 2,691,672 | |
| Payable for daily variation margin on futures contracts | 144,821 | |
| Total liabilities | | 231,786,024 |
| Net Assets | | $4,938,764,671 |
| Net Assets consist of: | | |
| Paid in capital | | $4,220,697,866 |
| Undistributed net investment income | | 8,115,432 |
| Accumulated undistributed net realized gain (loss) on investments | | 79,847,710 |
| Net unrealized appreciation (depreciation) on investments | | 630,103,663 |
| Net Assets | | $4,938,764,671 |
| Fidelity Freedom 2055 Fund: | | |
| Net Asset Value, offering price and redemption price per share ($1,428,045,930 ÷ 102,125,383 shares) | | $13.98 |
| Class K: | | |
| Net Asset Value, offering price and redemption price per share ($3,114,215,499 ÷ 222,803,681 shares) | | $13.98 |
| Class K6: | | |
| Net Asset Value, offering price and redemption price per share ($396,503,242 ÷ 28,326,689 shares) | | $14.00 |
See accompanying notes which are an integral part of the financial statements.
Statement of Operations
| | | Six months ended September 30, 2018 (Unaudited) |
| Investment Income | | |
| Dividends: | | |
| Affiliated issuers | | $25,605,821 |
| Interest | | 18,667 |
| Income from Fidelity Central Funds | | 20,640 |
| Total income | | 25,645,128 |
| Expenses | | |
| Management fee | $15,687,234 | |
| Independent trustees' fees and expenses | 11,101 | |
| Total expenses before reductions | 15,698,335 | |
| Expense reductions | (6) | |
| Total expenses after reductions | | 15,698,329 |
| Net investment income (loss) | | 9,946,799 |
| Realized and Unrealized Gain (Loss) | | |
| Net realized gain (loss) on: | | |
| Investment securities: | | |
| Fidelity Central Funds | 12 | |
| Other affiliated issuers | 21,798,681 | |
| Futures contracts | (2,541,532) | |
| Capital gain distributions from underlying funds: | | |
| Affiliated issuers | 71,804,253 | |
| Total net realized gain (loss) | | 91,061,414 |
| Change in net unrealized appreciation (depreciation) on: | | |
| Investment securities: | | |
| Unaffiliated issuers | (241) | |
| Affiliated issuers | 106,493,230 | |
| Futures contracts | 284,538 | |
| Total change in net unrealized appreciation (depreciation) | | 106,777,527 |
| Net gain (loss) | | 197,838,941 |
| Net increase (decrease) in net assets resulting from operations | | $207,785,740 |
See accompanying notes which are an integral part of the financial statements.
Statement of Changes in Net Assets
| | Six months ended September 30, 2018 (Unaudited) | Year ended March 31, 2018 |
| Increase (Decrease) in Net Assets | | |
| Operations | | |
| Net investment income (loss) | $9,946,799 | $44,165,758 |
| Net realized gain (loss) | 91,061,414 | 169,529,579 |
| Change in net unrealized appreciation (depreciation) | 106,777,527 | 107,945,915 |
| Net increase (decrease) in net assets resulting from operations | 207,785,740 | 321,641,252 |
| Distributions to shareholders from net investment income | – | (48,627,128) |
| Distributions to shareholders from net realized gain | (108,392,501) | (70,153,488) |
| Total distributions | (108,392,501) | (118,780,616) |
| Share transactions - net increase (decrease) | 445,979,420 | 3,268,247,071 |
| Total increase (decrease) in net assets | 545,372,659 | 3,471,107,707 |
| Net Assets | | |
| Beginning of period | 4,393,392,012 | 922,284,305 |
| End of period | $4,938,764,671 | $4,393,392,012 |
| Other Information | | |
| Undistributed net investment income end of period | $8,115,432 | $– |
| Distributions in excess of net investment income end of period | $– | $(1,831,367) |
See accompanying notes which are an integral part of the financial statements.
Financial Highlights
Fidelity Freedom 2055 Fund
| | Six months ended (Unaudited) September 30, | Years endedMarch 31, | | | | |
| | 2018 | 2018 | 2017 | 2016 | 2015 | 2014 |
| Selected Per–Share Data | | | | | | |
| Net asset value, beginning of period | $13.70 | $12.41 | $11.08 | $12.06 | $11.73 | $10.56 |
| Income from Investment Operations | | | | | | |
| Net investment income (loss)A | .02 | .14 | .17 | .17 | .19 | .16 |
| Net realized and unrealized gain (loss) | .59 | 1.64 | 1.57 | (.59) | .72 | 1.51 |
| Total from investment operations | .61 | 1.78 | 1.74 | (.42) | .91 | 1.67 |
| Distributions from net investment income | – | (.15) | (.16) | (.17) | (.18) | (.14) |
| Distributions from net realized gain | (.33) | (.34) | (.25) | (.39) | (.39) | (.36) |
| Total distributions | (.33) | (.49) | (.41) | (.56) | (.58)B | (.50) |
| Net asset value, end of period | $13.98 | $13.70 | $12.41 | $11.08 | $12.06 | $11.73 |
| Total ReturnC,D | 4.48% | 14.49% | 16.17% | (3.69)% | 7.98% | 16.00% |
| Ratios to Average Net AssetsE,F | | | | | | |
| Expenses before reductions | .75%G | .64%H | - %I | - %I | - %I | - %I |
| Expenses net of fee waivers, if any | .75%G | .64%H | -% | -% | -% | -% |
| Expenses net of all reductions | .75%G | .64%H | -% | -% | -% | -% |
| Net investment income (loss) | .35%G | 1.06% | 1.46% | 1.51% | 1.64% | 1.40% |
| Supplemental Data | | | | | | |
| Net assets, end of period (000 omitted) | $1,428,046 | $1,265,311 | $922,284 | $649,621 | $527,231 | $350,647 |
| Portfolio turnover rateE | 22%G | 15%J | 18% | 20% | 21% | 47% |
A Calculated based on average shares outstanding during the period.
B Total distributions of $.58 per share is comprised of distributions from net investment income of $.184 and distributions from net realized gain of $.394 per share.
C Total returns for periods of less than one year are not annualized.
D Total returns would have been lower if certain expenses had not been reduced during the applicable periods shown.
E Amounts do not include the activity of the Underlying Funds.
F Expense ratios reflect operating expenses of the class. Expenses before reductions do not reflect amounts reimbursed by the investment adviser or reductions from expense offset arrangements and do not represent the amount paid by the class during periods when reimbursements or reductions occur. Expenses net of fee waivers reflect expenses after reimbursement by the investment adviser but prior to reductions from expense offset arrangements. Expenses net of all reductions represent the net expenses paid by the class but do not include expenses of the underlying funds in which the Fund invests.
G Annualized
H On certain classes, the size and fluctuation of net assets and expense amounts may cause ratios to differ from contractual rates.
I Amount represents less than .005%.
J The portfolio turnover rate does not include the assets acquired in the merger.
See accompanying notes which are an integral part of the financial statements.
Fidelity Freedom 2055 Fund Class K
| | Six months ended (Unaudited) September 30, | Years endedMarch 31, |
| | 2018 | 2018 A |
| Selected Per–Share Data | | |
| Net asset value, beginning of period | $13.69 | $13.11 |
| Income from Investment Operations | | |
| Net investment income (loss)B | .03 | .19 |
| Net realized and unrealized gain (loss) | .59 | .76 |
| Total from investment operations | .62 | .95 |
| Distributions from net investment income | – | (.17) |
| Distributions from net realized gain | (.33) | (.20) |
| Total distributions | (.33) | (.37) |
| Net asset value, end of period | $13.98 | $13.69 |
| Total ReturnC,D | 4.56% | 7.26% |
| Ratios to Average Net AssetsE,F | | |
| Expenses before reductions | .64%G | .65%G,H |
| Expenses net of fee waivers, if any | .64%G | .65%G,H |
| Expenses net of all reductions | .64%G | .65%G,H |
| Net investment income (loss) | .45%G | 2.01%G |
| Supplemental Data | | |
| Net assets, end of period (000 omitted) | $3,114,215 | $2,992,599 |
| Portfolio turnover rateE | 22%G | 15%I |
A For the period July 20, 2017 (commencement of sale of shares) to March 31, 2018.
B Calculated based on average shares outstanding during the period.
C Total returns for periods of less than one year are not annualized.
D Total returns would have been lower if certain expenses had not been reduced during the applicable periods shown.
E Amounts do not include the activity of the Underlying Funds.
F Expense ratios reflect operating expenses of the class. Expenses before reductions do not reflect amounts reimbursed by the investment adviser or reductions from expense offset arrangements and do not represent the amount paid by the class during periods when reimbursements or reductions occur. Expense ratios before reductions for start-up periods may not be representative of longer-term operating periods. Expenses net of fee waivers reflect expenses after reimbursement by the investment adviser but prior to reductions from expense offset arrangements. Expenses net of all reductions represent the net expenses paid by the class but do not include expenses of the underlying funds in which the Fund invests.
G Annualized
H On certain classes, the size and fluctuation of net assets and expense amounts may cause ratios to differ from contractual rates.
I The portfolio turnover rate does not include the assets acquired in the merger.
See accompanying notes which are an integral part of the financial statements.
Fidelity Freedom 2055 Fund Class K6
| | Six months ended (Unaudited) September 30, | Years endedMarch 31, |
| | 2018 | 2018 A |
| Selected Per–Share Data | | |
| Net asset value, beginning of period | $13.70 | $12.83 |
| Income from Investment Operations | | |
| Net investment income (loss)B | .04 | .16 |
| Net realized and unrealized gain (loss) | .59 | 1.09 |
| Total from investment operations | .63 | 1.25 |
| Distributions from net investment income | – | (.17) |
| Distributions from net realized gain | (.33) | (.20) |
| Total distributions | (.33) | (.38)C |
| Net asset value, end of period | $14.00 | $13.70 |
| Total ReturnD,E | 4.63% | 9.70% |
| Ratios to Average Net AssetsF,G | | |
| Expenses before reductions | .49%H | .50%H,I |
| Expenses net of fee waivers, if any | .49%H | .50%H,I |
| Expenses net of all reductions | .49%H | .50%H,I |
| Net investment income (loss) | .60%H | 1.43%H |
| Supplemental Data | | |
| Net assets, end of period (000 omitted) | $396,503 | $135,481 |
| Portfolio turnover rateF | 22%H | 15%J |
A For the period June 7, 2017 (commencement of sale of shares) to March 31, 2018.
B Calculated based on average shares outstanding during the period.
C Total distributions of $.38 per share is comprised of distributions from net investment income of $.174 and distributions from net realized gain of $.202 per share.
D Total returns for periods of less than one year are not annualized.
E Total returns would have been lower if certain expenses had not been reduced during the applicable periods shown.
F Amounts do not include the activity of the Underlying Funds.
G Expense ratios reflect operating expenses of the class. Expenses before reductions do not reflect amounts reimbursed by the investment adviser or reductions from expense offset arrangements and do not represent the amount paid by the class during periods when reimbursements or reductions occur. Expense ratios before reductions for start-up periods may not be representative of longer-term operating periods. Expenses net of fee waivers reflect expenses after reimbursement by the investment adviser but prior to reductions from expense offset arrangements. Expenses net of all reductions represent the net expenses paid by the class but do not include expenses of the underlying funds in which the Fund invests.
H Annualized
I On certain classes, the size and fluctuation of net assets and expense amounts may cause ratios to differ from contractual rates.
J The portfolio turnover rate does not include the assets acquired in the merger.
See accompanying notes which are an integral part of the financial statements.
Fidelity Freedom® 2060 Fund
Investment Summary (Unaudited)
The information in the following tables is based on the direct investments of the Fund.
Top Holdings as of September 30, 2018
| | % of fund's net assets |
| Fidelity Series Intrinsic Opportunities Fund | 10.0 |
| Fidelity Series International Growth Fund | 9.3 |
| Fidelity Series International Value Fund | 9.2 |
| Fidelity Series Large Cap Stock Fund | 9.2 |
| Fidelity Series Growth Company Fund | 8.7 |
| Fidelity Series Emerging Markets Opportunities Fund | 8.6 |
| Fidelity Series Stock Selector Large Cap Value Fund | 6.9 |
| Fidelity Series Value Discovery Fund | 4.8 |
| Fidelity Series Opportunistic Insights Fund | 4.6 |
| Fidelity Series Blue Chip Growth Fund | 4.3 |
| | 75.6 |
Asset Allocation (% of fund's net assets)
| Period end |
| | Domestic Equity Funds | 60.5% |
| | International Equity Funds | 30.7% |
| | Bond Funds | 6.8% |
| | Short-Term Funds | 2.0% |
| | Short-Term Investments | 0.1% |
| | Net Other Assets (Liabilities)* | (0.1)% |

* Net Other Assets (Liabilities) are not included in the pie chart
Domestic Equity Funds category includes Fidelity Series Commodity Strategy Fund which invests in commodity-related investments.
Fidelity Freedom® 2060 Fund
Schedule of Investments September 30, 2018 (Unaudited)
Showing Percentage of Net Assets
| U.S. Treasury Obligations - 0.1% | | | |
| | | Principal Amount | Value |
| U.S. Treasury Bills, yield at date of purchase 2.07% to 2.11% 11/29/18 to 12/6/18 (a) | | | |
| (Cost $797,085) | | 800,000 | 797,034 |
| | | Shares | Value |
|
| Domestic Equity Funds - 60.5% | | | |
| Fidelity Series All-Sector Equity Fund (b) | | 1,838,644 | $25,023,944 |
| Fidelity Series Blue Chip Growth Fund (b) | | 2,975,684 | 45,527,971 |
| Fidelity Series Commodity Strategy Fund (b) | | 4,443,106 | 22,215,528 |
| Fidelity Series Growth Company Fund (b) | | 4,550,993 | 91,975,570 |
| Fidelity Series Intrinsic Opportunities Fund (b) | | 5,755,511 | 105,498,519 |
| Fidelity Series Large Cap Stock Fund (b) | | 6,104,939 | 97,251,673 |
| Fidelity Series Large Cap Value Index Fund (b) | | 2,020,457 | 26,670,027 |
| Fidelity Series Opportunistic Insights Fund (b) | | 2,477,154 | 49,171,512 |
| Fidelity Series Small Cap Discovery Fund (b) | | 1,011,206 | 12,286,156 |
| Fidelity Series Small Cap Opportunities Fund (b) | | 2,710,144 | 39,812,021 |
| Fidelity Series Stock Selector Large Cap Value Fund (b) | | 5,477,758 | 72,415,966 |
| Fidelity Series Value Discovery Fund (b) | | 3,730,125 | 51,065,405 |
| TOTAL DOMESTIC EQUITY FUNDS | | | |
| (Cost $576,230,099) | | | 638,914,292 |
|
| International Equity Funds - 30.7% | | | |
| Fidelity Series Canada Fund (b) | | 877,904 | 9,490,147 |
| Fidelity Series Emerging Markets Fund (b) | | 606,572 | 5,877,687 |
| Fidelity Series Emerging Markets Opportunities Fund (b) | | 4,731,379 | 90,795,162 |
| Fidelity Series International Growth Fund (b) | | 5,970,220 | 97,911,608 |
| Fidelity Series International Small Cap Fund (b) | | 1,293,735 | 23,157,854 |
| Fidelity Series International Value Fund (b) | | 9,248,206 | 97,291,122 |
| TOTAL INTERNATIONAL EQUITY FUNDS | | | |
| (Cost $305,822,397) | | | 324,523,580 |
|
| Bond Funds - 6.8% | | | |
| Fidelity Series Emerging Markets Debt Fund (b) | | 630,546 | 6,009,107 |
| Fidelity Series Floating Rate High Income Fund (b) | | 256,242 | 2,439,422 |
| Fidelity Series High Income Fund (b) | | 1,440,033 | 13,838,718 |
| Fidelity Series Inflation-Protected Bond Index Fund (b) | | 327,898 | 3,183,891 |
| Fidelity Series International Credit Fund (b) | | 24,341 | 239,271 |
| Fidelity Series Investment Grade Bond Fund (b) | | 430,423 | 4,687,309 |
| Fidelity Series Long-Term Treasury Bond Index Fund (b) | | 4,442,787 | 36,608,565 |
| Fidelity Series Real Estate Income Fund (b) | | 435,539 | 4,695,111 |
| TOTAL BOND FUNDS | | | |
| (Cost $73,129,110) | | | 71,701,394 |
|
| Short-Term Funds - 2.0% | | | |
| Fidelity Cash Central Fund, 2.11% (c) | | 1,236,628 | 1,236,876 |
| Fidelity Series Government Money Market Fund 2.12% (b)(d) | | 15,937,406 | 15,937,406 |
| Fidelity Series Short-Term Credit Fund (b) | | 344,943 | 3,401,134 |
| TOTAL SHORT-TERM FUNDS | | | |
| (Cost $20,599,005) | | | 20,575,416 |
| TOTAL INVESTMENT IN SECURITIES - 100.1% | | | |
| (Cost $976,577,696) | | | 1,056,511,716 |
| NET OTHER ASSETS (LIABILITIES) - (0.1)% | | | (551,752) |
| NET ASSETS - 100% | | | $1,055,959,964 |
| Futures Contracts | | | | | |
| | Number of contracts | Expiration Date | Notional Amount | Value | Unrealized Appreciation/(Depreciation) |
| Purchased | | | | | |
| Equity Index Contracts | | | | | |
| CME E-mini S&P 500 Index Contracts (United States) | 40 | Dec. 2018 | $5,838,000 | $1,132 | $1,132 |
| ICE E-mini MSCI Emerging Markets Index Contracts (United States) | 63 | Dec. 2018 | 3,306,555 | 65,214 | 65,214 |
|
| TOTAL PURCHASED | | | | | 66,346 |
|
| Sold | | | | | |
| Equity Index Contracts | | | | | |
| ICE E-mini MSCI EAFE Index Contracts (United States) | 28 | Dec. 2018 | 2,765,700 | (4,509) | (4,509) |
| TOTAL FUTURES CONTRACTS | | | | | $61,837 |
The notional amount of futures purchased as a percentage of Net Assets is 0.9%
The notional amount of futures sold as a percentage of Net Assets is 0.3%
Legend
(a) Security or a portion of the security was pledged to cover margin requirements for futures contracts. At period end, the value of securities pledged amounted to $239,064.
(b) Affiliated Fund
(c) Affiliated fund that is generally available only to investment companies and other accounts managed by Fidelity Investments. The rate quoted is the annualized seven-day yield of the fund at period end. A complete unaudited listing of the fund's holdings as of its most recent quarter end is available upon request. In addition, each Fidelity Central Fund's financial statements are available on the SEC's website or upon request.
(d) The rate quoted is the annualized seven-day yield of the fund at period end.
Affiliated Central Funds
Information regarding fiscal year to date income earned by the Fund from investments in Fidelity Central Funds is as follows:
| Fund | Income earned |
| Fidelity Cash Central Fund | $3,858 |
| Total | $3,858 |
Amounts in the income column in the above table include any capital gain distributions from underlying funds, which are presented in the corresponding line-item in the Statement of Operations if applicable.
Affiliated Underlying Funds
Fiscal year to date information regarding the Fund's investments in affiliated Underlying Funds, excluding any Money Market Central Funds, is presented below. Exchanges between classes of the same affiliated Underlying Funds may occur.
| Affiliate | Value, beginning of period | Purchases | Sales Proceeds | Dividend Income | Realized Gain (loss) | Change in Unrealized appreciation (depreciation) | Value, end of period |
| Fidelity Series 100 Index Fund | $15,904,680 | $26,022 | $17,014,627 | $-- | $2,869,723 | $(1,785,798) | $-- |
| Fidelity Series All-Sector Equity Fund | 31,253,568 | 8,281,207 | 18,450,077 | -- | 331,215 | 3,608,031 | 25,023,944 |
| Fidelity Series Blue Chip Growth Fund | 32,253,565 | 13,299,443 | 2,291,558 | 4,121,215 | (27,941) | 2,294,462 | 45,527,971 |
| Fidelity Series Canada Fund | 7,202,539 | 2,080,748 | 271,469 | -- | (3,918) | 482,247 | 9,490,147 |
| Fidelity Series Commodity Strategy Fund | 17,145,686 | 7,426,851 | 641,267 | 1,298,303 | (15,376) | (1,700,366) | 22,215,528 |
| Fidelity Series Emerging Markets Debt Fund | 4,840,852 | 1,635,292 | 183,184 | 163,432 | (13,354) | (270,499) | 6,009,107 |
| Fidelity Series Emerging Markets Fund | -- | 5,783,206 | -- | -- | -- | 94,481 | 5,877,687 |
| Fidelity Series Emerging Markets Opportunities Fund | 74,428,681 | 29,507,460 | 2,800,586 | -- | (171,091) | (10,169,302) | 90,795,162 |
| Fidelity Series Floating Rate High Income Fund | 1,890,315 | 620,513 | 74,436 | 57,613 | (915) | 3,945 | 2,439,422 |
| Fidelity Series Government Money Market Fund 2.12% | 13,009,017 | 18,108,826 | 15,180,437 | 118,221 | -- | -- | 15,937,406 |
| Fidelity Series Growth Company Fund | 65,444,549 | 18,545,105 | 2,958,205 | -- | (69,744) | 11,013,865 | 91,975,570 |
| Fidelity Series High Income Fund | 11,127,742 | 3,246,886 | 640,430 | 360,558 | (6,771) | 111,291 | 13,838,718 |
| Fidelity Series Inflation-Protected Bond Index Fund | 6,768,528 | 2,198,589 | 5,813,413 | 10,958 | (73,455) | 103,642 | 3,183,891 |
| Fidelity Series International Credit Fund | 244,476 | 3,750 | 6,496 | 3,013 | (83) | (2,376) | 239,271 |
| Fidelity Series International Growth Fund | 72,306,514 | 26,958,054 | 2,671,371 | -- | (269) | 1,318,680 | 97,911,608 |
| Fidelity Series International Small Cap Fund | 18,039,162 | 6,212,841 | 324,152 | -- | (6,710) | (763,287) | 23,157,854 |
| Fidelity Series International Value Fund | 73,255,562 | 24,797,563 | 743,071 | -- | (38,882) | 19,950 | 97,291,122 |
| Fidelity Series Intrinsic Opportunities Fund | 79,157,527 | 27,884,606 | 2,480,933 | 4,550,343 | (51,985) | 989,304 | 105,498,519 |
| Fidelity Series Investment Grade Bond Fund | 3,875,761 | 1,226,939 | 366,110 | 59,786 | (5,123) | (44,158) | 4,687,309 |
| Fidelity Series Large Cap Stock Fund | 70,836,746 | 25,776,696 | 2,991,297 | 5,233,170 | (40,706) | 3,670,234 | 97,251,673 |
| Fidelity Series Large Cap Value Index Fund | 20,224,908 | 5,727,431 | 880,618 | -- | (14,018) | 1,612,324 | 26,670,027 |
| Fidelity Series Long-Term Treasury Bond Index Fund | 18,521,138 | 24,874,281 | 5,632,143 | 417,397 | (191,191) | (963,520) | 36,608,565 |
| Fidelity Series Opportunistic Insights Fund | 35,335,440 | 10,245,532 | 1,506,699 | -- | (25,768) | 5,123,007 | 49,171,512 |
| Fidelity Series Real Estate Equity Fund | 6,272,892 | 370,736 | 6,935,358 | 55,732 | (243,095) | 534,825 | -- |
| Fidelity Series Real Estate Income Fund | 3,580,706 | 1,242,001 | 142,212 | 183,543 | (3,786) | 18,402 | 4,695,111 |
| Fidelity Series Short-Term Credit Fund | 2,622,315 | 910,408 | 131,568 | 34,374 | (1,629) | 1,608 | 3,401,134 |
| Fidelity Series Small Cap Discovery Fund | 9,487,528 | 3,377,568 | 393,631 | 626,810 | (21,529) | (163,780) | 12,286,156 |
| Fidelity Series Small Cap Opportunities Fund | 29,169,642 | 11,379,312 | 1,357,623 | 3,000,140 | (8,998) | 629,688 | 39,812,021 |
| Fidelity Series Stock Selector Large Cap Value Fund | 55,114,043 | 15,634,527 | 2,594,313 | -- | (85,780) | 4,347,489 | 72,415,966 |
| Fidelity Series Value Discovery Fund | 39,075,165 | 11,108,650 | 1,659,297 | -- | (39,722) | 2,580,609 | 51,065,405 |
| | $818,389,247 | $308,491,043 | $97,136,581 | $20,294,608 | $2,039,099 | $22,694,998 | $1,054,477,806 |
Amounts in the income column in the above table include any capital gain distributions from underlying funds, which are presented in the corresponding line-item in the Statement of Operations if applicable.
Investment Valuation
The following is a summary of the inputs used, as of September 30, 2018, involving the Fund's assets and liabilities carried at fair value. The inputs or methodology used for valuing securities may not be an indication of the risk associated with investing in those securities. For more information on valuation inputs, and their aggregation into the levels used below, please refer to the Investment Valuation section in the accompanying Notes to Financial Statements.
| | Valuation Inputs at Reporting Date: |
| Description | Total | Level 1 | Level 2 | Level 3 |
| Investments in Securities: | | | | |
| Other Short-Term Investments | $797,034 | $-- | $797,034 | $-- |
| Domestic Equity Funds | 638,914,292 | 638,914,292 | -- | -- |
| International Equity Funds | 324,523,580 | 324,523,580 | -- | -- |
| Bond Funds | 71,701,394 | 71,701,394 | -- | -- |
| Short-Term Funds | 20,575,416 | 20,575,416 | -- | -- |
| Total Investments in Securities: | $1,056,511,716 | $1,055,714,682 | $797,034 | $-- |
| Derivative Instruments: | | | | |
| Assets | | | | |
| Futures Contracts | $66,346 | $66,346 | $-- | $-- |
| Total Assets | $66,346 | $66,346 | $-- | $-- |
| Liabilities | | | | |
| Futures Contracts | $(4,509) | $(4,509) | $-- | $-- |
| Total Liabilities | $(4,509) | $(4,509) | $-- | $-- |
| Total Derivative Instruments: | $61,837 | $61,837 | $-- | $-- |
Value of Derivative Instruments
The following table is a summary of the Fund's value of derivative instruments by primary risk exposure as of September 30, 2018. For additional information on derivative instruments, please refer to the Derivative Instruments section in the accompanying Notes to Financial Statements.
| Primary Risk Exposure / Derivative Type | Value |
| | Asset | Liability |
| Equity Risk | | |
| Futures Contracts(a) | $66,346 | $(4,509) |
| Total Equity Risk | 66,346 | (4,509) |
| Total Value of Derivatives | $66,346 | $(4,509) |
(a) Reflects gross cumulative appreciation (depreciation) on futures contracts as presented in the Schedule of Investments. In the Statement of Assets and Liabilities, the period end daily variation margin is included in receivable or payable for daily variation margin on futures contracts, and the net cumulative appreciation (depreciation) is included in net unrealized appreciation (depreciation).
See accompanying notes which are an integral part of the financial statements.
Fidelity Freedom® 2060 Fund
Financial Statements
Statement of Assets and Liabilities
| | | September 30, 2018 (Unaudited) |
| Assets | | |
Investment in securities, at value — See accompanying schedule:
Unaffiliated issuers (cost $797,085) | $797,034 | |
| Fidelity Central Funds (cost $1,236,876) | 1,236,876 | |
| Other affiliated issuers (cost $974,543,735) | 1,054,477,806 | |
| Total Investment in Securities (cost $976,577,696) | | $1,056,511,716 |
| Cash | | 49,000 |
| Receivable for investments sold | | 11,995,418 |
| Receivable for fund shares sold | | 38,486,998 |
| Distributions receivable from Fidelity Central Funds | | 1,950 |
| Total assets | | 1,107,045,082 |
| Liabilities | | |
| Payable for investments purchased | $16,921,506 | |
| Payable for fund shares redeemed | 33,560,005 | |
| Accrued management fee | 569,739 | |
| Payable for daily variation margin on futures contracts | 33,868 | |
| Total liabilities | | 51,085,118 |
| Net Assets | | $1,055,959,964 |
| Net Assets consist of: | | |
| Paid in capital | | $959,240,324 |
| Undistributed net investment income | | 1,465,439 |
| Accumulated undistributed net realized gain (loss) on investments | | 15,258,344 |
| Net unrealized appreciation (depreciation) on investments | | 79,995,857 |
| Net Assets | | $1,055,959,964 |
| Fidelity Freedom 2060 Fund: | | |
| Net Asset Value, offering price and redemption price per share ($308,416,621 ÷ 24,683,601 shares) | | $12.49 |
| Class K: | | |
| Net Asset Value, offering price and redemption price per share ($665,459,435 ÷ 53,288,428 shares) | | $12.49 |
| Class K6: | | |
| Net Asset Value, offering price and redemption price per share ($82,083,908 ÷ 6,561,514 shares) | | $12.51 |
See accompanying notes which are an integral part of the financial statements.
Statement of Operations
| | | Six months ended September 30, 2018 (Unaudited) |
| Investment Income | | |
| Dividends: | | |
| Affiliated issuers | | $5,251,724 |
| Interest | | 3,695 |
| Income from Fidelity Central Funds | | 3,858 |
| Total income | | 5,259,277 |
| Expenses | | |
| Management fee | $3,136,166 | |
| Independent trustees' fees and expenses | 2,137 | |
| Total expenses | | 3,138,303 |
| Net investment income (loss) | | 2,120,974 |
| Realized and Unrealized Gain (Loss) | | |
| Net realized gain (loss) on: | | |
| Investment securities: | | |
| Fidelity Central Funds | 3 | |
| Other affiliated issuers | 2,039,099 | |
| Futures contracts | (525,815) | |
| Capital gain distributions from underlying funds: | | |
| Affiliated issuers | 15,042,884 | |
| Total net realized gain (loss) | | 16,556,171 |
| Change in net unrealized appreciation (depreciation) on: | | |
| Investment securities: | | |
| Unaffiliated issuers | (51) | |
| Affiliated issuers | 22,694,998 | |
| Futures contracts | 61,837 | |
| Total change in net unrealized appreciation (depreciation) | | 22,756,784 |
| Net gain (loss) | | 39,312,955 |
| Net increase (decrease) in net assets resulting from operations | | $41,433,929 |
See accompanying notes which are an integral part of the financial statements.
Statement of Changes in Net Assets
| | Six months ended September 30, 2018 (Unaudited) | Year ended March 31, 2018 |
| Increase (Decrease) in Net Assets | | |
| Operations | | |
| Net investment income (loss) | $2,120,974 | $6,919,637 |
| Net realized gain (loss) | 16,556,171 | 26,038,634 |
| Change in net unrealized appreciation (depreciation) | 22,756,784 | 12,512,816 |
| Net increase (decrease) in net assets resulting from operations | 41,433,929 | 45,471,087 |
| Distributions to shareholders from net investment income | – | (7,703,403) |
| Distributions to shareholders from net realized gain | (18,081,222) | (9,428,917) |
| Total distributions | (18,081,222) | (17,132,320) |
| Share transactions - net increase (decrease) | 214,665,548 | 673,447,954 |
| Total increase (decrease) in net assets | 238,018,255 | 701,786,721 |
| Net Assets | | |
| Beginning of period | 817,941,709 | 116,154,988 |
| End of period | $1,055,959,964 | $817,941,709 |
| Other Information | | |
| Undistributed net investment income end of period | $1,465,439 | $– |
| Distributions in excess of net investment income end of period | $– | $(655,535) |
See accompanying notes which are an integral part of the financial statements.
Financial Highlights
Fidelity Freedom 2060 Fund
| | Six months ended (Unaudited) September 30, | Years endedMarch 31, | | | |
| | 2018 | 2018 | 2017 | 2016 | 2015 A |
| Selected Per–Share Data | | | | | |
| Net asset value, beginning of period | $12.20 | $11.01 | $9.78 | $10.45 | $10.00 |
| Income from Investment Operations | | | | | |
| Net investment income (loss)B | .02 | .13 | .16 | .16 | .10 |
| Net realized and unrealized gain (loss) | .52 | 1.46 | 1.37 | (.53) | .52 |
| Total from investment operations | .54 | 1.59 | 1.53 | (.37) | .62 |
| Distributions from net investment income | – | (.13) | (.13) | (.12) | (.10) |
| Distributions from net realized gain | (.25) | (.26) | (.17) | (.17) | (.07) |
| Total distributions | (.25) | (.40)C | (.30) | (.30)D | (.17) |
| Net asset value, end of period | $12.49 | $12.20 | $11.01 | $9.78 | $10.45 |
| Total ReturnE,F | 4.49% | 14.50% | 16.01% | (3.67)% | 6.22% |
| Ratios to Average Net AssetsG,H | | | | | |
| Expenses before reductions | .75%I | .66%J | - %K | - %K | - %I,K |
| Expenses net of fee waivers, if any | .75%I | .66%J | -% | -% | - %I |
| Expenses net of all reductions | .75%I | .66%J | -% | -% | - %I |
| Net investment income (loss) | .38%I | 1.09% | 1.54% | 1.67% | 1.54%I |
| Supplemental Data | | | | | |
| Net assets, end of period (000 omitted) | $308,417 | $241,896 | $116,155 | $47,019 | $8,968 |
| Portfolio turnover rateG | 21%I | 11%L | 21% | 31% | 28%I |
A For the period August 5, 2014 (commencement of operations) to March 31, 2015.
B Calculated based on average shares outstanding during the period.
C Total distributions of $.40 per share is comprised of distributions from net investment income of $.132 and distributions from net realized gain of $.263 per share.
D Total distributions of $.30 per share is comprised of distributions from net investment income of $.121 and distributions from net realized gain of $.174 per share.
E Total returns for periods of less than one year are not annualized.
F Total returns would have been lower if certain expenses had not been reduced during the applicable periods shown.
G Amounts do not include the activity of the Underlying Funds.
H Expense ratios reflect operating expenses of the class. Expenses before reductions do not reflect amounts reimbursed by the investment adviser or reductions from expense offset arrangements and do not represent the amount paid by the class during periods when reimbursements or reductions occur. Expenses net of fee waivers reflect expenses after reimbursement by the investment adviser but prior to reductions from expense offset arrangements. Expenses net of all reductions represent the net expenses paid by the class but do not include expenses of the underlying funds in which the Fund invests.
I Annualized
J On certain classes, the size and fluctuation of net assets and expense amounts may cause ratios to differ from contractual rates.
K Amount represents less than .005%.
L The portfolio turnover rate does not include the assets acquired in the merger.
See accompanying notes which are an integral part of the financial statements.
Fidelity Freedom 2060 Fund Class K
| | Six months ended (Unaudited) September 30, | Years endedMarch 31, |
| | 2018 | 2018 A |
| Selected Per–Share Data | | |
| Net asset value, beginning of period | $12.19 | $11.65 |
| Income from Investment Operations | | |
| Net investment income (loss)B | .03 | .16 |
| Net realized and unrealized gain (loss) | .52 | .68 |
| Total from investment operations | .55 | .84 |
| Distributions from net investment income | – | (.15) |
| Distributions from net realized gain | (.25) | (.15) |
| Total distributions | (.25) | (.30) |
| Net asset value, end of period | $12.49 | $12.19 |
| Total ReturnC,D | 4.58% | 7.19% |
| Ratios to Average Net AssetsE,F | | |
| Expenses before reductions | .64%G | .65%G,H |
| Expenses net of fee waivers, if any | .64%G | .65%G,H |
| Expenses net of all reductions | .64%G | .65%G,H |
| Net investment income (loss) | .48%G | 1.92%G |
| Supplemental Data | | |
| Net assets, end of period (000 omitted) | $665,459 | $549,158 |
| Portfolio turnover rateE | 21%G | 11%I |
A For the period July 20, 2017 (commencement of sale of shares) to March 31, 2018.
B Calculated based on average shares outstanding during the period.
C Total returns for periods of less than one year are not annualized.
D Total returns would have been lower if certain expenses had not been reduced during the applicable periods shown.
E Amounts do not include the activity of the Underlying Funds.
F Expense ratios reflect operating expenses of the class. Expenses before reductions do not reflect amounts reimbursed by the investment adviser or reductions from expense offset arrangements and do not represent the amount paid by the class during periods when reimbursements or reductions occur. Expense ratios before reductions for start-up periods may not be representative of longer-term operating periods. Expenses net of fee waivers reflect expenses after reimbursement by the investment adviser but prior to reductions from expense offset arrangements. Expenses net of all reductions represent the net expenses paid by the class but do not include expenses of the underlying funds in which the Fund invests.
G Annualized
H On certain classes, the size and fluctuation of net assets and expense amounts may cause ratios to differ from contractual rates.
I The portfolio turnover rate does not include the assets acquired in the merger.
See accompanying notes which are an integral part of the financial statements.
Fidelity Freedom 2060 Fund Class K6
| | Six months ended (Unaudited) September 30, | Years endedMarch 31, |
| | 2018 | 2018 A |
| Selected Per–Share Data | | |
| Net asset value, beginning of period | $12.20 | $11.40 |
| Income from Investment Operations | | |
| Net investment income (loss)B | .04 | .14 |
| Net realized and unrealized gain (loss) | .52 | .96 |
| Total from investment operations | .56 | 1.10 |
| Distributions from net investment income | – | (.15) |
| Distributions from net realized gain | (.25) | (.15) |
| Total distributions | (.25) | (.30) |
| Net asset value, end of period | $12.51 | $12.20 |
| Total ReturnC,D | 4.66% | 9.65% |
| Ratios to Average Net AssetsE,F | | |
| Expenses before reductions | .49%G | .50%G,H |
| Expenses net of fee waivers, if any | .49%G | .50%G,H |
| Expenses net of all reductions | .49%G | .50%G,H |
| Net investment income (loss) | .63%G | 1.44%G |
| Supplemental Data | | |
| Net assets, end of period (000 omitted) | $82,084 | $26,888 |
| Portfolio turnover rateE | 21%G | 11%I |
A For the period June 7, 2017 (commencement of sale of shares) to March 31, 2018.
B Calculated based on average shares outstanding during the period.
C Total returns for periods of less than one year are not annualized.
D Total returns would have been lower if certain expenses had not been reduced during the applicable periods shown.
E Amounts do not include the activity of the Underlying Funds.
F Expense ratios reflect operating expenses of the class. Expenses before reductions do not reflect amounts reimbursed by the investment adviser or reductions from expense offset arrangements and do not represent the amount paid by the class during periods when reimbursements or reductions occur. Expense ratios before reductions for start-up periods may not be representative of longer-term operating periods. Expenses net of fee waivers reflect expenses after reimbursement by the investment adviser but prior to reductions from expense offset arrangements. Expenses net of all reductions represent the net expenses paid by the class but do not include expenses of the underlying funds in which the Fund invests.
G Annualized
H On certain classes, the size and fluctuation of net assets and expense amounts may cause ratios to differ from contractual rates.
I The portfolio turnover rate does not include the assets acquired in the merger.
See accompanying notes which are an integral part of the financial statements.
Notes to Financial Statements (Unaudited)
For the period ended September 30, 2018
1. Organization.
Fidelity Freedom Income Fund, Fidelity Freedom 2005 Fund, Fidelity Freedom 2010 Fund, Fidelity Freedom 2015 Fund, Fidelity Freedom 2020 Fund, Fidelity Freedom 2025 Fund, Fidelity Freedom 2030 Fund, Fidelity Freedom 2035 Fund, Fidelity Freedom 2040 Fund, Fidelity Freedom 2045 Fund, Fidelity Freedom 2050 Fund, Fidelity Freedom 2055 Fund and Fidelity Freedom 2060 Fund (the Funds) are funds of Fidelity Aberdeen Street Trust (the Trust). The Trust is registered under the Investment Company Act of 1940, as amended (the 1940 Act), as an open-end management investment company organized as a Delaware statutory trust. Each Fund is authorized to issue an unlimited number of shares. Each Fund offers Fidelity Freedom, Class K and Class K6 shares, each of which has equal rights as to assets and voting privileges. Each class has exclusive voting rights with respect to matters that affect that class. The Funds invest primarily in a combination of other Fidelity equity, bond, and short-term funds (the Underlying Funds) managed by Fidelity Management & Research Company (FMR). Certain Underlying Funds incurred name changes since their most recent shareholder report. The names of the Underlying Funds are those in effect at period end. In the prior year, the Funds transitioned their portfolios to invest exclusively in classes of the Fidelity Series funds, offered only to certain other Fidelity funds advised by FMR or its affiliates.
2. Investments in Fidelity Central Funds.
The Funds may invest in Fidelity Central Funds, which are open-end investment companies generally available only to other investment companies and accounts managed by the investment adviser and its affiliates. The Funds' Schedules of Investments list each of the Fidelity Central Funds held as of period end, if any, as an investment of each Fund, but do not include the underlying holdings of each Fidelity Central Fund. As an Investing Fund, each Fund indirectly bears its proportionate share of the expenses of the underlying Fidelity Central Funds.
The Money Market Central Funds seek preservation of capital and current income and are managed by Fidelity Investments Money Management, Inc. (FIMM), an affiliate of the investment adviser. Annualized expenses of the Money Market Central Funds as of their most recent shareholder report date are less than .005%.
A complete unaudited list of holdings for each Fidelity Central Fund is available upon request or at the Securities and Exchange Commission (the SEC) website at www.sec.gov. In addition, the financial statements of the Fidelity Central Funds are available on the SEC website or upon request.
3. Significant Accounting Policies.
Each Fund is an investment company and applies the accounting and reporting guidance of the Financial Accounting Standards Board (FASB) Accounting Standards Codification Topic 946 Financial Services – Investments Companies. The financial statements have been prepared in conformity with accounting principles generally accepted in the United States of America (GAAP), which require management to make certain estimates and assumptions at the date of the financial statements. Actual results could differ from those estimates. Subsequent events, if any, through the date that the financial statements were issued have been evaluated in the preparation of the financial statements. The following summarizes the significant accounting policies of the Funds:
Investment Valuation. Investments are valued as of 4:00 p.m. Eastern time on the last calendar day of the period. The Board of Trustees (the Board) has delegated the day to day responsibility for the valuation of each Fund's investments to the Fair Value Committee (the Committee) established by each Fund's investment adviser. In accordance with valuation policies and procedures approved by the Board, each Fund attempts to obtain prices from one or more third party pricing vendors or brokers to value its investments. When current market prices, quotations or currency exchange rates are not readily available or reliable, investments will be fair valued in good faith by the Committee, in accordance with procedures adopted by the Board. Factors used in determining fair value vary by investment type and may include market or investment specific events, changes in interest rates and credit quality. The frequency with which these procedures are used cannot be predicted and they may be utilized to a significant extent. The Committee oversees each Fund's valuation policies and procedures and reports to the Board on the Committee's activities and fair value determinations. The Board monitors the appropriateness of the procedures used in valuing each Fund's investments and ratifies the fair value determinations of the Committee. Each Fund categorizes the inputs to valuation techniques used to value its investments into a disclosure hierarchy consisting of three levels as shown below:
- Level 1 – quoted prices in active markets for identical investments
- Level 2 – other significant observable inputs (including quoted prices for similar investments, interest rates, prepayment speeds, etc.)
- Level 3 – unobservable inputs (including the Fund's own assumptions based on the best information available)
Valuation techniques used to value each Fund's investments by major category are as follows. Investments in the Underlying Funds are valued at their closing net asset value (NAV) each business day and are categorized as Level 1 in the hierarchy. Debt securities, including restricted securities, are valued based on evaluated prices received from third party pricing vendors or from brokers who make markets in such securities. U.S. government and government agency obligations are valued by pricing vendors who utilize matrix pricing which considers yield or price of bonds of comparable quality, coupon, maturity and type or by broker-supplied prices. When independent prices are unavailable or unreliable, debt securities may be valued utilizing pricing methodologies which consider similar factors that would be used by third party pricing vendors. Debt securities are generally categorized as Level 2 in the hierarchy but may be Level 3 depending on the circumstances.
Futures contracts are valued at the settlement price established each day by the board of trade or exchange on which they are traded and are categorized as Level 1 in the hierarchy.
The aggregate value of investments by input level as of September 30, 2018 is included at the end of each applicable Fund's Schedule of Investments.
Investment Transactions and Income. For financial reporting purposes, the Funds' investment holdings and NAV include trades executed through the end of the last business day of the period. The NAV per share for processing shareholder transactions is calculated as of the close of business of the New York Stock Exchange (NYSE), normally 4:00 p.m. Eastern time and includes trades executed through the end of the prior business day. Gains and losses on securities sold are determined on the basis of identified cost. Income and capital gain distributions from the Underlying Funds, if any, are recorded on the ex-dividend date. Interest income is accrued as earned. Interest income includes coupon interest and amortization of premium and accretion of discount on debt securities as applicable.
Class Allocations and Expenses. Investment income, realized and unrealized capital gains and losses, common expenses of each Fund, and certain fund-level expense reductions, if any, are allocated daily on a pro-rata basis to each class based on the relative net assets of each class to the total net assets of each Fund. Each class differs with respect to fees incurred. Certain expense reductions may also differ by class. For the reporting period, the allocated portion of income and expenses to each class as a percent of its average net assets may vary due to the timing of recording these transactions in relation to fluctuating net assets of the classes. Expenses directly attributable to a fund are charged to that fund. Expenses attributable to more than one fund are allocated among the respective funds on the basis of relative net assets or other appropriate methods. Expenses included in the accompanying financial statements reflect the expenses of each Fund and do not include any expenses associated with the Underlying Funds. Although not included in each Fund's expenses, each Fund indirectly bears its proportionate share of the Underlying Funds' expenses through the impact of these expenses on each Underlying Fund's NAV. Expense estimates are accrued in the period to which they relate and adjustments are made when actual amounts are known.
Deferred Trustee Compensation. Under a Deferred Compensation Plan (the Plan) for Fidelity Freedom 2010 Fund, Fidelity Freedom 2020 Fund and Fidelity Freedom 2030 Fund, certain independent Trustees have elected to defer receipt of a portion of their annual compensation. Deferred amounts are invested in a cross-section of Fidelity funds, are marked-to-market and remain in each Fund until distributed in accordance with the Plan. The investment of deferred amounts and the offsetting payable to the Trustees presented below are included in each accompanying Statement of Assets and Liabilities in other receivables and other payables and accrued expenses, respectively.
| Fidelity Freedom 2010 Fund | $93,931 |
| Fidelity Freedom 2020 Fund | 212,156 |
| Fidelity Freedom 2030 Fund | 174,805 |
Income Tax Information and Distributions to Shareholders. Each year, each Fund intends to qualify as a regulated investment company under Subchapter M of the Internal Revenue Code, including distributing substantially all of its taxable income and realized gains. As a result, no provision for U.S. Federal income taxes is required. Each Fund files a U.S. federal tax return, in addition to state and local tax returns as required. Each Fund's federal income tax returns are subject to examination by the Internal Revenue Service (IRS) for a period of three fiscal years after they are filed. State and local tax returns may be subject to examination for an additional fiscal year depending on the jurisdiction.
Distributions are declared and recorded on the ex-dividend date. Income and capital gain distributions are declared separately for each class. Income and capital gain distributions are determined in accordance with income tax regulations, which may differ from GAAP.
Capital accounts within the financial statements are adjusted for permanent book-tax differences. These adjustments have no impact on net assets or the results of operations. Capital accounts are not adjusted for temporary book-tax differences which will reverse in a subsequent period.
Book-tax differences are primarily due to the short-term gain distributions from the Underlying Funds, futures contracts, market discount, deferred trustees compensation, losses deferred due to wash sales, and excise tax regulations.
As of period end, the cost and unrealized appreciation (depreciation) in securities, and derivatives if applicable, for federal income tax purposes were as follows for each Fund:
| | Tax cost | Gross unrealized appreciation | Gross unrealized depreciation | Net unrealized appreciation (depreciation) |
| Fidelity Freedom Income Fund | $3,348,077,971 | $219,688,827 | $(48,495,993) | $171,192,834 |
| Fidelity Freedom 2005 Fund | 934,442,654 | 77,482,242 | (23,566,371) | 53,915,871 |
| Fidelity Freedom 2010 Fund | 5,637,412,521 | 704,900,587 | (128,215,802) | 576,684,785 |
| Fidelity Freedom 2015 Fund | 8,327,269,154 | 1,359,749,262 | (149,074,212) | 1,210,675,050 |
| Fidelity Freedom 2020 Fund | 25,108,681,386 | 4,480,786,893 | (471,556,551) | 4,009,230,342 |
| Fidelity Freedom 2025 Fund | 23,618,026,776 | 4,344,409,295 | (398,472,176) | 3,945,937,119 |
| Fidelity Freedom 2030 Fund | 26,942,964,282 | 6,063,148,062 | (388,054,234) | 5,675,093,828 |
| Fidelity Freedom 2035 Fund | 18,177,492,824 | 4,546,451,869 | (156,640,239) | 4,389,811,630 |
| Fidelity Freedom 2040 Fund | 18,340,202,614 | 4,904,765,625 | (156,601,951) | 4,748,163,674 |
| Fidelity Freedom 2045 Fund | 11,299,537,650 | 2,751,964,841 | (90,481,282) | 2,661,483,559 |
| Fidelity Freedom 2050 Fund | 9,660,653,843 | 2,295,466,260 | (77,689,528) | 2,217,776,732 |
| Fidelity Freedom 2055 Fund | 4,325,199,677 | 654,003,691 | (37,344,982) | 616,658,709 |
| Fidelity Freedom 2060 Fund | 978,408,082 | 88,105,095 | (9,939,624) | 78,165,471 |
Certain of the Funds elected to defer to the next fiscal year ordinary losses recognized during the period January 1, 2018 to March 31, 2018. Loss deferrals were as follows:
| | Ordinary losses |
| Fidelity Freedom 2050 Fund | $1,076,447 |
| Fidelity Freedom 2055 Fund | 1,831,366 |
| Fidelity Freedom 2060 Fund | 655,535 |
4. Derivative Instruments.
Risk Exposures and the Use of Derivative Instruments. The Funds' investment objective allows the Funds to enter into various types of derivative contracts, including futures contracts. Derivatives are investments whose value is primarily derived from underlying assets, indices or reference rates and may be transacted on an exchange or over-the-counter (OTC). Derivatives may involve a future commitment to buy or sell a specified asset based on specified terms, to exchange future cash flows at periodic intervals based on a notional principal amount, or for one party to make one or more payments upon the occurrence of specified events in exchange for periodic payments from the other party.
The Funds used derivatives to increase returns and to manage exposure to certain risks as defined below. The success of any strategy involving derivatives depends on analysis of numerous economic factors, and if the strategies for investment do not work as intended, the Funds may not achieve their objectives.
The Funds' use of derivatives increased or decreased their exposure to the following risk:
| Equity Risk | Equity risk relates to the fluctuations in the value of financial instruments as a result of changes in market prices (other than those arising from interest rate risk or foreign exchange risk), whether caused by factors specific to an individual investment, its issuer, or all factors affecting all instruments traded in a market or market segment.
|
The Funds are also exposed to additional risks from investing in derivatives, such as liquidity risk and counterparty credit risk. Liquidity risk is the risk that the Funds will be unable to close out the derivative in the open market in a timely manner. Counterparty credit risk is the risk that the counterparty will not be able to fulfill its obligation to the Funds. Counterparty credit risk related to exchange-traded futures contracts may be mitigated by the protection provided by the exchange on which they trade.
Investing in derivatives may involve greater risks than investing in the underlying assets directly and, to varying degrees, may involve risk of loss in excess of any initial investment and collateral received and amounts recognized in the Statement of Assets and Liabilities. In addition, there may be the risk that the change in value of the derivative contract does not correspond to the change in value of the underlying instrument.
Futures Contracts. A futures contract is an agreement between two parties to buy or sell a specified underlying instrument for a fixed price at a specified future date. The Funds used futures contracts to manage their exposure to the stock market.
Upon entering into a futures contract, a fund is required to deposit either cash or securities (initial margin) with a clearing broker in an amount equal to a certain percentage of the face value of the contract. Futures contracts are marked-to-market daily and subsequent daily payments (variation margin) are made or received by a fund depending on the daily fluctuations in the value of the futures contracts and are recorded as unrealized appreciation or (depreciation). This receivable and/or payable, if any, is included in daily variation margin on futures contracts in the Statement of Assets and Liabilities. Realized gain or (loss) is recorded upon the expiration or closing of a futures contract. The net realized gain (loss) and change in net unrealized appreciation (depreciation) on futures contracts during the period is presented in the Statement of Operations.
Any open futures contracts at period end are presented in the Schedule of Investments under the caption "Futures Contracts". The notional amount at value reflects each contract's exposure to the underlying instrument or index at period end.
5. Purchases and Sales of Investments.
Purchases and sales of securities, other than short-term securities, are noted in the table below.
| | Purchases ($) | Sales ($) |
| Fidelity Freedom Income Fund | 580,118,712 | 779,411,886 |
| Fidelity Freedom 2005 Fund | 172,776,315 | 210,333,156 |
| Fidelity Freedom 2010 Fund | 828,962,275 | 1,153,580,828 |
| Fidelity Freedom 2015 Fund | 1,128,133,044 | 1,816,318,045 |
| Fidelity Freedom 2020 Fund | 3,196,773,708 | 4,491,014,473 |
| Fidelity Freedom 2025 Fund | 3,306,757,542 | 3,488,856,635 |
| Fidelity Freedom 2030 Fund | 3,218,978,872 | 3,246,280,546 |
| Fidelity Freedom 2035 Fund | 2,786,167,088 | 2,598,869,741 |
| Fidelity Freedom 2040 Fund | 2,610,252,508 | 2,596,606,461 |
| Fidelity Freedom 2045 Fund | 1,811,121,475 | 1,576,297,675 |
| Fidelity Freedom 2050 Fund | 1,611,420,742 | 1,344,980,883 |
| Fidelity Freedom 2055 Fund | 927,305,283 | 520,517,490 |
| Fidelity Freedom 2060 Fund | 308,491,043 | 97,136,581 |
6. Fees and Other Transactions with Affiliates.
Management Fee and Expense Contract. FMR Co., Inc. (the investment adviser), an affiliate of FMR, and its affiliates provide the Funds with investment management related services. Under the management contract, effective June 1, 2017, each Class of each Fund pays a monthly management fee that is set at an annual rate by referring to each Fund's target date, indicated by its name, such that the management fee rate applicable to each Class of each Fund is reduced as the fund approaches, and then passes, its target date. In addition, under the management contract, the investment adviser pays all ordinary operating expenses of each Fund, except fees and expenses of the independent Trustees, and certain miscellaneous expenses such as proxy and shareholder meeting expenses. The management fee is reduced by an amount equal to the fees and expenses paid by each Fund to the independent Trustees. Prior to June 1, 2017, the investment advisor provided the Funds with investment management related services. The Funds did not pay any fees for these services. For the reporting period, the total annual management fee rate for each Class of each Fund was as follows:r
| | Annual % of Class-Level Average Net Assets (Fidelity Freedom Class) | Annual % of Class-Level Average Net Assets (Class K) |
| Fidelity Freedom Income Fund | .465% | .415% |
| Fidelity Freedom 2005 Fund | .482% | .428% |
| Fidelity Freedom 2010 Fund | .525% | .461% |
| Fidelity Freedom 2015 Fund | .567% | .496% |
| Fidelity Freedom 2020 Fund | .610% | .531% |
| Fidelity Freedom 2025 Fund | .652% | .566% |
| Fidelity Freedom 2030 Fund | .695% | .601% |
| Fidelity Freedom 2035 Fund | .737% | .636% |
| Fidelity Freedom 2040 Fund | .746% | .643% |
| Fidelity Freedom 2045 Fund | .746% | .643% |
| Fidelity Freedom 2050 Fund | .746% | .643% |
| Fidelity Freedom 2055 Fund | .746% | .643% |
| Fidelity Freedom 2060 Fund | .746% | .643% |
Under the expense contract, the investment adviser pays class-level expenses for Class K6 of each Fund as necessary so that Class K6 total expenses do not exceed certain amounts of Class K6 average net assets on an annual basis with certain exceptions, as noted in the following table:
| | Annual % of Class-Level Average Net Assets (Class K6) |
| Fidelity Freedom Income Fund | .365% |
| Fidelity Freedom 2005 Fund | .373% |
| Fidelity Freedom 2010 Fund | .392% |
| Fidelity Freedom 2015 Fund | .412% |
| Fidelity Freedom 2020 Fund | .431% |
| Fidelity Freedom 2025 Fund | .450% |
| Fidelity Freedom 2030 Fund | .470% |
| Fidelity Freedom 2035 Fund | .489% |
| Fidelity Freedom 2040 Fund | .493% |
| Fidelity Freedom 2045 Fund | .493% |
| Fidelity Freedom 2050 Fund | .493% |
| Fidelity Freedom 2055 Fund | .493% |
| Fidelity Freedom 2060 Fund | .493% |
Other Transactions. The investment adviser has entered into an administration agreement with FMR under which FMR provides management and administrative services (other than investment advisory services) necessary for the operation of each Fund. Pursuant to this agreement, FMR pays all expenses of each Fund, excluding compensation of the independent Trustees and certain miscellaneous expenses such as proxy and shareholder meeting expenses. FMR also contracts with other Fidelity companies to perform the services necessary for the operation of each Fund. The Funds do not pay any fees for these services.
Prior Fiscal Year Reallocation of Underlying Fund Investments. During the prior period, the investment adviser reallocated investments of the Funds. This involved taxable redemptions of the Funds' interest in Fidelity Series Value Discovery Fund, ("selected Underlying Fund") for investments and cash and non-taxable exchanges of those investments and cash for shares of Fidelity Series Intrinsic Opportunities Fund and Fidelity Series Growth & Income Fund which are affiliated investment companies managed by FMR.
Details of these transactions with the net related gain (loss) for the Funds are presented in the accompanying table:
| | Value of Investments and Cash reallocated | Net realized Gain (Loss) on redemptions of selected Underlying Fund |
| Freedom Income Fund | $ 21,943,732 | $ 5,248,386 |
| Freedom 2005 Fund | 9,132,913 | 818,016 |
| Freedom 2010 Fund | 82,938,352 | 17,423,248 |
| Freedom 2015 Fund | 132,300,852 | 26,218,924 |
| Freedom 2020 Fund | 349,185,809 | 55,046,914 |
| Freedom 2025 Fund | 312,149,126 | 36,476,750 |
| Freedom 2030 Fund | 443,448,822 | 45,658,987 |
| Freedom 2035 Fund | 315,567,651 | 25,385,650 |
| Freedom 2040 Fund | 341,654,429 | 31,022,107 |
| Freedom 2045 Fund | 165,214,747 | 12,941,012 |
| Freedom 2050 Fund | 136,449,649 | 10,462,773 |
| Freedom 2055 Fund | 44,625,815 | 2,684,111 |
| Freedom 2060 Fund | 6,196,209 | 137,579 |
7. Expense Reductions.
Through arrangements with each applicable Fund's custodian, credits realized as a result of certain uninvested cash balances were used to reduce the Fund's expenses. All of the applicable expense reductions are noted in the table below.
| | Expense reduction |
| Fidelity Freedom Income Fund | $54 |
| Fidelity Freedom 2005 Fund | 70 |
| Fidelity Freedom 2010 Fund | 38 |
| Fidelity Freedom 2015 Fund | 55 |
| Fidelity Freedom 2020 Fund | 13 |
| Fidelity Freedom 2025 Fund | 12 |
| Fidelity Freedom 2030 Fund | 25 |
| Fidelity Freedom 2045 Fund | 29 |
| Fidelity Freedom 2050 Fund | 6 |
| Fidelity Freedom 2055 Fund | 6 |
8. Distributions to Shareholders.
Distributions to shareholders of each class were as follows:
| | Six months ended
September 30, 2018 | Year ended
March 31, 2018(a) |
| Fidelity Freedom Income Fund | | |
| From net investment income | | |
| Fidelity Freedom Income Fund | $14,984,465 | $34,335,271 |
| Class K | 10,910,977 | 17,390,446 |
| Class K6 | 455,334 | 223,737 |
| Total | $26,350,776 | $51,949,454 |
| From net realized gain | | |
| Fidelity Freedom Income Fund | $22,330,640 | $44,712,535 |
| Class K | 16,009,200 | 22,488,873 |
| Class K6 | 520,337 | 239,298 |
| Total | $38,860,177 | $67,440,706 |
| Fidelity Freedom 2005 Fund | | |
| From net investment income | | |
| Fidelity Freedom 2005 Fund | $1,524,497 | $8,256,167 |
| Class K | 1,072,276 | 5,348,186 |
| Class K6 | 40,475 | 66,981 |
| Total | $2,637,248 | $13,671,334 |
| From net realized gain | | |
| Fidelity Freedom 2005 Fund | $8,908,779 | $14,263,444 |
| Class K | 6,076,226 | 6,417,819 |
| Class K6 | 194,073 | 78,417 |
| Total | $15,179,078 | $20,759,680 |
| Fidelity Freedom 2010 Fund | | |
| From net investment income | | |
| Fidelity Freedom 2010 Fund | $8,368,166 | $59,450,122 |
| Class K | 5,046,887 | 33,379,063 |
| Class K6 | 229,872 | 446,466 |
| Total | $13,644,925 | $93,275,651 |
| From net realized gain | | |
| Fidelity Freedom 2010 Fund | $87,992,475 | $138,121,654 |
| Class K | 50,036,243 | 54,086,430 |
| Class K6 | 1,772,564 | 700,731 |
| Total | $139,801,282 | $192,908,815 |
| Fidelity Freedom 2015 Fund | | |
| From net investment income | | |
| Fidelity Freedom 2015 Fund | $8,688,870 | $75,356,851 |
| Class K | 7,132,266 | 62,744,245 |
| Class K6 | 397,154 | 834,279 |
| Total | $16,218,290 | $138,935,375 |
| From net realized gain | | |
| Fidelity Freedom 2015 Fund | $134,055,986 | $187,400,162 |
| Class K | 105,038,677 | 102,672,333 |
| Class K6 | 4,150,891 | 1,342,304 |
| Total | $243,245,554 | $291,414,799 |
| Fidelity Freedom 2020 Fund | | |
| From net investment income | | |
| Fidelity Freedom 2020 Fund | $15,444,745 | $170,977,599 |
| Class K | 19,118,065 | 214,523,078 |
| Class K6 | 1,282,075 | 3,160,558 |
| Total | $35,844,885 | $388,661,235 |
| From net realized gain | | |
| Fidelity Freedom 2020 Fund | $316,208,644 | $406,127,361 |
| Class K | 371,844,368 | 309,195,087 |
| Class K6 | 15,585,204 | 4,430,552 |
| Total | $703,638,216 | $719,753,000 |
| Fidelity Freedom 2025 Fund | | |
| From net investment income | | |
| Fidelity Freedom 2025 Fund | $8,064,374 | $135,746,842 |
| Class K | 11,556,354 | 196,874,291 |
| Class K6 | 1,171,512 | 4,557,308 |
| Total | $20,792,240 | $337,178,441 |
| From net realized gain | | |
| Fidelity Freedom 2025 Fund | $257,242,278 | $300,732,953 |
| Class K | 335,132,279 | 252,816,654 |
| Class K6 | 17,795,792 | 5,757,887 |
| Total | $610,170,349 | $559,307,494 |
| Fidelity Freedom 2030 Fund | | |
| From net investment income | | |
| Fidelity Freedom 2030 Fund | $– | $152,399,042 |
| Class K | – | 237,812,270 |
| Class K6 | – | 6,564,512 |
| Total | $– | $396,775,824 |
| From net realized gain | | |
| Fidelity Freedom 2030 Fund | $350,600,239 | $413,872,411 |
| Class K | 473,811,407 | 346,196,136 |
| Class K6 | 26,942,551 | 9,436,482 |
| Total | $851,354,197 | $769,505,029 |
| Fidelity Freedom 2035 Fund | | |
| From net investment income | | |
| Fidelity Freedom 2035 Fund | $– | $87,722,896 |
| Class K | – | 162,011,402 |
| Class K6 | – | 5,709,559 |
| Total | $– | $255,443,857 |
| From net realized gain | | |
| Fidelity Freedom 2035 Fund | $230,445,861 | $240,142,544 |
| Class K | 335,955,382 | 221,611,338 |
| Class K6 | 22,770,060 | 7,651,385 |
| Total | $589,171,303 | $469,405,267 |
| Fidelity Freedom 2040 Fund | | |
| From net investment income | | |
| Fidelity Freedom 2040 Fund | $– | $90,536,406 |
| Class K | – | 170,937,500 |
| Class K6 | – | 4,789,254 |
| Total | $– | $266,263,160 |
| From net realized gain | | |
| Fidelity Freedom 2040 Fund | $241,363,664 | $261,248,683 |
| Class K | 357,897,586 | 242,057,363 |
| Class K6 | 21,767,741 | 6,636,534 |
| Total | $621,028,991 | $509,942,580 |
| Fidelity Freedom 2045 Fund | | |
| From net investment income | | |
| Fidelity Freedom 2045 Fund | $– | $44,250,979 |
| Class K | – | 109,126,440 |
| Class K6 | – | 2,701,118 |
| Total | $– | $156,078,537 |
| From net realized gain | | |
| Fidelity Freedom 2045 Fund | $121,573,693 | $114,572,629 |
| Class K | 225,623,203 | 138,369,458 |
| Class K6 | 12,930,259 | 3,337,686 |
| Total | $360,127,155 | $256,279,773 |
| Fidelity Freedom 2050 Fund | | |
| From net investment income | | |
| Fidelity Freedom 2050 Fund | $– | $36,777,044 |
| Class K | – | 92,715,220 |
| Class K6 | – | 1,957,994 |
| Total | $– | $131,450,258 |
| From net realized gain | | |
| Fidelity Freedom 2050 Fund | $98,786,680 | $93,839,199 |
| Class K | 191,006,262 | 116,797,064 |
| Class K6 | 10,002,143 | 2,419,431 |
| Total | $299,795,085 | $213,055,694 |
| Fidelity Freedom 2055 Fund | | |
| From net investment income | | |
| Fidelity Freedom 2055 Fund | $– | $12,886,343 |
| Class K | – | 34,941,200 |
| Class K6 | – | 799,585 |
| Total | $– | $48,627,128 |
| From net realized gain | | |
| Fidelity Freedom 2055 Fund | $34,080,234 | $27,949,675 |
| Class K | 70,641,422 | 41,275,560 |
| Class K6 | 3,670,845 | 928,253 |
| Total | $108,392,501 | $70,153,488 |
| Fidelity Freedom 2060 Fund | | |
| From net investment income | | |
| Fidelity Freedom 2060 Fund | $– | $2,107,103 |
| Class K | – | 5,444,764 |
| Class K6 | – | 151,536 |
| Total | $– | $7,703,403 |
| From net realized gain | | |
| Fidelity Freedom 2060 Fund | $5,777,935 | $3,721,242 |
| Class K | 11,676,178 | 5,555,128 |
| Class K6 | 627,109 | 152,547 |
| Total | $18,081,222 | $9,428,917 |
(a) Amounts for Class K and Class K6 are for the period July 20, 2017 and June 7, 2017, respectively, (commencement of sale of shares) to March 31, 2018.
9. Share Transactions.
Share transactions for each class were as follows and may contain automatic conversions between classes or exchanges between affiliated funds:
| | Shares | Shares | Dollars | Dollars |
| | Six months ended September 30, 2018 | Year ended March 31, 2018 (a) | Six months ended September 30, 2018 | Year ended March 31, 2018 (a) |
| Fidelity Freedom Income Fund | | | | |
| Fidelity Freedom Income Fund | | | | |
| Shares sold | 12,814,841 | 27,221,111 | $148,674,954 | $320,765,917 |
| Reinvestment of distributions | 3,164,229 | 6,605,290 | 36,540,585 | 77,395,265 |
| Shares redeemed | (20,352,135) | (38,028,513) | (235,957,475) | (447,668,101) |
| Net increase (decrease) | (4,373,065) | (4,202,112) | $(50,741,936) | $(49,506,919) |
| Class K | | | | |
| Shares sold | 12,517,953 | 23,453,639 | $144,956,112 | $277,296,475 |
| Issued in exchange for the shares of Fidelity Freedom K Income Fund | – | 136,520,990 | – | 1,613,678,107 |
| Reinvestment of distributions | 2,334,978 | 3,392,232 | 26,920,177 | 39,879,319 |
| Shares redeemed | (29,145,944) | (29,017,558) | (337,442,532) | (343,144,692) |
| Net increase (decrease) | (14,293,013) | 134,349,303 | $(165,566,243) | $1,587,709,209 |
| Class K6 | | | | |
| Shares sold | 4,888,043 | 3,890,192 | $56,611,838 | $45,935,962 |
| Reinvestment of distributions | 84,555 | 39,381 | 975,671 | 463,035 |
| Shares redeemed | (678,423) | (569,053) | (7,861,133) | (6,709,845) |
| Net increase (decrease) | 4,294,175 | 3,360,520 | $49,726,376 | $39,689,152 |
| Fidelity Freedom 2005 Fund | | | | |
| Fidelity Freedom 2005 Fund | | | | |
| Shares sold | 3,686,723 | 7,378,209 | $45,792,236 | $92,645,422 |
| Reinvestment of distributions | 835,563 | 1,791,008 | 10,335,921 | 22,315,999 |
| Shares redeemed | (5,768,683) | (9,828,104) | (71,645,766) | (123,356,983) |
| Net increase (decrease) | (1,246,397) | (658,887) | $(15,517,609) | $(8,395,562) |
| Class K | | | | |
| Shares sold | 4,893,445 | 9,369,547 | $60,658,371 | $118,391,743 |
| Issued in exchange for the shares of Fidelity Freedom K 2005 Fund | – | 32,823,330 | – | 412,589,249 |
| Reinvestment of distributions | 578,826 | 938,278 | 7,148,502 | 11,766,005 |
| Shares redeemed | (8,230,204) | (9,282,767) | (102,006,836) | (117,477,612) |
| Net increase (decrease) | (2,757,933) | 33,848,388 | $(34,199,963) | $425,269,385 |
| Class K6 | | | | |
| Shares sold | 1,771,969 | 893,756 | $22,013,023 | $11,275,207 |
| Reinvestment of distributions | 18,992 | 11,585 | 234,548 | 145,398 |
| Shares redeemed | (174,160) | (106,187) | (2,164,051) | (1,340,558) |
| Net increase (decrease) | 1,616,801 | 799,154 | $20,083,520 | $10,080,047 |
| Fidelity Freedom 2010 Fund | | | | |
| Fidelity Freedom 2010 Fund | | | | |
| Shares sold | 12,416,194 | 23,767,583 | $196,634,359 | $381,761,384 |
| Reinvestment of distributions | 6,029,770 | 12,229,853 | 94,968,861 | 194,626,240 |
| Shares redeemed | (24,565,366) | (49,294,217) | (388,720,220) | (791,146,041) |
| Net increase (decrease) | (6,119,402) | (13,296,781) | $(97,117,000) | $(214,758,417) |
| Class K | | | | |
| Shares sold | 9,503,819 | 20,322,144 | $150,402,768 | $328,782,786 |
| Issued in exchange for the shares of Fidelity Freedom K 2010 Fund | – | 158,527,428 | – | 2,547,535,809 |
| Reinvestment of distributions | 3,501,788 | 5,452,961 | 55,083,130 | 87,465,493 |
| Shares redeemed | (28,041,001) | (34,234,425) | (443,557,450) | (555,204,634) |
| Net increase (decrease) | (15,035,394) | 150,068,108 | $(238,071,552) | $2,408,579,454 |
| Class K6 | | | | |
| Shares sold | 6,624,451 | 4,164,658 | $104,974,043 | $67,215,211 |
| Reinvestment of distributions | 127,381 | 71,521 | 2,002,436 | 1,147,196 |
| Shares redeemed | (627,780) | (490,870) | (9,946,565) | (7,955,488) |
| Net increase (decrease) | 6,124,052 | 3,745,309 | $97,029,914 | $60,406,919 |
| Fidelity Freedom 2015 Fund | | | | |
| Fidelity Freedom 2015 Fund | | | | |
| Shares sold | 42,069,204 | 72,616,042 | $555,702,088 | $968,356,768 |
| Reinvestment of distributions | 10,754,160 | 19,682,696 | 141,309,668 | 260,136,127 |
| Shares redeemed | (63,033,983) | (104,001,992) | (832,380,628) | (1,384,215,146) |
| Net increase (decrease) | (10,210,619) | (11,703,254) | $(135,368,872) | $(155,722,251) |
| Class K | | | | |
| Shares sold | 24,763,747 | 57,486,192 | $326,582,470 | $773,133,070 |
| Issued in exchange for the shares of Fidelity Freedom K 2015 Fund | – | 357,299,109 | – | 4,748,505,056 |
| Reinvestment of distributions | 8,549,615 | 12,372,220 | 112,170,943 | 165,416,578 |
| Shares redeemed | (83,158,645) | (79,691,095) | (1,097,577,183) | (1,075,934,728) |
| Net increase (decrease) | (49,845,283) | 347,466,426 | $(658,823,770) | $4,611,119,976 |
| Class K6 | | | | |
| Shares sold | 21,150,472 | 10,514,183 | $280,449,664 | $140,899,779 |
| Reinvestment of distributions | 346,650 | 162,796 | 4,548,045 | 2,176,583 |
| Shares redeemed | (2,371,453) | (2,096,076) | (31,309,506) | (28,077,012) |
| Net increase (decrease) | 19,125,669 | 8,580,903 | $253,688,203 | $114,999,350 |
| Fidelity Freedom 2020 Fund | | | | |
| Fidelity Freedom 2020 Fund | | | | |
| Shares sold | 100,964,511 | 152,441,221 | $1,654,474,680 | $2,504,940,140 |
| Reinvestment of distributions | 20,131,258 | 35,050,498 | 328,743,442 | 571,436,446 |
| Shares redeemed | (124,487,003) | (187,167,034) | (2,042,470,360) | (3,072,056,561) |
| Net increase (decrease) | (3,391,234) | 324,685 | $(59,252,238) | $4,320,025 |
| Class K | | | | |
| Shares sold | 81,218,328 | 159,801,375 | $1,331,407,311 | $2,656,458,207 |
| Issued in exchange for the shares of Fidelity Freedom K 2020 Fund | – | 997,191,746 | – | 16,284,141,352 |
| Reinvestment of distributions | 23,970,719 | 31,625,493 | 390,962,433 | 523,718,165 |
| Shares redeemed | (213,603,512) | (181,091,802) | (3,500,766,327) | (3,024,255,229) |
| Net increase (decrease) | (108,414,465) | 1,007,526,812 | $(1,778,396,583) | $16,440,062,495 |
| Class K6 | | | | |
| Shares sold | 59,778,897 | 31,475,610 | $984,841,647 | $521,683,894 |
| Reinvestment of distributions | 1,033,534 | 458,124 | 16,867,279 | 7,591,110 |
| Shares redeemed | (4,685,421) | (3,147,676) | (76,820,509) | (52,491,121) |
| Net increase (decrease) | 56,127,010 | 28,786,058 | $924,888,417 | $476,783,883 |
| Fidelity Freedom 2025 Fund | | | | |
| Fidelity Freedom 2025 Fund | | | | |
| Shares sold | 115,752,184 | 158,726,717 | $1,650,321,426 | $2,259,361,477 |
| Reinvestment of distributions | 18,499,634 | 30,656,487 | 263,619,804 | 433,261,289 |
| Shares redeemed | (120,383,751) | (151,675,334) | (1,722,482,523) | (2,154,686,419) |
| Net increase (decrease) | 13,868,067 | 37,707,870 | $191,458,707 | $537,936,347 |
| Class K | | | | |
| Shares sold | 110,517,604 | 199,976,963 | $1,578,994,350 | $2,881,263,698 |
| Issued in exchange for the shares of Fidelity Freedom K 2025 Fund | – | 1,039,138,058 | – | 14,641,455,337 |
| Reinvestment of distributions | 24,363,221 | 31,228,538 | 346,688,633 | 449,690,945 |
| Shares redeemed | (218,947,438) | (171,473,684) | (3,125,322,228) | (2,483,694,512) |
| Net increase (decrease) | (84,066,613) | 1,098,869,875 | $(1,199,639,245) | $15,488,715,468 |
| Class K6 | | | | |
| Shares sold | 80,963,256 | 47,051,793 | $1,164,521,730 | $673,422,348 |
| Reinvestment of distributions | 1,331,974 | 715,836 | 18,967,304 | 10,315,195 |
| Shares redeemed | (5,116,200) | (4,172,324) | (73,271,821) | (60,270,553) |
| Net increase (decrease) | 77,179,030 | 43,595,305 | $1,110,217,213 | $623,466,990 |
| Fidelity Freedom 2030 Fund | | | | |
| Fidelity Freedom 2030 Fund | | | | |
| Shares sold | 89,856,024 | 123,266,681 | $1,607,142,710 | $2,193,032,389 |
| Reinvestment of distributions | 19,465,688 | 31,803,918 | 348,046,505 | 561,630,140 |
| Shares redeemed | (89,285,758) | (126,546,656) | (1,604,093,908) | (2,245,714,755) |
| Net increase (decrease) | 20,035,954 | 28,523,943 | $351,095,307 | $508,947,774 |
| Class K | | | | |
| Shares sold | 93,910,114 | 159,214,941 | $1,684,872,969 | $2,878,963,957 |
| Issued in exchange for the shares of Fidelity Freedom K 2030 Fund | – | 980,848,240 | – | 17,213,886,716 |
| Reinvestment of distributions | 26,529,194 | 32,337,117 | 473,811,407 | 584,008,406 |
| Shares redeemed | (178,456,993) | (148,080,700) | (3,197,204,014) | (2,692,845,198) |
| Net increase (decrease) | (58,017,685) | 1,024,319,598 | $(1,038,519,638) | $17,984,013,881 |
| Class K6 | | | | |
| Shares sold | 62,570,300 | 47,995,734 | $1,130,087,929 | $858,334,852 |
| Reinvestment of distributions | 1,507,697 | 885,011 | 26,942,551 | 16,000,993 |
| Shares redeemed | (4,118,136) | (3,213,471) | (74,124,983) | (58,671,562) |
| Net increase (decrease) | 59,959,861 | 45,667,274 | $1,082,905,497 | $815,664,283 |
| Fidelity Freedom 2035 Fund | | | | |
| Fidelity Freedom 2035 Fund | | | | |
| Shares sold | 86,025,453 | 110,962,220 | $1,299,965,870 | $1,654,304,549 |
| Reinvestment of distributions | 15,107,462 | 21,957,182 | 229,180,205 | 325,960,643 |
| Shares redeemed | (82,917,707) | (99,897,658) | (1,262,836,996) | (1,486,838,456) |
| Net increase (decrease) | 18,215,208 | 33,021,744 | $266,309,079 | $493,426,736 |
| Class K | | | | |
| Shares sold | 93,071,804 | 152,904,028 | $1,414,570,724 | $2,323,823,499 |
| Issued in exchange for the shares of Fidelity Freedom K 2035 Fund | – | 810,190,579 | – | 11,861,189,816 |
| Reinvestment of distributions | 22,189,920 | 25,155,590 | 335,955,382 | 383,622,740 |
| Shares redeemed | (162,819,808) | (133,107,016) | (2,469,554,267) | (2,040,612,137) |
| Net increase (decrease) | (47,558,084) | 855,143,181 | $(719,028,161) | $12,528,023,918 |
| Class K6 | | | | |
| Shares sold | 61,962,222 | 48,428,487 | $950,919,386 | $727,016,849 |
| Reinvestment of distributions | 1,501,983 | 875,553 | 22,770,060 | 13,360,944 |
| Shares redeemed | (3,635,653) | (2,447,780) | (55,459,264) | (37,752,360) |
| Net increase (decrease) | 59,828,552 | 46,856,260 | $918,230,182 | $702,625,433 |
| Fidelity Freedom 2040 Fund | | | | |
| Fidelity Freedom 2040 Fund | | | | |
| Shares sold | 114,357,824 | 136,619,831 | $1,212,979,858 | $1,431,492,061 |
| Reinvestment of distributions | 22,477,411 | 33,488,676 | 239,384,409 | 348,747,375 |
| Shares redeemed | (113,943,932) | (139,529,622) | (1,218,390,159) | (1,457,941,134) |
| Net increase (decrease) | 22,891,303 | 30,578,885 | $233,974,108 | $322,298,302 |
| Class K | | | | |
| Shares sold | 127,998,063 | 204,272,570 | $1,366,553,863 | $2,180,144,652 |
| Issued in exchange for the shares of Fidelity Freedom K 2040 Fund | – | 1,209,417,175 | – | 12,432,808,583 |
| Reinvestment of distributions | 33,636,990 | 38,561,612 | 357,897,586 | 412,994,864 |
| Shares redeemed | (234,086,037) | (192,024,994) | (2,494,022,833) | (2,069,340,268) |
| Net increase (decrease) | (72,450,984) | 1,260,226,363 | $(769,571,384) | $12,956,607,831 |
| Class K6 | | | | |
| Shares sold | 81,192,591 | 63,538,724 | $875,001,916 | $671,238,294 |
| Reinvestment of distributions | 2,045,840 | 1,066,834 | 21,767,741 | 11,425,788 |
| Shares redeemed | (4,778,362) | (3,427,354) | (51,099,743) | (37,056,376) |
| Net increase (decrease) | 78,460,069 | 61,178,204 | $845,669,914 | $645,607,706 |
| Fidelity Freedom 2045 Fund | | | | |
| Fidelity Freedom 2045 Fund | | | | |
| Shares sold | 75,278,694 | 83,678,942 | $904,770,311 | $990,525,865 |
| Reinvestment of distributions | 9,991,436 | 13,350,262 | 120,696,554 | 157,549,317 |
| Shares redeemed | (69,963,161) | (72,278,251) | (848,390,338) | (853,762,795) |
| Net increase (decrease) | 15,306,969 | 24,750,953 | $177,076,527 | $294,312,387 |
| Class K | | | | |
| Shares sold | 90,594,687 | 138,438,372 | $1,096,330,973 | $1,672,115,670 |
| Issued in exchange for the shares of Fidelity Freedom K 2045 Fund | – | 680,392,245 | – | 7,906,157,717 |
| Reinvestment of distributions | 18,708,391 | 20,403,619 | 225,623,203 | 247,495,898 |
| Shares redeemed | (145,350,988) | (114,898,251) | (1,756,100,626) | (1,401,257,211) |
| Net increase (decrease) | (36,047,910) | 724,335,985 | $(434,146,450) | $8,424,512,074 |
| Class K6 | | | | |
| Shares sold | 55,104,850 | 35,416,332 | $674,338,014 | $424,716,328 |
| Reinvestment of distributions | 1,072,161 | 497,430 | 12,930,259 | 6,038,804 |
| Shares redeemed | (2,544,483) | (1,761,820) | (30,859,157) | (21,547,868) |
| Net increase (decrease) | 53,632,528 | 34,151,942 | $656,409,116 | $409,207,264 |
| Fidelity Freedom 2050 Fund | | | | |
| Fidelity Freedom 2050 Fund | | | | |
| Shares sold | 62,676,941 | 75,824,728 | $758,627,978 | $902,647,093 |
| Reinvestment of distributions | 8,041,120 | 10,861,802 | 97,699,616 | 128,951,626 |
| Shares redeemed | (55,905,302) | (63,697,605) | (681,837,559) | (756,367,850) |
| Net increase (decrease) | 14,812,759 | 22,988,925 | $174,490,035 | $275,230,869 |
| Class K | | | | |
| Shares sold | 85,023,890 | 122,562,514 | $1,034,677,925 | $1,491,197,304 |
| Issued in exchange for the shares of Fidelity Freedom K 2050 Fund | – | 572,849,516 | – | 6,690,882,218 |
| Reinvestment of distributions | 15,746,600 | 17,173,138 | 191,006,262 | 209,512,284 |
| Shares redeemed | (127,274,019) | (96,878,288) | (1,546,685,578) | (1,187,384,579) |
| Net increase (decrease) | (26,503,529) | 615,706,880 | $(321,001,391) | $7,204,207,227 |
| Class K6 | | | | |
| Shares sold | 46,171,269 | 28,136,620 | $568,148,027 | $340,101,592 |
| Reinvestment of distributions | 823,900 | 358,805 | 10,002,143 | 4,377,425 |
| Shares redeemed | (2,658,062) | (1,536,761) | (32,458,367) | (18,895,572) |
| Net increase (decrease) | 44,337,107 | 26,958,664 | $545,691,803 | $325,583,445 |
| Fidelity Freedom 2055 Fund | | | | |
| Fidelity Freedom 2055 Fund | | | | |
| Shares sold | 30,143,474 | 38,370,551 | $412,297,361 | $515,078,307 |
| Reinvestment of distributions | 2,447,312 | 2,987,887 | 33,577,117 | 40,144,179 |
| Shares redeemed | (22,821,438) | (23,349,667) | (314,192,707) | (313,087,284) |
| Net increase (decrease) | 9,769,348 | 18,008,771 | $131,681,771 | $242,135,202 |
| Class K | | | | |
| Shares sold | 46,944,626 | 61,914,305 | $645,358,663 | $850,947,947 |
| Issued in exchange for the shares of Fidelity Freedom K 2055 Fund | – | 187,145,598 | – | 2,460,964,568 |
| Reinvestment of distributions | 5,152,547 | 5,543,037 | 70,641,422 | 76,216,759 |
| Shares redeemed | (47,923,670) | (35,972,762) | (658,081,760) | (496,645,456) |
| Net increase (decrease) | 4,173,503 | 218,630,178 | $57,918,325 | $2,891,483,818 |
| Class K6 | | | | |
| Shares sold | 19,370,629 | 10,467,862 | $269,291,987 | $142,591,736 |
| Reinvestment of distributions | 267,554 | 125,661 | 3,670,845 | 1,727,838 |
| Shares redeemed | (1,203,845) | (701,172) | (16,583,508) | (9,691,523) |
| Net increase (decrease) | 18,434,338 | 9,892,351 | $256,379,324 | $134,628,051 |
| Fidelity Freedom 2060 Fund | | | | |
| Fidelity Freedom 2060 Fund | | | | |
| Shares sold | 9,862,313 | 13,553,573 | $120,757,734 | $162,527,190 |
| Reinvestment of distributions | 460,211 | 472,322 | 5,642,179 | 5,668,501 |
| Shares redeemed | (5,461,471) | (4,749,212) | (67,177,088) | (56,963,732) |
| Net increase (decrease) | 4,861,053 | 9,276,683 | $59,222,825 | $111,231,959 |
| Class K | | | | |
| Shares sold | 19,320,842 | 21,671,635 | $237,336,253 | $266,499,060 |
| Issued in exchange for the shares of Fidelity Freedom K 2060 Fund | – | 30,017,564 | – | 350,605,136 |
| Reinvestment of distributions | 953,157 | 897,950 | 11,676,178 | 10,999,891 |
| Shares redeemed | (12,034,179) | (7,538,541) | (147,707,053) | (92,630,473) |
| Net increase (decrease) | 8,239,820 | 45,048,608 | $101,305,378 | $535,473,614 |
| Class K6 | | | | |
| Shares sold | 4,634,350 | 2,364,906 | $57,544,228 | $28,724,895 |
| Reinvestment of distributions | 51,151 | 24,823 | 627,109 | 304,083 |
| Shares redeemed | (327,504) | (186,212) | (4,033,992) | (2,286,597) |
| Net increase (decrease) | 4,357,997 | 2,203,517 | $54,137,345 | $26,742,381 |
(a) Amounts for Class K and Class K6 are for the period July 20, 2017 and June 7, 2017, respectively, (commencement of sale of shares) to March 31, 2018.
10. Other.
The Funds' organizational documents provide former and current trustees and officers with a limited indemnification against liabilities arising in connection with the performance of their duties to the Funds. In the normal course of business, the Funds may also enter into contracts that provide general indemnifications. The Funds' maximum exposure under these arrangements is unknown as this would be dependent on future claims that may be made against the Funds. The risk of material loss from such claims is considered remote.
The Funds do not invest in the Underlying Funds for the purpose of exercising management or control; however, investments by the Funds within their principal investment strategies may represent a significant portion of the Underlying Fund's net assets. At the end of the period, the following Funds were the owners of record of 10% or more of the total outstanding shares of the Underlying Funds.
| | Fidelity Freedom 2010 Fund | Fidelity Freedom 2015 Fund | Fidelity Freedom 2025 Fund | Fidelity Freedom 2030 Fund | Fidelity Freedom 2035 Fund | Fidelity Freedom 2040 Fund | Fidelity Freedom 2045 Fund |
| Fidelity Series Small Cap Opportunities Fund | – | – | 11% | 16% | 13% | 14% | – |
| Fidelity Series Investment Grade Bond Fund | – | 10% | 21% | 19% | 1% | – | – |
| Fidelity Series All-Sector Equity Fund | – | – | 10% | 15% | 13% | 15% | – |
| Fidelity Series Emerging Markets Opportunities Fund | – | – | 12% | 16% | 13% | 14% | – |
| Fidelity Series Inflation-Protected Bond Index Fund | 10% | 12% | 19% | – | – | – | – |
| Fidelity Series High Income Fund | – | – | 14% | 16% | 11% | 11% | – |
| Fidelity Series Floating Rate High Income Fund | – | – | 14% | 16% | 11% | 11% | – |
| Fidelity Series Real Estate Income Fund | – | – | 14% | 16% | 11% | 11% | – |
| Fidelity Series Commodity Strategy Fund | – | – | 13% | 16% | 11% | 12% | – |
| Fidelity Series International Growth Fund | – | – | 11% | 16% | 13% | 14% | – |
| Fidelity Series International Value Fund | – | – | 11% | 16% | 13% | 14% | – |
| Fidelity Series International Small Cap Fund | – | – | 11% | 16% | 13% | 14% | – |
| Fidelity Series Emerging Markets Debt Fund | – | – | 14% | 16% | 10% | 11% | – |
| Fidelity Series Value Discovery Fund | – | – | 11% | 16% | 13% | 13% | – |
| Fidelity Series Intrinsic Opportunities Fund | – | – | 13% | 18% | 15% | 16% | – |
| Fidelity Series Large Cap Stock Fund | – | – | 11% | 16% | 13% | 14% | – |
| Fidelity Series Opportunistic Insights Fund | – | – | 11% | 16% | 13% | 14% | – |
| Fidelity Series Stock Selector Large Cap Value Fund | – | – | 11% | 16% | 13% | 14% | – |
| Fidelity Series Growth Company Fund | – | – | 12% | 18% | 15% | 16% | 10% |
| Fidelity Series Blue Chip Growth Fund | – | – | 12% | 18% | 15% | 16% | 10% |
| Fidelity Series Large Cap Value Index Fund | – | – | 12% | 18% | 14% | 15% | – |
| Fidelity Series Small Cap Discovery Fund | – | – | 13% | 18% | 15% | 15% | – |
| Fidelity Series Short-Term Credit Fund | – | 11% | 18% | – | – | – | – |
| Fidelity Series Government Money Market Fund | – | 10% | 15% | – | – | – | – |
| Fidelity Series Long-Term Treasury Bond Index Fund | – | – | 14% | 17% | 12% | – | – |
| Fidelity Series International Credit Fund | – | – | 15% | 15% | 10% | 10% | – |
| Fidelity Series Canada Fund | – | – | 12% | 16% | 13% | 14% | – |
| Fidelity Series Emerging Markets Fund | – | – | – | – | – | 15% | – |
The Funds, in aggregate, were the owners of record of more than 20% of the total outstanding shares of the following Underlying Funds.
| Fund | % of shares held |
| Fidelity Series Small Cap Opportunities Fund | 89% |
| Fidelity Series Investment Grade Bond Fund | 91% |
| Fidelity Series All-Sector Equity Fund | 87% |
| Fidelity Series Emerging Markets Opportunities Fund | 90% |
| Fidelity Series Inflation-Protected Bond Index Fund | 83% |
| Fidelity Series High Income Fund | 91% |
| Fidelity Series Floating Rate High Income Fund | 90% |
| Fidelity Series Real Estate Income Fund | 90% |
| Fidelity Series Commodity Strategy Fund | 90% |
| Fidelity Series International Growth Fund | 90% |
| Fidelity Series International Value Fund | 90% |
| Fidelity Series International Small Cap Fund | 90% |
| Fidelity Series Emerging Markets Debt Fund | 90% |
| Fidelity Series Value Discovery Fund | 86% |
| Fidelity Series Intrinsic Opportunities Fund | 99% |
| Fidelity Series Large Cap Stock Fund | 88% |
| Fidelity Series Opportunistic Insights Fund | 87% |
| Fidelity Series Stock Selector Large Cap Value Fund | 89% |
| Fidelity Series Growth Company Fund | 99% |
| Fidelity Series Blue Chip Growth Fund | 99% |
| Fidelity Series Large Cap Value Index Fund | 94% |
| Fidelity Series Small Cap Discovery Fund | 99% |
| Fidelity Series Short-Term Credit Fund | 91% |
| Fidelity Series Government Money Market Fund | 91% |
| Fidelity Series Long-Term Treasury Bond Index Fund | 83% |
| Fidelity Series International Credit Fund | 91% |
| Fidelity Series Canada Fund | 90% |
| Fidelity Series Emerging Markets Fund | 67% |
11. Prior Year Merger Information.
On September 8, 2017, each Surviving Fund acquired all of the assets and assumed all of the liabilities of each Target Fund pursuant to each Agreement and Plan of Reorganization approved by the Board of Trustees ("The Board"). Each acquisition was accomplished by an exchange of Class K shares of each Surviving Fund for corresponding shares then outstanding of each Target Fund, at their respective net asset value on the acquisition date. In addition, the Board approved the creation of additional classes of shares that commenced sale of shares on July 20, 2017. The reorganization provided shareholders of each Target Fund access to a larger portfolio with a similar investment objective and lower expenses. The reorganization qualified as a tax-free reorganization for federal income tax purposes with no gain or loss recognized to the funds or their shareholders.
Combined total net assets after the acquisition are as follows:
| Target Funds | Securities | Unrealized appreciation (depreciation) | Net Assets | Surviving Funds | Net assets | Total net assets after the acquisition |
| Fidelity Freedom K 2005 Fund | $412,419,889 | $40,449,279 | $412,589,249 | Fidelity Freedom 2005 Fund | $610,614,214 | $1,023,203,463 |
| Fidelity Freedom K 2010 Fund | 2,546,556,623 | 329,226,460 | 2,547,535,809 | Fidelity Freedom 2010 Fund | 4,238,458,400 | 6,785,994,209 |
| Fidelity Freedom K 2015 Fund | 4,746,815,623 | 696,286,166 | 4,748,505,056 | Fidelity Freedom 2015 Fund | 5,645,731,933 | 10,394,236,989 |
| Fidelity Freedom K 2020 Fund | 16,278,675,415 | 2,424,773,804 | 16,284,141,352 | Fidelity Freedom 2020 Fund | 13,414,449,646 | 29,698,590,998 |
| Fidelity Freedom K 2025 Fund | 14,636,906,056 | 2,237,270,202 | 14,641,455,337 | Fidelity Freedom 2025 Fund | 11,194,758,422 | 25,836,213,759 |
| Fidelity Freedom K 2030 Fund | 17,209,401,290 | 3,150,938,702 | 17,213,886,716 | Fidelity Freedom 2030 Fund | 12,912,345,253 | 30,126,231,969 |
| Fidelity Freedom K 2035 Fund | 11,858,805,237 | 2,326,083,837 | 11,861,189,816 | Fidelity Freedom 2035 Fund | 8,269,361,979 | 20,130,551,795 |
| Fidelity Freedom K 2040 Fund | 12,430,342,176 | 2,512,607,175 | 12,432,808,583 | Fidelity Freedom 2040 Fund | 8,489,396,048 | 20,922,204,631 |
| Fidelity Freedom K 2045 Fund | 7,904,615,516 | 1,469,965,780 | 7,906,157,717 | Fidelity Freedom 2045 Fund | 4,301,147,363 | 12,207,305,080 |
| Fidelity Freedom K 2050 Fund | 6,689,588,035 | 1,219,930,995 | 6,690,882,218 | Fidelity Freedom 2050 Fund | 3,509,123,170 | 10,200,005,388 |
| Fidelity Freedom K 2055 Fund | 2,460,473,831 | 326,647,894 | 2,460,964,568 | Fidelity Freedom 2055 Fund | 1,221,516,226 | 3,682,480,794 |
| Fidelity Freedom K 2060 Fund | 350,535,702 | 37,076,005 | 350,605,136 | Fidelity Freedom 2060 Fund | 184,982,168 | 535,587,304 |
| Fidelity Freedom K Income Fund | 1,612,974,652 | 111,654,038 | 1,613,678,107 | Fidelity Freedom Income Fund | 2,180,776,091 | 3,794,454,198 |
Pro forma results of operations of the combined entity for the entire period ended March 31, 2018, as though the acquisition had occurred as of the beginning of the year (rather than on the actual acquisition date), are as follows:
| Surviving Funds | Net investment income (loss) | Total net realized gain (loss) | Total change in net unrealized appreciation (depreciation) | Net increase (decrease) in net assets resulting from operations |
| Fidelity Freedom 2005 Fund | $16,728,029 | $35,389,643 | $11,609,337 | $63,727,009 |
| Fidelity Freedom 2010 Fund | 106,763,939 | 333,966,494 | 71,884,105 | 512,614,538 |
| Fidelity Freedom 2015 Fund | 159,942,201 | 586,125,932 | 165,934,516 | 912,002,649 |
| Fidelity Freedom 2020 Fund | 450,417,256 | 1,534,035,495 | 849,346,252 | 2,833,799,003 |
| Fidelity Freedom 2025 Fund | 380,268,141 | 1,245,869,247 | 1,016,040,300 | 2,642,177,688 |
| Fidelity Freedom 2030 Fund | 412,091,376 | 1,721,922,624 | 1,479,580,811 | 3,613,594,811 |
| Fidelity Freedom 2035 Fund | 242,223,907 | 1,155,921,037 | 1,298,580,090 | 2,696,725,034 |
| Fidelity Freedom 2040 Fund | 248,017,447 | 1,233,803,836 | 1,365,296,048 | 2,847,117,331 |
| Fidelity Freedom 2045 Fund | 146,215,610 | 672,902,843 | 832,531,991 | 1,651,650,444 |
| Fidelity Freedom 2050 Fund | 122,703,111 | 561,458,056 | 703,867,025 | 1,388,028,192 |
| Fidelity Freedom 2055 Fund | 45,262,250 | 182,494,227 | 254,156,558 | 481,913,035 |
| Fidelity Freedom 2060 Fund | 7,044,354 | 27,215,638 | 32,045,178 | 66,305,170 |
| Fidelity Freedom Income Fund | 63,379,287 | 104,507,706 | 13,301,658 | 181,188,651 |
Because each combined investment portfolio have been managed as a single portfolio since each acquisition was completed, it is not practicable to separate the amounts of revenue and earnings of each Target Fund that have been included in the Surviving Fund's accompanying Statement of Operations since September 8, 2017.
Shareholder Expense Example
As a shareholder of a Fund, you incur two types of costs: (1) transaction costs and (2) ongoing costs, including other Fund expenses. This Example is intended to help you understand your ongoing costs (in dollars) of investing in the Funds and to compare these costs with the ongoing costs of investing in other mutual funds.
The Example is based on an investment of $1,000 invested at the beginning of the period and held for the entire period (April 1, 2018 to September 30, 2018).
Actual Expenses
The first line of the accompanying table for each Class of each fund provides information about actual account values and actual expenses. You may use the information in this line, together with the amount you invested, to estimate the expenses that you paid over the period. Simply divide your account value by $1,000.00 (for example, an $8,600 account value divided by $1,000.00 = 8.6), then multiply the result by the number in the first line for a Class of the fund under the heading entitled "Expenses Paid During Period" to estimate the expenses you paid on your account during this period. A small balance maintenance fee of $12.00 that is charged once a year may apply for certain accounts with a value of less than $2,000. This fee, which was eliminated effective August 1, 2018, is not included in the table below. If it was, the estimate of expenses you paid during the period would be higher, and your ending account value lower, by this amount. In addition, each Fund, as a shareholder in underlying Fidelity Funds, will indirectly bear its pro-rata share of the fees and expenses incurred by the underlying Fidelity Funds. These fees and expenses are not included in each Fund's annualized expense ratio used to calculate the expense estimates in the table below.
Hypothetical Example for Comparison Purposes
The second line of the accompanying table for each Class of each fund provides information about hypothetical account values and hypothetical expenses based on a Class' actual expense ratio and an assumed rate of return of 5% per year before expenses, which is not the Class' actual return. The hypothetical account values and expenses may not be used to estimate the actual ending account balance or expenses you paid for the period. You may use this information to compare the ongoing costs of investing in the Fund and other funds. To do so, compare this 5% hypothetical example with the 5% hypothetical examples that appear in the shareholder reports of the other funds. A small balance maintenance fee of $12.00 that is charged once a year may apply for certain accounts with a value of less than $2,000. This fee, which was eliminated effective August 1, 2018, is not included in the table below. If it was, the estimate of expenses you paid during the period would be higher, and your ending account value lower, by this amount. In addition, each Fund, as a shareholder in underlying Fidelity Funds, will indirectly bear its pro-rata share of the fees and expenses incurred by the underlying Fidelity Funds. These fees and expenses are not included in each Fund's annualized expense ratio used to calculate the expense estimates in the table below.
Please note that the expenses shown in the table are meant to highlight your ongoing costs only and do not reflect any transaction costs. Therefore, the second line of the table is useful in comparing ongoing costs only, and will not help you determine the relative total costs of owning different funds.
| | Annualized Expense Ratio-A | Beginning
Account Value
April 1, 2018 | Ending
Account Value
September 30, 2018 | Expenses Paid
During Period-B
April 1, 2018
to September 30, 2018 |
| Fidelity Freedom Income Fund | | | | |
| Fidelity Freedom Income Fund | .46% | | | |
| Actual | | $1,000.00 | $1,008.30 | $2.32 |
| Hypothetical-C | | $1,000.00 | $1,022.76 | $2.33 |
| Class K | .41% | | | |
| Actual | | $1,000.00 | $1,007.80 | $2.06 |
| Hypothetical-C | | $1,000.00 | $1,023.01 | $2.08 |
| Class K6 | .37% | | | |
| Actual | | $1,000.00 | $1,008.30 | $1.86 |
| Hypothetical-C | | $1,000.00 | $1,023.21 | $1.88 |
| Fidelity Freedom 2005 Fund | | | | |
| Fidelity Freedom 2005 Fund | .48% | | | |
| Actual | | $1,000.00 | $1,012.80 | $2.42 |
| Hypothetical-C | | $1,000.00 | $1,022.66 | $2.43 |
| Class K | .43% | | | |
| Actual | | $1,000.00 | $1,012.10 | $2.17 |
| Hypothetical-C | | $1,000.00 | $1,022.91 | $2.18 |
| Class K6 | .37% | | | |
| Actual | | $1,000.00 | $1,013.40 | $1.87 |
| Hypothetical-C | | $1,000.00 | $1,023.21 | $1.88 |
| Fidelity Freedom 2010 Fund | | | | |
| Fidelity Freedom 2010 Fund | .52% | | | |
| Actual | | $1,000.00 | $1,017.10 | $2.63 |
| Hypothetical-C | | $1,000.00 | $1,022.46 | $2.64 |
| Class K | .46% | | | |
| Actual | | $1,000.00 | $1,017.20 | $2.33 |
| Hypothetical-C | | $1,000.00 | $1,022.76 | $2.33 |
| Class K6 | .39% | | | |
| Actual | | $1,000.00 | $1,017.20 | $1.97 |
| Hypothetical-C | | $1,000.00 | $1,023.11 | $1.98 |
| Fidelity Freedom 2015 Fund | | | | |
| Fidelity Freedom 2015 Fund | .57% | | | |
| Actual | | $1,000.00 | $1,021.60 | $2.89 |
| Hypothetical-C | | $1,000.00 | $1,022.21 | $2.89 |
| Class K | .50% | | | |
| Actual | | $1,000.00 | $1,021.70 | $2.53 |
| Hypothetical-C | | $1,000.00 | $1,022.56 | $2.54 |
| Class K6 | .41% | | | |
| Actual | | $1,000.00 | $1,022.40 | $2.08 |
| Hypothetical-C | | $1,000.00 | $1,023.01 | $2.08 |
| Fidelity Freedom 2020 Fund | | | | |
| Fidelity Freedom 2020 Fund | .61% | | | |
| Actual | | $1,000.00 | $1,025.00 | $3.10 |
| Hypothetical-C | | $1,000.00 | $1,022.01 | $3.09 |
| Class K | .53% | | | |
| Actual | | $1,000.00 | $1,025.70 | $2.69 |
| Hypothetical-C | | $1,000.00 | $1,022.41 | $2.69 |
| Class K6 | .43% | | | |
| Actual | | $1,000.00 | $1,026.40 | $2.18 |
| Hypothetical-C | | $1,000.00 | $1,022.91 | $2.18 |
| Fidelity Freedom 2025 Fund | | | | |
| Fidelity Freedom 2025 Fund | .65% | | | |
| Actual | | $1,000.00 | $1,028.80 | $3.31 |
| Hypothetical-C | | $1,000.00 | $1,021.81 | $3.29 |
| Class K | .57% | | | |
| Actual | | $1,000.00 | $1,028.90 | $2.90 |
| Hypothetical-C | | $1,000.00 | $1,022.21 | $2.89 |
| Class K6 | .45% | | | |
| Actual | | $1,000.00 | $1,029.60 | $2.29 |
| Hypothetical-C | | $1,000.00 | $1,022.81 | $2.28 |
| Fidelity Freedom 2030 Fund | | | | |
| Fidelity Freedom 2030 Fund | .70% | | | |
| Actual | | $1,000.00 | $1,035.20 | $3.57 |
| Hypothetical-C | | $1,000.00 | $1,021.56 | $3.55 |
| Class K | .60% | | | |
| Actual | | $1,000.00 | $1,035.30 | $3.06 |
| Hypothetical-C | | $1,000.00 | $1,022.06 | $3.04 |
| Class K6 | .47% | | | |
| Actual | | $1,000.00 | $1,036.00 | $2.40 |
| Hypothetical-C | | $1,000.00 | $1,022.71 | $2.38 |
| Fidelity Freedom 2035 Fund | | | | |
| Fidelity Freedom 2035 Fund | .74% | | | |
| Actual | | $1,000.00 | $1,042.40 | $3.79 |
| Hypothetical-C | | $1,000.00 | $1,021.36 | $3.75 |
| Class K | .64% | | | |
| Actual | | $1,000.00 | $1,043.20 | $3.28 |
| Hypothetical-C | | $1,000.00 | $1,021.86 | $3.24 |
| Class K6 | .49% | | | |
| Actual | | $1,000.00 | $1,043.80 | $2.51 |
| Hypothetical-C | | $1,000.00 | $1,022.61 | $2.48 |
| Fidelity Freedom 2040 Fund | | | | |
| Fidelity Freedom 2040 Fund | .75% | | | |
| Actual | | $1,000.00 | $1,044.80 | $3.84 |
| Hypothetical-C | | $1,000.00 | $1,021.31 | $3.80 |
| Class K | .64% | | | |
| Actual | | $1,000.00 | $1,045.90 | $3.28 |
| Hypothetical-C | | $1,000.00 | $1,021.86 | $3.24 |
| Class K6 | .49% | | | |
| Actual | | $1,000.00 | $1,046.70 | $2.51 |
| Hypothetical-C | | $1,000.00 | $1,022.61 | $2.48 |
| Fidelity Freedom 2045 Fund | | | | |
| Fidelity Freedom 2045 Fund | .75% | | | |
| Actual | | $1,000.00 | $1,045.30 | $3.85 |
| Hypothetical-C | | $1,000.00 | $1,021.31 | $3.80 |
| Class K | .64% | | | |
| Actual | | $1,000.00 | $1,045.50 | $3.28 |
| Hypothetical-C | | $1,000.00 | $1,021.86 | $3.24 |
| Class K6 | .49% | | | |
| Actual | | $1,000.00 | $1,046.10 | $2.51 |
| Hypothetical-C | | $1,000.00 | $1,022.61 | $2.48 |
| Fidelity Freedom 2050 Fund | | | | |
| Fidelity Freedom 2050 Fund | .75% | | | |
| Actual | | $1,000.00 | $1,044.80 | $3.84 |
| Hypothetical-C | | $1,000.00 | $1,021.31 | $3.80 |
| Class K | .64% | | | |
| Actual | | $1,000.00 | $1,045.70 | $3.28 |
| Hypothetical-C | | $1,000.00 | $1,021.86 | $3.24 |
| Class K6 | .49% | | | |
| Actual | | $1,000.00 | $1,046.50 | $2.51 |
| Hypothetical-C | | $1,000.00 | $1,022.61 | $2.48 |
| Fidelity Freedom 2055 Fund | | | | |
| Fidelity Freedom 2055 Fund | .75% | | | |
| Actual | | $1,000.00 | $1,044.80 | $3.84 |
| Hypothetical-C | | $1,000.00 | $1,021.31 | $3.80 |
| Class K | .64% | | | |
| Actual | | $1,000.00 | $1,045.60 | $3.28 |
| Hypothetical-C | | $1,000.00 | $1,021.86 | $3.24 |
| Class K6 | .49% | | | |
| Actual | | $1,000.00 | $1,046.30 | $2.51 |
| Hypothetical-C | | $1,000.00 | $1,022.61 | $2.48 |
| Fidelity Freedom 2060 Fund | | | | |
| Fidelity Freedom 2060 Fund | .75% | | | |
| Actual | | $1,000.00 | $1,044.90 | $3.84 |
| Hypothetical-C | | $1,000.00 | $1,021.31 | $3.80 |
| Class K | .64% | | | |
| Actual | | $1,000.00 | $1,045.80 | $3.28 |
| Hypothetical-C | | $1,000.00 | $1,021.86 | $3.24 |
| Class K6 | .49% | | | |
| Actual | | $1,000.00 | $1,046.60 | $2.51 |
| Hypothetical-C | | $1,000.00 | $1,022.61 | $2.48 |
A Annualized expense ratio reflects expenses net of applicable fee waivers.
B Expenses are equal to each Class' annualized expense ratio, multiplied by the average account value over the period, multiplied by 183/ 365 (to reflect the one-half year period). The fees and expenses of the underlying Fidelity Funds in which each Fund invests are not included in each Fund's annualized expense ratio.
C 5% return per year before expenses
Board Approval of Investment Advisory Contracts and Management Fees
Fidelity Freedom Funds
Each year, the Board of Trustees, including the Independent Trustees (together, the Board), votes on the renewal of the management contract (the Advisory Contract) with FMR Co., Inc. (FMRC), an affiliate of Fidelity Management & Research Company (FMR), for each fund. The Board, assisted by the advice of fund counsel and Independent Trustees' counsel, requests and considers a broad range of information relevant to the renewal of the Advisory Contracts throughout the year.
The Board meets regularly and, at each of its meetings, covers an extensive agenda of topics and materials and considers factors that are relevant to its annual consideration of the renewal of each fund's Advisory Contract, including the services and support provided to each fund and its shareholders. The Board has established four standing committees (Committees) — Operations, Audit, Fair Valuation, and Governance and Nominating — each composed of and chaired by Independent Trustees with varying backgrounds, to which the Board has assigned specific subject matter responsibilities in order to enhance effective decision-making by the Board. The Operations Committee, of which all of the Independent Trustees are members, meets regularly throughout the year and considers, among other matters, information specifically related to the annual consideration of the renewal of each fund's Advisory Contract. The Board, acting directly and through its Committees, requests and receives information concerning the annual consideration of the renewal of each fund's Advisory Contract. The Board also meets as needed to review matters specifically related to the Board's annual consideration of the renewal of the Advisory Contracts. Members of the Board may also meet with trustees of other Fidelity funds through joint ad hoc committees to discuss certain matters relevant to all of the Fidelity funds.
At its September 2018 meeting, the Board unanimously determined to renew each fund's Advisory Contract. In reaching its determination, the Board considered all factors it believed relevant, including (i) the nature, extent, and quality of the services to be provided to each fund and its shareholders (including the investment performance of each fund); (ii) the competitiveness of each fund's management fee and total expense ratio relative to peer funds; (iii) the total costs of the services to be provided by and the profits to be realized by Fidelity from its relationships with each fund; and (iv) the extent to which, if any, economies of scale exist and would be realized as each fund grows, and whether any economies of scale are appropriately shared with fund shareholders. The Board also considered that, effective June 1, 2017, each fund had implemented a new fee structure whereby it pays an all-inclusive management fee that covers all operating expenses of the fund, subject to certain exceptions, and varies by class (unified fee) and the underlying Fidelity funds in which the fund invests (Series Funds) no longer pay expenses, with certain limited exceptions. In connection with the renewal of the Advisory Contracts for the funds, the Board and the board of other funds that invest their assets in Series Funds and the boards of the Series Funds formed a joint ad hoc committee to review the responsibilities of each board related to the consideration of the renewal of the Advisory Contracts for the funds, other funds that invest substantially all of their assets in Series Funds, and the Series Funds.
In considering whether to renew the Advisory Contract for each fund, the Board reached a determination, with the assistance of fund counsel and Independent Trustees' counsel and through the exercise of its business judgment, that the renewal of the Advisory Contract was in the best interests of each fund and its shareholders and that the compensation payable under the Advisory Contracts was fair and reasonable. The Board's decision to renew the Advisory Contracts was not based on any single factor, but rather was based on a comprehensive consideration of all the information provided to the Board at its meetings throughout the year. The Board, in reaching its determination to renew the Advisory Contracts, was aware that shareholders of each fund have a broad range of investment choices available to them, including a wide choice among funds offered by Fidelity's competitors, and that each fund's shareholders, who have the opportunity to review and weigh the disclosure provided by the fund in its prospectus and other public disclosures, have chosen to invest in that fund, which is part of the Fidelity family of funds.
Nature, Extent, and Quality of Services Provided. The Board considered Fidelity's staffing as it relates to the funds, including the backgrounds of investment personnel of FMRC, and also considered the funds' investment objectives, strategies, and related investment philosophies. The Independent Trustees also had discussions with senior management of Fidelity's investment operations and investment groups with responsibility for the Series Funds. The Board considered the structure of the investment personnel compensation program and whether this structure provides appropriate incentives to act in the best interests of each fund. Additionally, the Board considered the portfolio managers' investments, if any, in the funds that they manage.
Resources Dedicated to Investment Management and Support Services. The Board reviewed the general qualifications and capabilities of Fidelity's investment staff, including its size, education, experience, and resources, as well as Fidelity's approach to recruiting, managing, and compensating investment personnel. The Board noted that Fidelity has continued to increase the resources devoted to non-U.S. offices, including expansion of Fidelity's global investment organization. The Board also noted that Fidelity's analysts have extensive resources, tools and capabilities that allow them to conduct sophisticated quantitative and fundamental analysis, as well as credit analysis of issuers, counterparties and guarantors. Further, the Board considered that Fidelity's investment professionals have sufficient access to global information and data so as to provide competitive investment results over time, and that those professionals also have access to sophisticated tools that permit them to assess portfolio construction and risk and performance attribution characteristics continuously, as well as to transmit new information and research conclusions rapidly around the world. Additionally, in its deliberations, the Board considered Fidelity's risk management, compliance, and technology and operations capabilities and resources, which are integral parts of the investment management process.
Shareholder and Administrative Services. The Board considered (i) the nature, extent, quality, and cost of advisory, administrative, and shareholder services performed by Fidelity under the Advisory Contract and under separate agreements covering transfer agency and pricing and bookkeeping services for each fund; (ii) the nature and extent of the supervision of third party service providers, principally custodians, subcustodians, and pricing vendors; and (iii) the resources devoted to, and the record of compliance with, each fund's compliance policies and procedures.
The Board noted that the growth of fund assets over time across the complex allows Fidelity to reinvest in the development of services designed to enhance the value and convenience of the Fidelity funds as investment vehicles. These services include 24-hour access to account information and market information through telephone representatives and over the Internet, investor education materials and asset allocation tools, and the expanded availability of Fidelity Investor Centers.
Investment in a Large Fund Family. The Board considered the benefits to shareholders of investing in a Fidelity fund, including the benefits of investing in a fund that is part of a large family of funds offering a variety of investment disciplines and providing a large variety of mutual fund investor services. The Board noted that Fidelity had taken, or had made recommendations that resulted in the Fidelity funds taking, a number of actions over the previous year that benefited particular funds, including: (i) continuing to dedicate additional resources to Fidelity's investment research process, which includes meetings with management of issuers of securities in which the funds invest, and to the support of the senior management team that oversees asset management; (ii) continuing efforts to enhance Fidelity's global research capabilities; (iii) launching new funds and making other enhancements to meet client needs; (iv) launching new share classes of existing funds; (v) eliminating purchase minimums and broadening eligibility requirements for certain funds and share classes; (vi) reducing management fees and total expenses for certain growth equity funds and index funds; (vii) lowering expense caps for certain existing funds and classes, and converting certain voluntary expense caps to contractual caps, to reduce expenses borne by shareholders; (viii) eliminating short-term redemption fees for funds that had such fees; (ix) rationalizing product lines and gaining increased efficiencies from fund mergers and share class consolidations; (x) continuing to develop, acquire and implement systems and technology to improve services to the funds and shareholders, strengthen information security, and increase efficiency; and (xi) continuing to implement enhancements to further strengthen Fidelity's product line to increase investors' probability of success in achieving their investment goals, including retirement income goals.
Investment Performance. The Board considered whether each fund has operated in accordance with its investment objective, as well as its record of compliance with its investment restrictions and its performance history.
The Board took into account discussions that occur at Board meetings throughout the year with representatives of the investment adviser about fund investment performance. In this regard the Board noted that as part of regularly scheduled fund reviews and other reports to the Board on fund performance, the Board considers annualized return information for each fund for different time periods, measured against one or more appropriate securities market indices, including a customized blended index that reflects the respective weights of the fund's asset classes (each a "benchmark index") and a peer group of funds with similar objectives ("peer group"), if any. In its evaluation of fund investment performance at meetings throughout the year, the Board gave particular attention to information indicating underperformance of certain Fidelity funds for specific time periods and discussed with the investment adviser the reasons for such underperformance.
In addition to reviewing absolute and relative fund performance, the Independent Trustees periodically consider the appropriateness of fund performance metrics in evaluating the results achieved. In general, the Independent Trustees believe that fund performance should be evaluated based on gross performance (before fees and expenses, including acquired fund fees and expenses, but after transaction costs, if any) compared to appropriate benchmark indices, over appropriate time periods that may include full market cycles, and on net performance (after fees and expenses, including acquired fund fees and expenses, if any) compared to peer groups, as applicable, over the same periods, taking into account relevant factors including the following: general market conditions; the extent to which particular underlying funds affected performance; and fund cash flows and other factors. Depending on the circumstances, the Independent Trustees may be satisfied with a fund's performance notwithstanding that it lags its benchmark index or peer group for certain periods.
The Independent Trustees recognize that shareholders evaluate performance on a net basis over their own holding periods, for which one-, three-, and five-year periods are often used as a proxy. For this reason, the performance information reviewed by the Board also included net cumulative calendar year total return information for each fund and an appropriate benchmark index for the most recent one-, three-, and five-year periods (for the most recent one- and three-year periods for Freedom 2060 Fund).
Based on its review, the Board concluded that the nature, extent, and quality of services provided to each fund under the Advisory Contracts should continue to benefit the shareholders of each fund.
Competitiveness of Management Fee and Total Expense Ratio. The Board considered each fund's management fee and total expense ratio compared to "mapped groups" of competitive funds and classes created for the purpose of facilitating the Trustees' competitive analysis of management fees and total expenses. Fidelity creates "mapped groups" by combining similar Lipper investment objective categories that have comparable investment mandates. Combining Lipper investment objective categories aids the Board's management fee and total expense ratio comparisons by broadening the competitive group used for comparison.
Management Fee. The Board considered two proprietary management fee comparisons for the 12-month periods shown in basis points (BP) in the charts below. The group of Lipper funds used by the Board for management fee comparisons is referred to below as the "Total Mapped Group." The Total Mapped Group comparison focuses on a fund's standing in terms of gross management fees before expense reimbursements or caps relative to the total universe of funds with comparable investment mandates, regardless of whether their management fee structures also are comparable. Funds with comparable investment mandates offer exposure to similar types of securities. Funds with comparable management fee structures have similar management fee contractual arrangements (
e.g., flat rate charged for advisory services, all-inclusive fee rate,
etc.). "TMG %" represents the percentage of funds in the Total Mapped Group that had management fees that were lower than a fund's. For example, a hypothetical TMG % of 20% would mean that 80% of the funds in the Total Mapped Group had higher, and 20% had lower, management fees than a fund. The funds' actual TMG %s and the number of funds in the Total Mapped Group are in the charts below. The "Asset-Size Peer Group" (ASPG) comparison focuses on a fund's standing relative to a subset of non-Fidelity funds within the Total Mapped Group that are similar in size and management fee structure. For example, if a fund is in the first quartile of the ASPG, the fund's management fee ranks in the least expensive or lowest 25% of funds in the ASPG. The ASPG represents at least 15% of the funds in the Total Mapped Group with comparable asset size and management fee structures, subject to a minimum of 50 funds (or all funds in the Total Mapped Group if fewer than 50). Additional information, such as the ASPG quartile in which a fund's management fee rate ranked, is also included in the charts and was considered by the Board. The Board considered that the charts below reflect the funds' fee structure effective June 1, 2017, as if it was in effect for the entire year.
Fidelity Freedom 2005 Fund
Fidelity Freedom 2010 Fund
Fidelity Freedom 2015 Fund
Fidelity Freedom 2020 Fund
Fidelity Freedom 2025 Fund
Fidelity Freedom 2030 Fund
Fidelity Freedom 2035 Fund
Fidelity Freedom 2040 Fund
Fidelity Freedom 2045 Fund
Fidelity Freedom 2050 Fund
Fidelity Freedom 2055 Fund
Fidelity Freedom 2060 Fund
Fidelity Freedom Income Fund
The Board compared each fund's class-level management fee rate for the current fiscal year relative to the median of its competitor funds in the applicable Total Mapped Group based on competitive data for 2017. The Board noted that each fund's class-level management fee rate ranks above the median of its competitor funds in the applicable Total Mapped Group based on competitive data for 2017. The Board noted that the majority of peer funds do not have top-level management fees, similar to the funds' fee structure prior to June 1, 2017. The Board also noted that the funds' total expense comparisons, which include the expenses of the Series Funds, facilitate better comparisons with funds and classes that use different expense structures and that the funds' total expense ratio comparisons to competitors generally were more favorable.
Based on its review, the Board concluded that each fund's management fee is fair and reasonable in light of the services that the fund receives and the other factors considered.
Total Expense Ratio. In its review of the total expense ratio of each class of each fund, the Board considered the fund's class-level management fee rate under the Advisory Contract. The Board also considered other expenses, such as transfer agent fees, pricing and bookkeeping fees, and custodial, legal, and audit fees, paid by FMR under the unified fee arrangement. The Board also noted that Fidelity may agree to waive fees and expenses from time to time, and the extent to which, if any, it has done so for each fund. As part of its review, the Board considered the total expense ratio of each class of each fund compared to the median total expenses for competitor funds (including expenses of underlying funds) based on competitive data for 2017. Each class of each fund is compared to those funds and classes in the Total Mapped Group (used by the Board for management fee comparisons) that have a similar sales load structure.
The Board noted that each fund offers multiple classes and that the multiple structures are intended to offer pricing options for the intermediary market. The Board also noted that the total expense ratios of the classes of each fund vary primarily due to differences in transfer agent fees. The Board considered that, in general, various factors can affect total expense ratios.
The Board noted that the total expense ratio of the retail class (including expenses of the Series Funds): (i) ranked below the competitive median for 2017 for Freedom 2005 Fund, Freedom 2010 Fund, Freedom 2015 Fund, Freedom 2025 Fund, Freedom 2030 Fund, Freedom 2035 Fund, and Freedom Income Fund; (ii) ranked equal to the competitive median for 2017 for Freedom 2040 Fund, Freedom 2045 Fund, Freedom 2050 Fund, Freedom 2055 Fund, and Freedom 2060 Fund; and (iii) ranked above the competitive median for 2017 for Freedom 2020 Fund. The Board noted that for Freedom 2020 Fund, the total expense ratio of the retail class is above the competitive median because a number of competitor target date funds are classified by Lipper as active, even though their underlying holdings are primarily passive. The Board considered that, when the Total Mapped Group is adjusted to remove funds that invest primarily in passive products, the total expense ratio of the retail class of Freedom 2020 Fund ranks below the competitive median.
The Board noted that the total expense ratio of each of Class K and Class K6 (including expenses of the Series Funds) for each fund ranked below the competitive median for 2017.
The Board considered that current contractual arrangements for the fund oblige FMR to pay all "class-level" expenses of Class K6 of each fund to the extent necessary to limit total operating expenses, with certain exceptions, to an amount specified in the applicable expense contract.
These contractual arrangements may not be amended to increase the fees or expenses payable by Class K6 of a fund except by a vote of a majority of the Board of Trustees and by a vote of a majority of the outstanding voting securities of Class K6 of the applicable fund.
Fees Charged to Other Fidelity Clients. The Board also considered Fidelity fee structures and other information with respect to clients of Fidelity, such as other funds advised or subadvised by Fidelity, pension plan clients, and other institutional clients with similar mandates. The Board noted that a joint ad hoc committee created by it and the boards of other Fidelity funds periodically reviews and compares Fidelity's institutional investment advisory business with its business of providing services to the Fidelity funds and also noted the most recent findings of the committee. The Board noted that the committee's review included a consideration of the differences in services provided, fees charged, and costs incurred, as well as competition in the markets serving the different categories of clients.
Based on its review of total expense ratios and fees charged to other Fidelity clients, the Board concluded that the total expense ratio of each class of each fund was reasonable in light of the services that the fund and its shareholders receive and the other factors considered.
Costs of the Services and Profitability. The Board considered the revenues earned and the expenses incurred by Fidelity in conducting the business of developing, marketing, distributing, managing, administering and servicing each fund and the Series Funds in which each fund invests and in servicing each fund's shareholders. The Board also considered the level of Fidelity's profits in respect of all the Fidelity funds.
On an annual basis, Fidelity presents to the Board information about the profitability of its relationships with each fund. Fidelity calculates profitability information for each fund, as well as aggregate profitability information for groups of Fidelity funds and all Fidelity funds, using a series of detailed revenue and cost allocation methodologies which originate with the books and records of Fidelity on which Fidelity's audited financial statements are based. The Audit Committee of the Board reviews any significant changes from the prior year's methodologies.
PricewaterhouseCoopers LLP (PwC), auditor to Fidelity and certain Fidelity funds, has been engaged annually by the Board as part of the Board's assessment of Fidelity's profitability analysis. PwC's engagement includes the review and assessment of the methodologies used by Fidelity in determining the revenues and expenses attributable to Fidelity's mutual fund business, and completion of agreed-upon procedures in respect of the mathematical accuracy of the fund profitability information and its conformity to established allocation methodologies. After considering PwC's reports issued under the engagement and information provided by Fidelity, the Board concluded that while other allocation methods may also be reasonable, Fidelity's profitability methodologies are reasonable in all material respects.
The Board also reviewed Fidelity's non-fund businesses and potential indirect benefits such businesses may have received as a result of their association with Fidelity's mutual fund business (i.e., fall-out benefits) as well as cases where Fidelity's affiliates may benefit from the funds' business. The Board noted that changes to fall-out benefits year-over-year reflect business developments at Fidelity's various businesses.
The Board considered the costs of the services provided by and the profits realized by Fidelity in connection with the operation of each fund and was satisfied that the profitability was not excessive.
Economies of Scale. The Board considered whether there have been economies of scale in respect of the management of the Fidelity funds, whether the Fidelity funds (including each fund) have appropriately benefited from any such economies of scale, and whether there is potential for realization of any further economies of scale. The Board considered the extent to which each fund will benefit from economies of scale as assets grow through increased services to the fund, through waivers or reimbursements, or through fee or expense ratio reductions. The Board recognized that, due to each fund's current contractual arrangements, its expense ratio will not decline if the fund's operating costs decrease as assets grow, or rise as assets decrease. The Board also noted that a committee (the Economies of Scale Committee) created by it and the boards of other Fidelity funds periodically analyzes whether Fidelity attains economies of scale in respect of the management and servicing of the Fidelity funds, whether the Fidelity funds have appropriately benefited from such economies of scale, and whether there is potential for realization of any further economies of scale.
The Board concluded, taking into account the analysis of the Economies of Scale Committee, that economies of scale, if any, are being appropriately shared between fund shareholders and Fidelity.
Additional Information Requested by the Board. In order to develop fully the factual basis for consideration of the Fidelity funds' advisory contracts, the Board requested and received additional information on certain topics, including: (i) Fidelity's fund profitability methodology, profitability trends for certain funds, the allocation of various costs to different funds, and the impact of certain factors on fund profitability results; (ii) portfolio manager changes that have occurred during the past year and the amount of the investment that each portfolio manager has made in the Fidelity fund(s) that he or she manages; (iii) Fidelity's compensation structure for portfolio managers, research analysts, and other key personnel, including its effects on fund profitability, the rationale for the compensation structure, and the extent to which current market conditions have affected retention and recruitment; (iv) the arrangements with and compensation paid to certain fund sub-advisers on behalf of the Fidelity funds and the treatment of such compensation within Fidelity's fund profitability methodology; (v) the terms of Fidelity's voluntary expense limitation agreements; (vi) the methodology with respect to competitive fund data and peer group classifications; (vii) Fidelity's transfer agent fee, expense, and service structures for different funds and classes relative to competitive trends, and the impact of the increased use of omnibus accounts; (viii) new developments in the retail and institutional marketplaces and the competitive positioning of the funds relative to other investment products and services; (ix) the impact of recent changes to the money market fund landscape, including the full implementation of money market fund reform and rising interest rates, on Fidelity's money market funds; (x) the funds' share class structures and distribution channels; and (xi) explanations regarding the relative total expense ratios of certain funds and classes, total expense competitive trends and methodologies for total expense competitive comparisons, and actions that might be taken by Fidelity to reduce total expense ratios for certain classes. In addition, the Board considered its discussions with Fidelity throughout the year regarding enhanced information security initiatives and the funds' fair valuation policies.
Based on its evaluation of all of the conclusions noted above, and after considering all factors it believed relevant, the Board concluded that the advisory fee arrangements are fair and reasonable, and that each fund's Advisory Contract should be renewed.
FF-K2-SANN-1118
1.9885892.101
Fidelity Freedom® Blend Funds - Income, 2005, 2010, 2015, 2020, 2025, 2030, 2035, 2040, 2045, 2050, 2055, 2060
Semi-Annual Report September 30, 2018 Fidelity Advisor share classes are included in this report. |
|
Contents
To view a fund's proxy voting guidelines and proxy voting record for the 12-month period ended June 30, visit http://www.fidelity.com/proxyvotingresults or visit the Securities and Exchange Commission's (SEC) web site at http://www.sec.gov.
You may also call 1-800-544-8544 for Fidelity Freedom Blend Class, 1-800-835-5092 for Class K and K6 and 1-877-208-0098 for Class A, M, C, I, Z and Z6 to request a free copy of the proxy voting guidelines.
Standard & Poor's, S&P and S&P 500 are registered service marks of The McGraw-Hill Companies, Inc. and have been licensed for use by Fidelity Distributors Corporation.
Other third-party marks appearing herein are the property of their respective owners.
All other marks appearing herein are registered or unregistered trademarks or service marks of FMR LLC or an affiliated company. © 2018 FMR LLC. All rights reserved.
This report and the financial statements contained herein are submitted for the general information of the shareholders of the Funds. This report is not authorized for distribution to prospective investors in the Funds unless preceded or accompanied by an effective prospectus.
A fund files its complete schedule of portfolio holdings with the SEC for the first and third quarters of each fiscal year on Form N-Q. Forms N-Q are available on the SEC’s web site at http://www.sec.gov. A fund's Forms N-Q may be reviewed and copied at the SEC’s Public Reference Room in Washington, DC. Information regarding the operation of the SEC's Public Reference Room may be obtained by calling 1-800-SEC-0330.
For a complete list of a fund's portfolio holdings, view the most recent holdings listing, semiannual report, or annual report on Fidelity's web site at http://www.fidelity.com, http://www.institutional.fidelity.com, or http://www.401k.com, as applicable.
NOT FDIC INSURED •MAY LOSE VALUE •NO BANK GUARANTEE
Neither the Funds nor Fidelity Distributors Corporation is a bank.
Fidelity Freedom® Blend Income Fund
Investment Summary (Unaudited)
The information in the following tables is based on the direct investments of the Fund.
Top Holdings as of September 30, 2018
| | % of fund's net assets |
| Fidelity Series Treasury Bill Index Fund | 13.7 |
| Fidelity Series Inflation-Protected Bond Index Fund | 13.3 |
| Fidelity Series Investment Grade Bond Fund | 11.1 |
| Fidelity Series Government Bond Index Fund | 10.2 |
| Fidelity Series Investment Grade Securitized Fund | 7.9 |
| Fidelity Series Corporate Bond Fund | 7.7 |
| Fidelity Series Short-Term Credit Fund | 4.6 |
| Fidelity Series Government Money Market Fund 2.12% | 4.5 |
| Fidelity Series Long-Term Treasury Bond Index Fund | 4.5 |
| Fidelity Series Emerging Markets Opportunities Fund | 3.1 |
| | 80.6 |
Asset Allocation (% of fund's net assets)
| Period end |
| | Domestic Equity Funds | 11.4% |
| | International Equity Funds | 8.4% |
| | Bond Funds | 57.4% |
| | Short-Term Funds | 22.8% |

Domestic Equity Funds category includes Fidelity Series Commodity Strategy Fund which invests in commodity-related investments.
Fidelity Freedom® Blend Income Fund
Schedule of Investments September 30, 2018 (Unaudited)
Showing Percentage of Net Assets
| Domestic Equity Funds - 11.4% | | | |
| | | Shares | Value |
| Fidelity Series Blue Chip Growth Fund (a) | | 1,123 | $17,185 |
| Fidelity Series Commodity Strategy Fund (a) | | 3,670 | 18,349 |
| Fidelity Series Large Cap Growth Index Fund (a) | | 1,298 | 13,471 |
| Fidelity Series Large Cap Stock Fund (a) | | 840 | 13,385 |
| Fidelity Series Large Cap Value Index Fund (a) | | 1,902 | 25,108 |
| Fidelity Series Small Cap Opportunities Fund (a) | | 449 | 6,597 |
| Fidelity Series Value Discovery Fund (a) | | 582 | 7,963 |
| TOTAL DOMESTIC EQUITY FUNDS | | | |
| (Cost $104,887) | | | 102,058 |
|
| International Equity Funds - 8.4% | | | |
| Fidelity Series Canada Fund (a) | | 166 | 1,797 |
| Fidelity Series Emerging Markets Fund (a) | | 311 | 3,014 |
| Fidelity Series Emerging Markets Opportunities Fund (a) | | 1,450 | 27,833 |
| Fidelity Series International Growth Fund (a) | | 1,029 | 16,882 |
| Fidelity Series International Index Fund (a) | | 435 | 4,454 |
| Fidelity Series International Small Cap Fund (a) | | 246 | 4,401 |
| Fidelity Series International Value Fund (a) | | 1,646 | 17,319 |
| TOTAL INTERNATIONAL EQUITY FUNDS | | | |
| (Cost $75,435) | | | 75,700 |
|
| Bond Funds - 57.4% | | | |
| Fidelity Series Corporate Bond Fund (a) | | 7,010 | 69,400 |
| Fidelity Series Emerging Markets Debt Fund (a) | | 582 | 5,548 |
| Fidelity Series Floating Rate High Income Fund (a) | | 238 | 2,267 |
| Fidelity Series Government Bond Index Fund (a) | | 9,288 | 91,856 |
| Fidelity Series High Income Fund (a) | | 1,225 | 11,776 |
| Fidelity Series Inflation-Protected Bond Index Fund (a) | | 12,291 | 119,346 |
| Fidelity Series Investment Grade Bond Fund (a) | | 9,128 | 99,408 |
| Fidelity Series Investment Grade Securitized Fund (a) | | 7,170 | 71,122 |
| Fidelity Series Long-Term Treasury Bond Index Fund (a) | | 4,876 | 40,178 |
| Fidelity Series Real Estate Income Fund (a) | | 391 | 4,214 |
| TOTAL BOND FUNDS | | | |
| (Cost $519,794) | | | 515,115 |
|
| Short-Term Funds - 22.8% | | | |
| Fidelity Cash Central Fund, 2.11% (b) | | 49 | 49 |
| Fidelity Series Government Money Market Fund 2.12% (a)(c) | | 40,899 | 40,899 |
| Fidelity Series Short-Term Credit Fund (a) | | 4,149 | 40,910 |
| Fidelity Series Treasury Bill Index Fund (a) | | 12,271 | 122,707 |
| TOTAL SHORT-TERM FUNDS | | | |
| (Cost $204,649) | | | 204,565 |
| TOTAL INVESTMENT IN SECURITIES - 100.0% | | | |
| (Cost $904,765) | | | 897,438 |
| NET OTHER ASSETS (LIABILITIES) - 0.0% | | | (159) |
| NET ASSETS - 100% | | | $897,279 |
Legend
(a) Affiliated Fund
(b) Affiliated fund that is generally available only to investment companies and other accounts managed by Fidelity Investments. The rate quoted is the annualized seven-day yield of the fund at period end. A complete unaudited listing of the fund's holdings as of its most recent quarter end is available upon request. In addition, each Fidelity Central Fund's financial statements are available on the SEC's website or upon request.
(c) The rate quoted is the annualized seven-day yield of the fund at period end.
Affiliated Central Funds
Information regarding fiscal year to date income earned by the Fund from investments in Fidelity Central Funds is as follows:
| Fund | Income earned |
| Fidelity Cash Central Fund | $195 |
| Total | $195 |
Amounts in the income column in the above table include any capital gain distributions from underlying funds, which are presented in the corresponding line-item in the Statement of Operations if applicable.
Affiliated Underlying Funds
Fiscal year to date information regarding the Fund's investments in affiliated Underlying Funds, excluding any Money Market Central Funds, is presented below. Exchanges between classes of the same affiliated Underlying Funds may occur.
| Affiliate | Value, beginning of period | Purchases | Sales Proceeds | Dividend Income | Realized Gain (loss) | Change in Unrealized appreciation (depreciation) | Value, end of period |
| Fidelity Series Blue Chip Growth Fund | $-- | $18,788 | $-- | $1,594 | $-- | $(1,603) | $17,185 |
| Fidelity Series Canada Fund | -- | 1,800 | -- | -- | -- | (3) | 1,797 |
| Fidelity Series Commodity Strategy Fund | -- | 19,102 | -- | 1,098 | -- | (753) | 18,349 |
| Fidelity Series Corporate Bond Fund | -- | 69,719 | 1 | 204 | -- | (318) | 69,400 |
| Fidelity Series Emerging Markets Debt Fund | -- | 5,426 | -- | 28 | -- | 122 | 5,548 |
| Fidelity Series Emerging Markets Fund | -- | 3,061 | -- | -- | -- | (47) | 3,014 |
| Fidelity Series Emerging Markets Opportunities Fund | -- | 27,906 | 1 | -- | -- | (72) | 27,833 |
| Fidelity Series Floating Rate High Income Fund | -- | 2,260 | -- | 10 | -- | 7 | 2,267 |
| Fidelity Series Government Bond Index Fund | -- | 96,242 | 3,330 | 211 | (37) | (1,019) | 91,856 |
| Fidelity Series Government Money Market Fund 2.12% | -- | 41,112 | 213 | 69 | -- | -- | 40,899 |
| Fidelity Series High Income Fund | -- | 11,752 | -- | 55 | -- | 24 | 11,776 |
| Fidelity Series Inflation-Protected Bond Index Fund | -- | 120,208 | 3 | 35 | -- | (859) | 119,346 |
| Fidelity Series International Growth Fund | -- | 16,924 | -- | -- | -- | (42) | 16,882 |
| Fidelity Series International Index Fund | -- | 4,411 | -- | -- | -- | 43 | 4,454 |
| Fidelity Series International Small Cap Fund | -- | 4,411 | -- | -- | -- | (10) | 4,401 |
| Fidelity Series International Value Fund | -- | 16,924 | -- | -- | -- | 395 | 17,319 |
| Fidelity Series Investment Grade Bond Fund | -- | 100,138 | 2 | 240 | -- | (728) | 99,408 |
| Fidelity Series Investment Grade Securitized Fund | -- | 73,967 | 2,254 | 163 | (18) | (573) | 71,122 |
| Fidelity Series Large Cap Growth Index Fund | -- | 13,413 | 20 | -- | -- | 78 | 13,471 |
| Fidelity Series Large Cap Stock Fund | -- | 13,413 | 96 | -- | -- | 68 | 13,385 |
| Fidelity Series Large Cap Value Index Fund | -- | 25,206 | 155 | -- | -- | 57 | 25,108 |
| Fidelity Series Long-Term Treasury Bond Index Fund | -- | 41,384 | 1 | 97 | -- | (1,205) | 40,178 |
| Fidelity Series Real Estate Income Fund | -- | 4,343 | -- | 112 | -- | (129) | 4,214 |
| Fidelity Series Short-Term Credit Fund | -- | 41,122 | 129 | 81 | -- | (83) | 40,910 |
| Fidelity Series Small Cap Opportunities Fund | -- | 7,261 | -- | 510 | -- | (664) | 6,597 |
| Fidelity Series Treasury Bill Index Fund | -- | 122,985 | 277 | 219 | -- | (1) | 122,707 |
| Fidelity Series Value Discovery Fund | -- | 8,012 | 37 | -- | -- | (12) | 7,963 |
| Total | $-- | $911,290 | $6,519 | $4,726 | $(55) | $(7,327) | $897,389 |
Amounts in the income column in the above table include any capital gain distributions from underlying funds, which are presented in the corresponding line-item in the Statement of Operations if applicable.
Investment Valuation
All investments are categorized as Level 1 under the Fair Value Hierarchy. The inputs or methodology used for valuing securities may not be an indication of the risk associated with investing in those securities. For more information on valuation inputs please refer to the Investment Valuation section in the accompanying Notes to Financial Statements.
See accompanying notes which are an integral part of the financial statements.
Fidelity Freedom® Blend Income Fund
Financial Statements
Statement of Assets and Liabilities
| | | September 30, 2018 (Unaudited) |
| Assets | | |
Investment in securities, at value — See accompanying schedule:
| | |
| Fidelity Central Funds (cost $49) | $49 | |
| Other affiliated issuers (cost $904,716) | 897,389 | |
| Total Investment in Securities (cost $904,765) | | $897,438 |
| Receivable for investments sold | | 6,500 |
| Distributions receivable from Fidelity Central Funds | | 146 |
| Total assets | | 904,084 |
| Liabilities | | |
| Payable for investments purchased | $6,363 | |
| Accrued management fee | 297 | |
| Distribution and service plan fees payable | 145 | |
| Total liabilities | | 6,805 |
| Net Assets | | $897,279 |
| Net Assets consist of: | | |
| Paid in capital | | $900,201 |
| Undistributed net investment income | | 2,408 |
| Accumulated undistributed net realized gain (loss) on investments | | 1,997 |
| Net unrealized appreciation (depreciation) on investments | | (7,327) |
| Net Assets | | $897,279 |
| Calculation of Maximum Offering Price | | |
| Class A: | | |
| Net Asset Value and redemption price per share ($99,665 ÷ 10,000 shares) | | $9.97 |
| Maximum offering price per share (100/94.25 of $9.97) | | $10.58 |
| Class M: | | |
| Net Asset Value and redemption price per share ($99,643 ÷ 10,000 shares) | | $9.96 |
| Maximum offering price per share (100/96.50 of $9.96) | | $10.32 |
| Class C: | | |
| Net Asset Value and offering price per share ($99,600 ÷ 10,000 shares)(a) | | $9.96 |
| Fidelity Freedom Blend Income Fund: | | |
| Net Asset Value, offering price and redemption price per share ($99,886 ÷ 10,020 shares) | | $9.97 |
| Class K: | | |
| Net Asset Value, offering price and redemption price per share ($99,695 ÷ 10,000 shares) | | $9.97 |
| Class K6: | | |
| Net Asset Value, offering price and redemption price per share ($99,704 ÷ 10,000 shares) | | $9.97 |
| Class I: | | |
| Net Asset Value, offering price and redemption price per share ($99,687 ÷ 10,000 shares) | | $9.97 |
| Class Z: | | |
| Net Asset Value, offering price and redemption price per share ($99,695 ÷ 10,000 shares) | | $9.97 |
| Class Z6: | | |
| Net Asset Value, offering price and redemption price per share ($99,704 ÷ 10,000 shares) | | $9.97 |
(a) Redemption price per share is equal to net asset value less any applicable contingent deferred sales charge.
See accompanying notes which are an integral part of the financial statements.
Statement of Operations
| | | For the period
August 31, 2018 (commencement of operations) to
September 30, 2018 (Unaudited) |
| Investment Income | | |
| Dividends: | | |
| Affiliated issuers | | $2,674 |
| Income from Fidelity Central Funds | | 195 |
| Total income | | 2,869 |
| Expenses | | |
| Management fee | $308 | |
| Distribution and service plan fees | 153 | |
| Total expenses | | 461 |
| Net investment income (loss) | | 2,408 |
| Realized and Unrealized Gain (Loss) | | |
| Net realized gain (loss) on: | | |
| Investment securities: | | |
| Affiliated issuers | (55) | |
| Capital gain distributions from underlying funds: | | |
| Affiliated issuers | 2,052 | |
| Total net realized gain (loss) | | 1,997 |
| Change in net unrealized appreciation (depreciation) on: | | |
| Investment securities: | | |
| Affiliated issuers | (7,327) | |
| Total change in net unrealized appreciation (depreciation) | | (7,327) |
| Net gain (loss) | | (5,330) |
| Net increase (decrease) in net assets resulting from operations | | $(2,922) |
See accompanying notes which are an integral part of the financial statements.
Statement of Changes in Net Assets
| | For the period
August 31, 2018 (commencement of operations) to
September 30, 2018 (Unaudited) |
| Increase (Decrease) in Net Assets | |
| Operations | |
| Net investment income (loss) | $2,408 |
| Net realized gain (loss) | 1,997 |
| Change in net unrealized appreciation (depreciation) | (7,327) |
| Net increase (decrease) in net assets resulting from operations | (2,922) |
| Share transactions - net increase (decrease) | 900,201 |
| Total increase (decrease) in net assets | 897,279 |
| Net Assets | |
| Beginning of period | – |
| End of period | $897,279 |
| Other Information | |
| Undistributed net investment income end of period | $2,408 |
See accompanying notes which are an integral part of the financial statements.
Financial Highlights
Fidelity Freedom Blend Income Fund Class A
| | Six months ended (Unaudited) September 30, |
| | 2018 A |
| Selected Per–Share Data | |
| Net asset value, beginning of period | $10.00 |
| Income from Investment Operations | |
| Net investment income (loss)B | .03 |
| Net realized and unrealized gain (loss) | (.06) |
| Total from investment operations | (.03) |
| Net asset value, end of period | $9.97 |
| Total ReturnC,D | (.30)% |
| Ratios to Average Net AssetsE | |
| Expenses before reductions | .72%F,G |
| Expenses net of fee waivers, if any | .72%F,G |
| Expenses net of all reductions | .72%F,G |
| Net investment income (loss) | 2.96%F |
| Supplemental Data | |
| Net assets, end of period (000 omitted) | $100 |
| Portfolio turnover rateH | 1%I |
A For the period August 31, 2018 (commencement of operations) to September 30, 2018.
B Calculated based on average shares outstanding during the period.
C Total returns for periods of less than one year are not annualized.
D Total returns do not include the effect of the sales charges.
E Expense ratios reflect operating expenses of the class. Expenses before reductions do not reflect amounts reimbursed by the investment adviser or reductions from expense offset arrangements and do not represent the amount paid by the class during periods when reimbursements or reductions occur. Expense ratios before reductions for start-up periods may not be representative of longer-term operating periods. Expenses net of fee waivers reflect expenses after reimbursement by the investment adviser but prior to reductions from expense offset arrangements. Expenses net of all reductions represent the net expenses paid by the class but do not include expenses of the underlying funds in which the Fund invests.
F Annualized
G On certain classes, the size and fluctuation of net assets and expense amounts may cause ratios to differ from contractual rates.
H Amounts do not include the activity of the Underlying Funds.
I Amount not annualized.
See accompanying notes which are an integral part of the financial statements.
Fidelity Freedom Blend Income Fund Class M
| | Six months ended (Unaudited) September 30, |
| | 2018 A |
| Selected Per–Share Data | |
| Net asset value, beginning of period | $10.00 |
| Income from Investment Operations | |
| Net investment income (loss)B | .02 |
| Net realized and unrealized gain (loss) | (.06) |
| Total from investment operations | (.04) |
| Net asset value, end of period | $9.96 |
| Total ReturnC,D | (.40)% |
| Ratios to Average Net AssetsE | |
| Expenses before reductions | .97%F,G |
| Expenses net of fee waivers, if any | .97%F,G |
| Expenses net of all reductions | .97%F,G |
| Net investment income (loss) | 2.71%F |
| Supplemental Data | |
| Net assets, end of period (000 omitted) | $100 |
| Portfolio turnover rateH | 1%I |
A For the period August 31, 2018 (commencement of operations) to September 30, 2018.
B Calculated based on average shares outstanding during the period.
C Total returns for periods of less than one year are not annualized.
D Total returns do not include the effect of the sales charges.
E Expense ratios reflect operating expenses of the class. Expenses before reductions do not reflect amounts reimbursed by the investment adviser or reductions from expense offset arrangements and do not represent the amount paid by the class during periods when reimbursements or reductions occur. Expense ratios before reductions for start-up periods may not be representative of longer-term operating periods. Expenses net of fee waivers reflect expenses after reimbursement by the investment adviser but prior to reductions from expense offset arrangements. Expenses net of all reductions represent the net expenses paid by the class but do not include expenses of the underlying funds in which the Fund invests.
F Annualized
G On certain classes, the size and fluctuation of net assets and expense amounts may cause ratios to differ from contractual rates.
H Amounts do not include the activity of the Underlying Funds.
I Amount not annualized.
See accompanying notes which are an integral part of the financial statements.
Fidelity Freedom Blend Income Fund Class C
| | Six months ended (Unaudited) September 30, |
| | 2018 A |
| Selected Per–Share Data | |
| Net asset value, beginning of period | $10.00 |
| Income from Investment Operations | |
| Net investment income (loss)B | .02 |
| Net realized and unrealized gain (loss) | (.06) |
| Total from investment operations | (.04) |
| Net asset value, end of period | $9.96 |
| Total ReturnC,D | (.40)% |
| Ratios to Average Net AssetsE | |
| Expenses before reductions | 1.47%F,G |
| Expenses net of fee waivers, if any | 1.47%F,G |
| Expenses net of all reductions | 1.47%F,G |
| Net investment income (loss) | 2.21%F |
| Supplemental Data | |
| Net assets, end of period (000 omitted) | $100 |
| Portfolio turnover rateH | 1%I |
A For the period August 31, 2018 (commencement of operations) to September 30, 2018.
B Calculated based on average shares outstanding during the period.
C Total returns for periods of less than one year are not annualized.
D Total returns do not include the effect of the contingent deferred sales charge.
E Expense ratios reflect operating expenses of the class. Expenses before reductions do not reflect amounts reimbursed by the investment adviser or reductions from expense offset arrangements and do not represent the amount paid by the class during periods when reimbursements or reductions occur. Expense ratios before reductions for start-up periods may not be representative of longer-term operating periods. Expenses net of fee waivers reflect expenses after reimbursement by the investment adviser but prior to reductions from expense offset arrangements. Expenses net of all reductions represent the net expenses paid by the class but do not include expenses of the underlying funds in which the Fund invests.
F Annualized
G On certain classes, the size and fluctuation of net assets and expense amounts may cause ratios to differ from contractual rates.
H Amounts do not include the activity of the Underlying Funds.
I Amount not annualized.
See accompanying notes which are an integral part of the financial statements.
Fidelity Freedom Blend Income Fund
| | Six months ended (Unaudited) September 30, |
| | 2018 A |
| Selected Per–Share Data | |
| Net asset value, beginning of period | $10.00 |
| Income from Investment Operations | |
| Net investment income (loss)B | .03 |
| Net realized and unrealized gain (loss) | (.06) |
| Total from investment operations | (.03) |
| Net asset value, end of period | $9.97 |
| Total ReturnC | (.30)% |
| Ratios to Average Net AssetsD | |
| Expenses before reductions | .46%E |
| Expenses net of fee waivers, if any | .46%E |
| Expenses net of all reductions | .46%E |
| Net investment income (loss) | 3.22%E |
| Supplemental Data | |
| Net assets, end of period (000 omitted) | $100 |
| Portfolio turnover rateF | 1%G |
A For the period August 31, 2018 (commencement of operations) to September 30, 2018.
B Calculated based on average shares outstanding during the period.
C Total returns for periods of less than one year are not annualized.
D Expense ratios reflect operating expenses of the class. Expenses before reductions do not reflect amounts reimbursed by the investment adviser or reductions from expense offset arrangements and do not represent the amount paid by the class during periods when reimbursements or reductions occur. Expense ratios before reductions for start-up periods may not be representative of longer-term operating periods. Expenses net of fee waivers reflect expenses after reimbursement by the investment adviser but prior to reductions from expense offset arrangements. Expenses net of all reductions represent the net expenses paid by the class but do not include expenses of the underlying funds in which the Fund invests.
E Annualized
F Amounts do not include the activity of the Underlying Funds.
G Amount not annualized.
See accompanying notes which are an integral part of the financial statements.
Fidelity Freedom Blend Income Fund Class K
| | Six months ended (Unaudited) September 30, |
| | 2018 A |
| Selected Per–Share Data | |
| Net asset value, beginning of period | $10.00 |
| Income from Investment Operations | |
| Net investment income (loss)B | .03 |
| Net realized and unrealized gain (loss) | (.06) |
| Total from investment operations | (.03) |
| Net asset value, end of period | $9.97 |
| Total ReturnC | (.30)% |
| Ratios to Average Net AssetsD | |
| Expenses before reductions | .36%E |
| Expenses net of fee waivers, if any | .36%E |
| Expenses net of all reductions | .36%E |
| Net investment income (loss) | 3.32%E |
| Supplemental Data | |
| Net assets, end of period (000 omitted) | $100 |
| Portfolio turnover rateF | 1%G |
A For the period August 31, 2018 (commencement of operations) to September 30, 2018.
B Calculated based on average shares outstanding during the period.
C Total returns for periods of less than one year are not annualized.
D Expense ratios reflect operating expenses of the class. Expenses before reductions do not reflect amounts reimbursed by the investment adviser or reductions from expense offset arrangements and do not represent the amount paid by the class during periods when reimbursements or reductions occur. Expense ratios before reductions for start-up periods may not be representative of longer-term operating periods. Expenses net of fee waivers reflect expenses after reimbursement by the investment adviser but prior to reductions from expense offset arrangements. Expenses net of all reductions represent the net expenses paid by the class but do not include expenses of the underlying funds in which the Fund invests.
E Annualized
F Amounts do not include the activity of the Underlying Funds.
G Amount not annualized.
See accompanying notes which are an integral part of the financial statements.
Fidelity Freedom Blend Income Fund Class K6
| | Six months ended (Unaudited) September 30, |
| | 2018 A |
| Selected Per–Share Data | |
| Net asset value, beginning of period | $10.00 |
| Income from Investment Operations | |
| Net investment income (loss)B | .03 |
| Net realized and unrealized gain (loss) | (.06) |
| Total from investment operations | (.03) |
| Net asset value, end of period | $9.97 |
| Total ReturnC | (.30)% |
| Ratios to Average Net AssetsD | |
| Expenses before reductions | .27%E,F |
| Expenses net of fee waivers, if any | .27%E,F |
| Expenses net of all reductions | .27%E,F |
| Net investment income (loss) | 3.41%E |
| Supplemental Data | |
| Net assets, end of period (000 omitted) | $100 |
| Portfolio turnover rateG | 1%H |
A For the period August 31, 2018 (commencement of operations) to September 30, 2018.
B Calculated based on average shares outstanding during the period.
C Total returns for periods of less than one year are not annualized.
D Expense ratios reflect operating expenses of the class. Expenses before reductions do not reflect amounts reimbursed by the investment adviser or reductions from expense offset arrangements and do not represent the amount paid by the class during periods when reimbursements or reductions occur. Expenses net of fee waivers reflect expenses after reimbursement by the investment adviser but prior to reductions from expense offset arrangements. Expenses net of all reductions represent the net expenses paid by the class but do not include expenses of the underlying funds in which the Fund invests.
E Annualized
F On certain classes, the size and fluctuation of net assets and expense amounts may cause ratios to differ from contractual rates.
G Amounts do not include the activity of the Underlying Funds.
H Amount not annualized.
See accompanying notes which are an integral part of the financial statements.
Fidelity Freedom Blend Income Fund Class I
| | Six months ended (Unaudited) September 30, |
| | 2018 A |
| Selected Per–Share Data | |
| Net asset value, beginning of period | $10.00 |
| Income from Investment Operations | |
| Net investment income (loss)B | .03 |
| Net realized and unrealized gain (loss) | (.06) |
| Total from investment operations | (.03) |
| Net asset value, end of period | $9.97 |
| Total ReturnC | (.30)% |
| Ratios to Average Net AssetsD | |
| Expenses before reductions | .46%E |
| Expenses net of fee waivers, if any | .46%E |
| Expenses net of all reductions | .46%E |
| Net investment income (loss) | 3.22%E |
| Supplemental Data | |
| Net assets, end of period (000 omitted) | $100 |
| Portfolio turnover rateF | 1%G |
A For the period August 31, 2018 (commencement of operations) to September 30, 2018.
B Calculated based on average shares outstanding during the period.
C Total returns for periods of less than one year are not annualized.
D Expense ratios reflect operating expenses of the class. Expenses before reductions do not reflect amounts reimbursed by the investment adviser or reductions from expense offset arrangements and do not represent the amount paid by the class during periods when reimbursements or reductions occur. Expense ratios before reductions for start-up periods may not be representative of longer-term operating periods. Expenses net of fee waivers reflect expenses after reimbursement by the investment adviser but prior to reductions from expense offset arrangements. Expenses net of all reductions represent the net expenses paid by the class but do not include expenses of the underlying funds in which the Fund invests.
E Annualized
F Amounts do not include the activity of the Underlying Funds.
G Amount not annualized.
See accompanying notes which are an integral part of the financial statements.
Fidelity Freedom Blend Income Fund Class Z
| | Six months ended (Unaudited) September 30, |
| | 2018 A |
| Selected Per–Share Data | |
| Net asset value, beginning of period | $10.00 |
| Income from Investment Operations | |
| Net investment income (loss)B | .03 |
| Net realized and unrealized gain (loss) | (.06) |
| Total from investment operations | (.03) |
| Net asset value, end of period | $9.97 |
| Total ReturnC | (.30)% |
| Ratios to Average Net AssetsD | |
| Expenses before reductions | .36%E |
| Expenses net of fee waivers, if any | .36%E |
| Expenses net of all reductions | .36%E |
| Net investment income (loss) | 3.32%E |
| Supplemental Data | |
| Net assets, end of period (000 omitted) | $100 |
| Portfolio turnover rateF | 1%G |
A For the period August 31, 2018 (commencement of operations) to September 30, 2018.
B Calculated based on average shares outstanding during the period.
C Total returns for periods of less than one year are not annualized.
D Expense ratios reflect operating expenses of the class. Expenses before reductions do not reflect amounts reimbursed by the investment adviser or reductions from expense offset arrangements and do not represent the amount paid by the class during periods when reimbursements or reductions occur. Expense ratios before reductions for start-up periods may not be representative of longer-term operating periods. Expenses net of fee waivers reflect expenses after reimbursement by the investment adviser but prior to reductions from expense offset arrangements. Expenses net of all reductions represent the net expenses paid by the class but do not include expenses of the underlying funds in which the Fund invests.
E Annualized
F Amounts do not include the activity of the Underlying Funds.
G Amount not annualized.
See accompanying notes which are an integral part of the financial statements.
Fidelity Freedom Blend Income Fund Class Z6
| | Six months ended (Unaudited) September 30, |
| | 2018 A |
| Selected Per–Share Data | |
| Net asset value, beginning of period | $10.00 |
| Income from Investment Operations | |
| Net investment income (loss)B | .03 |
| Net realized and unrealized gain (loss) | (.06) |
| Total from investment operations | (.03) |
| Net asset value, end of period | $9.97 |
| Total ReturnC | (.30)% |
| Ratios to Average Net AssetsD | |
| Expenses before reductions | .27%E,F |
| Expenses net of fee waivers, if any | .27%E,F |
| Expenses net of all reductions | .27%E,F |
| Net investment income (loss) | 3.41%E |
| Supplemental Data | |
| Net assets, end of period (000 omitted) | $100 |
| Portfolio turnover rateG | 1%H |
A For the period August 31, 2018 (commencement of operations) to September 30, 2018.
B Calculated based on average shares outstanding during the period.
C Total returns for periods of less than one year are not annualized.
D Expense ratios reflect operating expenses of the class. Expenses before reductions do not reflect amounts reimbursed by the investment adviser or reductions from expense offset arrangements and do not represent the amount paid by the class during periods when reimbursements or reductions occur. Expenses net of fee waivers reflect expenses after reimbursement by the investment adviser but prior to reductions from expense offset arrangements. Expenses net of all reductions represent the net expenses paid by the class but do not include expenses of the underlying funds in which the Fund invests.
E Annualized
F On certain classes, the size and fluctuation of net assets and expense amounts may cause ratios to differ from contractual rates.
G Amounts do not include the activity of the Underlying Funds.
H Amount not annualized.
See accompanying notes which are an integral part of the financial statements.
Fidelity Freedom® Blend 2005 Fund
Investment Summary (Unaudited)
The information in the following tables is based on the direct investments of the Fund.
Top Holdings as of September 30, 2018
| | % of fund's net assets |
| Fidelity Series Inflation-Protected Bond Index Fund | 11.3 |
| Fidelity Series Treasury Bill Index Fund | 11.2 |
| Fidelity Series Investment Grade Bond Fund | 10.1 |
| Fidelity Series Government Bond Index Fund | 9.4 |
| Fidelity Series Investment Grade Securitized Fund | 7.3 |
| Fidelity Series Corporate Bond Fund | 7.1 |
| Fidelity Series Large Cap Value Index Fund | 4.6 |
| Fidelity Series Long-Term Treasury Bond Index Fund | 4.6 |
| Fidelity Series Emerging Markets Opportunities Fund | 3.9 |
| Fidelity Series Short-Term Credit Fund | 3.8 |
| | 73.3 |
Asset Allocation (% of fund's net assets)
| Period end |
| | Domestic Equity Funds | 17.5% |
| | International Equity Funds | 11.4% |
| | Bond Funds | 52.4% |
| | Short-Term Funds | 18.7% |

Domestic Equity Funds category includes Fidelity Series Commodity Strategy Fund which invests in commodity-related investments.
Fidelity Freedom® Blend 2005 Fund
Schedule of Investments September 30, 2018 (Unaudited)
Showing Percentage of Net Assets
| Domestic Equity Funds - 17.5% | | | |
| | | Shares | Value |
| Fidelity Series Blue Chip Growth Fund (a) | | 1,874 | $28,677 |
| Fidelity Series Commodity Strategy Fund (a) | | 3,681 | 18,406 |
| Fidelity Series Large Cap Growth Index Fund (a) | | 2,162 | 22,446 |
| Fidelity Series Large Cap Stock Fund (a) | | 1,400 | 22,301 |
| Fidelity Series Large Cap Value Index Fund (a) | | 3,170 | 41,846 |
| Fidelity Series Small Cap Opportunities Fund (a) | | 751 | 11,030 |
| Fidelity Series Value Discovery Fund (a) | | 969 | 13,263 |
| TOTAL DOMESTIC EQUITY FUNDS | | | |
| (Cost $162,183) | | | 157,969 |
|
| International Equity Funds - 11.4% | | | |
| Fidelity Series Canada Fund (a) | | 233 | 2,524 |
| Fidelity Series Emerging Markets Fund (a) | | 395 | 3,824 |
| Fidelity Series Emerging Markets Opportunities Fund (a) | | 1,835 | 35,219 |
| Fidelity Series International Growth Fund (a) | | 1,456 | 23,873 |
| Fidelity Series International Index Fund (a) | | 623 | 6,384 |
| Fidelity Series International Small Cap Fund (a) | | 352 | 6,307 |
| Fidelity Series International Value Fund (a) | | 2,328 | 24,490 |
| TOTAL INTERNATIONAL EQUITY FUNDS | | | |
| (Cost $102,218) | | | 102,621 |
|
| Bond Funds - 52.4% | | | |
| Fidelity Series Corporate Bond Fund (a) | | 6,419 | 63,549 |
| Fidelity Series Emerging Markets Debt Fund (a) | | 584 | 5,565 |
| Fidelity Series Floating Rate High Income Fund (a) | | 239 | 2,274 |
| Fidelity Series Government Bond Index Fund (a) | | 8,529 | 84,352 |
| Fidelity Series High Income Fund (a) | | 1,229 | 11,813 |
| Fidelity Series Inflation-Protected Bond Index Fund (a) | | 10,473 | 101,693 |
| Fidelity Series Investment Grade Bond Fund (a) | | 8,367 | 91,111 |
| Fidelity Series Investment Grade Securitized Fund (a) | | 6,584 | 65,312 |
| Fidelity Series Long-Term Treasury Bond Index Fund (a) | | 5,043 | 41,553 |
| Fidelity Series Real Estate Income Fund (a) | | 392 | 4,227 |
| TOTAL BOND FUNDS | | | |
| (Cost $475,825) | | | 471,449 |
|
| Short-Term Funds - 18.7% | | | |
| Fidelity Cash Central Fund, 2.11% (b) | | 49 | 49 |
| Fidelity Series Government Money Market Fund 2.12% (a)(c) | | 33,700 | 33,700 |
| Fidelity Series Short-Term Credit Fund (a) | | 3,418 | 33,703 |
| Fidelity Series Treasury Bill Index Fund (a) | | 10,112 | 101,116 |
| TOTAL SHORT-TERM FUNDS | | | |
| (Cost $168,636) | | | 168,568 |
| TOTAL INVESTMENT IN SECURITIES - 100.0% | | | |
| (Cost $908,862) | | | 900,607 |
| NET OTHER ASSETS (LIABILITIES) - 0.0% | | | (173) |
| NET ASSETS - 100% | | | $900,434 |
Legend
(a) Affiliated Fund
(b) Affiliated fund that is generally available only to investment companies and other accounts managed by Fidelity Investments. The rate quoted is the annualized seven-day yield of the fund at period end. A complete unaudited listing of the fund's holdings as of its most recent quarter end is available upon request. In addition, each Fidelity Central Fund's financial statements are available on the SEC's website or upon request.
(c) The rate quoted is the annualized seven-day yield of the fund at period end.
Affiliated Central Funds
Information regarding fiscal year to date income earned by the Fund from investments in Fidelity Central Funds is as follows:
| Fund | Income earned |
| Fidelity Cash Central Fund | $195 |
| Total | $195 |
Amounts in the income column in the above table include any capital gain distributions from underlying funds, which are presented in the corresponding line-item in the Statement of Operations if applicable.
Affiliated Underlying Funds
Fiscal year to date information regarding the Fund's investments in affiliated Underlying Funds, excluding any Money Market Central Funds, is presented below. Exchanges between classes of the same affiliated Underlying Funds may occur.
| Affiliate | Value, beginning of period | Purchases | Sales Proceeds | Dividend Income | Realized Gain (loss) | Change in Unrealized appreciation (depreciation) | Value, end of period |
| Fidelity Series Blue Chip Growth Fund | $-- | $31,575 | $207 | $2,679 | $(21) | $(2,670) | $28,677 |
| Fidelity Series Canada Fund | -- | 2,529 | -- | -- | -- | (5) | 2,524 |
| Fidelity Series Commodity Strategy Fund | -- | 19,161 | -- | 1,101 | -- | (755) | 18,406 |
| Fidelity Series Corporate Bond Fund | -- | 63,841 | 1 | 186 | -- | (291) | 63,549 |
| Fidelity Series Emerging Markets Debt Fund | -- | 5,443 | -- | 28 | -- | 122 | 5,565 |
| Fidelity Series Emerging Markets Fund | -- | 3,883 | -- | -- | -- | (59) | 3,824 |
| Fidelity Series Emerging Markets Opportunities Fund | -- | 35,308 | 1 | -- | -- | (88) | 35,219 |
| Fidelity Series Floating Rate High Income Fund | -- | 2,267 | -- | 10 | -- | 7 | 2,274 |
| Fidelity Series Government Bond Index Fund | -- | 88,126 | 2,808 | 193 | (31) | (935) | 84,352 |
| Fidelity Series Government Money Market Fund 2.12% | -- | 33,733 | 33 | 57 | -- | -- | 33,700 |
| Fidelity Series High Income Fund | -- | 11,788 | -- | 55 | -- | 25 | 11,813 |
| Fidelity Series Inflation-Protected Bond Index Fund | -- | 102,427 | 2 | 30 | -- | (732) | 101,693 |
| Fidelity Series International Growth Fund | -- | 23,930 | 1 | -- | -- | (56) | 23,873 |
| Fidelity Series International Index Fund | -- | 6,321 | -- | -- | -- | 63 | 6,384 |
| Fidelity Series International Small Cap Fund | -- | 6,321 | -- | -- | -- | (14) | 6,307 |
| Fidelity Series International Value Fund | -- | 23,930 | 1 | -- | -- | 561 | 24,490 |
| Fidelity Series Investment Grade Bond Fund | -- | 91,779 | 2 | 220 | -- | (666) | 91,111 |
| Fidelity Series Investment Grade Securitized Fund | -- | 67,682 | 1,831 | 149 | (15) | (524) | 65,312 |
| Fidelity Series Large Cap Growth Index Fund | -- | 22,485 | 171 | -- | 1 | 131 | 22,446 |
| Fidelity Series Large Cap Stock Fund | -- | 22,485 | 298 | -- | 1 | 113 | 22,301 |
| Fidelity Series Large Cap Value Index Fund | -- | 42,260 | 511 | -- | 1 | 96 | 41,846 |
| Fidelity Series Long-Term Treasury Bond Index Fund | -- | 42,807 | 1 | 101 | -- | (1,253) | 41,553 |
| Fidelity Series Real Estate Income Fund | -- | 4,356 | -- | 112 | -- | (129) | 4,227 |
| Fidelity Series Short-Term Credit Fund | -- | 33,772 | 1 | 67 | -- | (68) | 33,703 |
| Fidelity Series Small Cap Opportunities Fund | -- | 12,139 | -- | 852 | -- | (1,109) | 11,030 |
| Fidelity Series Treasury Bill Index Fund | -- | 101,118 | 2 | 180 | -- | -- | 101,116 |
| Fidelity Series Value Discovery Fund | -- | 13,364 | 82 | -- | -- | (19) | 13,263 |
| Total | $-- | $914,830 | $5,953 | $6,020 | $(64) | $(8,255) | $900,558 |
Amounts in the income column in the above table include any capital gain distributions from underlying funds, which are presented in the corresponding line-item in the Statement of Operations if applicable.
Investment Valuation
All investments are categorized as Level 1 under the Fair Value Hierarchy. The inputs or methodology used for valuing securities may not be an indication of the risk associated with investing in those securities. For more information on valuation inputs please refer to the Investment Valuation section in the accompanying Notes to Financial Statements.
See accompanying notes which are an integral part of the financial statements.
Fidelity Freedom® Blend 2005 Fund
Financial Statements
Statement of Assets and Liabilities
| | | September 30, 2018 (Unaudited) |
| Assets | | |
Investment in securities, at value — See accompanying schedule:
| | |
| Fidelity Central Funds (cost $49) | $49 | |
| Other affiliated issuers (cost $908,813) | 900,558 | |
| Total Investment in Securities (cost $908,862) | | $900,607 |
| Receivable for investments sold | | 5,934 |
| Distributions receivable from Fidelity Central Funds | | 146 |
| Total assets | | 906,687 |
| Liabilities | | |
| Payable for investments purchased | $5,810 | |
| Accrued management fee | 298 | |
| Distribution and service plan fees payable | 145 | |
| Total liabilities | | 6,253 |
| Net Assets | | $900,434 |
| Net Assets consist of: | | |
| Paid in capital | | $903,000 |
| Undistributed net investment income | | 2,345 |
| Accumulated undistributed net realized gain (loss) on investments | | 3,344 |
| Net unrealized appreciation (depreciation) on investments | | (8,255) |
| Net Assets | | $900,434 |
| Calculation of Maximum Offering Price | | |
| Class A: | | |
| Net Asset Value and redemption price per share ($99,703 ÷ 10,000 shares) | | $9.97 |
| Maximum offering price per share (100/94.25 of $9.97) | | $10.58 |
| Class M: | | |
| Net Asset Value and redemption price per share ($99,681 ÷ 10,000 shares) | | $9.97 |
| Maximum offering price per share (100/96.50 of $9.97) | | $10.33 |
| Class C: | | |
| Net Asset Value and offering price per share ($99,638 ÷ 10,000 shares)(a) | | $9.96 |
| Fidelity Freedom Blend 2005 Fund: | | |
| Net Asset Value, offering price and redemption price per share ($102,737 ÷ 10,302 shares) | | $9.97 |
| Class K: | | |
| Net Asset Value, offering price and redemption price per share ($99,733 ÷ 10,000 shares) | | $9.97 |
| Class K6: | | |
| Net Asset Value, offering price and redemption price per share ($99,742 ÷ 10,000 shares) | | $9.97 |
| Class I: | | |
| Net Asset Value, offering price and redemption price per share ($99,725 ÷ 10,000 shares) | | $9.97 |
| Class Z: | | |
| Net Asset Value, offering price and redemption price per share ($99,733 ÷ 10,000 shares) | | $9.97 |
| Class Z6: | | |
| Net Asset Value, offering price and redemption price per share ($99,742 ÷ 10,000 shares) | | $9.97 |
(a) Redemption price per share is equal to net asset value less any applicable contingent deferred sales charge.
See accompanying notes which are an integral part of the financial statements.
Statement of Operations
| | | For the period
August 31, 2018 (commencement of operations) to
September 30, 2018 (Unaudited) |
| Investment Income | | |
| Dividends: | | |
| Affiliated issuers | | $2,612 |
| Income from Fidelity Central Funds | | 195 |
| Total income | | 2,807 |
| Expenses | | |
| Management fee | $309 | |
| Distribution and service plan fees | 153 | |
| Total expenses | | 462 |
| Net investment income (loss) | | 2,345 |
| Realized and Unrealized Gain (Loss) | | |
| Net realized gain (loss) on: | | |
| Investment securities: | | |
| Affiliated issuers | (64) | |
| Capital gain distributions from underlying funds: | | |
| Affiliated issuers | 3,408 | |
| Total net realized gain (loss) | | 3,344 |
| Change in net unrealized appreciation (depreciation) on: | | |
| Investment securities: | | |
| Affiliated issuers | (8,255) | |
| Total change in net unrealized appreciation (depreciation) | | (8,255) |
| Net gain (loss) | | (4,911) |
| Net increase (decrease) in net assets resulting from operations | | $(2,566) |
See accompanying notes which are an integral part of the financial statements.
Statement of Changes in Net Assets
| | For the period
August 31, 2018 (commencement of operations) to
September 30, 2018 (Unaudited) |
| Increase (Decrease) in Net Assets | |
| Operations | |
| Net investment income (loss) | $2,345 |
| Net realized gain (loss) | 3,344 |
| Change in net unrealized appreciation (depreciation) | (8,255) |
| Net increase (decrease) in net assets resulting from operations | (2,566) |
| Share transactions - net increase (decrease) | 903,000 |
| Total increase (decrease) in net assets | 900,434 |
| Net Assets | |
| Beginning of period | – |
| End of period | $900,434 |
| Other Information | |
| Undistributed net investment income end of period | $2,345 |
See accompanying notes which are an integral part of the financial statements.
Financial Highlights
Fidelity Freedom Blend 2005 Fund Class A
| | Six months ended (Unaudited) September 30, |
| | 2018 A |
| Selected Per–Share Data | |
| Net asset value, beginning of period | $10.00 |
| Income from Investment Operations | |
| Net investment income (loss)B | .02 |
| Net realized and unrealized gain (loss) | (.05) |
| Total from investment operations | (.03) |
| Net asset value, end of period | $9.97 |
| Total ReturnC,D | (.30)% |
| Ratios to Average Net AssetsE | |
| Expenses before reductions | .72%F,G |
| Expenses net of fee waivers, if any | .72%F,G |
| Expenses net of all reductions | .72%F,G |
| Net investment income (loss) | 2.88%F |
| Supplemental Data | |
| Net assets, end of period (000 omitted) | $100 |
| Portfolio turnover rateH | 1%I |
A For the period August 31, 2018 (commencement of operations) to September 30, 2018.
B Calculated based on average shares outstanding during the period.
C Total returns for periods of less than one year are not annualized.
D Total returns do not include the effect of the sales charges.
E Expense ratios reflect operating expenses of the class. Expenses before reductions do not reflect amounts reimbursed by the investment adviser or reductions from expense offset arrangements and do not represent the amount paid by the class during periods when reimbursements or reductions occur. Expense ratios before reductions for start-up periods may not be representative of longer-term operating periods. Expenses net of fee waivers reflect expenses after reimbursement by the investment adviser but prior to reductions from expense offset arrangements. Expenses net of all reductions represent the net expenses paid by the class but do not include expenses of the underlying funds in which the Fund invests.
F Annualized
G On certain classes, the size and fluctuation of net assets and expense amounts may cause ratios to differ from contractual rates.
H Amounts do not include the activity of the Underlying Funds.
I Amount not annualized.
See accompanying notes which are an integral part of the financial statements.
Fidelity Freedom Blend 2005 Fund Class M
| | Six months ended (Unaudited) September 30, |
| | 2018 A |
| Selected Per–Share Data | |
| Net asset value, beginning of period | $10.00 |
| Income from Investment Operations | |
| Net investment income (loss)B | .02 |
| Net realized and unrealized gain (loss) | (.05) |
| Total from investment operations | (.03) |
| Net asset value, end of period | $9.97 |
| Total ReturnC,D | (.30)% |
| Ratios to Average Net AssetsE | |
| Expenses before reductions | .97%F,G |
| Expenses net of fee waivers, if any | .97%F,G |
| Expenses net of all reductions | .97%F,G |
| Net investment income (loss) | 2.62%F |
| Supplemental Data | |
| Net assets, end of period (000 omitted) | $100 |
| Portfolio turnover rateH | 1%I |
A For the period August 31, 2018 (commencement of operations) to September 30, 2018.
B Calculated based on average shares outstanding during the period.
C Total returns for periods of less than one year are not annualized.
D Total returns do not include the effect of the sales charges.
E Expense ratios reflect operating expenses of the class. Expenses before reductions do not reflect amounts reimbursed by the investment adviser or reductions from expense offset arrangements and do not represent the amount paid by the class during periods when reimbursements or reductions occur. Expense ratios before reductions for start-up periods may not be representative of longer-term operating periods. Expenses net of fee waivers reflect expenses after reimbursement by the investment adviser but prior to reductions from expense offset arrangements. Expenses net of all reductions represent the net expenses paid by the class but do not include expenses of the underlying funds in which the Fund invests.
F Annualized
G On certain classes, the size and fluctuation of net assets and expense amounts may cause ratios to differ from contractual rates.
H Amounts do not include the activity of the Underlying Funds.
I Amount not annualized.
See accompanying notes which are an integral part of the financial statements.
Fidelity Freedom Blend 2005 Fund Class C
| | Six months ended (Unaudited) September 30, |
| | 2018 A |
| Selected Per–Share Data | |
| Net asset value, beginning of period | $10.00 |
| Income from Investment Operations | |
| Net investment income (loss)B | .02 |
| Net realized and unrealized gain (loss) | (.06) |
| Total from investment operations | (.04) |
| Net asset value, end of period | $9.96 |
| Total ReturnC,D | (.40)% |
| Ratios to Average Net AssetsE | |
| Expenses before reductions | 1.47%F,G |
| Expenses net of fee waivers, if any | 1.47%F,G |
| Expenses net of all reductions | 1.47%F,G |
| Net investment income (loss) | 2.13%F |
| Supplemental Data | |
| Net assets, end of period (000 omitted) | $100 |
| Portfolio turnover rateH | 1%I |
A For the period August 31, 2018 (commencement of operations) to September 30, 2018.
B Calculated based on average shares outstanding during the period.
C Total returns for periods of less than one year are not annualized.
D Total returns do not include the effect of the contingent deferred sales charge.
E Expense ratios reflect operating expenses of the class. Expenses before reductions do not reflect amounts reimbursed by the investment adviser or reductions from expense offset arrangements and do not represent the amount paid by the class during periods when reimbursements or reductions occur. Expense ratios before reductions for start-up periods may not be representative of longer-term operating periods. Expenses net of fee waivers reflect expenses after reimbursement by the investment adviser but prior to reductions from expense offset arrangements. Expenses net of all reductions represent the net expenses paid by the class but do not include expenses of the underlying funds in which the Fund invests.
F Annualized
G On certain classes, the size and fluctuation of net assets and expense amounts may cause ratios to differ from contractual rates.
H Amounts do not include the activity of the Underlying Funds.
I Amount not annualized.
See accompanying notes which are an integral part of the financial statements.
Fidelity Freedom Blend 2005 Fund
| | Six months ended (Unaudited) September 30, |
| | 2018 A |
| Selected Per–Share Data | |
| Net asset value, beginning of period | $10.00 |
| Income from Investment Operations | |
| Net investment income (loss)B | .03 |
| Net realized and unrealized gain (loss) | (.06) |
| Total from investment operations | (.03) |
| Net asset value, end of period | $9.97 |
| Total ReturnC | (.30)% |
| Ratios to Average Net AssetsD | |
| Expenses before reductions | .46%E |
| Expenses net of fee waivers, if any | .46%E |
| Expenses net of all reductions | .46%E |
| Net investment income (loss) | 3.13%E |
| Supplemental Data | |
| Net assets, end of period (000 omitted) | $103 |
| Portfolio turnover rateF | 1%G |
A For the period August 31, 2018 (commencement of operations) to September 30, 2018.
B Calculated based on average shares outstanding during the period.
C Total returns for periods of less than one year are not annualized.
D Expense ratios reflect operating expenses of the class. Expenses before reductions do not reflect amounts reimbursed by the investment adviser or reductions from expense offset arrangements and do not represent the amount paid by the class during periods when reimbursements or reductions occur. Expense ratios before reductions for start-up periods may not be representative of longer-term operating periods. Expenses net of fee waivers reflect expenses after reimbursement by the investment adviser but prior to reductions from expense offset arrangements. Expenses net of all reductions represent the net expenses paid by the class but do not include expenses of the underlying funds in which the Fund invests.
E Annualized
F Amounts do not include the activity of the Underlying Funds.
G Amount not annualized.
See accompanying notes which are an integral part of the financial statements.
Fidelity Freedom Blend 2005 Fund Class K
| | Six months ended (Unaudited) September 30, |
| | 2018 A |
| Selected Per–Share Data | |
| Net asset value, beginning of period | $10.00 |
| Income from Investment Operations | |
| Net investment income (loss)B | .03 |
| Net realized and unrealized gain (loss) | (.06) |
| Total from investment operations | (.03) |
| Net asset value, end of period | $9.97 |
| Total ReturnC | (.30)% |
| Ratios to Average Net AssetsD | |
| Expenses before reductions | .36%E |
| Expenses net of fee waivers, if any | .36%E |
| Expenses net of all reductions | .36%E |
| Net investment income (loss) | 3.24%E |
| Supplemental Data | |
| Net assets, end of period (000 omitted) | $100 |
| Portfolio turnover rateF | 1%G |
A For the period August 31, 2018 (commencement of operations) to September 30, 2018.
B Calculated based on average shares outstanding during the period.
C Total returns for periods of less than one year are not annualized.
D Expense ratios reflect operating expenses of the class. Expenses before reductions do not reflect amounts reimbursed by the investment adviser or reductions from expense offset arrangements and do not represent the amount paid by the class during periods when reimbursements or reductions occur. Expense ratios before reductions for start-up periods may not be representative of longer-term operating periods. Expenses net of fee waivers reflect expenses after reimbursement by the investment adviser but prior to reductions from expense offset arrangements. Expenses net of all reductions represent the net expenses paid by the class but do not include expenses of the underlying funds in which the Fund invests.
E Annualized
F Amounts do not include the activity of the Underlying Funds.
G Amount not annualized.
See accompanying notes which are an integral part of the financial statements.
Fidelity Freedom Blend 2005 Fund Class K6
| | Six months ended (Unaudited) September 30, |
| | 2018 A |
| Selected Per–Share Data | |
| Net asset value, beginning of period | $10.00 |
| Income from Investment Operations | |
| Net investment income (loss)B | .03 |
| Net realized and unrealized gain (loss) | (.06) |
| Total from investment operations | (.03) |
| Net asset value, end of period | $9.97 |
| Total ReturnC | (.30)% |
| Ratios to Average Net AssetsD | |
| Expenses before reductions | .27%E,F |
| Expenses net of fee waivers, if any | .27%E,F |
| Expenses net of all reductions | .27%E,F |
| Net investment income (loss) | 3.33%E |
| Supplemental Data | |
| Net assets, end of period (000 omitted) | $100 |
| Portfolio turnover rateG | 1%H |
A For the period August 31, 2018 (commencement of operations) to September 30, 2018.
B Calculated based on average shares outstanding during the period.
C Total returns for periods of less than one year are not annualized.
D Expense ratios reflect operating expenses of the class. Expenses before reductions do not reflect amounts reimbursed by the investment adviser or reductions from expense offset arrangements and do not represent the amount paid by the class during periods when reimbursements or reductions occur. Expenses net of fee waivers reflect expenses after reimbursement by the investment adviser but prior to reductions from expense offset arrangements. Expenses net of all reductions represent the net expenses paid by the class but do not include expenses of the underlying funds in which the Fund invests.
E Annualized
F On certain classes, the size and fluctuation of net assets and expense amounts may cause ratios to differ from contractual rates.
G Amounts do not include the activity of the Underlying Funds.
H Amount not annualized.
See accompanying notes which are an integral part of the financial statements.
Fidelity Freedom Blend 2005 Fund Class I
| | Six months ended (Unaudited) September 30, |
| | 2018 A |
| Selected Per–Share Data | |
| Net asset value, beginning of period | $10.00 |
| Income from Investment Operations | |
| Net investment income (loss)B | .03 |
| Net realized and unrealized gain (loss) | (.06) |
| Total from investment operations | (.03) |
| Net asset value, end of period | $9.97 |
| Total ReturnC | (.30)% |
| Ratios to Average Net AssetsD | |
| Expenses before reductions | .46%E |
| Expenses net of fee waivers, if any | .46%E |
| Expenses net of all reductions | .46%E |
| Net investment income (loss) | 3.13%E |
| Supplemental Data | |
| Net assets, end of period (000 omitted) | $100 |
| Portfolio turnover rateF | 1%G |
A For the period August 31, 2018 (commencement of operations) to September 30, 2018.
B Calculated based on average shares outstanding during the period.
C Total returns for periods of less than one year are not annualized.
D Expense ratios reflect operating expenses of the class. Expenses before reductions do not reflect amounts reimbursed by the investment adviser or reductions from expense offset arrangements and do not represent the amount paid by the class during periods when reimbursements or reductions occur. Expense ratios before reductions for start-up periods may not be representative of longer-term operating periods. Expenses net of fee waivers reflect expenses after reimbursement by the investment adviser but prior to reductions from expense offset arrangements. Expenses net of all reductions represent the net expenses paid by the class but do not include expenses of the underlying funds in which the Fund invests.
E Annualized
F Amounts do not include the activity of the Underlying Funds.
G Amount not annualized.
See accompanying notes which are an integral part of the financial statements.
Fidelity Freedom Blend 2005 Fund Class Z
| | Six months ended (Unaudited) September 30, |
| | 2018 A |
| Selected Per–Share Data | |
| Net asset value, beginning of period | $10.00 |
| Income from Investment Operations | |
| Net investment income (loss)B | .03 |
| Net realized and unrealized gain (loss) | (.06) |
| Total from investment operations | (.03) |
| Net asset value, end of period | $9.97 |
| Total ReturnC | (.30)% |
| Ratios to Average Net AssetsD | |
| Expenses before reductions | .36%E |
| Expenses net of fee waivers, if any | .36%E |
| Expenses net of all reductions | .36%E |
| Net investment income (loss) | 3.24%E |
| Supplemental Data | |
| Net assets, end of period (000 omitted) | $100 |
| Portfolio turnover rateF | 1%G |
A For the period August 31, 2018 (commencement of operations) to September 30, 2018.
B Calculated based on average shares outstanding during the period.
C Total returns for periods of less than one year are not annualized.
D Expense ratios reflect operating expenses of the class. Expenses before reductions do not reflect amounts reimbursed by the investment adviser or reductions from expense offset arrangements and do not represent the amount paid by the class during periods when reimbursements or reductions occur. Expense ratios before reductions for start-up periods may not be representative of longer-term operating periods. Expenses net of fee waivers reflect expenses after reimbursement by the investment adviser but prior to reductions from expense offset arrangements. Expenses net of all reductions represent the net expenses paid by the class but do not include expenses of the underlying funds in which the Fund invests.
E Annualized
F Amounts do not include the activity of the Underlying Funds.
G Amount not annualized.
See accompanying notes which are an integral part of the financial statements.
Fidelity Freedom Blend 2005 Fund Class Z6
| | Six months ended (Unaudited) September 30, |
| | 2018 A |
| Selected Per–Share Data | |
| Net asset value, beginning of period | $10.00 |
| Income from Investment Operations | |
| Net investment income (loss)B | .03 |
| Net realized and unrealized gain (loss) | (.06) |
| Total from investment operations | (.03) |
| Net asset value, end of period | $9.97 |
| Total ReturnC | (.30)% |
| Ratios to Average Net AssetsD | |
| Expenses before reductions | .27%E,F |
| Expenses net of fee waivers, if any | .27%E,F |
| Expenses net of all reductions | .27%E,F |
| Net investment income (loss) | 3.33%E |
| Supplemental Data | |
| Net assets, end of period (000 omitted) | $100 |
| Portfolio turnover rateG | 1%H |
A For the period August 31, 2018 (commencement of operations) to September 30, 2018.
B Calculated based on average shares outstanding during the period.
C Total returns for periods of less than one year are not annualized.
D Expense ratios reflect operating expenses of the class. Expenses before reductions do not reflect amounts reimbursed by the investment adviser or reductions from expense offset arrangements and do not represent the amount paid by the class during periods when reimbursements or reductions occur. Expenses net of fee waivers reflect expenses after reimbursement by the investment adviser but prior to reductions from expense offset arrangements. Expenses net of all reductions represent the net expenses paid by the class but do not include expenses of the underlying funds in which the Fund invests.
E Annualized
F On certain classes, the size and fluctuation of net assets and expense amounts may cause ratios to differ from contractual rates.
G Amounts do not include the activity of the Underlying Funds.
H Amount not annualized.
See accompanying notes which are an integral part of the financial statements.
Fidelity Freedom® Blend 2010 Fund
Investment Summary (Unaudited)
The information in the following tables is based on the direct investments of the Fund.
Top Holdings as of September 30, 2018
| | % of fund's net assets |
| Fidelity Series Inflation-Protected Bond Index Fund | 9.2 |
| Fidelity Series Investment Grade Bond Fund | 9.0 |
| Fidelity Series Treasury Bill Index Fund | 8.8 |
| Fidelity Series Government Bond Index Fund | 8.4 |
| Fidelity Series Large Cap Value Index Fund | 6.6 |
| Fidelity Series Investment Grade Securitized Fund | 6.5 |
| Fidelity Series Corporate Bond Fund | 6.3 |
| Fidelity Series Long-Term Treasury Bond Index Fund | 4.8 |
| Fidelity Series Emerging Markets Opportunities Fund | 4.8 |
| Fidelity Series Blue Chip Growth Fund | 4.5 |
| | 68.9 |
Asset Allocation (% of fund's net assets)
| Period end |
| | Domestic Equity Funds | 24.0% |
| | International Equity Funds | 14.4% |
| | Bond Funds | 46.9% |
| | Short-Term Funds | 14.7% |

Domestic Equity Funds category includes Fidelity Series Commodity Strategy Fund which invests in commodity-related investments.
Fidelity Freedom® Blend 2010 Fund
Schedule of Investments September 30, 2018 (Unaudited)
Showing Percentage of Net Assets
| Domestic Equity Funds - 24.0% | | | |
| | | Shares | Value |
| Fidelity Series Blue Chip Growth Fund (a) | | 2,676 | $40,950 |
| Fidelity Series Commodity Strategy Fund (a) | | 3,710 | 18,548 |
| Fidelity Series Large Cap Growth Index Fund (a) | | 3,088 | 32,056 |
| Fidelity Series Large Cap Stock Fund (a) | | 1,999 | 31,850 |
| Fidelity Series Large Cap Value Index Fund (a) | | 4,526 | 59,747 |
| Fidelity Series Small Cap Opportunities Fund (a) | | 1,065 | 15,652 |
| Fidelity Series Value Discovery Fund (a) | | 1,384 | 18,948 |
| TOTAL DOMESTIC EQUITY FUNDS | | | |
| (Cost $223,375) | | | 217,751 |
|
| International Equity Funds - 14.4% | | | |
| Fidelity Series Canada Fund (a) | | 302 | 3,270 |
| Fidelity Series Emerging Markets Fund (a) | | 490 | 4,751 |
| Fidelity Series Emerging Markets Opportunities Fund (a) | | 2,243 | 43,034 |
| Fidelity Series International Growth Fund (a) | | 1,904 | 31,225 |
| Fidelity Series International Index Fund (a) | | 807 | 8,270 |
| Fidelity Series International Small Cap Fund (a) | | 457 | 8,172 |
| Fidelity Series International Value Fund (a) | | 3,044 | 32,025 |
| TOTAL INTERNATIONAL EQUITY FUNDS | | | |
| (Cost $130,215) | | | 130,747 |
|
| Bond Funds - 46.9% | | | |
| Fidelity Series Corporate Bond Fund (a) | | 5,781 | 57,236 |
| Fidelity Series Emerging Markets Debt Fund (a) | | 588 | 5,607 |
| Fidelity Series Floating Rate High Income Fund (a) | | 241 | 2,291 |
| Fidelity Series Government Bond Index Fund (a) | | 7,679 | 75,942 |
| Fidelity Series High Income Fund (a) | | 1,239 | 11,904 |
| Fidelity Series Inflation-Protected Bond Index Fund (a) | | 8,638 | 83,872 |
| Fidelity Series Investment Grade Bond Fund (a) | | 7,524 | 81,939 |
| Fidelity Series Investment Grade Securitized Fund (a) | | 5,927 | 58,800 |
| Fidelity Series Long-Term Treasury Bond Index Fund (a) | | 5,309 | 43,750 |
| Fidelity Series Real Estate Income Fund (a) | | 395 | 4,260 |
| TOTAL BOND FUNDS | | | |
| (Cost $429,629) | | | 425,601 |
|
| Short-Term Funds - 14.7% | | | |
| Fidelity Cash Central Fund, 2.11% (b) | | 49 | 49 |
| Fidelity Series Government Money Market Fund 2.12% (a)(c) | | 26,795 | 26,795 |
| Fidelity Series Short-Term Credit Fund (a) | | 2,713 | 26,748 |
| Fidelity Series Treasury Bill Index Fund (a) | | 8,030 | 80,302 |
| TOTAL SHORT-TERM FUNDS | | | |
| (Cost $133,948) | | | 133,894 |
| TOTAL INVESTMENT IN SECURITIES - 100.0% | | | |
| (Cost $917,167) | | | 907,993 |
| NET OTHER ASSETS (LIABILITIES) - 0.0% | | | (194) |
| NET ASSETS - 100% | | | $907,799 |
Legend
(a) Affiliated Fund
(b) Affiliated fund that is generally available only to investment companies and other accounts managed by Fidelity Investments. The rate quoted is the annualized seven-day yield of the fund at period end. A complete unaudited listing of the fund's holdings as of its most recent quarter end is available upon request. In addition, each Fidelity Central Fund's financial statements are available on the SEC's website or upon request.
(c) The rate quoted is the annualized seven-day yield of the fund at period end.
Affiliated Central Funds
Information regarding fiscal year to date income earned by the Fund from investments in Fidelity Central Funds is as follows:
| Fund | Income earned |
| Fidelity Cash Central Fund | $195 |
| Total | $195 |
Amounts in the income column in the above table include any capital gain distributions from underlying funds, which are presented in the corresponding line-item in the Statement of Operations if applicable.
Affiliated Underlying Funds
Fiscal year to date information regarding the Fund's investments in affiliated Underlying Funds, excluding any Money Market Central Funds, is presented below. Exchanges between classes of the same affiliated Underlying Funds may occur.
| Affiliate | Value, beginning of period | Purchases | Sales Proceeds | Dividend Income | Realized Gain (loss) | Change in Unrealized appreciation (depreciation) | Value, end of period |
| Fidelity Series Blue Chip Growth Fund | $-- | $44,803 | $74 | $3,763 | $(8) | $(3,771) | $40,950 |
| Fidelity Series Canada Fund | -- | 3,276 | -- | -- | -- | (6) | 3,270 |
| Fidelity Series Commodity Strategy Fund | -- | 19,297 | -- | 1,098 | -- | (749) | 18,548 |
| Fidelity Series Corporate Bond Fund | -- | 57,495 | 1 | 167 | -- | (258) | 57,236 |
| Fidelity Series Emerging Markets Debt Fund | -- | 5,485 | -- | 28 | -- | 122 | 5,607 |
| Fidelity Series Emerging Markets Fund | -- | 4,823 | -- | -- | -- | (72) | 4,751 |
| Fidelity Series Emerging Markets Opportunities Fund | -- | 43,137 | 1 | -- | -- | (102) | 43,034 |
| Fidelity Series Floating Rate High Income Fund | -- | 2,284 | -- | 10 | -- | 7 | 2,291 |
| Fidelity Series Government Bond Index Fund | -- | 79,291 | 2,488 | 173 | (28) | (833) | 75,942 |
| Fidelity Series Government Money Market Fund 2.12% | -- | 26,796 | 1 | 45 | -- | -- | 26,795 |
| Fidelity Series High Income Fund | -- | 11,880 | -- | 55 | -- | 24 | 11,904 |
| Fidelity Series Inflation-Protected Bond Index Fund | -- | 84,471 | 2 | 24 | -- | (597) | 83,872 |
| Fidelity Series International Growth Fund | -- | 31,301 | 1 | -- | -- | (75) | 31,225 |
| Fidelity Series International Index Fund | -- | 8,190 | -- | -- | -- | 80 | 8,270 |
| Fidelity Series International Small Cap Fund | -- | 8,190 | -- | -- | -- | (18) | 8,172 |
| Fidelity Series International Value Fund | -- | 31,301 | 1 | -- | -- | 725 | 32,025 |
| Fidelity Series Investment Grade Bond Fund | -- | 82,534 | 2 | 197 | -- | (593) | 81,939 |
| Fidelity Series Investment Grade Securitized Fund | -- | 60,890 | 1,610 | 133 | (13) | (467) | 58,800 |
| Fidelity Series Large Cap Growth Index Fund | -- | 32,031 | 162 | -- | 1 | 186 | 32,056 |
| Fidelity Series Large Cap Stock Fund | -- | 32,031 | 340 | -- | (1) | 160 | 31,850 |
| Fidelity Series Large Cap Value Index Fund | -- | 60,147 | 531 | -- | (4) | 135 | 59,747 |
| Fidelity Series Long-Term Treasury Bond Index Fund | -- | 45,054 | 1 | 105 | -- | (1,303) | 43,750 |
| Fidelity Series Real Estate Income Fund | -- | 4,389 | -- | 112 | -- | (129) | 4,260 |
| Fidelity Series Short-Term Credit Fund | -- | 26,803 | 1 | 52 | -- | (54) | 26,748 |
| Fidelity Series Small Cap Opportunities Fund | -- | 17,210 | -- | 1,196 | -- | (1,558) | 15,652 |
| Fidelity Series Treasury Bill Index Fund | -- | 80,304 | 2 | 142 | -- | -- | 80,302 |
| Fidelity Series Value Discovery Fund | -- | 19,018 | 42 | -- | -- | (28) | 18,948 |
| Total | $-- | $922,431 | $5,260 | $7,300 | $(53) | $(9,174) | $907,944 |
Amounts in the income column in the above table include any capital gain distributions from underlying funds, which are presented in the corresponding line-item in the Statement of Operations if applicable.
Investment Valuation
All investments are categorized as Level 1 under the Fair Value Hierarchy. The inputs or methodology used for valuing securities may not be an indication of the risk associated with investing in those securities. For more information on valuation inputs please refer to the Investment Valuation section in the accompanying Notes to Financial Statements.
See accompanying notes which are an integral part of the financial statements.
Fidelity Freedom® Blend 2010 Fund
Financial Statements
Statement of Assets and Liabilities
| | | September 30, 2018 (Unaudited) |
| Assets | | |
Investment in securities, at value — See accompanying schedule:
| | |
| Fidelity Central Funds (cost $49) | $49 | |
| Other affiliated issuers (cost $917,118) | 907,944 | |
| Total Investment in Securities (cost $917,167) | | $907,993 |
| Receivable for investments sold | | 5,240 |
| Distributions receivable from Fidelity Central Funds | | 146 |
| Total assets | | 913,379 |
| Liabilities | | |
| Payable for investments purchased | $5,131 | |
| Accrued management fee | 304 | |
| Distribution and service plan fees payable | 145 | |
| Total liabilities | | 5,580 |
| Net Assets | | $907,799 |
| Net Assets consist of: | | |
| Paid in capital | | $910,000 |
| Undistributed net investment income | | 2,262 |
| Accumulated undistributed net realized gain (loss) on investments | | 4,711 |
| Net unrealized appreciation (depreciation) on investments | | (9,174) |
| Net Assets | | $907,799 |
| Calculation of Maximum Offering Price | | |
| Class A: | | |
| Net Asset Value and redemption price per share ($99,742 ÷ 10,000 shares) | | $9.97 |
| Maximum offering price per share (100/94.25 of $9.97) | | $10.58 |
| Class M: | | |
| Net Asset Value and redemption price per share ($99,721 ÷ 10,000 shares) | | $9.97 |
| Maximum offering price per share (100/96.50 of $9.97) | | $10.33 |
| Class C: | | |
| Net Asset Value and offering price per share ($99,677 ÷ 10,000 shares)(a) | | $9.97 |
| Fidelity Freedom Blend 2010 Fund: | | |
| Net Asset Value, offering price and redemption price per share ($109,787 ÷ 11,005 shares) | | $9.98 |
| Class K: | | |
| Net Asset Value, offering price and redemption price per share ($99,773 ÷ 10,000 shares) | | $9.98 |
| Class K6: | | |
| Net Asset Value, offering price and redemption price per share ($99,781 ÷ 10,000 shares) | | $9.98 |
| Class I: | | |
| Net Asset Value, offering price and redemption price per share ($99,764 ÷ 10,000 shares) | | $9.98 |
| Class Z: | | |
| Net Asset Value, offering price and redemption price per share ($99,773 ÷ 10,000 shares) | | $9.98 |
| Class Z6: | | |
| Net Asset Value, offering price and redemption price per share ($99,781 ÷ 10,000 shares) | | $9.98 |
(a) Redemption price per share is equal to net asset value less any applicable contingent deferred sales charge.
See accompanying notes which are an integral part of the financial statements.
Statement of Operations
| | | For the period
August 31, 2018 (commencement of operations) to
September 30, 2018 (Unaudited) |
| Investment Income | | |
| Dividends: | | |
| Affiliated issuers | | $2,536 |
| Income from Fidelity Central Funds | | 195 |
| Total income | | 2,731 |
| Expenses | | |
| Management fee | $316 | |
| Distribution and service plan fees | 153 | |
| Total expenses | | 469 |
| Net investment income (loss) | | 2,262 |
| Realized and Unrealized Gain (Loss) | | |
| Net realized gain (loss) on: | | |
| Investment securities: | | |
| Affiliated issuers | (53) | |
| Capital gain distributions from underlying funds: | | |
| Affiliated issuers | 4,764 | |
| Total net realized gain (loss) | | 4,711 |
| Change in net unrealized appreciation (depreciation) on: | | |
| Investment securities: | | |
| Affiliated issuers | (9,174) | |
| Total change in net unrealized appreciation (depreciation) | | (9,174) |
| Net gain (loss) | | (4,463) |
| Net increase (decrease) in net assets resulting from operations | | $(2,201) |
See accompanying notes which are an integral part of the financial statements.
Statement of Changes in Net Assets
| | For the period
August 31, 2018 (commencement of operations) to
September 30, 2018 (Unaudited) |
| Increase (Decrease) in Net Assets | |
| Operations | |
| Net investment income (loss) | $2,262 |
| Net realized gain (loss) | 4,711 |
| Change in net unrealized appreciation (depreciation) | (9,174) |
| Net increase (decrease) in net assets resulting from operations | (2,201) |
| Share transactions - net increase (decrease) | 910,000 |
| Total increase (decrease) in net assets | 907,799 |
| Net Assets | |
| Beginning of period | – |
| End of period | $907,799 |
| Other Information | |
| Undistributed net investment income end of period | $2,262 |
See accompanying notes which are an integral part of the financial statements.
Financial Highlights
Fidelity Freedom Blend 2010 Fund Class A
| | Six months ended (Unaudited) September 30, |
| | 2018 A |
| Selected Per–Share Data | |
| Net asset value, beginning of period | $10.00 |
| Income from Investment Operations | |
| Net investment income (loss)B | .02 |
| Net realized and unrealized gain (loss) | (.05) |
| Total from investment operations | (.03) |
| Net asset value, end of period | $9.97 |
| Total ReturnC,D | (.30)% |
| Ratios to Average Net AssetsE | |
| Expenses before reductions | .73%F,G |
| Expenses net of fee waivers, if any | .73%F,G |
| Expenses net of all reductions | .73%F,G |
| Net investment income (loss) | 2.77%F |
| Supplemental Data | |
| Net assets, end of period (000 omitted) | $100 |
| Portfolio turnover rateH | 1%I |
A For the period August 31, 2018 (commencement of operations) to September 30, 2018.
B Calculated based on average shares outstanding during the period.
C Total returns for periods of less than one year are not annualized.
D Total returns do not include the effect of the sales charges.
E Expense ratios reflect operating expenses of the class. Expenses before reductions do not reflect amounts reimbursed by the investment adviser or reductions from expense offset arrangements and do not represent the amount paid by the class during periods when reimbursements or reductions occur. Expense ratios before reductions for start-up periods may not be representative of longer-term operating periods. Expenses net of fee waivers reflect expenses after reimbursement by the investment adviser but prior to reductions from expense offset arrangements. Expenses net of all reductions represent the net expenses paid by the class but do not include expenses of the underlying funds in which the Fund invests.
F Annualized
G On certain classes, the size and fluctuation of net assets and expense amounts may cause ratios to differ from contractual rates.
H Amounts do not include the activity of the Underlying Funds.
I Amount not annualized.
See accompanying notes which are an integral part of the financial statements.
Fidelity Freedom Blend 2010 Fund Class M
| | Six months ended (Unaudited) September 30, |
| | 2018 A |
| Selected Per–Share Data | |
| Net asset value, beginning of period | $10.00 |
| Income from Investment Operations | |
| Net investment income (loss)B | .02 |
| Net realized and unrealized gain (loss) | (.05) |
| Total from investment operations | (.03) |
| Net asset value, end of period | $9.97 |
| Total ReturnC,D | (.30)% |
| Ratios to Average Net AssetsE | |
| Expenses before reductions | .98%F,G |
| Expenses net of fee waivers, if any | .98%F,G |
| Expenses net of all reductions | .98%F,G |
| Net investment income (loss) | 2.51%F |
| Supplemental Data | |
| Net assets, end of period (000 omitted) | $100 |
| Portfolio turnover rateH | 1%I |
A For the period August 31, 2018 (commencement of operations) to September 30, 2018.
B Calculated based on average shares outstanding during the period.
C Total returns for periods of less than one year are not annualized.
D Total returns do not include the effect of the sales charges.
E Expense ratios reflect operating expenses of the class. Expenses before reductions do not reflect amounts reimbursed by the investment adviser or reductions from expense offset arrangements and do not represent the amount paid by the class during periods when reimbursements or reductions occur. Expense ratios before reductions for start-up periods may not be representative of longer-term operating periods. Expenses net of fee waivers reflect expenses after reimbursement by the investment adviser but prior to reductions from expense offset arrangements. Expenses net of all reductions represent the net expenses paid by the class but do not include expenses of the underlying funds in which the Fund invests.
F Annualized
G On certain classes, the size and fluctuation of net assets and expense amounts may cause ratios to differ from contractual rates.
H Amounts do not include the activity of the Underlying Funds.
I Amount not annualized.
See accompanying notes which are an integral part of the financial statements.
Fidelity Freedom Blend 2010 Fund Class C
| | Six months ended (Unaudited) September 30, |
| | 2018 A |
| Selected Per–Share Data | |
| Net asset value, beginning of period | $10.00 |
| Income from Investment Operations | |
| Net investment income (loss)B | .02 |
| Net realized and unrealized gain (loss) | (.05) |
| Total from investment operations | (.03) |
| Net asset value, end of period | $9.97 |
| Total ReturnC,D | (.30)% |
| Ratios to Average Net AssetsE | |
| Expenses before reductions | 1.48%F,G |
| Expenses net of fee waivers, if any | 1.48%F,G |
| Expenses net of all reductions | 1.48%F,G |
| Net investment income (loss) | 2.01%F |
| Supplemental Data | |
| Net assets, end of period (000 omitted) | $100 |
| Portfolio turnover rateH | 1%I |
A For the period August 31, 2018 (commencement of operations) to September 30, 2018.
B Calculated based on average shares outstanding during the period.
C Total returns for periods of less than one year are not annualized.
D Total returns do not include the effect of the contingent deferred sales charge.
E Expense ratios reflect operating expenses of the class. Expenses before reductions do not reflect amounts reimbursed by the investment adviser or reductions from expense offset arrangements and do not represent the amount paid by the class during periods when reimbursements or reductions occur. Expense ratios before reductions for start-up periods may not be representative of longer-term operating periods. Expenses net of fee waivers reflect expenses after reimbursement by the investment adviser but prior to reductions from expense offset arrangements. Expenses net of all reductions represent the net expenses paid by the class but do not include expenses of the underlying funds in which the Fund invests.
F Annualized
G On certain classes, the size and fluctuation of net assets and expense amounts may cause ratios to differ from contractual rates.
H Amounts do not include the activity of the Underlying Funds.
I Amount not annualized.
See accompanying notes which are an integral part of the financial statements.
Fidelity Freedom Blend 2010 Fund
| | Six months ended (Unaudited) September 30, |
| | 2018 A |
| Selected Per–Share Data | |
| Net asset value, beginning of period | $10.00 |
| Income from Investment Operations | |
| Net investment income (loss)B | .03 |
| Net realized and unrealized gain (loss) | (.05) |
| Total from investment operations | (.02) |
| Net asset value, end of period | $9.98 |
| Total ReturnC | (.20)% |
| Ratios to Average Net AssetsD | |
| Expenses before reductions | .47%E |
| Expenses net of fee waivers, if any | .47%E |
| Expenses net of all reductions | .47%E |
| Net investment income (loss) | 3.02%E |
| Supplemental Data | |
| Net assets, end of period (000 omitted) | $110 |
| Portfolio turnover rateF | 1%G |
A For the period August 31, 2018 (commencement of operations) to September 30, 2018.
B Calculated based on average shares outstanding during the period.
C Total returns for periods of less than one year are not annualized.
D Expense ratios reflect operating expenses of the class. Expenses before reductions do not reflect amounts reimbursed by the investment adviser or reductions from expense offset arrangements and do not represent the amount paid by the class during periods when reimbursements or reductions occur. Expense ratios before reductions for start-up periods may not be representative of longer-term operating periods. Expenses net of fee waivers reflect expenses after reimbursement by the investment adviser but prior to reductions from expense offset arrangements. Expenses net of all reductions represent the net expenses paid by the class but do not include expenses of the underlying funds in which the Fund invests.
E Annualized
F Amounts do not include the activity of the Underlying Funds.
G Amount not annualized.
See accompanying notes which are an integral part of the financial statements.
Fidelity Freedom Blend 2010 Fund Class K
| | Six months ended (Unaudited) September 30, |
| | 2018 A |
| Selected Per–Share Data | |
| Net asset value, beginning of period | $10.00 |
| Income from Investment Operations | |
| Net investment income (loss)B | .03 |
| Net realized and unrealized gain (loss) | (.05) |
| Total from investment operations | (.02) |
| Net asset value, end of period | $9.98 |
| Total ReturnC | (.20)% |
| Ratios to Average Net AssetsD | |
| Expenses before reductions | .37%E |
| Expenses net of fee waivers, if any | .37%E |
| Expenses net of all reductions | .37%E |
| Net investment income (loss) | 3.12%E |
| Supplemental Data | |
| Net assets, end of period (000 omitted) | $100 |
| Portfolio turnover rateF | 1%G |
A For the period August 31, 2018 (commencement of operations) to September 30, 2018.
B Calculated based on average shares outstanding during the period.
C Total returns for periods of less than one year are not annualized.
D Expense ratios reflect operating expenses of the class. Expenses before reductions do not reflect amounts reimbursed by the investment adviser or reductions from expense offset arrangements and do not represent the amount paid by the class during periods when reimbursements or reductions occur. Expense ratios before reductions for start-up periods may not be representative of longer-term operating periods. Expenses net of fee waivers reflect expenses after reimbursement by the investment adviser but prior to reductions from expense offset arrangements. Expenses net of all reductions represent the net expenses paid by the class but do not include expenses of the underlying funds in which the Fund invests.
E Annualized
F Amounts do not include the activity of the Underlying Funds.
G Amount not annualized.
See accompanying notes which are an integral part of the financial statements.
Fidelity Freedom Blend 2010 Fund Class K6
| | Six months ended (Unaudited) September 30, |
| | 2018 A |
| Selected Per–Share Data | |
| Net asset value, beginning of period | $10.00 |
| Income from Investment Operations | |
| Net investment income (loss)B | .03 |
| Net realized and unrealized gain (loss) | (.05) |
| Total from investment operations | (.02) |
| Net asset value, end of period | $9.98 |
| Total ReturnC | (.20)% |
| Ratios to Average Net AssetsD | |
| Expenses before reductions | .27%E |
| Expenses net of fee waivers, if any | .27%E |
| Expenses net of all reductions | .27%E |
| Net investment income (loss) | 3.23%E |
| Supplemental Data | |
| Net assets, end of period (000 omitted) | $100 |
| Portfolio turnover rateF | 1%G |
A For the period August 31, 2018 (commencement of operations) to September 30, 2018.
B Calculated based on average shares outstanding during the period.
C Total returns for periods of less than one year are not annualized.
D Expense ratios reflect operating expenses of the class. Expenses before reductions do not reflect amounts reimbursed by the investment adviser or reductions from expense offset arrangements and do not represent the amount paid by the class during periods when reimbursements or reductions occur. Expenses net of fee waivers reflect expenses after reimbursement by the investment adviser but prior to reductions from expense offset arrangements. Expenses net of all reductions represent the net expenses paid by the class but do not include expenses of the underlying funds in which the Fund invests.
E Annualized
F Amounts do not include the activity of the Underlying Funds.
G Amount not annualized.
See accompanying notes which are an integral part of the financial statements.
Fidelity Freedom Blend 2010 Fund Class I
| | Six months ended (Unaudited) September 30, |
| | 2018 A |
| Selected Per–Share Data | |
| Net asset value, beginning of period | $10.00 |
| Income from Investment Operations | |
| Net investment income (loss)B | .03 |
| Net realized and unrealized gain (loss) | (.05) |
| Total from investment operations | (.02) |
| Net asset value, end of period | $9.98 |
| Total ReturnC | (.20)% |
| Ratios to Average Net AssetsD | |
| Expenses before reductions | .47%E |
| Expenses net of fee waivers, if any | .47%E |
| Expenses net of all reductions | .47%E |
| Net investment income (loss) | 3.02%E |
| Supplemental Data | |
| Net assets, end of period (000 omitted) | $100 |
| Portfolio turnover rateF | 1%G |
A For the period August 31, 2018 (commencement of operations) to September 30, 2018.
B Calculated based on average shares outstanding during the period.
C Total returns for periods of less than one year are not annualized.
D Expense ratios reflect operating expenses of the class. Expenses before reductions do not reflect amounts reimbursed by the investment adviser or reductions from expense offset arrangements and do not represent the amount paid by the class during periods when reimbursements or reductions occur. Expense ratios before reductions for start-up periods may not be representative of longer-term operating periods. Expenses net of fee waivers reflect expenses after reimbursement by the investment adviser but prior to reductions from expense offset arrangements. Expenses net of all reductions represent the net expenses paid by the class but do not include expenses of the underlying funds in which the Fund invests.
E Annualized
F Amounts do not include the activity of the Underlying Funds.
G Amount not annualized.
See accompanying notes which are an integral part of the financial statements.
Fidelity Freedom Blend 2010 Fund Class Z
| | Six months ended (Unaudited) September 30, |
| | 2018 A |
| Selected Per–Share Data | |
| Net asset value, beginning of period | $10.00 |
| Income from Investment Operations | |
| Net investment income (loss)B | .03 |
| Net realized and unrealized gain (loss) | (.05) |
| Total from investment operations | (.02) |
| Net asset value, end of period | $9.98 |
| Total ReturnC | (.20)% |
| Ratios to Average Net AssetsD | |
| Expenses before reductions | .37%E |
| Expenses net of fee waivers, if any | .37%E |
| Expenses net of all reductions | .37%E |
| Net investment income (loss) | 3.12%E |
| Supplemental Data | |
| Net assets, end of period (000 omitted) | $100 |
| Portfolio turnover rateF | 1%G |
A For the period August 31, 2018 (commencement of operations) to September 30, 2018.
B Calculated based on average shares outstanding during the period.
C Total returns for periods of less than one year are not annualized.
D Expense ratios reflect operating expenses of the class. Expenses before reductions do not reflect amounts reimbursed by the investment adviser or reductions from expense offset arrangements and do not represent the amount paid by the class during periods when reimbursements or reductions occur. Expense ratios before reductions for start-up periods may not be representative of longer-term operating periods. Expenses net of fee waivers reflect expenses after reimbursement by the investment adviser but prior to reductions from expense offset arrangements. Expenses net of all reductions represent the net expenses paid by the class but do not include expenses of the underlying funds in which the Fund invests.
E Annualized
F Amounts do not include the activity of the Underlying Funds.
G Amount not annualized.
See accompanying notes which are an integral part of the financial statements.
Fidelity Freedom Blend 2010 Fund Class Z6
| | Six months ended (Unaudited) September 30, |
| | 2018 A |
| Selected Per–Share Data | |
| Net asset value, beginning of period | $10.00 |
| Income from Investment Operations | |
| Net investment income (loss)B | .03 |
| Net realized and unrealized gain (loss) | (.05) |
| Total from investment operations | (.02) |
| Net asset value, end of period | $9.98 |
| Total ReturnC | (.20)% |
| Ratios to Average Net AssetsD | |
| Expenses before reductions | .27%E |
| Expenses net of fee waivers, if any | .27%E |
| Expenses net of all reductions | .27%E |
| Net investment income (loss) | 3.23%E |
| Supplemental Data | |
| Net assets, end of period (000 omitted) | $100 |
| Portfolio turnover rateF | 1%G |
A For the period August 31, 2018 (commencement of operations) to September 30, 2018.
B Calculated based on average shares outstanding during the period.
C Total returns for periods of less than one year are not annualized.
D Expense ratios reflect operating expenses of the class. Expenses before reductions do not reflect amounts reimbursed by the investment adviser or reductions from expense offset arrangements and do not represent the amount paid by the class during periods when reimbursements or reductions occur. Expenses net of fee waivers reflect expenses after reimbursement by the investment adviser but prior to reductions from expense offset arrangements. Expenses net of all reductions represent the net expenses paid by the class but do not include expenses of the underlying funds in which the Fund invests.
E Annualized
F Amounts do not include the activity of the Underlying Funds.
G Amount not annualized.
See accompanying notes which are an integral part of the financial statements.
Fidelity Freedom® Blend 2015 Fund
Investment Summary (Unaudited)
The information in the following tables is based on the direct investments of the Fund.
Top Holdings as of September 30, 2018
| | % of fund's net assets |
| Fidelity Series Large Cap Value Index Fund | 8.5 |
| Fidelity Series Investment Grade Bond Fund | 7.9 |
| Fidelity Series Government Bond Index Fund | 7.3 |
| Fidelity Series Inflation-Protected Bond Index Fund | 7.2 |
| Fidelity Series Treasury Bill Index Fund | 6.7 |
| Fidelity Series Blue Chip Growth Fund | 5.8 |
| Fidelity Series Investment Grade Securitized Fund | 5.7 |
| Fidelity Series Corporate Bond Fund | 5.5 |
| Fidelity Series Emerging Markets Opportunities Fund | 5.4 |
| Fidelity Series Long-Term Treasury Bond Index Fund | 4.9 |
| | 64.9 |
Asset Allocation (% of fund's net assets)
| Period end |
| | Domestic Equity Funds | 30.5% |
| | International Equity Funds | 17.2% |
| | Bond Funds | 41.1% |
| | Short-Term Funds | 11.2% |
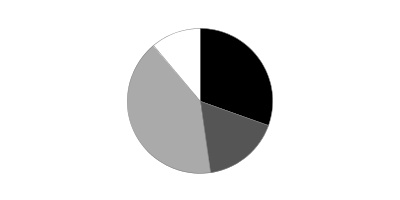
Domestic Equity Funds category includes Fidelity Series Commodity Strategy Fund which invests in commodity-related investments.
Fidelity Freedom® Blend 2015 Fund
Schedule of Investments September 30, 2018 (Unaudited)
Showing Percentage of Net Assets
| Domestic Equity Funds - 30.5% | | | |
| | | Shares | Value |
| Fidelity Series Blue Chip Growth Fund (a) | | 3,428 | $52,443 |
| Fidelity Series Commodity Strategy Fund (a) | | 3,669 | 18,347 |
| Fidelity Series Large Cap Growth Index Fund (a) | | 3,955 | 41,053 |
| Fidelity Series Large Cap Stock Fund (a) | | 2,560 | 40,789 |
| Fidelity Series Large Cap Value Index Fund (a) | | 5,797 | 76,514 |
| Fidelity Series Small Cap Opportunities Fund (a) | | 1,365 | 20,053 |
| Fidelity Series Value Discovery Fund (a) | | 1,773 | 24,266 |
| TOTAL DOMESTIC EQUITY FUNDS | | | |
| (Cost $280,545) | | | 273,465 |
|
| International Equity Funds - 17.2% | | | |
| Fidelity Series Canada Fund (a) | | 374 | 4,043 |
| Fidelity Series Emerging Markets Fund (a) | | 549 | 5,318 |
| Fidelity Series Emerging Markets Opportunities Fund (a) | | 2,512 | 48,210 |
| Fidelity Series International Growth Fund (a) | | 2,316 | 37,981 |
| Fidelity Series International Index Fund (a) | | 984 | 10,090 |
| Fidelity Series International Small Cap Fund (a) | | 557 | 9,969 |
| Fidelity Series International Value Fund (a) | | 3,704 | 38,963 |
| TOTAL INTERNATIONAL EQUITY FUNDS | | | |
| (Cost $153,916) | | | 154,574 |
|
| Bond Funds - 41.1% | | | |
| Fidelity Series Corporate Bond Fund (a) | | 4,990 | 49,404 |
| Fidelity Series Emerging Markets Debt Fund (a) | | 582 | 5,547 |
| Fidelity Series Floating Rate High Income Fund (a) | | 238 | 2,266 |
| Fidelity Series Government Bond Index Fund (a) | | 6,647 | 65,740 |
| Fidelity Series High Income Fund (a) | | 1,225 | 11,775 |
| Fidelity Series Inflation-Protected Bond Index Fund (a) | | 6,665 | 64,718 |
| Fidelity Series Investment Grade Bond Fund (a) | | 6,509 | 70,885 |
| Fidelity Series Investment Grade Securitized Fund (a) | | 5,131 | 50,901 |
| Fidelity Series Long-Term Treasury Bond Index Fund (a) | | 5,355 | 44,121 |
| Fidelity Series Real Estate Income Fund (a) | | 391 | 4,213 |
| TOTAL BOND FUNDS | | | |
| (Cost $373,230) | | | 369,570 |
|
| Short-Term Funds - 11.2% | | | |
| Fidelity Cash Central Fund, 2.11% (b) | | 49 | 49 |
| Fidelity Series Government Money Market Fund 2.12% (a)(c) | | 20,193 | 20,193 |
| Fidelity Series Short-Term Credit Fund (a) | | 2,044 | 20,157 |
| Fidelity Series Treasury Bill Index Fund (a) | | 6,049 | 60,494 |
| TOTAL SHORT-TERM FUNDS | | | |
| (Cost $100,934) | | | 100,893 |
| TOTAL INVESTMENT IN SECURITIES - 100.0% | | | |
| (Cost $908,625) | | | 898,502 |
| NET OTHER ASSETS (LIABILITIES) - 0.0% | | | (219) |
| NET ASSETS - 100% | | | $898,283 |
Legend
(a) Affiliated Fund
(b) Affiliated fund that is generally available only to investment companies and other accounts managed by Fidelity Investments. The rate quoted is the annualized seven-day yield of the fund at period end. A complete unaudited listing of the fund's holdings as of its most recent quarter end is available upon request. In addition, each Fidelity Central Fund's financial statements are available on the SEC's website or upon request.
(c) The rate quoted is the annualized seven-day yield of the fund at period end.
Affiliated Central Funds
Information regarding fiscal year to date income earned by the Fund from investments in Fidelity Central Funds is as follows:
| Fund | Income earned |
| Fidelity Cash Central Fund | $195 |
| Total | $195 |
Amounts in the income column in the above table include any capital gain distributions from underlying funds, which are presented in the corresponding line-item in the Statement of Operations if applicable.
Affiliated Underlying Funds
Fiscal year to date information regarding the Fund's investments in affiliated Underlying Funds, excluding any Money Market Central Funds, is presented below. Exchanges between classes of the same affiliated Underlying Funds may occur.
| Affiliate | Value, beginning of period | Purchases | Sales Proceeds | Dividend Income | Realized Gain (loss) | Change in Unrealized appreciation (depreciation) | Value, end of period |
| Fidelity Series Blue Chip Growth Fund | $-- | $57,343 | $8 | $4,865 | $(1) | $(4,891) | $52,443 |
| Fidelity Series Canada Fund | -- | 4,050 | -- | -- | -- | (7) | 4,043 |
| Fidelity Series Commodity Strategy Fund | -- | 19,100 | -- | 1,098 | -- | (753) | 18,347 |
| Fidelity Series Corporate Bond Fund | -- | 49,632 | 1 | 145 | -- | (227) | 49,404 |
| Fidelity Series Emerging Markets Debt Fund | -- | 5,425 | -- | 28 | -- | 122 | 5,547 |
| Fidelity Series Emerging Markets Fund | -- | 5,400 | -- | -- | -- | (82) | 5,318 |
| Fidelity Series Emerging Markets Opportunities Fund | -- | 48,336 | 1 | -- | -- | (125) | 48,210 |
| Fidelity Series Floating Rate High Income Fund | -- | 2,259 | -- | 10 | -- | 7 | 2,266 |
| Fidelity Series Government Bond Index Fund | -- | 68,544 | 2,052 | 150 | (22) | (730) | 65,740 |
| Fidelity Series Government Money Market Fund 2.12% | -- | 20,193 | -- | 34 | -- | -- | 20,193 |
| Fidelity Series High Income Fund | -- | 11,751 | -- | 55 | -- | 24 | 11,775 |
| Fidelity Series Inflation-Protected Bond Index Fund | -- | 65,185 | 1 | 19 | -- | (466) | 64,718 |
| Fidelity Series International Growth Fund | -- | 38,075 | 1 | -- | -- | (93) | 37,981 |
| Fidelity Series International Index Fund | -- | 9,992 | -- | -- | -- | 98 | 10,090 |
| Fidelity Series International Small Cap Fund | -- | 9,991 | -- | -- | -- | (22) | 9,969 |
| Fidelity Series International Value Fund | -- | 38,075 | 1 | -- | -- | 889 | 38,963 |
| Fidelity Series Investment Grade Bond Fund | -- | 71,406 | 2 | 171 | -- | (519) | 70,885 |
| Fidelity Series Investment Grade Securitized Fund | -- | 52,675 | 1,353 | 116 | (11) | (410) | 50,901 |
| Fidelity Series Large Cap Growth Index Fund | -- | 40,956 | 141 | -- | 1 | 237 | 41,053 |
| Fidelity Series Large Cap Stock Fund | -- | 40,955 | 373 | -- | 2 | 205 | 40,789 |
| Fidelity Series Large Cap Value Index Fund | -- | 76,960 | 620 | -- | 1 | 174 | 76,514 |
| Fidelity Series Long-Term Treasury Bond Index Fund | -- | 45,453 | 1 | 107 | -- | (1,331) | 44,121 |
| Fidelity Series Real Estate Income Fund | -- | 4,342 | -- | 112 | -- | (129) | 4,213 |
| Fidelity Series Short-Term Credit Fund | -- | 20,199 | 1 | 40 | -- | (41) | 20,157 |
| Fidelity Series Small Cap Opportunities Fund | -- | 22,071 | -- | 1,549 | -- | (2,018) | 20,053 |
| Fidelity Series Treasury Bill Index Fund | -- | 60,495 | 1 | 108 | -- | -- | 60,494 |
| Fidelity Series Value Discovery Fund | -- | 24,303 | 2 | -- | -- | (35) | 24,266 |
| Total | $-- | $913,165 | $4,559 | $8,607 | $(30) | $(10,123) | $898,453 |
Amounts in the income column in the above table include any capital gain distributions from underlying funds, which are presented in the corresponding line-item in the Statement of Operations if applicable.
Investment Valuation
All investments are categorized as Level 1 under the Fair Value Hierarchy. The inputs or methodology used for valuing securities may not be an indication of the risk associated with investing in those securities. For more information on valuation inputs please refer to the Investment Valuation section in the accompanying Notes to Financial Statements.
See accompanying notes which are an integral part of the financial statements.
Fidelity Freedom® Blend 2015 Fund
Financial Statements
Statement of Assets and Liabilities
| | | September 30, 2018 (Unaudited) |
| Assets | | |
Investment in securities, at value — See accompanying schedule:
| | |
| Fidelity Central Funds (cost $49) | $49 | |
| Other affiliated issuers (cost $908,576) | 898,453 | |
| Total Investment in Securities (cost $908,625) | | $898,502 |
| Receivable for investments sold | | 4,539 |
| Distributions receivable from Fidelity Central Funds | | 146 |
| Total assets | | 903,187 |
| Liabilities | | |
| Payable for investments purchased | $4,443 | |
| Accrued management fee | 316 | |
| Distribution and service plan fees payable | 145 | |
| Total liabilities | | 4,904 |
| Net Assets | | $898,283 |
| Net Assets consist of: | | |
| Paid in capital | | $900,115 |
| Undistributed net investment income | | 2,177 |
| Accumulated undistributed net realized gain (loss) on investments | | 6,114 |
| Net unrealized appreciation (depreciation) on investments | | (10,123) |
| Net Assets | | $898,283 |
| Calculation of Maximum Offering Price | | |
| Class A: | | |
| Net Asset Value and redemption price per share ($99,786 ÷ 10,000 shares) | | $9.98 |
| Maximum offering price per share (100/94.25 of $9.98) | | $10.59 |
| Class M: | | |
| Net Asset Value and redemption price per share ($99,764 ÷ 10,000 shares) | | $9.98 |
| Maximum offering price per share (100/96.50 of $9.98) | | $10.34 |
| Class C: | | |
| Net Asset Value and offering price per share ($99,721 ÷ 10,000 shares)(a) | | $9.97 |
| Fidelity Freedom Blend 2015 Fund: | | |
| Net Asset Value, offering price and redemption price per share ($99,923 ÷ 10,012 shares) | | $9.98 |
| Class K: | | |
| Net Asset Value, offering price and redemption price per share ($99,816 ÷ 10,000 shares) | | $9.98 |
| Class K6: | | |
| Net Asset Value, offering price and redemption price per share ($99,825 ÷ 10,000 shares) | | $9.98 |
| Class I: | | |
| Net Asset Value, offering price and redemption price per share ($99,807 ÷ 10,000 shares) | | $9.98 |
| Class Z: | | |
| Net Asset Value, offering price and redemption price per share ($99,816 ÷ 10,000 shares) | | $9.98 |
| Class Z6: | | |
| Net Asset Value, offering price and redemption price per share ($99,825 ÷ 10,000 shares) | | $9.98 |
(a) Redemption price per share is equal to net asset value less any applicable contingent deferred sales charge.
See accompanying notes which are an integral part of the financial statements.
Statement of Operations
| | | For the period
August 31, 2018 (commencement of operations) to
September 30, 2018 (Unaudited) |
| Investment Income | | |
| Dividends: | | |
| Affiliated issuers | | $2,463 |
| Income from Fidelity Central Funds | | 195 |
| Total income | | 2,658 |
| Expenses | | |
| Management fee | $328 | |
| Distribution and service plan fees | 153 | |
| Total expenses | | 481 |
| Net investment income (loss) | | 2,177 |
| Realized and Unrealized Gain (Loss) | | |
| Net realized gain (loss) on: | | |
| Investment securities: | | |
| Affiliated issuers | (30) | |
| Capital gain distributions from underlying funds: | | |
| Affiliated issuers | 6,144 | |
| Total net realized gain (loss) | | 6,114 |
| Change in net unrealized appreciation (depreciation) on: | | |
| Investment securities: | | |
| Affiliated issuers | (10,123) | |
| Total change in net unrealized appreciation (depreciation) | | (10,123) |
| Net gain (loss) | | (4,009) |
| Net increase (decrease) in net assets resulting from operations | | $(1,832) |
See accompanying notes which are an integral part of the financial statements.
Statement of Changes in Net Assets
| | For the period
August 31, 2018 (commencement of operations) to
September 30, 2018 (Unaudited) |
| Increase (Decrease) in Net Assets | |
| Operations | |
| Net investment income (loss) | $2,177 |
| Net realized gain (loss) | 6,114 |
| Change in net unrealized appreciation (depreciation) | (10,123) |
| Net increase (decrease) in net assets resulting from operations | (1,832) |
| Share transactions - net increase (decrease) | 900,115 |
| Total increase (decrease) in net assets | 898,283 |
| Net Assets | |
| Beginning of period | – |
| End of period | $898,283 |
| Other Information | |
| Undistributed net investment income end of period | $2,177 |
See accompanying notes which are an integral part of the financial statements.
Financial Highlights
Fidelity Freedom Blend 2015 Fund Class A
| | Six months ended (Unaudited) September 30, |
| | 2018 A |
| Selected Per–Share Data | |
| Net asset value, beginning of period | $10.00 |
| Income from Investment Operations | |
| Net investment income (loss)B | .02 |
| Net realized and unrealized gain (loss) | (.04) |
| Total from investment operations | (.02) |
| Net asset value, end of period | $9.98 |
| Total ReturnC,D | (.20)% |
| Ratios to Average Net AssetsE | |
| Expenses before reductions | .74%F |
| Expenses net of fee waivers, if any | .74%F |
| Expenses net of all reductions | .74%F |
| Net investment income (loss) | 2.67%F |
| Supplemental Data | |
| Net assets, end of period (000 omitted) | $100 |
| Portfolio turnover rateG | 1%H |
A For the period August 31, 2018 (commencement of operations) to September 30, 2018.
B Calculated based on average shares outstanding during the period.
C Total returns for periods of less than one year are not annualized.
D Total returns do not include the effect of the sales charges.
E Expense ratios reflect operating expenses of the class. Expenses before reductions do not reflect amounts reimbursed by the investment adviser or reductions from expense offset arrangements and do not represent the amount paid by the class during periods when reimbursements or reductions occur. Expense ratios before reductions for start-up periods may not be representative of longer-term operating periods. Expenses net of fee waivers reflect expenses after reimbursement by the investment adviser but prior to reductions from expense offset arrangements. Expenses net of all reductions represent the net expenses paid by the class but do not include expenses of the underlying funds in which the Fund invests.
F Annualized
G Amounts do not include the activity of the Underlying Funds.
H Amount not annualized.
See accompanying notes which are an integral part of the financial statements.
Fidelity Freedom Blend 2015 Fund Class M
| | Six months ended (Unaudited) September 30, |
| | 2018 A |
| Selected Per–Share Data | |
| Net asset value, beginning of period | $10.00 |
| Income from Investment Operations | |
| Net investment income (loss)B | .02 |
| Net realized and unrealized gain (loss) | (.04) |
| Total from investment operations | (.02) |
| Net asset value, end of period | $9.98 |
| Total ReturnC,D | (.20)% |
| Ratios to Average Net AssetsE | |
| Expenses before reductions | .99%F |
| Expenses net of fee waivers, if any | .99%F |
| Expenses net of all reductions | .99%F |
| Net investment income (loss) | 2.42%F |
| Supplemental Data | |
| Net assets, end of period (000 omitted) | $100 |
| Portfolio turnover rateG | 1%H |
A For the period August 31, 2018 (commencement of operations) to September 30, 2018.
B Calculated based on average shares outstanding during the period.
C Total returns for periods of less than one year are not annualized.
D Total returns do not include the effect of the sales charges.
E Expense ratios reflect operating expenses of the class. Expenses before reductions do not reflect amounts reimbursed by the investment adviser or reductions from expense offset arrangements and do not represent the amount paid by the class during periods when reimbursements or reductions occur. Expense ratios before reductions for start-up periods may not be representative of longer-term operating periods. Expenses net of fee waivers reflect expenses after reimbursement by the investment adviser but prior to reductions from expense offset arrangements. Expenses net of all reductions represent the net expenses paid by the class but do not include expenses of the underlying funds in which the Fund invests.
F Annualized
G Amounts do not include the activity of the Underlying Funds.
H Amount not annualized.
See accompanying notes which are an integral part of the financial statements.
Fidelity Freedom Blend 2015 Fund Class C
| | Six months ended (Unaudited) September 30, |
| | 2018 A |
| Selected Per–Share Data | |
| Net asset value, beginning of period | $10.00 |
| Income from Investment Operations | |
| Net investment income (loss)B | .02 |
| Net realized and unrealized gain (loss) | (.05) |
| Total from investment operations | (.03) |
| Net asset value, end of period | $9.97 |
| Total ReturnC,D | (.30)% |
| Ratios to Average Net AssetsE | |
| Expenses before reductions | 1.49%F |
| Expenses net of fee waivers, if any | 1.49%F |
| Expenses net of all reductions | 1.49%F |
| Net investment income (loss) | 1.92%F |
| Supplemental Data | |
| Net assets, end of period (000 omitted) | $100 |
| Portfolio turnover rateG | 1%H |
A For the period August 31, 2018 (commencement of operations) to September 30, 2018.
B Calculated based on average shares outstanding during the period.
C Total returns for periods of less than one year are not annualized.
D Total returns do not include the effect of the contingent deferred sales charge.
E Expense ratios reflect operating expenses of the class. Expenses before reductions do not reflect amounts reimbursed by the investment adviser or reductions from expense offset arrangements and do not represent the amount paid by the class during periods when reimbursements or reductions occur. Expense ratios before reductions for start-up periods may not be representative of longer-term operating periods. Expenses net of fee waivers reflect expenses after reimbursement by the investment adviser but prior to reductions from expense offset arrangements. Expenses net of all reductions represent the net expenses paid by the class but do not include expenses of the underlying funds in which the Fund invests.
F Annualized
G Amounts do not include the activity of the Underlying Funds.
H Amount not annualized.
See accompanying notes which are an integral part of the financial statements.
Fidelity Freedom Blend 2015 Fund
| | Six months ended (Unaudited) September 30, |
| | 2018 A |
| Selected Per–Share Data | |
| Net asset value, beginning of period | $10.00 |
| Income from Investment Operations | |
| Net investment income (loss)B | .03 |
| Net realized and unrealized gain (loss) | (.05) |
| Total from investment operations | (.02) |
| Net asset value, end of period | $9.98 |
| Total ReturnC | (.20)% |
| Ratios to Average Net AssetsD | |
| Expenses before reductions | .48%E,F |
| Expenses net of fee waivers, if any | .48%E,F |
| Expenses net of all reductions | .48%E,F |
| Net investment income (loss) | 2.93%E |
| Supplemental Data | |
| Net assets, end of period (000 omitted) | $100 |
| Portfolio turnover rateG | 1%H |
A For the period August 31, 2018 (commencement of operations) to September 30, 2018.
B Calculated based on average shares outstanding during the period.
C Total returns for periods of less than one year are not annualized.
D Expense ratios reflect operating expenses of the class. Expenses before reductions do not reflect amounts reimbursed by the investment adviser or reductions from expense offset arrangements and do not represent the amount paid by the class during periods when reimbursements or reductions occur. Expense ratios before reductions for start-up periods may not be representative of longer-term operating periods. Expenses net of fee waivers reflect expenses after reimbursement by the investment adviser but prior to reductions from expense offset arrangements. Expenses net of all reductions represent the net expenses paid by the class but do not include expenses of the underlying funds in which the Fund invests.
E Annualized
F On certain classes, the size and fluctuation of net assets and expense amounts may cause ratios to differ from contractual rates.
G Amounts do not include the activity of the Underlying Funds.
H Amount not annualized.
See accompanying notes which are an integral part of the financial statements.
Fidelity Freedom Blend 2015 Fund Class K
| | Six months ended (Unaudited) September 30, |
| | 2018 A |
| Selected Per–Share Data | |
| Net asset value, beginning of period | $10.00 |
| Income from Investment Operations | |
| Net investment income (loss)B | .03 |
| Net realized and unrealized gain (loss) | (.05) |
| Total from investment operations | (.02) |
| Net asset value, end of period | $9.98 |
| Total ReturnC | (.20)% |
| Ratios to Average Net AssetsD | |
| Expenses before reductions | .39%E |
| Expenses net of fee waivers, if any | .39%E |
| Expenses net of all reductions | .39%E |
| Net investment income (loss) | 3.02%E |
| Supplemental Data | |
| Net assets, end of period (000 omitted) | $100 |
| Portfolio turnover rateF | 1%G |
A For the period August 31, 2018 (commencement of operations) to September 30, 2018.
B Calculated based on average shares outstanding during the period.
C Total returns for periods of less than one year are not annualized.
D Expense ratios reflect operating expenses of the class. Expenses before reductions do not reflect amounts reimbursed by the investment adviser or reductions from expense offset arrangements and do not represent the amount paid by the class during periods when reimbursements or reductions occur. Expense ratios before reductions for start-up periods may not be representative of longer-term operating periods. Expenses net of fee waivers reflect expenses after reimbursement by the investment adviser but prior to reductions from expense offset arrangements. Expenses net of all reductions represent the net expenses paid by the class but do not include expenses of the underlying funds in which the Fund invests.
E Annualized
F Amounts do not include the activity of the Underlying Funds.
G Amount not annualized.
See accompanying notes which are an integral part of the financial statements.
Fidelity Freedom Blend 2015 Fund Class K6
| | Six months ended (Unaudited) September 30, |
| | 2018 A |
| Selected Per–Share Data | |
| Net asset value, beginning of period | $10.00 |
| Income from Investment Operations | |
| Net investment income (loss)B | .03 |
| Net realized and unrealized gain (loss) | (.05) |
| Total from investment operations | (.02) |
| Net asset value, end of period | $9.98 |
| Total ReturnC | (.20)% |
| Ratios to Average Net AssetsD | |
| Expenses before reductions | .29%E |
| Expenses net of fee waivers, if any | .29%E |
| Expenses net of all reductions | .29%E |
| Net investment income (loss) | 3.12%E |
| Supplemental Data | |
| Net assets, end of period (000 omitted) | $100 |
| Portfolio turnover rateF | 1%G |
A For the period August 31, 2018 (commencement of operations) to September 30, 2018.
B Calculated based on average shares outstanding during the period.
C Total returns for periods of less than one year are not annualized.
D Expense ratios reflect operating expenses of the class. Expenses before reductions do not reflect amounts reimbursed by the investment adviser or reductions from expense offset arrangements and do not represent the amount paid by the class during periods when reimbursements or reductions occur. Expenses net of fee waivers reflect expenses after reimbursement by the investment adviser but prior to reductions from expense offset arrangements. Expenses net of all reductions represent the net expenses paid by the class but do not include expenses of the underlying funds in which the Fund invests.
E Annualized
F Amounts do not include the activity of the Underlying Funds.
G Amount not annualized.
See accompanying notes which are an integral part of the financial statements.
Fidelity Freedom Blend 2015 Fund Class I
| | Six months ended (Unaudited) September 30, |
| | 2018 A |
| Selected Per–Share Data | |
| Net asset value, beginning of period | $10.00 |
| Income from Investment Operations | |
| Net investment income (loss)B | .03 |
| Net realized and unrealized gain (loss) | (.05) |
| Total from investment operations | (.02) |
| Net asset value, end of period | $9.98 |
| Total ReturnC | (.20)% |
| Ratios to Average Net AssetsD | |
| Expenses before reductions | .49%E |
| Expenses net of fee waivers, if any | .49%E |
| Expenses net of all reductions | .49%E |
| Net investment income (loss) | 2.93%E |
| Supplemental Data | |
| Net assets, end of period (000 omitted) | $100 |
| Portfolio turnover rateF | 1%G |
A For the period August 31, 2018 (commencement of operations) to September 30, 2018.
B Calculated based on average shares outstanding during the period.
C Total returns for periods of less than one year are not annualized.
D Expense ratios reflect operating expenses of the class. Expenses before reductions do not reflect amounts reimbursed by the investment adviser or reductions from expense offset arrangements and do not represent the amount paid by the class during periods when reimbursements or reductions occur. Expense ratios before reductions for start-up periods may not be representative of longer-term operating periods. Expenses net of fee waivers reflect expenses after reimbursement by the investment adviser but prior to reductions from expense offset arrangements. Expenses net of all reductions represent the net expenses paid by the class but do not include expenses of the underlying funds in which the Fund invests.
E Annualized
F Amounts do not include the activity of the Underlying Funds.
G Amount not annualized.
See accompanying notes which are an integral part of the financial statements.
Fidelity Freedom Blend 2015 Fund Class Z
| | Six months ended (Unaudited) September 30, |
| | 2018 A |
| Selected Per–Share Data | |
| Net asset value, beginning of period | $10.00 |
| Income from Investment Operations | |
| Net investment income (loss)B | .03 |
| Net realized and unrealized gain (loss) | (.05) |
| Total from investment operations | (.02) |
| Net asset value, end of period | $9.98 |
| Total ReturnC | (.20)% |
| Ratios to Average Net AssetsD | |
| Expenses before reductions | .39%E |
| Expenses net of fee waivers, if any | .39%E |
| Expenses net of all reductions | .39%E |
| Net investment income (loss) | 3.02%E |
| Supplemental Data | |
| Net assets, end of period (000 omitted) | $100 |
| Portfolio turnover rateF | 1%G |
A For the period August 31, 2018 (commencement of operations) to September 30, 2018.
B Calculated based on average shares outstanding during the period.
C Total returns for periods of less than one year are not annualized.
D Expense ratios reflect operating expenses of the class. Expenses before reductions do not reflect amounts reimbursed by the investment adviser or reductions from expense offset arrangements and do not represent the amount paid by the class during periods when reimbursements or reductions occur. Expense ratios before reductions for start-up periods may not be representative of longer-term operating periods. Expenses net of fee waivers reflect expenses after reimbursement by the investment adviser but prior to reductions from expense offset arrangements. Expenses net of all reductions represent the net expenses paid by the class but do not include expenses of the underlying funds in which the Fund invests.
E Annualized
F Amounts do not include the activity of the Underlying Funds.
G Amount not annualized.
See accompanying notes which are an integral part of the financial statements.
Fidelity Freedom Blend 2015 Fund Class Z6
| | Six months ended (Unaudited) September 30, |
| | 2018 A |
| Selected Per–Share Data | |
| Net asset value, beginning of period | $10.00 |
| Income from Investment Operations | |
| Net investment income (loss)B | .03 |
| Net realized and unrealized gain (loss) | (.05) |
| Total from investment operations | (.02) |
| Net asset value, end of period | $9.98 |
| Total ReturnC | (.20)% |
| Ratios to Average Net AssetsD | |
| Expenses before reductions | .29%E |
| Expenses net of fee waivers, if any | .29%E |
| Expenses net of all reductions | .29%E |
| Net investment income (loss) | 3.12%E |
| Supplemental Data | |
| Net assets, end of period (000 omitted) | $100 |
| Portfolio turnover rateF | 1%G |
A For the period August 31, 2018 (commencement of operations) to September 30, 2018.
B Calculated based on average shares outstanding during the period.
C Total returns for periods of less than one year are not annualized.
D Expense ratios reflect operating expenses of the class. Expenses before reductions do not reflect amounts reimbursed by the investment adviser or reductions from expense offset arrangements and do not represent the amount paid by the class during periods when reimbursements or reductions occur. Expenses net of fee waivers reflect expenses after reimbursement by the investment adviser but prior to reductions from expense offset arrangements. Expenses net of all reductions represent the net expenses paid by the class but do not include expenses of the underlying funds in which the Fund invests.
E Annualized
F Amounts do not include the activity of the Underlying Funds.
G Amount not annualized.
See accompanying notes which are an integral part of the financial statements.
Fidelity Freedom® Blend 2020 Fund
Investment Summary (Unaudited)
The information in the following tables is based on the direct investments of the Fund.
Top Holdings as of September 30, 2018
| | % of fund's net assets |
| Fidelity Series Large Cap Value Index Fund | 10.1 |
| Fidelity Series Investment Grade Bond Fund | 7.0 |
| Fidelity Series Blue Chip Growth Fund | 6.9 |
| Fidelity Series Government Bond Index Fund | 6.5 |
| Fidelity Series Emerging Markets Opportunities Fund | 5.9 |
| Fidelity Series Large Cap Growth Index Fund | 5.4 |
| Fidelity Series Large Cap Stock Fund | 5.4 |
| Fidelity Series Inflation-Protected Bond Index Fund | 5.4 |
| Fidelity Series Treasury Bill Index Fund | 5.1 |
| Fidelity Series Long-Term Treasury Bond Index Fund | 5.0 |
| | 62.7 |
Asset Allocation (% of fund's net assets)
| Period end |
| | Domestic Equity Funds | 35.7% |
| | International Equity Funds | 19.5% |
| | Bond Funds | 36.3% |
| | Short-Term Funds | 8.5% |

Domestic Equity Funds category includes Fidelity Series Commodity Strategy Fund which invests in commodity-related investments.
Fidelity Freedom® Blend 2020 Fund
Schedule of Investments September 30, 2018 (Unaudited)
Showing Percentage of Net Assets
| Domestic Equity Funds - 35.7% | | | |
| | | Shares | Value |
| Fidelity Series Blue Chip Growth Fund (a) | | 4,201 | $64,268 |
| Fidelity Series Commodity Strategy Fund (a) | | 3,792 | 18,961 |
| Fidelity Series Large Cap Growth Index Fund (a) | | 4,855 | 50,392 |
| Fidelity Series Large Cap Stock Fund (a) | | 3,143 | 50,069 |
| Fidelity Series Large Cap Value Index Fund (a) | | 7,113 | 93,885 |
| Fidelity Series Small Cap Opportunities Fund (a) | | 1,671 | 24,554 |
| Fidelity Series Value Discovery Fund (a) | | 2,171 | 29,715 |
| TOTAL DOMESTIC EQUITY FUNDS | | | |
| (Cost $340,060) | | | 331,844 |
|
| International Equity Funds - 19.5% | | | |
| Fidelity Series Canada Fund (a) | | 438 | 4,735 |
| Fidelity Series Emerging Markets Fund (a) | | 625 | 6,052 |
| Fidelity Series Emerging Markets Opportunities Fund (a) | | 2,860 | 54,878 |
| Fidelity Series International Growth Fund (a) | | 2,761 | 45,273 |
| Fidelity Series International Index Fund (a) | | 1,173 | 12,018 |
| Fidelity Series International Small Cap Fund (a) | | 664 | 11,878 |
| Fidelity Series International Value Fund (a) | | 4,412 | 46,417 |
| TOTAL INTERNATIONAL EQUITY FUNDS | | | |
| (Cost $180,433) | | | 181,251 |
|
| Bond Funds - 36.3% | | | |
| Fidelity Series Corporate Bond Fund (a) | | 4,529 | 44,838 |
| Fidelity Series Emerging Markets Debt Fund (a) | | 601 | 5,731 |
| Fidelity Series Floating Rate High Income Fund (a) | | 246 | 2,342 |
| Fidelity Series Government Bond Index Fund (a) | | 6,068 | 60,010 |
| Fidelity Series High Income Fund (a) | | 1,266 | 12,167 |
| Fidelity Series Inflation-Protected Bond Index Fund (a) | | 5,120 | 49,712 |
| Fidelity Series Investment Grade Bond Fund (a) | | 5,933 | 64,615 |
| Fidelity Series Investment Grade Securitized Fund (a) | | 4,684 | 46,464 |
| Fidelity Series Long-Term Treasury Bond Index Fund (a) | | 5,639 | 46,464 |
| Fidelity Series Real Estate Income Fund (a) | | 404 | 4,355 |
| TOTAL BOND FUNDS | | | |
| (Cost $340,016) | | | 336,698 |
|
| Short-Term Funds - 8.5% | | | |
| Fidelity Cash Central Fund, 2.11% (b) | | 49 | 49 |
| Fidelity Series Government Money Market Fund 2.12% (a)(c) | | 15,839 | 15,839 |
| Fidelity Series Short-Term Credit Fund (a) | | 1,604 | 15,812 |
| Fidelity Series Treasury Bill Index Fund (a) | | 4,752 | 47,521 |
| TOTAL SHORT-TERM FUNDS | | | |
| (Cost $79,252) | | | 79,221 |
| TOTAL INVESTMENT IN SECURITIES - 100.0% | | | |
| (Cost $939,761) | | | 929,014 |
| NET OTHER ASSETS (LIABILITIES) - 0.0% | | | (243) |
| NET ASSETS - 100% | | | $928,771 |
Legend
(a) Affiliated Fund
(b) Affiliated fund that is generally available only to investment companies and other accounts managed by Fidelity Investments. The rate quoted is the annualized seven-day yield of the fund at period end. A complete unaudited listing of the fund's holdings as of its most recent quarter end is available upon request. In addition, each Fidelity Central Fund's financial statements are available on the SEC's website or upon request.
(c) The rate quoted is the annualized seven-day yield of the fund at period end.
Affiliated Central Funds
Information regarding fiscal year to date income earned by the Fund from investments in Fidelity Central Funds is as follows:
| Fund | Income earned |
| Fidelity Cash Central Fund | $195 |
| Total | $195 |
Amounts in the income column in the above table include any capital gain distributions from underlying funds, which are presented in the corresponding line-item in the Statement of Operations if applicable.
Affiliated Underlying Funds
Fiscal year to date information regarding the Fund's investments in affiliated Underlying Funds, excluding any Money Market Central Funds, is presented below. Exchanges between classes of the same affiliated Underlying Funds may occur.
| Affiliate | Value, beginning of period | Purchases | Sales Proceeds | Dividend Income | Realized Gain (loss) | Change in Unrealized appreciation (depreciation) | Value, end of period |
| Fidelity Series Blue Chip Growth Fund | $-- | $70,035 | $2 | $5,767 | $-- | $(5,765) | $64,268 |
| Fidelity Series Canada Fund | -- | 4,744 | -- | -- | -- | (9) | 4,735 |
| Fidelity Series Commodity Strategy Fund | -- | 19,701 | -- | 1,098 | -- | (740) | 18,961 |
| Fidelity Series Corporate Bond Fund | -- | 45,035 | 1 | 130 | -- | (196) | 44,838 |
| Fidelity Series Emerging Markets Debt Fund | -- | 5,606 | -- | 28 | -- | 125 | 5,731 |
| Fidelity Series Emerging Markets Fund | -- | 6,139 | -- | -- | -- | (87) | 6,052 |
| Fidelity Series Emerging Markets Opportunities Fund | -- | 54,987 | 1 | -- | -- | (108) | 54,878 |
| Fidelity Series Floating Rate High Income Fund | -- | 2,334 | -- | 10 | -- | 8 | 2,342 |
| Fidelity Series Government Bond Index Fund | -- | 62,457 | 1,785 | 134 | (19) | (643) | 60,010 |
| Fidelity Series Government Money Market Fund 2.12% | -- | 15,839 | -- | 26 | -- | -- | 15,839 |
| Fidelity Series High Income Fund | -- | 12,142 | -- | 56 | -- | 25 | 12,167 |
| Fidelity Series Inflation-Protected Bond Index Fund | -- | 50,058 | 1 | 14 | -- | (345) | 49,712 |
| Fidelity Series International Growth Fund | -- | 45,380 | 1 | -- | -- | (106) | 45,273 |
| Fidelity Series International Index Fund | -- | 11,903 | -- | -- | -- | 115 | 12,018 |
| Fidelity Series International Small Cap Fund | -- | 11,903 | -- | -- | -- | (25) | 11,878 |
| Fidelity Series International Value Fund | -- | 45,380 | 1 | -- | -- | 1,038 | 46,417 |
| Fidelity Series Investment Grade Bond Fund | -- | 65,069 | 2 | 153 | -- | (452) | 64,615 |
| Fidelity Series Investment Grade Securitized Fund | -- | 48,042 | 1,209 | 104 | (10) | (359) | 46,464 |
| Fidelity Series Large Cap Growth Index Fund | -- | 50,133 | 43 | -- | -- | 302 | 50,392 |
| Fidelity Series Large Cap Stock Fund | -- | 50,133 | 300 | -- | (2) | 238 | 50,069 |
| Fidelity Series Large Cap Value Index Fund | -- | 93,946 | 245 | -- | (2) | 186 | 93,885 |
| Fidelity Series Long-Term Treasury Bond Index Fund | -- | 47,817 | 1 | 111 | -- | (1,352) | 46,464 |
| Fidelity Series Real Estate Income Fund | -- | 4,484 | -- | 112 | -- | (129) | 4,355 |
| Fidelity Series Short-Term Credit Fund | -- | 15,843 | -- | 31 | -- | (31) | 15,812 |
| Fidelity Series Small Cap Opportunities Fund | -- | 26,946 | 1 | 1,834 | -- | (2,391) | 24,554 |
| Fidelity Series Treasury Bill Index Fund | -- | 47,522 | 1 | 83 | -- | -- | 47,521 |
| Fidelity Series Value Discovery Fund | -- | 29,762 | 1 | -- | -- | (46) | 29,715 |
| Total | $-- | $943,340 | $3,595 | $9,691 | $(33) | $(10,747) | $928,965 |
Amounts in the income column in the above table include any capital gain distributions from underlying funds, which are presented in the corresponding line-item in the Statement of Operations if applicable.
Investment Valuation
All investments are categorized as Level 1 under the Fair Value Hierarchy. The inputs or methodology used for valuing securities may not be an indication of the risk associated with investing in those securities. For more information on valuation inputs please refer to the Investment Valuation section in the accompanying Notes to Financial Statements.
See accompanying notes which are an integral part of the financial statements.
Fidelity Freedom® Blend 2020 Fund
Financial Statements
Statement of Assets and Liabilities
| | | September 30, 2018 (Unaudited) |
| Assets | | |
Investment in securities, at value — See accompanying schedule:
| | |
| Fidelity Central Funds (cost $49) | $49 | |
| Other affiliated issuers (cost $939,712) | 928,965 | |
| Total Investment in Securities (cost $939,761) | | $929,014 |
| Receivable for investments sold | | 3,574 |
| Distributions receivable from Fidelity Central Funds | | 146 |
| Total assets | | 932,734 |
| Liabilities | | |
| Payable for investments purchased | $3,489 | |
| Accrued management fee | 329 | |
| Distribution and service plan fees payable | 145 | |
| Total liabilities | | 3,963 |
| Net Assets | | $928,771 |
| Net Assets consist of: | | |
| Paid in capital | | $930,159 |
| Undistributed net investment income | | 2,120 |
| Accumulated undistributed net realized gain (loss) on investments | | 7,239 |
| Net unrealized appreciation (depreciation) on investments | | (10,747) |
| Net Assets | | $928,771 |
| Calculation of Maximum Offering Price | | |
| Class A: | | |
| Net Asset Value and redemption price per share ($99,824 ÷ 10,000 shares) | | $9.98 |
| Maximum offering price per share (100/94.25 of $9.98) | | $10.59 |
| Class M: | | |
| Net Asset Value and redemption price per share ($99,802 ÷ 10,000 shares) | | $9.98 |
| Maximum offering price per share (100/96.50 of $9.98) | | $10.34 |
| Class C: | | |
| Net Asset Value and offering price per share ($99,758 ÷ 10,000 shares)(a) | | $9.98 |
| Fidelity Freedom Blend 2020 Fund: | | |
| Net Asset Value, offering price and redemption price per share ($130,108 ÷ 13,031 shares) | | $9.98 |
| Class K: | | |
| Net Asset Value, offering price and redemption price per share ($99,854 ÷ 10,000 shares) | | $9.99 |
| Class K6: | | |
| Net Asset Value, offering price and redemption price per share ($99,863 ÷ 10,000 shares) | | $9.99 |
| Class I: | | |
| Net Asset Value, offering price and redemption price per share ($99,845 ÷ 10,000 shares) | | $9.98 |
| Class Z: | | |
| Net Asset Value, offering price and redemption price per share ($99,854 ÷ 10,000 shares) | | $9.99 |
| Class Z6: | | |
| Net Asset Value, offering price and redemption price per share ($99,863 ÷ 10,000 shares) | | $9.99 |
(a) Redemption price per share is equal to net asset value less any applicable contingent deferred sales charge.
See accompanying notes which are an integral part of the financial statements.
Statement of Operations
| | | For the period
August 31, 2018 (commencement of operations) to
September 30, 2018 (Unaudited) |
| Investment Income | | |
| Dividends: | | |
| Affiliated issuers | | $2,419 |
| Income from Fidelity Central Funds | | 195 |
| Total income | | 2,614 |
| Expenses | | |
| Management fee | $341 | |
| Distribution and service plan fees | 153 | |
| Total expenses | | 494 |
| Net investment income (loss) | | 2,120 |
| Realized and Unrealized Gain (Loss) | | |
| Net realized gain (loss) on: | | |
| Investment securities: | | |
| Affiliated issuers | (33) | |
| Capital gain distributions from underlying funds: | | |
| Affiliated issuers | 7,272 | |
| Total net realized gain (loss) | | 7,239 |
| Change in net unrealized appreciation (depreciation) on: | | |
| Investment securities: | | |
| Affiliated issuers | (10,747) | |
| Total change in net unrealized appreciation (depreciation) | | (10,747) |
| Net gain (loss) | | (3,508) |
| Net increase (decrease) in net assets resulting from operations | | $(1,388) |
See accompanying notes which are an integral part of the financial statements.
Statement of Changes in Net Assets
| | For the period
August 31, 2018 (commencement of operations) to
September 30, 2018 (Unaudited) |
| Increase (Decrease) in Net Assets | |
| Operations | |
| Net investment income (loss) | $2,120 |
| Net realized gain (loss) | 7,239 |
| Change in net unrealized appreciation (depreciation) | (10,747) |
| Net increase (decrease) in net assets resulting from operations | (1,388) |
| Share transactions - net increase (decrease) | 930,159 |
| Total increase (decrease) in net assets | 928,771 |
| Net Assets | |
| Beginning of period | – |
| End of period | $928,771 |
| Other Information | |
| Undistributed net investment income end of period | $2,120 |
See accompanying notes which are an integral part of the financial statements.
Financial Highlights
Fidelity Freedom Blend 2020 Fund Class A
| | Six months ended (Unaudited) September 30, |
| | 2018 A |
| Selected Per–Share Data | |
| Net asset value, beginning of period | $10.00 |
| Income from Investment Operations | |
| Net investment income (loss)B | .02 |
| Net realized and unrealized gain (loss) | (.04) |
| Total from investment operations | (.02) |
| Net asset value, end of period | $9.98 |
| Total ReturnC,D | (.20)% |
| Ratios to Average Net AssetsE | |
| Expenses before reductions | .75%F |
| Expenses net of fee waivers, if any | .75%F |
| Expenses net of all reductions | .75%F |
| Net investment income (loss) | 2.56%F |
| Supplemental Data | |
| Net assets, end of period (000 omitted) | $100 |
| Portfolio turnover rateG | 0%H,I |
A For the period August 31, 2018 (commencement of operations) to September 30, 2018.
B Calculated based on average shares outstanding during the period.
C Total returns for periods of less than one year are not annualized.
D Total returns do not include the effect of the sales charges.
E Expense ratios reflect operating expenses of the class. Expenses before reductions do not reflect amounts reimbursed by the investment adviser or reductions from expense offset arrangements and do not represent the amount paid by the class during periods when reimbursements or reductions occur. Expense ratios before reductions for start-up periods may not be representative of longer-term operating periods. Expenses net of fee waivers reflect expenses after reimbursement by the investment adviser but prior to reductions from expense offset arrangements. Expenses net of all reductions represent the net expenses paid by the class but do not include expenses of the underlying funds in which the Fund invests.
F Annualized
G Amounts do not include the activity of the Underlying Funds.
H Amount represents less than 1%.
I Amount not annualized.
See accompanying notes which are an integral part of the financial statements.
Fidelity Freedom Blend 2020 Fund Class M
| | Six months ended (Unaudited) September 30, |
| | 2018 A |
| Selected Per–Share Data | |
| Net asset value, beginning of period | $10.00 |
| Income from Investment Operations | |
| Net investment income (loss)B | .02 |
| Net realized and unrealized gain (loss) | (.04) |
| Total from investment operations | (.02) |
| Net asset value, end of period | $9.98 |
| Total ReturnC,D | (.20)% |
| Ratios to Average Net AssetsE | |
| Expenses before reductions | 1.01%F,G |
| Expenses net of fee waivers, if any | 1.01%F,G |
| Expenses net of all reductions | 1.01%F,G |
| Net investment income (loss) | 2.31%F |
| Supplemental Data | |
| Net assets, end of period (000 omitted) | $100 |
| Portfolio turnover rateH | 0%I,J |
A For the period August 31, 2018 (commencement of operations) to September 30, 2018.
B Calculated based on average shares outstanding during the period.
C Total returns for periods of less than one year are not annualized.
D Total returns do not include the effect of the sales charges.
E Expense ratios reflect operating expenses of the class. Expenses before reductions do not reflect amounts reimbursed by the investment adviser or reductions from expense offset arrangements and do not represent the amount paid by the class during periods when reimbursements or reductions occur. Expense ratios before reductions for start-up periods may not be representative of longer-term operating periods. Expenses net of fee waivers reflect expenses after reimbursement by the investment adviser but prior to reductions from expense offset arrangements. Expenses net of all reductions represent the net expenses paid by the class but do not include expenses of the underlying funds in which the Fund invests.
F Annualized
G On certain classes, the size and fluctuation of net assets and expense amounts may cause ratios to differ from contractual rates.
H Amounts do not include the activity of the Underlying Funds.
I Amount represents less than 1%.
J Amount not annualized.
See accompanying notes which are an integral part of the financial statements.
Fidelity Freedom Blend 2020 Fund Class C
| | Six months ended (Unaudited) September 30, |
| | 2018 A |
| Selected Per–Share Data | |
| Net asset value, beginning of period | $10.00 |
| Income from Investment Operations | |
| Net investment income (loss)B | .02 |
| Net realized and unrealized gain (loss) | (.04) |
| Total from investment operations | (.02) |
| Net asset value, end of period | $9.98 |
| Total ReturnC,D | (.20)% |
| Ratios to Average Net AssetsE | |
| Expenses before reductions | 1.50%F |
| Expenses net of fee waivers, if any | 1.50%F |
| Expenses net of all reductions | 1.50%F |
| Net investment income (loss) | 1.81%F |
| Supplemental Data | |
| Net assets, end of period (000 omitted) | $100 |
| Portfolio turnover rateG | 0%H,I |
A For the period August 31, 2018 (commencement of operations) to September 30, 2018.
B Calculated based on average shares outstanding during the period.
C Total returns for periods of less than one year are not annualized.
D Total returns do not include the effect of the contingent deferred sales charge.
E Expense ratios reflect operating expenses of the class. Expenses before reductions do not reflect amounts reimbursed by the investment adviser or reductions from expense offset arrangements and do not represent the amount paid by the class during periods when reimbursements or reductions occur. Expense ratios before reductions for start-up periods may not be representative of longer-term operating periods. Expenses net of fee waivers reflect expenses after reimbursement by the investment adviser but prior to reductions from expense offset arrangements. Expenses net of all reductions represent the net expenses paid by the class but do not include expenses of the underlying funds in which the Fund invests.
F Annualized
G Amounts do not include the activity of the Underlying Funds.
H Amount represents less than 1%.
I Amount not annualized.
See accompanying notes which are an integral part of the financial statements.
Fidelity Freedom Blend 2020 Fund
| | Six months ended (Unaudited) September 30, |
| | 2018 A |
| Selected Per–Share Data | |
| Net asset value, beginning of period | $10.00 |
| Income from Investment Operations | |
| Net investment income (loss)B | .02 |
| Net realized and unrealized gain (loss) | (.04) |
| Total from investment operations | (.02) |
| Net asset value, end of period | $9.98 |
| Total ReturnC | (.20)% |
| Ratios to Average Net AssetsD | |
| Expenses before reductions | .49%E,F |
| Expenses net of fee waivers, if any | .49%E,F |
| Expenses net of all reductions | .49%E,F |
| Net investment income (loss) | 2.83%E |
| Supplemental Data | |
| Net assets, end of period (000 omitted) | $130 |
| Portfolio turnover rateG | 0%H,I |
A For the period August 31, 2018 (commencement of operations) to September 30, 2018.
B Calculated based on average shares outstanding during the period.
C Total returns for periods of less than one year are not annualized.
D Expense ratios reflect operating expenses of the class. Expenses before reductions do not reflect amounts reimbursed by the investment adviser or reductions from expense offset arrangements and do not represent the amount paid by the class during periods when reimbursements or reductions occur. Expense ratios before reductions for start-up periods may not be representative of longer-term operating periods. Expenses net of fee waivers reflect expenses after reimbursement by the investment adviser but prior to reductions from expense offset arrangements. Expenses net of all reductions represent the net expenses paid by the class but do not include expenses of the underlying funds in which the Fund invests.
E Annualized
F On certain classes, the size and fluctuation of net assets and expense amounts may cause ratios to differ from contractual rates.
G Amounts do not include the activity of the Underlying Funds.
H Amount represents less than 1%.
I Amount not annualized.
See accompanying notes which are an integral part of the financial statements.
Fidelity Freedom Blend 2020 Fund Class K
| | Six months ended (Unaudited) September 30, |
| | 2018 A |
| Selected Per–Share Data | |
| Net asset value, beginning of period | $10.00 |
| Income from Investment Operations | |
| Net investment income (loss)B | .03 |
| Net realized and unrealized gain (loss) | (.04) |
| Total from investment operations | (.01) |
| Net asset value, end of period | $9.99 |
| Total ReturnC | (.10)% |
| Ratios to Average Net AssetsD | |
| Expenses before reductions | .40%E |
| Expenses net of fee waivers, if any | .40%E |
| Expenses net of all reductions | .40%E |
| Net investment income (loss) | 2.91%E |
| Supplemental Data | |
| Net assets, end of period (000 omitted) | $100 |
| Portfolio turnover rateF | 0%G,H |
A For the period August 31, 2018 (commencement of operations) to September 30, 2018.
B Calculated based on average shares outstanding during the period.
C Total returns for periods of less than one year are not annualized.
D Expense ratios reflect operating expenses of the class. Expenses before reductions do not reflect amounts reimbursed by the investment adviser or reductions from expense offset arrangements and do not represent the amount paid by the class during periods when reimbursements or reductions occur. Expense ratios before reductions for start-up periods may not be representative of longer-term operating periods. Expenses net of fee waivers reflect expenses after reimbursement by the investment adviser but prior to reductions from expense offset arrangements. Expenses net of all reductions represent the net expenses paid by the class but do not include expenses of the underlying funds in which the Fund invests.
E Annualized
F Amounts do not include the activity of the Underlying Funds.
G Amount represents less than 1%.
H Amount not annualized.
See accompanying notes which are an integral part of the financial statements.
Fidelity Freedom Blend 2020 Fund Class K6
| | Six months ended (Unaudited) September 30, |
| | 2018 A |
| Selected Per–Share Data | |
| Net asset value, beginning of period | $10.00 |
| Income from Investment Operations | |
| Net investment income (loss)B | .03 |
| Net realized and unrealized gain (loss) | (.04) |
| Total from investment operations | (.01) |
| Net asset value, end of period | $9.99 |
| Total ReturnC | (.10)% |
| Ratios to Average Net AssetsD | |
| Expenses before reductions | .30%E |
| Expenses net of fee waivers, if any | .30%E |
| Expenses net of all reductions | .30%E |
| Net investment income (loss) | 3.01%E |
| Supplemental Data | |
| Net assets, end of period (000 omitted) | $100 |
| Portfolio turnover rateF | 0%G,H |
A For the period August 31, 2018 (commencement of operations) to September 30, 2018.
B Calculated based on average shares outstanding during the period.
C Total returns for periods of less than one year are not annualized.
D Expense ratios reflect operating expenses of the class. Expenses before reductions do not reflect amounts reimbursed by the investment adviser or reductions from expense offset arrangements and do not represent the amount paid by the class during periods when reimbursements or reductions occur. Expenses net of fee waivers reflect expenses after reimbursement by the investment adviser but prior to reductions from expense offset arrangements. Expenses net of all reductions represent the net expenses paid by the class but do not include expenses of the underlying funds in which the Fund invests.
E Annualized
F Amounts do not include the activity of the Underlying Funds.
G Amount represents less than 1%.
H Amount not annualized.
See accompanying notes which are an integral part of the financial statements.
Fidelity Freedom Blend 2020 Fund Class I
| | Six months ended (Unaudited) September 30, |
| | 2018 A |
| Selected Per–Share Data | |
| Net asset value, beginning of period | $10.00 |
| Income from Investment Operations | |
| Net investment income (loss)B | .02 |
| Net realized and unrealized gain (loss) | (.04) |
| Total from investment operations | (.02) |
| Net asset value, end of period | $9.98 |
| Total ReturnC | (.20)% |
| Ratios to Average Net AssetsD | |
| Expenses before reductions | .50%E |
| Expenses net of fee waivers, if any | .50%E |
| Expenses net of all reductions | .50%E |
| Net investment income (loss) | 2.82%E |
| Supplemental Data | |
| Net assets, end of period (000 omitted) | $100 |
| Portfolio turnover rateF | 0%G,H |
A For the period August 31, 2018 (commencement of operations) to September 30, 2018.
B Calculated based on average shares outstanding during the period.
C Total returns for periods of less than one year are not annualized.
D Expense ratios reflect operating expenses of the class. Expenses before reductions do not reflect amounts reimbursed by the investment adviser or reductions from expense offset arrangements and do not represent the amount paid by the class during periods when reimbursements or reductions occur. Expense ratios before reductions for start-up periods may not be representative of longer-term operating periods. Expenses net of fee waivers reflect expenses after reimbursement by the investment adviser but prior to reductions from expense offset arrangements. Expenses net of all reductions represent the net expenses paid by the class but do not include expenses of the underlying funds in which the Fund invests.
E Annualized
F Amounts do not include the activity of the Underlying Funds.
G Amount represents less than 1%.
H Amount not annualized.
See accompanying notes which are an integral part of the financial statements.
Fidelity Freedom Blend 2020 Fund Class Z
| | Six months ended (Unaudited) September 30, |
| | 2018 A |
| Selected Per–Share Data | |
| Net asset value, beginning of period | $10.00 |
| Income from Investment Operations | |
| Net investment income (loss)B | .03 |
| Net realized and unrealized gain (loss) | (.04) |
| Total from investment operations | (.01) |
| Net asset value, end of period | $9.99 |
| Total ReturnC | (.10)% |
| Ratios to Average Net AssetsD | |
| Expenses before reductions | .40%E |
| Expenses net of fee waivers, if any | .40%E |
| Expenses net of all reductions | .40%E |
| Net investment income (loss) | 2.91%E |
| Supplemental Data | |
| Net assets, end of period (000 omitted) | $100 |
| Portfolio turnover rateF | 0%G,H |
A For the period August 31, 2018 (commencement of operations) to September 30, 2018.
B Calculated based on average shares outstanding during the period.
C Total returns for periods of less than one year are not annualized.
D Expense ratios reflect operating expenses of the class. Expenses before reductions do not reflect amounts reimbursed by the investment adviser or reductions from expense offset arrangements and do not represent the amount paid by the class during periods when reimbursements or reductions occur. Expense ratios before reductions for start-up periods may not be representative of longer-term operating periods. Expenses net of fee waivers reflect expenses after reimbursement by the investment adviser but prior to reductions from expense offset arrangements. Expenses net of all reductions represent the net expenses paid by the class but do not include expenses of the underlying funds in which the Fund invests.
E Annualized
F Amounts do not include the activity of the Underlying Funds.
G Amount represents less than 1%.
H Amount not annualized.
See accompanying notes which are an integral part of the financial statements.
Fidelity Freedom Blend 2020 Fund Class Z6
| | Six months ended (Unaudited) September 30, |
| | 2018 A |
| Selected Per–Share Data | |
| Net asset value, beginning of period | $10.00 |
| Income from Investment Operations | |
| Net investment income (loss)B | .03 |
| Net realized and unrealized gain (loss) | (.04) |
| Total from investment operations | (.01) |
| Net asset value, end of period | $9.99 |
| Total ReturnC | (.10)% |
| Ratios to Average Net AssetsD | |
| Expenses before reductions | .30%E |
| Expenses net of fee waivers, if any | .30%E |
| Expenses net of all reductions | .30%E |
| Net investment income (loss) | 3.01%E |
| Supplemental Data | |
| Net assets, end of period (000 omitted) | $100 |
| Portfolio turnover rateF | 0%G,H |
A For the period August 31, 2018 (commencement of operations) to September 30, 2018.
B Calculated based on average shares outstanding during the period.
C Total returns for periods of less than one year are not annualized.
D Expense ratios reflect operating expenses of the class. Expenses before reductions do not reflect amounts reimbursed by the investment adviser or reductions from expense offset arrangements and do not represent the amount paid by the class during periods when reimbursements or reductions occur. Expenses net of fee waivers reflect expenses after reimbursement by the investment adviser but prior to reductions from expense offset arrangements. Expenses net of all reductions represent the net expenses paid by the class but do not include expenses of the underlying funds in which the Fund invests.
E Annualized
F Amounts do not include the activity of the Underlying Funds.
G Amount represents less than 1%.
H Amount not annualized.
See accompanying notes which are an integral part of the financial statements.
Fidelity Freedom® Blend 2025 Fund
Investment Summary (Unaudited)
The information in the following tables is based on the direct investments of the Fund.
Top Holdings as of September 30, 2018
| | % of fund's net assets |
| Fidelity Series Large Cap Value Index Fund | 11.5 |
| Fidelity Series Blue Chip Growth Fund | 7.9 |
| Fidelity Series Emerging Markets Opportunities Fund | 6.4 |
| Fidelity Series Large Cap Growth Index Fund | 6.2 |
| Fidelity Series Large Cap Stock Fund | 6.2 |
| Fidelity Series Investment Grade Bond Fund | 5.9 |
| Fidelity Series International Value Fund | 5.6 |
| Fidelity Series Long-Term Treasury Bond Index Fund | 5.5 |
| Fidelity Series Government Bond Index Fund | 5.5 |
| Fidelity Series International Growth Fund | 5.4 |
| | 66.1 |
Asset Allocation (% of fund's net assets)
| Period end |
| | Domestic Equity Funds | 40.5% |
| | International Equity Funds | 21.5% |
| | Bond Funds | 32.1% |
| | Short-Term Funds | 5.9% |
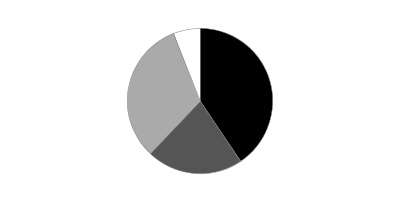
Domestic Equity Funds category includes Fidelity Series Commodity Strategy Fund which invests in commodity-related investments.
Fidelity Freedom® Blend 2025 Fund
Schedule of Investments September 30, 2018 (Unaudited)
Showing Percentage of Net Assets
| Domestic Equity Funds - 40.5% | | | |
| | | Shares | Value |
| Fidelity Series Blue Chip Growth Fund (a) | | 4,709 | $72,046 |
| Fidelity Series Commodity Strategy Fund (a) | | 3,723 | 18,617 |
| Fidelity Series Large Cap Growth Index Fund (a) | | 5,453 | 56,598 |
| Fidelity Series Large Cap Stock Fund (a) | | 3,530 | 56,230 |
| Fidelity Series Large Cap Value Index Fund (a) | | 7,985 | 105,406 |
| Fidelity Series Small Cap Opportunities Fund (a) | | 1,872 | 27,499 |
| Fidelity Series Value Discovery Fund (a) | | 2,438 | 33,382 |
| TOTAL DOMESTIC EQUITY FUNDS | | | |
| (Cost $379,079) | | | 369,778 |
|
| International Equity Funds - 21.5% | | | |
| Fidelity Series Canada Fund (a) | | 481 | 5,197 |
| Fidelity Series Emerging Markets Fund (a) | | 659 | 6,389 |
| Fidelity Series Emerging Markets Opportunities Fund (a) | | 3,026 | 58,061 |
| Fidelity Series International Growth Fund (a) | | 3,022 | 49,567 |
| Fidelity Series International Index Fund (a) | | 1,287 | 13,188 |
| Fidelity Series International Small Cap Fund (a) | | 728 | 13,033 |
| Fidelity Series International Value Fund (a) | | 4,832 | 50,832 |
| TOTAL INTERNATIONAL EQUITY FUNDS | | | |
| (Cost $195,388) | | | 196,267 |
|
| Bond Funds - 32.1% | | | |
| Fidelity Series Corporate Bond Fund (a) | | 3,758 | 37,202 |
| Fidelity Series Emerging Markets Debt Fund (a) | | 591 | 5,628 |
| Fidelity Series Floating Rate High Income Fund (a) | | 242 | 2,300 |
| Fidelity Series Government Bond Index Fund (a) | | 5,049 | 49,932 |
| Fidelity Series High Income Fund (a) | | 1,243 | 11,949 |
| Fidelity Series Inflation-Protected Bond Index Fund (a) | | 3,999 | 38,833 |
| Fidelity Series Investment Grade Bond Fund (a) | | 4,933 | 53,718 |
| Fidelity Series Investment Grade Securitized Fund (a) | | 3,897 | 38,661 |
| Fidelity Series Long-Term Treasury Bond Index Fund (a) | | 6,102 | 50,279 |
| Fidelity Series Real Estate Income Fund (a) | | 397 | 4,276 |
| TOTAL BOND FUNDS | | | |
| (Cost $295,929) | | | 292,778 |
|
| Short-Term Funds - 5.9% | | | |
| Fidelity Cash Central Fund, 2.11% (b) | | 49 | 49 |
| Fidelity Series Government Money Market Fund 2.12% (a)(c) | | 10,705 | 10,705 |
| Fidelity Series Short-Term Credit Fund (a) | | 1,084 | 10,687 |
| Fidelity Series Treasury Bill Index Fund (a) | | 3,221 | 32,210 |
| TOTAL SHORT-TERM FUNDS | | | |
| (Cost $53,672) | | | 53,651 |
| TOTAL INVESTMENT IN SECURITIES - 100.0% | | | |
| (Cost $924,068) | | | 912,474 |
| NET OTHER ASSETS (LIABILITIES) - 0.0% | | | (257) |
| NET ASSETS - 100% | | | $912,217 |
Legend
(a) Affiliated Fund
(b) Affiliated fund that is generally available only to investment companies and other accounts managed by Fidelity Investments. The rate quoted is the annualized seven-day yield of the fund at period end. A complete unaudited listing of the fund's holdings as of its most recent quarter end is available upon request. In addition, each Fidelity Central Fund's financial statements are available on the SEC's website or upon request.
(c) The rate quoted is the annualized seven-day yield of the fund at period end.
Affiliated Central Funds
Information regarding fiscal year to date income earned by the Fund from investments in Fidelity Central Funds is as follows:
| Fund | Income earned |
| Fidelity Cash Central Fund | $195 |
| Total | $195 |
Amounts in the income column in the above table include any capital gain distributions from underlying funds, which are presented in the corresponding line-item in the Statement of Operations if applicable.
Affiliated Underlying Funds
Fiscal year to date information regarding the Fund's investments in affiliated Underlying Funds, excluding any Money Market Central Funds, is presented below. Exchanges between classes of the same affiliated Underlying Funds may occur.
| Affiliate | Value, beginning of period | Purchases | Sales Proceeds | Dividend Income | Realized Gain (loss) | Change in Unrealized appreciation (depreciation) | Value, end of period |
| Fidelity Series Blue Chip Growth Fund | $-- | $78,657 | $2 | $6,584 | $-- | $(6,609) | $72,046 |
| Fidelity Series Canada Fund | -- | 5,207 | -- | -- | -- | (10) | 5,197 |
| Fidelity Series Commodity Strategy Fund | -- | 19,368 | -- | 1,098 | -- | (751) | 18,617 |
| Fidelity Series Corporate Bond Fund | -- | 37,371 | 1 | 109 | -- | (168) | 37,202 |
| Fidelity Series Emerging Markets Debt Fund | -- | 5,505 | -- | 28 | -- | 123 | 5,628 |
| Fidelity Series Emerging Markets Fund | -- | 6,485 | -- | -- | -- | (96) | 6,389 |
| Fidelity Series Emerging Markets Opportunities Fund | -- | 58,198 | 1 | -- | -- | (136) | 58,061 |
| Fidelity Series Floating Rate High Income Fund | -- | 2,293 | -- | 10 | -- | 7 | 2,300 |
| Fidelity Series Government Bond Index Fund | -- | 51,959 | 1,465 | 113 | (17) | (545) | 49,932 |
| Fidelity Series Government Money Market Fund 2.12% | -- | 10,705 | -- | 18 | -- | -- | 10,705 |
| Fidelity Series High Income Fund | -- | 11,925 | -- | 55 | -- | 24 | 11,949 |
| Fidelity Series Inflation-Protected Bond Index Fund | -- | 39,109 | 1 | 11 | -- | (275) | 38,833 |
| Fidelity Series International Growth Fund | -- | 49,689 | 1 | -- | -- | (121) | 49,567 |
| Fidelity Series International Index Fund | -- | 13,062 | -- | -- | -- | 126 | 13,188 |
| Fidelity Series International Small Cap Fund | -- | 13,062 | -- | -- | -- | (29) | 13,033 |
| Fidelity Series International Value Fund | -- | 49,689 | 1 | -- | -- | 1,144 | 50,832 |
| Fidelity Series Investment Grade Bond Fund | -- | 54,106 | 1 | 128 | -- | (387) | 53,718 |
| Fidelity Series Investment Grade Securitized Fund | -- | 39,982 | 1,007 | 87 | (8) | (306) | 38,661 |
| Fidelity Series Large Cap Growth Index Fund | -- | 56,270 | 1 | -- | -- | 329 | 56,598 |
| Fidelity Series Large Cap Stock Fund | -- | 56,270 | 316 | -- | (2) | 278 | 56,230 |
| Fidelity Series Large Cap Value Index Fund | -- | 105,508 | 326 | -- | (3) | 228 | 105,406 |
| Fidelity Series Long-Term Treasury Bond Index Fund | -- | 51,773 | 1 | 121 | -- | (1,493) | 50,279 |
| Fidelity Series Real Estate Income Fund | -- | 4,405 | -- | 112 | -- | (129) | 4,276 |
| Fidelity Series Short-Term Credit Fund | -- | 10,708 | -- | 21 | -- | (21) | 10,687 |
| Fidelity Series Small Cap Opportunities Fund | -- | 30,227 | 1 | 2,092 | -- | (2,727) | 27,499 |
| Fidelity Series Treasury Bill Index Fund | -- | 32,211 | 1 | 57 | -- | -- | 32,210 |
| Fidelity Series Value Discovery Fund | -- | 33,433 | 1 | -- | -- | (50) | 33,382 |
| Total | $-- | $927,176 | $3,127 | $10,644 | $(30) | $(11,594) | $912,425 |
Amounts in the income column in the above table include any capital gain distributions from underlying funds, which are presented in the corresponding line-item in the Statement of Operations if applicable.
Investment Valuation
All investments are categorized as Level 1 under the Fair Value Hierarchy. The inputs or methodology used for valuing securities may not be an indication of the risk associated with investing in those securities. For more information on valuation inputs please refer to the Investment Valuation section in the accompanying Notes to Financial Statements.
See accompanying notes which are an integral part of the financial statements.
Fidelity Freedom® Blend 2025 Fund
Financial Statements
Statement of Assets and Liabilities
| | | September 30, 2018 (Unaudited) |
| Assets | | |
Investment in securities, at value — See accompanying schedule:
| | |
| Fidelity Central Funds (cost $49) | $49 | |
| Other affiliated issuers (cost $924,019) | 912,425 | |
| Total Investment in Securities (cost $924,068) | | $912,474 |
| Receivable for investments sold | | 3,106 |
| Distributions receivable from Fidelity Central Funds | | 146 |
| Total assets | | 915,726 |
| Liabilities | | |
| Payable for investments purchased | $3,033 | |
| Accrued management fee | 331 | |
| Distribution and service plan fees payable | 145 | |
| Total liabilities | | 3,509 |
| Net Assets | | $912,217 |
| Net Assets consist of: | | |
| Paid in capital | | $913,500 |
| Undistributed net investment income | | 2,049 |
| Accumulated undistributed net realized gain (loss) on investments | | 8,262 |
| Net unrealized appreciation (depreciation) on investments | | (11,594) |
| Net Assets | | $912,217 |
| Calculation of Maximum Offering Price | | |
| Class A: | | �� |
| Net Asset Value and redemption price per share ($99,845 ÷ 10,000 shares) | | $9.98 |
| Maximum offering price per share (100/94.25 of $9.98) | | $10.59 |
| Class M: | | |
| Net Asset Value and redemption price per share ($99,823 ÷ 10,000 shares) | | $9.98 |
| Maximum offering price per share (100/96.50 of $9.98) | | $10.34 |
| Class C: | | |
| Net Asset Value and offering price per share ($99,780 ÷ 10,000 shares)(a) | | $9.98 |
| Fidelity Freedom Blend 2025 Fund: | | |
| Net Asset Value, offering price and redemption price per share ($113,384 ÷ 11,353 shares) | | $9.99 |
| Class K: | | |
| Net Asset Value, offering price and redemption price per share ($99,875 ÷ 10,000 shares) | | $9.99 |
| Class K6: | | |
| Net Asset Value, offering price and redemption price per share ($99,884 ÷ 10,000 shares) | | $9.99 |
| Class I: | | |
| Net Asset Value, offering price and redemption price per share ($99,867 ÷ 10,000 shares) | | $9.99 |
| Class Z: | | |
| Net Asset Value, offering price and redemption price per share ($99,875 ÷ 10,000 shares) | | $9.99 |
| Class Z6: | | |
| Net Asset Value, offering price and redemption price per share ($99,884 ÷ 10,000 shares) | | $9.99 |
(a) Redemption price per share is equal to net asset value less any applicable contingent deferred sales charge.
See accompanying notes which are an integral part of the financial statements.
Statement of Operations
| | | For the period
August 31, 2018 (commencement of operations) to
September 30, 2018 (Unaudited) |
| Investment Income | | |
| Dividends: | | |
| Affiliated issuers | | $2,352 |
| Income from Fidelity Central Funds | | 195 |
| Total income | | 2,547 |
| Expenses | | |
| Management fee | $345 | |
| Distribution and service plan fees | 153 | |
| Total expenses | | 498 |
| Net investment income (loss) | | 2,049 |
| Realized and Unrealized Gain (Loss) | | |
| Net realized gain (loss) on: | | |
| Investment securities: | | |
| Affiliated issuers | (30) | |
| Capital gain distributions from underlying funds: | | |
| Affiliated issuers | 8,292 | |
| Total net realized gain (loss) | | 8,262 |
| Change in net unrealized appreciation (depreciation) on: | | |
| Investment securities: | | |
| Affiliated issuers | (11,594) | |
| Total change in net unrealized appreciation (depreciation) | | (11,594) |
| Net gain (loss) | | (3,332) |
| Net increase (decrease) in net assets resulting from operations | | $(1,283) |
See accompanying notes which are an integral part of the financial statements.
Statement of Changes in Net Assets
| | For the period
August 31, 2018 (commencement of operations) to
September 30, 2018 (Unaudited) |
| Increase (Decrease) in Net Assets | |
| Operations | |
| Net investment income (loss) | $2,049 |
| Net realized gain (loss) | 8,262 |
| Change in net unrealized appreciation (depreciation) | (11,594) |
| Net increase (decrease) in net assets resulting from operations | (1,283) |
| Share transactions - net increase (decrease) | 913,500 |
| Total increase (decrease) in net assets | 912,217 |
| Net Assets | |
| Beginning of period | – |
| End of period | $912,217 |
| Other Information | |
| Undistributed net investment income end of period | $2,049 |
See accompanying notes which are an integral part of the financial statements.
Financial Highlights
Fidelity Freedom Blend 2025 Fund Class A
| | Six months ended (Unaudited) September 30, |
| | 2018 A |
| Selected Per–Share Data | |
| Net asset value, beginning of period | $10.00 |
| Income from Investment Operations | |
| Net investment income (loss)B | .02 |
| Net realized and unrealized gain (loss) | (.04) |
| Total from investment operations | (.02) |
| Net asset value, end of period | $9.98 |
| Total ReturnC,D | (.20)% |
| Ratios to Average Net AssetsE | |
| Expenses before reductions | .76%F |
| Expenses net of fee waivers, if any | .76%F |
| Expenses net of all reductions | .76%F |
| Net investment income (loss) | 2.49%F |
| Supplemental Data | |
| Net assets, end of period (000 omitted) | $100 |
| Portfolio turnover rateG | 0%H,I |
A For the period August 31, 2018 (commencement of operations) to September 30, 2018.
B Calculated based on average shares outstanding during the period.
C Total returns for periods of less than one year are not annualized.
D Total returns do not include the effect of the sales charges.
E Expense ratios reflect operating expenses of the class. Expenses before reductions do not reflect amounts reimbursed by the investment adviser or reductions from expense offset arrangements and do not represent the amount paid by the class during periods when reimbursements or reductions occur. Expense ratios before reductions for start-up periods may not be representative of longer-term operating periods. Expenses net of fee waivers reflect expenses after reimbursement by the investment adviser but prior to reductions from expense offset arrangements. Expenses net of all reductions represent the net expenses paid by the class but do not include expenses of the underlying funds in which the Fund invests.
F Annualized
G Amounts do not include the activity of the Underlying Funds.
H Amount represents less than 1%.
I Amount not annualized.
See accompanying notes which are an integral part of the financial statements.
Fidelity Freedom Blend 2025 Fund Class M
| | Six months ended (Unaudited) September 30, |
| | 2018 A |
| Selected Per–Share Data | |
| Net asset value, beginning of period | $10.00 |
| Income from Investment Operations | |
| Net investment income (loss)B | .02 |
| Net realized and unrealized gain (loss) | (.04) |
| Total from investment operations | (.02) |
| Net asset value, end of period | $9.98 |
| Total ReturnC,D | (.20)% |
| Ratios to Average Net AssetsE | |
| Expenses before reductions | 1.02%F,G |
| Expenses net of fee waivers, if any | 1.02%F,G |
| Expenses net of all reductions | 1.02%F,G |
| Net investment income (loss) | 2.24%F |
| Supplemental Data | |
| Net assets, end of period (000 omitted) | $100 |
| Portfolio turnover rateH | 0%I,J |
A For the period August 31, 2018 (commencement of operations) to September 30, 2018.
B Calculated based on average shares outstanding during the period.
C Total returns for periods of less than one year are not annualized.
D Total returns do not include the effect of the sales charges.
E Expense ratios reflect operating expenses of the class. Expenses before reductions do not reflect amounts reimbursed by the investment adviser or reductions from expense offset arrangements and do not represent the amount paid by the class during periods when reimbursements or reductions occur. Expense ratios before reductions for start-up periods may not be representative of longer-term operating periods. Expenses net of fee waivers reflect expenses after reimbursement by the investment adviser but prior to reductions from expense offset arrangements. Expenses net of all reductions represent the net expenses paid by the class but do not include expenses of the underlying funds in which the Fund invests.
F Annualized
G On certain classes, the size and fluctuation of net assets and expense amounts may cause ratios to differ from contractual rates.
H Amounts do not include the activity of the Underlying Funds.
I Amount represents less than 1%.
J Amount not annualized.
See accompanying notes which are an integral part of the financial statements.
Fidelity Freedom Blend 2025 Fund Class C
| | Six months ended (Unaudited) September 30, |
| | 2018 A |
| Selected Per–Share Data | |
| Net asset value, beginning of period | $10.00 |
| Income from Investment Operations | |
| Net investment income (loss)B | .02 |
| Net realized and unrealized gain (loss) | (.04) |
| Total from investment operations | (.02) |
| Net asset value, end of period | $9.98 |
| Total ReturnC,D | (.20)% |
| Ratios to Average Net AssetsE | |
| Expenses before reductions | 1.51%F |
| Expenses net of fee waivers, if any | 1.51%F |
| Expenses net of all reductions | 1.51%F |
| Net investment income (loss) | 1.74%F |
| Supplemental Data | |
| Net assets, end of period (000 omitted) | $100 |
| Portfolio turnover rateG | 0%H,I |
A For the period August 31, 2018 (commencement of operations) to September 30, 2018.
B Calculated based on average shares outstanding during the period.
C Total returns for periods of less than one year are not annualized.
D Total returns do not include the effect of the contingent deferred sales charge.
E Expense ratios reflect operating expenses of the class. Expenses before reductions do not reflect amounts reimbursed by the investment adviser or reductions from expense offset arrangements and do not represent the amount paid by the class during periods when reimbursements or reductions occur. Expense ratios before reductions for start-up periods may not be representative of longer-term operating periods. Expenses net of fee waivers reflect expenses after reimbursement by the investment adviser but prior to reductions from expense offset arrangements. Expenses net of all reductions represent the net expenses paid by the class but do not include expenses of the underlying funds in which the Fund invests.
F Annualized
G Amounts do not include the activity of the Underlying Funds.
H Amount represents less than 1%.
I Amount not annualized.
See accompanying notes which are an integral part of the financial statements.
Fidelity Freedom Blend 2025 Fund
| | Six months ended (Unaudited) September 30, |
| | 2018 A |
| Selected Per–Share Data | |
| Net asset value, beginning of period | $10.00 |
| Income from Investment Operations | |
| Net investment income (loss)B | .02 |
| Net realized and unrealized gain (loss) | (.03) |
| Total from investment operations | (.01) |
| Net asset value, end of period | $9.99 |
| Total ReturnC | (.10)% |
| Ratios to Average Net AssetsD | |
| Expenses before reductions | .50%E,F |
| Expenses net of fee waivers, if any | .50%E,F |
| Expenses net of all reductions | .50%E,F |
| Net investment income (loss) | 2.75%E |
| Supplemental Data | |
| Net assets, end of period (000 omitted) | $113 |
| Portfolio turnover rateG | 0%H,I |
A For the period August 31, 2018 (commencement of operations) to September 30, 2018.
B Calculated based on average shares outstanding during the period.
C Total returns for periods of less than one year are not annualized.
D Expense ratios reflect operating expenses of the class. Expenses before reductions do not reflect amounts reimbursed by the investment adviser or reductions from expense offset arrangements and do not represent the amount paid by the class during periods when reimbursements or reductions occur. Expense ratios before reductions for start-up periods may not be representative of longer-term operating periods. Expenses net of fee waivers reflect expenses after reimbursement by the investment adviser but prior to reductions from expense offset arrangements. Expenses net of all reductions represent the net expenses paid by the class but do not include expenses of the underlying funds in which the Fund invests.
E Annualized
F On certain classes, the size and fluctuation of net assets and expense amounts may cause ratios to differ from contractual rates.
G Amounts do not include the activity of the Underlying Funds.
H Amount represents less than 1%.
I Amount not annualized.
See accompanying notes which are an integral part of the financial statements.
Fidelity Freedom Blend 2025 Fund Class K
| | Six months ended (Unaudited) September 30, |
| | 2018 A |
| Selected Per–Share Data | |
| Net asset value, beginning of period | $10.00 |
| Income from Investment Operations | |
| Net investment income (loss)B | .02 |
| Net realized and unrealized gain (loss) | (.03) |
| Total from investment operations | (.01) |
| Net asset value, end of period | $9.99 |
| Total ReturnC | (.10)% |
| Ratios to Average Net AssetsD | |
| Expenses before reductions | .40%E,F |
| Expenses net of fee waivers, if any | .40%E,F |
| Expenses net of all reductions | .40%E,F |
| Net investment income (loss) | 2.85%E |
| Supplemental Data | |
| Net assets, end of period (000 omitted) | $100 |
| Portfolio turnover rateG | 0%H,I |
A For the period August 31, 2018 (commencement of operations) to September 30, 2018.
B Calculated based on average shares outstanding during the period.
C Total returns for periods of less than one year are not annualized.
D Expense ratios reflect operating expenses of the class. Expenses before reductions do not reflect amounts reimbursed by the investment adviser or reductions from expense offset arrangements and do not represent the amount paid by the class during periods when reimbursements or reductions occur. Expense ratios before reductions for start-up periods may not be representative of longer-term operating periods. Expenses net of fee waivers reflect expenses after reimbursement by the investment adviser but prior to reductions from expense offset arrangements. Expenses net of all reductions represent the net expenses paid by the class but do not include expenses of the underlying funds in which the Fund invests.
E Annualized
F On certain classes, the size and fluctuation of net assets and expense amounts may cause ratios to differ from contractual rates.
G Amounts do not include the activity of the Underlying Funds.
H Amount represents less than 1%.
I Amount not annualized.
See accompanying notes which are an integral part of the financial statements.
Fidelity Freedom Blend 2025 Fund Class K6
| | Six months ended (Unaudited) September 30, |
| | 2018 A |
| Selected Per–Share Data | |
| Net asset value, beginning of period | $10.00 |
| Income from Investment Operations | |
| Net investment income (loss)B | .03 |
| Net realized and unrealized gain (loss) | (.04) |
| Total from investment operations | (.01) |
| Net asset value, end of period | $9.99 |
| Total ReturnC | (.10)% |
| Ratios to Average Net AssetsD | |
| Expenses before reductions | .31%E |
| Expenses net of fee waivers, if any | .31%E |
| Expenses net of all reductions | .31%E |
| Net investment income (loss) | 2.95%E |
| Supplemental Data | |
| Net assets, end of period (000 omitted) | $100 |
| Portfolio turnover rateF | 0%G,H |
A For the period August 31, 2018 (commencement of operations) to September 30, 2018.
B Calculated based on average shares outstanding during the period.
C Total returns for periods of less than one year are not annualized.
D Expense ratios reflect operating expenses of the class. Expenses before reductions do not reflect amounts reimbursed by the investment adviser or reductions from expense offset arrangements and do not represent the amount paid by the class during periods when reimbursements or reductions occur. Expenses net of fee waivers reflect expenses after reimbursement by the investment adviser but prior to reductions from expense offset arrangements. Expenses net of all reductions represent the net expenses paid by the class but do not include expenses of the underlying funds in which the Fund invests.
E Annualized
F Amounts do not include the activity of the Underlying Funds.
G Amount represents less than 1%.
H Amount not annualized.
See accompanying notes which are an integral part of the financial statements.
Fidelity Freedom Blend 2025 Fund Class I
| | Six months ended (Unaudited) September 30, |
| | 2018 A |
| Selected Per–Share Data | |
| Net asset value, beginning of period | $10.00 |
| Income from Investment Operations | |
| Net investment income (loss)B | .02 |
| Net realized and unrealized gain (loss) | (.03) |
| Total from investment operations | (.01) |
| Net asset value, end of period | $9.99 |
| Total ReturnC | (.10)% |
| Ratios to Average Net AssetsD | |
| Expenses before reductions | .51%E |
| Expenses net of fee waivers, if any | .51%E |
| Expenses net of all reductions | .51%E |
| Net investment income (loss) | 2.75%E |
| Supplemental Data | |
| Net assets, end of period (000 omitted) | $100 |
| Portfolio turnover rateF | 0%G,H |
A For the period August 31, 2018 (commencement of operations) to September 30, 2018.
B Calculated based on average shares outstanding during the period.
C Total returns for periods of less than one year are not annualized.
D Expense ratios reflect operating expenses of the class. Expenses before reductions do not reflect amounts reimbursed by the investment adviser or reductions from expense offset arrangements and do not represent the amount paid by the class during periods when reimbursements or reductions occur. Expense ratios before reductions for start-up periods may not be representative of longer-term operating periods. Expenses net of fee waivers reflect expenses after reimbursement by the investment adviser but prior to reductions from expense offset arrangements. Expenses net of all reductions represent the net expenses paid by the class but do not include expenses of the underlying funds in which the Fund invests.
E Annualized
F Amounts do not include the activity of the Underlying Funds.
G Amount represents less than 1%.
H Amount not annualized.
See accompanying notes which are an integral part of the financial statements.
Fidelity Freedom Blend 2025 Fund Class Z
| | Six months ended (Unaudited) September 30, |
| | 2018 A |
| Selected Per–Share Data | |
| Net asset value, beginning of period | $10.00 |
| Income from Investment Operations | |
| Net investment income (loss)B | .02 |
| Net realized and unrealized gain (loss) | (.03) |
| Total from investment operations | (.01) |
| Net asset value, end of period | $9.99 |
| Total ReturnC | (.10)% |
| Ratios to Average Net AssetsD | |
| Expenses before reductions | .40%E,F |
| Expenses net of fee waivers, if any | .40%E,F |
| Expenses net of all reductions | .40%E,F |
| Net investment income (loss) | 2.85%E |
| Supplemental Data | |
| Net assets, end of period (000 omitted) | $100 |
| Portfolio turnover rateG | 0%H,I |
A For the period August 31, 2018 (commencement of operations) to September 30, 2018.
B Calculated based on average shares outstanding during the period.
C Total returns for periods of less than one year are not annualized.
D Expense ratios reflect operating expenses of the class. Expenses before reductions do not reflect amounts reimbursed by the investment adviser or reductions from expense offset arrangements and do not represent the amount paid by the class during periods when reimbursements or reductions occur. Expense ratios before reductions for start-up periods may not be representative of longer-term operating periods. Expenses net of fee waivers reflect expenses after reimbursement by the investment adviser but prior to reductions from expense offset arrangements. Expenses net of all reductions represent the net expenses paid by the class but do not include expenses of the underlying funds in which the Fund invests.
E Annualized
F On certain classes, the size and fluctuation of net assets and expense amounts may cause ratios to differ from contractual rates.
G Amounts do not include the activity of the Underlying Funds.
H Amount represents less than 1%.
I Amount not annualized.
See accompanying notes which are an integral part of the financial statements.
Fidelity Freedom Blend 2025 Fund Class Z6
| | Six months ended (Unaudited) September 30, |
| | 2018 A |
| Selected Per–Share Data | |
| Net asset value, beginning of period | $10.00 |
| Income from Investment Operations | |
| Net investment income (loss)B | .03 |
| Net realized and unrealized gain (loss) | (.04) |
| Total from investment operations | (.01) |
| Net asset value, end of period | $9.99 |
| Total ReturnC | (.10)% |
| Ratios to Average Net AssetsD | |
| Expenses before reductions | .31%E |
| Expenses net of fee waivers, if any | .31%E |
| Expenses net of all reductions | .31%E |
| Net investment income (loss) | 2.95%E |
| Supplemental Data | |
| Net assets, end of period (000 omitted) | $100 |
| Portfolio turnover rateF | 0%G,H |
A For the period August 31, 2018 (commencement of operations) to September 30, 2018.
B Calculated based on average shares outstanding during the period.
C Total returns for periods of less than one year are not annualized.
D Expense ratios reflect operating expenses of the class. Expenses before reductions do not reflect amounts reimbursed by the investment adviser or reductions from expense offset arrangements and do not represent the amount paid by the class during periods when reimbursements or reductions occur. Expenses net of fee waivers reflect expenses after reimbursement by the investment adviser but prior to reductions from expense offset arrangements. Expenses net of all reductions represent the net expenses paid by the class but do not include expenses of the underlying funds in which the Fund invests.
E Annualized
F Amounts do not include the activity of the Underlying Funds.
G Amount represents less than 1%.
H Amount not annualized.
See accompanying notes which are an integral part of the financial statements.
Fidelity Freedom® Blend 2030 Fund
Investment Summary (Unaudited)
The information in the following tables is based on the direct investments of the Fund.
Top Holdings as of September 30, 2018
| | % of fund's net assets |
| Fidelity Series Large Cap Value Index Fund | 14.1 |
| Fidelity Series Blue Chip Growth Fund | 9.7 |
| Fidelity Series Large Cap Growth Index Fund | 7.6 |
| Fidelity Series Large Cap Stock Fund | 7.5 |
| Fidelity Series Emerging Markets Opportunities Fund | 7.3 |
| Fidelity Series International Value Fund | 6.6 |
| Fidelity Series International Growth Fund | 6.5 |
| Fidelity Series Long-Term Treasury Bond Index Fund | 5.6 |
| Fidelity Series Value Discovery Fund | 4.5 |
| Fidelity Series Investment Grade Bond Fund | 4.4 |
| | 73.8 |
Asset Allocation (% of fund's net assets)
| Period end |
| | Domestic Equity Funds | 49.1% |
| | International Equity Funds | 25.3% |
| | Bond Funds | 23.5% |
| | Short-Term Funds | 2.1% |

Domestic Equity Funds category includes Fidelity Series Commodity Strategy Fund which invests in commodity-related investments.
Fidelity Freedom® Blend 2030 Fund
Schedule of Investments September 30, 2018 (Unaudited)
Showing Percentage of Net Assets
| Domestic Equity Funds - 49.1% | | | |
| | | Shares | Value |
| Fidelity Series Blue Chip Growth Fund (a) | | 6,016 | $92,052 |
| Fidelity Series Commodity Strategy Fund (a) | | 3,885 | 19,425 |
| Fidelity Series Large Cap Growth Index Fund (a) | | 6,953 | 72,175 |
| Fidelity Series Large Cap Stock Fund (a) | | 4,502 | 71,719 |
| Fidelity Series Large Cap Value Index Fund (a) | | 10,189 | 134,494 |
| Fidelity Series Small Cap Opportunities Fund (a) | | 2,393 | 35,153 |
| Fidelity Series Value Discovery Fund (a) | | 3,115 | 42,640 |
| TOTAL DOMESTIC EQUITY FUNDS | | | |
| (Cost $479,061) | | | 467,658 |
|
| International Equity Funds - 25.3% | | | |
| Fidelity Series Canada Fund (a) | | 599 | 6,472 |
| Fidelity Series Emerging Markets Fund (a) | | 786 | 7,613 |
| Fidelity Series Emerging Markets Opportunities Fund (a) | | 3,596 | 69,014 |
| Fidelity Series International Growth Fund (a) | | 3,762 | 61,703 |
| Fidelity Series International Index Fund (a) | | 1,605 | 16,448 |
| Fidelity Series International Small Cap Fund (a) | | 908 | 16,261 |
| Fidelity Series International Value Fund (a) | | 6,010 | 63,222 |
| TOTAL INTERNATIONAL EQUITY FUNDS | | | |
| (Cost $239,632) | | | 240,733 |
|
| Bond Funds - 23.5% | | | |
| Fidelity Series Corporate Bond Fund (a) | | 2,920 | 28,909 |
| Fidelity Series Emerging Markets Debt Fund (a) | | 616 | 5,869 |
| Fidelity Series Floating Rate High Income Fund (a) | | 252 | 2,400 |
| Fidelity Series Government Bond Index Fund (a) | | 3,948 | 39,044 |
| Fidelity Series High Income Fund (a) | | 1,297 | 12,469 |
| Fidelity Series Inflation-Protected Bond Index Fund (a) | | 589 | 5,719 |
| Fidelity Series Investment Grade Bond Fund (a) | | 3,835 | 41,760 |
| Fidelity Series Investment Grade Securitized Fund (a) | | 3,048 | 30,232 |
| Fidelity Series Long-Term Treasury Bond Index Fund (a) | | 6,511 | 53,647 |
| Fidelity Series Real Estate Income Fund (a) | | 414 | 4,464 |
| TOTAL BOND FUNDS | | | |
| (Cost $227,123) | | | 224,513 |
|
| Short-Term Funds - 2.1% | | | |
| Fidelity Cash Central Fund, 2.11% (b) | | 49 | 49 |
| Fidelity Series Government Money Market Fund 2.12% (a)(c) | | 4,009 | 4,009 |
| Fidelity Series Short-Term Credit Fund (a) | | 406 | 4,005 |
| Fidelity Series Treasury Bill Index Fund (a) | | 1,203 | 12,029 |
| TOTAL SHORT-TERM FUNDS | | | |
| (Cost $20,100) | | | 20,092 |
| TOTAL INVESTMENT IN SECURITIES - 100.0% | | | |
| (Cost $965,916) | | | 952,996 |
| NET OTHER ASSETS (LIABILITIES) - 0.0% | | | (287) |
| NET ASSETS - 100% | | | $952,709 |
Legend
(a) Affiliated Fund
(b) Affiliated fund that is generally available only to investment companies and other accounts managed by Fidelity Investments. The rate quoted is the annualized seven-day yield of the fund at period end. A complete unaudited listing of the fund's holdings as of its most recent quarter end is available upon request. In addition, each Fidelity Central Fund's financial statements are available on the SEC's website or upon request.
(c) The rate quoted is the annualized seven-day yield of the fund at period end.
Affiliated Central Funds
Information regarding fiscal year to date income earned by the Fund from investments in Fidelity Central Funds is as follows:
| Fund | Income earned |
| Fidelity Cash Central Fund | $195 |
| Total | $195 |
Amounts in the income column in the above table include any capital gain distributions from underlying funds, which are presented in the corresponding line-item in the Statement of Operations if applicable.
Affiliated Underlying Funds
Fiscal year to date information regarding the Fund's investments in affiliated Underlying Funds, excluding any Money Market Central Funds, is presented below. Exchanges between classes of the same affiliated Underlying Funds may occur.
| Affiliate | Value, beginning of period | Purchases | Sales Proceeds | Dividend Income | Realized Gain (loss) | Change in Unrealized appreciation (depreciation) | Value, end of period |
| Fidelity Series Blue Chip Growth Fund | $-- | $100,275 | $2 | $8,196 | $-- | $(8,221) | $92,052 |
| Fidelity Series Canada Fund | -- | 6,483 | -- | -- | -- | (11) | 6,472 |
| Fidelity Series Commodity Strategy Fund | -- | 20,183 | -- | 1,116 | -- | (758) | 19,425 |
| Fidelity Series Corporate Bond Fund | -- | 29,037 | 1 | 82 | -- | (127) | 28,909 |
| Fidelity Series Emerging Markets Debt Fund | -- | 5,745 | -- | 28 | -- | 124 | 5,869 |
| Fidelity Series Emerging Markets Fund | -- | 7,722 | -- | -- | -- | (109) | 7,613 |
| Fidelity Series Emerging Markets Opportunities Fund | -- | 69,146 | 2 | -- | -- | (130) | 69,014 |
| Fidelity Series Floating Rate High Income Fund | -- | 2,393 | -- | 10 | -- | 7 | 2,400 |
| Fidelity Series Government Bond Index Fund | -- | 40,350 | 884 | 85 | (11) | (411) | 39,044 |
| Fidelity Series Government Money Market Fund 2.12% | -- | 4,010 | 1 | 6 | -- | -- | 4,009 |
| Fidelity Series High Income Fund | -- | 12,444 | -- | 56 | -- | 25 | 12,469 |
| Fidelity Series Inflation-Protected Bond Index Fund | -- | 5,757 | -- | 2 | -- | (38) | 5,719 |
| Fidelity Series International Growth Fund | -- | 61,849 | 1 | -- | -- | (145) | 61,703 |
| Fidelity Series International Index Fund | -- | 16,294 | -- | -- | -- | 154 | 16,448 |
| Fidelity Series International Small Cap Fund | -- | 16,294 | -- | -- | -- | (33) | 16,261 |
| Fidelity Series International Value Fund | -- | 61,849 | 1 | -- | -- | 1,374 | 63,222 |
| Fidelity Series Investment Grade Bond Fund | -- | 42,050 | 1 | 97 | -- | (289) | 41,760 |
| Fidelity Series Investment Grade Securitized Fund | -- | 31,014 | 547 | 66 | (4) | (231) | 30,232 |
| Fidelity Series Large Cap Growth Index Fund | -- | 71,872 | 105 | -- | -- | 408 | 72,175 |
| Fidelity Series Large Cap Stock Fund | -- | 71,871 | 488 | -- | (3) | 339 | 71,719 |
| Fidelity Series Large Cap Value Index Fund | -- | 134,594 | 373 | -- | (3) | 277 | 134,494 |
| Fidelity Series Long-Term Treasury Bond Index Fund | -- | 55,191 | 1 | 125 | -- | (1,543) | 53,647 |
| Fidelity Series Real Estate Income Fund | -- | 4,593 | -- | 112 | -- | (129) | 4,464 |
| Fidelity Series Short-Term Credit Fund | -- | 4,013 | -- | 8 | -- | (8) | 4,005 |
| Fidelity Series Small Cap Opportunities Fund | -- | 38,538 | 1 | 2,604 | -- | (3,384) | 35,153 |
| Fidelity Series Treasury Bill Index Fund | -- | 12,031 | 2 | 21 | -- | -- | 12,029 |
| Fidelity Series Value Discovery Fund | -- | 42,703 | 2 | -- | -- | (61) | 42,640 |
| Total | $-- | $968,300 | $2,412 | $12,614 | $(21) | $(12,920) | $952,947 |
Amounts in the income column in the above table include any capital gain distributions from underlying funds, which are presented in the corresponding line-item in the Statement of Operations if applicable.
Investment Valuation
All investments are categorized as Level 1 under the Fair Value Hierarchy. The inputs or methodology used for valuing securities may not be an indication of the risk associated with investing in those securities. For more information on valuation inputs please refer to the Investment Valuation section in the accompanying Notes to Financial Statements.
See accompanying notes which are an integral part of the financial statements.
Fidelity Freedom® Blend 2030 Fund
Financial Statements
Statement of Assets and Liabilities
| | | September 30, 2018 (Unaudited) |
| Assets | | |
Investment in securities, at value — See accompanying schedule:
| | |
| Fidelity Central Funds (cost $49) | $49 | |
| Other affiliated issuers (cost $965,867) | 952,947 | |
| Total Investment in Securities (cost $965,916) | | $952,996 |
| Receivable for investments sold | | 2,390 |
| Distributions receivable from Fidelity Central Funds | | 146 |
| Total assets | | 955,532 |
| Liabilities | | |
| Payable for investments purchased | $2,334 | |
| Accrued management fee | 344 | |
| Distribution and service plan fees payable | 145 | |
| Total liabilities | | 2,823 |
| Net Assets | | $952,709 |
| Net Assets consist of: | | |
| Paid in capital | | $953,352 |
| Undistributed net investment income | | 1,988 |
| Accumulated undistributed net realized gain (loss) on investments | | 10,289 |
| Net unrealized appreciation (depreciation) on investments | | (12,920) |
| Net Assets | | $952,709 |
| Calculation of Maximum Offering Price | | |
| Class A: | | |
| Net Asset Value and redemption price per share ($99,913 ÷ 10,000 shares) | | $9.99 |
| Maximum offering price per share (100/94.25 of $9.99) | | $10.60 |
| Class M: | | |
| Net Asset Value and redemption price per share ($99,891 ÷ 10,000 shares) | | $9.99 |
| Maximum offering price per share (100/96.50 of $9.99) | | $10.35 |
| Class C: | | |
| Net Asset Value and offering price per share ($99,848 ÷ 10,000 shares)(a) | | $9.98 |
| Fidelity Freedom Blend 2030 Fund: | | |
| Net Asset Value, offering price and redemption price per share ($153,332 ÷ 15,343 shares) | | $9.99 |
| Class K: | | |
| Net Asset Value, offering price and redemption price per share ($99,943 ÷ 10,000 shares) | | $9.99 |
| Class K6: | | |
| Net Asset Value, offering price and redemption price per share ($99,952 ÷ 10,000 shares) | | $10.00 |
| Class I: | | |
| Net Asset Value, offering price and redemption price per share ($99,935 ÷ 10,000 shares) | | $9.99 |
| Class Z: | | |
| Net Asset Value, offering price and redemption price per share ($99,943 ÷ 10,000 shares) | | $9.99 |
| Class Z6: | | |
| Net Asset Value, offering price and redemption price per share ($99,952 ÷ 10,000 shares) | | $10.00 |
(a) Redemption price per share is equal to net asset value less any applicable contingent deferred sales charge.
See accompanying notes which are an integral part of the financial statements.
Statement of Operations
| | | For the period
August 31, 2018 (commencement of operations) to
September 30, 2018 (Unaudited) |
| Investment Income | | |
| Dividends: | | |
| Affiliated issuers | | $2,304 |
| Income from Fidelity Central Funds | | 195 |
| Total income | | 2,499 |
| Expenses | | |
| Management fee | $358 | |
| Distribution and service plan fees | 153 | |
| Total expenses | | 511 |
| Net investment income (loss) | | 1,988 |
| Realized and Unrealized Gain (Loss) | | |
| Net realized gain (loss) on: | | |
| Investment securities: | | |
| Affiliated issuers | (21) | |
| Capital gain distributions from underlying funds: | | |
| Affiliated issuers | 10,310 | |
| Total net realized gain (loss) | | 10,289 |
| Change in net unrealized appreciation (depreciation) on: | | |
| Investment securities: | | |
| Affiliated issuers | (12,920) | |
| Total change in net unrealized appreciation (depreciation) | | (12,920) |
| Net gain (loss) | | (2,631) |
| Net increase (decrease) in net assets resulting from operations | | $(643) |
See accompanying notes which are an integral part of the financial statements.
Statement of Changes in Net Assets
| | For the period
August 31, 2018 (commencement of operations) to
September 30, 2018 (Unaudited) |
| Increase (Decrease) in Net Assets | |
| Operations | |
| Net investment income (loss) | $1,988 |
| Net realized gain (loss) | 10,289 |
| Change in net unrealized appreciation (depreciation) | (12,920) |
| Net increase (decrease) in net assets resulting from operations | (643) |
| Share transactions - net increase (decrease) | 953,352 |
| Total increase (decrease) in net assets | 952,709 |
| Net Assets | |
| Beginning of period | – |
| End of period | $952,709 |
| Other Information | |
| Undistributed net investment income end of period | $1,988 |
See accompanying notes which are an integral part of the financial statements.
Financial Highlights
Fidelity Freedom Blend 2030 Fund Class A
| | Six months ended (Unaudited) September 30, |
| | 2018 A |
| Selected Per–Share Data | |
| Net asset value, beginning of period | $10.00 |
| Income from Investment Operations | |
| Net investment income (loss)B | .02 |
| Net realized and unrealized gain (loss) | (.03) |
| Total from investment operations | (.01) |
| Net asset value, end of period | $9.99 |
| Total ReturnC,D | (.10)% |
| Ratios to Average Net AssetsE | |
| Expenses before reductions | .77%F |
| Expenses net of fee waivers, if any | .77%F |
| Expenses net of all reductions | .77%F |
| Net investment income (loss) | 2.39%F |
| Supplemental Data | |
| Net assets, end of period (000 omitted) | $100 |
| Portfolio turnover rateG | 0%H,I |
A For the period August 31, 2018 (commencement of operations) to September 30, 2018.
B Calculated based on average shares outstanding during the period.
C Total returns for periods of less than one year are not annualized.
D Total returns do not include the effect of the sales charges.
E Expense ratios reflect operating expenses of the class. Expenses before reductions do not reflect amounts reimbursed by the investment adviser or reductions from expense offset arrangements and do not represent the amount paid by the class during periods when reimbursements or reductions occur. Expense ratios before reductions for start-up periods may not be representative of longer-term operating periods. Expenses net of fee waivers reflect expenses after reimbursement by the investment adviser but prior to reductions from expense offset arrangements. Expenses net of all reductions represent the net expenses paid by the class but do not include expenses of the underlying funds in which the Fund invests.
F Annualized
G Amounts do not include the activity of the Underlying Funds.
H Amount represents less than 1%.
I Amount not annualized.
See accompanying notes which are an integral part of the financial statements.
Fidelity Freedom Blend 2030 Fund Class M
| | Six months ended (Unaudited) September 30, |
| | 2018 A |
| Selected Per–Share Data | |
| Net asset value, beginning of period | $10.00 |
| Income from Investment Operations | |
| Net investment income (loss)B | .02 |
| Net realized and unrealized gain (loss) | (.03) |
| Total from investment operations | (.01) |
| Net asset value, end of period | $9.99 |
| Total ReturnC,D | (.10)% |
| Ratios to Average Net AssetsE | |
| Expenses before reductions | 1.03%F,G |
| Expenses net of fee waivers, if any | 1.03%F,G |
| Expenses net of all reductions | 1.03%F,G |
| Net investment income (loss) | 2.13%F |
| Supplemental Data | |
| Net assets, end of period (000 omitted) | $100 |
| Portfolio turnover rateH | 0%I,J |
A For the period August 31, 2018 (commencement of operations) to September 30, 2018.
B Calculated based on average shares outstanding during the period.
C Total returns for periods of less than one year are not annualized.
D Total returns do not include the effect of the sales charges.
E Expense ratios reflect operating expenses of the class. Expenses before reductions do not reflect amounts reimbursed by the investment adviser or reductions from expense offset arrangements and do not represent the amount paid by the class during periods when reimbursements or reductions occur. Expense ratios before reductions for start-up periods may not be representative of longer-term operating periods. Expenses net of fee waivers reflect expenses after reimbursement by the investment adviser but prior to reductions from expense offset arrangements. Expenses net of all reductions represent the net expenses paid by the class but do not include expenses of the underlying funds in which the Fund invests.
F Annualized
G On certain classes, the size and fluctuation of net assets and expense amounts may cause ratios to differ from contractual rates.
H Amounts do not include the activity of the Underlying Funds.
I Amount represents less than 1%.
J Amount not annualized.
See accompanying notes which are an integral part of the financial statements.
Fidelity Freedom Blend 2030 Fund Class C
| | Six months ended (Unaudited) September 30, |
| | 2018 A |
| Selected Per–Share Data | |
| Net asset value, beginning of period | $10.00 |
| Income from Investment Operations | |
| Net investment income (loss)B | .01 |
| Net realized and unrealized gain (loss) | (.03) |
| Total from investment operations | (.02) |
| Net asset value, end of period | $9.98 |
| Total ReturnC,D | (.20)% |
| Ratios to Average Net AssetsE | |
| Expenses before reductions | 1.53%F,G |
| Expenses net of fee waivers, if any | 1.53%F,G |
| Expenses net of all reductions | 1.53%F,G |
| Net investment income (loss) | 1.64%F |
| Supplemental Data | |
| Net assets, end of period (000 omitted) | $100 |
| Portfolio turnover rateH | 0%I,J |
A For the period August 31, 2018 (commencement of operations) to September 30, 2018.
B Calculated based on average shares outstanding during the period.
C Total returns for periods of less than one year are not annualized.
D Total returns do not include the effect of the contingent deferred sales charge.
E Expense ratios reflect operating expenses of the class. Expenses before reductions do not reflect amounts reimbursed by the investment adviser or reductions from expense offset arrangements and do not represent the amount paid by the class during periods when reimbursements or reductions occur. Expense ratios before reductions for start-up periods may not be representative of longer-term operating periods. Expenses net of fee waivers reflect expenses after reimbursement by the investment adviser but prior to reductions from expense offset arrangements. Expenses net of all reductions represent the net expenses paid by the class but do not include expenses of the underlying funds in which the Fund invests.
F Annualized
G On certain classes, the size and fluctuation of net assets and expense amounts may cause ratios to differ from contractual rates.
H Amounts do not include the activity of the Underlying Funds.
I Amount represents less than 1%.
J Amount not annualized.
See accompanying notes which are an integral part of the financial statements.
Fidelity Freedom Blend 2030 Fund
| | Six months ended (Unaudited) September 30, |
| | 2018 A |
| Selected Per–Share Data | |
| Net asset value, beginning of period | $10.00 |
| Income from Investment Operations | |
| Net investment income (loss)B | .02 |
| Net realized and unrealized gain (loss) | (.03) |
| Total from investment operations | (.01) |
| Net asset value, end of period | $9.99 |
| Total ReturnC | (.10)% |
| Ratios to Average Net AssetsD | |
| Expenses before reductions | .51%E,F |
| Expenses net of fee waivers, if any | .51%E,F |
| Expenses net of all reductions | .51%E,F |
| Net investment income (loss) | 2.65%E |
| Supplemental Data | |
| Net assets, end of period (000 omitted) | $153 |
| Portfolio turnover rateG | 0%H,I |
A For the period August 31, 2018 (commencement of operations) to September 30, 2018.
B Calculated based on average shares outstanding during the period.
C Total returns for periods of less than one year are not annualized.
D Expense ratios reflect operating expenses of the class. Expenses before reductions do not reflect amounts reimbursed by the investment adviser or reductions from expense offset arrangements and do not represent the amount paid by the class during periods when reimbursements or reductions occur. Expense ratios before reductions for start-up periods may not be representative of longer-term operating periods. Expenses net of fee waivers reflect expenses after reimbursement by the investment adviser but prior to reductions from expense offset arrangements. Expenses net of all reductions represent the net expenses paid by the class but do not include expenses of the underlying funds in which the Fund invests.
E Annualized
F On certain classes, the size and fluctuation of net assets and expense amounts may cause ratios to differ from contractual rates.
G Amounts do not include the activity of the Underlying Funds.
H Amount represents less than 1%.
I Amount not annualized.
See accompanying notes which are an integral part of the financial statements.
Fidelity Freedom Blend 2030 Fund Class K
| | Six months ended (Unaudited) September 30, |
| | 2018 A |
| Selected Per–Share Data | |
| Net asset value, beginning of period | $10.00 |
| Income from Investment Operations | |
| Net investment income (loss)B | .02 |
| Net realized and unrealized gain (loss) | (.03) |
| Total from investment operations | (.01) |
| Net asset value, end of period | $9.99 |
| Total ReturnC | (.10)% |
| Ratios to Average Net AssetsD | |
| Expenses before reductions | .42%E |
| Expenses net of fee waivers, if any | .42%E |
| Expenses net of all reductions | .42%E |
| Net investment income (loss) | 2.75%E |
| Supplemental Data | |
| Net assets, end of period (000 omitted) | $100 |
| Portfolio turnover rateF | 0%G,H |
A For the period August 31, 2018 (commencement of operations) to September 30, 2018.
B Calculated based on average shares outstanding during the period.
C Total returns for periods of less than one year are not annualized.
D Expense ratios reflect operating expenses of the class. Expenses before reductions do not reflect amounts reimbursed by the investment adviser or reductions from expense offset arrangements and do not represent the amount paid by the class during periods when reimbursements or reductions occur. Expense ratios before reductions for start-up periods may not be representative of longer-term operating periods. Expenses net of fee waivers reflect expenses after reimbursement by the investment adviser but prior to reductions from expense offset arrangements. Expenses net of all reductions represent the net expenses paid by the class but do not include expenses of the underlying funds in which the Fund invests.
E Annualized
F Amounts do not include the activity of the Underlying Funds.
G Amount represents less than 1%.
H Amount not annualized.
See accompanying notes which are an integral part of the financial statements.
Fidelity Freedom Blend 2030 Fund Class K6
| | Six months ended (Unaudited) September 30, |
| | 2018 A |
| Selected Per–Share Data | |
| Net asset value, beginning of period | $10.00 |
| Income from Investment Operations | |
| Net investment income (loss)B | .02 |
| Net realized and unrealized gain (loss) | (.02) |
| Total from investment operations | – |
| Net asset value, end of period | $10.00 |
| Total ReturnC | –% |
| Ratios to Average Net AssetsD | |
| Expenses before reductions | .32%E |
| Expenses net of fee waivers, if any | .32%E |
| Expenses net of all reductions | .32%E |
| Net investment income (loss) | 2.84%E |
| Supplemental Data | |
| Net assets, end of period (000 omitted) | $100 |
| Portfolio turnover rateF | 0%G,H |
A For the period August 31, 2018 (commencement of operations) to September 30, 2018.
B Calculated based on average shares outstanding during the period.
C Total returns for periods of less than one year are not annualized.
D Expense ratios reflect operating expenses of the class. Expenses before reductions do not reflect amounts reimbursed by the investment adviser or reductions from expense offset arrangements and do not represent the amount paid by the class during periods when reimbursements or reductions occur. Expenses net of fee waivers reflect expenses after reimbursement by the investment adviser but prior to reductions from expense offset arrangements. Expenses net of all reductions represent the net expenses paid by the class but do not include expenses of the underlying funds in which the Fund invests.
E Annualized
F Amounts do not include the activity of the Underlying Funds.
G Amount represents less than 1%.
H Amount not annualized.
See accompanying notes which are an integral part of the financial statements.
Fidelity Freedom Blend 2030 Fund Class I
| | Six months ended (Unaudited) September 30, |
| | 2018 A |
| Selected Per–Share Data | |
| Net asset value, beginning of period | $10.00 |
| Income from Investment Operations | |
| Net investment income (loss)B | .02 |
| Net realized and unrealized gain (loss) | (.03) |
| Total from investment operations | (.01) |
| Net asset value, end of period | $9.99 |
| Total ReturnC | (.10)% |
| Ratios to Average Net AssetsD | |
| Expenses before reductions | .52%E |
| Expenses net of fee waivers, if any | .52%E |
| Expenses net of all reductions | .52%E |
| Net investment income (loss) | 2.64%E |
| Supplemental Data | |
| Net assets, end of period (000 omitted) | $100 |
| Portfolio turnover rateF | 0%G,H |
A For the period August 31, 2018 (commencement of operations) to September 30, 2018.
B Calculated based on average shares outstanding during the period.
C Total returns for periods of less than one year are not annualized.
D Expense ratios reflect operating expenses of the class. Expenses before reductions do not reflect amounts reimbursed by the investment adviser or reductions from expense offset arrangements and do not represent the amount paid by the class during periods when reimbursements or reductions occur. Expense ratios before reductions for start-up periods may not be representative of longer-term operating periods. Expenses net of fee waivers reflect expenses after reimbursement by the investment adviser but prior to reductions from expense offset arrangements. Expenses net of all reductions represent the net expenses paid by the class but do not include expenses of the underlying funds in which the Fund invests.
E Annualized
F Amounts do not include the activity of the Underlying Funds.
G Amount represents less than 1%.
H Amount not annualized.
See accompanying notes which are an integral part of the financial statements.
Fidelity Freedom Blend 2030 Fund Class Z
| | Six months ended (Unaudited) September 30, |
| | 2018 A |
| Selected Per–Share Data | |
| Net asset value, beginning of period | $10.00 |
| Income from Investment Operations | |
| Net investment income (loss)B | .02 |
| Net realized and unrealized gain (loss) | (.03) |
| Total from investment operations | (.01) |
| Net asset value, end of period | $9.99 |
| Total ReturnC | (.10)% |
| Ratios to Average Net AssetsD | |
| Expenses before reductions | .42%E |
| Expenses net of fee waivers, if any | .42%E |
| Expenses net of all reductions | .42%E |
| Net investment income (loss) | 2.75%E |
| Supplemental Data | |
| Net assets, end of period (000 omitted) | $100 |
| Portfolio turnover rateF | 0%G,H |
A For the period August 31, 2018 (commencement of operations) to September 30, 2018.
B Calculated based on average shares outstanding during the period.
C Total returns for periods of less than one year are not annualized.
D Expense ratios reflect operating expenses of the class. Expenses before reductions do not reflect amounts reimbursed by the investment adviser or reductions from expense offset arrangements and do not represent the amount paid by the class during periods when reimbursements or reductions occur. Expense ratios before reductions for start-up periods may not be representative of longer-term operating periods. Expenses net of fee waivers reflect expenses after reimbursement by the investment adviser but prior to reductions from expense offset arrangements. Expenses net of all reductions represent the net expenses paid by the class but do not include expenses of the underlying funds in which the Fund invests.
E Annualized
F Amounts do not include the activity of the Underlying Funds.
G Amount represents less than 1%.
H Amount not annualized.
See accompanying notes which are an integral part of the financial statements.
Fidelity Freedom Blend 2030 Fund Class Z6
| | Six months ended (Unaudited) September 30, |
| | 2018 A |
| Selected Per–Share Data | |
| Net asset value, beginning of period | $10.00 |
| Income from Investment Operations | |
| Net investment income (loss)B | .02 |
| Net realized and unrealized gain (loss) | (.02) |
| Total from investment operations | – |
| Net asset value, end of period | $10.00 |
| Total ReturnC | –% |
| Ratios to Average Net AssetsD | |
| Expenses before reductions | .32%E |
| Expenses net of fee waivers, if any | .32%E |
| Expenses net of all reductions | .32%E |
| Net investment income (loss) | 2.84%E |
| Supplemental Data | |
| Net assets, end of period (000 omitted) | $100 |
| Portfolio turnover rateF | 0%G,H |
A For the period August 31, 2018 (commencement of operations) to September 30, 2018.
B Calculated based on average shares outstanding during the period.
C Total returns for periods of less than one year are not annualized.
D Expense ratios reflect operating expenses of the class. Expenses before reductions do not reflect amounts reimbursed by the investment adviser or reductions from expense offset arrangements and do not represent the amount paid by the class during periods when reimbursements or reductions occur. Expenses net of fee waivers reflect expenses after reimbursement by the investment adviser but prior to reductions from expense offset arrangements. Expenses net of all reductions represent the net expenses paid by the class but do not include expenses of the underlying funds in which the Fund invests.
E Annualized
F Amounts do not include the activity of the Underlying Funds.
G Amount represents less than 1%.
H Amount not annualized.
See accompanying notes which are an integral part of the financial statements.
Fidelity Freedom® Blend 2035 Fund
Investment Summary (Unaudited)
The information in the following tables is based on the direct investments of the Fund.
Top Holdings as of September 30, 2018
| | % of fund's net assets |
| Fidelity Series Large Cap Value Index Fund | 17.0 |
| Fidelity Series Blue Chip Growth Fund | 11.6 |
| Fidelity Series Large Cap Growth Index Fund | 9.1 |
| Fidelity Series Large Cap Stock Fund | 9.1 |
| Fidelity Series Emerging Markets Opportunities Fund | 8.2 |
| Fidelity Series International Value Fund | 7.8 |
| Fidelity Series International Growth Fund | 7.6 |
| Fidelity Series Long-Term Treasury Bond Index Fund | 5.6 |
| Fidelity Series Value Discovery Fund | 5.4 |
| Fidelity Series Small Cap Opportunities Fund | 4.4 |
| | 85.8 |
Asset Allocation (% of fund's net assets)
| Period end |
| | Domestic Equity Funds | 58.6% |
| | International Equity Funds | 29.3% |
| | Bond Funds | 10.0% |
| | Short-Term Funds | 2.1% |

Domestic Equity Funds category includes Fidelity Series Commodity Strategy Fund which invests in commodity-related investments.
Fidelity Freedom® Blend 2035 Fund
Schedule of Investments September 30, 2018 (Unaudited)
Showing Percentage of Net Assets
| Domestic Equity Funds - 58.6% | | | |
| | | Shares | Value |
| Fidelity Series Blue Chip Growth Fund (a) | | 8,357 | $127,864 |
| Fidelity Series Commodity Strategy Fund (a) | | 4,485 | 22,426 |
| Fidelity Series Large Cap Growth Index Fund (a) | | 9,656 | 100,226 |
| Fidelity Series Large Cap Stock Fund (a) | | 6,276 | 99,972 |
| Fidelity Series Large Cap Value Index Fund (a) | | 14,162 | 186,935 |
| Fidelity Series Small Cap Opportunities Fund (a) | | 3,327 | 48,878 |
| Fidelity Series Value Discovery Fund (a) | | 4,316 | 59,090 |
| TOTAL DOMESTIC EQUITY FUNDS | | | |
| (Cost $658,594) | | | 645,391 |
|
| International Equity Funds - 29.3% | | | |
| Fidelity Series Canada Fund (a) | | 822 | 8,884 |
| Fidelity Series Emerging Markets Fund (a) | | 1,023 | 9,915 |
| Fidelity Series Emerging Markets Opportunities Fund (a) | | 4,687 | 89,934 |
| Fidelity Series International Growth Fund (a) | | 5,121 | 83,984 |
| Fidelity Series International Index Fund (a) | | 2,177 | 22,309 |
| Fidelity Series International Small Cap Fund (a) | | 1,234 | 22,081 |
| Fidelity Series International Value Fund (a) | | 8,162 | 85,865 |
| TOTAL INTERNATIONAL EQUITY FUNDS | | | |
| (Cost $321,189) | | | 322,972 |
|
| Bond Funds - 10.0% | | | |
| Fidelity Series Corporate Bond Fund (a) | | 313 | 3,098 |
| Fidelity Series Emerging Markets Debt Fund (a) | | 710 | 6,766 |
| Fidelity Series Floating Rate High Income Fund (a) | | 291 | 2,769 |
| Fidelity Series Government Bond Index Fund (a) | | 470 | 4,644 |
| Fidelity Series High Income Fund (a) | | 1,497 | 14,388 |
| Fidelity Series Inflation-Protected Bond Index Fund (a) | | 338 | 3,283 |
| Fidelity Series Investment Grade Bond Fund (a) | | 443 | 4,825 |
| Fidelity Series Investment Grade Securitized Fund (a) | | 359 | 3,561 |
| Fidelity Series Long-Term Treasury Bond Index Fund (a) | | 7,533 | 62,073 |
| Fidelity Series Real Estate Income Fund (a) | | 478 | 5,156 |
| TOTAL BOND FUNDS | | | |
| (Cost $112,203) | | | 110,563 |
|
| Short-Term Funds - 2.1% | | | |
| Fidelity Cash Central Fund, 2.11% (b) | | 49 | 49 |
| Fidelity Series Government Money Market Fund 2.12% (a)(c) | | 4,629 | 4,629 |
| Fidelity Series Short-Term Credit Fund (a) | | 469 | 4,622 |
| Fidelity Series Treasury Bill Index Fund (a) | | 1,389 | 13,888 |
| TOTAL SHORT-TERM FUNDS | | | |
| (Cost $23,196) | | | 23,188 |
| TOTAL INVESTMENT IN SECURITIES - 100.0% | | | |
| (Cost $1,115,182) | | | 1,102,114 |
| NET OTHER ASSETS (LIABILITIES) - 0.0% | | | (340) |
| NET ASSETS - 100% | | | $1,101,774 |
Legend
(a) Affiliated Fund
(b) Affiliated fund that is generally available only to investment companies and other accounts managed by Fidelity Investments. The rate quoted is the annualized seven-day yield of the fund at period end. A complete unaudited listing of the fund's holdings as of its most recent quarter end is available upon request. In addition, each Fidelity Central Fund's financial statements are available on the SEC's website or upon request.
(c) The rate quoted is the annualized seven-day yield of the fund at period end.
Affiliated Central Funds
Information regarding fiscal year to date income earned by the Fund from investments in Fidelity Central Funds is as follows:
| Fund | Income earned |
| Fidelity Cash Central Fund | $195 |
| Total | $195 |
Amounts in the income column in the above table include any capital gain distributions from underlying funds, which are presented in the corresponding line-item in the Statement of Operations if applicable.
Affiliated Underlying Funds
Fiscal year to date information regarding the Fund's investments in affiliated Underlying Funds, excluding any Money Market Central Funds, is presented below. Exchanges between classes of the same affiliated Underlying Funds may occur.
| Affiliate | Value, beginning of period | Purchases | Sales Proceeds | Dividend Income | Realized Gain (loss) | Change in Unrealized appreciation (depreciation) | Value, end of period |
| Fidelity Series Blue Chip Growth Fund | $-- | $137,468 | $3 | $9,845 | $-- | $(9,601) | $127,864 |
| Fidelity Series Canada Fund | -- | 8,897 | -- | -- | -- | (13) | 8,884 |
| Fidelity Series Commodity Strategy Fund | -- | 23,130 | -- | 1,115 | -- | (704) | 22,426 |
| Fidelity Series Corporate Bond Fund | -- | 3,110 | -- | 8 | -- | (12) | 3,098 |
| Fidelity Series Emerging Markets Debt Fund | -- | 6,631 | -- | 30 | -- | 135 | 6,766 |
| Fidelity Series Emerging Markets Fund | -- | 10,016 | -- | -- | -- | (101) | 9,915 |
| Fidelity Series Emerging Markets Opportunities Fund | -- | 89,854 | 2 | -- | -- | 82 | 89,934 |
| Fidelity Series Floating Rate High Income Fund | -- | 2,762 | -- | 11 | -- | 7 | 2,769 |
| Fidelity Series Government Bond Index Fund | -- | 4,686 | -- | 9 | -- | (42) | 4,644 |
| Fidelity Series Government Money Market Fund 2.12% | -- | 4,629 | -- | 7 | -- | -- | 4,629 |
| Fidelity Series High Income Fund | -- | 14,362 | -- | 59 | -- | 26 | 14,388 |
| Fidelity Series Inflation-Protected Bond Index Fund | -- | 3,303 | -- | 1 | -- | (20) | 3,283 |
| Fidelity Series International Growth Fund | -- | 84,109 | 2 | -- | -- | (123) | 83,984 |
| Fidelity Series International Index Fund | -- | 22,104 | -- | -- | -- | 205 | 22,309 |
| Fidelity Series International Small Cap Fund | -- | 22,105 | -- | -- | -- | (24) | 22,081 |
| Fidelity Series International Value Fund | -- | 84,109 | 2 | -- | -- | 1,758 | 85,865 |
| Fidelity Series Investment Grade Bond Fund | -- | 4,853 | -- | 10 | -- | (28) | 4,825 |
| Fidelity Series Investment Grade Securitized Fund | -- | 3,584 | -- | 7 | -- | (23) | 3,561 |
| Fidelity Series Large Cap Growth Index Fund | -- | 99,574 | 2 | -- | -- | 654 | 100,226 |
| Fidelity Series Large Cap Stock Fund | -- | 99,574 | 2 | -- | -- | 400 | 99,972 |
| Fidelity Series Large Cap Value Index Fund | -- | 186,712 | 4 | -- | -- | 227 | 186,935 |
| Fidelity Series Long-Term Treasury Bond Index Fund | -- | 63,627 | 1 | 131 | -- | (1,553) | 62,073 |
| Fidelity Series Real Estate Income Fund | -- | 5,286 | -- | 113 | -- | (130) | 5,156 |
| Fidelity Series Short-Term Credit Fund | -- | 4,630 | -- | 8 | -- | (8) | 4,622 |
| Fidelity Series Small Cap Opportunities Fund | -- | 52,971 | 1 | 3,129 | -- | (4,092) | 48,878 |
| Fidelity Series Treasury Bill Index Fund | -- | 13,888 | -- | 22 | -- | -- | 13,888 |
| Fidelity Series Value Discovery Fund | -- | 59,179 | 1 | -- | -- | (88) | 59,090 |
| Total | $-- | $1,115,153 | $20 | $14,505 | $-- | $(13,068) | $1,102,065 |
Amounts in the income column in the above table include any capital gain distributions from underlying funds, which are presented in the corresponding line-item in the Statement of Operations if applicable.
Investment Valuation
All investments are categorized as Level 1 under the Fair Value Hierarchy. The inputs or methodology used for valuing securities may not be an indication of the risk associated with investing in those securities. For more information on valuation inputs please refer to the Investment Valuation section in the accompanying Notes to Financial Statements.
See accompanying notes which are an integral part of the financial statements.
Fidelity Freedom® Blend 2035 Fund
Financial Statements
Statement of Assets and Liabilities
| | | September 30, 2018 (Unaudited) |
| Assets | | |
Investment in securities, at value — See accompanying schedule:
| | |
| Fidelity Central Funds (cost $49) | $49 | |
| Other affiliated issuers (cost $1,115,133) | 1,102,065 | |
| Total Investment in Securities (cost $1,115,182) | | $1,102,114 |
| Receivable for fund shares sold | | 50,000 |
| Distributions receivable from Fidelity Central Funds | | 146 |
| Total assets | | 1,152,260 |
| Liabilities | | |
| Payable for investments purchased | $49,971 | |
| Accrued management fee | 370 | |
| Distribution and service plan fees payable | 145 | |
| Total liabilities | | 50,486 |
| Net Assets | | $1,101,774 |
| Net Assets consist of: | | |
| Paid in capital | | $1,100,679 |
| Undistributed net investment income | | 1,789 |
| Accumulated undistributed net realized gain (loss) on investments | | 12,374 |
| Net unrealized appreciation (depreciation) on investments | | (13,068) |
| Net Assets | | $1,101,774 |
| Calculation of Maximum Offering Price | | |
| Class A: | | |
| Net Asset Value and redemption price per share ($100,010 ÷ 10,000 shares) | | $10.00 |
| Maximum offering price per share (100/94.25 of $10.00) | | $10.61 |
| Class M: | | |
| Net Asset Value and redemption price per share ($99,988 ÷ 10,000 shares) | | $10.00 |
| Maximum offering price per share (100/96.50 of $10.00) | | $10.36 |
| Class C: | | |
| Net Asset Value and offering price per share ($99,945 ÷ 10,000 shares)(a) | | $9.99 |
| Fidelity Freedom Blend 2035 Fund: | | |
| Net Asset Value, offering price and redemption price per share ($301,621 ÷ 30,154 shares) | | $10.00 |
| Class K: | | |
| Net Asset Value, offering price and redemption price per share ($100,040 ÷ 10,000 shares) | | $10.00 |
| Class K6: | | |
| Net Asset Value, offering price and redemption price per share ($100,040 ÷ 10,000 shares) | | $10.00 |
| Class I: | | |
| Net Asset Value, offering price and redemption price per share ($100,032 ÷ 10,000 shares) | | $10.00 |
| Class Z: | | |
| Net Asset Value, offering price and redemption price per share ($100,049 ÷ 10,000 shares) | | $10.00 |
| Class Z6: | | |
| Net Asset Value, offering price and redemption price per share ($100,049 ÷ 10,000 shares) | | $10.00 |
(a) Redemption price per share is equal to net asset value less any applicable contingent deferred sales charge.
See accompanying notes which are an integral part of the financial statements.
Statement of Operations
| | | For the period
August 31, 2018 (commencement of operations) to
September 30, 2018 (Unaudited) |
| Investment Income | | |
| Dividends: | | |
| Affiliated issuers | | $2,131 |
| Income from Fidelity Central Funds | | 195 |
| Total income | | 2,326 |
| Expenses | | |
| Management fee | $386 | |
| Distribution and service plan fees | 151 | |
| Total expenses | | 537 |
| Net investment income (loss) | | 1,789 |
| Realized and Unrealized Gain (Loss) | | |
| Net realized gain (loss) on: | | |
| Capital gain distributions from underlying funds: | | |
| Affiliated issuers | 12,374 | |
| Total net realized gain (loss) | | 12,374 |
| Change in net unrealized appreciation (depreciation) on: | | |
| Investment securities: | | |
| Affiliated issuers | (13,068) | |
| Total change in net unrealized appreciation (depreciation) | | (13,068) |
| Net gain (loss) | | (694) |
| Net increase (decrease) in net assets resulting from operations | | $1,095 |
See accompanying notes which are an integral part of the financial statements.
Statement of Changes in Net Assets
| | For the period
August 31, 2018 (commencement of operations) to
September 30, 2018 (Unaudited) |
| Increase (Decrease) in Net Assets | |
| Operations | |
| Net investment income (loss) | $1,789 |
| Net realized gain (loss) | 12,374 |
| Change in net unrealized appreciation (depreciation) | (13,068) |
| Net increase (decrease) in net assets resulting from operations | 1,095 |
| Share transactions - net increase (decrease) | 1,100,679 |
| Total increase (decrease) in net assets | 1,101,774 |
| Net Assets | |
| Beginning of period | – |
| End of period | $1,101,774 |
| Other Information | |
| Undistributed net investment income end of period | $1,789 |
See accompanying notes which are an integral part of the financial statements.
Financial Highlights
Fidelity Freedom Blend 2035 Fund Class A
| | Six months ended (Unaudited) September 30, |
| | 2018 A |
| Selected Per–Share Data | |
| Net asset value, beginning of period | $10.00 |
| Income from Investment Operations | |
| Net investment income (loss)B | .02 |
| Net realized and unrealized gain (loss) | (.02) |
| Total from investment operations | – |
| Net asset value, end of period | $10.00 |
| Total ReturnC,D | –% |
| Ratios to Average Net AssetsE | |
| Expenses before reductions | .77%F,G |
| Expenses net of fee waivers, if any | .77%F,G |
| Expenses net of all reductions | .77%F,G |
| Net investment income (loss) | 2.04%F |
| Supplemental Data | |
| Net assets, end of period (000 omitted) | $100 |
| Portfolio turnover rateH | 0%I,J |
A For the period August 31, 2018 (commencement of operations) to September 30, 2018.
B Calculated based on average shares outstanding during the period.
C Total returns for periods of less than one year are not annualized.
D Total returns do not include the effect of the sales charges.
E Expense ratios reflect operating expenses of the class. Expenses before reductions do not reflect amounts reimbursed by the investment adviser or reductions from expense offset arrangements and do not represent the amount paid by the class during periods when reimbursements or reductions occur. Expense ratios before reductions for start-up periods may not be representative of longer-term operating periods. Expenses net of fee waivers reflect expenses after reimbursement by the investment adviser but prior to reductions from expense offset arrangements. Expenses net of all reductions represent the net expenses paid by the class but do not include expenses of the underlying funds in which the Fund invests.
F Annualized
G On certain classes, the size and fluctuation of net assets and expense amounts may cause ratios to differ from contractual rates.
H Amounts do not include the activity of the Underlying Funds.
I Amount represents less than 1%.
J Amount not annualized.
See accompanying notes which are an integral part of the financial statements.
Fidelity Freedom Blend 2035 Fund Class M
| | Six months ended (Unaudited) September 30, |
| | 2018 A |
| Selected Per–Share Data | |
| Net asset value, beginning of period | $10.00 |
| Income from Investment Operations | |
| Net investment income (loss)B | .02 |
| Net realized and unrealized gain (loss) | (.02) |
| Total from investment operations | – |
| Net asset value, end of period | $10.00 |
| Total ReturnC,D | –% |
| Ratios to Average Net AssetsE | |
| Expenses before reductions | 1.03%F |
| Expenses net of fee waivers, if any | 1.03%F |
| Expenses net of all reductions | 1.03%F |
| Net investment income (loss) | 1.78%F |
| Supplemental Data | |
| Net assets, end of period (000 omitted) | $100 |
| Portfolio turnover rateG | 0%H,I |
A For the period August 31, 2018 (commencement of operations) to September 30, 2018.
B Calculated based on average shares outstanding during the period.
C Total returns for periods of less than one year are not annualized.
D Total returns do not include the effect of the sales charges.
E Expense ratios reflect operating expenses of the class. Expenses before reductions do not reflect amounts reimbursed by the investment adviser or reductions from expense offset arrangements and do not represent the amount paid by the class during periods when reimbursements or reductions occur. Expense ratios before reductions for start-up periods may not be representative of longer-term operating periods. Expenses net of fee waivers reflect expenses after reimbursement by the investment adviser but prior to reductions from expense offset arrangements. Expenses net of all reductions represent the net expenses paid by the class but do not include expenses of the underlying funds in which the Fund invests.
F Annualized
G Amounts do not include the activity of the Underlying Funds.
H Amount represents less than 1%.
I Amount not annualized.
See accompanying notes which are an integral part of the financial statements.
Fidelity Freedom Blend 2035 Fund Class C
| | Six months ended (Unaudited) September 30, |
| | 2018 A |
| Selected Per–Share Data | |
| Net asset value, beginning of period | $10.00 |
| Income from Investment Operations | |
| Net investment income (loss)B | .01 |
| Net realized and unrealized gain (loss) | (.02) |
| Total from investment operations | (.01) |
| Net asset value, end of period | $9.99 |
| Total ReturnC,D | (.10)% |
| Ratios to Average Net AssetsE | |
| Expenses before reductions | 1.53%F |
| Expenses net of fee waivers, if any | 1.53%F |
| Expenses net of all reductions | 1.53%F |
| Net investment income (loss) | 1.29%F |
| Supplemental Data | |
| Net assets, end of period (000 omitted) | $100 |
| Portfolio turnover rateG | 0%H,I |
A For the period August 31, 2018 (commencement of operations) to September 30, 2018.
B Calculated based on average shares outstanding during the period.
C Total returns for periods of less than one year are not annualized.
D Total returns do not include the effect of the contingent deferred sales charge.
E Expense ratios reflect operating expenses of the class. Expenses before reductions do not reflect amounts reimbursed by the investment adviser or reductions from expense offset arrangements and do not represent the amount paid by the class during periods when reimbursements or reductions occur. Expense ratios before reductions for start-up periods may not be representative of longer-term operating periods. Expenses net of fee waivers reflect expenses after reimbursement by the investment adviser but prior to reductions from expense offset arrangements. Expenses net of all reductions represent the net expenses paid by the class but do not include expenses of the underlying funds in which the Fund invests.
F Annualized
G Amounts do not include the activity of the Underlying Funds.
H Amount represents less than 1%.
I Amount not annualized.
See accompanying notes which are an integral part of the financial statements.
Fidelity Freedom Blend 2035 Fund
| | Six months ended (Unaudited) September 30, |
| | 2018 A |
| Selected Per–Share Data | |
| Net asset value, beginning of period | $10.00 |
| Income from Investment Operations | |
| Net investment income (loss)B | .02 |
| Net realized and unrealized gain (loss) | (.02) |
| Total from investment operations | – |
| Net asset value, end of period | $10.00 |
| Total ReturnC | –% |
| Ratios to Average Net AssetsD | |
| Expenses before reductions | .53%E |
| Expenses net of fee waivers, if any | .53%E |
| Expenses net of all reductions | .53%E |
| Net investment income (loss) | 2.28%E |
| Supplemental Data | |
| Net assets, end of period (000 omitted) | $302 |
| Portfolio turnover rateF | 0%G,H |
A For the period August 31, 2018 (commencement of operations) to September 30, 2018.
B Calculated based on average shares outstanding during the period.
C Total returns for periods of less than one year are not annualized.
D Expense ratios reflect operating expenses of the class. Expenses before reductions do not reflect amounts reimbursed by the investment adviser or reductions from expense offset arrangements and do not represent the amount paid by the class during periods when reimbursements or reductions occur. Expense ratios before reductions for start-up periods may not be representative of longer-term operating periods. Expenses net of fee waivers reflect expenses after reimbursement by the investment adviser but prior to reductions from expense offset arrangements. Expenses net of all reductions represent the net expenses paid by the class but do not include expenses of the underlying funds in which the Fund invests.
E Annualized
F Amounts do not include the activity of the Underlying Funds.
G Amount represents less than 1%.
H Amount not annualized.
See accompanying notes which are an integral part of the financial statements.
Fidelity Freedom Blend 2035 Fund Class K
| | Six months ended (Unaudited) September 30, |
| | 2018 A |
| Selected Per–Share Data | |
| Net asset value, beginning of period | $10.00 |
| Income from Investment Operations | |
| Net investment income (loss)B | .02 |
| Net realized and unrealized gain (loss) | (.02) |
| Total from investment operations | – |
| Net asset value, end of period | $10.00 |
| Total ReturnC | –% |
| Ratios to Average Net AssetsD | |
| Expenses before reductions | .43%E |
| Expenses net of fee waivers, if any | .43%E |
| Expenses net of all reductions | .43%E |
| Net investment income (loss) | 2.38%E |
| Supplemental Data | |
| Net assets, end of period (000 omitted) | $100 |
| Portfolio turnover rateF | 0%G,H |
A For the period August 31, 2018 (commencement of operations) to September 30, 2018.
B Calculated based on average shares outstanding during the period.
C Total returns for periods of less than one year are not annualized.
D Expense ratios reflect operating expenses of the class. Expenses before reductions do not reflect amounts reimbursed by the investment adviser or reductions from expense offset arrangements and do not represent the amount paid by the class during periods when reimbursements or reductions occur. Expense ratios before reductions for start-up periods may not be representative of longer-term operating periods. Expenses net of fee waivers reflect expenses after reimbursement by the investment adviser but prior to reductions from expense offset arrangements. Expenses net of all reductions represent the net expenses paid by the class but do not include expenses of the underlying funds in which the Fund invests.
E Annualized
F Amounts do not include the activity of the Underlying Funds.
G Amount represents less than 1%.
H Amount not annualized.
See accompanying notes which are an integral part of the financial statements.
Fidelity Freedom Blend 2035 Fund Class K6
| | Six months ended (Unaudited) September 30, |
| | 2018 A |
| Selected Per–Share Data | |
| Net asset value, beginning of period | $10.00 |
| Income from Investment Operations | |
| Net investment income (loss)B | .02 |
| Net realized and unrealized gain (loss) | (.02) |
| Total from investment operations | – |
| Net asset value, end of period | $10.00 |
| Total ReturnC | –% |
| Ratios to Average Net AssetsD | |
| Expenses before reductions | .33%E |
| Expenses net of fee waivers, if any | .33%E |
| Expenses net of all reductions | .33%E |
| Net investment income (loss) | 2.48%E |
| Supplemental Data | |
| Net assets, end of period (000 omitted) | $100 |
| Portfolio turnover rateF | 0%G,H |
A For the period August 31, 2018 (commencement of operations) to September 30, 2018.
B Calculated based on average shares outstanding during the period.
C Total returns for periods of less than one year are not annualized.
D Expense ratios reflect operating expenses of the class. Expenses before reductions do not reflect amounts reimbursed by the investment adviser or reductions from expense offset arrangements and do not represent the amount paid by the class during periods when reimbursements or reductions occur. Expenses net of fee waivers reflect expenses after reimbursement by the investment adviser but prior to reductions from expense offset arrangements. Expenses net of all reductions represent the net expenses paid by the class but do not include expenses of the underlying funds in which the Fund invests.
E Annualized
F Amounts do not include the activity of the Underlying Funds.
G Amount represents less than 1%.
H Amount not annualized.
See accompanying notes which are an integral part of the financial statements.
Fidelity Freedom Blend 2035 Fund Class I
| | Six months ended (Unaudited) September 30, |
| | 2018 A |
| Selected Per–Share Data | |
| Net asset value, beginning of period | $10.00 |
| Income from Investment Operations | |
| Net investment income (loss)B | .02 |
| Net realized and unrealized gain (loss) | (.02) |
| Total from investment operations | – |
| Net asset value, end of period | $10.00 |
| Total ReturnC | –% |
| Ratios to Average Net AssetsD | |
| Expenses before reductions | .53%E |
| Expenses net of fee waivers, if any | .53%E |
| Expenses net of all reductions | .53%E |
| Net investment income (loss) | 2.28%E |
| Supplemental Data | |
| Net assets, end of period (000 omitted) | $100 |
| Portfolio turnover rateF | 0%G,H |
A For the period August 31, 2018 (commencement of operations) to September 30, 2018.
B Calculated based on average shares outstanding during the period.
C Total returns for periods of less than one year are not annualized.
D Expense ratios reflect operating expenses of the class. Expenses before reductions do not reflect amounts reimbursed by the investment adviser or reductions from expense offset arrangements and do not represent the amount paid by the class during periods when reimbursements or reductions occur. Expense ratios before reductions for start-up periods may not be representative of longer-term operating periods. Expenses net of fee waivers reflect expenses after reimbursement by the investment adviser but prior to reductions from expense offset arrangements. Expenses net of all reductions represent the net expenses paid by the class but do not include expenses of the underlying funds in which the Fund invests.
E Annualized
F Amounts do not include the activity of the Underlying Funds.
G Amount represents less than 1%.
H Amount not annualized.
See accompanying notes which are an integral part of the financial statements.
Fidelity Freedom Blend 2035 Fund Class Z
| | Six months ended (Unaudited) September 30, |
| | 2018 A |
| Selected Per–Share Data | |
| Net asset value, beginning of period | $10.00 |
| Income from Investment Operations | |
| Net investment income (loss)B | .02 |
| Net realized and unrealized gain (loss) | (.02) |
| Total from investment operations | – |
| Net asset value, end of period | $10.00 |
| Total ReturnC | –% |
| Ratios to Average Net AssetsD | |
| Expenses before reductions | .43%E |
| Expenses net of fee waivers, if any | .43%E |
| Expenses net of all reductions | .43%E |
| Net investment income (loss) | 2.38%E |
| Supplemental Data | |
| Net assets, end of period (000 omitted) | $100 |
| Portfolio turnover rateF | 0%G,H |
A For the period August 31, 2018 (commencement of operations) to September 30, 2018.
B Calculated based on average shares outstanding during the period.
C Total returns for periods of less than one year are not annualized.
D Expense ratios reflect operating expenses of the class. Expenses before reductions do not reflect amounts reimbursed by the investment adviser or reductions from expense offset arrangements and do not represent the amount paid by the class during periods when reimbursements or reductions occur. Expense ratios before reductions for start-up periods may not be representative of longer-term operating periods. Expenses net of fee waivers reflect expenses after reimbursement by the investment adviser but prior to reductions from expense offset arrangements. Expenses net of all reductions represent the net expenses paid by the class but do not include expenses of the underlying funds in which the Fund invests.
E Annualized
F Amounts do not include the activity of the Underlying Funds.
G Amount represents less than 1%.
H Amount not annualized.
See accompanying notes which are an integral part of the financial statements.
Fidelity Freedom Blend 2035 Fund Class Z6
| | Six months ended (Unaudited) September 30, |
| | 2018 A |
| Selected Per–Share Data | |
| Net asset value, beginning of period | $10.00 |
| Income from Investment Operations | |
| Net investment income (loss)B | .02 |
| Net realized and unrealized gain (loss) | (.02) |
| Total from investment operations | – |
| Net asset value, end of period | $10.00 |
| Total ReturnC | –% |
| Ratios to Average Net AssetsD | |
| Expenses before reductions | .33%E |
| Expenses net of fee waivers, if any | .33%E |
| Expenses net of all reductions | .33%E |
| Net investment income (loss) | 2.48%E |
| Supplemental Data | |
| Net assets, end of period (000 omitted) | $100 |
| Portfolio turnover rateF | 0%G,H |
A For the period August 31, 2018 (commencement of operations) to September 30, 2018.
B Calculated based on average shares outstanding during the period.
C Total returns for periods of less than one year are not annualized.
D Expense ratios reflect operating expenses of the class. Expenses before reductions do not reflect amounts reimbursed by the investment adviser or reductions from expense offset arrangements and do not represent the amount paid by the class during periods when reimbursements or reductions occur. Expenses net of fee waivers reflect expenses after reimbursement by the investment adviser but prior to reductions from expense offset arrangements. Expenses net of all reductions represent the net expenses paid by the class but do not include expenses of the underlying funds in which the Fund invests.
E Annualized
F Amounts do not include the activity of the Underlying Funds.
G Amount represents less than 1%.
H Amount not annualized.
See accompanying notes which are an integral part of the financial statements.
Fidelity Freedom® Blend 2040 Fund
Investment Summary (Unaudited)
The information in the following tables is based on the direct investments of the Fund.
Top Holdings as of September 30, 2018
| | % of fund's net assets |
| Fidelity Series Large Cap Value Index Fund | 17.8 |
| Fidelity Series Blue Chip Growth Fund | 12.2 |
| Fidelity Series Large Cap Growth Index Fund | 9.5 |
| Fidelity Series Large Cap Stock Fund | 9.5 |
| Fidelity Series Emerging Markets Opportunities Fund | 8.4 |
| Fidelity Series International Value Fund | 8.2 |
| Fidelity Series International Growth Fund | 8.0 |
| Fidelity Series Value Discovery Fund | 5.6 |
| Fidelity Series Small Cap Opportunities Fund | 4.7 |
| Fidelity Series Long-Term Treasury Bond Index Fund | 3.5 |
| | 87.4 |
Asset Allocation (% of fund's net assets)
| Period end |
| | Domestic Equity Funds | 61.3% |
| | International Equity Funds | 30.5% |
| | Bond Funds | 6.9% |
| | Short-Term Funds | 1.3% |

Domestic Equity Funds category includes Fidelity Series Commodity Strategy Fund which invests in commodity-related investments.
Fidelity Freedom® Blend 2040 Fund
Schedule of Investments September 30, 2018 (Unaudited)
Showing Percentage of Net Assets
| Domestic Equity Funds - 61.3% | | | |
| | | Shares | Value |
| Fidelity Series Blue Chip Growth Fund (a) | | 7,292 | $111,574 |
| Fidelity Series Commodity Strategy Fund (a) | | 3,741 | 18,707 |
| Fidelity Series Large Cap Growth Index Fund (a) | | 8,440 | 87,608 |
| Fidelity Series Large Cap Stock Fund (a) | | 5,495 | 87,529 |
| Fidelity Series Large Cap Value Index Fund (a) | | 12,410 | 163,809 |
| Fidelity Series Small Cap Opportunities Fund (a) | | 2,900 | 42,598 |
| Fidelity Series Value Discovery Fund (a) | | 3,775 | 51,684 |
| TOTAL DOMESTIC EQUITY FUNDS | | | |
| (Cost $577,618) | | | 563,509 |
|
| International Equity Funds - 30.5% | | | |
| Fidelity Series Canada Fund (a) | | 712 | 7,696 |
| Fidelity Series Emerging Markets Fund (a) | | 877 | 8,501 |
| Fidelity Series Emerging Markets Opportunities Fund (a) | | 4,019 | 77,131 |
| Fidelity Series International Growth Fund (a) | | 4,462 | 73,173 |
| Fidelity Series International Index Fund (a) | | 1,899 | 19,468 |
| Fidelity Series International Small Cap Fund (a) | | 1,075 | 19,235 |
| Fidelity Series International Value Fund (a) | | 7,135 | 75,056 |
| TOTAL INTERNATIONAL EQUITY FUNDS | | | |
| (Cost $278,767) | | | 280,260 |
|
| Bond Funds - 6.9% | | | |
| Fidelity Series Corporate Bond Fund (a) | | 94 | 933 |
| Fidelity Series Emerging Markets Debt Fund (a) | | 593 | 5,656 |
| Fidelity Series Floating Rate High Income Fund (a) | | 243 | 2,310 |
| Fidelity Series Government Bond Index Fund (a) | | 129 | 1,273 |
| Fidelity Series High Income Fund (a) | | 1,249 | 12,004 |
| Fidelity Series Inflation-Protected Bond Index Fund (a) | | 282 | 2,734 |
| Fidelity Series Investment Grade Bond Fund (a) | | 126 | 1,369 |
| Fidelity Series Investment Grade Securitized Fund (a) | | 99 | 986 |
| Fidelity Series Long-Term Treasury Bond Index Fund (a) | | 3,846 | 31,692 |
| Fidelity Series Real Estate Income Fund (a) | | 398 | 4,295 |
| TOTAL BOND FUNDS | | | |
| (Cost $64,233) | | | 63,252 |
|
| Short-Term Funds - 1.3% | | | |
| Fidelity Cash Central Fund, 2.11% (b) | | 49 | 49 |
| Fidelity Series Government Money Market Fund 2.12% (a)(c) | | 2,389 | 2,389 |
| Fidelity Series Short-Term Credit Fund (a) | | 242 | 2,385 |
| Fidelity Series Treasury Bill Index Fund (a) | | 726 | 7,261 |
| TOTAL SHORT-TERM FUNDS | | | |
| (Cost $12,089) | | | 12,084 |
| TOTAL INVESTMENT IN SECURITIES - 100.0% | | | |
| (Cost $932,707) | | | 919,105 |
| NET OTHER ASSETS (LIABILITIES) - 0.0% | | | (337) |
| NET ASSETS - 100% | | | $918,768 |
Legend
(a) Affiliated Fund
(b) Affiliated fund that is generally available only to investment companies and other accounts managed by Fidelity Investments. The rate quoted is the annualized seven-day yield of the fund at period end. A complete unaudited listing of the fund's holdings as of its most recent quarter end is available upon request. In addition, each Fidelity Central Fund's financial statements are available on the SEC's website or upon request.
(c) The rate quoted is the annualized seven-day yield of the fund at period end.
Affiliated Central Funds
Information regarding fiscal year to date income earned by the Fund from investments in Fidelity Central Funds is as follows:
| Fund | Income earned |
| Fidelity Cash Central Fund | $195 |
| Total | $195 |
Amounts in the income column in the above table include any capital gain distributions from underlying funds, which are presented in the corresponding line-item in the Statement of Operations if applicable.
Affiliated Underlying Funds
Fiscal year to date information regarding the Fund's investments in affiliated Underlying Funds, excluding any Money Market Central Funds, is presented below. Exchanges between classes of the same affiliated Underlying Funds may occur.
| Affiliate | Value, beginning of period | Purchases | Sales Proceeds | Dividend Income | Realized Gain (loss) | Change in Unrealized appreciation (depreciation) | Value, end of period |
| Fidelity Series Blue Chip Growth Fund | $-- | $121,933 | $3 | $10,349 | $-- | $(10,356) | $111,574 |
| Fidelity Series Canada Fund | -- | 7,708 | -- | -- | -- | (12) | 7,696 |
| Fidelity Series Commodity Strategy Fund | -- | 19,472 | -- | 1,120 | -- | (765) | 18,707 |
| Fidelity Series Corporate Bond Fund | -- | 938 | -- | 3 | -- | (5) | 933 |
| Fidelity Series Emerging Markets Debt Fund | -- | 5,531 | -- | 28 | -- | 125 | 5,656 |
| Fidelity Series Emerging Markets Fund | -- | 8,626 | -- | -- | -- | (125) | 8,501 |
| Fidelity Series Emerging Markets Opportunities Fund | -- | 77,264 | 2 | -- | -- | (131) | 77,131 |
| Fidelity Series Floating Rate High Income Fund | -- | 2,303 | -- | 10 | -- | 7 | 2,310 |
| Fidelity Series Government Bond Index Fund | -- | 1,287 | -- | 3 | -- | (14) | 1,273 |
| Fidelity Series Government Money Market Fund 2.12% | -- | 2,389 | -- | 4 | -- | -- | 2,389 |
| Fidelity Series High Income Fund | -- | 11,979 | -- | 56 | -- | 25 | 12,004 |
| Fidelity Series Inflation-Protected Bond Index Fund | -- | 2,753 | -- | 1 | -- | (19) | 2,734 |
| Fidelity Series International Growth Fund | -- | 73,319 | 2 | -- | -- | (144) | 73,173 |
| Fidelity Series International Index Fund | -- | 19,269 | -- | -- | -- | 199 | 19,468 |
| Fidelity Series International Small Cap Fund | -- | 19,269 | -- | -- | -- | (34) | 19,235 |
| Fidelity Series International Value Fund | -- | 73,318 | 2 | -- | -- | 1,740 | 75,056 |
| Fidelity Series Investment Grade Bond Fund | -- | 1,379 | -- | 3 | -- | (10) | 1,369 |
| Fidelity Series Investment Grade Securitized Fund | -- | 1,011 | 17 | 2 | -- | (8) | 986 |
| Fidelity Series Large Cap Growth Index Fund | -- | 87,083 | 3 | -- | -- | 528 | 87,608 |
| Fidelity Series Large Cap Stock Fund | -- | 87,083 | 3 | -- | -- | 449 | 87,529 |
| Fidelity Series Large Cap Value Index Fund | -- | 163,432 | 4 | -- | -- | 381 | 163,809 |
| Fidelity Series Long-Term Treasury Bond Index Fund | -- | 32,645 | 1 | 77 | -- | (952) | 31,692 |
| Fidelity Series Real Estate Income Fund | -- | 4,424 | -- | 112 | -- | (129) | 4,295 |
| Fidelity Series Short-Term Credit Fund | -- | 2,390 | -- | 5 | -- | (5) | 2,385 |
| Fidelity Series Small Cap Opportunities Fund | -- | 46,877 | 1 | 3,290 | -- | (4,278) | 42,598 |
| Fidelity Series Treasury Bill Index Fund | -- | 7,261 | -- | 13 | -- | -- | 7,261 |
| Fidelity Series Value Discovery Fund | -- | 51,754 | 1 | -- | -- | (69) | 51,684 |
| Total | $-- | $932,697 | $39 | $15,076 | $-- | $(13,602) | $919,056 |
Amounts in the income column in the above table include any capital gain distributions from underlying funds, which are presented in the corresponding line-item in the Statement of Operations if applicable.
Investment Valuation
All investments are categorized as Level 1 under the Fair Value Hierarchy. The inputs or methodology used for valuing securities may not be an indication of the risk associated with investing in those securities. For more information on valuation inputs please refer to the Investment Valuation section in the accompanying Notes to Financial Statements.
See accompanying notes which are an integral part of the financial statements.
Fidelity Freedom® Blend 2040 Fund
Financial Statements
Statement of Assets and Liabilities
| | | September 30, 2018 (Unaudited) |
| Assets | | |
Investment in securities, at value — See accompanying schedule:
| | |
| Fidelity Central Funds (cost $49) | $49 | |
| Other affiliated issuers (cost $932,658) | 919,056 | |
| Total Investment in Securities (cost $932,707) | | $919,105 |
| Receivable for investments sold | | 17 |
| Distributions receivable from Fidelity Central Funds | | 149 |
| Total assets | | 919,271 |
| Liabilities | | |
| Accrued management fee | 358 | |
| Distribution and service plan fees payable | 145 | |
| Total liabilities | | 503 |
| Net Assets | | $918,768 |
| Net Assets consist of: | | |
| Paid in capital | | $917,625 |
| Undistributed net investment income | | 1,739 |
| Accumulated undistributed net realized gain (loss) on investments | | 13,006 |
| Net unrealized appreciation (depreciation) on investments | | (13,602) |
| Net Assets | | $918,768 |
| Calculation of Maximum Offering Price | | |
| Class A: | | |
| Net Asset Value and redemption price per share ($100,085 ÷ 10,000 shares) | | $10.01 |
| Maximum offering price per share (100/94.25 of $10.01) | | $10.62 |
| Class M: | | |
| Net Asset Value and redemption price per share ($100,063 ÷ 10,000 shares) | | $10.01 |
| Maximum offering price per share (100/96.50 of $10.01) | | $10.37 |
| Class C: | | |
| Net Asset Value and offering price per share ($100,020 ÷ 10,000 shares)(a) | | $10.00 |
| Fidelity Freedom Blend 2040 Fund: | | |
| Net Asset Value, offering price and redemption price per share ($118,015 ÷ 11,789 shares) | | $10.01 |
| Class K: | | |
| Net Asset Value, offering price and redemption price per share ($100,115 ÷ 10,000 shares) | | $10.01 |
| Class K6: | | |
| Net Asset Value, offering price and redemption price per share ($100,115 ÷ 10,000 shares) | | $10.01 |
| Class I: | | |
| Net Asset Value, offering price and redemption price per share ($100,107 ÷ 10,000 shares) | | $10.01 |
| Class Z: | | |
| Net Asset Value, offering price and redemption price per share ($100,124 ÷ 10,000 shares) | | $10.01 |
| Class Z6: | | |
| Net Asset Value, offering price and redemption price per share ($100,124 ÷ 10,000 shares) | | $10.01 |
(a) Redemption price per share is equal to net asset value less any applicable contingent deferred sales charge.
See accompanying notes which are an integral part of the financial statements.
Statement of Operations
| | | For the period
August 31, 2018 (commencement of operations) to
September 30, 2018 (Unaudited) |
| Investment Income | | |
| Dividends: | | |
| Affiliated issuers | | $2,070 |
| Income from Fidelity Central Funds | | 195 |
| Total income | | 2,265 |
| Expenses | | |
| Management fee | $374 | |
| Distribution and service plan fees | 152 | |
| Total expenses | | 526 |
| Net investment income (loss) | | 1,739 |
| Realized and Unrealized Gain (Loss) | | |
| Net realized gain (loss) on: | | |
| Capital gain distributions from underlying funds: | | |
| Affiliated issuers | 13,006 | |
| Total net realized gain (loss) | | 13,006 |
| Change in net unrealized appreciation (depreciation) on: | | |
| Investment securities: | | |
| Affiliated issuers | (13,602) | |
| Total change in net unrealized appreciation (depreciation) | | (13,602) |
| Net gain (loss) | | (596) |
| Net increase (decrease) in net assets resulting from operations | | $1,143 |
See accompanying notes which are an integral part of the financial statements.
Statement of Changes in Net Assets
| | For the period
August 31, 2018 (commencement of operations) to
September 30, 2018 (Unaudited) |
| Increase (Decrease) in Net Assets | |
| Operations | |
| Net investment income (loss) | $1,739 |
| Net realized gain (loss) | 13,006 |
| Change in net unrealized appreciation (depreciation) | (13,602) |
| Net increase (decrease) in net assets resulting from operations | 1,143 |
| Share transactions - net increase (decrease) | 917,625 |
| Total increase (decrease) in net assets | 918,768 |
| Net Assets | |
| Beginning of period | – |
| End of period | $918,768 |
| Other Information | |
| Undistributed net investment income end of period | $1,739 |
See accompanying notes which are an integral part of the financial statements.
Financial Highlights
Fidelity Freedom Blend 2040 Fund Class A
| | Six months ended (Unaudited) September 30, |
| | 2018 A |
| Selected Per–Share Data | |
| Net asset value, beginning of period | $10.00 |
| Income from Investment Operations | |
| Net investment income (loss)B | .02 |
| Net realized and unrealized gain (loss) | (.01) |
| Total from investment operations | .01 |
| Net asset value, end of period | $10.01 |
| Total ReturnC,D | .10% |
| Ratios to Average Net AssetsE | |
| Expenses before reductions | .79%F |
| Expenses net of fee waivers, if any | .79%F |
| Expenses net of all reductions | .79%F |
| Net investment income (loss) | 2.08%F |
| Supplemental Data | |
| Net assets, end of period (000 omitted) | $100 |
| Portfolio turnover rateG | 0%H,I |
A For the period August 31, 2018 (commencement of operations) to September 30, 2018.
B Calculated based on average shares outstanding during the period.
C Total returns for periods of less than one year are not annualized.
D Total returns do not include the effect of the sales charges.
E Expense ratios reflect operating expenses of the class. Expenses before reductions do not reflect amounts reimbursed by the investment adviser or reductions from expense offset arrangements and do not represent the amount paid by the class during periods when reimbursements or reductions occur. Expense ratios before reductions for start-up periods may not be representative of longer-term operating periods. Expenses net of fee waivers reflect expenses after reimbursement by the investment adviser but prior to reductions from expense offset arrangements. Expenses net of all reductions represent the net expenses paid by the class but do not include expenses of the underlying funds in which the Fund invests.
F Annualized
G Amounts do not include the activity of the Underlying Funds.
H Amount represents less than 1%.
I Amount not annualized.
See accompanying notes which are an integral part of the financial statements.
Fidelity Freedom Blend 2040 Fund Class M
| | Six months ended (Unaudited) September 30, |
| | 2018 A |
| Selected Per–Share Data | |
| Net asset value, beginning of period | $10.00 |
| Income from Investment Operations | |
| Net investment income (loss)B | .02 |
| Net realized and unrealized gain (loss) | (.01) |
| Total from investment operations | .01 |
| Net asset value, end of period | $10.01 |
| Total ReturnC,D | .10% |
| Ratios to Average Net AssetsE | |
| Expenses before reductions | 1.04%F |
| Expenses net of fee waivers, if any | 1.04%F |
| Expenses net of all reductions | 1.04%F |
| Net investment income (loss) | 1.83%F |
| Supplemental Data | |
| Net assets, end of period (000 omitted) | $100 |
| Portfolio turnover rateG | 0%H,I |
A For the period August 31, 2018 (commencement of operations) to September 30, 2018.
B Calculated based on average shares outstanding during the period.
C Total returns for periods of less than one year are not annualized.
D Total returns do not include the effect of the sales charges.
E Expense ratios reflect operating expenses of the class. Expenses before reductions do not reflect amounts reimbursed by the investment adviser or reductions from expense offset arrangements and do not represent the amount paid by the class during periods when reimbursements or reductions occur. Expense ratios before reductions for start-up periods may not be representative of longer-term operating periods. Expenses net of fee waivers reflect expenses after reimbursement by the investment adviser but prior to reductions from expense offset arrangements. Expenses net of all reductions represent the net expenses paid by the class but do not include expenses of the underlying funds in which the Fund invests.
F Annualized
G Amounts do not include the activity of the Underlying Funds.
H Amount represents less than 1%.
I Amount not annualized.
See accompanying notes which are an integral part of the financial statements.
Fidelity Freedom Blend 2040 Fund Class C
| | Six months ended (Unaudited) September 30, |
| | 2018 A |
| Selected Per–Share Data | |
| Net asset value, beginning of period | $10.00 |
| Income from Investment Operations | |
| Net investment income (loss)B | .01 |
| Net realized and unrealized gain (loss) | (.01) |
| Total from investment operations | – |
| Net asset value, end of period | $10.00 |
| Total ReturnC,D | –% |
| Ratios to Average Net AssetsE | |
| Expenses before reductions | 1.54%F |
| Expenses net of fee waivers, if any | 1.54%F |
| Expenses net of all reductions | 1.54%F |
| Net investment income (loss) | 1.33%F |
| Supplemental Data | |
| Net assets, end of period (000 omitted) | $100 |
| Portfolio turnover rateG | 0%H,I |
A For the period August 31, 2018 (commencement of operations) to September 30, 2018.
B Calculated based on average shares outstanding during the period.
C Total returns for periods of less than one year are not annualized.
D Total returns do not include the effect of the contingent deferred sales charge.
E Expense ratios reflect operating expenses of the class. Expenses before reductions do not reflect amounts reimbursed by the investment adviser or reductions from expense offset arrangements and do not represent the amount paid by the class during periods when reimbursements or reductions occur. Expense ratios before reductions for start-up periods may not be representative of longer-term operating periods. Expenses net of fee waivers reflect expenses after reimbursement by the investment adviser but prior to reductions from expense offset arrangements. Expenses net of all reductions represent the net expenses paid by the class but do not include expenses of the underlying funds in which the Fund invests.
F Annualized
G Amounts do not include the activity of the Underlying Funds.
H Amount represents less than 1%.
I Amount not annualized.
See accompanying notes which are an integral part of the financial statements.
Fidelity Freedom Blend 2040 Fund
| | Six months ended (Unaudited) September 30, |
| | 2018 A |
| Selected Per–Share Data | |
| Net asset value, beginning of period | $10.00 |
| Income from Investment Operations | |
| Net investment income (loss)B | .02 |
| Net realized and unrealized gain (loss) | (.01) |
| Total from investment operations | .01 |
| Net asset value, end of period | $10.01 |
| Total ReturnC | .10% |
| Ratios to Average Net AssetsD | |
| Expenses before reductions | .54%E |
| Expenses net of fee waivers, if any | .54%E |
| Expenses net of all reductions | .54%E |
| Net investment income (loss) | 2.33%E |
| Supplemental Data | |
| Net assets, end of period (000 omitted) | $118 |
| Portfolio turnover rateF | 0%G,H |
A For the period August 31, 2018 (commencement of operations) to September 30, 2018.
B Calculated based on average shares outstanding during the period.
C Total returns for periods of less than one year are not annualized.
D Expense ratios reflect operating expenses of the class. Expenses before reductions do not reflect amounts reimbursed by the investment adviser or reductions from expense offset arrangements and do not represent the amount paid by the class during periods when reimbursements or reductions occur. Expense ratios before reductions for start-up periods may not be representative of longer-term operating periods. Expenses net of fee waivers reflect expenses after reimbursement by the investment adviser but prior to reductions from expense offset arrangements. Expenses net of all reductions represent the net expenses paid by the class but do not include expenses of the underlying funds in which the Fund invests.
E Annualized
F Amounts do not include the activity of the Underlying Funds.
G Amount represents less than 1%.
H Amount not annualized.
See accompanying notes which are an integral part of the financial statements.
Fidelity Freedom Blend 2040 Fund Class K
| | Six months ended (Unaudited) September 30, |
| | 2018 A |
| Selected Per–Share Data | |
| Net asset value, beginning of period | $10.00 |
| Income from Investment Operations | |
| Net investment income (loss)B | .02 |
| Net realized and unrealized gain (loss) | (.01) |
| Total from investment operations | .01 |
| Net asset value, end of period | $10.01 |
| Total ReturnC | .10% |
| Ratios to Average Net AssetsD | |
| Expenses before reductions | .44%E |
| Expenses net of fee waivers, if any | .44%E |
| Expenses net of all reductions | .44%E |
| Net investment income (loss) | 2.43%E |
| Supplemental Data | |
| Net assets, end of period (000 omitted) | $100 |
| Portfolio turnover rateF | 0%G,H |
A For the period August 31, 2018 (commencement of operations) to September 30, 2018.
B Calculated based on average shares outstanding during the period.
C Total returns for periods of less than one year are not annualized.
D Expense ratios reflect operating expenses of the class. Expenses before reductions do not reflect amounts reimbursed by the investment adviser or reductions from expense offset arrangements and do not represent the amount paid by the class during periods when reimbursements or reductions occur. Expense ratios before reductions for start-up periods may not be representative of longer-term operating periods. Expenses net of fee waivers reflect expenses after reimbursement by the investment adviser but prior to reductions from expense offset arrangements. Expenses net of all reductions represent the net expenses paid by the class but do not include expenses of the underlying funds in which the Fund invests.
E Annualized
F Amounts do not include the activity of the Underlying Funds.
G Amount represents less than 1%.
H Amount not annualized.
See accompanying notes which are an integral part of the financial statements.
Fidelity Freedom Blend 2040 Fund Class K6
| | Six months ended (Unaudited) September 30, |
| | 2018 A |
| Selected Per–Share Data | |
| Net asset value, beginning of period | $10.00 |
| Income from Investment Operations | |
| Net investment income (loss)B | .02 |
| Net realized and unrealized gain (loss) | (.01) |
| Total from investment operations | .01 |
| Net asset value, end of period | $10.01 |
| Total ReturnC | .10% |
| Ratios to Average Net AssetsD | |
| Expenses before reductions | .35%E,F |
| Expenses net of fee waivers, if any | .35%E,F |
| Expenses net of all reductions | .35%E,F |
| Net investment income (loss) | 2.52%E |
| Supplemental Data | |
| Net assets, end of period (000 omitted) | $100 |
| Portfolio turnover rateG | 0%H,I |
A For the period August 31, 2018 (commencement of operations) to September 30, 2018.
B Calculated based on average shares outstanding during the period.
C Total returns for periods of less than one year are not annualized.
D Expense ratios reflect operating expenses of the class. Expenses before reductions do not reflect amounts reimbursed by the investment adviser or reductions from expense offset arrangements and do not represent the amount paid by the class during periods when reimbursements or reductions occur. Expenses net of fee waivers reflect expenses after reimbursement by the investment adviser but prior to reductions from expense offset arrangements. Expenses net of all reductions represent the net expenses paid by the class but do not include expenses of the underlying funds in which the Fund invests.
E Annualized
F On certain classes, the size and fluctuation of net assets and expense amounts may cause ratios to differ from contractual rates.
G Amounts do not include the activity of the Underlying Funds.
H Amount represents less than 1%.
I Amount not annualized.
See accompanying notes which are an integral part of the financial statements.
Fidelity Freedom Blend 2040 Fund Class I
| | Six months ended (Unaudited) September 30, |
| | 2018 A |
| Selected Per–Share Data | |
| Net asset value, beginning of period | $10.00 |
| Income from Investment Operations | |
| Net investment income (loss)B | .02 |
| Net realized and unrealized gain (loss) | (.01) |
| Total from investment operations | .01 |
| Net asset value, end of period | $10.01 |
| Total ReturnC | .10% |
| Ratios to Average Net AssetsD | |
| Expenses before reductions | .54%E |
| Expenses net of fee waivers, if any | .54%E |
| Expenses net of all reductions | .54%E |
| Net investment income (loss) | 2.33%E |
| Supplemental Data | |
| Net assets, end of period (000 omitted) | $100 |
| Portfolio turnover rateF | 0%G,H |
A For the period August 31, 2018 (commencement of operations) to September 30, 2018.
B Calculated based on average shares outstanding during the period.
C Total returns for periods of less than one year are not annualized.
D Expense ratios reflect operating expenses of the class. Expenses before reductions do not reflect amounts reimbursed by the investment adviser or reductions from expense offset arrangements and do not represent the amount paid by the class during periods when reimbursements or reductions occur. Expense ratios before reductions for start-up periods may not be representative of longer-term operating periods. Expenses net of fee waivers reflect expenses after reimbursement by the investment adviser but prior to reductions from expense offset arrangements. Expenses net of all reductions represent the net expenses paid by the class but do not include expenses of the underlying funds in which the Fund invests.
E Annualized
F Amounts do not include the activity of the Underlying Funds.
G Amount represents less than 1%.
H Amount not annualized.
See accompanying notes which are an integral part of the financial statements.
Fidelity Freedom Blend 2040 Fund Class Z
| | Six months ended (Unaudited) September 30, |
| | 2018 A |
| Selected Per–Share Data | |
| Net asset value, beginning of period | $10.00 |
| Income from Investment Operations | |
| Net investment income (loss)B | .02 |
| Net realized and unrealized gain (loss) | (.01) |
| Total from investment operations | .01 |
| Net asset value, end of period | $10.01 |
| Total ReturnC | .10% |
| Ratios to Average Net AssetsD | |
| Expenses before reductions | .44%E |
| Expenses net of fee waivers, if any | .44%E |
| Expenses net of all reductions | .44%E |
| Net investment income (loss) | 2.43%E |
| Supplemental Data | |
| Net assets, end of period (000 omitted) | $100 |
| Portfolio turnover rateF | 0%G,H |
A For the period August 31, 2018 (commencement of operations) to September 30, 2018.
B Calculated based on average shares outstanding during the period.
C Total returns for periods of less than one year are not annualized.
D Expense ratios reflect operating expenses of the class. Expenses before reductions do not reflect amounts reimbursed by the investment adviser or reductions from expense offset arrangements and do not represent the amount paid by the class during periods when reimbursements or reductions occur. Expense ratios before reductions for start-up periods may not be representative of longer-term operating periods. Expenses net of fee waivers reflect expenses after reimbursement by the investment adviser but prior to reductions from expense offset arrangements. Expenses net of all reductions represent the net expenses paid by the class but do not include expenses of the underlying funds in which the Fund invests.
E Annualized
F Amounts do not include the activity of the Underlying Funds.
G Amount represents less than 1%.
H Amount not annualized.
See accompanying notes which are an integral part of the financial statements.
Fidelity Freedom Blend 2040 Fund Class Z6
| | Six months ended (Unaudited) September 30, |
| | 2018 A |
| Selected Per–Share Data | |
| Net asset value, beginning of period | $10.00 |
| Income from Investment Operations | |
| Net investment income (loss)B | .02 |
| Net realized and unrealized gain (loss) | (.01) |
| Total from investment operations | .01 |
| Net asset value, end of period | $10.01 |
| Total ReturnC | .10% |
| Ratios to Average Net AssetsD | |
| Expenses before reductions | .35%E,F |
| Expenses net of fee waivers, if any | .35%E,F |
| Expenses net of all reductions | .35%E,F |
| Net investment income (loss) | 2.52%E |
| Supplemental Data | |
| Net assets, end of period (000 omitted) | $100 |
| Portfolio turnover rateG | 0%H,I |
A For the period August 31, 2018 (commencement of operations) to September 30, 2018.
B Calculated based on average shares outstanding during the period.
C Total returns for periods of less than one year are not annualized.
D Expense ratios reflect operating expenses of the class. Expenses before reductions do not reflect amounts reimbursed by the investment adviser or reductions from expense offset arrangements and do not represent the amount paid by the class during periods when reimbursements or reductions occur. Expenses net of fee waivers reflect expenses after reimbursement by the investment adviser but prior to reductions from expense offset arrangements. Expenses net of all reductions represent the net expenses paid by the class but do not include expenses of the underlying funds in which the Fund invests.
E Annualized
F On certain classes, the size and fluctuation of net assets and expense amounts may cause ratios to differ from contractual rates.
G Amounts do not include the activity of the Underlying Funds.
H Amount represents less than 1%.
I Amount not annualized.
See accompanying notes which are an integral part of the financial statements.
Fidelity Freedom® Blend 2045 Fund
Investment Summary (Unaudited)
The information in the following tables is based on the direct investments of the Fund.
Top Holdings as of September 30, 2018
| | % of fund's net assets |
| Fidelity Series Large Cap Value Index Fund | 17.8 |
| Fidelity Series Blue Chip Growth Fund | 12.2 |
| Fidelity Series Large Cap Growth Index Fund | 9.5 |
| Fidelity Series Large Cap Stock Fund | 9.5 |
| Fidelity Series Emerging Markets Opportunities Fund | 8.4 |
| Fidelity Series International Value Fund | 8.2 |
| Fidelity Series International Growth Fund | 8.0 |
| Fidelity Series Value Discovery Fund | 5.6 |
| Fidelity Series Small Cap Opportunities Fund | 4.7 |
| Fidelity Series Long-Term Treasury Bond Index Fund | 3.5 |
| | 87.4 |
Asset Allocation (% of fund's net assets)
| Period end |
| | Domestic Equity Funds | 61.3% |
| | International Equity Funds | 30.5% |
| | Bond Funds | 6.9% |
| | Short-Term Funds | 1.3% |

Domestic Equity Funds category includes Fidelity Series Commodity Strategy Fund which invests in commodity-related investments.
Fidelity Freedom® Blend 2045 Fund
Schedule of Investments September 30, 2018 (Unaudited)
Showing Percentage of Net Assets
| Domestic Equity Funds - 61.3% | | | |
| | | Shares | Value |
| Fidelity Series Blue Chip Growth Fund (a) | | 8,441 | $129,143 |
| Fidelity Series Commodity Strategy Fund (a) | | 4,324 | 21,621 |
| Fidelity Series Large Cap Growth Index Fund (a) | | 9,756 | 101,270 |
| Fidelity Series Large Cap Stock Fund (a) | | 6,343 | 101,040 |
| Fidelity Series Large Cap Value Index Fund (a) | | 14,321 | 189,040 |
| Fidelity Series Small Cap Opportunities Fund (a) | | 3,355 | 49,289 |
| Fidelity Series Value Discovery Fund (a) | | 4,360 | 59,694 |
| TOTAL DOMESTIC EQUITY FUNDS | | | |
| (Cost $665,480) | | | 651,097 |
|
| International Equity Funds - 30.5% | | | |
| Fidelity Series Canada Fund (a) | | 823 | 8,896 |
| Fidelity Series Emerging Markets Fund (a) | | 1,018 | 9,862 |
| Fidelity Series Emerging Markets Opportunities Fund (a) | | 4,657 | 89,369 |
| Fidelity Series International Growth Fund (a) | | 5,157 | 84,571 |
| Fidelity Series International Index Fund (a) | | 2,194 | 22,486 |
| Fidelity Series International Small Cap Fund (a) | | 1,242 | 22,239 |
| Fidelity Series International Value Fund (a) | | 8,232 | 86,601 |
| TOTAL INTERNATIONAL EQUITY FUNDS | | | |
| (Cost $322,021) | | | 324,024 |
|
| Bond Funds - 6.9% | | | |
| Fidelity Series Corporate Bond Fund (a) | | 109 | 1,079 |
| Fidelity Series Emerging Markets Debt Fund (a) | | 685 | 6,524 |
| Fidelity Series Floating Rate High Income Fund (a) | | 280 | 2,667 |
| Fidelity Series Government Bond Index Fund (a) | | 149 | 1,472 |
| Fidelity Series High Income Fund (a) | | 1,442 | 13,862 |
| Fidelity Series Inflation-Protected Bond Index Fund (a) | | 326 | 3,161 |
| Fidelity Series Investment Grade Bond Fund (a) | | 145 | 1,583 |
| Fidelity Series Investment Grade Securitized Fund (a) | | 115 | 1,140 |
| Fidelity Series Long-Term Treasury Bond Index Fund (a) | | 4,457 | 36,722 |
| Fidelity Series Real Estate Income Fund (a) | | 461 | 4,965 |
| TOTAL BOND FUNDS | | | |
| (Cost $74,170) | | | 73,175 |
|
| Short-Term Funds - 1.3% | | | |
| Fidelity Cash Central Fund, 2.11% (b) | | 49 | 49 |
| Fidelity Series Government Money Market Fund 2.12% (a)(c) | | 2,760 | 2,760 |
| Fidelity Series Short-Term Credit Fund (a) | | 279 | 2,756 |
| Fidelity Series Treasury Bill Index Fund (a) | | 839 | 8,386 |
| TOTAL SHORT-TERM FUNDS | | | |
| (Cost $13,955) | | | 13,951 |
| TOTAL INVESTMENT IN SECURITIES - 100.0% | | | |
| (Cost $1,075,626) | | | 1,062,247 |
| NET OTHER ASSETS (LIABILITIES) - 0.0% | | | (365) |
| NET ASSETS - 100% | | | $1,061,882 |
Legend
(a) Affiliated Fund
(b) Affiliated fund that is generally available only to investment companies and other accounts managed by Fidelity Investments. The rate quoted is the annualized seven-day yield of the fund at period end. A complete unaudited listing of the fund's holdings as of its most recent quarter end is available upon request. In addition, each Fidelity Central Fund's financial statements are available on the SEC's website or upon request.
(c) The rate quoted is the annualized seven-day yield of the fund at period end.
Affiliated Central Funds
Information regarding fiscal year to date income earned by the Fund from investments in Fidelity Central Funds is as follows:
| Fund | Income earned |
| Fidelity Cash Central Fund | $195 |
| Total | $195 |
Amounts in the income column in the above table include any capital gain distributions from underlying funds, which are presented in the corresponding line-item in the Statement of Operations if applicable.
Affiliated Underlying Funds
Fiscal year to date information regarding the Fund's investments in affiliated Underlying Funds, excluding any Money Market Central Funds, is presented below. Exchanges between classes of the same affiliated Underlying Funds may occur.
| Affiliate | Value, beginning of period | Purchases | Sales Proceeds | Dividend Income | Realized Gain (loss) | Change in Unrealized appreciation (depreciation) | Value, end of period |
| Fidelity Series Blue Chip Growth Fund | $-- | $139,620 | $3 | $10,726 | $-- | $(10,474) | $129,143 |
| Fidelity Series Canada Fund | -- | 8,904 | -- | -- | -- | (8) | 8,896 |
| Fidelity Series Commodity Strategy Fund | -- | 22,359 | -- | 1,159 | -- | (738) | 21,621 |
| Fidelity Series Corporate Bond Fund | -- | 1,084 | -- | 3 | -- | (5) | 1,079 |
| Fidelity Series Emerging Markets Debt Fund | -- | 6,387 | -- | 30 | -- | 137 | 6,524 |
| Fidelity Series Emerging Markets Fund | -- | 9,971 | -- | -- | -- | (109) | 9,862 |
| Fidelity Series Emerging Markets Opportunities Fund | -- | 89,318 | 2 | -- | -- | 53 | 89,369 |
| Fidelity Series Floating Rate High Income Fund | -- | 2,659 | -- | 11 | -- | 8 | 2,667 |
| Fidelity Series Government Bond Index Fund | -- | 1,487 | 1 | 3 | -- | (14) | 1,472 |
| Fidelity Series Government Money Market Fund 2.12% | -- | 2,760 | -- | 4 | -- | -- | 2,760 |
| Fidelity Series High Income Fund | -- | 13,834 | -- | 60 | -- | 28 | 13,862 |
| Fidelity Series Inflation-Protected Bond Index Fund | -- | 3,181 | -- | 1 | -- | (20) | 3,161 |
| Fidelity Series International Growth Fund | -- | 84,665 | 2 | -- | -- | (92) | 84,571 |
| Fidelity Series International Index Fund | -- | 22,252 | -- | -- | -- | 234 | 22,486 |
| Fidelity Series International Small Cap Fund | -- | 22,252 | -- | -- | -- | (13) | 22,239 |
| Fidelity Series International Value Fund | -- | 84,665 | 2 | -- | -- | 1,938 | 86,601 |
| Fidelity Series Investment Grade Bond Fund | -- | 1,593 | -- | 4 | -- | (10) | 1,583 |
| Fidelity Series Investment Grade Securitized Fund | -- | 1,168 | 20 | 2 | -- | (8) | 1,140 |
| Fidelity Series Large Cap Growth Index Fund | -- | 100,594 | 2 | -- | -- | 678 | 101,270 |
| Fidelity Series Large Cap Stock Fund | -- | 100,594 | 2 | -- | -- | 448 | 101,040 |
| Fidelity Series Large Cap Value Index Fund | -- | 188,787 | 6 | -- | -- | 259 | 189,040 |
| Fidelity Series Long-Term Treasury Bond Index Fund | -- | 37,704 | 1 | 82 | -- | (981) | 36,722 |
| Fidelity Series Real Estate Income Fund | -- | 5,094 | -- | 112 | -- | (129) | 4,965 |
| Fidelity Series Short-Term Credit Fund | -- | 2,761 | -- | 5 | -- | (5) | 2,756 |
| Fidelity Series Small Cap Opportunities Fund | -- | 53,757 | 1 | 3,407 | -- | (4,467) | 49,289 |
| Fidelity Series Treasury Bill Index Fund | -- | 8,386 | -- | 14 | -- | -- | 8,386 |
| Fidelity Series Value Discovery Fund | -- | 59,784 | 1 | -- | -- | (89) | 59,694 |
| Total | $-- | $1,075,620 | $43 | $15,623 | $-- | $(13,379) | $1,062,198 |
Amounts in the income column in the above table include any capital gain distributions from underlying funds, which are presented in the corresponding line-item in the Statement of Operations if applicable.
Investment Valuation
All investments are categorized as Level 1 under the Fair Value Hierarchy. The inputs or methodology used for valuing securities may not be an indication of the risk associated with investing in those securities. For more information on valuation inputs please refer to the Investment Valuation section in the accompanying Notes to Financial Statements.
See accompanying notes which are an integral part of the financial statements.
Fidelity Freedom® Blend 2045 Fund
Financial Statements
Statement of Assets and Liabilities
| | | September 30, 2018 (Unaudited) |
| Assets | | |
Investment in securities, at value — See accompanying schedule:
| | |
| Fidelity Central Funds (cost $49) | $49 | |
| Other affiliated issuers (cost $1,075,577) | 1,062,198 | |
| Total Investment in Securities (cost $1,075,626) | | $1,062,247 |
| Receivable for investments sold | | 21 |
| Distributions receivable from Fidelity Central Funds | | 147 |
| Total assets | | 1,062,415 |
| Liabilities | | |
| Accrued management fee | 386 | |
| Distribution and service plan fees payable | 147 | |
| Total liabilities | | 533 |
| Net Assets | | $1,061,882 |
| Net Assets consist of: | | |
| Paid in capital | | $1,059,999 |
| Undistributed net investment income | | 1,789 |
| Accumulated undistributed net realized gain (loss) on investments | | 13,473 |
| Net unrealized appreciation (depreciation) on investments | | (13,379) |
| Net Assets | | $1,061,882 |
| Calculation of Maximum Offering Price | | |
| Class A: | | |
| Net Asset Value and redemption price per share ($130,248 ÷ 13,013 shares) | | $10.01 |
| Maximum offering price per share (100/94.25 of $10.01) | | $10.62 |
| Class M: | | |
| Net Asset Value and redemption price per share ($100,066 ÷ 10,000 shares) | | $10.01 |
| Maximum offering price per share (100/96.50 of $10.01) | | $10.37 |
| Class C: | | |
| Net Asset Value and offering price per share ($100,022 ÷ 10,000 shares)(a) | | $10.00 |
| Fidelity Freedom Blend 2045 Fund: | | |
| Net Asset Value, offering price and redemption price per share ($230,947 ÷ 23,070 shares) | | $10.01 |
| Class K: | | |
| Net Asset Value, offering price and redemption price per share ($100,118 ÷ 10,000 shares) | | $10.01 |
| Class K6: | | |
| Net Asset Value, offering price and redemption price per share ($100,118 ÷ 10,000 shares) | | $10.01 |
| Class I: | | |
| Net Asset Value, offering price and redemption price per share ($100,109 ÷ 10,000 shares) | | $10.01 |
| Class Z: | | |
| Net Asset Value, offering price and redemption price per share ($100,127 ÷ 10,000 shares) | | $10.01 |
| Class Z6: | | |
| Net Asset Value, offering price and redemption price per share ($100,127 ÷ 10,000 shares) | | $10.01 |
(a) Redemption price per share is equal to net asset value less any applicable contingent deferred sales charge.
See accompanying notes which are an integral part of the financial statements.
Statement of Operations
| | | For the period
August 31, 2018 (commencement of operations) to
September 30, 2018 (Unaudited) |
| Investment Income | | |
| Dividends: | | |
| Affiliated issuers | | $2,150 |
| Income from Fidelity Central Funds | | 195 |
| Total income | | 2,345 |
| Expenses | | |
| Management fee | $402 | |
| Distribution and service plan fees | 154 | |
| Total expenses | | 556 |
| Net investment income (loss) | | 1,789 |
| Realized and Unrealized Gain (Loss) | | |
| Net realized gain (loss) on: | | |
| Capital gain distributions from underlying funds: | | |
| Affiliated issuers | 13,473 | |
| Total net realized gain (loss) | | 13,473 |
| Change in net unrealized appreciation (depreciation) on: | | |
| Investment securities: | | |
| Affiliated issuers | (13,379) | |
| Total change in net unrealized appreciation (depreciation) | | (13,379) |
| Net gain (loss) | | 94 |
| Net increase (decrease) in net assets resulting from operations | | $1,883 |
See accompanying notes which are an integral part of the financial statements.
Statement of Changes in Net Assets
| | For the period
August 31, 2018 (commencement of operations) to
September 30, 2018 (Unaudited) |
| Increase (Decrease) in Net Assets | |
| Operations | |
| Net investment income (loss) | $1,789 |
| Net realized gain (loss) | 13,473 |
| Change in net unrealized appreciation (depreciation) | (13,379) |
| Net increase (decrease) in net assets resulting from operations | 1,883 |
| Share transactions - net increase (decrease) | 1,059,999 |
| Total increase (decrease) in net assets | 1,061,882 |
| Net Assets | |
| Beginning of period | – |
| End of period | $1,061,882 |
| Other Information | |
| Undistributed net investment income end of period | $1,789 |
See accompanying notes which are an integral part of the financial statements.
Financial Highlights
Fidelity Freedom Blend 2045 Fund Class A
| | Six months ended (Unaudited) September 30, |
| | 2018 A |
| Selected Per–Share Data | |
| Net asset value, beginning of period | $10.00 |
| Income from Investment Operations | |
| Net investment income (loss)B | .02 |
| Net realized and unrealized gain (loss) | (.01)C |
| Total from investment operations | .01 |
| Net asset value, end of period | $10.01 |
| Total ReturnD,E | .10% |
| Ratios to Average Net AssetsF | |
| Expenses before reductions | .78%G,H |
| Expenses net of fee waivers, if any | .78%G,H |
| Expenses net of all reductions | .78%G,H |
| Net investment income (loss) | 2.02%G |
| Supplemental Data | |
| Net assets, end of period (000 omitted) | $130 |
| Portfolio turnover rateI | 0%J,K |
A For the period August 31, 2018 (commencement of operations) to September 30, 2018.
B Calculated based on average shares outstanding during the period.
C The amount shown for a share outstanding does not correspond with the aggregate net gain (loss) on investments for the period due to the timing of sales and repurchases of shares in relation to fluctuating market values of the investments of the Fund.
D Total returns for periods of less than one year are not annualized.
E Total returns do not include the effect of the sales charges.
F Expense ratios reflect operating expenses of the class. Expenses before reductions do not reflect amounts reimbursed by the investment adviser or reductions from expense offset arrangements and do not represent the amount paid by the class during periods when reimbursements or reductions occur. Expense ratios before reductions for start-up periods may not be representative of longer-term operating periods. Expenses net of fee waivers reflect expenses after reimbursement by the investment adviser but prior to reductions from expense offset arrangements. Expenses net of all reductions represent the net expenses paid by the class but do not include expenses of the underlying funds in which the Fund invests.
G Annualized
H On certain classes, the size and fluctuation of net assets and expense amounts may cause ratios to differ from contractual rates.
I Amounts do not include the activity of the Underlying Funds.
J Amount represents less than 1%.
K Amount not annualized.
See accompanying notes which are an integral part of the financial statements.
Fidelity Freedom Blend 2045 Fund Class M
| | Six months ended (Unaudited) September 30, |
| | 2018 A |
| Selected Per–Share Data | |
| Net asset value, beginning of period | $10.00 |
| Income from Investment Operations | |
| Net investment income (loss)B | .02 |
| Net realized and unrealized gain (loss) | (.01)C |
| Total from investment operations | .01 |
| Net asset value, end of period | $10.01 |
| Total ReturnD,E | .10% |
| Ratios to Average Net AssetsF | |
| Expenses before reductions | 1.05%G,H |
| Expenses net of fee waivers, if any | 1.05%G,H |
| Expenses net of all reductions | 1.05%G,H |
| Net investment income (loss) | 1.74%G |
| Supplemental Data | |
| Net assets, end of period (000 omitted) | $100 |
| Portfolio turnover rateI | 0%J,K |
A For the period August 31, 2018 (commencement of operations) to September 30, 2018.
B Calculated based on average shares outstanding during the period.
C The amount shown for a share outstanding does not correspond with the aggregate net gain (loss) on investments for the period due to the timing of sales and repurchases of shares in relation to fluctuating market values of the investments of the Fund.
D Total returns for periods of less than one year are not annualized.
E Total returns do not include the effect of the sales charges.
F Expense ratios reflect operating expenses of the class. Expenses before reductions do not reflect amounts reimbursed by the investment adviser or reductions from expense offset arrangements and do not represent the amount paid by the class during periods when reimbursements or reductions occur. Expense ratios before reductions for start-up periods may not be representative of longer-term operating periods. Expenses net of fee waivers reflect expenses after reimbursement by the investment adviser but prior to reductions from expense offset arrangements. Expenses net of all reductions represent the net expenses paid by the class but do not include expenses of the underlying funds in which the Fund invests.
G Annualized
H On certain classes, the size and fluctuation of net assets and expense amounts may cause ratios to differ from contractual rates.
I Amounts do not include the activity of the Underlying Funds.
J Amount represents less than 1%.
K Amount not annualized.
See accompanying notes which are an integral part of the financial statements.
Fidelity Freedom Blend 2045 Fund Class C
| | Six months ended (Unaudited) September 30, |
| | 2018 A |
| Selected Per–Share Data | |
| Net asset value, beginning of period | $10.00 |
| Income from Investment Operations | |
| Net investment income (loss)B | .01 |
| Net realized and unrealized gain (loss) | (.01)C |
| Total from investment operations | – |
| Net asset value, end of period | $10.00 |
| Total ReturnD,E | –% |
| Ratios to Average Net AssetsF | |
| Expenses before reductions | 1.55%G,H |
| Expenses net of fee waivers, if any | 1.55%G,H |
| Expenses net of all reductions | 1.55%G,H |
| Net investment income (loss) | 1.24%G |
| Supplemental Data | |
| Net assets, end of period (000 omitted) | $100 |
| Portfolio turnover rateI | 0%J,K |
A For the period August 31, 2018 (commencement of operations) to September 30, 2018.
B Calculated based on average shares outstanding during the period.
C The amount shown for a share outstanding does not correspond with the aggregate net gain (loss) on investments for the period due to the timing of sales and repurchases of shares in relation to fluctuating market values of the investments of the Fund.
D Total returns for periods of less than one year are not annualized.
E Total returns do not include the effect of the contingent deferred sales charge.
F Expense ratios reflect operating expenses of the class. Expenses before reductions do not reflect amounts reimbursed by the investment adviser or reductions from expense offset arrangements and do not represent the amount paid by the class during periods when reimbursements or reductions occur. Expense ratios before reductions for start-up periods may not be representative of longer-term operating periods. Expenses net of fee waivers reflect expenses after reimbursement by the investment adviser but prior to reductions from expense offset arrangements. Expenses net of all reductions represent the net expenses paid by the class but do not include expenses of the underlying funds in which the Fund invests.
G Annualized
H On certain classes, the size and fluctuation of net assets and expense amounts may cause ratios to differ from contractual rates.
I Amounts do not include the activity of the Underlying Funds.
J Amount represents less than 1%.
K Amount not annualized.
See accompanying notes which are an integral part of the financial statements.
Fidelity Freedom Blend 2045 Fund
| | Six months ended (Unaudited) September 30, |
| | 2018 A |
| Selected Per–Share Data | |
| Net asset value, beginning of period | $10.00 |
| Income from Investment Operations | |
| Net investment income (loss)B | .02 |
| Net realized and unrealized gain (loss) | (.01)C |
| Total from investment operations | .01 |
| Net asset value, end of period | $10.01 |
| Total ReturnD | .10% |
| Ratios to Average Net AssetsE | |
| Expenses before reductions | .55%F,G |
| Expenses net of fee waivers, if any | .55%F,G |
| Expenses net of all reductions | .55%F,G |
| Net investment income (loss) | 2.24%F |
| Supplemental Data | |
| Net assets, end of period (000 omitted) | $231 |
| Portfolio turnover rateH | 0%I,J |
A For the period August 31, 2018 (commencement of operations) to September 30, 2018.
B Calculated based on average shares outstanding during the period.
C The amount shown for a share outstanding does not correspond with the aggregate net gain (loss) on investments for the period due to the timing of sales and repurchases of shares in relation to fluctuating market values of the investments of the Fund.
D Total returns for periods of less than one year are not annualized.
E Expense ratios reflect operating expenses of the class. Expenses before reductions do not reflect amounts reimbursed by the investment adviser or reductions from expense offset arrangements and do not represent the amount paid by the class during periods when reimbursements or reductions occur. Expense ratios before reductions for start-up periods may not be representative of longer-term operating periods. Expenses net of fee waivers reflect expenses after reimbursement by the investment adviser but prior to reductions from expense offset arrangements. Expenses net of all reductions represent the net expenses paid by the class but do not include expenses of the underlying funds in which the Fund invests.
F Annualized
G On certain classes, the size and fluctuation of net assets and expense amounts may cause ratios to differ from contractual rates.
H Amounts do not include the activity of the Underlying Funds.
I Amount represents less than 1%.
J Amount not annualized.
See accompanying notes which are an integral part of the financial statements.
Fidelity Freedom Blend 2045 Fund Class K
| | Six months ended (Unaudited) September 30, |
| | 2018 A |
| Selected Per–Share Data | |
| Net asset value, beginning of period | $10.00 |
| Income from Investment Operations | |
| Net investment income (loss)B | .02 |
| Net realized and unrealized gain (loss) | (.01)C |
| Total from investment operations | .01 |
| Net asset value, end of period | $10.01 |
| Total ReturnD | .10% |
| Ratios to Average Net AssetsE | |
| Expenses before reductions | .44%F |
| Expenses net of fee waivers, if any | .44%F |
| Expenses net of all reductions | .44%F |
| Net investment income (loss) | 2.35%F |
| Supplemental Data | |
| Net assets, end of period (000 omitted) | $100 |
| Portfolio turnover rateG | 0%H,I |
A For the period August 31, 2018 (commencement of operations) to September 30, 2018.
B Calculated based on average shares outstanding during the period.
C The amount shown for a share outstanding does not correspond with the aggregate net gain (loss) on investments for the period due to the timing of sales and repurchases of shares in relation to fluctuating market values of the investments of the Fund.
D Total returns for periods of less than one year are not annualized.
E Expense ratios reflect operating expenses of the class. Expenses before reductions do not reflect amounts reimbursed by the investment adviser or reductions from expense offset arrangements and do not represent the amount paid by the class during periods when reimbursements or reductions occur. Expense ratios before reductions for start-up periods may not be representative of longer-term operating periods. Expenses net of fee waivers reflect expenses after reimbursement by the investment adviser but prior to reductions from expense offset arrangements. Expenses net of all reductions represent the net expenses paid by the class but do not include expenses of the underlying funds in which the Fund invests.
F Annualized
G Amounts do not include the activity of the Underlying Funds.
H Amount represents less than 1%.
I Amount not annualized.
See accompanying notes which are an integral part of the financial statements.
Fidelity Freedom Blend 2045 Fund Class K6
| | Six months ended (Unaudited) September 30, |
| | 2018 A |
| Selected Per–Share Data | |
| Net asset value, beginning of period | $10.00 |
| Income from Investment Operations | |
| Net investment income (loss)B | .02 |
| Net realized and unrealized gain (loss) | (.01)C |
| Total from investment operations | .01 |
| Net asset value, end of period | $10.01 |
| Total ReturnD | .10% |
| Ratios to Average Net AssetsE | |
| Expenses before reductions | .33%F,G |
| Expenses net of fee waivers, if any | .33%F,G |
| Expenses net of all reductions | .33%F,G |
| Net investment income (loss) | 2.46%F |
| Supplemental Data | |
| Net assets, end of period (000 omitted) | $100 |
| Portfolio turnover rateH | 0%I,J |
A For the period August 31, 2018 (commencement of operations) to September 30, 2018.
B Calculated based on average shares outstanding during the period.
C The amount shown for a share outstanding does not correspond with the aggregate net gain (loss) on investments for the period due to the timing of sales and repurchases of shares in relation to fluctuating market values of the investments of the Fund.
D Total returns for periods of less than one year are not annualized.
E Expense ratios reflect operating expenses of the class. Expenses before reductions do not reflect amounts reimbursed by the investment adviser or reductions from expense offset arrangements and do not represent the amount paid by the class during periods when reimbursements or reductions occur. Expenses net of fee waivers reflect expenses after reimbursement by the investment adviser but prior to reductions from expense offset arrangements. Expenses net of all reductions represent the net expenses paid by the class but do not include expenses of the underlying funds in which the Fund invests.
F Annualized
G On certain classes, the size and fluctuation of net assets and expense amounts may cause ratios to differ from contractual rates.
H Amounts do not include the activity of the Underlying Funds.
I Amount represents less than 1%.
J Amount not annualized.
See accompanying notes which are an integral part of the financial statements.
Fidelity Freedom Blend 2045 Fund Class I
| | Six months ended (Unaudited) September 30, |
| | 2018 A |
| Selected Per–Share Data | |
| Net asset value, beginning of period | $10.00 |
| Income from Investment Operations | |
| Net investment income (loss)B | .02 |
| Net realized and unrealized gain (loss) | (.01)C |
| Total from investment operations | .01 |
| Net asset value, end of period | $10.01 |
| Total ReturnD | .10% |
| Ratios to Average Net AssetsE | |
| Expenses before reductions | .54%F |
| Expenses net of fee waivers, if any | .54%F |
| Expenses net of all reductions | .54%F |
| Net investment income (loss) | 2.25%F |
| Supplemental Data | |
| Net assets, end of period (000 omitted) | $100 |
| Portfolio turnover rateG | 0%H,I |
A For the period August 31, 2018 (commencement of operations) to September 30, 2018.
B Calculated based on average shares outstanding during the period.
C The amount shown for a share outstanding does not correspond with the aggregate net gain (loss) on investments for the period due to the timing of sales and repurchases of shares in relation to fluctuating market values of the investments of the Fund.
D Total returns for periods of less than one year are not annualized.
E Expense ratios reflect operating expenses of the class. Expenses before reductions do not reflect amounts reimbursed by the investment adviser or reductions from expense offset arrangements and do not represent the amount paid by the class during periods when reimbursements or reductions occur. Expense ratios before reductions for start-up periods may not be representative of longer-term operating periods. Expenses net of fee waivers reflect expenses after reimbursement by the investment adviser but prior to reductions from expense offset arrangements. Expenses net of all reductions represent the net expenses paid by the class but do not include expenses of the underlying funds in which the Fund invests.
F Annualized
G Amounts do not include the activity of the Underlying Funds.
H Amount represents less than 1%.
I Amount not annualized.
See accompanying notes which are an integral part of the financial statements.
Fidelity Freedom Blend 2045 Fund Class Z
| | Six months ended (Unaudited) September 30, |
| | 2018 A |
| Selected Per–Share Data | |
| Net asset value, beginning of period | $10.00 |
| Income from Investment Operations | |
| Net investment income (loss)B | .02 |
| Net realized and unrealized gain (loss) | (.01)C |
| Total from investment operations | .01 |
| Net asset value, end of period | $10.01 |
| Total ReturnD | .10% |
| Ratios to Average Net AssetsE | |
| Expenses before reductions | .44%F |
| Expenses net of fee waivers, if any | .44%F |
| Expenses net of all reductions | .44%F |
| Net investment income (loss) | 2.35%F |
| Supplemental Data | |
| Net assets, end of period (000 omitted) | $100 |
| Portfolio turnover rateG | 0%H,I |
A For the period August 31, 2018 (commencement of operations) to September 30, 2018.
B Calculated based on average shares outstanding during the period.
C The amount shown for a share outstanding does not correspond with the aggregate net gain (loss) on investments for the period due to the timing of sales and repurchases of shares in relation to fluctuating market values of the investments of the Fund.
D Total returns for periods of less than one year are not annualized.
E Expense ratios reflect operating expenses of the class. Expenses before reductions do not reflect amounts reimbursed by the investment adviser or reductions from expense offset arrangements and do not represent the amount paid by the class during periods when reimbursements or reductions occur. Expense ratios before reductions for start-up periods may not be representative of longer-term operating periods. Expenses net of fee waivers reflect expenses after reimbursement by the investment adviser but prior to reductions from expense offset arrangements. Expenses net of all reductions represent the net expenses paid by the class but do not include expenses of the underlying funds in which the Fund invests.
F Annualized
G Amounts do not include the activity of the Underlying Funds.
H Amount represents less than 1%.
I Amount not annualized.
See accompanying notes which are an integral part of the financial statements.
Fidelity Freedom Blend 2045 Fund Class Z6
| | Six months ended (Unaudited) September 30, |
| | 2018 A |
| Selected Per–Share Data | |
| Net asset value, beginning of period | $10.00 |
| Income from Investment Operations | |
| Net investment income (loss)B | .02 |
| Net realized and unrealized gain (loss) | (.01)C |
| Total from investment operations | .01 |
| Net asset value, end of period | $10.01 |
| Total ReturnD | .10% |
| Ratios to Average Net AssetsE | |
| Expenses before reductions | .33%F,G |
| Expenses net of fee waivers, if any | .33%F,G |
| Expenses net of all reductions | .33%F,G |
| Net investment income (loss) | 2.46%F |
| Supplemental Data | |
| Net assets, end of period (000 omitted) | $100 |
| Portfolio turnover rateH | 0%I,J |
A For the period August 31, 2018 (commencement of operations) to September 30, 2018.
B Calculated based on average shares outstanding during the period.
C The amount shown for a share outstanding does not correspond with the aggregate net gain (loss) on investments for the period due to the timing of sales and repurchases of shares in relation to fluctuating market values of the investments of the Fund.
D Total returns for periods of less than one year are not annualized.
E Expense ratios reflect operating expenses of the class. Expenses before reductions do not reflect amounts reimbursed by the investment adviser or reductions from expense offset arrangements and do not represent the amount paid by the class during periods when reimbursements or reductions occur. Expenses net of fee waivers reflect expenses after reimbursement by the investment adviser but prior to reductions from expense offset arrangements. Expenses net of all reductions represent the net expenses paid by the class but do not include expenses of the underlying funds in which the Fund invests.
F Annualized
G On certain classes, the size and fluctuation of net assets and expense amounts may cause ratios to differ from contractual rates.
H Amounts do not include the activity of the Underlying Funds.
I Amount represents less than 1%.
J Amount not annualized.
See accompanying notes which are an integral part of the financial statements.
Fidelity Freedom® Blend 2050 Fund
Investment Summary (Unaudited)
The information in the following tables is based on the direct investments of the Fund.
Top Holdings as of September 30, 2018
| | % of fund's net assets |
| Fidelity Series Large Cap Value Index Fund | 17.8 |
| Fidelity Series Blue Chip Growth Fund | 12.2 |
| Fidelity Series Large Cap Growth Index Fund | 9.5 |
| Fidelity Series Large Cap Stock Fund | 9.5 |
| Fidelity Series Emerging Markets Opportunities Fund | 8.4 |
| Fidelity Series International Value Fund | 8.2 |
| Fidelity Series International Growth Fund | 8.0 |
| Fidelity Series Value Discovery Fund | 5.6 |
| Fidelity Series Small Cap Opportunities Fund | 4.7 |
| Fidelity Series Long-Term Treasury Bond Index Fund | 3.5 |
| | 87.4 |
Asset Allocation (% of fund's net assets)
| Period end |
| | Domestic Equity Funds | 61.3% |
| | International Equity Funds | 30.5% |
| | Bond Funds | 6.9% |
| | Short-Term Funds | 1.3% |

Domestic Equity Funds category includes Fidelity Series Commodity Strategy Fund which invests in commodity-related investments.
Fidelity Freedom® Blend 2050 Fund
Schedule of Investments September 30, 2018 (Unaudited)
Showing Percentage of Net Assets
| Domestic Equity Funds - 61.3% | | | |
| | | Shares | Value |
| Fidelity Series Blue Chip Growth Fund (a) | | 7,184 | $109,917 |
| Fidelity Series Commodity Strategy Fund (a) | | 3,687 | 18,434 |
| Fidelity Series Large Cap Growth Index Fund (a) | | 8,316 | 86,319 |
| Fidelity Series Large Cap Stock Fund (a) | | 5,414 | 86,249 |
| Fidelity Series Large Cap Value Index Fund (a) | | 12,228 | 161,413 |
| Fidelity Series Small Cap Opportunities Fund (a) | | 2,857 | 41,975 |
| Fidelity Series Value Discovery Fund (a) | | 3,720 | 50,927 |
| TOTAL DOMESTIC EQUITY FUNDS | | | |
| (Cost $569,151) | | | 555,234 |
|
| International Equity Funds - 30.5% | | | |
| Fidelity Series Canada Fund (a) | | 701 | 7,582 |
| Fidelity Series Emerging Markets Fund (a) | | 864 | 8,373 |
| Fidelity Series Emerging Markets Opportunities Fund (a) | | 3,958 | 75,959 |
| Fidelity Series International Growth Fund (a) | | 4,395 | 72,078 |
| Fidelity Series International Index Fund (a) | | 1,871 | 19,177 |
| Fidelity Series International Small Cap Fund (a) | | 1,059 | 18,948 |
| Fidelity Series International Value Fund (a) | | 7,028 | 73,937 |
| TOTAL INTERNATIONAL EQUITY FUNDS | | | |
| (Cost $274,719) | | | 276,054 |
|
| Bond Funds - 6.9% | | | |
| Fidelity Series Corporate Bond Fund (a) | | 93 | 919 |
| Fidelity Series Emerging Markets Debt Fund (a) | | 585 | 5,573 |
| Fidelity Series Floating Rate High Income Fund (a) | | 239 | 2,277 |
| Fidelity Series Government Bond Index Fund (a) | | 127 | 1,255 |
| Fidelity Series High Income Fund (a) | | 1,231 | 11,830 |
| Fidelity Series Inflation-Protected Bond Index Fund (a) | | 277 | 2,694 |
| Fidelity Series Investment Grade Bond Fund (a) | | 124 | 1,350 |
| Fidelity Series Investment Grade Securitized Fund (a) | | 98 | 972 |
| Fidelity Series Long-Term Treasury Bond Index Fund (a) | | 3,790 | 31,227 |
| Fidelity Series Real Estate Income Fund (a) | | 393 | 4,233 |
| TOTAL BOND FUNDS | | | |
| (Cost $63,302) | | | 62,330 |
|
| Short-Term Funds - 1.3% | | | |
| Fidelity Cash Central Fund, 2.11% (b) | | 49 | 49 |
| Fidelity Series Government Money Market Fund 2.12% (a)(c) | | 2,355 | 2,355 |
| Fidelity Series Short-Term Credit Fund (a) | | 238 | 2,351 |
| Fidelity Series Treasury Bill Index Fund (a) | | 716 | 7,155 |
| TOTAL SHORT-TERM FUNDS | | | |
| (Cost $11,914) | | | 11,910 |
| TOTAL INVESTMENT IN SECURITIES - 100.0% | | | |
| (Cost $919,086) | | | 905,528 |
| NET OTHER ASSETS (LIABILITIES) - 0.0% | | | (334) |
| NET ASSETS - 100% | | | $905,194 |
Legend
(a) Affiliated Fund
(b) Affiliated fund that is generally available only to investment companies and other accounts managed by Fidelity Investments. The rate quoted is the annualized seven-day yield of the fund at period end. A complete unaudited listing of the fund's holdings as of its most recent quarter end is available upon request. In addition, each Fidelity Central Fund's financial statements are available on the SEC's website or upon request.
(c) The rate quoted is the annualized seven-day yield of the fund at period end.
Affiliated Central Funds
Information regarding fiscal year to date income earned by the Fund from investments in Fidelity Central Funds is as follows:
| Fund | Income earned |
| Fidelity Cash Central Fund | $195 |
| Total | $195 |
Amounts in the income column in the above table include any capital gain distributions from underlying funds, which are presented in the corresponding line-item in the Statement of Operations if applicable.
Affiliated Underlying Funds
Fiscal year to date information regarding the Fund's investments in affiliated Underlying Funds, excluding any Money Market Central Funds, is presented below. Exchanges between classes of the same affiliated Underlying Funds may occur.
| Affiliate | Value, beginning of period | Purchases | Sales Proceeds | Dividend Income | Realized Gain (loss) | Change in Unrealized appreciation (depreciation) | Value, end of period |
| Fidelity Series Blue Chip Growth Fund | $-- | $120,109 | $3 | $10,145 | $-- | $(10,189) | $109,917 |
| Fidelity Series Canada Fund | -- | 7,596 | -- | -- | -- | (14) | 7,582 |
| Fidelity Series Commodity Strategy Fund | -- | 19,184 | -- | 1,098 | -- | (750) | 18,434 |
| Fidelity Series Corporate Bond Fund | -- | 924 | -- | 3 | -- | (5) | 919 |
| Fidelity Series Emerging Markets Debt Fund | -- | 5,451 | -- | 28 | -- | 122 | 5,573 |
| Fidelity Series Emerging Markets Fund | -- | 8,501 | -- | -- | -- | (128) | 8,373 |
| Fidelity Series Emerging Markets Opportunities Fund | -- | 76,145 | 2 | -- | -- | (184) | 75,959 |
| Fidelity Series Floating Rate High Income Fund | -- | 2,270 | -- | 10 | -- | 7 | 2,277 |
| Fidelity Series Government Bond Index Fund | -- | 1,269 | -- | 3 | -- | (14) | 1,255 |
| Fidelity Series Government Money Market Fund 2.12% | -- | 2,355 | -- | 4 | -- | -- | 2,355 |
| Fidelity Series High Income Fund | -- | 11,806 | -- | 55 | -- | 24 | 11,830 |
| Fidelity Series Inflation-Protected Bond Index Fund | -- | 2,714 | -- | 1 | -- | (20) | 2,694 |
| Fidelity Series International Growth Fund | -- | 72,251 | 2 | -- | -- | (171) | 72,078 |
| Fidelity Series International Index Fund | -- | 18,989 | -- | -- | -- | 188 | 19,177 |
| Fidelity Series International Small Cap Fund | -- | 18,989 | -- | -- | -- | (41) | 18,948 |
| Fidelity Series International Value Fund | -- | 72,252 | 2 | -- | -- | 1,687 | 73,937 |
| Fidelity Series Investment Grade Bond Fund | -- | 1,360 | -- | 3 | -- | (10) | 1,350 |
| Fidelity Series Investment Grade Securitized Fund | -- | 997 | 17 | 2 | -- | (8) | 972 |
| Fidelity Series Large Cap Growth Index Fund | -- | 85,817 | 2 | -- | -- | 504 | 86,319 |
| Fidelity Series Large Cap Stock Fund | -- | 85,818 | 2 | -- | -- | 433 | 86,249 |
| Fidelity Series Large Cap Value Index Fund | -- | 161,054 | 6 | -- | -- | 365 | 161,413 |
| Fidelity Series Long-Term Treasury Bond Index Fund | -- | 32,170 | 1 | 76 | -- | (942) | 31,227 |
| Fidelity Series Real Estate Income Fund | -- | 4,362 | -- | 112 | -- | (129) | 4,233 |
| Fidelity Series Short-Term Credit Fund | -- | 2,356 | -- | 5 | -- | (5) | 2,351 |
| Fidelity Series Small Cap Opportunities Fund | -- | 46,180 | 1 | 3,227 | -- | (4,204) | 41,975 |
| Fidelity Series Treasury Bill Index Fund | -- | 7,155 | -- | 13 | -- | -- | 7,155 |
| Fidelity Series Value Discovery Fund | -- | 51,002 | 1 | -- | -- | (74) | 50,927 |
| Total | $-- | $919,076 | $39 | $14,785 | $-- | $(13,558) | $905,479 |
Amounts in the income column in the above table include any capital gain distributions from underlying funds, which are presented in the corresponding line-item in the Statement of Operations if applicable.
Investment Valuation
All investments are categorized as Level 1 under the Fair Value Hierarchy. The inputs or methodology used for valuing securities may not be an indication of the risk associated with investing in those securities. For more information on valuation inputs please refer to the Investment Valuation section in the accompanying Notes to Financial Statements.
See accompanying notes which are an integral part of the financial statements.
Fidelity Freedom® Blend 2050 Fund
Financial Statements
Statement of Assets and Liabilities
| | | September 30, 2018 (Unaudited) |
| Assets | | |
Investment in securities, at value — See accompanying schedule:
| | |
| Fidelity Central Funds (cost $49) | $49 | |
| Other affiliated issuers (cost $919,037) | 905,479 | |
| Total Investment in Securities (cost $919,086) | | $905,528 |
| Receivable for investments sold | | 17 |
| Distributions receivable from Fidelity Central Funds | | 149 |
| Total assets | | 905,694 |
| Liabilities | | |
| Accrued management fee | 355 | |
| Distribution and service plan fees payable | 145 | |
| Total liabilities | | 500 |
| Net Assets | | $905,194 |
| Net Assets consist of: | | |
| Paid in capital | | $904,295 |
| Undistributed net investment income | | 1,704 |
| Accumulated undistributed net realized gain (loss) on investments | | 12,753 |
| Net unrealized appreciation (depreciation) on investments | | (13,558) |
| Net Assets | | $905,194 |
| Calculation of Maximum Offering Price | | |
| Class A: | | |
| Net Asset Value and redemption price per share ($100,084 ÷ 10,000 shares) | | $10.01 |
| Maximum offering price per share (100/94.25 of $10.01) | | $10.62 |
| Class M: | | |
| Net Asset Value and redemption price per share ($100,063 ÷ 10,000 shares) | | $10.01 |
| Maximum offering price per share (100/96.50 of $10.01) | | $10.37 |
| Class C: | | |
| Net Asset Value and offering price per share ($100,019 ÷ 10,000 shares)(a) | | $10.00 |
| Fidelity Freedom Blend 2050 Fund: | | |
| Net Asset Value, offering price and redemption price per share ($104,446 ÷ 10,434 shares) | | $10.01 |
| Class K: | | |
| Net Asset Value, offering price and redemption price per share ($100,115 ÷ 10,000 shares) | | $10.01 |
| Class K6: | | |
| Net Asset Value, offering price and redemption price per share ($100,115 ÷ 10,000 shares) | | $10.01 |
| Class I: | | |
| Net Asset Value, offering price and redemption price per share ($100,106 ÷ 10,000 shares) | | $10.01 |
| Class Z: | | |
| Net Asset Value, offering price and redemption price per share ($100,123 ÷ 10,000 shares) | | $10.01 |
| Class Z6: | | |
| Net Asset Value, offering price and redemption price per share ($100,123 ÷ 10,000 shares) | | $10.01 |
(a) Redemption price per share is equal to net asset value less any applicable contingent deferred sales charge.
See accompanying notes which are an integral part of the financial statements.
Statement of Operations
| | | For the period
August 31, 2018 (commencement of operations) to
September 30, 2018 (Unaudited) |
| Investment Income | | |
| Dividends: | | |
| Affiliated issuers | | $2,032 |
| Income from Fidelity Central Funds | | 195 |
| Total income | | 2,227 |
| Expenses | | |
| Management fee | $370 | |
| Distribution and service plan fees | 153 | |
| Total expenses | | 523 |
| Net investment income (loss) | | 1,704 |
| Realized and Unrealized Gain (Loss) | | |
| Net realized gain (loss) on: | | |
| Capital gain distributions from underlying funds: | | |
| Affiliated issuers | 12,753 | |
| Total net realized gain (loss) | | 12,753 |
| Change in net unrealized appreciation (depreciation) on: | | |
| Investment securities: | | |
| Affiliated issuers | (13,558) | |
| Total change in net unrealized appreciation (depreciation) | | (13,558) |
| Net gain (loss) | | (805) |
| Net increase (decrease) in net assets resulting from operations | | $899 |
See accompanying notes which are an integral part of the financial statements.
Statement of Changes in Net Assets
| | For the period
August 31, 2018 (commencement of operations) to
September 30, 2018 (Unaudited) |
| Increase (Decrease) in Net Assets | |
| Operations | |
| Net investment income (loss) | $1,704 |
| Net realized gain (loss) | 12,753 |
| Change in net unrealized appreciation (depreciation) | (13,558) |
| Net increase (decrease) in net assets resulting from operations | 899 |
| Share transactions - net increase (decrease) | 904,295 |
| Total increase (decrease) in net assets | 905,194 |
| Net Assets | |
| Beginning of period | – |
| End of period | $905,194 |
| Other Information | |
| Undistributed net investment income end of period | $1,704 |
See accompanying notes which are an integral part of the financial statements.
Financial Highlights
Fidelity Freedom Blend 2050 Fund Class A
| | Six months ended (Unaudited) September 30, |
| | 2018 A |
| Selected Per–Share Data | |
| Net asset value, beginning of period | $10.00 |
| Income from Investment Operations | |
| Net investment income (loss)B | .02 |
| Net realized and unrealized gain (loss) | (.01) |
| Total from investment operations | .01 |
| Net asset value, end of period | $10.01 |
| Total ReturnC,D | .10% |
| Ratios to Average Net AssetsE | |
| Expenses before reductions | .80%F,G |
| Expenses net of fee waivers, if any | .80%F,G |
| Expenses net of all reductions | .80%F,G |
| Net investment income (loss) | 2.05%F |
| Supplemental Data | |
| Net assets, end of period (000 omitted) | $100 |
| Portfolio turnover rateH | 0%I,J |
A For the period August 31, 2018 (commencement of operations) to September 30, 2018.
B Calculated based on average shares outstanding during the period.
C Total returns for periods of less than one year are not annualized.
D Total returns do not include the effect of the sales charges.
E Expense ratios reflect operating expenses of the class. Expenses before reductions do not reflect amounts reimbursed by the investment adviser or reductions from expense offset arrangements and do not represent the amount paid by the class during periods when reimbursements or reductions occur. Expense ratios before reductions for start-up periods may not be representative of longer-term operating periods. Expenses net of fee waivers reflect expenses after reimbursement by the investment adviser but prior to reductions from expense offset arrangements. Expenses net of all reductions represent the net expenses paid by the class but do not include expenses of the underlying funds in which the Fund invests.
F Annualized
G On certain classes, the size and fluctuation of net assets and expense amounts may cause ratios to differ from contractual rates.
H Amounts do not include the activity of the Underlying Funds.
I Amount represents less than 1%.
J Amount not annualized.
See accompanying notes which are an integral part of the financial statements.
Fidelity Freedom Blend 2050 Fund Class M
| | Six months ended (Unaudited) September 30, |
| | 2018 A |
| Selected Per–Share Data | |
| Net asset value, beginning of period | $10.00 |
| Income from Investment Operations | |
| Net investment income (loss)B | .02 |
| Net realized and unrealized gain (loss) | (.01) |
| Total from investment operations | .01 |
| Net asset value, end of period | $10.01 |
| Total ReturnC,D | .10% |
| Ratios to Average Net AssetsE | |
| Expenses before reductions | 1.05%F,G |
| Expenses net of fee waivers, if any | 1.05%F,G |
| Expenses net of all reductions | 1.05%F,G |
| Net investment income (loss) | 1.80%F |
| Supplemental Data | |
| Net assets, end of period (000 omitted) | $100 |
| Portfolio turnover rateH | 0%I,J |
A For the period August 31, 2018 (commencement of operations) to September 30, 2018.
B Calculated based on average shares outstanding during the period.
C Total returns for periods of less than one year are not annualized.
D Total returns do not include the effect of the sales charges.
E Expense ratios reflect operating expenses of the class. Expenses before reductions do not reflect amounts reimbursed by the investment adviser or reductions from expense offset arrangements and do not represent the amount paid by the class during periods when reimbursements or reductions occur. Expense ratios before reductions for start-up periods may not be representative of longer-term operating periods. Expenses net of fee waivers reflect expenses after reimbursement by the investment adviser but prior to reductions from expense offset arrangements. Expenses net of all reductions represent the net expenses paid by the class but do not include expenses of the underlying funds in which the Fund invests.
F Annualized
G On certain classes, the size and fluctuation of net assets and expense amounts may cause ratios to differ from contractual rates.
H Amounts do not include the activity of the Underlying Funds.
I Amount represents less than 1%.
J Amount not annualized.
See accompanying notes which are an integral part of the financial statements.
Fidelity Freedom Blend 2050 Fund Class C
| | Six months ended (Unaudited) September 30, |
| | 2018 A |
| Selected Per–Share Data | |
| Net asset value, beginning of period | $10.00 |
| Income from Investment Operations | |
| Net investment income (loss)B | .01 |
| Net realized and unrealized gain (loss) | (.01) |
| Total from investment operations | – |
| Net asset value, end of period | $10.00 |
| Total ReturnC,D | –% |
| Ratios to Average Net AssetsE | |
| Expenses before reductions | 1.55%F,G |
| Expenses net of fee waivers, if any | 1.55%F,G |
| Expenses net of all reductions | 1.55%F,G |
| Net investment income (loss) | 1.30%F |
| Supplemental Data | |
| Net assets, end of period (000 omitted) | $100 |
| Portfolio turnover rateH | 0%I,J |
A For the period August 31, 2018 (commencement of operations) to September 30, 2018.
B Calculated based on average shares outstanding during the period.
C Total returns for periods of less than one year are not annualized.
D Total returns do not include the effect of the contingent deferred sales charge.
E Expense ratios reflect operating expenses of the class. Expenses before reductions do not reflect amounts reimbursed by the investment adviser or reductions from expense offset arrangements and do not represent the amount paid by the class during periods when reimbursements or reductions occur. Expense ratios before reductions for start-up periods may not be representative of longer-term operating periods. Expenses net of fee waivers reflect expenses after reimbursement by the investment adviser but prior to reductions from expense offset arrangements. Expenses net of all reductions represent the net expenses paid by the class but do not include expenses of the underlying funds in which the Fund invests.
F Annualized
G On certain classes, the size and fluctuation of net assets and expense amounts may cause ratios to differ from contractual rates.
H Amounts do not include the activity of the Underlying Funds.
I Amount represents less than 1%.
J Amount not annualized.
See accompanying notes which are an integral part of the financial statements.
Fidelity Freedom Blend 2050 Fund
| | Six months ended (Unaudited) September 30, |
| | 2018 A |
| Selected Per–Share Data | |
| Net asset value, beginning of period | $10.00 |
| Income from Investment Operations | |
| Net investment income (loss)B | .02 |
| Net realized and unrealized gain (loss) | (.01) |
| Total from investment operations | .01 |
| Net asset value, end of period | $10.01 |
| Total ReturnC | .10% |
| Ratios to Average Net AssetsD | |
| Expenses before reductions | .54%E |
| Expenses net of fee waivers, if any | .54%E |
| Expenses net of all reductions | .54%E |
| Net investment income (loss) | 2.31%E |
| Supplemental Data | |
| Net assets, end of period (000 omitted) | $104 |
| Portfolio turnover rateF | 0%G,H |
A For the period August 31, 2018 (commencement of operations) to September 30, 2018.
B Calculated based on average shares outstanding during the period.
C Total returns for periods of less than one year are not annualized.
D Expense ratios reflect operating expenses of the class. Expenses before reductions do not reflect amounts reimbursed by the investment adviser or reductions from expense offset arrangements and do not represent the amount paid by the class during periods when reimbursements or reductions occur. Expense ratios before reductions for start-up periods may not be representative of longer-term operating periods. Expenses net of fee waivers reflect expenses after reimbursement by the investment adviser but prior to reductions from expense offset arrangements. Expenses net of all reductions represent the net expenses paid by the class but do not include expenses of the underlying funds in which the Fund invests.
E Annualized
F Amounts do not include the activity of the Underlying Funds.
G Amount represents less than 1%.
H Amount not annualized.
See accompanying notes which are an integral part of the financial statements.
Fidelity Freedom Blend 2050 Fund Class K
| | Six months ended (Unaudited) September 30, |
| | 2018 A |
| Selected Per–Share Data | |
| Net asset value, beginning of period | $10.00 |
| Income from Investment Operations | |
| Net investment income (loss)B | .02 |
| Net realized and unrealized gain (loss) | (.01) |
| Total from investment operations | .01 |
| Net asset value, end of period | $10.01 |
| Total ReturnC | .10% |
| Ratios to Average Net AssetsD | |
| Expenses before reductions | .44%E |
| Expenses net of fee waivers, if any | .44%E |
| Expenses net of all reductions | .44%E |
| Net investment income (loss) | 2.41%E |
| Supplemental Data | |
| Net assets, end of period (000 omitted) | $100 |
| Portfolio turnover rateF | 0%G,H |
A For the period August 31, 2018 (commencement of operations) to September 30, 2018.
B Calculated based on average shares outstanding during the period.
C Total returns for periods of less than one year are not annualized.
D Expense ratios reflect operating expenses of the class. Expenses before reductions do not reflect amounts reimbursed by the investment adviser or reductions from expense offset arrangements and do not represent the amount paid by the class during periods when reimbursements or reductions occur. Expense ratios before reductions for start-up periods may not be representative of longer-term operating periods. Expenses net of fee waivers reflect expenses after reimbursement by the investment adviser but prior to reductions from expense offset arrangements. Expenses net of all reductions represent the net expenses paid by the class but do not include expenses of the underlying funds in which the Fund invests.
E Annualized
F Amounts do not include the activity of the Underlying Funds.
G Amount represents less than 1%.
H Amount not annualized.
See accompanying notes which are an integral part of the financial statements.
Fidelity Freedom Blend 2050 Fund Class K6
| | Six months ended (Unaudited) September 30, |
| | 2018 A |
| Selected Per–Share Data | |
| Net asset value, beginning of period | $10.00 |
| Income from Investment Operations | |
| Net investment income (loss)B | .02 |
| Net realized and unrealized gain (loss) | (.01) |
| Total from investment operations | .01 |
| Net asset value, end of period | $10.01 |
| Total ReturnC | .10% |
| Ratios to Average Net AssetsD | |
| Expenses before reductions | .33%E,F |
| Expenses net of fee waivers, if any | .33%E,F |
| Expenses net of all reductions | .33%E,F |
| Net investment income (loss) | 2.52%E |
| Supplemental Data | |
| Net assets, end of period (000 omitted) | $100 |
| Portfolio turnover rateG | 0%H,I |
A For the period August 31, 2018 (commencement of operations) to September 30, 2018.
B Calculated based on average shares outstanding during the period.
C Total returns for periods of less than one year are not annualized.
D Expense ratios reflect operating expenses of the class. Expenses before reductions do not reflect amounts reimbursed by the investment adviser or reductions from expense offset arrangements and do not represent the amount paid by the class during periods when reimbursements or reductions occur. Expenses net of fee waivers reflect expenses after reimbursement by the investment adviser but prior to reductions from expense offset arrangements. Expenses net of all reductions represent the net expenses paid by the class but do not include expenses of the underlying funds in which the Fund invests.
E Annualized
F On certain classes, the size and fluctuation of net assets and expense amounts may cause ratios to differ from contractual rates.
G Amounts do not include the activity of the Underlying Funds.
H Amount represents less than 1%.
I Amount not annualized.
See accompanying notes which are an integral part of the financial statements.
Fidelity Freedom Blend 2050 Fund Class I
| | Six months ended (Unaudited) September 30, |
| | 2018 A |
| Selected Per–Share Data | |
| Net asset value, beginning of period | $10.00 |
| Income from Investment Operations | |
| Net investment income (loss)B | .02 |
| Net realized and unrealized gain (loss) | (.01) |
| Total from investment operations | .01 |
| Net asset value, end of period | $10.01 |
| Total ReturnC | .10% |
| Ratios to Average Net AssetsD | |
| Expenses before reductions | .54%E |
| Expenses net of fee waivers, if any | .54%E |
| Expenses net of all reductions | .54%E |
| Net investment income (loss) | 2.31%E |
| Supplemental Data | |
| Net assets, end of period (000 omitted) | $100 |
| Portfolio turnover rateF | 0%G,H |
A For the period August 31, 2018 (commencement of operations) to September 30, 2018.
B Calculated based on average shares outstanding during the period.
C Total returns for periods of less than one year are not annualized.
D Expense ratios reflect operating expenses of the class. Expenses before reductions do not reflect amounts reimbursed by the investment adviser or reductions from expense offset arrangements and do not represent the amount paid by the class during periods when reimbursements or reductions occur. Expense ratios before reductions for start-up periods may not be representative of longer-term operating periods. Expenses net of fee waivers reflect expenses after reimbursement by the investment adviser but prior to reductions from expense offset arrangements. Expenses net of all reductions represent the net expenses paid by the class but do not include expenses of the underlying funds in which the Fund invests.
E Annualized
F Amounts do not include the activity of the Underlying Funds.
G Amount represents less than 1%.
H Amount not annualized.
See accompanying notes which are an integral part of the financial statements.
Fidelity Freedom Blend 2050 Fund Class Z
| | Six months ended (Unaudited) September 30, |
| | 2018 A |
| Selected Per–Share Data | |
| Net asset value, beginning of period | $10.00 |
| Income from Investment Operations | |
| Net investment income (loss)B | .02 |
| Net realized and unrealized gain (loss) | (.01) |
| Total from investment operations | .01 |
| Net asset value, end of period | $10.01 |
| Total ReturnC | .10% |
| Ratios to Average Net AssetsD | |
| Expenses before reductions | .44%E |
| Expenses net of fee waivers, if any | .44%E |
| Expenses net of all reductions | .44%E |
| Net investment income (loss) | 2.41%E |
| Supplemental Data | |
| Net assets, end of period (000 omitted) | $100 |
| Portfolio turnover rateF | 0%G,H |
A For the period August 31, 2018 (commencement of operations) to September 30, 2018.
B Calculated based on average shares outstanding during the period.
C Total returns for periods of less than one year are not annualized.
D Expense ratios reflect operating expenses of the class. Expenses before reductions do not reflect amounts reimbursed by the investment adviser or reductions from expense offset arrangements and do not represent the amount paid by the class during periods when reimbursements or reductions occur. Expense ratios before reductions for start-up periods may not be representative of longer-term operating periods. Expenses net of fee waivers reflect expenses after reimbursement by the investment adviser but prior to reductions from expense offset arrangements. Expenses net of all reductions represent the net expenses paid by the class but do not include expenses of the underlying funds in which the Fund invests.
E Annualized
F Amounts do not include the activity of the Underlying Funds.
G Amount represents less than 1%.
H Amount not annualized.
See accompanying notes which are an integral part of the financial statements.
Fidelity Freedom Blend 2050 Fund Class Z6
| | Six months ended (Unaudited) September 30, |
| | 2018 A |
| Selected Per–Share Data | |
| Net asset value, beginning of period | $10.00 |
| Income from Investment Operations | |
| Net investment income (loss)B | .02 |
| Net realized and unrealized gain (loss) | (.01) |
| Total from investment operations | .01 |
| Net asset value, end of period | $10.01 |
| Total ReturnC | .10% |
| Ratios to Average Net AssetsD | |
| Expenses before reductions | .33%E,F |
| Expenses net of fee waivers, if any | .33%E,F |
| Expenses net of all reductions | .33%E,F |
| Net investment income (loss) | 2.52%E |
| Supplemental Data | |
| Net assets, end of period (000 omitted) | $100 |
| Portfolio turnover rateG | 0%H,I |
A For the period August 31, 2018 (commencement of operations) to September 30, 2018.
B Calculated based on average shares outstanding during the period.
C Total returns for periods of less than one year are not annualized.
D Expense ratios reflect operating expenses of the class. Expenses before reductions do not reflect amounts reimbursed by the investment adviser or reductions from expense offset arrangements and do not represent the amount paid by the class during periods when reimbursements or reductions occur. Expenses net of fee waivers reflect expenses after reimbursement by the investment adviser but prior to reductions from expense offset arrangements. Expenses net of all reductions represent the net expenses paid by the class but do not include expenses of the underlying funds in which the Fund invests.
E Annualized
F On certain classes, the size and fluctuation of net assets and expense amounts may cause ratios to differ from contractual rates.
G Amounts do not include the activity of the Underlying Funds.
H Amount represents less than 1%.
I Amount not annualized.
See accompanying notes which are an integral part of the financial statements.
Fidelity Freedom® Blend 2055 Fund
Investment Summary (Unaudited)
The information in the following tables is based on the direct investments of the Fund.
Top Holdings as of September 30, 2018
| | % of fund's net assets |
| Fidelity Series Large Cap Value Index Fund | 17.8 |
| Fidelity Series Blue Chip Growth Fund | 12.2 |
| Fidelity Series Large Cap Growth Index Fund | 9.5 |
| Fidelity Series Large Cap Stock Fund | 9.5 |
| Fidelity Series Emerging Markets Opportunities Fund | 8.4 |
| Fidelity Series International Value Fund | 8.2 |
| Fidelity Series International Growth Fund | 8.0 |
| Fidelity Series Value Discovery Fund | 5.6 |
| Fidelity Series Small Cap Opportunities Fund | 4.7 |
| Fidelity Series Long-Term Treasury Bond Index Fund | 3.5 |
| | 87.4 |
Asset Allocation (% of fund's net assets)
| Period end |
| | Domestic Equity Funds | 61.3% |
| | International Equity Funds | 30.5% |
| | Bond Funds | 6.9% |
| | Short-Term Funds | 1.3% |

Domestic Equity Funds category includes Fidelity Series Commodity Strategy Fund which invests in commodity-related investments.
Fidelity Freedom® Blend 2055 Fund
Schedule of Investments September 30, 2018 (Unaudited)
Showing Percentage of Net Assets
| Domestic Equity Funds - 61.3% | | | |
| | | Shares | Value |
| Fidelity Series Blue Chip Growth Fund (a) | | 7,157 | $109,508 |
| Fidelity Series Commodity Strategy Fund (a) | | 3,673 | 18,365 |
| Fidelity Series Large Cap Growth Index Fund (a) | | 8,285 | 86,003 |
| Fidelity Series Large Cap Stock Fund (a) | | 5,395 | 85,936 |
| Fidelity Series Large Cap Value Index Fund (a) | | 12,184 | 160,831 |
| Fidelity Series Small Cap Opportunities Fund (a) | | 2,847 | 41,820 |
| Fidelity Series Value Discovery Fund (a) | | 3,707 | 50,742 |
| TOTAL DOMESTIC EQUITY FUNDS | | | |
| (Cost $567,147) | | | 553,205 |
|
| International Equity Funds - 30.5% | | | |
| Fidelity Series Canada Fund (a) | | 699 | 7,554 |
| Fidelity Series Emerging Markets Fund (a) | | 861 | 8,341 |
| Fidelity Series Emerging Markets Opportunities Fund (a) | | 3,943 | 75,670 |
| Fidelity Series International Growth Fund (a) | | 4,379 | 71,815 |
| Fidelity Series International Index Fund (a) | | 1,864 | 19,107 |
| Fidelity Series International Small Cap Fund (a) | | 1,055 | 18,879 |
| Fidelity Series International Value Fund (a) | | 7,003 | 73,669 |
| TOTAL INTERNATIONAL EQUITY FUNDS | | | |
| (Cost $273,722) | | | 275,035 |
|
| Bond Funds - 6.9% | | | |
| Fidelity Series Corporate Bond Fund (a) | | 93 | 916 |
| Fidelity Series Emerging Markets Debt Fund (a) | | 583 | 5,553 |
| Fidelity Series Floating Rate High Income Fund (a) | | 238 | 2,269 |
| Fidelity Series Government Bond Index Fund (a) | | 126 | 1,250 |
| Fidelity Series High Income Fund (a) | | 1,227 | 11,787 |
| Fidelity Series Inflation-Protected Bond Index Fund (a) | | 276 | 2,684 |
| Fidelity Series Investment Grade Bond Fund (a) | | 123 | 1,345 |
| Fidelity Series Investment Grade Securitized Fund (a) | | 98 | 968 |
| Fidelity Series Long-Term Treasury Bond Index Fund (a) | | 3,776 | 31,113 |
| Fidelity Series Real Estate Income Fund (a) | | 391 | 4,218 |
| TOTAL BOND FUNDS | | | |
| (Cost $63,074) | | | 62,103 |
|
| Short-Term Funds - 1.3% | | | |
| Fidelity Cash Central Fund, 2.11% (b) | | 49 | 49 |
| Fidelity Series Government Money Market Fund 2.12% (a)(c) | | 2,346 | 2,346 |
| Fidelity Series Short-Term Credit Fund (a) | | 238 | 2,342 |
| Fidelity Series Treasury Bill Index Fund (a) | | 713 | 7,129 |
| TOTAL SHORT-TERM FUNDS | | | |
| (Cost $11,871) | | | 11,866 |
| TOTAL INVESTMENT IN SECURITIES - 100.0% | | | |
| (Cost $915,814) | | | 902,209 |
| NET OTHER ASSETS (LIABILITIES) - 0.0% | | | (333) |
| NET ASSETS - 100% | | | $901,876 |
Legend
(a) Affiliated Fund
(b) Affiliated fund that is generally available only to investment companies and other accounts managed by Fidelity Investments. The rate quoted is the annualized seven-day yield of the fund at period end. A complete unaudited listing of the fund's holdings as of its most recent quarter end is available upon request. In addition, each Fidelity Central Fund's financial statements are available on the SEC's website or upon request.
(c) The rate quoted is the annualized seven-day yield of the fund at period end.
Affiliated Central Funds
Information regarding fiscal year to date income earned by the Fund from investments in Fidelity Central Funds is as follows:
| Fund | Income earned |
| Fidelity Cash Central Fund | $195 |
| Total | $195 |
Amounts in the income column in the above table include any capital gain distributions from underlying funds, which are presented in the corresponding line-item in the Statement of Operations if applicable.
Affiliated Underlying Funds
Fiscal year to date information regarding the Fund's investments in affiliated Underlying Funds, excluding any Money Market Central Funds, is presented below. Exchanges between classes of the same affiliated Underlying Funds may occur.
| Affiliate | Value, beginning of period | Purchases | Sales Proceeds | Dividend Income | Realized Gain (loss) | Change in Unrealized appreciation (depreciation) | Value, end of period |
| Fidelity Series Blue Chip Growth Fund | $-- | $119,713 | $3 | $10,149 | $-- | $(10,202) | $109,508 |
| Fidelity Series Canada Fund | -- | 7,568 | -- | -- | -- | (14) | 7,554 |
| Fidelity Series Commodity Strategy Fund | -- | 19,118 | -- | 1,098 | -- | (753) | 18,365 |
| Fidelity Series Corporate Bond Fund | -- | 921 | -- | 3 | -- | (5) | 916 |
| Fidelity Series Emerging Markets Debt Fund | -- | 5,431 | -- | 28 | -- | 122 | 5,553 |
| Fidelity Series Emerging Markets Fund | -- | 8,470 | -- | -- | -- | (129) | 8,341 |
| Fidelity Series Emerging Markets Opportunities Fund | -- | 75,867 | 2 | -- | -- | (195) | 75,670 |
| Fidelity Series Floating Rate High Income Fund | -- | 2,262 | -- | 10 | -- | 7 | 2,269 |
| Fidelity Series Government Bond Index Fund | -- | 1,264 | -- | 3 | -- | (14) | 1,250 |
| Fidelity Series Government Money Market Fund 2.12% | -- | 2,346 | -- | 4 | -- | -- | 2,346 |
| Fidelity Series High Income Fund | -- | 11,763 | -- | 55 | -- | 24 | 11,787 |
| Fidelity Series Inflation-Protected Bond Index Fund | -- | 2,703 | -- | 1 | -- | (19) | 2,684 |
| Fidelity Series International Growth Fund | -- | 71,991 | 2 | -- | -- | (174) | 71,815 |
| Fidelity Series International Index Fund | -- | 18,921 | -- | -- | -- | 186 | 19,107 |
| Fidelity Series International Small Cap Fund | -- | 18,921 | -- | -- | -- | (42) | 18,879 |
| Fidelity Series International Value Fund | -- | 71,991 | 2 | -- | -- | 1,680 | 73,669 |
| Fidelity Series Investment Grade Bond Fund | -- | 1,354 | -- | 3 | -- | (9) | 1,345 |
| Fidelity Series Investment Grade Securitized Fund | -- | 993 | 17 | 2 | -- | (8) | 968 |
| Fidelity Series Large Cap Growth Index Fund | -- | 85,507 | 2 | -- | -- | 498 | 86,003 |
| Fidelity Series Large Cap Stock Fund | -- | 85,507 | 2 | -- | -- | 431 | 85,936 |
| Fidelity Series Large Cap Value Index Fund | -- | 160,471 | 4 | -- | -- | 364 | 160,831 |
| Fidelity Series Long-Term Treasury Bond Index Fund | -- | 32,055 | 1 | 76 | -- | (941) | 31,113 |
| Fidelity Series Real Estate Income Fund | -- | 4,347 | -- | 112 | -- | (129) | 4,218 |
| Fidelity Series Short-Term Credit Fund | -- | 2,347 | -- | 5 | -- | (5) | 2,342 |
| Fidelity Series Small Cap Opportunities Fund | -- | 46,025 | 1 | 3,227 | -- | (4,204) | 41,820 |
| Fidelity Series Treasury Bill Index Fund | -- | 7,129 | -- | 13 | -- | -- | 7,129 |
| Fidelity Series Value Discovery Fund | -- | 50,817 | 1 | -- | -- | (74) | 50,742 |
| Total | $-- | $915,802 | $37 | $14,789 | $-- | $(13,605) | $902,160 |
Amounts in the income column in the above table include any capital gain distributions from underlying funds, which are presented in the corresponding line-item in the Statement of Operations if applicable.
Investment Valuation
All investments are categorized as Level 1 under the Fair Value Hierarchy. The inputs or methodology used for valuing securities may not be an indication of the risk associated with investing in those securities. For more information on valuation inputs please refer to the Investment Valuation section in the accompanying Notes to Financial Statements.
See accompanying notes which are an integral part of the financial statements.
Fidelity Freedom® Blend 2055 Fund
Financial Statements
Statement of Assets and Liabilities
| | | September 30, 2018 (Unaudited) |
| Assets | | |
Investment in securities, at value — See accompanying schedule:
| | |
| Fidelity Central Funds (cost $49) | $49 | |
| Other affiliated issuers (cost $915,765) | 902,160 | |
| Total Investment in Securities (cost $915,814) | | $902,209 |
| Receivable for investments sold | | 17 |
| Distributions receivable from Fidelity Central Funds | | 148 |
| Total assets | | 902,374 |
| Liabilities | | |
| Accrued management fee | 353 | |
| Distribution and service plan fees payable | 145 | |
| Total liabilities | | 498 |
| Net Assets | | $901,876 |
| Net Assets consist of: | | |
| Paid in capital | | $901,019 |
| Undistributed net investment income | | 1,705 |
| Accumulated undistributed net realized gain (loss) on investments | | 12,757 |
| Net unrealized appreciation (depreciation) on investments | | (13,605) |
| Net Assets | | $901,876 |
| Calculation of Maximum Offering Price | | |
| Class A: | | |
| Net Asset Value and redemption price per share ($100,084 ÷ 10,000 shares) | | $10.01 |
| Maximum offering price per share (100/94.25 of $10.01) | | $10.62 |
| Class M: | | |
| Net Asset Value and redemption price per share ($100,062 ÷ 10,000 shares) | | $10.01 |
| Maximum offering price per share (100/96.50 of $10.01) | | $10.37 |
| Class C: | | |
| Net Asset Value and offering price per share ($100,019 ÷ 10,000 shares)(a) | | $10.00 |
| Fidelity Freedom Blend 2055 Fund: | | |
| Net Asset Value, offering price and redemption price per share ($101,131 ÷ 10,102 shares) | | $10.01 |
| Class K: | | |
| Net Asset Value, offering price and redemption price per share ($100,114 ÷ 10,000 shares) | | $10.01 |
| Class K6: | | |
| Net Asset Value, offering price and redemption price per share ($100,123 ÷ 10,000 shares) | | $10.01 |
| Class I: | | |
| Net Asset Value, offering price and redemption price per share ($100,106 ÷ 10,000 shares) | | $10.01 |
| Class Z: | | |
| Net Asset Value, offering price and redemption price per share ($100,114 ÷ 10,000 shares) | | $10.01 |
| Class Z6: | | |
| Net Asset Value, offering price and redemption price per share ($100,123 ÷ 10,000 shares) | | $10.01 |
(a) Redemption price per share is equal to net asset value less any applicable contingent deferred sales charge.
See accompanying notes which are an integral part of the financial statements.
Statement of Operations
| | | For the period
August 31, 2018 (commencement of operations) to
September 30, 2018 (Unaudited) |
| Investment Income | | |
| Dividends: | | |
| Affiliated issuers | | $2,032 |
| Income from Fidelity Central Funds | | 195 |
| Total income | | 2,227 |
| Expenses | | |
| Management fee | $369 | |
| Distribution and service plan fees | 153 | |
| Total expenses | | 522 |
| Net investment income (loss) | | 1,705 |
| Realized and Unrealized Gain (Loss) | | |
| Net realized gain (loss) on: | | |
| Capital gain distributions from underlying funds: | | |
| Affiliated issuers | 12,757 | |
| Total net realized gain (loss) | | 12,757 |
| Change in net unrealized appreciation (depreciation) on: | | |
| Investment securities: | | |
| Affiliated issuers | (13,605) | |
| Total change in net unrealized appreciation (depreciation) | | (13,605) |
| Net gain (loss) | | (848) |
| Net increase (decrease) in net assets resulting from operations | | $857 |
See accompanying notes which are an integral part of the financial statements.
Statement of Changes in Net Assets
| | For the period
August 31, 2018 (commencement of operations) to
September 30, 2018 (Unaudited) |
| Increase (Decrease) in Net Assets | |
| Operations | |
| Net investment income (loss) | $1,705 |
| Net realized gain (loss) | 12,757 |
| Change in net unrealized appreciation (depreciation) | (13,605) |
| Net increase (decrease) in net assets resulting from operations | 857 |
| Share transactions - net increase (decrease) | 901,019 |
| Total increase (decrease) in net assets | 901,876 |
| Net Assets | |
| Beginning of period | – |
| End of period | $901,876 |
| Other Information | |
| Undistributed net investment income end of period | $1,705 |
See accompanying notes which are an integral part of the financial statements.
Financial Highlights
Fidelity Freedom Blend 2055 Fund Class A
| | Six months ended (Unaudited) September 30, |
| | 2018 A |
| Selected Per–Share Data | |
| Net asset value, beginning of period | $10.00 |
| Income from Investment Operations | |
| Net investment income (loss)B | .02 |
| Net realized and unrealized gain (loss) | (.01) |
| Total from investment operations | .01 |
| Net asset value, end of period | $10.01 |
| Total ReturnC,D | .10% |
| Ratios to Average Net AssetsE | |
| Expenses before reductions | .80%F,G |
| Expenses net of fee waivers, if any | .80%F,G |
| Expenses net of all reductions | .80%F,G |
| Net investment income (loss) | 2.06%F |
| Supplemental Data | |
| Net assets, end of period (000 omitted) | $100 |
| Portfolio turnover rateH | 0%I,J |
A For the period August 31, 2018 (commencement of operations) to September 30, 2018.
B Calculated based on average shares outstanding during the period.
C Total returns for periods of less than one year are not annualized.
D Total returns do not include the effect of the sales charges.
E Expense ratios reflect operating expenses of the class. Expenses before reductions do not reflect amounts reimbursed by the investment adviser or reductions from expense offset arrangements and do not represent the amount paid by the class during periods when reimbursements or reductions occur. Expense ratios before reductions for start-up periods may not be representative of longer-term operating periods. Expenses net of fee waivers reflect expenses after reimbursement by the investment adviser but prior to reductions from expense offset arrangements. Expenses net of all reductions represent the net expenses paid by the class but do not include expenses of the underlying funds in which the Fund invests.
F Annualized
G On certain classes, the size and fluctuation of net assets and expense amounts may cause ratios to differ from contractual rates.
H Amounts do not include the activity of the Underlying Funds.
I Amount represents less than 1%.
J Amount not annualized.
See accompanying notes which are an integral part of the financial statements.
Fidelity Freedom Blend 2055 Fund Class M
| | Six months ended (Unaudited) September 30, |
| | 2018 A |
| Selected Per–Share Data | |
| Net asset value, beginning of period | $10.00 |
| Income from Investment Operations | |
| Net investment income (loss)B | .02 |
| Net realized and unrealized gain (loss) | (.01) |
| Total from investment operations | .01 |
| Net asset value, end of period | $10.01 |
| Total ReturnC,D | .10% |
| Ratios to Average Net AssetsE | |
| Expenses before reductions | 1.05%F,G |
| Expenses net of fee waivers, if any | 1.05%F,G |
| Expenses net of all reductions | 1.05%F,G |
| Net investment income (loss) | 1.81%F |
| Supplemental Data | |
| Net assets, end of period (000 omitted) | $100 |
| Portfolio turnover rateH | 0%I,J |
A For the period August 31, 2018 (commencement of operations) to September 30, 2018.
B Calculated based on average shares outstanding during the period.
C Total returns for periods of less than one year are not annualized.
D Total returns do not include the effect of the sales charges.
E Expense ratios reflect operating expenses of the class. Expenses before reductions do not reflect amounts reimbursed by the investment adviser or reductions from expense offset arrangements and do not represent the amount paid by the class during periods when reimbursements or reductions occur. Expense ratios before reductions for start-up periods may not be representative of longer-term operating periods. Expenses net of fee waivers reflect expenses after reimbursement by the investment adviser but prior to reductions from expense offset arrangements. Expenses net of all reductions represent the net expenses paid by the class but do not include expenses of the underlying funds in which the Fund invests.
F Annualized
G On certain classes, the size and fluctuation of net assets and expense amounts may cause ratios to differ from contractual rates.
H Amounts do not include the activity of the Underlying Funds.
I Amount represents less than 1%.
J Amount not annualized.
See accompanying notes which are an integral part of the financial statements.
Fidelity Freedom Blend 2055 Fund Class C
| | Six months ended (Unaudited) September 30, |
| | 2018 A |
| Selected Per–Share Data | |
| Net asset value, beginning of period | $10.00 |
| Income from Investment Operations | |
| Net investment income (loss)B | .01 |
| Net realized and unrealized gain (loss) | (.01) |
| Total from investment operations | – |
| Net asset value, end of period | $10.00 |
| Total ReturnC,D | –% |
| Ratios to Average Net AssetsE | |
| Expenses before reductions | 1.55%F,G |
| Expenses net of fee waivers, if any | 1.55%F,G |
| Expenses net of all reductions | 1.55%F,G |
| Net investment income (loss) | 1.31%F |
| Supplemental Data | |
| Net assets, end of period (000 omitted) | $100 |
| Portfolio turnover rateH | 0%I,J |
A For the period August 31, 2018 (commencement of operations) to September 30, 2018.
B Calculated based on average shares outstanding during the period.
C Total returns for periods of less than one year are not annualized.
D Total returns do not include the effect of the contingent deferred sales charge.
E Expense ratios reflect operating expenses of the class. Expenses before reductions do not reflect amounts reimbursed by the investment adviser or reductions from expense offset arrangements and do not represent the amount paid by the class during periods when reimbursements or reductions occur. Expense ratios before reductions for start-up periods may not be representative of longer-term operating periods. Expenses net of fee waivers reflect expenses after reimbursement by the investment adviser but prior to reductions from expense offset arrangements. Expenses net of all reductions represent the net expenses paid by the class but do not include expenses of the underlying funds in which the Fund invests.
F Annualized
G On certain classes, the size and fluctuation of net assets and expense amounts may cause ratios to differ from contractual rates.
H Amounts do not include the activity of the Underlying Funds.
I Amount represents less than 1%.
J Amount not annualized.
See accompanying notes which are an integral part of the financial statements.
Fidelity Freedom Blend 2055 Fund
| | Six months ended (Unaudited) September 30, |
| | 2018 A |
| Selected Per–Share Data | |
| Net asset value, beginning of period | $10.00 |
| Income from Investment Operations | |
| Net investment income (loss)B | .02 |
| Net realized and unrealized gain (loss) | (.01) |
| Total from investment operations | .01 |
| Net asset value, end of period | $10.01 |
| Total ReturnC | .10% |
| Ratios to Average Net AssetsD | |
| Expenses before reductions | .54%E |
| Expenses net of fee waivers, if any | .54%E |
| Expenses net of all reductions | .54%E |
| Net investment income (loss) | 2.32%E |
| Supplemental Data | |
| Net assets, end of period (000 omitted) | $101 |
| Portfolio turnover rateF | 0%G,H |
A For the period August 31, 2018 (commencement of operations) to September 30, 2018.
B Calculated based on average shares outstanding during the period.
C Total returns for periods of less than one year are not annualized.
D Expense ratios reflect operating expenses of the class. Expenses before reductions do not reflect amounts reimbursed by the investment adviser or reductions from expense offset arrangements and do not represent the amount paid by the class during periods when reimbursements or reductions occur. Expense ratios before reductions for start-up periods may not be representative of longer-term operating periods. Expenses net of fee waivers reflect expenses after reimbursement by the investment adviser but prior to reductions from expense offset arrangements. Expenses net of all reductions represent the net expenses paid by the class but do not include expenses of the underlying funds in which the Fund invests.
E Annualized
F Amounts do not include the activity of the Underlying Funds.
G Amount represents less than 1%.
H Amount not annualized.
See accompanying notes which are an integral part of the financial statements.
Fidelity Freedom Blend 2055 Fund Class K
| | Six months ended (Unaudited) September 30, |
| | 2018 A |
| Selected Per–Share Data | |
| Net asset value, beginning of period | $10.00 |
| Income from Investment Operations | |
| Net investment income (loss)B | .02 |
| Net realized and unrealized gain (loss) | (.01) |
| Total from investment operations | .01 |
| Net asset value, end of period | $10.01 |
| Total ReturnC | .10% |
| Ratios to Average Net AssetsD | |
| Expenses before reductions | .44%E |
| Expenses net of fee waivers, if any | .44%E |
| Expenses net of all reductions | .44%E |
| Net investment income (loss) | 2.42%E |
| Supplemental Data | |
| Net assets, end of period (000 omitted) | $100 |
| Portfolio turnover rateF | 0%G,H |
A For the period August 31, 2018 (commencement of operations) to September 30, 2018.
B Calculated based on average shares outstanding during the period.
C Total returns for periods of less than one year are not annualized.
D Expense ratios reflect operating expenses of the class. Expenses before reductions do not reflect amounts reimbursed by the investment adviser or reductions from expense offset arrangements and do not represent the amount paid by the class during periods when reimbursements or reductions occur. Expense ratios before reductions for start-up periods may not be representative of longer-term operating periods. Expenses net of fee waivers reflect expenses after reimbursement by the investment adviser but prior to reductions from expense offset arrangements. Expenses net of all reductions represent the net expenses paid by the class but do not include expenses of the underlying funds in which the Fund invests.
E Annualized
F Amounts do not include the activity of the Underlying Funds.
G Amount represents less than 1%.
H Amount not annualized.
See accompanying notes which are an integral part of the financial statements.
Fidelity Freedom Blend 2055 Fund Class K6
| | Six months ended (Unaudited) September 30, |
| | 2018 A |
| Selected Per–Share Data | |
| Net asset value, beginning of period | $10.00 |
| Income from Investment Operations | |
| Net investment income (loss)B | .02 |
| Net realized and unrealized gain (loss) | (.01) |
| Total from investment operations | .01 |
| Net asset value, end of period | $10.01 |
| Total ReturnC | .10% |
| Ratios to Average Net AssetsD | |
| Expenses before reductions | .33%E,F |
| Expenses net of fee waivers, if any | .33%E,F |
| Expenses net of all reductions | .33%E,F |
| Net investment income (loss) | 2.52%E |
| Supplemental Data | |
| Net assets, end of period (000 omitted) | $100 |
| Portfolio turnover rateG | 0%H,I |
A For the period August 31, 2018 (commencement of operations) to September 30, 2018.
B Calculated based on average shares outstanding during the period.
C Total returns for periods of less than one year are not annualized.
D Expense ratios reflect operating expenses of the class. Expenses before reductions do not reflect amounts reimbursed by the investment adviser or reductions from expense offset arrangements and do not represent the amount paid by the class during periods when reimbursements or reductions occur. Expenses net of fee waivers reflect expenses after reimbursement by the investment adviser but prior to reductions from expense offset arrangements. Expenses net of all reductions represent the net expenses paid by the class but do not include expenses of the underlying funds in which the Fund invests.
E Annualized
F On certain classes, the size and fluctuation of net assets and expense amounts may cause ratios to differ from contractual rates.
G Amounts do not include the activity of the Underlying Funds.
H Amount represents less than 1%.
I Amount not annualized.
See accompanying notes which are an integral part of the financial statements.
Fidelity Freedom Blend 2055 Fund Class I
| | Six months ended (Unaudited) September 30, |
| | 2018 A |
| Selected Per–Share Data | |
| Net asset value, beginning of period | $10.00 |
| Income from Investment Operations | |
| Net investment income (loss)B | .02 |
| Net realized and unrealized gain (loss) | (.01) |
| Total from investment operations | .01 |
| Net asset value, end of period | $10.01 |
| Total ReturnC | .10% |
| Ratios to Average Net AssetsD | |
| Expenses before reductions | .54%E |
| Expenses net of fee waivers, if any | .54%E |
| Expenses net of all reductions | .54%E |
| Net investment income (loss) | 2.31%E |
| Supplemental Data | |
| Net assets, end of period (000 omitted) | $100 |
| Portfolio turnover rateF | 0%G,H |
A For the period August 31, 2018 (commencement of operations) to September 30, 2018.
B Calculated based on average shares outstanding during the period.
C Total returns for periods of less than one year are not annualized.
D Expense ratios reflect operating expenses of the class. Expenses before reductions do not reflect amounts reimbursed by the investment adviser or reductions from expense offset arrangements and do not represent the amount paid by the class during periods when reimbursements or reductions occur. Expense ratios before reductions for start-up periods may not be representative of longer-term operating periods. Expenses net of fee waivers reflect expenses after reimbursement by the investment adviser but prior to reductions from expense offset arrangements. Expenses net of all reductions represent the net expenses paid by the class but do not include expenses of the underlying funds in which the Fund invests.
E Annualized
F Amounts do not include the activity of the Underlying Funds.
G Amount represents less than 1%.
H Amount not annualized.
See accompanying notes which are an integral part of the financial statements.
Fidelity Freedom Blend 2055 Fund Class Z
| | Six months ended (Unaudited) September 30, |
| | 2018 A |
| Selected Per–Share Data | |
| Net asset value, beginning of period | $10.00 |
| Income from Investment Operations | |
| Net investment income (loss)B | .02 |
| Net realized and unrealized gain (loss) | (.01) |
| Total from investment operations | .01 |
| Net asset value, end of period | $10.01 |
| Total ReturnC | .10% |
| Ratios to Average Net AssetsD | |
| Expenses before reductions | .44%E |
| Expenses net of fee waivers, if any | .44%E |
| Expenses net of all reductions | .44%E |
| Net investment income (loss) | 2.42%E |
| Supplemental Data | |
| Net assets, end of period (000 omitted) | $100 |
| Portfolio turnover rateF | 0%G,H |
A For the period August 31, 2018 (commencement of operations) to September 30, 2018.
B Calculated based on average shares outstanding during the period.
C Total returns for periods of less than one year are not annualized.
D Expense ratios reflect operating expenses of the class. Expenses before reductions do not reflect amounts reimbursed by the investment adviser or reductions from expense offset arrangements and do not represent the amount paid by the class during periods when reimbursements or reductions occur. Expense ratios before reductions for start-up periods may not be representative of longer-term operating periods. Expenses net of fee waivers reflect expenses after reimbursement by the investment adviser but prior to reductions from expense offset arrangements. Expenses net of all reductions represent the net expenses paid by the class but do not include expenses of the underlying funds in which the Fund invests.
E Annualized
F Amounts do not include the activity of the Underlying Funds.
G Amount represents less than 1%.
H Amount not annualized.
See accompanying notes which are an integral part of the financial statements.
Fidelity Freedom Blend 2055 Fund Class Z6
| | Six months ended (Unaudited) September 30, |
| | 2018 A |
| Selected Per–Share Data | |
| Net asset value, beginning of period | $10.00 |
| Income from Investment Operations | |
| Net investment income (loss)B | .02 |
| Net realized and unrealized gain (loss) | (.01) |
| Total from investment operations | .01 |
| Net asset value, end of period | $10.01 |
| Total ReturnC | .10% |
| Ratios to Average Net AssetsD | |
| Expenses before reductions | .33%E,F |
| Expenses net of fee waivers, if any | .33%E,F |
| Expenses net of all reductions | .33%E,F |
| Net investment income (loss) | 2.52%E |
| Supplemental Data | |
| Net assets, end of period (000 omitted) | $100 |
| Portfolio turnover rateG | 0%H,I |
A For the period August 31, 2018 (commencement of operations) to September 30, 2018.
B Calculated based on average shares outstanding during the period.
C Total returns for periods of less than one year are not annualized.
D Expense ratios reflect operating expenses of the class. Expenses before reductions do not reflect amounts reimbursed by the investment adviser or reductions from expense offset arrangements and do not represent the amount paid by the class during periods when reimbursements or reductions occur. Expenses net of fee waivers reflect expenses after reimbursement by the investment adviser but prior to reductions from expense offset arrangements. Expenses net of all reductions represent the net expenses paid by the class but do not include expenses of the underlying funds in which the Fund invests.
E Annualized
F On certain classes, the size and fluctuation of net assets and expense amounts may cause ratios to differ from contractual rates.
G Amounts do not include the activity of the Underlying Funds.
H Amount represents less than 1%.
I Amount not annualized.
See accompanying notes which are an integral part of the financial statements.
Fidelity Freedom® Blend 2060 Fund
Investment Summary (Unaudited)
The information in the following tables is based on the direct investments of the Fund.
Top Holdings as of September 30, 2018
| | % of fund's net assets |
| Fidelity Series Large Cap Value Index Fund | 17.8 |
| Fidelity Series Blue Chip Growth Fund | 12.2 |
| Fidelity Series Large Cap Growth Index Fund | 9.5 |
| Fidelity Series Large Cap Stock Fund | 9.5 |
| Fidelity Series Emerging Markets Opportunities Fund | 8.4 |
| Fidelity Series International Value Fund | 8.2 |
| Fidelity Series International Growth Fund | 8.0 |
| Fidelity Series Value Discovery Fund | 5.6 |
| Fidelity Series Small Cap Opportunities Fund | 4.7 |
| Fidelity Series Long-Term Treasury Bond Index Fund | 3.5 |
| | 87.4 |
Asset Allocation (% of fund's net assets)
| Period end |
| | Domestic Equity Funds | 61.3% |
| | International Equity Funds | 30.5% |
| | Bond Funds | 6.9% |
| | Short-Term Funds | 1.3% |

Domestic Equity Funds category includes Fidelity Series Commodity Strategy Fund which invests in commodity-related investments.
Fidelity Freedom® Blend 2060 Fund
Schedule of Investments September 30, 2018 (Unaudited)
Showing Percentage of Net Assets
| Domestic Equity Funds - 61.3% | | | |
| | | Shares | Value |
| Fidelity Series Blue Chip Growth Fund (a) | | 7,456 | $114,075 |
| Fidelity Series Commodity Strategy Fund (a) | | 3,823 | 19,116 |
| Fidelity Series Large Cap Growth Index Fund (a) | | 8,629 | 89,571 |
| Fidelity Series Large Cap Stock Fund (a) | | 5,617 | 89,473 |
| Fidelity Series Large Cap Value Index Fund (a) | | 12,687 | 167,464 |
| Fidelity Series Small Cap Opportunities Fund (a) | | 2,967 | 43,587 |
| Fidelity Series Value Discovery Fund (a) | | 3,860 | 52,844 |
| TOTAL DOMESTIC EQUITY FUNDS | | | |
| (Cost $590,127) | | | 576,130 |
|
| International Equity Funds - 30.5% | | | |
| Fidelity Series Canada Fund (a) | | 728 | 7,869 |
| Fidelity Series Emerging Markets Fund (a) | | 898 | 8,697 |
| Fidelity Series Emerging Markets Opportunities Fund (a) | | 4,111 | 78,881 |
| Fidelity Series International Growth Fund (a) | | 4,559 | 74,771 |
| Fidelity Series International Index Fund (a) | | 1,940 | 19,884 |
| Fidelity Series International Small Cap Fund (a) | | 1,098 | 19,656 |
| Fidelity Series International Value Fund (a) | | 7,283 | 76,612 |
| TOTAL INTERNATIONAL EQUITY FUNDS | | | |
| (Cost $285,088) | | | 286,370 |
|
| Bond Funds - 6.9% | | | |
| Fidelity Series Corporate Bond Fund (a) | | 97 | 955 |
| Fidelity Series Emerging Markets Debt Fund (a) | | 606 | 5,779 |
| Fidelity Series Floating Rate High Income Fund (a) | | 248 | 2,362 |
| Fidelity Series Government Bond Index Fund (a) | | 132 | 1,302 |
| Fidelity Series High Income Fund (a) | | 1,277 | 12,274 |
| Fidelity Series Inflation-Protected Bond Index Fund (a) | | 288 | 2,797 |
| Fidelity Series Investment Grade Bond Fund (a) | | 129 | 1,401 |
| Fidelity Series Investment Grade Securitized Fund (a) | | 102 | 1,008 |
| Fidelity Series Long-Term Treasury Bond Index Fund (a) | | 3,938 | 32,446 |
| Fidelity Series Real Estate Income Fund (a) | | 408 | 4,394 |
| TOTAL BOND FUNDS | | | |
| (Cost $65,684) | | | 64,718 |
|
| Short-Term Funds - 1.3% | | | |
| Fidelity Cash Central Fund, 2.11% (b) | | 49 | 49 |
| Fidelity Series Government Money Market Fund 2.12% (a)(c) | | 2,443 | 2,443 |
| Fidelity Series Short-Term Credit Fund (a) | | 247 | 2,439 |
| Fidelity Series Treasury Bill Index Fund (a) | | 742 | 7,425 |
| TOTAL SHORT-TERM FUNDS | | | |
| (Cost $12,361) | | | 12,356 |
| TOTAL INVESTMENT IN SECURITIES - 100.0% | | | |
| (Cost $953,260) | | | 939,574 |
| NET OTHER ASSETS (LIABILITIES) - 0.0% | | | (334) |
| NET ASSETS - 100% | | | $939,240 |
Legend
(a) Affiliated Fund
(b) Affiliated fund that is generally available only to investment companies and other accounts managed by Fidelity Investments. The rate quoted is the annualized seven-day yield of the fund at period end. A complete unaudited listing of the fund's holdings as of its most recent quarter end is available upon request. In addition, each Fidelity Central Fund's financial statements are available on the SEC's website or upon request.
(c) The rate quoted is the annualized seven-day yield of the fund at period end.
Affiliated Central Funds
Information regarding fiscal year to date income earned by the Fund from investments in Fidelity Central Funds is as follows:
| Fund | Income earned |
| Fidelity Cash Central Fund | $195 |
| Total | $195 |
Amounts in the income column in the above table include any capital gain distributions from underlying funds, which are presented in the corresponding line-item in the Statement of Operations if applicable.
Affiliated Underlying Funds
Fiscal year to date information regarding the Fund's investments in affiliated Underlying Funds, excluding any Money Market Central Funds, is presented below. Exchanges between classes of the same affiliated Underlying Funds may occur.
| Affiliate | Value, beginning of period | Purchases | Sales Proceeds | Dividend Income | Realized Gain (loss) | Change in Unrealized appreciation (depreciation) | Value, end of period |
| Fidelity Series Blue Chip Growth Fund | $-- | $124,288 | $3 | $10,175 | $-- | $(10,210) | $114,075 |
| Fidelity Series Canada Fund | -- | 7,883 | -- | -- | -- | (14) | 7,869 |
| Fidelity Series Commodity Strategy Fund | -- | 19,869 | -- | 1,101 | -- | (753) | 19,116 |
| Fidelity Series Corporate Bond Fund | -- | 959 | -- | 3 | -- | (4) | 955 |
| Fidelity Series Emerging Markets Debt Fund | -- | 5,655 | -- | 28 | -- | 124 | 5,779 |
| Fidelity Series Emerging Markets Fund | -- | 8,824 | -- | -- | -- | (127) | 8,697 |
| Fidelity Series Emerging Markets Opportunities Fund | -- | 79,048 | 2 | -- | -- | (165) | 78,881 |
| Fidelity Series Floating Rate High Income Fund | -- | 2,355 | -- | 10 | -- | 7 | 2,362 |
| Fidelity Series Government Bond Index Fund | -- | 1,316 | -- | 3 | -- | (14) | 1,302 |
| Fidelity Series Government Money Market Fund 2.12% | -- | 2,443 | -- | 4 | -- | -- | 2,443 |
| Fidelity Series High Income Fund | -- | 12,249 | -- | 56 | -- | 25 | 12,274 |
| Fidelity Series Inflation-Protected Bond Index Fund | -- | 2,816 | -- | 1 | -- | (19) | 2,797 |
| Fidelity Series International Growth Fund | -- | 74,966 | 2 | -- | -- | (193) | 74,771 |
| Fidelity Series International Index Fund | -- | 19,703 | -- | -- | -- | 181 | 19,884 |
| Fidelity Series International Small Cap Fund | -- | 19,702 | -- | -- | -- | (46) | 19,656 |
| Fidelity Series International Value Fund | -- | 74,966 | 2 | -- | -- | 1,648 | 76,612 |
| Fidelity Series Investment Grade Bond Fund | -- | 1,411 | -- | 3 | -- | (10) | 1,401 |
| Fidelity Series Investment Grade Securitized Fund | -- | 1,036 | 20 | 2 | -- | (8) | 1,008 |
| Fidelity Series Large Cap Growth Index Fund | -- | 89,057 | 2 | -- | -- | 516 | 89,571 |
| Fidelity Series Large Cap Stock Fund | -- | 89,057 | 2 | -- | -- | 418 | 89,473 |
| Fidelity Series Large Cap Value Index Fund | -- | 167,135 | 4 | -- | -- | 333 | 167,464 |
| Fidelity Series Long-Term Treasury Bond Index Fund | -- | 33,383 | 1 | 76 | -- | (936) | 32,446 |
| Fidelity Series Real Estate Income Fund | -- | 4,523 | -- | 112 | -- | (129) | 4,394 |
| Fidelity Series Short-Term Credit Fund | -- | 2,444 | -- | 5 | -- | (5) | 2,439 |
| Fidelity Series Small Cap Opportunities Fund | -- | 47,811 | 1 | 3,235 | -- | (4,223) | 43,587 |
| Fidelity Series Treasury Bill Index Fund | -- | 7,425 | -- | 13 | -- | -- | 7,425 |
| Fidelity Series Value Discovery Fund | -- | 52,927 | 1 | -- | -- | (82) | 52,844 |
| Total | $-- | $953,251 | $40 | $14,827 | $-- | $(13,686) | $939,525 |
Amounts in the income column in the above table include any capital gain distributions from underlying funds, which are presented in the corresponding line-item in the Statement of Operations if applicable.
Investment Valuation
All investments are categorized as Level 1 under the Fair Value Hierarchy. The inputs or methodology used for valuing securities may not be an indication of the risk associated with investing in those securities. For more information on valuation inputs please refer to the Investment Valuation section in the accompanying Notes to Financial Statements.
See accompanying notes which are an integral part of the financial statements.
Fidelity Freedom® Blend 2060 Fund
Financial Statements
Statement of Assets and Liabilities
| | | September 30, 2018 (Unaudited) |
| Assets | | |
Investment in securities, at value — See accompanying schedule:
| | |
| Fidelity Central Funds (cost $49) | $49 | |
| Other affiliated issuers (cost $953,211) | 939,525 | |
| Total Investment in Securities (cost $953,260) | | $939,574 |
| Receivable for investments sold | | 18 |
| Receivable for fund shares sold | | 489 |
| Distributions receivable from Fidelity Central Funds | | 146 |
| Total assets | | 940,227 |
| Liabilities | | |
| Payable for investments purchased | $487 | |
| Accrued management fee | 355 | |
| Distribution and service plan fees payable | 145 | |
| Total liabilities | | 987 |
| Net Assets | | $939,240 |
| Net Assets consist of: | | |
| Paid in capital | | $938,428 |
| Undistributed net investment income | | 1,710 |
| Accumulated undistributed net realized gain (loss) on investments | | 12,788 |
| Net unrealized appreciation (depreciation) on investments | | (13,686) |
| Net Assets | | $939,240 |
| Calculation of Maximum Offering Price | | |
| Class A: | | |
| Net Asset Value and redemption price per share ($100,083 ÷ 10,000 shares) | | $10.01 |
| Maximum offering price per share (100/94.25 of $10.01) | | $10.62 |
| Class M: | | |
| Net Asset Value and redemption price per share ($100,062 ÷ 10,000 shares) | | $10.01 |
| Maximum offering price per share (100/96.50 of $10.01) | | $10.37 |
| Class C: | | |
| Net Asset Value and offering price per share ($100,018 ÷ 10,000 shares)(a) | | $10.00 |
| Fidelity Freedom Blend 2060 Fund: | | |
| Net Asset Value, offering price and redemption price per share ($138,500 ÷ 13,836 shares) | | $10.01 |
| Class K: | | |
| Net Asset Value, offering price and redemption price per share ($100,114 ÷ 10,000 shares) | | $10.01 |
| Class K6: | | |
| Net Asset Value, offering price and redemption price per share ($100,122 ÷ 10,000 shares) | | $10.01 |
| Class I: | | |
| Net Asset Value, offering price and redemption price per share ($100,105 ÷ 10,000 shares) | | $10.01 |
| Class Z: | | |
| Net Asset Value, offering price and redemption price per share ($100,114 ÷ 10,000 shares) | | $10.01 |
| Class Z6: | | |
| Net Asset Value, offering price and redemption price per share ($100,122 ÷ 10,000 shares) | | $10.01 |
(a) Redemption price per share is equal to net asset value less any applicable contingent deferred sales charge.
See accompanying notes which are an integral part of the financial statements.
Statement of Operations
| | | For the period
August 31, 2018 (commencement of operations) to
September 30, 2018 (Unaudited) |
| Investment Income | | |
| Dividends: | | |
| Affiliated issuers | | $2,039 |
| Income from Fidelity Central Funds | | 195 |
| Total income | | 2,234 |
| Expenses | | |
| Management fee | $371 | |
| Distribution and service plan fees | 153 | |
| Total expenses | | 524 |
| Net investment income (loss) | | 1,710 |
| Realized and Unrealized Gain (Loss) | | |
| Net realized gain (loss) on: | | |
| Capital gain distributions from underlying funds: | | |
| Affiliated issuers | 12,788 | |
| Total net realized gain (loss) | | 12,788 |
| Change in net unrealized appreciation (depreciation) on: | | |
| Investment securities: | | |
| Affiliated issuers | (13,686) | |
| Total change in net unrealized appreciation (depreciation) | | (13,686) |
| Net gain (loss) | | (898) |
| Net increase (decrease) in net assets resulting from operations | | $812 |
See accompanying notes which are an integral part of the financial statements.
Statement of Changes in Net Assets
| | For the period
August 31, 2018 (commencement of operations) to
September 30, 2018 (Unaudited) |
| Increase (Decrease) in Net Assets | |
| Operations | |
| Net investment income (loss) | $1,710 |
| Net realized gain (loss) | 12,788 |
| Change in net unrealized appreciation (depreciation) | (13,686) |
| Net increase (decrease) in net assets resulting from operations | 812 |
| Share transactions - net increase (decrease) | 938,428 |
| Total increase (decrease) in net assets | 939,240 |
| Net Assets | |
| Beginning of period | – |
| End of period | $939,240 |
| Other Information | |
| Undistributed net investment income end of period | $1,710 |
See accompanying notes which are an integral part of the financial statements.
Financial Highlights
Fidelity Freedom Blend 2060 Fund Class A
| | Six months ended (Unaudited) September 30, |
| | 2018 A |
| Selected Per–Share Data | |
| Net asset value, beginning of period | $10.00 |
| Income from Investment Operations | |
| Net investment income (loss)B | .02 |
| Net realized and unrealized gain (loss) | (.01) |
| Total from investment operations | .01 |
| Net asset value, end of period | $10.01 |
| Total ReturnC,D | .10% |
| Ratios to Average Net AssetsE | |
| Expenses before reductions | .80%F,G |
| Expenses net of fee waivers, if any | .80%F,G |
| Expenses net of all reductions | .80%F,G |
| Net investment income (loss) | 2.05%F |
| Supplemental Data | |
| Net assets, end of period (000 omitted) | $100 |
| Portfolio turnover rateH | 0%I,J |
A For the period August 31, 2018 (commencement of operations) to September 30, 2018.
B Calculated based on average shares outstanding during the period.
C Total returns for periods of less than one year are not annualized.
D Total returns do not include the effect of the sales charges.
E Expense ratios reflect operating expenses of the class. Expenses before reductions do not reflect amounts reimbursed by the investment adviser or reductions from expense offset arrangements and do not represent the amount paid by the class during periods when reimbursements or reductions occur. Expense ratios before reductions for start-up periods may not be representative of longer-term operating periods. Expenses net of fee waivers reflect expenses after reimbursement by the investment adviser but prior to reductions from expense offset arrangements. Expenses net of all reductions represent the net expenses paid by the class but do not include expenses of the underlying funds in which the Fund invests.
F Annualized
G On certain classes, the size and fluctuation of net assets and expense amounts may cause ratios to differ from contractual rates.
H Amounts do not include the activity of the Underlying Funds.
I Amount represents less than 1%.
J Amount not annualized.
See accompanying notes which are an integral part of the financial statements.
Fidelity Freedom Blend 2060 Fund Class M
| | Six months ended (Unaudited) September 30, |
| | 2018 A |
| Selected Per–Share Data | |
| Net asset value, beginning of period | $10.00 |
| Income from Investment Operations | |
| Net investment income (loss)B | .02 |
| Net realized and unrealized gain (loss) | (.01) |
| Total from investment operations | .01 |
| Net asset value, end of period | $10.01 |
| Total ReturnC,D | .10% |
| Ratios to Average Net AssetsE | |
| Expenses before reductions | 1.05%F,G |
| Expenses net of fee waivers, if any | 1.05%F,G |
| Expenses net of all reductions | 1.05%F,G |
| Net investment income (loss) | 1.79%F |
| Supplemental Data | |
| Net assets, end of period (000 omitted) | $100 |
| Portfolio turnover rateH | 0%I,J |
A For the period August 31, 2018 (commencement of operations) to September 30, 2018.
B Calculated based on average shares outstanding during the period.
C Total returns for periods of less than one year are not annualized.
D Total returns do not include the effect of the sales charges.
E Expense ratios reflect operating expenses of the class. Expenses before reductions do not reflect amounts reimbursed by the investment adviser or reductions from expense offset arrangements and do not represent the amount paid by the class during periods when reimbursements or reductions occur. Expense ratios before reductions for start-up periods may not be representative of longer-term operating periods. Expenses net of fee waivers reflect expenses after reimbursement by the investment adviser but prior to reductions from expense offset arrangements. Expenses net of all reductions represent the net expenses paid by the class but do not include expenses of the underlying funds in which the Fund invests.
F Annualized
G On certain classes, the size and fluctuation of net assets and expense amounts may cause ratios to differ from contractual rates.
H Amounts do not include the activity of the Underlying Funds.
I Amount represents less than 1%.
J Amount not annualized.
See accompanying notes which are an integral part of the financial statements.
Fidelity Freedom Blend 2060 Fund Class C
| | Six months ended (Unaudited) September 30, |
| | 2018 A |
| Selected Per–Share Data | |
| Net asset value, beginning of period | $10.00 |
| Income from Investment Operations | |
| Net investment income (loss)B | .01 |
| Net realized and unrealized gain (loss) | (.01) |
| Total from investment operations | – |
| Net asset value, end of period | $10.00 |
| Total ReturnC,D | –% |
| Ratios to Average Net AssetsE | |
| Expenses before reductions | 1.55%F,G |
| Expenses net of fee waivers, if any | 1.55%F,G |
| Expenses net of all reductions | 1.55%F,G |
| Net investment income (loss) | 1.30%F |
| Supplemental Data | |
| Net assets, end of period (000 omitted) | $100 |
| Portfolio turnover rateH | 0%I,J |
A For the period August 31, 2018 (commencement of operations) to September 30, 2018.
B Calculated based on average shares outstanding during the period.
C Total returns for periods of less than one year are not annualized.
D Total returns do not include the effect of the contingent deferred sales charge.
E Expense ratios reflect operating expenses of the class. Expenses before reductions do not reflect amounts reimbursed by the investment adviser or reductions from expense offset arrangements and do not represent the amount paid by the class during periods when reimbursements or reductions occur. Expense ratios before reductions for start-up periods may not be representative of longer-term operating periods. Expenses net of fee waivers reflect expenses after reimbursement by the investment adviser but prior to reductions from expense offset arrangements. Expenses net of all reductions represent the net expenses paid by the class but do not include expenses of the underlying funds in which the Fund invests.
F Annualized
G On certain classes, the size and fluctuation of net assets and expense amounts may cause ratios to differ from contractual rates.
H Amounts do not include the activity of the Underlying Funds.
I Amount represents less than 1%.
J Amount not annualized.
See accompanying notes which are an integral part of the financial statements.
Fidelity Freedom Blend 2060 Fund
| | Six months ended (Unaudited) September 30, |
| | 2018 A |
| Selected Per–Share Data | |
| Net asset value, beginning of period | $10.00 |
| Income from Investment Operations | |
| Net investment income (loss)B | .02 |
| Net realized and unrealized gain (loss) | (.01) |
| Total from investment operations | .01 |
| Net asset value, end of period | $10.01 |
| Total ReturnC | .10% |
| Ratios to Average Net AssetsD | |
| Expenses before reductions | .53%E,F |
| Expenses net of fee waivers, if any | .53%E,F |
| Expenses net of all reductions | .53%E,F |
| Net investment income (loss) | 2.32%E |
| Supplemental Data | |
| Net assets, end of period (000 omitted) | $139 |
| Portfolio turnover rateG | 0%H,I |
A For the period August 31, 2018 (commencement of operations) to September 30, 2018.
B Calculated based on average shares outstanding during the period.
C Total returns for periods of less than one year are not annualized.
D Expense ratios reflect operating expenses of the class. Expenses before reductions do not reflect amounts reimbursed by the investment adviser or reductions from expense offset arrangements and do not represent the amount paid by the class during periods when reimbursements or reductions occur. Expense ratios before reductions for start-up periods may not be representative of longer-term operating periods. Expenses net of fee waivers reflect expenses after reimbursement by the investment adviser but prior to reductions from expense offset arrangements. Expenses net of all reductions represent the net expenses paid by the class but do not include expenses of the underlying funds in which the Fund invests.
E Annualized
F On certain classes, the size and fluctuation of net assets and expense amounts may cause ratios to differ from contractual rates.
G Amounts do not include the activity of the Underlying Funds.
H Amount represents less than 1%.
I Amount not annualized.
See accompanying notes which are an integral part of the financial statements.
Fidelity Freedom Blend 2060 Fund Class K
| | Six months ended (Unaudited) September 30, |
| | 2018 A |
| Selected Per–Share Data | |
| Net asset value, beginning of period | $10.00 |
| Income from Investment Operations | |
| Net investment income (loss)B | .02 |
| Net realized and unrealized gain (loss) | (.01) |
| Total from investment operations | .01 |
| Net asset value, end of period | $10.01 |
| Total ReturnC | .10% |
| Ratios to Average Net AssetsD | |
| Expenses before reductions | .44%E |
| Expenses net of fee waivers, if any | .44%E |
| Expenses net of all reductions | .44%E |
| Net investment income (loss) | 2.40%E |
| Supplemental Data | |
| Net assets, end of period (000 omitted) | $100 |
| Portfolio turnover rateF | 0%G,H |
A For the period August 31, 2018 (commencement of operations) to September 30, 2018.
B Calculated based on average shares outstanding during the period.
C Total returns for periods of less than one year are not annualized.
D Expense ratios reflect operating expenses of the class. Expenses before reductions do not reflect amounts reimbursed by the investment adviser or reductions from expense offset arrangements and do not represent the amount paid by the class during periods when reimbursements or reductions occur. Expense ratios before reductions for start-up periods may not be representative of longer-term operating periods. Expenses net of fee waivers reflect expenses after reimbursement by the investment adviser but prior to reductions from expense offset arrangements. Expenses net of all reductions represent the net expenses paid by the class but do not include expenses of the underlying funds in which the Fund invests.
E Annualized
F Amounts do not include the activity of the Underlying Funds.
G Amount represents less than 1%.
H Amount not annualized.
See accompanying notes which are an integral part of the financial statements.
Fidelity Freedom Blend 2060 Fund Class K6
| | Six months ended (Unaudited) September 30, |
| | 2018 A |
| Selected Per–Share Data | |
| Net asset value, beginning of period | $10.00 |
| Income from Investment Operations | |
| Net investment income (loss)B | .02 |
| Net realized and unrealized gain (loss) | (.01) |
| Total from investment operations | .01 |
| Net asset value, end of period | $10.01 |
| Total ReturnC | .10% |
| Ratios to Average Net AssetsD | |
| Expenses before reductions | .33%E,F |
| Expenses net of fee waivers, if any | .33%E,F |
| Expenses net of all reductions | .33%E,F |
| Net investment income (loss) | 2.51%E |
| Supplemental Data | |
| Net assets, end of period (000 omitted) | $100 |
| Portfolio turnover rateG | 0%H,I |
A For the period August 31, 2018 (commencement of operations) to September 30, 2018.
B Calculated based on average shares outstanding during the period.
C Total returns for periods of less than one year are not annualized.
D Expense ratios reflect operating expenses of the class. Expenses before reductions do not reflect amounts reimbursed by the investment adviser or reductions from expense offset arrangements and do not represent the amount paid by the class during periods when reimbursements or reductions occur. Expenses net of fee waivers reflect expenses after reimbursement by the investment adviser but prior to reductions from expense offset arrangements. Expenses net of all reductions represent the net expenses paid by the class but do not include expenses of the underlying funds in which the Fund invests.
E Annualized
F On certain classes, the size and fluctuation of net assets and expense amounts may cause ratios to differ from contractual rates.
G Amounts do not include the activity of the Underlying Funds.
H Amount represents less than 1%.
I Amount not annualized.
See accompanying notes which are an integral part of the financial statements.
Fidelity Freedom Blend 2060 Fund Class I
| | Six months ended (Unaudited) September 30, |
| | 2018 A |
| Selected Per–Share Data | |
| Net asset value, beginning of period | $10.00 |
| Income from Investment Operations | |
| Net investment income (loss)B | .02 |
| Net realized and unrealized gain (loss) | (.01) |
| Total from investment operations | .01 |
| Net asset value, end of period | $10.01 |
| Total ReturnC | .10% |
| Ratios to Average Net AssetsD | |
| Expenses before reductions | .54%E |
| Expenses net of fee waivers, if any | .54%E |
| Expenses net of all reductions | .54%E |
| Net investment income (loss) | 2.30%E |
| Supplemental Data | |
| Net assets, end of period (000 omitted) | $100 |
| Portfolio turnover rateF | 0%G,H |
A For the period August 31, 2018 (commencement of operations) to September 30, 2018.
B Calculated based on average shares outstanding during the period.
C Total returns for periods of less than one year are not annualized.
D Expense ratios reflect operating expenses of the class. Expenses before reductions do not reflect amounts reimbursed by the investment adviser or reductions from expense offset arrangements and do not represent the amount paid by the class during periods when reimbursements or reductions occur. Expense ratios before reductions for start-up periods may not be representative of longer-term operating periods. Expenses net of fee waivers reflect expenses after reimbursement by the investment adviser but prior to reductions from expense offset arrangements. Expenses net of all reductions represent the net expenses paid by the class but do not include expenses of the underlying funds in which the Fund invests.
E Annualized
F Amounts do not include the activity of the Underlying Funds.
G Amount represents less than 1%.
H Amount not annualized.
See accompanying notes which are an integral part of the financial statements.
Fidelity Freedom Blend 2060 Fund Class Z
| | Six months ended (Unaudited) September 30, |
| | 2018 A |
| Selected Per–Share Data | |
| Net asset value, beginning of period | $10.00 |
| Income from Investment Operations | |
| Net investment income (loss)B | .02 |
| Net realized and unrealized gain (loss) | (.01) |
| Total from investment operations | .01 |
| Net asset value, end of period | $10.01 |
| Total ReturnC | .10% |
| Ratios to Average Net AssetsD | |
| Expenses before reductions | .44%E |
| Expenses net of fee waivers, if any | .44%E |
| Expenses net of all reductions | .44%E |
| Net investment income (loss) | 2.40%E |
| Supplemental Data | |
| Net assets, end of period (000 omitted) | $100 |
| Portfolio turnover rateF | 0%G,H |
A For the period August 31, 2018 (commencement of operations) to September 30, 2018.
B Calculated based on average shares outstanding during the period.
C Total returns for periods of less than one year are not annualized.
D Expense ratios reflect operating expenses of the class. Expenses before reductions do not reflect amounts reimbursed by the investment adviser or reductions from expense offset arrangements and do not represent the amount paid by the class during periods when reimbursements or reductions occur. Expense ratios before reductions for start-up periods may not be representative of longer-term operating periods. Expenses net of fee waivers reflect expenses after reimbursement by the investment adviser but prior to reductions from expense offset arrangements. Expenses net of all reductions represent the net expenses paid by the class but do not include expenses of the underlying funds in which the Fund invests.
E Annualized
F Amounts do not include the activity of the Underlying Funds.
G Amount represents less than 1%.
H Amount not annualized.
See accompanying notes which are an integral part of the financial statements.
Fidelity Freedom Blend 2060 Fund Class Z6
| | Six months ended (Unaudited) September 30, |
| | 2018 A |
| Selected Per–Share Data | |
| Net asset value, beginning of period | $10.00 |
| Income from Investment Operations | |
| Net investment income (loss)B | .02 |
| Net realized and unrealized gain (loss) | (.01) |
| Total from investment operations | .01 |
| Net asset value, end of period | $10.01 |
| Total ReturnC | .10% |
| Ratios to Average Net AssetsD | |
| Expenses before reductions | .33%E,F |
| Expenses net of fee waivers, if any | .33%E,F |
| Expenses net of all reductions | .33%E,F |
| Net investment income (loss) | 2.51%E |
| Supplemental Data | |
| Net assets, end of period (000 omitted) | $100 |
| Portfolio turnover rateG | 0%H,I |
A For the period August 31, 2018 (commencement of operations) to September 30, 2018.
B Calculated based on average shares outstanding during the period.
C Total returns for periods of less than one year are not annualized.
D Expense ratios reflect operating expenses of the class. Expenses before reductions do not reflect amounts reimbursed by the investment adviser or reductions from expense offset arrangements and do not represent the amount paid by the class during periods when reimbursements or reductions occur. Expenses net of fee waivers reflect expenses after reimbursement by the investment adviser but prior to reductions from expense offset arrangements. Expenses net of all reductions represent the net expenses paid by the class but do not include expenses of the underlying funds in which the Fund invests.
E Annualized
F On certain classes, the size and fluctuation of net assets and expense amounts may cause ratios to differ from contractual rates.
G Amounts do not include the activity of the Underlying Funds.
H Amount represents less than 1%.
I Amount not annualized.
See accompanying notes which are an integral part of the financial statements.
Notes to Financial Statements (Unaudited)
For the period ended September 30, 2018
1. Organization.
Fidelity Freedom Blend Income Fund, Fidelity Freedom Blend 2005 Fund, Fidelity Freedom Blend 2010 Fund, Fidelity Freedom Blend 2015 Fund, Fidelity Freedom Blend 2020 Fund, Fidelity Freedom Blend 2025 Fund, Fidelity Freedom Blend 2030 Fund, Fidelity Freedom Blend 2035 Fund, Fidelity Freedom Blend 2040 Fund, Fidelity Freedom Blend 2045 Fund, Fidelity Freedom Blend 2050 Fund, Fidelity Freedom Blend 2055 Fund and Fidelity Freedom Blend 2060 Fund (the Funds) are funds of Fidelity Aberdeen Street Trust (the Trust). The Trust is registered under the Investment Company Act of 1940, as amended (the 1940 Act), as an open-end management investment company organized as a Delaware statutory trust. Each Fund is authorized to issue an unlimited number of shares. Each Fund offers Class A, Class M, Class C, Fidelity Freedom Blend, Class K, Class K6, Class I, Class Z and Class Z6 shares, each of which has equal rights as to assets and voting privileges. Each class has exclusive voting rights with respect to matters that affect that class. The Funds invest primarily in a combination of other Fidelity equity, bond, and short-term funds (the Underlying Funds) managed by Fidelity Management & Research Company (FMR). Certain Underlying Funds incurred name changes since their most recent shareholder report. The names of the Underlying Funds are those in effect at period end.
2. Investments in Fidelity Central Funds.
The Funds invest in Fidelity Central Funds, which are open-end investment companies generally available only to other investment companies and accounts managed by the investment adviser and its affiliates. The Funds' Schedules of Investments list each of the Fidelity Central Funds held as of period end, if any, as an investment of each Fund, but do not include the underlying holdings of each Fidelity Central Fund. As an Investing Fund, each Fund indirectly bears its proportionate share of the expenses of the underlying Fidelity Central Funds.
The Money Market Central Funds seek preservation of capital and current income and are managed by Fidelity Investments Money Management, Inc. (FIMM), an affiliate of the investment adviser. Annualized expenses of the Money Market Central Funds as of their most recent shareholder report date are less than .005%.
A complete unaudited list of holdings for each Fidelity Central Fund is available upon request or at the Securities and Exchange Commission (the SEC) website at www.sec.gov. In addition, the financial statements of the Fidelity Central Funds are available on the SEC website or upon request.
3. Significant Accounting Policies.
Each Fund is an investment company and applies the accounting and reporting guidance of the Financial Accounting Standards Board (FASB) Accounting Standards Codification Topic 946 Financial Services – Investments Companies. The financial statements have been prepared in conformity with accounting principles generally accepted in the United States of America (GAAP), which require management to make certain estimates and assumptions at the date of the financial statements. Actual results could differ from those estimates. Subsequent events, if any, through the date that the financial statements were issued have been evaluated in the preparation of the financial statements. The following summarizes the significant accounting policies of the Funds:
Investment Valuation. Investments are valued as of 4:00 p.m. Eastern time on the last calendar day of the period. Each Fund categorizes the inputs to valuation techniques used to value its investments into a disclosure hierarchy consisting of three levels as shown below:
- Level 1 – quoted prices in active markets for identical investments
- Level 2 – other significant observable inputs (including quoted prices for similar investments, interest rates, prepayment speeds, etc.)
- Level 3 – unobservable inputs (including the Fund's own assumptions based on the best information available)
Valuation techniques used to value each Fund's investments by major category are as follows. Investments in the Underlying Funds are valued at their closing net asset value (NAV) each business day and are categorized as Level 1 in the hierarchy.
Investment Transactions and Income. For financial reporting purposes, the Funds' investment holdings and NAV include trades executed through the end of the last business day of the period. The NAV per share for processing shareholder transactions is calculated as of the close of business of the New York Stock Exchange (NYSE), normally 4:00 p.m. Eastern time and includes trades executed through the end of the prior business day. Gains and losses on securities sold are determined on the basis of identified cost. Income and capital gain distributions from the Underlying Funds, if any, are recorded on the ex-dividend date.
Class Allocations and Expenses. Investment income, realized and unrealized capital gains and losses, common expenses of each Fund, and certain fund-level expense reductions, if any, are allocated daily on a pro-rata basis to each class based on the relative net assets of each class to the total net assets of each Fund. Each class differs with respect to distribution and service plan fees incurred. Certain expense reductions may also differ by class. For the reporting period, the allocated portion of income and expenses to each class as a percent of its average net assets may vary due to the timing of recording these transactions in relation to fluctuating net assets of the classes. Expenses directly attributable to a fund are charged to that fund. Expenses attributable to more than one fund are allocated among the respective funds on the basis of relative net assets or other appropriate methods. Expenses included in the accompanying financial statements reflect the expenses of each Fund and do not include any expenses associated with the Underlying Funds. Although not included in each Fund's expenses, each Fund indirectly bears its proportionate share of the Underlying Funds' expenses through the impact of these expenses on each Underlying Fund's NAV. Expense estimates are accrued in the period to which they relate and adjustments are made when actual amounts are known.
Income Tax Information and Distributions to Shareholders. Each year, each Fund intends to qualify as a regulated investment company under Subchapter M of the Internal Revenue Code, including distributing substantially all of its taxable income and realized gains. As a result, no provision for U.S. Federal income taxes is required. Each Fund files a U.S. federal tax return, in addition to state and local tax returns as required. Each Fund's federal income tax returns are subject to examination by the Internal Revenue Service (IRS) for a period of three fiscal years after they are filed. State and local tax returns may be subject to examination for an additional fiscal year depending on the jurisdiction.
Distributions are declared and recorded on the ex-dividend date. Income and capital gain distributions are declared separately for each class. Income and capital gain distributions are determined in accordance with income tax regulations, which may differ from GAAP.
Capital accounts within the financial statements are adjusted for permanent book-tax differences. These adjustments have no impact on net assets or the results of operations. Capital accounts are not adjusted for temporary book-tax differences which will reverse in a subsequent period.
As of period end, the cost and unrealized appreciation (depreciation) in securities, and derivatives if applicable, for federal income tax purposes were as follows for each Fund:
| | Tax cost | Gross unrealized appreciation | Gross unrealized depreciation | Net unrealized appreciation (depreciation) |
| Fidelity Freedom Blend Income Fund | $904,764 | $849 | $(8,175) | $(7,326) |
| Fidelity Freedom Blend 2005 Fund | 908,862 | 1,189 | (9,444) | (8,255) |
| Fidelity Freedom Blend 2010 Fund | 917,167 | 1,543 | (10,717) | (9,174) |
| Fidelity Freedom Blend 2015 Fund | 908,625 | 1,844 | (11,967) | (10,123) |
| Fidelity Freedom Blend 2020 Fund | 939,762 | 2,267 | (13,015) | (10,748) |
| Fidelity Freedom Blend 2025 Fund | 924,068 | 2,412 | (14,006) | (11,594) |
| Fidelity Freedom Blend 2030 Fund | 965,916 | 2,964 | (15,884) | (12,920) |
| Fidelity Freedom Blend 2035 Fund | 1,115,182 | 4,472 | (17,540) | (13,068) |
| Fidelity Freedom Blend 2040 Fund | 932,707 | 3,713 | (17,315) | (13,602) |
| Fidelity Freedom Blend 2045 Fund | 1,075,626 | 4,819 | (18,198) | (13,379) |
| Fidelity Freedom Blend 2050 Fund | 919,086 | 3,504 | (17,062) | (13,558) |
| Fidelity Freedom Blend 2055 Fund | 915,814 | 3,458 | (17,063) | (13,605) |
| Fidelity Freedom Blend 2060 Fund | 953,260 | 3,548 | (17,234) | (13,686) |
4. Purchases and Sales of Investments.
Purchases and sales of securities (including the Underlying Fund shares), other than short-term securities, are noted in the table below.
| | Purchases ($) | Sales ($) |
| Fidelity Freedom Blend Income Fund | 911,290 | 6,519 |
| Fidelity Freedom Blend 2005 Fund | 914,830 | 5,953 |
| Fidelity Freedom Blend 2010 Fund | 922,431 | 5,260 |
| Fidelity Freedom Blend 2015 Fund | 913,165 | 4,559 |
| Fidelity Freedom Blend 2020 Fund | 943,340 | 3,595 |
| Fidelity Freedom Blend 2025 Fund | 927,176 | 3,127 |
| Fidelity Freedom Blend 2030 Fund | 968,300 | 2,412 |
| Fidelity Freedom Blend 2035 Fund | 1,115,153 | 20 |
| Fidelity Freedom Blend 2040 Fund | 932,697 | 39 |
| Fidelity Freedom Blend 2045 Fund | 1,075,620 | 43 |
| Fidelity Freedom Blend 2050 Fund | 919,076 | 39 |
| Fidelity Freedom Blend 2055 Fund | 915,802 | 37 |
| Fidelity Freedom Blend 2060 Fund | 953,251 | 40 |
5. Fees and Other Transactions with Affiliates.
Management Fee and Expense Contract. FMR Co., Inc. (the investment adviser), an affiliate of FMR, and its affiliates provide the Funds with investment management related services. Under the management contract, each Class of each Fund pays a monthly management fee that is set at an annual rate by referring to each Fund's target date, indicated by its name, such that the management fee rate applicable to each Class of each Fund is reduced as the fund approaches, and then passes, its target date. In addition, under the management contract, the investment adviser pays all ordinary operating expenses of each Fund, except distribution and service plan fees, fees and expenses of the independent Trustees, and certain miscellaneous expenses such as proxy and shareholder meeting expenses. During the period, fees and expenses of the Independent Trustees incurred by each Fund were less than fifty cents. For the reporting period, the total annual management fee rate for each Class of each Fund was as follows:
| | Annual % of Class-Level Average Net Assets (Classes A, M, C, I, Fidelity Freedom Blend Class) | Annual % of Class-Level Average Net Assets
(Classes K, K6, Z, Z6) |
| Fidelity Freedom Blend Income Fund | .46% | .36% |
| Fidelity Freedom Blend 2005 Fund | .46% | .36% |
| Fidelity Freedom Blend 2010 Fund | .47% | .37% |
| Fidelity Freedom Blend 2015 Fund | .49% | .39% |
| Fidelity Freedom Blend 2020 Fund | .50% | .40% |
| Fidelity Freedom Blend 2025 Fund | .51% | .41% |
| Fidelity Freedom Blend 2030 Fund | .52% | .42% |
| Fidelity Freedom Blend 2035 Fund | .53% | .43% |
| Fidelity Freedom Blend 2040 Fund | .54% | .44% |
| Fidelity Freedom Blend 2045 Fund | .54% | .44% |
| Fidelity Freedom Blend 2050 Fund | .54% | .44% |
| Fidelity Freedom Blend 2055 Fund | .54% | .44% |
| Fidelity Freedom Blend 2060 Fund | .54% | .44% |
Under the expense contract, the investment adviser pays class-level expenses for Class K6 and Class Z6 of each Fund as necessary so that Class K6 and Class Z6 total expenses do not exceed certain amounts of Class K6 and Class Z6 average net assets, respectively, on an annual basis with certain exceptions, as noted in the following table:
| | Annual % of Class-Level Average Net Assets (Class K6, Z6) |
| Fidelity Freedom Blend Income Fund | .26% |
| Fidelity Freedom Blend 2005 Fund | .26% |
| Fidelity Freedom Blend 2010 Fund | .27% |
| Fidelity Freedom Blend 2015 Fund | .29% |
| Fidelity Freedom Blend 2020 Fund | .30% |
| Fidelity Freedom Blend 2025 Fund | .31% |
| Fidelity Freedom Blend 2030 Fund | .32% |
| Fidelity Freedom Blend 2035 Fund | .33% |
| Fidelity Freedom Blend 2040 Fund | .34% |
| Fidelity Freedom Blend 2045 Fund | .34% |
| Fidelity Freedom Blend 2050 Fund | .34% |
| Fidelity Freedom Blend 2055 Fund | .34% |
| Fidelity Freedom Blend 2060 Fund | .34% |
Distribution and Service Plan Fees. In accordance with Rule 12b-1 of the 1940 Act, each Fund has adopted separate Distribution and Service Plans for each class of shares. Certain classes pay Fidelity Distributors Corporation (FDC), an affiliate of the investment adviser, separate Distribution and Service Fees, each of which is based on an annual percentage of each class' average net assets. In addition, FDC may pay financial intermediaries for selling shares of each Fund and providing shareholder support services. For the period, the Distribution and Service Fee rates, total fees and amounts retained by FDC were as follows:
| | Distribution Fee | Service Fee | Total Fees | Retained by FDC |
| Fidelity Freedom Blend Income Fund | | | | |
| Class A | -% | .25% | $22 | $22 |
| Class M | .25% | .25% | 44 | 44 |
| Class C | .75% | .25% | 87 | 87 |
| | | | $153 | $153 |
| Fidelity Freedom Blend 2005 Fund | | | | |
| Class A | -% | .25% | $22 | $22 |
| Class M | .25% | .25% | 44 | 44 |
| Class C | .75% | .25% | 87 | 87 |
| | | | $153 | $153 |
| Fidelity Freedom Blend 2010 Fund | | | | |
| Class A | -% | .25% | $22 | $22 |
| Class M | .25% | .25% | 44 | 44 |
| Class C | .75% | .25% | 87 | 87 |
| | | | $153 | $153 |
| Fidelity Freedom Blend 2015 Fund | | | | |
| Class A | -% | .25% | $22 | $22 |
| Class M | .25% | .25% | 44 | 44 |
| Class C | .75% | .25% | 87 | 87 |
| | | | $153 | $153 |
| Fidelity Freedom Blend 2020 Fund | | | | |
| Class A | -% | .25% | $22 | $22 |
| Class M | .25% | .25% | 44 | 44 |
| Class C | .75% | .25% | 87 | 87 |
| | | | $153 | $153 |
| Fidelity Freedom Blend 2025 Fund | | | | |
| Class A | -% | .25% | $22 | $22 |
| Class M | .25% | .25% | 44 | 44 |
| Class C | .75% | .25% | 87 | 87 |
| | | | $153 | $153 |
| Fidelity Freedom Blend 2030 Fund | | | | |
| Class A | -% | .25% | $22 | $22 |
| Class M | .25% | .25% | 44 | 44 |
| Class C | .75% | .25% | 87 | 87 |
| | | | $153 | $153 |
| Fidelity Freedom Blend 2035 Fund | | | | |
| Class A | -% | .25% | $22 | $22 |
| Class M | .25% | .25% | 44 | 44 |
| Class C | .75% | .25% | 87 | 87 |
| | | | $153 | $153 |
| Fidelity Freedom Blend 2040 Fund | | | | |
| Class A | -% | .25% | $22 | $22 |
| Class M | .25% | .25% | 44 | 44 |
| Class C | .75% | .25% | 87 | 87 |
| | | | $153 | $153 |
| Fidelity Freedom Blend 2045 Fund | | | | |
| Class A | -% | .25% | $23 | $23 |
| Class M | .25% | .25% | 44 | 44 |
| Class C | .75% | .25% | 87 | 87 |
| | | | $154 | $154 |
| Fidelity Freedom Blend 2050 Fund | | | | |
| Class A | -% | .25% | $22 | $22 |
| Class M | .25% | .25% | 44 | 44 |
| Class C | .75% | .25% | 87 | 87 |
| | | | $153 | $153 |
| Fidelity Freedom Blend 2055 Fund | | | | |
| Class A | -% | .25% | $22 | $22 |
| Class M | .25% | .25% | 44 | 44 |
| Class C | .75% | .25% | 87 | 87 |
| | | | $153 | $153 |
| Fidelity Freedom Blend 2060 Fund | | | | |
| Class A | -% | .25% | $22 | $22 |
| Class M | .25% | .25% | 44 | 44 |
| Class C | .75% | .25% | 87 | 87 |
| | | | $153 | $153 |
Sales Load. FDC may receive a front-end sales charge of up to 5.75% for selling Class A shares and 3.50% for selling Class M shares, some of which is paid to financial intermediaries for selling shares of each Fund. Depending on the holding period, FDC may receive contingent deferred sales charges levied on Class A, Class M and Class C redemptions. The deferred sales charges are 1.00% for Class C shares, 1.00% for certain purchases of Class A shares and .25% for certain purchases of Class M shares.
For the period, sales charge amounts retained by FDC were as follows:
| | Retained by FDC |
| Fidelity Freedom Blend 2045 Fund | |
| Class A | $107 |
| | $107 |
6. Share Transactions.
Share transactions for each class were as follows and may contain automatic conversions between classes or exchanges between affiliated funds:
| | Shares | Dollars |
| | Six months ended September 30, 2018(a) | Six months ended September 30, 2018(a) |
| Fidelity Freedom Blend Income Fund | | |
| Class A | | |
| Shares sold | 10,000 | $100,000 |
| Net increase (decrease) | 10,000 | $100,000 |
| Class M | | |
| Shares sold | 10,000 | $100,000 |
| Net increase (decrease) | 10,000 | $100,000 |
| Class C | | |
| Shares sold | 10,000 | $100,000 |
| Net increase (decrease) | 10,000 | $100,000 |
| Fidelity Freedom Blend Income Fund | | |
| Shares sold | 10,020 | $100,201 |
| Net increase (decrease) | 10,020 | $100,201 |
| Class K | | |
| Shares sold | 10,000 | $100,000 |
| Net increase (decrease) | 10,000 | $100,000 |
| Class K6 | | |
| Shares sold | 10,000 | $100,000 |
| Net increase (decrease) | 10,000 | $100,000 |
| Class I | | |
| Shares sold | 10,000 | $100,000 |
| Net increase (decrease) | 10,000 | $100,000 |
| Class Z | | |
| Shares sold | 10,000 | $100,000 |
| Net increase (decrease) | 10,000 | $100,000 |
| Class Z6 | | |
| Shares sold | 10,000 | $100,000 |
| Net increase (decrease) | 10,000 | $100,000 |
| Fidelity Freedom Blend 2005 Fund | | |
| Class A | | |
| Shares sold | 10,000 | $100,000 |
| Net increase (decrease) | 10,000 | $100,000 |
| Class M | | |
| Shares sold | 10,000 | $100,000 |
| Net increase (decrease) | 10,000 | $100,000 |
| Class C | | |
| Shares sold | 10,000 | $100,000 |
| Net increase (decrease) | 10,000 | $100,000 |
| Fidelity Freedom Blend 2005 Fund | | |
| Shares sold | 10,302 | $103,000 |
| Net increase (decrease) | 10,302 | $103,000 |
| Class K | | |
| Shares sold | 10,000 | $100,000 |
| Net increase (decrease) | 10,000 | $100,000 |
| Class K6 | | |
| Shares sold | 10,000 | $100,000 |
| Net increase (decrease) | 10,000 | $100,000 |
| Class I | | |
| Shares sold | 10,000 | $100,000 |
| Net increase (decrease) | 10,000 | $100,000 |
| Class Z | | |
| Shares sold | 10,000 | $100,000 |
| Net increase (decrease) | 10,000 | $100,000 |
| Class Z6 | | |
| Shares sold | 10,000 | $100,000 |
| Net increase (decrease) | 10,000 | $100,000 |
| Fidelity Freedom Blend 2010 Fund | | |
| Class A | | |
| Shares sold | 10,000 | $100,000 |
| Net increase (decrease) | 10,000 | $100,000 |
| Class M | | |
| Shares sold | 10,000 | $100,000 |
| Net increase (decrease) | 10,000 | $100,000 |
| Class C | | |
| Shares sold | 10,000 | $100,000 |
| Net increase (decrease) | 10,000 | $100,000 |
| Fidelity Freedom Blend 2010 Fund | | |
| Shares sold | 11,005 | $110,000 |
| Net increase (decrease) | 11,005 | $110,000 |
| Class K | | |
| Shares sold | 10,000 | $100,000 |
| Net increase (decrease) | 10,000 | $100,000 |
| Class K6 | | |
| Shares sold | 10,000 | $100,000 |
| Net increase (decrease) | 10,000 | $100,000 |
| Class I | | |
| Shares sold | 10,000 | $100,000 |
| Net increase (decrease) | 10,000 | $100,000 |
| Class Z | | |
| Shares sold | 10,000 | $100,000 |
| Net increase (decrease) | 10,000 | $100,000 |
| Class Z6 | | |
| Shares sold | 10,000 | $100,000 |
| Net increase (decrease) | 10,000 | $100,000 |
| Fidelity Freedom Blend 2015 Fund | | |
| Class A | | |
| Shares sold | 10,000 | $100,000 |
| Net increase (decrease) | 10,000 | $100,000 |
| Class M | | |
| Shares sold | 10,000 | $100,000 |
| Net increase (decrease) | 10,000 | $100,000 |
| Class C | | |
| Shares sold | 10,000 | $100,000 |
| Net increase (decrease) | 10,000 | $100,000 |
| Fidelity Freedom Blend 2015 Fund | | |
| Shares sold | 10,012 | $100,115 |
| Net increase (decrease) | 10,012 | $100,115 |
| Class K | | |
| Shares sold | 10,000 | $100,000 |
| Net increase (decrease) | 10,000 | $100,000 |
| Class K6 | | |
| Shares sold | 10,000 | $100,000 |
| Net increase (decrease) | 10,000 | $100,000 |
| Class I | | |
| Shares sold | 10,000 | $100,000 |
| Net increase (decrease) | 10,000 | $100,000 |
| Class Z | | |
| Shares sold | 10,000 | $100,000 |
| Net increase (decrease) | 10,000 | $100,000 |
| Class Z6 | | |
| Shares sold | 10,000 | $100,000 |
| Net increase (decrease) | 10,000 | $100,000 |
| Fidelity Freedom Blend 2020 Fund | | |
| Class A | | |
| Shares sold | 10,000 | $100,000 |
| Net increase (decrease) | 10,000 | $100,000 |
| Class M | | |
| Shares sold | 10,000 | $100,000 |
| Net increase (decrease) | 10,000 | $100,000 |
| Class C | | |
| Shares sold | 10,000 | $100,000 |
| Net increase (decrease) | 10,000 | $100,000 |
| Fidelity Freedom Blend 2020 Fund | | |
| Shares sold | 13,031 | $130,159 |
| Net increase (decrease) | 13,031 | $130,159 |
| Class K | | |
| Shares sold | 10,000 | $100,000 |
| Net increase (decrease) | 10,000 | $100,000 |
| Class K6 | | |
| Shares sold | 10,000 | $100,000 |
| Net increase (decrease) | 10,000 | $100,000 |
| Class I | | |
| Shares sold | 10,000 | $100,000 |
| Net increase (decrease) | 10,000 | $100,000 |
| Class Z | | |
| Shares sold | 10,000 | $100,000 |
| Net increase (decrease) | 10,000 | $100,000 |
| Class Z6 | | |
| Shares sold | 10,000 | $100,000 |
| Net increase (decrease) | 10,000 | $100,000 |
| Fidelity Freedom Blend 2025 Fund | | |
| Class A | | |
| Shares sold | 10,000 | $100,000 |
| Net increase (decrease) | 10,000 | $100,000 |
| Class M | | |
| Shares sold | 10,000 | $100,000 |
| Net increase (decrease) | 10,000 | $100,000 |
| Class C | | |
| Shares sold | 10,000 | $100,000 |
| Net increase (decrease) | 10,000 | $100,000 |
| Fidelity Freedom Blend 2025 Fund | | |
| Shares sold | 11,353 | $113,500 |
| Net increase (decrease) | 11,353 | $113,500 |
| Class K | | |
| Shares sold | 10,000 | $100,000 |
| Net increase (decrease) | 10,000 | $100,000 |
| Class K6 | | |
| Shares sold | 10,000 | $100,000 |
| Net increase (decrease) | 10,000 | $100,000 |
| Class I | | |
| Shares sold | 10,000 | $100,000 |
| Net increase (decrease) | 10,000 | $100,000 |
| Class Z | | |
| Shares sold | 10,000 | $100,000 |
| Net increase (decrease) | 10,000 | $100,000 |
| Class Z6 | | |
| Shares sold | 10,000 | $100,000 |
| Net increase (decrease) | 10,000 | $100,000 |
| Fidelity Freedom Blend 2030 Fund | | |
| Class A | | |
| Shares sold | 10,000 | $100,000 |
| Net increase (decrease) | 10,000 | $100,000 |
| Class M | | |
| Shares sold | 10,000 | $100,000 |
| Net increase (decrease) | 10,000 | $100,000 |
| Class C | | |
| Shares sold | 10,000 | $100,000 |
| Net increase (decrease) | 10,000 | $100,000 |
| Fidelity Freedom Blend 2030 Fund | | |
| Shares sold | 15,343 | $153,352 |
| Net increase (decrease) | 15,343 | $153,352 |
| Class K | | |
| Shares sold | 10,000 | $100,000 |
| Net increase (decrease) | 10,000 | $100,000 |
| Class K6 | | |
| Shares sold | 10,000 | $100,000 |
| Net increase (decrease) | 10,000 | $100,000 |
| Class I | | |
| Shares sold | 10,000 | $100,000 |
| Net increase (decrease) | 10,000 | $100,000 |
| Class Z | | |
| Shares sold | 10,000 | $100,000 |
| Net increase (decrease) | 10,000 | $100,000 |
| Class Z6 | | |
| Shares sold | 10,000 | $100,000 |
| Net increase (decrease) | 10,000 | $100,000 |
| Fidelity Freedom Blend 2035 Fund | | |
| Class A | | |
| Shares sold | 10,000 | $100,000 |
| Net increase (decrease) | 10,000 | $100,000 |
| Class M | | |
| Shares sold | 10,000 | $100,000 |
| Net increase (decrease) | 10,000 | $100,000 |
| Class C | | |
| Shares sold | 10,000 | $100,000 |
| Net increase (decrease) | 10,000 | $100,000 |
| Fidelity Freedom Blend 2035 Fund | | |
| Shares sold | 30,154 | $300,679 |
| Net increase (decrease) | 30,154 | $300,679 |
| Class K | | |
| Shares sold | 10,000 | $100,000 |
| Net increase (decrease) | 10,000 | $100,000 |
| Class K6 | | |
| Shares sold | 10,000 | $100,000 |
| Net increase (decrease) | 10,000 | $100,000 |
| Class I | | |
| Shares sold | 10,000 | $100,000 |
| Net increase (decrease) | 10,000 | $100,000 |
| Class Z | | |
| Shares sold | 10,000 | $100,000 |
| Net increase (decrease) | 10,000 | $100,000 |
| Class Z6 | | |
| Shares sold | 10,000 | $100,000 |
| Net increase (decrease) | 10,000 | $100,000 |
| Fidelity Freedom Blend 2040 Fund | | |
| Class A | | |
| Shares sold | 10,000 | $100,000 |
| Net increase (decrease) | 10,000 | $100,000 |
| Class M | | |
| Shares sold | 10,000 | $100,000 |
| Net increase (decrease) | 10,000 | $100,000 |
| Class C | | |
| Shares sold | 10,000 | $100,000 |
| Net increase (decrease) | 10,000 | $100,000 |
| Fidelity Freedom Blend 2040 Fund | | |
| Shares sold | 11,789 | $117,625 |
| Net increase (decrease) | 11,789 | $117,625 |
| Class K | | |
| Shares sold | 10,000 | $100,000 |
| Net increase (decrease) | 10,000 | $100,000 |
| Class K6 | | |
| Shares sold | 10,000 | $100,000 |
| Net increase (decrease) | 10,000 | $100,000 |
| Class I | | |
| Shares sold | 10,000 | $100,000 |
| Net increase (decrease) | 10,000 | $100,000 |
| Class Z | | |
| Shares sold | 10,000 | $100,000 |
| Net increase (decrease) | 10,000 | $100,000 |
| Class Z6 | | |
| Shares sold | 10,000 | $100,000 |
| Net increase (decrease) | 10,000 | $100,000 |
| Fidelity Freedom Blend 2045 Fund | | |
| Class A | | |
| Shares sold | 13,013 | $130,076 |
| Net increase (decrease) | 13,013 | $130,076 |
| Class M | | |
| Shares sold | 10,000 | $100,000 |
| Net increase (decrease) | 10,000 | $100,000 |
| Class C | | |
| Shares sold | 10,000 | $100,000 |
| Net increase (decrease) | 10,000 | $100,000 |
| Fidelity Freedom Blend 2045 Fund | | |
| Shares sold | 23,070 | $229,923 |
| Net increase (decrease) | 23,070 | $229,923 |
| Class K | | |
| Shares sold | 10,000 | $100,000 |
| Net increase (decrease) | 10,000 | $100,000 |
| Class K6 | | |
| Shares sold | 10,000 | $100,000 |
| Net increase (decrease) | 10,000 | $100,000 |
| Class I | | |
| Shares sold | 10,000 | $100,000 |
| Net increase (decrease) | 10,000 | $100,000 |
| Class Z | | |
| Shares sold | 10,000 | $100,000 |
| Net increase (decrease) | 10,000 | $100,000 |
| Class Z6 | | |
| Shares sold | 10,000 | $100,000 |
| Net increase (decrease) | 10,000 | $100,000 |
| Fidelity Freedom Blend 2050 Fund | | |
| Class A | | |
| Shares sold | 10,000 | $100,000 |
| Net increase (decrease) | 10,000 | $100,000 |
| Class M | | |
| Shares sold | 10,000 | $100,000 |
| Net increase (decrease) | 10,000 | $100,000 |
| Class C | | |
| Shares sold | 10,000 | $100,000 |
| Net increase (decrease) | 10,000 | $100,000 |
| Fidelity Freedom Blend 2050 Fund | | |
| Shares sold | 10,434 | $104,295 |
| Net increase (decrease) | 10,434 | $104,295 |
| Class K | | |
| Shares sold | 10,000 | $100,000 |
| Net increase (decrease) | 10,000 | $100,000 |
| Class K6 | | |
| Shares sold | 10,000 | $100,000 |
| Net increase (decrease) | 10,000 | $100,000 |
| Class I | | |
| Shares sold | 10,000 | $100,000 |
| Net increase (decrease) | 10,000 | $100,000 |
| Class Z | | |
| Shares sold | 10,000 | $100,000 |
| Net increase (decrease) | 10,000 | $100,000 |
| Class Z6 | | |
| Shares sold | 10,000 | $100,000 |
| Net increase (decrease) | 10,000 | $100,000 |
| Fidelity Freedom Blend 2055 Fund | | |
| Class A | | |
| Shares sold | 10,000 | $100,000 |
| Net increase (decrease) | 10,000 | $100,000 |
| Class M | | |
| Shares sold | 10,000 | $100,000 |
| Net increase (decrease) | 10,000 | $100,000 |
| Class C | | |
| Shares sold | 10,000 | $100,000 |
| Net increase (decrease) | 10,000 | $100,000 |
| Fidelity Freedom Blend 2055 Fund | | |
| Shares sold | 10,102 | $101,019 |
| Net increase (decrease) | 10,102 | $101,019 |
| Class K | | |
| Shares sold | 10,000 | $100,000 |
| Net increase (decrease) | 10,000 | $100,000 |
| Class K6 | | |
| Shares sold | 10,000 | $100,000 |
| Net increase (decrease) | 10,000 | $100,000 |
| Class I | | |
| Shares sold | 10,000 | $100,000 |
| Net increase (decrease) | 10,000 | $100,000 |
| Class Z | | |
| Shares sold | 10,000 | $100,000 |
| Net increase (decrease) | 10,000 | $100,000 |
| Class Z6 | | |
| Shares sold | 10,000 | $100,000 |
| Net increase (decrease) | 10,000 | $100,000 |
| Fidelity Freedom Blend 2060 Fund | | |
| Class A | | |
| Shares sold | 10,000 | $100,000 |
| Net increase (decrease) | 10,000 | $100,000 |
| Class M | | |
| Shares sold | 10,000 | $100,000 |
| Net increase (decrease) | 10,000 | $100,000 |
| Class C | | |
| Shares sold | 10,000 | $100,000 |
| Net increase (decrease) | 10,000 | $100,000 |
| Fidelity Freedom Blend 2060 Fund | | |
| Shares sold | 13,846 | $138,528 |
| Shares redeemed | (10) | (100) |
| Net increase (decrease) | 13,836 | $138,428 |
| Class K | | |
| Shares sold | 10,000 | $100,000 |
| Net increase (decrease) | 10,000 | $100,000 |
| Class K6 | | |
| Shares sold | 10,000 | $100,000 |
| Net increase (decrease) | 10,000 | $100,000 |
| Class I | | |
| Shares sold | 10,000 | $100,000 |
| Net increase (decrease) | 10,000 | $100,000 |
| Class Z | | |
| Shares sold | 10,000 | $100,000 |
| Net increase (decrease) | 10,000 | $100,000 |
| Class Z6 | | |
| Shares sold | 10,000 | $100,000 |
| Net increase (decrease) | 10,000 | $100,000 |
(a) For the period August 31, 2018 (commencement of operations) to September 30, 2018.
7. Other.
The Funds' organizational documents provide former and current trustees and officers with a limited indemnification against liabilities arising in connection with the performance of their duties to the Funds. In the normal course of business, the Funds may also enter into contracts that provide general indemnifications. The Funds' maximum exposure under these arrangements is unknown as this would be dependent on future claims that may be made against the Funds. The risk of material loss from such claims is considered remote.
At the end of the period, the investment adviser or its affiliates were owners of record of more than 10% of the outstanding shares of the following Funds:
| | Affiliated % |
| Fidelity Freedom Blend Income Fund | 100% |
| Fidelity Freedom Blend 2005 Fund | 100% |
| Fidelity Freedom Blend 2010 Fund | 99% |
| Fidelity Freedom Blend 2015 Fund | 100% |
| Fidelity Freedom Blend 2020 Fund | 97% |
| Fidelity Freedom Blend 2025 Fund | 99% |
| Fidelity Freedom Blend 2030 Fund | 94% |
| Fidelity Freedom Blend 2035 Fund | 86% |
| Fidelity Freedom Blend 2040 Fund | 98% |
| Fidelity Freedom Blend 2045 Fund | 85% |
| Fidelity Freedom Blend 2050 Fund | 100% |
| Fidelity Freedom Blend 2055 Fund | 100% |
| Fidelity Freedom Blend 2060 Fund | 96% |
Shareholder Expense Example
As a shareholder of a Fund, you incur two types of costs: (1) transaction costs, including sales charges (loads) on purchase payments or redemption proceeds, and (2) ongoing costs, including management fees, distribution and/or service (12b-1) fees and other Fund expenses. This Example is intended to help you understand your ongoing costs (in dollars) of investing in the Funds and to compare these costs with the ongoing costs of investing in other mutual funds.
The actual expense Example is based on an investment of $1,000 invested at the beginning of the period and held for the entire period (August 31, 2018 to September 30, 2018). The hypothetical expense Example is based on an investment of $1,000 invested for the one-half year period (April 1, 2018 to September 30, 2018).
Actual Expenses
The first line of the accompanying table for each Class of each fund provides information about actual account values and actual expenses. You may use the information in this line, together with the amount you invested, to estimate the expenses that you paid over the period. Simply divide your account value by $1,000.00 (for example, an $8,600 account value divided by $1,000.00 = 8.6), then multiply the result by the number in the first line for a Class of the fund under the heading entitled "Expenses Paid During Period" to estimate the expenses you paid on your account during this period. In addition, each Fund, as a shareholder in underlying Fidelity Funds, will indirectly bear its pro-rata share of the fees and expenses incurred by the underlying Fidelity Funds. These fees and expenses are not included in each Fund's annualized expense ratio used to calculate the expense estimates in the table below.
Hypothetical Example for Comparison Purposes
The second line of the accompanying table for each Class of each fund provides information about hypothetical account values and hypothetical expenses based on a Class' actual expense ratio and an assumed rate of return of 5% per year before expenses, which is not the Class' actual return. The hypothetical account values and expenses may not be used to estimate the actual ending account balance or expenses you paid for the period. You may use this information to compare the ongoing costs of investing in the Fund and other funds. To do so, compare this 5% hypothetical example with the 5% hypothetical examples that appear in the shareholder reports of the other funds. In addition, each Fund, as a shareholder in underlying Fidelity Funds, will indirectly bear its pro-rata share of the fees and expenses incurred by the underlying Fidelity Funds. These fees and expenses are not included in each Fund's annualized expense ratio used to calculate the expense estimates in the table below.
Please note that the expenses shown in the table are meant to highlight your ongoing costs only and do not reflect any transaction costs. Therefore, the second line of the table is useful in comparing ongoing costs only, and will not help you determine the relative total costs of owning different funds. In addition, if these transactional costs were included, your costs would have been higher.
| | Annualized Expense Ratio-A | Beginning
Account Value | Ending
Account Value
September 30, 2018 | Expenses Paid
During Period |
| Fidelity Freedom Blend Income Fund | | | | |
| Class A | .72% | | | |
| Actual | | $1,000.00 | $997.00 | $.61-B |
| Hypothetical-C | | $1,000.00 | $1,021.46 | $3.65-D |
| Class M | .97% | | | |
| Actual | | $1,000.00 | $996.00 | $.82-B |
| Hypothetical-C | | $1,000.00 | $1,020.21 | $4.91-D |
| Class C | 1.47% | | | |
| Actual | | $1,000.00 | $996.00 | $1.25-B |
| Hypothetical-C | | $1,000.00 | $1,017.70 | $7.44-D |
| Fidelity Freedom Blend Income Fund | .46% | | | |
| Actual | | $1,000.00 | $997.00 | $.39-B |
| Hypothetical-C | | $1,000.00 | $1,022.76 | $2.33-D |
| Class K | .36% | | | |
| Actual | | $1,000.00 | $997.00 | $.31-B |
| Hypothetical-C | | $1,000.00 | $1,023.26 | $1.83-D |
| Class K6 | .27% | | | |
| Actual | | $1,000.00 | $997.00 | $.23-B |
| Hypothetical-C | | $1,000.00 | $1,023.71 | $1.37-D |
| Class I | .46% | | | |
| Actual | | $1,000.00 | $997.00 | $.39-B |
| Hypothetical-C | | $1,000.00 | $1,022.76 | $2.33-D |
| Class Z | .36% | | | |
| Actual | | $1,000.00 | $997.00 | $.31-B |
| Hypothetical-C | | $1,000.00 | $1,023.26 | $1.83-D |
| Class Z6 | .27% | | | |
| Actual | | $1,000.00 | $997.00 | $.23-B |
| Hypothetical-C | | $1,000.00 | $1,023.71 | $1.37-D |
| Fidelity Freedom Blend 2005 Fund | | | | |
| Class A | .72% | | | |
| Actual | | $1,000.00 | $997.00 | $.61-B |
| Hypothetical-C | | $1,000.00 | $1,021.46 | $3.65-D |
| Class M | .97% | | | |
| Actual | | $1,000.00 | $997.00 | $.85-B |
| Hypothetical-C | | $1,000.00 | $1,020.21 | $4.91-D |
| Class C | 1.47% | | | |
| Actual | | $1,000.00 | $996.00 | $1.25-B |
| Hypothetical-C | | $1,000.00 | $1,017.70 | $7.44-D |
| Fidelity Freedom Blend 2005 Fund | .46% | | | |
| Actual | | $1,000.00 | $997.00 | $.39-B |
| Hypothetical-C | | $1,000.00 | $1,022.76 | $2.33-D |
| Class K | .36% | | | |
| Actual | | $1,000.00 | $997.00 | $.31-B |
| Hypothetical-C | | $1,000.00 | $1,023.26 | $1.83-D |
| Class K6 | .27% | | | |
| Actual | | $1,000.00 | $997.00 | $.23-B |
| Hypothetical-C | | $1,000.00 | $1,023.71 | $1.37-D |
| Class I | .46% | | | |
| Actual | | $1,000.00 | $997.00 | $.39-B |
| Hypothetical-C | | $1,000.00 | $1,022.76 | $2.33-D |
| Class Z | .36% | | | |
| Actual | | $1,000.00 | $997.00 | $.31-B |
| Hypothetical-C | | $1,000.00 | $1,023.26 | $1.83-D |
| Class Z6 | .27% | | | |
| Actual | | $1,000.00 | $997.00 | $.23-B |
| Hypothetical-C | | $1,000.00 | $1,023.71 | $1.37-D |
| Fidelity Freedom Blend 2010 Fund | | | | |
| Class A | .73% | | | |
| Actual | | $1,000.00 | $997.00 | $.62-B |
| Hypothetical-C | | $1,000.00 | $1,021.41 | $3.70-D |
| Class M | .98% | | | |
| Actual | | $1,000.00 | $997.00 | $.83-B |
| Hypothetical-C | | $1,000.00 | $1,020.16 | $4.96-D |
| Class C | 1.48% | | | |
| Actual | | $1,000.00 | $997.00 | $1.26-B |
| Hypothetical-C | | $1,000.00 | $1,017.65 | $7.49-D |
| Fidelity Freedom Blend 2010 Fund | .47% | | | |
| Actual | | $1,000.00 | $998.00 | $.40-B |
| Hypothetical-C | | $1,000.00 | $1,022.71 | $2.38-D |
| Class K | .37% | | | |
| Actual | | $1,000.00 | $998.00 | $.31-B |
| Hypothetical-C | | $1,000.00 | $1,023.21 | $1.88-D |
| Class K6 | .27% | | | |
| Actual | | $1,000.00 | $998.00 | $.23-B |
| Hypothetical-C | | $1,000.00 | $1,023.71 | $1.37-D |
| Class I | .47% | | | |
| Actual | | $1,000.00 | $998.00 | $.40-B |
| Hypothetical-C | | $1,000.00 | $1,022.71 | $2.38-D |
| Class Z | .37% | | | |
| Actual | | $1,000.00 | $998.00 | $.31-B |
| Hypothetical-C | | $1,000.00 | $1,023.21 | $1.88-D |
| Class Z6 | .27% | | | |
| Actual | | $1,000.00 | $998.00 | $.23-B |
| Hypothetical-C | | $1,000.00 | $1,023.71 | $1.37-D |
| Fidelity Freedom Blend 2015 Fund | | | | |
| Class A | .74% | | | |
| Actual | | $1,000.00 | $998.00 | $.63-B |
| Hypothetical-C | | $1,000.00 | $1,021.36 | $3.75-D |
| Class M | .99% | | | |
| Actual | | $1,000.00 | $998.00 | $.84-B |
| Hypothetical-C | | $1,000.00 | $1,020.10 | $5.01-D |
| Class C | 1.49% | | | |
| Actual | | $1,000.00 | $997.00 | $1.26-B |
| Hypothetical-C | | $1,000.00 | $1,017.60 | $7.54-D |
| Fidelity Freedom Blend 2015 Fund | .48% | | | |
| Actual | | $1,000.00 | $998.00 | $.41-B |
| Hypothetical-C | | $1,000.00 | $1,022.66 | $2.43-D |
| Class K | .39% | | | |
| Actual | | $1,000.00 | $998.00 | $.33-B |
| Hypothetical-C | | $1,000.00 | $1,023.11 | $1.98-D |
| Class K6 | .29% | | | |
| Actual | | $1,000.00 | $998.00 | $.25-B |
| Hypothetical-C | | $1,000.00 | $1,023.61 | $1.47-D |
| Class I | .49% | | | |
| Actual | | $1,000.00 | $998.00 | $.42-B |
| Hypothetical-C | | $1,000.00 | $1,022.61 | $2.48-D |
| Class Z | .39% | | | |
| Actual | | $1,000.00 | $998.00 | $.33-B |
| Hypothetical-C | | $1,000.00 | $1,023.11 | $1.98-D |
| Class Z6 | .29% | | | |
| Actual | | $1,000.00 | $998.00 | $.25-B |
| Hypothetical-C | | $1,000.00 | $1,023.61 | $1.47-D |
| Fidelity Freedom Blend 2020 Fund | | | | |
| Class A | .75% | | | |
| Actual | | $1,000.00 | $998.00 | $.64-B |
| Hypothetical-C | | $1,000.00 | $1,021.31 | $3.80-D |
| Class M | 1.01% | | | |
| Actual | | $1,000.00 | $998.00 | $.86-B |
| Hypothetical-C | | $1,000.00 | $1,020.00 | $5.11-D |
| Class C | 1.50% | | | |
| Actual | | $1,000.00 | $998.00 | $1.27-B |
| Hypothetical-C | | $1,000.00 | $1,017.55 | $7.59-D |
| Fidelity Freedom Blend 2020 Fund | .49% | | | |
| Actual | | $1,000.00 | $998.00 | $.42-B |
| Hypothetical-C | | $1,000.00 | $1,022.61 | $2.48-D |
| Class K | .40% | | | |
| Actual | | $1,000.00 | $999.00 | $.34-B |
| Hypothetical-C | | $1,000.00 | $1,023.06 | $2.03-D |
| Class K6 | .30% | | | |
| Actual | | $1,000.00 | $999.00 | $.25-B |
| Hypothetical-C | | $1,000.00 | $1,023.56 | $1.52-D |
| Class I | .50% | | | |
| Actual | | $1,000.00 | $998.00 | $.42-B |
| Hypothetical-C | | $1,000.00 | $1,022.56 | $2.54-D |
| Class Z | .40% | | | |
| Actual | | $1,000.00 | $999.00 | $.34-B |
| Hypothetical-C | | $1,000.00 | $1,023.06 | $2.03-D |
| Class Z6 | .30% | | | |
| Actual | | $1,000.00 | $999.00 | $.25-B |
| Hypothetical-C | | $1,000.00 | $1,023.56 | $1.52-D |
| Fidelity Freedom Blend 2025 Fund | | | | |
| Class A | .76% | | | |
| Actual | | $1,000.00 | $998.00 | $.64-B |
| Hypothetical-C | | $1,000.00 | $1,021.26 | $3.85-D |
| Class M | 1.02% | | | |
| Actual | | $1,000.00 | $998.00 | $.87-B |
| Hypothetical-C | | $1,000.00 | $1,019.95 | $5.17-D |
| Class C | 3.00% | | | |
| Actual | | $1,000.00 | $998.00 | $1.15-B |
| Hypothetical-C | | $1,000.00 | $1,010.03 | $15.12-D |
| Fidelity Freedom Blend 2025 Fund | .50% | | | |
| Actual | | $1,000.00 | $999.00 | $.42-B |
| Hypothetical-C | | $1,000.00 | $1,022.56 | $2.54-D |
| Class K | .40% | | | |
| Actual | | $1,000.00 | $999.00 | $.34-B |
| Hypothetical-C | | $1,000.00 | $1,023.06 | $2.03-D |
| Class K6 | .31% | | | |
| Actual | | $1,000.00 | $999.00 | $.26-B |
| Hypothetical-C | | $1,000.00 | $1,023.51 | $1.57-D |
| Class I | .51% | | | |
| Actual | | $1,000.00 | $999.00 | $.43-B |
| Hypothetical-C | | $1,000.00 | $1,022.51 | $2.59-D |
| Class Z | .40% | | | |
| Actual | | $1,000.00 | $999.00 | $.34-B |
| Hypothetical-C | | $1,000.00 | $1,023.06 | $2.03-D |
| Class Z6 | .31% | | | |
| Actual | | $1,000.00 | $999.00 | $.26-B |
| Hypothetical-C | | $1,000.00 | $1,023.51 | $1.57-D |
| Fidelity Freedom Blend 2030 Fund | | | | |
| Class A | .77% | | | |
| Actual | | $1,000.00 | $999.00 | $.65-B |
| Hypothetical-C | | $1,000.00 | $1,021.21 | $3.90-D |
| Class M | 1.03% | | | |
| Actual | | $1,000.00 | $999.00 | $.87-B |
| Hypothetical-C | | $1,000.00 | $1,019.90 | $5.22-D |
| Class C | 1.53% | | | |
| Actual | | $1,000.00 | $998.00 | $1.30-B |
| Hypothetical-C | | $1,000.00 | $1,017.40 | $7.74-D |
| Fidelity Freedom Blend 2030 Fund | .51% | | | |
| Actual | | $1,000.00 | $999.00 | $.43-B |
| Hypothetical-C | | $1,000.00 | $1,022.51 | $2.59-D |
| Class K | .42% | | | |
| Actual | | $1,000.00 | $999.00 | $.36-B |
| Hypothetical-C | | $1,000.00 | $1,022.96 | $2.13-D |
| Class K6 | .32% | | | |
| Actual | | $1,000.00 | $1,000.00 | $.27-B |
| Hypothetical-C | | $1,000.00 | $1,023.46 | $1.62-D |
| Class I | .52% | | | |
| Actual | | $1,000.00 | $999.00 | $.44-B |
| Hypothetical-C | | $1,000.00 | $1,022.46 | $2.64-D |
| Class Z | .42% | | | |
| Actual | | $1,000.00 | $999.00 | $.36-B |
| Hypothetical-C | | $1,000.00 | $1,022.96 | $2.13-D |
| Class Z6 | .32% | | | |
| Actual | | $1,000.00 | $1,000.00 | $.27-B |
| Hypothetical-C | | $1,000.00 | $1,023.46 | $1.62-D |
| Fidelity Freedom Blend 2035 Fund | | | | |
| Class A | .77% | | | |
| Actual | | $1,000.00 | $1,000.00 | $.65-B |
| Hypothetical-C | | $1,000.00 | $1,021.21 | $3.90-D |
| Class M | 1.03% | | | |
| Actual | | $1,000.00 | $1,000.00 | $.87-B |
| Hypothetical-C | | $1,000.00 | $1,019.90 | $5.22-D |
| Class C | 1.53% | | | |
| Actual | | $1,000.00 | $999.00 | $1.30-B |
| Hypothetical-C | | $1,000.00 | $1,017.40 | $7.74-D |
| Fidelity Freedom Blend 2035 Fund | .53% | | | |
| Actual | | $1,000.00 | $1,000.00 | $.45-B |
| Hypothetical-C | | $1,000.00 | $1,022.41 | $2.69-D |
| Class K | .43% | | | |
| Actual | | $1,000.00 | $1,000.00 | $.37-B |
| Hypothetical-C | | $1,000.00 | $1,022.91 | $2.18-D |
| Class K6 | .33% | | | |
| Actual | | $1,000.00 | $1,000.00 | $.28-B |
| Hypothetical-C | | $1,000.00 | $1,023.41 | $1.67-D |
| Class I | .53% | | | |
| Actual | | $1,000.00 | $1,000.00 | $.45-B |
| Hypothetical-C | | $1,000.00 | $1,022.41 | $2.69-D |
| Class Z | .43% | | | |
| Actual | | $1,000.00 | $1,000.00 | $.37-B |
| Hypothetical-C | | $1,000.00 | $1,022.91 | $2.18-D |
| Class Z6 | .33% | | | |
| Actual | | $1,000.00 | $1,000.00 | $.28-B |
| Hypothetical-C | | $1,000.00 | $1,023.41 | $1.67-D |
| Fidelity Freedom Blend 2040 Fund | | | | |
| Class A | .79% | | | |
| Actual | | $1,000.00 | $1,001.00 | $.67-B |
| Hypothetical-C | | $1,000.00 | $1,021.11 | $4.00-D |
| Class M | 1.04% | | | |
| Actual | | $1,000.00 | $1,001.00 | $.88-B |
| Hypothetical-C | | $1,000.00 | $1,019.85 | $5.27-D |
| Class C | 1.54% | | | |
| Actual | | $1,000.00 | $1,000.00 | $1.31-B |
| Hypothetical-C | | $1,000.00 | $1,017.35 | $7.79-D |
| Fidelity Freedom Blend 2040 Fund | .54% | | | |
| Actual | | $1,000.00 | $1,001.00 | $.46-B |
| Hypothetical-C | | $1,000.00 | $1,022.36 | $2.74-D |
| Class K | .44% | | | |
| Actual | | $1,000.00 | $1,001.00 | $.37-B |
| Hypothetical-C | | $1,000.00 | $1,022.86 | $2.23-D |
| Class K6 | .35% | | | |
| Actual | | $1,000.00 | $1,001.00 | $.30-B |
| Hypothetical-C | | $1,000.00 | $1,023.31 | $1.78-D |
| Class I | .54% | | | |
| Actual | | $1,000.00 | $1,001.00 | $.46-B |
| Hypothetical-C | | $1,000.00 | $1,022.36 | $2.74-D |
| Class Z | .44% | | | |
| Actual | | $1,000.00 | $1,001.00 | $.37-B |
| Hypothetical-C | | $1,000.00 | $1,022.86 | $2.23-D |
| Class Z6 | .35% | | | |
| Actual | | $1,000.00 | $1,001.00 | $.30-B |
| Hypothetical-C | | $1,000.00 | $1,023.31 | $1.78-D |
| Fidelity Freedom Blend 2045 Fund | | | | |
| Class A | .78% | | | |
| Actual | | $1,000.00 | $1,001.00 | $.66-B |
| Hypothetical-C | | $1,000.00 | $1,021.16 | $3.95-D |
| Class M | 1.05% | | | |
| Actual | | $1,000.00 | $1,001.00 | $.89-B |
| Hypothetical-C | | $1,000.00 | $1,019.80 | $5.32-D |
| Class C | 1.55% | | | |
| Actual | | $1,000.00 | $1,000.00 | $1.32-B |
| Hypothetical-C | | $1,000.00 | $1,017.30 | $7.84-D |
| Fidelity Freedom Blend 2045 Fund | .55% | | | |
| Actual | | $1,000.00 | $1,001.00 | $.47-B |
| Hypothetical-C | | $1,000.00 | $1,022.31 | $2.79-D |
| Class K | .44% | | | |
| Actual | | $1,000.00 | $1,001.00 | $.37-B |
| Hypothetical-C | | $1,000.00 | $1,022.86 | $2.23-D |
| Class K6 | .33% | | | |
| Actual | | $1,000.00 | $1,001.00 | $.28-B |
| Hypothetical-C | | $1,000.00 | $1,023.41 | $1.67-D |
| Class I | .54% | | | |
| Actual | | $1,000.00 | $1,001.00 | $.46-B |
| Hypothetical-C | | $1,000.00 | $1,022.36 | $2.74-D |
| Class Z | .44% | | | |
| Actual | | $1,000.00 | $1,001.00 | $.37-B |
| Hypothetical-C | | $1,000.00 | $1,022.86 | $2.23-D |
| Class Z6 | .33% | | | |
| Actual | | $1,000.00 | $1,001.00 | $.28-B |
| Hypothetical-C | | $1,000.00 | $1,023.41 | $1.67-D |
| Fidelity Freedom Blend 2050 Fund | | | | |
| Class A | .80% | | | |
| Actual | | $1,000.00 | $1,001.00 | $.68-B |
| Hypothetical-C | | $1,000.00 | $1,021.06 | $4.05-D |
| Class M | 1.05% | | | |
| Actual | | $1,000.00 | $1,001.00 | $.89-B |
| Hypothetical-C | | $1,000.00 | $1,019.80 | $5.32-D |
| Class C | 1.55% | | | |
| Actual | | $1,000.00 | $1,000.00 | $1.32-B |
| Hypothetical-C | | $1,000.00 | $1,017.30 | $7.84-D |
| Fidelity Freedom Blend 2050 Fund | .54% | | | |
| Actual | | $1,000.00 | $1,001.00 | $.46-B |
| Hypothetical-C | | $1,000.00 | $1,022.36 | $2.74-D |
| Class K | .44% | | | |
| Actual | | $1,000.00 | $1,001.00 | $.37-B |
| Hypothetical-C | | $1,000.00 | $1,022.86 | $2.23-D |
| Class K6 | .33% | | | |
| Actual | | $1,000.00 | $1,001.00 | $.28-B |
| Hypothetical-C | | $1,000.00 | $1,023.41 | $1.67-D |
| Class I | .54% | | | |
| Actual | | $1,000.00 | $1,001.00 | $.46-B |
| Hypothetical-C | | $1,000.00 | $1,022.36 | $2.74-D |
| Class Z | .44% | | | |
| Actual | | $1,000.00 | $1,001.00 | $.37-B |
| Hypothetical-C | | $1,000.00 | $1,022.86 | $2.23-D |
| Class Z6 | .33% | | | |
| Actual | | $1,000.00 | $1,001.00 | $.28-B |
| Hypothetical-C | | $1,000.00 | $1,023.41 | $1.67-D |
| Fidelity Freedom Blend 2055 Fund | | | | |
| Class A | .80% | | | |
| Actual | | $1,000.00 | $1,001.00 | $.68-B |
| Hypothetical-C | | $1,000.00 | $1,021.06 | $4.05-D |
| Class M | 1.05% | | | |
| Actual | | $1,000.00 | $1,001.00 | $.89-B |
| Hypothetical-C | | $1,000.00 | $1,019.80 | $5.32-D |
| Class C | 1.55% | | | |
| Actual | | $1,000.00 | $1,000.00 | $1.32-B |
| Hypothetical-C | | $1,000.00 | $1,017.30 | $7.84-D |
| Fidelity Freedom Blend 2055 Fund | .54% | | | |
| Actual | | $1,000.00 | $1,001.00 | $.46-B |
| Hypothetical-C | | $1,000.00 | $1,022.36 | $2.74-D |
| Class K | .44% | | | |
| Actual | | $1,000.00 | $1,001.00 | $.37-B |
| Hypothetical-C | | $1,000.00 | $1,022.86 | $2.23-D |
| Class K6 | .33% | | | |
| Actual | | $1,000.00 | $1,001.00 | $.28-B |
| Hypothetical-C | | $1,000.00 | $1,023.41 | $1.67-D |
| Class I | .54% | | | |
| Actual | | $1,000.00 | $1,001.00 | $.46-B |
| Hypothetical-C | | $1,000.00 | $1,022.36 | $2.74-D |
| Class Z | .44% | | | |
| Actual | | $1,000.00 | $1,001.00 | $.37-B |
| Hypothetical-C | | $1,000.00 | $1,022.86 | $2.23-D |
| Class Z6 | .33% | | | |
| Actual | | $1,000.00 | $1,001.00 | $.28-B |
| Hypothetical-C | | $1,000.00 | $1,023.41 | $1.67-D |
| Fidelity Freedom Blend 2060 Fund | | | | |
| Class A | .80% | | | |
| Actual | | $1,000.00 | $1,001.00 | $.68-B |
| Hypothetical-C | | $1,000.00 | $1,021.06 | $4.05-D |
| Class M | 1.05% | | | |
| Actual | | $1,000.00 | $1,001.00 | $.89-B |
| Hypothetical-C | | $1,000.00 | $1,019.80 | $5.32-D |
| Class C | 1.55% | | | |
| Actual | | $1,000.00 | $1,000.00 | $1.32-B |
| Hypothetical-C | | $1,000.00 | $1,017.30 | $7.84-D |
| Fidelity Freedom Blend 2060 Fund | .53% | | | |
| Actual | | $1,000.00 | $1,001.00 | $.45-B |
| Hypothetical-C | | $1,000.00 | $1,022.41 | $2.69-D |
| Class K | .44% | | | |
| Actual | | $1,000.00 | $1,001.00 | $.37-B |
| Hypothetical-C | | $1,000.00 | $1,022.86 | $2.23-D |
| Class K6 | .33% | | | |
| Actual | | $1,000.00 | $1,001.00 | $.28-B |
| Hypothetical-C | | $1,000.00 | $1,023.41 | $1.67-D |
| Class I | .54% | | | |
| Actual | | $1,000.00 | $1,001.00 | $.46-B |
| Hypothetical-C | | $1,000.00 | $1,022.36 | $2.74-D |
| Class Z | .44% | | | |
| Actual | | $1,000.00 | $1,001.00 | $.37-B |
| Hypothetical-C | | $1,000.00 | $1,022.86 | $2.23-D |
| Class Z6 | .33% | | | |
| Actual | | $1,000.00 | $1,001.00 | $.28-B |
| Hypothetical-C | | $1,000.00 | $1,023.41 | $1.67-D |
A Annualized expense ratio reflects expenses net of applicable fee waivers.
B Actual expenses are equal to each Class' annualized expense ratio, multiplied by the average account value over the period, multiplied by 31/365 (to reflect the period August 31, 2018 to September 30, 2018).
C 5% return per year before expenses
D Hypothetical expenses are equal to each Class' annualized expense ratio, multiplied by the average account value over the period, multiplied by 183/365 (to reflect the one-half year period).
Board Approval of Investment Advisory Contracts and Management Fees
Fidelity Freedom Blend Funds
On July 19, 2018, the Board of Trustees, including the Independent Trustees (together, the Board), voted to approve the management contract (the Advisory Contract) with FMR Co., Inc. (FMRC), an affiliate of Fidelity Management & Research Company (FMR), for each fund. The Board, assisted by the advice of fund counsel and Independent Trustees' counsel, considered a broad range of information.
Nature, Extent, and Quality of Services Provided. The Board considered Fidelity's staffing as it relates to the funds, including the backgrounds of investment personnel of FMRC, and also considered the funds' investment objectives, strategies, and related investment philosophies. The Board considered the structure of the investment personnel compensation program and whether this structure provides appropriate incentives to act in the best interests of each fund.
Resources Dedicated to Investment Management and Support Services. The Board reviewed the general qualifications and capabilities of Fidelity's investment staff, including its size, education, experience, and resources, as well as Fidelity's approach to recruiting, managing, and compensating investment personnel. The Board noted that Fidelity has continued to increase the resources devoted to non-U.S. offices, including expansion of Fidelity's global investment organization. The Board also noted that Fidelity's analysts have extensive resources, tools and capabilities that allow them to conduct sophisticated quantitative and fundamental analysis, as well as credit analysis of issuers, counterparties and guarantors. Further, the Board considered that Fidelity's investment professionals have sufficient access to global information and data so as to provide competitive investment results over time, and that those professionals also have access to sophisticated tools that permit them to assess portfolio construction and risk and performance attribution characteristics continuously, as well as to transmit new information and research conclusions rapidly around the world. Additionally, in its deliberations, the Board considered Fidelity's risk management, compliance, and technology and operations capabilities and resources, which are integral parts of the investment management process.
Shareholder and Administrative Services. The Board considered the nature, extent, quality, and cost of advisory, administrative, and shareholder services to be performed by Fidelity under the Advisory Contract and under separate agreements covering administration, transfer agency, and pricing and bookkeeping services for each fund. The Board also considered the nature and extent of the supervision of third party service providers, principally custodians, subcustodians, and pricing vendors.
The Board noted that the growth of fund assets over time across the complex allows Fidelity to reinvest in the development of services designed to enhance the value or convenience of the Fidelity funds as investment vehicles. These services include 24-hour access to account information and market information through telephone representatives and over the Internet, investor education materials and asset allocation tools, and the expanded availability of Fidelity Investor Centers.
Investment Performance. Each fund is a new fund and therefore had no historical performance for the Board to review at the time it approved each fund's Advisory Contract. The Board considered FMRC's strength in managing asset allocation funds, which the Board is familiar with through its supervision of other target date funds.
Based on its review, the Board concluded that the nature, extent, and quality of services to be provided to each fund under the Advisory Contract should benefit the shareholders of each fund.
Competitiveness of Management Fee and Total Expense Ratio. The Board considered each fund's proposed class-level management fee rate, which will cover most expenses of the top-level fund and underlying funds. In reviewing the Advisory Contract, the Board also considered the projected total expense ratio of each class of the fund. The Board noted that each fund's proposed management fee rate ranks above the median of its competitor funds because the majority of such competitor funds do not have top-level management fees. The Board also considered that the projected total expense ratio of each class of each fund is at or below the median of those funds and classes used by the Board for management fee comparisons that have a similar sales load structure, except for Class M of each fund and Class C of Fidelity Freedom Blend 2020 Fund, Fidelity Freedom Blend 2040 Fund, Fidelity Freedom Blend 2045 Fund, Fidelity Freedom Blend 2050 Fund, Fidelity Freedom Blend 2055 Fund, and Fidelity Freedom Blend 2060 Fund. The Board noted that the total expense ratio for these classes is above median, but below median when compared to funds and classes with similar 12b-1 fees.
Based on its review, the Board concluded that the management fee and the projected total expense ratio of each class of each fund were reasonable in light of the services that the fund and its shareholders will receive and the other factors considered.
Costs of the Services and Profitability. Each fund is a new fund and therefore no revenue, cost, or profitability data was available for the Board to review in respect of each fund at the time it approved the Advisory Contract. In connection with its future renewal of each fund's Advisory Contract, the Board will consider the revenues earned and the expenses incurred by Fidelity in conducting the business of developing, marketing, distributing, managing, administering and servicing each fund and servicing each fund's shareholders.
Economies of Scale. The Board will consider economies of scale when there is operating experience to permit assessment thereof. It noted that, notwithstanding the entrepreneurial risk associated with a new fund, the management fee was at a level normally associated, by comparison with competitors, with very high fund net assets, and Fidelity asserted to the Board that the level of the fee anticipated economies of scale at lower asset levels even before, if ever, economies of scale are achieved. The Board also noted that each fund and its shareholders would have access to the very considerable number and variety of services available through Fidelity and its affiliates.
Based on its evaluation of all of the conclusions noted above, and after considering all factors it believed relevant, the Board concluded that the advisory fee structures are fair and reasonable, and that each fund's Advisory Contract should be approved.
FBF-SANN-1118
1.9890345.100
Item 2.
Code of Ethics
Not applicable.
Item 3.
Audit Committee Financial Expert
Not applicable.
Item 4.
Principal Accountant Fees and Services
Not applicable.
Item 5.
Audit Committee of Listed Registrants
Not applicable.
Item 6.
Investments
(a)
Not applicable.
(b)
Not applicable
Item 7.
Disclosure of Proxy Voting Policies and Procedures for Closed-End Management Investment Companies
Not applicable.
Item 8.
Portfolio Managers of Closed-End Management Investment Companies
Not applicable.
Item 9.
Purchase of Equity Securities by Closed-End Management Investment Company and Affiliated Purchasers
Not applicable.
Item 10.
Submission of Matters to a Vote of Security Holders
There were no material changes to the procedures by which shareholders may recommend nominees to the Fidelity Aberdeen Street Trust’s Board of Trustees.
Item 11.
Controls and Procedures
(a)(i) The President and Treasurer and the Chief Financial Officer have concluded that the Fidelity Aberdeen Street Trust’s (the “Trust”) disclosure controls and procedures (as
defined in Rule 30a-3(c) under the Investment Company Act) provide reasonable assurances that material information relating to the Trust is made known to them by the appropriate persons, based on their evaluation of these controls and procedures as of a date within 90 days of the filing date of this report.
(a)(ii) There was no change in the Trust’s internal control over financial reporting (as defined in Rule 30a-3(d) under the Investment Company Act) that occurred during the period covered by this report that has materially affected, or is reasonably likely to materially affect, the Trust’s internal control over financial reporting.
Item 12.
Disclosure of Securities Lending Activities for Closed-End Management
Investment Companies
Not applicable.
Item 13.
Exhibits
| | |
(a) | (1) | Not applicable. |
(a) | (2) | Certification pursuant to Rule 30a-2(a) under the Investment Company Act of 1940 (17 CFR 270.30a-2(a)) is filed and attached hereto as Exhibit 99.CERT. |
(a) | (3) | Not applicable. |
(b) |
| Certification pursuant to Rule 30a-2(b) under the Investment Company Act of 1940 (17 CFR 270.30a-2(b)) is furnished and attached hereto as Exhibit 99.906CERT. |
SIGNATURES
Pursuant to the requirements of the Securities Exchange Act of 1934 and the Investment Company Act of 1940, the registrant has duly caused this report to be signed on its behalf by the undersigned, thereunto duly authorized.
Fidelity Aberdeen Street Trust
| |
By: | /s/Laura M. Del Prato |
| Laura M. Del Prato |
| President and Treasurer |
|
|
Date: | November 28, 2018 |
Pursuant to the requirements of the Securities Exchange Act of 1934 and the Investment Company Act of 1940, this report has been signed below by the following persons on behalf of the registrant and in the capacities and on the dates indicated.
| |
By: | /s/Laura M. Del Prato |
| Laura M. Del Prato |
| President and Treasurer |
|
|
Date: | November 28, 2018 |
| |
By: | /s/John J. Burke III |
| John J. Burke III |
| Chief Financial Officer |
|
|
Date: | November 28, 2018 |